UNITED STATES
SECURITIES AND EXCHANGE COMMISSION
Washington, D.C. 20549
FORM N-CSR
CERTIFIED SHAREHOLDER REPORT OF REGISTERED
MANAGEMENT INVESTMENT COMPANIES
Investment Company Act file number: 811-10045
CALVERT IMPACT FUND, INC.
(Exact name of registrant as specified in charter)
4550 Montgomery Avenue
Suite 1000N
Bethesda, Maryland 20814
(Address of Principal Executive Offices)
Ivy Wafford Duke, Esq.
4550 Montgomery Avenue
Suite 1000N
Bethesda, Maryland 20814
(Name and Address of Agent for Service)
Registrant's telephone number, including area code: (301) 951-4800
Date of fiscal year end: September 30
Date of reporting period: Twelve months ended September 30, 2015
Item 1. Report to Stockholders.
|
| |
Annual Report September 30, 2015 E-Delivery Sign-Up — Details Inside | |
|
|
| |
Choose Planet-friendly E-delivery! Sign up now for on-line statements, prospectuses, and fund reports. In less than five minutes you can help reduce paper mail and lower fund costs. Just go to calvert.com. If you already have an online account at Calvert, click on Login, to access your Account, and select the documents you would like to receive via e-mail. If you’re new to online account access, click on Login, then Register to create your user name and password. Once you’re in, click on the E-delivery sign-up on the Account Portfolio page and follow the quick, easy steps. Note: if your shares are not held directly at Calvert but through a brokerage firm, you must contact your broker for electronic delivery options available through their firm. |
|
| | | |
| | | TABLE OF CONTENTS |
| | | | |
| | | | President's Letter |
| | | | Portfolio Management Discussion |
| | | | Understanding Your Fund's Expenses |
| | | | Report of Independent Registered Public Accounting Firm |
| | | | Statement of Net Assets |
| | | | Statement of Operations |
| | | | Statements of Changes in Net Assets |
| | | | Notes to Financial Statements |
| | | | Financial Highlights |
| | | | Explanation of Financial Tables |
| | | | Proxy Voting |
| | | | Availability of Quarterly Portfolio Holdings |
| | | | Director and Officer Information Table |
|
| |
| John Streur President and Chief Executive Officer, Calvert Investments, Inc. |
Dear Shareholders,
Global economic growth is vital to the improvement of the lives of all people, especially so to those of the ultra-poor. However, how that growth is achieved is critical to the long-term health and sustainability of our collective societies. Business activity that does not show consideration for environmental and social impacts may have calamitous consequences, many of which we are witnessing now, including political and social unrest, unjust wealth distribution and diminished bio-diversity.
The returns of the markets (chart below) reflect the impact of the uncertainty created by a legacy of unsustainable development and the current lack of positive economic growth trends. The steep decline in the emerging market equities index (reflective of the flight of capital and currency weakness) is particularly impactful as these regions include some of the largest populations of individuals most in need of sustainable and inclusive economic development.
|
| | | | |
| MARKET BENCHMARKS | Total Returns for the period ended 9/30/2015 |
| 6 Months | Year-to-Date | 1 Year | 5 Year |
| S&P 500 | -6.18% | -5.29% | -0.61% | 13.34% |
| Russell 1000 | -6.72% | -5.24% | -0.61% | 13.42% |
| Russell 3000 | -7.12% | -5.45% | -0.49% | 13.28% |
| MSCI World ex USA | -9.88% | -6.32% | -9.73% | 3.92% |
| MSCI Emerging Markets | -17.11% | -15.22% | -18.98% | -3.25% |
| Barclays U.S. Aggregate Bond | -0.47% | 1.13% | 2.94% | 3.10% |
| Barclays Global Aggregate | -0.34% | -2.25% | -3.26% | 0.81% |
| Returns for periods greater than one year have been annualized. |
In an effort to mitigate this issue and foster the long term sustainability and justice of our global economic system, many of the world’s leaders participated with the United Nations (“UN”) to design and implement a 15-year plan to create the kind of economic development (http://www.calvert.com/media-relations/press-releases/calvert-ceo-participates-in-the-un-sustainable-development-summit) that should benefit the poorest people in the world, preserve opportunities for future generations, and provide stewardship to the environment. This effort, which kicked-off at the UN Summit earlier this month, involves bringing together private enterprise, governments, NGOs, development banks and people of all walks of life to achieve the “Sustainable Development Goals 2015” (SDGs). These goals include: eliminating extreme poverty, eliminating extreme hunger, fostering good health for all, promoting gender equality, and creating environmental sustainability and peace and stability throughout the world. The SDGs impact residents of every country in some manner, but no one more acutely than the denizens of the developing and emerging nations.
It was my privilege, as Calvert’s CEO, to be invited to the Summit, as one of 350 global leaders asked to participate in the development of this critical 15-year sustainability plan. During the course of this event, I announced that Calvert Investments would lead a project (http://www.calvert.com/perspective/social-impact/calvert-un-sustainable-development-goals) to map the Sustainable Development Goals to standards that companies can be measured by, and that investors may look to in order to
4 calvert.com CALVERT SMALL CAP FUND ANNUAL REPORT (UNAUDITED)
understand which companies are helping to create sustainable, responsible growth. It is integral to the success and achievement of the goals, that the largest holders of capital, i.e., corporations, help drive these initiatives.
The crucial role that corporations now play in creating social and environmental outcomes was highlighted at the UN sessions by the presence of CEOs and sustainability officers from around the world, and the vital role of investors and the capital markets was reflected by our presence and contribution. In addition to representing your interests at the UN event, Calvert has contributed to the understanding of the role that corporations and investors play in driving social and environmental conditions through our most recent research, “The Role of the Corporation in Society”, available to you on our website, (see http://www.calvert.com/perspective/governance/calvert-serafeim-series-report).
Despite the fact that the past year has not brought the financial returns that you or I would have wished for as investors, I believe that when we look back on 2015 several years from now we are likely to see it as a transformative year in terms of our economic and social systems. Individuals and organizations of all types — corporate, government, NGO, religious — are coming together due to the realization that we need a more sustainable and just system to serve the needs of all stakeholders. As a shareholder of Calvert Funds, you are very much part of this mission, as together we are a leader and innovator in connecting capital to mission, with the dual purpose of driving competitive investment returns with just and sustainable economic progress.
On behalf of all of us at Calvert Investments, thank you for the confidence you have placed in our management of your funds and the ongoing privilege to serve you. We appreciate the opportunity to work with you as we strive to meet your financial needs while also helping to render the world a better place for all people.
Respectfully,
John Streur
October 2015
calvert.com CALVERT SMALL CAP FUND ANNUAL REPORT (UNAUDITED) 5
|
| |
| PORTFOLIO MANAGEMENT DISCUSSION |
|
| |
| Joshua Linder, CFA Portfolio Manager |
|
| |
| Christopher Madden, CFA Portfolio Manager |
Performance
The Calvert Small Cap Fund Class A shares (at NAV) returned 8.18% for the 12-month period ended September 30, 2015, outperforming the Russell 2000 Index, which returned 1.25%. The Fund’s outperformance was driven primarily by superior stock selection across several economic sectors.
Investment Process
The investment process for the Fund focuses on sustainable businesses with attractive valuations and environmental, social, and governance (ESG) characteristics, generous dividend yields, reasonable growth prospects, stable quality of earnings and cash flows, and market support.
Market Review
Improving economic conditions in the United States compared with a stagnating or deteriorating growth outlook in much of the rest of the world helped domestic equities outperform international equity markets over the 12-month reporting period. Despite an initial positive reaction by European financial markets following the quantitative easing announcement by the European Central Bank (ECB), there are already signs the eurozone economic recovery may have a hard time accelerating. Further signs of an economic slowdown in China and concerns about the ability of the Chinese government to engineer a soft economic landing weighed on emerging market stocks throughout the period and contributed to the broader sell-off in equities at the end of the third quarter of 2015.
For the 12-month period ended September 30, 2015, the S&P 500 and Russell 1000 both declined 0.61% while the MSCI EAFE Investable Market Index (IMI) and MSCI Emerging Markets Index declined 7.16% and 18.98%, respectively. The Russell 2000 returned 1.25%. The Barclays U.S. Credit Index returned 1.50%.
A wide range of U.S. macroeconomic data improved over the year. Most importantly, the job market was relatively healthy for most of the 12-month period, adding an average of 237,000 jobs per month. This helped push the unemployment rate down to 5.1%, though this was driven in part by a declining labor force participation rate and has not yet been accompanied by meaningful wage growth.
The price of crude oil declined by 50% during the period. With lower commodity prices, a stronger dollar, and little wage growth, inflation in the U.S. remained below the U.S. Federal Reserve’s 2% target. The Fed decided to delay interest rate hikes given the continued low inflation and slowing global growth, but is still considering raising rates before the end of the calendar year.
Slowing growth in China helped push down commodity prices and contributed to weakness in other emerging market economies that rely heavily on Chinese commodity consumption. The low level of inflation provides the Chinese government with room for additional accommodative monetary and fiscal policy, which we saw with the devaluing of the yuan.
Portfolio Strategy
Several factors came together during the period, contributing to the Fund’s outperformance. The Fund remained relatively stable during the past 12 months with about 20% name turnover.
6 calvert.com CALVERT SMALL CAP FUND ANNUAL REPORT (UNAUDITED)
|
| | | | |
| | | | |
| | CALVERT SMALL CAP FUND |
| | SEPTEMBER 30, 2015 |
| | | | |
| | ECONOMIC SECTORS | % OF TOTAL INVESTMENTS | |
| | Consumer Discretionary | 19.0 | % | |
| | Energy | 1.0 | % | |
| | Financials | 27.5 | % | |
| | Health Care | 11.7 | % | |
| | High Social Impact Investments | 0.3 | % | |
| | Industrials | 19.1 | % | |
| | Information Technology | 10.2 | % | |
| | Short-Term Investments | 8.2 | % | |
| | Telecommunication Services | 3.0 | % | |
| | Total | 100 | % | |
| | | | |
Earlier in 2015, we made evolutionary adjustments to the Fund by repositioning it to a more defensive stance given a more cautious macroeconomic outlook, which impacts factor selection and weights, as well as model and portfolio construction. We have been placing less emphasis on absolute level of dividends and reduced the Fund’s debt-to-equity profile. In addition, value and quality factors are at high levels in the model as we anticipate a turn in the style performance away from growth and toward value over the next 6 to 12 months if, as expected, the interest rate regime changes. Along with higher cash levels in the Fund, this has been an advantageous positioning during recent market volatility.
The Fund continues to benefit from merger and acquisition activity, and acquisition premiums, as our companies get recognition from private investors. The financial services firm Symetra, a provider of employee benefit insurance, annuities, and life insurance, rose 49%, including a 30% acquisition premium based on an offer from Sumitomo Life of Japan.1 Another acquisition target, PartnerRe, was up 28% during the 12-month reporting period.
Our stock selection models performed well during the period such that superior stock selection drove outperformance in several sectors. The largest positive impacts came from our picks in the financials, health care, and industrial sectors while our stock selection in technology lagged. Our underweight in two of the worst performing sectors — energy and materials — helped relative performance during the period.
The Fund remained fossil-fuel free and as such, avoided the bulk of negative fallout from the downward spiral in energy prices and continued deterioration in the commodity cycle. Fuel efficiency is a notable theme working well in the Fund.
______________________________
1All returns reflect the period a holding was in the Fund.
|
| | | | | | |
| | | | | |
| | CALVERT SMALL CAP FUND | |
| | SEPTEMBER 30, 2015 | |
| | | | | |
| | INVESTMENT PERFORMANCE | |
| | (TOTAL RETURN AT NAV) | |
| | | 6 MONTHS ENDED 9/30/15 | 12 MONTHS ENDED 9/30/15 | |
| | Class A | -5.41 | % | 8.18 | % | |
| | Class C | -5.78 | % | 7.38 | % | |
| | Class I | -5.20 | % | 8.72 | % | |
| | Class Y | -5.34 | % | 8.45 | % | |
| | Russell 2000 Index | -11.55 | % | 1.25 | % | |
| | Lipper Small-Cap Core Funds Average | -10.83 | % | -0.77 | % | |
| | | | | |
| | Investment performance/return at NAV does not reflect the deduction of the Fund’s maximum 4.75% front-end sales charge or any deferred sales charges. | |
| | | | |
| | TEN LARGEST STOCK HOLDINGS | % OF NET ASSETS | |
| | PrivateBancorp, Inc. | | 4.2 | % | |
| | Texas Roadhouse, Inc. | | 4.2 | % | |
| | Grand Canyon Education, Inc. | | 4.1 | % | |
| | American Financial Group, Inc. | | 4.1 | % | |
| | DST Systems, Inc. | | 4.0 | % | |
| | John Wiley & Sons, Inc., Class A | | 3.9 | % | |
| | Symetra Financial Corp. | | 3.9 | % | |
| | SVB Financial Group | | 3.8 | % | |
| | East West Bancorp, Inc. | | 3.8 | % | |
| | Dillard's, Inc., Class A | | 3.7 | % | |
| | Total | 39.7 | % | |
| | | | | |
Leisure airline Allegiant Travel has been one of the top contributors, rising 83% during the period. Allegiant is adding newer Airbus planes, which are 15 to 20% more fuel efficient than older planes. Airbus planes should be about 30% of capacity flown in 2015 by Allegiant, versus just 5% in 2013. The airline’s costs are well below most competitors’, and it has direct competition on just 15% of its routes, which may allow it to double its size, and further contribute to Fund returns.
Ocean freight hauler Matson was up 58% during the period, as decreasing fuel costs are helping to improve margins. Matson plans to take delivery in 2018 of new, “green” ships with fuel-efficient design, capable of using liquefied natural gas as a fuel.
In addition, Matson’s recent acquisition of Horizon Lines, which carries freight to Alaska, is expected to increase its earnings per share (EPS).
calvert.com CALVERT SMALL CAP FUND ANNUAL REPORT (UNAUDITED) 7
We are gaining exposure to interest rate sensitive investments that should do well in the anticipated rising interest rate environment through well-positioned, niche banks, such as PrivateBancorp, East West Bancorp, and SVB Financial Group. PrivateBancorp was a key contributor to performance in the Fund’s 2015 fiscal year.
Private Bancorp was up 26% during the period. This Chicago-based bank focuses on small and midsized businesses and affluent individuals in the Midwest. The bank has seen robust EPS growth and 96% of its loans have floating interest rates, so the bank should benefit if, as expected, interest rates rise.
Steakhouse chain Texas Roadhouse rose 35% during the period as U.S. consumers remain price sensitive during a period of modest economic and wage growth.
On the negative side, Bristow Group was down 56% during the period. Bristow provides energy- and time-efficient transportation for offshore rig crews and was negatively affected by the price pressures in the energy sector.
Outlook
Central banks around the globe have engaged in a concurrent, unprecedented effort to keep interest rates low in hopes of boosting economic activity. As a result, risky assets have appeared more attractive to investors and benefited from an expansion in earnings multiples over the last several years. Although valuations are far from extreme levels, they are well above historical long-term averages, making markets more vulnerable to shocks from some of the negative catalysts currently in the global economy. These include continued economic deceleration in China — a scenario that began to unfold in the third quarter of 2015.
We are worried that concurrent quantitative easing (QE) across multiple global economies could be less potent than that implemented in the U.S. after the financial crisis if these efforts effectively cancel each other out. Market enthusiasm for global QE may wane if robust economic recovery doesn’t follow, hindered by underlying structural economic and fiscal challenges in many economies, including Europe and Japan.
In our view, the probability of a hard economic landing for China is increasing. If this process occurs in a disorderly fashion, it may have a significant negative impact on both market sentiment and the global economy since China is the world’s second-largest economy and has a meaningful impact on corporate earnings streams globally.
We believe the U.S. economy can continue to grow, although the tough first quarter of 2015 caused by severe weather will have a negative impact on growth numbers for the year. The positive impact of lower oil prices should provide additional support to the economy.
Despite our positive outlook on the U.S. economy in the medium-to-long run, we continue to be concerned about potential market jitters in the short term given recent data indicating softness globally.
Note: for information on a recent portfolio manager change in the Fund and other changes, please see the supplement to the prospectus included at the end of this report.
Joshua Linder, CFA
Christopher Madden
Calvert Investment Management, Inc.
October 2015
As of September 30, 2015, the following companies represented the following percentages of net assets: Symetra 3.92%, PartnerRe 2.24%, Allegiant Travel 3.05%, Matson 3.45%, PrivateBancorp 4.21%, East West Bancorp 3.73%, SVB Financial Group 3.82%, Texas Roadhouse 4.21%, and Bristow Group 1.03%. Holdings are subject to change.
8 calvert.com CALVERT SMALL CAP FUND ANNUAL REPORT (UNAUDITED)
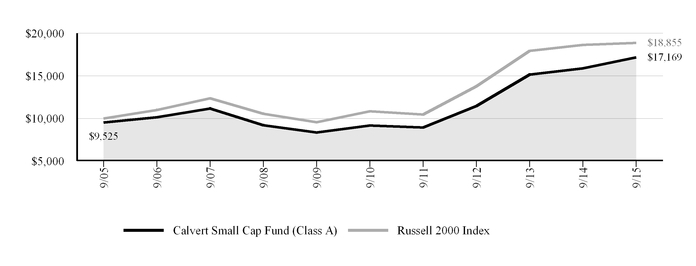
Growth of $10,000
The graph below shows the value of a hypothetical $10,000 investment in the Fund over the past 10 fiscal year periods. The results shown are for Class A shares, reflect the deduction of the maximum front-end Class A sales charge of 4.75%, and assume the reinvestment of dividends. The result is compared with a broad based market index. Market indexes are unmanaged and their results do not reflect the effect of expenses or sales charges. The value of an investment in a different share class would be different.
|
| | | | | | | |
| CALVERT SMALL CAP FUND |
| SEPTEMBER 30, 2015 |
| AVERAGE ANNUAL TOTAL RETURNS | Ticker Symbol | 1 Year | 5 Year | 10 Year |
| Class A (with max. load) | CCVAX | 3.03 | % | 12.26 | % | 5.55 | % |
| Class C (with max. load) | CSCCX | 6.38 | % | 12.38 | % | 5.11 | % |
| Class I | CSVIX | 8.72 | % | 14.12 | % | 6.84 | % |
| Class Y | CSCYX | 8.45 | % | 13.49 | % | 6.13 | % |
| Russell 2000 Index | | 1.25 | % | 11.73 | % | 6.55 | % |
| Lipper Small-Cap Core Funds Average | | -0.77 | % | 10.89 | % | 6.21 | % |
| | | | | |
| Calvert Small Cap Fund first offered Class C shares on April 1, 2005 and Class Y shares on October 18, 2013. Performance prior to those dates reflects the performance of Class A shares at net asset value (NAV). Actual Class C and Class Y share performance would have been different. |
| | | | | |
All performance data shown, including the graph above and the adjacent table, represents past performance, does not guarantee future results, assumes reinvestment of dividends and distributions, and does not reflect the deduction of taxes that a shareholder would pay on the Fund’s distributions or the redemption of the Fund shares. All performance data reflects fee waivers and/or expense limitations, if any are in effect; in their absence performance would be lower. See Note B in Notes to Financial Statements. The investment return and principal value of an investment will fluctuate so that an investor’s shares, when redeemed, may be worth more or less than their original cost. Current performance may be lower or higher than the performance data quoted; for current performance data, including most recent month-end, visit www.calvert.com. The gross expense ratio from the current prospectus for Class A shares is 1.61%. This number may differ from the expense ratio shown elsewhere in this report because it is based on a different time period and, if applicable, does not include fee or expense waivers. Performance data quoted already reflects the deduction of the Fund’s operating expenses.
calvert.com CALVERT SMALL CAP FUND ANNUAL REPORT (UNAUDITED) 9
UNDERSTANDING YOUR FUND'S EXPENSES
As an investor, you incur two types of costs. There are transaction costs, which generally include sales charges on purchases and may include redemption fees. There are also ongoing costs, which generally include management fees, distribution and/or service fees, and other fund expenses. The following information is intended to help you understand your ongoing costs (in dollars) of investing in this mutual fund and to help you compare these costs with the ongoing costs of investing in other mutual funds.
To illustrate these ongoing costs, we have provided examples and calculated the expenses paid by the fund's investors during the period. The actual and hypothetical information presented in the examples is based on an investment of $1,000 invested at the beginning of the period and held for the entire period (April 1, 2015 to September 30, 2015).
Actual Expenses
The first line of the table below provides information about actual account values and actual expenses. You may use the information in this line, together with the amount you invested, to estimate the expenses that you paid over the period. Simply divide your account value by $1,000 (for example, an $8,600 account value divided by $1,000 = 8.6), then multiply the result by the number in the first line under the heading entitled "Expenses Paid During Period" to estimate the expenses you paid on your account during this period.
Hypothetical Example for Comparison Purposes
The second line of the table below provides information about hypothetical account values and hypothetical expenses based on the Fund’s actual expense ratio and an assumed rate of return of 5% per year before expenses, which is not the Fund’s actual return. The hypothetical account values and expenses may not be used to estimate the actual ending account balance or expenses you paid for the period. You may use this information to compare the ongoing costs of investing in the Fund and other funds. To do so, compare the 5% hypothetical example with the 5% hypothetical examples that appear in the shareholder reports of the other funds.
Please note that the expenses shown in the table are meant to highlight your ongoing costs only and do not reflect any transactional costs, such as sales charges (loads), or redemption fees. Therefore, the second line of the table is useful in comparing ongoing costs only, and will not help you determine the relative total costs of owning different funds. In addition, if these transactional costs were included, your costs would have been higher.
|
| | | | |
| | ANNUALIZED
EXPENSE RATIO | BEGINNING
ACCOUNT VALUE
4/1/15 | ENDING
ACCOUNT VALUE
9/30/15 | EXPENSES PAID
DURING PERIOD*
4/1/15 - 9/30/15 |
| Class A | | | | |
| Actual | 1.37% | $1,000.00 | $945.90 | $6.68 |
| Hypothetical (5% return per year before expenses) | 1.37% | $1,000.00 | $1,018.20 | $6.93 |
| Class C | | | | |
| Actual | 2.12% | $1,000.00 | $942.20 | $10.32 |
| Hypothetical (5% return per year before expenses) | 2.12% | $1,000.00 | $1,014.44 | $10.71 |
| Class I | | | | |
| Actual | 0.91% | $1,000.00 | $948.00 | $4.44 |
| Hypothetical (5% return per year before expenses) | 0.91% | $1,000.00 | $1,020.51 | $4.61 |
| Class Y | | | | |
| Actual | 1.12% | $1,000.00 | $946.60 | $5.47 |
| Hypothetical (5% return per year before expenses) | 1.12% | $1,000.00 | $1,019.45 | $5.67 |
|
|
| * Expenses paid during the period are equal to the annualized expense ratio for each class as indicated above, multiplied by the average account value over the period, multiplied by 183/365 (to reflect the one-half year period). Expense ratios shown in the Financial Highlights represent the actual expenses incurred for the fiscal year. |
10 calvert.com CALVERT SMALL CAP FUND ANNUAL REPORT (UNAUDITED)
REPORT OF INDEPENDENT REGISTERED PUBLIC ACCOUNTING FIRM
The Board of Directors of Calvert Impact Fund, Inc. and Shareholders of Calvert Small Cap Fund:
We have audited the accompanying statement of net assets of the Calvert Small Cap Fund (the “Fund”), a series of Calvert Impact Fund, Inc., as of September 30, 2015, and the related statement of operations for the year then ended, the statements of changes in net assets for each of the years or periods in the two-year period then ended, and the financial highlights for each of the years or periods in the five-year period then ended. These financial statements and financial highlights are the responsibility of the Fund’s management. Our responsibility is to express an opinion on these financial statements and financial highlights based on our audits.
We conducted our audits in accordance with the standards of the Public Company Accounting Oversight Board (United States). Those standards require that we plan and perform the audit to obtain reasonable assurance about whether the financial statements and financial highlights are free of material misstatement. An audit includes examining, on a test basis, evidence supporting the amounts and disclosures in the financial statements. Our procedures included confirmation of securities owned as of September 30, 2015 by correspondence with the custodian and brokers or by other appropriate auditing procedures. An audit also includes assessing the accounting principles used and significant estimates made by management, as well as evaluating the overall financial statement presentation. We believe that our audits provide a reasonable basis for our opinion.
In our opinion, the financial statements and financial highlights referred to above present fairly, in all material respects, the financial position of the Calvert Small Cap Fund as of September 30, 2015, the results of its operations for the year then ended, the changes in its net assets for each of the years or periods in the two-year period then ended, and the financial highlights for each of the years or periods in the five-year period then ended, in conformity with U.S. generally accepted accounting principles.
Philadelphia, Pennsylvania
November 25, 2015
calvert.com CALVERT SMALL CAP FUND ANNUAL REPORT 11
CALVERT SMALL CAP FUND
STATEMENT OF NET ASSETS
SEPTEMBER 30, 2015
|
| | |
| | SHARES | VALUE ($) |
| EQUITY SECURITIES - 91.5% | | |
| Aerospace & Defense - 1.6% | | |
Ducommun, Inc. * | 193,110 | 3,875,718 |
| | | |
| Airlines - 3.1% | | |
Allegiant Travel Co. | 34,203 | 7,396,399 |
| | | |
| Banks - 11.8% | | |
| East West Bancorp, Inc. | 235,282 | 9,039,534 |
| PrivateBancorp, Inc. | 266,432 | 10,212,339 |
| SVB Financial Group * | 80,225 | 9,269,197 |
| | | 28,521,070 |
| | | |
| Commercial Services & Supplies - 6.8% | | |
| Deluxe Corp. | 161,458 | 8,999,669 |
| Pitney Bowes, Inc. | 369,910 | 7,342,714 |
| | | 16,342,383 |
| | | |
| Communications Equipment - 2.6% | | |
Comtech Telecommunications Corp. | 304,303 | 6,271,685 |
| | | |
| Consumer Finance - 2.3% | | |
Nelnet, Inc., Class A | 159,735 | 5,528,428 |
| | | |
| Diversified Consumer Services - 7.1% | | |
| Grand Canyon Education, Inc. * | 262,475 | 9,971,425 |
| Strayer Education, Inc. * | 132,067 | 7,259,723 |
| | | 17,231,148 |
| | | |
| Diversified Telecommunication Services - 1.8% | | |
Atlantic Tele-Network, Inc. | 59,931 | 4,430,699 |
| | | |
| Electronic Equipment & Instruments - 1.8% | | |
Plexus Corp. * | 114,314 | 4,410,234 |
| | | |
| Energy Equipment & Services - 1.0% | | |
Bristow Group, Inc. | 95,465 | 2,497,364 |
| | | |
| Health Care Equipment & Supplies - 8.3% | | |
| Analogic Corp. | 59,306 | 4,865,464 |
|
| | |
| | SHARES | VALUE ($) |
| Cyberonics, Inc. * | 48,000 | 2,917,440 |
| Edwards Lifesciences Corp. * | 56,324 | 8,007,583 |
| SurModics, Inc. * | 201,270 | 4,395,737 |
| | | 20,186,224 |
| | | |
| Health Care Providers & Services - 3.4% | | |
Centene Corp. * | 153,285 | 8,312,646 |
| | | |
| Hotels, Restaurants & Leisure - 4.2% | | |
Texas Roadhouse, Inc. | 274,084 | 10,195,925 |
| | | |
| Insurance - 13.4% | | |
| American Financial Group, Inc. | 142,788 | 9,839,521 |
| FBL Financial Group, Inc., Class A | 63,340 | 3,896,677 |
| Navigators Group, Inc. (The) * | 48,502 | 3,782,186 |
| PartnerRe Ltd. | 39,123 | 5,433,402 |
| Symetra Financial Corp. | 300,026 | 9,492,823 |
| | | 32,444,609 |
| | | |
| IT Services - 5.8% | | |
| DST Systems, Inc. | 92,779 | 9,754,784 |
| TeleTech Holdings, Inc. | 163,670 | 4,384,719 |
| | | 14,139,503 |
| | | |
| Machinery - 2.0% | | |
AGCO Corp. | 101,975 | 4,755,094 |
| | | |
| Marine - 3.5% | | |
Matson, Inc. | 217,137 | 8,357,603 |
| | | |
| Media - 3.9% | | |
John Wiley & Sons, Inc., Class A | 190,339 | 9,522,660 |
| | | |
| Multiline Retail - 3.7% | | |
Dillard's, Inc., Class A | 103,326 | 9,029,659 |
| | | |
| Professional Services - 2.3% | | |
Navigant Consulting, Inc. * | 353,007 | 5,616,341 |
| | | |
| Wireless Telecommunication Services - 1.1% | | |
Shenandoah Telecommunications Co. | 64,205 | 2,748,616 |
| | | |
| Total Equity Securities (Cost $215,290,997) | | 221,814,008 |
12 calvert.com CALVERT SMALL CAP FUND ANNUAL REPORT
|
| | | | |
| | PRINCIPAL
AMOUNT ($) | VALUE ($) |
|
| HIGH SOCIAL IMPACT INVESTMENTS - 0.3% | | |
| Calvert Social Investment Foundation Notes, 0.25%, 7/1/17(b)(i)(r) | 651,905 | 631,580 |
|
| | | |
| Total High Social Impact Investments (Cost $651,905) | | 631,580 |
|
| | | |
| | | |
| TIME DEPOSIT - 8.2% | | |
| State Street Bank Time Deposit, 0.088%, 10/1/15 | 19,931,545 | 19,931,545 |
|
| | | |
| Total Time Deposit (Cost $19,931,545) | | 19,931,545 |
|
| | | |
| | | |
| TOTAL INVESTMENTS (Cost $235,874,447) - 100.0% | | 242,377,133 |
|
| Other assets and liabilities, net - 0.0% | | (8,771) |
|
NET ASSETS - 100.0% | |
| $242,368,362 |
|
|
| | | |
| NET ASSETS CONSIST OF: | |
| Paid-in capital applicable to the following shares of common stock, with 250,000,000 shares of $0.01 par value shares authorized: | |
| Class A: 7,021,316 shares outstanding |
| $133,227,933 |
|
| Class C: 799,076 shares outstanding | 14,516,727 |
|
| Class I: 2,642,384 shares outstanding | 56,861,880 |
|
| Class Y: 454,584 shares outstanding | 10,589,120 |
|
| Undistributed net investment income | 300,565 |
|
| Accumulated net realized gain (loss) | 20,369,451 |
|
| Net unrealized appreciation (depreciation) | 6,502,686 |
|
| | |
| NET ASSETS |
| $242,368,362 |
|
| | |
| NET ASSET VALUE PER SHARE | |
| Class A (based on net assets of $154,727,976) |
| $22.04 |
|
| Class C (based on net assets of $15,887,230) |
| $19.88 |
|
| Class I (based on net assets of $61,668,773) |
| $23.34 |
|
| Class Y (based on net assets of $10,084,383) |
| $22.18 |
|
|
| |
| NOTES TO STATEMENT OF NET ASSETS |
| * | Non-income producing security. |
| (b) | This security was valued under the direction of the Board of Directors. See Note A. |
| (i) | Restricted securities represent 0.3% of the net assets of the Fund. |
| (r) | The coupon rate shown on floating or adjustable rate securities represents the rate in effect on September 30, 2015. |
| Abbreviations: |
| Ltd.: | Limited |
|
| | |
| RESTRICTED SECURITIES | ACQUISITON DATES | COST |
| Calvert Social Investment Foundation Notes, 0.25%, 7/1/17 | 7/1/14 | 651,905 |
| See notes to financial statements. |
calvert.com CALVERT SMALL CAP FUND ANNUAL REPORT 13
CALVERT SMALL CAP FUND
STATEMENT OF OPERATIONS
YEAR ENDED SEPTEMBER 30, 2015
|
| | | |
| NET INVESTMENT INCOME | |
| Investment Income: | |
| Dividend income (net of foreign taxes withheld of $7,905) |
| $3,823,639 |
|
| Interest income | 11,275 |
|
| Total investment income | 3,834,914 |
|
| | |
| Expenses: | |
| Investment advisory fee | 1,726,888 |
|
| Administrative fees | 508,998 |
|
| Transfer agency fees and expenses | 391,115 |
|
| Distribution Plan expenses: | |
| Class A | 379,306 |
|
| Class B (a) | 4,748 |
|
| Class C | 155,370 |
|
| Directors' fees and expenses | 24,234 |
|
| Accounting fees | 47,004 |
|
| Custodian fees | 30,530 |
|
| Professional fees | 30,005 |
|
| Registration fees | 69,959 |
|
| Reports to shareholders | 25,986 |
|
| Miscellaneous | 49,973 |
|
| Total expenses | 3,444,116 |
|
| Reimbursement from Advisor: | |
| Class A | (225,583) |
|
| Class B (a) | (8,125) |
|
| Class C | (37,657) |
|
| Class Y | (13,318) |
|
| Net expenses | 3,159,433 |
|
| | |
| NET INVESTMENT INCOME | 675,481 |
|
| | |
| REALIZED AND UNREALIZED GAIN (LOSS) ON INVESTMENTS | |
| Net realized gain (loss) | 20,293,614 |
|
| | |
| Change in unrealized appreciation (depreciation) | (2,063,669) |
|
| | |
| NET REALIZED AND UNREALIZED GAIN (LOSS) ON INVESTMENTS | 18,229,945 |
|
| | |
| INCREASE (DECREASE) IN NET ASSETS RESULTING FROM OPERATIONS |
| $18,905,426 |
|
| | |
| (a) Class B Shares were converted into Class A Shares at the close of business on April 20, 2015. | |
| See notes to financial statements. |
14 calvert.com CALVERT SMALL CAP FUND ANNUAL REPORT
CALVERT SMALL CAP FUND
STATEMENTS OF CHANGES IN NET ASSETS
|
| | | | | | | | |
| INCREASE (DECREASE) IN NET ASSETS | YEAR ENDED
SEPTEMBER 30, 2015 | | YEAR ENDED
SEPTEMBER 30, 2014 |
| Operations: | | | |
| Net investment income (loss) |
| $675,481 |
| |
| ($384,625 | ) |
| Net realized gain (loss) | 20,293,614 |
| | 44,084,049 |
|
| Change in unrealized appreciation (depreciation) | (2,063,669) |
| | (34,452,776) |
|
| INCREASE (DECREASE) IN NET ASSETS RESULTING FROM OPERATIONS | 18,905,426 |
| | 9,246,648 |
|
| | | | |
| Distributions to shareholders from: | | | |
| Net investment income: | | | |
| Class A shares | (20,872) |
| | — |
|
| Class I shares | (248,707) |
| | — |
|
| Class Y shares | (1,492) |
| | — |
|
| Net realized gain: | | | |
| Class A shares | (16,247,126) |
| | (14,647,077) |
|
| Class B shares(a) | (103,427) |
| | (138,533) |
|
| Class C shares | (1,823,563) |
| | (1,638,395) |
|
| Class I shares | (7,539,487) |
| | (5,147,885) |
|
| Class Y shares | (556,157) |
| | (15,806) |
|
| Total distributions | (26,540,831) |
| | (21,587,696) |
|
| | | | |
| Capital share transactions: | | | |
| Shares sold: | | | |
| Class A shares(b) | 32,375,922 |
| | 29,278,686 |
|
| Class B shares(a) | 12,071 |
| | 47,074 |
|
| Class C shares | 3,181,023 |
| | 2,078,627 |
|
| Class I shares | 27,750,171 |
| | 13,275,817 |
|
| Class Y shares | 7,010,873 |
| | 4,698,934 |
|
| Reinvestment of distributions: | | | |
| Class A shares | 15,410,910 |
| | 13,909,549 |
|
| Class B shares(a) | 97,987 |
| | 135,230 |
|
| Class C shares | 1,588,359 |
| | 1,424,032 |
|
| Class I shares | 7,262,349 |
| | 4,854,479 |
|
| Class Y shares | 499,379 |
| | 15,806 |
|
| Redemption fees: | | | |
| Class A shares | 30 |
| | 1,374 |
|
| Class C shares | 1 |
| | 66 |
|
| Shares redeemed: | | | |
| Class A shares | (21,337,967) |
| | (30,156,544) |
|
| Class B shares(a)(b) | (990,170) |
| | (495,699) |
|
| Class C shares | (2,181,949) |
| | (1,976,827) |
|
| Class I shares | (27,279,543) |
| | (7,103,176) |
|
| Class Y shares | (1,507,266) |
| | (128,606) |
|
| Total capital share transactions | 41,892,180 |
| | 29,858,822 |
|
| | | | |
| TOTAL INCREASE (DECREASE) IN NET ASSETS | 34,256,775 |
| | 17,517,774 |
|
| See notes to financial statements. |
calvert.com CALVERT SMALL CAP FUND ANNUAL REPORT 15
|
| | | | | | | | |
| NET ASSETS | YEAR ENDED
SEPTEMBER 30, 2015 | | YEAR ENDED
SEPTEMBER 30, 2014 |
| Beginning of year | 208,111,587 |
| | 190,593,813 |
|
| End of year (including undistributed net investment income of $300,565 and $0, respectively) |
| $242,368,362 |
| |
| $208,111,587 |
|
| CAPITAL SHARE ACTIVITY | | | |
| Shares sold: | | | |
| Class A shares(c) | 1,402,421 |
| | 1,235,969 |
|
| Class B shares(a) | 596 |
| | 2,108 |
|
| Class C shares | 152,248 |
| | 94,919 |
|
| Class I shares | 1,162,886 |
| | 536,492 |
|
| Class Y shares | 306,085 |
| �� | 195,656 |
|
| Reinvestment of distributions: | | | |
| Class A shares | 707,867 |
| | 611,947 |
|
| Class B shares(a) | 4,768 |
| | 6,155 |
|
| Class C shares | 80,382 |
| | 67,714 |
|
| Class I shares | 314,893 |
| | 204,227 |
|
| Class Y shares | 22,821 |
| | 695 |
|
| Shares redeemed: | | | |
| Class A shares | (926,943) |
| | (1,273,723) |
|
| Class B shares(a)(c) | (44,551) |
| | (21,876) |
|
| Class C shares | (103,746) |
| | (89,824) |
|
| Class I shares | (1,095,239) |
| | (288,306) |
|
| Class Y shares | (65,394) |
| | (5,279) |
|
| Total capital share activity | 1,919,094 |
| | 1,276,874 |
|
| | | | |
| (a) Class B Shares were converted into Class A Shares at the close of business on April 20, 2015. |
| (b) Amounts include $819,610 of share transactions that were redeemed from Class B shares and converted into Class A shares at the close of business on April 20, 2015. |
| (c) Amount includes 36,721 shares redeemed from Class B shares and 34,437 shares purchased into Class A shares at the close of business on April 20,2015. |
| See notes to financial statements. |
16 calvert.com CALVERT SMALL CAP FUND ANNUAL REPORT
NOTES TO FINANCIAL STATEMENTS
NOTE A — SIGNIFICANT ACCOUNTING POLICIES
General: Calvert Small Cap Fund (the “Fund”), a series of Calvert Impact Fund, Inc., is registered under the Investment Company Act of 1940 as a diversified, open-end management investment company. Calvert Impact Fund, Inc. is comprised of four separate series. The operations of each series are accounted for separately. The Fund applies the accounting and reporting guidance in the Financial Accounting Standards Board (FASB) Accounting Standards Codification Topic 946, Financial Services – Investment Companies (ASC 946).
The Fund offers four classes of shares - Classes A, C, I, and Y. The Fund also offered Class B shares; however, all existing Class B shares of the Fund were automatically converted to Class A shares of the Fund at the close of business on April 20, 2015, without the imposition of the applicable Class A sales load or the Class B contingent deferred sales charge. Class B shares were closed at that time and are no longer available. Class A shares are sold with a maximum front-end sales charge of 4.75%. Class C shares are sold without a front-end sales charge and, with certain exceptions, will be charged a deferred sales charge on shares sold within one year of purchase. Class C shares have higher levels of expenses than Class A shares. Class I shares require a minimum account balance of $1,000,000. The $1 million minimum initial investment is waived for retirement plans that trade through omnibus accounts and may be waived in certain other instances where it is believed to be in the best interest of the Fund and its shareholders. Class I shares have no front-end or deferred sales charge and have lower levels of expenses than Class A shares. Class Y shares are generally only available to wrap or similar fee-based programs offered by financial intermediaries, foundations, and endowments that have entered into an agreement with the Fund’s Distributor to offer Class Y shares. Class Y shares have no front-end or deferred sales charge and have lower levels of expenses than Class A shares. Each Class has different: (a) dividend rates due to differences in Distribution Plan expenses and other class specific expenses, (b) exchange privileges and (c) class specific voting rights.
Security Valuation: Net asset value per share is determined every business day as of the close of the regular session of the New York Stock Exchange (generally 4:00 p.m. Eastern time). The Fund uses independent pricing services approved by the Board of Directors (“the Board”) to value its investments wherever possible. Investments for which market quotations are not available or deemed not reliable are fair valued in good faith under the direction of the Board.
The Board has adopted Valuation Procedures (the “Procedures”) to determine the fair value of securities and other financial instruments for which market prices are not readily available or which may not be reliably priced. The Board has delegated the day-to-day responsibility for determining the fair value of assets of the Fund to Calvert Investment Management, Inc. (the “Advisor” or “Calvert”) and has provided these Procedures to govern Calvert in its valuation duties.
Calvert has chartered an internal Valuation Committee to oversee the implementation of these Procedures and to assist it in carrying out the valuation responsibilities that the Board has delegated.
The Valuation Committee meets on a regular basis to review illiquid securities and other investments which may not have readily available market prices. The Valuation Committee’s fair valuation determinations are subject to review, approval and ratification by the Board at its next regularly scheduled meeting covering the calendar quarter in which the fair valuation was determined.
The Valuation Committee utilizes various methods to measure the fair value of the Fund’s investments. U.S. generally accepted accounting principles (GAAP) establishes a disclosure hierarchy that categorizes the inputs to valuation techniques used to value assets and liabilities at measurement date. These inputs are summarized in the three broad levels listed below:
Level 1 - quoted prices in active markets for identical securities
Level 2 - other significant observable inputs (including quoted prices for similar securities, interest rates, prepayment speeds, credit risk, etc.)
Level 3 - significant unobservable inputs (including the Fund’s own assumptions in determining the fair value of investments)
The inputs or methodologies used for valuing securities are not necessarily an indication of the risk associated with investing in those securities.
Changes in valuation techniques may result in transfers in or out of an investment’s assigned level within the hierarchy during the year. Transfers in and/or out of levels are determined based on the fair value of such securities at the end of the year. Valuation techniques used to value the Fund’s investments by major category are as follows:
Equity securities, including restricted securities, for which market quotations are readily available, are valued at the last reported sale price or official closing price as reported by an independent pricing service on the primary market or exchange on which they are traded and are categorized as Level 1 in the hierarchy. In the event there were no sales during the day or closing prices are not available, securities are valued at the last quoted bid price or the last available price and are categorized as Level 2 in the hierarchy. Foreign securities are valued based on quotations from the principal market in which such
calvert.com CALVERT SMALL CAP FUND ANNUAL REPORT 17
securities are normally traded. If events occur after the close of the principal market in which foreign securities are traded, and before the close of business of the Fund, that are expected to materially affect the value of those securities, then they are valued at their fair value taking these events into account and are categorized as Level 2 in the hierarchy. For restricted securities and private placements where observable inputs are limited, assumptions about market activity and risk are used and such securities are categorized as Level 3 in the hierarchy.
Debt securities, including restricted securities, are valued based on evaluated prices received from independent pricing services or from dealers who make markets in such securities and are generally categorized as Level 2 in the hierarchy. Short-term securities of sufficient credit quality with remaining maturities of sixty days or less for which quotations are not readily available are valued at amortized cost, which approximates fair value, and are categorized as Level 2 in the hierarchy.
If a market value cannot be determined for a security using the methodologies described above, or if, in the good faith opinion of the Advisor, the market value does not constitute a readily available market quotation, or if a significant event has occurred that would materially affect the value of the security, the security will be fair valued as determined in good faith by the Valuation Committee.
The Valuation Committee considers a number of factors, including significant unobservable valuation inputs when arriving at fair value. It considers all significant facts that are reasonably available and relevant to the determination of fair value.
The Valuation Committee primarily employs a market-based approach which may use related or comparable assets or liabilities, recent transactions, market multiples, book values, and other relevant information for the investment to determine the fair value of the investment. When more appropriate, the Fund may employ an income-based or cost approach. An income-based valuation approach discounts anticipated future cash flows of the investment to calculate a present amount (discounted). The measurement is based on the value indicated by current market expectations about those future amounts. Discounts may also be applied due to the nature or duration of any restrictions on the disposition of the investments. A cost based approach is based on the amount that currently would be required to replace the service capacity of an asset (current replacement cost). From the seller’s perspective, the price that would be received for the asset is determined based on the cost to a buyer to acquire or construct a substitute asset of comparable utility, adjusted for obsolescence.
The values assigned to fair value investments are based on available information and do not necessarily represent amounts that might ultimately be realized. Further, due to the inherent uncertainty of valuations of such investments, the fair values may differ significantly from the values that would have been used had an active market existed, and the differences could be material. The Valuation Committee employs various methods for calibrating these valuation approaches including a regular review of key inputs and assumptions, transactional back-testing or disposition analysis and reviews of any related market activity.
At September 30, 2015, securities valued at $631,580 or 0.3% of net assets, were fair valued in good faith under the direction of the Board.
The following table summarizes the market value of the Fund's holdings as of September 30, 2015, based on the inputs used to value them:
|
| | | | | | | | | | | | |
| VALUATION INPUTS |
| INVESTMENT IN SECURITIES | LEVEL 1 | LEVEL 2 | LEVEL 3 | TOTAL |
| Equity Securities* |
| $221,814,008 |
| $— |
| $— |
|
| $221,814,008 |
|
| High Social Impact Investments | — |
| 631,580 |
| — |
| 631,580 |
|
| Time Deposit | — |
| 19,931,545 |
| — |
| 19,931,545 |
|
| TOTAL |
| $221,814,008 |
|
| $20,563,125 |
| $— |
|
| $242,377,133 |
|
| | | | | | |
* For further breakdown of equity securities by industry, please refer to the Statement of Net Assets.
There were no transfers between levels during the year.
Restricted Securities: The Fund may invest in securities that are subject to legal or contractual restrictions on resale. Generally, these securities may only be sold publicly upon registration under the Securities Act of 1933 or in transactions exempt from such registration. Information regarding restricted securities is included at the end of the Statement of Net Assets
The Fund may invest in Community Investment Notes issued by the Calvert Social Investment Foundation (the “CSI Foundation”). The CSI Foundation is a 501(c)(3) non-profit organization that receives in-kind support from Calvert and its subsidiaries. The Fund has received an exemptive order from the Securities and Exchange Commission permitting the Fund to make investments in these notes under certain conditions.
18 calvert.com CALVERT SMALL CAP FUND ANNUAL REPORT
Security Transactions and Investment Income: Security transactions are accounted for on trade date. Realized gains and losses are recorded on an identified cost basis and may include proceeds from litigation. Dividend income is recorded on the ex-dividend date or, in the case of dividends on certain foreign securities, as soon as the Fund is informed of the ex-dividend date. Withholding taxes on foreign dividends have been provided for in accordance with the Fund’s understanding of the applicable country’s tax rules and rates. Distributions received on securities that represent a return of capital or capital gain are recorded as a reduction of cost of investments and/or as a realized gain. Interest income, which includes amortization of premium and accretion of discount on debt securities, is accrued as earned. Investment income and realized and unrealized gains and losses are allocated to separate classes of shares based upon the relative net assets of each class. Expenses arising in connection with a specific class are charged directly to that class. Expenses common to the classes are allocated to each class in proportion to their relative net assets.
Distributions to Shareholders: Distributions to shareholders are recorded by the Fund on ex-dividend date. Dividends from net investment income and distributions from net realized capital gains, if any, are paid at least annually. Distributions are determined in accordance with income tax regulations which may differ from U.S. generally accepted accounting principles; accordingly, periodic reclassifications are made within the Fund's capital accounts to reflect income and gains available for distribution under income tax regulations.
Estimates: The preparation of financial statements in conformity with U.S. generally accepted accounting principles requires management to make estimates and assumptions that affect the reported amounts of assets and liabilities and disclosure of contingent assets and liabilities at the date of the financial statements and the reported amounts of increases and decreases in net assets from operations during the reporting period. Actual results could differ from those estimates.
Redemption Fees: The Fund charged a 2% redemption fee on redemptions, including exchanges, made within 30 days of purchase (within seven days for Class I shares). The redemption fee was accounted for as an addition to paid-in capital. This fee was eliminated effective February 2, 2015.
Federal Income Taxes: No provision for federal income or excise tax is required since the Fund intends to continue to qualify as a regulated investment company under the Internal Revenue Code and to distribute substantially all of its taxable earnings.
Management has analyzed the Fund's tax positions taken for all open federal income tax years and has concluded that no provision for federal income tax is required in the Fund's financial statements. A Fund's federal tax return is subject to examination by the Internal Revenue Service for a period of three years.
NOTE B — RELATED PARTY TRANSACTIONS
Calvert Investment Management, Inc. (the “Advisor”) is wholly-owned by Calvert Investments, Inc., which is indirectly wholly-owned by Ameritas Mutual Holding Company. The Advisor provides investment advisory services and pays the salaries and fees of officers and Directors of the Fund who are employees of the Advisor or its affiliates. For its services, the Advisor receives an annual fee, payable monthly, of .70% of the Fund’s average daily net assets. Under the terms of the agreement, $141,180 was payable at year end.
The Advisor has contractually agreed to limit net annual Fund operating expenses through January 31, 2016. The contractual expense caps are 1.37%, 3.19%, 2.12%, .92%, and 1.12%. for Class A, B, C, I, and Y, respectively. For the purpose of this expense limit, operating expenses do not include interest expense, brokerage commissions, taxes or extraordinary expenses. This expense limitation does not limit acquired fund fees and expenses, if any. Under the terms of the agreement, $738 was receivable at year end. The Advisor voluntarily reimbursed Class B shares for expenses of $8,125 for the year ended September 30, 2015.
Calvert Investment Administrative Services, Inc., an affiliate of the Advisor, provides administrative services to the Fund for an annual fee, payable monthly, of .25% for Class A, C and Y shares and .10% for Class I shares, based on their average daily net assets. Under the terms of the agreement, $42,712 was payable at year end.
Calvert Investment Distributors, Inc. (“CID”), an affiliate of the Advisor, is the distributor and principal underwriter for the Fund. Pursuant to Rule 12b-1 under the Investment Company Act of 1940, the Fund has adopted a Distribution Plan that permits the Fund to pay certain expenses associated with the distribution and servicing of its shares. The expenses paid may not exceed .35% and 1.00% annually of average daily net assets of Class A and C, respectively. The amount actually paid by the Fund is an annualized fee, payable monthly, of .25% and 1.00% of the Fund’s average daily net assets of Class A and C shares, respectively. Class I and Class Y shares do not have Distribution Plan expenses. Under the terms of the agreement, $45,465 was payable at year end.
CID received $36,333 as its portion of commissions charged on sales of the Fund’s Class A shares for the year ended September 30, 2015.
Calvert Investment Services, Inc. (“CIS”), an affiliate of the Advisor, acts as shareholder servicing agent for the Fund. For its services, CIS received a fee of $64,124 for the year ended September 30, 2015. Under the terms of the agreement, $5,396 was payable at year end. Boston Financial Data Services, Inc. is the transfer and dividend disbursing agent.
calvert.com CALVERT SMALL CAP FUND ANNUAL REPORT 19
Each Director of the Fund who is not an employee of the Advisor or its affiliates receives an annual retainer of $52,000 ($48,000 prior to January 1, 2015) plus a meeting fee of up to $3,000 for each Board meeting attended. Additional fees of $6,000 ($5,000 prior to January 1, 2015) annually may be paid to the Committee chairs ($10,000 for the Board Chair and the Special Equities Committee chair) and $2,500 annually may be paid to Committee members, plus a Committee meeting fee of $500 for each Committee meeting attended. Eligible Directors may participate in a Deferred Compensation Plan (the "Plan"). Obligations of the Plan will be paid solely out of the Fund’s assets. As of September 30, 2015, approximately $139,063 was deferred under the Plan. Directors’ fees are allocated to each of the funds served.
NOTE C — INVESTMENT ACTIVITY AND TAX INFORMATION
During the year, the cost of purchases and proceeds from sales of investments, other than short-term securities, were $139,725,482 and $139,779,428, respectively.
The tax character of dividends and distributions paid during the year ended September 30, 2015 and September 30, 2014 was as follows:
|
| | | | | | | |
| Distributions Paid From: | 2015 |
| | 2014 |
|
| Ordinary income |
| $2,851,358 |
| | $— |
|
| Long-term capital gains | 23,689,473 |
| | 21,587,696 |
|
| Total |
| $26,540,831 |
| |
| $21,587,696 |
|
As of September 30, 2015, the tax basis components of distributable earnings/(accumulated losses) and the federal tax cost were as follows:
|
| | | |
| Unrealized appreciation |
| $22,301,695 |
|
| Unrealized (depreciation) | (15,909,795 | ) |
| Net unrealized appreciation (depreciation) |
| $6,391,900 |
|
Undistributed ordinary income |
| $6,210,892 |
|
| Undistributed long-term capital gain |
| $14,569,910 |
|
| | |
| Federal income tax cost of investments |
| $235,985,233 |
|
The differences between components of distributable earnings on a tax basis and the amounts reflected in the Statement of Net Assets are primarily due to temporary book-tax differences that will reverse in a subsequent period. These differences are mainly due to wash sales.
Reclassifications, as shown in the table below, have been made to the Fund's components of net assets to reflect income and gains available for distribution (or available capital loss carryovers, as applicable) under income tax law and regulations. These reclassifications are due to permanent book-tax differences and have no impact on net assets.
|
| | | |
| Undistributed net investment income |
| ($103,845 | ) |
| Accumulated net realized gain (loss) |
| $103,845 |
|
NOTE D — LINE OF CREDIT
A financing agreement is in place with the Calvert Funds and State Street Corporation (“SSC”). Under the agreement, SSC provides an unsecured line of credit facility, in the aggregate amount of $50 million ($25 million committed and $25 million uncommitted), accessible by the Funds for temporary or emergency purposes only. Borrowings bear interest at the higher of the London Interbank Offered Rate (LIBOR) or the overnight Federal Funds Rate plus 1.25% per annum. A commitment fee of .20% per annum is incurred on the unused portion of the committed facility. An administrative fee of $25,000 was paid in connection with the uncommitted facility. These fees are allocated to all participating funds. The Fund had no borrowings under the agreement during the year ended September 30, 2015.
NOTE E — SUBSEQUENT EVENTS
At a special meeting of the Fund’s Board of Directors (the “Board”) held on November 24, 2015, the Board approved the recommendation made by Calvert Investment Administrative Services, Inc. (“CIAS”) to standardize and rationalize the administrative fee payable by the Calvert Funds at 12 basis points for all series and all share classes of the Calvert Funds. The change is being implemented in two phases. First, CIAS will voluntarily waive the amount of the existing administrative fee above 12 basis points for the period from December 1, 2015 through January 31, 2016. Second, CIAS and the Fund have entered
20 calvert.com CALVERT SMALL CAP FUND ANNUAL REPORT
into an Amended and Restated Administrative Services Agreement that will establish a 12 basis point administrative fee for all classes of the Fund commencing on February 1, 2016. In the case of any series or share class that currently pays an administrative fee to CIAS that is less than 12 basis points, CIAS has contractually agreed to waive the difference between that lower administrative fee and the 12 basis point fee until January 31, 2018.
In preparing the financial statements as of September 30, 2015, no other subsequent events or transactions occurred that would have required recognition or disclosure in these financial statements.
NOTICE TO SHAREHOLDERS (UNAUDITED)
For the fiscal year ended September 30, 2015, the Fund considers 58.7% of the ordinary dividends paid during the year as qualified dividend income and as eligible for the corporate dividends received deduction in accordance with Section 854 of the Internal Revenue Code. The Fund also considers $23,689,473 of the long-term capital gain distributions paid during the year as capital gain dividends in accordance with Section 852(b)(3)(C) of the Internal Revenue Code.
calvert.com CALVERT SMALL CAP FUND ANNUAL REPORT 21
CALVERT SMALL CAP FUND
FINANCIAL HIGHLIGHTS
|
| | | | | | | | | | | | | | | | | | | | |
| | YEARS ENDED |
| CLASS A SHARES | September 30, 2015 (z) | | September 30, 2014 (z) | | September 30, 2013 (z) | | September 30, 2012 (z) | | September 30, 2011 (z) |
| Net asset value, beginning |
| $22.98 |
| |
| $24.58 |
| |
| $19.36 |
| |
| $15.15 |
| |
| $15.55 |
|
| Income from investment operations: | | | | | | | | | |
| Net investment income (loss) | .04 |
| | (.07) |
| | (.01) |
| | .20 |
| | .02 |
|
| Net realized and unrealized gain (loss) | 1.80 |
| | 1.19 |
| | 6.02 |
| | 4.05 |
| | (.42) |
|
| Total from investment operations | 1.84 |
| | 1.12 |
| | 6.01 |
| | 4.25 |
| | (.40) |
|
| Distributions from: | | | | | | | | | |
| Net investment income | ** |
| | — |
| | (.25) |
| | (.04) |
| | — |
|
| Net realized gain | (2.78) |
| | (2.72) |
| | (.54) |
| | — |
| | — |
|
| Total distributions | (2.78) |
| | (2.72) |
| | (.79) |
| | (.04) |
| | — |
|
| Total increase (decrease) in net asset value | (.94) |
| | (1.60) |
| | 5.22 |
| | 4.21 |
| | (.40) |
|
| Net asset value, ending |
| $22.04 |
| |
| $22.98 |
| |
| $24.58 |
| |
| $19.36 |
| |
| $15.15 |
|
Total return* | 8.18 | % | | 4.69 | % | | 32.42 | % | | 28.12 | % | | (2.56 | %) |
| Ratios to average net assets: A | | | | | | | | | |
| Net investment income (loss) | .19% |
| | (.28%) |
| | (.05%) |
| | 1.13 | % | | .13% |
|
| Total expenses | 1.52 | % | | 1.61 | % | | 1.67 | % | | 1.78 | % | | 1.81 | % |
| Expenses before offsets | 1.37 | % | | 1.53 | % | | 1.67 | % | | 1.69 | % | | 1.69 | % |
| Net expenses | 1.37 | % | | 1.53 | % | | 1.67 | % | | 1.69 | % | | 1.69 | % |
| Portfolio turnover | 59 | % | | 103 | % | | 82 | % | | 3 | % | | 9 | % |
| Net assets, ending (in thousands) |
| $154,728 |
| |
| $134,128 |
| |
| $129,407 |
| |
| $95,189 |
| |
| $81,374 |
|
| | |
| (z) | Per share figures are calculated using the Average Shares Method. |
| ** | Amount is less than $.01 per share. |
| * | Total return is not annualized for periods of less than one year and does not reflect deduction of any front-end or deferred sales charge. |
| A | Total expenses do not reflect amounts reimbursed and/or waived by the Advisor or reductions from expense offset arrangements. Expenses before offsets reflect expenses after reimbursement and/or waiver by the Advisor but prior to reductions from expense offset arrangements. Net expenses are net of all reductions and represent the net expenses paid by the Fund. |
| See notes to financial statements. |
22 calvert.com CALVERT SMALL CAP FUND ANNUAL REPORT
CALVERT SMALL CAP FUND
FINANCIAL HIGHLIGHTS
|
| | | | | | | | | | | | | | | | | | | | |
| | YEARS ENDED |
| CLASS C SHARES | September 30, 2015 (z) | | September 30, 2014 (z) | | September 30, 2013 (z) | | September 30, 2012 (z) | | September 30, 2011 (z) |
| Net asset value, beginning |
| $21.12 |
| |
| $22.98 |
| |
| $18.08 |
| |
| $14.25 |
| |
| $14.77 |
|
| Income from investment operations: | | | | | | | | | |
| Net investment income (loss) | (.12) |
| | (.23) |
| | (.17) |
| | .03 |
| | (.15) |
|
| Net realized and unrealized gain (loss) | 1.66 |
| | 1.09 |
| | 5.65 |
| | 3.80 |
| | (.37) |
|
| Total from investment operations | 1.54 |
| | .86 |
| | 5.48 |
| | 3.83 |
| | (.52) |
|
| Distributions from: | | | | | | | | | |
| Net investment income | — |
| | — |
| | (.04) |
| | — |
| | — |
|
| Net realized gain | (2.78) |
| | (2.72) |
| | (.54) |
| | — |
| | — |
|
| Total distributions | (2.78) |
| | (2.72) |
| | (.58) |
| | — |
| | — |
|
| Total increase (decrease) in net asset value | (1.24) |
| | (1.86) |
| | 4.90 |
| | 3.83 |
| | (.52) |
|
| Net asset value, ending |
| $19.88 |
| |
| $21.12 |
| |
| $22.98 |
| |
| $18.08 |
| |
| $14.25 |
|
Total return* | 7.38 | % | | 3.81 | % | | 31.35 | % | | 26.88 | % | | (3.52 | %) |
| Ratios to average net assets: A | | | | | | | | | |
| Net investment income (loss) | (.56%) |
| | (1.06 | %) | | (.86%) |
| | .19% |
| | (.87%) |
|
| Total expenses | 2.36 | % | | 2.38 | % | | 2.49 | % | | 2.64 | % | | 2.74 | % |
| Expenses before offsets | 2.12 | % | | 2.31 | % | | 2.49 | % | | 2.64 | % | | 2.69 | % |
| Net expenses | 2.12 | % | | 2.31 | % | | 2.49 | % | | 2.64 | % | | 2.69 | % |
| Portfolio turnover | 59 | % | | 103 | % | | 82 | % | | 3 | % | | 9 | % |
| Net assets, ending (in thousands) |
| $15,887 |
| |
| $14,156 |
| |
| $13,726 |
| |
| $9,907 |
| |
| $8,618 |
|
| | |
| (z) | Per share figures are calculated using the Average Shares Method. |
| * | Total return is not annualized for periods of less than one year and does not reflect deduction of any front-end or deferred sales charge. |
| A | Total expenses do not reflect amounts reimbursed and/or waived by the Advisor or reductions from expense offset arrangements. Expenses before offsets reflect expenses after reimbursement and/or waiver by the Advisor but prior to reductions from expense offset arrangements. Net expenses are net of all reductions and represent the net expenses paid by the Fund. |
| See notes to financial statements. |
calvert.com CALVERT SMALL CAP FUND ANNUAL REPORT 23
CALVERT SMALL CAP FUND
FINANCIAL HIGHLIGHTS
|
| | | | | | | | | | | | | | | | | | | | |
| | YEARS ENDED |
| CLASS I SHARES | September 30, 2015 (z) | | September 30, 2014 (z) | | September 30, 2013 (z) | | September 30, 2012 (z) | | September 30, 2011 (z) |
| Net asset value, beginning |
| $24.14 |
| |
| $25.56 |
| |
| $20.06 |
| |
| $15.80 |
| |
| $16.14 |
|
| Income from investment operations: | | | | | | | | | |
| Net investment income | .16 |
| | .08 |
| | .16 |
| | .35 |
| | .17 |
|
| Net realized and unrealized gain (loss) | 1.90 |
| | 1.22 |
| | 6.24 |
| | 4.21 |
| | (.45) |
|
| Total from investment operations | 2.06 |
| | 1.30 |
| | 6.40 |
| | 4.56 |
| | (.28) |
|
| Distributions from: | | | | | | | | | |
| Net investment income | (.08) |
| | — |
| | (.36) |
| | (.30) |
| | (.06) |
|
| Net realized gain | (2.78) |
| | (2.72) |
| | (.54) |
| | — |
| | — |
|
| Total distributions | (2.86) |
| | (2.72) |
| | (.90) |
| | (.30) |
| | (.06) |
|
| Total increase (decrease) in net asset value | (.80) |
| | (1.42) |
| | 5.50 |
| | 4.26 |
| | (.34) |
|
| Net asset value, ending |
| $23.34 |
| |
| $24.14 |
| |
| $25.56 |
| |
| $20.06 |
| |
| $15.80 |
|
Total return* | 8.72 | % | | 5.27 | % | | 33.43 | % | | 29.11 | % | | (1.81 | %) |
| Ratios to average net assets: A | | | | | | | | | |
| Net investment income | .64% |
| | .33% |
| | .71% |
| | 1.88 | % | | .90 | % |
| Total expenses | .91% |
| | .95% |
| | .98% |
| | 1.03 | % | | 1.08 | % |
| Expenses before offsets | .91% |
| | .92% |
| | .92% |
| | .92% |
| | .92 | % |
| Net expenses | .91% |
| | .92% |
| | .92% |
| | .92% |
| | .92 | % |
| Portfolio turnover | 59 | % | | 103 | % | | 82 | % | | 3 | % | | 9 | % |
| Net assets, ending (in thousands) |
| $61,669 |
| |
| $54,563 |
| |
| $46,198 |
| |
| $26,129 |
| |
| $17,895 |
|
| | |
| (z) | Per share figures are calculated using the Average Shares Method. |
| * | Total return is not annualized for periods of less than one year and does not reflect deduction of any front-end or deferred sales charge. |
| A | Total expenses do not reflect amounts reimbursed and/or waived by the Advisor or reductions from expense offset arrangements. Expenses before offsets reflect expenses after reimbursement and/or waiver by the Advisor but prior to reductions from expense offset arrangements. Net expenses are net of all reductions and represent the net expenses paid by the Fund. |
| See notes to financial statements. |
24 calvert.com CALVERT SMALL CAP FUND ANNUAL REPORT
CALVERT SMALL CAP FUND
FINANCIAL HIGHLIGHTS
|
| | | | | | | | | |
| | | PERIODS ENDED | |
| CLASS Y SHARES | September 30, 2015 (z) | | September 30, 2014 (z)# | |
| Net asset value, beginning |
| $23.06 |
| |
| $25.36 |
| |
| Income from investment operations: | | | | |
| Net investment income | .09 |
| | .03 |
| |
| Net realized and unrealized gain (loss) | 1.82 |
| | .39 |
| |
| Total from investment operations | 1.91 |
| | .42 |
| |
| Distributions from: | | | | |
| Net investment income | (.01) |
| | — |
| |
| Net realized gain | (2.78) |
| | (2.72) |
| |
| Total distributions | (2.79) |
| | (2.72) |
| |
| Total increase (decrease) in net asset value | (.88) |
| | (2.30) |
| |
| Net asset value, ending |
| $22.18 |
| |
| $23.06 |
| |
Total return* | 8.45 | % | | 1.81 | % | |
| Ratios to average net assets: A | | | | |
| Net investment income | .39% |
| | .14%(a) |
| |
| Total expenses | 1.31 | % | | 2.20%(a) |
| |
| Expenses before offsets | 1.12 | % | | 1.16%(a) |
| |
| Net expenses | 1.12 | % | | 1.16%(a) |
| |
| Portfolio turnover | 59 | % | | 103 | % | |
| Net assets, ending (in thousands) |
| $10,084 |
| |
| $4,406 |
| |
| | |
| (z) | Per share figures are calculated using the Average Shares Method. |
| # | From October 18, 2013 inception. |
| * | Total return is not annualized for periods of less than one year and does not reflect deduction of any front-end or deferred sales charge. |
| A | Total expenses do not reflect amounts reimbursed and/or waived by the Advisor or reductions from expense offset arrangements. Expenses before offsets reflect expenses after reimbursement and/or waiver by the Advisor but prior to reductions from expense offset arrangements. Net expenses are net of all reductions and represent the net expenses paid by the Fund. |
| (a) | Annualized. |
| See notes to financial statements. |
calvert.com CALVERT SMALL CAP FUND ANNUAL REPORT 25
EXPLANATION OF FINANCIAL TABLES
SCHEDULE OF INVESTMENTS
The Schedule of Investments is a snapshot of all securities held in the fund at their market value, on the last day of the reporting period. Securities are listed by asset type (e.g., common stock, corporate bonds, U.S. government obligations) and may be further broken down into sub-groups and by industry classification.
STATEMENT OF ASSETS AND LIABILITIES
The Statement of Assets and Liabilities is often referred to as the fund’s balance sheet. It lists the value of what the fund owns, is due and owes on the last day of the reporting period. The fund’s assets include the market value of securities owned, cash, receivables for securities sold and shareholder subscriptions, and receivables for dividends and interest payments that have been earned, but not yet received. The fund’s liabilities include payables for securities purchased and shareholder redemptions, and expenses owed but not yet paid. The statement also reports the fund’s net asset value (NAV) per share on the last day of the reporting period. The NAV is calculated by dividing the fund’s net assets (assets minus liabilities) by the number of shares outstanding. This statement is accompanied by a Schedule of Investments. Alternatively, if certain conditions are met, a Statement of Net Assets may be presented in lieu of this statement and the Schedule of Investments.
STATEMENT OF NET ASSETS
The Statement of Net Assets provides a detailed list of the fund’s holdings, including each security’s market value on the last day of the reporting period. The Statement of Net Assets includes a Schedule of Investments. Other assets are added and other liabilities subtracted from the investments total to calculate the fund’s net assets. Finally, net assets are divided by the outstanding shares of the fund to arrive at its share price, or Net Asset Value (NAV) per share.
At the end of the Statement of Net Assets is a table displaying the composition of the fund’s net assets. Paid in Capital is the money invested by shareholders and represents the bulk of net assets. Undistributed Net Investment Income and Accumulated Net Realized Gains usually approximate the amounts the fund had available to distribute to shareholders as of the statement date. Accumulated Realized Losses will appear as negative balances. Unrealized Appreciation (Depreciation) is the difference between the market value of the fund’s investments and their cost, and reflects the gains (losses) that would be realized if the fund were to sell all of its investments at their statement-date -values.
STATEMENT OF OPERATIONS
The Statement of Operations summarizes the fund’s investment income earned and expenses incurred in operating the fund. Investment income includes dividends earned from stocks and interest earned from interest-bearing securities in the fund. Expenses incurred in operating the fund include the advisory fee paid to the investment advisor, administrative services fees, distribution plan expenses (if applicable), transfer agent fees, shareholder servicing expenses, custodial, legal, and audit fees, and the printing and postage expenses related to shareholder reports. Expense offsets (fees paid indirectly) may also be shown. Credits earned from offset arrangements may be used to reduce the fund’s expenses. This statement also shows net gains (losses) realized on the sale of investments and the increase or decrease in the unrealized appreciation (depreciation) on investments held during the period.
STATEMENT OF CHANGES IN NET ASSETS
The Statement of Changes in Net Assets shows how the fund’s total net assets changed during the two most recent reporting periods. Changes in the fund’s net assets are attributable to investment operations, distributions and capital share transactions.
The Operations section of the report summarizes information detailed in the Statement of Operations. The Distribution section shows the dividend and capital gain distributions made to shareholders. The amounts shown as distributions in this section may not match the net investment income and realized gains amounts shown in the Operations section because distributions are determined on a tax basis and certain investments or transactions may be treated differently for financial statement and tax purposes. The Capital Share Transactions section shows the amount shareholders invested in the fund, either by purchasing shares or by reinvesting distributions, and the amounts redeemed. The corresponding numbers of shares issued, reinvested and redeemed are shown at the end of the report.
FINANCIAL HIGHLIGHTS
The Financial Highlights table provides a per-share breakdown per class of the components that affect the fund’s net asset value for current and past reporting periods. The table provides total return, total distributions, expense ratios, portfolio turnover and net assets for the applicable period. Total return is a measure of a fund’s performance that encompasses all elements of return: dividends, capital gain distributions and changes in net asset value. Total return is the change in value of an investment over a given period, assuming reinvestment of any dividends and capital gain distributions, expressed as a percentage of the initial investment. Total distributions include distributions from net investment income and net realized gains. Long-term gains are earned on securities held in the fund more than one year. Short-term gains, on the sale of securities held less than one year, are treated as ordinary dividend income for tax purposes. The expense ratio is a fund’s cost of doing business, expressed as a
26 calvert.com CALVERT SMALL CAP FUND ANNUAL REPORT (UNAUDITED)
percentage of net assets. These expenses directly reduce returns to shareholders. Portfolio turnover measures the trading activity in a fund’s investment portfolio—how often securities are bought and sold by a fund. Portfolio turnover is affected by market conditions, changes in the size of the fund, the nature of the fund’s investments and the investment style of the portfolio manager.
PROXY VOTING
The Proxy Voting Guidelines of the Calvert Funds that the Fund uses to determine how to vote proxies relating to portfolio securities are provided as an Appendix to the Fund’s Statement of Additional Information. The Statement of Additional Information can be obtained free of charge by calling the Fund at 1-800-368-2745, by visiting the Calvert website at www.calvert.com; or by visiting the SEC’s website at www.sec.gov.
Information regarding how the Fund voted proxies relating to portfolio securities during the most recent 12-month period ended June 30 is available on the Fund’s website at www.calvert.com and on the SEC’s website at www.sec.gov.
AVAILABILITY OF QUARTERLY PORTFOLIO HOLDINGS
The Fund files its complete schedule of portfolio holdings with the SEC for the first and third quarters of each fiscal year on Form N-Q. The Fund’s Form N-Q is available on the SEC’s website at www.sec.gov. The Fund’s Form N-Q may be reviewed and copied at the SEC’s Public Reference Room in Washington, DC; information on the operation of the Public Reference Room may be obtained by calling 1-800-SEC-0330.
calvert.com CALVERT SMALL CAP FUND ANNUAL REPORT (UNAUDITED) 27
DIRECTOR AND OFFICER INFORMATION TABLE
|
| | | | | |
| Name & Age | Position With Fund | Position Start Date | Principal Occupation During Last 5 Years | # of Calvert Portfolios Overseen | Other Directorships During the Past Five Years |
| INDEPENDENT TRUSTEES/DIRECTORS |
REBECCA L. ADAMSON AGE: 66 | Trustee Director Director Director | 1989 CSIF 2000 IMPACT 2000 CRIS 2005 CWVF | President of the national non-profit, First People’s Worldwide, formerly First Nations Financial Project. Founded by her in 1980, First People’s Worldwide is the only American Indian alternative development institute in the country. | 18 | • Bay & Paul Foundation |
RICHARD L. BAIRD, JR. AGE: 67 | Trustee & Chair Director & Chair Director & Chair Director & Chair
| 1982 CSIF
2000 CRIS
2005 CWVF
2005 IMPACT | Former President and CEO of Adagio Health Inc. (retired in 2014) in Pittsburgh, PA, a non-profit corporation which provides family planning services, nutrition, maternal/child health care, and various health screening services and community preventive health programs. | 25 | |
JOHN G. GUFFEY, JR. AGE: 67 | Director Trustee Director Director | 1992 CWVF 1982 CSIF 2000 CRIS 2005 IMPACT | President of Aurora Press Inc., a privately held publisher of trade paperbacks. | 25 | • Ariel Funds (3) (asset management) (through 12/31/11) • Calvert Social Investment Foundation • Calvert Ventures, LLC |
MILES D. HARPER, III AGE: 52 | Director Trustee Director Director | 2000 IMPACT 2005 CSIF 2005 CRIS 2005 CWVF | Partner, Carr Riggs & Ingram (public accounting firm) since September 2013. Partner, Gainer Donnelly & Desroches (public accounting firm) (now Carr Riggs & Ingram), 1999-2013. | 18 | • Bridgeway Funds (14) (asset management) |
JOY V. JONES AGE: 65 | Director Trustee Director Director | 2000 IMPACT 1990 CSIF 2000 CRIS 2005 CWVF | Attorney. | 18 | • Director, Conduit Street Restaurants SUD 2 Limited • Director, Palm Management Corporation |
TERRENCE J. MOLLNER, Ed.D. AGE: 70 | Director Trustee Director Director | 1992 CWVF 1982 CSIF 2000 CRIS 2005 IMPACT | Founder, Chairperson and President of Trusteeship Institute, Inc., an educational organization focused on the personal skills and organizations described in Dr. Mollner’s book, The Love Skill: We Are Mastering the 7 Layers of Human Maturity, particularly businesses that freely chose to give priority to the common good. Chairperson, Stakeholders Capital, Inc., an asset management firm and financial services provider.
| 18 | • Calvert Social Investment Foundation • Ben & Jerry’s Homemade, Inc. (food products) |
SYDNEY A. MORRIS AGE: 66 | Trustee Director Director Director | 1982 CSIF 2000 CRIS 2005 CWVF 2005 IMPACT | The Rev. Dr. Morris is a Unitarian Universalist minister. | 18 | |
28 calvert.com CALVERT SMALL CAP FUND ANNUAL REPORT (UNAUDITED)
|
| | | | | |
| Name & Age | Position With Fund | Position Start Date | Principal Occupation During Last 5 Years | # of Calvert Portfolios Overseen | Other Directorships During the Past Five Years |
| INTERESTED TRUSTEES/DIRECTORS |
D. WAYNE SILBY, Esq.* AGE: 67 | Director Trustee Director Director | 1992 CWVF 1982 CSIF 2000 CRIS 2000 IMPACT | Mr. Silby is the founding Chair of the Calvert Funds. He is the Chair-Elect and a principal of Syntao.com, a Beijing-based company promoting corporate social responsibility. | 25 | • Ameritas Mutual Holding Company (insurance) • Calvert Social Investment Foundation • ImpactAssets, Inc. (asset management) • Committee for the Future (charitable supporting organization) • Syntao.com China (HK) (sustainability consulting) • The ICE Organization (environmental services) |
JOHN H. STREUR* AGE: 55 | Director & President Trustee & President Director & President Director & President | 2015 CWVF
2015 CSIF
2015 CRIS
2015 IMPACT | President and Chief Executive Officer of Calvert Investments, Inc. (since January 2015) and Chief Compliance Officer for the Advisor and Calvert Investment Distributors, Inc. (since August 10, 2015) President and Director, Portfolio 21 Investments, Inc. (through October 2014) President, Chief Executive Officer and Director, Managers Investment Group LLC (through January 2012) President and Director, The Managers Funds and Managers AMG Funds (through January 2012). | 38 | • Portfolio 21 Investments, Inc. (asset management)(through October 2014) • Managers Investment Group LLC (asset management)(through January 2012) • The Managers Funds (asset management) (through January 2012) • Managers AMG Funds (asset management) (through January 2012) • Calvert Social Investment Foundation |
calvert.com CALVERT SMALL CAP FUND ANNUAL REPORT (UNAUDITED) 29
|
| | | |
| Name & Age | Position With Fund | Position Start Date | Principal Occupation During Last 5 Years |
| OFFICERS |
SUSAN WALKER BENDER, Esq. AGE: 56 | Assistant Vice President & Assistant Secretary | 1988 CSIF 2000 CRIS 1992 CWVF 2000 Impact | Assistant Vice President, Assistant Secretary and Associate General Counsel of Calvert Investments, Inc. |
VICKI L. BENJAMIN AGE: 54 | Treasurer | 2015 | Executive Vice President and Chief Financial Officer of Calvert Investments, Inc. since March 2015. Prior to Calvert, Ms. Benjamin was a Senior Partner at KPMG. |
ROBERT D. BENSON, ESQ. AGE: 36 | Assistant Vice President & Assistant Secretary | 2014 | Assistant General Counsel (since 2014), Assistant Vice President & Assistant Secretary (since 2015) and Staff Attorney (prior to 2014), Calvert Investments, Inc. |
HOPE BROWN AGE: 42 | Chief Compliance Officer | 2014 | Chief Compliance Officer for the Calvert Funds (since 2014). Vice President and Chief Compliance Officer, Wilmington Funds (2012-2014). Vice President and Senior Compliance Officer, Wilmington Trust Investment Advisors, Inc. (2010-2012). Assistant Vice President, Lead Manager, Risk Management and Divisional Compliance, T. Rowe Price Associates, Inc. (2005-2010). |
THOMAS DAILEY AGE: 51 | Vice President | 2004 | Vice President of the Advisor and lead portfolio manager for Calvert’s municipal funds. |
MATTHEW DUCH Age: 40 | Vice President | 2011 | Vice President of the Advisor (since 2011) and portfolio manager for Calvert’s taxable fixed-income funds. |
IVY WAFFORD DUKE, Esq. AGE: 47 | Vice President & Secretary | 1996 CSIF 2000 CRIS 1996 CWVF 2000 Impact | Vice President, Acting Secretary and Acting General Counsel (Deputy General Counsel prior to 2015) of Calvert Investments, Inc. Prior to August 10, 2015, Ms. Duke was also Chief Compliance Officer for the Advisor and Calvert Investment Distributors, Inc. |
ROBERT J. ENDERSON, CFA AGE: 57 | Assistant Treasurer | 2014 | Acting Chief Financial Officer (September 2014-March 2015) and Vice President, Corporate Finance, of Calvert Investments, Inc. |
PATRICK FAUL AGE: 50 | Vice President | 2010 | Vice President and Head of Credit Research for the Advisor. |
TRACI L. GOLDT AGE: 42 | Assistant Secretary | 2004 | SEC Filing and Administrative Operations Manager (since 2011) and Executive Assistant to General Counsel (prior to 2011), Calvert Investments, Inc. |
VISHAL KHANDUJA, CFA AGE: 37 | Vice President | 2014 | Vice President of Calvert Investment Management, Inc. (since 2014) and portfolio manager for Calvert’s taxable fixed-income funds since 2012. Previously worked at Columbia Management as Portfolio Manager - Global Rates and Currency Team (2009-2012). |
LANCELOT A. KING, Esq. AGE: 45 | Assistant Vice President & Assistant Secretary | 2002 | Assistant Vice President, Assistant Secretary and Associate General Counsel of Calvert Investments, Inc. |
ANDREW K. NIEBLER, Esq. AGE: 48 | Assistant Vice President & Assistant Secretary | 2006 | Assistant Vice President, Assistant Secretary and Associate General Counsel of Calvert Investments, Inc. |
MARYBETH PILAT, CPA AGE: 47 | Fund Controller and Assistant Treasurer | 2015 | Director of Fund Administration, Calvert Investment Administrative Services, Inc. since August 2015. VP Expense & Budgeting, Global Fiduciary Platform, Legg Mason (May 2015 - July 2015). Vice President and Assistant Treasurer, Columbia Funds, Ameriprise, Columbia Management (2010 - April 2015). |
CATHERINE P. ROY AGE: 59 | Vice President | 2004 | Senior Vice President of the Advisor and Chief Investment Officer – Fixed Income. |
NATALIE A. TRUNOW AGE: 47 | Vice President | 2008 | Senior Vice President of the Advisor and Chief Investment Officer – Equities. |
* Mr. Streur is an interested person of the Funds since he is an Officer and Director of each Fund’s Advisor and certain affiliates. Mr. Silby is an interested person of the Funds since he is a Director of the parent company of each Fund’s Advisor. The address of Trustees/Directors and Officers is 4550 Montgomery Avenue, Suite 1000N, Bethesda, Maryland 20814, except Mr. Silby’s address is 1715 18th Street, N.W., Washington, DC 20009. Additional information about the Fund’s Trustees/Directors can be found in the Statement of Additional Information (SAI). You can get a free copy of the SAI at www.calvert.com, or by contacting your broker, or the Fund at 1-800-368-2745. |
30 calvert.com CALVERT SMALL CAP FUND ANNUAL REPORT (UNAUDITED)
|
|
| This page intentionally left blank. |
|
|
| This page intentionally left blank. |
|
|
| This page intentionally left blank. |
To Open an Account
800-368-2748
Service for Existing Account
Shareholders: 800-368-2745
Brokers: 800-368-2746
Registered Mail
Calvert Investments
c/o BFDS,
P.O. Box 219544
Kansas City, MO 64121-9544
Overnight Mail
Calvert Investments
c/o BFDS,
330 West 9th Street
Kansas City, MO 64105
Web Site
calvert.com
Principal Underwriter
Calvert Investment Distributors, Inc.
4550 Montgomery Avenue
Suite 1000 North
Bethesda, Maryland 20814
|
| | | |
| CALVERT SMALL CAP FUND | CALVERT’S FAMILY OF FUNDS | | |
| | Municipal Funds Tax-Free Responsible Impact Bond Fund Taxable Bond Funds Bond Portfolio Income Fund Short Duration Income Fund Long-Term Income Fund Ultra-Short Income Fund High Yield Bond Fund Green Bond Fund Unconstrained Bond Fund Balanced and Asset Allocation Funds Balanced Portfolio Conservative Allocation Fund Moderate Allocation Fund Aggressive Allocation Fund | | Equity Funds Large Cap Core Portfolio Equity Portfolio Global Value Fund U.S. Large Cap Core Responsible Index Fund U.S. Large Cap Value Responsible Index Fund U.S. Large Cap Growth Responsible Index Fund U.S. Mid Cap Core Responsible Index Fund Developed Markets EX-U.S. Responsible Index Fund Capital Accumulation Fund International Equity Fund Small Cap Fund Global Energy Solutions Fund Global Water Fund International Opportunities Fund Global Equity Income Fund Emerging Markets Equity Fund |
This report is intended to provide fund information to shareholders. It is not authorized for distribution to prospective investors unless preceded or accompanied by a prospectus. Note: The information on our website is not incorporated by reference into this report; our website address is included as an inactive textual reference only. Investors should carefully consider the investment objectives, risks, charges and expenses of the Calvert Funds. This and other important information is contained in the fund’s summary prospectus and prospectus, which can be obtained from your financial professional and should be read carefully before investing. You may also call Calvert at 800/368-2748 or visit calvert.com. Printed on recycled paper using soy inks. |
| | | | |
|
| | |
| | |
| | | |
Calvert Solution Strategies™ • Calvert Global Energy Solutions Fund• Calvert Global Water Fund
| | |
| | | |
| | |
|
| |
Annual Report September 30, 2015 E-Delivery Sign-Up — Details Inside | |
|
|
| |
Choose Planet-friendly E-delivery! Sign up now for on-line statements, prospectuses, and fund reports. In less than five minutes you can help reduce paper mail and lower fund costs. Just go to calvert.com. If you already have an online account at Calvert, click on Login, to access your Account, and select the documents you would like to receive via e-mail. If you’re new to online account access, click on Login, then Register to create your user name and password. Once you’re in, click on the E-delivery sign-up on the Account Portfolio page and follow the quick, easy steps. Note: if your shares are not held directly at Calvert but through a brokerage firm, you must contact your broker for electronic delivery options available through their firm. |
|
| | | |
| | | TABLE OF CONTENTS |
| | | | |
| | | | President's Letter |
| | | | Portfolio Management Discussion |
| | | | Understanding Your Fund's Expenses |
| | | | Report of Independent Registered Public Accounting Firm |
| | | | Statement of Net Assets |
| | | | Statements of Operations |
| | | | Statements of Changes in Net Assets |
| | | | Notes to Financial Statements |
| | | | Financial Highlights |
| | | | Explanation of Financial Tables |
| | | | Proxy Voting |
| | | | Availability of Quarterly Portfolio Holdings |
| | | | Director and Officer Information Table |
|
| |
| John Streur President and Chief Executive Officer, Calvert Investments, Inc. |
Dear Shareholders,
Global economic growth is vital to the improvement of the lives of all people, especially so to those of the ultra-poor. However, how that growth is achieved is critical to the long-term health and sustainability of our collective societies. Business activity that does not show consideration for environmental and social impacts may have calamitous consequences, many of which we are witnessing now, including political and social unrest, unjust wealth distribution and diminished bio-diversity.
The returns of the markets (chart below) reflect the impact of the uncertainty created by a legacy of unsustainable development and the current lack of positive economic growth trends. The steep decline in the emerging market equities index (reflective of the flight of capital and currency weakness) is particularly impactful as these regions include some of the largest populations of individuals most in need of sustainable and inclusive economic development.
|
| | | | |
| MARKET BENCHMARKS | Total Returns for the period ended 9/30/2015 |
| 6 Months | Year-to-Date | 1 Year | 5 Year |
| S&P 500 | -6.18% | -5.29% | -0.61% | 13.34% |
| Russell 1000 | -6.72% | -5.24% | -0.61% | 13.42% |
| Russell 3000 | -7.12% | -5.45% | -0.49% | 13.28% |
| MSCI World ex USA | -9.88% | -6.32% | -9.73% | 3.92% |
| MSCI Emerging Markets | -17.11% | -15.22% | -18.98% | -3.25% |
| Barclays U.S. Aggregate Bond | -0.47% | 1.13% | 2.94% | 3.10% |
| Barclays Global Aggregate | -0.34% | -2.25% | -3.26% | 0.81% |
| Returns for periods greater than one year have been annualized. |
In an effort to mitigate this issue and foster the long term sustainability and justice of our global economic system, many of the world’s leaders participated with the United Nations (“UN”) to design and implement a 15-year plan to create the kind of economic development (http://www.calvert.com/media-relations/press-releases/calvert-ceo-participates-in-the-un-sustainable-development-summit) that should benefit the poorest people in the world, preserve opportunities for future generations, and provide stewardship to the environment. This effort, which kicked-off at the UN Summit earlier this month, involves bringing together private enterprise, governments, NGOs, development banks and people of all walks of life to achieve the “Sustainable Development Goals 2015” (SDGs). These goals include: eliminating extreme poverty, eliminating extreme hunger, fostering good health for all, promoting gender equality, and creating environmental sustainability and peace and stability throughout the world. The SDGs impact residents of every country in some manner, but no one more acutely than the denizens of the developing and emerging nations.
It was my privilege, as Calvert’s CEO, to be invited to the Summit, as one of 350 global leaders asked to participate in the development of this critical 15-year sustainability plan. During the course of this event, I announced that Calvert Investments would lead a project (http://www.calvert.com/perspective/social-impact/calvert-un-sustainable-development-goals) to map the Sustainable Development Goals to standards that companies can be measured by, and that investors may look to in order to
4 calvert.com CALVERT SOLUTION STRATEGIES ANNUAL REPORT (UNAUDITED)
understand which companies are helping to create sustainable, responsible growth. It is integral to the success and achievement of the goals, that the largest holders of capital, i.e., corporations, help drive these initiatives.
The crucial role that corporations now play in creating social and environmental outcomes was highlighted at the UN sessions by the presence of CEOs and sustainability officers from around the world, and the vital role of investors and the capital markets was reflected by our presence and contribution. In addition to representing your interests at the UN event, Calvert has contributed to the understanding of the role that corporations and investors play in driving social and environmental conditions through our most recent research, “The Role of the Corporation in Society”, available to you on our website, (see http://www.calvert.com/perspective/governance/calvert-serafeim-series-report).
Despite the fact that the past year has not brought the financial returns that you or I would have wished for as investors, I believe that when we look back on 2015 several years from now we are likely to see it as a transformative year in terms of our economic and social systems. Individuals and organizations of all types — corporate, government, NGO, religious — are coming together due to the realization that we need a more sustainable and just system to serve the needs of all stakeholders. As a shareholder of Calvert Funds, you are very much part of this mission, as together we are a leader and innovator in connecting capital to mission, with the dual purpose of driving competitive investment returns with just and sustainable economic progress.
On behalf of all of us at Calvert Investments, thank you for the confidence you have placed in our management of your funds and the ongoing privilege to serve you. We appreciate the opportunity to work with you as we strive to meet your financial needs while also helping to render the world a better place for all people.
Respectfully,
John Streur
October 2015
calvert.com CALVERT SOLUTION STRATEGIES ANNUAL REPORT (UNAUDITED) 5
|
| |
| PORTFOLIO MANAGEMENT DISCUSSION |
|
| |
| Treasa Ni Chonghaile of Kleinwort Benson Investors International, Ltd. |
|
| |
| Colm O'Connor of Kleinwort Benson Investors International, Ltd. |
Performance
The year ended September 30, 2015 was a volatile period for equity markets in general. It was a particularly difficult period for an energy strategy because of the dramatic fall in oil prices, which led to energy and materials being the two worst performing industry groups in the broader equity market.
For the period, Global Energy Solutions Fund Class A shares (at NAV) declined 18.87% and its benchmark, the Ardour Global Alternative Energy Index, declined 17.32%. Relative underperformance was driven principally by the strong performance of two benchmark stocks — Vestas Wind Systems and, to a lesser extent, Tesla Motors, which we consider unattractively valued and do not hold. Combined, the two stocks account for almost 20% of the Ardour index.
Investment Process
The Calvert Global Energy Solutions Fund is a high conviction, global, long-only equity strategy that is constructed through three interactive components: theme definition and investment universe, sector allocation, and stock selection. In the theme definition component, we seek to precisely define each theme and the companies in its investment universe to assure that the opportunity set for investment is representative of the unique drivers of each theme. In order to qualify for inclusion in a theme, companies must meet one of the following revenue criteria: pure plays must have a minimum of 50% of revenue from the relevant theme; market leaders must have a minimum of 10% of revenue from the theme.
Market Review
Shares in all energy-related stocks sold off sharply as oil prices hit five-year lows in the fourth quarter of 2014 and into January of this year. Renewable energy stocks were particularly affected during the rout of energy-related companies. Wind and solar companies were out of favor even though a lower oil price does not have an impact on the fundamentals of these companies because renewable power is usually sold through multiyear, long-term contracts. The Fund was underweight to renewable energy relative to the Ardour Global Alternative Energy Index, and this had a positive impact on relative performance during both the fourth quarter of 2014 and third quarter of 2015. February saw the first monthly gain in oil prices in seven months, leading to a more positive sentiment toward the renewable energy sector. We had strategically increased our renewable holdings after the sell-off, and that led to a positive contribution during the first quarter. The solar sector rallied the most, following several months of disappointing performance. The volatility continued for equity markets in the second quarter of 2015, and most markets ended in negative territory due to concerns surrounding Greece's potential exit from the euro and a sell-off in the mainland China market.
Energy efficiency stocks were less affected by sharply declining oil prices, and the sector made a positive contribution to the Fund's performance in the one-year period relative to the Ardour index. Companies generally reported better building efficiency order activity in North America, and more positive data on improving momentum in institutional markets reassured investors. Light-emitting-diode stocks were also relatively strong and were led by the Austrian lighting company Zumtobel Group as the pace of adoption continued to quicken. European industrial and construction-related companies generally fared well, aided by strong earnings results coupled with improving macroeconomic data points. Energy efficiency-related stocks, especially the more cyclical industrials, did weaken in the June and July period as worries over industrial capital spending returned to the market.
In this volatile environment, our utilities holdings, which are more defensive stocks, provided a positive contribution to the Fund's relative performance.
6 calvert.com CALVERT SOLUTION STRATEGIES ANNUAL REPORT (UNAUDITED)
|
| | | | |
| | | | |
| | CALVERT GLOBAL ENERGY SOLUTIONS FUND |
| | SEPTEMBER 30, 2015 | |
| | | | |
| | ECONOMIC SECTORS | % OF TOTAL INVESTMENTS | |
| | Consumer Discretionary | 5.9 | % | |
| | Energy | 2.0 | % | |
| | Financials | 4.1 | % | |
| | Industrials | 24.4 | % | |
| | Information Technology | 27.4 | % | |
| | Materials | 5.7 | % | |
| | Short-Term Investments | 0.3 | % | |
| | Utilities | 30.2 | % | |
| | Total | 100 | % | |
| | | | |
August was the worst month for the performance of equity markets in more than three years as fears of a slowdown in global growth caused a broad sell-off, which continued into September. The sell-off was led by financial and energy stocks as weak Chinese manufacturing data renewed fears of slowing growth, causing oil prices to slump. In this risk-off environment, the Fund underperformed the market and declining oil prices weighed on performance once more. Despite strong results from solar companies, which beat earnings expectations and in some cases raised their full-year guidance, the sector sold off because of perceived higher risk.
The precipitous decline in oil prices has had a marked impact on bond spreads for all energy-related companies including yieldcos, publicly traded companies that are formed to own operating assets that produce predictable cash flows, primarily through long-term contracts. Their investor base is dominated by master limited partnership investors. This deteriorating financing environment has had a negative impact on sentiment toward renewable yieldco companies as investors questioned these companies' ability to continue to tap capital markets to fund their high growth.
Portfolio Strategy
We continue to believe that the renewable sector has strong fundamentals and view the recent correction of stocks as an opportunity to increase our holdings in high quality companies. Therefore renewable energy remains the largest weight in the Fund and solar remains our favorite renewable energy end market. Demand is robust in key markets, such as Japan, the U.S., and China, while pockets of unsubsidized demand continue to develop in emerging markets as solar economics continue to improve. Tier one solar module manufacturers are operating at full capacity, leading to stable pricing and expanding margins for companies such as Trina Solar and Jinko Solar. In the U.S., the decline in the investment tax credit at the end of 2016 is expected to lead to a record year for solar installations, which would drive earnings growth for developers such as SunPower and First Solar.
|
| | | | | | |
| | | | | |
| | CALVERT GLOBAL ENERGY SOLUTIONS FUND | |
| | SEPTEMBER 30, 2015 | |
| | | | | |
| | INVESTMENT PERFORMANCE | |
| | (TOTAL RETURN AT NAV) | |
| | | 6 MONTHS ENDED 9/30/15 | 12 MONTHS ENDED 9/30/15 | |
| | Class A | -18.64 | % | -18.87 | % | |
| | Class C | -19.10 | % | -19.70 | % | |
| | Class I | -18.45 | % | -18.45 | % | |
| | Class Y | -18.50 | % | -18.61 | % | |
| | Ardour Global Alternative Energy Index (Composite) | -12.91 | % | -17.32 | % | |
| | Lipper Global Natural Resources Funds Average | -21.47 | % | -33.37 | % | |
| | | | | |
| | Investment performance/return at NAV does not reflect the deduction of the Fund’s maximum 4.75% front-end sales charge or any deferred sales charges. | |
| | | | |
| | TEN LARGEST STOCK HOLDINGS | % OF NET ASSETS | |
| | SunPower Corp. | | 6.1 | % | |
| | Johnson Controls, Inc. | | 3.7 | % | |
| | Covanta Holding Corp. | | 3.7 | % | |
| | Trina Solar Ltd. (ADR) | | 3.7 | % | |
| | First Solar, Inc. | | 3.5 | % | |
| | JinkoSolar Holding Co., Ltd. (ADR) | | 3.4 | % | |
| | Zumtobel Group AG | | 3.3 | % | |
| | Renewables Infrastructure Group Ltd. (The) | | 3.3 | % | |
| | Eaton Corp. plc | | 3.1 | % | |
| | Canadian Solar, Inc. | | 3.1 | % | |
| | Total | | 36.9 | % | |
| | | |
The utilities sector remains a defensive pillar within the strategy. We prefer the electricity generators with strong cash flows supported by long-term power contracts, which are immune from the volatility in commodity prices. We consider the recent uncertainty surrounding the growth of yieldcos as a buying opportunity as we anticipate financing conditions will improve over the coming quarters.
Within the energy efficiency sector, we remain more weighted toward the building-efficiency companies whose end markets include the recovering institutional and nonresidential construction industries.
Outlook
The outlook remains very positive for the energy solutions strategy. Fundamentals are healthy, with strong demand, stable pricing, and low regulatory risk. Combining these factors with valuation support means the sector should
calvert.com CALVERT SOLUTION STRATEGIES ANNUAL REPORT (UNAUDITED) 7
recover strongly when the risk-off sentiment in the market improves. Regulatory support remains steadfast and could potentially improve. The climate change convention in Paris later this year could be an important catalyst for improving sentiment toward the cleaner energy space as large global economies set long-term targets to cut emissions and support cleaner energy. There is also the potential that the solar trade war between the U.S. and China will be resolved, bringing a reduction in tariffs set on imports of modules.
We expect that lower oil and gas prices will have only a muted effect on the energy efficiency sector as the move toward more efficient technologies, building systems, lighting, and HVAC systems should continue despite the near-term noise. The outlook is mixed for industrial end markets, with oil and gas and mining remaining weak, but more positive for construction-related companies, to which the Fund is more heavily skewed. The sustained recovery in U.S. residential and nonresidential construction markets as well as the bottoming out of European construction markets should be positive catalysts for our energy efficiency companies.
Longer term, we continue to believe that support for the Fund will be driven by the following key trends: favorable government legislation, falling input costs, an improving financing environment, rising energy prices, and supportive end markets.
Governments are keen to develop sustainable energy policies that serve the dual aim of reducing greenhouse gas emissions and stimulating energy independence. Legislation supporting the growth of renewable energy has been enacted in both developed and developing countries. These measures include the adoption of firm, long-term renewable energy targets and those promoting fixed, feed-in tariffs for renewable energy projects.
Functioning credit markets has always been an important ingredient influencing renewable energy growth. During the financial crisis, credit was tight and expensive. Both of these factors contributed to a slowing of capacity growth, which ultimately led to a number of renewable developers facing bankruptcy. Given the emergence of yieldco investments, debt securitizations, and the continued support of tax equity partnerships, we believe financing has never been as favorable for the industry.
Since the onset of the recession in 2008, input costs for wind and solar projects have declined markedly due to improvements in technology, lower raw material costs, and benefits accrued from volume production. Over the long term, we believe oil and gas prices will rise, further enhancing the economics of renewable energy generation.
The Fund is exposed to several different end markets, including the European and North American construction markets, the utility and industrial capital expenditure markets, automotive growth, and renewable energy capacity growth. These diverse markets provide a strong foundation for the Fund.
Kleinwort Benson Investors International, Ltd.
October 2015
As of September 30, 2015, the following companies represented the following percentages of net assets: Vestas Wind Systems 0.00%, Tesla Motors 0.00%, Zumtobel Group 3.33%, Trina Solar (ADR) 3.67%, Jinko Solar (ADR) 3.41%, SunPower 6.07%, and First Solar 3.54%. Holdings are subject to change.
8 calvert.com CALVERT SOLUTION STRATEGIES ANNUAL REPORT (UNAUDITED)
Growth of $10,000
The graph below shows the value of a hypothetical $10,000 investment in the Fund over the past 10 fiscal year periods or since inception (for funds without 10-year records). The results shown are for Class A shares, reflect the deduction of the maximum front-end Class A sales charge of 4.75%, and assume the reinvestment of dividends. The result is compared with a broad based market index. Market indexes are unmanaged and their results do not reflect the effect of expenses or sales charges. The value of an investment in a different share class would be different.
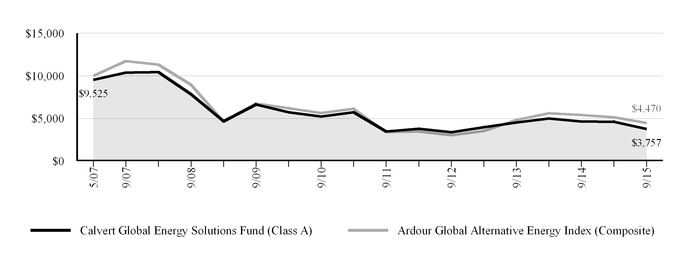
|
| | | | | | | |
| CALVERT GLOBAL ENERGY SOLUTIONS FUND |
| SEPTEMBER 30, 2015 |
| AVERAGE ANNUAL TOTAL RETURNS | Ticker Symbol | 1 Year | 5 Year | Since Inception (5/31/2007) |
| Class A (with max. load) | CGAEX | -22.68 | % | -7.27 | % | -11.08 | % |
| Class C (with max. load) | CGACX | -20.51 | % | -7.29 | % | -11.39 | % |
| Class I | CAEIX | -18.45 | % | -5.89 | % | -10.13 | % |
| Class Y | CGAYX | -18.61 | % | -6.13 | % | -10.42 | % |
| Ardour Global Alternative Energy Index (Composite) | | -17.32 | % | -4.55 | % | -9.21 | % |
| Lipper Global Natural Resources Funds Average | | -33.37 | % | -5.47 | % | -5.62 | % |
| | | | | |
| Calvert Global Energy Solutions Fund first offered Class C shares on July 9, 2011 and Class Y shares on July 29, 2011. Performance prior to those dates reflects the performance of Class A shares at net asset value (NAV). Actual Class C and Class Y share performance would have been different. |
| | | | | |
All performance data shown, including the graph above and the adjacent table, represents past performance, does not guarantee future results, assumes reinvestment of dividends and distributions, and does not reflect the deduction of taxes that a shareholder would pay on the Fund’s distributions or the redemption of the Fund shares. All performance data reflects fee waivers and/or expense limitations, if any are in effect; in their absence performance would be lower. See Note B in Notes to Financial Statements. The investment return and principal value of an investment will fluctuate so that an investor’s shares, when redeemed, may be worth more or less than their original cost. Current performance may be lower or higher than the performance data quoted; for current performance data, including most recent month-end, visit www.calvert.com. The gross expense ratio from the current prospectus for Class A shares is 2.13%. This number may differ from the expense ratio shown elsewhere in this report because it is based on a different time period and, if applicable, does not include fee or expense waivers. Performance data quoted already reflects the deduction of the Fund’s operating expenses.
calvert.com CALVERT SOLUTION STRATEGIES ANNUAL REPORT (UNAUDITED) 9
|
| |
| PORTFOLIO MANAGEMENT DISCUSSION |
|
| |
| Catherine Ryan of Kleinwort Benson Investors International, Ltd. |
|
| |
| Matthew Sheldon, CFA of Kleinwort Benson Investors International, Ltd. |
Performance
In the year ended September 30, 2015, Calvert Global Water Fund A shares (at NAV) declined 18.35%, significantly underperforming the benchmark, the S-Network Global Water Index, which declined 3.98%. The Fund's higher exposure to infrastructure relative to the Index largely accounts for the underperformance as infrastructure tends to underperform when markets are in risk-off mode, the dominant environment in the past year. While the Fund has a balanced blend of risk-on and risk-off exposures, our active management approach can lead to significant differences in periods when the performance dispersion of water stocks is high, such as that experienced during the year.
Investment Process
The Calvert Global Water Fund is a high conviction, global, long-only equity strategy that is constructed through three interactive components: theme definition and investment universe, sector allocation, and stock selection. In the theme definition component, we seek to precisely define each theme and the companies in its investment universe to assure that the opportunity set for investment is representative of the unique drivers of each theme. In order to qualify for inclusion in a theme, companies must meet one of the following revenue criteria: pure plays must have a minimum of 50% of revenue from the relevant theme; market leaders must have a minimum of 10% of revenue from the theme.
Market Review
The past year has been difficult for the water strategy. Macroeconomic headwinds have been numerous, from foreign-exchange volatility and rapidly declining oil prices to concern about a Greek exit from the euro and renewed fears about a slowdown in China, with its implications for global growth. Holdings that have suffered include those with energy exposure, our U.S. multinational industrials as a result of the impact of negative foreign-exchange translation, companies whose products represent large capital expenditures for customers, along with any that have exposure to China or emerging markets. The bulk of these kinds of holdings have resided within our infrastructure category. While there have been brief periods of risk-on trumping risk-off during the reporting period, risk-off sentiment has dominated and worked against the Fund.
Stylistically, growth has continued to outperform value for some time and this has worked against us given our sensitivity to valuation and tendency to buy underperformers and sell outperformers. Investors continue to pay a premium for earnings predictability and quality while small caps as a group, along with any stock that has a relatively complex investment thesis, remain out of favor.
From a fundamental perspective, there were no major surprises, for the most part, from our companies reporting their most recent earnings in July. Many of the concerns regarding the slowdown in certain end markets, particularly those related to capital expenditures, and foreign-exchange volatility had already been factored into earnings cuts, and share prices, ahead of the reporting season, leading to muted market reactions. Holdings with end-market exposure to U.S. nonresidential construction and municipal spending continue to be bright spots. We entered the year with good exposure to nonresidential and residential end markets and these stocks contributed strongly to performance in the period. These holdings included companies providing plumbing, stormwater management, and drainage-related products. Expectations appear to be muted for the remainder of 2015, and many companies have been starting cost cutting initiatives sooner than initially planned or increasing their magnitude to provide a buffer.
10 calvert.com CALVERT SOLUTION STRATEGIES ANNUAL REPORT (UNAUDITED)
|
| | | | |
| | | | |
| | CALVERT GLOBAL WATER FUND |
| | SEPTEMBER 30, 2015 | |
| | | | |
| | ECONOMIC SECTORS | % OF TOTAL INVESTMENTS | |
| | Consumer Discretionary | 5.9 | % | |
| | Energy | 1.4 | % | |
| | Financials | 3.1 | % | |
| | Industrials | 51.6 | % | |
| | Information Technology | 4.8 | % | |
| | Materials | 7.3 | % | |
| | Short-Term Investments | 0.5 | % | |
| | Utilities | 25.4 | % | |
| | Total | 100 | % | |
| | | | |
Portfolio Strategy
The big shift in the period happened in the first quarter of 2015, between December and March, when we reduced the weight of the infrastructure sector from 58% to 50%. We then reduced it further in the second quarter from 50% to 45%. We took advantage of strong performance in our stocks most related to the construction end market, for example Wolseley and Advanced Drainage Systems. These stocks had performed strongly in the period, and we reduced our exposure to them as the risk-reward relative to other opportunities declined. We also continued to trim stocks with exposure to end markets such as oil and gas capital expenditures, where our conviction was wavering. The move was made in favor of more defensive utility stocks, predominantly in the U.S., on attractive valuations resulting from selling in anticipation of a U.S. interest rate hike. We also increased our weighting in the water technology sector, enhancing our overall Fund exposure from a quality, end market, and business-model mix perspective. The result, in our view, is a more balanced Fund, better positioned for the risks the market may face in the months ahead, including currency volatility, oil price uncertainty, and the impact of slowing growth in China.
Between June and September, we started to increase our infrastructure exposure once again as we have seen opportunities to pick up companies with attractive end-market exposure. These included Mueller Water Products and Xylem because of their municipal end-market exposure. We continue to see good progress on leading indicators for this end market and think the outlook is strong in the medium term. We have also taken advantage of the underperformance of some other infrastructure stocks and added to our existing holdings in the sector. While the asymmetric risk-reward for many of these stocks is as attractive as we have seen in some time, given the current market volatility and the severe downdraft in these stocks for such a prolonged period, we have added to these holdings in a slow and calculated manner, continuing to be diligent about constraining the risk profile of the Fund. This recent move has been primarily at the expense of utilities, which performed strongly in August.
|
| | | | | | |
| | | | | |
| | CALVERT GLOBAL WATER FUND | |
| | SEPTEMBER 30, 2015 | |
| | | | | |
| | INVESTMENT PERFORMANCE | |
| | (TOTAL RETURN AT NAV) | |
| | | 6 MONTHS ENDED 9/30/15 | 12 MONTHS ENDED 9/30/15 | |
| | Class A | -15.03 | % | -18.35 | % | |
| | Class C | -15.35 | % | -18.92 | % | |
| | Class I | -14.80 | % | -17.93 | % | |
| | Class Y | -14.92 | % | -18.12 | % | |
| | S-Network Global Water Index | -5.35 | % | -3.98 | % | |
| | Lipper Global Natural Resources Funds Average | -21.47 | % | -33.37 | % | |
| | | | | |
| Investment performance/return at NAV does not reflect the deduction of the Fund’s maximum 4.75% front-end sales charge or any deferred sales charges. |
| | | | |
| | TEN LARGEST STOCK HOLDINGS | % OF NET ASSETS | |
| | EnerCare, Inc. | | 5.9 | % | |
| | Rexnord Corp. | | 5.1 | % | |
| | Suez Environnement Co. | | 4.9 | % | |
| | Arcadis NV | | 4.2 | % | |
| | Xylem, Inc. | | 4.1 | % | |
| | HD Supply Holdings, Inc. | | 4.0 | % | |
| | Calgon Carbon Corp. | | 3.9 | % | |
| | Pentair plc | | 3.9 | % | |
| | SPX FLOW, Inc. | | 3.7 | % | |
| | Mueller Water Products, Inc., Class A | 3.5 | % | |
| | Total | 43.2 | % | |
| | | | | |
Outlook
There have been a lot of headwinds in 2015, particularly for our U.S. multinational industrials — pension accounting, the reduction of energy capital expenditures and the ripple effect of that on the broader industrial economy, severe weather, inventory destocking, and most importantly, a rapid strengthening in the U.S. dollar. These headwinds have resulted in earnings expectation reductions, and we now expect 2015 earnings per share growth (in local currency) for our Fund in the mid-single digits versus in the mid-teens as we had expected at the beginning of the year. As we enter 2016, we expect these headwinds to turn into tailwinds (or at least to no longer be such severe headwinds). Further, our companies are not just waiting around for a better environment. Most of our companies have embarked on significant self-help that will mostly benefit earnings next year. These efforts include significant restructuring, share buybacks, asset monetizations, and accretive mergers and acquisitions.
Our style bias leads us to tend to buy underperforming stocks and sell outperforming stocks. We tend to like stocks with
calvert.com CALVERT SOLUTION STRATEGIES ANNUAL REPORT (UNAUDITED) 11
attractive valuations and strong asymmetry — more upside than downside — which leads us to areas that are out of favor or off the radar of most investors. Some of the investment theses for our holdings are complicated or considered messy. Many have expected catalysts, and some simply require patience for the thesis to play out. We strongly believe this style adds value over time, but it does not work all the time. The duration and persistence of the current market environment has therefore put pressure on our performance.
We summarize this tough recent performance in the context of our investment style because we believe it sets the scene for our outlook. The current water portfolio, in our view, represents a highly attractive collection of stocks, and we are optimistic about its return potential over the coming year. It is also a very balanced portfolio, more so than it has been in quite some time.
From a valuation perspective, the last time the type of stocks that we prefer to hold in the Fund were this cheap on a relative basis was more than a decade ago. With investor sentiment muted and expectations low, attractive valuations, strongly positive asymmetry in risk-reward, and increasing conviction around a better 2016, we are confident the Fund is well-positioned for the foreseeable future.
Kleinwort Benson Investors International, Ltd.
October 2015
As of September 30, 2015, the following companies represented the following percentages of net assets: Wolseley 0.00%, Advanced Drainage Systems 0.00%, Mueller Water Products 3.52%, and Xylem 4.07%. Holdings are subject to change.
12 calvert.com CALVERT SOLUTION STRATEGIES ANNUAL REPORT (UNAUDITED)
Growth of $10,000
The graph below shows the value of a hypothetical $10,000 investment in the Fund over the past 10 fiscal year periods or since inception (for funds without 10-year records). The results shown are for Class A shares, reflect the deduction of the maximum front-end Class A sales charge of 4.75%, and assume the reinvestment of dividends. The result is compared with a broad based market index. Market indexes are unmanaged and their results do not reflect the effect of expenses or sales charges. The value of an investment in a different share class would be different.
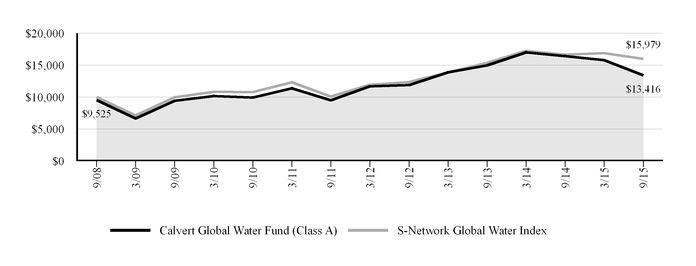
|
| | | | | | | |
| CALVERT GLOBAL WATER FUND |
| SEPTEMBER 30, 2015 |
| | | | | |
| AVERAGE ANNUAL TOTAL RETURNS | Ticker Symbol | 1 Year | 5 Year | Since Inception (9/30/2008) |
| Class A (with max. load) | CFWAX | -22.21 | % | 5.13 | % | 4.28 | % |
| Class C (with max. load) | CFWCX | -19.73 | % | 5.24 | % | 4.07 | % |
| Class I | CFWIX | -17.93 | % | 6.37 | % | 5.16 | % |
| Class Y | CFWYX | -18.12 | % | 6.46 | % | 5.25 | % |
| S-Network Global Water Index | | -3.98 | % | 8.15 | % | 6.92 | % |
| Lipper Global Natural Resources Funds Average | | -33.37 | % | -5.47 | % | -4.24 | % |
| | | | | |
| Calvert Global Water Fund first offered Class I shares on January 31, 2014. Performance prior to that date reflects the performance of Class A shares at net asset value (NAV). Actual Class I share performance would have been different. |
| | | | | |
All performance data shown, including the graph above and the adjacent table, represents past performance, does not guarantee future results, assumes reinvestment of dividends and distributions, and does not reflect the deduction of taxes that a shareholder would pay on the Fund’s distributions or the redemption of the Fund shares. All performance data reflects fee waivers and/or expense limitations, if any are in effect; in their absence performance would be lower. See Note B in Notes to Financial Statements. The investment return and principal value of an investment will fluctuate so that an investor’s shares, when redeemed, may be worth more or less than their original cost. Current performance may be lower or higher than the performance data quoted; for current performance data, including most recent month-end, visit www.calvert.com. The gross expense ratio from the current prospectus for Class A shares is 1.83%. This number may differ from the expense ratio shown elsewhere in this report because it is based on a different time period and, if applicable, does not include fee or expense waivers. Performance data quoted already reflects the deduction of the Fund’s operating expenses.
calvert.com CALVERT SOLUTION STRATEGIES ANNUAL REPORT (UNAUDITED) 13
UNDERSTANDING YOUR FUND'S EXPENSES
As an investor, you incur two types of costs. There are transaction costs, which generally include sales charges on purchases and may include redemption fees. There are also ongoing costs, which generally include management fees, distribution and/or service fees, and other fund expenses. The following information is intended to help you understand your ongoing costs (in dollars) of investing in this mutual fund and to help you compare these costs with the ongoing costs of investing in other mutual funds.
To illustrate these ongoing costs, we have provided examples and calculated the expenses paid by the fund's investors during the period. The actual and hypothetical information presented in the examples is based on an investment of $1,000 invested at the beginning of the period and held for the entire period (April 1, 2015 to September 30, 2015).
Actual Expenses
The first line of the table below provides information about actual account values and actual expenses. You may use the information in this line, together with the amount you invested, to estimate the expenses that you paid over the period. Simply divide your account value by $1,000 (for example, an $8,600 account value divided by $1,000 = 8.6), then multiply the result by the number in the first line under the heading entitled "Expenses Paid During Period" to estimate the expenses you paid on your account during this period.
Hypothetical Example for Comparison Purposes
The second line of the table below provides information about hypothetical account values and hypothetical expenses based on the Fund’s actual expense ratio and an assumed rate of return of 5% per year before expenses, which is not the Fund’s actual return. The hypothetical account values and expenses may not be used to estimate the actual ending account balance or expenses you paid for the period. You may use this information to compare the ongoing costs of investing in the Fund and other funds. To do so, compare the 5% hypothetical example with the 5% hypothetical examples that appear in the shareholder reports of the other funds.
Please note that the expenses shown in the table are meant to highlight your ongoing costs only and do not reflect any transactional costs, such as sales charges (loads), or redemption fees. Therefore, the second line of the table is useful in comparing ongoing costs only, and will not help you determine the relative total costs of owning different funds. In addition, if these transactional costs were included, your costs would have been higher.
|
| | | | |
| Calvert Global Energy Solutions Fund | ANNUALIZED
EXPENSE RATIO | BEGINNING
ACCOUNT VALUE
4/1/15 | ENDING
ACCOUNT VALUE
9/30/15 | EXPENSES PAID
DURING PERIOD*
4/1/15 - 9/30/15 |
| Class A | | | | |
| Actual | 1.85% | $1,000.00 | $813.60 | $8.41 |
| Hypothetical (5% return per year before expenses) | 1.85% | $1,000.00 | $1,015.79 | $9.35 |
| Class C | | | | |
| Actual | 2.85% | $1,000.00 | $809.00 | $12.92 |
| Hypothetical (5% return per year before expenses) | 2.85% | $1,000.00 | $1,010.78 | $14.37 |
| Class I | | | | |
| Actual | 1.40% | $1,000.00 | $815.50 | $6.37 |
| Hypothetical (5% return per year before expenses) | 1.40% | $1,000.00 | $1,018.05 | $7.08 |
| Class Y | | | | |
| Actual | 1.60% | $1,000.00 | $815.00 | $7.28 |
| Hypothetical (5% return per year before expenses) | 1.60% | $1,000.00 | $1,017.05 | $8.09 |
|
|
| * Expenses paid during the period are equal to the annualized expense ratio for each class as indicated above, multiplied by the average account value over the period, multiplied by 183/365 (to reflect the one-half year period). Expense ratios shown in the Financial Highlights represent the actual expenses incurred for the fiscal year. |
14 calvert.com CALVERT SOLUTION STRATEGIES ANNUAL REPORT (UNAUDITED)
|
| | | | |
| Calvert Global Water Fund | ANNUALIZED
EXPENSE RATIO | BEGINNING
ACCOUNT VALUE
4/1/15 | ENDING
ACCOUNT VALUE
9/30/15 | EXPENSES PAID
DURING PERIOD*
4/1/15 - 9/30/15 |
| Class A | | | | |
| Actual | 1.84% | $1,000.00 | $849.70 | $8.53 |
| Hypothetical (5% return per year before expenses) | 1.84% | $1,000.00 | $1,015.84 | $9.30 |
| Class C | | | | |
| Actual | 2.59% | $1,000.00 | $846.50 | $11.99 |
| Hypothetical (5% return per year before expenses) | 2.59% | $1,000.00 | $1,012.08 | $13.06 |
| Class I | | | | |
| Actual | 1.29% | $1,000.00 | $852.00 | $5.99 |
| Hypothetical (5% return per year before expenses) | 1.29% | $1,000.00 | $1,018.60 | $6.53 |
| Class Y | | | | |
| Actual | 1.57% | $1,000.00 | $850.80 | $7.28 |
| Hypothetical (5% return per year before expenses) | 1.57% | $1,000.00 | $1,017.20 | $7.94 |
|
|
| * Expenses paid during the period are equal to the annualized expense ratio for each class as indicated above, multiplied by the average account value over the period, multiplied by 183/365 (to reflect the one-half year period). Expense ratios shown in the Financial Highlights represent the actual expenses incurred for the fiscal year. |
calvert.com CALVERT SOLUTION STRATEGIES ANNUAL REPORT (UNAUDITED) 15
REPORT OF INDEPENDENT REGISTERED PUBLIC ACCOUNTING FIRM
The Board of Directors of Calvert Impact Fund, Inc. and Shareholders of Calvert Global Energy Solutions Fund and Calvert Global Water Fund:
We have audited the accompanying statements of net assets of the Calvert Global Energy Solutions Fund (formerly, Calvert Global Alternative Energy Fund) and Calvert Global Water Fund (collectively, the “Funds”), each a series of Calvert Impact Fund, Inc., as of September 30, 2015, and the related statements of operations for the year then ended, the statements of changes in net assets for each of the years in the two-year period then ended, and the financial highlights for each of the years or periods in the five-year period then ended. These financial statements and financial highlights are the responsibility of the Funds’ management. Our responsibility is to express an opinion on these financial statements and financial highlights based on our audits.
We conducted our audits in accordance with the standards of the Public Company Accounting Oversight Board (United States). Those standards require that we plan and perform the audit to obtain reasonable assurance about whether the financial statements and financial highlights are free of material misstatement. An audit includes examining, on a test basis, evidence supporting the amounts and disclosures in the financial statements. Our procedures included confirmation of securities owned as of September 30, 2015 by correspondence with the custodian and brokers or by other appropriate auditing procedures. An audit also includes assessing the accounting principles used and significant estimates made by management, as well as evaluating the overall financial statement presentation. We believe that our audits provide a reasonable basis for our opinion.
In our opinion, the financial statements and financial highlights referred to above present fairly, in all material respects, the financial position of the Calvert Global Energy Solutions Fund and Calvert Global Water Fund as of September 30, 2015, the results of their operations for the year then ended, the changes in their net assets for each of the years in the two-year period then ended, and the financial highlights for each of the years or periods in the five-year period then ended, in conformity with U.S. generally accepted accounting principles.
Philadelphia, Pennsylvania
November 25, 2015
16 calvert.com CALVERT SOLUTION STRATEGIES ANNUAL REPORT
CALVERT GLOBAL ENERGY SOLUTIONS FUND
STATEMENT OF NET ASSETS
SEPTEMBER 30, 2015
|
| | |
| | SHARES | VALUE ($) |
| EQUITY SECURITIES - 98.2% | | |
| Austria - 3.3% | | |
Zumtobel Group AG | 123,779 | 2,722,929 |
| | | |
| Brazil - 2.0% | | |
Cosan Ltd., Class A | 564,200 | 1,630,538 |
| | | |
| Canada - 8.5% | | |
| Capstone Infrastructure Corp. | 680,472 | 1,569,675 |
| DIRTT Environmental Solutions* | 83,698 | 354,274 |
| Innergex Renewable Energy, Inc. | 201,230 | 1,569,821 |
| Lumenpulse, Inc.* | 86,567 | 810,384 |
| Northland Power, Inc. | 125,007 | 1,622,837 |
| TransAlta Renewables, Inc. | 129,398 | 993,029 |
| | | 6,920,020 |
| | | |
| China - 15.7% | | |
| Beijing Jingneng Clean Energy Co., Ltd., Class H | 5,716,221 | 1,759,383 |
| Canadian Solar, Inc.* | 150,918 | 2,508,257 |
| China Longyuan Power Group Corp. Ltd., Class H | 1,590,000 | 1,718,544 |
| Daqo New Energy Corp. (ADR)* | 24,198 | 386,926 |
| Huaneng Renewables Corp. Ltd., Class H | 1,840,000 | 688,028 |
| JinkoSolar Holding Co., Ltd. (ADR)* | 127,102 | 2,788,618 |
| Trina Solar Ltd. (ADR)* | 334,764 | 3,002,833 |
| | | 12,852,589 |
| | | |
| Germany - 5.5% | | |
| Capital Stage AG | 250,791 | 2,456,521 |
| PNE Wind AG* | 547,187 | 1,281,640 |
| PSI AG Gesellschaft Fuer Produkte und Systeme der Informationstechnologie* | 57,810 | 774,535 |
| | | 4,512,696 |
| | | |
| Hong Kong - 1.4% | | |
GCL-Poly Energy Holdings Ltd. * | 5,694,000 | 1,111,988 |
| | | |
| India - 0.8% | | |
Greenko Group plc * | 577,323 | 637,152 |
| | | |
|
| | |
| | SHARES | VALUE ($) |
| Israel - 1.1% | | |
SolarEdge Technologies, Inc. * | 37,291 | 854,710 |
| | | |
| Italy - 1.3% | | |
Prysmian SpA | 51,077 | 1,055,468 |
| | | |
| Philippines - 1.6% | | |
Energy Development Corp. | 11,128,200 | 1,315,290 |
| | | |
| Spain - 5.4% | | |
| EDP Renovaveis SA | 238,862 | 1,566,476 |
| Gamesa Corp. Tecnologica SA | 81,195 | 1,124,450 |
| Saeta Yield SA | 189,296 | 1,743,923 |
| | | 4,434,849 |
| | | |
| United Kingdom - 14.9% | | |
| Delphi Automotive plc | 23,349 | 1,775,458 |
| Dialight plc | 51,149 | 490,410 |
| Infinis Energy plc | 614,544 | 1,250,486 |
| Johnson Matthey plc | 65,191 | 2,419,420 |
| National Grid plc | 116,356 | 1,619,017 |
| Renewables Infrastructure Group Ltd. (The) | 1,733,547 | 2,666,252 |
| SIG plc | 739,020 | 1,942,919 |
| | | 12,163,962 |
| | | |
| United States - 36.7% | | |
| Ameresco, Inc., Class A* | 220,032 | 1,293,788 |
| Calgon Carbon Corp. | 140,760 | 2,193,041 |
| Covanta Holding Corp. | 174,728 | 3,049,004 |
| Eaton Corp. plc | 49,283 | 2,528,218 |
| First Solar, Inc.* | 67,730 | 2,895,457 |
| FuelCell Energy, Inc.* | 540,244 | 396,971 |
| Hannon Armstrong Sustainable Infrastructure Capital, Inc. | 49,736 | 856,454 |
| Itron, Inc.* | 76,805 | 2,450,847 |
| Johnson Controls, Inc. | 73,749 | 3,050,259 |
| MasTec, Inc.* | 24,373 | 385,825 |
| NextEra Energy, Inc. | 16,387 | 1,598,552 |
| Pattern Energy Group, Inc. | 73,808 | 1,408,995 |
| Quanta Services, Inc.* | 39,187 | 948,717 |
| Regal-Beloit Corp. | 25,651 | 1,447,999 |
| SunEdison, Inc.* | 75,173 | 539,742 |
calvert.com CALVERT SOLUTION STRATEGIES ANNUAL REPORT 17
|
| | | | |
| | SHARES | VALUE ($) |
| SunPower Corp.* | 247,621 | 4,962,325 |
|
| | | 30,006,194 |
|
| | | |
Total Equity Securities (Cost $100,111,898) | | 80,218,385 |
|
| | | |
| | | |
| | | |
| CLOSED-END FUND - 1.1% | | |
| Greencoat UK Wind plc | 532,565 | 897,712 |
|
| | | |
Total Closed-End Fund (Cost $864,437) | | 897,712 |
|
TIME DEPOSIT - 0.3% | PRINCIPAL
AMOUNT ($) | |
| State Street Bank Time Deposit, 0.088%, 10/1/15 | 252,565 | 252,565 |
|
| | | |
Total Time Deposit (Cost $252,565) | | 252,565 |
|
| | | |
| | | |
| TOTAL INVESTMENTS (Cost $101,228,900) - 99.6% | | 81,368,662 |
|
| Other assets and liabilities, net - 0.4% | | 366,111 |
|
NET ASSETS - 100.0% | |
| $81,734,773 |
|
|
| | | |
| NET ASSETS CONSIST OF: | |
| Paid-in capital applicable to the following shares of common stock, with 250,000,000 shares of $0.01 par value shares authorized: | |
| Class A: 10,341,501 shares outstanding |
| $223,378,747 |
|
| Class C: 2,519,842 shares outstanding | 50,446,232 |
|
| Class I: 65,753 shares outstanding | 6,356,636 |
|
| Class Y: 1,351,871 shares outstanding | 10,133,039 |
|
| Undistributed net investment income | 90,554 |
|
| Accumulated net realized gain (loss) on investments and foreign currency transactions | (188,807,240) |
|
| Net unrealized appreciation (depreciation) on investments, foreign currencies and assets and liabilities denominated in foreign currencies | (19,863,195) |
|
| | |
| NET ASSETS |
| $81,734,773 |
|
| | |
| NET ASSET VALUE PER SHARE | |
| Class A (based on net assets of $59,588,665) |
| $5.76 |
|
| Class C (based on net assets of $13,662,521) |
| $5.42 |
|
| Class I (based on net assets of $386,453) |
| $5.88 |
|
| Class Y (based on net assets of $8,097,134) |
| $5.99 |
|
|
| |
| NOTES TO STATEMENT OF NET ASSETS |
| * | Non-income producing security. |
| Abbreviations: |
| ADR: | American Depositary Receipts |
| Ltd.: | Limited |
| plc: | Public Limited Company |
| | |
| See notes to financial statements. |
18 calvert.com CALVERT SOLUTION STRATEGIES ANNUAL REPORT
CALVERT GLOBAL WATER FUND
STATEMENT OF NET ASSETS
SEPTEMBER 30, 2015
|
| | |
| | SHARES | VALUE ($) |
| EQUITY SECURITIES - 100.2% | | |
| Brazil - 1.7% | | |
| Cia de Saneamento Basico do Estado de Sao Paulo (ADR) | 1,294,270 | 5,021,768 |
| Cia de Saneamento de Minas Gerais-COPASA | 967,600 | 3,042,844 |
| | | 8,064,612 |
| | | |
| Canada - 13.2% | | |
| Capstone Infrastructure Corp. | 4,999,894 | 11,533,480 |
| Chemtrade Logistics Income Fund | 515,395 | 6,702,386 |
| EnerCare, Inc. | 2,611,325 | 27,447,617 |
| Newalta Corp. | 955,999 | 6,558,643 |
| Pure Technologies Ltd. | 2,366,396 | 9,115,452 |
| | | 61,357,578 |
| | | |
| China - 2.5% | | |
| China Everbright International Ltd. | 2,813,000 | 3,987,217 |
| China Everbright Water Ltd.* | 9,609,100 | 4,088,720 |
| CT Environmental Group Ltd. | 10,616,000 | 3,316,376 |
| | | 11,392,313 |
| | | |
| France - 6.4% | | |
| Suez Environnement Co. | 1,259,499 | 22,629,924 |
| Veolia Environnement SA | 312,234 | 7,147,578 |
| | | 29,777,502 |
| | | |
| Hong Kong - 1.2% | | |
Beijing Enterprises Water Group Ltd. * | 7,904,000 | 5,587,701 |
| | | |
| India - 1.8% | | |
Jain Irrigation Systems Ltd. | 8,713,127 | 8,585,765 |
| | | |
| Israel - 0.6% | | |
Amiad Water Systems Ltd. | 1,149,854 | 2,815,382 |
| | | |
| Japan - 1.7% | | |
Ebara Corp. | 2,128,000 | 7,868,058 |
| | | |
| Mexico - 1.3% | | |
Empresas ICA SAB de CV * | 13,919,547 | 5,822,631 |
| | | |
|
| | |
| | SHARES | VALUE ($) |
| Netherlands - 4.2% | | |
Arcadis NV | 828,844 | 19,479,549 |
| | | |
| Philippines - 1.6% | | |
| Manila Water Co., Inc. | 10,170,500 | 4,736,954 |
| Metro Pacific Investments Corp. | 27,455,000 | 2,931,135 |
| | | 7,668,089 |
| | | |
| Switzerland - 2.7% | | |
Georg Fischer AG | 22,135 | 12,549,440 |
| | | |
| United Kingdom - 7.9% | | |
| Pentair plc | 354,702 | 18,103,990 |
| Rotork plc | 1,097,324 | 2,738,892 |
| Severn Trent plc | 194,978 | 6,449,606 |
| United Utilities Group plc | 671,407 | 9,403,696 |
| | | 36,696,184 |
| | | |
| United States - 53.4% | | |
| Aegion Corp.* | 530,346 | 8,740,102 |
| American Water Works Co., Inc. | 217,530 | 11,981,552 |
| Aqua America, Inc. | 395,828 | 10,477,567 |
| Calgon Carbon Corp. | 1,162,140 | 18,106,141 |
| California Water Service Group | 603,140 | 13,341,457 |
| Danaher Corp. | 179,679 | 15,310,448 |
| Ecolab, Inc. | 86,224 | 9,460,497 |
| Flowserve Corp. | 151,365 | 6,227,156 |
| Franklin Electric Co., Inc. | 208,658 | 5,681,757 |
| HD Supply Holdings, Inc.* | 651,119 | 18,635,026 |
| Itron, Inc.* | 411,127 | 13,119,063 |
Mueller Water Products, Inc., Class A | 2,136,485 | 16,365,475 |
| PICO Holdings, Inc.* | 1,217,806 | 11,788,362 |
| Rexnord Corp.* | 1,400,520 | 23,780,830 |
| SPX Corp. | 543,898 | 6,483,264 |
| SPX FLOW, Inc.* | 499,594 | 17,201,022 |
| Tetra Tech, Inc. | 522,961 | 12,713,182 |
| Toro Co. (The) | 136,092 | 9,599,930 |
| Xylem, Inc. | 576,251 | 18,929,845 |
| | | 247,942,676 |
| | | |
Total Equity Securities (Cost $578,113,142) | | 465,607,480 |
calvert.com CALVERT SOLUTION STRATEGIES ANNUAL REPORT 19
|
| | | | |
| | PRINCIPAL
AMOUNT ($) | VALUE ($) |
| TIME DEPOSIT - 0.5% | | |
| State Street Bank Time Deposit, 0.088%, 10/1/15 | 2,203,535 | 2,203,535 |
|
| | | |
Total Time Deposit (Cost $2,203,535) | | 2,203,535 |
|
| | | |
| | | |
| TOTAL INVESTMENTS (Cost $580,316,677) - 100.7% | | 467,811,015 |
|
| Other assets and liabilities, net - (0.7%) | | (3,083,488) |
|
NET ASSETS - 100.0% | |
| $464,727,527 |
|
|
| | | |
| NET ASSETS CONSIST OF: | |
| Paid-in capital applicable to the following shares of common stock, with 250,000,000 shares of $0.01 par value shares authorized: | |
| Class A: 19,865,497 shares outstanding |
| $367,621,845 |
|
| Class C: 5,424,374 shares outstanding | 97,723,850 |
|
| Class I: 51,855 shares outstanding | 1,025,326 |
|
| Class Y: 6,210,835 shares outstanding | 125,630,974 |
|
| Undistributed net investment income (loss) | (218,231) |
|
| Accumulated net realized gain (loss) on investments and foreign currency transactions | (14,524,822) |
|
| Net unrealized appreciation (depreciation) on investments, foreign currencies and assets and liabilities denominated in foreign currencies | (112,531,415) |
|
| | |
| NET ASSETS |
| $464,727,527 |
|
| | |
| NET ASSET VALUE PER SHARE | |
| Class A (based on net assets of $295,336,608) |
| $14.87 |
|
| Class C (based on net assets of $75,060,889) |
| $13.84 |
|
| Class I (based on net assets of $779,054) |
| $15.02 |
|
| Class Y (based on net assets of $93,550,976) |
| $15.06 |
|
|
| |
| NOTES TO STATEMENT OF NET ASSETS |
| * | Non-income producing security. |
| Abbreviations: |
| ADR: | American Depositary Receipts |
| Ltd.: | Limited |
| plc: | Public Limited Company |
| | |
| See notes to financial statements. |
20 calvert.com CALVERT SOLUTION STRATEGIES ANNUAL REPORT
STATEMENTS OF OPERATIONS
YEAR ENDED SEPTEMBER 30, 2015
|
| | | | | | | |
| NET INVESTMENT INCOME | CALVERT GLOBAL ENERGY SOLUTIONS FUND | | CALVERT GLOBAL WATER FUND |
| Investment Income: | | | |
| Dividend income (net of foreign taxes withheld of $110,749 and $913,644, respectively) |
| $1,956,613 |
| |
| $9,920,755 |
|
| Interest income | 809 |
| | 2,227 |
|
| Total investment income | 1,957,422 |
| | 9,922,982 |
|
| | | | |
| Expenses: | | | |
| Investment advisory fee | 915,159 |
| | 5,002,256 |
|
| Administrative fees | 336,529 |
| | 2,006,694 |
|
| Transfer agency fees and expenses | 369,470 |
| | 1,201,923 |
|
| Distribution Plan expenses: | | | |
| Class A | 177,313 |
| | 905,038 |
|
| Class C | 162,046 |
| | 907,223 |
|
| Directors' fees and expenses | 8,976 |
| | 64,986 |
|
| Accounting fees | 22,902 |
| | 95,550 |
|
| Custodian fees | 99,367 |
| | 224,636 |
|
| Professional fees | 21,806 |
| | 42,746 |
|
| Registration fees | 51,613 |
| | 109,157 |
|
| Reports to shareholders | 10,114 |
| | 56,309 |
|
| Miscellaneous | 52,072 |
| | 94,423 |
|
| Total expenses | 2,227,367 |
| | 10,710,941 |
|
| Reimbursement from Advisor: | | | |
| Class A | (253,376) |
| | — |
|
| Class C | (18,371) |
| | — |
|
| Class I | (13,429) |
| | (20,622) |
|
| Class Y | (21,634) |
| | — |
|
| Net expenses | 1,920,557 |
| | 10,690,319 |
|
| | | | |
| NET INVESTMENT INCOME (LOSS) | 36,865 |
| | (767,337) |
|
| | | | |
| REALIZED AND UNREALIZED GAIN (LOSS) | | | |
| Net realized gain (loss) on: | | | |
| Investments | (3,398,404) |
| | (6,610,972) |
|
| Foreign currency transactions | (69,438) |
| | (239,422) |
|
| | (3,467,842) |
| | (6,850,394) |
|
| | | | |
| Change in unrealized appreciation (depreciation) on: | | | |
| Investments | (16,405,337) |
| | (104,085,514) |
|
| Assets and liabilities denominated in foreign currencies | 21,084 |
| | (8,199) |
|
| | (16,384,253) |
| | (104,093,713) |
|
| | | | |
| NET REALIZED AND UNREALIZED GAIN (LOSS) | (19,852,095) |
| | (110,944,107) |
|
| | | | |
| INCREASE (DECREASE) IN NET ASSETS RESULTING FROM OPERATIONS |
| ($19,815,230 | ) | |
| ($111,711,444 | ) |
| | | | |
| See notes to financial statements. |
calvert.com CALVERT SOLUTION STRATEGIES ANNUAL REPORT 21
CALVERT GLOBAL ENERGY SOLUTIONS FUND
STATEMENTS OF CHANGES IN NET ASSETS
|
| | | | | | | |
| INCREASE (DECREASE) IN NET ASSETS | YEAR ENDED
SEPTEMBER 30, 2015 | | YEAR ENDED
SEPTEMBER 30, 2014 |
| Operations: | | | |
| Net investment income (loss) |
| $36,865 |
| |
| ($223,139 | ) |
| Net realized gain (loss) | (3,467,842) |
| | 8,177,170 |
|
| Change in unrealized appreciation (depreciation) | (16,384,253) |
| | (5,857,906) |
|
| INCREASE (DECREASE) IN NET ASSETS RESULTING FROM OPERATIONS | (19,815,230) |
| | 2,096,125 |
|
| | | | |
| Capital share transactions: | | | |
| Shares sold: | | | |
| Class A shares | 17,898,682 |
| | 21,389,009 |
|
| Class C shares | 3,276,644 |
| | 3,566,377 |
|
| Class I shares | 333,274 |
| | 35,885 |
|
| Class Y shares | 8,551,114 |
| | 6,676,603 |
|
| Redemption fees: | | | |
| Class A shares | 23 |
| | 3,154 |
|
| Class C shares | 37 |
| | 314 |
|
| Class Y shares | — |
| | 5 |
|
| Shares redeemed: | | | |
| Class A shares | (19,175,793) |
| | (27,716,116) |
|
| Class C shares | (3,476,867) |
| | (3,194,614) |
|
| Class I shares | (48,887) |
| | (433,546) |
|
| Class Y shares | (6,053,231) |
| | (580,260) |
|
| Total capital share transactions | 1,304,996 |
| | (253,189) |
|
| | | | |
| TOTAL INCREASE (DECREASE) IN NET ASSETS | (18,510,234) |
| | 1,842,936 |
|
| | | | |
| | | | |
| NET ASSETS | | | |
| Beginning of year | 100,245,007 |
| | 98,402,071 |
|
| End of year (including undistributed net investment income of $90,554 and $0, respectively) |
| $81,734,773 |
| |
| $100,245,007 |
|
| | | | |
| | | | |
| CAPITAL SHARE ACTIVITY | | | |
| Shares sold: | | | |
| Class A shares | 2,614,810 |
| | 2,852,699 |
|
| Class C shares | 505,715 |
| | 497,247 |
|
| Class I shares | 47,946 |
| | 4,729 |
|
| Class Y shares | 1,189,808 |
| | 853,259 |
|
| Shares redeemed: | | | |
| Class A shares | (2,860,590) |
| | (3,695,586) |
|
| Class C shares | (543,341) |
| | (446,613) |
|
| Class I shares | (7,174) |
| | (54,603) |
|
| Class Y shares | (877,758) |
| | (74,992) |
|
| Total capital share activity | 69,416 |
| | (63,860) |
|
| | | | |
| See notes to financial statements. |
22 calvert.com CALVERT SOLUTION STRATEGIES ANNUAL REPORT
CALVERT GLOBAL WATER FUND
STATEMENTS OF CHANGES IN NET ASSETS
|
| | | | | | | |
| INCREASE (DECREASE) IN NET ASSETS | YEAR ENDED
SEPTEMBER 30, 2015 | | YEAR ENDED
SEPTEMBER 30, 2014 |
| Operations: | | | |
| Net investment loss |
| ($767,337 | ) | |
| ($12,350 | ) |
| Net realized gain (loss) | (6,850,394) |
| | 40,467,118 |
|
| Change in unrealized appreciation (depreciation) | (104,093,713) |
| | (22,040,624) |
|
| INCREASE (DECREASE) IN NET ASSETS RESULTING FROM OPERATIONS | (111,711,444) |
| | 18,414,144 |
|
| | | | |
| Distributions to shareholders from: | | | |
| Net investment income: | | | |
| Class A shares | — |
| | (68,551) |
|
| Class C shares | — |
| | (14,539) |
|
| Class Y shares | — |
| | (12,396) |
|
| Net realized gain: | | | |
| Class A shares | (26,000,563) |
| | (14,860,794) |
|
| Class C shares | (6,686,475) |
| | (3,007,897) |
|
| Class I shares | (61,477) |
| | — |
|
| Class Y shares | (8,801,749) |
| | (2,403,907) |
|
| Total distributions | (41,550,264) |
| | (20,368,084) |
|
| | | | |
| Capital share transactions: | | | |
| Shares sold: | | | |
| Class A shares | 112,031,134 |
| | 254,889,868 |
|
| Class C shares | 25,045,753 |
| | 68,168,029 |
|
| Class I shares | 534,252 |
| | 1,140,707 |
|
| Class Y shares | 58,521,494 |
| | 120,823,853 |
|
| Reinvestment of distributions: | | | |
| Class A shares | 23,051,405 |
| | 13,753,501 |
|
| Class C shares | 5,046,129 |
| | 2,320,525 |
|
| Class I shares | 61,477 |
| | — |
|
| Class Y shares | 6,430,856 |
| | 1,859,210 |
|
| Redemption fees: | | | |
| Class A shares | 2,344 |
| | 13,115 |
|
| Class C shares | 83 |
| | 655 |
|
| Class Y shares | 2,046 |
| | 2,549 |
|
| Shares redeemed: | | | |
| Class A shares | (128,535,915) |
| | (63,203,750) |
|
| Class C shares | (25,248,171) |
| | (5,078,727) |
|
| Class I shares | (659,603) |
| | (51,507) |
|
| Class Y shares | (73,979,770) |
| | (12,041,650) |
|
| Total capital share transactions | 2,303,514 |
| | 382,596,378 |
|
| | | | |
| TOTAL INCREASE (DECREASE) IN NET ASSETS | (150,958,194) |
| | 380,642,438 |
|
| | | | |
| See notes to financial statements. |
calvert.com CALVERT SOLUTION STRATEGIES ANNUAL REPORT 23
|
| | | | | | | |
| NET ASSETS | YEAR ENDED
SEPTEMBER 30, 2015 | | YEAR ENDED
SEPTEMBER 30, 2014 |
| Beginning of year | $615,685,721 | | $235,043,283 |
| End of year (including undistributed net investment loss of $218,231 and $0, respectively) |
| $464,727,527 |
| |
| $615,685,721 |
|
| | | | |
| | | | |
| CAPITAL SHARE ACTIVITY | | | |
| Shares sold: | | | |
| Class A shares | 6,313,506 |
| | 12,763,057 |
|
| Class C shares | 1,506,838 |
| | 3,605,056 |
|
| Class I shares | 30,905 |
| | 56,751 |
|
| Class Y shares | 3,248,122 |
| | 5,979,295 |
|
| Reinvestment of distributions: | | | |
| Class A shares | 1,340,198 |
| | 745,278 |
|
| Class C shares | 313,424 |
| | 132,799 |
|
| Class I shares | 3,554 |
| | — |
|
| Class Y shares | 370,014 |
| | 100,149 |
|
| Shares redeemed: | | | |
| Class A shares | (7,465,594) |
| | (3,155,623) |
|
| Class C shares | (1,554,283) |
| | (269,682) |
|
| Class I shares | (36,873) |
| | (2,482) |
|
| Class Y shares | (4,246,645) |
| | (593,843) |
|
| Total capital share activity | (176,834) |
| | 19,360,755 |
|
| | | | |
| See notes to financial statements. |
24 calvert.com CALVERT SOLUTION STRATEGIES ANNUAL REPORT
NOTES TO FINANCIAL STATEMENTS
NOTE A — SIGNIFICANT ACCOUNTING POLICIES
General: Calvert Global Energy Solutions Fund (formerly known as Calvert Global Alternative Energy Fund) ("Global Energy Solutions") and Calvert Global Water Fund ("Global Water") (the “Funds,” each a “Fund”), each a series of Calvert Impact Fund, Inc., are registered under the Investment Company Act of 1940 as non-diversified, open-end management investment companies. Calvert Impact Fund, Inc. is comprised of four separate series. The operations of each series are accounted for separately. The Funds apply the accounting and reporting guidance in the Financial Accounting Standards Board (FASB) Accounting Standards Codification Topic 946, Financial Services – Investment Companies (ASC 946).
Each Fund offers four classes of shares - Classes A, C, I, and Y. Class A shares are sold with a maximum front-end sales charge of 4.75%. Class C shares are sold without a front-end sales charge and, with certain exceptions, will be charged a deferred sales charge on shares sold within one year of purchase. Class C shares have higher levels of expenses than Class A shares. Class I shares require a minimum account balance of $1,000,000. The $1 million minimum initial investment is waived for retirement plans that trade through omnibus accounts and may be waived in certain other instances where it is believed to be in the best interest of the Fund and its shareholders. Class Y shares are generally only available to wrap or similar fee-based programs offered by financial intermediaries, foundations, and endowments that have entered into an agreement with the Fund’s Distributor to offer Class Y shares. Class I and Class Y shares have no front-end or deferred sales charge and have lower levels of expenses than Class A shares. Each class has different: (a) dividend rates due to differences in Distribution Plan expenses and other class specific expenses, (b) exchange privileges and (c) class specific voting rights.
Security Valuation: Net asset value per share is determined every business day as of the close of the regular session of the New York Stock Exchange (generally 4:00 p.m. Eastern time). The Funds use independent pricing services approved by the Board of Directors (“the Board”) to value their investments wherever possible. Investments for which market quotations are not available or deemed not reliable are fair valued in good faith under the direction of the Board.
The Board has adopted Valuation Procedures (the “Procedures”) to determine the fair value of securities and other financial instruments for which market prices are not readily available or which may not be reliably priced. The Board has delegated the day-to-day responsibility for determining the fair value of assets of the Funds to Calvert Investment Management, Inc. (the “Advisor” or “Calvert”) and has provided these Procedures to govern Calvert in its valuation duties.
Calvert has chartered an internal Valuation Committee to oversee the implementation of these Procedures and to assist it in carrying out the valuation responsibilities that the Board has delegated.
The Valuation Committee meets on a regular basis to review illiquid securities and other investments which may not have readily available market prices. The Valuation Committee’s fair valuation determinations are subject to review, approval and ratification by the Board at its next regularly scheduled meeting covering the calendar quarter in which the fair valuation was determined.
The Valuation Committee utilizes various methods to measure the fair value of the Fund’s investments. U.S. generally accepted accounting principles (GAAP) establishes a disclosure hierarchy that categorizes the inputs to valuation techniques used to value assets and liabilities at measurement date. These inputs are summarized in the three broad levels listed below:
Level 1 - quoted prices in active markets for identical securities
Level 2 - other significant observable inputs (including quoted prices for similar securities, interest rates, prepayment speeds, credit risk, etc.)
Level 3 - significant unobservable inputs (including the Funds’ own assumptions in determining the fair value of investments)
The inputs or methodologies used for valuing securities are not necessarily an indication of the risk associated with investing in those securities.
Changes in valuation techniques may result in transfers in or out of an investment’s assigned level within the hierarchy during the year. Transfers in and/or out of levels are determined based on the fair value of such securities at the end of the year. Valuation techniques used to value the Funds’ investments by major category are as follows:
Equity securities, including restricted securities, for which market quotations are readily available, are valued at the last reported sale price or official closing price as reported by an independent pricing service on the primary market or exchange on which they are traded and are categorized as Level 1 in the hierarchy. In the event that there were no sales during the day or closing prices are not available, securities are valued at the last quoted bid price or using the last available price and are categorized as Level 2 in the hierarchy. Foreign securities are valued based on quotations from the principal market in which such securities are normally traded. If events occur after the close of the principal market in which foreign securities are traded, and before the close of business of the Funds, that are expected to materially affect the value of those securities, then they are valued at their fair value taking these events into account and are categorized as Level 2 in the hierarchy. The Funds
calvert.com CALVERT SOLUTION STRATEGIES ANNUAL REPORT 25
have retained a third party fair value pricing service to quantitatively analyze the price movement of their holdings on foreign exchanges and to automatically fair value if the variation from the prior day’s closing price exceeds specified parameters. Such securities would be categorized as Level 2 in the hierarchy in these circumstances. Utilizing this technique may result in transfers between Level 1 and Level 2. For restricted securities and private placements where observable inputs are limited, assumptions about market activity and risk are used and such securities are categorized as Level 3 in the hierarchy.
Closed-end funds are valued at the official closing price as reported by an independent pricing service on the primary market or exchange on which they are traded and are categorized as Level 1 in the hierarchy.
Short-term securities of sufficient credit quality with remaining maturities of sixty days or less for which quotations are not readily available are valued at amortized cost, which approximates fair value, and are categorized as Level 2 in the hierarchy.
If a market value cannot be determined for a security using the methodologies described above, or if, in the good faith opinion of the Advisor, the market value does not constitute a readily available market quotation, or if a significant event has occurred that would materially affect the value of the security, the security will be fair valued as determined in good faith by the Valuation Committee.
The Valuation Committee considers a number of factors, including significant unobservable valuation inputs when arriving at fair value. It considers all significant facts that are reasonably available and relevant to the determination of fair value.
The Valuation Committee primarily employs a market-based approach which may use related or comparable assets or liabilities, recent transactions, market multiples, book values, and other relevant information for the investment to determine the fair value of the investment. When more appropriate, the Funds may employ an income-based or cost approach. An income-based valuation approach discounts anticipated future cash flows of the investment to calculate a present amount (discounted). The measurement is based on the value indicated by current market expectations about those future amounts. Discounts may also be applied due to the nature or duration of any restrictions on the disposition of the investments. A cost based approach is based on the amount that currently would be required to replace the service capacity of an asset (current replacement cost). From the seller’s perspective, the price that would be received for the asset is determined based on the cost to a buyer to acquire or construct a substitute asset of comparable utility, adjusted for obsolescence.
The values assigned to fair value investments are based on available information and do not necessarily represent amounts that might ultimately be realized. Further, due to the inherent uncertainty of valuations of such investments, the fair values may differ significantly from the values that would have been used had an active market existed, and the differences could be material. The Valuation Committee employs various methods for calibrating these valuation approaches including a regular review of key inputs and assumptions, transactional back-testing or disposition analysis and reviews of any related market activity.
At September 30, 2015, no securities were fair valued in good faith under the direction of the Board.
The following tables summarize the market value of the Funds' holdings as of September 30, 2015, based on the inputs used to value them:
|
| | | | | | | | | | | |
| CALVERT GLOBAL ENERGY SOLUTIONS FUND | VALUATION INPUTS |
| INVESTMENTS IN SECURITIES | LEVEL 1 | LEVEL 2 | LEVEL 3 | TOTAL |
| Equity Securities* |
| $49,873,554 |
| $30,344,831** |
| $— |
|
| $80,218,385 |
|
| Closed-End Funds | — |
| 897,712** |
| — |
| 897,712 |
|
| Time Deposit | — |
| 252,565 |
| — |
| 252,565 |
|
| TOTAL |
| $49,873,554 |
|
| $31,495,108 |
| $— |
|
| $81,368,662 |
|
| | | | | |
*For further breakdown of equity securities by country, please refer to the Statement of Net Assets. ** Includes certain securities trading primarily outside the U.S. whose value was adjusted as a result of significant market movements following the close of local trading. On September 30, 2015, price movements exceeded specified parameters and the third party fair value pricing service quantitatively fair valued the affected securities. |
On September 30, 2015, price movements exceeded specified parameters and the third party fair value pricing service quantitatively fair valued the affected securities. As a result, $31,242,543 transferred out of Level 1 into Level 2. The amount of this transfer was determined based on the fair value of the securities at the end of the year.
26 calvert.com CALVERT SOLUTION STRATEGIES ANNUAL REPORT
|
| | | | | | | | | | | |
| CALVERT GLOBAL WATER FUND | VALUATION INPUTS |
| INVESTMENTS IN SECURITIES | LEVEL 1 | LEVEL 2 | LEVEL 3 | TOTAL |
| Equity Securities* |
| $344,106,869 |
| $121,500,611** |
| $— |
|
| $465,607,480 |
|
| Time Deposit | — |
| 2,203,535 |
| — |
| 2,203,535 |
|
| TOTAL |
| $344,106,869 |
|
| $123,704,146 |
| $— |
|
| $467,811,015 |
|
| | | | | |
* For further breakdown of equity securities by country, please refer to the Statement of Net Assets. ** Includes certain securities trading primarily outside the U.S. whose value was adjusted as a result of significant market movements following the close of local trading. On September 30, 2015, price movements exceeded specified parameters and the third party fair value pricing service quantitatively fair valued the affected securities. |
On September 30, 2015, price movements exceeded specified parameters and the third party fair value pricing service quantitatively fair valued the affected securities. As a result, $121,500,611 transferred out of Level 1 into Level 2. The amount of this transfer was determined based on the fair value of the securities at the end of the year.
Security Transactions and Investment Income: Security transactions are accounted for on trade date. Realized gains and losses are recorded on an identified cost basis and may include proceeds from litigation. Dividend income is recorded on the ex-dividend date or, in the case of dividends on certain foreign securities, as soon as the Funds are informed of the ex-dividend date. Withholding taxes on foreign dividends have been provided for in accordance with the Funds' understanding of the applicable country’s tax rules and rates. Distributions received on securities that represent a return of capital or capital gain are recorded as a reduction of cost of investments and/or as a realized gain. Interest income, which includes amortization of premium and accretion of discount on debt securities, is accrued as earned. Investment income and realized and unrealized gains and losses are allocated to separate classes of shares based upon the relative net assets of each class. Expenses arising in connection with a specific class are charged directly to that class. Expenses common to the classes are allocated to each class in proportion to their relative net assets.
Foreign Currency Transactions: The Funds’ accounting records are maintained in U.S. dollars. For valuation of assets and liabilities on each date of net asset value determination, foreign denominations are converted into U.S. dollars using the current exchange rate. Security transactions, income and expenses are translated at the prevailing rate of exchange on the date of the event. The effect of changes in foreign exchange rates on securities and foreign currencies is included in the net realized and unrealized gain or loss on securities and foreign currencies.
Distributions to Shareholders: Distributions to shareholders are recorded by the Funds on ex-dividend date. Dividends from net investment income and distributions from net realized capital gains, if any, are paid at least annually. Distributions are determined in accordance with income tax regulations which may differ from U.S. generally accepted accounting principles; accordingly, periodic reclassifications are made within the Funds’ capital accounts to reflect income and gains available for distribution under income tax regulations.
Estimates: The preparation of financial statements in conformity with U.S. generally accepted accounting principles requires management to make estimates and assumptions that affect the reported amounts of assets and liabilities and disclosure of contingent assets and liabilities at the date of the financial statements and the reported amounts of increases and decreases in net assets from operations during the reporting period. Actual results could differ from those estimates.
Redemption Fees: The Funds charged a 2% redemption fee on redemptions, including exchanges, made within 30 days of purchase in the same Fund (within seven days for Class I shares). The redemption fee was accounted for as an addition to paid-in capital. This fee was eliminated effective February 2, 2015.
Federal Income Taxes: No provision for federal income or excise tax is required since each Fund intends to continue to qualify as a regulated investment company under the Internal Revenue Code and to distribute substantially all of its taxable earnings.
Management has analyzed the Funds’ tax positions taken for all open federal income tax years and has concluded that no provision for federal income tax is required in the Funds’ financial statements. A Fund’s federal tax return is subject to examination by the Internal Revenue Service for a period of three years.
NOTE B — RELATED PARTY TRANSACTIONS
Calvert Investment Management, Inc. (the “Advisor”) is wholly-owned by Calvert Investments, Inc., which is indirectly wholly-owned by Ameritas Mutual Holding Company. The Advisor provides investment advisory services and pays the salaries and fees of officers and Directors of the Fund who are employees of the Advisor or its affiliates. For its services, the Advisor receives an annual fee, payable monthly, of .95% of the average daily net assets of Global Energy Solutions. For its services, the Advisor receives an annual fee, payable monthly, of .90% of the first $250 million of the average daily net assets of Global Water
calvert.com CALVERT SOLUTION STRATEGIES ANNUAL REPORT 27
and .85% of all assets above $250 million. Under the terms of the agreement, $66,108 and $348,422 was payable at year end for Global Energy Solutions and Global Water, respectively.
The Advisor has contractually agreed to limit net annual fund operating expenses for Classes A, C, I and Y through January 31, 2016. The contractual expense caps are 1.85% for Class A, 2.85% for Class C, and 1.60% for Class Y of each Fund. The contractual expense caps are 1.40% and 1.29% for Class I in Global Energy Solutions and Global Water, respectively. For the purpose of this expense limit, operating expenses do not include interest expense, brokerage commissions, taxes, and extraordinary expenses. This expense limitation does not limit acquired fund fees and expenses, if any. At year end, $23,233 and $3,369 was receivable from the Advisor for Global Energy Solutions and Global Water, respectively.
Calvert Investment Administrative Services, Inc., an affiliate of the Advisor, provides administrative services to the Funds for an annual fee, payable monthly, of .35% for Class A, C, and Y shares of each Fund and .15% for Class I shares of each Fund based on their average daily net assets. Under the terms of the agreement, $24,291 and $139,111 was payable at year end for Global Energy Solutions and Global Water, respectively.
Calvert Investment Distributors, Inc. (“CID”), an affiliate of the Advisor, is the distributor and principal underwriter for the Funds. Pursuant to Rule 12b-1 under the Investment Company Act of 1940, each Fund has adopted a Distribution Plan that permits each Fund to pay certain expenses associated with the distribution and servicing of its shares. The expenses paid may not exceed .50% and 1.00% annually of the average daily net assets of Class A and C, respectively. The amount actually paid by each Fund is an annualized fee, payable monthly, of .25% and 1.00% of the Funds' average daily net assets of Class A and C, respectively. Class I and Class Y shares do not have Distribution Plan expenses. Under the terms of the agreement, $24,359 and $127,393 was payable at year end for Global Energy Solutions and Global Water, respectively.
CID received $52,027 and $227,661 as its portion of commissions charged on the sales of Class A shares of Global Energy Solutions and Global Water, respectively, for the year ended September 30, 2015.
Calvert Investment Services, Inc. (“CIS”), an affiliate of the Advisor, is the shareholder servicing agent for the Funds. For its services, CIS received a fee of $66,803 and $131,976 for the year ended September 30, 2015 for Global Energy Solutions and Global Water, respectively. Under the terms of the agreement, $5,524 and $10,609 was payable at year end for Global Energy Solutions and Global Water, respectively. Boston Financial Data Services, Inc. is the transfer and dividend disbursing agent.
Each Director of the Funds who is not an employee of the Advisor or its affiliates receives an annual retainer of $52,000 ($48,000 prior to January 1, 2015) plus a meeting fee of up to $3,000 for each Board meeting attended. Additional fees of $6,000 ($5,000 prior to January 1, 2015) annually may be paid to the Committee chairs ($10,000 for the Board chair and the Special Equities Committee chair) and $2,500 annually may be paid to Committee members, plus a Committee meeting fee of $500 for each Committee meeting attended. Eligible Directors may participate in a Deferred Compensation Plan (the "Plan"). Obligations of the Plan will be paid solely out of the Funds' assets. As of September 30, 2015, approximately $46,880 and $267,044 was deferred under the Plan in Global Energy Solutions and Global Water, respectively. Directors’ fees are allocated to each of the funds served.
NOTE C — INVESTMENT ACTIVITY AND TAX INFORMATION
During the year, the cost of purchases and proceeds from sales of investments, other than short-term securities, were:
|
| | | | | | | |
| | CALVERT GLOBAL ENERGY SOLUTIONS FUND | | CALVERT GLOBAL WATER FUND |
| Purchases |
| $96,279,841 |
| |
| $617,831,928 |
|
| Sales |
| $94,249,658 |
| |
| $642,303,196 |
|
|
| |
| Capital Loss Carryforwards | |
| CALVERT GLOBAL ENERGY SOLUTIONS FUND | |
| EXPIRATION DATE | |
| 2017 | ($21,115,915) |
| 2018 | (56,693,584) |
| 2019 | (43,799,530) |
| NO EXPIRATION DATE | |
| Short-term | ($1,686,599) |
| Long-term | (62,344,564) |
28 calvert.com CALVERT SOLUTION STRATEGIES ANNUAL REPORT
Under the Regulated Investment Company Modernization Act of 2010, capital losses incurred in taxable years beginning after December 22, 2010 can be carried forward to offset future capital gains for an unlimited period. These losses are required to be utilized prior to the losses incurred in pre-enactment taxable years and will retain their character as either long-term or short-term. Losses incurred in pre-enactment taxable years can be utilized until expiration.
The tax character of dividends and distributions paid during the years ended September 30, 2015 and September 30, 2014 was as follows:
|
| | | | | | | |
| CALVERT GLOBAL WATER FUND | | | |
| | | | |
| DISTRIBUTIONS PAID FROM: | 2015 |
| | 2014 |
|
| Ordinary income |
| $35,778,309 |
| |
| $18,349,115 |
|
| Long-term capital gains | 5,771,955 |
| | 2,018,969 |
|
| Total |
| $41,550,264 |
| |
| $20,368,084 |
|
As of September 30, 2015, the tax basis components of distributable earnings/(accumulated losses) and the federal tax cost were as follows:
|
| | | | | | | |
| | CALVERT GLOBAL ENERGY SOLUTIONS FUND | CALVERT GLOBAL WATER FUND |
| Unrealized appreciation |
| $2,257,649 |
| |
| $4,743,853 |
|
| Unrealized (depreciation) | (23,634,512) | | (130,022,085) |
|
| Net unrealized appreciation (depreciation) |
| ($21,376,863 | ) | |
| ($125,278,232 | ) |
| | | | |
| Undistributed ordinary income |
| $132,015 |
| | $— |
|
| Capital loss carryforward |
| ($185,640,192 | ) | | $— |
|
| Late year ordinary and post October capital loss deferrals |
| ($1,691,885 | ) | |
| ($1,970,483 | ) |
| | | | |
| Federal income tax cost of investments |
| $102,745,525 |
| |
| $593,089,247 |
|
The differences between the components of distributable earnings on a tax basis and the amounts reflected in the Statement of Net Assets are primarily due to temporary book-tax differences that will reverse in a subsequent period. For both Funds, these book-tax differences are due to wash sales. For Global Energy Solutions, there are also differences due to investments in Real Estate Investment Trusts and Passive Foreign Investment Companies.
Reclassifications, as shown in the table below, have been made to the Funds’ components of net assets to reflect income and gains available for distribution (or available capital loss carryovers, as applicable) under income tax law and regulations. These reclassifications are due to permanent book-tax differences and have no impact on net assets. For Global Energy Solutions, the permanent differences are primarily due to investments in Real Estate Investment Trusts and Passive Foreign Investment Companies and foreign currency transactions. For Global Water, the permanent differences are due to foreign currency transactions, capital gains taxes, and net operating losses.
|
| | | | | | |
| | CALVERT GLOBAL ENERGY SOLUTIONS FUND | CALVERT GLOBAL WATER FUND |
| Undistributed net investment income |
| $53,689 |
|
| $549,106 |
|
| Accumulated net realized gain (loss) | (94,968) |
| (549,106) |
|
| Paid-in capital | 41,279 |
| — |
|
NOTE D — LINE OF CREDIT
A financing agreement is in place with the Calvert Funds and State Street Corporation (“SSC”). Under the agreement, SSC provides an unsecured line of credit facility, in the aggregate amount of $50 million ($25 million committed and $25 million uncommitted), accessible by the Funds for temporary or emergency purposes only. Borrowings bear interest at the higher of the
calvert.com CALVERT SOLUTION STRATEGIES ANNUAL REPORT 29
London Interbank Offered Rate (LIBOR) or the overnight Federal Funds Rate plus 1.25% per annum. A commitment fee of .20% per annum is incurred on the unused portion of the committed facility. An administrative fee of $25,000 was paid in connection with the uncommitted facility. These fees are allocated to all participating funds. The Funds had no loans outstanding pursuant to this line of credit at September 30, 2015.
For the year ended September 30, 2015, borrowings by the Funds under the agreement were as follows:
|
| | | | |
| | AVERAGE DAILY BALANCE | WEIGHTED AVERAGE INTEREST RATE | MAXIMUM AMOUNT BORROWED | MONTH OF MAXIMUM AMOUNT BORROWED |
| Calvert Global Energy Solutions Fund | $47,733 | 1.38% | $1,979,166 | August 2015 |
| Calvert Global Water Fund | $368,144 | 1.39% | $8,563,293 | January 2015 |
NOTE E — SUBSEQUENT EVENTS
At a special meeting of the Funds' Board of Directors (the “Board”) held on November 24, 2015, the Board approved the recommendation made by Calvert Investment Administrative Services, Inc. (“CIAS”) to standardize and rationalize the administrative fee payable by the Calvert Funds at 12 basis points for all series and all share classes of the Calvert Funds. The change is being implemented in two phases. First, CIAS will voluntarily waive the amount of the existing administrative fee above 12 basis points for the period from December 1, 2015 through January 31, 2016. Second, CIAS and the Funds have entered into an Amended and Restated Administrative Services Agreement that will establish a 12 basis point administrative fee for all classes of the Funds commencing on February 1, 2016. In the case of any series or share class that currently pays an administrative fee to CIAS that is less than 12 basis points, CIAS has contractually agreed to waive the difference between that lower administrative fee and the 12 basis point fee until January 31, 2018.
In preparing the financial statements as of September 30, 2015, no other subsequent events or transactions occurred that would have required recognition or disclosure in these financial statements.
NOTICE TO SHAREHOLDERS (UNAUDITED)
For the fiscal year ended September 30, 2015, Calvert Global Energy Solutions Fund considers 100% of the ordinary dividends paid during the year as qualified dividend income and 100% as eligible for the corporate dividends received deduction in accordance with Section 854 of the Internal Revenue Code. Calvert Global Energy Solutions Fund also considers $1,628,635 as income derived from foreign sources and $110,749 as foreign taxes paid.
For the fiscal year ended September 30, 2015, Calvert Global Water Fund considers 18.0% of the ordinary dividends paid during the year as qualified dividend income and 6.1% as eligible for the corporate dividends received deduction in accordance with Section 854 of the Internal Revenue Code. Calvert Global Water Fund also considers $5,771,955 of the long-term capital gain distributions paid during the year as capital gain dividends in accordance with Section 852(b)(3)(C) of the Internal Revenue Code.
30 calvert.com CALVERT SOLUTION STRATEGIES ANNUAL REPORT
CALVERT GLOBAL ENERGY SOLUTIONS FUND
FINANCIAL HIGHLIGHTS
|
| | | | | | | | | | | | | | | | | | | | |
| | YEARS ENDED |
| CLASS A SHARES | September 30, 2015 (z) | | September 30, 2014 (z) | | September 30, 2013 | | September 30, 2012 (z) | | September 30, 2011 (z) |
| Net asset value, beginning |
| $7.10 |
| |
| $6.94 |
| |
| $5.16 |
| |
| $5.48 |
| |
| $8.22 |
|
| Income from investment operations: | | | | | | | | | |
| Net investment income (loss) | .01 |
| | — |
| | (.01 | ) | | (.01 | ) | | .10 |
|
| Net realized and unrealized gain (loss) | (1.35 | ) | | .16 |
| | 1.79 |
| | (.17 | ) | | (2.84 | ) |
| Total from investment operations | (1.34 | ) | | .16 |
| | 1.78 |
| | (.18 | ) | | (2.74 | ) |
| Distributions from: | | | | | | | | | |
| Net investment income | — |
| | — |
| | — |
| | (.14 | ) | | — |
|
| Total distributions | — |
| | — |
| | — |
| | (.14 | ) | | — |
|
| Total increase (decrease) in net asset value | (1.34 | ) | | .16 |
| | 1.78 |
| | (.32 | ) | | (2.74 | ) |
| Net asset value, ending |
| $5.76 |
| |
| $7.10 |
| |
| $6.94 |
| |
| $5.16 |
| |
| $5.48 |
|
Total return* | (18.87 | %) | | 2.31 | % | | 34.50 | % | | (3.27 | %) | | (33.33 | %) |
| Ratios to average net assets: A | | | | | | | | | |
| Net investment income (loss) | .17 | % | | (.05 | %) | | (.19 | %) | | (.21 | %) | | 1.28 | % |
| Total expenses | 2.21 | % | | 2.13 | % | | 2.40 | % | | 2.57 | % | | 2.30 | % |
| Expenses before offsets | 1.85 | % | | 1.85 | % | | 1.85 | % | | 1.85 | % | | 1.85 | % |
| Net expenses | 1.85 | % | | 1.85 | % | | 1.85 | % | | 1.85 | % | | 1.85 | % |
| Portfolio turnover | 99 | % | | 62 | % | | 90 | % | | 52 | % | | 65 | % |
| Net assets, ending (in thousands) |
| $59,589 |
| |
| $75,155 |
| |
| $79,302 |
| |
| $57,727 |
| |
| $76,921 |
|
| | |
| (z) | Per share figures are calculated using the Average Shares Method. |
| * | Total return is not annualized for periods of less than one year and does not reflect deduction of any front-end or deferred sales charge. |
| A | Total expenses do not reflect amounts reimbursed and/or waived by the Advisor or reductions from expense offset arrangements. Expenses before offsets reflect expenses after reimbursement and/or waiver by the Advisor but prior to reductions from expense offset arrangements. Net expenses are net of all reductions and represent the net expenses paid by the Fund. |
| | | | | | | | | | | |
| See notes to financial statements. |
calvert.com CALVERT SOLUTION STRATEGIES ANNUAL REPORT 31
CALVERT GLOBAL ENERGY SOLUTIONS FUND
FINANCIAL HIGHLIGHTS
|
| | | | | | | | | | | | | | | | | | | | |
| | YEARS ENDED |
| CLASS C SHARES | September 30, 2015 (z) | | September 30, 2014 (z) | | September 30, 2013 | | September 30, 2012 (z) | | September 30, 2011 (z) |
| Net asset value, beginning |
| $6.75 |
| |
| $6.66 |
| |
| $5.00 |
| |
| $5.28 |
| |
| $7.99 |
|
| Income from investment operations: | | | | | | | | | |
| Net investment income (loss) | (.05 | ) | | (.07 | ) | | (.07 | ) | | (.06 | ) | | .02 |
|
| Net realized and unrealized gain (loss) | (1.28 | ) | | .16 |
| | 1.73 |
| | (.17 | ) | | (2.73 | ) |
| Total from investment operations | (1.33 | ) | | .09 |
| | 1.66 |
| | (.23 | ) | | (2.71 | ) |
| Distributions from: | | | | | | | | | |
| Net investment income | — |
| | — |
| | — |
| | (.05 | ) | | — |
|
| Total distributions | — |
| | — |
| | — |
| | (.05 | ) | | — |
|
| Total increase (decrease) in net asset value | (1.33 | ) | | .09 |
| | 1.66 |
| | (.28 | ) | | (2.71 | ) |
| Net asset value, ending |
| $5.42 |
| |
| $6.75 |
| |
| $6.66 |
| |
| $5.00 |
| |
| $5.28 |
|
Total return* | (19.70 | %) | | 1.35 | % | | 33.20 | % | | (4.38 | %) | | (33.92 | %) |
| Ratios to average net assets: A | | | | | | | | | |
| Net investment income (loss) | (.84 | %) | | (1.04 | %) | | (1.21 | %) | | (1.22 | %) | | .28 | % |
| Total expenses | 2.96 | % | | 2.93 | % | | 3.20 | % | | 3.37 | % | | 3.10 | % |
| Expenses before offsets | 2.85 | % | | 2.85 | % | | 2.85 | % | | 2.85 | % | | 2.85 | % |
| Net expenses | 2.85 | % | | 2.85 | % | | 2.85 | % | | 2.85 | % | | 2.85 | % |
| Portfolio turnover | 99 | % | | 62 | % | | 90 | % | | 52 | % | | 65 | % |
| Net assets, ending (in thousands) |
| $13,663 |
| |
| $17,256 |
| |
| $16,697 |
| |
| $13,595 |
| |
| $18,300 |
|
| | | | | | | | | | | |
| (z) | Per share figures are calculated using the Average Shares Method. |
| * | Total return is not annualized for periods of less than one year and does not reflect deduction of any front-end or deferred sales charge. |
| A | Total expenses do not reflect amounts reimbursed and/or waived by the Advisor or reductions from expense offset arrangements. Expenses before offsets reflect expenses after reimbursement and/or waiver by the Advisor but prior to reductions from expense offset arrangements. Net expenses are net of all reductions and represent the net expenses paid by the Fund. |
| | | | | | | | | | | |
| See notes to financial statements. |
32 calvert.com CALVERT SOLUTION STRATEGIES ANNUAL REPORT
CALVERT GLOBAL ENERGY SOLUTIONS FUND
FINANCIAL HIGHLIGHTS
|
| | | | | | | | | | | | | | | | | | | | |
| | YEARS ENDED |
| CLASS I SHARES | September 30, 2015 (z) | | September 30, 2014 (z) | | September 30, 2013 | | September 30, 2012 (z) | | September 30, 2011 (z) |
| Net asset value, beginning |
| $7.21 |
| |
| $7.02 |
| |
| $5.19 |
| |
| $5.59 |
| |
| $8.34 |
|
| Income from investment operations: | | | | | | | | | |
| Net investment income | .06 |
| | .03 |
| | — |
| | .02 |
| | .17 |
|
| Net realized and unrealized gain (loss) | (1.39 | ) | | .16 |
| | 1.83 |
| | (.18 | ) | | (2.92 | ) |
| Total from investment operations | (1.33 | ) | | .19 |
| | 1.83 |
| | (.16 | ) | | (2.75 | ) |
| Distributions from: | | | | | | | | | |
| Net investment income | — |
| | — |
| | — |
| | (.24 | ) | | — |
|
| Total distributions | — |
| | — |
| | — |
| | (.24 | ) | | — |
|
| Total increase (decrease) in net asset value | (1.33 | ) | | .19 |
| | 1.83 |
| | (.40 | ) | | (2.75 | ) |
| Net asset value, ending |
| $5.88 |
| |
| $7.21 |
| |
| $7.02 |
| |
| $5.19 |
| |
| $5.59 |
|
Total return* | (18.45 | %) | | 2.71 | % | | 35.26 | % | | (2.77 | %) | | (32.97 | %) |
| Ratios to average net assets: A | | | | | | | | | |
| Net investment income | .82 | % | | .34 | % | | .04 | % | | .38 | % | | 2.00 | % |
| Total expenses | 5.63 | % | | 2.88 | % | | 3.19 | % | | 1.77 | % | | 1.51 | % |
| Expenses before offsets | 1.40 | % | | 1.40 | % | | 1.40 | % | | 1.40 | % | | 1.40 | % |
| Net expenses | 1.40 | % | | 1.40 | % | | 1.40 | % | | 1.40 | % | | 1.40 | % |
| Portfolio turnover | 99 | % | | 62 | % | | 90 | % | | 52 | % | | 65 | % |
| Net assets, ending (in thousands) |
| $386 |
| |
| $180 |
| |
| $525 |
| |
| $725 |
| | $4,916 |
| | |
| (z) | Per share figures are calculated using the Average Shares Method. |
| * | Total return is not annualized for periods of less than one year and does not reflect deduction of any front-end or deferred sales charge. |
| A | Total expenses do not reflect amounts reimbursed and/or waived by the Advisor or reductions from expense offset arrangements. Expenses before offsets reflect expenses after reimbursement and/or waiver by the Advisor but prior to reductions from expense offset arrangements. Net expenses are net of all reductions and represent the net expenses paid by the Fund. |
| | | | | | | | | | | |
| See notes to financial statements. |
calvert.com CALVERT SOLUTION STRATEGIES ANNUAL REPORT 33
CALVERT GLOBAL ENERGY SOLUTIONS FUND
FINANCIAL HIGHLIGHTS
|
| | | | | | | | | | | | | | | | | | | | |
| | YEARS ENDED | | PERIOD ENDED |
| CLASS Y SHARES | September 30, 2015 (z) | | September 30, 2014 (z) | | September 30, 2013 | | September 30, 2012 (z) | | September 30, 2011 ^(z) |
| Net asset value, beginning |
| $7.36 |
| |
| $7.18 |
| |
| $5.32 |
| |
| $5.49 |
| |
| $7.70 |
|
| Income from investment operations: | | | | | | | | | |
| Net investment income (loss) | .04 |
| | .02 |
| | .01 |
| | .05 |
| | (.01 | ) |
| Net realized and unrealized gain (loss) | (1.41 | ) | | .16 |
| | 1.85 |
| | (.22 | ) | | (2.20 | ) |
| Total from investment operations | (1.37 | ) | | .18 |
| | 1.86 |
| | (.17 | ) | | (2.21 | ) |
| Total increase (decrease) in net asset value | (1.37 | ) | | .18 |
| | 1.86 |
| | (.17 | ) | | (2.21 | ) |
| Net asset value, ending |
| $5.99 |
| |
| $7.36 |
| |
| $7.18 |
| |
| $5.32 |
| |
| $5.49 |
|
Total return* | (18.61 | %) | | 2.51 | % | | 34.96 | % | | (3.10 | %) | | (28.70 | %) |
| Ratios to average net assets: A | | | | | | | | | |
| Net investment income (loss) | .57 | % | | .33 | % | | .16 | % | | .90 | % | | (.92%)(a) |
|
| Total expenses | 1.84 | % | | 1.85 | % | | 2.50 | % | | 6.75 | % | | 873.73%(a) |
|
| Expenses before offsets | 1.60 | % | | 1.60 | % | | 1.60 | % | | 1.60 | % | | 1.60%(a) |
|
| Net expenses | 1.60 | % | | 1.60 | % | | 1.60 | % | | 1.60 | % | | 1.60%(a) |
|
| Portfolio turnover | 99 | % | | 62 | % | | 90 | % | | 52 | % | | 65%** |
|
| Net assets, ending (in thousands) |
| $8,097 |
| |
| $7,654 |
| |
| $1,877 |
| |
| $897 |
| |
| $9 |
|
| | |
| ^ | From July 29, 2011 inception. |
| (z) | Per share figures are calculated using the Average Shares Method. |
| * | Total return is not annualized for periods of less than one year and does not reflect deduction of any front-end or deferred sales charge. |
| A | Total expenses do not reflect amounts reimbursed and/or waived by the Advisor or reductions from expense offset arrangements. Expenses before offsets reflect expenses after reimbursement and/or waiver by the Advisor but prior to reductions from expense offset arrangements. Net expenses are net of all reductions and represent the net expenses paid by the Fund. |
| (a) | Annualized. |
| ** | Portfolio turnover is not annualized for periods of less than one year. |
| | | | | | | | | | | |
| See notes to financial statements. |
34 calvert.com CALVERT SOLUTION STRATEGIES ANNUAL REPORT
CALVERT GLOBAL WATER FUND
FINANCIAL HIGHLIGHTS
|
| | | | | | | | | | | | | | | | | | | | |
| | YEARS ENDED |
| CLASS A SHARES | September 30, 2015 (z) | | September 30, 2014 (z) | | September 30, 2013 (z) | | September 30, 2012 (z) | | September 30, 2011 (z) |
| Net asset value, beginning |
| $19.55 |
| |
| $19.12 |
| |
| $15.98 |
| |
| $14.29 |
| |
| $15.40 |
|
| Income from investment operations: | | | | | | | | | |
| Net investment income (loss) | (.02 | ) | | .01 |
| | (.04 | ) | | .02 |
| | .06 |
|
| Net realized and unrealized gain (loss) | (3.40 | ) | | 1.77 |
| | 3.99 |
| | 3.29 |
| | (.69 | ) |
| Total from investment operations | (3.42 | ) | | 1.78 |
| | 3.95 |
| | 3.31 |
| | (.63 | ) |
| Distributions from: | | | | | | | | | |
| Net investment income | — |
| | (.01 | ) | | (.01 | ) | | (.04 | ) | | (.02 | ) |
| Net realized gain | (1.26 | ) | | (1.34 | ) | | (.80 | ) | | (1.58 | ) | | (.46 | ) |
| Total distributions | (1.26 | ) | | (1.35 | ) | | (.81 | ) | | (1.62 | ) | | (.48 | ) |
| Total increase (decrease) in net asset value | (4.68 | ) | | .43 |
| | 3.14 |
| | 1.69 |
| | (1.11 | ) |
| Net asset value, ending |
| $14.87 |
| |
| $19.55 |
| |
| $19.12 |
| |
| $15.98 |
| |
| $14.29 |
|
Total return* | (18.35 | %) | | 9.69 | % | | 25.81 | % | | 25.16 | % | | (4.38 | %) |
| Ratios to average net assets: A | | | | | | | | | |
| Net investment income (loss) | (.09 | %) | | .05 | % | | (.23 | %) | | .16 | % | | .36 | % |
| Total expenses | 1.82 | % | | 1.85 | % | | 2.04 | % | | 2.34 | % | | 2.32 | % |
| Expenses before offsets | 1.82 | % | | 1.85 | % | | 1.85 | % | | 1.85 | % | | 1.85 | % |
| Net expenses | 1.82 | % | | 1.85 | % | | 1.85 | % | | 1.85 | % | | 1.85 | % |
| Portfolio turnover | 110 | % | | 77 | % | | 104 | % | | 116 | % | | 125 | % |
| Net assets, ending (in thousands) |
| $295,337 |
| |
| $384,697 |
| |
| $178,275 |
| |
| $55,964 |
| |
| $39,535 |
|
| | |
| (z) | Per share figures are calculated using the Average Shares Method. |
| * | Total return is not annualized for periods of less than one year and does not reflect deduction of any front-end or deferred sales charge. |
| A | Total expenses do not reflect amounts reimbursed and/or waived by the Advisor or reductions from expense offset arrangements. Expenses before offsets reflect expenses after reimbursement and/or waiver by the Advisor but prior to reductions from expense offset arrangements. Net expenses are net of all reductions and represent the net expenses paid by the Fund. |
| | | | | | | | | | | |
| See notes to financial statements. |
calvert.com CALVERT SOLUTION STRATEGIES ANNUAL REPORT 35
CALVERT GLOBAL WATER FUND
FINANCIAL HIGHLIGHTS
|
| | | | | | | | | | | | | | | | | | | | |
| | YEARS ENDED |
| CLASS C SHARES | September 30, 2015 (z) | | September 30, 2014 (z) | | September 30, 2013 (z) | | September 30, 2012 (z) | | September 30, 2011 (z) |
| Net asset value, beginning |
| $18.41 |
| |
| $18.20 |
| |
| $15.38 |
| |
| $13.90 |
| |
| $15.12 |
|
| Income from investment operations: | | | | | | | | | |
| Net investment loss | (.13 | ) | | (.12 | ) | | (.19 | ) | | (.12 | ) | | (.10 | ) |
| Net realized and unrealized gain (loss) | (3.18 | ) | | 1.68 |
| | 3.81 |
| | 3.18 |
| | (.66 | ) |
| Total from investment operations | (3.31 | ) | | 1.56 |
| | 3.62 |
| | 3.06 |
| | (.76 | ) |
| Distributions from: | | | | | | | | | |
| Net investment income | — |
| | (.01 | ) | | — |
| | — |
| | — |
|
| Net realized gain | (1.26 | ) | | (1.34 | ) | | (.80 | ) | | (1.58 | ) | | (.46 | ) |
| Total distributions | (1.26 | ) | | (1.35 | ) | | (.80 | ) | | (1.58 | ) | | (.46 | ) |
| Total increase (decrease) in net asset value | (4.57 | ) | | .21 |
| | 2.82 |
| | 1.48 |
| | (1.22 | ) |
| Net asset value, ending |
| $13.84 |
| |
| $18.41 |
| |
| $18.20 |
| |
| $15.38 |
| |
| $13.90 |
|
Total return* | (18.92 | %) | | 8.93 | % | | 24.63 | % | | 23.90 | % | | (5.33 | %) |
| Ratios to average net assets: A | | | | | | | | | |
| Net investment loss | (.79 | %) | | (.65 | %) | | (1.16 | %) | | (.81 | %) | | (.60 | %) |
| Total expenses | 2.53 | % | | 2.53 | % | | 2.79 | % | | 3.20 | % | | 3.26 | % |
| Expenses before offsets | 2.53 | % | | 2.53 | % | | 2.79 | % | | 2.85 | % | | 2.85 | % |
| Net expenses | 2.53 | % | | 2.53 | % | | 2.79 | % | | 2.85 | % | | 2.85 | % |
| Portfolio turnover | 110 | % | | 77 | % | | 104 | % | | 116 | % | | 125 | % |
| Net assets, ending (in thousands) |
| $75,061 |
| |
| $94,985 |
| |
| $30,759 |
| |
| $8,574 |
| |
| $5,537 |
|
| | |
| (z) | Per share figures are calculated using the Average Shares Method. |
| * | Total return is not annualized for periods of less than one year and does not reflect deduction of any front-end or deferred sales charge. |
| A | Total expenses do not reflect amounts reimbursed and/or waived by the Advisor or reductions from expense offset arrangements. Expenses before offsets reflect expenses after reimbursement and/or waiver by the Advisor but prior to reductions from expense offset arrangements. Net expenses are net of all reductions and represent the net expenses paid by the Fund. |
| | | | | | | | | | | |
| See notes to financial statements. |
36 calvert.com CALVERT SOLUTION STRATEGIES ANNUAL REPORT
CALVERT GLOBAL WATER FUND
FINANCIAL HIGHLIGHTS
|
| | | | | | | | | |
| | YEAR ENDED | | PERIOD ENDED | |
| CLASS I SHARES | September 30, 2015 (z) | | September 30, 2014 (z)^ | |
| Net asset value, beginning | 19.64 |
| | 18.99 |
| |
| Income from investment operations: | | | | |
| Net investment income | .06 |
| | .04 |
| |
| Net realized and unrealized gain (loss) | (3.42 | ) | | .61 |
| |
| Total from investment operations | (3.36 | ) | | .65 |
| |
| Distributions from: | | | | |
| Net realized gain | (1.26 | ) | | — |
| |
| Total distributions | (1.26 | ) | | — |
| |
| Total increase (decrease) in net asset value | (4.62 | ) | | .65 |
| |
| Net asset value, ending |
| $15.02 |
| |
| $19.64 |
| |
Total return* | (17.93 | %) | | 3.42 | % | |
| Ratios to average net assets: A | | | | |
| Net investment income | .32 | % | | .24%(a) |
| |
| Total expenses | 3.89 | % | | 4.85%(a) |
| |
| Expenses before offsets | 1.29 | % | | 1.29%(a) |
| |
| Net expenses | 1.29 | % | | 1.29%(a) |
| |
| Portfolio turnover | 110 | % | | 77 | % | |
| Net assets, ending (in thousands) |
| $779 |
| |
| $1,066 |
| |
| | |
| (z) | Per share figures are calculated using the Average Shares Method. |
| ^ | From January 31, 2014 inception. |
| * | Total return is not annualized for periods of less than one year and does not reflect deduction of any front-end or deferred sales charge. |
| A | Total expenses do not reflect amounts reimbursed and/or waived by the Advisor or reductions from expense offset arrangements. Expenses before offsets reflect expenses after reimbursement and/or waiver by the Advisor but prior to reductions from expense offset arrangements. Net expenses are net of all reductions and represent the net expenses paid by the Fund. |
| (a) | Annualized. |
| | | | | | |
| See notes to financial statements. |
calvert.com CALVERT SOLUTION STRATEGIES ANNUAL REPORT 37
CALVERT GLOBAL WATER FUND
FINANCIAL HIGHLIGHTS
|
| | | | | | | | | | | | | | | | | | | | |
| | YEARS ENDED |
| CLASS Y SHARES | September 30, 2015 (z) | | September 30, 2014 (z) | | September 30, 2013 (z) | | September 30, 2012 (z) | | September 30, 2011 (z) |
| Net asset value, beginning |
| $19.73 |
| |
| $19.21 |
| |
| $16.03 |
| |
| $14.28 |
| |
| $15.44 |
|
| Income from investment operations: | | | | | | | | | |
| Net investment income | .04 |
| | .07 |
| | .01 |
| | .05 |
| | .12 |
|
| Net realized and unrealized gain (loss) | (3.45 | ) | | 1.80 |
| | 3.99 |
| | 3.31 |
| | (.71 | ) |
| Total from investment operations | (3.41 | ) | | 1.87 |
| | 4.00 |
| | 3.36 |
| | (.59 | ) |
| Distributions from: | | | | | | | | | |
| Net investment income | — |
| | (.01 | ) | | (.02 | ) | | (.03 | ) | | (.11 | ) |
| Net realized gain | (1.26 | ) | | (1.34 | ) | | (.80 | ) | | (1.58 | ) | | (.46 | ) |
| Total distributions | (1.26 | ) | | (1.35 | ) | | (.82 | ) | | (1.61 | ) | | (.57 | ) |
| Total increase (decrease) in net asset value | (4.67 | ) | | .52 |
| | 3.18 |
| | 1.75 |
| | (1.16 | ) |
| Net asset value, ending |
| $15.06 |
| |
| $19.73 |
| |
| $19.21 |
| |
| $16.03 |
| |
| $14.28 |
|
Total return* | (18.12 | %) | | 10.14 | % | | 26.07 | % | | 25.55 | % | | (4.22 | %) |
| Ratios to average net assets: A | | | | | | | | | |
| Net investment income | .23 | % | | .36 | % | | .08 | % | | .40 | % | | .76 | % |
| Total expenses | 1.49 | % | | 1.49 | % | | 1.66 | % | | 2.12 | % | | 2.56 | % |
| Expenses before offsets | 1.49 | % | | 1.49 | % | | 1.60 | % | | 1.60 | % | | 1.60 | % |
| Net expenses | 1.49 | % | | 1.49 | % | | 1.60 | % | | 1.60 | % | | 1.60 | % |
| Portfolio turnover | 110 | % | | 77 | % | | 104 | % | | 116 | % | | 125 | % |
| Net assets, ending (in thousands) |
| $93,551 |
| |
| $134,938 |
| |
| $26,009 |
| |
| $3,692 |
| |
| $2,934 |
|
| | |
| (z) | Per share figures are calculated using the Average Shares Method. |
| * | Total return is not annualized for periods of less than one year and does not reflect deduction of any front-end or deferred sales charge. |
| A | Total expenses do not reflect amounts reimbursed and/or waived by the Advisor or reductions from expense offset arrangements. Expenses before offsets reflect expenses after reimbursement and/or waiver by the Advisor but prior to reductions from expense offset arrangements. Net expenses are net of all reductions and represent the net expenses paid by the Fund. |
| | | | | | | | | | | |
| See notes to financial statements. |
38 calvert.com CALVERT SOLUTION STRATEGIES ANNUAL REPORT
EXPLANATION OF FINANCIAL TABLES
SCHEDULE OF INVESTMENTS
The Schedule of Investments is a snapshot of all securities held in the fund at their market value, on the last day of the reporting period. Securities are listed by asset type (e.g., common stock, corporate bonds, U.S. government obligations) or, for International and Global funds, by country, and may be further broken down into sub-groups and by industry classification.
STATEMENT OF ASSETS AND LIABILITIES
The Statement of Assets and Liabilities is often referred to as the fund’s balance sheet. It lists the value of what the fund owns, is due and owes on the last day of the reporting period. The fund’s assets include the market value of securities owned, cash, receivables for securities sold and shareholder subscriptions, and receivables for dividends and interest payments that have been earned, but not yet received. The fund’s liabilities include payables for securities purchased and shareholder redemptions, and expenses owed but not yet paid. The statement also reports the fund’s net asset value (NAV) per share on the last day of the reporting period. The NAV is calculated by dividing the fund’s net assets (assets minus liabilities) by the number of shares outstanding. This statement is accompanied by a Schedule of Investments. Alternatively, if certain conditions are met, a Statement of Net Assets may be presented in lieu of this statement and the Schedule of Investments.
STATEMENT OF NET ASSETS
The Statement of Net Assets provides a detailed list of the fund’s holdings, including each security’s market value on the last day of the reporting period. The Statement of Net Assets includes a Schedule of Investments. Other assets are added and other liabilities subtracted from the investments total to calculate the fund’s net assets. Finally, net assets are divided by the outstanding shares of the fund to arrive at its share price, or Net Asset Value (NAV) per share.
At the end of the Statement of Net Assets is a table displaying the composition of the fund’s net assets. Paid in Capital is the money invested by shareholders and represents the bulk of net assets. Undistributed Net Investment Income and Accumulated Net Realized Gains usually approximate the amounts the fund had available to distribute to shareholders as of the statement date. Accumulated Realized Losses will appear as negative balances. Unrealized Appreciation (Depreciation) is the difference between the market value of the fund’s investments and their cost, and reflects the gains (losses) that would be realized if the fund were to sell all of its investments at their statement-date -values.
STATEMENT OF OPERATIONS
The Statement of Operations summarizes the fund’s investment income earned and expenses incurred in operating the fund. Investment income includes dividends earned from stocks and interest earned from interest-bearing securities in the fund. Expenses incurred in operating the fund include the advisory fee paid to the investment advisor, administrative services fees, distribution plan expenses (if applicable), transfer agent fees, shareholder servicing expenses, custodial, legal, and audit fees, and the printing and postage expenses related to shareholder reports. Expense offsets (fees paid indirectly) may also be shown. Credits earned from offset arrangements may be used to reduce the fund’s expenses. This statement also shows net gains (losses) realized on the sale of investments and the increase or decrease in the unrealized appreciation (depreciation) on investments held during the period.
STATEMENT OF CHANGES IN NET ASSETS
The Statement of Changes in Net Assets shows how the fund’s total net assets changed during the two most recent reporting periods. Changes in the fund’s net assets are attributable to investment operations, distributions and capital share transactions.
The Operations section of the report summarizes information detailed in the Statement of Operations. The Distribution section shows the dividend and capital gain distributions made to shareholders. The amounts shown as distributions in this section may not match the net investment income and realized gains amounts shown in the Operations section because distributions are determined on a tax basis and certain investments or transactions may be treated differently for financial statement and tax purposes. The Capital Share Transactions section shows the amount shareholders invested in the fund, either by purchasing shares or by reinvesting distributions, and the amounts redeemed. The corresponding numbers of shares issued, reinvested and redeemed are shown at the end of the report.
FINANCIAL HIGHLIGHTS
The Financial Highlights table provides a per-share breakdown per class of the components that affect the fund’s net asset value for current and past reporting periods. The table provides total return, total distributions, expense ratios, portfolio turnover and net assets for the applicable period. Total return is a measure of a fund’s performance that encompasses all elements of return: dividends, capital gain distributions and changes in net asset value. Total return is the change in value of an investment over a given period, assuming reinvestment of any dividends and capital gain distributions, expressed as a percentage of the initial investment. Total distributions include distributions from net investment income and net realized gains. Long-term gains are earned on securities held in the fund more than one year. Short-term gains, on the sale of securities held less than one year, are treated as ordinary dividend income for tax purposes. The expense ratio is a fund’s cost of doing business, expressed as a
calvert.com CALVERT SOLUTION STRATEGIES ANNUAL REPORT (UNAUDITED) 39
percentage of net assets. These expenses directly reduce returns to shareholders. Portfolio turnover measures the trading activity in a fund’s investment portfolio—how often securities are bought and sold by a fund. Portfolio turnover is affected by market conditions, changes in the size of the fund, the nature of the fund’s investments and the investment style of the portfolio manager.
PROXY VOTING
The Proxy Voting Guidelines of the Calvert Funds that the Fund uses to determine how to vote proxies relating to portfolio securities are provided as an Appendix to the Fund’s Statement of Additional Information. The Statement of Additional Information can be obtained free of charge by calling the Fund at 1-800-368-2745, by visiting the Calvert website at www.calvert.com; or by visiting the SEC’s website at www.sec.gov.
Information regarding how the Fund voted proxies relating to portfolio securities during the most recent 12-month period ended June 30 is available on the Fund’s website at www.calvert.com and on the SEC’s website at www.sec.gov.
AVAILABILITY OF QUARTERLY PORTFOLIO HOLDINGS
The Fund files its complete schedule of portfolio holdings with the SEC for the first and third quarters of each fiscal year on Form N-Q. The Fund’s Form N-Q is available on the SEC’s website at www.sec.gov. The Fund’s Form N-Q may be reviewed and copied at the SEC’s Public Reference Room in Washington, DC; information on the operation of the Public Reference Room may be obtained by calling 1-800-SEC-0330.
40 calvert.com CALVERT SOLUTION STRATEGIES ANNUAL REPORT (UNAUDITED)
DIRECTOR AND OFFICER INFORMATION TABLE
|
| | | | | |
| Name & Age | Position With Fund | Position Start Date | Principal Occupation During Last 5 Years | # of Calvert Portfolios Overseen | Other Directorships During the Past Five Years |
| INDEPENDENT TRUSTEES/DIRECTORS |
REBECCA L. ADAMSON AGE: 66 | Trustee Director Director Director | 1989 CSIF 2000 IMPACT 2000 CRIS 2005 CWVF | President of the national non-profit, First People’s Worldwide, formerly First Nations Financial Project. Founded by her in 1980, First People’s Worldwide is the only American Indian alternative development institute in the country. | 18 | • Bay & Paul Foundation |
RICHARD L. BAIRD, JR. AGE: 67 | Trustee & Chair Director & Chair Director & Chair Director & Chair
| 1982 CSIF
2000 CRIS
2005 CWVF
2005 IMPACT | Former President and CEO of Adagio Health Inc. (retired in 2014) in Pittsburgh, PA, a non-profit corporation which provides family planning services, nutrition, maternal/child health care, and various health screening services and community preventive health programs. | 25 | |
JOHN G. GUFFEY, JR. AGE: 67 | Director Trustee Director Director | 1992 CWVF 1982 CSIF 2000 CRIS 2005 IMPACT | President of Aurora Press Inc., a privately held publisher of trade paperbacks. | 25 | • Ariel Funds (3) (asset management) (through 12/31/11) • Calvert Social Investment Foundation • Calvert Ventures, LLC |
MILES D. HARPER, III AGE: 52 | Director Trustee Director Director | 2000 IMPACT 2005 CSIF 2005 CRIS 2005 CWVF | Partner, Carr Riggs & Ingram (public accounting firm) since September 2013. Partner, Gainer Donnelly & Desroches (public accounting firm) (now Carr Riggs & Ingram), 1999-2013. | 18 | • Bridgeway Funds (14) (asset management) |
JOY V. JONES AGE: 65 | Director Trustee Director Director | 2000 IMPACT 1990 CSIF 2000 CRIS 2005 CWVF | Attorney. | 18 | • Director, Conduit Street Restaurants SUD 2 Limited • Director, Palm Management Corporation |
TERRENCE J. MOLLNER, Ed.D. AGE: 70 | Director Trustee Director Director | 1992 CWVF 1982 CSIF 2000 CRIS 2005 IMPACT | Founder, Chairperson and President of Trusteeship Institute, Inc., an educational organization focused on the personal skills and organizations described in Dr. Mollner’s book, The Love Skill: We Are Mastering the 7 Layers of Human Maturity, particularly businesses that freely chose to give priority to the common good. Chairperson, Stakeholders Capital, Inc., an asset management firm and financial services provider.
| 18 | • Calvert Social Investment Foundation • Ben & Jerry’s Homemade, Inc. (food products) |
SYDNEY A. MORRIS AGE: 66 | Trustee Director Director Director | 1982 CSIF 2000 CRIS 2005 CWVF 2005 IMPACT | The Rev. Dr. Morris is a Unitarian Universalist minister. | 18 | |
calvert.com CALVERT SOLUTION STRATEGIES ANNUAL REPORT (UNAUDITED) 41
|
| | | | | |
| Name & Age | Position With Fund | Position Start Date | Principal Occupation During Last 5 Years | # of Calvert Portfolios Overseen | Other Directorships During the Past Five Years |
| INTERESTED TRUSTEES/DIRECTORS |
D. WAYNE SILBY, Esq.* AGE: 67 | Director Trustee Director Director | 1992 CWVF 1982 CSIF 2000 CRIS 2000 IMPACT | Mr. Silby is the founding Chair of the Calvert Funds. He is the Chair-Elect and a principal of Syntao.com, a Beijing-based company promoting corporate social responsibility. | 25 | • Ameritas Mutual Holding Company (insurance) • Calvert Social Investment Foundation • ImpactAssets, Inc. (asset management) • Committee for the Future (charitable supporting organization) • Syntao.com China (HK) (sustainability consulting) • The ICE Organization (environmental services) |
JOHN H. STREUR* AGE: 55 | Director & President Trustee & President Director & President Director & President | 2015 CWVF
2015 CSIF
2015 CRIS
2015 IMPACT | President and Chief Executive Officer of Calvert Investments, Inc. (since January 2015) and Chief Compliance Officer for the Advisor and Calvert Investment Distributors, Inc. (since August 10, 2015) President and Director, Portfolio 21 Investments, Inc. (through October 2014) President, Chief Executive Officer and Director, Managers Investment Group LLC (through January 2012) President and Director, The Managers Funds and Managers AMG Funds (through January 2012). | 38 | • Portfolio 21 Investments, Inc. (asset management)(through October 2014) • Managers Investment Group LLC (asset management)(through January 2012) • The Managers Funds (asset management) (through January 2012) • Managers AMG Funds (asset management) (through January 2012) • Calvert Social Investment Foundation |
42 calvert.com CALVERT SOLUTION STRATEGIES ANNUAL REPORT (UNAUDITED)
|
| | | |
| Name & Age | Position With Fund | Position Start Date | Principal Occupation During Last 5 Years |
| OFFICERS |
SUSAN WALKER BENDER, Esq. AGE: 56 | Assistant Vice President & Assistant Secretary | 1988 CSIF 2000 CRIS 1992 CWVF 2000 Impact | Assistant Vice President, Assistant Secretary and Associate General Counsel of Calvert Investments, Inc. |
VICKI L. BENJAMIN AGE: 54 | Treasurer | 2015 | Executive Vice President and Chief Financial Officer of Calvert Investments, Inc. since March 2015. Prior to Calvert, Ms. Benjamin was a Senior Partner at KPMG. |
ROBERT D. BENSON, ESQ. AGE: 36 | Assistant Vice President & Assistant Secretary | 2014 | Assistant General Counsel (since 2014), Assistant Vice President & Assistant Secretary (since 2015) and Staff Attorney (prior to 2014), Calvert Investments, Inc. |
HOPE BROWN AGE: 42 | Chief Compliance Officer | 2014 | Chief Compliance Officer for the Calvert Funds (since 2014). Vice President and Chief Compliance Officer, Wilmington Funds (2012-2014). Vice President and Senior Compliance Officer, Wilmington Trust Investment Advisors, Inc. (2010-2012). Assistant Vice President, Lead Manager, Risk Management and Divisional Compliance, T. Rowe Price Associates, Inc. (2005-2010). |
THOMAS DAILEY AGE: 51 | Vice President | 2004 | Vice President of the Advisor and lead portfolio manager for Calvert’s municipal funds. |
MATTHEW DUCH Age: 40 | Vice President | 2011 | Vice President of the Advisor (since 2011) and portfolio manager for Calvert’s taxable fixed-income funds. |
IVY WAFFORD DUKE, Esq. AGE: 47 | Vice President & Secretary | 1996 CSIF 2000 CRIS 1996 CWVF 2000 Impact | Vice President, Acting Secretary and Acting General Counsel (Deputy General Counsel prior to 2015) of Calvert Investments, Inc. Prior to August 10, 2015, Ms. Duke was also Chief Compliance Officer for the Advisor and Calvert Investment Distributors, Inc. |
ROBERT J. ENDERSON, CFA AGE: 57 | Assistant Treasurer | 2014 | Acting Chief Financial Officer (September 2014-March 2015) and Vice President, Corporate Finance, of Calvert Investments, Inc. |
PATRICK FAUL AGE: 50 | Vice President | 2010 | Vice President and Head of Credit Research for the Advisor. |
TRACI L. GOLDT AGE: 42 | Assistant Secretary | 2004 | SEC Filing and Administrative Operations Manager (since 2011) and Executive Assistant to General Counsel (prior to 2011), Calvert Investments, Inc. |
VISHAL KHANDUJA, CFA AGE: 37 | Vice President | 2014 | Vice President of Calvert Investment Management, Inc. (since 2014) and portfolio manager for Calvert’s taxable fixed-income funds since 2012. Previously worked at Columbia Management as Portfolio Manager - Global Rates and Currency Team (2009-2012). |
LANCELOT A. KING, Esq. AGE: 45 | Assistant Vice President & Assistant Secretary | 2002 | Assistant Vice President, Assistant Secretary and Associate General Counsel of Calvert Investments, Inc. |
ANDREW K. NIEBLER, Esq. AGE: 48 | Assistant Vice President & Assistant Secretary | 2006 | Assistant Vice President, Assistant Secretary and Associate General Counsel of Calvert Investments, Inc. |
MARYBETH PILAT, CPA AGE: 47 | Fund Controller and Assistant Treasurer | 2015 | Director of Fund Administration, Calvert Investment Administrative Services, Inc. since August 2015. VP Expense & Budgeting, Global Fiduciary Platform, Legg Mason (May 2015 - July 2015). Vice President and Assistant Treasurer, Columbia Funds, Ameriprise, Columbia Management (2010 - April 2015). |
CATHERINE P. ROY AGE: 59 | Vice President | 2004 | Senior Vice President of the Advisor and Chief Investment Officer – Fixed Income. |
NATALIE A. TRUNOW AGE: 47 | Vice President | 2008 | Senior Vice President of the Advisor and Chief Investment Officer – Equities. |
* Mr. Streur is an interested person of the Funds since he is an Officer and Director of each Fund’s Advisor and certain affiliates. Mr. Silby is an interested person of the Funds since he is a Director of the parent company of each Fund’s Advisor. The address of Trustees/Directors and Officers is 4550 Montgomery Avenue, Suite 1000N, Bethesda, Maryland 20814, except Mr. Silby’s address is 1715 18th Street, N.W., Washington, DC 20009. Additional information about the Fund’s Trustees/Directors can be found in the Statement of Additional Information (SAI). You can get a free copy of the SAI at www.calvert.com, or by contacting your broker, or the Fund at 1-800-368-2745. |
calvert.com CALVERT SOLUTION STRATEGIES ANNUAL REPORT (UNAUDITED) 43
|
|
| This page intentionally left blank. |
|
|
| This page intentionally left blank. |
To Open an Account
800-368-2748
Service for Existing Account
Shareholders: 800-368-2745
Brokers: 800-368-2746
Registered Mail
Calvert Investments
c/o BFDS,
P.O. Box 219544
Kansas City, MO 64121-9544
Overnight Mail
Calvert Investments
c/o BFDS,
330 West 9th Street
Kansas City, MO 64105
Web Site
calvert.com
Principal Underwriter
Calvert Investment Distributors, Inc.
4550 Montgomery Avenue
Suite 1000 North
Bethesda, Maryland 20814
|
| | | |
CALVERT SOLUTION STRATEGIES | CALVERT’S FAMILY OF FUNDS | | |
| | Municipal Funds Tax-Free Responsible Impact Bond Fund Taxable Bond Funds Bond Portfolio Income Fund Short Duration Income Fund Long-Term Income Fund Ultra-Short Income Fund High Yield Bond Fund Green Bond Fund Unconstrained Bond Fund Balanced and Asset Allocation Funds Balanced Portfolio Conservative Allocation Fund Moderate Allocation Fund Aggressive Allocation Fund | | Equity Funds Large Cap Core Portfolio Equity Portfolio Global Value Fund U.S. Large Cap Core Responsible Index Fund U.S. Large Cap Value Responsible Index Fund U.S. Large Cap Growth Responsible Index Fund U.S. Mid Cap Core Responsible Index Fund Developed Markets EX-U.S. Responsible Index Fund Capital Accumulation Fund International Equity Fund Small Cap Fund Global Energy Solutions Fund Global Water Fund International Opportunities Fund Global Equity Income Fund Emerging Markets Equity Fund |
This report is intended to provide fund information to shareholders. It is not authorized for distribution to prospective investors unless preceded or accompanied by a prospectus. Note: The information on our website is not incorporated by reference into this report; our website address is included as an inactive textual reference only. Investors should carefully consider the investment objectives, risks, charges and expenses of the Calvert Funds. This and other important information is contained in the fund’s summary prospectus and prospectus, which can be obtained from your financial professional and should be read carefully before investing. You may also call Calvert at 800/368-2748 or visit calvert.com. Printed on recycled paper using soy inks. |
| | | | |
|
| |
Annual Report September 30, 2015 E-Delivery Sign-Up — Details Inside | |
|
|
| |
Choose Planet-friendly E-delivery! Sign up now for on-line statements, prospectuses, and fund reports. In less than five minutes you can help reduce paper mail and lower fund costs. Just go to calvert.com. If you already have an online account at Calvert, click on Login, to access your Account, and select the documents you would like to receive via e-mail. If you’re new to online account access, click on Login, then Register to create your user name and password. Once you’re in, click on the E-delivery sign-up on the Account Portfolio page and follow the quick, easy steps. Note: if your shares are not held directly at Calvert but through a brokerage firm, you must contact your broker for electronic delivery options available through their firm. |
|
| | | |
| TABLE OF CONTENTS |
| | | | |
| | | | President’s Letter |
| | | | Portfolio Management Discussion |
| | | | Understanding Your Fund's Expenses |
| | | | Report of Independent Registered Public Accounting Firm |
| | | | Schedule of Investments |
| | | | Statement of Assets and Liabilities |
| | | | Statement of Operations |
| | | | Statements of Changes in Net Assets |
| | | | Notes to Financial Statements |
| | | | Financial Highlights |
| | | | Explanation of Financial Tables |
| | | | Proxy Voting |
| | | | Availability of Quarterly Portfolio Holdings |
| | | | Director and Officer Information Table |
|
| |
| John Streur President and Chief Executive Officer, Calvert Investments, Inc. |
Dear Shareholders,
Global economic growth is vital to the improvement of the lives of all people, especially so to those of the ultra-poor. However, how that growth is achieved is critical to the long-term health and sustainability of our collective societies. Business activity that does not show consideration for environmental and social impacts may have calamitous consequences, many of which we are witnessing now, including political and social unrest, unjust wealth distribution and diminished bio-diversity.
The returns of the markets (chart below) reflect the impact of the uncertainty created by a legacy of unsustainable development and the current lack of positive economic growth trends. The steep decline in the emerging market equities index (reflective of the flight of capital and currency weakness) is particularly impactful as these regions include some of the largest populations of individuals most in need of sustainable and inclusive economic development.
|
| | | | |
| MARKET BENCHMARKS | Total Returns for the period ended 9/30/2015 |
| 6 Months | Year-to-Date | 1 Year | 5 Year |
| S&P 500 | -6.18% | -5.29% | -0.61% | 13.34% |
| Russell 1000 | -6.72% | -5.24% | -0.61% | 13.42% |
| Russell 3000 | -7.12% | -5.45% | -0.49% | 13.28% |
| MSCI World ex USA | -9.88% | -6.32% | -9.73% | 3.92% |
| MSCI Emerging Markets | -17.11% | -15.22% | -18.98% | -3.25% |
| Barclays U.S. Aggregate Bond | -0.47% | 1.13% | 2.94% | 3.10% |
| Barclays Global Aggregate | -0.34% | -2.25% | -3.26% | 0.81% |
| Returns for periods greater than one year have been annualized. |
In an effort to mitigate this issue and foster the long term sustainability and justice of our global economic system, many of the world’s leaders participated with the United Nations (“UN”) to design and implement a 15-year plan to create the kind of economic development (http://www.calvert.com/media-relations/press-releases/calvert-ceo-participates-in-the-un-sustainable-development-summit) that should benefit the poorest people in the world, preserve opportunities for future generations, and provide stewardship to the environment. This effort, which kicked-off at the UN Summit earlier this month, involves bringing together private enterprise, governments, NGOs, development banks and people of all walks of life to achieve the “Sustainable Development Goals 2015” (SDGs). These goals include: eliminating extreme poverty, eliminating extreme hunger, fostering good health for all, promoting gender equality, and creating environmental sustainability and peace and stability throughout the world. The SDGs impact residents of every country in some manner, but no one more acutely than the denizens of the developing and emerging nations.
It was my privilege, as Calvert’s CEO, to be invited to the Summit, as one of 350 global leaders asked to participate in the development of this critical 15-year sustainability plan. During the course of this event, I announced that Calvert Investments would lead a project (http://www.calvert.com/perspective/social-impact/calvert-un-sustainable-development-goals) to map the Sustainable Development Goals to standards that companies can be measured by, and that investors may look to in order to
4 calvert.com CALVERT GREEN BOND FUND ANNUAL REPORT (UNAUDITED)
understand which companies are helping to create sustainable, responsible growth. It is integral to the success and achievement of the goals, that the largest holders of capital, i.e., corporations, help drive these initiatives.
The crucial role that corporations now play in creating social and environmental outcomes was highlighted at the UN sessions by the presence of CEOs and sustainability officers from around the world, and the vital role of investors and the capital markets was reflected by our presence and contribution. In addition to representing your interests at the UN event, Calvert has contributed to the understanding of the role that corporations and investors play in driving social and environmental conditions through our most recent research, “The Role of the Corporation in Society”, available to you on our website, (see http://www.calvert.com/perspective/governance/calvert-serafeim-series-report).
Despite the fact that the past year has not brought the financial returns that you or I would have wished for as investors, I believe that when we look back on 2015 several years from now we are likely to see it as a transformative year in terms of our economic and social systems. Individuals and organizations of all types — corporate, government, NGO, religious — are coming together due to the realization that we need a more sustainable and just system to serve the needs of all stakeholders. As a shareholder of Calvert Funds, you are very much part of this mission, as together we are a leader and innovator in connecting capital to mission, with the dual purpose of driving competitive investment returns with just and sustainable economic progress.
On behalf of all of us at Calvert Investments, thank you for the confidence you have placed in our management of your funds and the ongoing privilege to serve you. We appreciate the opportunity to work with you as we strive to meet your financial needs while also helping to render the world a better place for all people.
Respectfully,
John Streur
October 2015
calvert.com CALVERT GREEN BOND FUND ANNUAL REPORT (UNAUDITED) 5
|
| |
| PORTFOLIO MANAGEMENT DISCUSSION |
|
| |
| Vishal Khanduja, CFA Vice President, Portfolio Manager and Head of Taxable Fixed Income |
|
| |
| Matthew Duch Vice President, Portfolio Manager |
Performance
The Calvert Green Bond Fund Class A shares (at NAV) returned 1.95% for the 12-month period ended September 30, 2015. The Fund underperformed its passive benchmark, the Barclays U.S. Aggregate Bond Index, which returned 2.94% for the period, but outpaced the Lipper A Rated Corporate Debt Funds Average, which returned 1.61%.
Investment Process
Environmental, social, and governance considerations
The Calvert fixed-income investment team employs a relative value discipline across our investment portfolios. Broad macroeconomic analysis drives our long-term economic outlook. We then determine our highest investment convictions and allocate assets accordingly, possibly including investments outside our benchmarks. Our bottom-up security selection and sector weight targets result from integrating financial and nonfinancial fundamental analysis into our evaluation process. Effective October 30, 2015, the Fund adopted The Calvert Principles for Responsible Investment. The Principles may be found at http://www.calvert.com/approach/how-we-invest/the-calvert-principles.
Market Review
Despite steady improvement in the labor market and strong housing data throughout the first half of 2015, a continuing deceleration in growth was evident in a manufacturing slowdown, a decline in business spending, and unimpressive retail sales. Rather than contributing to a surge in spending, the windfall from lower gas prices has led to an increase in personal savings, which rose to 5.4% from 4.7% in the first quarter. Economists cited disruption at West Coast ports and severe weather among the factors contributing to the weak manufacturing output, while a strong dollar was the catalyst for softer exports and weaker earnings for U.S. multinationals.
Oil prices recovered from their fourth-quarter slump and have stabilized around $45 per barrel. The calendar year began with energy companies racing to reduce their capital expenditures to control costs in light of the price decline. Despite the positive impact of lower oil prices on consumers, spending remained sluggish.
Globally, the macroeconomic picture remains one of anemic growth and low inflation or deflation. Aggressive monetary easing outside the U.S. — the European Central Bank (ECB) announced 60 billion euros per month of quantitative easing (QE) in January — pushed both global interest rates and non-U.S. dollar currencies lower. (The euro ended down 11.3% relative to the dollar for the first half of 2015.) U.S. interest rates rose for all maturities in the first half of the year. More recently, China’s slowing economy, uncertainty about the timing of U.S. Federal Reserve tightening, and collapsing commodity prices weighed heavily on global markets. In mid-August, China let the yuan depreciate. This move triggered doubt worldwide about the Chinese government’s ability to manage its slowing economy. Along with wild swings in the Chinese stock market, the devaluation caused a global sell-off in risk assets, particularly in emerging markets, currencies, and commodities. Global equities recorded one of their worst quarters since 2011.
6 calvert.com CALVERT GREEN BOND FUND ANNUAL REPORT (UNAUDITED)
|
| | | | |
| | | | |
| | CALVERT GREEN BOND FUND | |
| | SEPTEMBER 30, 2015 | |
| | | | |
| | ECONOMIC SECTORS | % OF TOTAL INVESTMENTS | |
| | Corporate | 32.7 | % | |
| | Financial Institutions | 13.1 | % | |
| | Industrial | 16.9 | % | |
| | Utility | 2.7 | % | |
| | Government Related | 10.4 | % | |
| | Agency | 3.4 | % | |
| | Local Authority | 1.6 | % | |
| | Supranational | 5.4 | % | |
| | Municipal | 4.9 | % | |
| | Utility | 4.9 | % | |
| | Securitized | 15.3 | % | |
| | Asset-Backed Securities | 6.4 | % | |
| | Commercial Mortgage-Backed Securities | 2.2 | % | |
| | Mortgage-Backed Pass-Through | 6.7 | % | |
| | Short-Term Investments | 15.7 | % | |
| | Treasury | 21.0 | % | |
| | Total | 100 | % | |
| | | | |
In the U.S., the unemployment rate remained at 5.1% in September, a seven-year low. Gross domestic product increased in the second quarter by 3.7%, after an increase of only 0.6% in the first quarter. Inflation remains in check with the core personal consumption expenditure index up 1.8% in the second quarter, from 1.0% in the first quarter. Despite the improving U.S. economy, the Federal Reserve did not raise interest rates in September because of recent global economic and financial developments. The weaker than expected September jobs report puts a 2015 rate hike in doubt. We continue to expect U.S. interest rates to remain low for the foreseeable future.
Portfolio Strategy
The Fund delivered gains of 1.95% for the reporting period but underperformed its passive benchmark. A shorter-than-benchmark duration along with the Fund’s allocation to out-of-index, high-yield securities were the primary drivers of underperformance.1 The Fund’s hedging strategy, which is used to manage interest-rate risk and yield-curve position and is partially implemented with Treasury futures, did not have a material impact on performance.
On a positive note, the Fund’s overweight allocation to investment grade corporates, in particular green bonds issued by financial institutions, and allocations to the transportation
______________________________
1Duration measures a portfolio’s sensitivity to changes in interest rates. Generally, the longer the duration, the greater the change in value in response to a given change in interest rates.
|
| | | | | | |
| | | | | |
| | CALVERT GREEN BOND FUND | |
| | SEPTEMBER 30, 2015 | |
| | | | | |
| | INVESTMENT PERFORMANCE | |
| | (TOTAL RETURN AT NAV) | |
| | | 6 MONTHS ENDED 9/30/15 | 12 MONTHS ENDED 9/30/15 | |
| | Class A | -1.29 | % | 1.95 | % | |
| | Class I | -1.10 | % | 2.36 | % | |
| | Class Y | -1.22 | % | 2.21 | % | |
| | Barclays U.S. Aggregate Bond Index | -0.47 | % | 2.94 | % | |
| | Lipper A Rated Corporate Debt Funds Average | -2.18 | % | 1.61 | % | |
| | | | | |
| | Investment performance/return at NAV does not reflect the deduction of the Fund’s maximum 3.75% front-end sales charge or any deferred sales charge. | |
| | | | | |
| | | 30 DAYS ENDED | |
| | SEC YIELD | 9/30/14 | 9/30/15 | |
| | Class A | 1.28 | % | 1.58 | % | |
| | Class I | 1.71 | % | 2.01 | % | |
| | Class Y | 1.59 | % | 1.88 | % | |
| | | |
sector (airlines) and consumer cyclicals (automotive and retailers) contributed positively to performance. The Fund’s overweight exposure to green asset-backed securities backed by solar panels and energy-efficient vehicles was a notable positive contributor within the securitized sector. The Fund also benefited from an underweight allocation to the energy and mining sectors.
During October 2014, global fears of Ebola put downward pressure on the airline industry. At the same time, oil prices were declining and we viewed this as an attractive opportunity to increase exposure to the airlines sector. We did so in the form of enhanced equipment trust certificates. Soon after the Ebola scare subsided, airlines’ profitability rose on increased consumer demand and lower jet fuel prices. We tactically reduced exposure to the airlines sector in early May 2015 as valuations became less attractive versus other sectors.
In February 2015, we began tactically reducing our exposure to the U.S. money center banks on relative valuation and new-debt issuance concerns. Later in the year, we again sought to increase exposure to money center banks on attractive relative valuations.
One area we find especially attractive is fixed-to-floating, callable, non-cumulative preferred securities issued by U.S. money center banks. These are hybrid instruments that share the qualities of both equity and debt securities and usually rank between the two in the bank capital structure. These securities can pay dividends at a fixed or floating rate. Although they do
calvert.com CALVERT GREEN BOND FUND ANNUAL REPORT (UNAUDITED) 7
not have a set maturity date, most preferred securities are callable and can be redeemed by the issuer after a certain date (the “call date”), usually the end of their fixed-rate period. Issuers are more likely to redeem preferred securities that pay above-market interest rates, and replace them with new, lower-rated preferred securities.
Outlook
We expect U.S. economic growth to pick up from a rather weak first half of the year, but remain below its long-term average. Consumer spending, supported by lower energy prices and an improving employment picture, should continue to drive domestic activity, especially through housing and autos. This should help offset the drag from the strong dollar.
U.S. economic performance and monetary policy is likely to continue to diverge from the rest of the world. The ECB, for instance, is beginning full-scale QE while the Fed is nearing tightening after a more than six-year QE program. Eurozone growth has picked up, but the true success of the ECB easing will only become apparent over a longer time period. It remains to be seen if its relatively late start will ultimately require more easing. In the meantime, barring any deterioration in U.S. economic data, we see a strengthening dollar as likely.
Today’s lower energy prices have dampened inflation, which remains well below 2%. This will keep a lid on any potential move higher in long rates. We remain in the camp of those expecting low rates for longer and any meaningful Fed rate increases not happening until late 2015 or the first part of 2016. However, as the Federal Reserve moves to inch short rates higher, lower energy rates will be a catalyst for a flattening yield curve. We also see lower energy costs driving relative outperformance across several industries, both in investment-grade and high-yield markets.
Note: for information on a recent portfolio manager change in the Fund and other changes, please see the supplement to the prospectus included at the end of this report.
Vishal Khanduja, CFA
Matthew Duch
Calvert Investment Management, Inc.
October 2015
8 calvert.com CALVERT GREEN BOND FUND ANNUAL REPORT (UNAUDITED)
Growth of $10,000
The graph below shows the value of a hypothetical $10,000 investment in the Fund over the past 10 fiscal year periods or since inception (for funds without 10-year records). The results shown are for Class A shares, reflect the deduction of the maximum front-end Class A sales charge of 3.75%, and assume the reinvestment of dividends. The result is compared with a broad based market index. Market indexes are unmanaged and their results do not reflect the effect of expenses or sales charges. The value of an investment in a different share class would be different.
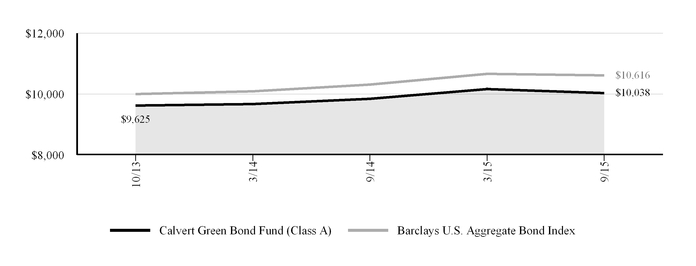
|
| | | | | |
| CALVERT GREEN BOND FUND |
| SEPTEMBER 30, 2015 |
| AVERAGE ANNUAL TOTAL RETURNS | Ticker Symbol | 1 Year | Since Inception (10/31/2013) |
| Class A (with max. load) | CGAFX | -1.85 | % | 0.21 | % |
| Class I | CGBIX | 2.36 | % | 2.58 | % |
| Class Y | CGYFX | 2.21 | % | 2.49 | % |
| Barclays U.S. Aggregate Bond Index | | 2.94 | % | 3.17 | % |
| Lipper A Rated Corporate Debt Funds Average | | 1.61 | % | 3.32 | % |
| | | | |
| | | | |
All performance data shown, including the graph above and the adjacent table, represents past performance, does not guarantee future results, assumes reinvestment of dividends and distributions, and does not reflect the deduction of taxes that a shareholder would pay on the Fund’s distributions or the redemption of the Fund shares. All performance data reflects fee waivers and/or expense limitations, if any are in effect; in their absence performance would be lower. See Note B in Notes to Financial Statements. The investment return and principal value of an investment will fluctuate so that an investor’s shares, when redeemed, may be worth more or less than their original cost. Current performance may be lower or higher than the performance data quoted; for current performance data, including most recent month-end, visit www.calvert.com. The gross expense ratio from the current prospectus for Class A shares is 1.99%. This number may differ from the expense ratio shown elsewhere in this report because it is based on a different time period and, if applicable, does not include fee or expense waivers. Performance data quoted already reflects the deduction of the Fund’s operating expenses.
calvert.com CALVERT GREEN BOND FUND ANNUAL REPORT (UNAUDITED) 9
UNDERSTANDING YOUR FUND'S EXPENSES
As an investor, you incur two types of costs. There are transaction costs, which generally include sales charges on purchases and may include redemption fees. There are also ongoing costs, which generally include management fees, distribution and/or service fees, and other fund expenses. The following information is intended to help you understand your ongoing costs (in dollars) of investing in this mutual fund and to help you compare these costs with the ongoing costs of investing in other mutual funds.
To illustrate these ongoing costs, we have provided examples and calculated the expenses paid by the fund's investors during the period. The actual and hypothetical information presented in the examples is based on an investment of $1,000 invested at the beginning of the period and held for the entire period (April 1, 2015 to September 30, 2015).
Actual Expenses
The first line of the table below provides information about actual account values and actual expenses. You may use the information in this line, together with the amount you invested, to estimate the expenses that you paid over the period. Simply divide your account value by $1,000 (for example, an $8,600 account value divided by $1,000 = 8.6), then multiply the result by the number in the first line under the heading entitled "Expenses Paid During Period" to estimate the expenses you paid on your account during this period.
Hypothetical Example for Comparison Purposes
The second line of the table below provides information about hypothetical account values and hypothetical expenses based on the Fund’s actual expense ratio and an assumed rate of return of 5% per year before expenses, which is not the Fund’s actual return. The hypothetical account values and expenses may not be used to estimate the actual ending account balance or expenses you paid for the period. You may use this information to compare the ongoing costs of investing in the Fund and other funds. To do so, compare the 5% hypothetical example with the 5% hypothetical examples that appear in the shareholder reports of the other funds.
Please note that the expenses shown in the table are meant to highlight your ongoing costs only and do not reflect any transactional costs, such as sales charges (loads), or redemption fees. Therefore, the second line of the table is useful in comparing ongoing costs only, and will not help you determine the relative total costs of owning different funds. In addition, if these transactional costs were included, your costs would have been higher.
|
| | | | | | | | |
| | ANNUALIZED
EXPENSE RATIO | BEGINNING
ACCOUNT VALUE
4/1/15 | ENDING
ACCOUNT VALUE
9/30/15 | EXPENSES PAID
DURING PERIOD*
4/1/15 - 9/30/15 |
| Class A | | | | | | |
| Actual | 0.88% | $1,000.00 | $987.10 | $4.38 |
| Hypothetical (5% return per year before expenses) | 0.88% | $1,000.00 | $1,020.66 | $4.46 |
| Class I | |
| Actual | 0.50% | $1,000.00 | $989.00 | $2.49 |
| Hypothetical (5% return per year before expenses) | 0.50% | $1,000.00 | $1,022.56 | $2.54 |
| Class Y | |
| Actual | 0.63% | $1,000.00 | $987.80 | $3.14 |
| Hypothetical (5% return per year before expenses) | 0.63% | $1,000.00 | $1,021.91 | $3.19 |
| |
| * Expenses paid during the period are equal to the annualized expense ratio for each class as indicated above, multiplied by the average account value over the period, multiplied by 183/365 (to reflect the one-half year period). Expense ratios shown in the Financial Highlights represent the actual expenses incurred for the fiscal year. |
10 calvert.com CALVERT GREEN BOND FUND ANNUAL REPORT (UNAUDITED)
REPORT OF INDEPENDENT REGISTERED PUBLIC ACCOUNTING FIRM
The Board of Directors of Calvert Impact Fund, Inc. and Shareholders of Calvert Green Bond Fund:
We have audited the accompanying statement of assets and liabilities of the Calvert Green Bond Fund (the “Fund”), a series of Calvert Impact Fund, Inc., including the schedule of investments, as of September 30, 2015, and the related statement of operations for the year then ended, the statements of changes in net assets for each of the years or periods in the two-year period then ended, and the financial highlights for each of the years or periods in the two-year period then ended. These financial statements and financial highlights are the responsibility of the Fund’s management. Our responsibility is to express an opinion on these financial statements and financial highlights based on our audits.
We conducted our audits in accordance with the standards of the Public Company Accounting Oversight Board (United States). Those standards require that we plan and perform the audit to obtain reasonable assurance about whether the financial statements and financial highlights are free of material misstatement. An audit includes examining, on a test basis, evidence supporting the amounts and disclosures in the financial statements. Our procedures included confirmation of securities owned as of September 30, 2015 by correspondence with the custodian and brokers or by other appropriate auditing procedures. An audit also includes assessing the accounting principles used and significant estimates made by management, as well as evaluating the overall financial statement presentation. We believe that our audits provide a reasonable basis for our opinion.
In our opinion, the financial statements and financial highlights referred to above present fairly, in all material respects, the financial position of the Calvert Green Bond Fund as of September 30, 2015, the results of its operations for the year then ended, the changes in its net assets for each of the years or periods in the two-year period then ended, and the financial highlights for each of the years or periods in the two-year period then ended, in conformity with U.S. generally accepted accounting principles.
Philadelphia, Pennsylvania
November 25, 2015
calvert.com CALVERT GREEN BOND FUND ANNUAL REPORT 11
CALVERT GREEN BOND FUND
SCHEDULE OF INVESTMENTS
SEPTEMBER 30, 2015
|
| | |
| | PRINCIPAL
AMOUNT ($) | VALUE ($) |
ASSET-BACKED SECURITIES - 6.6% | | |
| Dell Equipment Finance Trust, 1.80%, 6/22/20 (e) | 420,000 | 418,991 |
| Ford Credit Auto Owner Trust/Ford Credit, 2.41%, 11/15/25 (e) | 300,000 | 302,488 |
| Ford Credit Floorplan Master Owner Trust, 1.82%, 1/15/18 | 150,000 | 150,284 |
| RenewFund Receivables Trust, 3.51%, 4/15/25 (e) | 362,216 | 360,948 |
| SolarCity LMC: | | |
| Series I LLC, 4.80%, 11/20/38 (e) | 293,523 | 314,709 |
Series III LLC, 4.02%, 7/20/44 (e) | 384,529 | 378,934 |
Series III LLC, 5.44%, 7/20/44 (e) | 192,528 | 199,247 |
| Sunrun Callisto Issuer LLC, 5.38%, 7/20/45 (e) | 991,019 | 1,005,983 |
| Toyota Auto Receivables Owner Trust: | | |
| 0.417%, 11/15/17 (r) | 500,000 | 499,150 |
| 1.18%, 6/17/19 | 300,000 | 300,548 |
| | | |
Total Asset-Backed Securities (Cost $3,897,985) | | 3,931,282 |
| | | |
| | | |
| COMMERCIAL MORTGAGE-BACKED SECURITIES - 2.3% | | |
| GRACE Mortgage Trust, 3.71%, 6/10/28 (e)(r) | 400,000 | 386,564 |
| JP Morgan Chase Commercial Mortgage Securities Trust, 3.931%, 6/10/27 (e)(r) | 450,000 | 458,201 |
| Morgan Stanley Capital I Trust Series 2014-CPT: | | |
| Class F, 3.56%, 7/13/29 (e)(r) | 430,000 | 408,014 |
| Class G, 3.56%, 7/13/29 (e)(r) | 100,000 | 95,869 |
| | | |
Total Commercial Mortgage-Backed Securities (Cost $1,334,699) | | 1,348,648 |
| | | |
| | | |
| CORPORATE BONDS - 41.2% | | |
| African Development Bank, 0.75%, 10/18/16 | 370,000 | 370,855 |
| American Airlines B Pass Through Trust, 3.70%, 11/1/24 | 250,000 | 245,625 |
|
| | |
| | PRINCIPAL
AMOUNT ($) | VALUE ($) |
| American Airlines Group, Inc., 4.625%, 3/1/20 (e) | 100,000 | 97,500 |
| American Express Credit Corp., 0.89%, 3/18/19 (r) | 350,000 | 348,509 |
| American Tower Corp.: | | |
| 3.45%, 9/15/21 | 200,000 | 200,903 |
| 4.00%, 6/1/25 | 200,000 | 195,144 |
| American Water Capital Corp., 3.40%, 3/1/25 | 400,000 | 405,341 |
| Asian Development Bank, 2.125%, 3/19/25 | 750,000 | 743,554 |
| AT&T, Inc.: | | |
| 3.875%, 8/15/21 | 100,000 | 103,857 |
| 4.75%, 5/15/46 | 100,000 | 91,630 |
| Bank of America Corp.: | | |
| 2.25%, 4/21/20 | 425,000 | 418,723 |
| 3.95%, 4/21/25 | 250,000 | 243,209 |
| 3.875%, 8/1/25 | 500,000 | 506,945 |
| 4.25%, 10/22/26 | 100,000 | 98,862 |
| Capital One Bank, 2.25%, 2/13/19 | 300,000 | 298,934 |
| Capital One NA: | | |
| 1.474%, 8/17/18 (r) | 750,000 | 752,099 |
| 2.35%, 8/17/18 | 250,000 | 250,696 |
| Citigroup, Inc.: | | |
| 2.50%, 9/26/18 | 350,000 | 354,648 |
| 5.95%, 8/15/20, floating rate thereafter to 12/29/49 (r) | 100,000 | 98,625 |
| 5.90%, 2/15/23, floating rate thereafter to 12/29/49 (r) | 100,000 | 97,500 |
| 3.75%, 6/16/24 | 100,000 | 101,711 |
| 4.40%, 6/10/25 | 50,000 | 50,287 |
| 4.45%, 9/29/27 | 150,000 | 149,191 |
| CNH Industrial Capital LLC: | | |
| 3.875%, 11/1/15 | 400,000 | 399,000 |
| 3.875%, 7/16/18 (e) | 200,000 | 196,000 |
| Continental Airlines Pass Through Trust, 6.25%, 10/11/21 | 279,053 | 290,913 |
| CVS Health Corp.: | | |
| 3.875%, 7/20/25 | 500,000 | 515,404 |
| 4.875%, 7/20/35 | 200,000 | 209,854 |
| 5.125%, 7/20/45 | 200,000 | 214,991 |
| DIRECTV Holdings LLC / DIRECTV Financing Co., Inc., 6.375%, 3/1/41 | 420,000 | 449,991 |
| European Investment Bank, 2.50%, 10/15/24 | 200,000 | 204,864 |
12 calvert.com CALVERT GREEN BOND FUND ANNUAL REPORT
|
| | | | |
| | PRINCIPAL
AMOUNT ($) | VALUE ($) |
|
| Export Development Canada, 0.875%, 1/30/17 | 150,000 | 150,455 |
|
| Ford Motor Co., 4.75%, 1/15/43 | 125,000 | 117,256 |
|
| Ford Motor Credit Co. LLC, 1.239%, 11/4/19 (r) | 750,000 | 727,378 |
|
| General Electric Co., 2.70%, 10/9/22 | 345,000 | 345,871 |
|
| Home Depot, Inc. (The), 4.20%, 4/1/43 | 150,000 | 151,482 |
|
| Host Hotels & Resorts LP, 3.75%, 10/15/23 | 300,000 | 293,635 |
|
| Intel Corp., 3.70%, 7/29/25 | 100,000 | 102,596 |
|
| International Finance Corp., 0.625%, 11/15/16 | 200,000 | 200,065 |
|
| Johnson Controls, Inc., 3.625%, 7/2/24 | 250,000 | 243,162 |
|
| JPMorgan Chase & Co.: | | |
| 1.249%, 1/23/20 (r) | 100,000 | 100,436 |
|
| 3.625%, 5/13/24 | 250,000 | 253,472 |
|
| 3.875%, 9/10/24 | 500,000 | 495,222 |
|
| 3.90%, 7/15/25 | 150,000 | 152,778 |
|
| 4.25%, 10/1/27 | 150,000 | 149,386 |
|
| KFW, 1.75%, 10/15/19 | 200,000 | 202,985 |
|
| Kommunalbanken AS, 0.75%, 11/21/16 (e) | 200,000 | 200,344 |
|
Latam Airlines 2015-1 Pass-Through Trust B, 4.50%, 8/15/25 (e) | 100,000 | 95,000 |
|
| Masco Corp., 4.45%, 4/1/25 | 100,000 | 101,250 |
|
| Massachusetts Institute of Technology, 3.959%, 7/1/38 | 375,000 | 387,519 |
|
| Methanex Corp., 5.65%, 12/1/44 | 200,000 | 185,551 |
|
| Morgan Stanley: | | |
| 2.20%, 12/7/18 | 600,000 | 605,571 |
|
| 1.316%, 6/16/20 (r) | 350,000 | 348,856 |
|
| 4.00%, 7/23/25 | 100,000 | 102,199 |
|
| 5.00%, 11/24/25 | 100,000 | 106,322 |
|
| 3.95%, 4/23/27 | 100,000 | 96,308 |
|
| Nissan Motor Acceptance Corp.: | | |
| 1.026%, 9/26/16 (e)(r) | 250,000 | 250,019 |
|
| 2.35%, 3/4/19 (e) | 100,000 | 101,284 |
|
| Nordic Investment Bank, 2.25%, 9/30/21 | 750,000 | 772,195 |
|
| North American Development Bank, 2.40%, 10/26/22 | 1,000,000 | 990,335 |
|
| Pentair Finance SA: | | |
| 1.35%, 12/1/15 | 500,000 | 500,296 |
|
| 3.625%, 9/15/20 | 150,000 | 151,875 |
|
| Prologis LP, 3.35%, 2/1/21 | 250,000 | 253,415 |
|
| Prudential Financial, Inc., 2.30%, 8/15/18 | 300,000 | 304,256 |
|
|
| | | | |
| | PRINCIPAL
AMOUNT ($) | VALUE ($) |
|
| Svensk Exportkredit AB, 1.875%, 6/23/20 | 500,000 | 505,560 |
|
| Telefonica Emisiones SAU: | | |
| 3.992%, 2/16/16 | 600,000 | 606,254 |
|
| 3.192%, 4/27/18 | 200,000 | 204,556 |
|
| Terraform Global Operating LLC, 9.75%, 8/15/22 (e) | 1,000,000 | 802,500 |
|
| TerraForm Power Operating LLC, 5.875%, 2/1/23 (e) | 500,000 | 441,250 |
|
| Verizon Communications, Inc.: | | |
| 1.104%, 6/17/19 (r) | 500,000 | 496,658 |
|
| 2.625%, 2/21/20 | 200,000 | 200,593 |
|
| 4.862%, 8/21/46 | 400,000 | 375,085 |
|
| Virgin Australia Trust: | | |
| 7.125%, 10/23/18 (e) | 181,731 | 184,457 |
|
| 6.00%, 4/23/22 (e) | 483,195 | 495,274 |
|
| Vornado Realty LP, 2.50%, 6/30/19 | 1,000,000 | 1,003,129 |
|
| Whirlpool Corp.: | | |
| 6.50%, 6/15/16 | 500,000 | 519,847 |
|
| 3.70%, 5/1/25 | 400,000 | 397,318 |
|
| Xerox Corp., 2.80%, 5/15/20 | 200,000 | 198,063 |
|
| | | |
Total Corporate Bonds (Cost $24,596,262) | | 24,374,683 |
|
| | | |
| | | |
MUNICIPAL OBLIGATIONS - 6.7% | | |
| Massachusetts Clean Water Trust Revenue Bonds, 5.192%, 8/1/40 | 150,000 | 176,871 |
|
| Metropolitan Water District of Southern California Revenue Bonds, 6.947%, 7/1/40 | 250,000 | 294,655 |
|
| New York State Environmental Facilities Corp. Revenue Bonds: | | |
| 1.48%, 7/15/18 | 750,000 | 753,990 |
|
| 2.25%, 7/15/20 | 1,040,000 | 1,055,922 |
|
| Santa Clara Valley California Transportation Authority Revenue Bonds, 5.876%, 4/1/32 | 430,000 | 524,127 |
|
| Southern California Public Power Authority Revenue Bonds, 5.943%, 7/1/40 | 1,000,000 | 1,172,760 |
|
| | | |
Total Municipal Obligations (Cost $3,901,272) | | 3,978,325 |
|
| | | |
| | | |
calvert.com CALVERT GREEN BOND FUND ANNUAL REPORT 13
|
| | | | |
| | PRINCIPAL
AMOUNT ($) | VALUE ($) |
|
| U.S. GOVERNMENT AGENCIES AND INSTRUMENTALITIES - 1.7% | | |
| Overseas Private Investment Corp.: | | |
| 3.22%, 9/15/29 | 800,000 | 821,250 |
|
| 3.16%, 6/1/33 | 200,000 | 202,735 |
|
| | | |
Total U.S. Government Agencies and Instrumentalities (Cost $1,000,000) | | 1,023,985 |
|
| | | |
| | | |
| U.S. GOVERNMENT AGENCY MORTGAGE-BACKED SECURITIES - 6.9% | | |
| Fannie Mae: | | |
| 3.11%, 7/1/23 | 145,201 | 153,149 |
|
| 3.00%, 11/1/30^ | 400,000 | 415,859 |
|
| 3.50%, 11/1/30^ | 435,000 | 458,908 |
|
| 3.00%, 11/1/45^ | 575,000 | 581,514 |
|
| 3.50%, 11/1/45^ | 1,410,000 | 1,467,711 |
|
| 4.00%, 11/1/45^ | 925,000 | 984,872 |
|
| | | |
Total U.S. Government Agency Mortgage-Backed Securities (Cost $4,048,089) | | 4,062,013 |
|
| | | |
| | | |
|
| | | | |
| | PRINCIPAL
AMOUNT ($) | VALUE ($) |
|
| U.S. TREASURY OBLIGATIONS - 21.7% | | |
| United States Treasury Bonds, 3.00%, 5/15/45 | 2,265,000 | 2,317,908 |
|
| United States Treasury Notes: | | |
| 0.06%, 1/31/16(r) | 500,000 | 499,996 |
|
| 0.084%, 4/30/16(r) | 500,000 | 500,049 |
|
| 0.625%, 8/31/17 | 1,805,000 | 1,804,930 |
|
| 1.00%, 9/15/18 | 570,000 | 571,306 |
|
| 1.375%, 8/31/20 | 4,325,000 | 4,330,069 |
|
| 1.875%, 8/31/22 | 550,000 | 554,655 |
|
| 2.00%, 8/15/25 | 2,285,000 | 2,272,921 |
|
| | | |
| Total U.S. Treasury Obligations (Cost $12,797,886) | | 12,851,834 |
|
| | | |
| | | |
| TIME DEPOSIT - 16.3% | | |
| State Street Bank Time Deposit, 0.088%, 10/1/15 | 9,614,139 | 9,614,139 |
|
| | | |
Total Time Deposit (Cost $9,614,139) | | 9,614,139 |
|
| | | |
| TOTAL INVESTMENTS (Cost $61,190,332) - 103.4% | | 61,184,909 |
|
| Other assets and liabilities, net - (3.4)% | | (2,019,768) |
|
NET ASSETS - 100.0% | |
| $59,165,141 |
|
|
| | | | | | | | | | |
| FUTURES | NUMBER OF
CONTRACTS | EXPIRATION
DATE | UNDERLYING FACE AMOUNT AT VALUE | UNREALIZED
APPRECIATION
(DEPRECIATION) |
| Purchased: | | | | | |
| | Ultra U.S. Treasury Bonds | 12 | 12/15 |
| $1,924,875 |
|
| $12,440 |
|
| Sold: | | | | | | |
| | 2 Year U.S. Treasury Notes | (11) | 12/15 |
| ($2,409,344 | ) |
| $497 |
|
| | 5 Year U.S. Treasury Notes | (1) | 12/15 | (120,516) |
| (150) |
|
| | 10 Year U.S. Treasury Notes | (40) | 12/15 | (5,149,375) |
| (7,568) |
|
| | Total Sold | | | |
| ($7,221 | ) |
|
| |
| NOTES TO SCHEDULE OF INVESTMENTS |
| (e) | Security is exempt from registration under Rule 144A of the Securities Act of 1933. These securities may be resold in transactions exempt from registration, normally to qualified institutional buyers. |
| (r) | The coupon rate shown on floating or adjustable rate securities represents the rate in effect on September 30, 2015. |
| ^ | Security has been purchased on a forward commitment basis with an approximate principal amount and maturity date. The actual principal amount and maturity date will be determined upon settlement. As of September 30, 2015, the total market value of these securities was $3,908,864, which represents 6.6% of the Fund’s net assets.
|
| Abbreviations: |
| LLC: | Limited Liability Corporation |
| LP: | Limited Partnership |
| See notes to financial statements. |
14 calvert.com CALVERT GREEN BOND FUND ANNUAL REPORT
CALVERT GREEN BOND FUND
STATEMENT OF ASSETS AND LIABILITIES
SEPTEMBER 30, 2015
|
| | | |
| ASSETS | |
| Investments in securities, at value (Cost $61,190,332) - see accompanying schedule |
| $61,184,909 |
|
| Cash collateral at broker | 34,375 |
|
| Receivable for securities sold | 5,790,582 |
|
| Receivable for shares sold | 57,567 |
|
| Interest receivable | 285,235 |
|
| Directors’ deferred compensation plan | 33,954 |
|
| Receivable from Calvert Investment Management, Inc. | 9,217 |
|
| Total assets | 67,395,839 |
|
| | |
| LIABILITIES | |
| Payable for securities purchased | 8,097,289 |
|
| Payable for shares redeemed | 51,077 |
|
| Payable for futures contracts variation margin | 1,505 |
|
| Payable to Calvert Investment Distributors, Inc. | 4,591 |
|
| Payable to Calvert Investment Administrative Services, Inc. | 7,169 |
|
| Payable to Calvert Investment Services, Inc. | 307 |
|
| Directors’ deferred compensation plan | 33,954 |
|
| Accrued expenses and other liabilities | 34,806 |
|
| Total liabilities | 8,230,698 |
|
| NET ASSETS |
| $59,165,141 |
|
| | |
| NET ASSETS CONSIST OF: | |
| Paid-in capital applicable to the following shares of common stock, | |
| with 250,000,000 of $0.01 par value shares authorized: | |
| Class A: 1,526,606 shares outstanding |
| $23,169,848 |
|
| Class I: 1,885,965 shares outstanding | 28,374,443 |
|
| Class Y: 495,599 shares outstanding | 7,601,376 |
|
| Undistributed net investment income | 487 |
|
| Accumulated net realized gain (loss) | 19,191 |
|
| Net unrealized appreciation (depreciation) | (204) |
|
| NET ASSETS |
| $59,165,141 |
|
| | |
| NET ASSET VALUE PER SHARE | |
| Class A (based on net assets of $23,107,881) |
| $15.14 |
|
| Class I (based on net assets of $28,539,791) |
| $15.13 |
|
| Class Y (based on net assets of $7,517,469) |
| $15.17 |
|
| See notes to financial statements. |
calvert.com CALVERT GREEN BOND FUND ANNUAL REPORT 15
CALVERT GREEN BOND FUND
STATEMENT OF OPERATIONS
YEAR ENDED SEPTEMBER 30, 2015
|
| | | |
| NET INVESTMENT INCOME | |
| Investment Income: | |
| Interest income (net of foreign taxes withheld of $413) |
| $905,298 |
|
| Total investment income | 905,298 |
|
| | |
| Expenses: | |
| Investment advisory fee | 114,125 |
|
| Administrative fees | 59,471 |
|
| Transfer agency fees and expenses | 29,249 |
|
| Distribution Plan expenses: | |
| Class A | 39,692 |
|
| Directors' fees and expenses | 4,121 |
|
| Accounting fees | 12,330 |
|
| Custodian fees | 39,465 |
|
| Professional fees | 16,321 |
|
| Registration fees | 56,184 |
|
| Reports to shareholders | 5,137 |
|
| Miscellaneous | 7,049 |
|
| Total expenses | 383,144 |
|
| Reimbursement from Advisor: | |
| Class A | (56,680) |
|
| Class I | (42,583) |
|
| Class Y | (26,122) |
|
| Net expenses | 257,759 |
|
| | |
| NET INVESTMENT INCOME | 647,539 |
|
| | |
| REALIZED AND UNREALIZED GAIN (LOSS) | |
| Net realized gain (loss) on: | |
| Investments | 312,317 |
|
| Futures | (217,615) |
|
| | 94,702 |
|
| | |
| Change in unrealized appreciation (depreciation) on: | |
| Investments | (81,873) |
|
| Futures | (14,106) |
|
| | (95,979) |
|
| | |
| NET REALIZED AND UNREALIZED GAIN (LOSS) | (1,277) |
|
| | |
| INCREASE (DECREASE) IN NET ASSETS RESULTING FROM OPERATIONS |
| $646,262 |
|
| See notes to financial statements. |
16 calvert.com CALVERT GREEN BOND FUND ANNUAL REPORT
CALVERT GREEN BOND FUND
STATEMENTS OF CHANGES IN NET ASSETS
|
| | | | | | | |
| INCREASE (DECREASE) IN NET ASSETS | YEAR ENDED
SEPTEMBER 30, 2015 | | FROM INCEPTION OCTOBER 31, 2013 THROUGH
SEPTEMBER 30, 2014 |
| Operations: | | | |
| Net investment income |
| $647,539 |
| |
| $227,603 |
|
| Net realized gain (loss) | 94,702 |
| | 165,982 |
|
| Change in unrealized appreciation (depreciation) | (95,979) |
| | 95,775 |
|
| INCREASE (DECREASE) IN NET ASSETS RESULTING FROM OPERATIONS | 646,262 |
| | 489,360 |
|
| | | | |
| Distributions to shareholders from: | | | |
| Net investment income: | | | |
| Class A shares | (238,749) |
| | (56,347) |
|
| Class I shares | (312,643) |
| | (168,437) |
|
| Class Y shares | (96,395) |
| | (2,191) |
|
| Net realized gain: | | | |
| Class A shares | (112,953) |
| | — |
|
| Class I shares | (115,207) |
| | — |
|
| Class Y shares | (13,226) |
| | — |
|
| Total distributions | (889,173) |
| | (226,975) |
|
| | | | |
| Capital share transactions: | | | |
| Shares sold: | | | |
| Class A shares | 16,387,578 |
| | 10,916,078 |
|
| Class I shares | 15,689,941 |
| | 12,788,496 |
|
| Class Y shares | 7,857,931 |
| | 1,042,657 |
|
| Reinvestment of distributions: | | | |
| Class A shares | 316,593 |
| | 41,106 |
|
| Class I shares | 156,235 |
| | 29,549 |
|
| Class Y shares | 75,016 |
| | 1,979 |
|
| Redemption fees: | | | |
| Class A shares | 2,517 |
| | 418 |
|
| Class Y shares | 151 |
| | — |
|
| Shares redeemed: | | | |
| Class A shares | (4,073,252) |
| | (421,190) |
|
| Class I shares | (289,778) |
| | — |
|
| Class Y shares | (1,376,015) |
| | (343) |
|
| Total capital share transactions | 34,746,917 |
| | 24,398,750 |
|
| | | | |
| TOTAL INCREASE (DECREASE) IN NET ASSETS | 34,504,006 |
| | 24,661,135 |
|
| | | | |
| | | | |
| NET ASSETS | | | |
| Beginning of period | 24,661,135 |
| | — |
|
| End of period (including undistributed net investment income of $487 and $601, respectively) |
| $59,165,141 |
| |
| $24,661,135 |
|
| See notes to financial statements. |
calvert.com CALVERT GREEN BOND FUND ANNUAL REPORT 17
|
| | | | |
| CAPITAL SHARE ACTIVITY | YEAR ENDED
SEPTEMBER 30, 2015 | | FROM INCEPTION OCTOBER 31, 2013 THROUGH
SEPTEMBER 30, 2014 |
| Shares sold: | | | |
| Class A shares | 1,072,847 | | 723,890 |
|
| Class I shares | 1,038,982 | | 853,913 |
|
| Class Y shares | 512,333 | | 68,588 |
|
| Reinvestment of distributions: | | | |
| Class A shares | 20,765 | | 2,706 |
|
| Class I shares | 10,287 | | 1,950 |
|
| Class Y shares | 4,907 | | 130 |
|
| Shares redeemed: | | | |
| Class A shares | (265,793) | | (27,809) |
|
| Class I shares | (19,167) | | — |
|
| Class Y shares | (90,336) | | (23) |
|
| Total capital share activity | 2,284,825 | | 1,623,345 |
|
| See notes to financial statements. |
18 calvert.com CALVERT GREEN BOND FUND ANNUAL REPORT
NOTES TO FINANCIAL STATEMENTS
NOTE A — SIGNIFICANT ACCOUNTING POLICIES
General: Calvert Green Bond Fund (the "Fund"), a series of Calvert Impact Fund, Inc., is registered under the Investment Company Act of 1940 as a non-diversified, open-end management investment company. Calvert Impact Fund, Inc. is comprised of four separate series. The operations of each series are accounted for separately. The Fund applies the accounting and reporting guidance in the Financial Accounting Standards Board (FASB) Accounting Standards Codification Topic 946, Financial Services – Investment Companies (ASC 946).
The Fund, which commenced operations on October 31, 2013, offers three classes of shares - Classes A, I, and Y. Class A shares are sold with a maximum front-end sales charge of 3.75%. Class I shares require a minimum account balance of $1,000,000. The $1 million minimum initial investment is waived for retirement plans that trade through omnibus accounts and may be waived in certain other instances where it is believed to be in the best interest of the Fund and its shareholders. Class I shares have no front-end or deferred sales charge and have lower levels of expenses than Class A shares. Class Y shares are generally only available to wrap or similar fee-based programs offered by financial intermediaries, foundations, and endowments that have entered into an agreement with the Fund’s Distributor to offer Class Y shares. Class Y shares have no front-end or deferred sales charge and have lower levels of expenses than Class A shares. Each class has different: (a) dividend rates due to differences in Distribution Plan expenses and other class specific expenses, (b) exchange privileges and (c) class specific voting rights.
Security Valuation: Net asset value per share is determined every business day as of the close of the regular session of the New York Stock Exchange (generally 4:00 p.m. Eastern time). The Fund uses independent pricing services approved by the Board of Directors (“the Board”) to value its investments wherever possible. Investments for which market quotations are not available or deemed not reliable are fair valued in good faith under the direction of the Board.
The Board has adopted Valuation Procedures (the “Procedures”) to determine the fair value of securities and other financial instruments for which market prices are not readily available or which may not be reliably priced. The Board has delegated the day-to-day responsibility for determining the fair value of assets of the Fund to Calvert Investment Management, Inc. (the “Advisor” or “Calvert”) and has provided these Procedures to govern Calvert in its valuation duties.
Calvert has chartered an internal Valuation Committee to oversee the implementation of these Procedures and to assist it in carrying out the valuation responsibilities that the Board has delegated.
The Valuation Committee meets on a regular basis to review illiquid securities and other investments which may not have readily available market prices. The Valuation Committee’s fair valuation determinations are subject to review, approval and ratification by the Board at its next regularly scheduled meeting covering the calendar quarter in which the fair valuation was determined.
The Valuation Committee utilizes various methods to measure the fair value of the Fund’s investments. U.S. generally accepted accounting principles (GAAP) establishes a disclosure hierarchy that categorizes the inputs to valuation techniques used to value assets and liabilities at measurement date. These inputs are summarized in the three broad levels listed below:
Level 1 - quoted prices in active markets for identical securities
Level 2 - other significant observable inputs (including quoted prices for similar securities, interest rates, prepayment speeds, credit risk, etc.)
Level 3 - significant unobservable inputs (including the Fund’s own assumptions in determining the fair value of investments)
The inputs or methodologies used for valuing securities are not necessarily an indication of the risk associated with investing in those securities.
Changes in valuation techniques may result in transfers in or out of an investment’s assigned level within the hierarchy during the year. Transfers in and/or out of levels are determined based on the fair value of such securities at the end of the year. Valuation techniques used to value the Fund’s investments by major category are as follows:
Debt securities, including restricted securities, are valued based on evaluated prices received from independent pricing services or from dealers who make markets in such securities. For corporate bonds, sovereign government bonds, municipal securities, and U.S. government and government agency obligations, pricing services utilize matrix pricing which considers yield or price of bonds of comparable quality, coupon, maturity and type as well as dealer supplied prices and such securities are generally categorized as Level 2 in the hierarchy. For asset-backed securities, commercial mortgage-backed securities, and U.S. government agency mortgage-backed securities, pricing services utilize matrix pricing which considers prepayment speed assumptions, attributes of the collateral, yield or price of bonds of comparable quality, coupon, maturity and type as well as dealer supplied prices and, accordingly, such securities are generally categorized as Level 2 in the hierarchy. Short-term securities of sufficient credit quality with remaining maturities of sixty days or less for which quotations are not readily available are valued at amortized cost, which approximates fair value, and are categorized as Level 2 in the hierarchy.
calvert.com CALVERT GREEN BOND FUND ANNUAL REPORT 19
Futures contracts are valued at unrealized appreciation (depreciation) based on the settlement price established each day by the board of trade or exchange on which they are traded and are categorized as Level 1 in the hierarchy.
If a market value cannot be determined for a security using the methodologies described above, or if, in the good faith opinion of the Advisor, the market value does not constitute a readily available market quotation, or if a significant event has occurred that would materially affect the value of the security, the security will be fair valued as determined in good faith by the Valuation Committee.
The Valuation Committee considers a number of factors, including significant unobservable valuation inputs when arriving at fair value. It considers all significant facts that are reasonably available and relevant to the determination of fair value.
The Valuation Committee primarily employs a market-based approach which may use related or comparable assets or liabilities, recent transactions, market multiples, book values, and other relevant information for the investment to determine the fair value of the investment. When more appropriate, the Fund may employ an income-based or cost approach. An income-based valuation approach discounts anticipated future cash flows of the investment to calculate a present amount (discounted). The measurement is based on the value indicated by current market expectations about those future amounts. Discounts may also be applied due to the nature or duration of any restrictions on the disposition of the investments. A cost based approach is based on the amount that currently would be required to replace the service capacity of an asset (current replacement cost). From the seller’s perspective, the price that would be received for the asset is determined based on the cost to a buyer to acquire or construct a substitute asset of comparable utility, adjusted for obsolescence.
The values assigned to fair value investments are based on available information and do not necessarily represent amounts that might ultimately be realized. Further, due to the inherent uncertainty of valuations of such investments, the fair values may differ significantly from the values that would have been used had an active market existed, and the differences could be material. The Valuation Committee employs various methods for calibrating these valuation approaches including a regular review of key inputs and assumptions, transactional back-testing or disposition analysis and reviews of any related market activity.
At September 30, 2015, no securities were fair valued in good faith under the direction of the Board.
The following table summarizes the market value of the Fund's holdings as of September 30, 2015, based on the inputs used to value them:
|
| | | | | | | | | | | | | |
| VALUATION INPUTS |
| INVESTMENT IN SECURITIES* | LEVEL 1 | LEVEL 2 | LEVEL 3 | TOTAL |
| Asset-Backed Securities | $— |
|
| $3,931,282 |
| $— |
|
| $3,931,282 |
|
| Commercial Mortgage-Backed Securities | — |
| 1,348,648 |
| — |
| 1,348,648 |
|
| Corporate Bonds | — |
| 24,374,683 |
| — |
| 24,374,683 |
|
| Municipal Obligations | — |
| 3,978,325 |
| — |
| 3,978,325 |
|
| U.S. Government Agencies and Instrumentalities | — |
| 1,023,985 |
| — |
| 1,023,985 |
|
| U.S. Government Agency Mortgage-Backed Securities | — |
| 4,062,013 |
| — |
| 4,062,013 |
|
| U.S. Treasury Obligations | — |
| 12,851,834 |
| — |
| 12,851,834 |
|
| Time Deposit | — |
| 9,614,139 |
| — |
| 9,614,139 |
|
| TOTAL | $— |
|
| $61,184,909 |
| $— |
|
| $61,184,909 |
|
| Other financial instruments** |
| $5,219 |
| $— |
| $— |
|
| $5,219 |
|
| | | | | | |
| * | For a complete listing of investments, please refer to the Schedule of Investments. |
| ** | Other financial instruments are derivative instruments not reflected in the Total Investments in the Schedule of Investments, such as futures, which are valued at the unrealized appreciation/depreciation of the instrument. |
There were no transfers between levels during the year.
Futures Contracts: The Fund may purchase and sell futures contracts, but only when, in the judgment of the Advisor, such a position acts as a hedge. The Fund may not enter into futures contracts for the purpose of speculation or leverage. These futures contracts may include, but are not limited to, futures contracts based on U.S. government obligations. The Fund is subject to interest rate risk in the normal course of pursuing its investment objectives and may use futures contracts to hedge against changes in interest rates. The Fund may enter into futures contracts agreeing to buy or sell a financial instrument for a set price at a future date. Initial margin deposits of either cash or securities as required by the broker are made upon entering into the contract. While the contract is open, daily variation margin payments are made to or received from the broker reflecting the daily change in market value of the contract and are recorded for financial reporting purposes as unrealized gains or losses by the Fund. When a
20 calvert.com CALVERT GREEN BOND FUND ANNUAL REPORT
futures contract is closed, a realized gain or loss is recorded equal to the difference between the opening and closing value of the contract. The risks associated with entering into futures contracts may include the possible illiquidity of the secondary market which would limit the Fund’s ability to close out a futures contract prior to the settlement date, an imperfect correlation between the value of the contracts and the underlying financial instruments, or that the counterparty will fail to perform its obligations under the contracts’ terms. Futures contracts are designed by boards of trade which are designated “contracts markets” by the Commodities Futures Trading Commission. Futures contracts trade on the contracts markets in a manner that is similar to the way a stock trades on a stock exchange, and the boards of trade, through their clearing corporations, guarantee the futures contracts against default. As a result, there is minimal counterparty credit risk to the Fund. During the year, the Fund used U.S. Treasury Bond and Notes futures contracts to hedge against interest rate changes and to manage overall duration of the Fund. The Fund’s futures contracts at year end are presented in the Schedule of Investments.
At September 30, 2015, the Fund had the following derivatives, categorized by risk exposure:
|
| | | | |
| Risk | Statement of Assets and Liabilities | Assets | Statement of Assets and Liabilities | Liabilities |
| Interest | Unrealized gain on futures contracts | $12,937* | Unrealized loss on futures contracts | ($7,718*) |
* Only the current day's variation margin is reported within the Statement of Assets and Liabilities.
The effect of derivative instruments on the Statement of Operations for the year ended September 30, 2015 was as follows:
|
| | | |
| | | Statement of Operations Location |
| Risk |
Derivatives | Net Realized Gain (Loss) | Change in Unrealized Gain (Loss) |
| Interest Rate | Futures | ($217,615) | ($14,106) |
During the year, the Fund invested in 2 year, 5 year and 10 year U.S. Treasury Notes and 20 year and Ultra U.S. Treasury Bond futures. The volume of outstanding contracts has varied throughout the year with an average number of contracts as in the following table:
|
| |
| Derivative Description | Average Number of Contracts* |
| Futures contracts long | 3 |
| Futures contracts short | (46) |
| |
| *Averages are based on activity levels during the year ended September 30, 2015. |
Security Transactions and Investment Income: Security transactions are accounted for on trade date. Realized gains and losses are recorded on an identified cost basis and may include proceeds from litigation. Interest income, which includes amortization of premium and accretion of discount on debt securities, is accrued as earned. Debt obligations may be placed on non-accrual status and related interest income may be reduced by ceasing current accruals and writing off interest receivables when the collection of all or a portion of interest has become doubtful based on consistently applied procedures. A debt obligation may be removed from non-accrual status when the issuer resumes interest payments or when collectability of interest is reasonably assured. Investment income and realized and unrealized gains and losses are allocated to separate classes of shares based upon the relative net assets of each class. Expenses arising in connection with a specific class are charged directly to that class. Expenses common to the classes are allocated to each class in proportion to their relative net assets.
Distributions to Shareholders: Distributions to shareholders are recorded by the Fund on ex-dividend date. Dividends from net investment income are declared and paid monthly. Distributions from net realized capital gains, if any, are paid at least annually. Distributions are determined in accordance with income tax regulations which may differ from U.S. generally accepted accounting principles; accordingly, periodic reclassifications are made within the Fund's capital accounts to reflect income and gains available for distribution under income tax regulations.
Estimates: The preparation of financial statements in conformity with U.S. generally accepted accounting principles requires management to make estimates and assumptions that affect the reported amounts of assets and liabilities and disclosure of contingent assets and liabilities at the date of the financial statements and the reported amounts of increases and decreases in net assets from operations during the reporting period. Actual results could differ from those estimates.
Redemption Fees: The Fund charged a 2% redemption fee on redemptions, including exchanges, made within 30 days of purchase (within seven days for Class I shares). The redemption fee was accounted for as an addition to paid-in capital. This fee was eliminated effective February 2, 2015.
calvert.com CALVERT GREEN BOND FUND ANNUAL REPORT 21
Federal Income Taxes: No provision for federal income or excise tax is required since the Fund intends to continue to qualify as a regulated investment company under the Internal Revenue Code and to distribute substantially all of its taxable earnings.
Management has analyzed the Fund's tax positions taken for all open federal income tax years and has concluded that no provision for federal income tax is required in the Fund's financial statements. A Fund's federal tax return is subject to examination by the Internal Revenue Service for a period of three years.
NOTE B — RELATED PARTY TRANSACTIONS
Calvert Investment Management, Inc. (the “Advisor”) is wholly-owned by Calvert Investments, Inc., which is indirectly wholly-owned by Ameritas Mutual Holding Company. The Advisor provides investment advisory services and pays the salaries and fees of officers and Directors of the Fund who are employees of the Advisor or its affiliates. For its services, the Advisor receives an annual fee, payable monthly, of .30% of the Fund’s average daily net assets.
The Advisor has contractually agreed to limit net annual fund operating expenses through January 31, 2016 for Class A, I and Y. The contractual expense caps are .88%, .50%, and .63%, respectively. For the purpose of this expense limit, operating expenses do not include interest expense, brokerage commissions, taxes and extraordinary expenses. This expense limitation does not limit acquired fund fees and expenses, if any.
Calvert Investment Administrative Services, Inc., an affiliate of the Advisor, provides administrative services to the Fund for an annual fee, payable monthly, of .20% for Classes A and Y, and .10% for Class I shares, based on their average daily net assets.
Calvert Investment Distributors, Inc. (“CID”), an affiliate of the Advisor, is the distributor and principal underwriter for the Fund. Pursuant to Rule 12b-1 under the Investment Company Act of 1940, the Fund has adopted a Distribution Plan that permits the Fund to pay certain expenses associated with the distribution and servicing of its shares. The expenses paid may not exceed .50% annually of the Fund’s average daily net assets of Class A. The amount actually paid by the Fund is an annualized fee, payable monthly, of .25% of the Fund’s average daily net assets of Class A. Class I and Y shares do not have Distribution Plan expenses.
CID received $16,998 as its portion of commissions charged on sales of the Fund’s Class A shares for the year ended September 30, 2015.
Calvert Investment Services, Inc. (“CIS”), an affiliate of the Advisor, acts as shareholder servicing agent for the Fund. For its services, CIS received a fee of $2,995 for the year ended September 30, 2015. Boston Financial Data Services, Inc. is the transfer and dividend disbursing agent.
Each Director of the Fund who is not an employee of the Advisor or its affiliates receives an annual retainer of $52,000 ($48,000 prior to January 1, 2015) plus a meeting fee of up to $3,000 for each Board meeting attended. Additional fees of $6,000 ($5,000 prior to January 1, 2015) annually may be paid to the Committee chairs ($10,000 for the Board Chair and the Special Equities Committee chair) and $2,500 annually may be paid to Committee members, plus a Committee meeting fee of $500 for each Committee meeting attended. Eligible Directors may participate in a Deferred Compensation Plan (the "Plan"). Obligations of the Plan will be paid solely out of the Fund’s assets. Directors’ fees are allocated to each of the funds served.
NOTE C — INVESTMENT ACTIVITY AND TAX INFORMATION
During the year, the cost of purchases and proceeds from sales of investments, other than U.S. government and short-term securities, were $36,874,366 and $20,267,872, respectively. U.S. government security purchases and sales were $145,223,040 and $135,547,581, respectively.
The Fund may purchase securities, typically short-term variable rate demand notes, from or sell to other funds managed by the Advisor. These interportfolio transactions are primarily used for cash management purposes and are made pursuant to Rule 17a-7 of the Investment Company Act of 1940. For the year ended September 30, 2015, such sales transactions were $251,406. The realized loss on these sales transactions was $449.
The tax character of dividends and distributions paid during the years ended September 30, 2015 and September 30, 2014 was as follows:
|
| | | | | | | |
| DISTRIBUTIONS PAID FROM: | 2015 |
| | 2014 |
|
| Ordinary income |
| $889,173 |
| |
| $226,975 |
|
| Total |
| $889,173 |
| |
| $226,975 |
|
22 calvert.com CALVERT GREEN BOND FUND ANNUAL REPORT
As of September 30, 2015, the tax basis components of distributable earnings/(accumulated losses) and the federal tax cost were as follows:
|
| | | |
| Unrealized appreciation |
| $445,671 |
|
| Unrealized (depreciation) | (455,448) |
|
| Net unrealized appreciation (depreciation) |
| ($9,777 | ) |
| | |
| Undistributed ordinary income |
| $59,912 |
|
| Late year ordinary and post October capital loss deferrals |
| ($30,660 | ) |
| | |
| Federal income tax cost of investments |
| $61,194,686 |
|
The differences between the components of distributable earnings on a tax basis and the amounts reflected in the Statement of Assets and Liabilities are primarily due to temporary book-tax differences that will reverse in a subsequent period. These differences are mainly due to wash sales, Section 1256 futures contracts, and loss deferrals on straddle transactions.
Reclassifications, as shown in the table below, have been made to the Fund's components of net assets to reflect income and gains available for distribution (or available capital loss carryovers, as applicable) under income tax law and regulations. These reclassifications are due to permanent book-tax differences and have no impact on net assets. The primary permanent differences causing such reclassifications for the Fund are due to asset-backed securities.
|
| | | |
| Undistributed net investment income |
| $134 |
|
| Accumulated net realized gain (loss) |
| ($134 | ) |
NOTE D — LINE OF CREDIT
A financing agreement is in place with the Calvert Funds and State Street Corporation (“SSC”). Under the agreement, SSC provides an unsecured line of credit facility, in the aggregate amount of $50 million ($25 million committed and $25 million uncommitted), accessible by the Funds for temporary or emergency purposes only. Borrowings bear interest at the higher of the London Interbank Offered Rate (LIBOR) or the overnight Federal Funds Rate plus 1.25% per annum. A commitment fee of .20% per annum is incurred on the unused portion of the committed facility. An administrative fee of $25,000 was paid in connection with the uncommitted facility. These fees are allocated to all participating funds. The Fund had no borrowings under the agreement during the year ended September 30, 2015.
NOTE E — SUBSEQUENT EVENTS
At a special meeting of the Fund’s Board of Directors (the “Board”) held on November 24, 2015, the Board approved the recommendation made by Calvert Investment Administrative Services, Inc. (“CIAS”) to standardize and rationalize the administrative fee payable by the Calvert Funds at 12 basis points for all series and all share classes of the Calvert Funds. The change is being implemented in two phases. First, CIAS will voluntarily waive the amount of the existing administrative fee above 12 basis points for the period from December 1, 2015 through January 31, 2016. Second, CIAS and the Fund have entered into an Amended and Restated Administrative Services Agreement that will establish a 12 basis point administrative fee for all classes of the Fund commencing on February 1, 2016. In the case of any series or share class that currently pays an administrative fee to CIAS that is less than 12 basis points, CIAS has contractually agreed to waive the difference between that lower administrative fee and the 12 basis point fee until January 31, 2018.
In preparing the financial statements as of September 30, 2015, no other subsequent events or transactions occurred that would have required recognition or disclosure in these financial statements.
calvert.com CALVERT GREEN BOND FUND ANNUAL REPORT 23
CALVERT GREEN BOND FUND
FINANCIAL HIGHLIGHTS
|
| | | | | | | | | |
| | PERIODS ENDED | |
| CLASS A SHARES | September 30, 2015 (z) | | September 30, 2014 (z)# | |
| Net asset value, beginning |
| $15.20 |
| |
| $15.00 |
| |
| Income from investment operations: | | | | |
| Net investment income | .23 |
| | .17 |
| |
| Net realized and unrealized gain (loss) | .06 |
| | .17 |
| |
| Total from investment operations | .29 |
| | .34 |
| |
| Distributions from: | | | | |
| Net investment income | (.22 | ) | | (.14 | ) | |
| Net realized gain | (.13 | ) | | — |
| |
| Total distributions | (.35 | ) | | (.14 | ) | |
| Total increase (decrease) in net asset value | (.06 | ) | | .20 |
| |
| Net asset value, ending |
| $15.14 |
| |
| $15.20 |
| |
Total return* | 1.95 | % | | 2.29 | % | |
| Ratios to average net assets: A | | | | |
| Net investment income | 1.49 | % | | 1.21%(a) |
| |
| Total expenses | 1.24 | % | | 1.99%(a) |
| |
| Expenses before offsets | .88 | % | | .88%(a) |
| |
| Net expenses | .88 | % | | .88%(a) |
| |
| Portfolio turnover | 444 | % | | 545 | % | |
| Net assets, ending (in thousands) |
| $23,108 |
| |
| $10,622 |
| |
| | |
| (z) | Per share figures are calculated using the Average Shares Method. |
| # | From October 31, 2013 inception. |
| * | Total return is not annualized for periods of less than one year and does not reflect deduction of any front-end or deferred sales charge. |
| A | Total expenses do not reflect amounts reimbursed and/or waived by the Advisor or reductions from expense offset arrangements. Expenses before offsets reflect expenses after reimbursement and/or waiver by the Advisor but prior to reductions from expense offset arrangements. Net expenses are net of all reductions and represent the net expenses paid by the Fund. |
| (a) | Annualized. |
| | | | | | |
See notes to financial statements.
|
24 calvert.com CALVERT GREEN BOND FUND ANNUAL REPORT
CALVERT GREEN BOND FUND
FINANCIAL HIGHLIGHTS
|
| | | | | | | | | |
| | PERIODS ENDED | |
| CLASS I SHARES | September 30, 2015 (z) | | September 30, 2014 (z)# | |
| Net asset value, beginning |
| $15.18 |
| |
| $15.00 |
| |
| Income from investment operations: | | | | |
| Net investment income | .29 |
| | .21 |
| |
| Net realized and unrealized gain (loss) | .06 |
| | .18 |
| |
| Total from investment operations | .35 |
| | .39 |
| |
| Distributions from: | | | | |
| Net investment income | (.27 | ) | | (.21 | ) | |
| Net realized gain | (.13 | ) | | — |
| |
| Total distributions | (.40 | ) | | (.21 | ) | |
| Total increase (decrease) in net asset value | (.05 | ) | | .18 |
| |
| Net asset value, ending |
| $15.13 |
| |
| $15.18 |
| |
Total return* | 2.36 | % | | 2.58 | % | |
| Ratios to average net assets: A | | | | |
| Net investment income | 1.89 | % | | 1.51%(a) |
| |
| Total expenses | .76% |
| | 1.17%(a) |
| |
| Expenses before offsets | .50% |
| | .50%(a) |
| |
| Net expenses | .50% |
| | .50%(a) |
| |
| Portfolio turnover | 444 | % | | 545 | % | |
| Net assets, ending (in thousands) |
| $28,540 |
| |
| $12,994 |
| |
| | |
| (z) | Per share figures are calculated using the Average Shares Method. |
| # | From October 31, 2013 inception. |
| * | Total return is not annualized for periods of less than one year and does not reflect deduction of any front-end or deferred sales charge. |
| A | Total expenses do not reflect amounts reimbursed and/or waived by the Advisor or reductions from expense offset arrangements. Expenses before offsets reflect expenses after reimbursement and/or waiver by the Advisor but prior to reductions from expense offset arrangements. Net expenses are net of all reductions and represent the net expenses paid by the Fund. |
| (a) | Annualized. |
| | | | | | |
See notes to financial statements.
|
calvert.com CALVERT GREEN BOND FUND ANNUAL REPORT 25
CALVERT GREEN BOND FUND
FINANCIAL HIGHLIGHTS
|
| | | | | | | | | |
| | PERIODS ENDED | |
| CLASS Y SHARES | September 30, 2015 (z) | | September 30, 2014 (z)# | |
| Net asset value, beginning |
| $15.22 |
| |
| $15.00 |
| |
| Income from investment operations: | | | | |
| Net investment income | .27 |
| | .17 |
| |
| Net realized and unrealized gain (loss) | .06 |
| | .21 |
| |
| Total from investment operations | .33 |
| | .38 |
| |
| Distributions from: | | | | |
| Net investment income | (.25 | ) | | (.16 | ) | |
| Net realized gain | (.13 | ) | | — |
| |
| Total distributions | (.38 | ) | | (.16 | ) | |
| Total increase (decrease) in net asset value | (.05 | ) | | .22 |
| |
| Net asset value, ending |
| $15.17 |
| |
| $15.22 |
| |
Total return* | 2.21 | % | | 2.56 | % | |
| Ratios to average net assets: A | | | | |
| Net investment income | 1.74 | % | | 1.56%(a) |
| |
| Total expenses | 1.10 | % | | 14.21%(a) |
| |
| Expenses before offsets | .63 | % | | .63%(a) |
| |
| Net expenses | .63 | % | | .63%(a) |
| |
| Portfolio turnover | 444 | % | | 545 | % | |
| Net assets, ending (in thousands) |
| $7,517 |
| |
| $1,046 |
| |
| | |
| (z) | Per share figures are calculated using the Average Shares Method. |
| # | From October 31, 2013 inception. |
| * | Total return is not annualized for periods of less than one year and does not reflect deduction of any front-end or deferred sales charge. |
| A | Total expenses do not reflect amounts reimbursed and/or waived by the Advisor or reductions from expense offset arrangements. Expenses before offsets reflect expenses after reimbursement and/or waiver by the Advisor but prior to reductions from expense offset arrangements. Net expenses are net of all reductions and represent the net expenses paid by the Fund. |
| (a) | Annualized. |
| | | | | | |
| See notes to financial statements. |
26 calvert.com CALVERT GREEN BOND FUND ANNUAL REPORT
EXPLANATION OF FINANCIAL TABLES
SCHEDULE OF INVESTMENTS
The Schedule of Investments is a snapshot of all securities held in the fund at their market value, on the last day of the reporting period. Securities are listed by asset type (e.g., common stock, corporate bonds, U.S. government obligations) and may be further broken down into sub-groups and by industry classification.
STATEMENT OF ASSETS AND LIABILITIES
The Statement of Assets and Liabilities is often referred to as the fund’s balance sheet. It lists the value of what the fund owns, is due and owes on the last day of the reporting period. The fund’s assets include the market value of securities owned, cash, receivables for securities sold and shareholder subscriptions, and receivables for dividends and interest payments that have been earned, but not yet received. The fund’s liabilities include payables for securities purchased and shareholder redemptions, and expenses owed but not yet paid. The statement also reports the fund’s net asset value (NAV) per share on the last day of the reporting period. The NAV is calculated by dividing the fund’s net assets (assets minus liabilities) by the number of shares outstanding. This statement is accompanied by a Schedule of Investments. Alternatively, if certain conditions are met, a Statement of Net Assets may be presented in lieu of this statement and the Schedule of Investments.
STATEMENT OF NET ASSETS
The Statement of Net Assets provides a detailed list of the fund’s holdings, including each security’s market value on the last day of the reporting period. The Statement of Net Assets includes a Schedule of Investments. Other assets are added and other liabilities subtracted from the investments total to calculate the fund’s net assets. Finally, net assets are divided by the outstanding shares of the fund to arrive at its share price, or Net Asset Value (NAV) per share.
At the end of the Statement of Net Assets is a table displaying the composition of the fund’s net assets. Paid in Capital is the money invested by shareholders and represents the bulk of net assets. Undistributed Net Investment Income and Accumulated Net Realized Gains usually approximate the amounts the fund had available to distribute to shareholders as of the statement date. Accumulated Realized Losses will appear as negative balances. Unrealized Appreciation (Depreciation) is the difference between the market value of the fund’s investments and their cost, and reflects the gains (losses) that would be realized if the fund were to sell all of its investments at their statement-date -values.
STATEMENT OF OPERATIONS
The Statement of Operations summarizes the fund’s investment income earned and expenses incurred in operating the fund. Investment income includes dividends earned from stocks and interest earned from interest-bearing securities in the fund. Expenses incurred in operating the fund include the advisory fee paid to the investment advisor, administrative services fees, distribution plan expenses (if applicable), transfer agent fees, shareholder servicing expenses, custodial, legal, and audit fees, and the printing and postage expenses related to shareholder reports. Expense offsets (fees paid indirectly) may also be shown. Credits earned from offset arrangements may be used to reduce the fund’s expenses. This statement also shows net gains (losses) realized on the sale of investments and the increase or decrease in the unrealized appreciation (depreciation) on investments held during the period.
STATEMENT OF CHANGES IN NET ASSETS
The Statement of Changes in Net Assets shows how the fund’s total net assets changed during the two most recent reporting periods. Changes in the fund’s net assets are attributable to investment operations, distributions and capital share transactions.
The Operations section of the report summarizes information detailed in the Statement of Operations. The Distribution section shows the dividend and capital gain distributions made to shareholders. The amounts shown as distributions in this section may not match the net investment income and realized gains amounts shown in the Operations section because distributions are determined on a tax basis and certain investments or transactions may be treated differently for financial statement and tax purposes. The Capital Share Transactions section shows the amount shareholders invested in the fund, either by purchasing shares or by reinvesting distributions, and the amounts redeemed. The corresponding numbers of shares issued, reinvested and redeemed are shown at the end of the report.
FINANCIAL HIGHLIGHTS
The Financial Highlights table provides a per-share breakdown per class of the components that affect the fund’s net asset value for current and past reporting periods. The table provides total return, total distributions, expense ratios, portfolio turnover and net assets for the applicable period. Total return is a measure of a fund’s performance that encompasses all elements of return: dividends, capital gain distributions and changes in net asset value. Total return is the change in value of an investment over a given period, assuming reinvestment of any dividends and capital gain distributions, expressed as a percentage of the initial investment. Total distributions include distributions from net investment income and net realized gains. Long-term gains are earned on securities held in the fund more than one year. Short-term gains, on the sale of securities held less than one year, are treated as ordinary dividend income for tax purposes. The expense ratio is a fund’s cost of doing business, expressed as a
calvert.com CALVERT GREEN BOND FUND ANNUAL REPORT (UNAUDITED) 27
percentage of net assets. These expenses directly reduce returns to shareholders. Portfolio turnover measures the trading activity in a fund’s investment portfolio—how often securities are bought and sold by a fund. Portfolio turnover is affected by market conditions, changes in the size of the fund, the nature of the fund’s investments and the investment style of the portfolio manager.
PROXY VOTING
The Proxy Voting Guidelines of the Calvert Funds that the Fund uses to determine how to vote proxies relating to portfolio securities are provided as an Appendix to the Fund’s Statement of Additional Information. The Statement of Additional Information can be obtained free of charge by calling the Fund at 1-800-368-2745, by visiting the Calvert website at www.calvert.com; or by visiting the SEC’s website at www.sec.gov.
Information regarding how the Fund voted proxies relating to portfolio securities during the most recent 12-month period ended June 30 is available on the Fund’s website at www.calvert.com and on the SEC’s website at www.sec.gov.
AVAILABILITY OF QUARTERLY PORTFOLIO HOLDINGS
The Fund files its complete schedule of portfolio holdings with the SEC for the first and third quarters of each fiscal year on Form N-Q. The Fund’s Form N-Q is available on the SEC’s website at www.sec.gov. The Fund’s Form N-Q may be reviewed and copied at the SEC’s Public Reference Room in Washington, DC; information on the operation of the Public Reference Room may be obtained by calling 1-800-SEC-0330.
28 calvert.com CALVERT GREEN BOND FUND ANNUAL REPORT (UNAUDITED)
DIRECTOR AND OFFICER INFORMATION TABLE
|
| | | | | |
| Name & Age | Position With Fund | Position Start Date | Principal Occupation During Last 5 Years | # of Calvert Portfolios Overseen | Other Directorships During the Past Five Years |
| INDEPENDENT TRUSTEES/DIRECTORS |
REBECCA L. ADAMSON AGE: 66 | Trustee Director Director Director | 1989 CSIF 2000 IMPACT 2000 CRIS 2005 CWVF | President of the national non-profit, First People’s Worldwide, formerly First Nations Financial Project. Founded by her in 1980, First People’s Worldwide is the only American Indian alternative development institute in the country. | 18 | • Bay & Paul Foundation |
RICHARD L. BAIRD, JR. AGE: 67 | Trustee & Chair Director & Chair Director & Chair Director & Chair
| 1982 CSIF
2000 CRIS
2005 CWVF
2005 IMPACT | Former President and CEO of Adagio Health Inc. (retired in 2014) in Pittsburgh, PA, a non-profit corporation which provides family planning services, nutrition, maternal/child health care, and various health screening services and community preventive health programs. | 25 | |
JOHN G. GUFFEY, JR. AGE: 67 | Director Trustee Director Director | 1992 CWVF 1982 CSIF 2000 CRIS 2005 IMPACT | President of Aurora Press Inc., a privately held publisher of trade paperbacks. | 25 | • Ariel Funds (3) (asset management) (through 12/31/11) • Calvert Social Investment Foundation • Calvert Ventures, LLC |
MILES D. HARPER, III AGE: 52 | Director Trustee Director Director | 2000 IMPACT 2005 CSIF 2005 CRIS 2005 CWVF | Partner, Carr Riggs & Ingram (public accounting firm) since September 2013. Partner, Gainer Donnelly & Desroches (public accounting firm) (now Carr Riggs & Ingram), 1999-2013. | 18 | • Bridgeway Funds (14) (asset management) |
JOY V. JONES AGE: 65 | Director Trustee Director Director | 2000 IMPACT 1990 CSIF 2000 CRIS 2005 CWVF | Attorney. | 18 | • Director, Conduit Street Restaurants SUD 2 Limited • Director, Palm Management Corporation |
TERRENCE J. MOLLNER, Ed.D. AGE: 70 | Director Trustee Director Director | 1992 CWVF 1982 CSIF 2000 CRIS 2005 IMPACT | Founder, Chairperson and President of Trusteeship Institute, Inc., an educational organization focused on the personal skills and organizations described in Dr. Mollner’s book, The Love Skill: We Are Mastering the 7 Layers of Human Maturity, particularly businesses that freely chose to give priority to the common good. Chairperson, Stakeholders Capital, Inc., an asset management firm and financial services provider.
| 18 | • Calvert Social Investment Foundation • Ben & Jerry’s Homemade, Inc. (food products) |
SYDNEY A. MORRIS AGE: 66 | Trustee Director Director Director | 1982 CSIF 2000 CRIS 2005 CWVF 2005 IMPACT | The Rev. Dr. Morris is a Unitarian Universalist minister. | 18 | |
calvert.com CALVERT GREEN BOND FUND ANNUAL REPORT (UNAUDITED) 29
|
| | | | | |
| Name & Age | Position With Fund | Position Start Date | Principal Occupation During Last 5 Years | # of Calvert Portfolios Overseen | Other Directorships During the Past Five Years |
| INTERESTED TRUSTEES/DIRECTORS |
D. WAYNE SILBY, Esq.* AGE: 67 | Director Trustee Director Director | 1992 CWVF 1982 CSIF 2000 CRIS 2000 IMPACT | Mr. Silby is the founding Chair of the Calvert Funds. He is the Chair-Elect and a principal of Syntao.com, a Beijing-based company promoting corporate social responsibility. | 25 | • Ameritas Mutual Holding Company (insurance) • Calvert Social Investment Foundation • ImpactAssets, Inc. (asset management) • Committee for the Future (charitable supporting organization) • Syntao.com China (HK) (sustainability consulting) • The ICE Organization (environmental services) |
JOHN H. STREUR* AGE: 55 | Director & President Trustee & President Director & President Director & President | 2015 CWVF
2015 CSIF
2015 CRIS
2015 IMPACT | President and Chief Executive Officer of Calvert Investments, Inc. (since January 2015) and Chief Compliance Officer for the Advisor and Calvert Investment Distributors, Inc. (since August 10, 2015) President and Director, Portfolio 21 Investments, Inc. (through October 2014) President, Chief Executive Officer and Director, Managers Investment Group LLC (through January 2012) President and Director, The Managers Funds and Managers AMG Funds (through January 2012). | 38 | • Portfolio 21 Investments, Inc. (asset management)(through October 2014) • Managers Investment Group LLC (asset management)(through January 2012) • The Managers Funds (asset management) (through January 2012) • Managers AMG Funds (asset management) (through January 2012) • Calvert Social Investment Foundation |
30 calvert.com CALVERT GREEN BOND FUND ANNUAL REPORT (UNAUDITED)
|
| | | |
| Name & Age | Position With Fund | Position Start Date | Principal Occupation During Last 5 Years |
| OFFICERS |
SUSAN WALKER BENDER, Esq. AGE: 56 | Assistant Vice President & Assistant Secretary | 1988 CSIF 2000 CRIS 1992 CWVF 2000 Impact | Assistant Vice President, Assistant Secretary and Associate General Counsel of Calvert Investments, Inc. |
VICKI L. BENJAMIN AGE: 54 | Treasurer | 2015 | Executive Vice President and Chief Financial Officer of Calvert Investments, Inc. since March 2015. Prior to Calvert, Ms. Benjamin was a Senior Partner at KPMG. |
ROBERT D. BENSON, ESQ. AGE: 36 | Assistant Vice President & Assistant Secretary | 2014 | Assistant General Counsel (since 2014), Assistant Vice President & Assistant Secretary (since 2015) and Staff Attorney (prior to 2014), Calvert Investments, Inc. |
HOPE BROWN AGE: 42 | Chief Compliance Officer | 2014 | Chief Compliance Officer for the Calvert Funds (since 2014). Vice President and Chief Compliance Officer, Wilmington Funds (2012-2014). Vice President and Senior Compliance Officer, Wilmington Trust Investment Advisors, Inc. (2010-2012). Assistant Vice President, Lead Manager, Risk Management and Divisional Compliance, T. Rowe Price Associates, Inc. (2005-2010). |
THOMAS DAILEY AGE: 51 | Vice President | 2004 | Vice President of the Advisor and lead portfolio manager for Calvert’s municipal funds. |
MATTHEW DUCH Age: 40 | Vice President | 2011 | Vice President of the Advisor (since 2011) and portfolio manager for Calvert’s taxable fixed-income funds. |
IVY WAFFORD DUKE, Esq. AGE: 47 | Vice President & Secretary | 1996 CSIF 2000 CRIS 1996 CWVF 2000 Impact | Vice President, Acting Secretary and Acting General Counsel (Deputy General Counsel prior to 2015) of Calvert Investments, Inc. Prior to August 10, 2015, Ms. Duke was also Chief Compliance Officer for the Advisor and Calvert Investment Distributors, Inc. |
ROBERT J. ENDERSON, CFA AGE: 57 | Assistant Treasurer | 2014 | Acting Chief Financial Officer (September 2014-March 2015) and Vice President, Corporate Finance, of Calvert Investments, Inc. |
PATRICK FAUL AGE: 50 | Vice President | 2010 | Vice President and Head of Credit Research for the Advisor. |
TRACI L. GOLDT AGE: 42 | Assistant Secretary | 2004 | SEC Filing and Administrative Operations Manager (since 2011) and Executive Assistant to General Counsel (prior to 2011), Calvert Investments, Inc. |
VISHAL KHANDUJA, CFA AGE: 37 | Vice President | 2014 | Vice President of Calvert Investment Management, Inc. (since 2014) and portfolio manager for Calvert’s taxable fixed-income funds since 2012. Previously worked at Columbia Management as Portfolio Manager - Global Rates and Currency Team (2009-2012). |
LANCELOT A. KING, Esq. AGE: 45 | Assistant Vice President & Assistant Secretary | 2002 | Assistant Vice President, Assistant Secretary and Associate General Counsel of Calvert Investments, Inc. |
ANDREW K. NIEBLER, Esq. AGE: 48 | Assistant Vice President & Assistant Secretary | 2006 | Assistant Vice President, Assistant Secretary and Associate General Counsel of Calvert Investments, Inc. |
MARYBETH PILAT, CPA AGE: 47 | Fund Controller and Assistant Treasurer | 2015 | Director of Fund Administration, Calvert Investment Administrative Services, Inc. since August 2015. VP Expense & Budgeting, Global Fiduciary Platform, Legg Mason (May 2015 - July 2015). Vice President and Assistant Treasurer, Columbia Funds, Ameriprise, Columbia Management (2010 - April 2015). |
CATHERINE P. ROY AGE: 59 | Vice President | 2004 | Senior Vice President of the Advisor and Chief Investment Officer – Fixed Income. |
NATALIE A. TRUNOW AGE: 47 | Vice President | 2008 | Senior Vice President of the Advisor and Chief Investment Officer – Equities. |
* Mr. Streur is an interested person of the Funds since he is an Officer and Director of each Fund’s Advisor and certain affiliates. Mr. Silby is an interested person of the Funds since he is a Director of the parent company of each Fund’s Advisor. The address of Trustees/Directors and Officers is 4550 Montgomery Avenue, Suite 1000N, Bethesda, Maryland 20814, except Mr. Silby’s address is 1715 18th Street, N.W., Washington, DC 20009. Additional information about the Fund’s Trustees/Directors can be found in the Statement of Additional Information (SAI). You can get a free copy of the SAI at www.calvert.com, or by contacting your broker, or the Fund at 1-800-368-2745. |
calvert.com CALVERT GREEN BOND FUND ANNUAL REPORT (UNAUDITED) 31
|
|
| This page intentionally left blank. |
To Open an Account
800-368-2748
Service for Existing Account
Shareholders: 800-368-2745
Brokers: 800-368-2746
Registered Mail
Calvert Investments
c/o BFDS,
P.O. Box 219544
Kansas City, MO 64121-9544
Overnight Mail
Calvert Investments
c/o BFDS,
330 West 9th Street
Kansas City, MO 64105
Web Site
calvert.com
Principal Underwriter
Calvert Investment Distributors, Inc.
4550 Montgomery Avenue
Suite 1000 North
Bethesda, Maryland 20814
|
| | | |
CALVERT GREEN BOND FUND | CALVERT’S FAMILY OF FUNDS | | |
| | Municipal Funds Tax-Free Responsible Impact Bond Fund Taxable Bond Funds Bond Portfolio Income Fund Short Duration Income Fund Long-Term Income Fund Ultra-Short Income Fund High Yield Bond Fund Green Bond Fund Unconstrained Bond Fund Balanced and Asset Allocation Funds Balanced Portfolio Conservative Allocation Fund Moderate Allocation Fund Aggressive Allocation Fund | | Equity Funds Large Cap Core Portfolio Equity Portfolio Global Value Fund U.S. Large Cap Core Responsible Index Fund U.S. Large Cap Value Responsible Index Fund U.S. Large Cap Growth Responsible Index Fund U.S. Mid Cap Core Responsible Index Fund Developed Markets EX-U.S. Responsible Index Fund Capital Accumulation Fund International Equity Fund Small Cap Fund Global Energy Solutions Fund Global Water Fund International Opportunities Fund Global Equity Income Fund Emerging Markets Equity Fund |
This report is intended to provide fund information to shareholders. It is not authorized for distribution to prospective investors unless preceded or accompanied by a prospectus. Note: The information on our website is not incorporated by reference into this report; our website address is included as an inactive textual reference only. Investors should carefully consider the investment objectives, risks, charges and expenses of the Calvert Funds. This and other important information is contained in the fund’s summary prospectus and prospectus, which can be obtained from your financial professional and should be read carefully before investing. You may also call Calvert at 800/368-2748 or visit calvert.com. Printed on recycled paper using soy inks. |
| | | | |
Item 2. Code of Ethics.
(a) The registrant has adopted a code of ethics (the "Code of Ethics") that applies to its principal executive officer and principal financial officer (also referred to as “principal accounting officer”).
(b) No information need be disclosed under this paragraph.
(c) The registrant has not amended its Code of Ethics during the period covered by the shareholder report presented in Item 1 hereto.
(d) The registrant has not granted a waiver or implicit waiver from a provision of its Code of Ethics during the period covered by the shareholder report presented in Item 1 hereto.
(e) Not applicable.
(f) The registrant's Code of Ethics is attached as an Exhibit hereto.
Item 3. Audit Committee Financial Expert.
The registrant's Board of Directors has determined that Miles D. Harper, III, an "independent" Director serving on the registrant's audit committee, is an "audit committee financial expert," as defined in Item 3 of Form N-CSR. Under applicable securities laws, a person who is determined to be an audit committee financial expert will not be deemed an "expert" for any purpose, including without limitation for the purposes of Section 11 of the Securities Act of 1933, as a result of being designated or identified as an audit committee financial expert. The designation or identification of a person as an audit committee financial expert does not impose on such person any duties, obligations, or liabilities that are greater than the duties, obligations, and liabilities imposed on such person as a member of the audit committee and Board of Directors in the absence of such designation or identification.
Item 4. Principal Accountant Fees and Services.
Services fees paid to auditing firm:
|
| | | | |
| | Fiscal Year ended 9/30/15 | Fiscal Year ended 9/30/14 |
| | $ | % * | $ | %* |
| | | | | |
| (a) Audit Fees | $80,960 | 0% | $73,157 | 0% |
| (b) Audit-Related Fees | $0 | 0% | $0 | 0% |
| (c) Tax Fees (tax return preparation and filing for the registrant) | $13,400 | 0% | $13,120 | 0% |
| (d) All Other Fees | $0 | 0% | $0 | 0% |
| | | | | |
| Total | $94,360 | 0% | $86,277 | 0% |
* Percentage of fees approved by the Audit Committee pursuant to (c)(7)(i)(C) of Rule 2-01 of Reg. S-X (statutory de minimis waiver of Committee’s requirement to pre-approve)
(e) Audit Committee pre-approval policies and procedures:
The Audit Committee is required to pre-approve all audit and non-audit services provided to the registrant by the auditors, and to the registrant’s investment advisor, and any entity controlling, controlled by, or under common control with the advisor that provides ongoing services to the registrant. In determining whether to pre-approve non-audit services, the Audit Committee considers whether the services are consistent with maintaining the independence of the auditors. The Committee may delegate its authority to pre-approve certain matters to one or more of its members. In this regard, the Committee has delegated authority jointly to the Audit Committee Chair together with another Committee member with respect to non-audit services not exceeding $25,000 in each instance. In addition, the Committee has pre-approved the retention of the auditors to provide tax-related services related to the tax treatment and tax accounting of newly acquired securities, upon request by the investment advisor in each instance.
(f) Not applicable.
(g) Aggregate non-audit fees billed by the registrant’s accountant for services rendered to the registrant, and rendered to the registrant’s investment advisor, and any entity controlling, controlled by, or under common control with the advisor that provides ongoing services to the registrant for each of the last two fiscal years of the registrant:
|
| | | | |
| | Fiscal Year ended 9/30/15 | Fiscal Year ended 9/30/14 |
| | $ | %* | $ | %* |
| | $340,000 | 0%* | $28,146 | 0%* |
* Percentage of fees approved by the Audit Committee pursuant to (c)(7)(i)(C) of Rule 2-01 of Reg. S-X (statutory de minimis waiver of Committee’s requirement to pre-approve)
(h) The registrant’s Audit Committee of the Board of Directors has considered whether the provision of non-audit services that were rendered to the registrant’s investment advisor, and any entity controlling, controlled by, or under common control with the investment advisor that provides ongoing services to the registrant that were not pre-approved pursuant to paragraph (c) (7)(ii) of Rule 2-01 of Reg. S-X is compatible with maintaining the principal accountant’s independence and found that the provision of such services is compatible with maintaining the principal accountant’s independence.
Item 5. Audit Committee of Listed Registrants.
Not applicable.
Item 6. Schedule of Investments.
| |
| (a) | This Schedule is included as part of the report to shareholders filed under Item 1 of this Form. |
Item 7. Disclosure of Proxy Voting Policies and Procedures for Closed-End Management Investment Companies.
Not applicable.
Item 8. Portfolio Managers of Closed-End Management Investment Companies
Not applicable.
Item 9. Purchases of Equity Securities by Closed-End Management Investment Company and Affiliated Purchasers.
Not applicable.
Item 10. Submission of Matters to a Vote of Security Holders.
No material changes were made to the procedures by which shareholders may recommend nominees to the registrant’s Board of Directors since registrant last provided disclosure in response to this Item.
Item 11. Controls and Procedures.
(a) The principal executive and financial officers concluded that the registrant's disclosure controls and procedures (as defined in Rule 30a-3(c) under the 1940 Act) were effective, based on the evaluation of these controls and procedures required by Rule 30a-3(b) under the 1940 Act and Rules 13a-15(b) or 15d-15(b) under the Exchange Act, as of a date within 90 days of the filing date of this report.
(b) There was no change in the registrant's internal control over financial reporting (as defined in Rule 30a-3(d) under the 1940 Act) that occurred during the registrant's second fiscal quarter of the period covered by this report that has materially affected, or is reasonably likely to materially affect, the registrant's internal control over financial reporting.
Item 12. Exhibits.
(a)(1) A copy of the Registrant’s Code of Ethics.
Attached hereto.
(a)(2) A separate certification for each principal executive officer and principal financial officer of the registrant as required by Rule 30a-2 under the Act (17 CFR 270.30a-2).
Attached hereto.
(a)(3) Not applicable.
(b) A certification for the registrant's Principal Executive Officer and Principal Financial Officer, as required by Rule 30a-2(b) under the Investment Company Act of 1940, is attached hereto. The certification furnished pursuant to this paragraph is not deemed to be "filed" for purposes of Section 18 of the Securities Exchange Act of 1934, or otherwise subject to the liability of that section. Such certification is not deemed to be incorporated by reference into any filing under the Securities Act of 1933 or the Securities Exchange Act of 1934, except to the extent that the registrant specifically incorporates it by reference.
Pursuant to the requirements of the Securities Exchange Act of 1934 and the Investment Act of 1940, the registrant has duly caused this report to be signed on its behalf by the undersigned, thereunto duly authorized.
CALVERT IMPACT FUND, INC.
By: /s/ John H. Streur
John H. Streur
President -- Principal Executive Officer
Date: December 3, 2015
Pursuant to the requirements of the Securities Exchange Act of 1934 and the Investment Act of 1940, this report has been signed below by the following persons on behalf of the registrant and in the capacities and on the dates indicated.
/s/ John H. Streur
John H. Streur
President -- Principal Executive Officer
Date: December 3, 2015
/s/ Vicki L. Benjamin
Vicki L. Benjamin
Treasurer -- Principal Financial Officer
Date: December 3, 2015