UNITED STATES SECURITIES AND EXCHANGE COMMISSION
Form N-CSR
CERTIFIED SHAREHOLDER REPORT OF REGISTERED
MANAGEMENT INVESTMENT COMPANIES
Investment Company Act File Number: 811-10045
CALVERT IMPACT FUND, INC.
(Exact Name of Registrant as Specified in Charter)
1825 Connecticut Avenue NW, Suite 400, Washington, DC 20009
(Address of Principal Executive Offices)
Maureen A. Gemma
Two International Place, Boston, Massachusetts 02110
(Name and Address of Agent for Services)
(202) 238-2200
(Registrant’s Telephone Number)
September 30
Date of Fiscal Year End
September 30, 2018
Date of Reporting Period
____________________________________________________________________________________
Item 1. Reports to Stockholders
Calvert Small-Cap Fund
Calvert Global Energy Solutions Fund
Calvert Global Water Fund
Calvert Green Bond Fund
|
| |
Annual Report September 30, 2018 E-Delivery Sign-Up — Details Inside | |
|
|
Commodity Futures Trading Commission Registration. Effective December 31, 2012, the Commodity Futures Trading Commission (“CFTC”) adopted certain regulatory changes that subject registered investment companies and advisers to regulation by the CFTC if a fund invests more than a prescribed level of its assets in certain CFTC-regulated instruments (including futures, certain options and swap agreements) or markets itself as providing investment exposure to such instruments. The Fund and its adviser have claimed an exclusion from the definition of the term “commodity pool operator” under the Commodity Exchange Act. Accordingly, neither the Fund nor the adviser is subject to CFTC regulation. |
Choose Planet-friendly E-delivery! Sign up now for on-line statements, prospectuses, and fund reports. In less than five minutes you can help reduce paper mail and lower fund costs. Just go to www.calvert.com. If you already have an online account with the Calvert funds, click on Login to access your Account and select the documents you would like to receive via e-mail. If you’re new to online account access, click on Login, then Register to create your user name and password. Once you’re in, click on the E-delivery sign-up on the Account Portfolio page and follow the quick, easy steps. Note: If your shares are not held directly with the Calvert funds but through a brokerage firm, you must contact your broker for electronic delivery options available through their firm. |
|
| | | | |
| | TABLE OF CONTENTS |
| | | | | |
| | | | | Management’s Discussion of Fund Performance |
| | | | | Performance |
| | | | | Fund Profile |
| | | | | Endnotes and Additional Disclosures |
| | | | | Fund Expenses |
| | | | | Financial Statements |
| | | | | Report of Independent Registered Public Accounting Firm |
| | | | | Federal Tax Information |
| | | | | Management and Organization |
| | | | | Important Notices |
MANAGEMENT’S DISCUSSION OF FUND PERFORMANCE1 Economic and Market Conditions
U.S. stocks led the way with double-digit gains in the 12-month period ended September 30, 2018, while global stocks delivered mixed results.
U.S. stocks opened the period on the upswing, as investors anticipated and then cheered passage of the Republican tax reform package in December 2017. Sharp cuts in corporate taxes, a key element of the bill, raised corporate-profit expectations. Stocks also got a boost from positive U.S. economic data, including the unemployment rate which fell to a 17-year low.
Stocks pulled back in February 2018 amid fears that rising rates would spur inflation and boost the appeal of fixed-income investments at the expense of stocks. After a brief rebound, equity markets weakened in the spring of 2018, as investors confronted the prospect of a global trade war due to President Trump’s imposition of broad new tariffs. The tariffs drew retaliatory action from impacted countries including China, Canada, and certain countries in the European Union.
Stocks bounced back in the final three months of the period. Technology stocks led the advance, overcoming an earlier setback from a wave of data-privacy scandals. U.S. economic indicators remained largely positive throughout the period, prompting the U.S. Federal Reserve to raise its benchmark interest rate three times over the 12-month span.
Overseas equity markets delivered mixed results in the period. After early strength aided by rising corporate profits, European stocks subsequently pulled back amid mounting trade war concerns, before a partial recovery in the final months of the period. Similarly, after early gains, China entered a prolonged stock slump that reached bear market territory in late June 2018. Besides trade war fears, signs of slowing economic growth also weighed on Chinese stocks.
For the 12-month period ended September 30, 2018, all major U.S. stock indexes recorded double-digit gains. The blue-chip Dow Jones Industrial Average®2 advanced 20.76%, while the broader U.S. equity market, as represented by the S&P 500® Index, rose 17.91%. The technology-laden NASDAQ Composite Index surged 25.17% in the period. Large-cap U.S. stocks as measured by the S&P 500® Index generally outperformed their small-cap counterparts as measured by the Russell 2000® Index during the period. Growth stocks as a group outpaced value stocks in both the large- and small-cap categories, as measured by the Russell growth and value indexes.
Fund Performance
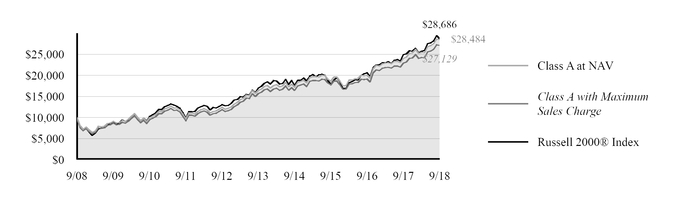
For the 12-month period ended September 30, 2018, Calvert Small-Cap Fund (the Fund) had a total return of 18.55% for Class A shares at net asset value (NAV), outperforming the Russell 2000® Index (the Index), which returned 15.24%.
Stock selection ─ particularly in the health care, information technology, and real estate sectors ─ contributed most to outperformance relative to the Index during the period. An overweight in information technology, one of the strongest performing sectors, was also a positive contributor. In general, sector allocation detracted from performance relative to the Index, particularly as a result of the Fund’s underweight position in health care, in which returns were the most robust overall. Stock selection in the industrials and energy sectors was also a detractor.
Three of the top five performers were in the health care sector, including Amedisys, Inc., the leading contributor overall. Other top health care contributors included ICU Medical, Inc. and Ligand Pharmaceuticals, Inc. Altair Engineering, Inc. and RealPage, Inc., both software companies in information technology, were also among top contributors.
Amedisys, Inc., a provider of home health and hospice care services, outperformed health care service companies in the Index with accelerating growth, improved government reimbursements, and technology-led margin expansion.
Altair Engineering, Inc., a supplier of simulation software, saw its stock price appreciate strongly following a 2017 initial public offering. The company consistently reported results surpassing consensus expectations and its valuation rose closer to those of its public peers.
RealPage, Inc., a leader in multifamily real estate management software, performed well on strong organic growth and attractive acquisitions.
Three of the largest detractors were in industrials, including WageWorks, Inc., Multi-Color Corp., and Deluxe Corp.
WageWorks, Inc., a leading provider of consumer-directed benefits for corporations, detracted most. The employee benefits plan provider lagged peer performance in the industrials sector as the company delayed its Securities and Exchange Commission filings and changed its senior management team. The security was sold during the period.
Multi-Color Corp., a global label maker for consumer products in the industrials sector, also weighed on returns as a result of market pressures following a large acquisition and mixed operating results.
Deluxe Corp., a marketing company specializing in small businesses and financial institutions, detracted as a result of disappointing organic growth and the unexpected retirement of its longstanding CEO.
|
|
See Endnotes and Additional Disclosures in this report. Past performance is no guarantee of future results. Returns are historical and are calculated by determining the percentage change in net asset value (NAV) or offering price (as applicable) with all distributions reinvested. Investment return and principal value will fluctuate so that shares, when redeemed, may be worth more or less than their original cost. Performance less than or equal to one year is cumulative. Performance is for the stated time period only; due to market volatility, the Fund’s current performance may be lower or higher than quoted. Returns are before taxes unless otherwise noted. For performance as of the most recent month-end, please refer to www.calvert.com. |
2 www.calvert.com CALVERT SMALL-CAP FUND ANNUAL REPORT (Unaudited)
PERFORMANCE
|
| | | | | | | | | | | | | | |
Performance2,3 | | | | | | | | | |
Portfolio Managers Michael D. McLean, CFA and J. Griffith Noble, CFA, each of Calvert Research and Management |
| | | | | | | | | | |
| % Average Annual Total Returns | Class Inception Date |
| | Performance Inception Date |
| | One Year |
| | Five Years |
| | Ten Years |
|
| Class A at NAV | 10/01/2004 |
| | 10/01/2004 |
| | 18.55 | % | | 11.59 | % | | 11.03 | % |
| Class A with 4.75% Maximum Sales Charge | — |
| | — |
| | 12.92 |
| | 10.51 |
| | 10.49 |
|
| Class C at NAV | 04/01/2005 |
| | 10/01/2004 |
| | 17.66 |
| | 10.74 |
| | 10.10 |
|
| Class C with 1% Maximum Sales Charge | — |
| | — |
| | 16.66 |
| | 10.74 |
| | 10.10 |
|
| Class I at NAV | 04/29/2005 |
| | 10/01/2004 |
| | 18.92 |
| | 12.10 |
| | 11.71 |
|
| | | | | | | | | | |
| | | | | | | | | | |
Russell 2000® Index | — |
| | — |
| | 15.24 | % | | 11.07 | % | | 11.11 | % |
| | | | | | | | | | |
% Total Annual Operating Expense Ratios4 | | | | | Class A |
| | Class C |
| | Class I |
|
| Gross | | | | | 1.35 | % | | 2.21 | % | | 0.91 | % |
| Net | | | | | 1.29 |
| | 2.04 |
| | 0.91 |
|
|
|
| Growth of $10,000 |
| This graph shows the change in value of a hypothetical investment of $10,000 in Class A of the Fund for the period indicated. For comparison, the same investment is shown in the indicated index. |
|
| | | | | | | | |
| Growth of Investment | Amount Invested |
| Period Beginning | At NAV |
| With Maximum Sales Charge |
| Class C |
| $10,000 |
| 09/30/2008 |
| $26,198 |
| N.A. |
| Class I |
| $250,000 |
| 09/30/2008 |
| $757,208 |
| N.A. |
See Endnotes and Additional Disclosures in this report.
Past performance is no guarantee of future results. Returns are historical and are calculated by determining the percentage change in net asset value (NAV) or offering price (as applicable) with all distributions reinvested. Investment return and principal value will fluctuate so that shares, when redeemed, may be worth more or less than their original cost. Performance less than or equal to one year is cumulative. Performance is for the stated time period only; due to market volatility, the Fund’s current performance may be lower or higher than quoted. Returns are before taxes unless otherwise noted. For performance as of the most recent month-end, please refer to www.calvert.com.
www.calvert.com CALVERT SMALL-CAP FUND ANNUAL REPORT (Unaudited) 3
FUND PROFILE
|
| | | | | | | |
| |
| | | | | |
| | SECTOR ALLOCATION (% of total investments)5 | | | TEN LARGEST HOLDINGS (% of net assets)6 | |
| | | | | | |
| | Financials | 17.9 | % | | ICU Medical, Inc. | 3.0 | % |
| | Industrials | 17.8 | % | | ServiceMaster Global Holdings, Inc. | 2.8 | % |
| | Information Technology | 16.4 | % | | Grand Canyon Education, Inc. | 2.7 | % |
| | Health Care | 14.0 | % | | RealPage, Inc. | 2.7 | % |
| | Consumer Discretionary | 11.6 | % | | Catalent, Inc. | 2.6 | % |
| | Real Estate | 7.2 | % | | Dolby Laboratories, Inc., Class A | 2.4 | % |
| | Consumer Staples | 5.1 | % | | Performance Food Group Co. | 2.4 | % |
| | Utilities | 3.6 | % | | ACI Worldwide, Inc. | 2.3 | % |
| | Materials | 2.7 | % | | Hexcel Corp. | 2.3 | % |
| | Energy | 2.6 | % | | West Pharmaceutical Services, Inc. | 2.2 | % |
| | Communication Services | 0.7 | % | | Total | 25.4 | % |
| | High Social Impact Investments | 0.4 | % | | | |
| | Total | 100.0 | % | | | |
See Endnotes and Additional Disclosures in this report.
4 www.calvert.com CALVERT SMALL-CAP FUND ANNUAL REPORT (Unaudited)
|
| | |
| Endnotes and Additional Disclosures | | |
1 The views expressed in this report are those of the portfolio manager(s) and are current only through the date stated on the cover. These views are subject to change at any time based upon market or other conditions, and Calvert and the Fund(s) disclaim any responsibility to update such views. These views may not be relied upon as investment advice and, because investment decisions are based on many factors, may not be relied upon as an indication of trading intent on behalf of any Calvert fund. This commentary may contain statements that are not historical facts, referred to as “forward looking statements.” The Fund’s actual future results may differ significantly from those stated in any forward looking statement, depending on factors such as changes in securities or financial markets or general economic conditions, the volume of sales and purchases of Fund shares, the continuation of investment advisory, administrative and service contracts, and other risks discussed from time to time in the Fund’s filings with the Securities and Exchange Commission.
| |
2 | Dow Jones Industrial Average® is a price-weighted average of 30 blue-chip stocks that are generally the leaders in their industry. S&P 500® Index is an unmanaged index of large-cap stocks commonly used as a measure of U.S. stock market performance. NASDAQ Composite Index is a market capitalization-weighted index of all domestic and international securities listed on NASDAQ. Source: Nasdaq, Inc. The information is provided by Nasdaq (with its affiliates, are referred to as “Corporations”) and Nasdaq’s third party licensors on an “as is” basis and the Corporations make no guarantees and bear no liability of any kind with respect to the information or the Fund. Russell 2000® Index is an unmanaged index of 2,000 U.S. small-cap stocks. Unless otherwise stated, index returns do not reflect the effect of any applicable sales charges, commissions, expenses, taxes or leverage, as applicable. It is not possible to invest directly in an index. |
| |
3 | Total Returns at NAV do not include applicable sales charges. If sales charges were deducted, the returns would be lower. Total Returns shown with maximum sales charge reflect the stated maximum sales charge. Unless otherwise stated, performance does not reflect the deduction of taxes on Fund distributions or redemptions of Fund shares. Performance since inception for an index, if presented, is the performance since the Fund’s or oldest share class’ inception, as applicable. |
Effective December 31, 2016, Calvert Research and Management became the investment adviser to the Fund and performance reflected prior to such date is that of the Fund’s former investment adviser, Calvert Investment Management, Inc.
| |
4 | Source: Fund prospectus. Net expense ratios reflect a contractual expense reimbursement that continues through 1/31/19. Without the reimbursement, performance would have been lower. The expense ratios for the current reporting period can be found in the Financial Highlights section of this report. |
5 Does not include Short Term Investment of Cash Collateral for Securities Loaned.
6 Excludes cash and cash equivalents.
Fund profile subject to change due to active management.
www.calvert.com CALVERT SMALL-CAP FUND ANNUAL REPORT (Unaudited) 5
FUND EXPENSES
Example
As a Fund shareholder, you incur two types of costs: (1) transaction costs, including sales charges (loads) on purchases and redemption fees (if applicable); and (2) ongoing costs, including management fees; distribution and/or service fees; and other Fund expenses. This Example is intended to help you understand your ongoing costs (in dollars) of Fund investing and to compare these costs with the ongoing costs of investing in other mutual funds. The Example is based on an investment of $1,000 invested at the beginning of the period and held for the entire period (April 1, 2018 to September 30, 2018).
Actual Expenses
The first section of the table below provides information about actual account values and actual expenses. You may use the information in this section, together with the amount you invested, to estimate the expenses that you paid over the period. Simply divide your account value by $1,000 (for example, an $8,600 account value divided by $1,000 = 8.6), then multiply the result by the number in the first section under the heading entitled “Expenses Paid During Period” to estimate the expenses you paid on your account during this period.
Hypothetical Example for Comparison Purposes
The second section of the table below provides information about hypothetical account values and hypothetical expenses based on the actual Fund expense ratio and an assumed rate of return of 5% per year (before expenses), which is not the actual Fund return. The hypothetical account values and expenses may not be used to estimate the actual ending account balance or expenses you paid for the period. You may use this information to compare the ongoing costs of investing in the Fund and other funds. To do so, compare this 5% hypothetical example with the 5% hypothetical examples that appear in the shareholder reports of the other funds.
Please note that the expenses shown in the table are meant to highlight your ongoing costs only and do not reflect any transactional costs, such as sales charges (loads) or redemption fees (if applicable). Therefore, the second section of the table is useful in comparing ongoing costs only, and will not help you determine the relative total costs of owning different funds. In addition, if these transactional costs were included, your costs would be higher.
|
| | | | |
| | Beginning
Account Value
(4/1/18) | Ending
Account Value
(9/30/18) | Expenses Paid
During Period*
(4/1/18 - 9/30/18) | Annualized
Expense Ratio |
| Actual | | | | |
| Class A | $1,000.00 | $1,119.50 | $6.80 | 1.28% |
| Class C | $1,000.00 | $1,115.40 | $10.77 | 2.03% |
| Class I | $1,000.00 | $1,121.40 | $4.89** | 0.92% |
| Hypothetical | | | | |
| (5% return per year before expenses) | | | | |
| Class A | $1,000.00 | $1,018.65 | $6.48 | 1.28% |
| Class C | $1,000.00 | $1,014.89 | $10.25 | 2.03% |
| Class I | $1,000.00 | $1,020.46 | $4.66** | 0.92% |
| | | | | |
| * Expenses are equal to the Fund’s annualized expense ratio for the indicated Class, multiplied by the average account value over the period, multiplied by 183/365 (to reflect the one-half year period). The Example assumes that the $1,000 was invested at the net asset value per share determined at the close of business on March 31, 2018. |
| ** Absent a waiver and/or reimbursement of expenses by an affiliate, expenses would be higher. |
6 www.calvert.com CALVERT SMALL-CAP FUND ANNUAL REPORT (Unaudited)
CALVERT SMALL-CAP FUND
SCHEDULE OF INVESTMENTS
SEPTEMBER 30, 2018
|
| | |
| | SHARES | VALUE ($) |
| COMMON STOCKS - 97.9% | | |
| Aerospace & Defense - 3.6% | | |
| Hexcel Corp. | 148,524 | 9,958,534 |
| Mercury Systems, Inc. (1) | 102,410 | 5,665,321 |
| | | 15,623,855 |
| | | |
| Banks - 9.0% | | |
| Ameris Bancorp | 90,603 | 4,140,557 |
| Columbia Banking System, Inc. | 137,404 | 5,327,153 |
| Sterling Bancorp | 349,556 | 7,690,232 |
| Stock Yards Bancorp, Inc. | 135,046 | 4,902,170 |
| Texas Capital Bancshares, Inc. (1) | 71,441 | 5,904,598 |
| Western Alliance Bancorp (1) | 90,039 | 5,122,319 |
| Wintrust Financial Corp. | 72,039 | 6,118,993 |
| | | 39,206,022 |
| | | |
| Biotechnology - 1.4% | | |
| Ligand Pharmaceuticals, Inc. (1)(2) | 21,443 | 5,885,889 |
| | | |
| Capital Markets - 2.9% | | |
| Cohen & Steers, Inc. (2) | 222,816 | 9,048,558 |
| Lazard Ltd., Class A | 71,337 | 3,433,450 |
| | | 12,482,008 |
| | | |
| Chemicals - 2.7% | | |
| Minerals Technologies, Inc. | 96,821 | 6,545,099 |
| Sensient Technologies Corp. | 65,788 | 5,033,440 |
| | | 11,578,539 |
| | | |
| Commercial Services & Supplies - 3.9% | | |
| Deluxe Corp. | 87,749 | 4,996,428 |
| Multi-Color Corp. | 124,129 | 7,727,030 |
| Viad Corp. | 68,978 | 4,086,947 |
| | | 16,810,405 |
| | | |
| Diversified Consumer Services - 6.6% | | |
| Bright Horizons Family Solutions, Inc. (1) | 41,175 | 4,852,062 |
| Grand Canyon Education, Inc. (1) | 105,775 | 11,931,420 |
| ServiceMaster Global Holdings, Inc. (1) | 192,837 | 11,961,679 |
| | | 28,745,161 |
| | | |
www.calvert.com CALVERT SMALL-CAP FUND ANNUAL REPORT 7
|
| | |
| | SHARES | VALUE ($) |
| COMMON STOCKS - CONT’D | | |
| Electric Utilities - 1.7% | | |
| Portland General Electric Co. | 162,126 | 7,394,567 |
| | | |
| Electrical Equipment - 2.1% | | |
| EnerSys | 106,146 | 9,248,501 |
| | | |
| Electronic Equipment, Instruments & Components - 2.4% | | |
| Dolby Laboratories, Inc., Class A | 149,806 | 10,481,926 |
| | | |
| Energy Equipment & Services - 2.5% | | |
| Oceaneering International, Inc. (1) | 225,903 | 6,234,923 |
| US Silica Holdings, Inc. (2) | 251,785 | 4,741,111 |
| | | 10,976,034 |
| | | |
| Equity Real Estate Investment Trusts (REITs) - 7.0% | | |
| Acadia Realty Trust | 175,252 | 4,912,314 |
| CubeSmart | 227,146 | 6,480,475 |
| EastGroup Properties, Inc. (2) | 78,169 | 7,474,520 |
| Rexford Industrial Realty, Inc. (2) | 217,876 | 6,963,317 |
| STORE Capital Corp. | 171,355 | 4,761,955 |
| | | 30,592,581 |
| | | |
| Food & Staples Retailing - 2.4% | | |
| Performance Food Group Co. (1) | 308,782 | 10,282,441 |
| | | |
| Food Products - 1.3% | | |
| J&J Snack Foods Corp. | 20,382 | 3,075,440 |
| Lancaster Colony Corp. | 15,847 | 2,364,531 |
| | | 5,439,971 |
| | | |
| Gas Utilities - 1.9% | | |
| ONE Gas, Inc. | 98,608 | 8,113,466 |
| | | |
| Health Care Equipment & Supplies - 6.5% | | |
| ICU Medical, Inc. (1) | 46,165 | 13,053,154 |
| Masimo Corp. (1) | 44,689 | 5,565,568 |
| West Pharmaceutical Services, Inc. | 78,869 | 9,737,955 |
| | | 28,356,677 |
| | | |
| Health Care Providers & Services - 3.3% | | |
| Addus HomeCare Corp. (1) | 59,162 | 4,150,214 |
| Amedisys, Inc. (1) | 65,162 | 8,142,644 |
| Chemed Corp. | 6,497 | 2,076,311 |
| | | 14,369,169 |
| | | |
| Hotels, Restaurants & Leisure - 1.4% | | |
| Texas Roadhouse, Inc. | 85,613 | 5,932,125 |
| | | |
8 www.calvert.com CALVERT SMALL-CAP FUND ANNUAL REPORT
|
| | |
| | SHARES | VALUE ($) |
| COMMON STOCKS - CONT’D | | |
| Household Products - 1.4% | | |
| Central Garden & Pet Co., Class A (1) | 187,280 | 6,206,459 |
| | | |
| Insurance - 5.0% | | |
| First American Financial Corp. | 102,005 | 5,262,438 |
| Horace Mann Educators Corp. | 143,944 | 6,463,086 |
| Kinsale Capital Group, Inc. | 58,961 | 3,765,249 |
| RLI Corp. | 80,289 | 6,309,110 |
| | | 21,799,883 |
| | | |
| Interactive Media & Services - 0.6% | | |
| Eventbrite, Inc., Class A (1) | 73,498 | 2,790,719 |
| | | |
| IT Services - 4.8% | | |
| Black Knight, Inc. (1) | 149,658 | 7,774,733 |
| Conduent, Inc. (1) | 259,567 | 5,845,449 |
| CSG Systems International, Inc. | 179,736 | 7,214,603 |
| | | 20,834,785 |
| | | |
| Machinery - 4.3% | | |
| Milacron Holdings Corp. (1) | 331,355 | 6,709,939 |
| RBC Bearings, Inc. (1) | 45,261 | 6,805,444 |
| Woodward, Inc. | 61,327 | 4,958,901 |
| | | 18,474,284 |
| | | |
| Pharmaceuticals - 2.6% | | |
| Catalent, Inc. (1) | 243,704 | 11,100,717 |
| | | |
| Road & Rail - 1.6% | | |
| Landstar System, Inc. | 58,441 | 7,129,802 |
| | | |
| Software - 8.9% | | |
| ACI Worldwide, Inc. (1) | 359,901 | 10,127,614 |
| Altair Engineering, Inc., Class A (1) | 172,090 | 7,477,311 |
| Blackbaud, Inc. | 58,191 | 5,905,223 |
| Ceridian HCM Holding, Inc. (1)(2) | 87,099 | 3,660,771 |
| RealPage, Inc. (1) | 174,976 | 11,530,918 |
| | | 38,701,837 |
| | | |
| Specialty Retail - 0.9% | | |
| Monro, Inc. (2) | 57,563 | 4,006,385 |
| | | |
| Textiles, Apparel & Luxury Goods - 2.5% | | |
| Columbia Sportswear Co. | 42,899 | 3,992,610 |
| Gildan Activewear, Inc. | 231,076 | 7,031,643 |
| | | 11,024,253 |
| | | |
www.calvert.com CALVERT SMALL-CAP FUND ANNUAL REPORT 9
|
| | |
| | SHARES | VALUE ($) |
| COMMON STOCKS - CONT’D | | |
| Thrifts & Mortgage Finance - 0.7% | | |
| Essent Group Ltd. (1) | 72,846 | 3,223,435 |
| | | |
| Trading Companies & Distributors - 2.0% | | |
| Applied Industrial Technologies, Inc. | 113,488 | 8,880,436 |
| | | |
| Total Common Stocks (Cost $355,340,056) | | 425,692,332 |
| | | |
| | | |
| | PRINCIPAL AMOUNT ($) | VALUE ($) |
| HIGH SOCIAL IMPACT INVESTMENTS - 0.4% | | |
| Calvert Impact Capital, Inc., Community Investment Notes, 1.50%, 12/15/19 (3)(4) | 1,401,905 | 1,349,123 |
| ImpactAssets Inc., Global Sustainable Agriculture Notes, 2.50%, 11/3/20 (3)(5)(6) | 152,000 | 142,728 |
| ImpactAssets Inc., Microfinance Plus Notes, 2.40%, 11/3/20 (3)(5)(6) | 195,000 | 178,425 |
| | | |
| Total High Social Impact Investments (Cost $1,748,905) | | 1,670,276 |
| | | |
| | | |
| | SHARES | VALUE ($) |
| SHORT TERM INVESTMENT OF CASH COLLATERAL FOR SECURITIES LOANED - 0.3% | | |
| State Street Navigator Securities Lending Government Money Market Portfolio, 2.16% | 1,398,450 | 1,398,450 |
| | | |
| Total Short Term Investment of Cash Collateral for Securities Loaned (Cost $1,398,450) | | 1,398,450 |
| | | |
| | | |
| TOTAL INVESTMENTS (Cost $358,487,411) - 98.6% | | 428,761,058 |
| Other assets and liabilities, net - 1.4% | | 6,193,980 |
NET ASSETS - 100.0% | | 434,955,038 |
|
|
| NOTES TO SCHEDULE OF INVESTMENTS |
| (1) Non-income producing security. |
| (2) All or a portion of this security was on loan at September 30, 2018. The aggregate market value of securities on loan at September 30, 2018 was $20,790,571. |
| (3) Restricted security. Total market value of restricted securities amounts to $1,670,276, which represents 0.4% of the net assets of the Fund as of September 30, 2018. |
| (4) Affiliated company (see Note 7). |
| (5) For fair value measurement disclosure purposes, security is categorized as Level 3 (see Note 1A). |
| (6) Notes carry an interest rate that varies by period and is contingent on the performance of the underlying portfolio of loans to borrowers. The coupon rate shown represents the rate in effect at September 30, 2018. |
|
| | |
| RESTRICTED SECURITIES | ACQUISITION
DATES | COST ($) |
| Calvert Impact Capital, Inc., Community Investment Notes, 1.50%, 12/15/19 | 12/15/16 | 1,401,905 |
| ImpactAssets Inc., Global Sustainable Agriculture Notes, 2.50%, 11/3/20 | 11/13/15 | 152,000 |
| ImpactAssets Inc., Microfinance Plus Notes, 2.40%, 11/3/20 | 11/13/15 | 195,000 |
| See notes to financial statements. |
10 www.calvert.com CALVERT SMALL-CAP FUND ANNUAL REPORT
CALVERT SMALL-CAP FUND
STATEMENT OF ASSETS AND LIABILITIES
SEPTEMBER 30, 2018
|
| | | |
| ASSETS | |
Investments in securities of unaffiliated issuers, at value (identified cost $357,085,506) - including $20,790,571 of securities on loan |
| $427,411,935 |
|
| Investments in securities of affiliated issuers, at value (identified cost $1,401,905) | 1,349,123 |
|
| Cash | 15,777,836 |
|
| Receivable for capital shares sold | 1,524,721 |
|
| Dividends and interest receivable | 368,730 |
|
| Interest receivable - affiliated | 16,940 |
|
| Securities lending income receivable | 2,562 |
|
| Receivable from affiliate | 28,742 |
|
| Directors’ deferred compensation plan | 194,273 |
|
| Other assets | 7,339 |
|
| Total assets | 446,682,201 |
|
| | |
| LIABILITIES | |
| Payable for investments purchased | 9,014,499 |
|
| Payable for capital shares redeemed | 613,098 |
|
| Deposits for securities loaned | 1,398,450 |
|
| Payable to affiliates: | |
| Investment advisory fee | 240,955 |
|
| Administrative fee | 42,521 |
|
| Distribution and service fees | 48,076 |
|
| Sub-transfer agency fee | 12,666 |
|
| Directors’ deferred compensation plan | 194,273 |
|
| Accrued expenses | 162,625 |
|
| Total liabilities | 11,727,163 |
|
| NET ASSETS |
| $434,955,038 |
|
| | |
| NET ASSETS CONSIST OF: | |
| Paid-in capital applicable to common stock | |
| (75,000,000 shares per class of $0.01 par value authorized) |
| $345,431,322 |
|
| Distributable earnings | 89,523,716 |
|
| Total |
| $434,955,038 |
|
| | |
| NET ASSET VALUE PER SHARE | |
| Class A (based on net assets of $158,921,372 and 5,972,447 shares outstanding) |
| $26.61 |
|
| Class C (based on net assets of $18,944,950 and 827,327 shares outstanding) |
| $22.90 |
|
| Class I (based on net assets of $257,088,716 and 8,947,191 shares outstanding) |
| $28.73 |
|
| | |
| OFFERING PRICE PER SHARE* | |
| Class A (100/95.25 of net asset value per share) |
| $27.94 |
|
| * On sales of $50,000 or more, the offering price of Class A shares is reduced. | |
| See notes to financial statements. |
www.calvert.com CALVERT SMALL-CAP FUND ANNUAL REPORT 11
CALVERT SMALL-CAP FUND
STATEMENT OF OPERATIONS
YEAR ENDED SEPTEMBER 30, 2018
|
| | | |
| INVESTMENT INCOME | |
| Dividend income (net of foreign taxes withheld of $2,720) |
| $3,935,405 |
|
| Interest income | 32,189 |
|
| Interest income - affiliated issuers | 21,028 |
|
| Securities lending income, net | 21,824 |
|
| Total investment income | 4,010,446 |
|
| | |
| EXPENSES | |
| Investment advisory fee | 2,437,803 |
|
| Administrative fee | 430,005 |
|
| Distribution and service fees: | |
| Class A | 365,380 |
|
| Class C | 174,734 |
|
| Directors’ fees and expenses | 18,728 |
|
| Custodian fees | 42,005 |
|
| Transfer agency fees and expenses | 479,202 |
|
| Accounting fees | 76,739 |
|
| Professional fees | 54,797 |
|
| Registration fees | 101,978 |
|
| Reports to shareholders | 46,100 |
|
| Miscellaneous | 32,405 |
|
| Total expenses | 4,259,876 |
|
| Waiver and/or reimbursement of expenses by affiliate | (211,027) |
|
| Reimbursement of expenses-other | (7,339) |
|
| Net expenses | 4,041,510 |
|
| Net investment loss | (31,064) |
|
| | |
| | |
| REALIZED AND UNREALIZED GAIN (LOSS) | |
| Net realized gain on investment securities - unaffiliated issuers | 22,639,811 |
|
| | |
| Net change in unrealized appreciation (depreciation) on: | |
| Investment securities - unaffiliated issuers | 38,647,824 |
|
| Investment securities - affiliated issuers | 12,995 |
|
| | 38,660,819 |
|
| | |
| Net realized and unrealized gain | 61,300,630 |
|
| | |
| Net increase in net assets resulting from operations |
| $61,269,566 |
|
| See notes to financial statements. |
12 www.calvert.com CALVERT SMALL-CAP FUND ANNUAL REPORT
CALVERT SMALL-CAP FUND
STATEMENTS OF CHANGES IN NET ASSETS
|
| | | | | | | |
| INCREASE (DECREASE) IN NET ASSETS | Year Ended
September 30, 2018 | | Year Ended
September 30, 2017 |
| Operations: | | | |
| Net investment loss |
| ($31,064 | ) | |
| ($261,458 | ) |
| Net realized gain | 22,639,811 |
| | 47,142,343 |
|
| Net change in unrealized appreciation (depreciation) | 38,660,819 |
| | 8,597,262 |
|
| Net increase in net assets resulting from operations | 61,269,566 |
| | 55,478,147 |
|
| | | | |
Distributions to shareholders:(1) | | | |
| Class A shares | (18,026,063) |
| | (2,557,610) |
|
| Class C shares | (2,382,276) |
| | (279,848) |
|
| Class I shares | (12,620,526) |
| | (1,495,671) |
|
| Class Y shares | (7,637,178) |
| | (304,385) |
|
| Total distributions to shareholders | (40,666,043) |
| | (4,637,514) |
|
| | | | |
| Capital share transactions: | | | |
| Class A shares | 14,461,672 |
| | (58,875,527) |
|
| Class C shares | 1,790,165 |
| | (2,844,203) |
|
| Class I shares | 144,885,685 |
| | (19,476,370) |
|
Class Y shares(2) | (46,060,517) |
| | 25,601,612 |
|
| Net increase (decrease) in net assets from capital share transactions | 115,077,005 |
| | (55,594,488) |
|
| | | | |
| TOTAL INCREASE (DECREASE) IN NET ASSETS | 135,680,528 |
| | (4,753,855) |
|
| | | | |
| | | | |
| NET ASSETS | | | |
| Beginning of year | 299,274,510 |
| | 304,028,365 |
|
| End of year |
| $434,955,038 |
| |
| $299,274,510 |
|
(1) For the year ended September 30, 2017, the source of distributions was as follows: Net investment income - Class I ($70,704) Net realized capital gain - Class A ($2,557,610), Class C ($279,848), Class I ($1,424,967) and Class Y ($304,385) |
(2) Effective December 8, 2017, Class Y shares of the Fund converted to Class I shares at net asset value. Thereafter, Class Y shares were terminated. |
| See notes to financial statements. |
www.calvert.com CALVERT SMALL-CAP FUND ANNUAL REPORT 13
CALVERT SMALL-CAP FUND
FINANCIAL HIGHLIGHTS
|
| | | | | | | | | | | | | | | |
| | Year Ended September 30, |
| CLASS A SHARES | 2018 | | 2017 | | 2016 | | 2015 | | 2014 | |
| Net asset value, beginning | $25.70 | | $21.76 | | $22.04 | | $22.98 | | $24.58 | |
| Income from investment operations: | | | | | | | | | | |
Net investment income (loss) (1) | (0.04) |
| | (0.05) |
| | 0.03 |
| (2) | 0.04 |
| | (0.07) |
| |
| Net realized and unrealized gain | 4.34 |
| | 4.32 |
| | 1.53 |
| | 1.80 |
| | 1.19 |
| |
| Total from investment operations | 4.30 |
| | 4.27 |
| | 1.56 |
| | 1.84 |
| | 1.12 |
| |
| Distributions from: | | | | | | | | | | |
| Net investment income | — |
| (3) | — |
| | (0.01) |
| | — |
| (3) | — |
| |
| Net realized gain | (3.39) |
| | (0.33) |
| | (1.83) |
| | (2.78) |
| | (2.72) |
| |
| Total distributions | (3.39) |
| | (0.33) |
| | (1.84) |
| | (2.78) |
| | (2.72) |
| |
| Total increase (decrease) in net asset value | 0.91 |
| | 3.94 |
| | (0.28) |
| | (0.94) |
| | (1.60) |
| |
| Net asset value, ending | $26.61 | | $25.70 | | $21.76 | | $22.04 | | $22.98 | |
Total return (4) | 18.55 | % | | 19.74 | % | | 7.66 | % | | 8.18 | % | | 4.69 | % | |
Ratios to average net assets: (5) | | | | | | | | | | |
| Total expenses | 1.28 | % | | 1.36 | % | | 1.42 | % | | 1.52 | % | | 1.61 | % | |
| Net expenses | 1.28 | % | | 1.36 | % | | 1.37 | % | | 1.37 | % | | 1.53 | % | |
| Net investment income (loss) | (0.17 | %) | | (0.22 | %) | | 0.12 | % | (2) | 0.19 | % | | (0.28 | %) | |
| Portfolio turnover | 51 | % | | 137 | % | | 150 | % | | 59 | % | | 103 | % | |
| Net assets, ending (in thousands) | $158,921 | | $137,860 | | $170,294 | | $154,728 | | $134,128 | |
| | | | | | | | | | | |
(1) Computed using average shares outstanding. |
(2) Amount includes a non-recurring refund for overbilling of prior years’ custody out-of-pocket fees. This amounted to $0.001 per share and 0.01% of average net assets. |
(3) Amount is less than $0.005. |
(4) Returns are historical and are calculated by determining the percentage change in net asset value with all distributions reinvested and do not reflect the effect of sales charges, if any. |
(5) Total expenses do not reflect amounts reimbursed and/or waived by the adviser and certain of its affiliates, if applicable. Net expenses are net of all reductions and represent the net expenses paid by the Fund. |
| See notes to financial statements. |
14 www.calvert.com CALVERT SMALL-CAP FUND ANNUAL REPORT
CALVERT SMALL-CAP FUND
FINANCIAL HIGHLIGHTS
|
| | | | | | | | | | | | | | | |
| | Year Ended September 30, |
| CLASS C SHARES | 2018 | | 2017 | | 2016 | | 2015 | | 2014 | |
| Net asset value, beginning | $22.58 | | $19.30 | | $19.88 | | $21.12 | | $22.98 | |
| Income from investment operations: | | | | | | | | | | |
Net investment loss (1) | (0.20) |
| | (0.21) |
| | (0.12) |
| (2) | (0.12) |
| | (0.23) |
| |
| Net realized and unrealized gain | 3.77 |
| | 3.82 |
| | 1.37 |
| | 1.66 |
| | 1.09 |
| |
| Total from investment operations | 3.57 |
| | 3.61 |
| | 1.25 |
| | 1.54 |
| | 0.86 |
| |
| Distributions from: | | | | | | | | | | |
| Net realized gain | (3.25) |
| | (0.33) |
| | (1.83) |
| | (2.78) |
| | (2.72) |
| |
| Total distributions | (3.25) |
| | (0.33) |
| | (1.83) |
| | (2.78) |
| | (2.72) |
| |
| Total increase (decrease) in net asset value | 0.32 |
| | 3.28 |
| | (0.58) |
| | (1.24) |
| | (1.86) |
| |
| Net asset value, ending | $22.90 | | $22.58 | | $19.30 | | $19.88 | | $21.12 | |
Total return (3) | 17.66 | % | | 18.82 | % | | 6.89 | % | | 7.38 | % | | 3.81 | % | |
Ratios to average net assets: (4) | | | | | | | | | | |
| Total expenses | 2.03 | % | | 2.22 | % | | 2.31 | % | | 2.36 | % | | 2.38 | % | |
| Net expenses | 2.03 | % | | 2.12 | % | | 2.12 | % | | 2.12 | % | | 2.31 | % | |
| Net investment loss | (0.91 | %) | | (0.99 | %) | | (0.63 | %) | (2) | (0.56 | %) | | (1.06 | %) | |
| Portfolio turnover | 51 | % | | 137 | % | | 150 | % | | 59 | % | | 103 | % | |
| Net assets, ending (in thousands) | $18,945 | | $16,691 | | $16,842 | | $15,887 | | $14,156 | |
| | | | | | | | | | | |
(1) Computed using average shares outstanding. |
(2) Amount includes a non-recurring refund for overbilling of prior years’ custody out-of-pocket fees. This amounted to $0.001 per share and 0.01% of average net assets. |
(3) Returns are historical and are calculated by determining the percentage change in net asset value with all distributions reinvested and do not reflect the effect of sales charges, if any. |
(4) Total expenses do not reflect amounts reimbursed and/or waived by the adviser and certain of its affiliates, if applicable. Net expenses are net of all reductions and represent the net expenses paid by the Fund. |
| See notes to financial statements. |
www.calvert.com CALVERT SMALL-CAP FUND ANNUAL REPORT 15
CALVERT SMALL-CAP FUND
FINANCIAL HIGHLIGHTS
|
| | | | | | | | | | | | | | | |
| | Year Ended September 30, |
| CLASS I SHARES | 2018 | | 2017 | | 2016 | | 2015 | | 2014 | |
| Net asset value, beginning | $27.51 | | $23.18 | | $23.34 | | $24.14 | | $25.56 | |
| Income from investment operations: | | | | | | | | | | |
Net investment income (1) | 0.05 |
| | 0.06 |
| | 0.13 |
| (2) | 0.16 |
| | 0.08 |
| |
| Net realized and unrealized gain | 4.67 |
| | 4.62 |
| | 1.63 |
| | 1.90 |
| | 1.22 |
| |
| Total from investment operations | 4.72 |
| | 4.68 |
| | 1.76 |
| | 2.06 |
| | 1.30 |
| |
| Distributions from: | | | | | | | | | | |
| Net investment income | (0.08) |
| | (0.02) |
| | (0.09) |
| | (0.08) |
| | — |
| |
| Net realized gain | (3.42) |
| | (0.33) |
| | (1.83) |
| | (2.78) |
| | (2.72) |
| |
| Total distributions | (3.50) |
| | (0.35) |
| | (1.92) |
| | (2.86) |
| | (2.72) |
| |
| Total increase (decrease) in net asset value | 1.22 |
| | 4.33 |
| | (0.16) |
| | (0.80) |
| | (1.42) |
| |
| Net asset value, ending | $28.73 | | $27.51 | | $23.18 | | $23.34 | | $24.14 | |
Total return (3) | 18.92 | % | | 20.29 | % | | 8.15 | % | | 8.72 | % | | 5.27 | % | |
Ratios to average net assets: (4) | | | | | | | | | | |
| Total expenses | 1.04 | % | | 0.92 | % | | 0.94 | % | | 0.91 | % | | 0.95 | % | |
| Net expenses | 0.92 | % | | 0.90 | % | | 0.92 | % | | 0.91 | % | | 0.92 | % | |
| Net investment income | 0.19 | % | | 0.23 | % | | 0.58 | % | (2) | 0.64 | % | | 0.33 | % | |
| Portfolio turnover | 51 | % | | 137 | % | | 150 | % | | 59 | % | | 103 | % | |
| Net assets, ending (in thousands) | $257,089 | | $93,724 | | $96,664 | | $61,669 | | $54,563 | |
| | | | | | | | | | | |
(1) Computed using average shares outstanding. |
(2) Amount includes a non-recurring refund for overbilling of prior years’ custody out-of-pocket fees. This amounted to $0.001 per share and 0.01% of average net assets. |
(3) Returns are historical and are calculated by determining the percentage change in net asset value with all distributions reinvested and do not reflect the effect of sales charges, if any. |
(4) Total expenses do not reflect amounts reimbursed and/or waived by the adviser and certain of its affiliates, if applicable. Net expenses are net of all reductions and represent the net expenses paid by the Fund. |
| See notes to financial statements. |
16 www.calvert.com CALVERT SMALL-CAP FUND ANNUAL REPORT
NOTES TO FINANCIAL STATEMENTS
NOTE 1 — SIGNIFICANT ACCOUNTING POLICIES
Calvert Small-Cap Fund (the Fund) is a diversified series of Calvert Impact Fund, Inc. (the Corporation). The Corporation is a Maryland corporation registered under the Investment Company Act of 1940, as amended (the 1940 Act), as an open-end management investment company. The investment objective of the Fund is to seek to provide long-term capital appreciation through investment primarily in small-cap common stocks of U.S. companies.
The Fund offers three classes of shares. Class A shares are generally sold subject to a sales charge imposed at time of purchase. A contingent deferred sales charge of 0.80% may apply to certain redemptions of Class A shares for accounts for which no sales charge was paid, if redeemed within one year of purchase. Class C shares are sold without a front-end sales charge, and with certain exceptions, are charged a contingent deferred sales charge of 1% on shares redeemed within one year of purchase. Class C shares are only available for purchase through a financial intermediary. Class I shares are sold at net asset value, are not subject to a sales charge and are sold only to certain eligible investors. The Fund previously offered Class Y shares. At the close of business on December 8, 2017, Class Y shares were converted to Class I shares. Each class represents a pro rata interest in the Fund, but votes separately on class-specific matters and is subject to different expenses.
The Fund applies the accounting and reporting guidance in the Financial Accounting Standards Board (FASB) Accounting Standards Codification Topic 946, Financial Services – Investment Companies (ASC 946). Subsequent events, if any, through the date that the financial statements were issued have been evaluated in the preparation of the financial statements.
A. Investment Valuation: Net asset value per share is determined every business day as of the close of the regular session of the New York Stock Exchange (generally 4:00 p.m. Eastern time). The Fund uses independent pricing services approved by the Board of Directors (the Board) to value its investments wherever possible. Investments for which market quotations are not available or deemed not reliable are fair valued in good faith under the direction of the Board.
U.S. generally accepted accounting principles (U.S. GAAP) establishes a disclosure hierarchy that categorizes the inputs to valuation techniques used to value assets and liabilities at measurement date. These inputs are summarized in the three broad levels listed below:
Level 1 - quoted prices in active markets for identical securities
Level 2 - other significant observable inputs (including quoted prices for similar securities, interest rates, prepayment speeds, credit risk, etc.)
Level 3 - significant unobservable inputs (including the Fund’s own assumptions in determining the fair value of investments)
The inputs or methodologies used for valuing securities are not necessarily an indication of the risk associated with investing in those securities.
Valuation techniques used to value the Fund’s investments by major category are as follows:
Equity Securities. Equity securities (including warrants and rights) listed on a U.S. securities exchange generally are valued at the last sale or closing price as reported by an independent pricing service on the primary market or exchange on which they are traded and are categorized as Level 1 in the hierarchy. Equity securities listed on the NASDAQ Global or Global Select Market are valued at the NASDAQ official closing price and are categorized as Level 1 in the hierarchy. Unlisted or listed securities for which closing sales prices or closing quotations are not available are valued at the mean between the latest available bid and asked prices and are categorized as Level 2 in the hierarchy.
Debt Securities. Debt securities are generally valued on the basis of valuations provided by third party pricing services, as derived from such services’ pricing models. Inputs to the models may include, but are not limited to, reported trades, executable bid and asked prices, broker/dealer quotations, prices or yields of securities with similar characteristics, interest rates, anticipated prepayments, benchmark curves or information pertaining to the issuer, as well as industry and economic events. Accordingly, debt securities are generally categorized as Level 2 in the hierarchy. Short-term debt securities of sufficient credit quality purchased with remaining maturities of sixty days or less for which a valuation from a third party pricing service is not readily available may be valued at amortized cost, which approximates fair value, and are categorized as Level 2 in the hierarchy.
Other Securities. Investments in registered investment companies (including money market funds) that do not trade on an exchange are valued at the net asset value per share on the valuation day and are categorized as Level 1 in the hierarchy.
Fair Valuation. If a market value cannot be determined for a security using the methodologies described above, or if, in the good faith opinion of the Fund’s adviser, the market value does not constitute a readily available market quotation, or if a significant event has occurred that would materially affect the value of the security, the security will be fair valued as determined in good faith by or at the direction of the Board in a manner that fairly reflects the security’s value, or the amount that the Fund might
www.calvert.com CALVERT SMALL-CAP FUND ANNUAL REPORT 17
reasonably expect to receive for the security upon its current sale in the ordinary course. Each such determination is based on a consideration of relevant factors, which are likely to vary from one pricing context to another. These factors may include, but are not limited to, the type of security, the existence of any contractual restrictions on the security’s disposition, the price and extent of public trading in similar securities of the issuer or of comparable companies or entities, quotations or relevant information obtained from broker/dealers or other market participants, information obtained from the issuer, analysts, and/or the appropriate stock exchange (for exchange-traded securities), an analysis of the company’s or entity’s financial condition, and an evaluation of the forces that influence the issuer and the market(s) in which the security is purchased and sold.
The values assigned to fair value investments are based on available information and do not necessarily represent amounts that might ultimately be realized. Further, due to the inherent uncertainty of valuations of such investments, the fair values may differ significantly from the values that would have been used had an active market existed, and the differences could be material.
The following table summarizes the market value of the Fund’s holdings as of September 30, 2018, based on the inputs used to value them:
|
| | | | | | | | | | | | | |
| Assets | Level 1 | | Level 2 | Level 3(1) | Total |
| Common Stocks |
| $425,692,332 |
| (2) |
| $— |
|
| $— |
|
| $425,692,332 |
|
| High Social Impact Investments | — |
| | 1,349,123 |
| 321,153 |
| 1,670,276 |
|
| Short Term Investment of Cash Collateral for Securities Loaned | 1,398,450 |
| | — |
| — |
| 1,398,450 |
|
| Total Investments |
| $427,090,782 |
| |
| $1,349,123 |
|
| $321,153 |
|
| $428,761,058 |
|
| | | | | | |
(1) None of the unobservable inputs for Level 3 assets, individually or collectively, had a material impact on the Fund. |
(2) The level classification by major category of investments is the same as the category presentation in the Schedule of Investments. |
Level 3 investments at the beginning and/or end of the period in relation to net assets were not significant and accordingly, a reconciliation of Level 3 assets for the year ended September 30, 2018 is not presented.
B. Investment Transactions and Income: Investment transactions for financial statement purposes are accounted for on trade date. Realized gains and losses are recorded on an identified cost basis and may include proceeds from litigation. Dividend income is recorded on the ex-dividend date for dividends received in cash and/or securities or, in the case of dividends on certain foreign securities, as soon as the Fund is informed of the ex-dividend date. Non-cash dividends are recorded at the fair value of the securities received. Withholding taxes on foreign dividends, if any, have been provided for in accordance with the Fund’s understanding of the applicable country’s tax rules and rates. Distributions received that represent a return of capital are recorded as a reduction of cost of investments. Distributions received that represent a capital gain are recorded as a realized gain. Interest income, which includes amortization of premium and accretion of discount on debt securities, is accrued as earned.
C. Share Class Accounting: Realized and unrealized gains and losses and net investment income and losses, other than class-specific expenses, are allocated daily to each class of shares based upon the relative net assets of each class to the total net assets of the Fund. Expenses arising in connection with a specific class are charged directly to that class.
D. Restricted Securities: The Fund may invest in securities that are subject to legal or contractual restrictions on resale. Generally, these securities may only be sold publicly upon registration under the Securities Act of 1933 or in transactions exempt from such registration. Information regarding restricted securities (excluding Rule 144A securities) is included at the end of the Schedule of Investments.
E. Distributions to Shareholders: Distributions to shareholders are recorded by the Fund on ex-dividend date. Dividends from net investment income and distributions from net realized capital gains, if any, are paid at least annually. Distributions are determined in accordance with income tax regulations which may differ from U.S. GAAP; accordingly, periodic reclassifications are made within the Fund’s capital accounts to reflect income and gains available for distribution under income tax regulations.
F. Estimates: The preparation of financial statements in conformity with U.S. GAAP requires management to make estimates and assumptions that affect the reported amounts of assets and liabilities and disclosure of contingent assets and liabilities at the date of the financial statements and the reported amounts of increases and decreases in net assets from operations during the reporting period. Actual results could differ from those estimates.
G. Indemnifications: The Corporation’s By-Laws provide for indemnification for Directors or officers of the Corporation and certain other parties, to the fullest extent permitted by Maryland law and the 1940 Act, provided certain conditions are met. Additionally, in the normal course of business, the Fund enters into agreements with service providers that may contain indemnification clauses. The Fund’s maximum exposure under these arrangements is unknown as this would involve future claims that may be made against the Fund that have not yet occurred.
18 www.calvert.com CALVERT SMALL-CAP FUND ANNUAL REPORT
H. Federal Income Taxes: No provision for federal income or excise tax is required since the Fund intends to continue to qualify as a regulated investment company under the Internal Revenue Code and to distribute substantially all of its taxable earnings.
Management has analyzed the Fund’s tax positions taken for all open federal income tax years and has concluded that no provision for federal income tax is required in the Fund’s financial statements. A Fund’s federal tax return is subject to examination by the Internal Revenue Service for a period of three years from the date of filing.
NOTE 2 — RELATED PARTY TRANSACTIONS
The investment advisory fee is earned by Calvert Research and Management (CRM), a subsidiary of Eaton Vance Management (EVM), as compensation for investment advisory services rendered to the Fund. Pursuant to the investment advisory agreement, CRM receives a fee, payable monthly, at the annual rate of 0.68% of the Fund’s average daily net assets. For the year ended September 30, 2018, the investment advisory fee amounted to $2,437,803.
CRM has agreed to reimburse the Fund’s operating expenses to the extent that total annual operating expenses (relating to ordinary operating expenses only and excluding expenses such as brokerage commissions, acquired fund fees and expenses of unaffiliated funds, interest expense, taxes or litigation expenses) exceed 1.29%, 2.04% and 0.92% for Class A, Class C and Class I, respectively, and prior to the close of business on December 8, 2017, 1.12% for Class Y, of such class’ average daily net assets. The expense reimbursement agreement with CRM may be changed or terminated after January 31, 2019. For the year ended September 30, 2018, CRM waived or reimbursed expenses of $202,460.
The administrative fee is earned by CRM as compensation for administrative services rendered to the Fund. The fee is computed at an annual rate of 0.12% of the Fund’s average daily net assets attributable to Class A, Class C and Class I (and Class Y prior to the close of business on December 8, 2017) and is payable monthly. CRM contractually waived 0.02% of the administrative fee through January 31, 2018 for Class I. For the year ended September 30, 2018, CRM was paid administrative fees of $430,005 of which $8,567 were waived.
The Fund has in effect a distribution plan for Class A shares (Class A Plan) pursuant to Rule 12b-1 under the 1940 Act. Pursuant to the Class A Plan, the Fund pays Eaton Vance Distributors, Inc. (EVD), an affiliate of CRM and the Fund’s principal underwriter, a distribution and service fee of 0.25% per annum of its average daily net assets attributable to Class A for distribution services and facilities provided to the Fund by EVD, as well as for personal services and/or the maintenance of shareholder accounts. The Fund also has in effect a distribution plan for Class C shares (Class C Plan) pursuant to Rule 12b-1 under the 1940 Act. Pursuant to the Class C Plan, the Fund pays EVD amounts equal to 0.75% per annum of its average daily net assets attributable to Class C shares for providing ongoing distribution services and facilities to the Fund. In addition, pursuant to the Class C Plan, the Fund also makes payments of service fees to EVD, financial intermediaries and other persons in amounts equal to 0.25% per annum of its average daily net assets attributable to that class. Service fees paid or accrued are for personal services and/or the maintenance of shareholder accounts. Distribution and service fees paid or accrued for the year ended September 30, 2018 amounted to $365,380 and $174,734 for Class A shares and Class C shares, respectively.
The Fund was informed that EVD received $40,151 as its portion of the sales charge on sales of Class A shares for the year ended September 30, 2018. The Fund was also informed that EVD received $1,268 of contingent deferred sales charges (CDSC) paid by Class C shareholders and no CDSC paid by Class A shareholders for the same period.
EVM provides sub-transfer agency and related services to the Fund pursuant to a Sub-Transfer Agency Support Services Agreement. For the year ended September 30, 2018, sub-transfer agency fees and expenses incurred to EVM amounted to $67,909 and are included in transfer agency fees and expenses on the Statement of Operations.
Each Director of the Fund who is not an employee of CRM or its affiliates receives a fee of $3,000 for each Board meeting attended in person and $2,000 for each Board meeting attended by phone plus an annual fee of $52,000, and $1,500 for each Committee meeting attended in person and $1,000 for each Committee meeting attended by phone plus an annual Committee fee of $2,500. The Board chair receives an additional $10,000 annual retainer and Committee chairs receive an additional $6,000 annual retainer. Eligible Directors may participate in a Deferred Compensation Plan (the Plan). Amounts deferred under the Plan are treated as though equal dollar amounts had been invested in shares of the Fund or other Calvert funds selected by the Directors. The Fund purchases shares of the funds selected equal to the dollar amounts deferred under the Plan, resulting in an asset equal to the deferred compensation liability. Obligations of the Plan are paid solely from the Fund’s assets. Directors’ fees are allocated to each of the Calvert funds served. Salaries and fees of officers and Directors of the Fund who are employees of CRM or its affiliates are paid by CRM. In addition, an advisory council was established to aid the Board and CRM in advancing the cause of responsible investing through original scholarship and thought leadership. The advisory council consists of CRM’s Chief Executive Officer and four additional members. Each member (other than CRM’s Chief Executive Officer) receives annual compensation of $75,000, which is being reimbursed by Calvert Investment Management, Inc. (CIM), the Calvert funds’ former investment adviser and Ameritas Holding Company, CIM’s parent company, through the end of 2019. For the year ended
www.calvert.com CALVERT SMALL-CAP FUND ANNUAL REPORT 19
September 30, 2018, the Fund’s allocated portion of such expense and reimbursement was $7,339, which are included in miscellaneous expense and reimbursement of expenses-other, respectively, on the Statement of Operations.
NOTE 3 — INVESTMENT ACTIVITY
During the year ended September 30, 2018, the cost of purchases and proceeds from sales of investments, other than short-term securities, were $255,899,293 and $176,867,510, respectively.
NOTE 4 — DISTRIBUTIONS TO SHAREHOLDERS AND INCOME TAX INFORMATION
The tax character of distributions declared for the years ended September 30, 2018 and September 30, 2017 was as follows:
|
| | | | | | |
| | Year Ended September 30, |
| | 2018 | 2017 |
| Ordinary income |
| $19,113,210 |
|
| $70,704 |
|
| Long-term capital gains |
| $21,552,833 |
|
| $4,566,810 |
|
During the year ended September 30, 2018, distributable earnings was decreased by $2,244,835 and paid-in capital was increased by $2,244,835 primarily due to the Fund’s use of equalization accounting. Tax equalization accounting allows the Fund to treat as a distribution that portion of redemption proceeds representing a redeeming shareholder’s portion of undistributed taxable income and net capital gains. These reclassifications had no effect on the net assets or net asset value per share of the Fund.
As of September 30, 2018, the components of distributable earnings (accumulated loss) on a tax basis were as follows:
|
| | | |
| Undistributed ordinary income |
| $7,929,253 |
|
| Undistributed long-term capital gains |
| $11,447,862 |
|
| Net unrealized appreciation (depreciation) |
| $70,146,601 |
|
The cost and unrealized appreciation (depreciation) of investments of the Fund at September 30, 2018, as determined on a federal income tax basis, were as follows:
|
| | | |
| Aggregate cost |
| $358,614,457 |
|
| Gross unrealized appreciation |
| $78,484,202 |
|
| Gross unrealized depreciation | (8,337,601) |
|
| Net unrealized appreciation (depreciation) |
| $70,146,601 |
|
NOTE 5 — SECURITIES LENDING
To generate additional income, the Fund may lend its securities pursuant to a securities lending agency agreement with State Street Bank and Trust Company (SSB), the securities lending agent. Security loans are subject to termination by the Fund at any time and, therefore, are not considered illiquid investments. The Fund requires that the loan be continuously collateralized by either cash or securities as collateral equal at all times to at least 102% of the market value of the domestic securities loaned and 105% of the market value of the international securities loaned (if applicable). The market value of securities loaned is determined daily and any additional required collateral is delivered to the Fund on the next business day. Cash collateral is generally invested in a money market fund registered under the 1940 Act that is managed by an affiliate of SSB. Any gain or loss in the market price of the loaned securities that might occur and any interest earned or dividends declared during the term of the loan would accrue to the account of the Fund. Income earned on the investment of collateral, net of broker rebates and other expenses incurred by the securities lending agent, is split between the Fund and the securities lending agent on the basis of agreed upon contractual terms. Non-cash collateral, if any, is held by the lending agent on behalf of the Fund and cannot be sold or re-pledged by the Fund; accordingly, such collateral is not reflected in the Statement of Assets and Liabilities.
The risks associated with lending portfolio securities include, but are not limited to, possible delays in receiving additional collateral or in the recovery of the loaned securities, possible loss of rights to the collateral should the borrower fail financially, as well as risk of loss in the value of the collateral or the value of the investments made with the collateral. The securities lending agent shall indemnify the Fund in the case of default of any securities borrower.
At September 30, 2018, the total value of securities on loan was $20,790,571 and the total value of collateral received was $21,024,386, comprised of cash of $1,398,450 and U.S. Government and/or agencies securities of $19,625,936.
20 www.calvert.com CALVERT SMALL-CAP FUND ANNUAL REPORT
The following table provides a breakdown of securities lending transactions accounted for as secured borrowings, the obligations by class of collateral pledged, and the remaining contractual maturity of those transactions as of September 30, 2018.
|
| | | | | | | | | | | | | | | |
| | Remaining Contractual Maturity of the Transactions |
| | Overnight and
Continuous | <30 days | 30 to 90 days | >90 days | Total |
| Securities Lending Transactions |
| Common Stocks |
| $21,024,386 |
|
| $— |
|
| $— |
|
| $— |
|
| $21,024,386 |
|
The carrying amount of the liability for deposits for securities loaned at September 30, 2018 approximated its fair value. If measured at fair value, such liability would have been considered as Level 2 in the fair value hierarchy (see Note 1A) at September 30, 2018.
NOTE 6 — LINE OF CREDIT
The Fund participates with other funds managed by CRM in a $62.5 million committed ($25 million committed and $25 million uncommitted prior to August 7, 2018) unsecured line of credit agreement with SSB, which is in effect through August 6, 2019. Borrowings may be made for temporary or emergency purposes only. Borrowings bear interest at the higher of the One-Month London Interbank Offered Rate (LIBOR) in effect that day or the overnight Federal Funds Rate, plus 1.00% (1.25% prior to August 7, 2018) per annum. A commitment fee of 0.20% (0.25% prior to August 7, 2018) per annum is incurred on the unused portion of the committed facility. An administrative fee of $37,500 was incurred in connection with the renewal of the facility in August 2018. These fees are allocated to all participating funds. Because the line of credit is not available exclusively to the Fund, it may be unable to borrow some or all of its requested amounts at any particular time. The Fund had no borrowings outstanding pursuant to this line of credit at September 30, 2018. The Fund did not have any significant borrowings or allocated fees during the year ended September 30, 2018.
NOTE 7 — AFFILIATED COMPANIES
The Fund has invested a portion of its assets designated for high social impact investments in notes (the Notes) issued by Calvert Impact Capital, Inc. (CIC), formerly the Calvert Social Investment Foundation, pursuant to an exemptive order granted by the U.S. Securities and Exchange Commission (the SEC) in 1998 (the Exemptive Order). The Fund obtained the Exemptive Order because at that time there was a significant overlap of Fund Board members and CIC Board members as well as certain other affiliations between CIC and affiliates of the Fund’s investment adviser. CIC may be considered an affiliated person of the Fund based on the overlap between CIC’s Board of Directors and the Calvert funds’ Directors/Trustees and other potential affiliations. CIC has licensed use of the Calvert name from CRM, and currently two Fund Board members (one of whom is CRM’s President and Chief Executive Officer), two members of the Advisory Council to the Calvert Fund Board of Directors/Trustees, and an additional CRM officer serve on CIC’s Board. CIC is not owned or otherwise controlled by CRM or its affiliates. The Fund intends to request a new exemptive order from the SEC to permit additional investment in CIC notes.
At September 30, 2018, the value of the Fund’s investment in the Notes was $1,349,123, which represents 0.3% of the Fund’s net assets. Transactions in the Notes by the Fund for the year ended September 30, 2018 were as follows:
|
| | | | | | | | | | | | | | | | | | | | | | | | | | | |
| Name of Issuer | Principal Amount,
beginning of period | Gross Additions | Gross Reductions | Principal Amount,
end of
period | Value,
end of period | Interest
Income | Net Realized
Gain (Loss) | Capital Gain
Distributions Received | Change in
Unrealized
Appreciation
(Depreciation) |
| High Social Impact Investments | | | | | | | | | |
Calvert Impact Capital, Inc., Community Investment Notes, 1.50%, 12/15/19(1) |
| $1,401,905 |
|
| $— |
|
| $— |
|
| $1,401,905 |
|
| $1,349,123 |
|
| $21,028 |
|
| $— |
|
| $— |
|
| $12,995 |
|
| TOTALS | | | | |
| $1,349,123 |
|
| $21,028 |
|
| $— |
|
| $— |
|
| $12,995 |
|
(1) Restricted security.
www.calvert.com CALVERT SMALL-CAP FUND ANNUAL REPORT 21
NOTE 8 — CAPITAL SHARES
Transactions in capital shares for the years ended September 30, 2018 and September 30, 2017 were as follows:
|
| | | | | | | | | | | |
| | Year Ended
September 30, 2018 | | Year Ended
September 30, 2017 |
| | Shares | Amount | | Shares | Amount |
| Class A | | | | | |
| Shares sold | 1,448,003 |
|
| $36,391,649 |
| | 1,151,710 |
|
| $27,491,576 |
|
| Reinvestment of distributions | 729,490 |
| 17,070,062 |
| | 102,568 |
| 2,461,616 |
|
| Shares redeemed | (1,568,340 | ) | (39,000,039 | ) | | (3,718,270 | ) | (88,828,719 | ) |
| Net increase (decrease) | 609,153 |
|
| $14,461,672 |
| | (2,463,992 | ) |
| ($58,875,527 | ) |
| | | | | | |
| Class C | | | | | |
| Shares sold | 138,869 |
|
| $3,008,756 |
| | 111,995 |
|
| $2,369,515 |
|
| Reinvestment of distributions | 109,480 |
| 2,219,166 |
| | 11,774 |
| 249,835 |
|
| Shares redeemed | (160,129 | ) | (3,437,757 | ) | | (257,513 | ) | (5,463,553 | ) |
| Net increase (decrease) | 88,220 |
|
| $1,790,165 |
| | (133,744 | ) |
| ($2,844,203 | ) |
| | | | | | |
| Class I | | | | | |
| Shares sold | 5,113,586 |
|
| $137,357,519 |
| | 1,415,706 |
|
| $36,468,810 |
|
| Reinvestment of distributions | 448,820 |
| 11,310,256 |
| | 53,023 |
| 1,358,551 |
|
| Shares redeemed | (2,365,065 | ) | (63,158,802 | ) | | (2,233,032 | ) | (57,303,731 | ) |
| Conversion from Class Y | 2,343,506 |
| 59,376,712 |
| | — |
| — |
|
| Net increase (decrease) | 5,540,847 |
|
| $144,885,685 |
| | (764,303 | ) |
| ($19,476,370 | ) |
| | | | | | |
Class Y (1) | | | | | |
| Shares sold | 385,898 |
|
| $9,876,396 |
| | 1,388,431 |
|
| $33,991,378 |
|
| Reinvestment of distributions | 291,560 |
| 6,877,890 |
| | 9,812 |
| 237,257 |
|
| Shares redeemed | (138,308 | ) | (3,438,091 | ) | | (357,503 | ) | (8,627,023 | ) |
| Conversion to Class I | (2,503,266 | ) | (59,376,712 | ) | | — |
| — |
|
| Net increase (decrease) | (1,964,116 | ) |
| ($46,060,517 | ) | | 1,040,740 |
|
| $25,601,612 |
|
| | | | | | |
(1) Effective December 8, 2017, Class Y shares of the Fund converted to Class I shares at net asset value. Thereafter, Class Y shares were terminated. |
22 www.calvert.com CALVERT SMALL-CAP FUND ANNUAL REPORT
REPORT OF INDEPENDENT REGISTERED PUBLIC ACCOUNTING FIRM
To the Shareholders and Board of Directors
Calvert Impact Fund, Inc.:
Opinion on the Financial Statements
We have audited the accompanying statement of assets and liabilities of Calvert Small-Cap Fund (the Fund), a series of Calvert Impact Fund, Inc., including the schedule of investments, as of September 30, 2018, the related statement of operations for the year then ended, the statements of changes in net assets for each of the years in the two‑year period then ended, and the related notes (collectively, the financial statements) and the financial highlights for each of the years in the five‑year period then ended. In our opinion, the financial statements and financial highlights present fairly, in all material respects, the financial position of the Fund as of September 30, 2018, the results of its operations for the year then ended, the changes in its net assets for each of the years in the two‑year period then ended, and the financial highlights for each of the years in the five‑year period then ended, in conformity with U.S. generally accepted accounting principles.
Basis for Opinion
These financial statements and financial highlights are the responsibility of the Fund’s management. Our responsibility is to express an opinion on these financial statements and financial highlights based on our audits. We are a public accounting firm registered with the Public Company Accounting Oversight Board (United States) (PCAOB) and are required to be independent with respect to the Fund in accordance with the U.S. federal securities laws and the applicable rules and regulations of the Securities and Exchange Commission and the PCAOB.
We conducted our audits in accordance with the standards of the PCAOB. Those standards require that we plan and perform the audit to obtain reasonable assurance about whether the financial statements and financial highlights are free of material misstatement, whether due to error or fraud. Our audits included performing procedures to assess the risks of material misstatement of the financial statements and financial highlights, whether due to error or fraud, and performing procedures that respond to those risks. Such procedures included examining, on a test basis, evidence regarding the amounts and disclosures in the financial statements and financial highlights. Such procedures also included confirmation of securities owned as of September 30, 2018, by correspondence with custodians and brokers. Our audits also included evaluating the accounting principles used and significant estimates made by management, as well as evaluating the overall presentation of the financial statements and financial highlights. We believe that our audits provide a reasonable basis for our opinion.
We have served as the auditor of one or more of the Calvert Funds since 2002.
Philadelphia, Pennsylvania
November 21, 2018
www.calvert.com CALVERT SMALL-CAP FUND ANNUAL REPORT 23
FEDERAL TAX INFORMATION
The Form 1099-DIV you receive in February 2019 will show the tax status of all distributions paid to your account in calendar year 2018. Shareholders are advised to consult their own tax adviser with respect to the tax consequences of their investment in the Fund. As required by the Internal Revenue Code and/or regulations, shareholders must be notified regarding the status of qualified dividend income for individuals, the dividends received deduction for corporations and capital gains dividends.
Qualified Dividend Income. For the fiscal year ended September 30, 2018, the Fund designates approximately $2,663,142, or up to the maximum amount of such dividends allowable pursuant to the Internal Revenue Code, as qualified dividend income eligible for the reduced tax rate of 15%.
Dividends Received Deduction. Corporate shareholders are generally entitled to take the dividends received deduction on the portion of the Fund’s dividend distribution that qualifies under tax law. For the Fund’s fiscal 2018 ordinary income dividends, 12% qualifies for the corporate dividends received deduction.
Capital Gains Dividends. The Fund hereby designates as a capital gain dividend with respect to the taxable year ended September 30, 2018, $12,772,289 or, if subsequently determined to be different, the net capital gain of such year.
24 www.calvert.com CALVERT SMALL-CAP FUND ANNUAL REPORT (Unaudited)
MANAGEMENT AND ORGANIZATION
Fund Management. The Directors of Calvert Impact Fund, Inc. (the Corporation) are responsible for the overall management and supervision of the Corporation’s affairs. The Directors and officers of the Corporation are listed below. Except as indicated, each individual has held the office shown or other offices in the same company for the last five years. Directors and officers of the Corporation hold indefinite terms of office. The “Independent Directors” consist of those Directors who are not “interested persons” of the Corporation, as that term is defined under the 1940 Act. The business address of each Director and officer, with the exception of Ms. Gemma and Mr. Kirchner, is 1825 Connecticut Avenue NW, Suite 400, Washington, DC 20009. As used below, “CRM” refers to Calvert Research and Management. Each Director oversees 39 funds in the Calvert fund complex. Each officer serves as an officer of certain other Calvert funds.
|
| | | |
| Name and Year of Birth | Position with Corporation | Position Start Date | Principal Occupation(s) and Directorships During Past Five Years and Other Relevant Experience |
| | | | |
| Interested Director | | | |
John H. Streur(1) 1960 | Director & President | 2015 | President and Chief Executive Officer of Calvert Research and Management (since December 31, 2016). President and Chief Executive Officer of Calvert Investments, Inc. (January 2015 - December 2016); Chief Executive Officer of Calvert Investment Distributors, Inc. (August 2015 - December 2016); Chief Compliance Officer of Calvert Investment Management, Inc. (August 2015 - April 2016); President and Director, Portfolio 21 Investments, Inc. (through October 2014); President, Chief Executive Officer and Director, Managers Investment Group LLC (through January 2012); President and Director, The Managers Funds and Managers AMG Funds (through January 2012). Directorships in the Last Five Years. Portfolio 21 Investments, Inc. (asset management) (through October 2014); Managers Investment Group LLC (asset management) (through January 2012); The Managers Funds (asset management) (through January 2012); Managers AMG Funds (asset management) (through January 2012); Calvert Impact Capital, Inc. |
| Independent Directors | | | |
Richard L. Baird, Jr 1948 | Director | 2005 | Former President and CEO of Adagio Health Inc. (retired in 2014) in Pittsburgh, PA, a non-profit corporation which provides family planning services, nutrition, maternal/child health care, and various health screening services and community preventive health programs. Directorships in the Last Five Years. None. |
Alice Gresham Bullock 1950 | Chair & Director | 2016 | Professor at Howard University School of Law (retired June 2016). She is former Dean of Howard University School of Law (1996-2002) and Deputy Director of the Association of American Law Schools (1992-1994). Directorships in the Last Five Years. None. |
Cari M. Dominguez 1949 | Director | 2016 | Former Chair of the U.S. Equal Employment Opportunity Commission. Directorships in the Last Five Years. Manpower, Inc. (employment agency); Triple S Management Corporation (managed care); National Association of Corporate Directors. |
John G. Guffey, Jr. 1948 | Director | 2005 | President of Aurora Press Inc., a privately held publisher of trade paperbacks (since January 1997). Directorships in the Last Five Years. Calvert Impact Capital, Inc.; Calvert Ventures, LLC. |
Miles D. Harper, III 1962 | Director | 2000 | Partner, Carr Riggs & Ingram (public accounting firm) since October 2014. Partner, Gainer Donnelly & Desroches (public accounting firm) (now Carr Riggs & Ingram), November 1999 - September 2014). Directorships in the Last Five Years. Bridgeway Funds (10) (asset management). |
Joy V. Jones 1950 | Director | 2000 | Attorney. Directorships in the Last Five Years. Conduit Street Restaurants SUD 2 Limited; Palm Management Restaurant Corporation. |
Anthony A. Williams 1951 | Director | 2016 | CEO and Executive Director of the Federal City Council (July 2012 to present); Senior Adviser and Independent Consultant for McKenna Long & Aldridge LLP (September 2011 to present); Executive Director of Global Government Practice at the Corporate Executive Board (January 2010 to January 2012). Directorships in the Last Five Years. Freddie Mac; Evoq Properties/ Meruelo Maddux Properties, Inc. (real estate management); Weston Solutions, Inc. (environmental services); Bipartisan Policy Center’s Debt Reduction Task Force; Chesapeake Bay Foundation; Catholic University of America; Urban Institute (research organization). |
www.calvert.com CALVERT SMALL-CAP FUND ANNUAL REPORT (Unaudited) 25
|
| | | |
| Principal Officers who are not Directors | |
| Name and Year of Birth | Position with Corporation | Position Start Date | Principal Occupation During Past Five Years |
Hope L. Brown 1973 | Chief Compliance Officer | 2014 | Chief Compliance Officer of 39 registered investment companies advised by CRM (since 2014). Vice President and Chief Compliance Officer, Wilmington Funds (2012-2014). Vice President and Senior Compliance Officer, Wilmington Trust Investment Advisors, Inc. (2010-2012). |
Maureen A. Gemma(2) 1960 | Secretary and Vice President | 2016 | Vice President of CRM and officer of 39 registered investment companies advised by CRM (since 2016). Also Vice President of Eaton Vance Management (“EVM”) and certain of its affiliates and officer of 174 registered investment companies advised or administered by EVM. |
James F. Kirchner(2) 1967 | Treasurer | 2016 | Vice President of CRM and officer of 39 registered investment companies advised by CRM (since 2016). Also Vice President of EVM and certain of its affiliates and officer of 174 registered investment companies advised or administered by EVM. |
| |
(1) | Mr. Streur is an interested person of the Fund because of his positions with the Fund’s Adviser and certain affiliates. |
| |
(2) | The business address for Ms. Gemma and Mr. Kirchner is Two International Place, Boston, MA 02110. |
The SAI for the Fund includes additional information about the Directors and officers of the Fund and can be obtained without charge on Calvert’s website at www.calvert.com or by calling 1-800-368-2745.
26 www.calvert.com CALVERT SMALL-CAP FUND ANNUAL REPORT (Unaudited)
IMPORTANT NOTICES
Privacy. The Calvert Funds and Calvert Research and Management are committed to ensuring your financial privacy. Each of the financial institutions identified below has in effect the following policy (“Privacy Policy”) with respect to nonpublic personal information about its customers:
| |
| • | Only such information received from you, through application forms or otherwise, and information about your Calvert fund transactions will be collected. This may include information such as name, address, social security number, tax status, account balances and transactions. |
| |
| • | None of such information about you (or former customers) will be disclosed to anyone, except as permitted by law (which includes disclosure to employees necessary to service your account). In the normal course of servicing a customer’s account, Calvert Research and Management may share information with unaffiliated third parties that perform various required services such as transfer agents, custodians and broker-dealers. |
| |
| • | Policies and procedures (including physical, electronic and procedural safeguards) are in place that are designed to protect the confidentiality of such information. |
| |
| • | The Funds reserve the right to change this Privacy Policy at any time upon proper notification to you. Customers may want to review the Funds’ Privacy Policy periodically for changes by accessing the link on our homepage: www.calvert.com. |
Our pledge of privacy applies to the following entities: the Calvert Family of Funds, Calvert Research and Management and their affiliated service providers, Eaton Vance Management and Eaton Vance Distributors, Inc. In addition, our Privacy Policy applies only to those Calvert customers who are individuals and who have a direct relationship with us. If a customer’s account (i.e., fund shares) is held in the name of a third-party financial advisor/broker-dealer, it is likely that only such advisor’s privacy policies apply to the customer. This notice supersedes all previously issued privacy disclosures. For more information about Calvert’s Privacy Policy, please call 1-800-368-2745.
Delivery of Shareholder Documents. The Securities and Exchange Commission (SEC) permits funds to deliver only one copy of shareholder documents, including prospectuses, proxy statements and shareholder reports, to fund investors with multiple accounts at the same residential or post office box address. This practice is often called “householding” and it helps eliminate duplicate mailings to shareholders. Calvert funds, or your financial advisor, may household the mailing of your documents indefinitely unless you instruct Calvert funds, or your financial advisor, otherwise. If you would prefer that your Calvert fund documents not be householded, please contact Calvert funds at 1-800-368-2745, or contact your financial advisor. Your instructions that householding not apply to delivery of your Calvert fund documents will typically be effective within 30 days of receipt by Calvert funds or your financial advisor. Separate statements will be generated for each separate account and will be householded as described above.
Portfolio Holdings. Each Calvert fund will file a schedule of portfolio holdings on Form N-Q with the SEC for the first and third quarters of each fiscal year. The Form N-Q will be available on the Calvert funds’ website at www.calvert.com, by calling Calvert funds at 1-800-368-2745 or in the EDGAR database on the SEC’s website at www.sec.gov. Form N-Q may also be reviewed and copied at the SEC’s public reference room in Washington, D.C. (call 1-800-732-0330 for information on the operation of the public reference room).
Proxy Voting. The Proxy Voting Guidelines that each Calvert fund uses to determine how to vote proxies relating to portfolio securities is provided as an Appendix to the fund’s Statement of Additional Information. The Statement of Additional Information can be obtained free of charge by calling the Calvert funds at 1-800-368-2745, by visiting the Calvert funds’ website at www.calvert.com or visiting the SEC’s website at www.sec.gov. Information regarding how a Calvert fund voted proxies relating to portfolio securities during the most recent 12-month period ended June 30 is available by calling Calvert funds, by visiting the Calvert funds’ website at www.calvert.com or by visiting the SEC’s website at www.sec.gov.
www.calvert.com CALVERT SMALL-CAP FUND ANNUAL REPORT (Unaudited) 27
|
|
| This page intentionally left blank. |
|
| |
| CALVERT SMALL-CAP FUND | |
Investment Adviser and Administrator Calvert Research and Management 1825 Connecticut Avenue NW, Suite 400 Washington, DC 20009 | Transfer Agent DST Asset Manager Solutions, Inc. 2000 Crown Colony Drive Quincy, MA 02169 |
Principal Underwriter* Eaton Vance Distributors, Inc. Two International Place Boston, MA 02110 (617) 482-8260 | Independent Registered Public Accounting Firm KPMG LLP 1601 Market Street Philadelphia, PA 19103-2499 |
Custodian State Street Bank and Trust Company State Street Financial Center, One Lincoln Street Boston, MA 02111 | Fund Offices 1825 Connecticut Avenue NW, Suite 400 Washington, DC 20009 |
| | |
* FINRA BrokerCheck. Investors may check the background of their Investment Professional by contacting the Financial Industry Regulatory Authority (FINRA). FINRA BrokerCheck is a free tool to help investors check the professional background of current and former FINRA-registered securities firms and brokers. FINRA BrokerCheck is available by calling 1-800-289-9999 and at www.FINRA.org. The FINRA BrokerCheck brochure describing this program is available to investors at www.FINRA.org.
|
| |
| | |
Fund shares are not insured by the FDIC and are not deposits or other obligations of, or guaranteed by, any depository institution. Shares are subject to investment risks, including possible loss of principal invested. This report is intended to provide fund information to shareholders. It is not authorized for distribution to prospective investors unless preceded or accompanied by a prospectus. Note: The information on our website is not incorporated by reference into this report; our website address is included as an inactive textual reference only. Investors should carefully consider the investment objectives, risks, charges and expenses of the Calvert funds. This and other important information is contained in the fund’s summary prospectus and prospectus, which can be obtained from your financial professional and should be read carefully before investing. You may also call the Calvert funds at 800-368-2745. Printed on recycled paper. |
| 24197 9.30.18 | |
|
| | |
| | |
| | | |
Calvert Global Energy Solutions Fund Calvert Global Water Fund
| | |
| | | |
| | |
|
| |
Annual Report September 30, 2018 E-Delivery Sign-Up — Details Inside | |
|
|
Commodity Futures Trading Commission Registration. Effective December 31, 2012, the Commodity Futures Trading Commission (“CFTC”) adopted certain regulatory changes that subject registered investment companies and advisers to regulation by the CFTC if a fund invests more than a prescribed level of its assets in certain CFTC-regulated instruments (including futures, certain options and swap agreements) or markets itself as providing investment exposure to such instruments. Each Fund and its adviser have claimed an exclusion from the definition of the term “commodity pool operator” under the Commodity Exchange Act. Accordingly, neither the Funds nor the adviser is subject to CFTC regulation. |
Choose Planet-friendly E-delivery! Sign up now for on-line statements, prospectuses, and fund reports. In less than five minutes you can help reduce paper mail and lower fund costs. Just go to www.calvert.com. If you already have an online account with the Calvert funds, click on Login to access your Account and select the documents you would like to receive via e-mail. If you’re new to online account access, click on Login, then Register to create your user name and password. Once you’re in, click on the E-delivery sign-up on the Account Portfolio page and follow the quick, easy steps. Note: If your shares are not held directly with the Calvert funds but through a brokerage firm, you must contact your broker for electronic delivery options available through their firm.
|
|
| | | | |
| | TABLE OF CONTENTS |
| | | | | |
| | | | | Management’s Discussion of Fund Performance |
| | | | | Performance and Fund Profile |
| | | | | Calvert Global Energy Solutions Fund |
| | | | | Calvert Global Water Fund |
| | | | | Endnotes and Additional Disclosures |
| | | | | Fund Expenses |
| | | | | Financial Statements |
| | | | | Report of Independent Registered Public Accounting Firm |
| | | | | Federal Tax Information |
| | | | | Management and Organization |
| | | | | Important Notices |
MANAGEMENT’S DISCUSSION OF FUND PERFORMANCE1 Economic and Market Conditions
Led by higher U.S. stocks, most global stock indexes advanced during the 12-month period ended September 30, 2018.
U.S. stocks opened the period on the upswing as investors anticipated, and then cheered passage of the Republican tax reform package in December 2017. Sharp cuts in corporate taxes - a key element of the bill - raised corporate-profit expectations. Stocks also got a boost from positive U.S. economic data, including the unemployment rate, which fell to a 17-year low.
Early in the period, global stocks followed U.S. stocks sharply higher. European stocks got a boost from growing economies and rising corporate profits across the region. Key equity indexes in the Asia-Pacific region also rose despite tensions with North Korea. China’s stock market advanced behind an accelerating housing market, rising retail sales, and strong foreign trade.
U.S. stocks pulled back in February 2018 amid fears that rising rates would spur inflation and boost the appeal of fixed-income investments at the expense of stocks. After a brief rebound, equity markets weakened in the spring of 2018, as investors confronted the prospect of a global trade war due to President Trump’s imposition of broad new tariffs. The protectionist move drew retaliatory action from impacted countries including China, Canada, and certain countries in the European Union.
European stocks also pulled back even more substantially amid mounting trade war concerns, before a partial recovery in the final months of the period. In China, signs of a slowing economy compounded trade war concerns, sending Chinese stocks into a prolonged slump that reached bear market territory in late June 2018.
U.S. stocks bounced back strongly in the final three months of the period. Technology stocks led the advance, overcoming an earlier setback from a wave of data-privacy scandals. U.S. economic indicators remained largely positive throughout the period, prompting the U.S. Federal Reserve to raise its benchmark interest rate three times over the 12-month span.
For the 12-month period ended September 30, 2018, the MSCI World Index,2 a proxy for global equities, advanced 11.24%. The MSCI EAFE Index of developed-market international equities rose 2.74%, while the MSCI Emerging Markets Index declined fractionally. In the U.S., the blue-chip Dow Jones Industrial Average® advanced 20.76%, while the broader U.S. equity market, as represented by the S&P 500® Index, gained 17.91%.
Fund Performance - Calvert Global Energy Solutions Fund
For the fiscal year ended September 30, 2018, Calvert Global Energy Solutions Fund (the Fund) had a total return of -2.73% for Class A shares at net asset value (NAV), underperforming its primary benchmark, the MSCI ACWI Index, which returned 9.77%. The Fund also underperformed its secondary benchmark, the Calvert Global Energy Research Index (the Calvert Energy Index), which returned -1.56%.
The Fund’s underperformance versus its secondary benchmark was due to Fund expenses and fees, which the Calvert Energy Index does not incur.
While the Fund’s holdings in renewable-energy power producers were able to keep up with the broader market, holdings in energy efficiency, energy technology, and energy-efficient leader/solution provider categories detracted from the Fund’s overall performance.
The Fund’s large investment footprint in foreign stocks ─ 71.6% of the portfolio as of the end of the period ─ was a detractor as the U.S. market significantly outperformed global markets for the year. The Fund’s overweights in Asian and Western European markets were particularly detrimental.
Two leading contributors during the period ─ Renewable Energy Group, Inc. and Sunrun, Inc. ─ benefited from falling solar prices, which enhanced profit margins. The stock of Renewable Energy Group, Inc., a manufacturer of plant-based biodiesel, rose more than 137% during the year. The stock of Sunrun, Inc., an installer of solar-based energy systems and storage, rose more than 100%.
Although the Fund’s holdings in energy efficiency lagged overall, several holdings in the sector performed well, including Microsoft Corp., Metsä Board Oyj (Finland), and Croda International plc (U.K.), each of which rose more than 30%.
A combination of steep price declines in solar panels and the U.S.’s January 2018 announcement that it would levy 30% tariffs on solar panels entering the country placed significant pressure on the margins for non-U.S. manufacturers. While tariffs helped U.S.-based manufacturer SolarEdge Technologies, Inc., the Fund had higher exposure to international manufacturers, including JinkoSolar Holding Co. Ltd. ADR (China).
The Fund’s exposure to electric vehicles also hampered Fund performance. Tesla, Inc. experienced a significant decline stemming from a combination of manufacturing issues and securities fraud charges brought against Tesla, Inc.’s CEO, Elon Musk, by the U.S. Securities and Exchange Commission.
Another detractor, FDG Electric Vehicles Ltd, a Hong Kong manufacturer of electric vehicles and batteries, suffered a significant drop in the price of its shares after it announced it was increasing the number of its outstanding shares by 25%. FDG Electric Vehicles Ltd. was sold during the period.
Utilitywise plc (U.K.) and Tanaka Chemical Corp. (Japan) were among the most significant detractors from returns. Utilitywise plc, an energy management services company, saw a steep decline as sales and earnings markedly decreased. Tanaka Chemical Corp., a manufacturer of chemicals for batteries, had a very strong 2017 before pulling back this year. Utiltywise plc was sold during the period.
|
|
See Endnotes and Additional Disclosures in this report. Past performance is no guarantee of future results. Returns are historical and are calculated by determining the percentage change in net asset value (NAV) or offering price (as applicable) with all distributions reinvested. Investment return and principal value will fluctuate so that shares, when redeemed, may be worth more or less than their original cost. Performance less than or equal to one year is cumulative. Performance is for the stated time period only; due to market volatility, the Fund’s current performance may be lower or higher than quoted. Returns are before taxes unless otherwise noted. For performance as of the most recent month-end, please refer to www.calvert.com. |
2 www.calvert.com CALVERT GLOBAL ENERGY SOLUTIONS AND GLOBAL WATER FUNDS ANNUAL REPORT (Unaudited)
MANAGEMENT’S DISCUSSION OF FUND PERFORMANCE - continued Fund Performance - Calvert Global Water Fund
For the fiscal year ended September 30, 2018, Calvert Global Water Fund (the Fund) Class A shares at net asset value (NAV) returned 1.34%, underperforming the primary benchmark, the MSCI ACWI Index (the Index), which returned 9.77%. The Fund also underperformed its secondary benchmark, the Calvert Global Water Research Index (the Calvert Water Index), which returned 2.96%.
The Fund’s underperformance versus its secondary benchmark was due to Fund expenses and fees, which the Calvert Water Index does not incur.
An overweight position in water utilities and stock selection within the water technology and infrastructure sectors were the largest contributors to underperformance relative to the Index. Stock selection among solutions providers in Asia also detracted, whereas stock selection among solutions providers in Europe contributed.
While the utilities sector did well in the U.S., utilities in Europe and emerging markets, which made up approximately 10% of the Fund, were weighed down by slow growth and currency weakness relative to the U.S. dollar. Brazilian utilities especially struggled because of slow revenue growth, as well as currency impacts.
Within the water infrastructure sector, about half of the negative impact came from European holdings, including Uponor Oyj (Finland) and Arcadis NV (the Netherlands). The Fund’s bias toward small- and mid-cap stocks relative to the Index was a significant detractor. Another significant detractor was the Fund’s lack of exposure to Amazon, Inc. and Apple, Inc. stocks, which are large constituents of the Index, but not usually held in water equity funds or indexes.
EnerCare, Inc. was a major contributor to performance. It rose 44% during the period as shareholders approved its acquisition by Brookfield Infrastructure Partners L.P.
Tetra Tech, Inc., a California-based consulting and engineering services firm, further contributed as its stock rose nearly 48% on strong growth and financial performance during the period.
Croda International plc (U.K.) and Metsä Board Oyj (Finland) were leading contributors among solutions providers in Europe.
See Endnotes and Additional Disclosures in this report.
Past performance is no guarantee of future results. Returns are historical and are calculated by determining the percentage change in net asset value (NAV) or offering price (as applicable) with all distributions reinvested. Investment return and principal value will fluctuate so that shares, when redeemed, may be worth more or less than their original cost. Performance less than or equal to one year is cumulative. Performance is for the stated time period only; due to market volatility, the Fund’s current performance may be lower or higher than quoted. Returns are before taxes unless otherwise noted. For performance as of the most recent month-end, please refer to www.calvert.com.
www.calvert.com CALVERT GLOBAL ENERGY SOLUTIONS AND GLOBAL WATER FUNDS ANNUAL REPORT (Unaudited) 3
CALVERT GLOBAL ENERGY SOLUTIONS FUND
PERFORMANCE
|
| | | | | | | | | | | | | | |
Performance2,3 | | | | | | | | | |
Portfolio Managers Thomas C. Seto, Christopher Madden, CFA and Jade Huang, each of Calvert Research and Management |
| | | | | | | | | | |
| % Average Annual Total Returns | Class Inception Date |
| | Performance Inception Date |
| | One Year |
| | Five Years |
| | Ten Years |
|
| Class A at NAV | 05/31/2007 |
| | 05/31/2007 |
| | -2.73 | % | | 0.52 | % | | -5.10 | % |
| Class A with 4.75% Maximum Sales Charge | — |
| | — |
| | -7.34 |
| | -0.47 |
| | -5.56 |
|
| Class C at NAV | 07/31/2007 |
| | 05/31/2007 |
| | -3.31 |
| | -0.34 |
| | -5.96 |
|
| Class C with 1% Maximum Sales Charge | — |
| | — |
| | -4.28 |
| | -0.34 |
| | -5.96 |
|
| Class I at NAV | 05/31/2007 |
| | 05/31/2007 |
| | -2.33 |
| | 0.92 |
| | -4.66 |
|
| | | | | | | | | | |
| | | | | | | | | | |
| MSCI ACWI Index | — |
| | — |
| | 9.77 | % | | 8.66 | % | | 8.18 | % |
| Calvert Global Energy Research Spliced Benchmark | — |
| | — |
| | -1.56 |
| | 4.33 |
| | -4.03 |
|
| Calvert Global Energy Research Index | — |
| | — |
| | -1.56 |
| | — |
| | — |
|
| Ardour Global Alternative Energy Index | — |
| | — |
| | -0.81 |
| | 3.69 |
| | -4.32 |
|
| | | | | | | | | | |
% Total Annual Operating Expense Ratios4 | | | | | Class A |
| | Class C |
| | Class I |
|
| Gross | | | | | 1.89 | % | | 2.73 | % | | 1.61 | % |
| Net | | | | | 1.28 |
| | 2.03 |
| | 0.93 |
|
|
|
| Growth of $10,000 |
| This graph shows the change in value of a hypothetical investment of $10,000 in Class A of the Fund for the period indicated. For comparison, the same investment is shown in the indicated index. |
|
| | | | | | | | |
| Growth of Investment | Amount Invested |
| Period Beginning | At NAV |
| With Maximum Sales Charge |
| Class C |
| $10,000 |
| 09/30/2008 |
| $5,407 |
| N.A. |
| Class I |
| $250,000 |
| 09/30/2008 |
| $155,153 |
| N.A. |
See Endnotes and Additional Disclosures in this report.
Past performance is no guarantee of future results. Returns are historical and are calculated by determining the percentage change in net asset value (NAV) or offering price (as applicable) with all distributions reinvested. Investment return and principal value will fluctuate so that shares, when redeemed, may be worth more or less than their original cost. Performance less than or equal to one year is cumulative. Performance is for the stated time period only; due to market volatility, the Fund’s current performance may be lower or higher than quoted. Returns are before taxes unless otherwise noted. For performance as of the most recent month-end, please refer to www.calvert.com.
4 www.calvert.com CALVERT GLOBAL ENERGY SOLUTIONS AND GLOBAL WATER FUNDS ANNUAL REPORT (Unaudited)
CALVERT GLOBAL ENERGY SOLUTIONS FUND
FUND PROFILE
|
| | | | | | | |
| |
| | | | | |
| | SECTOR ALLOCATION (% of total investments)5 | | | TEN LARGEST HOLDINGS (% of net assets)6 |
| | | | | | |
| | Industrials | 31.2 | % | | Calvert Impact Capital, Inc., Community Investment Notes | 2.1 | % |
| | Information Technology | 23.2 | % | | Samsung SDI Co. Ltd. | 1.0 | % |
| | Utilities | 18.8 | % | | Delta Electronics, Inc. | 0.9 | % |
| | Materials | 11.9 | % | | Infineon Technologies AG | 0.9 | % |
| | Consumer Discretionary | 6.8 | % | | Enel SpA | 0.9 | % |
| | Energy | 2.7 | % | | Umicore SA | 0.9 | % |
| | High Social Impact Investments | 2.3 | % | | Siemens AG | 0.9 | % |
| | Consumer Staples | 1.8 | % | | China Everbright International Ltd. | 0.9 | % |
| | Financials | 0.7 | % | | Vestas Wind Systems A/S | 0.8 | % |
| | Communication Services | 0.6 | % | | Emerson Electric Co. | 0.8 | % |
| | Total | 100.0 | % | | Total | 10.1 | % |
See Endnotes and Additional Disclosures in this report.
www.calvert.com CALVERT GLOBAL ENERGY SOLUTIONS AND GLOBAL WATER FUNDS ANNUAL REPORT (Unaudited) 5
CALVERT GLOBAL WATER FUND
PERFORMANCE
|
| | | | | | | | | | | | | | |
Performance2,3 | | | | | | | | | |
Portfolio Managers Thomas C. Seto, Christopher Madden, CFA and Jade Huang, each of Calvert Research and Management |
| | | | | | | | | | |
| % Average Annual Total Returns | Class Inception Date |
| | Performance Inception Date |
| | One Year |
| | Five Years |
| | Since Inception |
|
| Class A at NAV | 09/30/2008 |
| | 09/30/2008 |
| | 1.34 | % | | 3.99 | % | | 6.70 | % |
| Class A with 4.75% Maximum Sales Charge | — |
| | — |
| | -3.46 |
| | 2.99 |
| | 6.18 |
|
| Class C at NAV | 09/30/2008 |
| | 09/30/2008 |
| | 0.61 |
| | 3.25 |
| | 5.80 |
|
| Class C with 1% Maximum Sales Charge | — |
| | — |
| | -0.39 |
| | 3.25 |
| | 5.80 |
|
| Class I at NAV | 01/31/2014 |
| | 09/30/2008 |
| | 1.68 |
| | 4.43 |
| | 6.92 |
|
| | | | | | | | | | |
| | | | | | | | | | |
| MSCI ACWI Index | — |
| | — |
| | 9.77 | % | | 8.66 | % | | 8.18 | % |
| Calvert Global Water Research Spliced Benchmark | — |
| | — |
| | 2.96 |
| | 8.93 |
| | 8.65 |
|
| Calvert Global Water Research Index | — |
| | — |
| | 2.96 |
| | — |
| | — |
|
| S-Network Global Water Index | — |
| | — |
| | 1.46 |
| | 8.43 |
| | 8.40 |
|
| | | | | | | | | | |
% Total Annual Operating Expense Ratios4 | | | | | Class A |
| | Class C |
| | Class I |
|
| Gross | | | | | 1.46 | % | | 2.17 | % | | 1.12 | % |
| Net | | | | | 1.28 |
| | 2.03 |
| | 0.93 |
|
|
|
| Growth of $10,000 |
| This graph shows the change in value of a hypothetical investment of $10,000 in Class A of the Fund for the period indicated. For comparison, the same investment is shown in the indicated index. |
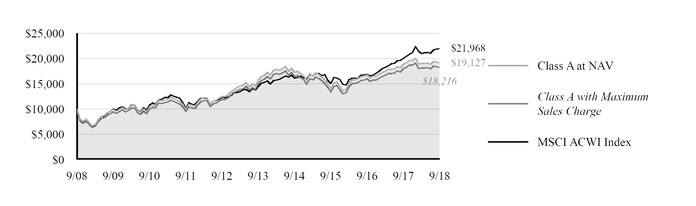
|
| | | | | | | | |
Growth of Investment3 | Amount Invested |
| Period Beginning | At NAV |
| With Maximum Sales Charge |
| Class C |
| $10,000 |
| 09/30/2008 |
| $17,467 |
| N.A. |
| Class I |
| $250,000 |
| 09/30/2008 |
| $480,283 |
| N.A. |
See Endnotes and Additional Disclosures in this report.
Past performance is no guarantee of future results. Returns are historical and are calculated by determining the percentage change in net asset value (NAV) or offering price (as applicable) with all distributions reinvested. Investment return and principal value will fluctuate so that shares, when redeemed, may be worth more or less than their original cost. Performance less than or equal to one year is cumulative. Performance is for the stated time period only; due to market volatility, the Fund’s current performance may be lower or higher than quoted. Returns are before taxes unless otherwise noted. For performance as of the most recent month-end, please refer to www.calvert.com.
6 www.calvert.com CALVERT GLOBAL ENERGY SOLUTIONS AND GLOBAL WATER FUNDS ANNUAL REPORT (Unaudited)
CALVERT GLOBAL WATER FUND
FUND PROFILE
|
| | | | | | | |
| |
| | | | | |
| | SECTOR ALLOCATION (% of total investments)5 | | | TEN LARGEST HOLDINGS (% of net assets)6 |
| | | | | | |
| | Industrials | 40.9 | % | | American Water Works Co., Inc. | 1.5 | % |
| | Utilities | 29.5 | % | | Veolia Environnement SA | 1.4 | % |
| | Materials | 8.9 | % | | Guangdong Investment Ltd. | 1.4 | % |
| | Consumer Discretionary | 6.0 | % | | United Utilities Group plc | 1.4 | % |
| | Information Technology | 5.6 | % | | Aqua America, Inc. | 1.4 | % |
| | Consumer Staples | 4.6 | % | | Suez | 1.4 | % |
| | Health Care | 4.1 | % | | Ferguson plc | 1.3 | % |
| | High Social Impact Investments | 0.4 | % | | Beijing Enterprises Water Group Ltd. | 1.3 | % |
| | Total | 100.0 | % | | Geberit AG | 1.3 | % |
| | | | | Pennon Group plc | 1.3 | % |
| | | | | Total | 13.7 | % |
See Endnotes and Additional Disclosures in this report.
www.calvert.com CALVERT GLOBAL ENERGY SOLUTIONS AND GLOBAL WATER FUNDS ANNUAL REPORT (Unaudited) 7
|
| | |
| Endnotes and Additional Disclosures | | |
1 The views expressed in this report are those of the portfolio manager(s) and are current only through the date stated on the cover. These views are subject to change at any time based upon market or other conditions, and Calvert and the Fund(s) disclaim any responsibility to update such views. These views may not be relied upon as investment advice and, because investment decisions are based on many factors, may not be relied upon as an indication of trading intent on behalf of any Calvert fund. This commentary may contain statements that are not historical facts, referred to as “forward looking statements.” The Fund’s actual future results may differ significantly from those stated in any forward looking statement, depending on factors such as changes in securities or financial markets or general economic conditions, the volume of sales and purchases of Fund shares, the continuation of investment advisory, administrative and service contracts, and other risks discussed from time to time in the Fund’s filings with the Securities and Exchange Commission.
2 MSCI World Index is an unmanaged index of equity securities in the developed markets. MSCI EAFE Index is an unmanaged index of equities in the developed markets, excluding the U.S. and Canada. MSCI Emerging Markets Index is an unmanaged index of emerging markets common stocks. MSCI ACWI Index is an unmanaged free-float-adjusted market-capitalization-weighted index designed to measure the equity market performance of developed and emerging markets. MSCI indexes are net of foreign withholding taxes. Source: MSCI. MSCI data may not be reproduced or used for any other purpose. MSCI provides no warranties, has not prepared or approved this report, and has no liability hereunder. Dow Jones Industrial Average® is a price-weighted average of 30 blue-chip stocks that are generally the leaders in their industry. S&P 500® Index is an unmanaged index of large-cap stocks commonly used as a measure of U.S. stock market performance. The Calvert Global Energy Research Spliced Benchmark is comprised of the Ardour Global Alternative Energy Index prior to October 4, 2016 and the Calvert Global Energy Research Index thereafter. The Calvert Global Energy Research Index includes companies that manage energy use in a sustainable manner or that are actively engaged in facilitating the transition to a more sustainable economy through the reduction of greenhouse gas emissions and the expanded use of renewable energy sources. The Calvert Global Energy Research Index incepted on July 15, 2016; accordingly the five years and ten years returns are not available. The Ardour Global Alternative Energy Index measures the performance of stocks engaged in the field of alternative energy including solar, bioenergy, wind, hydro, and geothermal power sources. The Calvert Global Water Research Spliced Benchmark is comprised of S-Network Global Water Index prior to May 31, 2016 and Calvert Global Water Research Index thereafter. The Calvert Global Water Research Index includes stocks of companies that manage water use in a sustainable manner or that are actively engaged in expanding access to water, improving water quality, promoting the efficient use of water, or providing solutions that address other global water challenges. The Calvert Global Water Research Index incepted on February 5, 2016; accordingly the five years and Since Inception returns are not available. The S-Network Global Water Index measures the performance of stocks involved in water infrastructure, including utilities, and water technology development. Unless otherwise stated, index returns do not reflect the effect of any applicable sales charges, commissions, expenses, taxes or leverage, as applicable. It is not possible to invest directly in an index.
3 Total Returns at NAV do not include applicable sales charges. If sales charges were deducted, the returns would be lower. Total Returns shown with maximum sales charge reflect the stated maximum sales charge. Unless otherwise stated, performance does not reflect the deduction of taxes on Fund distributions or redemptions of Fund shares.
Performance prior to the inception date of a class may be linked to the performance of an older class of the Calvert Global Water Fund. This linked performance is adjusted for any applicable sales charge, but is not adjusted for class expense differences. If adjusted for such differences, the performance would be different. The performance of Class I for the Calvert Global Water Fund is linked to Class A. Performance since inception for an index, if presented, is the performance since the Fund’s or oldest share class’ inception, as applicable. Performance presented in the Financial Highlights included in the financial statements is not linked.
Effective October 4, 2016, the Calvert Global Energy Solutions Fund changed its investment objective and principal investment strategies to track the Calvert Global Energy Research Index and implement the Calvert Principles for Responsible Investment. Prior to October 4, 2016, the Fund employed an active management strategy. Performance prior to October 4, 2016 reflects the Fund’s performance under its former investment objective and policies. In connection with such changes, the Fund changed its secondary benchmark from Ardour Global Alternative Energy Index to Calvert Global Energy Research Index.
Effective April 11, 2016, the Calvert Global Water Fund changed its investment objective and principal investment strategies to track the Calvert Global Water Research Index and implement the Calvert Principles for Responsible Investment. Prior to April 11, 2016, the Fund employed an active management strategy. Performance prior to April 11, 2016 reflects the Fund’s performance under its former investment objective and policies. In connection with such changes, the Fund changed its secondary benchmark from S-Network Global Water Index to Calvert Global Water Research Index.
Effective December 31, 2016, Calvert Research and Management became the investment adviser to the Fund and performance reflected prior to such date is that of the Fund’s former investment adviser, Calvert Investment Management, Inc.
4 Source: Fund prospectus. Net expense ratios reflect a contractual expense reimbursement that continues through 1/31/19. Without the reimbursement, performance would have been lower. The expense ratios for the current reporting period can be found in the Financial Highlights section of this report.
5 Does not include Short Term Investment of Cash Collateral for Securities Loaned.
6 Excludes cash and cash equivalents.
8 www.calvert.com CALVERT GLOBAL ENERGY SOLUTIONS AND GLOBAL WATER FUNDS ANNUAL REPORT (Unaudited)
FUND EXPENSES
Example
As a Fund shareholder, you incur two types of costs: (1) transaction costs, including sales charges (loads) on purchases and redemption fees (if applicable); and (2) ongoing costs, including management fees; distribution and/or service fees; and other Fund expenses. This Example is intended to help you understand your ongoing costs (in dollars) of Fund investing and to compare these costs with the ongoing costs of investing in other mutual funds. The Example is based on an investment of $1,000 invested at the beginning of the period and held for the entire period (April 1, 2018 to September 30, 2018).
Actual Expenses
The first section of the tables below provides information about actual account values and actual expenses. You may use the information in this section, together with the amount you invested, to estimate the expenses that you paid over the period. Simply divide your account value by $1,000 (for example, an $8,600 account value divided by $1,000 = 8.6), then multiply the result by the number in the first section under the heading entitled “Expenses Paid During Period” to estimate the expenses you paid on your account during this period.
Hypothetical Example for Comparison Purposes
The second section of the tables below provides information about hypothetical account values and hypothetical expenses based on the actual Fund expense ratio and an assumed rate of return of 5% per year (before expenses), which is not the actual Fund return. The hypothetical account values and expenses may not be used to estimate the actual ending account balance or expenses you paid for the period. You may use this information to compare the ongoing costs of investing in the Fund and other funds. To do so, compare this 5% hypothetical example with the 5% hypothetical examples that appear in the shareholder reports of the other funds.
Please note that the expenses shown in the tables are meant to highlight your ongoing costs only and do not reflect any transactional costs, such as sales charges (loads) or redemption fees (if applicable). Therefore, the second section of the tables is useful in comparing ongoing costs only, and will not help you determine the relative total costs of owning different funds. In addition, if these transactional costs were included, your costs would be higher.
|
| | | | |
| CALVERT GLOBAL ENERGY SOLUTIONS FUND | BEGINNING
ACCOUNT VALUE
(4/1/18) | ENDING
ACCOUNT VALUE
(9/30/18) | EXPENSES PAID
DURING PERIOD*
(4/1/18 - 9/30/18) | ANNUALIZED
EXPENSE RATIO |
| Actual | | | | |
| Class A | $1,000.00 | $952.10 | $6.26** | 1.28% |
| Class C | $1,000.00 | $948.90 | $9.92** | 2.03% |
| Class I | $1,000.00 | $954.10 | $4.56** | 0.93% |
| Hypothetical | | | | |
| (5% return per year before expenses) | | | | |
| Class A | $1,000.00 | $1,018.65 | $6.48** | 1.28% |
| Class C | $1,000.00 | $1,014.89 | $10.25** | 2.03% |
| Class I | $1,000.00 | $1,020.41 | $4.71** | 0.93% |
| | | | | |
| * Expenses are equal to the Fund’s annualized expense ratio for the indicated Class, multiplied by the average account value over the period, multiplied by 183/365 (to reflect the one-half year period). The Example assumes that the $1,000 was invested at the net asset value per share determined at the close of business on March 31, 2018. |
| ** Absent a waiver and/or reimbursement of expenses by an affiliate, expenses would be higher. |
www.calvert.com CALVERT GLOBAL ENERGY SOLUTIONS AND GLOBAL WATER FUNDS ANNUAL REPORT (Unaudited) 9
|
| | | | |
| CALVERT GLOBAL WATER FUND | BEGINNING
ACCOUNT VALUE
(4/1/18) | ENDING
ACCOUNT VALUE
(9/30/18) | EXPENSES PAID
DURING PERIOD*
(4/1/18 - 9/30/18) | ANNUALIZED
EXPENSE RATIO |
| Actual | | | | |
| Class A | $1,000.00 | $1,005.50 | $6.44** | 1.28% |
| Class C | $1,000.00 | $1,002.20 | $10.19** | 2.03% |
| Class I | $1,000.00 | $1,007.00 | $4.68** | 0.93% |
| Hypothetical | | | | |
| (5% return per year before expenses) | | | | |
| Class A | $1,000.00 | $1,018.65 | $6.48** | 1.28% |
| Class C | $1,000.00 | $1,014.89 | $10.25** | 2.03% |
| Class I | $1,000.00 | $1,020.41 | $4.71** | 0.93% |
| | | | | |
| * Expenses are equal to the Fund’s annualized expense ratio for the indicated Class, multiplied by the average account value over the period, multiplied by 183/365 (to reflect the one-half year period). The Example assumes that the $1,000 was invested at the net asset value per share determined at the close of business on March 31, 2018. |
| ** Absent a waiver and/or reimbursement of expenses by an affiliate, expenses would be higher. |
10 www.calvert.com CALVERT GLOBAL ENERGY SOLUTIONS AND GLOBAL WATER FUNDS ANNUAL REPORT (Unaudited)
CALVERT GLOBAL ENERGY SOLUTIONS FUND
SCHEDULE OF INVESTMENTS
SEPTEMBER 30, 2018
|
| | |
| | SHARES | VALUE ($) |
| COMMON STOCKS - 97.5% | | |
| Austria - 1.9% | | |
| Andritz AG | 10,857 | 633,238 |
| Verbund AG | 12,143 | 598,172 |
| Zumtobel Group AG (1)(2) | 32,162 | 306,135 |
| | | 1,537,545 |
| | | |
| Belgium - 0.9% | | |
| Umicore SA | 12,704 | 709,626 |
| | | |
| Brazil - 0.5% | | |
| Sao Martinho SA | 96,352 | 437,080 |
| | | |
| Canada - 3.0% | | |
| Boralex, Inc., Class A | 31,278 | 436,606 |
| Brookfield Renewable Partners LP | 20,816 | 630,773 |
| Canadian Solar, Inc. (1)(2) | 30,232 | 438,364 |
| Innergex Renewable Energy, Inc. (1) | 47,517 | 477,506 |
| TransAlta Renewables, Inc. | 51,390 | 457,543 |
| | | 2,440,792 |
| | | |
| China - 4.3% | | |
| China Longyuan Power Group Corp. Ltd., Class H | 666,000 | 560,833 |
| Daqo New Energy Corp. ADR (1)(2) | 15,161 | 395,854 |
| Huaneng Renewables Corp. Ltd., Class H | 1,699,955 | 506,903 |
| JinkoSolar Holding Co. Ltd. ADR (1)(2) | 38,659 | 416,357 |
| Tianneng Power International Ltd. | 578,000 | 510,962 |
| Xinjiang Goldwind Science & Technology Co. Ltd., Class H | 480,700 | 514,581 |
| Xinyi Solar Holdings Ltd. (1) | 1,804,000 | 557,577 |
| | | 3,463,067 |
| | | |
| Denmark - 2.9% | | |
| Novozymes A/S, Class B | 10,773 | 590,882 |
| Orsted A/S (3) | 8,207 | 557,690 |
| Rockwool International A/S, Class B | 1,212 | 518,595 |
| Vestas Wind Systems A/S | 10,008 | 676,103 |
| | | 2,343,270 |
| | | |
| Finland - 1.2% | | |
Metsä Board Oyj | 48,896 | 494,075 |
| Neste Oyj | 6,096 | 502,465 |
| | | 996,540 |
| | | |
www.calvert.com CALVERT GLOBAL ENERGY SOLUTIONS AND GLOBAL WATER FUNDS ANNUAL REPORT 11
|
| | |
| | SHARES | VALUE ($) |
| COMMON STOCKS - CONT’D | | |
| France - 3.4% | | |
| Albioma SA | 19,757 | 451,894 |
| Cie de Saint-Gobain | 13,830 | 596,087 |
| Danone SA | 6,837 | 531,339 |
| Schneider Electric SE | 7,785 | 625,112 |
| Valeo SA | 12,412 | 537,450 |
| | | 2,741,882 |
| | | |
| Germany - 8.7% | | |
| Bayerische Motoren Werke AG | 5,250 | 472,977 |
| CropEnergies AG | 57,722 | 310,013 |
| Daimler AG | 7,802 | 491,700 |
| Deutsche Post AG | 14,175 | 503,983 |
| Encavis AG | 62,120 | 433,080 |
| Evonik Industries AG | 14,259 | 509,972 |
| HeidelbergCement AG | 6,389 | 499,031 |
| Infineon Technologies AG | 33,248 | 756,587 |
| Manz AG (2) | 9,233 | 390,319 |
| Nordex SE (2) | 45,044 | 484,183 |
| OSRAM Licht AG | 11,331 | 449,920 |
| PNE AG | 115,723 | 373,495 |
| Siemens AG | 5,394 | 689,696 |
| SMA Solar Technology AG | 13,379 | 313,622 |
| VERBIO Vereinigte BioEnergie AG | 47,228 | 322,150 |
| | | 7,000,728 |
| | | |
| Hong Kong - 2.1% | | |
| Cathay Pacific Airways Ltd. | 342,000 | 515,602 |
| China Everbright International Ltd. | 798,037 | 689,016 |
| GCL-Poly Energy Holdings Ltd. (1)(2) | 7,416,000 | 520,615 |
| | | 1,725,233 |
| | | |
| Ireland - 1.3% | | |
| CRH plc | 15,397 | 503,703 |
| Kingspan Group plc | 11,044 | 514,199 |
| | | 1,017,902 |
| | | |
| Italy - 1.9% | | |
| Enel SpA | 140,198 | 716,626 |
| ERG SpA | 23,666 | 481,605 |
| Falck Renewables SpA | 165,516 | 356,506 |
| | | 1,554,737 |
| | | |
| Japan - 7.2% | | |
| Daikin Industries Ltd. | 4,700 | 625,587 |
| Ferrotec Holdings Corp. (1) | 44,600 | 433,687 |
| GS Yuasa Corp. (1) | 23,400 | 576,170 |
12 www.calvert.com CALVERT GLOBAL ENERGY SOLUTIONS AND GLOBAL WATER FUNDS ANNUAL REPORT
|
| | |
| | SHARES | VALUE ($) |
| COMMON STOCKS - CONT’D | | |
| Hitachi Chemical Co. Ltd. (1) | 30,100 | 612,519 |
| Hitachi Metals Ltd. (1) | 44,300 | 548,565 |
| Nidec Corp. | 3,500 | 503,285 |
| Nippon Express Co. Ltd. | 7,600 | 499,119 |
| Nissan Motor Co. Ltd. (1) | 53,700 | 502,499 |
| Sumitomo Chemical Co. Ltd. | 90,000 | 526,711 |
| Tanaka Chemical Corp. (1)(2) | 38,000 | 470,496 |
| Yokogawa Electric Corp. | 24,900 | 526,708 |
| | | 5,825,346 |
| | | |
| Netherlands - 1.0% | | |
| SIF Holding NV | 21,364 | 397,719 |
| Signify NV (3) | 16,894 | 437,299 |
| | | 835,018 |
| | | |
| New Zealand - 1.3% | | |
| Mercury NZ Ltd. | 222,097 | 495,483 |
| Meridian Energy Ltd. | 248,010 | 539,953 |
| | | 1,035,436 |
| | | |
| Norway - 1.2% | | |
| Norsk Hydro ASA | 89,059 | 534,075 |
| Scatec Solar ASA (1)(3) | 57,332 | 424,126 |
| | | 958,201 |
| | | |
| Portugal - 1.4% | | |
| Altri SGPS SA | 53,687 | 515,594 |
| EDP - Energias de Portugal SA | 164,303 | 606,846 |
| | | 1,122,440 |
| | | |
| South Africa - 0.5% | | |
| Montauk Holdings Ltd. | 56,074 | 360,337 |
| | | |
| South Korea - 2.3% | | |
| Finetex EnE, Inc. (1)(2) | 96,731 | 11,337 |
| Hansol Technics Co. Ltd. (2) | 44,323 | 333,944 |
| Samsung SDI Co. Ltd. | 3,295 | 767,377 |
| Seoul Semiconductor Co. Ltd. | 21,467 | 397,101 |
| Taewoong Co. Ltd. (1)(2) | 26,668 | 336,514 |
| | | 1,846,273 |
| | | |
| Spain - 4.6% | | |
| Acciona SA | 5,977 | 540,419 |
| Atlantica Yield plc | 24,988 | 514,253 |
| EDP Renovaveis SA | 52,907 | 537,017 |
| Ence Energia y Celulosa SA | 53,582 | 543,080 |
| | | |
www.calvert.com CALVERT GLOBAL ENERGY SOLUTIONS AND GLOBAL WATER FUNDS ANNUAL REPORT 13
|
| | |
| | SHARES | VALUE ($) |
| COMMON STOCKS - CONT’D | | |
| Iberdrola SA | 69,580 | 511,055 |
| Red Electrica Corp. SA | 24,755 | 517,517 |
| Siemens Gamesa Renewable Energy SA (1)(2) | 40,432 | 510,173 |
| | | 3,673,514 |
| | | |
| Sweden - 0.6% | | |
| Nibe Industrier AB, Class B | 43,425 | 519,967 |
| | | |
| Switzerland - 3.1% | | |
| ABB Ltd. | 27,089 | 640,784 |
| Clariant AG | 20,804 | 541,180 |
| Gurit Holding AG | 462 | 387,699 |
| Landis+Gyr Group AG (1) | 6,868 | 458,960 |
| Meyer Burger Technology AG (1)(2) | 685,293 | 479,863 |
| | | 2,508,486 |
| | | |
| Taiwan - 6.2% | | |
| Chroma ATE, Inc. | 104,000 | 498,881 |
| Delta Electronics, Inc. | 178,000 | 763,055 |
| Epistar Corp. | 492,000 | 558,315 |
| Everlight Electronics Co. Ltd. | 449,000 | 458,760 |
| Gigasolar Materials Corp. | 83,000 | 355,776 |
| Lextar Electronics Corp. | 516,000 | 337,108 |
| Motech Industries, Inc. (2) | 1,167,000 | 388,461 |
| OptoTech Corp. | 628,000 | 468,799 |
| Simplo Technology Co. Ltd. | 82,000 | 562,799 |
| Sino-American Silicon Products, Inc. | 235,000 | 602,690 |
| | | 4,994,644 |
| | | |
| Thailand - 1.3% | | |
| BCPG PCL | 684,800 | 480,432 |
| Energy Absolute PCL, NVDR | 356,100 | 530,887 |
| Inter Far East Energy Corp. (2)(4) | 2,662,000 | 0 |
| | | 1,011,319 |
| | | |
| United Kingdom - 7.0% | | |
| Aptiv plc | 6,681 | 560,536 |
| Croda International plc | 7,750 | 525,324 |
| Delphi Technologies plc | 13,211 | 414,297 |
| Dialight plc (2) | 61,426 | 381,669 |
| easyJet plc | 26,355 | 450,990 |
| John Laing Group plc (3) | 126,564 | 514,840 |
| Johnson Matthey plc | 11,575 | 537,117 |
| Ricardo plc | 44,397 | 489,486 |
| SIG plc | 239,877 | 396,306 |
| | | |
14 www.calvert.com CALVERT GLOBAL ENERGY SOLUTIONS AND GLOBAL WATER FUNDS ANNUAL REPORT
|
| | |
| | SHARES | VALUE ($) |
| COMMON STOCKS - CONT’D | | |
| Smart Metering Systems plc | 48,320 | 387,186 |
| Unilever plc | 9,362 | 514,293 |
| United Utilities Group plc | 53,457 | 490,732 |
| | | 5,662,776 |
| | | |
| United States - 27.7% | | |
| 3M Co. | 2,506 | 528,039 |
| AAON, Inc. (1) | 10,931 | 413,192 |
| Advanced Emissions Solutions, Inc. (1) | 44,458 | 531,718 |
| Alaska Air Group, Inc. | 7,336 | 505,157 |
| Alphabet, Inc., Class A (2) | 429 | 517,837 |
| Ameresco, Inc., Class A (2) | 24,581 | 335,531 |
| BorgWarner, Inc. | 11,930 | 510,365 |
| Clearway Energy, Inc., Class C | 26,036 | 501,193 |
| Covanta Holding Corp. | 30,724 | 499,265 |
| Cree, Inc. (1)(2) | 11,532 | 436,717 |
| Eaton Corp. plc | 7,324 | 635,211 |
| Emerson Electric Co. | 8,454 | 647,407 |
| EnerSys | 7,336 | 639,186 |
| First Solar, Inc. (2) | 12,928 | 625,974 |
| Gibraltar Industries, Inc. (2) | 11,037 | 503,287 |
| Hannon Armstrong Sustainable Infrastructure Capital, Inc. (1) | 24,200 | 519,574 |
| Ingersoll-Rand plc | 5,961 | 609,810 |
| International Business Machines Corp. | 3,515 | 531,503 |
| Itron, Inc. (2) | 6,869 | 440,990 |
| Johnson Controls International plc | 16,340 | 571,900 |
| Maxwell Technologies, Inc. (1)(2) | 135,965 | 474,518 |
| Microsoft Corp. | 4,601 | 526,216 |
| NextEra Energy Partners LP | 11,034 | 535,149 |
| ON Semiconductor Corp. (2) | 26,336 | 485,372 |
| Ormat Technologies, Inc. | 9,233 | 499,598 |
| Owens Corning | 8,602 | 466,831 |
| Pattern Energy Group, Inc. | 25,749 | 511,633 |
| Plug Power, Inc. (1)(2) | 224,044 | 430,164 |
| Power Integrations, Inc. | 8,469 | 535,241 |
| Renewable Energy Group, Inc. (1)(2) | 17,266 | 497,261 |
| Rockwell Automation, Inc. | 3,097 | 580,749 |
| Sensata Technologies Holding plc (2) | 10,549 | 522,703 |
| SolarEdge Technologies, Inc. (1)(2) | 13,290 | 500,368 |
| SunPower Corp. (1)(2) | 62,242 | 454,367 |
| Sunrun, Inc. (1)(2) | 36,434 | 453,239 |
| Tenneco, Inc. | 10,422 | 439,183 |
| TerraForm Power, Inc., Class A | 38,151 | 440,644 |
| Tesla, Inc. (2) | 2,085 | 552,045 |
| TPI Composites, Inc. (2) | 17,925 | 511,759 |
| Universal Display Corp. (1) | 5,434 | 640,669 |
| Veeco Instruments, Inc. (2) | 42,321 | 433,790 |
www.calvert.com CALVERT GLOBAL ENERGY SOLUTIONS AND GLOBAL WATER FUNDS ANNUAL REPORT 15
|
| | |
| | SHARES | VALUE ($) |
| COMMON STOCKS - CONT’D | | |
| Vivint Solar, Inc. (1)(2) | 70,765 | 367,978 |
| Waste Management, Inc. | 5,667 | 512,070 |
| Whirlpool Corp. (1) | 3,972 | 471,675 |
| | | 22,347,078 |
| | | |
| Total Common Stocks (Cost $75,836,124) | | 78,669,237 |
| | | |
| | | |
| | PRINCIPAL AMOUNT ($) | VALUE ($) |
| HIGH SOCIAL IMPACT INVESTMENTS - 2.3% | | |
| Calvert Impact Capital, Inc., Community Investment Notes, 1.50%, 12/15/19 (5)(6) | 1,800,000 | 1,732,230 |
| ImpactAssets Inc., Global Sustainable Agriculture Notes, 2.50%, 11/3/20 (4)(5)(7) | 53,000 | 49,767 |
| ImpactAssets Inc., Microfinance Plus Notes, 2.40%, 11/3/20 (4)(5)(7) | 68,000 | 62,220 |
| | | |
| Total High Social Impact Investments (Cost $1,921,000) | | 1,844,217 |
| | | |
| | | |
| | SHARES | VALUE ($) |
| SHORT TERM INVESTMENT OF CASH COLLATERAL FOR SECURITIES LOANED - 8.9% | | |
| State Street Navigator Securities Lending Government Money Market Portfolio, 2.16% | 7,217,580 | 7,217,580 |
| | | |
| Total Short Term Investment of Cash Collateral for Securities Loaned (Cost $7,217,580) | | 7,217,580 |
| | | |
| | | |
| TOTAL INVESTMENTS (Cost $84,974,704) - 108.7% | | 87,731,034 |
| Other assets and liabilities, net - (8.7%) | | (7,054,656) |
NET ASSETS - 100.0% | | 80,676,378 |
|
| | |
| NOTES TO SCHEDULE OF INVESTMENTS |
| (1) All or a portion of this security was on loan at September 30, 2018. The aggregate market value of securities on loan at September 30, 2018 was $11,382,309. |
| (2) Non-income producing security. |
| (3) Security is exempt from registration under Rule 144A of the Securities Act of 1933. These securities may be resold in transactions exempt from registration, normally to qualified institutional buyers. Total market value of Rule 144A securities amounts to $1,933,955, which represents 2.4% of the net assets of the Fund as of September 30, 2018. |
| (4) For fair value measurement purposes, security is categorized as Level 3 (see Note 1A). |
| (5) Restricted security. Total market value of restricted securities amounts to $1,844,217, which represents 2.3% of the net assets of the Fund as of September 30, 2018. |
| (6) Affiliated company (see Note 7). |
| (7) Notes carry an interest rate that varies by period and is contingent on the performance of the underlying portfolio of loans to borrowers. The coupon rate shown represents the rate in effect at September 30, 2018. |
| |
| Abbreviations: |
| ADR: | American Depositary Receipt | |
| NVDR: | Non-Voting Depository Receipt | |
| PCL: | Public Company Limited | |
16 www.calvert.com CALVERT GLOBAL ENERGY SOLUTIONS AND GLOBAL WATER FUNDS ANNUAL REPORT
|
|
| At September 30, 2018, the concentration of the Fund’s investments in the various sectors, determined as a percentage of total investments, was as follows: |
|
| | |
| ECONOMIC SECTORS | % OF TOTAL INVESTMENTS* |
| Industrials | 31.2 | % |
| Information Technology | 23.2 | % |
| Utilities | 18.8 | % |
| Materials | 11.9 | % |
| Consumer Discretionary | 6.8 | % |
| Energy | 2.7 | % |
| High Social Impact Investments | 2.3 | % |
| Consumer Staples | 1.8 | % |
| Financials | 0.7 | % |
| Communication Services | 0.6 | % |
| Total | 100.0 | % |
| * Does not include Short Term Investment of Cash Collateral for Securities Loaned. | |
|
| | |
| RESTRICTED SECURITIES | ACQUISITION
DATES | COST ($) |
| Calvert Impact Capital, Inc., Community Investment Notes, 1.50%, 12/15/19 | 12/15/16 | 1,800,000 |
| ImpactAssets Inc., Global Sustainable Agriculture Notes, 2.50%, 11/3/20 | 11/13/15 | 53,000 |
| ImpactAssets Inc., Microfinance Plus Notes, 2.40%, 11/3/20 | 11/13/15 | 68,000 |
| See notes to financial statements. | | |
www.calvert.com CALVERT GLOBAL ENERGY SOLUTIONS AND GLOBAL WATER FUNDS ANNUAL REPORT 17
CALVERT GLOBAL WATER FUND
SCHEDULE OF INVESTMENTS
SEPTEMBER 30, 2018
|
| | |
| | SHARES | VALUE ($) |
| COMMON STOCKS - 99.3% | | |
| Australia - 0.9% | | |
| Reliance Worldwide Corp. Ltd. (1) | 985,110 | 3,679,846 |
| | | |
| Brazil - 2.1% | | |
| Cia de Saneamento de Minas Gerais | 471,264 | 4,543,963 |
| Cia de Saneamento do Parana, PFC Shares | 2,161,794 | 4,453,610 |
| | | 8,997,573 |
| | | |
| Canada - 0.9% | | |
| EnerCare, Inc. | 171,083 | 3,833,192 |
| | | |
| Chile - 2.2% | | |
| Aguas Andinas SA, Class A | 9,168,357 | 5,080,098 |
| Inversiones Aguas Metropolitanas SA | 2,889,398 | 4,326,136 |
| | | 9,406,234 |
| | | |
| China - 1.5% | | |
| China Lesso Group Holdings Ltd. | 6,540,578 | 3,706,117 |
| CT Environmental Group Ltd. (1) | 23,974,202 | 2,781,716 |
| | | 6,487,833 |
| | | |
| Denmark - 0.8% | | |
| Novozymes A/S, Class B | 63,018 | 3,456,440 |
| | | |
| Finland - 4.1% | | |
| Kemira Oyj | 270,592 | 3,644,370 |
| Metsa Board Oyj | 334,467 | 3,379,658 |
| Outotec Oyj (2) | 524,985 | 3,433,744 |
| Uponor Oyj | 290,568 | 3,796,095 |
| Valmet Oyj | 159,608 | 3,555,155 |
| | | 17,809,022 |
| | | |
| France - 6.0% | | |
| Accor SA | 67,020 | 3,442,944 |
| Danone SA | 44,332 | 3,445,270 |
| L’Oreal SA | 14,327 | 3,454,057 |
| Sanofi SA | 39,137 | 3,496,781 |
| Suez | 411,467 | 5,853,077 |
| Veolia Environnement SA | 307,219 | 6,130,440 |
| | | 25,822,569 |
| | | |
18 www.calvert.com CALVERT GLOBAL ENERGY SOLUTIONS AND GLOBAL WATER FUNDS ANNUAL REPORT
|
| | |
| | SHARES | VALUE ($) |
| COMMON STOCKS - CONT’D | | |
| Hong Kong - 4.7% | | |
| Beijing Enterprises Water Group Ltd. | 10,773,452 | 5,743,494 |
| China Everbright International Ltd. (1) | 4,197,666 | 3,624,215 |
| China Water Affairs Group Ltd. (1) | 4,210,421 | 4,710,206 |
| Guangdong Investment Ltd. | 3,417,427 | 6,055,554 |
| | | 20,133,469 |
| | | |
| India - 0.9% | | |
| Jain Irrigation Systems Ltd. | 2,515,990 | 2,122,382 |
| VA Tech Wabag Ltd. | 484,908 | 1,952,913 |
| | | 4,075,295 |
| | | |
| Italy - 0.8% | | |
| ACEA SpA | 241,147 | 3,610,561 |
| | | |
| Japan - 6.5% | | |
| Ebara Corp. | 136,856 | 4,721,754 |
| Hitachi Zosen Corp. (1) | 909,327 | 3,801,660 |
| Kurita Water Industries Ltd. | 138,042 | 4,021,479 |
| LIXIL Group Corp. | 220,900 | 4,253,339 |
| METAWATER Co. Ltd. | 117,217 | 3,367,977 |
| Nihon Trim Co. Ltd. | 54,900 | 2,830,554 |
| TOTO Ltd. (1) | 117,200 | 4,860,795 |
| | | 27,857,558 |
| | | |
| Netherlands - 2.8% | | |
| Aalberts Industries NV | 110,206 | 4,693,464 |
| Arcadis NV (1) | 238,728 | 3,994,251 |
| Boskalis Westminster (1) | 112,665 | 3,547,653 |
| | | 12,235,368 |
| | | |
| Philippines - 1.0% | | |
| Manila Water Co., Inc. | 9,578,006 | 4,343,425 |
| | | |
| Singapore - 0.3% | | |
| Hyflux Ltd. (1)(2)(3) | 17,622,294 | 1,353,528 |
| | | |
| South Korea - 0.9% | | |
| Coway Co. Ltd. | 48,319 | 3,780,586 |
| | | |
| Spain - 0.8% | | |
| Iberdrola SA | 451,418 | 3,315,598 |
| | | |
| Sweden - 1.0% | | |
| Hennes & Mauritz AB, Class B (1) | 245,127 | 4,528,376 |
| | | |
www.calvert.com CALVERT GLOBAL ENERGY SOLUTIONS AND GLOBAL WATER FUNDS ANNUAL REPORT 19
|
| | |
| | SHARES | VALUE ($) |
| COMMON STOCKS - CONT’D | | |
| Switzerland - 6.2% | | |
| Ferguson plc | 67,907 | 5,759,997 |
| Geberit AG | 12,098 | 5,615,186 |
| Georg Fischer AG | 3,990 | 4,519,346 |
| Novartis AG | 40,109 | 3,452,521 |
| Sika AG | 23,458 | 3,413,596 |
| Sulzer AG | 33,814 | 4,053,876 |
| | | 26,814,522 |
| | | |
| Taiwan - 1.6% | | |
| China Steel Corp. | 4,122,000 | 3,441,959 |
| Taiwan Semiconductor Manufacturing Co. Ltd. | 405,294 | 3,458,590 |
| | | 6,900,549 |
| | | |
| United Kingdom - 9.7% | | |
| Croda International plc | 51,023 | 3,458,527 |
| Halma plc | 182,592 | 3,437,635 |
| Mondi plc | 119,431 | 3,269,987 |
| nVent Electric plc | 149,559 | 4,062,022 |
| Pennon Group plc | 598,868 | 5,565,746 |
| Pentair plc | 101,368 | 4,394,303 |
| Polypipe Group plc | 772,205 | 3,579,285 |
| Rotork plc | 1,076,755 | 4,634,626 |
| Unilever plc | 60,641 | 3,331,259 |
| United Utilities Group plc | 652,078 | 5,986,036 |
| | | 41,719,426 |
| | | |
| United States - 43.6% | | |
| Advanced Drainage Systems, Inc. | 128,785 | 3,979,456 |
| Aegion Corp. (2) | 151,501 | 3,845,095 |
| American States Water Co. | 85,401 | 5,221,417 |
| American Water Works Co., Inc. | 74,834 | 6,583,147 |
| Aqua America, Inc. | 159,184 | 5,873,890 |
| AquaVenture Holdings Ltd. (2) | 158,131 | 2,857,427 |
| Artesian Resources Corp., Class A | 106,052 | 3,900,593 |
| Badger Meter, Inc. | 67,753 | 3,587,521 |
| California Water Service Group | 122,825 | 5,269,192 |
| Cantel Medical Corp. | 42,254 | 3,889,903 |
| Colgate-Palmolive Co. | 49,755 | 3,331,097 |
| Connecticut Water Service, Inc. | 66,155 | 4,589,172 |
| Danaher Corp. | 31,848 | 3,460,604 |
| Ecolab, Inc. | 33,918 | 5,317,664 |
| Entegris, Inc. | 107,027 | 3,098,432 |
| Evoqua Water Technologies Corp. (1)(2) | 197,783 | 3,516,582 |
| Flowserve Corp. (1) | 79,613 | 4,354,035 |
| Ford Motor Co. | 346,405 | 3,204,246 |
| Forterra, Inc. (1)(2) | 356,784 | 2,661,609 |
20 www.calvert.com CALVERT GLOBAL ENERGY SOLUTIONS AND GLOBAL WATER FUNDS ANNUAL REPORT
|
| | |
| | SHARES | VALUE ($) |
| COMMON STOCKS - CONT’D | | |
| Fortune Brands Home & Security, Inc. | 90,706 | 4,749,366 |
| Franklin Electric Co., Inc. | 75,377 | 3,561,563 |
| General Mills, Inc. | 69,745 | 2,993,455 |
| Gorman-Rupp Co. (The) | 101,012 | 3,686,938 |
| Hanesbrands, Inc. (1) | 185,839 | 3,425,013 |
| Hawkins, Inc. | 72,581 | 3,008,482 |
| HD Supply Holdings, Inc. (2) | 121,206 | 5,186,405 |
| IDEX Corp. | 30,363 | 4,574,490 |
| IDEXX Laboratories, Inc. (2) | 13,529 | 3,377,650 |
| Intel Corp. | 71,550 | 3,383,600 |
| Itron, Inc. (2) | 57,785 | 3,709,797 |
| Kellogg Co. | 44,549 | 3,119,321 |
| Lindsay Corp. (1) | 40,253 | 4,034,961 |
| Middlesex Water Co. | 94,151 | 4,558,791 |
| Mueller Industries, Inc. | 145,499 | 4,216,561 |
| Mueller Water Products, Inc., Class A | 363,423 | 4,182,999 |
| NIKE, Inc., Class B | 40,551 | 3,435,481 |
| Nucor Corp. | 52,250 | 3,315,263 |
| Rexnord Corp. (2) | 130,115 | 4,007,542 |
| Sempra Energy | 28,604 | 3,253,705 |
| SJW Group | 76,737 | 4,692,468 |
| Tetra Tech, Inc. | 57,525 | 3,928,957 |
| Toro Co. (The) | 69,842 | 4,188,425 |
| Trimble, Inc. (2) | 76,530 | 3,325,994 |
| Valmont Industries, Inc. | 32,655 | 4,522,717 |
| Watts Water Technologies, Inc., Class A | 47,716 | 3,960,428 |
| Xylem, Inc. | 58,952 | 4,708,496 |
| York Water Co. (The) | 134,872 | 4,100,109 |
| | | 187,750,059 |
| | | |
| Total Common Stocks (Cost $385,207,597) | | 427,911,029 |
| | | |
| | | |
| | PRINCIPAL AMOUNT ($) | VALUE ($) |
| HIGH SOCIAL IMPACT INVESTMENTS - 0.4% | | |
| Calvert Impact Capital, Inc., Community Investment Notes, 1.50%, 12/15/19 (4)(5) | 1,000,000 | 962,350 |
| ImpactAssets Inc., Global Sustainable Agriculture Notes, 2.50%, 11/3/20 (3)(5)(6) | 284,000 | 266,676 |
| ImpactAssets Inc., Microfinance Plus Notes, 2.40%, 11/3/20 (3)(5)(6) | 366,000 | 334,890 |
| | | |
| Total High Social Impact Investments (Cost $1,650,000) | | 1,563,916 |
www.calvert.com CALVERT GLOBAL ENERGY SOLUTIONS AND GLOBAL WATER FUNDS ANNUAL REPORT 21
|
| | |
| | SHARES | VALUE ($) |
| SHORT TERM INVESTMENT OF CASH COLLATERAL FOR SECURITIES LOANED - 2.3% | |
| State Street Navigator Securities Lending Government Money Market Portfolio, 2.16% | 9,746,202 | 9,746,202 |
| | | |
| Total Short Term Investment of Cash Collateral for Securities Loaned (Cost $9,746,202) | | 9,746,202 |
| | | |
| | | |
| TOTAL INVESTMENTS (Cost $396,603,799) - 102.0% | | 439,221,147 |
| Other assets and liabilities, net - (2.0%) | | (8,526,964) |
NET ASSETS - 100.0% | | 430,694,183 |
|
|
| NOTES TO SCHEDULE OF INVESTMENTS |
| (1) All or a portion of this security was on loan at September 30, 2018. The aggregate market value of securities on loan at September 30, 2018 was $27,725,623. |
| (2) Non-income producing security. |
| (3) For fair value measurement disclosure purposes, security is categorized as Level 3 (see Note 1A). |
| (4) Affiliated company (see Note 7). |
| (5) Restricted security. Total market value of restricted securities amounts to $1,563,916, which represents 0.4% of the net assets of the Fund as of September 30, 2018. |
| (6) Notes carry an interest rate that varies by period and is contingent on the performance of the underlying portfolio of loans to borrowers. The coupon rate shown represents the rate in effect at September 30, 2018. |
|
| | |
| Abbreviations: |
| PFC Shares: | Preference Shares | |
|
|
| At September 30, 2018, the concentration of the Fund’s investments in the various sectors, determined as a percentage of total investments, was as follows: |
|
| | |
| ECONOMIC SECTORS | % OF TOTAL INVESTMENTS* |
| Industrials | 40.9 | % |
| Utilities | 29.5 | % |
| Materials | 8.9 | % |
| Consumer Discretionary | 6.0 | % |
| Information Technology | 5.6 | % |
| Consumer Staples | 4.6 | % |
| Health Care | 4.1 | % |
| High Social Impact Investments | 0.4 | % |
| Total | 100.0 | % |
| * Does not include Short Term Investment of Cash Collateral for Securities Loaned. | |
|
| | |
| RESTRICTED SECURITIES | ACQUISITION
DATES | COST ($) |
| Calvert Impact Capital, Inc., Community Investment Notes, 1.50%, 12/15/19 | 12/15/16 | 1,000,000 |
| ImpactAssets Inc., Global Sustainable Agriculture Notes, 2.50%, 11/3/20 | 11/13/15 | 284,000 |
| ImpactAssets Inc., Microfinance Plus Notes, 2.40%, 11/3/20 | 11/13/15 | 366,000 |
| See notes to financial statements. | | |
22 www.calvert.com CALVERT GLOBAL ENERGY SOLUTIONS AND GLOBAL WATER FUNDS ANNUAL REPORT
CALVERT GLOBAL ENERGY SOLUTIONS FUND
STATEMENT OF ASSETS AND LIABILITIES
SEPTEMBER 30, 2018
|
| | | |
| ASSETS | |
Investments in securities of unaffiliated issuers, at value (identified cost $83,174,704) - including $11,382,309 of securities on loan |
| $85,998,804 |
|
| Investments in securities of affiliated issuers, at value (identified cost $1,800,000) | 1,732,230 |
|
| Cash | 57 |
|
| Cash denominated in foreign currency, at value (cost $66,750) | 66,823 |
|
| Receivable for investments sold | 62,055 |
|
| Receivable for capital shares sold | 90,719 |
|
| Dividends and interest receivable | 118,350 |
|
| Interest receivable - affiliated | 21,750 |
|
| Securities lending income receivable | 20,517 |
|
| Tax reclaims receivable | 61,086 |
|
| Receivable from affiliate | 32,223 |
|
| Directors’ deferred compensation plan | 45,926 |
|
| Other assets | 1,786 |
|
| Total assets | 88,252,326 |
|
| | |
| LIABILITIES | |
| Payable for capital shares redeemed | 48,500 |
|
| Payable for foreign capital gains taxes | 38,513 |
|
| Deposits for securities loaned | 7,217,580 |
|
| Demand note payable | 23,970 |
|
| Payable to affiliates: | |
| Investment advisory fee | 50,414 |
|
| Administrative fee | 8,066 |
|
| Distribution and service fees | 19,113 |
|
| Sub-transfer agency fee | 9,195 |
|
| Directors’ deferred compensation plan | 45,926 |
|
| Accrued expenses | 114,671 |
|
| Total liabilities | 7,575,948 |
|
| NET ASSETS |
| $80,676,378 |
|
| | |
| NET ASSETS CONSIST OF: | |
| Paid-in capital applicable to common stock | |
| (75,000,000 shares per class of $0.01 par value authorized) |
| $196,814,936 |
|
| Accumulated loss | (116,138,558) |
|
| Total |
| $80,676,378 |
|
| | |
| NET ASSET VALUE PER SHARE | |
| Class A (based on net assets of $51,502,281 and 7,405,545 shares outstanding) |
| $6.95 |
|
| Class C (based on net assets of $9,995,948 and 1,537,534 shares outstanding) |
| $6.50 |
|
| Class I (based on net assets of $19,178,149 and 2,712,144 shares outstanding) |
| $7.07 |
|
| | |
| OFFERING PRICE PER SHARE* | |
| Class A (100/95.25 of net asset value per share) |
| $7.30 |
|
| * On sales of $50,000 or more, the offering price of Class A shares is reduced. | |
| See notes to financial statements. | |
www.calvert.com CALVERT GLOBAL ENERGY SOLUTIONS AND GLOBAL WATER FUNDS ANNUAL REPORT 23
CALVERT GLOBAL WATER FUND
STATEMENT OF ASSETS AND LIABILITIES
SEPTEMBER 30, 2018
|
| | | |
| ASSETS | |
Investments in securities of unaffiliated issuers, at value (identified cost $395,603,799) - including $27,725,623 of securities on loan |
| $438,258,797 |
|
| Investments in securities of affiliated issuers, at value (identified cost $1,000,000) | 962,350 |
|
| Cash | 158 |
|
| Cash denominated in foreign currency, at value (cost $165,421) | 165,104 |
|
| Receivable for investments sold | 1,091,169 |
|
| Receivable for capital shares sold | 364,639 |
|
| Dividends and interest receivable | 847,448 |
|
| Interest receivable - affiliated | 12,083 |
|
| Securities lending income receivable | 20,230 |
|
| Tax reclaims receivable | 241,136 |
|
| Receivable from affiliate | 61,844 |
|
| Directors’ deferred compensation plan | 238,367 |
|
| Other assets | 9,481 |
|
| Total assets | 442,272,806 |
|
| | |
| LIABILITIES | |
| Payable for capital shares redeemed | 828,436 |
|
| Deposits for securities loaned | 9,746,202 |
|
| Demand note payable | 55,175 |
|
| Payable to affiliates: | |
| Investment advisory fee | 260,870 |
|
| Administrative fee | 42,959 |
|
| Distribution and service fees | 90,909 |
|
| Sub-transfer agency fee | 16,758 |
|
| Directors’ deferred compensation plan | 238,367 |
|
| Accrued expenses | 298,947 |
|
| Total liabilities | 11,578,623 |
|
| NET ASSETS |
| $430,694,183 |
|
| | |
| NET ASSETS CONSIST OF: | |
| Paid-in capital applicable to common stock | |
| (75,000,000 shares per class of $0.01 par value authorized) |
| $430,124,767 |
|
| Distributable earnings | 569,416 |
|
| Total |
| $430,694,183 |
|
| | |
| NET ASSET VALUE PER SHARE | |
| Class A (based on net assets of $201,243,147 and 10,062,564 shares outstanding) |
| $20.00 |
|
| Class C (based on net assets of $58,454,692 and 3,189,905 shares outstanding) |
| $18.32 |
|
| Class I (based on net assets of $170,996,344 and 8,484,944 shares outstanding) |
| $20.15 |
|
| | |
| OFFERING PRICE PER SHARE* | |
| Class A (100/95.25 of net asset value per share) |
| $21.00 |
|
| * On sales of $50,000 or more, the offering price of Class A shares is reduced. | |
| See notes to financial statements. | |
24 www.calvert.com CALVERT GLOBAL ENERGY SOLUTIONS AND GLOBAL WATER FUNDS ANNUAL REPORT
STATEMENTS OF OPERATIONS
YEAR ENDED SEPTEMBER 30, 2018
|
| | | | | | | |
| INVESTMENT INCOME | Calvert Global Energy Solutions Fund | | Calvert Global Water Fund |
| Dividend income (net of foreign taxes withheld of $162,191 and $842,960, respectively) |
| $1,836,570 |
| |
| $10,669,469 |
|
| Interest income | 2,783 |
| | 16,233 |
|
| Interest income - affiliated issuers | 27,000 |
| | 15,000 |
|
| Securities lending income, net | 431,879 |
| | 411,084 |
|
| Total investment income | 2,298,232 |
| | 11,111,786 |
|
| | | | |
| EXPENSES | | | |
| Investment advisory fee | 650,445 |
| | 3,302,875 |
|
| Administrative fee | 104,038 |
| | 544,313 |
|
| Distribution and service fees: | | | |
| Class A | 142,468 |
| | 559,148 |
|
| Class C | 114,141 |
| | 647,274 |
|
| Directors’ fees and expenses | 4,319 |
| | 22,683 |
|
| Custodian fees | 76,821 |
| | 216,947 |
|
| Transfer agency fees and expenses | 239,565 |
| | 711,107 |
|
| Accounting fees | 35,321 |
| | 104,872 |
|
| Professional fees | 30,721 |
| | 78,494 |
|
| Registration fees | 56,500 |
| | 64,848 |
|
| Reports to shareholders | 24,587 |
| | 91,781 |
|
| Miscellaneous | 23,086 |
| | 50,209 |
|
| Total expenses | 1,502,012 |
| | 6,394,551 |
|
| Waiver and/or reimbursement of expenses by affiliates | (364,356) |
| | (638,172) |
|
| Reimbursement of expenses-other | (1,786) |
| | (9,481) |
|
| Net expenses | 1,135,870 |
| | 5,746,898 |
|
| Net investment income | 1,162,362 |
| | 5,364,888 |
|
| | | | |
| REALIZED AND UNREALIZED GAIN (LOSS) | | | |
| Net realized gain (loss) on: | | | |
| Investment securities - unaffiliated issuers (net of foreign capital gains taxes of $14,613 and $34,263, respectively) | 4,032,121 |
| | 29,680,182 |
|
| Foreign currency transactions | (22,169) |
| | (161,090) |
|
| | 4,009,952 |
| | 29,519,092 |
|
| | | | |
| Net change in unrealized appreciation (depreciation) on: | | | |
| Investment securities - unaffiliated issuers (including net increase in payable for foreign capital gains taxes of $16,462 and $0, respectively) | (7,368,414) |
| | (28,802,263) |
|
| Investment securities - affiliated issuers | 16,686 |
| | 9,270 |
|
| Foreign currency | (2,251) |
| | (13,315) |
|
| | (7,353,979) |
| | (28,806,308) |
|
| | | | |
| Net realized and unrealized gain (loss) | (3,344,027) |
| | 712,784 |
|
| | | | |
| Net increase (decrease) in net assets resulting from operations |
| ($2,181,665 | ) | |
| $6,077,672 |
|
| See notes to financial statements. |
www.calvert.com CALVERT GLOBAL ENERGY SOLUTIONS AND GLOBAL WATER FUNDS ANNUAL REPORT 25
CALVERT GLOBAL ENERGY SOLUTIONS FUND
STATEMENTS OF CHANGES IN NET ASSETS
|
| | | | | | | |
| INCREASE (DECREASE) IN NET ASSETS | Year Ended
September 30, 2018 | | Year Ended
September 30, 2017 |
| Operations: | | | |
| Net investment income |
| $1,162,362 |
| |
| $1,026,722 |
|
| Net realized gain (loss) | 4,009,952 |
| | (2,195,855) |
|
| Net change in unrealized appreciation (depreciation) | (7,353,979) |
| | 13,557,001 |
|
| Net increase (decrease) in net assets resulting from operations | (2,181,665) |
| | 12,387,868 |
|
| | | | |
Distributions to shareholders: (1) | | | |
| Class A shares | (715,579) |
| | (595,985) |
|
| Class C shares | (66,958) |
| | (23,199) |
|
| Class I shares | (227,800) |
| | (52,798) |
|
| Class Y shares | — |
| | (96,007) |
|
| Total distributions to shareholders | (1,010,337) |
| | (767,989) |
|
| | | | |
| Capital share transactions: | | | |
| Class A shares | (5,274,938) |
| | (19,226,700) |
|
| Class C shares | (1,542,856) |
| | (2,965,664) |
|
| Class I shares | 14,706,189 |
| | 3,692,575 |
|
Class Y shares (2) | (10,378,245) |
| | (1,938,646) |
|
| Net decrease in net assets from capital share transactions | (2,489,850) |
| | (20,438,435) |
|
| | | | |
| TOTAL DECREASE IN NET ASSETS | (5,681,852) |
| | (8,818,556) |
|
| | | | |
| | | | |
| NET ASSETS | | | |
| Beginning of year | 86,358,230 |
| | 95,176,786 |
|
| End of year |
| $80,676,378 |
| | $86,358,230(3) |
|
| | | | |
| | | | |
(1) For the year ended September 30, 2017, the source of distributions was from net investment income. |
(2) Effective December 8, 2017, Class Y shares of the Fund converted to Class I shares at net asset value. Thereafter, Class Y shares were terminated. |
(3) Includes accumulated undistributed net investment income of $518,591 at September 30, 2017. The requirement to disclose the corresponding amount as of September 30, 2018 was eliminated. |
| See notes to financial statements |
26 www.calvert.com CALVERT GLOBAL ENERGY SOLUTIONS AND GLOBAL WATER FUNDS ANNUAL REPORT
CALVERT GLOBAL WATER FUND
STATEMENTS OF CHANGES IN NET ASSETS
|
| | | | | | | |
| INCREASE (DECREASE) IN NET ASSETS | Year Ended
September 30, 2018 | | Year Ended
September 30, 2017 |
| Operations: | | | |
| Net investment income |
| $5,364,888 |
| |
| $4,913,933 |
|
| Net realized gain | 29,519,092 |
| | 13,200,094 |
|
| Net change in unrealized appreciation (depreciation) | (28,806,308) |
| | 33,827,162 |
|
| Net increase in net assets resulting from operations | 6,077,672 |
| | 51,941,189 |
|
| | | | |
| Distributions to shareholders: | | | |
| Class A shares | (2,210,996) |
| | — |
|
| Class C shares | (224,953) |
| | — |
|
| Class I shares | (2,126,296) |
| | — |
|
| Total distributions to shareholders | (4,562,245) |
| | — |
|
| | | | |
| Capital share transactions: | | | |
| Class A shares | (35,083,220) |
| | (71,667,884) |
|
| Class C shares | (8,854,235) |
| | (11,643,515) |
|
| Class I shares | 158,225,312 |
| | 9,439,487 |
|
Class Y shares (1) | (142,537,131) |
| | 39,991,068 |
|
| Net decrease in net assets from capital share transactions | (28,249,274) |
| | (33,880,844) |
|
| | | | |
| TOTAL INCREASE (DECREASE) IN NET ASSETS | (26,733,847) |
| | 18,060,345 |
|
| | | | |
| | | | |
| NET ASSETS | | | |
| Beginning of year | 457,428,030 |
| | 439,367,685 |
|
| End of year |
| $430,694,183 |
| | $457,428,030(2) |
|
| | | | |
| | | | |
(1) Effective December 8, 2017, Class Y shares of the Fund converted to Class I shares at net asset value. Thereafter, Class Y shares were terminated. |
(2) Includes accumulated undistributed net investment income of $4,322,151 at September 30, 2017. The requirement to disclose the corresponding amount as of September 30, 2018 was eliminated. |
| See notes to financial statements. |
www.calvert.com CALVERT GLOBAL ENERGY SOLUTIONS AND GLOBAL WATER FUNDS ANNUAL REPORT 27
CALVERT GLOBAL ENERGY SOLUTIONS FUND
FINANCIAL HIGHLIGHTS
|
| | | | | | | | | | | | | | | |
| | Year Ended September 30, |
| CLASS A SHARES | 2018 | | 2017 | | 2016 | | 2015 | | 2014 | |
| Net asset value, beginning | $7.23 | | $6.23 | | $5.76 | | $7.10 | | $6.94 | |
| Income from investment operations: | | | | | | | | | | |
Net investment income (1) | 0.10 |
| | 0.08 |
| | 0.08 |
| (2) | 0.01 |
| | — |
| (3) |
| Net realized and unrealized gain (loss) | (0.29) |
| | 0.98 |
| | 0.40 |
| | (1.35) |
| | 0.16 |
| |
| Total from investment operations | (0.19) |
| | 1.06 |
| | 0.48 |
| | (1.34) |
| | 0.16 |
| |
| Distributions from: | | | | | | | | | | |
| Net investment income | (0.09) |
| | (0.06) |
| | (0.01) |
| | — |
| | — |
| |
| Total distributions | (0.09) |
| | (0.06) |
| | (0.01) |
| | — |
| | — |
| |
| Total increase (decrease) in net asset value | (0.28) |
| | 1.00 |
| | 0.47 |
| | (1.34) |
| | 0.16 |
| |
| Net asset value, ending | $6.95 | | $7.23 | | $6.23 | | $5.76 | | $7.10 | |
Total return (4) | (2.73 | %) | | 17.28 | % | | 8.38 | % | | (18.87 | %) | | 2.31 | % | |
Ratios to average net assets: (5) | | | | | | | | | | |
| Total expenses | 1.69 | % | | 1.94 | % | | 2.06 | % | | 2.21 | % | | 2.13 | % | |
| Net expenses | 1.28 | % | | 1.38 | % | | 1.85 | % | | 1.85 | % | | 1.85 | % | |
| Net investment income (loss) | 1.34 | % | | 1.26 | % | | 1.33 | % | (2) | 0.17 | % | | (0.05 | %) | |
| Portfolio turnover | 38 | % | | 133 | % | | 89 | % | | 99 | % | | 62 | % | |
| Net assets, ending (in thousands) | $51,502 | | $58,695 | | $70,317 | | $59,589 | | $75,155 | |
| | | | | | | | | | | |
(1) Computed using average shares outstanding. |
(2) Amount includes a non-recurring refund for overbilling of prior years’ custody out-of-pocket fees. This amounted to $0.005 per share and 0.08% of average net assets. |
(3) Amount is less than $0.005. |
(4) Returns are historical and are calculated by determining the percentage change in net asset value with all distributions reinvested and do not reflect the effect of sales charges, if any. |
(5) Total expenses do not reflect amounts reimbursed and/or waived by the adviser and certain of its affiliates, if applicable. Net expenses are net of all reductions and represent the net expenses paid by the Fund. |
| See notes to financial statements. |
28 www.calvert.com CALVERT GLOBAL ENERGY SOLUTIONS AND GLOBAL WATER FUNDS ANNUAL REPORT
CALVERT GLOBAL ENERGY SOLUTIONS FUND
FINANCIAL HIGHLIGHTS
|
| | | | | | | | | | | | | | | |
| | Year Ended September 30, |
| CLASS C SHARES | 2018 | | 2017 | | 2016 | | 2015 | | 2014 | |
| Net asset value, beginning | $6.76 | | $5.82 | | $5.42 | | $6.75 | | $6.66 | |
| Income from investment operations: | | | | | | | | | | |
Net investment income (loss) (1) | 0.04 |
| | 0.03 |
| | 0.03 |
| (2) | (0.05) |
| | (0.07) |
| |
| Net realized and unrealized gain (loss) | (0.26) |
| | 0.92 |
| | 0.37 |
| | (1.28) |
| | 0.16 |
| |
| Total from investment operations | (0.22) |
| | 0.95 |
| | 0.40 |
| | (1.33) |
| | 0.09 |
| |
| Distributions from: | | | | | | | | | | |
| Net investment income | (0.04) |
| | (0.01 | ) | | — |
| | — |
| | — |
| |
| Total distributions | (0.04) |
| | (0.01 | ) | | — |
| | — |
| | — |
| |
| Total increase (decrease) in net asset value | (0.26) |
| | 0.94 |
| | 0.40 |
| | (1.33) |
| | 0.09 |
| |
| Net asset value, ending | $6.50 | | $6.76 | | $5.82 | | $5.42 | | $6.75 | |
Total return (3) | (3.31 | %) | | 16.38 | % | | 7.38 | % | | (19.70 | %) | | 1.35 | % | |
Ratios to average net assets: (4) | | | | | | | | | | |
| Total expenses | 2.44 | % | | 2.78 | % | | 2.87 | % | | 2.96 | % | | 2.93 | % | |
| Net expenses | 2.03 | % | | 2.13 | % | | 2.69 | % | | 2.85 | % | | 2.85 | % | |
| Net investment income (loss) | 0.59 | % | | 0.55 | % | | 0.45 | % | (2) | (0.84 | %) | | (1.04 | %) | |
| Portfolio turnover | 38 | % | | 133 | % | | 89 | % | | 99 | % | | 62 | % | |
| Net assets, ending (in thousands) | $9,996 | | $11,938 | | $13,213 | | $13,663 | | $17,256 | |
| | | | | | | | | | | |
(1) Computed using average shares outstanding. |
(2) Amount includes a non-recurring refund for overbilling of prior years’ custody out-of-pocket fees. This amounted to $0.004 per share and 0.07% of average net assets. |
(3) Returns are historical and are calculated by determining the percentage change in net asset value with all distributions reinvested and do not reflect the effect of sales charges, if any. |
(4) Total expenses do not reflect amounts reimbursed and/or waived by the adviser and certain of its affiliates, if applicable. Net expenses are net of all reductions and represent the net expenses paid by the Fund. |
| See notes to financial statements. |
www.calvert.com CALVERT GLOBAL ENERGY SOLUTIONS AND GLOBAL WATER FUNDS ANNUAL REPORT 29
CALVERT GLOBAL ENERGY SOLUTIONS FUND
FINANCIAL HIGHLIGHTS
|
| | | | | | | | | | | | | | | |
| | Year Ended September 30, |
| CLASS I SHARES | 2018 | | 2017 | | 2016 | | 2015 | | 2014 | |
| Net asset value, beginning | $7.34 | | $6.35 | | $5.88 | | $7.21 | | $7.02 | |
| Income from investment operations: | | | | | | | | | | |
Net investment income (1) | 0.15 |
| | 0.13 |
| | 0.11 |
| (2) | 0.06 |
| | 0.03 |
| |
| Net realized and unrealized gain (loss) | (0.31) |
| | 0.97 |
| | 0.41 |
| | (1.39) |
| | 0.16 |
| |
| Total from investment operations | (0.16) |
| | 1.10 |
| | 0.52 |
| | (1.33) |
| | 0.19 |
| |
| Distributions from: | | | | | | | | | | |
| Net investment income | (0.11) |
| | (0.11) |
| | (0.05) |
| | — |
| | — |
| |
| Total distributions | (0.11) |
| | (0.11) |
| | (0.05) |
| | — |
| | — |
| |
| Total increase (decrease) in net asset value | (0.27) |
| | 0.99 |
| | 0.47 |
| | (1.33) |
| | 0.19 |
| |
| Net asset value, ending | $7.07 | | $7.34 | | $6.35 | | $5.88 | | $7.21 | |
Total return (3) | (2.33 | %) | | 17.66 | % | | 8.76 | % | | (18.45 | %) | | 2.71 | % | |
Ratios to average net assets: (4) | | | | | | | | | | |
| Total expenses | 1.43 | % | | 1.66 | % | | 3.83 | % | | 5.63 | % | | 2.88 | % | |
| Net expenses | 0.93 | % | | 0.97 | % | | 1.40 | % | | 1.40 | % | | 1.40 | % | |
| Net investment income | 2.00 | % | | 1.99 | % | | 1.74 | % | (2) | 0.82 | % | | 0.34 | % | |
| Portfolio turnover | 38 | % | | 133 | % | | 89 | % | | 99 | % | | 62 | % | |
| Net assets, ending (in thousands) | $19,178 | | $5,503 | | $910 | | $386 | | $180 | |
| | | | | | | | | | | |
(1) Computed using average shares outstanding. |
(2) Amount includes a non-recurring refund for overbilling of prior years’ custody out-of-pocket fees. This amounted to $0.006 per share and 0.09% of average net assets. |
(3) Returns are historical and are calculated by determining the percentage change in net asset value with all distributions reinvested and do not reflect the effect of sales charges, if any. |
(4) Total expenses do not reflect amounts reimbursed and/or waived by the adviser and certain of its affiliates, if applicable. Net expenses are net of all reductions and represent the net expenses paid by the Fund. |
| See notes to financial statements. |
30 www.calvert.com CALVERT GLOBAL ENERGY SOLUTIONS AND GLOBAL WATER FUNDS ANNUAL REPORT
CALVERT GLOBAL WATER FUND
FINANCIAL HIGHLIGHTS
|
| | | | | | | | | | | | | | | |
| | Year Ended September 30, |
| CLASS A SHARES | 2018 | | 2017 | | 2016 | | 2015 | | 2014 | |
| Net asset value, beginning | $19.92 | | $17.71 | | $14.87 | | $19.55 | | $19.12 | |
| Income from investment operations: | | | | | | | | | | |
Net investment income (loss) (1) | 0.23 |
| | 0.20 |
| | 0.03 |
| (2) | (0.02) |
| | 0.01 |
| |
| Net realized and unrealized gain (loss) | 0.04 |
| | 2.01 |
| | 2.81 |
| | (3.40) |
| | 1.77 |
| |
| Total from investment operations | 0.27 |
| | 2.21 |
| | 2.84 |
| | (3.42) |
| | 1.78 |
| |
| Distributions from: | | | | | | | | | | |
| Net investment income | (0.19) |
| | — |
| | — |
| (3) | — |
| | (0.01) |
| |
| Net realized gain | — |
| | — |
| | — |
| | (1.26) |
| | (1.34) |
| |
| Total distributions | (0.19) |
| | — |
| | — |
| (3) | (1.26) |
| | (1.35) |
| |
| Total increase (decrease) in net asset value | 0.08 |
| | 2.21 |
| | 2.84 |
| | (4.68) |
| | 0.43 |
| |
| Net asset value, ending | $20.00 | | $19.92 | | $17.71 | | $14.87 | | $19.55 | |
Total return (4) | 1.34 | % | | 12.48 | % | | 19.13 | % | | (18.35 | %) | | 9.69 | % | |
Ratios to average net assets: (5) | | | | | | | | | | |
| Total expenses | 1.39 | % | | 1.46 | % | | 1.63 | % | | 1.82 | % | | 1.85 | % | |
| Net expenses | 1.28 | % | | 1.28 | % | | 1.51 | % | | 1.82 | % | | 1.85 | % | |
| Net investment income (loss) | 1.14 | % | | 1.11 | % | | 0.22 | % | (2) | (0.09 | %) | | 0.05 | % | |
| Portfolio turnover | 40 | % | | 34 | % | | 103 | % | | 110 | % | | 77 | % | |
| Net assets, ending (in thousands) | $201,243 | | $235,266 | | $278,517 | | $295,337 | | $384,697 | |
| | | | | | | | | | | |
(1) Computed using average shares outstanding. |
(2) Amount includes a non-recurring refund for overbilling of prior years’ custody out-of-pocket fees. This amounted to $0.002 per share and 0.01% of average net assets. |
(3) Amount is less than $0.005. |
(4) Returns are historical and are calculated by determining the percentage change in net asset value with all distributions reinvested and do not reflect the effect of sales charges, if any. |
(5) Total expenses do not reflect amounts reimbursed and/or waived by the adviser and certain of its affiliates, if applicable. Net expenses are net of all reductions and represent the net expenses paid by the Fund. |
| See notes to financial statements. |
www.calvert.com CALVERT GLOBAL ENERGY SOLUTIONS AND GLOBAL WATER FUNDS ANNUAL REPORT 31
CALVERT GLOBAL WATER FUND
FINANCIAL HIGHLIGHTS
|
| | | | | | | | | | | | | | | |
| | Year Ended September 30, |
| CLASS C SHARES | 2018 | | 2017 | | 2016 | | 2015 | | 2014 | |
| Net asset value, beginning | $18.28 | | $16.37 | | $13.84 | | $18.41 | | $18.20 | |
| Income from investment operations: | | | | | | | | | | |
Net investment income (loss) (1) | 0.07 |
| | 0.07 |
| | (0.08) |
| (2) | (0.13) |
| | (0.12) |
| |
| Net realized and unrealized gain (loss) | 0.03 |
| | 1.84 |
| | 2.61 |
| | (3.18) |
| | 1.68 |
| |
| Total from investment operations | 0.10 |
| | 1.91 |
| | 2.53 |
| | (3.31) |
| | 1.56 |
| |
| Distributions from: | | | | | | | | | | |
| Net investment income | (0.06) |
| | — |
| | — |
| | — |
| | (0.01) |
| |
| Net realized gain | — |
| | — |
| | — |
| | (1.26) |
| | (1.34) |
| |
| Total distributions | (0.06) |
| | — |
| | — |
| | (1.26) |
| | (1.35) |
| |
| Total increase (decrease) in net asset value | 0.04 |
| | 1.91 |
| | 2.53 |
| | (4.57) |
| | 0.21 |
| |
| Net asset value, ending | $18.32 | | $18.28 | | $16.37 | | $13.84 | | $18.41 | |
Total return (3) | 0.61 | % | | 11.67 | % | | 18.28 | % | | (18.92 | %) | | 8.93 | % | |
Ratios to average net assets: (4) | | | | | | | | | | |
| Total expenses | 2.14 | % | | 2.17 | % | | 2.35 | % | | 2.53 | % | | 2.53 | % | |
| Net expenses | 2.03 | % | | 2.03 | % | | 2.25 | % | | 2.53 | % | | 2.53 | % | |
| Net investment income (loss) | 0.40 | % | | 0.41 | % | | (0.52 | %) | (2) | (0.79 | %) | | (0.65 | %) | |
| Portfolio turnover | 40 | % | | 34 | % | | 103 | % | | 110 | % | | 77 | % | |
| Net assets, ending (in thousands) | $58,455 | | $67,096 | | $71,334 | | $75,061 | | $94,985 | |
| | | | | | | | | | | |
(1) Computed using average shares outstanding. |
(2) Amount includes a non-recurring refund for overbilling of prior years’ custody out-of-pocket fees. This amounted to $0.002 per share and 0.01% of average net assets. |
(3) Returns are historical and are calculated by determining the percentage change in net asset value with all distributions reinvested and do not reflect the effect of sales charges, if any. |
(4) Total expenses do not reflect amounts reimbursed and/or waived by the adviser and certain of its affiliates, if applicable. Net expenses are net of all reductions and represent the net expenses paid by the Fund. |
| See notes to financial statements. |
32 www.calvert.com CALVERT GLOBAL ENERGY SOLUTIONS AND GLOBAL WATER FUNDS ANNUAL REPORT
CALVERT GLOBAL WATER FUND
FINANCIAL HIGHLIGHTS
|
| | | | | | | | | | | | | | | |
| | Year Ended September 30, | | Period Ended September 30, 2014 (1) | |
| CLASS I SHARES | 2018 | | 2017 | | 2016 | | 2015 | | |
| Net asset value, beginning | $20.08 | | $17.79 | | $15.02 | | $19.64 | | $18.99 | |
| Income from investment operations: | | | | | | | | | | |
Net investment income (2) | 0.36 |
| | 0.30 |
| | 0.13 |
| (3) | 0.06 |
| | 0.04 |
| |
| Net realized and unrealized gain (loss) | (0.02) |
| | 1.99 |
| | 2.80 |
| | (3.42) |
| | 0.61 |
| |
| Total from investment operations | 0.34 |
| | 2.29 |
| | 2.93 |
| | (3.36) |
| | 0.65 |
| |
| Distributions from: | | | | | | | | | | |
| Net investment income | (0.27) |
| | — |
| | (0.16) |
| | — |
| | — |
| |
| Net realized gain | — |
| | — |
| | — |
| | (1.26) |
| | — |
| |
| Total distributions | (0.27) |
| | — |
| | (0.16) |
| | (1.26) |
| | — |
| |
| Total increase (decrease) in net asset value | 0.07 |
| | 2.29 |
| | 2.77 |
| | (4.62) |
| | 0.65 |
| |
| Net asset value, ending | $20.15 | | $20.08 | | $17.79 | | $15.02 | | $19.64 | |
Total return (4) | 1.68 | % | | 12.87 | % | | 19.68 | % | | (17.93 | %) | | 3.42 | % | (5) |
Ratios to average net assets: (6) | | | | | | | | | | |
| Total expenses | 1.14 | % | | 1.12 | % | | 1.56 | % | | 3.89 | % | | 4.85 | % | (7) |
| Net expenses | 0.93 | % | | 0.93 | % | | 1.08 | % | | 1.29 | % | | 1.29 | % | (7) |
| Net investment income | 1.78 | % | | 1.61 | % | | 0.80 | % | (3) | 0.32 | % | | 0.24 | % | (7) |
| Portfolio turnover | 40 | % | | 34 | % | | 103 | % | | 110 | % | | 77 | % | (5) |
| Net assets, ending (in thousands) | $170,996 | | $16,094 | | $4,637 | | $779 | | $1,066 | |
| | | | | | | | | | | |
(1) From January 31, 2014 inception. |
(2) Computed using average shares outstanding. |
(3) Amount includes a non-recurring refund for overbilling of prior years’ custody out-of-pocket fees. This amounted to $0.003 per share and 0.02% of average net assets. |
(4) Returns are historical and are calculated by determining the percentage change in net asset value with all distributions reinvested and do not reflect the effect of sales charges, if any. |
(5) Not annualized. |
(6) Total expenses do not reflect amounts reimbursed and/or waived by the adviser and certain of its affiliates, if applicable. Net expenses are net of all reductions and represent the net expenses paid by the Fund. |
(7) Annualized. |
| See notes to financial statements. |
www.calvert.com CALVERT GLOBAL ENERGY SOLUTIONS AND GLOBAL WATER FUNDS ANNUAL REPORT 33
NOTES TO FINANCIAL STATEMENTS
NOTE 1 — SIGNIFICANT ACCOUNTING POLICIES
Calvert Global Energy Solutions Fund (Global Energy Solutions) and Calvert Global Water Fund (Global Water) (each a Fund and collectively, the Funds) are diversified series of Calvert Impact Fund, Inc. (the Corporation). The Corporation is a Maryland corporation registered under the Investment Company Act of 1940, as amended (the 1940 Act), as an open-end management investment company. The investment objective of Global Energy Solutions is to seek to track the performance of the Calvert Global Energy Research Index. Global Energy Solutions primarily invests in equity securities of U.S. and non-U.S. companies whose main business is sustainable energy solutions or that are significantly involved in the sustainable energy solutions industry. The investment objective of Global Water is to seek to track the performance of the Calvert Global Water Research Index. Global Water invests in equity securities of U.S. and non-U.S. companies whose main business is in the water industry or that are significantly involved in water-related services or technologies.
Each Fund offers three classes of shares. Class A shares are generally sold subject to a sales charge imposed at time of purchase. A contingent deferred sales charge of 0.80% may apply to certain redemptions of Class A shares for accounts for which no sales charge was paid, if redeemed within one year of purchase. Class C shares are sold without a front-end sales charge, and with certain exceptions, are charged a contingent deferred sales charge of 1% on shares redeemed within one year of purchase. Class C shares are only available for purchase through a financial intermediary. Class I shares are sold at net asset value, are not subject to a sales charge and are sold only to certain eligible investors. Each Fund previously offered Class Y shares. At the close of business on December 8, 2017, Class Y shares were converted to Class I shares. Each class represents a pro rata interest in each Fund, but votes separately on class-specific matters and is subject to different expenses.
Each Fund applies the accounting and reporting guidance in the Financial Accounting Standards Board (FASB) Accounting Standards Codification Topic 946, Financial Services - Investment Companies (ASC 946). Subsequent events, if any, through the date that the financial statements were issued have been evaluated in the preparation of the financial statements.
A. Investment Valuation: Net asset value per share is determined every business day as of the close of the regular session of the New York Stock Exchange (generally 4:00 p.m. Eastern time). The Funds use independent pricing services approved by the Board of Directors (the Board) to value their investments wherever possible. Investments for which market quotations are not available or deemed not reliable are fair valued in good faith under the direction of the Board.
U.S. generally accepted accounting principles (U.S. GAAP) establishes a disclosure hierarchy that categorizes the inputs to valuation techniques used to value assets and liabilities at measurement date. These inputs are summarized in the three broad levels listed below:
Level 1 - quoted prices in active markets for identical securities
Level 2 - other significant observable inputs (including quoted prices for similar securities, interest rates, prepayment speeds, credit risk, etc.)
Level 3 - significant unobservable inputs (including a Fund’s own assumptions in determining the fair value of investments)
The inputs or methodologies used for valuing securities are not necessarily an indication of the risk associated with investing in those securities.
Valuation techniques used to value the Funds’ investments by major category are as follows:
Equity Securities. Equity securities (including warrants and rights) listed on a U.S. securities exchange generally are valued at the last sale or closing price as reported by an independent pricing service on the primary market or exchange on which they are traded and are categorized as Level 1 in the hierarchy. Equity securities listed on the NASDAQ Global or Global Select Market are valued at the NASDAQ official closing price and are categorized as Level 1 in the hierarchy. Unlisted or listed securities for which closing sales prices or closing quotations are not available are valued at the mean between the latest available bid and asked prices and are categorized as Level 2 in the hierarchy. The daily valuation of exchange-traded foreign securities generally is determined as of the close of trading on the principal exchange on which such securities trade. Events occurring after the close of trading on foreign exchanges may result in adjustments to the valuation of foreign securities to more accurately reflect their fair value as of the close of regular trading on the New York Stock Exchange. When valuing foreign equity securities that meet certain criteria, the Funds’ Board has approved the use of a fair value service that values such securities to reflect market trading that occurs after the close of the applicable foreign markets of comparable securities or other instruments that have a strong correlation to the fair-valued securities. Such securities are categorized as Level 2 in the hierarchy.
Debt Securities. Debt securities are generally valued on the basis of valuations provided by third party pricing services, as derived from such services’ pricing models. Inputs to the models may include, but are not limited to, reported trades, executable bid and asked prices, broker/dealer quotations, prices or yields of securities with similar characteristics, interest rates, anticipated
34 www.calvert.com CALVERT GLOBAL ENERGY SOLUTIONS AND GLOBAL WATER FUNDS ANNUAL REPORT
prepayments, benchmark curves or information pertaining to the issuer, as well as industry and economic events. Accordingly, debt securities are generally categorized as Level 2 in the hierarchy. Short-term debt securities of sufficient credit quality purchased with remaining maturities of sixty days or less for which a valuation from a third party pricing service is not readily available may be valued at amortized cost, which approximates fair value, and are categorized as Level 2 in the hierarchy.
Other Securities. Investments in registered investment companies (including money market funds) that do not trade on an exchange are valued at the net asset value per share on the valuation day and are categorized as Level 1 in the hierarchy.
Fair Valuation. If a market value cannot be determined for a security using the methodologies described above, or if, in the good faith opinion of the Funds’ adviser, the market value does not constitute a readily available market quotation, or if a significant event has occurred that would materially affect the value of the security, the security will be fair valued as determined in good faith by or at the direction of the Board in a manner that fairly reflects the security’s value, or the amount that the Funds might reasonably expect to receive for the security upon its current sale in the ordinary course. Each such determination is based on a consideration of relevant factors, which are likely to vary from one pricing context to another. These factors may include, but are not limited to, the type of security, the existence of any contractual restrictions on the security’s disposition, the price and extent of public trading in similar securities of the issuer or of comparable companies or entities, quotations or relevant information obtained from broker/dealers or other market participants, information obtained from the issuer, analysts, and/or the appropriate stock exchange (for exchange-traded securities), an analysis of the company’s or entity’s financial condition, and an evaluation of the forces that influence the issuer and the market(s) in which the security is purchased and sold.
The values assigned to fair value investments are based on available information and do not necessarily represent amounts that might ultimately be realized. Further, due to the inherent uncertainty of valuations of such investments, the fair values may differ significantly from the values that would have been used had an active market existed, and the differences could be material.
The following tables summarize the market value of each of the Funds’ holdings as of September 30, 2018, based on the inputs used to value them:
Global Energy Solutions
|
| | | | | | | | | | | | | |
| Assets | Level 1 | Level 2 | | Level 3(1) | Total |
| Common Stocks | | | | | |
| Brazil | $ | 437,080 |
| $ | — |
| | $ | — |
| $ | 437,080 |
|
| Canada | 2,440,792 |
| — |
| | — |
| 2,440,792 |
|
| China | 812,211 |
| 2,650,856 |
| | — |
| 3,463,067 |
|
| Spain | 514,253 |
| 3,159,261 |
| | — |
| 3,673,514 |
|
| Thailand | — |
| 1,011,319 |
| | 0 |
| 1,011,319 |
|
| United Kingdom | 974,833 |
| 4,687,943 |
| | — |
| 5,662,776 |
|
| United States | 22,347,078 |
| — |
| | — |
| 22,347,078 |
|
Other Countries(2) | — |
| 39,633,611 |
| | — |
| 39,633,611 |
|
| Total Common Stocks | $ | 27,526,247 |
| $ | 51,142,990 |
| (3) | $ | 0 |
| $ | 78,669,237 |
|
| High Social Impact Investments | — |
| 1,732,230 |
| | 111,987 |
| 1,844,217 |
|
| Short Term Investment of Cash Collateral for Securities Loaned | 7,217,580 |
| — |
| | — |
| 7,217,580 |
|
| Total Investments | $ | 34,743,827 |
| $ | 52,875,220 |
| | $ | 111,987 |
| $ | 87,731,034 |
|
| | | | | | |
(1) None of the unobservable inputs for Level 3 assets, individually or collectively, had a material impact on the Fund. |
(2) For further breakdown of equity securities by country, please refer to the Schedule of Investments. |
(3) Includes foreign equity securities whose values were adjusted to reflect market trading of comparable securities or other correlated instruments that occurred after the close of trading in their applicable foreign markets. |
Level 3 investments at the beginning and/or end of the period in relation to net assets were not significant and accordingly, a reconciliation of Level 3 assets for the year ended September 30, 2018 is not presented.
www.calvert.com CALVERT GLOBAL ENERGY SOLUTIONS AND GLOBAL WATER FUNDS ANNUAL REPORT 35
Global Water
|
| | | | | | | | | | | | | |
| Assets | Level 1 | Level 2 | | Level 3(1) | Total |
| Common Stocks | | | | | |
| Brazil | $ | 8,997,573 |
| $ | — |
| | $ | — |
| $ | 8,997,573 |
|
| Canada | 3,833,192 |
| — |
| | — |
| 3,833,192 |
|
| Chile | 9,406,234 |
| — |
| | — |
| 9,406,234 |
|
| Singapore | — |
| — |
| | 1,353,528 |
| 1,353,528 |
|
| United Kingdom | 8,456,325 |
| 33,263,101 |
| | — |
| 41,719,426 |
|
| United States | 187,750,059 |
| — |
| | — |
| 187,750,059 |
|
Other Countries(2) | — |
| 174,851,017 |
| | — |
| 174,851,017 |
|
| Total Common Stocks | $ | 218,443,383 |
| $ | 208,114,118 |
| (3) | $ | 1,353,528 |
| $ | 427,911,029 |
|
| High Social Impact Investments | — |
| 962,350 |
| | 601,566 |
| 1,563,916 |
|
| Short Term Investment of Cash Collateral for Securities Loaned | 9,746,202 |
| — |
| | — |
| 9,746,202 |
|
| Total Investments | $ | 228,189,585 |
| $ | 209,076,468 |
| | $ | 1,955,094 |
| $ | 439,221,147 |
|
| | | | | | |
(1) None of the unobservable inputs for Level 3 assets, individually or collectively, had a material impact on the Fund. |
(2) For further breakdown of equity securities by country, please refer to the Schedule of Investments. |
(3) Includes foreign equity securities whose values were adjusted to reflect market trading of comparable securities or other correlated instruments that occurred after the close of trading in their applicable foreign markets. |
Level 3 investments at the beginning and/or end of the period in relation to net assets were not significant and accordingly, a reconciliation of Level 3 assets for the year ended September 30, 2018 is not presented.
B. Investment Transactions and Income: Investment transactions for financial statement purposes are accounted for on trade date. Realized gains and losses are recorded on an identified cost basis and may include proceeds from litigation. Dividend income is recorded on the ex-dividend date for dividends received in cash and/or securities or, in the case of dividends on certain foreign securities, as soon as the Fund is informed of the ex-dividend date. Non-cash dividends are recorded at the fair value of the securities received. Withholding taxes on foreign dividends, if any, have been provided for in accordance with the Funds’ understanding of the applicable country’s tax rules and rates. In consideration of recent decisions rendered by European courts, Global Water has filed additional tax reclaims for previously withheld taxes on dividends earned in certain European Union countries. These filings are subject to various administrative and judicial proceedings within these countries. Due to the uncertainty as to the ultimate resolution of these proceedings, the likelihood of receipt of these reclaims, and the potential timing of payment, no amounts are reflected in the financial statements for such outstanding reclaims. Distributions received that represent a return of capital are recorded as a reduction of cost of investments. Distributions received that represent a capital gain are recorded as a realized gain. Interest income, which includes amortization of premium and accretion of discount on debt securities, is accrued as earned.
C. Share Class Accounting: Realized and unrealized gains and losses and net investment income and losses, other than class-specific expenses, are allocated daily to each class of shares based upon the relative net assets of each class to the total net assets of each Fund. Expenses arising in connection with a specific class are charged directly to that class.
D. Foreign Currency Transactions: The Funds’ accounting records are maintained in U.S. dollars. For valuation of assets and liabilities on each date of net asset value determination, foreign denominations are converted into U.S. dollars using the current exchange rate. Security transactions, income and expenses are translated at the prevailing rate of exchange on the date of the event. Recognized gains or losses on investment transactions attributable to changes in foreign currency exchange rates are recorded for financial statement purposes as net realized gains and losses on investments. That portion of unrealized gains and losses on investments that results from fluctuations in foreign currency exchange rates is not separately disclosed.
E. Restricted Securities: The Funds may invest in securities that are subject to legal or contractual restrictions on resale. Generally, these securities may only be sold publicly upon registration under the Securities Act of 1933 or in transactions exempt from such registration. Information regarding restricted securities (excluding Rule 144A securities) is included at the end of each Fund’s Schedule of Investments.
F. Distributions to Shareholders: Distributions to shareholders are recorded by the Funds on ex-dividend date. Dividends from net investment income and distributions from net realized capital gains, if any, are paid at least annually. Distributions are
36 www.calvert.com CALVERT GLOBAL ENERGY SOLUTIONS AND GLOBAL WATER FUNDS ANNUAL REPORT
determined in accordance with income tax regulations which may differ from U.S. GAAP; accordingly, periodic reclassifications are made within the Funds’ capital accounts to reflect income and gains available for distribution under income tax regulations.
G. Estimates: The preparation of financial statements in conformity with U.S. GAAP requires management to make estimates and assumptions that affect the reported amounts of assets and liabilities and disclosure of contingent assets and liabilities at the date of the financial statements and the reported amounts of increases and decreases in net assets from operations during the reporting period. Actual results could differ from those estimates.
H. Indemnifications: The Corporation’s By-Laws provide for indemnification for Directors or officers of the Corporation and certain other parties, to the fullest extent permitted by Maryland law and the 1940 Act, provided certain conditions are met. Additionally, in the normal course of business, each Fund enters into agreements with service providers that may contain indemnification clauses. Each Fund’s maximum exposure under these arrangements is unknown as this would involve future claims that may be made against each Fund that have not yet occurred.
I. Federal Income Taxes: No provision for federal income or excise tax is required since each Fund intends to continue to qualify as a regulated investment company under the Internal Revenue Code and to distribute substantially all of its taxable earnings.
In addition to the requirements of the Internal Revenue Code, each Fund may also be subject to local taxes on the recognition of capital gains in certain countries. In determining the daily net asset value, each Fund estimates the accrual for such taxes, if any, based on the unrealized appreciation on certain portfolio securities and the related tax rates. Taxes attributable to unrealized appreciation are included in the respective Funds’ change in unrealized appreciation (depreciation) on investments. Capital gains taxes on securities sold are included in the respective Funds’ net realized gain (loss) on investments.
Management has analyzed the Funds’ tax positions taken for all open federal income tax years and has concluded that no provision for federal income tax is required in the Funds’ financial statements. Each Fund’s federal tax return is subject to examination by the Internal Revenue Service for a period of three years from the date of filing.
NOTE 2 — RELATED PARTY TRANSACTIONS
The investment advisory fee is earned by Calvert Research and Management (CRM), a subsidiary of Eaton Vance Management (EVM), as compensation for investment advisory services rendered to each Fund. Pursuant to the investment advisory agreement, CRM receives a fee, payable monthly at the following annual rates of each respective Fund’s average daily net assets:
|
| | |
| GLOBAL ENERGY SOLUTIONS | 0.75 | % |
|
| | |
| GLOBAL WATER | |
| Up to and including $250 Million | 0.75 | % |
| Over $250 Million | 0.70 | % |
For the year ended September 30, 2018, the investment advisory fee for Global Energy Solutions and Global Water amounted to $650,445 and $3,302,875, respectively, or 0.75% and 0.73%, respectively, of the Funds’ average daily net assets.
CRM has agreed to reimburse the Funds’ operating expenses to the extent that total annual operating expenses (relating to ordinary operating expenses only and excluding expenses such as brokerage commissions, acquired fund fees and expenses of unaffiliated funds, interest expense, taxes or litigation expenses) exceed 1.28%, 2.03% and 0.93% for Class A, Class C and Class I, respectively, and prior to the close of business on December 8, 2017, 1.03% for Class Y, of such class’ average daily net assets for Global Energy Solutions and Global Water. The expense reimbursement agreements with CRM may be changed or terminated after January 31, 2019. For the year ended September 30, 2018, CRM waived or reimbursed expenses of $364,356 and $638,172 for Global Energy Solutions and Global Water, respectively.
The administrative fee is earned by CRM as compensation for administrative services rendered to the Funds. The fee is computed at an annual rate of 0.12% of each Fund’s average daily net assets attributable to Class A, Class C and Class I (and Class Y prior to the close of business on December 8, 2017) and is payable monthly. For the year ended September 30, 2018, CRM was paid administrative fees of $104,038 and $544,313 for Global Energy Solutions and Global Water, respectively.
Each Fund has in effect a distribution plan for Class A shares (Class A Plan) pursuant to Rule 12b-1 under the 1940 Act. Pursuant to the Class A Plan, each Fund pays Eaton Vance Distributors, Inc. (EVD), an affiliate of CRM and the Funds’ principal underwriter, a distribution and service fee of 0.25% per annum of its average daily net assets attributable to Class A for distribution services and facilities provided to the Funds by EVD, as well as for personal services and/or the maintenance of shareholder accounts. Each Fund also has in effect a distribution plan for Class C shares (Class C Plan) pursuant to Rule 12b-1 under the 1940 Act. Pursuant to the Class C Plan, each Fund pays EVD amounts equal to 0.75% per annum of its average daily
www.calvert.com CALVERT GLOBAL ENERGY SOLUTIONS AND GLOBAL WATER FUNDS ANNUAL REPORT 37
net assets attributable to Class C shares for providing ongoing distribution services and facilities to the Funds. In addition, pursuant to the Class C Plan, each Fund also makes payments of service fees to EVD, financial intermediaries and other persons in amounts equal to 0.25% per annum of its average daily net assets attributable to that class. Service fees paid or accrued are for personal services and/or the maintenance of shareholder accounts. Distribution and service fees for Global Energy Solutions and Global Water paid or accrued for the year ended September 30, 2018 amounted to $142,468 and $559,148, respectively, for Class A shares. Distribution and service fees for Global Energy Solutions and Global Water paid or accrued for the year ended September 30, 2018 amounted to $114,141 and $647,274, respectively, for Class C shares.
The Funds were informed that EVD received $13,102 and $59,773 for Global Energy Solutions and Global Water, respectively, as their portion of the sales charge on sales of Class A shares paid by Funds shareholders for the year ended September 30, 2018. The Funds were also informed that EVD received $1,012 and $7,859 for Global Energy Solutions and Global Water, respectively, of contingent deferred sales charges (CDSC) paid by Class C shareholders and no CDSC paid by Class A shareholders for the same period.
EVM provides sub-transfer agency and related services to the Funds pursuant to a Sub-Transfer Agency Support Services Agreement. For the year ended September 30, 2018, sub-transfer agency fees and expenses for Global Energy Solutions and Global Water incurred to EVM amounted to $50,484 and $96,023, respectively, and are included in transfer agency fees and expenses on the Statements of Operations.
Each Director of the Funds who is not an employee of CRM or its affiliates receives a fee of $3,000 for each Board meeting attended in person and $2,000 for each Board meeting attended by phone plus an annual fee of $52,000, and $1,500 for each Committee meeting attended in person and $1,000 for each Committee meeting attended by phone plus an annual Committee fee of $2,500. The Board chair receives an additional $10,000 annual retainer and Committee chairs receive an additional $6,000 annual retainer. Eligible Directors may participate in a Deferred Compensation Plan (the Plan). Amounts deferred under the Plan are treated as though equal dollar amounts had been invested in shares of the Funds or other Calvert funds selected by the Directors. The Funds purchase shares of the funds selected equal to the dollar amounts deferred under the Plan, resulting in an asset equal to the deferred compensation liability. Obligations of the Plan are paid solely from the Funds’ assets. Directors’ fees are allocated to each of the Calvert funds served. Salaries and fees of officers and Directors of the Funds who are employees of CRM or their affiliates are paid by CRM. In addition, an advisory council was established to aid the Board and CRM in advancing the cause of responsible investing through original scholarship and thought leadership. The advisory council consists of CRM’s Chief Executive Officer and four additional members. Each member (other than CRM’s Chief Executive Officer) receives annual compensation of $75,000, which is being reimbursed by Calvert Investment Management, Inc. (CIM), the Calvert funds’ former investment adviser and Ameritas Holding Company, CIM’s parent company, through the end of 2019. For the year ended September 30, 2018, Global Energy Solutions’ and Global Water’s allocated portion of such expense and reimbursement was $1,786 and $9,481, respectively, which are included in miscellaneous expense and reimbursement of expenses-other, respectively, on the Statements of Operations.
NOTE 3 — INVESTMENT ACTIVITY
During the year ended September 30, 2018, the cost of purchases and proceeds from sales of investments, other than short-term securities, were as follows:
|
| | | | | | |
| | GLOBAL ENERGY SOLUTIONS | GLOBAL WATER |
| Purchases |
| $32,710,494 |
|
| $178,261,657 |
|
| Sales |
| $34,748,469 |
|
| $206,489,727 |
|
NOTE 4 — DISTRIBUTIONS TO SHAREHOLDERS AND INCOME TAX INFORMATION
The tax character of distributions declared for the years ended September 30, 2018 and September 30, 2017 was as follows:
|
| | | | |
| | GLOBAL ENERGY SOLUTIONS | GLOBAL WATER |
| | Year Ended September 30, | Year Ended September 30, |
| | 2018 | 2017 | 2018 | 2017 |
| Ordinary income | $1,010,337 | $767,989 | $4,562,245 | $— |
During the year ended September 30, 2018, the following amounts were reclassified due to expired capital loss carryforwards for Global Energy Solutions and use of equalization accounting for Global Water. Tax equalization accounting allows the Funds to
38 www.calvert.com CALVERT GLOBAL ENERGY SOLUTIONS AND GLOBAL WATER FUNDS ANNUAL REPORT
treat as a distribution that portion of redemption proceeds representing a redeeming shareholder’s portion of undistributed taxable income and net capital gains. These reclassifications had no effect on the net assets or net asset value per share of the Funds.
|
| | | | | | |
| | GLOBAL ENERGY SOLUTIONS | GLOBAL WATER |
| Change in: | | |
| Paid-in capital |
| ($56,693,584 | ) |
| $468,526 |
|
| Distributable earnings (Accumulated loss) |
| $56,693,584 |
|
| ($468,526 | ) |
As of September 30, 2018, the components of distributable earnings (accumulated loss) on a tax basis were as follows:
|
| | | | | | |
| | GLOBAL ENERGY SOLUTIONS | GLOBAL WATER |
| Undistributed ordinary income |
| $1,115,268 |
|
| $4,460,662 |
|
| Capital loss carryforwards and deferred capital losses |
| ($119,383,804 | ) |
| ($44,457,838 | ) |
| Net unrealized appreciation |
| $2,129,978 |
|
| $40,566,592 |
|
At September 30, 2018, the Funds, for federal income tax purposes, had the following capital loss carryforwards and deferred capital losses which would reduce the respective Fund’s taxable income arising from future net realized gains on investment transactions, if any, to the extent permitted by the Internal Revenue Code, and thus would reduce the amount of distributions to shareholders, which would otherwise be necessary to relieve the Funds of any liability for federal income or excise tax. The deferred capital losses are treated as arising on the first day of the Funds’ next taxable year and retain the same short-term or long-term character as when originally deferred.
The amounts and expiration dates of the capital loss carryforwards, whose character is short-term, and the amounts of the deferred capital losses are as follows:
|
| | | | | | |
| Expiration Date | GLOBAL ENERGY SOLUTIONS | GLOBAL WATER |
| September 30, 2019 |
| $43,799,530 |
|
| $— |
|
| Total capital loss carryforwards |
| $43,799,530 |
|
| $— |
|
| Deferred capital losses: | | |
| Short-term |
| $596,204 |
|
| $9,764,030 |
|
| Long-term |
| $74,988,070 |
|
| $34,693,808 |
|
Under tax regulations, capital losses incurred in taxable years beginning after December 2010 can be carried forward to offset future capital gains for an unlimited period. These losses are required to be used prior to capital loss carryforwards, which carry an expiration date. As a result of this ordering rule, capital loss carryforwards may be more likely to expire unused.
The cost and unrealized appreciation (depreciation) of investments of the Funds at September 30, 2018, as determined on a federal income tax basis, were as follows:
|
| | | | | | |
| | GLOBAL ENERGY SOLUTIONS | GLOBAL WATER |
| Aggregate cost |
| $85,562,689 |
|
| $398,647,666 |
|
| Gross unrealized appreciation |
| $10,312,872 |
|
| $72,047,397 |
|
| Gross unrealized depreciation | (8,144,527) |
| (31,473,916) |
|
| Net unrealized appreciation (depreciation) |
| $2,168,345 |
|
| $40,573,481 |
|
NOTE 5 — SECURITIES LENDING
To generate additional income, the Funds may lend their securities pursuant to a securities lending agency agreement with State Street Bank and Trust Company (SSB), the securities lending agent. Security loans are subject to termination by the Funds at any time and, therefore, are not considered illiquid investments. The Funds require that the loan be continuously collateralized by
www.calvert.com CALVERT GLOBAL ENERGY SOLUTIONS AND GLOBAL WATER FUNDS ANNUAL REPORT 39
either cash or securities as collateral equal at all times to at least 102% of the market value of the domestic securities loaned and 105% of the market value of the international securities loaned (if applicable). The market value of securities loaned is determined daily and any additional required collateral is delivered to the respective Fund on the next business day. Cash collateral is generally invested in a money market fund registered under the 1940 Act that is managed by an affiliate of SSB. Any gain or loss in the market price of the loaned securities that might occur and any interest earned or dividends declared during the term of the loan would accrue to the account of the Funds. Income earned on the investment of collateral, net of broker rebates and other expenses incurred by the securities lending agent, is split between the respective Fund and the securities lending agent on the basis of agreed upon contractual terms. Non-cash collateral, if any, is held by the lending agent on behalf of the respective Fund and cannot be sold or re-pledged by the respective Fund; accordingly, such collateral is not reflected in each of the Statement of Assets and Liabilities.
The risks associated with lending portfolio securities include, but are not limited to, possible delays in receiving additional collateral or in the recovery of the loaned securities, possible loss of rights to the collateral should the borrower fail financially, as well as risk of loss in the value of the collateral or the value of the investments made with the collateral. The securities lending agent shall indemnify the Funds in the case of default of any securities borrower.
At September 30, 2018, the total value of securities on loan and the total value of collateral received were as follows:
|
| | | | | | |
| | GLOBAL ENERGY SOLUTIONS | GLOBAL WATER |
| Securities on Loan |
| $11,382,309 |
|
| $27,725,623 |
|
| Collateral Received: | | |
| Cash |
| $7,217,580 |
|
| $9,746,202 |
|
| U.S. Government and/or agencies securities | 4,992,888 |
| 19,955,052 |
|
| Total Collateral Received |
| $12,210,468 |
|
| $29,701,254 |
|
The following table provides a breakdown of securities lending transactions accounted for as secured borrowings, the obligations by class of collateral pledged, and the remaining contractual maturity of those transactions as of September 30, 2018.
|
| | | | | | | | | | | | | | | |
| | Remaining Contractual Maturity of the Transactions |
| | Overnight and Continuous | <30 days | 30 to 90 days | >90 days | Total |
| Securities Lending Transactions | | | | | |
| Common Stocks | | | | | |
| Global Energy Solutions |
| $12,210,468 |
|
| $— |
|
| $— |
|
| $— |
|
| $12,210,468 |
|
| Global Water |
| $29,701,254 |
|
| $— |
|
| $— |
|
| $— |
|
| $29,701,254 |
|
The carrying amounts of the liabilities for deposits for securities loaned at September 30, 2018 approximated their fair value. If measured at fair value, such liabilities would have been considered as Level 2 in the fair value hierarchy (see Note 1A) at September 30, 2018.
NOTE 6 — LINE OF CREDIT
The Funds participates with other funds managed by CRM in a $62.5 million committed ($25 million committed and $25 million uncommitted prior to August 7, 2018) unsecured line of credit agreement with SSB, which is in effect through August 6, 2019. Borrowings may be made for temporary or emergency purposes only. Borrowings bear interest at the higher of the One-Month London Interbank Offered Rate (LIBOR) in effect that day or the overnight Federal Funds Rate, plus 1.00% (1.25% prior to August 7, 2018) per annum. A commitment fee of 0.20% (0.25% prior to August 7, 2018) per annum is incurred on the unused portion of the committed facility. An administrative fee of $37,500 was incurred in connection with the renewal of the facility in August 2018. These fees are allocated to all participating funds. Because the line of credit is not available exclusively to the Funds, a Fund may be unable to borrow some or all of its requested amounts at any particular time. At September 30, 2018, Global Energy Solutions and Global Water had a balance outstanding pursuant to this line of credit of $23,970 and $55,175, respectively, at an interest rate of 3.26% and 3.26%, respectively. Based on the short-term nature of the borrowings under the line of credit and variable interest rate, the carrying value of the borrowings approximated its fair value at September 30, 2018. If measured at fair value, borrowings under the line of credit would have been considered as Level 2 in the fair value hierarchy (see Note 1A) at September 30, 2018. The Funds average borrowings or allocated fees during the year ended September 30, 2018 were not significant.
40 www.calvert.com CALVERT GLOBAL ENERGY SOLUTIONS AND GLOBAL WATER FUNDS ANNUAL REPORT
NOTE 7 — AFFILIATED COMPANIES
The Funds have invested a portion of their assets designated for high social impact investments in notes (the Notes) issued by Calvert Impact Capital, Inc. (CIC), formerly the Calvert Social Investment Foundation, pursuant to an exemptive order granted by the U.S. Securities and Exchange Commission (the SEC) in 1998 (the Exemptive Order). The Funds obtained the Exemptive Order because at that time there was a significant overlap of Fund Board members and CIC Board members as well as certain other affiliations between CIC and affiliates of the Funds’ investment adviser. CIC may be considered an affiliated person of the Funds based on the overlap between CIC’s Board of Directors and the Calvert funds’ Directors/Trustees and other potential affiliations. CIC has licensed use of the Calvert name from CRM, and currently two Fund Board members (one of whom is CRM’s President and Chief Executive Officer), two members of the Advisory Council to the Calvert Fund Board of Directors/Trustees, and an additional CRM officer serve on CIC’s Board. CIC is not owned or otherwise controlled by CRM or its affiliates. The Funds intend to request a new exemptive order from the SEC to permit additional investment in CIC notes.
At September 30, 2018, the value of the investment in the Notes for Global Energy Solutions was $1,732,230, which represents 2.1% of its net assets and for Global Water was $962,350, which represents 0.2% of its net assets. Transactions in the Notes by each Fund for the year ended September 30, 2018 were as follows:
GLOBAL ENERGY SOLUTIONS
|
| | | | | | | | | | | | | | | | | | | | | | | | | | | |
Name of Affiliated
Company | Principal Amount,
beginning of period | Gross Additions | Gross Reductions | Principal Amount,
end of
period | Value,
end of period | Interest
Income | Net Realized
Gain (Loss) | Capital Gain
Distributions Received | Change In
Unrealized
Appreciation
(Depreciation) |
High Social Impact Investments Calvert Impact Capital, Inc., Community Investment Notes, 1.50%, 12/15/19 (1) |
| $1,800,000 |
|
| $— |
|
| $— |
|
| $1,800,000 |
|
| $1,732,230 |
|
| $27,000 |
|
| $— |
|
| $— |
|
| $16,686 |
|
GLOBAL WATER
|
| | | | | | | | | | | | | | | | | | | | | | | | | | | |
Name of Affiliated
Company | Principal Amount,
beginning of period | Gross Additions | Gross Reductions | Principal Amount,
end of
period | Value,
end of period | Interest
Income | Net Realized
Gain (Loss) | Capital Gain
Distributions Received | Change In
Unrealized
Appreciation
(Depreciation) |
High Social Impact Investments Calvert Impact Capital, Inc., Community Investment Notes, 1.50%, 12/15/19 (1) |
| $1,000,000 |
|
| $— |
|
| $— |
|
| $1,000,000 |
|
| $962,350 |
|
| $15,000 |
|
| $— |
|
| $— |
|
| $9,270 |
|
(1) Restricted security.
www.calvert.com CALVERT GLOBAL ENERGY SOLUTIONS AND GLOBAL WATER FUNDS ANNUAL REPORT 41
NOTE 8 — CAPITAL SHARES
Transactions in capital shares for the years ended September 30, 2018 and September 30, 2017 were as follows:
|
| | | | | | | | | | | |
| GLOBAL ENERGY SOLUTIONS | Year Ended
September 30, 2018 | | Year Ended
September 30, 2017 |
| | Shares | Amount | | Shares | Amount |
| Class A | | | | | |
| Shares sold | 1,117,430 |
|
| $8,195,566 |
| | 1,209,636 |
|
| $7,714,045 |
|
| Reinvestment of distributions | 90,355 |
| 679,470 |
| | 94,738 |
| 558,006 |
|
| Shares redeemed | (1,924,505 | ) | (14,149,974 | ) | | (4,475,705 | ) | (27,498,751 | ) |
| Net decrease | (716,720 | ) |
| ($5,274,938 | ) | | (3,171,331 | ) |
| ($19,226,700 | ) |
| | | | | | |
| Class C | | | | | |
| Shares sold | 143,092 |
|
| $991,557 |
| | 158,200 |
|
| $956,326 |
|
| Reinvestment of distributions | 8,307 |
| 58,729 |
| | 3,522 |
| 19,546 |
|
| Shares redeemed | (379,003 | ) | (2,593,142 | ) | | (666,132 | ) | (3,941,536 | ) |
| Net decrease | (227,604 | ) |
| ($1,542,856 | ) | | (504,410 | ) |
| ($2,965,664 | ) |
| | | | | | |
| Class I | | | | | |
| Shares sold | 1,131,225 |
|
| $8,495,674 |
| | 823,240 |
|
| $5,117,936 |
|
| Reinvestment of distributions | 28,546 |
| 217,810 |
| | 8,614 |
| 51,424 |
|
| Shares redeemed | (571,721 | ) | (4,241,557 | ) | | (225,173 | ) | (1,476,785 | ) |
| Conversion from Class Y | 1,374,040 |
| 10,234,262 |
| | — |
| — |
|
| Net increase | 1,962,090 |
|
| $14,706,189 |
| | 606,681 |
|
| $3,692,575 |
|
| | | | | | |
Class Y(1) | | | | | |
| Shares sold | 124,845 |
|
| $960,892 |
| | 1,212,395 |
|
| $7,960,157 |
|
| Reinvestment of distributions | — |
| — |
| | 14,486 |
| 88,509 |
|
| Shares redeemed | (143,680 | ) | (1,104,875 | ) | | (1,525,243 | ) | (9,987,312 | ) |
| Conversion to Class I | (1,342,427 | ) | (10,234,262 | ) | | — |
| — |
|
| Net decrease | (1,361,262 | ) |
| ($10,378,245 | ) | | (298,362 | ) |
| ($1,938,646 | ) |
42 www.calvert.com CALVERT GLOBAL ENERGY SOLUTIONS AND GLOBAL WATER FUNDS ANNUAL REPORT
|
| | | | | | | | | | | |
| GLOBAL WATER | Year Ended
September 30, 2018 | | Year Ended
September 30, 2017 |
| | Shares | Amount | | Shares | Amount |
| Class A | | | | | |
| Shares sold | 1,266,551 |
|
| $25,626,840 |
| | 2,129,491 |
|
| $38,743,469 |
|
| Reinvestment of distributions | 100,880 |
| 2,054,923 |
| | — |
| — |
|
| Shares redeemed | (3,113,037 | ) | (62,764,983 | ) | | (6,047,752 | ) | (110,411,353 | ) |
| Net decrease | (1,745,606 | ) |
| ($35,083,220 | ) | | (3,918,261 | ) |
| ($71,667,884 | ) |
| | | | | | |
| Class C | | | | | |
| Shares sold | 401,042 |
|
| $7,461,295 |
| | 454,847 |
|
| $7,675,671 |
|
| Reinvestment of distributions | 9,931 |
| 186,409 |
| | — |
| — |
|
| Shares redeemed | (892,262 | ) | (16,501,939 | ) | | (1,141,784 | ) | (19,319,186 | ) |
| Net decrease | (481,289 | ) |
| ($8,854,235 | ) | | (686,937 | ) |
| ($11,643,515 | ) |
| | | | | | |
| Class I | | | | | |
| Shares sold | 2,734,514 |
|
| $55,432,549 |
| | 657,636 |
|
| $11,595,708 |
|
| Reinvestment of distributions | 89,340 |
| 1,828,798 |
| | — |
| — |
|
| Shares redeemed | (1,999,658 | ) | (40,383,183 | ) | | (116,966 | ) | (2,156,221 | ) |
| Conversion from Class Y | 6,859,381 |
| 141,347,148 |
| | — |
| — |
|
| Net increase | 7,683,577 |
|
| $158,225,312 |
| | 540,670 |
|
| $9,439,487 |
|
| | | | | | |
Class Y(1) | | | | | |
| Shares sold | 332,896 |
|
| $6,851,319 |
| | 4,364,405 |
|
| $81,221,788 |
|
| Reinvestment of distributions | — |
| — |
| | — |
| — |
|
| Shares redeemed | (391,471 | ) | (8,041,302 | ) | | (2,227,976 | ) | (41,230,720 | ) |
| Conversion to Class I | (6,808,039 | ) | (141,347,148 | ) | | — |
| — |
|
| Net increase (decrease) | (6,866,614 | ) |
| ($142,537,131 | ) | | 2,136,429 |
|
| $39,991,068 |
|
| | | | | | |
(1) Effective December 8, 2017, Class Y shares of each Fund converted to Class I shares at net asset value. Thereafter, Class Y shares were terminated. |
NOTE 9 — RISKS ASSOCIATED WITH FOREIGN INVESTMENTS
Investing in foreign securities involves additional risks relating to political, social, and economic developments abroad. Other risks result from differences between regulations that apply to U.S. and foreign issuers and markets, and the potential for foreign markets to be less liquid and more volatile than U.S. markets. Securities that trade or are denominated in currencies other than the U.S. dollar may be adversely affected by fluctuations in currency exchange rates.
The risks of investing in emerging market securities are greater than those of investing in securities of developed foreign countries. These risks include volatile currency exchange rates, periods of high inflation, increased risk of default, greater social, economic and political uncertainty and instability, less governmental supervision and regulation of securities markets, weaker auditing and financial reporting standards, lack of liquidity in the markets, and the significantly smaller market capitalization of emerging market issuers.
NOTE 10 — CONCENTRATION RISK
Global Energy Solutions concentrates its investments in the sustainable energy solutions industry. This industry can be significantly affected by obsolescence of existing technology, short product lifecycles, falling prices and profits, competition from new market entrants and general economic conditions. The industry can also be significantly affected by fluctuations in energy prices and supply and demand of alternative energy fuels, energy conservation, the success of exploration projects and tax and other government regulations and policies. Companies in this industry could be adversely affected by commodity price volatility, imposition of import controls, increased competition, depletion of resources, technological developments and labor relations.
www.calvert.com CALVERT GLOBAL ENERGY SOLUTIONS AND GLOBAL WATER FUNDS ANNUAL REPORT 43
Global Water concentrates its investments in the water industry. This industry can be significantly affected by economic trends or other conditions or developments, such as the availability of water, the level of rainfall and occurrence of other climatic events, changes in water consumption, new technologies relating to the supply of water, and water conservation. The industry can also be significantly affected by environmental considerations, taxation, government regulation (including the increased cost of compliance), inflation, increases in interest rates, price and supply fluctuations, increases in the cost of raw materials and other operating costs, technological advances, and competition from new market entrants.
44 www.calvert.com CALVERT GLOBAL ENERGY SOLUTIONS AND GLOBAL WATER FUNDS ANNUAL REPORT
REPORT OF INDEPENDENT REGISTERED PUBLIC ACCOUNTING FIRM
To the Shareholders and Board of Directors
Calvert Impact Fund, Inc.:
Opinion on the Financial Statements
We have audited the accompanying statements of assets and liabilities of Calvert Global Energy Solutions Fund and Calvert Global Water Fund (collectively, the Funds), each a series of Calvert Impact Fund, Inc., including the schedules of investments, as of September 30, 2018, the related statements of operations for the year then ended, the statements of changes in net assets for each of the years in the two‑year period then ended, and the related notes (collectively, the financial statements) and the financial highlights for each of the years or periods in the five‑year period then ended. In our opinion, the financial statements and financial highlights present fairly, in all material respects, the financial position of the Funds as of September 30, 2018, the results of their operations for the year then ended, the changes in their net assets for each of the years in the two‑year period then ended, and the financial highlights for each of the years or periods in the five‑year period then ended, in conformity with U.S. generally accepted accounting principles.
Basis for Opinion
These financial statements and financial highlights are the responsibility of the Funds’ management. Our responsibility is to express an opinion on these financial statements and financial highlights based on our audits. We are a public accounting firm registered with the Public Company Accounting Oversight Board (United States) (PCAOB) and are required to be independent with respect to the Funds in accordance with the U.S. federal securities laws and the applicable rules and regulations of the Securities and Exchange Commission and the PCAOB.
We conducted our audits in accordance with the standards of the PCAOB. Those standards require that we plan and perform the audit to obtain reasonable assurance about whether the financial statements and financial highlights are free of material misstatement, whether due to error or fraud. Our audits included performing procedures to assess the risks of material misstatement of the financial statements and financial highlights, whether due to error or fraud, and performing procedures that respond to those risks. Such procedures included examining, on a test basis, evidence regarding the amounts and disclosures in the financial statements and financial highlights. Such procedures also included confirmation of securities owned as of September 30, 2018, by correspondence with custodians. Our audits also included evaluating the accounting principles used and significant estimates made by management, as well as evaluating the overall presentation of the financial statements and financial highlights. We believe that our audits provide a reasonable basis for our opinion.
We have served as the auditor of one or more of the Calvert Funds since 2002.
Philadelphia, Pennsylvania
November 21, 2018
www.calvert.com CALVERT GLOBAL ENERGY SOLUTIONS AND GLOBAL WATER FUNDS ANNUAL REPORT 45
FEDERAL TAX INFORMATION
The Form 1099-DIV you receive in February 2019 will show the tax status of all distributions paid to your account in calendar year 2018. Shareholders are advised to consult their own tax adviser with respect to the tax consequences of their investment in the Funds. As required by the Internal Revenue Code and/or regulations, shareholders must be notified regarding the status of qualified dividend income for individuals, the dividends received deduction for corporations and the foreign tax credit.
Qualified Dividend Income. For the fiscal year ended September 30, 2018, the Funds designate approximately the following amounts, or up to the maximum amount of such dividends allowable pursuant to the Internal Revenue Code, as qualified dividend income eligible for the reduced tax rate of 15%.
|
| | | |
| Global Energy Solutions |
| $1,388,399 |
|
| Global Water |
| $6,625,850 |
|
Dividends Received Deduction. Corporate shareholders are generally entitled to take the dividends received deduction on the portion of the Funds’ dividend distribution that qualifies under tax law. For the Funds’ fiscal 2018 ordinary income dividends, the following amounts qualify for the corporate dividends received deduction:
|
| | |
| Global Energy Solutions | 18.09 | % |
| Global Water | 83.75 | % |
Foreign Tax Credit. For the fiscal year ended September 30, 2018, the Funds paid foreign taxes and recognized foreign source income as follows:
|
| | | | | | |
| | Foreign Taxes | Foreign Source Income |
| Global Energy Solutions |
| $136,869 |
|
| $1,620,111 |
|
| Global Water |
| $593,229 |
|
| $8,555,337 |
|
46 www.calvert.com CALVERT GLOBAL ENERGY SOLUTIONS AND GLOBAL WATER FUNDS ANNUAL REPORT (Unaudited)
MANAGEMENT AND ORGANIZATION
Fund Management. The Directors of Calvert Impact Fund, Inc. (the Corporation) are responsible for the overall management and supervision of the Corporation’s affairs. The Directors and officers of the Corporation are listed below. Except as indicated, each individual has held the office shown or other offices in the same company for the last five years. Directors and officers of the Corporation hold indefinite terms of office. The “Independent Directors” consist of those Directors who are not “interested persons” of the Corporation, as that term is defined under the 1940 Act. The business address of each Director and officer, with the exception of Ms. Gemma and Mr. Kirchner, is 1825 Connecticut Avenue NW, Suite 400, Washington, DC 20009. As used below, “CRM” refers to Calvert Research and Management. Each Director oversees 39 funds in the Calvert fund complex. Each officer serves as an officer of certain other Calvert funds.
|
| | | |
| Name and Year of Birth | Position
with Corporation | Position
Start Date | Principal Occupation(s) and Directorships
During Past Five Years and Other Relevant Experience |
| | | | |
| Interested Director | | | |
John H. Streur(1)
1960 | Director & President | 2015 | President and Chief Executive Officer of Calvert Research and Management (since December 31, 2016). President and Chief Executive Officer of Calvert Investments, Inc. (January 2015 - December 2016); Chief Executive Officer of Calvert Investment Distributors, Inc. (August 2015 - December 2016); Chief Compliance Officer of Calvert Investment Management, Inc. (August 2015 - April 2016); President and Director, Portfolio 21 Investments, Inc. (through October 2014); President, Chief Executive Officer and Director, Managers Investment Group LLC (through January 2012); President and Director, The Managers Funds and Managers AMG Funds (through January 2012).
Directorships in the Last Five Years. Portfolio 21 Investments, Inc. (asset management) (through October 2014); Managers Investment Group LLC (asset management) (through January 2012); The Managers Funds (asset management) (through January 2012); Managers AMG Funds (asset management) (through January 2012); Calvert Impact Capital, Inc. |
| Independent Directors | | | |
Richard L. Baird, Jr
1948 | Director | 2005 | Former President and CEO of Adagio Health Inc. (retired in 2014) in Pittsburgh, PA, a non-profit corporation which provides family planning services, nutrition, maternal/child health care, and various health screening services and community preventive health programs.
Directorships in the Last Five Years. None. |
Alice Gresham Bullock
1950 | Chair & Director | 2016 | Professor at Howard University School of Law (retired June 2016). She is former Dean of Howard University School of Law (1996-2002) and Deputy Director of the Association of American Law Schools (1992-1994).
Directorships in the Last Five Years. None. |
Cari M. Dominguez
1949 | Director | 2016 | Former Chair of the U.S. Equal Employment Opportunity Commission.
Directorships in the Last Five Years. Manpower, Inc. (employment agency); Triple S Management Corporation (managed care); National Association of Corporate Directors. |
John G. Guffey, Jr.
1948 | Director | 2005 | President of Aurora Press Inc., a privately held publisher of trade paperbacks (since January 1997).
Directorships in the Last Five Years. Calvert Impact Capital, Inc.; Calvert Ventures, LLC. |
www.calvert.com CALVERT GLOBAL ENERGY SOLUTIONS AND GLOBAL WATER FUNDS ANNUAL REPORT (Unaudited) 47
|
| | | |
| Name and Year of Birth | Position
with Corporation | Position
Start Date | Principal Occupation(s) and Directorships
During Past Five Years and Other Relevant Experience |
| | | | |
Miles D. Harper, III
1962 | Director | 2000 | Partner, Carr Riggs & Ingram (public accounting firm) since October 2014. Partner, Gainer Donnelly & Desroches (public accounting firm) (now Carr Riggs & Ingram), November 1999 - September 2014).
Directorships in the Last Five Years. Bridgeway Funds (10) (asset management). |
Joy V. Jones
1950 | Director | 2000 | Attorney.
Directorships in the Last Five Years. Conduit Street Restaurants SUD 2 Limited; Palm Management Restaurant Corporation. |
Anthony A. Williams
1951 | Director | 2016 | CEO and Executive Director of the Federal City Council (July 2012 to present); Senior Adviser and Independent Consultant for McKenna Long & Aldridge LLP (September 2011 to present); Executive Director of Global Government Practice at the Corporate Executive Board (January 2010 to January 2012).
Directorships in the Last Five Years. Freddie Mac; Evoq Properties/ Meruelo Maddux Properties, Inc. (real estate management); Weston Solutions, Inc. (environmental services); Bipartisan Policy Center’s Debt Reduction Task Force; Chesapeake Bay Foundation; Catholic University of America; Urban Institute (research organization). |
|
| | | |
| Principal Officers who are not Directors | |
Name and
Year of Birth | Position with
Corporation | Position Start Date | Principal Occupation
During Past Five Years |
| | | | |
Hope L. Brown
1973 | Chief Compliance Officer | 2014 | Chief Compliance Officer of 39 registered investment companies advised by CRM (since 2014). Vice President and Chief Compliance Officer, Wilmington Funds (2012-2014). Vice President and Senior Compliance Officer, Wilmington Trust Investment Advisors, Inc. (2010-2012). |
Maureen A. Gemma(2)
1960 | Secretary, Vice President and Chief Legal Officer | 2016 | Vice President of CRM and officer of 39 registered investment companies advised by CRM (since 2016). Also Vice President of Eaton Vance Management (“EVM”) and certain of its affiliates and officer of 174 registered investment companies advised or administered by EVM. |
James F. Kirchner(2)
1967 | Treasurer | 2016 | Vice President of CRM and officer of 39 registered investment companies advised by CRM (since 2016). Also Vice President of EVM and certain of its affiliates and officer of 174 registered investment companies advised or administered by EVM. |
| | | | |
| |
(1) | Mr. Streur is an interested person of the Funds because of his positions with each Fund’s adviser and certain affiliates. |
| |
(2) | The business address for Ms. Gemma and Mr. Kirchner is Two International Place, Boston, MA 02110. |
The SAI for the Funds includes additional information about the Directors and officers of the Funds and can be obtained without charge on Calvert’s website at www.calvert.com or by calling 1-800-368-2745.
48 www.calvert.com CALVERT GLOBAL ENERGY SOLUTIONS AND GLOBAL WATER FUNDS ANNUAL REPORT (Unaudited)
IMPORTANT NOTICES
Privacy. The Calvert Funds and Calvert Research and Management are committed to ensuring your financial privacy. Each of the financial institutions identified below has in effect the following policy (“Privacy Policy”) with respect to nonpublic personal information about its customers:
| |
| • | Only such information received from you, through application forms or otherwise, and information about your Calvert fund transactions will be collected. This may include information such as name, address, social security number, tax status, account balances and transactions. |
| |
| • | None of such information about you (or former customers) will be disclosed to anyone, except as permitted by law (which includes disclosure to employees necessary to service your account). In the normal course of servicing a customer’s account, Calvert Research and Management may share information with unaffiliated third parties that perform various required services such as transfer agents, custodians and broker-dealers. |
| |
| • | Policies and procedures (including physical, electronic and procedural safeguards) are in place that are designed to protect the confidentiality of such information. |
| |
| • | The Funds reserve the right to change this Privacy Policy at any time upon proper notification to you. Customers may want to review the Funds’ Privacy Policy periodically for changes by accessing the link on our homepage: www.calvert.com. |
Our pledge of privacy applies to the following entities: the Calvert Family of Funds, Calvert Research and Management and their affiliated service providers, Eaton Vance Management and Eaton Vance Distributors, Inc. In addition, our Privacy Policy applies only to those Calvert customers who are individuals and who have a direct relationship with us. If a customer’s account (i.e., fund shares) is held in the name of a third-party financial advisor/broker-dealer, it is likely that only such advisor’s privacy policies apply to the customer. This notice supersedes all previously issued privacy disclosures. For more information about Calvert’s Privacy Policy, please call 1-800-368-2745.
Delivery of Shareholder Documents. The Securities and Exchange Commission (SEC) permits funds to deliver only one copy of shareholder documents, including prospectuses, proxy statements and shareholder reports, to fund investors with multiple accounts at the same residential or post office box address. This practice is often called “householding” and it helps eliminate duplicate mailings to shareholders. Calvert funds, or your financial advisor, may household the mailing of your documents indefinitely unless you instruct Calvert funds, or your financial advisor, otherwise. If you would prefer that your Calvert fund documents not be householded, please contact Calvert funds at 1-800-368-2745, or contact your financial advisor. Your instructions that householding not apply to delivery of your Calvert fund documents will typically be effective within 30 days of receipt by Calvert funds or your financial advisor. Separate statements will be generated for each separate account and will be householded as described above.
Portfolio Holdings. Each Calvert fund will file a schedule of portfolio holdings on Form N-Q with the SEC for the first and third quarters of each fiscal year. The Form N-Q will be available on the Calvert funds’ website at www.calvert.com, by calling Calvert funds at 1-800-368-2745 or in the EDGAR database on the SEC’s website at www.sec.gov. Form N-Q may also be reviewed and copied at the SEC’s public reference room in Washington, D.C. (call 1-800-732-0330 for information on the operation of the public reference room).
Proxy Voting. The Proxy Voting Guidelines that each Calvert fund uses to determine how to vote proxies relating to portfolio securities is provided as an Appendix to the fund’s Statement of Additional Information. The Statement of Additional Information can be obtained free of charge by calling the Calvert funds at 1-800-368-2745, by visiting the Calvert funds’ website at www.calvert.com or visiting the SEC’s website at www.sec.gov. Information regarding how a Calvert fund voted proxies relating to portfolio securities during the most recent 12-month period ended June 30 is available by calling Calvert funds, by visiting the Calvert funds’ website at www.calvert.com or by visiting the SEC’s website at www.sec.gov.
www.calvert.com CALVERT GLOBAL ENERGY SOLUTIONS AND GLOBAL WATER FUNDS ANNUAL REPORT (Unaudited) 49
|
|
| This page intentionally left blank. |
|
|
| This page intentionally left blank. |
|
|
| This page intentionally left blank. |
|
| |
| CALVERT GLOBAL ENERGY SOLUTIONS FUND |
| CALVERT GLOBAL WATER FUND |
Investment Adviser and Administrator Calvert Research and Management 1825 Connecticut Avenue NW, Suite 400 Washington, DC 20009 | Transfer Agent DST Asset Manager Solutions, Inc. 2000 Crown Colony Drive Quincy, MA 02169 |
Principal Underwriter* Eaton Vance Distributors, Inc. Two International Place Boston, MA 02110 (617) 482-8260 | Independent Registered Public Accounting Firm KPMG LLP 1601 Market Street Philadelphia, PA 19103-2499 |
Custodian State Street Bank and Trust Company State Street Financial Center, One Lincoln Street Boston, MA 02111 | Fund Offices 1825 Connecticut Avenue NW, Suite 400 Washington, DC 20009 |
| | |
* FINRA BrokerCheck. Investors may check the background of their Investment Professional by contacting the Financial Industry Regulatory Authority (FINRA). FINRA BrokerCheck is a free tool to help investors check the professional background of current and former FINRA-registered securities firms and brokers. FINRA BrokerCheck is available by calling 1-800-289-9999 and at www.FINRA.org. The FINRA BrokerCheck brochure describing this program is available to investors at www.FINRA.org.
|
| |
| | |
Fund shares are not insured by the FDIC and are not deposits or other obligations of, or guaranteed by, any depository institution. Shares are subject to investment risks, including possible loss of principal invested. This report is intended to provide fund information to shareholders. It is not authorized for distribution to prospective investors unless preceded or accompanied by a prospectus. Note: The information on our website is not incorporated by reference into this report; our website address is included as an inactive textual reference only. Investors should carefully consider the investment objectives, risks, charges and expenses of the Calvert funds. This and other important information is contained in the fund’s summary prospectus and prospectus, which can be obtained from your financial professional and should be read carefully before investing. You may also call the Calvert funds at 800-368-2745. Printed on recycled paper. |
| 24199 9.30.18 | |
|
| |
Annual Report September 30, 2018 E-Delivery Sign-Up — Details Inside | |
|
|
Commodity Futures Trading Commission Registration. Effective December 31, 2012, the Commodity Futures Trading Commission (“CFTC”) adopted certain regulatory changes that subject registered investment companies and advisers to regulation by the CFTC if a fund invests more than a prescribed level of its assets in certain CFTC-regulated instruments (including futures, certain options and swap agreements) or markets itself as providing investment exposure to such instruments. The Fund and its adviser have claimed an exclusion from the definition of the term “commodity pool operator” under the Commodity Exchange Act. Accordingly, neither the Fund nor the adviser is subject to CFTC regulation. |
Choose Planet-friendly E-delivery! Sign up now for on-line statements, prospectuses, and fund reports. In less than five minutes you can help reduce paper mail and lower fund costs. Just go to www.calvert.com. If you already have an online account with the Calvert funds, click on Login to access your Account and select the documents you would like to receive via e-mail. If you’re new to online account access, click on Login, then Register to create your user name and password. Once you’re in, click on the E-delivery sign-up on the Account Portfolio page and follow the quick, easy steps. Note: If your shares are not held directly with the Calvert funds but through a brokerage firm, you must contact your broker for electronic delivery options available through their firm. |
|
| | | | |
| | TABLE OF CONTENTS |
| | | | | |
| | | | | Management’s Discussion of Fund Performance |
| | | | | Performance |
| | | | | Fund Profile |
| | | | | Endnotes and Additional Disclosures |
| | | | | Fund Expenses |
| | | | | Financial Statements |
| | | | | Report of Independent Registered Public Accounting Firm |
| | | | | Federal Tax Information |
| | | | | Management and Organization |
| | | | | Important Notices |
MANAGEMENT’S DISCUSSION OF FUND PERFORMANCE1 Economic and Market Conditions
For the 12-month period ended September 30, 2018, U.S. investment-grade, fixed-income securities declined, with the Bloomberg Barclays U.S. Aggregate Bond Index2 returning -1.22%. In comparison, high-yield credits showed strength with the ICE BofAML U.S. High Yield Index rising 2.94% during the period.
Although geopolitical tensions involving North Korea rattled markets early in the period, accommodative central banks, strong corporate earnings, and global growth muffled the impact of these potential sources of volatility. However, as the year progressed, the growing threat of an international trade war and mounting uncertainties about the course of Brexit raised market worries. Signs of decelerating growth outside the U.S. ─ as well as concerns about rising inflation and interest rates inside the U.S. ─ led to an uptick in volatility.
U.S. gross domestic product (GDP) growth accelerated through most of the period, reaching a quarterly annualized rate of 4.2% in the second quarter of 2018, the highest level in four years. Corporate earnings and balance sheets also steadily strengthened and the unemployment rate fell to 3.9% during the period from 4.2% at the start of the period. Wages, which had remained stagnant even as the jobless rate fell, began to rise in the latter stages of the period. Inflation increased modestly with the personal consumption expenditures index rising to nearly 2%, mirroring the U.S. Federal Reserve Board (the Fed) target level.
As the U.S. economy showed signs of building strength, the Fed raised the federal funds rate four times during the period and projected another rate hike before the end of 2018 as well as three more potential increases in 2019.
Outside the U.S., growth in major economies in the eurozone and China slowed during the period. Eurozone countries shifted away from monetary-easing policies while the Central Bank of China cut interest rates. Both actions contributed to a stronger U.S. dollar. Meanwhile, the Bank of Japan curtailed the easing policies it had pursued since the 2008 financial crisis.
As the Fed adhered to its tightening course, spreads between the yields of issues of longer- and shorter-term maturities ─ already unusually narrow at the beginning of the period ─ converged, further flattening the yield curve. Early in the calendar year, a major U.S. tax cut supported a surge in Treasury bill issuances and large-scale corporate cash repatriation, putting pressure on short-term interest rates.
Later in the period, a strong supply of issuances from merger-and-acquisition transactions ─ in addition to concerns about increased leverage and weakening fundamentals in the latter stages of the credit cycle ─ contributed to widening spreads.
Fund Performance
For the fiscal year ended September 30, 2018, Calvert Green Bond Fund (the Fund) Class A shares at net asset value (NAV) returned -0.80%. The Fund underperformed its new primary
benchmark (as of July 12, 2018), the ICE BofAML Green Bond Index-Hedged USD (the Index), which returned 1.48%.
As short-term rates rose during the period, the Fund’s duration, which exceeded the Index, detracted. Duration is a measure of the expected change in the price of a bond - in percentage terms - given a one-percent change in interest rates, all else being constant. Securities with lower durations tend to be less sensitive to interest rate changes.
In the most recent quarter, the Fund outperformed the Index. In the first fiscal quarter, the returns of U.S. fixed-income securities were generally solid amid low volatility and a healthy global economy. Allocations to investment-grade bonds and fixed-income securities contributed to Fund performance versus the Index during the period.
As volatility returned in the new calendar year, allocations to these securities began to detract following the widening of yield spreads among issues of different credit qualities. Allocations to supranational, municipal, clean-energy, asset-backed securities and green corporate bonds ─ particularly in banking ─ contributed positively to performance relative to the Index.
In the final quarter, a large overweight to U.S. dollar-denominated securities with durations that exceeded the average duration of the Index was the primary detractor from performance relative to the Index.
Overweights to asset-backed securities and high-yield investments were positive contributors during the period. Security selection within the manufacturing sector was also a positive contributor relative to the Index. Following a strong late period surge, green bond issuances in 2017 reached $119 billion. As of period end, green bond issuances in 2018 were on pace to reach $160 billion, although Fund management projected a slowdown in growth.
During the period, the Fund sought to enhance diversification6 by increasing exposure to new issuers. The Fund sought attractive investment opportunities within and beyond the green bond universe in line with the Calvert Principles for Responsible Investment and the Fund’s green investment criteria.
At period end, while the Fed had projected a tightening fiscal course to offset the prospect of modest inflation, no one knew whether, when, or how much interest rates would increase. Other areas of uncertainty included how trade tensions with China would play out, the impact of U.S. midterm elections, the looming Brexit deadline, the fiscal policy of Italy’s new government, and the imbalances facing several emerging economies.
Given that environment, the Fund was conservatively positioned at period end, including a slightly shorter-than-Index duration. The Fund maintained an overweight to short-duration, investment grade fixed-income securities and asset-backed securities at period end. Fund management believed that the rapid growth in BBB-rated7 bonds during the period warranted some caution. In this and other sectors, the Fund continued to emphasize bottom-up security selection.
|
|
See Endnotes and Additional Disclosures in this report. Past performance is no guarantee of future results. Returns are historical and are calculated by determining the percentage change in net asset value (NAV) or offering price (as applicable) with all distributions reinvested. Investment return and principal value will fluctuate so that shares, when redeemed, may be worth more or less than their original cost. Performance less than or equal to one year is cumulative. Performance is for the stated time period only; due to market volatility, the Fund’s current performance may be lower or higher than quoted. Returns are before taxes unless otherwise noted. For performance as of the most recent month-end, please refer to www.calvert.com. |
2 www.calvert.com CALVERT GREEN BOND FUND ANNUAL REPORT (Unaudited)
PERFORMANCE
|
| | | | | | | | | | | | | | |
Performance2,3 | | | | | | | | | |
Portfolio Managers Vishal Khanduja, CFA and Brian S. Ellis, CFA, each of Calvert Research and Management |
| | | | | | | | | | |
| % Average Annual Total Returns | Class Inception Date |
| | Performance Inception Date |
| | One Year |
| | Five Years |
| | Since Inception |
|
| Class A at NAV | 10/31/2013 |
| | 10/31/2013 |
| | -0.80 | % | | — | % | | 1.88 | % |
| Class A with 3.75% Maximum Sales Charge | — |
| | — |
| | -4.54 |
| | — |
| | 1.10 |
|
| Class I at NAV | 10/31/2013 |
| | 10/31/2013 |
| | -0.48 |
| | — |
| | 2.26 |
|
| | | | | | | | | | |
| | | | | | | | | | |
| ICE BofAML Green Bond Index - Hedged USD | — |
| | — |
| | 1.48 | % | | 3.09 | % | | 2.99 | % |
| ICE BofAML 3-Month U.S. Treasury Bill Index | — |
| | — |
| | 1.59 |
| | 0.52 |
| | 0.53 |
|
| Bloomberg Barclays 1-3 Month U.S. Treasury Bill Index | — |
| | — |
| | 1.52 |
| | 0.48 |
| | 0.49 |
|
| | | | | | | | | | |
% Total Annual Operating Expense Ratios4 | | | | | | | Class A |
| | Class I |
|
| Gross | | | | | | | 1.04 | % | | 0.68 | % |
| Net | | | | | | | 0.85 |
| | 0.50 |
|
|
|
| Growth of $10,000 |
| This graph shows the change in value of a hypothetical investment of $10,000 in Class A of the Fund for the period indicated. For comparison, the same investment is shown in the indicated index. |
|
| | | | | | | | |
| Growth of Investment | Amount Invested |
| Period Beginning | At NAV |
| With Maximum Sales Charge |
| Class I |
| $250,000 |
| 10/31/2013 |
| $279,060 |
| N.A. |
See Endnotes and Additional Disclosures in this report.
Past performance is no guarantee of future results. Returns are historical and are calculated by determining the percentage change in net asset value (NAV) or offering price (as applicable) with all distributions reinvested. Investment return and principal value will fluctuate so that shares, when redeemed, may be worth more or less than their original cost. Performance less than or equal to one year is cumulative. Performance is for the stated time period only; due to market volatility, the Fund’s current performance may be lower or higher than quoted. Returns are before taxes unless otherwise noted. For performance as of the most recent month-end, please refer to www.calvert.com.
www.calvert.com CALVERT GREEN BOND FUND ANNUAL REPORT (Unaudited) 3
FUND PROFILE
|
| | | | | | |
| |
| | | | | |
| | PORTFOLIO COMPOSITION (% of total investments)5 | | | |
| | | | | | |
| | Corporate Bonds | 54.8 | % | | | |
| | Sovereign Government Bonds | 17.8 | % | | | |
| | Asset-Backed Securities | 14.6 | % | | | |
| | U.S. Government Agency Mortgage-Backed Securities | 7.6 | % | | | |
| | Taxable Municipal Obligations | 4.5 | % | | | |
| | U.S. Government Agencies and Instrumentalities | 0.6 | % | | | |
| | High Social Impact Investments | 0.1 | % | | | |
| | Total | 100.0 | % | | | |
| | | | | | |
See Endnotes and Additional Disclosures in this report.
4 www.calvert.com CALVERT GREEN BOND FUND ANNUAL REPORT (Unaudited)
|
| | |
| Endnotes and Additional Disclosures | | |
1 The views expressed in this report are those of the portfolio manager(s) and are current only through the date stated on the cover. These views are subject to change at any time based upon market or other conditions, and Calvert and the Fund(s) disclaim any responsibility to update such views. These views may not be relied upon as investment advice and, because investment decisions are based on many factors, may not be relied upon as an indication of trading intent on behalf of any Calvert fund. This commentary may contain statements that are not historical facts, referred to as “forward looking statements.” The Fund’s actual future results may differ significantly from those stated in any forward looking statement, depending on factors such as changes in securities or financial markets or general economic conditions, the volume of sales and purchases of Fund shares, the continuation of investment advisory, administrative and service contracts, and other risks discussed from time to time in the Fund’s filings with the Securities and Exchange Commission.
| |
2 | ICE BofAML U.S. High Yield Index is an unmanaged index of below-investment grade U.S. corporate bonds. ICE BofAML Green Bond Index tracks the performance of securities issued for qualified “green” purposes. Qualifying bonds must have a clearly designated use of proceeds that is solely applied toward projects or activities that promote climate change mitigation or adaptation or other environmental sustainability purposes. ICE BofAML 3-Month U.S. Treasury Bill Index is an unmanaged index of U.S. Treasury securities maturing in 90 days. ICE® BofAML® indices are not for redistribution or other uses; provided “as is”, without warranties, and with no liability. Eaton Vance has prepared this report and ICE Data Indices, LLC does not endorse it, or guarantee, review, or endorse Eaton Vance’s products. BofAML® is a licensed registered trademark of Bank of America Corporation in the United States and other countries. Bloomberg Barclays U.S. Aggregate Bond Index is an unmanaged index of domestic investment-grade bonds, including corporate, government and mortgage-backed securities. Bloomberg Barclays 1-3 Month U.S. Treasury Bill Index measures the performance of U.S. Treasury Bills with a maturity between one and three months. Unless otherwise stated, index returns do not reflect the effect of any applicable sales charges, commissions, expenses, taxes or leverage, as applicable. It is not possible to invest directly in an index. |
| |
3 | Total Returns at NAV do not include applicable sales charges. If sales charges were deducted, the returns would be lower. Total Returns shown with maximum sales charge reflect the stated maximum sales charge. Unless otherwise stated, performance does not reflect the deduction of taxes on Fund distributions or redemptions of Fund shares. Performance since inception for an index, if presented, is the performance since the Fund’s or oldest share class’ inception, as applicable. |
Effective December 31, 2016, Calvert Research and Management became the investment adviser to the Fund and performance reflected prior to such date is that of the Fund’s former investment adviser, Calvert Investment Management, Inc.
| |
4 | Source: Fund prospectus. Net expense ratios reflect a contractual expense reimbursement that continues through 1/31/19. Without the reimbursement, performance would have been lower. The expense ratios for the current reporting period can be found in the Financial Highlights section of this report. |
5 Does not include Short Term Investment of Cash Collateral for Securities Loaned.
| |
6 | Diversification cannot ensure a profit or eliminate the risk of loss. |
| |
7 | Ratings are based on Moody’s Investors Service, Inc. (“Moody’s”), S&P Global Ratings (“S&P”) or Fitch Ratings (“Fitch”), as applicable. If securities are rated differently by the ratings agencies, the highest rating is applied. Ratings, which are subject to change, apply to the creditworthiness of the issuers of the underlying securities and not to the Fund or its shares. Credit ratings measure the quality of a bond based on the issuer’s creditworthiness, with ratings ranging from AAA, being the highest, to D, being the lowest based on S&P’s measures. Ratings of BBB or higher by S&P or Fitch (Baa or higher by Moody’s) are considered to be investment-grade quality. Credit ratings are based largely on the ratings agency’s analysis at the time of rating. The rating assigned to any particular security is not necessarily a reflection of the issuer’s current financial condition and does not necessarily reflect its assessment of the volatility of a security’s market value or of the liquidity of an investment in the security. |
Fund profile subject to change due to active management.
Important Notice to Shareholders
Effective July 12, 2018, the Fund’s primary benchmark has been changed to the ICE BofAML Green Bond Index - Hedged USD because it was deemed by the portfolio managers to be a more appropriate benchmark for the Fund.
www.calvert.com CALVERT GREEN BOND FUND ANNUAL REPORT (Unaudited) 5
FUND EXPENSES
Example
As a Fund shareholder, you incur two types of costs: (1) transaction costs, including sales charges (loads) on purchases and redemption fees (if applicable); and (2) ongoing costs, including management fees; distribution and/or service fees; and other Fund expenses. This Example is intended to help you understand your ongoing costs (in dollars) of Fund investing and to compare these costs with the ongoing costs of investing in other mutual funds. The Example is based on an investment of $1,000 invested at the beginning of the period and held for the entire period (April 1, 2018 to September 30, 2018).
Actual Expenses
The first section of the table below provides information about actual account values and actual expenses. You may use the information in this section, together with the amount you invested, to estimate the expenses that you paid over the period. Simply divide your account value by $1,000 (for example, an $8,600 account value divided by $1,000 = 8.6), then multiply the result by the number in the first section under the heading entitled “Expenses Paid During Period” to estimate the expenses you paid on your account during this period.
Hypothetical Example for Comparison Purposes
The second section of the table below provides information about hypothetical account values and hypothetical expenses based on the actual Fund expense ratio and an assumed rate of return of 5% per year (before expenses), which is not the actual Fund return. The hypothetical account values and expenses may not be used to estimate the actual ending account balance or expenses you paid for the period. You may use this information to compare the ongoing costs of investing in the Fund and other funds. To do so, compare this 5% hypothetical example with the 5% hypothetical examples that appear in the shareholder reports of the other funds.
Please note that the expenses shown in the table are meant to highlight your ongoing costs only and do not reflect any transactional costs, such as sales charges (loads) or redemption fees (if applicable). Therefore, the second section of the table is useful in comparing ongoing costs only, and will not help you determine the relative total costs of owning different funds. In addition, if these transactional costs were included, your costs would be higher.
|
| | | | |
| | BEGINNING
ACCOUNT VALUE
(4/1/18) | ENDING
ACCOUNT VALUE
(9/30/18) | EXPENSES PAID
DURING PERIOD*
(4/1/18 - 9/30/18) | ANNUALIZED
EXPENSE RATIO |
| Actual | | | | |
| Class A | $1,000.00 | $1,001.80 | $4.27** | 0.85% |
| Class I | $1,000.00 | $1,003.10 | $2.51** | 0.50% |
| Hypothetical | | | | |
| (5% return per year before expenses) | | | | |
| Class A | $1,000.00 | $1,020.81 | $4.31** | 0.85% |
| Class I | $1,000.00 | $1,022.56 | $2.54** | 0.50% |
| | | | | |
| * Expenses are equal to the Fund’s annualized expense ratio for the indicated Class, multiplied by the average account value over the period, multiplied by 183/365 (to reflect the one-half year period). The Example assumes that the $1,000 was invested at the net asset value per share determined at the close of business on March 31, 2018. |
| ** Absent a waiver and/or reimbursement of expenses by an affiliate, expenses would be higher. |
6 www.calvert.com CALVERT GREEN BOND FUND ANNUAL REPORT (Unaudited)
CALVERT GREEN BOND FUND
SCHEDULE OF INVESTMENTS
SEPTEMBER 30, 2018
|
| | |
| | PRINCIPAL AMOUNT ($) | VALUE ($) |
| CORPORATE BONDS - 54.0% | | |
| Communications - 0.7% | | |
| Alphabet, Inc., 1.998%, 8/15/26 | 1,200,000 | 1,081,980 |
| | | |
| Consumer, Cyclical - 1.4% | | |
| Hyundai Capital Services, Inc., 2.875%, 3/16/21 (1) | 1,200,000 | 1,172,239 |
| Starbucks Corp., 2.45%, 6/15/26 | 1,150,000 | 1,036,920 |
| | | 2,209,159 |
| | | |
| Consumer, Non-cyclical - 3.1% | | |
| Ecolab, Inc.: | | |
| 3.25%, 12/1/27 | 372,000 | 357,577 |
| 3.95%, 12/1/47 | 400,000 | 380,978 |
| Kaiser Foundation Hospitals, 3.15%, 5/1/27 | 1,658,000 | 1,590,984 |
| Massachusetts Institute of Technology, 3.959%, 7/1/38 | 2,435,000 | 2,448,489 |
| | | 4,778,028 |
| | | |
| Energy - 1.2% | | |
| Pattern Energy Group, Inc., 5.875%, 2/1/24 (1) | 1,430,000 | 1,451,450 |
| TerraForm Power Operating LLC, 5.00%, 1/31/28 (1) | 470,000 | 438,863 |
| | | 1,890,313 |
| | | |
| Financial - 19.8% | | |
| Alexandria Real Estate Equities, Inc., 4.00%, 1/15/24 | 2,364,000 | 2,372,004 |
| Bank of America Corp.: | | |
| 2.151%, 11/9/20 | 3,524,000 | 3,449,566 |
| 3.499% to 5/17/21, 5/17/22 (2) | 3,472,000 | 3,471,148 |
| DBS Group Holdings Ltd., 2.955%, (3 mo. USD LIBOR + 0.62%), 7/25/22 (1)(3) | 3,640,000 | 3,663,681 |
| Digital Realty Trust LP, 3.95%, 7/1/22 | 3,258,000 | 3,280,501 |
| ING Bank NV, 2.00%, 11/26/18 (1) | 2,600,000 | 2,597,906 |
| Mitsubishi UFJ Financial Group, Inc., 2.527%, 9/13/23 (4) | 1,100,000 | 1,034,542 |
| Morgan Stanley, 2.20%, 12/7/18 | 4,016,000 | 4,013,933 |
| National Australia Bank Ltd., 3.625%, 6/20/23 | 1,867,000 | 1,859,493 |
| Regency Centers LP, 3.75%, 6/15/24 | 1,500,000 | 1,466,964 |
| Toronto-Dominion Bank (The), 1.85%, 9/11/20 | 3,624,000 | 3,542,609 |
| | | 30,752,347 |
| | | |
| Government - 11.0% | | |
| African Development Bank, 1.375%, 12/17/18 | 2,200,000 | 2,195,712 |
| Asian Development Bank: | | |
| 1.00%, 8/16/19 | 1,800,000 | 1,773,382 |
| 1.875%, 8/10/22 | 1,000,000 | 957,704 |
www.calvert.com CALVERT GREEN BOND FUND ANNUAL REPORT 7
|
| | |
| | PRINCIPAL AMOUNT ($) | VALUE ($) |
| CORPORATE BONDS - CONT’D | | |
| 2.125%, 3/19/25 | 750,000 | 704,847 |
| 2.375%, 8/10/27 | 750,000 | 703,524 |
| 3.125%, 9/26/28 | 800,000 | 794,443 |
| European Bank for Reconstruction & Development, 0.875%, 7/22/19 | 1,275,000 | 1,257,112 |
| European Investment Bank: | | |
| 2.375%, 5/24/27 | 3,250,000 | 3,050,342 |
| 2.50%, 10/15/24 | 600,000 | 578,842 |
| International Bank for Reconstruction & Development, 1.005%, 10/1/18 | 625,000 | 625,000 |
| International Finance Corp.: | | |
| 2.00%, 10/24/22 | 2,450,000 | 2,352,788 |
| 2.125%, 4/7/26 | 1,500,000 | 1,399,259 |
| Nordic Investment Bank, 2.25%, 9/30/21 | 750,000 | 733,046 |
| | | 17,126,001 |
| | | |
| Industrial - 1.9% | | |
| Xylem, Inc.: | | |
| 3.25%, 11/1/26 | 1,549,000 | 1,456,608 |
| 4.375%, 11/1/46 | 1,590,000 | 1,527,618 |
| | | 2,984,226 |
| | | |
| Technology - 5.4% | | |
| Apple, Inc.: | | |
| 2.85%, 2/23/23 | 2,500,000 | 2,456,896 |
| 3.00%, 6/20/27 | 1,746,000 | 1,662,350 |
| DXC Technology Co.: | | |
| 3.271%, (3 mo. USD LIBOR + 0.95%), 3/1/21 (3) | 2,250,000 | 2,250,039 |
| 4.75%, 4/15/27 | 800,000 | 819,894 |
| Microsoft Corp.: | | |
| 3.75%, 2/12/45 | 641,000 | 621,116 |
| 4.45%, 11/3/45 | 575,000 | 617,207 |
| | | 8,427,502 |
| | | |
| Utilities - 9.5% | | |
| American Water Capital Corp.: | | |
| 2.95%, 9/1/27 | 480,000 | 449,410 |
| 3.40%, 3/1/25 | 850,000 | 835,140 |
| 4.00%, 12/1/46 | 500,000 | 468,220 |
| Avangrid, Inc., 3.15%, 12/1/24 | 4,583,000 | 4,373,251 |
| Clearway Energy Operating LLC, 5.375%, 8/15/24 | 1,185,000 | 1,196,850 |
| NextEra Energy Operating Partners LP: | | |
| 4.25%, 9/15/24 (1) | 1,825,000 | 1,795,344 |
| 4.50%, 9/15/27 (1) | 1,185,000 | 1,139,081 |
| | | |
8 www.calvert.com CALVERT GREEN BOND FUND ANNUAL REPORT
|
| | |
| | PRINCIPAL AMOUNT ($) | VALUE ($) |
| CORPORATE BONDS - CONT’D | | |
| Public Service Co. of Colorado: | | |
| 3.70%, 6/15/28 | 1,978,000 | 1,979,287 |
| 4.10%, 6/15/48 | 1,000,000 | 995,536 |
| Terraform Global Operating LLC, 6.125%, 3/1/26 (1) | 1,595,000 | 1,535,188 |
| | | 14,767,307 |
| | | |
| Total Corporate Bonds (Cost $85,624,633) | | 84,016,863 |
| | | |
| | | |
| SOVEREIGN GOVERNMENT BONDS - 17.5% | | |
| Canada - 3.1% | | |
| Export Development Canada: | | |
| 1.25%, 12/10/18 | 1,230,000 | 1,226,797 |
| 1.625%, 6/1/20 | 2,025,000 | 1,982,303 |
| Province of Ontario Canada, 2.65%, 2/5/25 | 2,000,000 | 1,528,587 |
| | | 4,737,687 |
| | | |
| Finland - 3.1% | | |
| Municipality Finance plc, 1.375%, 9/21/21 (1) | 5,000,000 | 4,759,455 |
| | | |
| France - 1.5% | | |
| French Republic Government Bond OAT, 1.75%, 6/25/39 (1)(5) | 1,900,000 | 2,343,840 |
| | | |
| Germany - 2.9% | | |
| Kreditanstalt fuer Wiederaufbau: | | |
| 1.75%, 10/15/19 | 1,200,000 | 1,187,836 |
| 1.875%, 11/30/20 | 1,500,000 | 1,466,921 |
| 2.00%, 9/29/22 | 2,000,000 | 1,921,402 |
| | | 4,576,159 |
| | | |
| Mexico - 0.5% | | |
| Nacional Financiera SNC, 3.375%, 11/5/20 (1) | 750,000 | 745,320 |
| | | |
| Netherlands - 2.0% | | |
| Bank Nederlandse Gemeenten NV, 1.625%, 11/25/19 (1) | 1,500,000 | 1,479,582 |
| Nederlandse Waterschapsbank NV, 2.375%, 3/24/26 (1) | 1,700,000 | 1,601,798 |
| | | 3,081,380 |
| | | |
| Norway - 0.6% | | |
| Kommunalbanken AS, 1.375%, 10/26/20 (1) | 1,000,000 | 967,881 |
| | | |
| South Korea - 0.6% | | |
| Export-Import Bank of Korea, 2.125%, 2/11/21 | 1,000,000 | 969,812 |
| | | |
www.calvert.com CALVERT GREEN BOND FUND ANNUAL REPORT 9
|
| | |
| | PRINCIPAL AMOUNT ($) | VALUE ($) |
| SOVEREIGN GOVERNMENT BONDS - CONT’D | | |
| Sweden - 3.2% | | |
| Kommuninvest i Sverige AB: | | |
| 1.50%, 4/23/19 (1) | 1,000,000 | 993,954 |
| 1.875%, 6/1/21 (1) | 1,600,000 | 1,552,159 |
| Svensk Exportkredit AB, 1.875%, 6/23/20 | 2,500,000 | 2,454,456 |
| | | 5,000,569 |
| | | |
| Total Sovereign Government Bonds (Cost $27,654,655) | | 27,182,103 |
| | | |
| | | |
| ASSET-BACKED SECURITIES - 14.4% | | |
| Mosaic Solar Loan Trust, Series 2018-1A, Class A, 4.01%, 6/22/43 (1) | 1,364,016 | 1,353,956 |
| Mosaic Solar Loans LLC, Series 2017-1A, Class A, 4.45%, 6/20/42 (1) | 901,495 | 908,903 |
| RenewFund Receivables Trust, Series 2015-1, Class A, 3.51%, 4/15/25 (1) | 115,335 | 114,163 |
| SolarCity LMC: | | |
| Series 2013-1, Class A, 4.80%, 11/20/38 (1) | 219,372 | 220,823 |
| Series 2014-2, Class A, 4.02%, 7/20/44 (1) | 1,736,918 | 1,703,613 |
| Series 2014-2, Class B, 5.44%, 7/20/44 (1) | 176,050 | 169,202 |
| Spruce ABS Trust, Series 2016-E1, Class A, 4.32%, 6/15/28 (1) | 861,059 | 864,172 |
| Sunrun Callisto Issuer LLC, Series 2015-1A, Class B, 5.38%, 7/20/45 (1) | 887,619 | 860,603 |
| TES LLC, Series 2017-1A, Class A, 4.33%, 10/20/47 (1) | 463,790 | 453,547 |
| Tesla Auto Lease Trust, Series 2018-A, Class A, 2.32%, 12/20/19 (1) | 6,786,851 | 6,769,200 |
| Toyota Auto Receivables Owner Trust: | | |
| Series 2016-B, Class A3, 1.30%, 4/15/20 | 2,087,821 | 2,078,834 |
| Series 2016-B, Class A4, 1.52%, 8/16/21 | 5,500,000 | 5,426,595 |
| Vivint Solar Financing V LLC, Series 2018-1A, Class A, 4.73%, 4/30/48 (1) | 1,500,000 | 1,496,840 |
| | | |
| Total Asset-Backed Securities (Cost $22,494,679) | | 22,420,451 |
| | | |
| | | |
| TAXABLE MUNICIPAL OBLIGATIONS - 4.4% | | |
| General Obligations - 2.1% | | |
| Massachusetts, Green Bonds, 3.277%, 6/1/46 | 3,775,000 | 3,343,933 |
| | | |
| Water and Sewer - 2.3% | | |
| District of Columbia Water & Sewer Authority, Green Bonds, 4.814%, 10/1/2114 | 1,225,000 | 1,338,913 |
| Massachusetts Water Pollution Abatement Trust, 5.192%, 8/1/40 (6) | 150,000 | 163,162 |
| Metropolitan Water District of Southern California, 6.947%, 7/1/40 (6) | 250,000 | 265,967 |
| New York City Municipal Water Finance Authority, NY, (Water and Sewer System), 5.882%, 6/15/44 (6) | 605,000 | 769,705 |
| New York Environmental Facilities Corp., Green Bonds, 2.25%, 7/15/20 | 1,040,000 | 1,028,373 |
| | | 3,566,120 |
| | | |
| Total Taxable Municipal Obligations (Cost $7,260,753) | | 6,910,053 |
| | | |
10 www.calvert.com CALVERT GREEN BOND FUND ANNUAL REPORT
|
| | |
| | PRINCIPAL AMOUNT ($) | VALUE ($) |
| U.S. GOVERNMENT AGENCY MORTGAGE-BACKED SECURITIES - 7.5% | | |
| Federal National Mortgage Association: | | |
| 2.647%, 7/25/24(7) | 1,930,000 | 1,867,515 |
| 2.65%, 6/1/26 | 1,925,402 | 1,840,220 |
| 2.68%, 7/1/26 | 2,000,000 | 1,905,531 |
| 2.878%, 2/25/27(7) | 948,918 | 929,061 |
| 3.037%, 9/25/27(7) | 3,475,000 | 3,309,012 |
| 3.144%, 3/25/28(7) | 940,000 | 900,788 |
| 3.436%, 6/25/28(7) | 923,077 | 903,031 |
| | | |
| Total U.S. Government Agency Mortgage-Backed Securities (Cost $12,083,957) | | 11,655,158 |
| | | |
| | | |
| U.S. GOVERNMENT AGENCIES AND INSTRUMENTALITIES - 0.6% | | |
| Overseas Private Investment Corp.: | | |
| 3.16%, 6/1/33 | 180,852 | 175,135 |
| 3.22%, 9/15/29 | 774,454 | 770,374 |
| | | |
| Total U.S. Government Agencies and Instrumentalities (Cost $955,306) | | 945,509 |
| | | |
| | | |
| HIGH SOCIAL IMPACT INVESTMENTS - 0.1% | | |
| Calvert Impact Capital, Inc., Community Investment Notes, 1.50%, 12/15/19 (8)(9) | 150,000 | 144,353 |
| | | |
| Total High Social Impact Investments (Cost $150,000) | | 144,353 |
| | | |
| | | |
| | SHARES | VALUE ($) |
| SHORT TERM INVESTMENT OF CASH COLLATERAL FOR SECURITIES LOANED - 0.0% (10) | |
| State Street Navigator Securities Lending Government Money Market Portfolio, 2.16% | 48,000 | 48,000 |
| | | |
| Total Short Term Investment of Cash Collateral for Securities Loaned (Cost $48,000) | | 48,000 |
| | | |
| | | |
| TOTAL INVESTMENTS (Cost $156,271,983) - 98.5% | | 153,322,490 |
| Other assets and liabilities, net - 1.5% | | 2,384,903 |
NET ASSETS - 100.0% | | 155,707,393 |
www.calvert.com CALVERT GREEN BOND FUND ANNUAL REPORT 11
|
| | |
| NOTES TO SCHEDULE OF INVESTMENTS |
| (1) Security is exempt from registration under Rule 144A of the Securities Act of 1933. These securities may be resold in transactions exempt from registration, normally to qualified institutional buyers. Total market value of Rule 144A securities amounts to $43,152,763, which represents 27.7% of the net assets of the Fund as of September 30, 2018. |
| (2) Security converts to floating rate after the indicated fixed-rate coupon period. |
| (3) Variable rate security. The stated interest rate represents the rate in effect at September 30, 2018. |
| (4) All or a portion of this security was on loan at September 30, 2018. The aggregate market value of securities on loan at September 30, 2018 was $47,025. |
| (5) Security exempt from registration under Regulation S of the Securities Act of 1933, which exempts from registration securities offered and sold outside the United States. Security may not be offered or sold in the United States except pursuant to an exemption from, or in a transaction not subject to, the registration requirements of the Securities Act of 1933. At September 30, 2018, the aggregate value of these securities is $2,343,840 or 1.5% of the Fund’s net assets. |
| (6) Build America Bond. Represents taxable municipal obligation issued pursuant to the American Recovery and Reinvestment Act of 2009 or other legislation providing for the issuance of taxable municipal debt on which the issuer receives federal support. |
| (7) Weighted average fixed-rate coupon that changes/updates monthly. Rate shown is the rate at September 30, 2018. |
| (8) Restricted security. Total market value of restricted securities amounts to $144,353, which represents 0.1% of the net assets of the Fund as of September 30, 2018. |
| (9) Affiliated company (see Note 8). |
| (10) Amount is less than 0.05%. |
| |
| Abbreviations: |
| LIBOR: | London Interbank Offered Rate | |
| USD: | United States Dollar | |
|
| | | | | | | | |
| FUTURES CONTRACTS | NUMBER OF
CONTRACTS | EXPIRATION
MONTH/YEAR | NOTIONAL AMOUNT | VALUE/NET UNREALIZED
APPRECIATION
(DEPRECIATION) |
| Long: | | | | |
| U.S. Ultra 10-Year Treasury Note | 14 | Dec-18 |
| $1,764,000 |
|
| ($24,307 | ) |
| U.S. Ultra-Long Treasury Bond | 6 | Dec-18 | 925,688 |
| (27,386) |
|
| Total Long | | | |
| ($51,693 | ) |
|
| | |
| RESTRICTED SECURITIES | ACQUISITION
DATE | COST ($) |
| Calvert Impact Capital, Inc., Community Investment Notes, 1.50%, 12/15/19 | 12/15/16 | 150,000 |
| See notes to financial statements. | |
12 www.calvert.com CALVERT GREEN BOND FUND ANNUAL REPORT
CALVERT GREEN BOND FUND
STATEMENT OF ASSETS AND LIABILITIES
SEPTEMBER 30, 2018
|
| | | |
| ASSETS | |
Investments in securities of unaffiliated issuers, at value (identified cost $156,121,983) - including $47,025 of securities on loan |
| $153,178,137 |
|
| Investments in securities of affiliated issuers, at value (identified cost $150,000) | 144,353 |
|
| Cash | 5,100,171 |
|
| Receivable for capital shares sold | 525,048 |
|
| Interest receivable | 964,223 |
|
| Interest receivable - affiliated | 1,813 |
|
| Securities lending income receivable | 107 |
|
| Receivable from affiliate | 26,182 |
|
| Deposits at broker for futures contracts | 38,700 |
|
| Directors’ deferred compensation plan | 68,080 |
|
| Other assets | 2,455 |
|
| Total assets | 160,049,269 |
|
| | |
| LIABILITIES | |
| Payable for variation margin on open futures contracts | 2,058 |
|
| Payable for investments purchased | 3,975,850 |
|
| Payable for capital shares redeemed | 94,561 |
|
| Deposits for securities loaned | 48,000 |
|
| Payable to affiliates: | |
| Investment advisory fee | 37,906 |
|
| Administrative fee | 15,162 |
|
| Distribution and service fees | 8,691 |
|
| Sub-transfer agency fee | 4,866 |
|
| Directors’ deferred compensation plan | 68,080 |
|
| Accrued expenses | 86,702 |
|
| Total liabilities | 4,341,876 |
|
| NET ASSETS |
| $155,707,393 |
|
| | |
| NET ASSETS CONSIST OF: | |
| Paid-in capital applicable to common stock | |
| (75,000,000 shares per class of $0.01 par value authorized) |
| $158,630,784 |
|
| Accumulated loss | (2,923,391) |
|
| Total |
| $155,707,393 |
|
| | |
| NET ASSET VALUE PER SHARE | |
| Class A (based on net assets of $42,610,805 and 2,876,169 shares outstanding) |
| $14.82 |
|
| Class I (based on net assets of $113,096,588 and 7,625,698 shares outstanding) |
| $14.83 |
|
| | |
| OFFERING PRICE PER SHARE* | |
| Class A (100/96.25 of net asset value per share) |
| $15.40 |
|
| * On sales of $50,000 or more, the offering price of Class A shares is reduced. | |
| See notes to financial statements. |
www.calvert.com CALVERT GREEN BOND FUND ANNUAL REPORT 13
CALVERT GREEN BOND FUND
STATEMENT OF OPERATIONS
YEAR ENDED SEPTEMBER 30, 2018
|
| | | |
| INVESTMENT INCOME | |
| Interest income (net of foreign taxes withheld of $1,899) |
| $3,320,759 |
|
| Interest income - affiliated issuers | 2,250 |
|
| Securities lending income, net | 420 |
|
| Total investment income | 3,323,429 |
|
| | |
| EXPENSES | |
| Investment advisory fee | 368,126 |
|
| Administrative fee | 147,123 |
|
| Distribution and service fees: | |
| Class A | 101,895 |
|
| Directors’ fees and expenses | 6,504 |
|
| Custodian fees | 31,835 |
|
| Transfer agency fees and expenses | 168,714 |
|
| Accounting fees | 29,790 |
|
| Professional fees | 35,925 |
|
| Registration fees | 82,558 |
|
| Reports to shareholders | 18,401 |
|
| Miscellaneous | 19,359 |
|
| Total expenses | 1,010,230 |
|
| Waiver and/or reimbursement of expenses by affiliate | (242,467) |
|
| Reimbursement of expenses-other | (2,455) |
|
| Net expenses | 765,308 |
|
| Net investment income | 2,558,121 |
|
| | |
| | |
| REALIZED AND UNREALIZED GAIN (LOSS) | |
| Net realized gain (loss) on: | |
| Investment securities - unaffiliated issuers | (81,083) |
|
| Futures contracts | 164,655 |
|
| Foreign currency transactions | (3,598) |
|
| | 79,974 |
|
| | |
| Net change in unrealized appreciation (depreciation) on: | |
| Investment securities - unaffiliated issuers | (3,090,655) |
|
| Investment securities - affiliated issuers | 1,391 |
|
| Futures contracts | (100,162) |
|
| Foreign currency | 28,961 |
|
| | (3,160,465) |
|
| | |
| Net realized and unrealized loss | (3,080,491) |
|
| | |
| Net decrease in net assets resulting from operations |
| ($522,370 | ) |
| See notes to financial statements. |
14 www.calvert.com CALVERT GREEN BOND FUND ANNUAL REPORT
CALVERT GREEN BOND FUND
STATEMENTS OF CHANGES IN NET ASSETS
|
| | | | | | | |
| INCREASE (DECREASE) IN NET ASSETS | Year Ended
September 30, 2018 | | Year Ended
September 30, 2017 |
| Operations: | | | |
| Net investment income |
| $2,558,121 |
| |
| $1,470,236 |
|
| Net realized gain | 79,974 |
| | 1,031,700 |
|
| Net change in unrealized appreciation (depreciation) | (3,160,465) |
| | (1,605,393) |
|
| Net increase (decrease) in net assets resulting from operations | (522,370) |
| | 896,543 |
|
| | | | |
Distributions to shareholders:(1) | | | |
| Class A shares | (1,028,519) |
| | (852,398) |
|
| Class I shares | (2,084,302) |
| | (677,987) |
|
| Class Y shares | (113,468) |
| | (672,240) |
|
| Total distributions to shareholders | (3,226,289) |
| | (2,202,625) |
|
| | | | |
| Capital share transactions: | | | |
| Class A shares | 5,971,148 |
| | 9,598,590 |
|
| Class I shares | 91,774,077 |
| | 215,879 |
|
Class Y shares (2) | (35,779,108) |
| | 19,162,573 |
|
| Net increase in net assets from capital share transactions | 61,966,117 |
| | 28,977,042 |
|
| | | | |
| TOTAL INCREASE IN NET ASSETS | 58,217,458 |
| | 27,670,960 |
|
| | | | |
| | | | |
| NET ASSETS | | | |
| Beginning of year | 97,489,935 |
| | 69,818,975 |
|
| End of year |
| $155,707,393 |
| | $97,489,935(3) |
|
| | | | |
| | | | |
(1) For the year ended September 30, 2017, the source of distributions was as follows: Net investment income - Class A ($541,024), Class I ($442,121), and Class Y ($484,967) Net realized capital gain - Class A ($311,374), Class I ($235,866), and Class Y ($187,273) |
(2) Effective December 8, 2017, Class Y shares of the Fund converted to Class I shares at net asset value. Thereafter, Class Y shares were terminated. |
(3) Includes accumulated undistributed net investment income of $1,132 at September 30, 2017. The requirement to disclose the corresponding amount as of September 30, 2018 was eliminated. |
| See notes to financial statements. | | |
www.calvert.com CALVERT GREEN BOND FUND ANNUAL REPORT 15
CALVERT GREEN BOND FUND
FINANCIAL HIGHLIGHTS
|
| | | | | | | | | | | | | | | |
| | Year Ended September 30, | | Period Ended September 30, | |
| CLASS A SHARES | 2018 | | 2017 | | 2016 | | 2015 | | 2014(1) | |
| Net asset value, beginning | $15.32 | | $15.64 | | $15.14 | | $15.20 | | $15.00 | |
| Income from investment operations: | | | | | | | | | | |
Net investment income (2) | 0.27 |
| | 0.26 |
| | 0.25 |
| | 0.23 |
| | 0.17 |
| |
| Net realized and unrealized gain (loss) | (0.39) |
| | (0.16) |
| | 0.53 |
| | 0.06 |
| | 0.17 |
| |
| Total from investment operations | (0.12) |
| | 0.10 |
| | 0.78 |
| | 0.29 |
| | 0.34 |
| |
| Distributions from: | | | | | | | | | | |
| Net investment income | (0.27) |
| | (0.26) |
| | (0.25) |
| | (0.22) |
| | (0.14) |
| |
| Net realized gain | (0.11) |
| | (0.16) |
| | (0.03) |
| | (0.13) |
| | — |
| |
| Total distributions | (0.38) |
| | (0.42) |
| | (0.28) |
| | (0.35) |
| | (0.14) |
| |
| Total increase (decrease) in net asset value | (0.50) |
| | (0.32) |
| | 0.50 |
| | (0.06) |
| | 0.20 |
| |
| Net asset value, ending | $14.82 | | $15.32 | | $15.64 | | $15.14 | | $15.20 | |
Total return (3) | (0.80 | %) | | 0.71 | % | | 5.21 | % | | 1.95 | % | | 2.29 | % | |
Ratios to average net assets: (4) | | | | | | | | | | |
| Total expenses | 0.99 | % | | 1.04 | % | | 1.12 | % | | 1.24 | % | | 1.99 | % | (5) |
| Net expenses | 0.85 | % | | 0.88 | % | | 0.88 | % | | 0.88 | % | | 0.88 | % | (5) |
| Net investment income | 1.83 | % | | 1.71 | % | | 1.64 | % | | 1.49 | % | | 1.21 | % | (5) |
| Portfolio turnover | 16 | % | | 43 | % | | 243 | % | | 444 | % | | 545 | % | |
| Net assets, ending (in thousands) | $42,611 | | $38,011 | | $28,987 | | $23,108 | | $10,622 | |
| | | | | | | | | | | |
(1) From October 31, 2013 inception. |
(2) Computed using average shares outstanding. |
(3) Returns are historical and are calculated by determining the percentage change in net asset value with all distributions reinvested and do not reflect the effect of sales charges, if any. |
(4) Total expenses do not reflect amounts reimbursed and/or waived by the adviser and certain of its affiliates, if applicable. Net expenses are net of all reductions and represent the net expenses paid by the Fund. |
(5) Annualized. |
| See notes to financial statements. |
16 www.calvert.com CALVERT GREEN BOND FUND ANNUAL REPORT
CALVERT GREEN BOND FUND
FINANCIAL HIGHLIGHTS
|
| | | | | | | | | | | | | | | |
| | Year Ended September 30, | | Period Ended September 30, | |
| CLASS I SHARES | 2018 | | 2017 | | 2016 | | 2015 | | 2014(1) | |
| Net asset value, beginning | $15.32 | | $15.63 | | $15.13 | | $15.18 | | $15.00 | |
| Income from investment operations: | | | | | | | | | | |
Net investment income (2) | 0.33 |
| | 0.32 |
| | 0.31 |
| | 0.29 |
| | 0.21 |
| |
| Net realized and unrealized gain (loss) | (0.40) |
| | (0.15) |
| | 0.53 |
| | 0.06 |
| | 0.18 |
| |
| Total from investment operations | (0.07) |
| | 0.17 |
| | 0.84 |
| | 0.35 |
| | 0.39 |
| |
| Distributions from: | | | | | | | | | | |
| Net investment income | (0.31) |
| | (0.32) |
| | (0.31) |
| | (0.27) |
| | (0.21) |
| |
| Net realized gain | (0.11) |
| | (0.16) |
| | (0.03) |
| | (0.13) |
| | — |
| |
| Total distributions | (0.42) |
| | (0.48) |
| | (0.34) |
| | (0.40) |
| | (0.21) |
| |
| Total increase (decrease) in net asset value | (0.49) |
| | (0.31) |
| | 0.50 |
| | (0.05) |
| | 0.18 |
| |
| Net asset value, ending | $14.83 | | $15.32 | | $15.63 | | $15.13 | | $15.18 | |
Total return (3) | (0.48 | %) | | 1.15 | % | | 5.60 | % | | 2.36 | % | | 2.58 | % | |
Ratios to average net assets: (4) | | | | | | | | | | |
| Total expenses | 0.74 | % | | 0.68 | % | | 0.67 | % | | 0.76 | % | | 1.17 | % | (5) |
| Net expenses | 0.50 | % | | 0.50 | % | | 0.50 | % | | 0.50 | % | | 0.50 | % | (5) |
| Net investment income | 2.24 | % | | 2.09 | % | | 2.01 | % | | 1.89 | % | | 1.51 | % | (5) |
| Portfolio turnover | 16 | % | | 43 | % | | 243 | % | | 444 | % | | 545 | % | |
| Net assets, ending (in thousands) | $113,097 | | $23,641 | | $23,908 | | $28,540 | | $12,994 | |
| | | | | | | | | | | |
(1) From October 31, 2013 inception. |
(2) Computed using average shares outstanding. |
(3) Returns are historical and are calculated by determining the percentage change in net asset value with all distributions reinvested and do not reflect the effect of sales charges, if any. |
(4) Total expenses do not reflect amounts reimbursed and/or waived by the adviser and certain of its affiliates, if applicable. Net expenses are net of all reductions and represent the net expenses paid by the Fund. |
(5) Annualized. |
| See notes to financial statements. |
www.calvert.com CALVERT GREEN BOND FUND ANNUAL REPORT 17
NOTES TO FINANCIAL STATEMENTS
NOTE 1 — SIGNIFICANT ACCOUNTING POLICIES
Calvert Green Bond Fund (the Fund) is a diversified series of Calvert Impact Fund, Inc. (the Corporation). The Corporation is a Maryland corporation registered under the Investment Company Act of 1940, as amended (the 1940 Act), as an open-end management investment company. The investment objective of the Fund is to seek to maximize income, to the extent consistent with preservation of capital, primarily through investments in bonds. The Fund invests primarily in “green” investments which include those issued by companies that develop or provide products or services that seek to provide environmental solutions or that support environmental projects, among others.
The Fund offers two classes of shares. Class A shares are generally sold subject to a sales charge imposed at time of purchase. A contingent deferred sales charge of 0.80% may apply to certain redemptions of Class A shares for accounts for which no sales charge was paid, if redeemed within one year of purchase. Class I shares are sold at net asset value, are not subject to a sales charge and are sold only to certain eligible investors. The Fund previously offered Class Y shares. At the close of business on December 8, 2017, Class Y shares were converted to Class I shares. Each class represents a pro rata interest in the Fund, but votes separately on class-specific matters and is subject to different expenses.
The Fund applies the accounting and reporting guidance in the Financial Accounting Standards Board (FASB) Accounting Standards Codification Topic 946, Financial Services – Investment Companies (ASC 946). Subsequent events, if any, through the date that the financial statements were issued have been evaluated in the preparation of the financial statements.
A. Investment Valuation: Net asset value per share is determined every business day as of the close of the regular session of the New York Stock Exchange (generally 4:00 p.m. Eastern time). The Fund uses independent pricing services approved by the Board of Directors (the Board) to value its investments wherever possible. Investments for which market quotations are not available or deemed not reliable are fair valued in good faith under the direction of the Board.
U.S. generally accepted accounting principles (U.S. GAAP) establishes a disclosure hierarchy that categorizes the inputs to valuation techniques used to value assets and liabilities at measurement date. These inputs are summarized in the three broad levels listed below:
Level 1 - quoted prices in active markets for identical securities
Level 2 - other significant observable inputs (including quoted prices for similar securities, interest rates, prepayment speeds, credit risk, etc.)
Level 3 - significant unobservable inputs (including the Fund’s own assumptions in determining the fair value of investments)
The inputs or methodologies used for valuing securities are not necessarily an indication of the risk associated with investing in those securities.
Valuation techniques used to value the Fund’s investments by major category are as follows:
Debt Securities. Debt securities are generally valued on the basis of valuations provided by third party pricing services, as derived from such services’ pricing models. Inputs to the models may include, but are not limited to, reported trades, executable bid and asked prices, broker/dealer quotations, prices or yields of securities with similar characteristics, interest rates, anticipated prepayments, benchmark curves or information pertaining to the issuer, as well as industry and economic events. Accordingly, debt securities are generally categorized as Level 2 in the hierarchy. Short-term debt securities of sufficient credit quality purchased with remaining maturities of sixty days or less for which a valuation from a third party pricing service is not readily available may be valued at amortized cost, which approximates fair value, and are categorized as Level 2 in the hierarchy.
Other Securities. Investments in registered investment companies (including money market funds) that do not trade on an exchange are valued at the net asset value per share on the valuation day and are categorized as Level 1 in the hierarchy.
Derivatives. Futures contracts are valued at unrealized appreciation (depreciation) based on the settlement price established each day by the board of trade or exchange on which they are traded and are categorized as Level 1 in the hierarchy.
Fair Valuation. If a market value cannot be determined for a security using the methodologies described above, or if, in the good faith opinion of the Fund’s adviser, the market value does not constitute a readily available market quotation, or if a significant event has occurred that would materially affect the value of the security, the security will be fair valued as determined in good faith by or at the direction of the Board in a manner that fairly reflects the security’s value, or the amount that the Fund might reasonably expect to receive for the security upon its current sale in the ordinary course. Each such determination is based on a consideration of relevant factors, which are likely to vary from one pricing context to another. These factors may include, but are not limited to, the type of security, the existence of any contractual restrictions on the security’s disposition, the price and extent of public trading in similar securities of the issuer or of comparable companies or entities, quotations or relevant information
18 www.calvert.com CALVERT GREEN BOND FUND ANNUAL REPORT
obtained from broker/dealers or other market participants, information obtained from the issuer, analysts, and/or the appropriate stock exchange (for exchange-traded securities), an analysis of the company’s or entity’s financial condition, and an evaluation of the forces that influence the issuer and the market(s) in which the security is purchased and sold.
The values assigned to fair value investments are based on available information and do not necessarily represent amounts that might ultimately be realized. Further, due to the inherent uncertainty of valuations of such investments, the fair values may differ significantly from the values that would have been used had an active market existed, and the differences could be material.
The following table summarizes the market value of the Fund’s holdings as of September 30, 2018, based on the inputs used to value them:
|
| | | | | | | | | | | | |
| Assets | Level 1 | Level 2 | Level 3 | Total |
| Corporate Bonds | $ | — |
| $ | 84,016,863 |
| $ | — |
| $ | 84,016,863 |
|
| Sovereign Government Bonds | — |
| 27,182,103 |
| — |
| 27,182,103 |
|
| Asset-Backed Securities | — |
| 22,420,451 |
| — |
| 22,420,451 |
|
| Taxable Municipal Obligations | — |
| 6,910,053 |
| — |
| 6,910,053 |
|
| U.S. Government Agency Mortgage-Backed Securities | — |
| 11,655,158 |
| — |
| 11,655,158 |
|
| U.S. Government Agencies and Instrumentalities | — |
| 945,509 |
| — |
| 945,509 |
|
| High Social Impact Investments | — |
| 144,353 |
| — |
| 144,353 |
|
| Short Term Investment of Cash Collateral for Securities Loaned | 48,000 |
| — |
| — |
| 48,000 |
|
| Total Investments | $ | 48,000 |
| $ | 153,274,490 |
| $ | — |
| $ | 153,322,490 |
|
| | | | | |
| Liabilities | | | | |
Futures Contracts(1) | $ | (51,693 | ) | $ | — |
| $ | — |
| $ | (51,693 | ) |
(1) The value listed reflects unrealized appreciation (depreciation) as shown in the Schedule of Investments. |
B. Investment Transactions and Income: Investment transactions for financial statement purposes are accounted for on trade date. Realized gains and losses are recorded on an identified cost basis and may include proceeds from litigation. Withholding taxes on foreign interest, if any, have been provided for in accordance with the Fund’s understanding of the applicable country’s tax rules and rates. Interest income, which includes amortization of premium and accretion of discount on debt securities, is accrued as earned.
C. Share Class Accounting: Realized and unrealized gains and losses and net investment income and losses, other than class-specific expenses, are allocated daily to each class of shares based upon the relative net assets of each class to the total net assets of the Fund. Expenses arising in connection with a specific class are charged directly to that class.
D. Foreign Currency Transactions: The Fund’s accounting records are maintained in U.S. dollars. For valuation of assets and liabilities on each date of net asset value determination, foreign denominations are converted into U.S. dollars using the current exchange rate. Security transactions, income, and expenses are translated at the prevailing rate of exchange on the date of the event. Recognized gains or losses on investment transactions attributable to changes in foreign currency exchange rates are recorded for financial statement purposes as net realized gains and losses on investments. That portion of unrealized gains and losses on investments that results from fluctuations in foreign currency exchange rates is not separately disclosed.
E. Futures Contracts: The Fund may enter into futures contracts to buy or sell a financial instrument for a set price at a future date. Initial margin deposits of either cash or securities as required by the broker are made upon entering into the contract. While the contract is open, daily variation margin payments are made to or received from the broker reflecting the daily change in market value of the contract and are recorded for financial reporting purposes as unrealized gains or losses by the Fund. When a futures contract is closed, a realized gain or loss is recorded equal to the difference between the opening and closing value of the contract. The risks associated with entering into futures contracts may include the possible illiquidity of the secondary market which would limit the Fund’s ability to close out a futures contract prior to the settlement date, an imperfect correlation between the value of the contracts and the underlying financial instruments, or that the counterparty will fail to perform its obligations under the contracts’ terms. Futures contracts are designed by boards of trade which are designated “contracts markets” by the Commodities Futures Trading Commission. Futures contracts trade on the contracts markets in a manner that is similar to the way a stock trades on a stock exchange, and the boards of trade, through their clearing corporations, guarantee the futures contracts against default. As a result, there is minimal counterparty credit risk to the Fund.
F. Restricted Securities: The Fund may invest in securities that are subject to legal or contractual restrictions on resale. Generally, these securities may only be sold publicly upon registration under the Securities Act of 1933 or in transactions exempt
www.calvert.com CALVERT GREEN BOND FUND ANNUAL REPORT 19
from such registration. Information regarding restricted securities (excluding Rule 144A securities) is included at the end of the Schedule of Investments.
G. Distributions to Shareholders: Distributions to shareholders are recorded by the Fund on ex-dividend date. Dividends from net investment income are declared and paid monthly. Distributions from net realized capital gains, if any, are paid at least annually. Distributions are determined in accordance with income tax regulations which may differ from U.S. GAAP; accordingly, periodic reclassifications are made within the Fund’s capital accounts to reflect income and gains available for distribution under income tax regulations.
H. Estimates: The preparation of financial statements in conformity with U.S. GAAP requires management to make estimates and assumptions that affect the reported amounts of assets and liabilities and disclosure of contingent assets and liabilities at the date of the financial statements and the reported amounts of increases and decreases in net assets from operations during the reporting period. Actual results could differ from those estimates.
I. Indemnifications: The Corporation’s By-Laws provide for indemnification for Directors or officers of the Corporation and certain other parties, to the fullest extent permitted by Maryland law and the 1940 Act, provided certain conditions are met. Additionally, in the normal course of business, the Fund enters into agreements with service providers that may contain indemnification clauses. The Fund’s maximum exposure under these arrangements is unknown as this would involve future claims that may be made against the Fund that have not yet occurred.
J. Federal Income Taxes: No provision for federal income or excise tax is required since the Fund intends to continue to qualify as a regulated investment company under the Internal Revenue Code and to distribute substantially all of its taxable earnings.
Management has analyzed the Fund’s tax positions taken for all open federal income tax years and has concluded that no provision for federal income tax is required in the Fund’s financial statements. A Fund’s federal tax return is subject to examination by the Internal Revenue Service for a period of three years from the date of filing.
NOTE 2 — RELATED PARTY TRANSACTIONS
The investment advisory fee is earned by Calvert Research and Management (CRM), a subsidiary of Eaton Vance Management (EVM), as compensation for investment advisory services rendered to the Fund. Pursuant to the investment advisory agreement, CRM receives a fee, payable monthly, at the annual rate of 0.30% of the Fund’s average daily net assets. For the year ended September 30, 2018, the investment advisory fee amounted to $368,126.
CRM has agreed to reimburse the Fund’s operating expenses to the extent that total annual operating expenses (relating to ordinary operating expenses only and excluding expenses such as brokerage commissions, acquired fund fees and expenses of unaffiliated funds, interest expense, taxes or litigation expenses) exceed 0.85% and 0.50% for Class A and Class I, respectively, and prior to the close of business on December 8, 2017, 0.63% for Class Y, of such class’ average daily net assets. The expense reimbursement agreement with CRM may be changed or terminated after January 31, 2019. For the year ended September 30, 2018, CRM waived or reimbursed expenses of $239,673.
The administrative fee is earned by CRM as compensation for administrative services rendered to the Fund. The fee is computed at an annual rate of 0.12% of the Fund’s average daily net assets attributable to Class A and Class I (and Class Y prior to the close of business on December 8, 2017) and is payable monthly. CRM contractually waived 0.02% of the administrative fee through January 31, 2018 for Class I. For the year ended September 30, 2018, CRM was paid administrative fees of $147,123, of which $2,794 were waived.
The Fund has in effect a distribution plan for Class A shares (Class A Plan) pursuant to Rule 12b-1 under the 1940 Act. Pursuant to the Class A Plan, the Fund pays Eaton Vance Distributors, Inc. (EVD), an affiliate of CRM and the Fund’s principal underwriter, a distribution and service fee of 0.25% per annum of its average daily net assets attributable to Class A for distribution services and facilities provided to the Fund by EVD, as well as for personal services and/or the maintenance of shareholder accounts. Distribution and service fees paid or accrued for the year ended September 30, 2018 amounted to $101,895 for Class A shares.
The Fund was informed that EVD received $17,721 as its portion of the sales charge on sales of Class A shares and no contingent deferred sales charges paid by Fund shareholders for the year ended September 30, 2018.
EVM provides sub-transfer agency and related services to the Fund pursuant to a Sub-Transfer Agency Support Services Agreement. For the year ended September 30, 2018, sub-transfer agency fees and expenses incurred to EVM amounted to $24,360 and are included in transfer agency fees and expenses on the Statement of Operations.
Each Director of the Fund who is not an employee of CRM or its affiliates receives a fee of $3,000 for each Board meeting attended in person and $2,000 for each Board meeting attended by phone plus an annual fee of $52,000, and $1,500 for each Committee meeting attended in person and $1,000 for each Committee meeting attended by phone plus an annual Committee fee
20 www.calvert.com CALVERT GREEN BOND FUND ANNUAL REPORT
of $2,500. The Board chair receives an additional $10,000 annual retainer and Committee chairs receive an additional $6,000 annual retainer. Eligible Directors may participate in a Deferred Compensation Plan (the Plan). Amounts deferred under the Plan are treated as though equal dollar amounts had been invested in shares of the Fund or other Calvert funds selected by the Directors. The Fund purchases shares of the funds selected equal to the dollar amounts deferred under the Plan, resulting in an asset equal to the deferred compensation liability. Obligations of the Plan are paid solely from the Fund’s assets. Directors’ fees are allocated to each of the Calvert funds served. Salaries and fees of officers and Directors of the Fund who are employees of CRM or its affiliates are paid by CRM. In addition, an advisory council was established to aid the Board and CRM in advancing the cause of responsible investing through original scholarship and thought leadership. The advisory council consists of CRM’s Chief Executive Officer and four additional members. Each member (other than CRM’s Chief Executive Officer) receives annual compensation of $75,000, which is being reimbursed by Calvert Investment Management, Inc. (CIM), the Calvert funds’ former investment adviser and Ameritas Holding Company, CIM’s parent company, through the end of 2019. For the year ended September 30, 2018, the Fund’s allocated portion of such expense and reimbursement was $2,455, which are included in miscellaneous expense and reimbursement of expenses-other, respectively, on the Statement of Operations.
NOTE 3 — INVESTMENT ACTIVITY
During the year ended September 30, 2018, the cost of purchases and proceeds from sales of investments, other than U.S. government and agency securities and short-term securities, and including paydowns, were $74,005,223 and $18,341,007, respectively. Purchases and sales of U.S. government and agency securities, including paydowns, were $6,130,743 and $212,583, respectively.
NOTE 4 — DISTRIBUTIONS TO SHAREHOLDERS AND INCOME TAX INFORMATION
The tax character of distributions declared for the years ended September 30, 2018 and September 30, 2017 was as follows:
|
| | | | | | |
| | Year Ended September 30, |
| | 2018 | 2017 |
| Ordinary income |
| $2,723,930 |
|
| $1,875,004 |
|
| Long-term capital gains |
| $502,359 |
|
| $327,621 |
|
During the year ended September 30, 2018, accumulated loss was increased by $53,553 and paid-in capital was increased by $53,553 due to the Fund’s use of equalization accounting. Tax equalization accounting allows the Fund to treat as a distribution that portion of redemption proceeds representing a redeeming shareholder’s portion of undistributed taxable income and net capital gains. These reclassifications had no effect on the net assets or net asset value per share of the Fund.
As of September 30, 2018, the components of distributable earnings (accumulated loss) on a tax basis were as follows:
|
| | | |
| Undistributed ordinary income |
| $32,642 |
|
| Deferred capital losses |
| ($7,271 | ) |
| Net unrealized appreciation (depreciation) |
| ($2,948,762 | ) |
At September 30, 2018, the Fund, for federal income tax purposes, had deferred capital losses of $7,271 which would reduce the Fund’s taxable income arising from future net realized gains on investment transactions, if any, to the extent permitted by the Internal Revenue Code, and thus would reduce the amount of distributions to shareholders, which would otherwise be necessary to relieve the Fund of any liability for federal income or excise tax. The deferred capital losses are treated as arising on the first day of the Fund’s next taxable year and retain the same short-term or long-term character as when originally deferred. Of the deferred capital losses at September 30, 2018, $7,271 are short-term.
The cost and unrealized appreciation (depreciation) of investments, including open derivative contracts, of the Fund at September 30, 2018, as determined on a federal income tax basis, were as follows:
|
| | | |
| Aggregate cost |
| $156,271,983 |
|
| Gross unrealized appreciation |
| $57,524 |
|
| Gross unrealized depreciation | (3,007,017) |
|
| Net unrealized appreciation (depreciation) |
| ($2,949,493 | ) |
www.calvert.com CALVERT GREEN BOND FUND ANNUAL REPORT 21
NOTE 5 — FINANCIAL INSTRUMENTS
A summary of futures contracts outstanding at September 30, 2018 is included in the Schedule of Investments. During the year ended September 30, 2018, the Fund used futures contracts to hedge interest rate risk and to manage duration.
At September 30, 2018, the fair value of open derivative instruments (not considered to be hedging instruments for accounting disclosure purposes) and whose primary underlying risk exposure is interest rate risk was as follows:
|
| | | | | | | |
| Derivative | Assets | Liabilities | |
| Futures contracts |
| $— |
|
| ($51,693 | ) | * |
* Only the current day’s variation margin is reported within the Statement of Assets and Liabilities as Receivable or Payable for variation margin on open futures contracts, as applicable.
The effect of derivative instruments (not considered to be hedging instruments for accounting disclosure purposes) on the Statement of Operations and whose primary underlying risk exposure is interest rate risk for the year ended September 30,2018 was as follows:
|
| | | | | | |
| | Statement of Operations Caption |
| Derivative | Net realized gain (loss) on futures contracts | Net change in unrealized appreciation (depreciation) on futures contracts |
| Futures contracts |
| $164,655 |
|
| ($100,162 | ) |
The average notional cost of futures contracts (long) and futures contracts (short) outstanding during the year ended September 30, 2018 was approximately $422,000 and $1,660,000, respectively.
NOTE 6 — SECURITIES LENDING
To generate additional income, the Fund may lend its securities pursuant to a securities lending agency agreement with State Street Bank and Trust Company (SSB), the securities lending agent. Security loans are subject to termination by the Fund at any time and, therefore, are not considered illiquid investments. The Fund requires that the loan be continuously collateralized by either cash or securities as collateral equal at all times to at least 102% of the market value of the domestic securities loaned and 105% of the market value of the international securities loaned (if applicable). The market value of securities loaned is determined daily and any additional required collateral is delivered to the Fund on the next business day. Cash collateral is generally invested in a money market fund registered under the 1940 Act that is managed by an affiliate of SSB. Any gain or loss in the market price of the loaned securities that might occur and any interest earned or dividends declared during the term of the loan would accrue to the account of the Fund. Income earned on the investment of collateral, net of broker rebates and other expenses incurred by the securities lending agent, is split between the Fund and the securities lending agent on the basis of agreed upon contractual terms. Non-cash collateral, if any, is held by the lending agent on behalf of the Fund and cannot be sold or re-pledged by the Fund; accordingly, such collateral is not reflected in the Statement of Assets and Liabilities.
The risks associated with lending portfolio securities include, but are not limited to, possible delays in receiving additional collateral or in the recovery of the loaned securities, possible loss of rights to the collateral should the borrower fail financially, as well as risk of loss in the value of the collateral or the value of the investments made with the collateral. The securities lending agent shall indemnify the Fund in the case of default of any securities borrower.
At September 30, 2018, the total value of securities on loan, including accrued interest, was $47,053 and the total value of collateral received was $48,000, comprised of cash.
The following table provides a breakdown of securities lending transactions accounted for as secured borrowings, the obligations by class of collateral pledged, and the remaining contractual maturity of those transactions as of September 30, 2018.
|
| | | | | | | | | | | | | | | |
| | Remaining Contractual Maturity of the Transactions |
| | Overnight and
Continuous | <30 days | 30 to 90 days | >90 days | Total |
| Securities Lending Transactions |
| Corporate Bonds |
| $48,000 |
|
| $— |
|
| $— |
|
| $— |
|
| $48,000 |
|
The carrying amount of the liability for deposits for securities loaned at September 30, 2018 approximated its fair value. If measured at fair value, such liability would have been considered as Level 2 in the fair value hierarchy (see Note 1A) at September 30, 2018.
22 www.calvert.com CALVERT GREEN BOND FUND ANNUAL REPORT
NOTE 7 — LINE OF CREDIT
The Fund participates with other funds managed by CRM in a $62.5 million committed ($25 million committed and $25 million uncommitted prior to August 7, 2018) unsecured line of credit agreement with SSB, which is in effect through August 6, 2019. Borrowings may be made for temporary or emergency purposes only. Borrowings bear interest at the higher of the One-Month London Interbank Offered Rate (LIBOR) in effect that day or the overnight Federal Funds Rate, plus 1.00% (1.25% prior to August 7, 2018) per annum. A commitment fee of 0.20% (0.25% prior to August 7, 2018) per annum is incurred on the unused portion of the committed facility. An administrative fee of $37,500 was incurred in connection with the renewal of the facility in August 2018. These fees are allocated to all participating funds. Because the line of credit is not available exclusively to the Fund, it may be unable to borrow some or all of its requested amounts at any particular time. The Fund had no borrowings outstanding pursuant to this line of credit at September 30, 2018. The Fund did not have any significant borrowings or allocated fees during the year ended September 30, 2018.
NOTE 8 — AFFILIATED COMPANIES
The Fund has invested a portion of its assets designated for high social impact investments in notes (the Notes) issued by Calvert Impact Capital, Inc. (CIC), formerly the Calvert Social Investment Foundation, pursuant to an exemptive order granted by the U.S. Securities and Exchange Commission (the SEC) in 1998 (the Exemptive Order). The Fund obtained the Exemptive Order because at that time there was a significant overlap of Fund Board members and CIC Board members as well as certain other affiliations between CIC and affiliates of the Fund’s investment adviser. CIC may be considered an affiliated person of the Fund based on the overlap between CIC’s Board of Directors and the Calvert funds’ Directors/Trustees and other potential affiliations. CIC has licensed use of the Calvert name from CRM, and currently two Fund Board members (one of whom is CRM’s President and Chief Executive Officer), two members of the Advisory Council to the Calvert Fund Board of Directors/Trustees, and an additional CRM officer serve on CIC’s Board. CIC is not owned or otherwise controlled by CRM or its affiliates. The Fund intends to request a new exemptive order from the SEC to permit additional investment in CIC notes.
At September 30, 2018, the value of the Fund’s investment in the Notes was $144,353, which represents 0.09% of the Fund’s net assets. Transactions in the Notes by the Fund for the year ended September 30, 2018 were as follows:
|
| | | | | | | | | | | | | | | | | | | | | | | | | | | |
| Name of Issuer | Principal Amount,
beginning of year | Gross Additions | Gross Reductions | Principal Amount,
end of
year | Value,
end of year | Interest
Income | Net Realized
Gain (Loss) | Capital Gain
Distributions Received | Change in
Unrealized
Appreciation (Depreciation) |
| High Social Impact Investments | | | | | | | | | |
Calvert Impact Capital, Inc., Community Investment Notes, 1.50%, 12/15/19 (1) |
| $150,000 |
|
| $— |
|
| $— |
|
| $150,000 |
|
| $144,353 |
|
| $2,250 |
|
| $— |
|
| $— |
|
| $1,391 |
|
| TOTALS | | | | |
| $144,353 |
|
| $2,250 |
|
| $— |
|
| $— |
|
| $1,391 |
|
(1) Restricted security.
www.calvert.com CALVERT GREEN BOND FUND ANNUAL REPORT 23
NOTE 9 — CAPITAL SHARES
Transactions in capital shares for the years ended September 30, 2018 and September 30, 2017 were as follows:
|
| | | | | | | | | | | |
| | Year Ended
September 30, 2018 | | Year Ended
September 30, 2017 |
| | Shares | Amount | | Shares | Amount |
| Class A | | | | | |
| Shares sold | 1,218,090 |
|
| $18,270,517 |
| | 1,205,915 |
|
| $18,405,961 |
|
| Reinvestment of distributions | 64,092 |
| 962,198 |
| | 52,380 |
| 796,669 |
|
| Shares redeemed | (887,229 | ) | (13,261,567 | ) | | (630,894 | ) | (9,604,040 | ) |
| Net increase | 394,953 |
|
| $5,971,148 |
| | 627,401 |
|
| $9,598,590 |
|
| | | | | | |
| Class I | | | | | |
| Shares sold | 4,217,632 |
|
| $63,008,279 |
| | 923,568 |
|
| $14,035,718 |
|
| Reinvestment of distributions | 128,410 |
| 1,922,953 |
| | 30,274 |
| 460,788 |
|
| Shares redeemed | (782,172 | ) | (11,692,537 | ) | | (940,001 | ) | (14,280,627 | ) |
| Conversion from Class Y | 2,518,669 |
| 38,535,382 |
| | — |
| — |
|
| Net increase | 6,082,539 |
|
| $91,774,077 |
| | 13,841 |
|
| $215,879 |
|
| | | | | | |
Class Y (1) | | | | | |
| Shares sold | 252,580 |
|
| $3,876,594 |
| | 1,757,478 |
|
| $26,819,232 |
|
| Reinvestment of distributions | 7,157 |
| 109,537 |
| | 39,103 |
| 596,950 |
|
| Shares redeemed | (80,165 | ) | (1,229,857 | ) | | (542,219 | ) | (8,253,609 | ) |
| Conversion to Class I | (2,513,986 | ) | (38,535,382 | ) | | — |
| — |
|
| Net increase (decrease) | (2,334,414 | ) |
| ($35,779,108 | ) | | 1,254,362 |
|
| $19,162,573 |
|
| | | | | | |
(1) Effective December 8, 2017, Class Y shares of the Fund converted to Class I shares at net asset value. Thereafter, Class Y shares were terminated. |
24 www.calvert.com CALVERT GREEN BOND FUND ANNUAL REPORT
REPORT OF INDEPENDENT REGISTERED PUBLIC ACCOUNTING FIRM
To the Shareholders and Board of Directors
Calvert Impact Fund, Inc.:
Opinion on the Financial Statements
We have audited the accompanying statement of assets and liabilities of Calvert Green Bond Fund (the Fund), a series of Calvert Impact Fund, Inc., including the schedule of investments, as of September 30, 2018, the related statement of operations for the year then ended, the statements of changes in net assets for each of the years in the two‑year period then ended, and the related notes (collectively, the financial statements) and the financial highlights for each of the years or periods in the five‑year period then ended. In our opinion, the financial statements and financial highlights present fairly, in all material respects, the financial position of the Fund as of September 30, 2018, the results of its operations for the year then ended, the changes in its net assets for each of the years in the two‑year period then ended, and the financial highlights for each of the years or periods in the five‑year period then ended, in conformity with U.S. generally accepted accounting principles.
Basis for Opinion
These financial statements and financial highlights are the responsibility of the Fund’s management. Our responsibility is to express an opinion on these financial statements and financial highlights based on our audits. We are a public accounting firm registered with the Public Company Accounting Oversight Board (United States) (PCAOB) and are required to be independent with respect to the Fund in accordance with the U.S. federal securities laws and the applicable rules and regulations of the Securities and Exchange Commission and the PCAOB.
We conducted our audits in accordance with the standards of the PCAOB. Those standards require that we plan and perform the audit to obtain reasonable assurance about whether the financial statements and financial highlights are free of material misstatement, whether due to error or fraud. Our audits included performing procedures to assess the risks of material misstatement of the financial statements and financial highlights, whether due to error or fraud, and performing procedures that respond to those risks. Such procedures included examining, on a test basis, evidence regarding the amounts and disclosures in the financial statements and financial highlights. Such procedures also included confirmation of securities owned as of September 30, 2018, by correspondence with custodians and brokers. Our audits also included evaluating the accounting principles used and significant estimates made by management, as well as evaluating the overall presentation of the financial statements and financial highlights. We believe that our audits provide a reasonable basis for our opinion.
We have served as the auditor of one or more of the Calvert Funds since 2002.
Philadelphia, Pennsylvania
November 21, 2018
www.calvert.com CALVERT GREEN BOND FUND ANNUAL REPORT 25
FEDERAL TAX INFORMATION
The Form 1099-DIV you receive in February 2019 will show the tax status of all distributions paid to your account in calendar year 2018. Shareholders are advised to consult their own tax adviser with respect to the tax consequences of their investment in the Fund.
26 www.calvert.com CALVERT GREEN BOND FUND ANNUAL REPORT (Unaudited)
MANAGEMENT AND ORGANIZATION
Fund Management. The Directors of Calvert Impact Fund, Inc. (the Corporation) are responsible for the overall management and supervision of the Corporation’s affairs. The Directors and officers of the Corporation are listed below. Except as indicated, each individual has held the office shown or other offices in the same company for the last five years. Directors and officers of the Corporation hold indefinite terms of office. The “Independent Directors” consist of those Directors who are not “interested persons” of the Corporation, as that term is defined under the 1940 Act. The business address of each Director and officer, with the exception of Ms. Gemma and Mr. Kirchner, is 1825 Connecticut Avenue NW, Suite 400, Washington, DC 20009. As used below, “CRM” refers to Calvert Research and Management. Each Director oversees 39 funds in the Calvert fund complex. Each officer serves as an officer of certain other Calvert funds.
|
| | | |
| Name and Year of Birth | Position
with Corporation | Position
Start Date | Principal Occupation(s) and Directorships
During Past Five Years and Other Relevant Experience |
| | | | |
| Interested Director | | | |
John H. Streur(1)
1960 | Director & President | 2015 | President and Chief Executive Officer of Calvert Research and Management (since December 31, 2016). President and Chief Executive Officer of Calvert Investments, Inc. (January 2015 - December 2016); Chief Executive Officer of Calvert Investment Distributors, Inc. (August 2015 - December 2016); Chief Compliance Officer of Calvert Investment Management, Inc. (August 2015 - April 2016); President and Director, Portfolio 21 Investments, Inc. (through October 2014); President, Chief Executive Officer and Director, Managers Investment Group LLC (through January 2012); President and Director, The Managers Funds and Managers AMG Funds (through January 2012).
Directorships in the Last Five Years. Portfolio 21 Investments, Inc. (asset management) (through October 2014); Managers Investment Group LLC (asset management) (through January 2012); The Managers Funds (asset management) (through January 2012); Managers AMG Funds (asset management) (through January 2012); Calvert Impact Capital, Inc. |
| Independent Directors | | | |
Richard L. Baird, Jr
1948 | Director | 2005 | Former President and CEO of Adagio Health Inc. (retired in 2014) in Pittsburgh, PA, a non-profit corporation which provides family planning services, nutrition, maternal/child health care, and various health screening services and community preventive health programs.
Directorships in the Last Five Years. None. |
Alice Gresham Bullock
1950 | Chair & Director | 2016 | Professor at Howard University School of Law (retired June 2016). She is former Dean of Howard University School of Law (1996-2002) and Deputy Director of the Association of American Law Schools (1992-1994).
Directorships in the Last Five Years. None. |
Cari M. Dominguez
1949 | Director | 2016 | Former Chair of the U.S. Equal Employment Opportunity Commission.
Directorships in the Last Five Years. Manpower, Inc. (employment agency); Triple S Management Corporation (managed care); National Association of Corporate Directors. |
John G. Guffey, Jr.
1948 | Director | 2005 | President of Aurora Press Inc., a privately held publisher of trade paperbacks (since January 1997).
Directorships in the Last Five Years. Calvert Impact Capital, Inc.; Calvert Ventures, LLC. |
Miles D. Harper, III
1962 | Director | 2000 | Partner, Carr Riggs & Ingram (public accounting firm) since October 2014. Partner, Gainer Donnelly & Desroches (public accounting firm) (now Carr Riggs & Ingram), November 1999 - September 2014).
Directorships in the Last Five Years. Bridgeway Funds (10) (asset management). |
www.calvert.com CALVERT GREEN BOND FUND ANNUAL REPORT (Unaudited) 27
|
| | | |
| Name and Year of Birth | Position
with Corporation | Position
Start Date | Principal Occupation(s) and Directorships
During Past Five Years and Other Relevant Experience |
| | | | |
Joy V. Jones
1950 | Director | 2000 | Attorney.
Directorships in the Last Five Years. Conduit Street Restaurants SUD 2 Limited; Palm Management Restaurant Corporation. |
Anthony A. Williams
1951 | Director | 2016 | CEO and Executive Director of the Federal City Council (July 2012 to present); Senior Adviser and Independent Consultant for McKenna Long & Aldridge LLP (September 2011 to present); Executive Director of Global Government Practice at the Corporate Executive Board (January 2010 to January 2012).
Directorships in the Last Five Years. Freddie Mac; Evoq Properties/ Meruelo Maddux Properties, Inc. (real estate management); Weston Solutions, Inc. (environmental services); Bipartisan Policy Center’s Debt Reduction Task Force; Chesapeake Bay Foundation; Catholic University of America; Urban Institute (research organization). |
|
| | | |
| Principal Officers who are not Directors | |
Name and
Year of Birth | Position with
Corporation | Position Start Date | Principal Occupation
During Past Five Years |
| | | | |
Hope L. Brown
1973 | Chief Compliance Officer | 2014 | Chief Compliance Officer of 39 registered investment companies advised by CRM (since 2014). Vice President and Chief Compliance Officer, Wilmington Funds (2012-2014). Vice President and Senior Compliance Officer, Wilmington Trust Investment Advisors, Inc. (2010-2012). |
Maureen A. Gemma(2)
1960 | Secretary, Vice President and Chief Legal Officer | 2016 | Vice President of CRM and officer of 39 registered investment companies advised by CRM (since 2016). Also Vice President of Eaton Vance Management (“EVM”) and certain of its affiliates and officer of 174 registered investment companies advised or administered by EVM. |
James F. Kirchner(2)
1967 | Treasurer | 2016 | Vice President of CRM and officer of 39 registered investment companies advised by CRM (since 2016). Also Vice President of EVM and certain of its affiliates and officer of 174 registered investment companies advised or administered by EVM. |
| |
(1) | Mr. Streur is an interested person of the Fund because of his positions with the Fund’s Adviser and certain affiliates. |
| |
(2) | The business address for Ms. Gemma and Mr. Kirchner is Two International Place, Boston, MA 02110. |
The SAI for the Fund includes additional information about the Directors and officers of the Fund and can be obtained without charge on Calvert’s website at www.calvert.com or by calling 1-800-368-2745.
28 www.calvert.com CALVERT GREEN BOND FUND ANNUAL REPORT (Unaudited)
IMPORTANT NOTICES
Privacy. The Calvert Funds and Calvert Research and Management are committed to ensuring your financial privacy. Each of the financial institutions identified below has in effect the following policy (“Privacy Policy”) with respect to nonpublic personal information about its customers:
| |
| • | Only such information received from you, through application forms or otherwise, and information about your Calvert fund transactions will be collected. This may include information such as name, address, social security number, tax status, account balances and transactions. |
| |
| • | None of such information about you (or former customers) will be disclosed to anyone, except as permitted by law (which includes disclosure to employees necessary to service your account). In the normal course of servicing a customer’s account, Calvert Research and Management may share information with unaffiliated third parties that perform various required services such as transfer agents, custodians and broker-dealers. |
| |
| • | Policies and procedures (including physical, electronic and procedural safeguards) are in place that are designed to protect the confidentiality of such information. |
| |
| • | The Funds reserve the right to change this Privacy Policy at any time upon proper notification to you. Customers may want to review the Funds’ Privacy Policy periodically for changes by accessing the link on our homepage: www.calvert.com. |
Our pledge of privacy applies to the following entities: the Calvert Family of Funds, Calvert Research and Management and their affiliated service providers, Eaton Vance Management and Eaton Vance Distributors, Inc. In addition, our Privacy Policy applies only to those Calvert customers who are individuals and who have a direct relationship with us. If a customer’s account (i.e., fund shares) is held in the name of a third-party financial advisor/broker-dealer, it is likely that only such advisor’s privacy policies apply to the customer. This notice supersedes all previously issued privacy disclosures. For more information about Calvert’s Privacy Policy, please call 1-800-368-2745.
Delivery of Shareholder Documents. The Securities and Exchange Commission (SEC) permits funds to deliver only one copy of shareholder documents, including prospectuses, proxy statements and shareholder reports, to fund investors with multiple accounts at the same residential or post office box address. This practice is often called “householding” and it helps eliminate duplicate mailings to shareholders. Calvert funds, or your financial advisor, may household the mailing of your documents indefinitely unless you instruct Calvert funds, or your financial advisor, otherwise. If you would prefer that your Calvert fund documents not be householded, please contact Calvert funds at 1-800-368-2745, or contact your financial advisor. Your instructions that householding not apply to delivery of your Calvert fund documents will typically be effective within 30 days of receipt by Calvert funds or your financial advisor. Separate statements will be generated for each separate account and will be householded as described above.
Portfolio Holdings. Each Calvert fund will file a schedule of portfolio holdings on Form N-Q with the SEC for the first and third quarters of each fiscal year. The Form N-Q will be available on the Calvert funds’ website at www.calvert.com, by calling Calvert funds at 1-800-368-2745 or in the EDGAR database on the SEC’s website at www.sec.gov. Form N-Q may also be reviewed and copied at the SEC’s public reference room in Washington, D.C. (call 1-800-732-0330 for information on the operation of the public reference room).
Proxy Voting. The Proxy Voting Guidelines that each Calvert fund uses to determine how to vote proxies relating to portfolio securities is provided as an Appendix to the fund’s Statement of Additional Information. The Statement of Additional Information can be obtained free of charge by calling the Calvert funds at 1-800-368-2745, by visiting the Calvert funds’ website at www.calvert.com or visiting the SEC’s website at www.sec.gov. Information regarding how a Calvert fund voted proxies relating to portfolio securities during the most recent 12-month period ended June 30 is available by calling Calvert funds, by visiting the Calvert funds’ website at www.calvert.com or by visiting the SEC’s website at www.sec.gov.
www.calvert.com CALVERT GREEN BOND FUND ANNUAL REPORT (Unaudited) 29
|
|
| This page intentionally left blank. |
|
|
| This page intentionally left blank. |
|
|
| This page intentionally left blank. |
|
| |
| CALVERT GREEN BOND FUND | |
Investment Adviser and Administrator Calvert Research and Management 1825 Connecticut Avenue NW, Suite 400 Washington, DC 20009 | Transfer Agent DST Asset Manager Solutions, Inc. 2000 Crown Colony Drive Quincy, MA 02169 |
Principal Underwriter* Eaton Vance Distributors, Inc. Two International Place Boston, MA 02110 (617) 482-8260 | Independent Registered Public Accounting Firm KPMG LLP 1601 Market Street Philadelphia, PA 19103-2499 |
Custodian State Street Bank and Trust Company State Street Financial Center, One Lincoln Street Boston, MA 02111 | Fund Offices 1825 Connecticut Avenue NW, Suite 400 Washington, DC 20009 |
| | |
* FINRA BrokerCheck. Investors may check the background of their Investment Professional by contacting the Financial Industry Regulatory Authority (FINRA). FINRA BrokerCheck is a free tool to help investors check the professional background of current and former FINRA-registered securities firms and brokers. FINRA BrokerCheck is available by calling 1-800-289-9999 and at www.FINRA.org. The FINRA BrokerCheck brochure describing this program is available to investors at www.FINRA.org.
|
| |
| | |
Fund shares are not insured by the FDIC and are not deposits or other obligations of, or guaranteed by, any depository institution. Shares are subject to investment risks, including possible loss of principal invested. This report is intended to provide fund information to shareholders. It is not authorized for distribution to prospective investors unless preceded or accompanied by a prospectus. Note: The information on our website is not incorporated by reference into this report; our website address is included as an inactive textual reference only. Investors should carefully consider the investment objectives, risks, charges and expenses of the Calvert funds. This and other important information is contained in the fund’s summary prospectus and prospectus, which can be obtained from your financial professional and should be read carefully before investing. You may also call the Calvert funds at 800-368-2745. Printed on recycled paper. |
| 24201 9.30.18 | |
Item 2. Code of Ethics
The registrant has adopted a code of ethics applicable to its Principal Executive Officer, Principal Financial Officer and Principal Accounting Officer. The registrant undertakes to provide a copy of such code of ethics to any person upon request, without charge, by calling 1-800-368-2745. The registrant has amended the code of ethics as described in Form N-CSR during the period covered by this report to make immaterial changes. The registrant has not granted any waiver, including an implicit waiver, from a provision of the code of ethics as described in Form N-CSR during the period covered by this report.
Item 3. Audit Committee Financial Expert
The registrant's Board of Directors has determined that Miles D. Harper III, an “independent” Director serving on the registrant’s audit committee, is an “audit committee financial expert,” as defined in Item 3 of Form N-CSR. Under applicable securities laws, a person who is determined to be an audit committee financial expert will not be deemed an "expert" for any purpose, including without limitation for the purposes of Section 11 of the Securities Act of 1933, as a result of being designated or identified as an audit committee financial expert. The designation or identification of a person as an audit committee financial expert does not impose on such person any duties, obligations, or liabilities that are greater than the duties, obligations, and liabilities imposed on such person as a member of the audit committee and Board of Directors in the absence of such designation or identification.
Item 4. Principal Accountant Fees and Services
(a) –(d)
The following table presents the aggregate fees billed to the registrant for the registrant’s fiscal years ended September 30, 2017 and September 30, 2018 by KPMG for professional services rendered for the audit of the registrant’s annual financial statements and fees billed for other services rendered by KPMG during such periods.
|
| | | | | | | | | | |
| Fiscal Years Ended | 9/30/17 |
| %* |
| 9/30/18 |
| %* |
|
| | | | | |
| Audit Fees |
| $80,453 |
| 0 | % |
| $84,650 |
| 0 | % |
| | | | | |
| Audit-Related Fees |
| $0 |
| 0 | % |
| $0 |
| 0 | % |
| | | | | |
Tax Fees(1) |
| $18,000 |
| 0 | % |
| $25,315 |
| 0 | % |
| | | | | |
| All Other Fees |
| $0 |
| 0 | % |
| $0 |
| 0 | % |
| | | | | |
| Total |
| $98,453 |
| 0 | % |
| $109,965 |
| 0 | % |
*Percentage of fees approved by the Audit Committee pursuant to (c )(7)(i)(C ) of Rule 2-01 of Reg. S-X (statutory de minimis
waiver of Committee’s requirement to pre-approve).
| |
(1) | Tax fees consist of the aggregate fees billed for professional services rendered by the principal accountant relating to tax compliance, tax advice, and tax planning and specifically include fees for tax return preparation and other related tax compliance/planning matters. |
(e) The Audit Committee is required to pre-approve all audit and non-audit services provided to the registrant by the auditors, and to the registrant’s investment adviser, and any entity controlling, controlled by, or under common control with the adviser that provides ongoing services to the registrant. In determining whether to pre-approve non-audit services, the Audit Committee considers whether the services are consistent with maintaining the independence of the auditors. The Committee may delegate its authority to pre-approve certain matters to one or more of its members. In this regard, the Committee has delegated authority jointly to the Audit Committee Chair together with another Committee member with respect to non-audit services not exceeding $25,000 in each instance. In addition, the Committee has pre-approved the retention of the auditors to provide tax-related services related to the tax treatment and tax accounting of newly acquired securities, upon request by the investment adviser in each instance.
(f) Not applicable.
(g) Aggregate non-audit fees billed by the registrant’s accountant for services rendered to the registrant, and rendered to the registrant’s investment adviser, and any entity controlling, controlled by, or under common control with the adviser that provides ongoing services to the registrant for each of the last two fiscal years of the registrant:
|
| | | |
Fiscal Year ended 9/30/17 |
Fiscal Year ended 9/30/18
|
| $ | %* | $ | %* |
| | | | |
| $63,000 | 0% | $20,400 | 0% |
*Percentage of fees approved by the Audit Committee pursuant to (c)(7)(i)(C) of Rule 2-01 of Reg. S-X (statutory de minimis waiver of Committee’s requirement to pre-approve)
(h) The registrant’s audit committee has considered whether the provision by the registrant’s principal accountant of non-audit services to the registrant’s investment adviser and any entity controlling, controlled by, or under common control with the adviser that provides ongoing services to the registrant that were not pre-approved pursuant to Rule 2-01(c)(7)(ii) of Regulation S-X is compatible with maintaining the principal accountant’s independence.
Item 5. Audit Committee of Listed Registrants
Not applicable.
Item 6. Schedule of Investments
Please see schedule of investments contained in the Report to Stockholders included under Item 1 of this Form N-CSR.
Item 7. Disclosure of Proxy Voting Policies and Procedures for Closed-End Management Investment Companies
Not applicable.
Item 8. Portfolio Managers of Closed-End Management Investment Companies
Not applicable.
Item 9. Purchases of Equity Securities by Closed-End Management Investment Company and Affiliated Purchasers
Not applicable.
Item 10. Submission of Matters to a Vote of Security Holders
No material changes.
Item 11. Controls and Procedures
(a) The registrant’s principal executive and principal financial officers have concluded that the registrant's disclosure controls and procedures (as defined in Rule 30a-3(c) under the Investment Company Act of 1940 Act, as amended (the “1940 Act”) are effective, based on the evaluation of these controls and procedures required by Rule 30a-3(b) under the 1940 Act and Rules 13a-15(b) or 15d-15(b) under the Securities Exchange Act of 1934 (“Exchange Act”), as of a date within 90 days of the filing date of this report.
(b) There was no change in the registrant's internal control over financial reporting (as defined in Rule 30a-3(d) under the 1940 Act) that occurred during the second fiscal quarter of the period covered by this report that has materially affected, or is reasonably likely to materially affect, the registrant's internal control over financial reporting.
Item 12. Disclosure of Securities Lending Activities for Closed-End Management Investment Companies
Not applicable.
Item 13. Exhibits
(a)(1) Registrant’s Code of Ethics – Not applicable (please see Item 2).
(a)(2)(i) Treasurer’s Section 302 certification.
(a)(2)(ii) President’s Section 302 certification.
(b) Combined Section 906 certification.
Signatures
Pursuant to the requirements of the Securities Exchange Act of 1934 and the Investment Company Act of 1940, the registrant has duly caused this report to be signed on its behalf by the undersigned, thereunto duly authorized.
CALVERT IMPACT FUND, INC.
By: /s/ John H. Streur
John H. Streur
President
Date: November 26, 2018
Pursuant to the requirements of the Securities Exchange Act of 1934 and the Investment Company Act of 1940, this report has been signed below by the following persons on behalf of the registrant and in the capacities and on the dates indicated.
By: /s/ James F. Kirchner
James F. Kirchner
Treasurer
Date: ��November 26, 2018
By: /s/ John H. Streur
John H. Streur
President
Date: November 26, 2018