UNITED STATES
SECURITIES AND EXCHANGE COMMISSION
Washington, D.C. 20549
Form N-CSR
CERTIFIED SHAREHOLDER REPORT OF REGISTERED
MANAGEMENT INVESTMENT COMPANIES
Investment Company Act File Number: 811-10045
CALVERT IMPACT FUND, INC.
(Exact Name of Registrant as Specified in Charter)
1825 Connecticut Avenue NW, Suite 400, Washington, DC 20009
(Address of Principal Executive Offices)
Maureen A. Gemma
Two International Place, Boston, Massachusetts 02110
(Name and Address of Agent for Services)
(202) 238-2200
(Registrant’s Telephone Number)
September 30
Date of Fiscal Year End
September 30, 2020
Date of Reporting Period
| Item 1. | Reports to Stockholders |
Calvert
Green Bond Fund
Annual Report
September 30, 2020
Important Note. Beginning on January 1, 2021, as permitted by regulations adopted by the Securities and Exchange Commission, paper copies of the Fund’s annual and semi-annual shareholder reports will no longer be sent by mail unless you specifically request paper copies of the reports. Instead, the reports will be made available on the Fund’s website (calvert.com/prospectus), and you will be notified by mail each time a report is posted and provided with a website address to access the report.
If you already elected to receive shareholder reports electronically, you will not be affected by this change and you need not take any action. If you are a direct investor, you may elect to receive shareholder reports and other communications from the Fund electronically by signing up for e-Delivery at calvert.com. If you own your shares through a financial intermediary (such as a broker-dealer or bank), you must contact your financial intermediary to sign up.
You may elect to receive all future Fund shareholder reports in paper free of charge. If you are a direct investor, you can inform the Fund that you wish to continue receiving paper copies of your shareholder reports by calling 1-800-368-2745. If you own these shares through a financial intermediary, you must contact your financial intermediary or follow instructions included with this disclosure, if applicable, to elect to continue to receive paper copies of your shareholder reports. Your election to receive reports in paper will apply to all Calvert funds held directly or to all funds held through your financial intermediary, as applicable.
E-Delivery Sign-Up - Details Inside
Commodity Futures Trading Commission Registration. Effective December 31, 2012, the Commodity Futures Trading Commission (“CFTC”) adopted certain regulatory changes that subject registered investment companies and advisers to regulation by the CFTC if a fund invests more than a prescribed level of its assets in certain CFTC-regulated instruments (including futures, certain options and swap agreements) or markets itself as providing investment exposure to such instruments. The adviser has claimed an exclusion from the definition of “commodity pool operator” under the Commodity Exchange Act with respect to its management of the Fund and the other funds it manages. Accordingly, neither the Fund nor the adviser is subject to CFTC regulation.
Fund shares are not insured by the FDIC and are not deposits or other obligations of, or guaranteed by, any depository institution. Shares are subject to investment risks, including possible loss of principal invested.
This report must be preceded or accompanied by a current summary prospectus or prospectus. Before investing, investors should consider carefully the investment objective, risks, and charges and expenses of a mutual fund. This and other important information is contained in the summary prospectus and prospectus, which can be obtained from a financial intermediary. Prospective investors should read the prospectus carefully before investing. For further information, please call 1-800-368-2745.
Choose Planet-friendly E-delivery!
Sign up now for on-line statements, prospectuses, and fund reports. In less than five minutes you can help reduce paper mail and lower fund costs.
Just go to www.calvert.com. If you already have an online account with the Calvert funds, click on Login to access your Account and select the documents you would like to receive via e-mail.
If you’re new to online account access, click on Login, then Register to create your user name and password. Once you’re in, click on the E-delivery sign-up on the Account Portfolio page and follow the quick, easy steps.
Note: If your shares are not held directly with the Calvert funds but through a brokerage firm, you must contact your broker for electronic delivery options available through their firm.
Annual Report September 30, 2020
Calvert
Green Bond Fund
Calvert
Green Bond Fund
September 30, 2020
Management's Discussion of Fund Performance†
Economic and Market Conditions
As the 12-month period opened on October 1, 2019, interest rates were trending modestly upward amid better-than-expected U.S. employment reports and cautious optimism about a détente in U.S.-China trade relations. Interest rates continued to move upward through the end of 2019.
In January 2020, however, news of the novel coronavirus outbreak in China began to raise investor concerns and led to a “flight to quality” that sparked a brief fixed-income market rally. As the virus turned into a global pandemic in February and March, it ended the longest-ever period of U.S. economic expansion and brought about a global economic slowdown. Credit markets along with equity markets declined in value amid unprecedented volatility.
In response, the U.S. Federal Reserve (the Fed) announced two emergency rate cuts in March 2020 — lowering the federal funds rate to 0.00%-0.25% — along with other measures designed to shore up credit markets. At its July meeting, the Fed provided additional reassurances that it would maintain rates close to zero percent for the foreseeable future and use all tools at its disposal to support the U.S. economy. These moves helped calm the markets and initiated a new fixed-income rally that began in April and lasted through most of the summer.
Midway through August, however, the fixed-income rally stalled as investors grew concerned about a resurgence of the coronavirus and the consequences for the nascent economic recovery. For the rest of the period, fixed-income prices were flat to down, driven in part by Congress’ failure to pass another stimulus bill — following the expiration of support from the federal CARES Act passed in March 2020, which boosted unemployment benefits and helped businesses keep workers employed. As the period ended, the U.S. Senate and House were deadlocked on an additional stimulus bill, and coronavirus cases were rising.
For the period as a whole, most fixed-income asset classes delivered positive returns, with strong gains from April through mid-August 2020, which compensated for losses in March. The Bloomberg Barclays U.S. Aggregate Bond Index, a broad measure of the U.S. bond market, returned 6.98% for the period. As corporate bonds benefited from Fed policy — which included purchases of corporate investment-grade debt and high yield exchange-traded funds — the Bloomberg Barclays U.S. Corporate Bond Index returned 7.90% for the period.
High yield bonds, which had fared poorly early in the period, outperformed investment-grade bonds in the second half of the period as investors searched for yield in a low-rate environment. For the period as a whole, the Bloomberg Barclays U.S. Corporate High Yield Index returned 3.25%.
Fund Performance
For the 12-month period ended September 30, 2020, Calvert Green Bond Fund (the Fund) returned 5.27% for Class A shares at net asset value, outperforming its benchmark, the ICE BofA Green Bond Index - Hedged USD (the Index), which returned 3.80%.
The Fund's duration and yield-curve positioning were leading contributors to Index-relative performance during the period. The Fund's longer-than-Index USD (U.S. dollar) duration positioning was especially beneficial as the COVID-19 pandemic made riskier assets less favorable among investors and helped drive down U.S. interest rates to record lows during the first quarter of 2020. The use of derivatives (U.S. Treasury futures) detracted from the Fund's Index-relative performance. The Fund’s overweight exposure to investment-grade corporate bonds and its out-of-Index allocation to high yield securities were significant contributors during the full period. The Fund’s underweight exposure to government-related securities was also beneficial.
The Fund’s sector allocation positioning overall, however, detracted from Index-relative performance during the period. In particular, an underweight exposure to foreign government securities and an out-of-Index allocation to commercial mortgage-backed securities detracted from performance. Security selection within government-related issues also detracted from returns during the period.
In the first quarter of the period, green bond issuance approached record-breaking levels, and then fell off in the following two quarters in the midst of the COVID-19 pandemic. In the final quarter of the period, issuance began to recover.
With additional U.S. fiscal stimulus in doubt at the end of the period, the Fund exited or trimmed its positions in consumer-focused securitized credit as valuations rebounded. The Fund maintained an out-of-Index allocation to asset-backed securities, favoring areas that the Fund believed were more attractive in long-term fundamentals, such as renewable energy. At period-end, the Fund was underweight interest rate duration.
See Endnotes and Additional Disclosures in this report.
Past performance is no guarantee of future results. Returns are historical and are calculated by determining the percentage change in net asset value (NAV) or offering price (as applicable) with all distributions reinvested. Investment return and principal value will fluctuate so that shares, when redeemed, may be worth more or less than their original cost. Performance for periods less than or equal to one year is cumulative. Performance is for the stated time period only; due to market volatility, current Fund performance may be lower or higher than the quoted return. For performance as of the most recent month-end, please refer to www.calvert.com.
Calvert
Green Bond Fund
September 30, 2020
Performance
Portfolio Managers Vishal Khanduja, CFA and Brian S. Ellis, CFA, each of Calvert Research and Management
| % Average Annual Total Returns1,2 | Class
Inception Date | Performance
Inception Date | One Year | Five Years | Since
Inception |
| Class A at NAV | 10/31/2013 | 10/31/2013 | 5.27% | 3.89% | 3.42% |
| Class A with 3.75% Maximum Sales Charge | — | — | 1.32 | 3.10 | 2.86 |
| Class I at NAV | 10/31/2013 | 10/31/2013 | 5.53 | 4.23 | 3.77 |
| Class R6 at NAV | 02/01/2019 | 10/31/2013 | 5.58 | 4.25 | 3.79 |
|
| ICE BofA Green Bond Index - Hedged USD | — | — | 3.80% | 4.85% | 4.47% |
| % Total Annual Operating Expense Ratios3 | Class A | Class I | Class R6 |
| Gross | 0.86% | 0.61% | 0.56% |
| Net | 0.73 | 0.48 | 0.43 |
Growth of $10,000
This graph shows the change in value of a hypothetical investment of $10,000 in Class A of the Fund for the period indicated. For comparison, the same investment is shown in the indicated index.
| Growth of Investment2 | Amount Invested | Period Beginning | At NAV | With Maximum Sales Charge |
| Class I | $250,000 | 10/31/2013 | $322,993 | N.A. |
| Class R6 | $1,000,000 | 10/31/2013 | $1,293,515 | N.A. |
See Endnotes and Additional Disclosures in this report.
Past performance is no guarantee of future results. Returns are historical and are calculated by determining the percentage change in net asset value (NAV) or offering price (as applicable) with all distributions reinvested. Investment return and principal value will fluctuate so that shares, when redeemed, may be worth more or less than their original cost. Performance for periods less than or equal to one year is cumulative. Performance is for the stated time period only; due to market volatility, current Fund performance may be lower or higher than the quoted return. For performance as of the most recent month-end, please refer to www.calvert.com.
Calvert
Green Bond Fund
September 30, 2020
Asset Allocation (% of total investments)
| Country Allocation (% of total investments) | |
| United States | 73.3% |
| Canada | 5.1 |
| Netherlands | 4.6 |
| France | 4.6 |
| Luxembourg | 1.7 |
| Italy | 1.7 |
| Finland | 1.5 |
| South Korea | 1.2 |
| Sweden | 1.1 |
| Other (less than 1.0% each) | 5.2 |
| Total | 100.0% |
Credit Quality (% of bond holdings)*
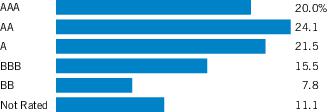
* Ratings are based on Moody’s Investors Service, Inc. (“Moody’s”), S&P Global Ratings (“S&P”) or Fitch Ratings (“Fitch”), as applicable. If securities are rated differently by the ratings agencies, the highest rating is applied. Ratings, which are subject to change, apply to the creditworthiness of the issuers of the underlying securities and not to the Fund or its shares. Credit ratings measure the quality of a bond based on the issuer’s creditworthiness, with ratings ranging from AAA, being the highest, to D, being the lowest based on S&P’s measures. Ratings of BBB or higher by S&P or Fitch (Baa or higher by Moody’s) are considered to be investment-grade quality. Credit ratings are based largely on the ratings agency’s analysis at the time of rating. The rating assigned to any particular security is not necessarily a reflection of the issuer’s current financial condition and does not necessarily reflect its assessment of the volatility of a security’s market value or of the liquidity of an investment in the security. Holdings designated as “Not Rated” (if any) are not rated by the national ratings agencies stated above.
See Endnotes and Additional Disclosures in this report.
Calvert
Green Bond Fund
September 30, 2020
Endnotes and Additional Disclosures
| † | The views expressed in this report are those of the portfolio manager(s) and are current only through the date stated at the top of this page. These views are subject to change at any time based upon market or other conditions, and Calvert and the Fund(s) disclaim any responsibility to update such views. These views may not be relied upon as investment advice and, because investment decisions are based on many factors, may not be relied upon as an indication of trading intent on behalf of any Calvert fund. This commentary may contain statements that are not historical facts, referred to as “forward-looking statements.” The Fund’s actual future results may differ significantly from those stated in any forward-looking statement, depending on factors such as changes in securities or financial markets or general economic conditions, the volume of sales and purchases of Fund shares, the continuation of investment advisory, administrative and service contracts, and other risks discussed from time to time in the Fund’s filings with the Securities and Exchange Commission. |
| | |
| 1 | ICE BofA Green Bond Index - Hedged USD tracks the performance of securities issued for qualified “green” purposes. Qualifying bonds must have a clearly designated use of proceeds that is solely applied toward projects or activities that promote climate change mitigation or adaptation or other environmental sustainability purposes. ICE® BofA® indices are not for redistribution or other uses; provided “as is”, without warranties, and with no liability. Eaton Vance has prepared this report and ICE Data Indices, LLC does not endorse it, or guarantee, review, or endorse Eaton Vance’s products. BofA® is a licensed registered trademark of Bank of America Corporation in the United States and other countries. Unless otherwise stated, index returns do not reflect the effect of any applicable sales charges, commissions, expenses, taxes or leverage, as applicable. It is not possible to invest directly in an index. |
| 2 | Total Returns at NAV do not include applicable sales charges. If sales charges were deducted, the returns would be lower. Total Returns shown with maximum sales charge reflect the stated maximum sales charge. Unless otherwise stated, performance does not reflect the deduction of taxes on Fund distributions or redemptions of Fund shares.Performance prior to the inception date of a class may be linked to the performance of an older class of the Fund. This linked performance is adjusted for any applicable sales charge, but is not adjusted for class expense differences. If adjusted for such differences, the performance would be different. The performance of Class R6 is linked to Class I. Performance since inception for an index, if presented, is the performance since the Fund’s or oldest share class’ inception, as applicable. Performance presented in the Financial Highlights included in the financial statements is not linked. |
| | Calvert Research and Management became the investment adviser to the Fund on December 31, 2016. Performance reflected prior to such date is that of the Fund’s former investment adviser. |
| 3 | Source: Fund prospectus. Net expense ratios reflect a contractual expense reimbursement that continues through 1/31/21. Without the reimbursement, performance would have been lower. The expense ratios for the current reporting period can be found in the Financial Highlights section of this report. |
| Fund profile subject to change due to active management. |
| | Additional Information |
| | Bloomberg Barclays U.S. Aggregate Bond Index is an unmanaged index of domestic investment-grade bonds, including corporate, government and mortgage-backed securities. Bloomberg Barclays U.S. Corporate Bond Index measures the performance of investment-grade U.S. corporate securities with a maturity of one year or more. Bloomberg Barclays U.S. Corporate High Yield Index measures USD-denominated, non-investment grade corporate securities. |
| | Duration is a measure of the expected change in price of a bond — in percentage terms — given a one percent change in interest rates, all else being constant. Securities with lower durations tend to be less sensitive to interest rate changes. |
| | Yield curve is a graphical representation of the yields offered by bonds of various maturities. The yield curve flattens when long-term interest rates fall and/or short-term interest rates increase, and the yield curve steepens when long-term interest rates increase and/or short-term interest rates fall. |
Calvert
Green Bond Fund
September 30, 2020
Example
As a Fund shareholder, you incur two types of costs: (1) transaction costs, including sales charges (loads) on purchases and redemption fees (if applicable); and (2) ongoing costs, including management fees; distribution and/or service fees; and other Fund expenses. This Example is intended to help you understand your ongoing costs (in dollars) of Fund investing and to compare these costs with the ongoing costs of investing in other mutual funds. The Example is based on an investment of $1,000 invested at the beginning of the period and held for the entire period (April 1, 2020 to September 30, 2020).
Actual Expenses
The first section of the table below provides information about actual account values and actual expenses. You may use the information in this section, together with the amount you invested, to estimate the expenses that you paid over the period. Simply divide your account value by $1,000 (for example, an $8,600 account value divided by $1,000 = 8.6), then multiply the result by the number in the first section under the heading entitled “Expenses Paid During Period” to estimate the expenses you paid on your account during this period.
Hypothetical Example for Comparison Purposes
The second section of the table below provides information about hypothetical account values and hypothetical expenses based on the actual Fund expense ratio and an assumed rate of return of 5% per year (before expenses), which is not the actual Fund return. The hypothetical account values and expenses may not be used to estimate the actual ending account balance or expenses you paid for the period. You may use this information to compare the ongoing costs of investing in the Fund and other funds. To do so, compare this 5% hypothetical example with the 5% hypothetical examples that appear in the shareholder reports of the other funds.
Please note that the expenses shown in the table are meant to highlight your ongoing costs only and do not reflect any transactional costs, such as sales charges (loads) or redemption fees (if applicable). Therefore, the second section of the table is useful in comparing ongoing costs only, and will not help you determine the relative total costs of owning different funds. In addition, if these transactional costs were included, your costs would be higher.
| | Beginning
Account Value
(4/1/20) | Ending
Account Value
(9/30/20) | Expenses Paid
During Period*
(4/1/20 – 9/30/20) | Annualized
Expense
Ratio |
| Actual | | | | |
| Class A | $1,000.00 | $1,078.30 | $3.79 ** | 0.73% |
| Class I | $1,000.00 | $1,079.50 | $2.50 ** | 0.48% |
| Class R6 | $1,000.00 | $1,079.80 | $2.24 ** | 0.43% |
| Hypothetical | | | | |
| (5% return per year before expenses) | | | | |
| Class A | $1,000.00 | $1,021.35 | $3.69 ** | 0.73% |
| Class I | $1,000.00 | $1,022.60 | $2.43 ** | 0.48% |
| Class R6 | $1,000.00 | $1,022.85 | $2.17 ** | 0.43% |
| * | Expenses are equal to the Fund's annualized expense ratio for the indicated Class, multiplied by the average account value over the period, multiplied by 183/366 (to reflect the one-half year period). The Example assumes that the $1,000 was invested at the net asset value per share determined at the close of business on March 31, 2020. |
| ** | Absent a waiver and/or reimbursement of expenses by an affiliate, expenses would be higher. |
Calvert
Green Bond Fund
September 30, 2020
| Asset-Backed Securities — 11.7% |
| Security | Principal
Amount
(000's omitted) | Value |
| Helios Issuer, LLC: | | | |
| Series 2017-1A, Class C, 8.00%, 9/20/49(1) | $ | 5,443 | $ 5,389,138 |
| Series 2020-AA, Class A, 2.98%, 6/20/47(1) | | 6,051 | 6,311,028 |
| Mosaic Solar Loan Trust: | | | |
| Series 2018-1A, Class A, 4.01%, 6/22/43(1) | | 904 | 957,328 |
| Series 2019-1A, Class A, 4.37%, 12/21/43(1) | | 1,177 | 1,264,730 |
| Series 2019-2A, Class A, 2.88%, 9/20/40(1) | | 3,639 | 3,861,011 |
| Series 2019-2A, Class B, 3.28%, 9/20/40(1) | | 4,800 | 4,927,313 |
| Series 2019-2A, Class C, 4.35%, 9/20/40(1) | | 1,665 | 1,645,835 |
| Series 2020-1A, Class A, 2.10%, 4/20/46(1) | | 2,162 | 2,215,240 |
| Series 2020-1A, Class B, 3.10%, 4/20/46(1) | | 2,485 | 2,552,972 |
| Series 2020-2A, Class B, 2.21%, 8/20/46(1)(2) | | 1,350 | 1,330,631 |
| Mosaic Solar Loans LLC: | | | |
| Series 2017-1A, Class A, 4.45%, 6/20/42(1) | | 712 | 766,080 |
| Series 2017-2A, Class A, 3.82%, 6/22/43(1) | | 76 | 80,333 |
| RenewFund Receivables Trust, Series 2015-1, Class A, 3.51%, 4/15/25(1) | | 21 | 21,540 |
| SolarCity LMC Series I, LLC, Series 2013-1, Class A, 4.80%, 11/20/38(1) | | 165 | 161,564 |
| SolarCity LMC Series II, LLC, Series 2014-1, Class A, 4.59%, 4/20/44(1) | | 3,729 | 3,690,455 |
| SolarCity LMC Series III, LLC: | | | |
| Series 2014-2, Class A, 4.02%, 7/20/44(1) | | 2,992 | 3,023,140 |
| Series 2014-2, Class B, 5.44%, 7/20/44(1) | | 170 | 165,417 |
| Spruce ABS Trust, Series 2016-E1, Class A, 4.32%, 6/15/28(1) | | 191 | 196,445 |
| Sunnova Helios II Issuer, LLC, Series 2018-1A, Class B, 7.71%, 7/20/48(1) | | 868 | 837,008 |
| Sunnova Sol Issuer, LLC, Series 2020-1A, Class A, 3.35%, 2/1/55(1) | | 2,985 | 3,022,803 |
| Sunrun Atlas Issuer, LLC, Series 2019-2, Class A, 3.61%, 2/1/55(1) | | 1,798 | 1,891,723 |
| Sunrun Callisto Issuer, LLC, Series 2015-1A, Class B, 5.38%, 7/20/45(1) | | 802 | 790,835 |
| Sunrun Xanadu Issuer, LLC, Series 2019-1A, Class A, 3.98%, 6/30/54(1) | | 2,225 | 2,289,786 |
| TES, LLC, Series 2017-1A, Class A, 4.33%, 10/20/47(1) | | 2,515 | 2,568,116 |
| Tesla Auto Lease Trust: | | | |
| Series 2018-B, Class A, 3.71%, 8/20/21(1) | | 1,187 | 1,197,646 |
| Series 2018-B, Class C, 4.36%, 10/20/21(1) | | 1,875 | 1,923,857 |
| Series 2019-A, Class A2, 2.13%, 4/20/22(1) | | 1,706 | 1,725,219 |
| Series 2019-A, Class A4, 2.20%, 11/21/22(1) | | 1,535 | 1,578,556 |
| Series 2019-A, Class B, 2.41%, 12/20/22(1) | | 3,270 | 3,360,467 |
| Series 2019-A, Class E, 5.48%, 5/22/23(1) | | 1,545 | 1,619,308 |
| Series 2020-A, Class A3, 0.68%, 12/20/23(1) | | 1,000 | 1,005,244 |
| Series 2020-A, Class C, 1.68%, 2/20/24(1) | | 2,000 | 2,021,797 |
| Security | Principal
Amount
(000's omitted) | Value |
| Tesla Auto Lease Trust: (continued) | | | |
| Series 2020-A, Class D, 2.33%, 2/20/24(1) | $ | 1,695 | $ 1,721,779 |
| Series 2020-A, Class E, 4.64%, 8/20/24(1) | | 973 | 1,010,415 |
| Vivint Solar Financing V LLC, Series 2018-1A, Class A, 4.73%, 4/30/48(1) | | 1,452 | 1,501,881 |
| Vivint Solar Financing VII, LLC, Series 2020-1A, Class A, 2.21%, 7/31/51(1) | | 3,285 | 3,309,808 |
Total Asset-Backed Securities
(identified cost $70,441,374) | | | $ 71,936,448 |
| Collateralized Mortgage-Backed Obligations — 9.0% |
| Security | Principal
Amount
(000's omitted) | Value |
| Federal Home Loan Mortgage Corp. Multifamily Structured Pass Through Certificates: | | | |
| Series KG02, Class A2, 2.412%, 8/25/29 | $ | 4,050 | $ 4,446,453 |
| Series KG03, Class A2, 1.297%, 6/25/30(3) | | 1,360 | 1,384,276 |
| Federal National Mortgage Association: | | | |
| Series 2017-M2, Class A1, 2.801%, 2/25/27(3) | | 318 | 328,740 |
| Series 2017-M13, Class A2, 2.939%, 9/25/27(3) | | 4,150 | 4,708,296 |
| Series 2018-M4, Class A2, 3.045%, 3/25/28(3) | | 4,167 | 4,770,002 |
| Series 2018-M8, Class A2, 3.325%, 6/25/28(3) | | 923 | 1,073,663 |
| Series 2018-M13, Class A2, 3.697%, 9/25/30(3) | | 2,420 | 2,964,855 |
| Series 2019-M1, Class A2, 3.555%, 9/25/28(3) | | 5,005 | 5,958,675 |
| Series 2019-M9, Class A2, 2.937%, 4/25/29 | | 2,455 | 2,780,779 |
| Series 2019-M22, Class A2, 2.522%, 8/25/29 | | 12,800 | 14,143,748 |
| Series 2020-M1, Class A2, 2.444%, 10/25/29 | | 7,842 | 8,479,134 |
| Series 2020-M20, Class A2, 1.435%, 10/25/29 | | 4,250 | 4,372,833 |
Total Collateralized Mortgage-Backed Obligations
(identified cost $50,567,317) | | | $ 55,411,454 |
| Security | Principal
Amount
(000's omitted)* | Value |
| Basic Materials — 1.2% | |
| LG Chem, Ltd.: | | | |
| 3.25%, 10/15/24(1) | | 1,550 | $ 1,670,452 |
| 3.625%, 4/15/29(1) | | 5,125 | 5,688,815 |
| | | | $ 7,359,267 |
7
See Notes to Financial Statements.
Calvert
Green Bond Fund
September 30, 2020
Schedule of Investments — continued
| Security | Principal
Amount
(000's omitted)* | Value |
| Communications — 1.7% | |
| Verizon Communications, Inc.: | | | |
| 1.50%, 9/18/30 | | 8,484 | $ 8,468,004 |
| 3.875%, 2/8/29 | | 1,480 | 1,752,667 |
| | | | $ 10,220,671 |
| Consumer, Cyclical — 0.3% | |
| Toyota Motor Credit Corp., 2.15%, 2/13/30 | | 1,500 | $ 1,583,142 |
| | | | $ 1,583,142 |
| Consumer, Non-cyclical — 3.9% | |
| Coca-Cola Femsa SAB de CV, 1.85%, 9/1/32 | | 3,470 | $ 3,482,266 |
| Conservation Fund (The), Green Bonds, 3.474%, 12/15/29 | | 2,345 | 2,536,557 |
| Kaiser Foundation Hospitals, 3.15%, 5/1/27 | | 1,208 | 1,354,413 |
| Koninklijke Philips NV, 0.50%, 5/22/26(4) | EUR | 9,350 | 11,234,205 |
| PepsiCo, Inc., 2.875%, 10/15/49 | | 5,200 | 5,598,104 |
| | | | $ 24,205,545 |
| Energy — 2.6% | |
| Hanwha Energy USA Holdings Corp., 2.375%, 7/30/22(1) | | 2,500 | $ 2,571,300 |
| TerraForm Power Operating, LLC: | | | |
| 4.75%, 1/15/30(1) | | 11,700 | 12,457,107 |
| 5.00%, 1/31/28(1) | | 867 | 950,709 |
| | | | $ 15,979,116 |
| Financial — 26.8% | |
| Alexandria Real Estate Equities, Inc., 4.00%, 1/15/24 | | 2,364 | $ 2,602,190 |
| Bank of America Corp.: | | | |
| 2.456% to 10/22/24, 10/22/25(5) | | 5,888 | 6,214,987 |
| 3.499% to 5/17/21, 5/17/22(5) | | 7,282 | 7,418,838 |
| Bank of Nova Scotia (The), 2.375%, 1/18/23 | | 6,600 | 6,879,374 |
| Boston Properties, L.P., 3.40%, 6/21/29 | | 2,700 | 2,942,241 |
| Citigroup, Inc.: | | | |
| 0.50%, 1/29/22(4) | EUR | 14,064 | 16,636,666 |
| 1.678% to 5/15/23, 5/15/24(5) | | 7,075 | 7,253,782 |
| Commonwealth Bank of Australia, 3.25%, 3/31/22 | AUD | 2,020 | 1,510,258 |
| Credit Agricole Corporate & Investment Bank S.A., 0.924%, (3 mo. USD LIBOR + 0.625%), 10/3/21(6) | | 9,556 | 9,556,205 |
| DBS Group Holdings Ltd., 0.865%, (3 mo. USD LIBOR + 0.62%), 7/25/22(1)(6) | | 3,640 | 3,649,528 |
| Digital Dutch Finco BV, 1.50%, 3/15/30(4) | EUR | 1,500 | 1,840,312 |
| Digital Euro Finco LLC, 2.50%, 1/16/26(4) | EUR | 8,700 | 11,218,641 |
| HAT Holdings I, LLC/HAT Holdings II, LLC: | | | |
| 3.75%, 9/15/30(1) | | 3,562 | 3,588,715 |
| 5.25%, 7/15/24(1) | | 11,000 | 11,484,550 |
| Security | Principal
Amount
(000's omitted)* | Value |
| Financial (continued) | |
| HAT Holdings I, LLC/HAT Holdings II, LLC: (continued) | | | |
| 6.00%, 4/15/25(1) | | 76 | $ 81,058 |
| ING Groep NV: | | | |
| 1.40% to 7/1/25, 7/1/26(1)(5) | | 7,600 | 7,697,339 |
| 4.625%, 1/6/26(1) | | 2,175 | 2,554,058 |
| JPMorgan Chase & Co., 0.653% to 9/16/23, 9/16/24(5)(7) | | 12,500 | 12,509,264 |
| Kimco Realty Corp., 2.70%, 10/1/30 | | 2,500 | 2,543,820 |
| Metropolitan Life Global Funding I, 0.95%, 7/2/25(1) | | 5,200 | 5,252,311 |
| Mitsubishi UFJ Financial Group, Inc., 2.527%, 9/13/23 | | 1,100 | 1,164,345 |
| National Australia Bank, Ltd., 3.625%, 6/20/23 | | 1,867 | 2,026,037 |
| PNC Financial Services Group, Inc. (The), 2.20%, 11/1/24 | | 8,000 | 8,481,593 |
| Prologis Euro Finance, LLC, 0.375%, 2/6/28 | EUR | 6,700 | 7,908,461 |
| Prologis, L.P., 1.25%, 10/15/30 | | 3,614 | 3,532,616 |
| Prudential Financial, Inc., 1.50%, 3/10/26(7) | | 2,000 | 2,085,638 |
| Regency Centers, L.P., 3.75%, 6/15/24 | | 1,500 | 1,596,052 |
| Royal Bank of Canada, 0.25%, 5/2/24(4) | EUR | 8,600 | 10,188,809 |
| Welltower, Inc., 2.70%, 2/15/27 | | 4,000 | 4,224,953 |
| | | | $ 164,642,641 |
| Government - Multinational — 4.6% | |
| Asian Development Bank: | | | |
| 1.875%, 8/10/22 | | 1,500 | $ 1,546,360 |
| 2.125%, 3/19/25 | | 750 | 808,236 |
| 2.375%, 8/10/27 | | 750 | 839,292 |
| 3.125%, 9/26/28 | | 800 | 951,523 |
| European Bank for Reconstruction & Development, 1.625%, 9/27/24 | | 2,000 | 2,101,237 |
| European Investment Bank: | | | |
| 1.00%, 11/14/42(4) | EUR | 3,400 | 4,845,877 |
| 2.375%, 5/24/27 | | 3,965 | 4,424,915 |
| 2.50%, 10/15/24 | | 1,000 | 1,088,059 |
| International Bank for Reconstruction & Development: | | | |
| 0.625%, 11/22/27 | EUR | 3,550 | 4,448,181 |
| 3.125%, 11/20/25 | | 4,150 | 4,710,671 |
| International Finance Corp., 2.125%, 4/7/26 | | 1,500 | 1,635,985 |
| Nordic Investment Bank, 2.25%, 9/30/21 | | 950 | 969,506 |
| | | | $ 28,369,842 |
| Industrial — 3.4% | |
| Johnson Controls International plc/Tyco Fire & Security Finance SCA, 1.75%, 9/15/30(7) | | 4,000 | $ 4,039,016 |
| Owens Corning, 3.95%, 8/15/29 | | 10,632 | 12,056,574 |
8
See Notes to Financial Statements.
Calvert
Green Bond Fund
September 30, 2020
Schedule of Investments — continued
| Security | Principal
Amount
(000's omitted)* | Value |
| Industrial (continued) | |
| Xylem, Inc.: | | | |
| 1.95%, 1/30/28 | | 3,400 | $ 3,549,973 |
| 2.25%, 1/30/31 | | 1,071 | 1,137,770 |
| | | | $ 20,783,333 |
| Technology — 1.7% | |
| Apple, Inc., 0.50%, 11/15/31 | EUR | 7,238 | $ 8,804,862 |
| NXP B.V./NXP Funding, LLC NXP USA, Inc., 3.40%, 5/1/30(1) | | 1,411 | 1,547,878 |
| | | | $ 10,352,740 |
| Utilities — 13.8% | |
| Avangrid, Inc.: | | | |
| 3.15%, 12/1/24 | | 4,913 | $ 5,364,061 |
| 3.80%, 6/1/29 | | 7,600 | 8,786,170 |
| Brookfield Renewable Partners ULC, 3.33%, 8/13/50 | CAD | 4,000 | 2,979,866 |
| Clearway Energy Operating, LLC, 4.75%, 3/15/28(1) | | 2,047 | 2,125,687 |
| Consolidated Edison Co. of New York, Inc., 3.35%, 4/1/30 | | 1,333 | 1,538,921 |
| Enel Finance International NV: | | | |
| 1.00%, 9/16/24(4) | EUR | 4,250 | 5,183,175 |
| 1.125%, 9/16/26(4) | EUR | 4,100 | 5,103,581 |
| Liberty Utilities Finance GP 1, 2.05%, 9/15/30(1) | | 9,474 | 9,362,141 |
| MidAmerican Energy Co.: | | | |
| 3.15%, 4/15/50 | | 850 | 943,266 |
| 3.65%, 8/1/48 | | 3,570 | 4,221,650 |
| 4.25%, 7/15/49 | | 2,390 | 3,106,089 |
| NextEra Energy Operating Partners, L.P.: | | | |
| 4.25%, 9/15/24(1) | | 1,825 | 1,904,844 |
| 4.50%, 9/15/27(1)(7) | | 4,782 | 5,152,605 |
| Niagara Mohawk Power Corp., 1.96%, 6/27/30(1) | | 3,782 | 3,897,009 |
| Northern States Power Co., 2.60%, 6/1/51 | | 5,600 | 5,699,968 |
| NSTAR Electric Co., 3.25%, 5/15/29 | | 2,500 | 2,855,893 |
| Pattern Energy Operations, L.P./Pattern Energy Operations, Inc., 4.50%, 8/15/28(1) | | 5,914 | 6,146,579 |
| Public Service Co. of Colorado: | | | |
| 3.20%, 3/1/50 | | 4,500 | 5,116,737 |
| 4.10%, 6/15/48 | | 1,000 | 1,285,694 |
| Terraform Global Operating, LLC, 6.125%, 3/1/26(1) | | 1,595 | 1,628,591 |
| Tucson Electric Power Co., 1.50%, 8/1/30 | | 2,000 | 1,983,677 |
| | | | $ 84,386,204 |
Total Corporate Bonds
(identified cost $347,247,168) | | | $ 367,882,501 |
| High Social Impact Investments — 0.2% |
| Security | Principal
Amount
(000's omitted) | Value |
| Calvert Impact Capital, Inc., Community Investment Notes, 1.50%, 12/15/20(8)(9) | $ | 1,196 | $ 1,189,991 |
Total High Social Impact Investments
(identified cost $1,196,055) | | | $ 1,189,991 |
| Security | Shares | Value |
| Real Estate Management & Development — 0.8% | |
| Brookfield Property Partners, L.P.: | | | |
| Series A, 5.75% | | 92,000 | $ 1,644,040 |
| Series A2, 6.375%(7) | | 169,100 | 3,353,253 |
Total Preferred Stocks
(identified cost $6,575,394) | | | $ 4,997,293 |
| Sovereign Government Bonds — 9.3% |
| Security | Principal
Amount
(000's omitted)* | Value |
| Chile Government International Bond, 2.55%, 1/27/32 | | 1,500 | $ 1,586,250 |
| French Republic Government Bond OAT, 1.75%, 6/25/39(1)(4) | EUR | 12,090 | 18,525,214 |
| Kreditanstalt fuer Wiederaufbau: | | | |
| 0.75%, 9/30/30 | | 3,034 | 3,015,659 |
| 1.75%, 9/14/29(7) | | 2,200 | 2,387,847 |
| Municipality Finance PLC: | | | |
| 0.05%, 9/6/29(4) | EUR | 3,750 | 4,512,649 |
| 1.375%, 9/21/21(1) | | 3,500 | 3,537,940 |
| Nacional Financiera SNC, 3.375%, 11/5/20(1) | | 750 | 752,138 |
| Nederlandse Waterschapsbank NV: | | | |
| 1.00%, 5/28/30(1) | | 2,400 | 2,408,851 |
| 2.375%, 3/24/26(1) | | 1,700 | 1,862,770 |
| 3.125%, 12/5/22(1) | | 500 | 530,680 |
| Province of Ontario Canada: | | | |
| 1.95%, 1/27/23 | CAD | 3,200 | 2,489,346 |
| 2.65%, 2/5/25 | CAD | 5,000 | 4,076,377 |
| South Coast British Columbia Transportation Authority, 2.65%, 10/29/50 | CAD | 5,490 | 4,425,190 |
| Sweden Government International Bond, 0.125%, 9/9/30(1) | SEK | 61,500 | 7,006,455 |
Total Sovereign Government Bonds
(identified cost $53,017,876) | | | $ 57,117,366 |
9
See Notes to Financial Statements.
Calvert
Green Bond Fund
September 30, 2020
Schedule of Investments — continued
| Taxable Municipal Obligations — 4.6% |
| Security | Principal
Amount
(000's omitted) | Value |
| General Obligations — 1.5% | |
| Massachusetts, Green Bonds, 3.277%, 6/1/46 | $ | 8,240 | $ 9,308,151 |
| | | | $ 9,308,151 |
| Water and Sewer — 3.1% | |
| District of Columbia Water & Sewer Authority, Green Bonds, 4.814%, 10/1/2114 | $ | 1,665 | $ 2,499,681 |
| Massachusetts Water Pollution Abatement Trust, 5.192%, 8/1/40(10) | | 150 | 183,548 |
| Narragansett Bay Commission, RI, Wastewater System Revenue, Green Bonds: | | | |
| 2.094%, 9/1/30 | | 620 | 652,711 |
| 2.184%, 9/1/31 | | 500 | 516,765 |
| 2.264%, 9/1/32 | | 445 | 458,915 |
| 2.344%, 9/1/33 | | 1,445 | 1,491,139 |
| New York City Municipal Water Finance Authority, NY, (Water and Sewer System), 5.882%, 6/15/44(10) | | 605 | 969,192 |
| San Diego County Water Authority, CA, Green Bonds, 1.951%, 5/1/34 | | 635 | 642,442 |
| San Francisco City and County Public Utilities Commission, CA, Water Revenue, Green Bonds, 3.303%, 11/1/39 | | 10,705 | 11,571,142 |
| | | | $ 18,985,535 |
Total Taxable Municipal Obligations
(identified cost $25,553,348) | | | $ 28,293,686 |
| U.S. Government Agencies and Instrumentalities — 2.1% |
| Security | Principal
Amount
(000's omitted) | Value |
| U.S. International Development Finance Corp.: | | | |
| 1.79%, 10/15/29 | $ | 4,430 | $ 4,683,031 |
| 2.36%, 10/15/29 | | 2,870 | 3,134,738 |
| 3.16%, 6/1/33 | | 173 | 200,205 |
| 3.22%, 9/15/29 | | 701 | 794,008 |
| 3.52%, 9/20/32 | | 3,256 | 3,808,376 |
Total U.S. Government Agencies and Instrumentalities
(identified cost $11,429,525) | | | $ 12,620,358 |
| U.S. Government Agency Mortgage-Backed Securities — 0.7% |
| Security | Principal
Amount
(000's omitted) | Value |
| Federal National Mortgage Association: | | | |
| Pool #AN1879, 2.65%, with maturity at 6/1/26 | $ | 1,853 | $ 2,028,859 |
| Pool #AN1909, 2.68%, with maturity at 7/1/26 | | 2,000 | 2,202,179 |
Total U.S. Government Agency Mortgage-Backed Securities
(identified cost $3,907,780) | | $ 4,231,038 |
| Short-Term Investments — 0.9% | | | |
| Other — 0.5% |
| Description | Units | Value |
| Calvert Cash Reserves Fund, LLC, 0.13%(11) | | 3,018,762 | $ 3,019,064 |
Total Other
(identified cost $3,019,064) | | | $ 3,019,064 |
| Securities Lending Collateral — 0.4% |
| Security | Shares | Value |
| State Street Navigator Securities Lending Government Money Market Portfolio, 0.09%(12) | | 2,339,550 | $ 2,339,550 |
Total Securities Lending Collateral
(identified cost $2,339,550) | | | $ 2,339,550 |
Total Short-Term Investments
(identified cost $5,358,614) | | | $ 5,358,614 |
Total Investments — 99.3%
(identified cost $575,294,451) | | | $ 609,038,749 |
| Other Assets, Less Liabilities — 0.7% | | | $ 4,308,889 |
| Net Assets — 100.0% | | | $ 613,347,638 |
| The percentage shown for each investment category in the Schedule of Investments is based on net assets. | |
| * | In U.S. dollars unless otherwise indicated. |
| (1) | Security exempt from registration under Rule 144A of the Securities Act of 1933, as amended. These securities may be sold in certain transactions in reliance on an exemption from registration (normally to qualified institutional buyers). At September 30, 2020, the aggregate value of these securities is $195,971,772 or 32.0% of the Fund's net assets. |
| (2) | When-issued security. |
| (3) | Weighted average fixed-rate coupon that changes/updates monthly. Rate shown is the rate at September 30, 2020. |
10
See Notes to Financial Statements.
Calvert
Green Bond Fund
September 30, 2020
Schedule of Investments — continued
| (4) | Security exempt from registration under Regulation S of the Securities Act of 1933, as amended, which exempts from registration securities offered and sold outside the United States. Security may not be offered or sold in the United States except pursuant to an exemption from, or in a transaction not subject to, the registration requirements of the Securities Act of 1933, as amended. At September 30, 2020, the aggregate value of these securities is $89,289,129 or 14.6% of the Fund's net assets. |
| (5) | Security converts to variable rate after the indicated fixed-rate coupon period. |
| (6) | Variable rate security. The stated interest rate represents the rate in effect at September 30, 2020. |
| (7) | All or a portion of this security was on loan at September 30, 2020. The aggregate market value of securities on loan at September 30, 2020 was $6,874,641. |
| (8) | Affiliated company (see Note 8). |
| (9) | Restricted security. Total market value of restricted securities amounts to $1,189,991, which represents 0.2% of the net assets of the Fund as of September 30, 2020. |
| (10) | Build America Bond. Represents taxable municipal obligation issued pursuant to the American Recovery and Reinvestment Act of 2009 or other legislation providing for the issuance of taxable municipal debt on which the issuer receives federal support. |
| (11) | Affiliated investment company, available to Calvert portfolios and funds, which invests in high quality, U.S. dollar denominated money market instruments. The rate shown is the annualized seven-day yield as of September 30, 2020. |
| (12) | Represents investment of cash collateral received in connection with securities lending. |
| Country Allocation (% of Total Investments) | |
| United States | 73.3% |
| Canada | 5.1 |
| Netherlands | 4.6 |
| France | 4.6 |
| Other (less than 3.0% each) | 12.4 |
| Total | 100.0% |
Forward Foreign Currency Exchange Contracts
| Currency Purchased | Currency Sold | Counterparty | Settlement
Date | Unrealized
Appreciation | Unrealized
(Depreciation) |
| USD | 1,559,171 | AUD | 2,144,812 | State Street Bank and Trust Company | 11/30/20 | $ 22,723 | $ — |
| USD | 10,708,791 | CAD | 14,038,675 | State Street Bank and Trust Company | 11/30/20 | 163,813 | — |
| USD | 3,047,615 | CAD | 4,058,681 | State Street Bank and Trust Company | 11/30/20 | — | (1,013) |
| USD | 110,826,237 | EUR | 93,586,167 | State Street Bank and Trust Company | 11/30/20 | 967,205 | — |
| USD | 7,121,257 | SEK | 61,714,020 | State Street Bank and Trust Company | 11/30/20 | 226,150 | — |
| | | | | | | $1,379,891 | $(1,013) |
Futures Contracts
| Description | Number of
Contracts | Position | Expiration
Date | Notional
Amount | Value/
Unrealized
Appreciation
(Depreciation) |
| Interest Rate Futures | | | | | |
| U.S. 2-Year Treasury Note | 41 | Long | 12/31/20 | $ 9,059,398 | $ 3,455 |
| U.S. Ultra-Long Treasury Bond | 10 | Long | 12/21/20 | 2,218,125 | (16,191) |
| U.S. 5-Year Treasury Note | (40) | Short | 12/31/20 | (5,041,250) | (2,881) |
| U.S. Long Treasury Bond | (57) | Short | 12/21/20 | (10,048,031) | 33,292 |
| U.S. Ultra 10-Year Treasury Note | (208) | Short | 12/21/20 | (33,263,750) | (56,785) |
| | | | | | $(39,110) |
11
See Notes to Financial Statements.
Calvert
Green Bond Fund
September 30, 2020
Schedule of Investments — continued
Restricted Securities
| Description | Acquisition Date | Cost |
| Calvert Impact Capital, Inc., Community Investment Notes, 1.50%, 12/15/20 | 12/13/19 | $1,196,055 |
| Abbreviations: |
| LIBOR | – London Interbank Offered Rate |
| Currency Abbreviations: |
| AUD | – Australian Dollar |
| CAD | – Canadian Dollar |
| EUR | – Euro |
| SEK | – Swedish Krona |
| USD | – United States Dollar |
12
See Notes to Financial Statements.
Calvert
Green Bond Fund
September 30, 2020
Statement of Assets and Liabilities
| | September 30, 2020 |
| Assets | |
Investments in securities of unaffiliated issuers, at value (identified cost $571,079,332) - including
$6,874,641 of securities on loan | $ 604,829,694 |
| Investments in securities of affiliated issuers, at value (identified cost $4,215,119) | 4,209,055 |
| Receivable for variation margin on open futures contracts | 137,549 |
| Receivable for open forward foreign currency exchange contracts | 1,379,891 |
| Cash | 2,020,329 |
| Deposits at broker for futures contracts | 737,392 |
| Deposits for derivatives collateral - forward foreign currency exchange contracts | 1,340,000 |
| Cash denominated in foreign currency, at value (cost $23,506) | 23,511 |
| Receivable for investments sold | 5,394,105 |
| Receivable for capital shares sold | 4,161,682 |
| Interest receivable | 3,064,449 |
| Dividends and interest receivable - affiliated | 15,535 |
| Securities lending income receivable | 241 |
| Receivable from affiliate | 36,082 |
| Directors' deferred compensation plan | 80,217 |
| Total assets | $627,429,732 |
| Liabilities | |
| Cash collateral due to broker | $ 1,340,000 |
| Payable for open forward foreign currency exchange contracts | 1,013 |
| Payable for investments purchased | 8,305,749 |
| Payable for when-issued securities | 1,330,630 |
| Payable for capital shares redeemed | 276,343 |
| Distributions payable | 26,318 |
| Deposits for securities loaned | 2,339,550 |
| Payable to affiliates: | |
| Investment advisory fee | 122,313 |
| Administrative fee | 58,710 |
| Distribution and service fees | 15,851 |
| Sub-transfer agency fee | 6,896 |
| Directors' deferred compensation plan | 80,217 |
| Accrued expenses | 178,504 |
| Total liabilities | $ 14,082,094 |
| Net Assets | $613,347,638 |
| Sources of Net Assets | |
| Paid-in capital | $ 584,543,926 |
| Distributable earnings | 28,803,712 |
| Total | $613,347,638 |
| Class A Shares | |
| Net Assets | $ 77,990,912 |
| Shares Outstanding | 4,767,856 |
Net Asset Value and Redemption Price Per Share
(net assets ÷ shares of beneficial interest outstanding) | $ 16.36 |
Maximum Offering Price Per Share
(100 ÷ 96.25 of net asset value per share) | $ 17.00 |
13
See Notes to Financial Statements.
Calvert
Green Bond Fund
September 30, 2020
Statement of Assets and Liabilities — continued
| | September 30, 2020 |
| Class I Shares | |
| Net Assets | $532,148,520 |
| Shares Outstanding | 32,487,915 |
Net Asset Value, Offering Price and Redemption Price Per Share
(net assets ÷ shares of beneficial interest outstanding) | $ 16.38 |
| Class R6 Shares | |
| Net Assets | $ 3,208,206 |
| Shares Outstanding | 195,751 |
Net Asset Value, Offering Price and Redemption Price Per Share
(net assets ÷ shares of beneficial interest outstanding) | $ 16.39 |
On sales of $50,000 or more, the offering price of Class A shares is reduced.
14
See Notes to Financial Statements.
Calvert
Green Bond Fund
September 30, 2020
| | Year Ended |
| | September 30, 2020 |
| Investment Income | |
| Dividend income | $ 350,595 |
| Dividend income - affiliated issuers | 6,827 |
| Interest and other income | 11,248,075 |
| Interest income - affiliated issuers | 14,641 |
| Securities lending income, net | 4,619 |
| Total investment income | $11,624,757 |
| Expenses | |
| Investment advisory fee | $ 1,169,611 |
| Administrative fee | 561,413 |
| Distribution and service fees: | |
| Class A | 169,309 |
| Directors' fees and expenses | 19,356 |
| Custodian fees | 19,560 |
| Transfer agency fees and expenses | 405,839 |
| Accounting fees | 109,055 |
| Professional fees | 46,644 |
| Registration fees | 107,139 |
| Reports to shareholders | 27,550 |
| Miscellaneous | 54,628 |
| Total expenses | $ 2,690,104 |
| Waiver and/or reimbursement of expenses by affiliate | $ (268,226) |
| Reimbursement of expenses - other | (5,648) |
| Net expenses | $ 2,416,230 |
| Net investment income | $ 9,208,527 |
| Realized and Unrealized Gain (Loss) | |
| Net realized gain (loss): | |
| Investment securities | $ 3,254,226 |
| Investment securities - affiliated issuers | 3,481 |
| Futures contracts | (4,504,476) |
| Foreign currency transactions | (28,818) |
| Forward foreign currency exchange contracts | (4,896,490) |
| Net realized loss | $ (6,172,077) |
| Change in unrealized appreciation (depreciation): | |
| Investment securities | $ 21,883,045 |
| Investment securities - affiliated issuers | (5,270) |
| Futures contracts | (127,411) |
| Foreign currency | 19,432 |
| Forward foreign currency exchange contracts | 428,931 |
| Net change in unrealized appreciation (depreciation) | $22,198,727 |
| Net realized and unrealized gain | $16,026,650 |
| Net increase in net assets from operations | $25,235,177 |
15
See Notes to Financial Statements.
Calvert
Green Bond Fund
September 30, 2020
Statements of Changes in Net Assets
| | Year Ended September 30, |
| | 2020 | 2019 |
| Increase (Decrease) in Net Assets | | |
| From operations: | | |
| Net investment income | $ 9,208,527 | $ 5,638,916 |
| Net realized gain (loss) | (6,172,077) | 1,294,743 |
| Net change in unrealized appreciation (depreciation) | 22,198,727 | 15,872,750 |
| Net increase in net assets from operations | $ 25,235,177 | $ 22,806,409 |
| Distributions to shareholders: | | |
| Class A | $ (1,392,425) | $ (1,080,665) |
| Class I | (9,054,002) | (4,552,457) |
| Class R6 | (22,346) | (5,324) |
| Total distributions to shareholders | $ (10,468,773) | $ (5,638,446) |
| Capital share transactions: | | |
| Class A | $ 17,390,289 | $ 12,395,417 |
| Class I | 233,793,006 | 158,968,614 |
| Class R6 | 2,598,426 | 560,126 (1) |
| Net increase in net assets from capital share transactions | $253,781,721 | $171,924,157 |
| Net increase in net assets | $268,548,125 | $189,092,120 |
| Net Assets | | |
| At beginning of year | $ 344,799,513 | $ 155,707,393 |
| At end of year | $613,347,638 | $344,799,513 |
| (1) | For the period from the commencement of operations, February 1, 2019, to September 30, 2019. |
16
See Notes to Financial Statements.
Calvert
Green Bond Fund
September 30, 2020
| | Class A |
| | Year Ended September 30, |
| | 2020 | 2019 | 2018 | 2017 | 2016 |
| Net asset value — Beginning of year | $ 15.87 | $ 14.82 | $ 15.32 | $ 15.64 | $ 15.14 |
| Income (Loss) From Operations | | | | | |
| Net investment income(1) | $ 0.28 | $ 0.34 | $ 0.27 | $ 0.26 | $ 0.25 |
| Net realized and unrealized gain (loss) | 0.55 | 1.05 | (0.39) | (0.16) | 0.53 |
| Total income (loss) from operations | $ 0.83 | $ 1.39 | $ (0.12) | $ 0.10 | $ 0.78 |
| Less Distributions | | | | | |
| From net investment income | $ (0.32) | $ (0.34) | $ (0.27) | $ (0.26) | $ (0.25) |
| From net realized gain | (0.02) | — | (0.11) | (0.16) | (0.03) |
| Total distributions | $ (0.34) | $ (0.34) | $ (0.38) | $ (0.42) | $ (0.28) |
| Net asset value — End of year | $ 16.36 | $ 15.87 | $ 14.82 | $ 15.32 | $ 15.64 |
| Total Return(2) | 5.27% | 9.53% | (0.80)% | 0.71% | 5.21% |
| Ratios/Supplemental Data | | | | | |
| Net assets, end of year (000’s omitted) | $77,991 | $58,422 | $42,611 | $38,011 | $28,987 |
| Ratios (as a percentage of average daily net assets):(3) | | | | | |
| Total expenses | 0.79% | 0.86% | 0.99% | 1.04% | 1.12% |
| Net expenses | 0.73% | 0.77% | 0.85% | 0.88% | 0.88% |
| Net investment income | 1.77% | 2.21% | 1.83% | 1.71% | 1.64% |
| Portfolio Turnover | 26% | 21% | 16% | 43% | 243% |
| (1) | Computed using average shares outstanding. |
| (2) | Returns are historical and are calculated by determining the percentage change in net asset value with all distributions reinvested and do not reflect the effect of sales charges, if any. |
| (3) | Total expenses do not reflect amounts reimbursed and/or waived by the adviser and certain of its affiliates, if applicable. Net expenses are net of all reductions and represent the net expenses paid by the Fund. |
17
See Notes to Financial Statements.
Calvert
Green Bond Fund
September 30, 2020
Financial Highlights — continued
| | Class I |
| | Year Ended September 30, |
| | 2020 | 2019 | 2018 | 2017 | 2016 |
| Net asset value — Beginning of year | $ 15.89 | $ 14.83 | $ 15.32 | $ 15.63 | $ 15.13 |
| Income (Loss) From Operations | | | | | |
| Net investment income(1) | $ 0.32 | $ 0.38 | $ 0.33 | $ 0.32 | $ 0.31 |
| Net realized and unrealized gain (loss) | 0.55 | 1.06 | (0.40) | (0.15) | 0.53 |
| Total income (loss) from operations | $ 0.87 | $ 1.44 | $ (0.07) | $ 0.17 | $ 0.84 |
| Less Distributions | | | | | |
| From net investment income | $ (0.36) | $ (0.38) | $ (0.31) | $ (0.32) | $ (0.31) |
| From net realized gain | (0.02) | — | (0.11) | (0.16) | (0.03) |
| Total distributions | $ (0.38) | $ (0.38) | $ (0.42) | $ (0.48) | $ (0.34) |
| Net asset value — End of year | $ 16.38 | $ 15.89 | $ 14.83 | $ 15.32 | $ 15.63 |
| Total Return(2) | 5.53% | 9.84% | (0.48)% | 1.15% | 5.60% |
| Ratios/Supplemental Data | | | | | |
| Net assets, end of year (000’s omitted) | $532,149 | $285,796 | $113,097 | $23,641 | $23,908 |
| Ratios (as a percentage of average daily net assets):(3) | | | | | |
| Total expenses | 0.54% | 0.61% | 0.74% | 0.68% | 0.67% |
| Net expenses | 0.48% | 0.48% | 0.50% | 0.50% | 0.50% |
| Net investment income | 2.00% | 2.47% | 2.24% | 2.09% | 2.01% |
| Portfolio Turnover | 26% | 21% | 16% | 43% | 243% |
| (1) | Computed using average shares outstanding. |
| (2) | Returns are historical and are calculated by determining the percentage change in net asset value with all distributions reinvested and do not reflect the effect of sales charges, if any. |
| (3) | Total expenses do not reflect amounts reimbursed and/or waived by the adviser and certain of its affiliates, if applicable. Net expenses are net of all reductions and represent the net expenses paid by the Fund. |
18
See Notes to Financial Statements.
Calvert
Green Bond Fund
September 30, 2020
Financial Highlights — continued
| | Class R6 |
| | Year Ended September 30, | Period Ended
September 30, |
| | 2020 | 2019 (1) |
| Net asset value — Beginning of period | $ 15.90 | $ 15.01 |
| Income (Loss) From Operations | | |
| Net investment income(2) | $ 0.32 | $ 0.26 |
| Net realized and unrealized gain | 0.55 | 0.89 |
| Total income from operations | $ 0.87 | $ 1.15 |
| Less Distributions | | |
| From net investment income | $ (0.36) | $ (0.26) |
| From net realized gain | (0.02) | — |
| Total distributions | $ (0.38) | $ (0.26) |
| Net asset value — End of period | $16.39 | $15.90 |
| Total Return(3) | 5.58% | 7.68% (4) |
| Ratios/Supplemental Data | | |
| Net assets, end of period (000’s omitted) | $ 3,208 | $ 581 |
| Ratios (as a percentage of average daily net assets):(5) | | |
| Total expenses | 0.49% | 0.54% (6) |
| Net expenses | 0.43% | 0.43% (6) |
| Net investment income | 1.99% | 2.49% (6) |
| Portfolio Turnover | 26% | 21% (7) |
| (1) | For the period from the commencement of operations, February 1, 2019, to September 30, 2019. |
| (2) | Computed using average shares outstanding. |
| (3) | Returns are historical and are calculated by determining the percentage change in net asset value with all distributions reinvested and do not reflect the effect of sales charges, if any. |
| (4) | Not annualized. |
| (5) | Total expenses do not reflect amounts reimbursed and/or waived by the adviser and certain of its affiliates, if applicable. Net expenses are net of all reductions and represent the net expenses paid by the Fund. |
| (6) | Annualized. |
| (7) | For the year ended September 30, 2019. |
19
See Notes to Financial Statements.
Calvert
Green Bond Fund
September 30, 2020
Notes to Financial Statements
1 Significant Accounting Policies
Calvert Green Bond Fund (the Fund) is a diversified series of Calvert Impact Fund, Inc. (the Corporation). The Corporation is a Maryland corporation registered under the Investment Company Act of 1940, as amended (the 1940 Act), as an open-end management investment company. The investment objective of the Fund is to seek to maximize income, to the extent consistent with preservation of capital, primarily through investment in bonds. The Fund invests primarily in “green” investments which include those issued by companies that develop or provide products or services that seek to provide environmental solutions and/or that support environmental projects, among others.
The Fund offers three classes of shares. Class A shares are generally sold subject to a sales charge imposed at time of purchase. A contingent deferred sales charge of 0.80% may apply to certain redemptions of Class A shares for accounts for which no sales charge was paid, if redeemed within 12 months of purchase. Class I and Class R6 shares are sold at net asset value, are not subject to a sales charge and are sold only to certain eligible investors. Each class represents a pro rata interest in the Fund, but votes separately on class-specific matters and is subject to different expenses.
The Fund applies the accounting and reporting guidance in the Financial Accounting Standards Board (FASB) Accounting Standards Codification Topic 946, Financial Services – Investment Companies (ASC 946). Subsequent events, if any, through the date that the financial statements were issued have been evaluated in the preparation of the financial statements.
A Investment Valuation— Net asset value per share is determined every business day as of the close of the regular session of the New York Stock Exchange (generally 4:00 p.m. Eastern time). The Fund uses independent pricing services approved by the Board of Directors (the Board) to value its investments wherever possible. Investments for which market quotations are not available or deemed not reliable are fair valued in good faith under the direction of the Board.
U.S. generally accepted accounting principles (U.S. GAAP) establishes a disclosure hierarchy that categorizes the inputs to valuation techniques used to value assets and liabilities at measurement date. These inputs are summarized in the three broad levels listed below:
Level 1 - quoted prices in active markets for identical securities
Level 2 - other significant observable inputs (including quoted prices for similar securities, interest rates, prepayment speeds, credit risk, etc.)
Level 3 - significant unobservable inputs (including the Fund’s own assumptions in determining the fair value of investments)
The inputs or methodologies used for valuing securities are not necessarily an indication of the risk associated with investing in those securities.
Valuation techniques used to value the Fund’s investments by major category are as follows:
Equity Securities. Equity securities (including warrants and rights) listed on a U.S. securities exchange generally are valued at the last sale or closing price as reported by an independent pricing service on the primary market or exchange on which they are traded and are categorized as Level 1 in the hierarchy. Equity securities listed on the NASDAQ Global or Global Select Market are valued at the NASDAQ official closing price and are categorized as Level 1 in the hierarchy. Unlisted or listed securities for which closing sales prices or closing quotations are not available are valued at the mean between the latest available bid and ask prices and are categorized as Level 2 in the hierarchy.
Debt Securities. Debt securities are generally valued based on valuations provided by third party pricing services, as derived from such services’ pricing models. Inputs to the models may include, but are not limited to, reported trades, executable bid and ask prices, broker/dealer quotations, prices or yields of securities with similar characteristics, interest rates, anticipated prepayments, benchmark curves or information pertaining to the issuer, as well as industry and economic events. Accordingly, debt securities are generally categorized as Level 2 in the hierarchy. Short-term debt securities with a remaining maturity at time of purchase of more than sixty days are valued based on valuations provided by a third party pricing service. Such securities are generally categorized as Level 2 in the hierarchy. Short-term debt securities of sufficient credit quality purchased with remaining maturities of sixty days or less are valued at amortized cost, which approximates fair value, and are categorized as Level 2 in the hierarchy.
Affiliated Fund. The Fund may invest in Calvert Cash Reserves Fund, LLC (Cash Reserves Fund), an affiliated investment company managed by Calvert Research and Management (CRM). While Cash Reserves Fund is not a registered money market mutual fund, it conducts all of its investment activities in accordance with the requirements of Rule 2a-7 under the 1940 Act. Investments in Cash Reserves Fund are valued at the closing net asset value per unit on the valuation day and are categorized as Level 2 in the hierarchy. Cash Reserves Fund generally values its investment securities based on available market quotations provided by a third party pricing service.
Other Securities. Investments in registered investment companies (including money market funds) that do not trade on an exchange are valued at the net asset value per share on the valuation day and are categorized as Level 1 in the hierarchy.
Derivatives. Futures contracts are valued at unrealized appreciation (depreciation) based on the settlement price established each day by the board of trade or exchange on which they are traded and are categorized as Level 1 in the hierarchy. Forward foreign currency exchange contracts are generally valued at the mean of the average bid and average ask prices that are reported by currency dealers to a third party pricing service at the valuation time. Such third party pricing service valuations are supplied for specific settlement periods and the Fund's forward foreign currency exchange contracts are valued at an interpolated rate between the closest preceding and subsequent settlement period reported by the third party pricing service and are categorized as Level 2
Calvert
Green Bond Fund
September 30, 2020
Notes to Financial Statements — continued
in the hierarchy. U.S. exchange-traded options are valued at the mean between the bid and ask prices at valuation time as reported by the Options Price Reporting Authority and are categorized as Level 1 in the hierarchy.
Fair Valuation. If a market value cannot be determined for a security using the methodologies described above, or if, in the good faith opinion of the Fund's adviser, the market value does not constitute a readily available market quotation, or if a significant event has occurred that would materially affect the value of the security, the security will be fair valued as determined in good faith by or at the direction of the Board in a manner that most fairly reflects the security’s “fair value”, which is the amount that the Fund might reasonably expect to receive for the security upon its current sale in the ordinary course. Each such determination is based on a consideration of relevant factors, which are likely to vary from one pricing context to another. These factors may include, but are not limited to, the type of security, the existence of any contractual restrictions on the security’s disposition, the price and extent of public trading in similar securities of the issuer or of comparable companies or entities, quotations or relevant information obtained from broker/dealers or other market participants, information obtained from the issuer, analysts, and/or the appropriate stock exchange (for exchange-traded securities), an analysis of the company’s or entity’s financial statements, and an evaluation of the forces that influence the issuer and the market(s) in which the security is purchased and sold.
The values assigned to fair value investments are based on available information and do not necessarily represent amounts that might ultimately be realized. Further, due to the inherent uncertainty of valuations of such investments, the fair values may differ significantly from the values that would have been used had an active market existed, and the differences could be material.
The following table summarizes the market value of the Fund's holdings as of September 30, 2020, based on the inputs used to value them:
| Asset Description | Level 1 | Level 2 | Level 3 | Total |
| Asset-Backed Securities | $ — | $ 71,936,448 | $ — | $ 71,936,448 |
| Collateralized Mortgage-Backed Obligations | — | 55,411,454 | — | 55,411,454 |
| Corporate Bonds | — | 367,882,501 | — | 367,882,501 |
| High Social Impact Investments | — | 1,189,991 | — | 1,189,991 |
| Preferred Stocks | 4,997,293 | — | — | 4,997,293 |
| Sovereign Government Bonds | — | 57,117,366 | — | 57,117,366 |
| Taxable Municipal Obligations | — | 28,293,686 | — | 28,293,686 |
| U.S. Government Agencies and Instrumentalities | — | 12,620,358 | — | 12,620,358 |
| U.S. Government Agency Mortgage-Backed Securities | — | 4,231,038 | — | 4,231,038 |
| Short-Term Investments: | | | | |
| Other | — | 3,019,064 | — | 3,019,064 |
| Securities Lending Collateral | 2,339,550 | — | — | 2,339,550 |
| Total Investments | $7,336,843 | $601,701,906 | $ — | $609,038,749 |
| Forward Foreign Currency Exchange Contracts | $ — | $ 1,379,891 | $ — | $ 1,379,891 |
| Futures Contracts | 36,747 | — | — | 36,747 |
| Total | $7,373,590 | $603,081,797 | $ — | $610,455,387 |
| Liability Description | | | | |
| Forward Foreign Currency Exchange Contracts | $ — | $ (1,013) | $ — | $ (1,013) |
| Futures Contracts | (75,857) | — | — | (75,857) |
| Total | $ (75,857) | $ (1,013) | $ — | $ (76,870) |
B Investment Transactions and Income— Investment transactions for financial statement purposes are accounted for on trade date. Realized gains and losses are recorded on an identified cost basis and may include proceeds from litigation. Dividend income is recorded on the ex-dividend date for dividends received in cash and/or securities or, in the case of dividends on certain foreign securities, as soon as the Fund is informed of the ex-dividend date. Non-cash dividends are recorded at the fair value of the securities received. Withholding taxes on foreign interest, if any, have been provided for in accordance with the Fund’s understanding of the applicable country’s tax rules and rates. Interest income, which includes amortization of premium and accretion of discount on debt securities, is accrued as earned.
C Share Class Accounting— Realized and unrealized gains and losses are allocated daily to each class of shares based upon the relative net assets of each class to the total net assets of the Fund. Net investment income, other than class-specific expenses, is allocated daily to each class of shares based upon the ratio of the value of each class’s paid shares to the total value of all paid shares. Expenses arising in connection with a specific class are charged
Calvert
Green Bond Fund
September 30, 2020
Notes to Financial Statements — continued
directly to that class. Sub-accounting, recordkeeping and similar administrative fees payable to financial intermediaries, which are a component of transfer agency fees and expenses on the Statement of Operations, are not allocated to Class R6 shares.
D Foreign Currency Transactions— The Fund’s accounting records are maintained in U.S. dollars. For valuation of assets and liabilities on each date of net asset value determination, foreign denominations are converted into U.S. dollars using the current exchange rate. Security transactions, income and expenses are translated at the prevailing rate of exchange on the date of the event. Recognized gains or losses on investment transactions attributable to changes in foreign currency exchange rates are recorded for financial statement purposes as net realized gains and losses on investments. That portion of unrealized gains and losses on investments that results from fluctuations in foreign currency exchange rates is not separately disclosed.
E Futures Contracts— The Fund may enter into futures contracts to buy or sell a financial instrument for a set price at a future date. Initial margin deposits of either cash or securities as required by the broker are made upon entering into the contract. While the contract is open, daily variation margin payments are made to or received from the broker reflecting the daily change in market value of the contract and are recorded for financial reporting purposes as unrealized gains or losses by the Fund. When a futures contract is closed, a realized gain or loss is recorded equal to the difference between the opening and closing value of the contract. The risks associated with entering into futures contracts may include the possible illiquidity of the secondary market which would limit the Fund’s ability to close out a futures contract prior to the settlement date, an imperfect correlation between the value of the contracts and the underlying financial instruments, or that the counterparty will fail to perform its obligations under the contracts’ terms. Futures contracts are designed by boards of trade, which are designated “contracts markets” by the Commodities Futures Trading Commission. Futures contracts trade on the contracts markets in a manner that is similar to the way a stock trades on a stock exchange, and the boards of trade, through their clearing corporations, guarantee the futures contracts against default. As a result, there is minimal counterparty credit risk to the Fund.
F Forward Foreign Currency Exchange Contracts— The Fund may enter into forward foreign currency exchange contracts for the purchase or sale of a specific foreign currency at a fixed price on a future date. The forward foreign currency exchange contracts are adjusted by the daily exchange rate of the underlying currency and any gains or losses are recorded as unrealized until such time as the contracts have been closed. Risks may arise upon entering these contracts from the potential inability of counterparties to meet the terms of their contracts and from movements in the value of a foreign currency relative to the U.S. dollar.
G Options Contracts— Upon the purchase of a call or put option, the premium paid by the Fund is included in the Statement of Assets and Liabilities as an investment. The amount of the investment is subsequently marked-to-market to reflect the current market value of the option purchased, in accordance with the Fund’s policies on investment valuations discussed above. Premiums paid for purchasing options that expire are treated as realized losses. Premiums paid for purchasing options that are exercised or closed are added to the amounts paid or offset against the proceeds on the underlying investment transaction to determine the realized gain or loss. As the purchaser of an index option, the Fund has the right to receive a cash payment equal to any depreciation in the value of the index below the exercise price of the option (in the case of a put) or equal to any appreciation in the value of the index over the exercise price of the option (in the case of a call) as of the valuation date of the option. The risk associated with purchasing options is limited to the premium originally paid. Purchased options traded over-the-counter involve risk that the issuer or counterparty will fail to perform its contractual obligations.
H Restricted Securities— The Fund may invest in securities that are subject to legal or contractual restrictions on resale. Generally, these securities may only be sold publicly upon registration under the Securities Act of 1933 or in transactions exempt from such registration. Information regarding restricted securities (excluding Rule 144A securities) is included at the end of the Schedule of Investments.
I Distributions to Shareholders— Distributions to shareholders are recorded by the Fund on ex-dividend date. The Fund declares income distributions daily to shareholders of record at the time of declaration and generally pays them monthly. The Fund makes distributions of net realized capital gains, if any, at least annually. Distributions are declared separately for each class of shares. Distributions are determined in accordance with income tax regulations, which may differ from U.S. GAAP; accordingly, periodic reclassifications are made within the Fund’s capital accounts to reflect income and gains available for distribution under income tax regulations.
J Estimates— The preparation of financial statements in conformity with U.S. GAAP requires management to make estimates and assumptions that affect the reported amounts of assets and liabilities and disclosure of contingent assets and liabilities at the date of the financial statements and the reported amounts of increases and decreases in net assets from operations during the reporting period. Actual results could differ from those estimates.
K Indemnifications— The Corporation’s By-Laws provide for indemnification for Directors or officers of the Corporation and certain other parties, to the fullest extent permitted by Maryland law and the 1940 Act, provided certain conditions are met. Additionally, in the normal course of business, the Fund enters into agreements with service providers that may contain indemnification clauses. The Fund’s maximum exposure under these arrangements is unknown as this would involve future claims that may be made against the Fund that have not yet occurred.
L Federal Income Taxes— No provision for federal income or excise tax is required since the Fund intends to continue to qualify as a regulated investment company under the Internal Revenue Code and to distribute substantially all of its taxable earnings.
Calvert
Green Bond Fund
September 30, 2020
Notes to Financial Statements — continued
Management has analyzed the Fund's tax positions taken for all open federal income tax years and has concluded that no provision for federal income tax is required in the Fund's financial statements. A Fund's federal tax return is subject to examination by the Internal Revenue Service for a period of three years from the date of filing.
M When-Issued Securities and Delayed Delivery Transactions— The Fund may purchase or sell securities on a delayed delivery or when-issued basis. Payment and delivery may take place after the customary settlement period for that security. At the time the transaction is negotiated, the price of the security that will be delivered is fixed. The Fund maintains cash and/or security positions for these commitments such that sufficient liquid assets will be available to make payments upon settlement. Securities purchased on a delayed delivery or when-issued basis are marked-to-market daily and begin earning interest on settlement date. Losses may arise due to changes in the market value of the underlying securities or if the counterparty does not perform under the contract.
2 Related Party Transactions
The investment advisory fee is earned by CRM, a subsidiary of Eaton Vance Management (EVM), as compensation for investment advisory services rendered to the Fund. EVM is a wholly-owned subsidiary of Eaton Vance Corp. Pursuant to the investment advisory agreement dated December 31, 2016 and an amended fee schedule to such agreement effective February 1, 2019, CRM receives a fee, payable monthly, at the annual rate of 0.25% of the Fund’s average daily net assets. For the year ended September 30, 2020, the investment advisory fee amounted to $1,169,611. The Fund may invest its cash in Cash Reserves Fund. CRM does not currently receive a fee for advisory services provided to Cash Reserves Fund.
CRM has agreed to reimburse the Fund's operating expenses to the extent that total annual operating expenses (relating to ordinary operating expenses only and excluding expenses such as brokerage commissions, acquired fund fees and expenses of unaffiliated funds, borrowing costs, taxes or litigation expenses) exceed 0.73%, 0.48% and 0.43% for Class A, Class I and Class R6, respectively, of such class’s average daily net assets. The expense reimbursement agreement with CRM may be changed or terminated after January 31, 2021. For the year ended September 30, 2020, CRM waived or reimbursed expenses of $268,226.
The administrative fee is earned by CRM as compensation for administrative services rendered to the Fund. The fee is computed at an annual rate of 0.12% of the Fund’s average daily net assets attributable to Class A, Class I and Class R6 and is payable monthly. For the year ended September 30, 2020, CRM was paid administrative fees of $561,413.
The Fund has in effect a distribution plan for Class A shares (Class A Plan) pursuant to Rule 12b-1 under the 1940 Act. Pursuant to the Class A Plan, the Fund pays Eaton Vance Distributors, Inc. (EVD), an affiliate of CRM and the Fund’s principal underwriter, a distribution and service fee of 0.25% per annum of its average daily net assets attributable to Class A shares for distribution services and facilities provided to the Fund by EVD, as well as for personal services and/or the maintenance of shareholder accounts. Distribution and service fees paid or accrued for the year ended September 30, 2020 amounted to $169,309 for Class A shares.
The Fund was informed that EVD received $36,869 as its portion of the sales charge on sales of Class A shares and approximately $200 of contingent deferred sales charges paid by Fund shareholders for the year ended September 30, 2020.
EVM provides sub-transfer agency and related services to the Fund pursuant to a Sub-Transfer Agency Support Services Agreement. For the year ended September 30, 2020, sub-transfer agency fees and expenses incurred to EVM amounted to $40,394 and are included in transfer agency fees and expenses on the Statement of Operations.
Each Director of the Fund who is not an employee of CRM or its affiliates receives an annual fee of $154,000, plus an annual Committee fee ranging from $8,500 to $16,500 depending on the Committee. The Board chair receives an additional $20,000 annual fee and Committee chairs receive an additional $6,000 annual fee. Eligible Directors may participate in a Deferred Compensation Plan (the Plan). Amounts deferred under the Plan are treated as though equal dollar amounts had been invested in shares of the Fund or other Calvert funds selected by the Directors. The Fund purchases shares of the funds selected equal to the dollar amounts deferred under the Plan, resulting in an asset equal to the deferred compensation liability. Obligations of the Plan are paid solely from the Fund's assets. Directors’ fees are allocated to each of the Calvert funds served. Salaries and fees of officers and Directors of the Fund who are employees of CRM or its affiliates are paid by CRM. In addition, an Advisory Council was established to aid the Board and CRM in advancing the cause of responsible investing through original scholarship and thought leadership. The Advisory Council consists of CRM’s Chief Executive Officer and three (four prior to December 31, 2019) additional members. Each member (other than CRM’s Chief Executive Officer) received annual compensation of $75,000, which was being reimbursed by Calvert Investment Management, Inc. (CIM), the Calvert funds’ former investment adviser and Ameritas Holding Company, CIM’s parent company, through the end of 2019. For the year ending December 31, 2020, each member (other than CRM’s Chief Executive Officer) is expected to be compensated $20,000 for their service on the Advisory Council. Such compensation, and any other compensation and/or expenses incurred by the Advisory Council as may be approved by the Board, shall be borne by the Calvert funds. For the year ended September 30, 2020, the Fund’s allocated portion of the Advisory Council compensation and fees was $6,287 and the reimbursement was $5,648, which are included in miscellaneous expense and reimbursement of expenses-other, respectively, on the Statement of Operations.
Calvert
Green Bond Fund
September 30, 2020
Notes to Financial Statements — continued
3 Investment Activity
During the year ended September 30, 2020, the cost of purchases and proceeds from sales of investments, other than U.S. government and agency securities and short-term securities and including maturities and paydowns, were $332,002,655 and $117,859,553, respectively. Purchases and sales of U.S. government and agency securities, including paydowns, were $36,608,673 and $428,859, respectively.
4 Distributions to Shareholders and Income Tax Information
The tax character of distributions declared for the years ended September 30, 2020 and September 30, 2019 was as follows:
| | Year Ended September 30, |
| | 2020 | 2019 |
| Ordinary income | $10,365,628 | $5,638,446 |
| Long-term capital gains | $ 103,145 | $ — |
During the year ended September 30, 2020, distributable earnings was decreased by $117,762 and paid-in capital was increased by $117,762 due to the Fund's use of equalization accounting. Tax equalization accounting allows the Fund to treat as a distribution that portion of redemption proceeds representing a redeeming shareholder’s portion of undistributed taxable income and net capital gains.
These reclassifications had no effect on the net assets or net asset value per share of the Fund.
As of September 30, 2020, the components of distributable earnings (accumulated loss) on a tax basis were as follows:
| Undistributed ordinary income | $ 1,024,079 |
| Post October capital losses | $ (1,575,325) |
| Net unrealized appreciation | $29,381,276 |
| Distributions payable | $ (26,318) |
At September 30, 2020, the Fund had a net capital loss of $1,575,325 attributable to security transactions incurred after October 31, 2019 that it has elected to defer. This net capital loss is treated as arising on the first day of the Fund’s taxable year ending September 30, 2021.
The cost and unrealized appreciation (depreciation) of investments, including open derivative contracts, of the Fund at September 30, 2020, as determined on a federal income tax basis, were as follows:
| Aggregate cost | $579,672,659 |
| Gross unrealized appreciation | $ 31,680,645 |
| Gross unrealized depreciation | (2,314,555) |
| Net unrealized appreciation | $ 29,366,090 |
5 Financial Instruments
The Fund may trade in financial instruments with off-balance sheet risk in the normal course of its investing activities. These financial instruments may include forward foreign currency exchange contracts and futures contracts and may involve, to a varying degree, elements of risk in excess of the amounts recognized for financial statement purposes. The notional or contractual amounts of these instruments represent the investment the Fund has in particular classes of financial instruments and do not necessarily represent the amounts potentially subject to risk. The measurement of the risks associated with these instruments is meaningful only when all related and offsetting transactions are considered. A summary of obligations under these financial instruments at September 30, 2020 is included in the Schedule of Investments. At September 30, 2020, the Fund had sufficient cash and/or securities to cover commitments under these contracts.
In the normal course of pursuing its investment objective, the Fund is subject to the following risks:
Foreign Exchange Risk: During the year ended September 30, 2020, the Fund entered into forward foreign currency exchange contracts to seek to hedge against the decline in the value of currencies in which its portfolio holdings are denominated against the U.S. dollar.
Calvert
Green Bond Fund
September 30, 2020
Notes to Financial Statements — continued
Interest Rate Risk: During the year ended September 30, 2020, the Fund used futures contracts and options thereon to hedge interest rate risk and to manage duration.
The Fund enters into forward foreign currency exchange contracts that may contain provisions whereby the counterparty may terminate the contract under certain conditions, including but not limited to a decline in the Fund’s net assets below a certain level over a certain period of time, which would trigger a payment by the Fund for those derivatives in a liability position. At September 30, 2020, the fair value of derivatives with credit-related contingent features in a net liability position was $1,013. At September 30, 2020, there were no assets pledged by the Fund for such liability.
The over-the-counter (OTC) derivatives in which the Fund invests are subject to the risk that the counterparty to the contract fails to perform its obligations under the contract. To mitigate this risk, the Fund has entered into an International Swaps and Derivatives Association, Inc. Master Agreement (“ISDA Master Agreement”) with its derivative counterparty. The ISDA Master Agreement is a bilateral agreement between the Fund and the counterparty that governs certain OTC derivatives and typically contains, among other things, set-off provisions in the event of a default and/or termination event as defined under the ISDA Master Agreement. Under the ISDA Master Agreement, the Fund may, under certain circumstances, offset with the counterparty certain derivative financial instruments’ payables and/or receivables with collateral held and/or posted and create one single net payment. The provisions of the ISDA Master Agreement typically permit a single net payment in the event of default including the bankruptcy or insolvency of the counterparty. However, bankruptcy or insolvency laws of a particular jurisdiction may impose restrictions on or prohibitions against the right of offset in bankruptcy or insolvency. The ISDA Master Agreement allows the counterparty to OTC derivatives to terminate derivative contracts prior to maturity in the event the Fund’s net assets decline by a stated percentage or the Fund fails to meet the terms of its ISDA Master Agreement, which would cause the counterparty to accelerate payment by the Fund of any net liability owed to it.
The collateral requirements for derivatives traded under the ISDA Master Agreement are governed by a Credit Support Annex to the ISDA Master Agreement. Collateral requirements are determined at the close of business each day and are typically based on changes in market values for each transaction under the ISDA Master Agreement and netted into one amount for such agreement. Generally, the amount of collateral due from or to a counterparty is subject to a minimum transfer threshold amount before a transfer is required. Collateral pledged for the benefit of the Fund and/or counterparty is held in segregated accounts by the Fund’s custodian and cannot be sold, re-pledged, assigned or otherwise used while pledged. The portion of such collateral representing cash, if any, is reflected as deposits for derivatives collateral and, in the case of cash pledged by a counterparty for the benefit of the Fund, a corresponding liability on the Statement of Assets and Liabilities. Securities pledged by the Fund as collateral, if any, are identified as such in the Schedule of Investments.
At September 30, 2020, the fair value of open derivative instruments (not considered to be hedging instruments for accounting disclosure purposes) by risk exposure was as follows:
| Risk | Derivative | Statement of Assets and Liabilities Caption | Assets | Liabilities |
| Foreign exchange | Forward foreign currency exchange contracts | Receivable/Payable for open forward foreign currency
exchange contracts | $ 1,379,891 | $ (1,013) |
| Interest rate | Futures contracts | Distributable earnings | 36,747 (1) | (75,857) (1) |
| Total | | | $1,416,638 | $(76,870) |
| Derivatives not subject to master netting agreement | $ 36,747 | $(75,857) |
| Total Derivatives subject to master netting agreement | $1,379,891 | $ (1,013) |
| (1) | Only the current day's variation margin is reported within the Statement of Assets and Liabilities as Receivable or Payable for variation margin on open futures contracts, as applicable. |
The Fund’s derivative assets and liabilities at fair value by risk, which are reported gross in the Statement of Assets and Liabilities, are presented in the table above. The following tables present the Fund’s derivative assets and liabilities by counterparty, net of amounts available for offset under a master netting agreement and net of the related collateral received by the Fund for such assets and pledged by the Fund for such liabilities as of September 30, 2020.
| Counterparty | Derivative
Assets Subject to
Master Netting
Agreement | Derivatives
Available
for Offset | Non-cash
Collateral
Received(a) | Cash
Collateral
Received(a) | Net Amount
of Derivative
Assets(b) | Total Cash
Collateral
Received |
| State Street Bank and Trust Company | $1,379,891 | $(1,013) | $ — | $(1,340,000) | $38,878 | $1,340,000 |
Calvert
Green Bond Fund
September 30, 2020
Notes to Financial Statements — continued
| Counterparty | Derivative
Liabilities Subject to
Master Netting
Agreement | Derivatives
Available
for Offset | Non-cash
Collateral
Pledged(a) | Cash
Collateral
Pledged(a) | Net Amount
of Derivative
Liabilities(c) | Total Cash
Collateral
Pledged |
| State Street Bank and Trust Company | $(1,013) | $1,013 | $ — | $ — | $ — | $ — |
| (a) | In some instances, the total collateral received and/or pledged may be more than the amount shown due to overcollateralization. |
| (b) | Net amount represents the net amount due from the counterparty in the event of default. |
| (c) | Net amount represents the net amount payable to the counterparty in the event of default. |
The effect of derivative instruments (not considered to be hedging instruments for accounting disclosure purposes) on the Statement of Operations by risk exposure for the year ended September 30, 2020 was as follows:
| Statement of Operations Caption | Foreign exchange | Interest rate | Total |
| Net realized gain (loss): | | | |
| Investment securities(1) | $ — | $ (24,313) | $ (24,313) |
| Forward foreign currency exchange contracts | (4,896,490) | — | (4,896,490) |
| Futures contracts | — | (4,504,476) | (4,504,476) |
| Total | $(4,896,490) | $(4,528,789) | $(9,425,279) |
| Change in unrealized appreciation (depreciation): | | | |
| Forward foreign currency exchange contracts | $ 428,931 | $ — | $ 428,931 |
| Futures contracts | — | (127,411) | (127,411) |
| Total | $ 428,931 | $ (127,411) | $ 301,520 |
| (1) | Relates to purchased options. |
The average notional cost of futures contracts and average notional amounts of other derivative contracts outstanding during the year ended September 30, 2020, which are indicative of the volume of these derivative types, were approximately as follows:
Futures
Contracts — Long | Futures
Contracts — Short | Forward
Foreign Currency
Exchange Contracts* |
| $13,453,000 | $34,028,000 | $108,196,000 |
| * | The average notional amount for forward foreign currency exchange contracts is based on the absolute value of notional amounts of currency purchased and currency sold. |
The average number of purchased options contracts outstanding during the year ended September 30, 2020, which is indicative of the volume of this derivative type, was approximately 23 contracts.
6 Securities Lending
To generate additional income, the Fund may lend its securities pursuant to a securities lending agency agreement with State Street Bank and Trust Company (SSBT), the securities lending agent. Security loans are subject to termination by the Fund at any time and, therefore, are not considered illiquid investments. The Fund requires that the loan be continuously collateralized by either cash or securities as collateral equal at all times to at least 102% of the market value of the domestic securities loaned and 105% of the market value of the international securities loaned (if applicable). The market value of securities loaned is determined daily and any additional required collateral is delivered to the Fund on the next business day. Cash collateral is generally invested in a money market fund registered under the 1940 Act that is managed by an affiliate of SSBT. Any gain or loss in the market price of the loaned securities that might occur and any interest earned or dividends declared during the term of the loan would accrue to the account of the Fund. Income earned on the investment of collateral, net of broker rebates and other expenses incurred by the securities lending agent, is split between the Fund and the securities lending agent based on agreed upon contractual terms. Non-cash collateral, if any, is held by the lending agent on behalf of the Fund and cannot be sold or re-pledged by the Fund; accordingly, such collateral is not reflected in the Statement of Assets and Liabilities.
Calvert
Green Bond Fund
September 30, 2020
Notes to Financial Statements — continued
The risks associated with lending portfolio securities include, but are not limited to, possible delays in receiving additional collateral or in the recovery of the loaned securities, possible loss of rights to the collateral should the borrower fail financially, as well as risk of loss in the value of the collateral or the value of the investments made with the collateral. The securities lending agent shall indemnify the Fund in the case of default of any securities borrower.
At September 30, 2020, the total value of securities on loan, including accrued interest, was $6,877,765 and the total value of collateral received was $7,017,087, comprised of cash of $2,339,550 and U.S. government and/or agencies securities of $4,677,537.
The following table provides a breakdown of securities lending transactions accounted for as secured borrowings, the obligations by class of collateral pledged, and the remaining contractual maturity of those transactions as of September 30, 2020.
| | Remaining Contractual Maturity of the Transactions |
| | Overnight and
Continuous | <30 days | 30 to 90 days | >90 days | Total |
| Corporate Bonds | $ 2,226,150 | $ — | $ — | $ — | $ 2,226,150 |
| Preferred Stocks | 113,400 | — | — | — | 113,400 |
| Total | $2,339,550 | $ — | $ — | $ — | $2,339,550 |
The carrying amount of the liability for deposits for securities loaned at September 30, 2020 approximated its fair value. If measured at fair value, such liability would have been considered as Level 2 in the fair value hierarchy (see Note 1A) at September 30, 2020.
7 Line of Credit
Effective October 29, 2019, the Fund participates with other portfolios and funds managed by EVM and its affiliates, including CRM, in an $800 million unsecured line of credit with a group of banks, which is in effect through October 27, 2020. Borrowings are made by the Fund solely for temporary purposes related to redemptions and other short-term cash needs. Interest is charged to the Fund based on its borrowings at an amount above either the Eurodollar rate or Federal Funds rate. In addition, a fee computed at an annual rate of 0.15% on the daily unused portion of the line of credit is allocated among the participating portfolios and funds at the end of each quarter. Because the line of credit is not available exclusively to the Fund, it may be unable to borrow some or all of its requested amounts at any particular time.
Prior to October 29, 2019, the Fund participated with other funds managed by CRM in a $100 million committed unsecured line of credit agreement with SSBT, which was terminated by the Calvert funds. Borrowings bore interest at the higher of the one-month London Interbank Offered Rate (LIBOR) in effect that day or the overnight Federal Funds rate, plus 1.00% per annum. A commitment fee of 0.20% per annum was incurred on the unused portion of the committed facility, which was allocated to all participating funds.
The Fund had no borrowings pursuant to its lines of credit during the year ended September 30, 2020. Effective October 27, 2020, the Fund renewed its line of credit agreement, which expires October 26, 2021, at substantially the same terms.
8 Affiliated Companies and Funds
The Fund has invested a portion of its assets in notes (the Notes) issued by Calvert Impact Capital, Inc. (CIC) pursuant to exemptive relief granted by the U.S. Securities and Exchange Commission (the SEC). There are certain potential points of affiliation between the Fund and CIC. CRM has licensed use of the Calvert name to CIC and provides other types of support. CRM’s President and Chief Executive Officer (and the only director/trustee on the Fund Board that is an “interested person” of the Fund) serves on the CIC Board, along with one member of the Advisory Council to the Fund Board. In addition, another director/trustee on the Fund Board and a member of the Advisory Council each serve as a director emeritus on the CIC Board.
Calvert
Green Bond Fund
September 30, 2020
Notes to Financial Statements — continued
At September 30, 2020, the value of the Fund’s investment in the Notes and affiliated funds was $4,209,055, which represents 0.7% of the Fund’s net assets. Transactions in the Notes and affiliated funds by the Fund for the year ended September 30, 2020 were as follows:
| Name | Value,
beginning
of period | Purchases | Sales
proceeds | Net
realized
gain
(loss) | Change in
unrealized
appreciation
(depreciation) | Value,
end of
period | Interest/
Dividend
income | Principal
amount/Units,
end of period |
| High Social Impact Investments | | | | | | | | |
| Calvert Impact Capital, Inc., Community Investment Notes, 1.50%, 12/15/19(1) | $149,206 | $ — | $ (150,000) | $ — | $ 794 | $ — | $ 438 | $ — |
| Calvert Impact Capital, Inc., Community Investment Notes, 1.50%, 12/15/20(1) | — | 1,196,055 | — | — | (6,064) | 1,189,991 | 14,203 | 1,196,055 |
| Short-Term Investments | | | | | | | | |
| Calvert Cash Reserves Fund, LLC | — | 108,443,101 | (105,427,518) | 3,481 | — | 3,019,064 | 6,827 | 3,018,762 |
| Totals | | | | $3,481 | $ (5,270) | $4,209,055 | $21,468 | |
9 Capital Shares
The Corporation may issue its shares in one or more series (such as the Fund). The authorized shares of the Fund consist of 75,000,000 common shares, $0.01 par value, for each Class.
Transactions in capital shares for the years ended September 30, 2020 and September 30, 2019 were as follows:
| | Year Ended
September 30, 2020 | | Year Ended
September 30, 2019(1) |
| | Shares | Amount | | Shares | Amount |
| Class A | | | | | |
| Shares sold | 2,062,278 | $ 32,912,680 | | 1,398,702 | $ 21,394,507 |
| Reinvestment of distributions | 82,759 | 1,321,476 | | 66,735 | 1,020,393 |
| Shares redeemed | (1,058,461) | (16,843,867) | | (660,326) | (10,019,483) |
| Net increase | 1,086,576 | $ 17,390,289 | | 805,111 | $ 12,395,417 |
| Class I | | | | | |
| Shares sold | 19,929,297 | $ 319,155,887 | | 12,333,822 | $ 189,249,815 |
| Reinvestment of distributions | 547,153 | 8,759,879 | | 281,533 | 4,331,692 |
| Shares redeemed | (5,971,478) | (94,122,760) | | (2,258,110) | (34,612,893) |
| Net increase | 14,504,972 | $233,793,006 | | 10,357,245 | $158,968,614 |
| Class R6 | | | | | |
| Shares sold | 198,342 | $ 3,220,456 | | 63,941 | $ 993,091 |
| Reinvestment of distributions | 1,195 | 19,204 | | 337 | 5,324 |
| Shares redeemed | (40,354) | (641,234) | | (27,710) | (438,289) |
| Net increase | 159,183 | $ 2,598,426 | | 36,568 | $ 560,126 |
| (1) | For Class R6, for the period from the commencement of operations, February 1, 2019, to September 30, 2019. |
Calvert
Green Bond Fund
September 30, 2020
Notes to Financial Statements — continued
10 Risks and Uncertainties
Risks Associated with Foreign Investments
Investing in foreign securities involves additional risks relating to political economic and market developments abroad, including the imposition of economic and other sanctions by the United States or another country. Other risks result from differences between regulations that apply to U.S. and foreign issuers and markets, and the potential for foreign markets to be less liquid and more volatile than U.S. markets. Securities that trade or are denominated in currencies other than the U.S. dollar may be adversely affected by fluctuations in currency exchange rates.
The Fund may have difficulties enforcing its legal or contractual rights in a foreign country. Economic data as reported by sovereign or government entities and other issuers may be delayed, inaccurate or fraudulent. In the event of default of a sovereign or government debt, there are typically no assets to be seized or cash flows to be attached. Furthermore, the willingness or ability of a sovereign or government entity to renegotiate defaulted debt may be limited.
Pandemic Risk
An outbreak of respiratory disease caused by a novel coronavirus was first detected in China in December 2019 and subsequently spread internationally. This coronavirus has resulted in closing borders, enhanced health screenings, changes to healthcare service preparation and delivery, quarantines, cancellations, disruptions to supply chains and customer activity, as well as general concern and uncertainty. Health crises caused by outbreaks, such as the coronavirus outbreak, may exacerbate other pre-existing political, social and economic risks and disrupt normal market conditions and operations. The impact of this outbreak has negatively affected the worldwide economy, the economies of individual countries, individual companies, and the market in general, and may continue to do so in significant and unforeseen ways, as may other epidemics and pandemics that may arise in the future. Any such impact could adversely affect the Fund's performance, or the performance of the securities in which the Fund invests.
11 Subsequent Event
On October 8, 2020, Morgan Stanley and Eaton Vance Corp. (“Eaton Vance”) announced that they had entered into a definitive agreement under which Morgan Stanley would acquire Eaton Vance. Under the Investment Company Act of 1940, as amended, consummation of this transaction may result in the automatic termination of the Fund’s investment advisory agreement, and any related sub-advisory agreement(s), if applicable. Thus, the Fund’s Board will be asked to approve a new investment advisory agreement (and new sub-advisory agreement(s), if applicable). If approved by the Fund’s Board, the new investment advisory agreement (and new sub-advisory agreement(s), if applicable) is expected to be presented to Fund shareholders for approval, and, if approved, would take effect upon the closing of the transaction.
Calvert
Green Bond Fund
September 30, 2020
Report of Independent Registered Public Accounting Firm
To the Shareholders and Board of Directors
Calvert Impact Fund, Inc.:
Opinion on the Financial Statements
We have audited the accompanying statement of assets and liabilities of Calvert Green Bond Fund (the Fund), a series of Calvert Impact Fund, Inc., including the schedule of investments, as of September 30, 2020, the related statement of operations for the year then ended, the statements of changes in net assets for each of the years in the two-year period then ended, and the related notes (collectively, the financial statements) and the financial highlights for each of the years or periods in the five-year period then ended. In our opinion, the financial statements and financial highlights present fairly, in all material respects, the financial position of the Fund as of September 30, 2020, the results of its operations for the year then ended, the changes in its net assets for each of the years in the two-year period then ended, and the financial highlights for each of the years or periods in the five-year period then ended, in conformity with U.S. generally accepted accounting principles.
Basis for Opinion
These financial statements and financial highlights are the responsibility of the Fund’s management. Our responsibility is to express an opinion on these financial statements and financial highlights based on our audits. We are a public accounting firm registered with the Public Company Accounting Oversight Board (United States) (PCAOB) and are required to be independent with respect to the Fund in accordance with the U.S. federal securities laws and the applicable rules and regulations of the Securities and Exchange Commission and the PCAOB.
We conducted our audits in accordance with the standards of the PCAOB. Those standards require that we plan and perform the audit to obtain reasonable assurance about whether the financial statements and financial highlights are free of material misstatement, whether due to error or fraud. Our audits included performing procedures to assess the risks of material misstatement of the financial statements and financial highlights, whether due to error or fraud, and performing procedures that respond to those risks. Such procedures included examining, on a test basis, evidence regarding the amounts and disclosures in the financial statements and financial highlights. Such procedures also included confirmation of securities owned as of September 30, 2020, by correspondence with the custodian, brokers, and agent banks. Our audits also included evaluating the accounting principles used and significant estimates made by management, as well as evaluating the overall presentation of the financial statements and financial highlights. We believe that our audits provide a reasonable basis for our opinion.

We have served as the auditor of one or more of the Calvert Funds since 2002.
Philadelphia, Pennsylvania
November 20, 2020
Calvert
Green Bond Fund
September 30, 2020
Federal Tax Information (Unaudited)
The Form 1099-DIV you receive in February 2021 will show the tax status of all distributions paid to your account in calendar year 2020. Shareholders are advised to consult their own tax adviser with respect to the tax consequences of their investment in the Fund. As required by the Internal Revenue Code and/or regulations, shareholders must be notified regarding the status of capital gains dividends.
Capital Gains Dividends. The Fund hereby designates as a capital gain dividend with respect to the taxable year ended September 30, 2020, $103,145 or, if subsequently determined to be different, the net capital gain of such year.
Calvert
Green Bond Fund
September 30, 2020
Liquidity Risk Management Program
The Fund has implemented a written liquidity risk management program (Program) and related procedures to manage its liquidity in accordance with Rule 22e-4 under the Investment Company Act of 1940, as amended (Liquidity Rule). The Liquidity Rule defines “liquidity risk” as the risk that a fund could not meet requests to redeem shares issued by the fund without significant dilution of the remaining investors’ interests in the fund. The Fund's Board of Trustees/Directors has designated the investment adviser to serve as the administrator of the Program and the related procedures. The administrator has established a Liquidity Risk Management Oversight Committee (Committee) to perform the functions necessary to administer the Program. As part of the Program, the administrator is responsible for identifying illiquid investments and categorizing the relative liquidity of the Fund's investments in accordance with the Liquidity Rule. Under the Program, the administrator assesses, manages, and periodically reviews the Fund's liquidity risk, and is responsible for making certain reports to the Fund's Board of Trustees/Directors and the Securities and Exchange Commission (SEC) regarding the liquidity of the Fund’s investments, and to notify the Board of Trustees/Directors and the SEC of certain liquidity events specified in the Liquidity Rule. The liquidity of the Fund's portfolio investments is determined based on a number of factors including, but not limited to, relevant market, trading and investment-specific considerations under the Program.
At a meeting of the Fund's Board of Trustees/Directors, the Committee provided a written report to the Fund's Board of Trustees/Directors pertaining to the operation, adequacy, and effectiveness of implementation of the Program, as well as the operation of the highly liquid investment minimum (if applicable) for the period December 1, 2018 through December 31, 2019 (Review Period). The Program operated effectively during the Review Period, supporting the administrator’s ability to assess, manage and monitor Fund liquidity risk, including during periods of market volatility and net redemptions. During the Review Period, the Fund met redemption requests on a timely basis.
There can be no assurance that the Program will achieve its objectives in the future. Please refer to the Fund's prospectus for more information regarding the Fund's exposure to liquidity risk and other principal risks to which an investment in the Fund may be subject.
Calvert
Green Bond Fund
September 30, 2020
Management and Organization
Fund Management. The Directors of Calvert Impact Fund, Inc. (the Corporation) are responsible for the overall management and supervision of the Corporation’s affairs. The Directors and officers of the Corporation are listed below. Except as indicated, each individual has held the office shown or other offices in the same company for the last five years. Directors and officers of the Corporation hold indefinite terms of office. The “Independent Directors” consist of those Directors who are not “interested persons” of the Corporation, as that term is defined under the 1940 Act. The business address of each Director and officer, with the exception of Ms. Gemma and Mr. Kirchner, is 1825 Connecticut Avenue NW, Suite 400, Washington, DC 20009. As used below, “CRM” refers to Calvert Research and Management. Each Director oversees 39 funds in the Calvert fund complex. Each officer serves as an officer of certain other Calvert funds.
| Name and Year of Birth | Corporation
Position(s) | Position
Start Date | Principal Occupation(s) and Other Directorships
During Past Five Years and Other Relevant Experience | |
| Interested Director | |
John H. Streur(1)
1960 | Director &
President | 2015 | President and Chief Executive Officer of Calvert Research and
Management (since December 31, 2016). President and Chief Executive
Officer of Calvert Investments, Inc. (January 2015 - December 2016);
Chief Executive Officer of Calvert Investment Distributors, Inc. (August
2015 - December 2016); Chief Compliance Officer of Calvert Investment
Management, Inc. (August 2015 - April 2016); President and Director, Portfolio 21 Investments, Inc. (through October 2014); President,
Chief Executive Officer and Director, Managers Investment Group LLC
(through January 2012); President and Director, The Managers Funds
and Managers AMG Funds (through January 2012).
Other Directorships in the Last Five Years. Portfolio 21 Investments,
Inc. (asset management) (through October 2014); Managers Investment
Group LLC (asset management) (through January 2012); The Managers
Funds (asset management) (through January 2012); Managers AMG Funds
(asset management) (through January 2012); Calvert Impact Capital, Inc. | |
| Independent Directors | |
Richard L. Baird, Jr.
1948 | Director | 2005 | Regional Disaster Recovery Lead, American Red Cross of Greater
Pennsylvania (since 2017). Volunteer, American Red Cross (since 2015).
Former President and CEO of Adagio Health Inc. (retired in 2014) in
Pittsburgh, PA.
Other Directorships in the Last Five Years. None. | |
Alice Gresham Bullock
1950 | Chair &
Director | 2016 | Professor Emerita at Howard University School of Law. Dean Emerita of
Howard University School of Law and Deputy Director of the Association
of American Law Schools (1992-1994).
Other Directorships in the Last Five Years. None. | |
Cari M. Dominguez
1949 | Director | 2016 | Former Chair of the U.S. Equal Employment Opportunity Commission.
Other Directorships in the Last Five Years. Manpower, Inc. (employment
agency); Triple S Management Corporation (managed care); National
Association of Corporate Directors. | |
John G. Guffey, Jr.(2)
1948 | Director | 2005 | President of Aurora Press Inc., a privately held publisher of trade
paperbacks (since January 1997).
Other Directorships in the Last Five Years. Calvert Impact Capital, Inc.
(through December 31, 2018); Calvert Ventures, LLC. | |
Miles D. Harper, III
1962 | Director | 2000 | Partner, Carr Riggs & Ingram (public accounting firm) since October 2014.
Partner, Gainer Donnelly & Desroches (public accounting firm) (now Carr
Riggs & Ingram), (November 1999-September 2014).
Other Directorships in the Last Five Years. Bridgeway Funds (9) (asset
management). | |
Joy V. Jones
1950 | Director | 2000 | Attorney.
Other Directorships in the Last Five Years. Conduit Street Restaurants
SUD 2 Limited; Palm Management Restaurant Corporation. | |
Calvert
Green Bond Fund
September 30, 2020
Management and Organization — continued
| Name and Year of Birth | Corporation
Position(s) | Position
Start Date | Principal Occupation(s) and Other Directorships
During Past Five Years and Other Relevant Experience | |
| Independent Directors (continued) |
Anthony A. Williams
1951 | Director | 2016 | CEO and Executive Director of the Federal City Council (July 2012 to
present); Senior Adviser and Independent Consultant for King and
Spalding LLP (September 2015 to present); Executive Director of Global
Government Practice at the Corporate Executive Board (January 2010 to
January 2012).
Other Directorships in the Last Five Years. Freddie Mac; Evoq
Properties/Meruelo Maddux Properties, Inc. (real estate management);
Weston Solutions, Inc. (environmental services); Bipartisan Policy Center’s
Debt Reduction Task Force; Chesapeake Bay Foundation; Catholic
University of America; Urban Institute (research organization). | |
| Name and Year of Birth | Corporation
Position(s) | Position
Start Date | Principal Occupation(s)
During Past Five Years | |
| Principal Officers who are not Directors | |
Hope L. Brown
1973 | Chief
Compliance
Officer | 2014 | Chief Compliance Officer of 39 registered investment companies advised
by CRM (since 2014). Vice President and Chief Compliance Officer,
Wilmington Funds (2012-2014). | |
Maureen A. Gemma(3)
1960 | Secretary,
Vice President
and Chief
Legal Officer | 2016 | Vice President of CRM and officer of 39 registered investment
companies advised by CRM (since 2016). Also Vice President of
Eaton Vance and certain of its affiliates and officer of 156 registered
investment companies advised or administered by Eaton Vance. | |
James F. Kirchner(3)
1967 | Treasurer | 2016 | Vice President of CRM and officer of 39 registered investment companies
advised by CRM (since 2016). Also Vice President of Eaton Vance and
certain of its affiliates and officer of 156 registered investment companies
advised or administered by Eaton Vance. | |
| (1) Mr. Streur is an interested person of the Fund because of his positions with the Fund’s adviser and certain affiliates. | |
| (2) Mr. Guffey is currently married to Rebecca L. Adamson, who served as a member of the Advisory Council through December 31, 2019. | |
| (3) The business address for Ms. Gemma and Mr. Kirchner is Two International Place, Boston, MA 02110. | |
The SAI for the Fund includes additional information about the Directors and officers of the Fund and can be obtained without charge on Calvert’s website at www.calvert.com or by calling 1-800-368-2745.
Privacy. The Eaton Vance organization is committed to ensuring your financial privacy. Each entity listed below has adopted a privacy policy and procedures (“Privacy Program”) Eaton Vance believes is reasonably designed to protect your personal information and to govern when and with whom Eaton Vance may share your personal information.
| • | At the time of opening an account, Eaton Vance generally requires you to provide us with certain information such as name, address, social security number, tax status, account numbers, and account balances. This information is necessary for us to both open an account for you and to allow us to satisfy legal requirements such as applicable anti-money laundering reviews and know-your-customer requirements. |
| • | On an ongoing basis, in the normal course of servicing your account, Eaton Vance may share your information with unaffiliated third parties that perform various services for Eaton Vance and/or your account. These third parties include transfer agents, custodians, broker/dealers and our professional advisers, including auditors, accountants, and legal counsel. Eaton Vance may additionally share your personal information with our affiliates. |
| • | We believe our Privacy Program is reasonably designed to protect the confidentiality of your personal information and to prevent unauthorized access to that information. |
| • | We reserve the right to change our Privacy Program at any time upon proper notification to you. You may want to review our Privacy Program periodically for changes by accessing the link on our homepage: www.calvert.com. |
Our pledge of protecting your personal information applies to the following entities within the Eaton Vance organization: the Eaton Vance Family of Funds, Eaton Vance Management, Eaton Vance Investment Counsel, Eaton Vance Distributors, Inc., Eaton Vance Trust Company, Eaton Vance Management (International) Limited, Eaton Vance Advisers International Ltd., Eaton Vance Global Advisors Limited, Eaton Vance Management's Real Estate Investment Group, Boston Management and Research, Calvert Research and Management, and Calvert Funds. This Privacy Notice supersedes all previously issued privacy disclosures. For more information about our Privacy Program or about how your personal information may be used, please call 1-800-368-2745.
Delivery of Shareholder Documents. The Securities and Exchange Commission (SEC) permits funds to deliver only one copy of shareholder documents, including prospectuses, proxy statements and shareholder reports, to fund investors with multiple accounts at the same residential or post office box address. This practice is often called “householding” and it helps eliminate duplicate mailings to shareholders. Calvert funds, or your financial intermediary, may household the mailing of your documents indefinitely unless you instruct Calvert funds, or your financial intermediary, otherwise. If you would prefer that your Calvert fund documents not be householded, please contact Calvert funds at 1-800-368-2745, or contact your financial intermediary. Your instructions that householding not apply to delivery of your Calvert fund documents will typically be effective within 30 days of receipt by Calvert funds or your financial intermediary. Separate statements will be generated for each separate account and will be householded as described above.
Portfolio Holdings. Each Calvert fund files a schedule of portfolio holdings on Part F to Form N-PORT with the SEC. Certain information filed on Form N-PORT may be viewed on the Calvert website at www.calvert.com, by calling Calvert at 1-800-368-2745 or in the EDGAR database on the SEC’s website at www.sec.gov.
Proxy Voting. The Proxy Voting Guidelines that each Calvert fund uses to determine how to vote proxies relating to portfolio securities is provided as an Appendix to the fund’s Statement of Additional Information. The Statement of Additional Information can be obtained free of charge by calling the Calvert funds at 1-800-368-2745, by visiting the Calvert funds’ website at www.calvert.com or visiting the SEC’s website at www.sec.gov. Information regarding how a Calvert fund voted proxies relating to portfolio securities during the most recent 12-month period ended June 30 is available by calling Calvert funds, by visiting the Calvert funds’ website at www.calvert.com or by visiting the SEC’s website at www.sec.gov.
This Page Intentionally Left Blank
Investment Adviser and Administrator
Calvert Research and Management
1825 Connecticut Avenue NW, Suite 400
Washington, DC 20009
Principal Underwriter*
Eaton Vance Distributors, Inc.
Two International Place
Boston, MA 02110
(617) 482-8260
Custodian
State Street Bank and Trust Company
State Street Financial Center, One Lincoln Street
Boston, MA 02111
Transfer Agent
DST Asset Manager Solutions, Inc.
2000 Crown Colony Drive
Quincy, MA 02169
Independent Registered Public Accounting Firm
KPMG LLP
1601 Market Street
Philadelphia, PA 19103-2499
Fund Offices
1825 Connecticut Avenue NW, Suite 400
Washington, DC 20009
* FINRA BrokerCheck. Investors may check the background of their Investment Professional by contacting the Financial Industry Regulatory Authority (FINRA). FINRA BrokerCheck is a free tool to help investors check the professional background of current and former FINRA-registered securities firms and brokers. FINRA BrokerCheck is available by calling 1-800-289-9999 and at www.FINRA.org. The FINRA BrokerCheck brochure describing this program is available to investors at www.FINRA.org.
Printed on recycled paper.
Calvert
Global Energy Solutions Fund
Global Water Fund
Annual Report
September 30, 2020
Important Note. Beginning on January 1, 2021, as permitted by regulations adopted by the Securities and Exchange Commission, paper copies of each Fund’s annual and semi-annual shareholder reports will no longer be sent by mail unless you specifically request paper copies of the reports. Instead, the reports will be made available on the Funds' website (calvert.com/prospectus), and you will be notified by mail each time a report is posted and provided with a website address to access the report.
If you already elected to receive shareholder reports electronically, you will not be affected by this change and you need not take any action. If you are a direct investor, you may elect to receive shareholder reports and other communications from the Funds electronically by signing up for e-Delivery at calvert.com. If you own your shares through a financial intermediary (such as a broker-dealer or bank), you must contact your financial intermediary to sign up.
You may elect to receive all future Fund shareholder reports in paper free of charge. If you are a direct investor, you can inform the Funds that you wish to continue receiving paper copies of your shareholder reports by calling 1-800-368-2745. If you own these shares through a financial intermediary, you must contact your financial intermediary or follow instructions included with this disclosure, if applicable, to elect to continue to receive paper copies of your shareholder reports. Your election to receive reports in paper will apply to all Calvert funds held directly or to all funds held through your financial intermediary, as applicable.
E-Delivery Sign-Up - Details Inside
Commodity Futures Trading Commission Registration. Effective December 31, 2012, the Commodity Futures Trading Commission (“CFTC”) adopted certain regulatory changes that subject registered investment companies and advisers to regulation by the CFTC if a fund invests more than a prescribed level of its assets in certain CFTC-regulated instruments (including futures, certain options and swap agreements) or markets itself as providing investment exposure to such instruments. The adviser has claimed an exclusion from the definition of “commodity pool operator” under the Commodity Exchange Act with respect to its management of each Fund and the other funds it manages. Accordingly, neither the Funds nor the adviser is subject to CFTC regulation.
Fund shares are not insured by the FDIC and are not deposits or other obligations of, or guaranteed by, any depository institution. Shares are subject to investment risks, including possible loss of principal invested.
This report must be preceded or accompanied by a current summary prospectus or prospectus. Before investing, investors should consider carefully the investment objective, risks, and charges and expenses of a mutual fund. This and other important information is contained in the summary prospectus and prospectus, which can be obtained from a financial intermediary. Prospective investors should read the prospectus carefully before investing. For further information, please call 1-800-368-2745.
Choose Planet-friendly E-delivery!
Sign up now for on-line statements, prospectuses, and fund reports. In less than five minutes you can help reduce paper mail and lower fund costs.
Just go to www.calvert.com. If you already have an online account with the Calvert funds, click on Login to access your Account and select the documents you would like to receive via e-mail.
If you’re new to online account access, click on Login, then Register to create your user name and password. Once you’re in, click on the E-delivery sign-up on the Account Portfolio page and follow the quick, easy steps.
Note: If your shares are not held directly with the Calvert funds but through a brokerage firm, you must contact your broker for electronic delivery options available through their firm.
Annual Report September 30, 2020
Calvert
Global Energy Solutions Fund
Global Water Fund
Calvert
Global Energy Solutions Fund
Global Water Fund
September 30, 2020
Management's Discussion of Fund Performance†
Economic and Market Conditions
The 12-month period that began October 1, 2019, included some of the best and worst equity performances in over a decade.
The period began with global equities rallying in the closing months of 2019, supported by interest-rate reductions by dozens of central banks worldwide. In July 2019, the U.S. Federal Reserve (the Fed) had cut rates for the first time in over a decade, followed by two additional rate cuts in September and October.
In January 2020, however, news of the novel coronavirus outbreak in China began to raise investor concerns. As the virus turned into a global pandemic in February and March, it ended the longest-ever U.S. economic expansion and brought about a global economic slowdown. Equity markets along with credit markets declined in value amid unprecedented volatility.
In response, the Fed announced two emergency rate cuts in March 2020 — lowering the federal funds rate to 0.00%-0.25% — along with other measures designed to shore up the markets. Across the globe, other central banks and governments also commenced aggressive monetary and fiscal responses to help mitigate the economic effects of the virus.
These moves helped calm the markets and initiated a global equity rally that began in late March and lasted through August. In the second quarter of 2020, U.S. stocks reported their best quarterly returns since 1998 — on the heels of the worst first quarter for American stocks since the 2007-2008 global financial crisis. As with U.S. equities, overseas stock indexes reflected investor optimism as economies started to emerge from coronavirus lockdowns and factories resumed production.
In September 2020, however, the equity rally stalled as the pandemic appeared to increase its drag on the global economy. Across Europe, nations that seemed to have beaten back the coronavirus during the summer began to brace for a second wave of infections. In the U.S., coronavirus cases were on the rise in more than 30 states. Of the 22 million U.S. jobs lost in the early months of the pandemic, only 11 million jobs had returned, and 26.5 million Americans were collecting unemployment benefits. Reflecting the increasingly grim economic outlook for fall and winter, most major global stock indexes reported negative returns for the final month of the period.
For the period as a whole, positive equity returns belied the dramatic volatility during the period. The MSCI World Index, a broad measure of global equities, returned 10.41%; while the S&P 500® Index, a broad measure of U.S. stocks, returned 15.15%; and the technology-laden Nasdaq Composite Index returned 40.96%. The MSCI EAFE Index of developed-market international equities returned 0.49%; while the MSCI Emerging Markets Index returned 10.54% in U.S. dollars.
Fund Performance - Calvert Global Energy Solutions Fund
For the 12-month period ended September 30, 2020, Calvert Global Energy Solutions Fund (the Fund) returned 36.12% for Class A shares at net asset value (NAV). The Fund outperformed its primary benchmark, the MSCI ACWI Index (the Index), which returned 10.44%. The Fund also underperformed its secondary benchmark, the Calvert Global Energy Research Index (the Calvert Energy Index), which returned 37.45%.
The Fund’s underperformance relative to the Calvert Energy Index was the result of Fund expenses and fees, which the Calvert Energy Index does not incur.
The Fund invests in five categories of companies that are significantly involved in energy-related business activities (each as defined in the Fund’s prospectus): renewable energy producers/distributors, energy technology providers, energy efficiency providers, energy use leaders, and energy innovators.
The Fund outperformed relative to the Index as all energy-related business categories outperformed the global equity market. Performance in the renewable energy producers/distributors category was especially strong during the period. The Fund’s larger-than-Index exposure to non-U.S. equities was the primary detractor from relative performance as U.S. equities significantly outperformed the global market for the period. In particular, the Fund’s overweight exposure to Europe detracted from returns versus the Index.
Tesla, Inc., whose growth was driven by both its electric car and energy storage systems, was a leading individual contributor.
Plug Power, Inc. (Plug Power) and Vivint Solar, Inc. (Vivint), both companies in the energy technology providers category, were also among top contributors. The revenue of Plug Power, which specializes in hydrogen fuel cells, rose significantly during the period as the company diversified its market from warehouses and distribution centers to delivery vehicles, scooters and other uses. Vivint, a designer and installer of residential solar energy, was purchased by Sunrun, Inc., which is also a residential solar provider and was another Fund holding during the period.
Advanced Emissions Solutions, Inc., a provider of emissions controls for energy companies, was among the largest detractors. Its revenues fell as coal generation continued to decline in the U.S. and energy demand shrank as a result of the COVID-19 pandemic. The stock was removed from the Calvert Energy Index in June 2020, and in turn the Fund, which seeks to track the Calvert Energy Index.
easyJet PLC, a low-cost U.K. airline and a leader in energy efficiency, also detracted from Fund performance versus the Index as the COVID-19 pandemic severely cut airline travel worldwide during the period. Other major detractors from returns relative to the Index included several high-profile companies like Apple, Inc. and Amazon.com, Inc., neither of which the Fund owned during the period.
See Endnotes and Additional Disclosures in this report.
Past performance is no guarantee of future results. Returns are historical and are calculated by determining the percentage change in net asset value (NAV) or offering price (as applicable) with all distributions reinvested. Investment return and principal value will fluctuate so that shares, when redeemed, may be worth more or less than their original cost. Performance for periods less than or equal to one year is cumulative. Performance is for the stated time period only; due to market volatility, current Fund performance may be lower or higher than the quoted return. For performance as of the most recent month-end, please refer to www.calvert.com.
Calvert
Global Energy Solutions Fund
Global Water Fund
September 30, 2020
Management's Discussion of Fund Performance† — continued
Fund Performance - Calvert Global Water Fund
For the 12-month period ended September 30, 2020, Calvert Global Water Fund (the Fund) returned 5.57% for Class A shares at NAV, underperforming its primary benchmark, the MSCI ACWI Index (the Index), which returned 10.44%. The Fund also underperformed its secondary benchmark, the Calvert Global Water Research Index (the Calvert Water Index), which returned 6.72% during the period.
The Fund’s underperformance relative to the Calvert Water Index was the result of Fund expenses and fees, which the Calvert Water Index does not incur.
The Fund invests in five categories of companies that are significantly involved in water-related business activities (each as defined in the Fund’s prospectus): water utilities, water infrastructure providers, water technology providers, water use leaders, and water innovators.
The Fund’s underperformance during the period relative to the Index was largely the result of an overweight exposure to companies in the water utilities category, particularly those located in Latin America and Asia. The Fund’s lack of exposure to large U.S. technology companies — like Apple, Inc., Amazon.com, Inc., and Microsoft Corp — that are in the Index and performed well during the period was also a major detractor of Fund performance versus the Index.
Companies in the water technology providers category, particularly those in the U.S., performed strongly during the period with AquaVenture Holdings Ltd. (AquaVenture) and Pentair PLC (Pentair) among the largest contributors to Fund returns during the period.
AquaVenture is a water-as-a-service company that provides water purification, disinfection, and desalination services. Its stock price rose steeply after the company announced it would be acquired by Culligan, a U.S. provider of water filtration and treatment systems.
After falling sharply at the outset of the COVID-19 pandemic, the stock price of Pentair, a water treatment company based in Ireland, has since risen in part by the large share of its business in residential swimming pools. Demand for swimming pools has grown since people have been largely confined to their homes due to the pandemic.
Companies in the water infrastructure providers category also performed well. Another of the Fund’s top contributors, China Lesso Group Holdings, Ltd., was in the category. The piping company benefited from strong demand in China and expansion into Southeast Asia during the period.
See Endnotes and Additional Disclosures in this report.
Past performance is no guarantee of future results. Returns are historical and are calculated by determining the percentage change in net asset value (NAV) or offering price (as applicable) with all distributions reinvested. Investment return and principal value will fluctuate so that shares, when redeemed, may be worth more or less than their original cost. Performance for periods less than or equal to one year is cumulative. Performance is for the stated time period only; due to market volatility, current Fund performance may be lower or higher than the quoted return. For performance as of the most recent month-end, please refer to www.calvert.com.
Calvert
Global Energy Solutions Fund
September 30, 2020
Performance
Portfolio Manager Thomas C. Seto of Calvert Research and Management
| % Average Annual Total Returns1,2 | Class
Inception Date | Performance
Inception Date | One Year | Five Years | Ten Years |
| Class A at NAV | 05/31/2007 | 05/31/2007 | 36.12% | 11.74% | 2.30% |
| Class A with 4.75% Maximum Sales Charge | — | — | 29.70 | 10.65 | 1.80 |
| Class C at NAV | 07/31/2007 | 05/31/2007 | 35.03 | 10.89 | 1.40 |
| Class C with 1% Maximum Sales Charge | — | — | 34.03 | 10.89 | 1.40 |
| Class I at NAV | 05/31/2007 | 05/31/2007 | 36.40 | 12.10 | 2.72 |
|
| MSCI ACWI Index | — | — | 10.44% | 10.29% | 8.54% |
| Calvert Global Energy Research Spliced Benchmark | — | — | 37.45 | 13.77 | 4.21 |
| Calvert Global Energy Research Index | — | — | 37.45 | — | — |
| Ardour Global Alternative Energy Index | — | — | 81.58 | 21.01 | 7.47 |
| % Total Annual Operating Expense Ratios3 | Class A | Class C | Class I |
| Gross | 1.72% | 2.48% | 1.47% |
| Net | 1.24 | 1.99 | 0.99 |
Growth of $10,000
This graph shows the change in value of a hypothetical investment of $10,000 in Class A of the Fund for the period indicated. For comparison, the same investment is shown in the indicated index.
| Growth of Investment | Amount Invested | Period Beginning | At NAV | With Maximum Sales Charge |
| Class C | $10,000 | 09/30/2010 | $11,494 | N.A. |
| Class I | $250,000 | 09/30/2010 | $326,890 | N.A. |
See Endnotes and Additional Disclosures in this report.
Past performance is no guarantee of future results. Returns are historical and are calculated by determining the percentage change in net asset value (NAV) or offering price (as applicable) with all distributions reinvested. Investment return and principal value will fluctuate so that shares, when redeemed, may be worth more or less than their original cost. Performance for periods less than or equal to one year is cumulative. Performance is for the stated time period only; due to market volatility, current Fund performance may be lower or higher than the quoted return. For performance as of the most recent month-end, please refer to www.calvert.com.
Calvert
Global Energy Solutions Fund
September 30, 2020
Sector Allocation (% of net assets)*
* Excludes cash and cash equivalents.
| Top 10 Holdings (% of net assets)* | |
| Xinyi Solar Holdings, Ltd. | 1.5% |
| Infineon Technologies AG | 1.4 |
| SolarEdge Technologies, Inc. | 1.4 |
| Delta Electronics, Inc. | 1.3 |
| Universal Display Corp. | 1.3 |
| Umicore S.A. | 1.1 |
| Power Integrations, Inc. | 1.1 |
| Sino-American Silicon Products, Inc. | 1.0 |
| First Solar, Inc. | 1.0 |
| Livent Corp. | 1.0 |
| Total | 12.1% |
| * | Excludes cash and cash equivalents. |
See Endnotes and Additional Disclosures in this report.
Calvert
Global Water Fund
September 30, 2020
Performance
Portfolio Manager Thomas C. Seto of Calvert Research and Management
| % Average Annual Total Returns1,2 | Class
Inception Date | Performance
Inception Date | One Year | Five Years | Ten Years |
| Class A at NAV | 09/30/2008 | 09/30/2008 | 5.57% | 8.48% | 7.32% |
| Class A with 4.75% Maximum Sales Charge | — | — | 0.56 | 7.44 | 6.79 |
| Class C at NAV | 09/30/2008 | 09/30/2008 | 4.75 | 7.69 | 6.46 |
| Class C with 1% Maximum Sales Charge | — | — | 3.75 | 7.69 | 6.46 |
| Class I at NAV | 01/31/2014 | 09/30/2008 | 5.83 | 8.85 | 7.60 |
|
| MSCI ACWI Index | — | — | 10.44% | 10.29% | 8.54% |
| Calvert Global Water Research Spliced Benchmark | — | — | 6.72 | 11.01 | 9.30 |
| Calvert Global Water Research Index | — | — | 6.72 | — | — |
| S-Network Global Water Index | — | — | 2.84 | 11.01 | 9.30 |
| % Total Annual Operating Expense Ratios3 | Class A | Class C | Class I |
| Gross | 1.38% | 2.13% | 1.13% |
| Net | 1.24 | 1.99 | 0.99 |
Growth of $10,000
This graph shows the change in value of a hypothetical investment of $10,000 in Class A of the Fund for the period indicated. For comparison, the same investment is shown in the indicated index.
| Growth of Investment2 | Amount Invested | Period Beginning | At NAV | With Maximum Sales Charge |
| Class C | $10,000 | 09/30/2010 | $18,706 | N.A. |
| Class I | $250,000 | 09/30/2010 | $520,454 | N.A. |
See Endnotes and Additional Disclosures in this report.
Past performance is no guarantee of future results. Returns are historical and are calculated by determining the percentage change in net asset value (NAV) or offering price (as applicable) with all distributions reinvested. Investment return and principal value will fluctuate so that shares, when redeemed, may be worth more or less than their original cost. Performance for periods less than or equal to one year is cumulative. Performance is for the stated time period only; due to market volatility, current Fund performance may be lower or higher than the quoted return. For performance as of the most recent month-end, please refer to www.calvert.com.
Calvert
Global Water Fund
September 30, 2020
Sector Allocation (% of net assets)*
* Excludes cash and cash equivalents.
| Top 10 Holdings (% of net assets)* | |
| Ecolab, Inc. | 2.2% |
| Xylem, Inc. | 2.0 |
| IDEX Corp. | 1.9 |
| LIXIL Group Corp. | 1.8 |
| Pentair PLC | 1.8 |
| Tetra Tech, Inc. | 1.7 |
| Kurita Water Industries, Ltd. | 1.7 |
| Rexnord Corp. | 1.7 |
| Watts Water Technologies, Inc., Class A | 1.6 |
| Badger Meter, Inc. | 1.6 |
| Total | 18.0% |
| * | Excludes cash and cash equivalents. |
See Endnotes and Additional Disclosures in this report.
Calvert
Global Energy Solutions Fund
Global Water Fund
September 30, 2020
Endnotes and Additional Disclosures
| † | The views expressed in this report are those of the portfolio manager(s) and are current only through the date stated at the top of this page. These views are subject to change at any time based upon market or other conditions, and Calvert and the Fund(s) disclaim any responsibility to update such views. These views may not be relied upon as investment advice and, because investment decisions are based on many factors, may not be relied upon as an indication of trading intent on behalf of any Calvert fund. This commentary may contain statements that are not historical facts, referred to as “forward-looking statements.” The Fund’s actual future results may differ significantly from those stated in any forward-looking statement, depending on factors such as changes in securities or financial markets or general economic conditions, the volume of sales and purchases of Fund shares, the continuation of investment advisory, administrative and service contracts, and other risks discussed from time to time in the Fund’s filings with the Securities and Exchange Commission. |
| | |
| 1 | MSCI ACWI Index is an unmanaged free-float-adjusted market-capitalization-weighted index designed to measure the equity market performance of developed and emerging markets. MSCI indexes are net of foreign withholding taxes. Source: MSCI. MSCI data may not be reproduced or used for any other purpose. MSCI provides no warranties, has not prepared or approved this report, and has no liability hereunder.The Calvert Global Energy Research Spliced Benchmark is comprised of the Ardour Global Alternative Energy Index prior to October 4, 2016 and the Calvert Global Energy Research Index thereafter. The Calvert Global Energy Research Index includes companies that manage energy use in a sustainable manner or that are actively engaged in facilitating the transition to a more sustainable economy through the reduction of greenhouse gas emissions and the expanded use of renewable energy sources. The Calvert Global Energy Research Index incepted on July 15, 2016; accordingly, the five and ten years returns are not available. The Ardour Global Alternative Energy Index measures the performance of stocks engaged in the field of alternative energy including solar, bioenergy, wind, hydro, and geothermal power sources. |
| | The Calvert Global Water Research Spliced Benchmark is comprised of the S-Network Global Water Index prior to May 31, 2016 and the Calvert Global Water Research Index thereafter. The Calvert Global Water Research Index includes stocks of companies that manage water use in a sustainable manner or that are actively engaged in expanding access to water, improving water quality, promoting the efficient use of water, or providing solutions that address other global water challenges. The Calvert Global Water Research Index incepted on February 5, 2016; accordingly, the five and ten years returns are not available. The S-Network Global Water Index measures the performance of stocks involved in water infrastructure, including utilities, and water technology development.Unless otherwise stated, index returns do not reflect the effect of any applicable sales charges, commissions, expenses, taxes or leverage, as applicable. It is not possible to invest directly in an index. |
| 2 | Total Returns at NAV do not include applicable sales charges. If sales charges were deducted, the returns would be lower. Total Returns shown with maximum sales charge reflect the stated maximum sales charge. Unless otherwise stated, performance does not reflect the deduction of taxes on Fund distributions or redemptions of Fund shares.For Calvert Global Water Fund, performance prior to the inception date of a class may be linked to the performance of an older class of the Fund. This linked performance is adjusted for any applicable sales charge, but is not adjusted for class expense differences. If adjusted for such differences, the performance would be different. The performance of Class I for the Calvert Global Water Fund is linked to Class A. Performance presented in the Financial Highlights included in the financial statements is not linked.Effective October 4, 2016, the Calvert Global Energy Solutions Fund changed its investment objective and principal investment strategies to track the Calvert Global Energy Research Index and implement the Calvert Principles for Responsible Investment. Prior to October 4, 2016, the Fund employed an active management strategy. Performance prior to October 4, 2016 reflects the Fund’s performance under its former investment objective and policies. In connection with such changes, the Fund changed its secondary benchmark from Ardour Global Alternative Energy Index to Calvert Global Energy Research Index. |
Calvert
Global Energy Solutions Fund
Global Water Fund
September 30, 2020
Endnotes and Additional Disclosures — continued
| | Effective April 11, 2016, the Calvert Global Water Fund changed its investment objective and principal investment strategies to track the Calvert Global Water Research Index and implement the Calvert Principles for Responsible Investment. Prior to April 11, 2016, the Fund employed an active management strategy. Performance prior to April 11, 2016 reflects the Fund’s performance under its former investment objective and policies. In connection with such changes, the Fund changed its secondary benchmark from S-Network Global Water Index to Calvert Global Water Research Index.Effective December 31, 2016, Calvert Research and Management became the investment adviser to each Fund and performance reflected prior to such date is that of each Fund’s former investment adviser, Calvert Investment Management, Inc. |
| 3 | Source: Fund prospectus. Net expense ratios reflect a contractual expense reimbursement that continues through 1/31/21. Without the reimbursement, performance would have been lower. The expense ratios for the current reporting period can be found in the Financial Highlights section of this report. |
| Additional Information |
| | MSCI World Index is an unmanaged index of equity securities in the developed markets. MSCI EAFE Index is an unmanaged index of equities in the developed markets, excluding the U.S. and Canada. MSCI Emerging Markets Index is an unmanaged index of emerging markets common stocks. MSCI indexes are net of foreign withholding taxes. Source: MSCI. MSCI data may not be reproduced or used for any other purpose. MSCI provides no warranties, has not prepared or approved this report, and has no liability hereunder. S&P 500® Index is an unmanaged index of large-cap stocks commonly used as a measure of U.S. stock market performance. S&P Dow Jones Indices are a product of S&P Dow Jones Indices LLC (“S&P DJI”) and have been licensed for use. S&P® and S&P 500® are registered trademarks of S&P DJI; Dow Jones® is a registered trademark of Dow Jones Trademark Holdings LLC (“Dow Jones”); S&P DJI, Dow Jones and their respective affiliates do not sponsor, endorse, sell or promote the Fund, will not have any liability with respect thereto and do not have any liability for any errors, omissions, or interruptions of the S&P Dow Jones Indices. Nasdaq Composite Index is a market capitalization-weighted index of all domestic and international securities listed on Nasdaq. Source: Nasdaq, Inc. The information is provided by Nasdaq (with its affiliates, are referred to as the “Corporations”) and Nasdaq's third party licensors on an “as is” basis and the Corporations make no guarantees and bear no liability of any kind with respect to the information or the Fund. |
Calvert
Global Energy Solutions Fund
Global Water Fund
September 30, 2020
Example
As a Fund shareholder, you incur two types of costs: (1) transaction costs, including sales charges (loads) on purchases and redemption fees (if applicable); and (2) ongoing costs, including management fees; distribution and/or service fees; and other Fund expenses. This Example is intended to help you understand your ongoing costs (in dollars) of Fund investing and to compare these costs with the ongoing costs of investing in other mutual funds. The Example is based on an investment of $1,000 invested at the beginning of the period and held for the entire period (April 1, 2020 to September 30, 2020).
Actual Expenses
The first section of the tables below provides information about actual account values and actual expenses. You may use the information in this section, together with the amount you invested, to estimate the expenses that you paid over the period. Simply divide your account value by $1,000 (for example, an $8,600 account value divided by $1,000 = 8.6), then multiply the result by the number in the first section under the heading entitled “Expenses Paid During Period” to estimate the expenses you paid on your account during this period.
Hypothetical Example for Comparison Purposes
The second section of the tables below provides information about hypothetical account values and hypothetical expenses based on the actual Fund expense ratio and an assumed rate of return of 5% per year (before expenses), which is not the actual Fund return. The hypothetical account values and expenses may not be used to estimate the actual ending account balance or expenses you paid for the period. You may use this information to compare the ongoing costs of investing in the Fund and other funds. To do so, compare this 5% hypothetical example with the 5% hypothetical examples that appear in the shareholder reports of the other funds.
Please note that the expenses shown in the tables are meant to highlight your ongoing costs only and do not reflect any transactional costs, such as sales charges (loads) or redemption fees (if applicable). Therefore, the second section of the tables is useful in comparing ongoing costs only, and will not help you determine the relative total costs of owning different funds. In addition, if these transactional costs were included, your costs would be higher.
Calvert Global Energy Solutions Fund
| | Beginning
Account Value
(4/1/20) | Ending
Account Value
(9/30/20) | Expenses Paid
During Period*
(4/1/20 – 9/30/20) | Annualized
Expense
Ratio |
| Actual | | | | |
| Class A | $1,000.00 | $1,592.70 | $ 8.04** | 1.24% |
| Class C | $1,000.00 | $1,587.20 | $12.87 ** | 1.99% |
| Class I | $1,000.00 | $1,595.40 | $ 6.42** | 0.99% |
| Hypothetical | | | | |
| (5% return per year before expenses) | | | | |
| Class A | $1,000.00 | $1,018.80 | $ 6.26** | 1.24% |
| Class C | $1,000.00 | $1,015.05 | $10.02 ** | 1.99% |
| Class I | $1,000.00 | $1,020.05 | $ 5.00** | 0.99% |
| * | Expenses are equal to the Fund's annualized expense ratio for the indicated Class, multiplied by the average account value over the period, multiplied by 183/366 (to reflect the one-half year period). The Example assumes that the $1,000 was invested at the net asset value per share determined at the close of business on March 31, 2020. |
| ** | Absent a waiver and/or reimbursement of expenses by an affiliate, expenses would be higher. |
Calvert
Global Energy Solutions Fund
Global Water Fund
September 30, 2020
Fund Expenses — continued
Calvert Global Water Fund
| | Beginning
Account Value
(4/1/20) | Ending
Account Value
(9/30/20) | Expenses Paid
During Period*
(4/1/20 – 9/30/20) | Annualized
Expense
Ratio |
| Actual | | | | |
| Class A | $1,000.00 | $1,264.30 | $ 7.02** | 1.24% |
| Class C | $1,000.00 | $1,259.70 | $11.24 ** | 1.99% |
| Class I | $1,000.00 | $1,266.20 | $ 5.61** | 0.99% |
| Hypothetical | | | | |
| (5% return per year before expenses) | | | | |
| Class A | $1,000.00 | $1,018.80 | $ 6.26** | 1.24% |
| Class C | $1,000.00 | $1,015.05 | $10.02 ** | 1.99% |
| Class I | $1,000.00 | $1,020.05 | $ 5.00** | 0.99% |
| * | Expenses are equal to the Fund's annualized expense ratio for the indicated Class, multiplied by the average account value over the period, multiplied by 183/366 (to reflect the one-half year period). The Example assumes that the $1,000 was invested at the net asset value per share determined at the close of business on March 31, 2020. |
| ** | Absent a waiver and/or reimbursement of expenses by an affiliate, expenses would be higher. |
Calvert
Global Energy Solutions Fund
September 30, 2020
| Security | Shares | Value |
| Australia — 0.5% | |
| AusNet Services(1) | | 456,334 | $ 616,020 |
| | | | $ 616,020 |
| Austria — 0.6% | |
| Verbund AG | | 13,483 | $ 736,337 |
| | | | $ 736,337 |
| Belgium — 1.1% | |
| Umicore S.A. | | 30,869 | $ 1,283,981 |
| | | | $ 1,283,981 |
| Brazil — 0.9% | |
| Omega Geracao S.A.(2) | | 85,900 | $ 559,981 |
| Sao Martinho S.A. | | 134,352 | 521,054 |
| | | | $ 1,081,035 |
| Canada — 4.0% | |
| Boralex, Inc., Class A | | 27,371 | $ 791,191 |
| Brookfield Renewable Partners L.P. | | 17,541 | 921,780 |
| Canadian Solar, Inc.(1)(2) | | 20,154 | 707,405 |
| Innergex Renewable Energy, Inc. | | 40,009 | 722,929 |
| Northland Power, Inc.(1) | | 27,244 | 824,143 |
| TransAlta Renewables, Inc.(1) | | 52,206 | 655,932 |
| | | | $ 4,623,380 |
| China — 5.6% | |
| BYD Co., Ltd., Class H(1) | | 68,500 | $ 1,104,646 |
| China Everbright Environment Group, Ltd. | | 1,130,037 | 646,083 |
| China Longyuan Power Group Corp., Ltd., Class H | | 1,080,000 | 678,563 |
| Xinjiang Goldwind Science & Technology Co., Ltd., Class H | | 1,190,500 | 1,047,452 |
| Xinyi Solar Holdings, Ltd. | | 1,070,000 | 1,705,846 |
| Yadea Group Holdings, Ltd.(2)(3) | | 524,000 | 773,874 |
| Zhuzhou CRRC Times Electric Co., Ltd., Class H | | 176,800 | 594,053 |
| | | | $ 6,550,517 |
| Denmark — 2.6% | |
| Novozymes A/S, Class B | | 12,106 | $ 760,891 |
| Orsted A/S(3) | | 4,410 | 607,609 |
| Rockwool International A/S, Class B | | 1,745 | 669,548 |
| Vestas Wind Systems A/S | | 6,028 | 974,164 |
| | | | $ 3,012,212 |
| Finland — 1.1% | |
| Metsa Board Oyj | | 75,569 | $ 623,160 |
| Neste Oyj | | 11,654 | 613,696 |
| | | | $ 1,236,856 |
| Security | Shares | Value |
| France — 4.7% | |
| Albioma S.A. | | 11,761 | $ 611,560 |
| Cie de Saint-Gobain(2) | | 18,765 | 786,012 |
| Danone S.A. | | 9,347 | 605,452 |
| Engie S.A.(2) | | 44,188 | 590,506 |
| Legrand S.A. | | 9,125 | 726,800 |
| Neoen S.A.(2)(3) | | 12,365 | 665,391 |
| Nexans S.A.(2) | | 11,097 | 641,104 |
| Schneider Electric SE | | 6,825 | 848,340 |
| | | | $ 5,475,165 |
| Germany — 8.2% | |
| Bayerische Motoren Werke AG | | 8,636 | $ 626,776 |
| Daimler AG | | 12,241 | 660,341 |
| Deutsche Post AG | | 13,704 | 621,827 |
| Encavis AG | | 34,193 | 669,523 |
| Evonik Industries AG | | 22,651 | 585,957 |
| Infineon Technologies AG | | 59,337 | 1,672,460 |
| Nordex SE(2) | | 80,290 | 1,037,038 |
| OSRAM Licht AG(2) | | 10,824 | 645,292 |
| Siemens AG | | 6,376 | 805,218 |
| Siemens Energy AG(2) | | 3,188 | 85,969 |
| SMA Solar Technology AG(2) | | 22,106 | 988,610 |
| Varta AG(1)(2) | | 7,891 | 1,101,145 |
| | | | $ 9,500,156 |
| Greece — 0.5% | |
| Terna Energy S.A. | | 40,721 | $ 545,199 |
| | | | $ 545,199 |
| Ireland — 1.2% | |
| CRH PLC | | 16,613 | $ 602,409 |
| Kingspan Group PLC(2) | | 8,513 | 774,736 |
| | | | $ 1,377,145 |
| Italy — 2.9% | |
| Enel SpA | | 108,635 | $ 942,507 |
| ERG SpA | | 24,109 | 606,336 |
| Falck Renewables SpA | | 87,402 | 551,509 |
| Snam SpA | | 120,049 | 617,384 |
| Terna Rete Elettrica Nazionale SpA | | 85,012 | 594,812 |
| | | | $ 3,312,548 |
| Japan — 7.2% | |
| Daikin Industries, Ltd. | | 4,300 | $ 794,529 |
| Ferrotec Holdings Corp.(1) | | 119,000 | 1,025,499 |
| GS Yuasa Corp. | | 65,400 | 1,130,150 |
| Hitachi Metals, Ltd.(1) | | 41,900 | 646,102 |
| Meidensha Corp. | | 62,900 | 968,982 |
12
See Notes to Financial Statements.
Calvert
Global Energy Solutions Fund
September 30, 2020
Schedule of Investments — continued
| Security | Shares | Value |
| Japan (continued) | |
| Mitsubishi Electric Corp. | | 55,800 | $ 757,161 |
| Nidec Corp.(1) | | 7,400 | 693,956 |
| Nippon Express Co., Ltd.(1) | | 10,400 | 606,872 |
| Nissan Motor Co., Ltd.(2) | | 151,400 | 535,441 |
| Sumitomo Chemical Co., Ltd. | | 189,300 | 626,579 |
| Yokogawa Electric Corp. | | 38,200 | 606,675 |
| | | | $ 8,391,946 |
| Netherlands — 0.6% | |
| Signify NV(2)(3) | | 19,264 | $ 712,519 |
| | | | $ 712,519 |
| New Zealand — 1.8% | |
| Infratil, Ltd. | | 204,774 | $ 678,569 |
| Mercury NZ, Ltd. | | 195,242 | 660,655 |
| Meridian Energy, Ltd. | | 217,207 | 714,366 |
| | | | $ 2,053,590 |
| Norway — 1.1% | |
| Norsk Hydro ASA(2) | | 193,388 | $ 533,795 |
| Scatec Solar ASA(3) | | 31,254 | 721,804 |
| | | | $ 1,255,599 |
| Portugal — 0.6% | |
| EDP Renovaveis S.A. | | 41,146 | $ 683,053 |
| | | | $ 683,053 |
| Singapore — 0.9% | |
| City Developments, Ltd. | | 104,300 | $ 587,154 |
| Maxeon Solar Technologies, Ltd.(2) | | 23,987 | 406,819 |
| | | | $ 993,973 |
| South Korea — 1.9% | |
| Ecopro BM Co., Ltd. | | 8,407 | $ 978,529 |
| LG Chem, Ltd. | | 1,004 | 560,403 |
| LG Display Co., Ltd.(2) | | 49,813 | 652,554 |
| | | | $ 2,191,486 |
| Spain — 3.7% | |
| Acciona S.A.(1) | | 5,786 | $ 627,928 |
| Atlantica Sustainable Infrastructure PLC | | 22,091 | 632,024 |
| Ence Energia y Celulosa S.A.(1)(2) | | 167,396 | 428,852 |
| Iberdrola S.A. | | 48,816 | 600,856 |
| Red Electrica Corp. S.A. | | 32,138 | 602,759 |
| Siemens Gamesa Renewable Energy S.A. | | 28,978 | 784,205 |
| Solaria Energia y Medio Ambiente S.A.(2) | | 31,345 | 593,227 |
| | | | $ 4,269,851 |
| Security | Shares | Value |
| Sweden — 1.2% | |
| Fabege AB | | 50,425 | $ 697,364 |
| Nibe Industrier AB, Class B(2) | | 25,199 | 647,641 |
| | | | $ 1,345,005 |
| Switzerland — 2.1% | |
| ABB, Ltd. | | 32,492 | $ 826,071 |
| Gurit Holding AG | | 527 | 1,122,157 |
| Landis+Gyr Group AG(2) | | 9,244 | 503,342 |
| | | | $ 2,451,570 |
| Taiwan — 6.4% | |
| Chroma ATE, Inc. | | 113,000 | $ 602,335 |
| Delta Electronics, Inc. | | 228,000 | 1,497,149 |
| Epistar Corp.(2) | | 837,000 | 1,031,184 |
| Everlight Electronics Co., Ltd. | | 822,000 | 1,059,168 |
| OptoTech Corp.(2) | | 1,209,200 | 975,293 |
| Simplo Technology Co., Ltd. | | 102,000 | 1,059,126 |
| Sino-American Silicon Products, Inc. | | 352,000 | 1,185,811 |
| | | | $ 7,410,066 |
| Thailand — 1.4% | |
| BCPG PCL | | 1,179,500 | $ 445,592 |
| CK Power PCL(2) | | 2,852,500 | 524,390 |
| Energy Absolute PCL NVDR | | 507,600 | 632,222 |
| | | | $ 1,602,204 |
| United Kingdom — 3.6% | |
| Croda International PLC | | 7,864 | $ 634,355 |
| easyJet PLC(1) | | 72,647 | 468,066 |
| John Laing Group PLC(3) | | 161,177 | 650,482 |
| Johnson Matthey PLC | | 20,923 | 635,807 |
| Linde PLC | | 2,488 | 592,467 |
| Smart Metering Systems PLC | | 71,875 | 603,663 |
| United Utilities Group PLC | | 55,342 | 611,328 |
| | | | $ 4,196,168 |
| United States — 32.8% | |
| 3M Co. | | 3,778 | $ 605,160 |
| AAON, Inc. | | 10,393 | 626,178 |
| Acuity Brands, Inc. | | 5,891 | 602,944 |
| AES Corp. (The) | | 35,202 | 637,508 |
| Alaska Air Group, Inc. | | 15,813 | 579,230 |
| Alphabet, Inc., Class A(2) | | 378 | 553,997 |
| Ameresco, Inc., Class A(2) | | 15,180 | 507,012 |
| American Superconductor Corp.(2) | | 49,769 | 720,655 |
| Aptiv PLC | | 8,907 | 816,594 |
| BorgWarner, Inc. | | 16,986 | 658,038 |
| Brookfield Renewable Corp., Class A | | 14,208 | 832,589 |
13
See Notes to Financial Statements.
Calvert
Global Energy Solutions Fund
September 30, 2020
Schedule of Investments — continued
| Security | Shares | Value |
| United States (continued) | |
| Clearway Energy, Inc., Class C | | 27,587 | $ 743,746 |
| Covanta Holding Corp. | | 65,660 | 508,865 |
| Cree, Inc.(2) | | 10,687 | 681,189 |
| Cummins, Inc. | | 2,997 | 632,847 |
| Delphi Technologies PLC(2) | | 31,917 | 533,333 |
| Eaton Corp. PLC | | 7,937 | 809,812 |
| Emerson Electric Co. | | 11,678 | 765,726 |
| EnerSys | | 17,427 | 1,169,700 |
| Enphase Energy, Inc.(2) | | 8,976 | 741,328 |
| Enviva Partners L.P. | | 14,874 | 598,827 |
| First Solar, Inc.(2) | | 17,853 | 1,181,869 |
| General Mills, Inc. | | 9,631 | 594,040 |
| Gibraltar Industries, Inc.(2) | | 9,440 | 614,922 |
| Hannon Armstrong Sustainable Infrastructure Capital, Inc. | | 14,728 | 622,553 |
| Ingersoll Rand, Inc.(2) | | 20,628 | 734,357 |
| International Business Machines Corp. | | 4,995 | 607,742 |
| Itron, Inc.(2) | | 9,961 | 605,031 |
| Johnson Controls International PLC | | 19,485 | 795,962 |
| Livent Corp.(1)(2) | | 131,431 | 1,178,936 |
| Microsoft Corp. | | 2,755 | 579,459 |
| NextEra Energy Partners, L.P. | | 12,181 | 730,373 |
| NextEra Energy, Inc. | | 2,206 | 612,297 |
| ON Semiconductor Corp.(2) | | 32,789 | 711,193 |
| Ormat Technologies, Inc.(1) | | 11,532 | 681,657 |
| Owens Corning | | 10,105 | 695,325 |
| Plug Power, Inc.(1)(2) | | 58,088 | 778,960 |
| Power Integrations, Inc. | | 22,614 | 1,252,816 |
| Renewable Energy Group, Inc.(2) | | 19,051 | 1,017,704 |
| Rockwell Automation, Inc. | | 3,375 | 744,795 |
| SolarEdge Technologies, Inc.(2) | | 6,612 | 1,575,970 |
| SunPower Corp.(1)(2) | | 55,338 | 692,278 |
| Sunrun, Inc.(2) | | 13,911 | 1,072,121 |
| Tenneco, Inc., Class A(1)(2) | | 58,008 | 402,576 |
| Tesla, Inc.(2) | | 1,985 | 851,585 |
| Trane Technologies PLC | | 6,660 | 807,525 |
| Universal Display Corp. | | 7,967 | 1,439,956 |
| Vivint Solar, Inc.(1)(2) | | 21,210 | 898,243 |
| Waste Management, Inc. | | 5,403 | 611,457 |
| Whirlpool Corp. | | 3,515 | 646,373 |
| | | | $ 38,063,353 |
Total Common Stocks
(identified cost $90,315,072) | | | $ 114,970,934 |
| High Social Impact Investments — 0.3% |
| Security | Principal
Amount
(000's omitted) | Value |
| Calvert Impact Capital, Inc., Community Investment Notes, 1.50%, 12/15/20(4)(5) | $ | 264 | $ 262,231 |
| ImpactAssets, Inc., Global Sustainable Agriculture Notes, 2.07%, 11/3/20(5)(6) | | 53 | 51,306 |
| ImpactAssets, Inc., Microfinance Plus Notes, 0.46%, 11/3/20(5)(6) | | 68 | 58,653 |
Total High Social Impact Investments
(identified cost $384,568) | | | $ 372,190 |
| Short-Term Investments — 4.8% |
| Other — 0.2% |
| Description | Units | Value |
| Calvert Cash Reserves Fund, LLC, 0.13%(7) | | 258,604 | $ 258,630 |
Total Other
(identified cost $258,642) | | | $ 258,630 |
| Securities Lending Collateral — 4.6% |
| Security | Shares | Value |
| State Street Navigator Securities Lending Government Money Market Portfolio, 0.09%(8) | | 5,381,289 | $ 5,381,289 |
Total Securities Lending Collateral
(identified cost $5,381,289) | | | $ 5,381,289 |
Total Short-Term Investments
(identified cost $5,639,931) | | | $ 5,639,919 |
Total Investments — 104.3%
(identified cost $96,339,571) | | $ 120,983,043 |
| Other Assets, Less Liabilities — (4.3)% | | $ (5,038,687) |
| Net Assets — 100.0% | | $ 115,944,356 |
The percentage shown for each investment category in the Schedule of Investments is based on net assets.
| |
| (1) | All or a portion of this security was on loan at September 30, 2020. The aggregate market value of securities on loan at September 30, 2020 was $11,192,401. |
| (2) | Non-income producing security. |
| (3) | Security exempt from registration under Rule 144A of the Securities Act of 1933, as amended. These securities may be sold in certain transactions in reliance on an exemption from registration (normally to qualified institutional buyers). At September 30, 2020, the aggregate value of these securities is $4,131,679 or 3.6% of the Fund's net assets. |
14
See Notes to Financial Statements.
Calvert
Global Energy Solutions Fund
September 30, 2020
Schedule of Investments — continued
| (4) | Affiliated company (see Note 7). |
| (5) | Restricted security. Total market value of restricted securities amounts to $372,190, which represents 0.3% of the net assets of the Fund as of September 30, 2020. |
| (6) | Notes carry an interest rate that varies by period and is contingent on the performance of the underlying portfolio of loans to borrowers. The coupon rate shown represents the rate in effect at September 30, 2020. |
| (7) | Affiliated investment company, available to Calvert portfolios and funds, which invests in high quality, U.S. dollar denominated money market instruments. The rate shown is the annualized seven-day yield as of September 30, 2020. |
| (8) | Represents investment of cash collateral received in connection with securities lending. |
At September 30, 2020, the concentration of the Fund’s investments in the various sectors, determined as a percentage of net assets, was as follows:
| Economic Sectors | % of Net Assets |
| Industrials | 32.6% |
| Utilities | 22.9 |
| Information Technology | 22.2 |
| Materials | 9.3 |
| Consumer Discretionary | 6.6 |
| Energy | 1.9 |
| Consumer Staples | 1.5 |
| Real Estate | 1.1 |
| Financials | 0.6 |
| Communication Services | 0.5 |
| High Social Impact Investments | 0.3 |
| Total | 99.5% |
Restricted Securities
| Description | Acquisition Dates | Cost |
| Calvert Impact Capital, Inc., Community Investment Notes, 1.50%, 12/15/20 | 12/13/19 | $263,568 |
| ImpactAssets, Inc., Global Sustainable Agriculture Notes, 2.07%, 11/3/20 | 11/13/15 | 53,000 |
| ImpactAssets, Inc., Microfinance Plus Notes, 0.46%, 11/3/20 | 11/13/15 | 68,000 |
| Abbreviations: |
| NVDR | – Non-Voting Depository Receipt |
| PCL | – Public Company Limited |
15
See Notes to Financial Statements.
Calvert
Global Water Fund
September 30, 2020
| Security | Shares | Value |
| Australia — 1.5% | |
| Reliance Worldwide Corp., Ltd. | | 2,179,854 | $ 6,026,353 |
| | | | $ 6,026,353 |
| Brazil — 3.0% | |
| Cia de Saneamento Basico do Estado de Sao Paulo ADR | | 560,164 | $ 4,649,361 |
| Cia de Saneamento de Minas Gerais | | 442,964 | 3,685,911 |
| Cia de Saneamento do Parana, PFC Shares | | 4,543,682 | 4,118,190 |
| | | | $ 12,453,462 |
| Canada — 2.1% | |
| Brookfield Renewable Partners, L.P. | | 47,102 | $ 2,476,167 |
| Gildan Activewear, Inc. | | 105,849 | 2,085,898 |
| Nutrien, Ltd.(1) | | 56,118 | 2,200,384 |
| Stantec, Inc. | | 65,145 | 1,978,005 |
| | | | $ 8,740,454 |
| Chile — 1.7% | |
| Aguas Andinas S.A., Class A | | 13,531,422 | $ 3,790,373 |
| Inversiones Aguas Metropolitanas S.A. | | 4,374,911 | 3,169,152 |
| | | | $ 6,959,525 |
| China — 4.7% | |
| Beijing Enterprises Water Group, Ltd. | | 12,037,452 | $ 4,691,039 |
| China Everbright Environment Group, Ltd. | | 3,553,666 | 2,031,758 |
| China Lesso Group Holdings, Ltd. | | 1,976,578 | 3,589,729 |
| China Water Affairs Group, Ltd.(1) | | 4,752,421 | 3,743,601 |
| Guangdong Investment, Ltd. | | 3,275,427 | 5,207,870 |
| | | | $ 19,263,997 |
| Denmark — 0.5% | |
| Novozymes A/S, Class B | | 35,704 | $ 2,244,081 |
| | | | $ 2,244,081 |
| Finland — 1.7% | |
| Kemira Oyj | | 412,008 | $ 5,248,721 |
| Valmet Oyj | | 73,232 | 1,806,424 |
| | | | $ 7,055,145 |
| France — 4.1% | |
| Accor S.A.(2) | | 71,267 | $ 1,994,765 |
| Eurofins Scientific SE(2) | | 2,629 | 2,082,606 |
| L'Oreal S.A. | | 6,738 | 2,192,739 |
| Suez S.A. | | 299,614 | 5,535,978 |
| Veolia Environnement S.A. | | 232,629 | 5,019,220 |
| | | | $ 16,825,308 |
| Security | Shares | Value |
| Germany — 1.1% | |
| GEA Group AG | | 60,177 | $ 2,108,493 |
| Henkel AG & Co. KGaA, PFC Shares | | 21,145 | 2,211,480 |
| | | | $ 4,319,973 |
| Italy — 0.8% | |
| ACEA SpA | | 157,755 | $ 3,317,862 |
| | | | $ 3,317,862 |
| Japan — 10.7% | |
| Ebara Corp. | | 152,356 | $ 4,131,292 |
| Hitachi Zosen Corp. | | 816,927 | 3,463,116 |
| Hulic Reit, Inc. | | 1,562 | 2,070,158 |
| Kitz Corp.(1) | | 502,300 | 2,863,103 |
| Kurita Water Industries, Ltd. | | 206,742 | 6,836,688 |
| LIXIL Group Corp.(1) | | 369,500 | 7,468,440 |
| METAWATER Co., Ltd. | | 146,634 | 3,207,740 |
| Nihon Trim Co., Ltd. | | 112,200 | 4,060,362 |
| Sekisui Chemical Co., Ltd. | | 139,600 | 2,232,940 |
| TOTO, Ltd.(1) | | 98,700 | 4,548,023 |
| Tsukishima Kikai Co., Ltd.(1) | | 242,400 | 2,950,356 |
| | | | $ 43,832,218 |
| Netherlands — 1.5% | |
| Aalberts NV | | 112,091 | $ 4,030,745 |
| Arcadis NV(2) | | 89,072 | 1,933,265 |
| | | | $ 5,964,010 |
| Singapore — 0.5% | |
| City Developments, Ltd. | | 369,400 | $ 2,079,526 |
| Hyflux, Ltd.(1)(2)(3) | | 17,622,294 | 0 |
| | | | $ 2,079,526 |
| South Korea — 1.1% | |
| Coway Co., Ltd. | | 33,262 | $ 2,262,198 |
| LG Chem, Ltd. | | 3,646 | 2,035,087 |
| | | | $ 4,297,285 |
| Spain — 1.0% | |
| Acciona S.A.(1) | | 18,352 | $ 1,991,659 |
| Iberdrola S.A. | | 167,488 | 2,061,540 |
| | | | $ 4,053,199 |
| Switzerland — 4.6% | |
| Geberit AG | | 8,478 | $ 5,015,788 |
| Georg Fischer AG | | 4,106 | 4,263,637 |
| Roche Holding AG | | 5,663 | 1,939,807 |
| SGS S.A. | | 825 | 2,210,866 |
| Sika AG | | 8,543 | 2,097,748 |
16
See Notes to Financial Statements.
Calvert
Global Water Fund
September 30, 2020
Schedule of Investments — continued
| Security | Shares | Value |
| Switzerland (continued) | |
| Sulzer AG | | 40,289 | $ 3,238,407 |
| | | | $ 18,766,253 |
| Taiwan — 0.6% | |
| Taiwan Semiconductor Manufacturing Co., Ltd. | | 154,294 | $ 2,321,209 |
| | | | $ 2,321,209 |
| Thailand — 1.5% | |
| TTW PCL, Foregin Shares | | 8,998,300 | $ 3,587,128 |
| WHA Utilities and Power PCL, Foreign Shares | | 23,562,400 | 2,657,966 |
| | | | $ 6,245,094 |
| United Kingdom — 9.0% | |
| CNH Industrial NV(1)(2) | | 260,427 | $ 2,036,539 |
| Croda International PLC | | 27,989 | 2,257,752 |
| Ferguson PLC | | 50,059 | 5,037,458 |
| Halma PLC | | 68,021 | 2,055,040 |
| Mondi PLC | | 101,781 | 2,152,118 |
| Pennon Group PLC | | 391,117 | 5,203,589 |
| Polypipe Group PLC(2) | | 621,738 | 3,468,675 |
| Rotork PLC | | 1,052,869 | 3,817,307 |
| Severn Trent PLC | | 172,873 | 5,442,856 |
| United Utilities Group PLC | | 488,714 | 5,398,518 |
| | | | $ 36,869,852 |
| United States — 47.4% | |
| Advanced Drainage Systems, Inc. | | 70,314 | $ 4,390,406 |
| Aegion Corp.(2) | | 190,163 | 2,687,003 |
| American States Water Co. | | 63,526 | 4,761,274 |
| American Water Works Co., Inc. | | 42,614 | 6,173,916 |
| Badger Meter, Inc. | | 98,258 | 6,423,125 |
| Ball Corp. | | 27,491 | 2,285,052 |
| Brookfield Renewable Corp., Class A | | 41,986 | 2,460,380 |
| California Water Service Group | | 103,618 | 4,502,202 |
| Cantel Medical Corp. | | 43,285 | 1,901,943 |
| Cousins Properties, Inc. | | 71,622 | 2,047,673 |
| Danaher Corp. | | 10,774 | 2,319,965 |
| Ecolab, Inc. | | 44,423 | 8,877,492 |
| Energy Recovery, Inc.(1)(2) | | 528,743 | 4,335,693 |
| Entegris, Inc. | | 32,772 | 2,436,270 |
| Essential Utilities, Inc. | | 132,697 | 5,341,054 |
| Evoqua Water Technologies Corp.(2) | | 295,593 | 6,272,483 |
| Flowserve Corp. | | 138,631 | 3,783,240 |
| Forterra, Inc.(2) | | 217,934 | 2,575,980 |
| Fortune Brands Home & Security, Inc. | | 54,856 | 4,746,141 |
| Franklin Electric Co., Inc. | | 66,798 | 3,929,726 |
| Gorman-Rupp Co. (The) | | 95,116 | 2,802,117 |
| Security | Shares | Value |
| United States (continued) | |
| Hawkins, Inc. | | 100,868 | $ 4,650,015 |
| Hyatt Hotels Corp., Class A(1) | | 36,478 | 1,946,831 |
| IDEX Corp. | | 43,098 | 7,861,506 |
| IDEXX Laboratories, Inc.(2) | | 5,774 | 2,269,817 |
| Intel Corp. | | 41,961 | 2,172,741 |
| Itron, Inc.(2) | | 35,889 | 2,179,898 |
| Levi Strauss & Co., Class A(1) | | 173,532 | 2,325,329 |
| Lindsay Corp. | | 33,551 | 3,243,711 |
| Masco Corp. | | 81,509 | 4,493,591 |
| Middlesex Water Co. | | 66,427 | 4,128,438 |
| Mondelez International, Inc., Class A | | 35,157 | 2,019,770 |
| Mueller Industries, Inc. | | 121,008 | 3,274,476 |
| Mueller Water Products, Inc., Class A | | 344,240 | 3,576,654 |
| NIKE, Inc., Class B | | 19,888 | 2,496,740 |
| Nucor Corp. | | 48,287 | 2,166,155 |
| nVent Electric PLC | | 109,634 | 1,939,425 |
| Parker-Hannifin Corp. | | 10,354 | 2,095,028 |
| Pentair PLC | | 160,593 | 7,350,342 |
| Procter & Gamble Co. (The) | | 14,850 | 2,064,002 |
| Rexnord Corp. | | 228,071 | 6,805,639 |
| Roper Technologies, Inc. | | 4,980 | 1,967,648 |
| Sherwin-Williams Co. (The) | | 3,277 | 2,283,217 |
| SJW Group | | 72,107 | 4,388,432 |
| Tetra Tech, Inc. | | 74,445 | 7,109,497 |
| Trimble, Inc.(2) | | 43,230 | 2,105,301 |
| Valmont Industries, Inc. | | 31,172 | 3,870,939 |
| Watts Water Technologies, Inc., Class A | | 65,724 | 6,582,259 |
| Xylem, Inc. | | 95,783 | 8,057,266 |
| York Water Co. (The) | | 85,227 | 3,602,545 |
| | | | $ 194,080,347 |
Total Common Stocks
(identified cost $337,209,871) | | | $ 405,715,153 |
| High Social Impact Investments — 0.4% |
| Security | Principal
Amount
(000's omitted) | Value |
| Calvert Impact Capital, Inc., Community Investment Notes, 1.50%, 12/15/20(4)(5) | $ | 1,324 | $ 1,317,403 |
| ImpactAssets, Inc., Global Sustainable Agriculture Notes, 2.07%, 11/3/20(5)(6) | | 284 | 274,923 |
| ImpactAssets, Inc., Microfinance Plus Notes, 0.46%, 11/3/20(5)(6) | | 366 | 315,690 |
Total High Social Impact Investments
(identified cost $1,974,116) | | | $ 1,908,016 |
17
See Notes to Financial Statements.
Calvert
Global Water Fund
September 30, 2020
Schedule of Investments — continued
| Short-Term Investments — 0.5% |
| Other — 0.3% |
| Description | Units | Value |
| Calvert Cash Reserves Fund, LLC, 0.13%(7) | | 1,005,563 | $ 1,005,664 |
Total Other
(identified cost $1,005,765) | | | $ 1,005,664 |
| Securities Lending Collateral — 0.2% |
| Security | Shares | Value |
| State Street Navigator Securities Lending Government Money Market Portfolio, 0.09%(8) | | 961,941 | $ 961,941 |
Total Securities Lending Collateral
(identified cost $961,941) | | | $ 961,941 |
Total Short-Term Investments
(identified cost $1,967,706) | | | $ 1,967,605 |
Total Investments — 100.0%
(identified cost $341,151,693) | | $ 409,590,774 |
| Other Assets, Less Liabilities — (0.0)% | | $ (135,718) |
| Net Assets — 100.0% | | $ 409,455,056 |
The percentage shown for each investment category in the Schedule of Investments is based on net assets.
| |
| (1) | All or a portion of this security was on loan at September 30, 2020. The aggregate market value of securities on loan at September 30, 2020 was $24,042,900. |
| (2) | Non-income producing security. |
| (3) | For fair value measurement disclosure purposes, security is categorized as Level 3 (see Note 1A). |
| (4) | Affiliated company (see Note 7). |
| (5) | Restricted security. Total market value of restricted securities amounts to $1,908,016, which represents 0.4% of the net assets of the Fund as of September 30, 2020. |
| (6) | Notes carry an interest rate that varies by period and is contingent on the performance of the underlying portfolio of loans to borrowers. The coupon rate shown represents the rate in effect at September 30, 2020. |
| (7) | Affiliated investment company, available to Calvert portfolios and funds, which invests in high quality, U.S. dollar denominated money market instruments. The rate shown is the annualized seven-day yield as of September 30, 2020. |
| (8) | Represents investment of cash collateral received in connection with securities lending. |
At September 30, 2020, the concentration of the Fund’s investments in the various sectors, determined as a percentage of net assets, was as follows:
| Economic Sectors | % of Net Assets |
| Industrials | 47.2% |
| Utilities | 27.1 |
| Materials | 10.0 |
| Information Technology | 4.8 |
| Consumer Discretionary | 3.8 |
| Health Care | 2.6 |
| Consumer Staples | 2.1 |
| Real Estate | 1.5 |
| High Social Impact Investments | 0.4 |
| Total | 99.5% |
Restricted Securities
| Description | Acquisition Dates | Cost |
| Calvert Impact Capital, Inc., Community Investment Notes, 1.50%, 12/15/20 | 12/13/19 | $1,324,116 |
| ImpactAssets, Inc., Global Sustainable Agriculture Notes, 2.07%, 11/3/20 | 11/13/15 | 284,000 |
| ImpactAssets, Inc., Microfinance Plus Notes, 0.46%, 11/3/20 | 11/13/15 | 366,000 |
| Abbreviations: |
| ADR | – American Depositary Receipt |
| PCL | – Public Company Limited |
| PFC Shares | – Preference Shares |
18
See Notes to Financial Statements.
Calvert
Global Energy Solutions Fund
Global Water Fund
September 30, 2020
Statements of Assets and Liabilities
| | September 30, 2020 |
| | Global Energy Solutions Fund | Global Water Fund |
| Assets | | |
| Investments in securities of unaffiliated issuers, at value (identified cost $95,817,361 and $338,821,812, respectively) - including $11,192,401 and $24,042,900, respectively, of securities on loan | $ 120,462,182 | $ 407,267,707 |
| Investments in securities of affiliated issuers, at value (identified cost $522,210 and $2,329,881, respectively) | 520,861 | 2,323,067 |
| Cash | 5,169 | — |
| Cash denominated in foreign currency, at value (cost $148,593 and $355,202, respectively) | 148,526 | 355,999 |
| Receivable for capital shares sold | 139,777 | 330,403 |
| Dividends and interest receivable | 198,861 | 1,124,402 |
| Dividends and interest receivable - affiliated | 3,188 | 15,777 |
| Securities lending income receivable | 22,905 | 3,533 |
| Tax reclaims receivable | 126,824 | 374,637 |
| Receivable from affiliate | 11,776 | 13,995 |
| Directors' deferred compensation plan | 44,321 | 237,374 |
| Other assets | — | 778 |
| Total assets | $121,684,390 | $412,047,672 |
| Liabilities | | |
| Payable for investments purchased | $ 82,268 | $ — |
| Payable for capital shares redeemed | 38,756 | 814,926 |
| Deposits for securities loaned | 5,381,289 | 961,941 |
| Payable to affiliates: | | |
| Investment advisory fee | 69,135 | 246,645 |
| Administrative fee | 11,062 | 40,526 |
| Distribution and service fees | 18,758 | 69,689 |
| Sub-transfer agency fee | 7,563 | 16,816 |
| Directors' deferred compensation plan | 44,321 | 237,374 |
| Accrued expenses | 86,882 | 204,699 |
| Total liabilities | $ 5,740,034 | $ 2,592,616 |
| Net Assets | $115,944,356 | $409,455,056 |
| Sources of Net Assets | | |
| Paid-in capital | $ 158,294,598 | $ 381,646,957 |
| Distributable earnings (Accumulated loss) | (42,350,242) | 27,808,099 |
| Total | $115,944,356 | $409,455,056 |
| Class A Shares | | |
| Net Assets | $ 62,427,716 | $ 180,956,318 |
| Shares Outstanding | 6,544,568 | 8,349,310 |
Net Asset Value and Redemption Price Per Share
(net assets ÷ shares of beneficial interest outstanding) | $ 9.54 | $ 21.67 |
Maximum Offering Price Per Share
(100 ÷ 95.25 of net asset value per share) | $ 10.02 | $ 22.75 |
| Class C Shares | | |
| Net Assets | $ 7,841,091 | $ 39,357,582 |
| Shares Outstanding | 879,211 | 1,983,576 |
Net Asset Value and Offering Price Per Share*
(net assets ÷ shares of beneficial interest outstanding) | $ 8.92 | $ 19.84 |
19
See Notes to Financial Statements.
Calvert
Global Energy Solutions Fund
Global Water Fund
September 30, 2020
Statements of Assets and Liabilities — continued
| | September 30, 2020 |
| | Global Energy Solutions Fund | Global Water Fund |
| Class I Shares | | |
| Net Assets | $45,675,549 | $189,141,156 |
| Shares Outstanding | 4,708,783 | 8,662,413 |
Net Asset Value, Offering Price and Redemption Price Per Share
(net assets ÷ shares of beneficial interest outstanding) | $ 9.70 | $ 21.83 |
| | On sales of $50,000 or more, the offering price of Class A shares is reduced. |
| * | Redemption price per share is equal to the net asset value less any applicable contingent deferred sales charge. |
20
See Notes to Financial Statements.
Calvert
Global Energy Solutions Fund
Global Water Fund
September 30, 2020
| | Year Ended September 30, 2020 |
| | Global Energy Solutions Fund | Global Water Fund |
| Investment Income | | |
| Dividend income (net of foreign taxes withheld of $147,084 and $577,890, respectively) | $ 1,549,892 | $ 7,798,882 |
| Dividend income - affiliated issuers | 168 | 96 |
| Non-cash dividend income | 93,368 | — |
| Interest income | 3,060 | 13,444 |
| Interest income - affiliated issuers | 8,380 | 18,641 |
| Securities lending income, net | 150,288 | 60,240 |
| Total investment income | $ 1,805,156 | $ 7,891,303 |
| Expenses | | |
| Investment advisory fee | $ 667,979 | $ 2,966,407 |
| Administrative fee | 106,877 | 487,098 |
| Distribution and service fees: | | |
| Class A | 127,230 | 440,389 |
| Class C | 68,426 | 455,488 |
| Directors' fees and expenses | 3,558 | 16,868 |
| Custodian fees | 17,288 | 22,607 |
| Transfer agency fees and expenses | 189,771 | 608,243 |
| Accounting fees | 29,148 | 94,768 |
| Professional fees | 32,650 | 54,775 |
| Registration fees | 55,251 | 66,683 |
| Reports to shareholders | 20,459 | 56,993 |
| Miscellaneous | 32,542 | 50,123 |
| Total expenses | $ 1,351,179 | $ 5,320,442 |
| Waiver and/or reimbursement of expenses by affiliate | $ (271,839) | $ (397,127) |
| Reimbursement of expenses - other | (1,224) | (6,026) |
| Net expenses | $ 1,078,116 | $ 4,917,289 |
| Net investment income | $ 727,040 | $ 2,974,014 |
| Realized and Unrealized Gain (Loss) | | |
| Net realized gain (loss): | | |
| Investment securities (net of foreign capital gains taxes of $298 and $6,138, respectively) | $ 8,883,179 | $ 5,653,250 |
| Investment securities - affiliated issuers | 47 | (41) |
| Foreign currency transactions | (5,391) | (101,760) |
| Net realized gain | $ 8,877,835 | $ 5,551,449 |
| Change in unrealized appreciation (depreciation): | | |
| Investment securities (including net decrease in payable for foreign capital gains taxes of $22,880 and $129,687, respectively) | $ 19,946,557 | $ 11,144,206 |
| Investment securities - affiliated issuers | 8,173 | (1,524) |
| Foreign currency | 8,761 | 37,101 |
| Net change in unrealized appreciation (depreciation) | $19,963,491 | $11,179,783 |
| Net realized and unrealized gain | $28,841,326 | $16,731,232 |
| Net increase in net assets from operations | $29,568,366 | $19,705,246 |
21
See Notes to Financial Statements.
Calvert
Global Energy Solutions Fund
Global Water Fund
September 30, 2020
Statements of Changes in Net Assets
| | Global Energy Solutions Fund | Global Water Fund |
| | Year Ended September 30, |
| | 2020 | 2019 | 2020 | 2019 |
| Increase (Decrease) in Net Assets | | | | |
| From operations: | | | | |
| Net investment income | $ 727,040 | $ 974,787 | $ 2,974,014 | $ 4,769,609 |
| Net realized gain (loss) | 8,877,835 | (396,874) | 5,551,449 | (2,517,548) |
| Net change in unrealized appreciation (depreciation) | 19,963,491 | 1,966,950 | 11,179,783 | 14,673,929 |
| Net increase in net assets from operations | $ 29,568,366 | $ 2,544,863 | $ 19,705,246 | $ 16,925,990 |
| Distributions to shareholders: | | | | |
| Class A | $ (529,616) | $ (702,716) | $ (1,611,283) | $ (2,155,791) |
| Class C | (26,519) | (66,797) | (108,693) | (248,276) |
| Class I | (359,921) | (346,105) | (2,089,882) | (2,449,451) |
| Total distributions to shareholders | $ (916,056) | $ (1,115,618) | $ (3,809,858) | $ (4,853,518) |
| Capital share transactions: | | | | |
| Class A | $ (1,151,504) | $ (4,663,197) | $ (7,542,026) | $ (24,869,349) |
| Class C | (956,642) | (3,207,233) | (12,448,296) | (9,435,586) |
| Class I | 11,184,843 | 3,980,156 | 2,202,758 | 2,885,512 |
| Net increase (decrease) in net assets from capital share transactions | $ 9,076,697 | $ (3,890,274) | $ (17,787,564) | $ (31,419,423) |
| Net increase (decrease) in net assets | $ 37,729,007 | $ (2,461,029) | $ (1,892,176) | $ (19,346,951) |
| Net Assets | | | | |
| At beginning of year | $ 78,215,349 | $ 80,676,378 | $ 411,347,232 | $ 430,694,183 |
| At end of year | $115,944,356 | $78,215,349 | $409,455,056 | $411,347,232 |
22
See Notes to Financial Statements.
Calvert
Global Energy Solutions Fund
September 30, 2020
| | Global Energy Solutions Fund — Class A |
| | Year Ended September 30, |
| | 2020 | 2019 | 2018 | 2017 | 2016 |
| Net asset value — Beginning of year | $ 7.08 | $ 6.95 | $ 7.23 | $ 6.23 | $ 5.76 |
| Income (Loss) From Operations | | | | | |
| Net investment income(1) | $ 0.06 | $ 0.08 | $ 0.10 | $ 0.08 | $ 0.08(2) |
| Net realized and unrealized gain (loss) | 2.48 | 0.15 | (0.29) | 0.98 | 0.40 |
| Total income (loss) from operations | $ 2.54 | $ 0.23 | $ (0.19) | $ 1.06 | $ 0.48 |
| Less Distributions | | | | | |
| From net investment income | $ (0.08) | $ (0.10) | $ (0.09) | $ (0.06) | $ (0.01) |
| Total distributions | $ (0.08) | $ (0.10) | $ (0.09) | $ (0.06) | $ (0.01) |
| Net asset value — End of year | $ 9.54 | $ 7.08 | $ 6.95 | $ 7.23 | $ 6.23 |
| Total Return(3) | 36.12% | 3.60% | (2.73)% | 17.28% | 8.38% |
| Ratios/Supplemental Data | | | | | |
| Net assets, end of year (000’s omitted) | $62,428 | $47,596 | $51,502 | $58,695 | $70,317 |
| Ratios (as a percentage of average daily net assets):(4) | | | | | |
| Total expenses | 1.54% | 1.72% | 1.69% | 1.94% | 2.06% |
| Net expenses | 1.24% | 1.26% | 1.28% | 1.38% | 1.85% |
| Net investment income | 0.76% | 1.27% | 1.34% | 1.26% | 1.33% (2) |
| Portfolio Turnover | 45% | 40% | 38% | 133% | 89% |
| (1) | Computed using average shares outstanding. |
| (2) | Amount includes a non-recurring refund for overbilling of prior years' custody out-of-pocket fees. This amounted to $0.005 per share and 0.08% of average net assets. |
| (3) | Returns are historical and are calculated by determining the percentage change in net asset value with all distributions reinvested and do not reflect the effect of sales charges, if any. |
| (4) | Total expenses do not reflect amounts reimbursed and/or waived by the adviser and certain of its affiliates, if applicable. Net expenses are net of all reductions and represent the net expenses paid by the Fund. |
23
See Notes to Financial Statements.
Calvert
Global Energy Solutions Fund
September 30, 2020
Financial Highlights — continued
| | Global Energy Solutions Fund — Class C |
| | Year Ended September 30, |
| | 2020 | 2019 | 2018 | 2017 | 2016 |
| Net asset value — Beginning of year | $ 6.63 | $ 6.50 | $ 6.76 | $ 5.82 | $ 5.42 |
| Income (Loss) From Operations | | | | | |
| Net investment income (loss)(1) | $ (—)(2) | $ 0.02 | $ 0.04 | $ 0.03 | $ 0.03(3) |
| Net realized and unrealized gain (loss) | 2.32 | 0.16 | (0.26) | 0.92 | 0.37 |
| Total income (loss) from operations | $ 2.32 | $ 0.18 | $ (0.22) | $ 0.95 | $ 0.40 |
| Less Distributions | | | | | |
| From net investment income | $ (0.03) | $ (0.05) | $ (0.04) | $ (0.01) | $ — |
| Total distributions | $ (0.03) | $ (0.05) | $ (0.04) | $ (0.01) | $ — |
| Net asset value — End of year | $ 8.92 | $ 6.63 | $ 6.50 | $ 6.76 | $ 5.82 |
| Total Return(4) | 35.03% | 2.85% | (3.31)% | 16.38% | 7.38% |
| Ratios/Supplemental Data | | | | | |
| Net assets, end of year (000’s omitted) | $ 7,841 | $6,752 | $9,996 | $11,938 | $13,213 |
| Ratios (as a percentage of average daily net assets):(5) | | | | | |
| Total expenses | 2.29% | 2.48% | 2.44% | 2.78% | 2.87% |
| Net expenses | 1.99% | 2.01% | 2.03% | 2.13% | 2.69% |
| Net investment income (loss) | (0.01)% | 0.38% | 0.59% | 0.55% | 0.45% (3) |
| Portfolio Turnover | 45% | 40% | 38% | 133% | 89% |
| (1) | Computed using average shares outstanding. |
| (2) | Amount is less than $(0.005). |
| (3) | Amount includes a non-recurring refund for overbilling of prior years' custody out-of-pocket fees. This amounted to $0.004 per share and 0.07% of average net assets. |
| (4) | Returns are historical and are calculated by determining the percentage change in net asset value with all distributions reinvested and do not reflect the effect of sales charges, if any. |
| (5) | Total expenses do not reflect amounts reimbursed and/or waived by the adviser and certain of its affiliates, if applicable. Net expenses are net of all reductions and represent the net expenses paid by the Fund. |
24
See Notes to Financial Statements.
Calvert
Global Energy Solutions Fund
September 30, 2020
Financial Highlights — continued
| | Global Energy Solutions Fund — Class I |
| | Year Ended September 30, |
| | 2020 | 2019 | 2018 | 2017 | 2016 |
| Net asset value — Beginning of year | $ 7.20 | $ 7.07 | $ 7.34 | $ 6.35 | $ 5.88 |
| Income (Loss) From Operations | | | | | |
| Net investment income(1) | $ 0.08 | $ 0.11 | $ 0.15 | $ 0.13 | $ 0.11(2) |
| Net realized and unrealized gain (loss) | 2.52 | 0.14 | (0.31) | 0.97 | 0.41 |
| Total income (loss) from operations | $ 2.60 | $ 0.25 | $ (0.16) | $ 1.10 | $ 0.52 |
| Less Distributions | | | | | |
| From net investment income | $ (0.10) | $ (0.12) | $ (0.11) | $ (0.11) | $ (0.05) |
| Total distributions | $ (0.10) | $ (0.12) | $ (0.11) | $ (0.11) | $(0.05) |
| Net asset value — End of year | $ 9.70 | $ 7.20 | $ 7.07 | $ 7.34 | $ 6.35 |
| Total Return(3) | 36.40% | 3.89% | (2.33)% | 17.66% | 8.76% |
| Ratios/Supplemental Data | | | | | |
| Net assets, end of year (000’s omitted) | $45,676 | $23,867 | $19,178 | $ 5,503 | $ 910 |
| Ratios (as a percentage of average daily net assets):(4) | | | | | |
| Total expenses | 1.29% | 1.47% | 1.43% | 1.66% | 3.83% |
| Net expenses | 0.99% | 0.98% | 0.93% | 0.97% | 1.40% |
| Net investment income | 1.08% | 1.60% | 2.00% | 1.99% | 1.74% (2) |
| Portfolio Turnover | 45% | 40% | 38% | 133% | 89% |
| (1) | Computed using average shares outstanding. |
| (2) | Amount includes a non-recurring refund for overbilling of prior years' custody out-of-pocket fees. This amounted to $0.006 per share and 0.09% of average net assets. |
| (3) | Returns are historical and are calculated by determining the percentage change in net asset value with all distributions reinvested and do not reflect the effect of sales charges, if any. |
| (4) | Total expenses do not reflect amounts reimbursed and/or waived by the adviser and certain of its affiliates, if applicable. Net expenses are net of all reductions and represent the net expenses paid by the Fund. |
25
See Notes to Financial Statements.
Calvert
Global Water Fund
September 30, 2020
| | Global Water Fund — Class A |
| | Year Ended September 30, |
| | 2020 | 2019 | 2018 | 2017 | 2016 |
| Net asset value — Beginning of year | $ 20.70 | $ 20.00 | $ 19.92 | $ 17.71 | $ 14.87 |
| Income (Loss) From Operations | | | | | |
| Net investment income(1) | $ 0.14 | $ 0.23 | $ 0.23 | $ 0.20 | $ 0.03(2) |
| Net realized and unrealized gain | 1.02 | 0.70 | 0.04 | 2.01 | 2.81 |
| Total income from operations | $ 1.16 | $ 0.93 | $ 0.27 | $ 2.21 | $ 2.84 |
| Less Distributions | | | | | |
| From net investment income | $ (0.19) | $ (0.23) | $ (0.19) | $ — | $ —(3) |
| Total distributions | $ (0.19) | $ (0.23) | $ (0.19) | $ — | $ —(3) |
| Net asset value — End of year | $ 21.67 | $ 20.70 | $ 20.00 | $ 19.92 | $ 17.71 |
| Total Return(4) | 5.57% | 4.86% | 1.34% | 12.48% | 19.13% |
| Ratios/Supplemental Data | | | | | |
| Net assets, end of year (000’s omitted) | $180,956 | $181,139 | $201,243 | $235,266 | $278,517 |
| Ratios (as a percentage of average daily net assets):(5) | | | | | |
| Total expenses | 1.34% | 1.38% | 1.39% | 1.46% | 1.63% |
| Net expenses | 1.24% | 1.25% | 1.28% | 1.28% | 1.51% |
| Net investment income | 0.70% | 1.17% | 1.14% | 1.11% | 0.22% (2) |
| Portfolio Turnover | 35% | 28% | 40% | 34% | 103% |
| (1) | Computed using average shares outstanding. |
| (2) | Amount includes a non-recurring refund for overbilling of prior years' custody out-of-pocket fees. This amounted to $0.002 per share and 0.01% of average net assets. |
| (3) | Amount is less than $0.005. |
| (4) | Returns are historical and are calculated by determining the percentage change in net asset value with all distributions reinvested and do not reflect the effect of sales charges, if any. |
| (5) | Total expenses do not reflect amounts reimbursed and/or waived by the adviser and certain of its affiliates, if applicable. Net expenses are net of all reductions and represent the net expenses paid by the Fund. |
26
See Notes to Financial Statements.
Calvert
Global Water Fund
September 30, 2020
Financial Highlights — continued
| | Global Water Fund — Class C |
| | Year Ended September 30, |
| | 2020 | 2019 | 2018 | 2017 | 2016 |
| Net asset value — Beginning of year | $ 18.98 | $ 18.32 | $ 18.28 | $ 16.37 | $ 13.84 |
| Income (Loss) From Operations | | | | | |
| Net investment income (loss)(1) | $ (0.02) | $ 0.08 | $ 0.07 | $ 0.07 | $ (0.08)(2) |
| Net realized and unrealized gain | 0.92 | 0.66 | 0.03 | 1.84 | 2.61 |
| Total income from operations | $ 0.90 | $ 0.74 | $ 0.10 | $ 1.91 | $ 2.53 |
| Less Distributions | | | | | |
| From net investment income | $ (0.04) | $ (0.08) | $ (0.06) | $ — | $ — |
| Total distributions | $ (0.04) | $ (0.08) | $ (0.06) | $ — | $ — |
| Net asset value — End of year | $ 19.84 | $ 18.98 | $ 18.32 | $ 18.28 | $ 16.37 |
| Total Return(3) | 4.75% | 4.08% | 0.61% | 11.67% | 18.28% |
| Ratios/Supplemental Data | | | | | |
| Net assets, end of year (000’s omitted) | $39,358 | $50,369 | $58,455 | $67,096 | $71,334 |
| Ratios (as a percentage of average daily net assets):(4) | | | | | |
| Total expenses | 2.09% | 2.13% | 2.14% | 2.17% | 2.35% |
| Net expenses | 1.99% | 2.01% | 2.03% | 2.03% | 2.25% |
| Net investment income (loss) | (0.08)% | 0.43% | 0.40% | 0.41% | (0.52)% (2) |
| Portfolio Turnover | 35% | 28% | 40% | 34% | 103% |
| (1) | Computed using average shares outstanding. |
| (2) | Amount includes a non-recurring refund for overbilling of prior years' custody out-of-pocket fees. This amounted to $0.002 per share and 0.01% of average net assets. |
| (3) | Returns are historical and are calculated by determining the percentage change in net asset value with all distributions reinvested and do not reflect the effect of sales charges, if any. |
| (4) | Total expenses do not reflect amounts reimbursed and/or waived by the adviser and certain of its affiliates, if applicable. Net expenses are net of all reductions and represent the net expenses paid by the Fund. |
27
See Notes to Financial Statements.
Calvert
Global Water Fund
September 30, 2020
Financial Highlights — continued
| | Global Water Fund — Class I |
| | Year Ended September 30, |
| | 2020 | 2019 | 2018 | 2017 | 2016 |
| Net asset value — Beginning of year | $ 20.85 | $ 20.15 | $ 20.08 | $ 17.79 | $ 15.02 |
| Income (Loss) From Operations | | | | | |
| Net investment income(1) | $ 0.20 | $ 0.29 | $ 0.36 | $ 0.30 | $ 0.13(2) |
| Net realized and unrealized gain (loss) | 1.02 | 0.70 | (0.02) | 1.99 | 2.80 |
| Total income from operations | $ 1.22 | $ 0.99 | $ 0.34 | $ 2.29 | $ 2.93 |
| Less Distributions | | | | | |
| From net investment income | $ (0.24) | $ (0.29) | $ (0.27) | $ — | $ (0.16) |
| Total distributions | $ (0.24) | $ (0.29) | $ (0.27) | $ — | $ (0.16) |
| Net asset value — End of year | $ 21.83 | $ 20.85 | $ 20.15 | $ 20.08 | $17.79 |
| Total Return(3) | 5.83% | 5.18% | 1.68% | 12.87% | 19.68% |
| Ratios/Supplemental Data | | | | | |
| Net assets, end of year (000’s omitted) | $189,141 | $179,839 | $170,996 | $16,094 | $ 4,637 |
| Ratios (as a percentage of average daily net assets):(4) | | | | | |
| Total expenses | 1.09% | 1.13% | 1.14% | 1.12% | 1.56% |
| Net expenses | 0.99% | 0.97% | 0.93% | 0.93% | 1.08% |
| Net investment income | 0.97% | 1.48% | 1.78% | 1.61% | 0.80% (2) |
| Portfolio Turnover | 35% | 28% | 40% | 34% | 103% |
| (1) | Computed using average shares outstanding. |
| (2) | Amount includes a non-recurring refund for overbilling of prior years' custody out-of-pocket fees. This amounted to $0.003 per share and 0.02% of average net assets. |
| (3) | Returns are historical and are calculated by determining the percentage change in net asset value with all distributions reinvested and do not reflect the effect of sales charges, if any. |
| (4) | Total expenses do not reflect amounts reimbursed and/or waived by the adviser and certain of its affiliates, if applicable. Net expenses are net of all reductions and represent the net expenses paid by the Fund. |
28
See Notes to Financial Statements.
Calvert
Global Energy Solutions Fund
Global Water Fund
September 30, 2020
Notes to Financial Statements
1 Significant Accounting Policies
Calvert Global Energy Solutions Fund (Global Energy Solutions) and Calvert Global Water Fund (Global Water) (each a Fund and collectively, the Funds) are diversified series of Calvert Impact Fund, Inc. (the Corporation). The Corporation is a Maryland corporation registered under the Investment Company Act of 1940, as amended (the 1940 Act), as an open-end management investment company. The investment objective of Global Energy Solutions is to seek to track the performance of the Calvert Global Energy Research Index. Global Energy Solutions invests in equity securities of U.S. and non-U.S. companies whose main business is sustainable energy solutions, or that are significantly involved in the sustainable energy solutions industry. The investment objective of Global Water is to seek to track the performance of the Calvert Global Water Research Index. Global Water invests in equity securities of U.S. and non-U.S. companies whose main business is in the water industry, or that are significantly involved in water-related services or technologies.
Each Fund offers three classes of shares. Class A shares are generally sold subject to a sales charge imposed at time of purchase. A contingent deferred sales charge of 0.80% may apply to certain redemptions of Class A shares for accounts for which no sales charge was paid, if redeemed within 12 months of purchase. Class C shares are sold without a front-end sales charge, and with certain exceptions, are charged a contingent deferred sales charge of 1% on shares redeemed within 12 months of purchase. Class C shares are only available for purchase through a financial intermediary. Effective January 25, 2019, Class C shares generally automatically convert to Class A shares ten years after their purchase and, effective November 5, 2020, automatically convert to Class A shares eight years after their purchase as described in the Funds’ prospectus. Class I shares are sold at net asset value, are not subject to a sales charge and are sold only to certain eligible investors. Each class represents a pro rata interest in each Fund, but votes separately on class-specific matters and is subject to different expenses.
Each Fund applies the accounting and reporting guidance in the Financial Accounting Standards Board (FASB) Accounting Standards Codification Topic 946, Financial Services – Investment Companies (ASC 946). Subsequent events, if any, through the date that the financial statements were issued have been evaluated in the preparation of the financial statements.
A Investment Valuation— Net asset value per share is determined every business day as of the close of the regular session of the New York Stock Exchange (generally 4:00 p.m. Eastern time). The Funds use independent pricing services approved by the Board of Directors (the Board) to value their investments wherever possible. Investments for which market quotations are not available or deemed not reliable are fair valued in good faith under the direction of the Board.
U.S. generally accepted accounting principles (U.S. GAAP) establishes a disclosure hierarchy that categorizes the inputs to valuation techniques used to value assets and liabilities at measurement date. These inputs are summarized in the three broad levels listed below:
Level 1 – quoted prices in active markets for identical securities
Level 2 – other significant observable inputs (including quoted prices for similar securities, interest rates, prepayment speeds, credit risk, etc.)
Level 3 – significant unobservable inputs (including each Fund's own assumptions in determining the fair value of investments)
The inputs or methodologies used for valuing securities are not necessarily an indication of the risk associated with investing in those securities.
Valuation techniques used to value each Fund’s investments by major category are as follows:
Equity Securities. Equity securities (including warrants and rights) listed on a U.S. securities exchange generally are valued at the last sale or closing price as reported by an independent pricing service on the primary market or exchange on which they are traded and are categorized as Level 1 in the hierarchy. Equity securities listed on the NASDAQ Global or Global Select Market are valued at the NASDAQ official closing price and are categorized as Level 1 in the hierarchy. Unlisted or listed securities for which closing sales prices or closing quotations are not available are valued at the mean between the latest available bid and ask prices and are categorized as Level 2 in the hierarchy. The daily valuation of exchange-traded foreign securities generally is determined as of the close of trading on the principal exchange on which such securities trade. Events occurring after the close of trading on foreign exchanges may result in adjustments to the valuation of foreign securities to more accurately reflect their fair value as of the close of regular trading on the New York Stock Exchange. When valuing foreign equity securities that meet certain criteria, the Funds' Board has approved the use of a fair value service that values such securities to reflect market trading that occurs after the close of the applicable foreign markets of comparable securities or other instruments that have a strong correlation to the fair-valued securities. Such securities are categorized as Level 2 in the hierarchy.
Debt Securities. Debt securities are generally valued based on valuations provided by third party pricing services, as derived from such services’ pricing models. Inputs to the models may include, but are not limited to, reported trades, executable bid and ask prices, broker/dealer quotations, prices or yields of securities with similar characteristics, interest rates, anticipated prepayments, benchmark curves or information pertaining to the issuer, as well as industry and economic events. Accordingly, debt securities are generally categorized as Level 2 in the hierarchy. Short-term debt securities with a remaining maturity at time of purchase of more than sixty days are valued based on valuations provided by a third party pricing service. Such securities are generally categorized as Level 2 in the hierarchy. Short-term debt securities of sufficient credit quality purchased with remaining maturities of sixty days or less are valued at amortized cost, which approximates fair value, and are categorized as Level 2 in the hierarchy.
Calvert
Global Energy Solutions Fund
Global Water Fund
September 30, 2020
Notes to Financial Statements — continued
Affiliated Fund. The Funds may invest in Calvert Cash Reserves Fund, LLC (Cash Reserves Fund), an affiliated investment company managed by Calvert Research and Management (CRM). While Cash Reserves Fund is not a registered money market mutual fund, it conducts all of its investment activities in accordance with the requirements of Rule 2a-7 under the 1940 Act. Investments in Cash Reserves Fund are valued at the closing net asset value per unit on the valuation day and are categorized as Level 2 in the hierarchy. Cash Reserves Fund generally values its investment securities based on available market quotations provided by a third party pricing service.
Other Securities. Investments in registered investment companies (including money market funds) that do not trade on an exchange are valued at the net asset value per share on the valuation day and are categorized as Level 1 in the hierarchy.
Fair Valuation. If a market value cannot be determined for a security using the methodologies described above, or if, in the good faith opinion of the Funds’ adviser, the market value does not constitute a readily available market quotation, or if a significant event has occurred that would materially affect the value of the security, the security will be fair valued as determined in good faith by or at the direction of the Board in a manner that most fairly reflects the security’s “fair value”, which is the amount that the Funds might reasonably expect to receive for the security upon its current sale in the ordinary course. Each such determination is based on a consideration of relevant factors, which are likely to vary from one pricing context to another. These factors may include, but are not limited to, the type of security, the existence of any contractual restrictions on the security’s disposition, the price and extent of public trading in similar securities of the issuer or of comparable companies or entities, quotations or relevant information obtained from broker/dealers or other market participants, information obtained from the issuer, analysts, and/or the appropriate stock exchange (for exchange-traded securities), an analysis of the company’s or entity’s financial statements, and an evaluation of the forces that influence the issuer and the market(s) in which the security is purchased and sold.
The values assigned to fair value investments are based on available information and do not necessarily represent amounts that might ultimately be realized. Further, due to the inherent uncertainty of valuations of such investments, the fair values may differ significantly from the values that would have been used had an active market existed, and the differences could be material.
The following tables summarize the market value of each of the Funds' holdings as of September 30, 2020, based on the inputs used to value them:
Global Energy Solutions
| Asset Description | Level 1 | Level 2 | Level 3 | Total |
| Common Stocks | | | | |
| Australia | $ — | $ 616,020 | $ — | $ 616,020 |
| Austria | — | 736,337 | — | 736,337 |
| Belgium | — | 1,283,981 | — | 1,283,981 |
| Brazil | 1,081,035 | — | — | 1,081,035 |
| Canada | 4,623,380 | — | — | 4,623,380 |
| China | — | 6,550,517 | — | 6,550,517 |
| Denmark | — | 3,012,212 | — | 3,012,212 |
| Finland | — | 1,236,856 | — | 1,236,856 |
| France | — | 5,475,165 | — | 5,475,165 |
| Germany | 85,969 | 9,414,187 | — | 9,500,156 |
| Greece | — | 545,199 | — | 545,199 |
| Ireland | — | 1,377,145 | — | 1,377,145 |
| Italy | — | 3,312,548 | — | 3,312,548 |
| Japan | — | 8,391,946 | — | 8,391,946 |
| Netherlands | — | 712,519 | — | 712,519 |
| New Zealand | — | 2,053,590 | — | 2,053,590 |
| Norway | — | 1,255,599 | — | 1,255,599 |
| Portugal | — | 683,053 | — | 683,053 |
| Singapore | 406,819 | 587,154 | — | 993,973 |
| South Korea | — | 2,191,486 | — | 2,191,486 |
| Spain | 632,024 | 3,637,827 | — | 4,269,851 |
| Sweden | — | 1,345,005 | — | 1,345,005 |
| Switzerland | — | 2,451,570 | — | 2,451,570 |
Calvert
Global Energy Solutions Fund
Global Water Fund
September 30, 2020
Notes to Financial Statements — continued
Global Energy Solutions — continued
| Asset Description | Level 1 | Level 2 | Level 3 | Total |
| Taiwan | $ — | $ 7,410,066 | $ — | $ 7,410,066 |
| Thailand | — | 1,602,204 | — | 1,602,204 |
| United Kingdom | 592,467 | 3,603,701 | — | 4,196,168 |
| United States | 38,063,353 | — | — | 38,063,353 |
| Total Common Stocks | $45,485,047 | 69,485,887 (1) | $ — | $114,970,934 |
| High Social Impact Investments | $ — | $ 372,190 | $ — | $ 372,190 |
| Short-Term Investments: | | | | |
| Other | — | 258,630 | — | 258,630 |
| Securities Lending Collateral | 5,381,289 | — | — | 5,381,289 |
| Total Investments | $50,866,336 | $70,116,707 | $ — | $120,983,043 |
| (1) | Includes foreign equity securities whose values were adjusted to reflect market trading of comparable securities or other correlated instruments that occurred after the close of trading in their applicable foreign markets. |
Global Water
| Asset Description | Level 1 | Level 2 | Level 3(1) | Total |
| Common Stocks | | | | |
| Australia | $ — | $ 6,026,353 | $ — | $ 6,026,353 |
| Brazil | 12,453,462 | — | — | 12,453,462 |
| Canada | 8,740,454 | — | — | 8,740,454 |
| Chile | — | 6,959,525 | — | 6,959,525 |
| China | — | 19,263,997 | — | 19,263,997 |
| Denmark | — | 2,244,081 | — | 2,244,081 |
| Finland | — | 7,055,145 | — | 7,055,145 |
| France | — | 16,825,308 | — | 16,825,308 |
| Germany | — | 4,319,973 | — | 4,319,973 |
| Italy | — | 3,317,862 | — | 3,317,862 |
| Japan | — | 43,832,218 | — | 43,832,218 |
| Netherlands | — | 5,964,010 | 0 | 5,964,010 |
| Singapore | — | 2,079,526 | — | 2,079,526 |
| South Korea | — | 4,297,285 | — | 4,297,285 |
| Spain | — | 4,053,199 | — | 4,053,199 |
| Switzerland | — | 18,766,253 | — | 18,766,253 |
| Taiwan | — | 2,321,209 | — | 2,321,209 |
| Thailand | — | 6,245,094 | — | 6,245,094 |
| United Kingdom | 2,036,539 | 34,833,313 | — | 36,869,852 |
| United States | 194,080,347 | — | — | 194,080,347 |
| Total Common Stocks | $217,310,802 | $188,404,351 (2) | $ 0 | $405,715,153 |
| High Social Impact Investments | $ — | $ 1,908,016 | $ — | $ 1,908,016 |
| Short-Term Investments: | | | | |
| Other | — | 1,005,664 | — | 1,005,664 |
Calvert
Global Energy Solutions Fund
Global Water Fund
September 30, 2020
Notes to Financial Statements — continued
Global Water — continued
| Asset Description | Level 1 | Level 2 | Level 3(1) | Total |
| Securities Lending Collateral | $ 961,941 | $ — | $ — | $ 961,941 |
| Total Investments | $218,272,743 | $191,318,031 | $ 0 | $409,590,774 |
| (1) | None of the unobservable inputs for Level 3 assets, individually or collectively, had a material impact on the Fund. |
| (2) | Includes foreign equity securities whose values were adjusted to reflect market trading of comparable securities or other correlated instruments that occurred after the close of trading in their applicable foreign markets. |
Level 3 investments at the beginning and/or end of the period in relation to net assets were not significant and accordingly, a reconciliation of Level 3 assets for the year ended September 30, 2020 is not presented.
B Investment Transactions and Income— Investment transactions for financial statement purposes are accounted for on trade date. Realized gains and losses are recorded on an identified cost basis and may include proceeds from litigation. Dividend income is recorded on the ex-dividend date for dividends received in cash and/or securities or, in the case of dividends on certain foreign securities, as soon as the Fund is informed of the ex-dividend date. Non-cash dividends are recorded at the fair value of the securities received. Withholding taxes on foreign dividends, if any, have been provided for in accordance with the Funds' understanding of the applicable country’s tax rules and rates. In consideration of recent decisions rendered by European courts, Global Water has filed additional tax reclaims for previously withheld taxes on dividends earned in certain European Union countries. These filings are subject to various administrative and judicial proceedings within these countries. Due to the uncertainty as to the ultimate resolution of these proceedings, the likelihood of receipt of these reclaims, and the potential timing of payment, no amounts are reflected in the financial statements for such outstanding reclaims. Distributions received that represent a return of capital are recorded as a reduction of cost of investments. Distributions received that represent a capital gain are recorded as a realized gain. Interest income, which includes amortization of premium and accretion of discount on debt securities, is accrued as earned.
C Share Class Accounting— Realized and unrealized gains and losses and net investment income and losses, other than class-specific expenses, are allocated daily to each class of shares based upon the relative net assets of each class to the total net assets of each Fund. Expenses arising in connection with a specific class are charged directly to that class.
D Foreign Currency Transactions— The Funds’ accounting records are maintained in U.S. dollars. For valuation of assets and liabilities on each date of net asset value determination, foreign denominations are converted into U.S. dollars using the current exchange rate. Security transactions, income and expenses are translated at the prevailing rate of exchange on the date of the event. Recognized gains or losses on investment transactions attributable to changes in foreign currency exchange rates are recorded for financial statement purposes as net realized gains and losses on investments. That portion of unrealized gains and losses on investments that results from fluctuations in foreign currency exchange rates is not separately disclosed.
E Restricted Securities— The Funds may invest in securities that are subject to legal or contractual restrictions on resale. Generally, these securities may only be sold publicly upon registration under the Securities Act of 1933 or in transactions exempt from such registration. Information regarding restricted securities (excluding Rule 144A securities) is included at the end of each Fund's Schedule of Investments.
F Distributions to Shareholders— Distributions to shareholders are recorded by the Funds on ex-dividend date. Distributions from net investment income and distributions from net realized capital gains, if any, are paid at least annually. Distributions are declared separately for each class of shares. Distributions are determined in accordance with income tax regulations which may differ from U.S. GAAP; accordingly, periodic reclassifications are made within the Funds' capital accounts to reflect income and gains available for distribution under income tax regulations.
G Estimates— The preparation of financial statements in conformity with U.S. GAAP requires management to make estimates and assumptions that affect the reported amounts of assets and liabilities and disclosure of contingent assets and liabilities at the date of the financial statements and the reported amounts of increases and decreases in net assets from operations during the reporting period. Actual results could differ from those estimates.
H Indemnifications— The Corporation’s By-Laws provide for indemnification for Directors or officers of the Corporation and certain other parties, to the fullest extent permitted by Maryland law and the 1940 Act, provided certain conditions are met. Additionally, in the normal course of business, each Fund enters into agreements with service providers that may contain indemnification clauses. Each Fund’s maximum exposure under these arrangements is unknown as this would involve future claims that may be made against each Fund that have not yet occurred.
I Federal Income Taxes— No provision for federal income or excise tax is required since each Fund intends to continue to qualify as a regulated investment company under the Internal Revenue Code and to distribute substantially all of its taxable earnings.
Calvert
Global Energy Solutions Fund
Global Water Fund
September 30, 2020
Notes to Financial Statements — continued
In addition to the requirements of the Internal Revenue Code, each Fund may also be subject to local taxes on the recognition of capital gains in certain countries. In determining the daily net asset value, each Fund estimates the accrual for such taxes, if any, based on the unrealized appreciation on certain portfolio securities and the related tax rates. Taxes attributable to unrealized appreciation are included in the respective Fund's change in unrealized appreciation (depreciation) on investments. Capital gains taxes on securities sold are included in the respective Fund's net realized gain (loss) on investments.
Management has analyzed the Funds’ tax positions taken for all open federal income tax years and has concluded that no provision for federal income tax is required in the Funds’ financial statements. Each Fund’s federal tax return is subject to examination by the Internal Revenue Service for a period of three years from the date of filing.
2 Related Party Transactions
The investment advisory fee is earned by CRM, a subsidiary of Eaton Vance Management (EVM), as compensation for investment advisory services rendered to each Fund. EVM is a wholly-owned subsidiary of Eaton Vance Corp. Pursuant to the investment advisory agreement, CRM receives a fee, payable monthly, at the following annual rates of each respective Fund's average daily net assets:
Global Energy Solutions0.75%
Global Water
Up to and including $250 Million0.75%
Over $250 Million0.70%
For the year ended September 30, 2020, the investment advisory fee for Global Energy Solutions and Global Water amounted to $667,979 and $2,966,407, respectively, or 0.75% and 0.73%, respectively, of each Fund’s average daily net assets. The Funds may invest their cash in Cash Reserves Fund. CRM does not currently receive a fee for advisory services provided to Cash Reserves Fund.
CRM has agreed to reimburse the Funds' operating expenses to the extent that total annual operating expenses (relating to ordinary operating expenses only and excluding expenses such as brokerage commissions, acquired fund fees and expenses of unaffiliated funds, borrowing costs, taxes or litigation expenses) exceed 1.24%, 1.99% and 0.99% of each Fund’s average daily net assets for Class A, Class C and Class I, respectively. The expense reimbursement agreements with CRM may be changed or terminated after January 31, 2021. For the year ended September 30, 2020, CRM waived or reimbursed expenses of $271,839 and $397,127 for Global Energy Solutions and Global Water, respectively.
The administrative fee is earned by CRM as compensation for administrative services rendered to the Funds. The fee is computed at an annual rate of 0.12% of each Fund’s average daily net assets attributable to Class A, Class C and Class I and is payable monthly. For the year ended September 30, 2020, CRM was paid administrative fees of $106,877 and $487,098 for Global Energy Solutions and Global Water, respectively.
Each Fund has in effect a distribution plan for Class A shares (Class A Plan) pursuant to Rule 12b-1 under the 1940 Act. Pursuant to the Class A Plan, each Fund pays Eaton Vance Distributors, Inc. (EVD), an affiliate of CRM and the Funds' principal underwriter, a distribution and service fee of 0.25% per annum of its average daily net assets attributable to Class A shares for distribution services and facilities provided to the Funds by EVD, as well as for personal services and/or the maintenance of shareholder accounts. Each Fund also has in effect a distribution plan for Class C shares (Class C Plan) pursuant to Rule 12b-1 under the 1940 Act. Pursuant to the Class C Plan, each Fund pays EVD amounts equal to 0.75% per annum of its average daily net assets attributable to Class C shares for providing ongoing distribution services and facilities to the Funds. In addition, pursuant to the Class C Plan, each Fund also makes payments of service fees to EVD, financial intermediaries and other persons in amounts equal to 0.25% per annum of its average daily net assets attributable to that class. Service fees paid or accrued are for personal services and/or the maintenance of shareholder accounts. Distribution and service fees for Global Energy Solutions and Global Water paid or accrued for the year ended September 30, 2020 amounted to $127,230 and $440,389, respectively, for Class A shares. Distribution and service fees for Global Energy Solutions and Global Water paid or accrued for the year ended September 30, 2020 amounted to $68,426 and $455,488, respectively, for Class C shares.
The Funds were informed that EVD received $19,266 and $37,072 for Global Energy Solutions and Global Water, respectively, as its portion of the sales charge on sales of Class A shares for the year ended September 30, 2020.
For the year ended September 30, 2020, the Funds were also informed that EVD received the following amounts of contingent deferred sales charges paid by Class A and Class C shareholders:
| | Global Energy Solutions | Global Water |
| Class A | $ - | $ 59 |
| Class C | 598 | 2,549 |
Calvert
Global Energy Solutions Fund
Global Water Fund
September 30, 2020
Notes to Financial Statements — continued
EVM provides sub-transfer agency and related services to the Funds pursuant to a Sub-Transfer Agency Support Services Agreement. For the year ended September 30, 2020, sub-transfer agency fees and expenses for Global Energy Solutions and Global Water incurred to EVM amounted to $43,793 and $107,069, respectively, and are included in transfer agency fees and expenses on the Statements of Operations.
Each Director of the Funds who is not an employee of CRM or its affiliates receives an annual fee of $154,000, plus an annual Committee fee ranging from $8,500 to $16,500 depending on the Committee. The Board chair receives an additional $20,000 annual fee and Committee chairs receive an additional $6,000 annual fee. Eligible Directors may participate in a Deferred Compensation Plan (the Plan). Amounts deferred under the Plan are treated as though equal dollar amounts had been invested in shares of the Funds or other Calvert funds selected by the Directors. The Funds purchase shares of the funds selected equal to the dollar amounts deferred under the Plan, resulting in an asset equal to the deferred compensation liability. Obligations of the Plan are paid solely from the Funds’ assets. Directors’ fees are allocated to each of the Calvert funds served. Salaries and fees of officers and Directors of the Funds who are employees of CRM or its affiliates are paid by CRM. In addition, an Advisory Council was established to aid the Board and CRM in advancing the cause of responsible investing through original scholarship and thought leadership. The Advisory Council consists of CRM’s Chief Executive Officer and three (four prior to December 31, 2019) additional members. Each member (other than CRM’s Chief Executive Officer) received annual compensation of $75,000, which was being reimbursed by Calvert Investment Management, Inc. (CIM), the Calvert funds' former investment adviser and Ameritas Holding Company, CIM’s parent company, through the end of 2019. For the year ending December 31, 2020, each member (other than CRM's Chief Executive Officer) is expected to be compensated $20,000 for their service on the Advisory Council. Such compensation, and any other compensation and/or expenses incurred by the Advisory Council as may be approved by the Board, shall be borne by the Calvert funds. For the year ended September 30, 2020, Global Energy Solutions' and Global Water's allocated portion of the Advisory Council compensation and fees was $1,339 and $6,518, respectively, and the reimbursement was $1,224 and $6,026, respectively, which are included in miscellaneous expense and reimbursement of expenses-other, respectively, on the Statements of Operations.
3 Investment Activity
During the year ended September 30, 2020, the cost of purchases and proceeds from sales of investments, other than short-term securities, were as follows:
| | Global Energy Solutions | Global Water |
| Purchases | $49,312,043 | $143,118,385 |
| Sales | 40,176,993 | 160,568,120 |
4 Distributions to Shareholders and Income Tax Information
The tax character of distributions declared for the years ended September 30, 2020 and September 30, 2019 was as follows:
| | Global Energy Solutions | Global Water |
| | Year Ended September 30, | Year Ended September 30, |
| | 2020 | 2019 | 2020 | 2019 |
| Ordinary income | $916,056 | $1,115,618 | $3,809,858 | $4,853,518 |
During the year ended September 30, 2020, the following amounts were reclassified due to investments in partnerships and the use of equalization accounting for Global Energy Solutions and use of equalization accounting for Global Water. Tax equalization accounting allows the Funds to treat as a distribution that portion of redemption proceeds representing a redeeming shareholder’s portion of undistributed taxable income and net capital gains.
These reclassifications had no effect on the net assets or net asset value per share of the Funds.
| | Global Energy Solutions | Global Water |
| Change in: | | |
| Paid-in capital | $ 92,768 | $ 307,287 |
| Distributable earnings (Accumulated loss) | $(92,768) | $(307,287) |
Calvert
Global Energy Solutions Fund
Global Water Fund
September 30, 2020
Notes to Financial Statements — continued
As of September 30, 2020, the components of distributable earnings (accumulated loss) on a tax basis were as follows:
| | Global Energy Solutions | Global Water |
| Undistributed ordinary income | $ 1,070,801 | $ 2,939,542 |
| Deferred capital losses | $(67,682,110) | $(38,797,795) |
| Net unrealized appreciation | $ 24,261,067 | $ 63,666,352 |
At September 30, 2020, the Funds, for federal income tax purposes, had the following deferred capital losses which would reduce the respective Fund’s taxable income arising from future net realized gains on investment transactions, if any, to the extent permitted by the Internal Revenue Code, and thus would reduce the amount of distributions to shareholders, which would otherwise be necessary to relieve the Funds of any liability for federal income or excise tax. The deferred capital losses are treated as arising on the first day of the Funds’ next taxable year, can be carried forward for an unlimited period, and retain the same short-term or long term character as when originally deferred.
The amounts of the deferred capital losses are as follows:
| | Global Energy Solutions | Global Water |
| Deferred capital losses: | | |
| Short-term | $ — | $16,661,603 |
| Long-term | 67,682,110 | 22,136,192 |
The cost and unrealized appreciation (depreciation) of investments of the Funds at September 30, 2020, as determined on a federal income tax basis, were as follows:
| | Global Energy Solutions | Global Water |
| Aggregate cost | $96,726,874 | $345,949,259 |
| Gross unrealized appreciation | $ 29,676,226 | $ 89,744,630 |
| Gross unrealized depreciation | (5,420,057) | (26,103,115) |
| Net unrealized appreciation | $24,256,169 | $ 63,641,515 |
5 Securities Lending
To generate additional income, the Funds may lend their securities pursuant to a securities lending agency agreement with State Street Bank and Trust Company (SSBT), the securities lending agent. Security loans are subject to termination by the Funds at any time and, therefore, are not considered illiquid investments. The Funds require that the loan be continuously collateralized by either cash or securities as collateral equal at all times to at least 102% of the market value of the domestic securities loaned and 105% of the market value of the international securities loaned (if applicable). The market value of securities loaned is determined daily and any additional required collateral is delivered to the Funds on the next business day. Cash collateral is generally invested in a money market fund registered under the 1940 Act that is managed by an affiliate of SSBT. Any gain or loss in the market price of the loaned securities that might occur and any interest earned or dividends declared during the term of the loan would accrue to the account of the Funds. Income earned on the investment of collateral, net of broker rebates and other expenses incurred by the securities lending agent, is split between the Funds and the securities lending agent based on agreed upon contractual terms. Non-cash collateral, if any, is held by the lending agent on behalf of a Fund and cannot be sold or re-pledged by the Fund; accordingly, such collateral is not reflected in the Statement of Assets and Liabilities.
The risks associated with lending portfolio securities include, but are not limited to, possible delays in receiving additional collateral or in the recovery of the loaned securities, possible loss of rights to the collateral should the borrower fail financially, as well as risk of loss in the value of the collateral or the value of the investments made with the collateral. The securities lending agent shall indemnify the Funds in the case of default of any securities borrower.
Calvert
Global Energy Solutions Fund
Global Water Fund
September 30, 2020
Notes to Financial Statements — continued
At September 30, 2020, the total value of securities on loan and the total value of collateral received were as follows:
| | Global Energy Solutions | Global Water |
| Securities on Loan | $ 11,192,401 | $ 24,042,900 |
| Collateral Received: | | |
| Cash | 5,381,289 | 961,941 |
| U.S. government and/or agencies securities | 6,035,831 | 24,308,512 |
| Total Collateral Received | $11,417,120 | $25,270,453 |
The following tables provide a breakdown of securities lending transactions accounted for as secured borrowings, the obligations by class of collateral pledged, and the remaining contractual maturity of those transactions as of September 30, 2020.
| Global Energy Solutions | Remaining Contractual Maturity of the Transactions |
| | Overnight and
Continuous | <30 days | 30 to 90 days | >90 days | Total |
| Common Stocks | $5,381,289 | $ — | $ — | $ — | $5,381,289 |
| Global Water | Remaining Contractual Maturity of the Transactions |
| | Overnight and
Continuous | <30 days | 30 to 90 days | >90 days | Total |
| Common Stocks | $961,941 | $ — | $ — | $ — | $961,941 |
The carrying amounts of the liabilities for deposits for securities loaned at September 30, 2020 approximated their fair value. If measured at fair value, such liabilities would have been considered as Level 2 in the fair value hierarchy (see Note 1A) at September 30, 2020.
6 Line of Credit
Effective October 29, 2019, the Funds participate with other portfolios and funds managed by EVM and its affiliates, including CRM, in an $800 million unsecured line of credit with a group of banks, which is in effect through October 27, 2020. Borrowings are made by the Funds solely for temporary purposes related to redemptions and other short-term cash needs. Interest is charged to each Fund based on its borrowings at an amount above either the Eurodollar rate or Federal Funds rate. In addition, a fee computed at an annual rate of 0.15% on the daily unused portion of the line of credit is allocated among the participating portfolios and funds at the end of each quarter. Because the line of credit is not available exclusively to the Funds, a Fund may be unable to borrow some or all of its requested amounts at any particular time.
Prior to October 29, 2019, the Funds participated with other funds managed by CRM in a $100 million committed unsecured line of credit agreement with SSBT, which was terminated by the Calvert funds. Borrowings bore interest at the higher of the one-month London Interbank Offered Rate (LIBOR) in effect that day or the overnight Federal Funds rate, plus 1.00% per annum. A commitment fee of 0.20% per annum was incurred on the unused portion of the committed facility, which was allocated to all participating funds.
The Funds had no borrowings outstanding pursuant to this line of credit at September 30, 2020. The Funds did not have any significant borrowings or allocated fees during the year ended September 30, 2020. Effective October 27, 2020, the Funds renewed their line of credit agreement, which expires October 26, 2021, at substantially the same terms.
7 Affiliated Companies and Funds
Each Fund has invested a portion of its assets in notes (the Notes) issued by Calvert Impact Capital, Inc. (CIC), pursuant to exemptive relief granted by the U.S. Securities and Exchange Commission (the SEC). There are certain potential points of affiliation between the Funds and CIC. CRM has licensed use of the Calvert name to CIC and provides other types of support. CRM’s President and Chief Executive Officer (and the only director/trustee on the Fund Board that is an “interested person” of the Funds) serves on the CIC Board, along with one member of the Advisory Council to the Fund Board and a second officer of CRM. In addition, another director/trustee on the Fund Board and a member of the Advisory Council each serve as a director emeritus on the CIC Board.
Calvert
Global Energy Solutions Fund
Global Water Fund
September 30, 2020
Notes to Financial Statements — continued
At September 30, 2020, the value of the Funds’ investment in the Notes and affiliated funds was $520,861 for Global Energy Solutions, which represents 0.5% of its net assets and $2,323,067 for Global Water, which represents 0.6% of its net assets. Transactions in the Notes and affiliated funds by the Funds for the year ended September 30, 2020 were as follows:
Global Energy Solutions
| Name | Value,
beginning
of period | Purchases | Sales
proceeds | Net
realized
gain
(loss) | Change in
unrealized
appreciation
(depreciation) | Value,
end of
period | Interest/
Dividend
income | Principal
amount/Units,
end of period |
| High Social Impact Investments | | | | | | | | |
| Calvert Impact Capital, Inc., Community Investment Notes, 1.50%, 12/15/19(1) | $1,790,478 | $ — | $(1,800,000) | $ — | $ 9,522 | $ — | $ 5,250 | $ — |
| Calvert Impact Capital, Inc., Community Investment Notes, 1.50%, 12/15/20(1) | — | 263,568 | — | — | (1,337) | 262,231 | 3,130 | 263,568 |
| Short-Term Investments | | | | | | | | |
| Calvert Cash Reserves Fund, LLC | — | 7,416,868 | (7,158,273) | 47 | (12) | 258,630 | 168 | 258,604 |
| Totals | | | | $ 47 | $ 8,173 | $ 520,861 | $ 8,548 | |
Global Water
| Name | Value,
beginning
of period | Purchases | Sales
proceeds | Net
realized
gain
(loss) | Change in
unrealized
appreciation
(depreciation) | Value,
end of
period | Interest/
Dividend
income | Principal
amount/Units,
end of period |
| High Social Impact Investments | | | | | | | | |
| Calvert Impact Capital, Inc., Community Investment Notes, 1.50%, 12/15/19(1) | $ 994,710 | $ — | $(1,000,000) | $ — | $ 5,290 | $ — | $ 2,917 | $ — |
| Calvert Impact Capital, Inc., Community Investment Notes, 1.50%, 12/15/20(1) | — | 1,324,116 | — | — | (6,713) | 1,317,403 | 15,724 | 1,324,116 |
| Short-Term Investments | | | | | | | | |
| Calvert Cash Reserves Fund, LLC | — | 7,702,185 | (6,696,379) | (41) | (101) | 1,005,664 | 96 | 1,005,563 |
| Totals | | | | $ (41) | $ (1,524) | $2,323,067 | $18,737 | |
8 Capital Shares
The Corporation may issue its shares in one or more series (such as the Funds). The authorized shares of each Fund consists of 75,000,000 common shares, $0.01 par value, for each Class.
Calvert
Global Energy Solutions Fund
Global Water Fund
September 30, 2020
Notes to Financial Statements — continued
Transactions in capital shares for the years ended September 30, 2020 and September 30, 2019 were as follows:
Global Energy Solutions
| | Year Ended
September 30, 2020 | | Year Ended
September 30, 2019 |
| | Shares | Amount | | Shares | Amount |
| Class A | | | | | |
| Shares sold | 754,608 | $ 5,816,261 | | 1,775,530 | $ 11,992,411 |
| Reinvestment of distributions | 63,936 | 495,506 | | 112,454 | 664,603 |
| Shares redeemed | (1,071,928) | (8,061,751) | | (2,862,064) | (19,213,624) |
| Converted from Class C | 79,273 | 598,480 | | 287,214 | 1,893,413 |
| Net decrease | (174,111) | $ (1,151,504) | | (686,866) | $ (4,663,197) |
| Class C | | | | | |
| Shares sold | 118,738 | $ 859,345 | | 89,959 | $ 580,475 |
| Reinvestment of distributions | 3,456 | 25,163 | | 11,289 | 62,766 |
| Shares redeemed | (176,751) | (1,242,670) | | (314,820) | (1,957,061) |
| Converted to Class A | (84,574) | (598,480) | | (305,620) | (1,893,413) |
| Net decrease | (139,131) | $ (956,642) | | (519,192) | $ (3,207,233) |
| Class I | | | | | |
| Shares sold | 2,478,591 | $ 19,373,804 | | 1,807,826 | $ 12,172,970 |
| Reinvestment of distributions | 44,987 | 353,601 | | 56,163 | 336,977 |
| Shares redeemed | (1,128,620) | (8,542,562) | | (1,262,308) | (8,529,791) |
| Net increase | 1,394,958 | $11,184,843 | | 601,681 | $ 3,980,156 |
Global Water
| | Year Ended
September 30, 2020 | | Year Ended
September 30, 2019 |
| | Shares | Amount | | Shares | Amount |
| Class A | | | | | |
| Shares sold | 1,009,457 | $ 20,886,003 | | 960,394 | $ 18,681,657 |
| Reinvestment of distributions | 67,917 | 1,499,614 | | 116,365 | 2,016,615 |
| Shares redeemed | (1,566,924) | (31,683,730) | | (2,459,523) | (46,910,007) |
| Converted from Class C | 88,411 | 1,756,087 | | 70,649 | 1,342,386 |
| Net decrease | (401,139) | $ (7,542,026) | | (1,312,115) | $(24,869,349) |
| Class C | | | | | |
| Shares sold | 165,165 | $ 3,190,157 | | 164,935 | $ 2,960,681 |
| Reinvestment of distributions | 4,561 | 92,739 | | 13,492 | 215,596 |
| Shares redeemed | (744,118) | (13,975,105) | | (637,289) | (11,269,477) |
| Converted to Class A | (96,329) | (1,756,087) | | (76,746) | (1,342,386) |
| Net decrease | (670,721) | $(12,448,296) | | (535,608) | $ (9,435,586) |
Calvert
Global Energy Solutions Fund
Global Water Fund
September 30, 2020
Notes to Financial Statements — continued
Global Water — continued
| | Year Ended
September 30, 2020 | | Year Ended
September 30, 2019 |
| | Shares | Amount | | Shares | Amount |
| Class I | | | | | |
| Shares sold | 2,263,617 | $ 46,188,116 | | 2,133,477 | $ 41,451,651 |
| Reinvestment of distributions | 81,579 | 1,811,063 | | 120,781 | 2,104,010 |
| Shares redeemed | (2,308,016) | (45,796,421) | | (2,113,969) | (40,670,149) |
| Net increase | 37,180 | $ 2,202,758 | | 140,289 | $ 2,885,512 |
9 Risks and Uncertainties
Risks Associated with Foreign Investments
Investing in foreign securities involves additional risks relating to political, social, and economic developments abroad. Other risks result from differences between regulations that apply to U.S. and foreign issuers and markets, and the potential for foreign markets to be less liquid and more volatile than U.S. markets. Securities that trade or are denominated in currencies other than the U.S. dollar may be adversely affected by fluctuations in currency exchange rates.
The risks of investing in emerging market securities are greater than those of investing in securities of developed foreign countries. These risks include volatile currency exchange rates, periods of high inflation, increased risk of default, greater social, economic and political uncertainty and instability, less governmental supervision and regulation of securities markets, weaker auditing and financial reporting standards, lack of liquidity in the markets, and the significantly smaller market capitalization of emerging market issuers.
Concentration Risk
Global Energy Solutions concentrates its investments in the sustainable energy solutions industry. This industry can be significantly affected by obsolescence of existing technology, short product lifecycles, falling prices and profits, competition from new market entrants and general economic conditions. The industry can also be significantly affected by fluctuations in energy prices and supply and demand of alternative energy fuels, energy conservation, the success of exploration projects and tax and other government regulations and policies. Companies in this industry could be adversely affected by commodity price volatility, imposition of import controls, increased competition, depletion of resources, technological developments and labor relations.
Global Water concentrates its investments in the water industry. This industry can be significantly affected by economic trends or other conditions or developments, such as the availability of water, the level of rainfall and occurrence of other climatic events, changes in water consumption, new technologies relating to the supply of water, and water conservation. The industry can also be significantly affected by environmental considerations, taxation, government regulation (including the increased cost of compliance), inflation, increases in interest rates, price and supply fluctuations, increases in the cost of raw materials and other operating costs, technological advances, and competition from new market entrants.
Pandemic Risk
An outbreak of respiratory disease caused by a novel coronavirus was first detected in China in December 2019 and subsequently spread internationally. This coronavirus has resulted in closing borders, enhanced health screenings, changes to healthcare service preparation and delivery, quarantines, cancellations, disruptions to supply chains and customer activity, as well as general concern and uncertainty. Health crises caused by outbreaks, such as the coronavirus outbreak, may exacerbate other pre-existing political, social and economic risks and disrupt normal market conditions and operations. The impact of this outbreak has negatively affected the worldwide economy, the economies of individual countries, individual companies, and the market in general, and may continue to do so in significant and unforeseen ways, as may other epidemics and pandemics that may arise in the future. Any such impact could adversely affect the Funds' performance, or the performance of the securities in which the Funds invest.
10 Subsequent Event
On October 8, 2020, Morgan Stanley and Eaton Vance Corp. (“Eaton Vance”) announced that they had entered into a definitive agreement under which Morgan Stanley would acquire Eaton Vance. Under the Investment Company Act of 1940, as amended, consummation of this transaction may result in the automatic termination of each Fund’s investment advisory agreement, and any related sub-advisory agreement(s), if applicable. Thus, each Fund’s Board will be asked to approve a new investment advisory agreement (and new sub-advisory agreement(s), if applicable). If approved by each Fund’s Board, the new investment advisory agreement (and new sub-advisory agreement(s), if applicable) is expected to be presented to Fund shareholders for approval, and, if approved, would take effect upon the closing of the transaction.
Calvert
Global Energy Solutions Fund
Global Water Fund
September 30, 2020
Report of Independent Registered Public Accounting Firm
To the Shareholders and Board of Directors
Calvert Impact Fund, Inc.:
Opinion on the Financial Statements
We have audited the accompanying statement of assets and liabilities of Calvert Global Energy Solutions Fund and Calvert Global Water Fund (collectively, the Funds), each a series of Calvert Impact Fund, Inc., including the schedules of investments, as of September 30, 2020, the related statements of operations for the year then ended, the statements of changes in net assets for each of the years in the two-year period then ended, and the related notes (collectively, the financial statements) and the financial highlights for each of the years in the five-year period then ended. In our opinion, the financial statements and financial highlights present fairly, in all material respects, the financial position of the Funds as of September 30, 2020, the results of their operations for the year then ended, the changes in their net assets for each of the years in the two-year period then ended, and the financial highlights for each of the years in the five-year period then ended, in conformity with U.S. generally accepted accounting principles.
Basis for Opinion
These financial statements and financial highlights are the responsibility of the Funds’ management. Our responsibility is to express an opinion on these financial statements and financial highlights based on our audits. We are a public accounting firm registered with the Public Company Accounting Oversight Board (United States) (PCAOB) and are required to be independent with respect to the Funds in accordance with the U.S. federal securities laws and the applicable rules and regulations of the Securities and Exchange Commission and the PCAOB.
We conducted our audits in accordance with the standards of the PCAOB. Those standards require that we plan and perform the audit to obtain reasonable assurance about whether the financial statements and financial highlights are free of material misstatement, whether due to error or fraud. Our audits included performing procedures to assess the risks of material misstatement of the financial statements and financial highlights, whether due to error or fraud, and performing procedures that respond to those risks. Such procedures included examining, on a test basis, evidence regarding the amounts and disclosures in the financial statements and financial highlights. Such procedures also included confirmation of securities owned as of September 30, 2020, by correspondence with the custodian, brokers and agent banks. Our audits also included evaluating the accounting principles used and significant estimates made by management, as well as evaluating the overall presentation of the financial statements and financial highlights. We believe that our audits provide a reasonable basis for our opinion.

We have served as the auditor of one or more of the Calvert Funds since 2002.
Philadelphia, Pennsylvania
November 20, 2020
Calvert
Global Energy Solutions Fund
Global Water Fund
September 30, 2020
Federal Tax Information (Unaudited)
The Form 1099-DIV you receive in February 2021 will show the tax status of all distributions paid to your account in calendar year 2020. Shareholders are advised to consult their own tax adviser with respect to the tax consequences of their investment in the Funds. As required by the Internal Revenue Code and/or regulations, shareholders must be notified regarding the status of qualified dividend income for individuals, the dividends received deduction for corporations and the foreign tax credit.
Qualified Dividend Income. For the fiscal year ended September 30, 2020, the Funds designate approximately the following amounts, or up to the maximum amount of such dividends allowable pursuant to the Internal Revenue Code, as qualified dividend income eligible for the reduced tax rate of 15%:
| Global Energy Solutions | $1,204,077 |
| Global Water | $5,698,592 |
Dividends Received Deduction. Corporate shareholders are generally entitled to take the dividends received deduction on the portion of each Fund's dividend distribution that qualifies under tax law. For each Fund's fiscal 2020 ordinary income dividends, the following qualifies for the corporate dividends received deduction:
| Global Energy Solutions | 27.29% |
| Global Water | 51.67% |
Foreign Tax Credit. For the fiscal year ended September 30, 2020, the Funds paid foreign taxes and recognized foreign source income as follows:
| | Foreign Taxes | | Foreign Source Income |
| Global Energy Solutions | $113,617 | | $1,271,775 |
| Global Water | $439,314 | | $5,309,319 |
Calvert
Global Energy Solutions Fund
Global Water Fund
September 30, 2020
Liquidity Risk Management Program
The Fund has implemented a written liquidity risk management program (Program) and related procedures to manage its liquidity in accordance with Rule 22e-4 under the Investment Company Act of 1940, as amended (Liquidity Rule). The Liquidity Rule defines “liquidity risk” as the risk that a fund could not meet requests to redeem shares issued by the fund without significant dilution of the remaining investors’ interests in the fund. The Fund’s Board of Trustees/Directors has designated the investment adviser to serve as the administrator of the Program and the related procedures. The administrator has established a Liquidity Risk Management Oversight Committee (Committee) to perform the functions necessary to administer the Program. As part of the Program, the administrator is responsible for identifying illiquid investments and categorizing the relative liquidity of the Fund’s investments in accordance with the Liquidity Rule. Under the Program, the administrator assesses, manages, and periodically reviews the Fund’s liquidity risk, and is responsible for making certain reports to the Fund’s Board of Trustees/Directors and the Securities and Exchange Commission (SEC) regarding the liquidity of the Fund’s investments, and to notify the Board of Trustees/Directors and the SEC of certain liquidity events specified in the Liquidity Rule. The liquidity of the Fund’s portfolio investments is determined based on a number of factors including, but not limited to, relevant market, trading and investment-specific considerations under the Program.
At a meeting of the Fund’s Board of Trustees/Directors, the Committee provided a written report to the Fund’s Board of Trustees/Directors pertaining to the operation, adequacy, and effectiveness of implementation of the Program, as well as the operation of the highly liquid investment minimum (if applicable) for the period December 1, 2018 through December 31, 2019 (Review Period). The Program operated effectively during the Review Period, supporting the administrator’s ability to assess, manage and monitor Fund liquidity risk, including during periods of market volatility and net redemptions. During the Review Period, the Fund met redemption requests on a timely basis.
There can be no assurance that the Program will achieve its objectives in the future. Please refer to the Fund’s prospectus for more information regarding the Fund’s exposure to liquidity risk and other principal risks to which an investment in the Fund may be subject.
Calvert
Global Energy Solutions Fund
Global Water Fund
September 30, 2020
Management and Organization
Fund Management. The Directors of Calvert Impact Fund, Inc. (the Corporation) are responsible for the overall management and supervision of the Corporation’s affairs. The Directors and officers of the Corporation are listed below. Except as indicated, each individual has held the office shown or other offices in the same company for the last five years. Directors and officers of the Corporation hold indefinite terms of office. The “Independent Directors” consist of those Directors who are not “interested persons” of the Corporation, as that term is defined under the 1940 Act. The business address of each Director and officer, with the exception of Ms. Gemma and Mr. Kirchner, is 1825 Connecticut Avenue NW, Suite 400, Washington, DC 20009. As used below, “CRM” refers to Calvert Research and Management. Each Director oversees 39 funds in the Calvert fund complex. Each officer serves as an officer of certain other Calvert funds.
| Name and Year of Birth | Corporation
Position(s) | Position
Start Date | Principal Occupation(s) and Other Directorships
During Past Five Years and Other Relevant Experience | |
| Interested Director | |
John H. Streur(1)
1960 | Director &
President | 2015 | President and Chief Executive Officer of Calvert Research and
Management (since December 31, 2016). President and Chief Executive
Officer of Calvert Investments, Inc. (January 2015 - December 2016);
Chief Executive Officer of Calvert Investment Distributors, Inc. (August
2015 - December 2016); Chief Compliance Officer of Calvert Investment
Management, Inc. (August 2015 - April 2016); President and Director, Portfolio 21 Investments, Inc. (through October 2014); President,
Chief Executive Officer and Director, Managers Investment Group LLC
(through January 2012); President and Director, The Managers Funds
and Managers AMG Funds (through January 2012).
Other Directorships in the Last Five Years. Portfolio 21 Investments,
Inc. (asset management) (through October 2014); Managers Investment
Group LLC (asset management) (through January 2012); The Managers
Funds (asset management) (through January 2012); Managers AMG Funds
(asset management) (through January 2012); Calvert Impact Capital, Inc. | |
| Independent Directors | |
Richard L. Baird, Jr.
1948 | Director | 2005 | Regional Disaster Recovery Lead, American Red Cross of Greater
Pennsylvania (since 2017). Volunteer, American Red Cross (since 2015).
Former President and CEO of Adagio Health Inc. (retired in 2014) in
Pittsburgh, PA.
Other Directorships in the Last Five Years. None. | |
Alice Gresham Bullock
1950 | Chair &
Director | 2016 | Professor Emerita at Howard University School of Law. Dean Emerita of
Howard University School of Law and Deputy Director of the Association
of American Law Schools (1992-1994).
Other Directorships in the Last Five Years. None. | |
Cari M. Dominguez
1949 | Director | 2016 | Former Chair of the U.S. Equal Employment Opportunity Commission.
Other Directorships in the Last Five Years. Manpower, Inc. (employment
agency); Triple S Management Corporation (managed care); National
Association of Corporate Directors. | |
John G. Guffey, Jr.(2)
1948 | Director | 2005 | President of Aurora Press Inc., a privately held publisher of trade
paperbacks (since January 1997).
Other Directorships in the Last Five Years. Calvert Impact Capital, Inc.
(through December 31, 2018); Calvert Ventures, LLC. | |
Miles D. Harper, III
1962 | Director | 2000 | Partner, Carr Riggs & Ingram (public accounting firm) since October 2014.
Partner, Gainer Donnelly & Desroches (public accounting firm) (now Carr
Riggs & Ingram), (November 1999-September 2014).
Other Directorships in the Last Five Years. Bridgeway Funds (9) (asset
management). | |
Joy V. Jones
1950 | Director | 2000 | Attorney.
Other Directorships in the Last Five Years. Conduit Street Restaurants
SUD 2 Limited; Palm Management Restaurant Corporation. | |
Calvert
Global Energy Solutions Fund
Global Water Fund
September 30, 2020
Management and Organization — continued
| Name and Year of Birth | Corporation
Position(s) | Position
Start Date | Principal Occupation(s) and Other Directorships
During Past Five Years and Other Relevant Experience | |
| Independent Directors (continued) |
Anthony A. Williams
1951 | Director | 2016 | CEO and Executive Director of the Federal City Council (July 2012 to
present); Senior Adviser and Independent Consultant for King and
Spalding LLP (September 2015 to present); Executive Director of Global
Government Practice at the Corporate Executive Board (January 2010 to
January 2012).
Other Directorships in the Last Five Years. Freddie Mac; Evoq
Properties/Meruelo Maddux Properties, Inc. (real estate management);
Weston Solutions, Inc. (environmental services); Bipartisan Policy Center’s
Debt Reduction Task Force; Chesapeake Bay Foundation; Catholic
University of America; Urban Institute (research organization). | |
| Name and Year of Birth | Corporation
Position(s) | Position
Start Date | Principal Occupation(s)
During Past Five Years | |
| Principal Officers who are not Directors | |
Hope L. Brown
1973 | Chief
Compliance
Officer | 2014 | Chief Compliance Officer of 39 registered investment companies advised
by CRM (since 2014). Vice President and Chief Compliance Officer,
Wilmington Funds (2012-2014). | |
Maureen A. Gemma(3)
1960 | Secretary,
Vice President
and Chief
Legal Officer | 2016 | Vice President of CRM and officer of 39 registered investment
companies advised by CRM (since 2016). Also Vice President of
Eaton Vance and certain of its affiliates and officer of 156 registered
investment companies advised or administered by Eaton Vance. | |
James F. Kirchner(3)
1967 | Treasurer | 2016 | Vice President of CRM and officer of 39 registered investment companies
advised by CRM (since 2016). Also Vice President of Eaton Vance and
certain of its affiliates and officer of 156 registered investment companies
advised or administered by Eaton Vance. | |
| (1) Mr. Streur is an interested person of the Fund because of his positions with the Fund’s adviser and certain affiliates. | |
| (2) Mr. Guffey is currently married to Rebecca L. Adamson, who served as a member of the Advisory Council through December 31, 2019. | |
| (3) The business address for Ms. Gemma and Mr. Kirchner is Two International Place, Boston, MA 02110. | |
The SAI for the Funds includes additional information about the Directors and officers of the Funds and can be obtained without charge on Calvert’s website at www.calvert.com or by calling 1-800-368-2745.
Privacy. The Eaton Vance organization is committed to ensuring your financial privacy. Each entity listed below has adopted a privacy policy and procedures (“Privacy Program”) Eaton Vance believes is reasonably designed to protect your personal information and to govern when and with whom Eaton Vance may share your personal information.
| • | At the time of opening an account, Eaton Vance generally requires you to provide us with certain information such as name, address, social security number, tax status, account numbers, and account balances. This information is necessary for us to both open an account for you and to allow us to satisfy legal requirements such as applicable anti-money laundering reviews and know-your-customer requirements. |
| • | On an ongoing basis, in the normal course of servicing your account, Eaton Vance may share your information with unaffiliated third parties that perform various services for Eaton Vance and/or your account. These third parties include transfer agents, custodians, broker/dealers and our professional advisers, including auditors, accountants, and legal counsel. Eaton Vance may additionally share your personal information with our affiliates. |
| • | We believe our Privacy Program is reasonably designed to protect the confidentiality of your personal information and to prevent unauthorized access to that information. |
| • | We reserve the right to change our Privacy Program at any time upon proper notification to you. You may want to review our Privacy Program periodically for changes by accessing the link on our homepage: www.calvert.com. |
Our pledge of protecting your personal information applies to the following entities within the Eaton Vance organization: the Eaton Vance Family of Funds, Eaton Vance Management, Eaton Vance Investment Counsel, Eaton Vance Distributors, Inc., Eaton Vance Trust Company, Eaton Vance Management (International) Limited, Eaton Vance Advisers International Ltd., Eaton Vance Global Advisors Limited, Eaton Vance Management's Real Estate Investment Group, Boston Management and Research, Calvert Research and Management, and Calvert Funds. This Privacy Notice supersedes all previously issued privacy disclosures. For more information about our Privacy Program or about how your personal information may be used, please call 1-800-368-2745.
Delivery of Shareholder Documents. The Securities and Exchange Commission (SEC) permits funds to deliver only one copy of shareholder documents, including prospectuses, proxy statements and shareholder reports, to fund investors with multiple accounts at the same residential or post office box address. This practice is often called “householding” and it helps eliminate duplicate mailings to shareholders. Calvert funds, or your financial intermediary, may household the mailing of your documents indefinitely unless you instruct Calvert funds, or your financial intermediary, otherwise. If you would prefer that your Calvert fund documents not be householded, please contact Calvert funds at 1-800-368-2745, or contact your financial intermediary. Your instructions that householding not apply to delivery of your Calvert fund documents will typically be effective within 30 days of receipt by Calvert funds or your financial intermediary. Separate statements will be generated for each separate account and will be householded as described above.
Portfolio Holdings. Each Calvert fund files a schedule of portfolio holdings on Part F to Form N-PORT with the SEC. Certain information filed on Form N-PORT may be viewed on the Calvert website at www.calvert.com, by calling Calvert at 1-800-368-2745 or in the EDGAR database on the SEC’s website at www.sec.gov.
Proxy Voting. The Proxy Voting Guidelines that each Calvert fund uses to determine how to vote proxies relating to portfolio securities is provided as an Appendix to the fund’s Statement of Additional Information. The Statement of Additional Information can be obtained free of charge by calling the Calvert funds at 1-800-368-2745, by visiting the Calvert funds’ website at www.calvert.com or visiting the SEC’s website at www.sec.gov. Information regarding how a Calvert fund voted proxies relating to portfolio securities during the most recent 12-month period ended June 30 is available by calling Calvert funds, by visiting the Calvert funds’ website at www.calvert.com or by visiting the SEC’s website at www.sec.gov.
This Page Intentionally Left Blank
This Page Intentionally Left Blank
This Page Intentionally Left Blank
Investment Adviser and Administrator
Calvert Research and Management
1825 Connecticut Avenue NW, Suite 400
Washington, DC 20009
Principal Underwriter*
Eaton Vance Distributors, Inc.
Two International Place
Boston, MA 02110
(617) 482-8260
Custodian
State Street Bank and Trust Company
State Street Financial Center, One Lincoln Street
Boston, MA 02111
Transfer Agent
DST Asset Manager Solutions, Inc.
2000 Crown Colony Drive
Quincy, MA 02169
Independent Registered Public Accounting Firm
KPMG LLP
1601 Market Street
Philadelphia, PA 19103-2499
Fund Offices
1825 Connecticut Avenue NW, Suite 400
Washington, DC 20009
* FINRA BrokerCheck. Investors may check the background of their Investment Professional by contacting the Financial Industry Regulatory Authority (FINRA). FINRA BrokerCheck is a free tool to help investors check the professional background of current and former FINRA-registered securities firms and brokers. FINRA BrokerCheck is available by calling 1-800-289-9999 and at www.FINRA.org. The FINRA BrokerCheck brochure describing this program is available to investors at www.FINRA.org.
Printed on recycled paper.
Calvert
Small-Cap Fund
Annual Report
September 30, 2020
Important Note. Beginning on January 1, 2021, as permitted by regulations adopted by the Securities and Exchange Commission, paper copies of the Fund’s annual and semi-annual shareholder reports will no longer be sent by mail unless you specifically request paper copies of the reports. Instead, the reports will be made available on the Fund’s website (calvert.com/prospectus), and you will be notified by mail each time a report is posted and provided with a website address to access the report.
If you already elected to receive shareholder reports electronically, you will not be affected by this change and you need not take any action. If you are a direct investor, you may elect to receive shareholder reports and other communications from the Fund electronically by signing up for e-Delivery at calvert.com. If you own your shares through a financial intermediary (such as a broker-dealer or bank), you must contact your financial intermediary to sign up.
You may elect to receive all future Fund shareholder reports in paper free of charge. If you are a direct investor, you can inform the Fund that you wish to continue receiving paper copies of your shareholder reports by calling 1-800-368-2745. If you own these shares through a financial intermediary, you must contact your financial intermediary or follow instructions included with this disclosure, if applicable, to elect to continue to receive paper copies of your shareholder reports. Your election to receive reports in paper will apply to all Calvert funds held directly or to all funds held through your financial intermediary, as applicable.
E-Delivery Sign-Up - Details Inside
Commodity Futures Trading Commission Registration. Effective December 31, 2012, the Commodity Futures Trading Commission (“CFTC”) adopted certain regulatory changes that subject registered investment companies and advisers to regulation by the CFTC if a fund invests more than a prescribed level of its assets in certain CFTC-regulated instruments (including futures, certain options and swap agreements) or markets itself as providing investment exposure to such instruments. The adviser has claimed an exclusion from the definition of “commodity pool operator” under the Commodity Exchange Act with respect to its management of the Fund and the other funds it manages. Accordingly, neither the Fund nor the adviser is subject to CFTC regulation.
Fund shares are not insured by the FDIC and are not deposits or other obligations of, or guaranteed by, any depository institution. Shares are subject to investment risks, including possible loss of principal invested.
This report must be preceded or accompanied by a current summary prospectus or prospectus. Before investing, investors should consider carefully the investment objective, risks, and charges and expenses of a mutual fund. This and other important information is contained in the summary prospectus and prospectus, which can be obtained from a financial intermediary. Prospective investors should read the prospectus carefully before investing. For further information, please call 1-800-368-2745.
Choose Planet-friendly E-delivery!
Sign up now for on-line statements, prospectuses, and fund reports. In less than five minutes you can help reduce paper mail and lower fund costs.
Just go to www.calvert.com. If you already have an online account with the Calvert funds, click on Login to access your Account and select the documents you would like to receive via e-mail.
If you’re new to online account access, click on Login, then Register to create your user name and password. Once you’re in, click on the E-delivery sign-up on the Account Portfolio page and follow the quick, easy steps.
Note: If your shares are not held directly with the Calvert funds but through a brokerage firm, you must contact your broker for electronic delivery options available through their firm.
Annual Report September 30, 2020
Calvert
Small-Cap Fund
Calvert
Small-Cap Fund
September 30, 2020
Management's Discussion of Fund Performance†
Economic and Market Conditions
The 12-month period that began October 1, 2019, included some of the best and worst U.S. equity performances in over a decade.
The period began with stocks rallying in the closing months of 2019, supported by better-than-expected U.S. employment reports, cautious optimism about a détente in U.S.-China trade relations, and interest rate reductions by the U.S. Federal Reserve (the Fed). In July 2019, the Fed cut rates for the first time in over a decade, followed by two additional rate cuts in September and October.
In January 2020, however, news of the novel coronavirus outbreak in China began to raise investor concerns. As the virus turned into a global pandemic in February and March, it ended the longest-ever U.S. economic expansion and brought about a global economic slowdown. Equity markets along with credit markets declined in value amid unprecedented volatility.
In response, the Fed announced two emergency rate cuts in March 2020 — lowering the federal funds rate to 0.00%-0.25% — along with other measures designed to shore up equity and credit markets. At its July meeting, the Fed provided additional reassurances that it would maintain rates around zero for the foreseeable future and use all the tools at its disposal to support the U.S. economy.
These moves helped calm the markets and initiated a new equity rally that began in April and lasted through most of the summer. As consumers started to emerge from coronavirus lockdowns and factories gradually resumed production, stock prices reflected investor optimism. In the second quarter of 2020, U.S. stocks reported their best quarterly returns since 1998 — on the heels of the worst first quarter for American stocks since the 2007-2008 global financial crisis.
In September 2020, however, the equity rally stalled, as stock prices on Wall Street began to reflect the reality on Main Street. In the final weeks of the period, coronavirus cases were on the rise in more than 30 states. Of the 22 million U.S. jobs lost in the early months of the pandemic, only 11 million jobs had returned, and 26.5 million Americans were collecting unemployment benefits. Reflecting concerns about the economic outlook for fall and winter, most U.S. stock indexes reported negative returns for the final month of the period.
For the period as a whole, largely positive equity returns belied the dramatic volatility during the period. The S&P 500® Index, a broad measure of U.S. stocks, returned 15.15%; the blue-chip Dow Jones Industrial Average® returned 5.70%; and the technology-laden Nasdaq Composite Index returned 40.96%. Large-cap U.S. stocks, as measured by the S&P 500® Index and Russell 1000® Index, generally outperformed their small-cap counterparts, as measured by the Russell 2000® Index. As a group, growth stocks significantly outpaced value stocks, which were in negative territory in both large- and small-cap categories, as measured by the Russell growth and value indexes.
Fund Performance
For the 12-month period ended September 30, 2020, Calvert Small-Cap Fund (the Fund) returned -4.38% for Class A shares at net asset value, underperforming the Fund’s benchmark, the Russell 2000® Index (the Index), which returned 0.39%.
Stock selection overall was the largest detractor from performance relative to the Index. Selections in industrials, information technology, health care, and consumer discretionary weighed most on relative performance. The Fund’s sector allocation contributed to relative returns, with an underweight exposure to the energy sector and a lack of exposure to the communication services sector being particularly beneficial. While stock selection overall detracted,selections in real estate and financials contributed positively.
Two of the three largest detractors from performance relative to the Index were in the industrials sector — Hexcel Corp. (Hexcel) and Woodward, Inc. (Woodward). The third, Haemonetics Corp. (Haemonetics), was in health care.
Hexcel is a leading provider of carbon fiber and other materials for the aerospace industry. Hexcel’s stock price, already hurt by problems with Boeing’s 737 MAX, was further weakened by the spread of the COVID-19 pandemic and the resulting slowdown in airline travel. Investors also reacted negatively to Hexcel’s proposed merger with Woodward, a supplier of flight and engine controls to the aerospace industry, which detracted from returns relative to the Index as airline travel plummeted as a result of the pandemic. COVID-19 also had a negative impact on Haemonetics, a maker of blood and plasma collection systems, as blood and plasma donations dropped off because of the pandemic.
The three strongest contributors to Fund performance were in the health care sector.
Emergent BioSolutions, Inc. (Emergent), a leading supplier of vaccines and antibodies, was a top contributor. Most of the company’s revenues came from long-term government contracts, which made Emergent particularly attractive amid volatility during the period. It also benefited from the U.S. government’s heavy investment in the search for a COVID-19 vaccine as it signed several large contracts with pharmaceutical companies to manufacture their vaccines.
Catalent, Inc. (Catalent) is a contract manufacturer of biologics, a class of drugs that includes vaccines and antibodies, and a maker of technologies for drug delivery. Catalent’s stock price increased with the onset of COVID-19. By period-end, the stock was sold from the Fund because its strong performance increased Catalent’s market capitalization beyond that of the small capitalization category.
The stock of R1 RCM, Inc., a provider of revenue cycle management for hospitals, health care systems and physicians’ groups, rose after acquiring new business during the period.
See Endnotes and Additional Disclosures in this report.
Past performance is no guarantee of future results. Returns are historical and are calculated by determining the percentage change in net asset value (NAV) or offering price (as applicable) with all distributions reinvested. Investment return and principal value will fluctuate so that shares, when redeemed, may be worth more or less than their original cost. Performance for periods less than or equal to one year is cumulative. Performance is for the stated time period only; due to market volatility, current Fund performance may be lower or higher than the quoted return. For performance as of the most recent month-end, please refer to www.calvert.com.
Calvert
Small-Cap Fund
September 30, 2020
Performance
Portfolio Managers Michael D. McLean, CFA and J. Griffith Noble, CFA, each of Calvert Research and Management
| % Average Annual Total Returns1,2 | Class
Inception Date | Performance
Inception Date | One Year | Five Years | Ten Years |
| Class A at NAV | 10/01/2004 | 10/01/2004 | (4.38)% | 8.00% | 10.65% |
| Class A with 4.75% Maximum Sales Charge | — | — | (8.91) | 6.96 | 10.11 |
| Class C at NAV | 04/01/2005 | 10/01/2004 | (5.10) | 7.20 | 9.76 |
| Class C with 1% Maximum Sales Charge | — | — | (6.03) | 7.20 | 9.76 |
| Class I at NAV | 04/29/2005 | 10/01/2004 | (4.12) | 8.39 | 11.22 |
| Class R6 at NAV | 02/01/2019 | 10/01/2004 | (4.07) | 8.41 | 11.23 |
|
| Russell 2000® Index | — | — | 0.39% | 7.99% | 9.84% |
| % Total Annual Operating Expense Ratios3 | Class A | Class C | Class I | Class R6 |
| Gross | 1.25% | 2.01% | 1.00% | 0.94% |
| Net | 1.21 | 1.96 | 0.96 | 0.90 |
Growth of $10,000
This graph shows the change in value of a hypothetical investment of $10,000 in Class A of the Fund for the period indicated. For comparison, the same investment is shown in the indicated index.
| Growth of Investment2 | Amount Invested | Period Beginning | At NAV | With Maximum Sales Charge |
| Class C | $10,000 | 09/30/2010 | $25,388 | N.A. |
| Class I | $250,000 | 09/30/2010 | $724,490 | N.A. |
| Class R6 | $1,000,000 | 09/30/2010 | $2,900,609 | N.A. |
See Endnotes and Additional Disclosures in this report.
Past performance is no guarantee of future results. Returns are historical and are calculated by determining the percentage change in net asset value (NAV) or offering price (as applicable) with all distributions reinvested. Investment return and principal value will fluctuate so that shares, when redeemed, may be worth more or less than their original cost. Performance for periods less than or equal to one year is cumulative. Performance is for the stated time period only; due to market volatility, current Fund performance may be lower or higher than the quoted return. For performance as of the most recent month-end, please refer to www.calvert.com.
Calvert
Small-Cap Fund
September 30, 2020
Sector Allocation (% of net assets)*
* Excludes cash and cash equivalents.
| Top 10 Holdings (% of net assets)* | |
| National Vision Holdings, Inc. | 2.6% |
| ServiceMaster Global Holdings, Inc. | 2.5 |
| LHC Group, Inc. | 2.5 |
| Nomad Foods, Ltd. | 2.4 |
| RealPage, Inc. | 2.4 |
| ACI Worldwide, Inc. | 2.4 |
| Mueller Water Products, Inc., Class A | 2.3 |
| Altair Engineering, Inc., Class A | 2.2 |
| R1 RCM, Inc. | 2.2 |
| Envestnet, Inc. | 2.1 |
| Total | 23.6% |
| * | Excludes cash and cash equivalents. |
See Endnotes and Additional Disclosures in this report.
Calvert
Small-Cap Fund
September 30, 2020
Endnotes and Additional Disclosures
| † | The views expressed in this report are those of the portfolio manager(s) and are current only through the date stated at the top of this page. These views are subject to change at any time based upon market or other conditions, and Calvert and the Fund(s) disclaim any responsibility to update such views. These views may not be relied upon as investment advice and, because investment decisions are based on many factors, may not be relied upon as an indication of trading intent on behalf of any Calvert fund. This commentary may contain statements that are not historical facts, referred to as “forward-looking statements.” The Fund’s actual future results may differ significantly from those stated in any forward-looking statement, depending on factors such as changes in securities or financial markets or general economic conditions, the volume of sales and purchases of Fund shares, the continuation of investment advisory, administrative and service contracts, and other risks discussed from time to time in the Fund’s filings with the Securities and Exchange Commission. |
| | |
| 1 | Russell 2000® Index is an unmanaged index of 2,000 U.S. small-cap stocks. Unless otherwise stated, index returns do not reflect the effect of any applicable sales charges, commissions, expenses, taxes or leverage, as applicable. It is not possible to invest directly in an index. |
| 2 | Total Returns at NAV do not include applicable sales charges. If sales charges were deducted, the returns would be lower. Total Returns shown with maximum sales charge reflect the stated maximum sales charge. Unless otherwise stated, performance does not reflect the deduction of taxes on Fund distributions or redemptions of Fund shares.Performance prior to the inception date of a class may be linked to the performance of an older class of the Fund. This linked performance is adjusted for any applicable sales charge, but is not adjusted for class expense differences. If adjusted for such differences, the performance would be different. The performance of Class R6 is linked to Class I. Performance presented in the Financial Highlights included in the financial statements is not linked.Calvert Research and Management became the investment adviser to the Fund on December 31, 2016. Performance reflected prior to such date is that of the Fund’s former investment adviser. |
| 3 | Source: Fund prospectus. Net expense ratios reflect a contractual expense reimbursement that continues through 1/31/21. Without the reimbursement, performance would have been lower. The expense ratios for the current reporting period can be found in the Financial Highlights section of this report. |
| | Fund profile subject to change due to active management. |
Additional Information
S&P 500® Index is an unmanaged index of large-cap stocks commonly used as a measure of U.S. stock market performance. Dow Jones Industrial Average® is a price-weighted average of 30 blue-chip stocks that are generally the leaders in their industry. S&P Dow Jones Indices are a product of S&P Dow Jones Indices LLC (“S&P DJI”) and have been licensed for use. S&P® and S&P 500® are registered trademarks of S&P DJI; Dow Jones® is a registered trademark of Dow Jones Trademark Holdings LLC (“Dow Jones”); S&P DJI, Dow Jones and their respective affiliates do not sponsor, endorse, sell or promote the Fund, will not have any liability with respect thereto and do not have any liability for any errors, omissions, or interruptions of the S&P Dow Jones Indices. Nasdaq Composite Index is a market capitalization-weighted index of all domestic and international securities listed on Nasdaq. Source: Nasdaq, Inc. The information is provided by Nasdaq (with its affiliates, are referred to as the “Corporations”) and Nasdaq’s third party licensors on an “as is” basis and the Corporations make no guarantees and bear no liability of any kind with respect to the information or the Fund. Russell 1000® Index is an unmanaged index of 1,000 U.S. large-cap stocks.
Calvert
Small-Cap Fund
September 30, 2020
Example
As a Fund shareholder, you incur two types of costs: (1) transaction costs, including sales charges (loads) on purchases and redemption fees (if applicable); and (2) ongoing costs, including management fees; distribution and/or service fees; and other Fund expenses. This Example is intended to help you understand your ongoing costs (in dollars) of Fund investing and to compare these costs with the ongoing costs of investing in other mutual funds. The Example is based on an investment of $1,000 invested at the beginning of the period and held for the entire period (April 1, 2020 to September 30, 2020).
Actual Expenses
The first section of the table below provides information about actual account values and actual expenses. You may use the information in this section, together with the amount you invested, to estimate the expenses that you paid over the period. Simply divide your account value by $1,000 (for example, an $8,600 account value divided by $1,000 = 8.6), then multiply the result by the number in the first section under the heading entitled “Expenses Paid During Period” to estimate the expenses you paid on your account during this period.
Hypothetical Example for Comparison Purposes
The second section of the table below provides information about hypothetical account values and hypothetical expenses based on the actual Fund expense ratio and an assumed rate of return of 5% per year (before expenses), which is not the actual Fund return. The hypothetical account values and expenses may not be used to estimate the actual ending account balance or expenses you paid for the period. You may use this information to compare the ongoing costs of investing in the Fund and other funds. To do so, compare this 5% hypothetical example with the 5% hypothetical examples that appear in the shareholder reports of the other funds.
Please note that the expenses shown in the table are meant to highlight your ongoing costs only and do not reflect any transactional costs, such as sales charges (loads) or redemption fees (if applicable). Therefore, the second section of the table is useful in comparing ongoing costs only, and will not help you determine the relative total costs of owning different funds. In addition, if these transactional costs were included, your costs would be higher.
| | Beginning
Account Value
(4/1/20) | Ending
Account Value
(9/30/20) | Expenses Paid
During Period*
(4/1/20 – 9/30/20) | Annualized
Expense
Ratio |
| Actual | | | | |
| Class A | $1,000.00 | $1,212.20 | $ 6.69** | 1.21% |
| Class C | $1,000.00 | $1,208.00 | $10.82 ** | 1.96% |
| Class I | $1,000.00 | $1,213.80 | $ 5.31** | 0.96% |
| Class R6 | $1,000.00 | $1,214.30 | $ 4.98** | 0.90% |
| Hypothetical | | | | |
| (5% return per year before expenses) | | | | |
| Class A | $1,000.00 | $1,018.95 | $ 6.11** | 1.21% |
| Class C | $1,000.00 | $1,015.20 | $ 9.87** | 1.96% |
| Class I | $1,000.00 | $1,020.20 | $ 4.85** | 0.96% |
| Class R6 | $1,000.00 | $1,020.50 | $ 4.55** | 0.90% |
| * | Expenses are equal to the Fund's annualized expense ratio for the indicated Class, multiplied by the average account value over the period, multiplied by 183/366 (to reflect the one-half year period). The Example assumes that the $1,000 was invested at the net asset value per share determined at the close of business on March 31, 2020. |
| ** | Absent a waiver and/or reimbursement of expenses by an affiliate, expenses would be higher. |
Calvert
Small-Cap Fund
September 30, 2020
| Security | Shares | Value |
| Aerospace & Defense — 3.3% | |
| Hexcel Corp. | | 537,138 | $ 18,020,980 |
| Mercury Systems, Inc.(1) | | 386,742 | 29,957,035 |
| | | | $ 47,978,015 |
| Auto Components — 3.8% | |
| Dana, Inc. | | 1,513,174 | $ 18,642,304 |
| Dorman Products, Inc.(1) | | 251,644 | 22,743,585 |
| Visteon Corp.(1) | | 203,388 | 14,078,517 |
| | | | $ 55,464,406 |
| Banks — 7.0% | |
| City Holding Co. | | 56,178 | $ 3,236,415 |
| Commerce Bancshares, Inc. | | 284,995 | 16,042,369 |
| Community Bank System, Inc. | | 345,848 | 18,834,882 |
| First Citizens Bancshares, Inc., Class A | | 47,103 | 15,015,494 |
| Glacier Bancorp, Inc. | | 479,376 | 15,364,001 |
| Independent Bank Corp. | | 198,584 | 10,401,830 |
| Stock Yards Bancorp, Inc. | | 180,745 | 6,152,560 |
| Westamerica BanCorp. | | 310,413 | 16,870,946 |
| | | | $ 101,918,497 |
| Biotechnology — 2.9% | |
| Emergent BioSolutions, Inc.(1) | | 249,771 | $ 25,808,838 |
| Ligand Pharmaceuticals, Inc.(1)(2) | | 173,860 | 16,572,335 |
| | | | $ 42,381,173 |
| Building Products — 2.4% | |
| AZEK Co., Inc. (The)(1) | | 552,262 | $ 19,224,240 |
| CSW Industrials, Inc. | | 195,899 | 15,133,198 |
| | | | $ 34,357,438 |
| Capital Markets — 0.5% | |
| Cohen & Steers, Inc. | | 135,545 | $ 7,555,278 |
| | | | $ 7,555,278 |
| Chemicals — 3.3% | |
| Minerals Technologies, Inc. | | 570,266 | $ 29,140,593 |
| Sensient Technologies Corp. | | 328,994 | 18,996,113 |
| | | | $ 48,136,706 |
| Commercial Services & Supplies — 1.7% | |
| Herman Miller, Inc. | | 423,343 | $ 12,768,025 |
| Kimball International, Inc., Class B | | 330,725 | 3,485,842 |
| Security | Shares | Value |
| Commercial Services & Supplies (continued) | |
| UniFirst Corp. | | 43,212 | $ 8,183,056 |
| | | | $ 24,436,923 |
| Diversified Consumer Services — 2.5% | |
| ServiceMaster Global Holdings, Inc.(1) | | 928,934 | $ 37,045,888 |
| | | | $ 37,045,888 |
| Energy Equipment & Services — 0.5% | |
| Core Laboratories NV | | 441,061 | $ 6,730,591 |
| | | | $ 6,730,591 |
| Equity Real Estate Investment Trusts (REITs) — 8.7% | |
| CubeSmart | | 883,129 | $ 28,533,898 |
| EastGroup Properties, Inc. | | 207,136 | 26,788,899 |
| Healthcare Realty Trust, Inc. | | 836,459 | 25,194,145 |
| Rexford Industrial Realty, Inc. | | 529,934 | 24,249,780 |
| STORE Capital Corp. | | 823,446 | 22,587,124 |
| | | | $ 127,353,846 |
| Food & Staples Retailing — 0.9% | |
| Performance Food Group Co.(1) | | 357,969 | $ 12,392,887 |
| | | | $ 12,392,887 |
| Food Products — 4.3% | |
| Flowers Foods, Inc. | | 646,178 | $ 15,721,511 |
| Lancaster Colony Corp. | | 66,115 | 11,821,362 |
| Nomad Foods, Ltd.(1) | | 1,399,091 | 35,648,838 |
| | | | $ 63,191,711 |
| Gas Utilities — 1.8% | |
| ONE Gas, Inc. | | 388,052 | $ 26,779,469 |
| | | | $ 26,779,469 |
| Health Care Equipment & Supplies — 7.2% | |
| Envista Holdings Corp.(1) | | 561,193 | $ 13,850,243 |
| Haemonetics Corp.(1) | | 347,433 | 30,313,529 |
| ICU Medical, Inc.(1) | | 159,888 | 29,221,131 |
| Integra LifeSciences Holdings Corp.(1) | | 454,457 | 21,459,460 |
| Tandem Diabetes Care, Inc.(1) | | 89,018 | 10,103,543 |
| | | | $ 104,947,906 |
| Health Care Providers & Services — 7.7% | |
| Addus HomeCare Corp.(1) | | 252,373 | $ 23,851,772 |
| Chemed Corp. | | 41,304 | 19,840,377 |
| LHC Group, Inc.(1) | | 171,843 | 36,526,948 |
7
See Notes to Financial Statements.
Calvert
Small-Cap Fund
September 30, 2020
Schedule of Investments — continued
| Security | Shares | Value |
| Health Care Providers & Services (continued) | |
| R1 RCM, Inc.(1) | | 1,858,587 | $ 31,874,767 |
| | | | $ 112,093,864 |
| Health Care Technology — 0.9% | |
| Phreesia, Inc.(1) | | 410,667 | $ 13,194,731 |
| | | | $ 13,194,731 |
| Hotels, Restaurants & Leisure — 0.5% | |
| Choice Hotels International, Inc. | | ��� 85,274 | $ 7,330,153 |
| | | | $ 7,330,153 |
| Insurance — 6.3% | |
| AMERISAFE, Inc. | | 250,204 | $ 14,351,701 |
| First American Financial Corp. | | 243,145 | 12,378,512 |
| Horace Mann Educators Corp. | | 629,325 | 21,019,455 |
| RLI Corp. | | 195,322 | 16,354,311 |
| Selective Insurance Group, Inc. | | 527,214 | 27,146,249 |
| | | | $ 91,250,228 |
| IT Services — 1.9% | |
| NIC, Inc. | | 1,390,592 | $ 27,394,662 |
| | | | $ 27,394,662 |
| Leisure Products — 1.4% | |
| Brunswick Corp. | | 358,092 | $ 21,095,200 |
| | | | $ 21,095,200 |
| Machinery — 5.0% | |
| Middleby Corp.(1) | | 154,333 | $ 13,845,213 |
| Mueller Water Products, Inc., Class A | | 3,291,386 | 34,197,501 |
| RBC Bearings, Inc.(1) | | 93,916 | 11,383,558 |
| Woodward, Inc. | | 167,522 | 13,428,564 |
| | | | $ 72,854,836 |
| Professional Services — 1.8% | |
| CBIZ, Inc.(1) | | 1,160,412 | $ 26,538,622 |
| | | | $ 26,538,622 |
| Road & Rail — 1.9% | |
| Landstar System, Inc. | | 223,843 | $ 28,090,058 |
| | | | $ 28,090,058 |
| Semiconductors & Semiconductor Equipment — 1.4% | |
| Ambarella, Inc.(1) | | 65,403 | $ 3,412,728 |
| Silicon Laboratories, Inc.(1) | | 169,394 | 16,575,203 |
| | | | $ 19,987,931 |
| Security | Shares | Value |
| Software — 11.0% | |
| ACI Worldwide, Inc.(1) | | 1,324,063 | $ 34,597,766 |
| Altair Engineering, Inc., Class A(1) | | 761,271 | 31,958,157 |
| CDK Global, Inc. | | 535,985 | 23,363,586 |
| Envestnet, Inc.(1) | | 395,975 | 30,553,431 |
| nCino, Inc.(1)(2) | | 53,431 | 4,257,382 |
| RealPage, Inc.(1) | | 611,895 | 35,269,628 |
| | | | $ 159,999,950 |
| Specialty Retail — 4.5% | |
| Asbury Automotive Group, Inc.(1) | | 72,022 | $ 7,018,544 |
| Lithia Motors, Inc., Class A | | 95,212 | 21,702,623 |
| National Vision Holdings, Inc.(1) | | 972,867 | 37,202,434 |
| | | | $ 65,923,601 |
| Textiles, Apparel & Luxury Goods — 0.9% | |
| Columbia Sportswear Co. | | 72,166 | $ 6,276,999 |
| Deckers Outdoor Corp.(1) | | 28,233 | 6,211,542 |
| | | | $ 12,488,541 |
| Thrifts & Mortgage Finance — 0.6% | |
| Washington Federal, Inc. | | 405,481 | $ 8,458,334 |
| | | | $ 8,458,334 |
| Trading Companies & Distributors — 1.0% | |
| Applied Industrial Technologies, Inc. | | 260,260 | $ 14,340,326 |
| | | | $ 14,340,326 |
| Water Utilities — 1.2% | |
| Middlesex Water Co. | | 289,670 | $ 18,002,990 |
| | | | $ 18,002,990 |
Total Common Stocks
(identified cost $1,347,168,517) | | | $ 1,439,714,761 |
| High Social Impact Investments — 0.2% |
| Security | Principal
Amount
(000's omitted) | Value |
| Calvert Impact Capital, Inc., Community Investment Notes, 1.50%, 12/15/20(3)(4) | $ | 2,516 | $ 2,502,849 |
| ImpactAssets, Inc., Global Sustainable Agriculture Notes, 2.07%, 11/3/20(4)(5) | | 152 | 147,142 |
| ImpactAssets, Inc., Microfinance Plus Notes, 0.46%, 11/3/20(4)(5) | | 195 | 168,195 |
Total High Social Impact Investments
(identified cost $2,862,603) | | | $ 2,818,186 |
8
See Notes to Financial Statements.
Calvert
Small-Cap Fund
September 30, 2020
Schedule of Investments — continued
| Short-Term Investments — 2.1% | | | |
| Other — 1.4% |
| Description | Units | Value |
| Calvert Cash Reserves Fund, LLC, 0.13%(6) | | 20,893,634 | $ 20,895,723 |
Total Other
(identified cost $20,896,036) | | | $ 20,895,723 |
| Securities Lending Collateral — 0.7% |
| Security | Shares | Value |
| State Street Navigator Securities Lending Government Money Market Portfolio, 0.09%(7) | | 10,082,639 | $ 10,082,639 |
Total Securities Lending Collateral
(identified cost $10,082,639) | | | $ 10,082,639 |
Total Short-Term Investments
(identified cost $30,978,675) | | | $ 30,978,362 |
Total Investments — 101.1%
(identified cost $1,381,009,795) | | | $ 1,473,511,309 |
| Other Assets, Less Liabilities — (1.1)% | | | $ (15,701,387) |
| Net Assets — 100.0% | | | $ 1,457,809,922 |
| The percentage shown for each investment category in the Schedule of Investments is based on net assets. | |
| (1) | Non-income producing security. |
| (2) | All or a portion of this security was on loan at September 30, 2020. The aggregate market value of securities on loan at September 30, 2020 was $17,362,052. |
| (3) | Affiliated company (see Note 7). |
| (4) | Restricted security. Total market value of restricted securities amounts to $2,818,186, which represents 0.2% of the net assets of the Fund as of September 30, 2020. |
| (5) | Notes carry an interest rate that varies by period and is contingent on the performance of the underlying portfolio of loans to borrowers. The coupon rate shown represents the rate in effect at September 30, 2020. |
| (6) | Affiliated investment company, available to Calvert portfolios and funds, which invests in high quality, U.S. dollar denominated money market instruments. The rate shown is the annualized seven-day yield as of September 30, 2020. |
| (7) | Represents investment of cash collateral received in connection with securities lending. |
Restricted Securities
| Description | Acquisition Dates | Cost |
| Calvert Impact Capital, Inc., Community Investment Notes, 1.50%, 12/15/20 | 12/13/19 | $2,515,603 |
| ImpactAssets, Inc., Global Sustainable Agriculture Notes, 2.07%, 11/3/20 | 11/13/15 | 152,000 |
| ImpactAssets, Inc., Microfinance Plus Notes, 0.46%, 11/3/20 | 11/13/15 | 195,000 |
9
See Notes to Financial Statements.
Calvert
Small-Cap Fund
September 30, 2020
Statement of Assets and Liabilities
| | September 30, 2020 |
| Assets | |
Investments in securities of unaffiliated issuers, at value (identified cost $1,357,598,156) - including
$17,362,052 of securities on loan | $ 1,450,112,737 |
| Investments in securities of affiliated issuers, at value (identified cost $23,411,639) | 23,398,572 |
| Receivable for investments sold | 4,128,744 |
| Receivable for capital shares sold | 9,260,468 |
| Dividends and interest receivable | 1,139,939 |
| Dividends and interest receivable - affiliated | 30,794 |
| Securities lending income receivable | 8,162 |
| Directors' deferred compensation plan | 227,532 |
| Total assets | $1,488,306,948 |
| Liabilities | |
| Payable for investments purchased | $ 17,041,546 |
| Payable for capital shares redeemed | 1,774,012 |
| Deposits for securities loaned | 10,082,639 |
| Payable to affiliates: | |
| Investment advisory fee | 803,129 |
| Administrative fee | 141,729 |
| Distribution and service fees | 52,712 |
| Sub-transfer agency fee | 17,715 |
| Directors' deferred compensation plan | 227,532 |
| Other | 12,490 |
| Accrued expenses | 343,522 |
| Total liabilities | $ 30,497,026 |
| Net Assets | $1,457,809,922 |
| Sources of Net Assets | |
| Paid-in capital | $ 1,402,125,556 |
| Distributable earnings | 55,684,366 |
| Total | $1,457,809,922 |
| Class A Shares | |
| Net Assets | $ 185,777,384 |
| Shares Outstanding | 7,758,695 |
Net Asset Value and Redemption Price Per Share
(net assets ÷ shares of beneficial interest outstanding) | $ 23.94 |
Maximum Offering Price Per Share
(100 ÷ 95.25 of net asset value per share) | $ 25.13 |
| Class C Shares | |
| Net Assets | $ 16,991,860 |
| Shares Outstanding | 838,304 |
Net Asset Value and Offering Price Per Share*
(net assets ÷ shares of beneficial interest outstanding) | $ 20.27 |
| Class I Shares | |
| Net Assets | $ 1,211,029,061 |
| Shares Outstanding | 46,576,994 |
Net Asset Value, Offering Price and Redemption Price Per Share
(net assets ÷ shares of beneficial interest outstanding) | $ 26.00 |
10
See Notes to Financial Statements.
Calvert
Small-Cap Fund
September 30, 2020
Statement of Assets and Liabilities — continued
| | September 30, 2020 |
| Class R6 Shares | |
| Net Assets | $44,011,617 |
| Shares Outstanding | 1,692,100 |
Net Asset Value, Offering Price and Redemption Price Per Share
(net assets ÷ shares of beneficial interest outstanding) | $ 26.01 |
| | On sales of $50,000 or more, the offering price of Class A shares is reduced. |
| * | Redemption price per share is equal to the net asset value less any applicable contingent deferred sales charge. |
11
See Notes to Financial Statements.
Calvert
Small-Cap Fund
September 30, 2020
| | Year Ended |
| | September 30, 2020 |
| Investment Income | |
| Dividend income (net of foreign taxes withheld of $10,363) | $ 11,671,744 |
| Dividend income - affiliated issuers | 6,129 |
| Interest income | 31,748 |
| Interest income - affiliated issuers | 33,962 |
| Securities lending income, net | 63,965 |
| Total investment income | $ 11,807,548 |
| Expenses | |
| Investment advisory fee | $ 6,804,063 |
| Administrative fee | 1,200,717 |
| Distribution and service fees: | |
| Class A | 443,451 |
| Class C | 157,409 |
| Directors' fees and expenses | 38,993 |
| Custodian fees | 25,817 |
| Transfer agency fees and expenses | 967,177 |
| Accounting fees | 227,737 |
| Professional fees | 66,120 |
| Registration fees | 197,845 |
| Reports to shareholders | 88,708 |
| Miscellaneous | 81,380 |
| Total expenses | $ 10,299,417 |
| Waiver and/or reimbursement of expenses by affiliate | $ (76,073) |
| Reimbursement of expenses - other | (11,792) |
| Net expenses | $ 10,211,552 |
| Net investment income | $ 1,595,996 |
| Realized and Unrealized Gain (Loss) | |
| Net realized gain (loss): | |
| Investment securities | $ (37,033,515) |
| Investment securities - affiliated issuers | 2,845 |
| Net realized loss | $(37,030,670) |
| Change in unrealized appreciation (depreciation): | |
| Investment securities | $ 22,966,550 |
| Investment securities - affiliated issuers | (5,651) |
| Net change in unrealized appreciation (depreciation) | $ 22,960,899 |
| Net realized and unrealized loss | $(14,069,771) |
| Net decrease in net assets from operations | $(12,473,775) |
12
See Notes to Financial Statements.
Calvert
Small-Cap Fund
September 30, 2020
Statements of Changes in Net Assets
| | Year Ended September 30, |
| | 2020 | 2019 |
| Increase (Decrease) in Net Assets | | |
| From operations: | | |
| Net investment income | $ 1,595,996 | $ 1,124,940 |
| Net realized gain (loss) | (37,030,670) | 11,688,855 |
| Net change in unrealized appreciation (depreciation) | 22,960,899 | (733,032) |
| Net increase (decrease) in net assets from operations | $ (12,473,775) | $ 12,080,763 |
| Distributions to shareholders: | | |
| Class A | $ (2,242,958) | $ (7,375,765) |
| Class C | (200,001) | (897,708) |
| Class I | (7,919,039) | (12,325,140) |
| Class R6 | (509,400) | — |
| Total distributions to shareholders | $ (10,871,398) | $ (20,598,613) |
| Capital share transactions: | | |
| Class A | $ 23,635,745 | $ 19,666,759 |
| Class C | 3,231,774 | (2,714,077) |
| Class I | 761,543,484 | 205,627,063 |
| Class R6 | 9,673,290 | 34,053,869 (1) |
| Net increase in net assets from capital share transactions | $ 798,084,293 | $256,633,614 |
| Net increase in net assets | $ 774,739,120 | $248,115,764 |
| Net Assets | | |
| At beginning of year | $ 683,070,802 | $ 434,955,038 |
| At end of year | $1,457,809,922 | $683,070,802 |
| (1) | For the period from the commencement of operations, February 1, 2019, to September 30, 2019. |
13
See Notes to Financial Statements.
Calvert
Small-Cap Fund
September 30, 2020
| | Class A |
| | Year Ended September 30, |
| | 2020 | 2019 | 2018 | 2017 | 2016 |
| Net asset value — Beginning of year | $ 25.35 | $ 26.61 | $ 25.70 | $ 21.76 | $ 22.04 |
| Income (Loss) From Operations | | | | | |
| Net investment income (loss)(1) | $ (0.01) | $ 0.02 | $ (0.04) | $ (0.05) | $ 0.03(2) |
| Net realized and unrealized gain (loss) | (1.08) | (0.04) (3) | 4.34 | 4.32 | 1.53 |
| Total income (loss) from operations | $ (1.09) | $ (0.02) | $ 4.30 | $ 4.27 | $ 1.56 |
| Less Distributions | | | | | |
| From net investment income | $ — | $ — | $ —(4) | $ — | $ (0.01) |
| From net realized gain | (0.32) | (1.24) | (3.39) | (0.33) | (1.83) |
| Total distributions | $ (0.32) | $ (1.24) | $ (3.39) | $ (0.33) | $ (1.84) |
| Net asset value — End of year | $ 23.94 | $ 25.35 | $ 26.61 | $ 25.70 | $ 21.76 |
| Total Return(5) | (4.38)% | 0.61% | 18.55% | 19.74% | 7.66% |
| Ratios/Supplemental Data | | | | | |
| Net assets, end of year (000’s omitted) | $185,777 | $172,277 | $158,921 | $137,860 | $170,294 |
| Ratios (as a percentage of average daily net assets):(6) | | | | | |
| Total expenses | 1.22% | 1.25% | 1.28% | 1.36% | 1.42% |
| Net expenses | 1.21% | 1.23% | 1.28% | 1.36% | 1.37% |
| Net investment income (loss) | (0.03)% | 0.07% | (0.17)% | (0.22)% | 0.12% (2) |
| Portfolio Turnover | 44% | 45% | 51% | 137% | 150% |
| (1) | Computed using average shares outstanding. |
| (2) | Amount includes a non-recurring refund for overbilling of prior years' custody out-of-pocket fees. This amounted to $0.001 per share and 0.01% of average net assets. |
| (3) | The per share amount is not in accord with the net realized and unrealized gain (loss) on investments for the period because of the timing of sales of Fund shares and the amount of the per share realized and unrealized gains and losses at such time. |
| (4) | Amount is less than $0.005. |
| (5) | Returns are historical and are calculated by determining the percentage change in net asset value with all distributions reinvested and do not reflect the effect of sales charges, if any. |
| (6) | Total expenses do not reflect amounts reimbursed and/or waived by the adviser and certain of its affiliates, if applicable. Net expenses are net of all reductions and represent the net expenses paid by the Fund. |
14
See Notes to Financial Statements.
Calvert
Small-Cap Fund
September 30, 2020
Financial Highlights — continued
| | Class C |
| | Year Ended September 30, |
| | 2020 | 2019 | 2018 | 2017 | 2016 |
| Net asset value — Beginning of year | $ 21.63 | $ 22.90 | $ 22.58 | $ 19.30 | $ 19.88 |
| Income (Loss) From Operations | | | | | |
| Net investment loss(1) | $ (0.16) | $ (0.14) | $ (0.20) | $ (0.21) | $ (0.12)(2) |
| Net realized and unrealized gain (loss) | (0.92) | (0.04) (3) | 3.77 | 3.82 | 1.37 |
| Total income (loss) from operations | $ (1.08) | $ (0.18) | $ 3.57 | $ 3.61 | $ 1.25 |
| Less Distributions | | | | | |
| From net realized gain | $ (0.28) | $ (1.09) | $ (3.25) | $ (0.33) | $ (1.83) |
| Total distributions | $ (0.28) | $ (1.09) | $ (3.25) | $ (0.33) | $ (1.83) |
| Net asset value — End of year | $ 20.27 | $ 21.63 | $ 22.90 | $ 22.58 | $ 19.30 |
| Total Return(4) | (5.10)% | (0.12)% | 17.66% | 18.82% | 6.89% |
| Ratios/Supplemental Data | | | | | |
| Net assets, end of year (000’s omitted) | $16,992 | $14,775 | $18,945 | $16,691 | $16,842 |
| Ratios (as a percentage of average daily net assets):(5) | | | | | |
| Total expenses | 1.97% | 2.01% | 2.03% | 2.22% | 2.31% |
| Net expenses | 1.96% | 1.99% | 2.03% | 2.12% | 2.12% |
| Net investment loss | (0.78)% | (0.68)% | (0.91)% | (0.99)% | (0.63)% (2) |
| Portfolio Turnover | 44% | 45% | 51% | 137% | 150% |
| (1) | Computed using average shares outstanding. |
| (2) | Amount includes a non-recurring refund for overbilling of prior years' custody out-of-pocket fees. This amounted to $0.001 per share and 0.01% of average net assets. |
| (3) | The per share amount is not in accord with the net realized and unrealized gain (loss) on investments for the period because of the timing of sales of Fund shares and the amount of the per share realized and unrealized gains and losses at such time. |
| (4) | Returns are historical and are calculated by determining the percentage change in net asset value with all distributions reinvested and do not reflect the effect of sales charges, if any. |
| (5) | Total expenses do not reflect amounts reimbursed and/or waived by the adviser and certain of its affiliates, if applicable. Net expenses are net of all reductions and represent the net expenses paid by the Fund. |
15
See Notes to Financial Statements.
Calvert
Small-Cap Fund
September 30, 2020
Financial Highlights — continued
| | Class I |
| | Year Ended September 30, |
| | 2020 | 2019 | 2018 | 2017 | 2016 |
| Net asset value — Beginning of year | $ 27.49 | $ 28.73 | $ 27.51 | $ 23.18 | $ 23.34 |
| Income (Loss) From Operations | | | | | |
| Net investment income(1) | $ 0.06 | $ 0.09 | $ 0.05 | $ 0.06 | $ 0.13(2) |
| Net realized and unrealized gain (loss) | (1.17) | (0.02) (3) | 4.67 | 4.62 | 1.63 |
| Total income (loss) from operations | $ (1.11) | $ 0.07 | $ 4.72 | $ 4.68 | $ 1.76 |
| Less Distributions | | | | | |
| From net investment income | $ (0.05) | $ (0.06) | $ (0.08) | $ (0.02) | $ (0.09) |
| From net realized gain | (0.33) | (1.25) | (3.42) | (0.33) | (1.83) |
| Total distributions | $ (0.38) | $ (1.31) | $ (3.50) | $ (0.35) | $ (1.92) |
| Net asset value — End of year | $ 26.00 | $ 27.49 | $ 28.73 | $ 27.51 | $ 23.18 |
| Total Return(4) | (4.12)% | 0.92% | 18.92% | 20.29% | 8.15% |
| Ratios/Supplemental Data | | | | | |
| Net assets, end of year (000’s omitted) | $1,211,029 | $461,237 | $257,089 | $93,724 | $96,664 |
| Ratios (as a percentage of average daily net assets):(5) | | | | | |
| Total expenses | 0.97% | 1.00% | 1.04% | 0.92% | 0.94% |
| Net expenses | 0.96% | 0.95% | 0.92% | 0.90% | 0.92% |
| Net investment income | 0.22% | 0.34% | 0.19% | 0.23% | 0.58% (2) |
| Portfolio Turnover | 44% | 45% | 51% | 137% | 150% |
| (1) | Computed using average shares outstanding. |
| (2) | Amount includes a non-recurring refund for overbilling of prior years' custody out-of-pocket fees. This amounted to $0.001 per share and 0.01% of average net assets. |
| (3) | The per share amount is not in accord with the net realized and unrealized gain (loss) on investments for the period because of the timing of sales of Fund shares and the amount of the per share realized and unrealized gains and losses at such time. |
| (4) | Returns are historical and are calculated by determining the percentage change in net asset value with all distributions reinvested and do not reflect the effect of sales charges, if any. |
| (5) | Total expenses do not reflect amounts reimbursed and/or waived by the adviser and certain of its affiliates, if applicable. Net expenses are net of all reductions and represent the net expenses paid by the Fund. |
16
See Notes to Financial Statements.
Calvert
Small-Cap Fund
September 30, 2020
Financial Highlights — continued
| | Class R6 |
| | Year Ended September 30, | Period Ended
September 30, |
| | 2020 | 2019 (1) |
| Net asset value — Beginning of period | $ 27.50 | $ 24.93 |
| Income (Loss) From Operations | | |
| Net investment income(2) | $ 0.07 | $ 0.07 |
| Net realized and unrealized gain (loss) | (1.16) | 2.50 |
| Total income (loss) from operations | $ (1.09) | $ 2.57 |
| Less Distributions | | |
| From net investment income | $ (0.07) | $ — |
| From net realized gain | (0.33) | — |
| Total distributions | $ (0.40) | $ — |
| Net asset value — End of period | $ 26.01 | $ 27.50 |
| Total Return(3) | (4.07)% | 10.31% (4) |
| Ratios/Supplemental Data | | |
| Net assets, end of period (000’s omitted) | $44,012 | $34,782 |
| Ratios (as a percentage of average daily net assets):(5) | | |
| Total expenses | 0.91% | 0.93% (6) |
| Net expenses | 0.90% | 0.90% (6) |
| Net investment income | 0.28% | 0.37% (6) |
| Portfolio Turnover | 44% | 45% (7) |
| (1) | For the period from the commencement of operations, February 1, 2019, to September 30, 2019. |
| (2) | Computed using average shares outstanding. |
| (3) | Returns are historical and are calculated by determining the percentage change in net asset value with all distributions reinvested and do not reflect the effect of sales charges, if any. |
| (4) | Not annualized. |
| (5) | Total expenses do not reflect amounts reimbursed and/or waived by the adviser and certain of its affiliates, if applicable. Net expenses are net of all reductions and represent the net expenses paid by the Fund. |
| (6) | Annualized. |
| (7) | For the year ended September 30, 2019. |
17
See Notes to Financial Statements.
Calvert
Small-Cap Fund
September 30, 2020
Notes to Financial Statements
1 Significant Accounting Policies
Calvert Small-Cap Fund (the Fund) is a diversified series of Calvert Impact Fund, Inc. (the Corporation). The Corporation is a Maryland business corporation registered under the Investment Company Act of 1940, as amended (the 1940 Act), as an open-end management investment company. The investment objective of the Fund is to seek to provide long-term capital appreciation through investment primarily in small-cap common stocks of U.S. companies.
The Fund offers four classes of shares. Class A shares are generally sold subject to a sales charge imposed at time of purchase. A contingent deferred sales charge of 0.80% may apply to certain redemptions of Class A shares for accounts for which no sales charge was paid, if redeemed within 12 months of purchase. Class C shares are sold without a front-end sales charge, and with certain exceptions, are charged a contingent deferred sales charge of 1% on shares redeemed within 12 months of purchase. Class C shares are only available for purchase through a financial intermediary. Effective January 25, 2019, Class C shares generally automatically convert to Class A shares ten years after their purchase and, effective November 5, 2020, automatically convert to Class A shares eight years after their purchase as described in the Fund's prospectus. Class I and Class R6 shares are sold at net asset value, are not subject to a sales charge and are sold only to certain eligible investors. Each class represents a pro rata interest in the Fund, but votes separately on class-specific matters and is subject to different expenses.
The Fund applies the accounting and reporting guidance in the Financial Accounting Standards Board (FASB) Accounting Standards Codification Topic 946, Financial Services – Investment Companies (ASC 946). Subsequent events, if any, through the date that the financial statements were issued have been evaluated in the preparation of the financial statements.
A Investment Valuation— Net asset value per share is determined every business day as of the close of the regular session of the New York Stock Exchange (generally 4:00 p.m. Eastern time). The Fund uses independent pricing services approved by the Board of Directors (the Board) to value its investments wherever possible. Investments for which market quotations are not available or deemed not reliable are fair valued in good faith under the direction of the Board.
U.S. generally accepted accounting principles (U.S. GAAP) establishes a disclosure hierarchy that categorizes the inputs to valuation techniques used to value assets and liabilities at measurement date. These inputs are summarized in the three broad levels listed below:
Level 1 - quoted prices in active markets for identical securities
Level 2 - other significant observable inputs (including quoted prices for similar securities, interest rates, prepayment speeds, credit risk, etc.)
Level 3 - significant unobservable inputs (including the Fund’s own assumptions in determining the fair value of investments)
The inputs or methodologies used for valuing securities are not necessarily an indication of the risk associated with investing in those securities.
Valuation techniques used to value the Fund’s investments by major category are as follows:
Equity Securities. Equity securities (including warrants and rights) listed on a U.S. securities exchange generally are valued at the last sale or closing price as reported by an independent pricing service on the primary market or exchange on which they are traded and are categorized as Level 1 in the hierarchy. Equity securities listed on the NASDAQ Global or Global Select Market are valued at the NASDAQ official closing price and are categorized as Level 1 in the hierarchy. Unlisted or listed securities for which closing sales prices or closing quotations are not available are valued at the mean between the latest available bid and ask prices and are categorized as Level 2 in the hierarchy.
Debt Securities. Debt securities are generally valued based on valuations provided by third party pricing services, as derived from such services’ pricing models. Inputs to the models may include, but are not limited to, reported trades, executable bid and ask prices, broker/dealer quotations, prices or yields of securities with similar characteristics, interest rates, anticipated prepayments, benchmark curves or information pertaining to the issuer, as well as industry and economic events. Accordingly, debt securities are generally categorized as Level 2 in the hierarchy. Short-term debt securities with a remaining maturity at time of purchase of more than sixty days are valued based on valuations provided by a third party pricing service. Such securities are generally categorized as Level 2 in the hierarchy. Short-term debt securities of sufficient credit quality purchased with remaining maturities of sixty days or less are valued at amortized cost, which approximates fair value, and are categorized as Level 2 in the hierarchy.
Affiliated Fund. The Fund may invest in Calvert Cash Reserves Fund, LLC (Cash Reserves Fund), an affiliated investment company managed by Calvert Research and Management (CRM). While Cash Reserves Fund is not a registered money market mutual fund, it conducts all of its investment activities in accordance with the requirements of Rule 2a-7 under the 1940 Act. Investments in Cash Reserves Fund are valued at the closing net asset value per unit on the valuation day and are categorized as Level 2 in the hierarchy. Cash Reserves Fund generally values its investment securities based on available market quotations provided by a third party pricing service.
Other Securities. Investments in registered investment companies (including money market funds) that do not trade on an exchange are valued at the net asset value per share on the valuation day and are categorized as Level 1 in the hierarchy.
Fair Valuation. If a market value cannot be determined for a security using the methodologies described above, or if, in the good faith opinion of the Fund's adviser, the market value does not constitute a readily available market quotation, or if a significant event has occurred that would materially affect the value of the security, the security will be fair valued as determined in good faith by or at the direction of the Board in a manner that most fairly reflects the security’s “fair value”, which is the amount that the Fund might reasonably expect to receive for the security upon its current sale in the ordinary course.
Calvert
Small-Cap Fund
September 30, 2020
Notes to Financial Statements — continued
Each such determination is based on a consideration of relevant factors, which are likely to vary from one pricing context to another. These factors may include, but are not limited to, the type of security, the existence of any contractual restrictions on the security’s disposition, the price and extent of public trading in similar securities of the issuer or of comparable companies or entities, quotations or relevant information obtained from broker/dealers or other market participants, information obtained from the issuer, analysts, and/or the appropriate stock exchange (for exchange-traded securities), an analysis of the company’s or entity’s financial statements, and an evaluation of the forces that influence the issuer and the market(s) in which the security is purchased and sold.
The values assigned to fair value investments are based on available information and do not necessarily represent amounts that might ultimately be realized. Further, due to the inherent uncertainty of valuations of such investments, the fair values may differ significantly from the values that would have been used had an active market existed, and the differences could be material.
The following table summarizes the market value of the Fund's holdings as of September 30, 2020, based on the inputs used to value them:
| Asset Description | Level 1 | Level 2 | Level 3 | Total |
| Common Stocks | $ 1,439,714,761(1) | $ — | $ — | $ 1,439,714,761 |
| High Social Impact Investments | — | 2,818,186 | — | 2,818,186 |
| Short-Term Investments: | | | | |
| Other | — | 20,895,723 | — | 20,895,723 |
| Securities Lending Collateral | 10,082,639 | — | — | 10,082,639 |
| Total Investments | $1,449,797,400 | $23,713,909 | $ — | $1,473,511,309 |
| (1) | The level classification by major category of investments is the same as the category presentation in the Schedule of Investments. |
B Investment Transactions and Income— Investment transactions for financial statement purposes are accounted for on trade date. Realized gains and losses are recorded on an identified cost basis and may include proceeds from litigation. Dividend income is recorded on the ex-dividend date for dividends received in cash and/or securities or, in the case of dividends on certain foreign securities, as soon as the Fund is informed of the ex-dividend date. Non-cash dividends are recorded at the fair value of the securities received. Withholding taxes on foreign dividends, if any, have been provided for in accordance with the Fund’s understanding of the applicable country’s tax rules and rates. Distributions received that represent a return of capital are recorded as a reduction of cost of investments. Distributions received that represent a capital gain are recorded as a realized gain. Interest income, which includes amortization of premium and accretion of discount on debt securities, is accrued as earned.
C Share Class Accounting— Realized and unrealized gains and losses and net investment income and losses, other than class-specific expenses, are allocated daily to each class of shares based upon the relative net assets of each class to the total net assets of the Fund. Expenses arising in connection with a specific class are charged directly to that class. Sub-accounting, recordkeeping and similar administrative fees payable to financial intermediaries, which are a component of transfer agency fees and expenses on the Statement of Operations, are not allocated to Class R6 shares.
D Restricted Securities— The Fund may invest in securities that are subject to legal or contractual restrictions on resale. Generally, these securities may only be sold publicly upon registration under the Securities Act of 1933 or in transactions exempt from such registration. Information regarding restricted securities (excluding Rule 144A securities) is included at the end of the Schedule of Investments.
E Distributions to Shareholders— Distributions to shareholders are recorded by the Fund on ex-dividend date. Distributions from net investment income and distributions from net realized capital gains, if any, are paid at least annually. Distributions are declared separately for each class of shares. Distributions are determined in accordance with income tax regulations, which may differ from U.S. GAAP; accordingly, periodic reclassifications are made within the Fund's capital accounts to reflect income and gains available for distribution under income tax regulations.
F Estimates— The preparation of financial statements in conformity with U.S. GAAP requires management to make estimates and assumptions that affect the reported amounts of assets and liabilities and disclosure of contingent assets and liabilities at the date of the financial statements and the reported amounts of increases and decreases in net assets from operations during the reporting period. Actual results could differ from those estimates.
G Indemnifications— The Corporation’s By-Laws provide for indemnification for Directors or officers of the Corporation and certain other parties, to the fullest extent permitted by Maryland law and the 1940 Act, provided certain conditions are met. Additionally, in the normal course of business, the Fund enters into agreements with service providers that may contain indemnification clauses. The Fund’s maximum exposure under these arrangements is unknown as this would involve future claims that may be made against the Fund that have not yet occurred.
H Federal Income Taxes— No provision for federal income or excise tax is required since the Fund intends to continue to qualify as a regulated investment company under the Internal Revenue Code and to distribute substantially all of its taxable earnings.
Calvert
Small-Cap Fund
September 30, 2020
Notes to Financial Statements — continued
Management has analyzed the Fund's tax positions taken for all open federal income tax years and has concluded that no provision for federal income tax is required in the Fund's financial statements. A Fund's federal tax return is subject to examination by the Internal Revenue Service for a period of three years from the date of filing.
2 Related Party Transactions
The investment advisory fee is earned by CRM, a subsidiary of Eaton Vance Management (EVM), as compensation for investment advisory services rendered to the Fund. EVM is a wholly-owned subsidiary of Eaton Vance Corp. Pursuant to the investment advisory agreement, CRM receives a fee, payable monthly, at the annual rate of 0.68% of the Fund’s average daily net assets. For the year ended September 30, 2020, the investment advisory fee amounted to $6,804,063. The Fund may invest its cash in Cash Reserves Fund. CRM does not currently receive a fee for advisory services provided to Cash Reserves Fund.
CRM has agreed to reimburse the Fund’s operating expenses to the extent that total annual operating expenses (relating to ordinary operating expenses only and excluding expenses such as brokerage commissions, acquired fund fees and expenses of unaffiliated funds, borrowing costs, taxes or litigation expenses) exceed 1.21%, 1.96%, 0.96% and 0.90% for Class A, Class C, Class I and Class R6, respectively, of such class's average daily net assets. The expense reimbursement agreement with CRM may be changed or terminated after January 31, 2021. For the year ended September 30, 2020, CRM waived or reimbursed expenses of $76,073.
The administrative fee is earned by CRM as compensation for administrative services rendered to the Fund. The fee is computed at an annual rate of 0.12% of the Fund’s average daily net assets attributable to Class A, Class C, Class I and Class R6 and is payable monthly. For the year ended September 30, 2020, CRM was paid administrative fees of $1,200,717.
The Fund has in effect a distribution plan for Class A shares (Class A Plan) pursuant to Rule 12b-1 under the 1940 Act. Pursuant to the Class A Plan, the Fund pays Eaton Vance Distributors, Inc. (EVD), an affiliate of CRM and the Fund’s principal underwriter, a distribution and service fee of 0.25% per annum of its average daily net assets attributable to Class A shares for distribution services and facilities provided to the Fund by EVD, as well as for personal services and/or the maintenance of shareholder accounts. The Fund also has in effect a distribution plan for Class C shares (Class C Plan) pursuant to Rule 12b-1 under the 1940 Act. Pursuant to the Class C Plan, the Fund pays EVD amounts equal to 0.75% per annum of its average daily net assets attributable to Class C shares for providing ongoing distribution services and facilities to the Fund. In addition, pursuant to the Class C Plan, the Fund also makes payments of service fees to EVD, financial intermediaries and other persons in amounts equal to 0.25% per annum of its average daily net assets attributable to that class. Service fees paid or accrued are for personal services and/or the maintenance of shareholder accounts. Distribution and service fees paid or accrued for the year ended September 30, 2020 amounted to $443,451 and $157,409 for Class A shares and Class C shares, respectively.
The Fund was informed that EVD received $53,680 as its portion of the sales charge on sales of Class A shares for the year ended September 30, 2020. The Fund was also informed that EVD received $459 and $2,414 of contingent deferred sales charges (CDSC) paid by Class A and Class C shareholders, respectively, for the same period.
EVM provides sub-transfer agency and related services to the Fund pursuant to a Sub-Transfer Agency Support Services Agreement. For the year ended September 30, 2020, sub-transfer agency fees and expenses incurred to EVM amounted to $101,848 and are included in transfer agency fees and expenses on the Statement of Operations.
Each Director of the Fund who is not an employee of CRM or its affiliates receives an annual fee of $154,000, plus an annual Committee fee ranging from $8,500 to $16,500 depending on the Committee. The Board chair receives an additional $20,000 annual fee and Committee chairs receive an additional $6,000 annual fee. Eligible Directors may participate in a Deferred Compensation Plan (the Plan). Amounts deferred under the Plan are treated as though equal dollar amounts had been invested in shares of the Fund or other Calvert funds selected by the Directors. The Fund purchases shares of the funds selected equal to the dollar amounts deferred under the Plan, resulting in an asset equal to the deferred compensation liability. Obligations of the Plan are paid solely from the Fund's assets. Directors’ fees are allocated to each of the Calvert funds served. Salaries and fees of officers and Directors of the Fund who are employees of CRM or its affiliates are paid by CRM. In addition, an Advisory Council was established to aid the Board and CRM in advancing the cause of responsible investing through original scholarship and thought leadership. The Advisory Council consists of CRM’s Chief Executive Officer and three (four prior to December 31, 2019) additional members. Each member (other than CRM’s Chief Executive Officer) received annual compensation of $75,000, which was being reimbursed by Calvert Investment Management, Inc. (CIM), the Calvert funds’ former investment adviser and Ameritas Holding Company, CIM’s parent company, through the end of 2019. For the year ending December 31, 2020, each member (other than CRM’s Chief Executive Officer) is expected to be compensated $20,000 for their service on the Advisory Council. Such compensation, and any other compensation and/or expenses incurred by the Advisory Council as may be approved by the Board, shall be borne by the Calvert funds. For the year ended September 30, 2020, the Fund’s allocated portion of the Advisory Council compensation and fees was $13,254 and the reimbursement was $11,792, which are included in miscellaneous expense and reimbursement of expenses-other, respectively, on the Statement of Operations.
Calvert
Small-Cap Fund
September 30, 2020
Notes to Financial Statements — continued
3 Investment Activity
During the year ended September 30, 2020, the cost of purchases and proceeds from sales of investments, other than short-term securities, were $1,221,258,144 and $433,939,938, respectively.
4 Distributions to Shareholders and Income Tax Information
The tax character of distributions declared for the years ended September 30, 2020 and September 30, 2019 was as follows:
| | Year Ended September 30, |
| | 2020 | 2019 |
| Ordinary income | $2,610,080 | $ 8,593,954 |
| Long-term capital gains | $8,261,318 | $12,004,659 |
During the year ended September 30, 2020, distributable earnings was decreased by $296,062 and paid-in capital was increased by $296,062 primarily due to the Fund's use of equalization accounting. Tax equalization accounting allows the Fund to treat as a distribution that portion of redemption proceeds representing a redeeming shareholder’s portion of undistributed taxable income and net capital gains.
These reclassifications had no effect on the net assets or net asset value per share of the Fund.
As of September 30, 2020, the components of distributable earnings (accumulated loss) on a tax basis were as follows:
| Undistributed ordinary income | $ 295,069 |
| Deferred capital losses | $(28,267,982) |
| Net unrealized appreciation | $ 83,657,279 |
At September 30, 2020, the Fund, for federal income tax purposes, had deferred capital losses of $28,267,982 which would reduce the Fund’s taxable income arising from future net realized gains on investment transactions, if any, to the extent permitted by the Internal Revenue Code, and thus would reduce the amount of distributions to shareholders, which would otherwise be necessary to relieve the Fund of any liability for federal income or excise tax. The deferred capital losses are treated as arising on the first day of the Fund’s next taxable year, can be carried forward for an unlimited period, and retain the same short-term or long-term character as when originally deferred. Of the deferred capital losses at September 30, 2020, $28,267,982 are short-term.
The cost and unrealized appreciation (depreciation) of investments of the Fund at September 30, 2020, as determined on a federal income tax basis, were as follows:
| Aggregate cost | $1,389,854,030 |
| Gross unrealized appreciation | $ 147,931,744 |
| Gross unrealized depreciation | (64,274,465) |
| Net unrealized appreciation | $ 83,657,279 |
Calvert
Small-Cap Fund
September 30, 2020
Notes to Financial Statements — continued
5 Securities Lending
To generate additional income, the Fund may lend its securities pursuant to a securities lending agency agreement with State Street Bank and Trust Company (SSBT), the securities lending agent. Security loans are subject to termination by the Fund at any time and, therefore, are not considered illiquid investments. The Fund requires that the loan be continuously collateralized by either cash or securities as collateral equal at all times to at least 102% of the market value of the domestic securities loaned and 105% of the market value of the international securities loaned (if applicable). The market value of securities loaned is determined daily and any additional required collateral is delivered to the Fund on the next business day. Cash collateral is generally invested in a money market fund registered under the 1940 Act that is managed by an affiliate of SSBT. Any gain or loss in the market price of the loaned securities that might occur and any interest earned or dividends declared during the term of the loan would accrue to the account of the Fund. Income earned on the investment of collateral, net of broker rebates and other expenses incurred by the securities lending agent, is split between the Fund and the securities lending agent based on agreed upon contractual terms. Non-cash collateral, if any, is held by the lending agent on behalf of the Fund and cannot be sold or re-pledged by the Fund; accordingly, such collateral is not reflected in the Statement of Assets and Liabilities.
The risks associated with lending portfolio securities include, but are not limited to, possible delays in receiving additional collateral or in the recovery of the loaned securities, possible loss of rights to the collateral should the borrower fail financially, as well as risk of loss in the value of the collateral or the value of the investments made with the collateral. The securities lending agent shall indemnify the Fund in the case of default of any securities borrower.
At September 30, 2020, the total value of securities on loan was $17,362,052 and the total value of collateral received was $17,820,634, comprised of cash of $10,082,639 and U.S. government and/or agencies securities of $7,737,995.
The following table provides a breakdown of securities lending transactions accounted for as secured borrowings, the obligations by class of collateral pledged, and the remaining contractual maturity of those transactions as of September 30, 2020.
| | Remaining Contractual Maturity of the Transactions |
| | Overnight and
Continuous | <30 days | 30 to 90 days | >90 days | Total |
| Common Stocks | $10,082,639 | $ — | $ — | $ — | $10,082,639 |
The carrying amount of the liability for deposits for securities loaned at September 30, 2020 approximated its fair value. If measured at fair value, such liability would have been considered as Level 2 in the fair value hierarchy (see Note 1A) at September 30, 2020.
6 Line of Credit
Effective October 29, 2019, the Fund participates with other portfolios and funds managed by EVM and its affiliates, including CRM, in an $800 million unsecured line of credit with a group of banks, which is in effect through October 27, 2020. Borrowings are made by the Fund solely for temporary purposes related to redemptions and other short-term cash needs. Interest is charged to the Fund based on its borrowings at an amount above either the Eurodollar rate or Federal Funds rate. In addition, a fee computed at an annual rate of 0.15% on the daily unused portion of the line of credit is allocated among the participating portfolios and funds at the end of each quarter. Because the line of credit is not available exclusively to the Fund, it may be unable to borrow some or all of its requested amounts at any particular time.
Prior to October 29, 2019, the Fund participated with other funds managed by CRM in a $100 million committed unsecured line of credit agreement with SSBT, which was terminated by the Calvert funds. Borrowings bore interest at the higher of the one-month London Interbank Offered Rate (LIBOR) in effect that day or the overnight Federal Funds rate, plus 1.00% per annum. A commitment fee of 0.20% per annum was incurred on the unused portion of the committed facility, which was allocated to all participating funds.
The Fund had no borrowings outstanding pursuant to its line of credit at September 30, 2020. The Fund did not have any significant borrowings or allocated fees during the year ended September 30, 2020. Effective October 27, 2020, the Fund renewed its line of credit agreement, which expires October 26, 2021, at substantially the same terms.
7 Affiliated Companies and Funds
The Fund has invested a portion of its assets in notes (the Notes) issued by Calvert Impact Capital, Inc. (CIC) pursuant to exemptive relief granted by the U.S. Securities and Exchange Commission (the SEC). There are certain potential points of affiliation between the Fund and CIC. CRM has licensed use of the Calvert name to CIC and provides other types of support. CRM’s President and Chief Executive Officer (and the only director/trustee on the Fund Board that is an “interested person” of the Fund) serves on the CIC Board, along with one member of the Advisory Council to the Fund Board. In addition, another director/trustee on the Fund Board and a member of the Advisory Council each serve as a director emeritus on the CIC Board.
Calvert
Small-Cap Fund
September 30, 2020
Notes to Financial Statements — continued
At September 30, 2020, the value of the Fund’s investment in the Notes and affiliated funds was $23,398,572, which represents 1.6% of the Fund’s net assets. Transactions in the Notes and affiliated funds by the Fund for the year ended September 30, 2020 were as follows:
| Name | Value,
beginning
of period | Purchases | Sales
proceeds | Net
realized
gain
(loss) | Change in
unrealized
appreciation
(depreciation) | Value,
end of
period | Interest/
Dividend
income | Principal
amount/Units,
end of period |
| High Social Impact Investments | | | | | | | | |
| Calvert Impact Capital, Inc., Community Investment Notes, 1.50%, 12/15/19(1) | $1,394,489 | $ — | $ (1,401,905) | $ — | $ 7,416 | $ — | $ 4,089 | $ — |
| Calvert Impact Capital, Inc., Community Investment Notes, 1.50%, 12/15/20(1) | — | 2,515,603 | — | — | (12,754) | 2,502,849 | 29,873 | 2,515,603 |
| Short-Term Investments | | | | | | | | |
| Calvert Cash Reserves Fund, LLC | — | 251,200,545 | (230,307,354) | 2,845 | (313) | 20,895,723 | 6,129 | 20,893,634 |
| Totals | | | | $2,845 | $ (5,651) | $23,398,572 | $40,091 | |
8 Capital Shares
The Corporation may issue its shares in one or more series (such as the Fund). The authorized shares of the Fund consist of 75,000,000 common shares, $0.01 par value, for each Class.
Transactions in capital shares for the years ended September 30, 2020 and September 30, 2019 were as follows:
| | Year Ended
September 30, 2020 | | Year Ended
September 30, 2019(1) |
| | Shares | Amount | | Shares | Amount |
| Class A | | | | | |
| Shares sold | 2,505,463 | $ 59,082,941 | | 1,467,767 | $ 36,064,446 |
| Reinvestment of distributions | 84,645 | 2,165,230 | | 317,910 | 7,044,877 |
| Shares redeemed | (1,652,197) | (38,244,903) | | (1,148,858) | (27,656,569) |
| Converted from Class C | 25,804 | 632,477 | | 185,714 | 4,214,005 |
| Net increase | 963,715 | $ 23,635,745 | | 822,533 | $ 19,666,759 |
| Class C | | | | | |
| Shares sold | 359,892 | $ 7,284,269 | | 210,002 | $ 4,399,949 |
| Reinvestment of distributions | 8,772 | 191,136 | | 45,085 | 857,509 |
| Shares redeemed | (183,232) | (3,611,154) | | (182,656) | (3,757,530) |
| Converted to Class A | (30,252) | (632,477) | | (216,634) | (4,214,005) |
| Net increase (decrease) | 155,180 | $ 3,231,774 | | (144,203) | $ (2,714,077) |
| Class I | | | | | |
| Shares sold | 41,335,024 | $1,041,863,042 | | 11,621,056 | $ 306,043,800 |
| Reinvestment of distributions | 268,712 | 7,448,686 | | 456,891 | 10,956,240 |
| Shares redeemed | (11,802,177) | (287,768,244) | | (4,249,703) | (111,372,977) |
| Net increase | 29,801,559 | $ 761,543,484 | | 7,828,244 | $ 205,627,063 |
Calvert
Small-Cap Fund
September 30, 2020
Notes to Financial Statements — continued
| | Year Ended
September 30, 2020 | | Year Ended
September 30, 2019(1) |
| | Shares | Amount | | Shares | Amount |
| Class R6 | | | | | |
| Shares sold | 686,828 | $ 16,652,531 | | 1,296,704 | $ 34,920,036 |
| Reinvestment of distributions | 18,383 | 509,400 | | — | — |
| Shares redeemed | (277,774) | (7,488,641) | | (32,041) | (866,167) |
| Net increase | 427,437 | $ 9,673,290 | | 1,264,663 | $ 34,053,869 |
| (1) | For Class R6, for the period from the commencement of operations, February 1, 2019, to September 30, 2019. |
9 Risks and Uncertainties
Pandemic Risk
An outbreak of respiratory disease caused by a novel coronavirus was first detected in China in December 2019 and subsequently spread internationally. This coronavirus has resulted in closing borders, enhanced health screenings, changes to healthcare service preparation and delivery, quarantines, cancellations, disruptions to supply chains and customer activity, as well as general concern and uncertainty. Health crises caused by outbreaks, such as the coronavirus outbreak, may exacerbate other pre-existing political, social and economic risks and disrupt normal market conditions and operations. The impact of this outbreak has negatively affected the worldwide economy, the economies of individual countries, individual companies, and the market in general, and may continue to do so in significant and unforeseen ways, as may other epidemics and pandemics that may arise in the future. Any such impact could adversely affect the Fund's performance, or the performance of the securities in which the Fund invests.
10 Subsequent Event
On October 8, 2020, Morgan Stanley and Eaton Vance Corp. (“Eaton Vance”) announced that they had entered into a definitive agreement under which Morgan Stanley would acquire Eaton Vance. Under the Investment Company Act of 1940, as amended, consummation of this transaction may result in the automatic termination of the Fund’s investment advisory agreement, and any related sub-advisory agreement(s), if applicable. Thus, the Fund’s Board will be asked to approve a new investment advisory agreement (and new sub-advisory agreement(s), if applicable). If approved by the Fund’s Board, the new investment advisory agreement (and new sub-advisory agreement(s), if applicable) is expected to be presented to Fund shareholders for approval, and, if approved, would take effect upon the closing of the transaction.
Calvert
Small-Cap Fund
September 30, 2020
Report of Independent Registered Public Accounting Firm
To the Shareholders and Board of Directors
Calvert Impact Fund, Inc.:
Opinion on the Financial Statements
We have audited the accompanying statement of assets and liabilities of Calvert Small-Cap Fund (the Fund), a series of Calvert Impact Fund, Inc., including the schedule of investments, as of September 30, 2020, the related statement of operations for the year then ended, the statements of changes in net assets for each of the years in the two-year period then ended, and the related notes (collectively, the financial statements) and the financial highlights for each of the years or periods in the five-year period then ended. In our opinion, the financial statements and financial highlights present fairly, in all material respects, the financial position of the Fund as of September 30, 2020, the results of its operations for the year then ended, the changes in its net assets for each of the years in the two-year period then ended, and the financial highlights for each of the years or periods in the five-year period then ended, in conformity with U.S. generally accepted accounting principles.
Basis for Opinion
These financial statements and financial highlights are the responsibility of the Fund’s management. Our responsibility is to express an opinion on these financial statements and financial highlights based on our audits. We are a public accounting firm registered with the Public Company Accounting Oversight Board (United States) (PCAOB) and are required to be independent with respect to the Fund in accordance with the U.S. federal securities laws and the applicable rules and regulations of the Securities and Exchange Commission and the PCAOB.
We conducted our audits in accordance with the standards of the PCAOB. Those standards require that we plan and perform the audit to obtain reasonable assurance about whether the financial statements and financial highlights are free of material misstatement, whether due to error or fraud. Our audits included performing procedures to assess the risks of material misstatement of the financial statements and financial highlights, whether due to error or fraud, and performing procedures that respond to those risks. Such procedures included examining, on a test basis, evidence regarding the amounts and disclosures in the financial statements and financial highlights. Such procedures also included confirmation of securities owned as of September 30, 2020, by correspondence with the custodian, brokers and agent banks. Our audits also included evaluating the accounting principles used and significant estimates made by management, as well as evaluating the overall presentation of the financial statements and financial highlights. We believe that our audits provide a reasonable basis for our opinion.

We have served as the auditor of one or more of the Calvert Funds since 2002.
Philadelphia, Pennsylvania
November 20, 2020
Calvert
Small-Cap Fund
September 30, 2020
Federal Tax Information (Unaudited)
The Form 1099-DIV you receive in February 2021 will show the tax status of all distributions paid to your account in calendar year 2020. Shareholders are advised to consult their own tax adviser with respect to the tax consequences of their investment in the Fund. As required by the Internal Revenue Code and/or regulations, shareholders must be notified regarding the status of qualified dividend income for individuals and the dividends received deduction for corporations.
Qualified Dividend Income. For the fiscal year ended September 30, 2020, the Fund designates approximately $8,100,841, or up to the maximum amount of such dividends allowable pursuant to the Internal Revenue Code, as qualified dividend income eligible for the reduced tax rate of 15%.
Dividends Received Deduction. Corporate shareholders are generally entitled to take the dividends received deduction on the portion of the Fund's dividend distribution that qualifies under tax law. For the Fund's fiscal 2020 ordinary income dividends, 100% qualifies for the corporate dividends received deduction.
Calvert
Small-Cap Fund
September 30, 2020
Liquidity Risk Management Program
The Fund has implemented a written liquidity risk management program (Program) and related procedures to manage its liquidity in accordance with Rule 22e-4 under the Investment Company Act of 1940, as amended (Liquidity Rule). The Liquidity Rule defines “liquidity risk” as the risk that a fund could not meet requests to redeem shares issued by the fund without significant dilution of the remaining investors’ interests in the fund. The Fund’s Board of Trustees/Directors has designated the investment adviser to serve as the administrator of the Program and the related procedures. The administrator has established a Liquidity Risk Management Oversight Committee (Committee) to perform the functions necessary to administer the Program. As part of the Program, the administrator is responsible for identifying illiquid investments and categorizing the relative liquidity of the Fund’s investments in accordance with the Liquidity Rule. Under the Program, the administrator assesses, manages, and periodically reviews the Fund’s liquidity risk, and is responsible for making certain reports to the Fund’s Board of Trustees/Directors and the Securities and Exchange Commission (SEC) regarding the liquidity of the Fund’s investments, and to notify the Board of Trustees/Directors and the SEC of certain liquidity events specified in the Liquidity Rule. The liquidity of the Fund’s portfolio investments is determined based on a number of factors including, but not limited to, relevant market, trading and investment-specific considerations under the Program.
At a meeting of the Fund’s Board of Trustees/Directors, the Committee provided a written report to the Fund’s Board of Trustees/Directors pertaining to the operation, adequacy, and effectiveness of implementation of the Program, as well as the operation of the highly liquid investment minimum (if applicable) for the period December 1, 2018 through December 31, 2019 (Review Period). The Program operated effectively during the Review Period, supporting the administrator’s ability to assess, manage and monitor Fund liquidity risk, including during periods of market volatility and net redemptions. During the Review Period, the Fund met redemption requests on a timely basis.
There can be no assurance that the Program will achieve its objectives in the future. Please refer to the Fund’s prospectus for more information regarding the Fund’s exposure to liquidity risk and other principal risks to which an investment in the Fund may be subject.
Calvert
Small-Cap Fund
September 30, 2020
Management and Organization
Fund Management. The Directors of Calvert Impact Fund, Inc. (the Corporation) are responsible for the overall management and supervision of the Corporation’s affairs. The Directors and officers of the Corporation are listed below. Except as indicated, each individual has held the office shown or other offices in the same company for the last five years. Directors and officers of the Corporation hold indefinite terms of office. The “Independent Directors” consist of those Directors who are not “interested persons” of the Corporation, as that term is defined under the 1940 Act. The business address of each Director and officer, with the exception of Ms. Gemma and Mr. Kirchner, is 1825 Connecticut Avenue NW, Suite 400, Washington, DC 20009. As used below, “CRM” refers to Calvert Research and Management. Each Director oversees 39 funds in the Calvert fund complex. Each officer serves as an officer of certain other Calvert funds.
| Name and Year of Birth | Corporation
Position(s) | Position
Start Date | Principal Occupation(s) and Other Directorships
During Past Five Years and Other Relevant Experience | |
| Interested Director | |
John H. Streur(1)
1960 | Director &
President | 2015 | President and Chief Executive Officer of Calvert Research and
Management (since December 31, 2016). President and Chief Executive
Officer of Calvert Investments, Inc. (January 2015 - December 2016);
Chief Executive Officer of Calvert Investment Distributors, Inc. (August
2015 - December 2016); Chief Compliance Officer of Calvert Investment
Management, Inc. (August 2015 - April 2016); President and Director, Portfolio 21 Investments, Inc. (through October 2014); President,
Chief Executive Officer and Director, Managers Investment Group LLC
(through January 2012); President and Director, The Managers Funds
and Managers AMG Funds (through January 2012).
Other Directorships in the Last Five Years. Portfolio 21 Investments,
Inc. (asset management) (through October 2014); Managers Investment
Group LLC (asset management) (through January 2012); The Managers
Funds (asset management) (through January 2012); Managers AMG Funds
(asset management) (through January 2012); Calvert Impact Capital, Inc. | |
| Independent Directors | |
Richard L. Baird, Jr.
1948 | Director | 2005 | Regional Disaster Recovery Lead, American Red Cross of Greater
Pennsylvania (since 2017). Volunteer, American Red Cross (since 2015).
Former President and CEO of Adagio Health Inc. (retired in 2014) in
Pittsburgh, PA.
Other Directorships in the Last Five Years. None. | |
Alice Gresham Bullock
1950 | Chair &
Director | 2016 | Professor Emerita at Howard University School of Law. Dean Emerita of
Howard University School of Law and Deputy Director of the Association
of American Law Schools (1992-1994).
Other Directorships in the Last Five Years. None. | |
Cari M. Dominguez
1949 | Director | 2016 | Former Chair of the U.S. Equal Employment Opportunity Commission.
Other Directorships in the Last Five Years. Manpower, Inc. (employment
agency); Triple S Management Corporation (managed care); National
Association of Corporate Directors. | |
John G. Guffey, Jr.(2)
1948 | Director | 2005 | President of Aurora Press Inc., a privately held publisher of trade
paperbacks (since January 1997).
Other Directorships in the Last Five Years. Calvert Impact Capital, Inc.
(through December 31, 2018); Calvert Ventures, LLC. | |
Miles D. Harper, III
1962 | Director | 2000 | Partner, Carr Riggs & Ingram (public accounting firm) since October 2014.
Partner, Gainer Donnelly & Desroches (public accounting firm) (now Carr
Riggs & Ingram), (November 1999-September 2014).
Other Directorships in the Last Five Years. Bridgeway Funds (9) (asset
management). | |
Joy V. Jones
1950 | Director | 2000 | Attorney.
Other Directorships in the Last Five Years. Conduit Street Restaurants
SUD 2 Limited; Palm Management Restaurant Corporation. | |
Calvert
Small-Cap Fund
September 30, 2020
Management and Organization — continued
| Name and Year of Birth | Corporation
Position(s) | Position
Start Date | Principal Occupation(s) and Other Directorships
During Past Five Years and Other Relevant Experience | |
| Independent Directors (continued) |
Anthony A. Williams
1951 | Director | 2016 | CEO and Executive Director of the Federal City Council (July 2012 to
present); Senior Adviser and Independent Consultant for King and
Spalding LLP (September 2015 to present); Executive Director of Global
Government Practice at the Corporate Executive Board (January 2010 to
January 2012).
Other Directorships in the Last Five Years. Freddie Mac; Evoq
Properties/Meruelo Maddux Properties, Inc. (real estate management);
Weston Solutions, Inc. (environmental services); Bipartisan Policy Center’s
Debt Reduction Task Force; Chesapeake Bay Foundation; Catholic
University of America; Urban Institute (research organization). | |
| Name and Year of Birth | Corporation
Position(s) | Position
Start Date | Principal Occupation(s)
During Past Five Years | |
| Principal Officers who are not Directors | |
Hope L. Brown
1973 | Chief
Compliance
Officer | 2014 | Chief Compliance Officer of 39 registered investment companies advised
by CRM (since 2014). Vice President and Chief Compliance Officer,
Wilmington Funds (2012-2014). | |
Maureen A. Gemma(3)
1960 | Secretary,
Vice President
and Chief
Legal Officer | 2016 | Vice President of CRM and officer of 39 registered investment
companies advised by CRM (since 2016). Also Vice President of
Eaton Vance and certain of its affiliates and officer of 156 registered
investment companies advised or administered by Eaton Vance. | |
James F. Kirchner(3)
1967 | Treasurer | 2016 | Vice President of CRM and officer of 39 registered investment companies
advised by CRM (since 2016). Also Vice President of Eaton Vance and
certain of its affiliates and officer of 156 registered investment companies
advised or administered by Eaton Vance. | |
| (1) Mr. Streur is an interested person of the Fund because of his positions with the Fund’s adviser and certain affiliates. | |
| (2) Mr. Guffey is currently married to Rebecca L. Adamson, who served as a member of the Advisory Council through December 31, 2019. | |
| (3) The business address for Ms. Gemma and Mr. Kirchner is Two International Place, Boston, MA 02110. | |
The SAI for the Fund includes additional information about the Directors and officers of the Fund and can be obtained without charge on Calvert’s website at www.calvert.com or by calling 1-800-368-2745.
Privacy. The Eaton Vance organization is committed to ensuring your financial privacy. Each entity listed below has adopted a privacy policy and procedures (“Privacy Program”) Eaton Vance believes is reasonably designed to protect your personal information and to govern when and with whom Eaton Vance may share your personal information.
| • | At the time of opening an account, Eaton Vance generally requires you to provide us with certain information such as name, address, social security number, tax status, account numbers, and account balances. This information is necessary for us to both open an account for you and to allow us to satisfy legal requirements such as applicable anti-money laundering reviews and know-your-customer requirements. |
| • | On an ongoing basis, in the normal course of servicing your account, Eaton Vance may share your information with unaffiliated third parties that perform various services for Eaton Vance and/or your account. These third parties include transfer agents, custodians, broker/dealers and our professional advisers, including auditors, accountants, and legal counsel. Eaton Vance may additionally share your personal information with our affiliates. |
| • | We believe our Privacy Program is reasonably designed to protect the confidentiality of your personal information and to prevent unauthorized access to that information. |
| • | We reserve the right to change our Privacy Program at any time upon proper notification to you. You may want to review our Privacy Program periodically for changes by accessing the link on our homepage: www.calvert.com. |
Our pledge of protecting your personal information applies to the following entities within the Eaton Vance organization: the Eaton Vance Family of Funds, Eaton Vance Management, Eaton Vance Investment Counsel, Eaton Vance Distributors, Inc., Eaton Vance Trust Company, Eaton Vance Management (International) Limited, Eaton Vance Advisers International Ltd., Eaton Vance Global Advisors Limited, Eaton Vance Management's Real Estate Investment Group, Boston Management and Research, Calvert Research and Management, and Calvert Funds. This Privacy Notice supersedes all previously issued privacy disclosures. For more information about our Privacy Program or about how your personal information may be used, please call 1-800-368-2745.
Delivery of Shareholder Documents. The Securities and Exchange Commission (SEC) permits funds to deliver only one copy of shareholder documents, including prospectuses, proxy statements and shareholder reports, to fund investors with multiple accounts at the same residential or post office box address. This practice is often called “householding” and it helps eliminate duplicate mailings to shareholders. Calvert funds, or your financial intermediary, may household the mailing of your documents indefinitely unless you instruct Calvert funds, or your financial intermediary, otherwise. If you would prefer that your Calvert fund documents not be householded, please contact Calvert funds at 1-800-368-2745, or contact your financial intermediary. Your instructions that householding not apply to delivery of your Calvert fund documents will typically be effective within 30 days of receipt by Calvert funds or your financial intermediary. Separate statements will be generated for each separate account and will be householded as described above.
Portfolio Holdings. Each Calvert fund files a schedule of portfolio holdings on Part F to Form N-PORT with the SEC. Certain information filed on Form N-PORT may be viewed on the Calvert website at www.calvert.com, by calling Calvert at 1-800-368-2745 or in the EDGAR database on the SEC’s website at www.sec.gov.
Proxy Voting. The Proxy Voting Guidelines that each Calvert fund uses to determine how to vote proxies relating to portfolio securities is provided as an Appendix to the fund’s Statement of Additional Information. The Statement of Additional Information can be obtained free of charge by calling the Calvert funds at 1-800-368-2745, by visiting the Calvert funds’ website at www.calvert.com or visiting the SEC’s website at www.sec.gov. Information regarding how a Calvert fund voted proxies relating to portfolio securities during the most recent 12-month period ended June 30 is available by calling Calvert funds, by visiting the Calvert funds’ website at www.calvert.com or by visiting the SEC’s website at www.sec.gov.
This Page Intentionally Left Blank
This Page Intentionally Left Blank
Investment Adviser and Administrator
Calvert Research and Management
1825 Connecticut Avenue NW, Suite 400
Washington, DC 20009
Principal Underwriter*
Eaton Vance Distributors, Inc.
Two International Place
Boston, MA 02110
(617) 482-8260
Custodian
State Street Bank and Trust Company
State Street Financial Center, One Lincoln Street
Boston, MA 02111
Transfer Agent
DST Asset Manager Solutions, Inc.
2000 Crown Colony Drive
Quincy, MA 02169
Independent Registered Public Accounting Firm
KPMG LLP
1601 Market Street
Philadelphia, PA 19103-2499
Fund Offices
1825 Connecticut Avenue NW, Suite 400
Washington, DC 20009
* FINRA BrokerCheck. Investors may check the background of their Investment Professional by contacting the Financial Industry Regulatory Authority (FINRA). FINRA BrokerCheck is a free tool to help investors check the professional background of current and former FINRA-registered securities firms and brokers. FINRA BrokerCheck is available by calling 1-800-289-9999 and at www.FINRA.org. The FINRA BrokerCheck brochure describing this program is available to investors at www.FINRA.org.
Printed on recycled paper.
The registrant has adopted a code of ethics applicable to its Principal Executive Officer, Principal Financial Officer and Principal Accounting Officer. The registrant undertakes to provide a copy of such code of ethics to any person upon request, without charge, by calling 1-800-368-2745. The registrant has not amended the code of ethics as described in Form N-CSR during the period covered by this report. The registrant has not granted any waiver, including an implicit waiver, from a provision of the code of ethics as described in Form N-CSR during the period covered by this report.
| Item 3. | Audit Committee Financial Expert |
The registrant’s Board of Directors has determined that Miles D. Harper III, an “independent” Director serving on the registrant’s audit committee, is an “audit committee financial expert,” as defined in Item 3 of Form N-CSR. Under applicable securities laws, a person who is determined to be an audit committee financial expert
will not be deemed an “expert” for any purpose, including without limitation for the purposes of Section 11 of the Securities Act of 1933, as a result of being designated or identified as an audit committee financial expert. The designation or identification of a person as an audit committee financial expert does not impose on such person any duties, obligations, or liabilities that are greater than the duties, obligations, and liabilities imposed on such person as a member of the audit committee and Board of Directors in the absence of such designation or identification.
| Item 4. | Principal Accountant Fees and Services |
(a) –(d)
The following table presents the aggregate fees billed to the registrant for the registrant’s fiscal years ended September 30, 2019 and September 30, 2020 by KPMG for professional services rendered for the audit of the registrant’s annual financial statements and fees billed for other services rendered by KPMG during such periods.
| | | | | | | | | | | | | | | | |
Fiscal Years Ended | | 9/30/19 | | | %* | | | 9/30/20 | | | %* | |
Audit Fees | | $ | 91,060 | | | | 0 | % | | $ | 93,275 | | | | 0 | % |
Audit-Related Fees(1) | | $ | 0 | | | | 0 | % | | $ | 0 | | | | 0 | % |
Tax Fees(2) | | $ | 22,200 | | | | 0 | % | | $ | 21,635 | | | | 0 | % |
All Other Fees(3) | | $ | 0 | | | | 0 | % | | $ | 0 | | | | 0 | % |
| | | | | | | | | | | | | | | | |
Total | | $ | 113,260 | | | | 0 | % | | $ | 114,910 | | | | 0 | % |
| | | | | | | | | | | | | | | | |
| * | Percentage of fees approved by the Audit Committee pursuant to (c )(7)(i)(C ) of Rule 2-01 of Reg. S-X (statutory de minimis waiver of Committee’s requirement to pre-approve). |
| (1) | Audit-related fees consist of the aggregate fees billed for assurance and related services that are reasonably related to the performance of the audit of the registrant’s financial statements and are not reported under the category of audit fees. |
| (2) | Tax fees consist of the aggregate fees billed for professional services rendered by the principal accountant relating to tax compliance, tax advice, and tax planning and specifically include fees for tax return preparation and other related tax compliance/planning matters. |
| (3) | All other fees consist of the aggregate fees billed for products and services provided by the principal accountant other than audit, audit-related, and tax services. |
(e) The Audit Committee is required to pre-approve all audit and non-audit services provided to the registrant by the auditors, and to the registrant’s investment adviser, and any entity controlling, controlled by, or under common control with the adviser that provides ongoing services to the registrant. In determining whether to pre-approve non-audit services, the Audit Committee considers whether the services are consistent with maintaining the independence of the auditors. The Committee may delegate its authority to pre-approve certain matters to one or more of its members. In this regard, the Committee has delegated authority jointly to the Audit Committee Chair together with another Committee member with respect to non-audit services not exceeding $25,000 in each instance. In addition, the Committee has pre-approved the retention of the auditors to provide tax-related services related to the tax treatment and tax accounting of newly acquired securities, upon request by the investment adviser in each instance.
(f) Not applicable.
(g) Aggregate non-audit fees billed by the registrant’s accountant for services rendered to the registrant, and rendered to the registrant’s investment adviser, and any entity controlling, controlled by, or under common
control with the adviser that provides ongoing services to the registrant for each of the last two fiscal years of the registrant:
| | | | | | |
| Fiscal Year ended 9/30/19 | | Fiscal Year ended 9/30/20 |
| $ | | %* | | $ | | %* |
| $22,200 | | 0% | | $21,635 | | 0% |
| * | Percentage of fees approved by the Audit Committee pursuant to (c)(7)(i)(C) of Rule 2-01 of Reg. S-X (statutory de minimis waiver of Committee’s requirement to pre-approve). |
(h) The registrant’s audit committee has considered whether the provision by the registrant’s principal accountant of non-audit services to the registrant’s investment adviser and any entity controlling, controlled by, or under common control with the adviser that provides ongoing services to the registrant that were not pre-approved pursuant to Rule 2-01(c)(7)(ii) of Regulation S-X is compatible with maintaining the principal accountant’s independence.
| Item 5. | Audit Committee of Listed Registrants |
Not applicable.
| Item 6. | Schedule of Investments |
Please see schedule of investments contained in the Report to Stockholders included under Item 1 of this Form N-CSR.
| Item 7. | Disclosure of Proxy Voting Policies and Procedures for Closed-End Management Investment Companies |
Not applicable.
| Item 8. | Portfolio Managers of Closed-End Management Investment Companies |
Not applicable.
| Item 9. | Purchases of Equity Securities by Closed-End Management Investment Company and Affiliated Purchasers |
Not applicable.
| Item 10. | Submission of Matters to a Vote of Security Holders |
No material changes.
| Item 11. | Controls and Procedures |
(a) The registrant’s principal executive and principal financial officers have concluded that the registrant’s disclosure controls and procedures (as defined in Rule 30a-3(c) under the Investment Company Act of 1940 Act, as amended (the “1940 Act”) are effective, based on the evaluation of these controls and procedures required by Rule 30a-3(b) under the 1940 Act and Rules 13a-15(b) or 15d-15(b) under the Securities Exchange Act of 1934 (“Exchange Act”), as of a date within 90 days of the filing date of this report.
(b) There was no change in the registrant’s internal control over financial reporting (as defined in Rule 30a-3(d) under the 1940 Act) that occurred during the period covered by this report that has materially affected, or is reasonably likely to materially affect, the registrant’s internal control over financial reporting.
| Item 12. | Disclosure of Securities Lending Activities for Closed-End Management Investment Companies |
Not applicable.
Signatures
Pursuant to the requirements of the Securities Exchange Act of 1934 and the Investment Company Act of 1940, the registrant has duly caused this report to be signed on its behalf by the undersigned, thereunto duly authorized.
CALVERT IMPACT FUND, INC.
| | |
| By: | | /s/ John H. Streur |
| | John H. Streur |
| | President |
| |
| Date: | | November 20, 2020 |
Pursuant to the requirements of the Securities Exchange Act of 1934 and the Investment Company Act of 1940, this report has been signed below by the following persons on behalf of the registrant and in the capacities and on the dates indicated.
| | |
| By: | | /s/ James F. Kirchner |
| | James F. Kirchner |
| | Treasurer |
| |
| Date: | | November 20, 2020 |
| |
| By: | | /s/ John H. Streur |
| | John H. Streur |
| | President |
| |
| Date: | | November 20, 2020 |