UNITED STATES
SECURITIES AND EXCHANGE COMMISSION
Washington, D.C. 20549
Form N-CSR
CERTIFIED SHAREHOLDER REPORT OF REGISTERED
MANAGEMENT INVESTMENT COMPANIES
Investment Company Act File Number: 811-10045
CALVERT IMPACT FUND, INC.
(Exact Name of Registrant as Specified in Charter)
2050 M Street NW, Washington, DC 20036
(Address of Principal Executive Offices)
Deidre E. Walsh
Two International Place, Boston, Massachusetts 02110
(Name and Address of Agent for Services)
(202) 238-2200
(Registrant’s Telephone Number)
September 30
Date of Fiscal Year End
September 30, 2023
Date of Reporting Period
Item 1. Reports to Stockholders
Calvert
Green Bond Fund
Annual Report
September 30, 2023
Commodity Futures Trading Commission Registration. The Commodity Futures Trading Commission (“CFTC”) has adopted regulations that subject registered investment companies and advisers to regulation by the CFTC if a fund invests more than a prescribed level of its assets in certain CFTC-regulated instruments (including futures, certain options and swap agreements) or markets itself as providing investment exposure to such instruments. The adviser has claimed an exclusion from the definition of “commodity pool operator” under the Commodity Exchange Act with respect to its management of the Fund and the other funds it manages. Accordingly, neither the Fund nor the adviser is subject to CFTC regulation.
Fund shares are not insured by the FDIC and are not deposits or other obligations of, or guaranteed by, any depository institution. Shares are subject to investment risks, including possible loss of principal invested.
This report must be preceded or accompanied by a current summary prospectus or prospectus. Before investing, investors should consider carefully the investment objective, risks, and charges and expenses of a mutual fund. This and other important information is contained in the summary prospectus and prospectus, which can be obtained from a financial intermediary. Prospective investors should read the prospectus carefully before investing. For further information, please call 1-800-368-2745.
Choose Planet-friendly E-delivery!
Sign up now for on-line statements, prospectuses, and fund reports. In less than five minutes you can help reduce paper mail and lower fund costs.
Just go to www.calvert.com. If you already have an online account with the Calvert funds, click on Login to access your Account and select the documents you would like to receive via e-mail.
If you’re new to online account access, click on Login, then Register to create your user name and password. Once you’re in, click on the E-delivery sign-up on the Account Portfolio page and follow the quick, easy steps.
Note: If your shares are not held directly with the Calvert funds but through a brokerage firm, you must contact your broker for electronic delivery options available through their firm.
Annual Report September 30, 2023
Calvert
Green Bond Fund
Calvert
Green Bond Fund
September 30, 2023
Management's Discussion of Fund Performance†
Economic and Market Conditions
For fixed-income investors, the dominant event during the 12-month period ended September 30, 2023, was the series of U.S. Federal Reserve (Fed) interest rate hikes -- six during the period, and 11 in total -- that brought the federal funds rate to its highest level in 22 years.
But while the Fed’s campaign to tamp down inflation led to negative performance for government bonds, corporate bond returns were strongly positive during the period -- buoyed in part by the very factors that were fueling inflation: record low unemployment, strong job creation, and robust consumer spending.
By the summer of 2023, a majority of economists and market observers seemed to be coming around to the view that Jerome Powell’s Fed might be able to accomplish what had seldom, if ever, been done before: raise rates significantly to lower inflation and still bring the economy in for a soft landing without a recession.
One cloud that hung over fixed-income markets during the period, however, was fear that even after it finished raising rates, the Fed would leave rates higher for longer than investors had previously anticipated. During the final two months of the period -- and especially after the Fed’s September 2023 meeting -- longer-term interest rates rose dramatically, as investor expectations of how high rates would go -- and how long they would stay there -- seemed to get higher and longer.
Against the backdrop of the Fed’s aggressive monetary tightening campaign, U.S. Treasurys were the worst-performing major fixed-income asset class during the 12-month period, with the Bloomberg U.S. Treasury Index returning -0.81%.
In contrast, the strong U.S. economy and increasing confidence in a soft-landing scenario served as tailwinds for investment-grade corporate bonds. Even in a rising-rate environment, the Bloomberg U.S. Corporate Bond Index returned 3.65% during the period.
High yield bonds were the standout performer among major fixed-income asset classes, with the Bloomberg U.S. Corporate High Yield Index returning 10.28% during the period. With a strong U.S. economy helping keep bond defaults low, and a recession looking increasingly remote, investors gravitated toward riskier investments with greater yields.
Asset-backed securities -- including bonds backed by automobile and consumer loans -- benefited from strong consumer balance sheets and spending during the period, with the Bloomberg U.S. Asset-Backed Securities Index returning 2.81%.
Mortgage-backed securities (MBS), however, were dogged by two technical factors that depressed prices, causing the Bloomberg U.S. Mortgage-Backed Securities Index to return -0.17% during the period. As the Fed lowered its balance sheet, it sold off much of its MBS holdings. And several regional banks that had been significant buyers of MBS were forced by the banking crisis of March 2023 to liquidate their assets. The resulting release of a significant amount of MBS into the market led prices to fall and the asset class to deliver negative returns.
Fund Performance
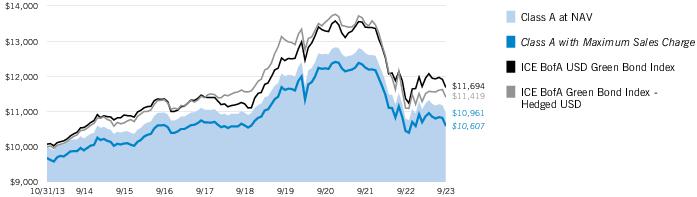
For the 12-month period ended September 30, 2023, Calvert Green Bond Fund (the Fund) returned 1.49% for Class A shares at net asset value (NAV), underperforming its benchmark, the ICE BofA USD Green Bond Index (the Index), which returned 2.85%.
Security selections were the leading detractor from returns relative to the Index during the period. Selections in investment-grade corporate securities and government-related securities particularly weighed on relative returns. The Fund’s sector allocations, especially out-of-Index allocations to asset-backed securities and commercial mortgage-backed securities, also detracted from relative performance during the period.
On the positive side, the Fund’s duration and yield-curve positioning led contributors to relative performance during the period. While sector allocations detracted overall, underweight allocations to government-related securities and non-U.S. government bonds, and an out-of-Index allocation to high yield corporate bonds contributed to relative returns during the period.
The use of U.S. Treasury futures and options on U.S. Treasury futures to manage interest rate duration had a negative impact on total returns during the period.
See Endnotes and Additional Disclosures in this report.
Past performance is no guarantee of future results. Returns are historical and are calculated by determining the percentage change in net asset value (NAV) or offering price (as applicable) with all distributions reinvested. Furthermore, returns do not reflect the deduction of taxes that shareholders may have to pay on Fund distributions or upon the redemption of Fund shares. Investment return and principal value will fluctuate so that shares, when redeemed, may be worth more or less than their original cost. Performance for periods less than or equal to one year is cumulative. Performance is for the stated time period only; due to market volatility, current Fund performance may be lower or higher than the quoted return. For performance as of the most recent month-end, please refer to www.calvert.com.
Calvert
Green Bond Fund
September 30, 2023
Performance
Portfolio Manager(s) Vishal Khanduja, CFA and Brian S. Ellis, CFA, each of Calvert Research and Management
| % Average Annual Total Returns1,2 | Class
Inception Date | Performance
Inception Date | One Year | Five Years | Since
Inception |
| Class A at NAV | 10/31/2013 | 10/31/2013 | 1.49% | —% 3 | 0.93% |
| Class A with 3.25% Maximum Sales Charge | — | — | (1.78) | (0.66) | 0.60 |
| Class I at NAV | 10/31/2013 | 10/31/2013 | 1.67 | 0.25 | 1.24 |
| Class R6 at NAV | 02/01/2019 | 10/31/2013 | 1.72 | 0.31 | 1.28 |
|
| ICE BofA USD Green Bond Index | — | — | 2.85% | 0.84% | 1.52% |
| ICE BofA Green Bond Index - Hedged USD | — | — | 2.89 | (0.24) | 1.35 |
| % Total Annual Operating Expense Ratios4 | Class A | Class I | Class R6 |
| Gross | 0.77% | 0.52% | 0.47% |
| Net | 0.73 | 0.48 | 0.43 |
Growth of $10,000
This graph shows the change in value of a hypothetical investment of $10,000 in Class A of the Fund for the period indicated. For comparison, the same investment is shown in the indicated index.
| Growth of Investment2 | Amount Invested | Period Beginning | At NAV | With Maximum Sales Charge |
| Class I, at minimum investment | $1,000,000 | 10/31/2013 | $1,130,371 | N.A. |
| Class R6, at minimum investment | $5,000,000 | 10/31/2013 | $5,669,822 | N.A. |
See Endnotes and Additional Disclosures in this report.
Past performance is no guarantee of future results. Returns are historical and are calculated by determining the percentage change in net asset value (NAV) or offering price (as applicable) with all distributions reinvested. Furthermore, returns do not reflect the deduction of taxes that shareholders may have to pay on Fund distributions or upon the redemption of Fund shares. Investment return and principal value will fluctuate so that shares, when redeemed, may be worth more or less than their original cost. Performance for periods less than or equal to one year is cumulative. Performance is for the stated time period only; due to market volatility, current Fund performance may be lower or higher than the quoted return. For performance as of the most recent month-end, please refer to www.calvert.com.
Calvert
Green Bond Fund
September 30, 2023
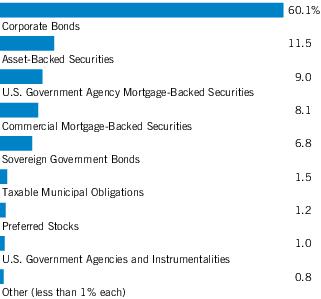
| Asset Allocation (% of total investments) |
| Credit Quality (% of bond holdings)1 |
| Country Allocation (% of total investments) | |
| United States | 69.1% |
| Netherlands | 5.4 |
| Luxembourg | 4.9 |
| Canada | 2.6 |
| Germany | 2.4 |
| Italy | 2.1 |
| Norway | 1.9 |
| France | 1.5 |
| United Kingdom | 1.3 |
| Israel | 1.2 |
| Spain | 1.1 |
| Sweden | 1.0 |
| South Korea | 1.0 |
| Other (less than 1.0% each) | 4.5 |
| Total | 100.0% |
Footnotes:
| 1 | For purposes of the Fund's rating restrictions, ratings are based on Moody's Investors Service, Inc. (“Moody's”), S&P Global Ratings (“S&P”) or Fitch Ratings (“Fitch”), or Kroll Bond Rating Agency, LLC (“Kroll”) for securitized debt instruments only (such as asset-backed securities (“ABS”) and mortgage-backed securities (“MBS”)), as applicable. If securities are rated differently by the ratings agencies, the highest rating is applied. Ratings, which are subject to change, apply to the creditworthiness of the issuers of the underlying securities and not to the Fund or its shares. Credit ratings measure the quality of an issuance based on the issuer's creditworthiness, with ratings ranging from AAA, being the highest, to D, being the lowest based on S&P's measures. Ratings of BBB or higher by S&P, Fitch or Kroll (Baa or higher by Moody's) are considered to be investment-grade quality. Credit ratings are based largely on the ratings agency's analysis at the time of rating. The rating assigned to any particular security is not necessarily a reflection of the issuer's current financial condition and does not necessarily reflect its assessment of the volatility of a security's market value or of the liquidity of an investment in the security. Holdings designated as “Not Rated” (if any) are not rated by the national ratings agencies stated above. |
Calvert
Green Bond Fund
September 30, 2023
Endnotes and Additional Disclosures
| † | The views expressed in this report are those of the portfolio manager(s) and are current only through the date stated at the top of this page. These views are subject to change at any time based upon market or other conditions, and Calvert and the Fund(s) disclaim any responsibility to update such views. These views may not be relied upon as investment advice and, because investment decisions are based on many factors, may not be relied upon as an indication of trading intent on behalf of any Calvert fund. This commentary may contain statements that are not historical facts, referred to as “forward-looking statements.” The Fund’s actual future results may differ significantly from those stated in any forward-looking statement, depending on factors such as changes in securities or financial markets or general economic conditions, the volume of sales and purchases of Fund shares, the continuation of investment advisory, administrative and service contracts, and other risks discussed from time to time in the Fund’s filings with the Securities and Exchange Commission. |
| | |
| 1 | Both the ICE BofA USD Green Bond Index and ICE BofA Green Bond Index - Hedged USD track the performance of securities issued for qualified “green” purposes. Qualifying bonds must have a clearly designated use of proceeds that is solely applied toward projects or activities that promote climate change mitigation or adaptation or other environmental sustainability purposes. ICE® BofA® indices are not for redistribution or other uses; provided “as is”, without warranties, and with no liability. Eaton Vance has prepared this report and ICE Data Indices, LLC does not endorse it, or guarantee, review, or endorse Eaton Vance’s products. BofA® is a licensed registered trademark of Bank of America Corporation in the United States and other countries. Unless otherwise stated, index returns do not reflect the effect of any applicable sales charges, commissions, expenses, taxes or leverage, as applicable. It is not possible to invest directly in an index. |
| 2 | Total Returns at NAV do not include applicable sales charges. If sales charges were deducted, the returns would be lower. Total Returns shown with maximum sales charge reflect the stated maximum sales charge. Unless otherwise stated, performance does not reflect the deduction of taxes on Fund distributions or redemptions of Fund shares.Performance prior to the inception date of a class may be linked to the performance of an older class of the Fund. This linked performance is adjusted for any applicable sales charge, but is not adjusted for class expense differences. If adjusted for such differences, the performance would be different. The performance of Class R6 is linked to Class I. Performance since inception for an index, if presented, is the performance since the Fund’s or oldest share class’s inception, as applicable. Performance presented in the Financial Highlights included in the financial statements is not linked. |
| | The ICE BofA USD Green Bond Index commenced operations on December 31, 2014. The Since Inception return prior to that date reflects the Fund's previous primary benchmark, ICE BofA Green Bond Index - Hedged USD.Calvert Research and Management became the investment adviser to the Fund on December 31, 2016. Performance reflected prior to such date is that of the Fund’s former investment adviser. |
| 3 | Amount is less than 0.005%. |
| 4 | Source: Fund prospectus. Net expense ratios reflect a contractual expense reimbursement that continues through 2/1/25. The expense ratios for the current reporting period can be found in the Financial Highlights section of this report. Performance reflects expenses waived and/or reimbursed, if applicable. Without such waivers and/or reimbursements, performance would have been lower. |
| Fund profile subject to change due to active management. |
| | Important Notice to Shareholders |
| | Effective June 30, 2023, the Fund changed its primary benchmark to the ICE BofA USD Green Bond Index because the Adviser believes such benchmark better reflects the Fund’s investment portfolio. |
| | Additional Information |
| | Bloomberg U.S. Treasury Index measures the performance of U.S. Treasuries with a maturity of one year or more. Bloomberg U.S. Corporate Bond Index measures the performance of investment-grade U.S. corporate securities with a maturity of one year or more. Bloomberg U.S. Corporate High Yield Index measures USD-denominated, non- investment grade corporate securities. Bloomberg U.S. Asset-Backed Securities Index tracks the performance of U.S. dollar denominated investment grade, fixed rate asset-backed securities publicly issued in the U.S. domestic market. Bloomberg U.S. Mortgage-Backed Securities Index measures agency mortgage-backed pass-through securities issued by Ginnie Mae (GNMA), Fannie Mae (FNMA), and Freddie Mac (FHLMC). |
| | Duration is a measure of the expected change in price of a bond — in percentage terms — given a one percent change in interest rates, all else being constant. Securities with lower durations tend to be less sensitive to interest rate changes. |
| | Yield curve is a graphical representation of the yields offered by bonds of various maturities. The yield curve flattens when long-term interest rates fall and/or short-term interest rates increase, and the yield curve steepens when long-term interest rates increase and/or short-term interest rates fall. |
Calvert
Green Bond Fund
September 30, 2023
Example
As a Fund shareholder, you incur two types of costs: (1) transaction costs, including sales charges (loads) on purchases; and (2) ongoing costs, including management fees; distribution and/or service fees; and other Fund expenses. This Example is intended to help you understand your ongoing costs (in dollars) of Fund investing and to compare these costs with the ongoing costs of investing in other mutual funds. The Example is based on an investment of $1,000 invested at the beginning of the period and held for the entire period (April 1, 2023 to September 30, 2023).
Actual Expenses
The first section of the table below provides information about actual account values and actual expenses. You may use the information in this section, together with the amount you invested, to estimate the expenses that you paid over the period. Simply divide your account value by $1,000 (for example, an $8,600 account value divided by $1,000 = 8.6), then multiply the result by the number in the first section under the heading entitled “Expenses Paid During Period” to estimate the expenses you paid on your account during this period.
Hypothetical Example for Comparison Purposes
The second section of the table below provides information about hypothetical account values and hypothetical expenses based on the actual Fund expense ratio and an assumed rate of return of 5% per year (before expenses), which is not the actual Fund return. The hypothetical account values and expenses may not be used to estimate the actual ending account balance or expenses you paid for the period. You may use this information to compare the ongoing costs of investing in the Fund and other funds. To do so, compare this 5% hypothetical example with the 5% hypothetical examples that appear in the shareholder reports of the other funds.
Please note that the expenses shown in the table are meant to highlight your ongoing costs only and do not reflect any transactional costs, such as sales charges (loads). Therefore, the second section of the table is useful in comparing ongoing costs only, and will not help you determine the relative total costs of owning different funds. In addition, if these transactional costs were included, your costs would be higher.
| | Beginning
Account Value
(4/1/23) | Ending
Account Value
(9/30/23) | Expenses Paid
During Period*
(4/1/23 – 9/30/23) | Annualized
Expense
Ratio |
| Actual | | | | |
| Class A | $1,000.00 | $ 976.20 | $3.62 ** | 0.73% |
| Class I | $1,000.00 | $ 976.70 | $2.38 ** | 0.48% |
| Class R6 | $1,000.00 | $ 977.00 | $2.13 ** | 0.43% |
| Hypothetical | | | | |
| (5% return per year before expenses) | | | | |
| Class A | $1,000.00 | $1,021.41 | $3.70 ** | 0.73% |
| Class I | $1,000.00 | $1,022.66 | $2.43 ** | 0.48% |
| Class R6 | $1,000.00 | $1,022.91 | $2.18 ** | 0.43% |
| * | Expenses are equal to the Fund's annualized expense ratio for the indicated Class, multiplied by the average account value over the period, multiplied by 183/365 (to reflect the one-half year period). The Example assumes that the $1,000 was invested at the net asset value per share determined at the close of business on March 31, 2023. |
| ** | Absent a waiver and/or reimbursement of expenses by affiliate(s), expenses would be higher. |
Calvert
Green Bond Fund
September 30, 2023
| Asset-Backed Securities — 11.5% |
| Security | Principal
Amount
(000's omitted) | Value |
| GoodLeap Sustainable Home Solutions Trust: | | | |
| Series 2021-4GS, Class A, 1.93%, 7/20/48(1) | $ | 1,543 | $ 1,135,466 |
| Series 2021-5CS, Class A, 2.31%, 10/20/48(1) | | 1,348 | 1,017,073 |
| Series 2022-2CS, Class A, 4.00%, 4/20/49(1) | | 3,143 | 2,703,438 |
| Loanpal Solar Loan, Ltd.: | | | |
| Series 2020-1GS, Class C, 2.00%, 6/20/47(1) | | 4,037 | 2,430,515 |
| Series 2020-3GS, Class A, 2.47%, 12/20/47(1) | | 1,395 | 1,053,933 |
| Luminace ABS Issuer, LLC, Series 2022-1, Class A, 4.88%, 7/31/62(1) | | 2,807 | 2,542,297 |
| Mill City Solar Loan, Ltd., Series 2020-1A, Class C, 2.00%, 6/20/47(1) | | 473 | 310,915 |
| Mosaic Solar Loan Trust: | | | |
| Series 2018-1A, Class A, 4.01%, 6/22/43(1) | | 479 | 431,312 |
| Series 2018-1A, Class B, 2.00%, 6/22/43(1) | | 1,477 | 1,227,507 |
| Series 2019-1A, Class A, 4.37%, 12/21/43(1) | | 695 | 629,458 |
| Series 2019-2A, Class A, 2.88%, 9/20/40(1) | | 2,470 | 2,110,065 |
| Series 2019-2A, Class B, 3.28%, 9/20/40(1) | | 2,247 | 1,941,849 |
| Series 2019-2A, Class C, 4.35%, 9/20/40(1)(2) | | 0 | 87 |
| Series 2020-1A, Class A, 2.10%, 4/20/46(1) | | 1,039 | 878,184 |
| Series 2020-1A, Class B, 3.10%, 4/20/46(1) | | 1,195 | 1,021,169 |
| Series 2020-2A, Class B, 2.21%, 8/20/46(1) | | 1,475 | 1,148,069 |
| Series 2021-1A, Class B, 2.05%, 12/20/46(1) | | 851 | 645,166 |
| Series 2021-1A, Class C, 2.25%, 12/20/46(1) | | 678 | 596,213 |
| Series 2021-2A, Class A, 1.64%, 4/22/47(1) | | 1,933 | 1,522,219 |
| Series 2022-2A, Class B, 5.13%, 1/21/53(1) | | 1,876 | 1,630,297 |
| Mosaic Solar Loans, LLC: | | | |
| Series 2017-1A, Class A, 4.45%, 6/20/42(1) | | 335 | 313,741 |
| Series 2017-2A, Class A, 3.82%, 6/22/43(1) | | 39 | 35,148 |
| Series 2017-2A, Class C, 2.00%, 6/22/43(1) | | 157 | 153,069 |
| SolarCity LMC Series I, LLC, Series 2013-1, Class A, 4.80%, 11/20/38(1) | | 86 | 85,888 |
| Sunnova Helios II Issuer, LLC: | | | |
| Series 2019-AA, Class C, 5.32%, 6/20/46(1) | | 1,062 | 806,576 |
| Series 2021-B, Class B, 2.01%, 7/20/48(1) | | 3,194 | 2,573,393 |
| Sunnova Helios IV Issuer, LLC, Series 2020-AA, Class A, 2.98%, 6/20/47(1) | | 5,976 | 5,324,982 |
| Sunnova Helios V Issuer, LLC: | | | |
| Series 2021-A, Class A, 1.80%, 2/20/48(1) | | 2,461 | 2,073,776 |
| Series 2021-A, Class B, 3.15%, 2/20/48(1) | | 4,375 | 3,414,820 |
| Sunnova Sol II Issuer, LLC: | | | |
| Series 2020-2A, Class A, 2.73%, 11/1/55(1) | | 1,850 | 1,456,549 |
| Series 2020-2A, Class B, 5.47%, 11/1/55(1) | | 6,724 | 5,338,636 |
| Sunnova Sol Issuer, LLC: | | | |
| Series 2020-1A, Class A, 3.35%, 2/1/55(1) | | 2,674 | 2,248,751 |
| Series 2020-1A, Class B, 5.54%, 2/1/55(1) | | 1,572 | 1,309,463 |
| Sunrun Atlas Issuer, LLC, Series 2019-2, Class A, 3.61%, 2/1/55(1) | | 2,258 | 1,965,882 |
| Sunrun Callisto Issuer, LLC, Series 2015-1A, Class B, 5.38%, 7/20/45(1) | | 656 | 626,481 |
| Security | Principal
Amount
(000's omitted) | Value |
| Sunrun Demeter Issuer, LLC, Series 2021-2A, Class A, 2.27%, 1/30/57(1) | $ | 7,554 | $ 5,985,719 |
| Sunrun Jupiter Issuer, LLC, Series 2022-1A, Class A, 4.75%, 7/30/57(1) | | 4,073 | 3,551,570 |
| Sunrun Vulcan Issuer, LLC, Series 2021-1A, Class A, 2.46%, 1/30/52(1) | | 4,893 | 4,039,647 |
| Sunrun Xanadu Issuer, LLC, Series 2019-1A, Class A, 3.98%, 6/30/54(1) | | 1,860 | 1,630,064 |
| Tesla Auto Lease Trust: | | | |
| Series 2021-A, Class B, 1.02%, 3/20/25(1) | | 1,700 | 1,687,625 |
| Series 2021-A, Class D, 1.34%, 3/20/25(1) | | 3,500 | 3,445,059 |
| Series 2023-B, Class A3, 6.13%, 9/21/26(1) | | 4,986 | 4,986,843 |
| Vivint Solar Financing V, LLC, Series 2018-1A, Class A, 4.73%, 4/30/48(1) | | 1,345 | 1,208,774 |
| Vivint Solar Financing VII, LLC, Series 2020-1A, Class A, 2.21%, 7/31/51(1) | | 4,688 | 3,681,547 |
Total Asset-Backed Securities
(identified cost $98,561,248) | | | $ 82,919,235 |
| Commercial Mortgage-Backed Securities — 8.1% |
| Security | Principal
Amount
(000's omitted) | Value |
| Federal Home Loan Mortgage Corp. Multifamily Structured Pass Through Certificates: | | | |
| Series KG02, Class A2, 2.412%, 8/25/29 | $ | 4,050 | $ 3,494,873 |
| Series KG03, Class A2, 1.297%, 6/25/30(3) | | 3,760 | 2,939,942 |
| Series KG04, Class A1, 0.845%, 6/25/30 | | 3,707 | 3,126,749 |
| Series KG08, Class A2, 4.134%, 5/25/33(3) | | 10,000 | 9,150,643 |
| Federal National Mortgage Association: | | | |
| Series 2017-M13, Class A2, 3.029%, 9/25/27(3) | | 5,273 | 4,863,849 |
| Series 2018-M4, Class A2, 3.166%, 3/25/28(3) | | 9,965 | 9,192,763 |
| Series 2018-M13, Class A2, 3.866%, 9/25/30(3) | | 5,488 | 5,070,061 |
| Series 2019-M1, Class A2, 3.665%, 9/25/28(3) | | 5,050 | 4,723,854 |
| Series 2019-M22, Class A2, 2.522%, 8/25/29 | | 6,410 | 5,584,489 |
| Series 2020-M1, Class A2, 2.444%, 10/25/29 | | 7,842 | 6,742,821 |
| Series 2020-M20, Class A2, 1.435%, 10/25/29 | | 4,250 | 3,417,898 |
Total Commercial Mortgage-Backed Securities
(identified cost $64,978,974) | | | $ 58,307,942 |
| Security | Principal
Amount*
(000’s omitted) | Value |
| Communications — 2.5% | |
| Comcast Corp., 4.65%, 2/15/33(4) | | 6,000 | $ 5,620,403 |
| Verizon Communications, Inc.: | | | |
| 1.50%, 9/18/30 | | 11,734 | 8,907,295 |
7
See Notes to Financial Statements.
Calvert
Green Bond Fund
September 30, 2023
Schedule of Investments — continued
| Security | Principal
Amount*
(000’s omitted) | Value |
| Communications (continued) | |
| Verizon Communications, Inc.: (continued) | | | |
| 2.85%, 9/3/41 | | 2,600 | $ 1,682,640 |
| 3.875%, 3/1/52 | | 2,300 | 1,620,614 |
| | | | $ 17,830,952 |
| Consumer, Cyclical — 3.8% | |
| Ford Motor Co., 3.25%, 2/12/32 | | 7,121 | $ 5,494,873 |
| General Motors Co.: | | | |
| 5.40%, 10/15/29(4) | | 2,300 | 2,193,652 |
| 5.60%, 10/15/32(4) | | 13,327 | 12,453,924 |
| Hyundai Capital America, 5.80%, 6/26/25(1) | | 5,280 | 5,259,862 |
| Walmart, Inc., 1.80%, 9/22/31 | | 2,482 | 1,954,701 |
| | | | $ 27,357,012 |
| Consumer, Non-cyclical — 1.0% | |
| Coca-Cola Femsa SAB de CV, 1.85%, 9/1/32 | | 3,470 | $ 2,584,334 |
| Conservation Fund (The), 3.474%, 12/15/29 | | 2,345 | 1,981,638 |
| Kaiser Foundation Hospitals, 3.15%, 5/1/27 | | 1,208 | 1,131,026 |
| PepsiCo, Inc.: | | | |
| 2.875%, 10/15/49 | | 1,065 | 697,577 |
| 3.90%, 7/18/32 | | 775 | 706,692 |
| | | | $ 7,101,267 |
| Energy — 0.3% | |
| TerraForm Power Operating, LLC, 4.75%, 1/15/30(1) | | 2,165 | $ 1,852,493 |
| | | | $ 1,852,493 |
| Financial — 23.4% | |
| Alexandria Real Estate Equities, Inc.: | | | |
| 2.00%, 5/18/32 | | 6,900 | $ 5,021,816 |
| 4.75%, 4/15/35 | | 3,332 | 2,932,936 |
| AXA S.A., 1.375% to 4/7/31, 10/7/41(5)(6) | EUR | 3,000 | 2,412,464 |
| Banco Santander S.A., 0.625% to 6/24/28, 6/24/29(5)(6) | EUR | 4,500 | 3,989,821 |
| Bank Hapoalim BM, 3.255% to 1/21/27, 1/21/32(1)(5)(6) | | 7,600 | 6,507,454 |
| Bank Leumi Le-Israel BM, 7.129% to 4/18/28, 7/18/33(1)(5)(6) | | 2,361 | 2,322,662 |
| Bank of America Corp., 2.456% to 10/22/24, 10/22/25(5) | | 27,325 | 26,250,476 |
| BNP Paribas S.A.: | | | |
| 0.375% to 10/14/26, 10/14/27(5)(6) | EUR | 7,500 | 7,024,634 |
| 1.675% to 6/30/26, 6/30/27(1)(5) | | 1,155 | 1,023,599 |
| Boston Properties, L.P., 2.45%, 10/1/33 | | 5,896 | 4,029,461 |
| CaixaBank S.A., 1.25% to 3/18/26, 6/18/31(5)(6) | EUR | 4,000 | 3,783,736 |
| Canadian Imperial Bank of Commerce, 0.95%, 10/23/25 | | 1,970 | 1,787,024 |
| Cooperatieve Rabobank UA, 1.106% to 2/24/26, 2/24/27(1)(5) | | 7,021 | 6,238,306 |
| Digital Dutch Finco BV, 1.50%, 3/15/30(6) | EUR | 6,300 | 5,385,456 |
| Digital Euro Finco, LLC, 2.50%, 1/16/26(6) | EUR | 8,700 | 8,735,155 |
| Equinix, Inc., 1.00%, 9/15/25 | | 3,000 | 2,727,234 |
| HAT Holdings I, LLC/HAT Holdings II, LLC: | | | |
| 3.375%, 6/15/26(1) | | 12,396 | 11,031,303 |
| 3.75%, 9/15/30(1)(4) | | 6,592 | 5,052,798 |
| Security | Principal
Amount*
(000’s omitted) | Value |
| Financial (continued) | |
| HAT Holdings I, LLC/HAT Holdings II, LLC: (continued) | | | |
| 6.00%, 4/15/25(1) | | 76 | $ 74,034 |
| ING Groep NV: | | | |
| 0.875% to 3/9/27, 6/9/32(5)(6) | EUR | 3,000 | 2,698,639 |
| 1.40% to 7/1/25, 7/1/26(1)(5) | | 6,632 | 6,098,544 |
| 4.625%, 1/6/26(1) | | 3,025 | 2,931,719 |
| Intesa Sanpaolo SpA, 6.50% to 3/14/28, 3/14/29(5)(6) | GBP | 3,000 | 3,562,621 |
| Kimco Realty OP, LLC, 2.70%, 10/1/30 | | 3,000 | 2,415,313 |
| Metropolitan Life Global Funding I, 0.95%, 7/2/25(1) | | 5,720 | 5,263,928 |
| Muenchener Rueckversicherungs-Gesellschaft AG in Muenchen, 1.25% to 11/26/30, 5/26/41(5)(6) | EUR | 3,200 | 2,570,168 |
| PNC Financial Services Group, Inc. (The): | | | |
| 2.20%, 11/1/24 | | 7,377 | 7,082,143 |
| 4.758% to 1/26/26, 1/26/27(5) | | 920 | 894,567 |
| Prologis Euro Finance, LLC, 0.375%, 2/6/28 | EUR | 6,700 | 6,002,870 |
| Prologis, L.P., 1.25%, 10/15/30(4) | | 1,477 | 1,103,659 |
| Prudential Financial, Inc., 1.50%, 3/10/26 | | 3,431 | 3,114,063 |
| REC, Ltd., 5.625%, 4/11/28(1) | | 3,841 | 3,748,578 |
| Regency Centers, L.P., 3.75%, 6/15/24 | | 2,500 | 2,441,066 |
| Royal Bank of Canada, 0.25%, 5/2/24(6) | EUR | 8,600 | 8,894,192 |
| Sumitomo Mitsui Financial Group, Inc., 0.508%, 1/12/24 | | 3,000 | 2,955,770 |
| Welltower OP, LLC, 2.70%, 2/15/27 | | 1,280 | 1,164,798 |
| | | | $169,273,007 |
| Government - Multinational — 7.4% | |
| Asian Development Bank: | | | |
| 2.125%, 3/19/25 | | 750 | $ 715,918 |
| 2.375%, 8/10/27 | | 4,000 | 3,674,429 |
| 3.125%, 9/26/28(4) | | 800 | 743,403 |
| European Bank for Reconstruction & Development: | | | |
| 1.50%, 2/13/25 | | 7,515 | 7,128,555 |
| 1.625%, 9/27/24 | | 2,635 | 2,533,453 |
| European Investment Bank: | | | |
| 0.75%, 9/23/30 | | 4,000 | 3,077,404 |
| 1.625%, 5/13/31 | | 3,960 | 3,201,255 |
| 2.375%, 5/24/27 | | 8,671 | 7,988,033 |
| 2.50%, 10/15/24(4) | | 6,200 | 6,012,426 |
| 2.875%, 6/13/25(1) | | 8,202 | 7,889,158 |
| International Bank for Reconstruction & Development: | | | |
| 2.125%, 3/3/25 | | 2,000 | 1,911,878 |
| 3.125%, 11/20/25 | | 4,150 | 3,983,179 |
| 6.875%, 2/9/29 | MXN | 70,000 | 3,468,771 |
| International Finance Corp., 2.125%, 4/7/26 | | 1,547 | 1,443,498 |
| | | | $ 53,771,360 |
| Government - Regional — 1.0% | |
| Kommuninvest I Sverige AB, 0.375%, 6/19/24(1) | | 7,785 | $ 7,494,883 |
| | | | $ 7,494,883 |
8
See Notes to Financial Statements.
Calvert
Green Bond Fund
September 30, 2023
Schedule of Investments — continued
| Security | Principal
Amount*
(000’s omitted) | Value |
| Industrial — 2.7% | |
| AP Moller - Maersk A/S, 5.875%, 9/14/33(1) | | 2,875 | $ 2,795,281 |
| Cemex SAB de CV, 9.125% to 3/14/28(1)(5)(7) | | 2,461 | 2,564,990 |
| Jabil, Inc., 4.25%, 5/15/27 | | 5,000 | 4,735,518 |
| Johnson Controls International plc/Tyco Fire & Security Finance SCA, 1.75%, 9/15/30 | | 4,650 | 3,622,051 |
| Owens Corning, 3.95%, 8/15/29 | | 1,382 | 1,256,780 |
| Xylem, Inc.: | | | |
| 1.95%, 1/30/28 | | 3,400 | 2,931,327 |
| 2.25%, 1/30/31 | | 1,821 | 1,450,974 |
| | | | $ 19,356,921 |
| Technology — 6.8% | |
| Apple, Inc.: | | | |
| 0.50%, 11/15/31 | EUR | 11,000 | $ 9,173,513 |
| 3.00%, 6/20/27 | | 20,500 | 19,108,029 |
| Micron Technology, Inc., 2.703%, 4/15/32 | | 10,185 | 7,782,914 |
| NXP BV/NXP Funding, LLC/NXP USA, Inc.: | | | |
| 2.50%, 5/11/31 | | 6,100 | 4,766,523 |
| 3.40%, 5/1/30 | | 2,861 | 2,447,949 |
| SK Hynix, Inc., 2.375%, 1/19/31(1) | | 8,000 | 6,012,028 |
| | | | $ 49,290,956 |
| Utilities — 11.0% | |
| AES Corp. (The), 2.45%, 1/15/31 | | 16,002 | $ 12,320,077 |
| Avangrid, Inc., 3.15%, 12/1/24 | | 3,029 | 2,921,540 |
| Brookfield Renewable Partners ULC, 3.33%, 8/13/50 | CAD | 4,000 | 1,901,947 |
| Clearway Energy Operating, LLC, 3.75%, 1/15/32(1) | | 2,313 | 1,800,682 |
| Consolidated Edison Co. of New York, Inc., 3.60%, 6/15/61 | | 3,000 | 1,947,458 |
| Enel Finance International N.V.: | | | |
| 1.375%, 7/12/26(1) | | 3,197 | 2,824,927 |
| 4.625%, 6/15/27(1) | | 6,500 | 6,202,487 |
| 5.00%, 6/15/32(1) | | 2,692 | 2,437,821 |
| Liberty Utilities Finance GP 1, 2.05%, 9/15/30(1) | | 11,594 | 8,951,252 |
| MidAmerican Energy Co.: | | | |
| 3.15%, 4/15/50 | | 1,600 | 1,016,257 |
| 3.65%, 8/1/48 | | 4,490 | 3,208,442 |
| 4.25%, 7/15/49 | | 3,190 | 2,497,983 |
| NextEra Energy Capital Holdings, Inc., 1.90%, 6/15/28 | | 16,515 | 13,986,795 |
| NextEra Energy Operating Partners, L.P., 4.50%, 9/15/27(1) | | 2,004 | 1,818,834 |
| Niagara Mohawk Power Corp., 1.96%, 6/27/30(1) | | 982 | 766,051 |
| Northern States Power Co., 2.60%, 6/1/51 | | 6,100 | 3,462,321 |
| NSTAR Electric Co., 3.25%, 5/15/29 | | 4,000 | 3,597,745 |
| Pattern Energy Operations, L.P./Pattern Energy Operations, Inc., 4.50%, 8/15/28(1) | | 2,075 | 1,804,461 |
| Public Service Co. of Colorado: | | | |
| 3.20%, 3/1/50 | | 5,000 | 3,146,331 |
| 4.10%, 6/15/48 | | 1,000 | 732,105 |
| Security | Principal
Amount*
(000’s omitted) | Value |
| Utilities (continued) | |
| Tucson Electric Power Co., 1.50%, 8/1/30 | | 3,300 | $ 2,511,664 |
| | | | $ 79,857,180 |
Total Corporate Bonds
(identified cost $500,146,384) | | | $433,186,031 |
| High Social Impact Investments — 0.2% |
| Security | Principal
Amount
(000's omitted) | Value |
| Calvert Impact Capital, Inc., Community Investment Notes, 1.50%, 12/15/23(8)(9) | $ | 1,700 | $ 1,676,693 |
Total High Social Impact Investments
(identified cost $1,700,000) | | | $ 1,676,693 |
| Security | Shares | Value |
| Electric Utilities — 0.7% | |
| Brookfield BRP Holdings Canada, Inc.,4.625% | | 353,000 | $ 5,174,980 |
| | | | $ 5,174,980 |
| Real Estate Management & Development — 0.5% | |
| Brookfield Property Partners, L.P.: | | | |
| Series A, 5.75% | | 92,000 | $ 1,172,080 |
| Series A2, 6.375% | | 169,100 | 2,282,850 |
| | | | $ 3,454,930 |
Total Preferred Stocks
(identified cost $15,400,394) | | | $ 8,629,910 |
| Sovereign Government Bonds — 6.7% |
| Security | Principal
Amount*
(000’s omitted) | Value |
| Chile Government International Bond, 2.55%, 1/27/32(4) | | 1,500 | $ 1,214,974 |
| Export-Import Bank of Korea, 5.125%, 1/11/33 | | 1,429 | 1,401,629 |
| Kommunalbanken AS: | | | |
| 0.50%, 10/21/24(6) | | 4,068 | 3,854,793 |
| 2.125%, 2/11/25(1) | | 3,000 | 2,866,350 |
| 2.125%, 2/11/25(6) | | 7,238 | 6,915,547 |
| Kreditanstalt fuer Wiederaufbau: | | | |
| 0.75%, 9/30/30 | | 3,034 | 2,328,717 |
| 1.00%, 10/1/26 | | 5,023 | 4,488,537 |
| 1.75%, 9/14/29 | | 9,697 | 8,246,866 |
| Kuntarahoitus Oyj, 0.05%, 9/6/29(6) | EUR | 1,250 | 1,092,028 |
9
See Notes to Financial Statements.
Calvert
Green Bond Fund
September 30, 2023
Schedule of Investments — continued
| Security | Principal
Amount*
(000’s omitted) | Value |
| Nederlandse Waterschapsbank NV: | | | |
| 1.00%, 5/28/30(1) | | 7,100 | $ 5,549,037 |
| 2.375%, 3/24/26(1) | | 10,866 | 10,182,280 |
| Province of Ontario Canada, 2.65%, 2/5/25 | CAD | 1,000 | 712,770 |
Total Sovereign Government Bonds
(identified cost $52,590,154) | | | $ 48,853,528 |
| Taxable Municipal Obligations — 1.5% |
| Security | Principal
Amount
(000's omitted) | Value |
| General Obligations — 0.9% | |
| Massachusetts, Green Bonds, 3.277%, 6/1/46 | $ | 8,240 | $ 6,100,484 |
| | | | $ 6,100,484 |
| Water and Sewer — 0.6% | |
| District of Columbia Water & Sewer Authority, Green Bonds, 4.814%, 10/1/2114 | $ | 1,665 | $ 1,423,026 |
| Massachusetts Water Pollution Abatement Trust, 5.192%, 8/1/40(10) | | 120 | 117,121 |
| Narragansett Bay Commission, RI, Wastewater System Revenue: | | | |
| Green Bonds, 2.094%, 9/1/30 | | 620 | 505,529 |
| Green Bonds, 2.184%, 9/1/31 | | 500 | 397,970 |
| Green Bonds, 2.264%, 9/1/32 | | 445 | 346,370 |
| Green Bonds, 2.344%, 9/1/33 | | 1,445 | 1,102,275 |
| New York City Municipal Water Finance Authority, NY, (Water and Sewer System), 5.882%, 6/15/44(10) | | 605 | 611,431 |
| | | | $ 4,503,722 |
Total Taxable Municipal Obligations
(identified cost $14,153,180) | | | $ 10,604,206 |
| U.S. Government Agencies and Instrumentalities — 1.0% |
| Security | Principal
Amount
(000's omitted) | Value |
| U.S. International Development Finance Corp.: | | | |
| 1.79%, 10/15/29 | $ | 3,320 | $ 2,961,289 |
| 2.36%, 10/15/29 | | 2,151 | 1,953,285 |
| 3.16%, 6/1/33 | | 151 | 135,129 |
| 3.52%, 9/20/32 | | 2,442 | 2,258,217 |
Total U.S. Government Agencies and Instrumentalities
(identified cost $8,064,007) | | | $ 7,307,920 |
| U.S. Government Agency Mortgage-Backed Securities — 8.9% |
| Security | Principal
Amount
(000's omitted) | Value |
| Federal Home Loan Mortgage Corp.: | | | |
| 5.50%, 7/1/53 | $ | 15,195 | $ 14,714,410 |
| 6.00%, with various maturities to 2053 | | 29,158 | 28,838,666 |
| 6.50%, 9/1/53 | | 4,820 | 4,852,500 |
| Federal National Mortgage Association: | | | |
| 2.68%, 7/1/26 | | 1,920 | 1,797,857 |
| 5.00%, 7/1/53 | | 7,231 | 6,831,153 |
| 5.50%, 7/1/53 | | 7,564 | 7,321,554 |
Total U.S. Government Agency Mortgage-Backed Securities
(identified cost $65,443,808) | | $ 64,356,140 |
| Short-Term Investments — 0.6% | | | |
| Affiliated Fund — 0.0%(11) |
| Security | Shares | Value |
| Morgan Stanley Institutional Liquidity Funds - Government Portfolio, Institutional Class, 5.27%(12) | | 78,920 | $ 78,920 |
Total Affiliated Fund
(identified cost $78,920) | | | $ 78,920 |
| Securities Lending Collateral — 0.6% |
| Security | Shares | Value |
| State Street Navigator Securities Lending Government Money Market Portfolio, 5.36%(13) | | 4,407,338 | $ 4,407,338 |
Total Securities Lending Collateral
(identified cost $4,407,338) | | | $ 4,407,338 |
Total Short-Term Investments
(identified cost $4,486,258) | | | $ 4,486,258 |
Total Purchased Call Options — 0.0%(11)
(identified cost $77,283) | | | $ 79,406 |
Total Investments — 99.6%
(identified cost $825,601,690) | | | $720,407,269 |
| Other Assets, Less Liabilities — 0.4% | | | $ 2,957,804 |
| Net Assets — 100.0% | | | $723,365,073 |
10
See Notes to Financial Statements.
Calvert
Green Bond Fund
September 30, 2023
Schedule of Investments — continued
| The percentage shown for each investment category in the Schedule of Investments is based on net assets. |
| * | In U.S. dollars unless otherwise indicated. |
| (1) | Security exempt from registration under Rule 144A of the Securities Act of 1933, as amended. These securities may be sold in certain transactions in reliance on an exemption from registration (normally to qualified institutional buyers). At September 30, 2023, the aggregate value of these securities is $212,285,037 or 29.3% of the Fund's net assets. |
| (2) | Principal amount is less than $500. |
| (3) | Weighted average fixed-rate coupon that changes/updates monthly. Rate shown is the rate at September 30, 2023. |
| (4) | All or a portion of this security was on loan at September 30, 2023. The aggregate market value of securities on loan at September 30, 2023 was $19,490,601. |
| (5) | Security converts to variable rate after the indicated fixed-rate coupon period. |
| (6) | Security exempt from registration under Regulation S of the Securities Act of 1933, as amended, which exempts from registration securities offered and sold outside the United States. Security may not be offered or sold in the United States except pursuant to an exemption from, or in a transaction not subject to, the registration requirements of the Securities Act of 1933, as amended. At September 30, 2023, the aggregate value of these securities is $69,749,370 or 9.7% of the Fund's net assets. |
| (7) | Perpetual security with no stated maturity date but may be subject to calls by the issuer. |
| (8) | May be deemed to be an affiliated company (see Note 8). |
| (9) | Restricted security. Total market value of restricted securities amounts to $1,676,693, which represents 0.2% of the net assets of the Fund as of September 30, 2023. |
| (10) | Build America Bond. Represents taxable municipal obligation issued pursuant to the American Recovery and Reinvestment Act of 2009 or other legislation providing for the issuance of taxable municipal debt on which the issuer receives federal support. |
| (11) | Amount is less than 0.05%. |
| (12) | May be deemed to be an affiliated investment company. The rate shown is the annualized seven-day yield as of September 30, 2023. |
| (13) | Represents investment of cash collateral received in connection with securities lending. |
| Country Allocation (% of Total Investments) | |
| United States | 69.1% |
| Netherlands | 5.4 |
| Luxembourg | 4.9 |
| Other (less than 3.0% each) | 20.6 |
| Total | 100.0% |
11
See Notes to Financial Statements.
Calvert
Green Bond Fund
September 30, 2023
Schedule of Investments — continued
Purchased Call Options (Exchange-Traded) — 0.0%(1)
| Description | Number of
Contracts | Notional
Amount | Exercise
Price | Expiration
Date | Value |
| U.S. 10-Year Treasury Note Futures 12/2023 | 154 | $16,641,625 | $110.00 | 11/24/23 | $ 79,406 |
| Total | | | | | $79,406 |
| (1) | Amount is less than 0.05%. |
Forward Foreign Currency Exchange Contracts (OTC)
| Currency Purchased | Currency Sold | Counterparty | Settlement
Date | Unrealized
Appreciation | Unrealized
(Depreciation) |
| AUD | 1,239,823 | USD | 801,296 | JPMorgan Chase Bank, N.A. | 11/10/23 | $ — | $ (3,147) |
| CAD | 7,492,873 | USD | 5,553,567 | Bank of America, N.A. | 11/10/23 | — | (34,104) |
| EUR | 9,714,200 | USD | 10,630,093 | Bank of America, N.A. | 11/10/23 | — | (343,542) |
| EUR | 8,308,600 | USD | 8,796,755 | UBS AG | 11/10/23 | 1,381 | — |
| EUR | 10,916,955 | USD | 11,583,741 | UBS AG | 11/10/23 | — | (23,569) |
| USD | 826,397 | AUD | 1,247,865 | JPMorgan Chase Bank, N.A. | 11/10/23 | 23,070 | — |
| USD | 8,680,827 | CAD | 11,557,224 | Citibank, N.A. | 11/10/23 | 167,449 | — |
| USD | 97,246,049 | EUR | 87,739,833 | JPMorgan Chase Bank, N.A. | 11/10/23 | 4,336,666 | — |
| USD | 3,697,583 | GBP | 2,891,089 | Barclays Bank PLC | 11/10/23 | 169,374 | — |
| USD | 191,056 | SEK | 2,007,289 | Citibank, N.A. | 11/10/23 | 7,047 | — |
| | | | | | | $4,704,987 | $(404,362) |
Futures Contracts
| Description | Number of
Contracts | Position | Expiration
Date | Notional
Amount | Value/
Unrealized
Appreciation
(Depreciation) |
| Interest Rate Futures | | | | | |
| U.S. 2-Year Treasury Note | 432 | Long | 12/29/23 | $ 87,571,125 | $ (277,471) |
| U.S. 5-Year Treasury Note | 314 | Long | 12/29/23 | 33,082,844 | (275,104) |
| U.S. 10-Year Treasury Note | 285 | Long | 12/19/23 | 30,797,812 | (305,757) |
| U.S. Long Treasury Bond | 282 | Long | 12/19/23 | 32,086,312 | (1,316,345) |
| U.S. Ultra-Long Treasury Bond | 221 | Long | 12/19/23 | 26,229,938 | (1,319,472) |
| U.S. Ultra 10-Year Treasury Note | (402) | Short | 12/19/23 | (44,848,125) | 1,246,456 |
| | | | | | $(2,247,693) |
Restricted Securities
| Description | Acquisition Date | Cost |
| Calvert Impact Capital, Inc., Community Investment Notes, 1.50%, 12/15/23 | 12/14/20 | $1,700,000 |
| Currency Abbreviations: |
| AUD | – Australian Dollar |
| CAD | – Canadian Dollar |
12
See Notes to Financial Statements.
Calvert
Green Bond Fund
September 30, 2023
Schedule of Investments — continued
| |
| EUR | – Euro |
| GBP | – British Pound Sterling |
| MXN | – Mexican Peso |
| SEK | – Swedish Krona |
| USD | – United States Dollar |
13
See Notes to Financial Statements.
Calvert
Green Bond Fund
September 30, 2023
Statement of Assets and Liabilities
| | September 30, 2023 |
| Assets | |
Investments in securities of unaffiliated issuers, at value (identified cost $823,822,770) - including
$19,490,601 of securities on loan | $ 718,651,656 |
| Investments in securities of affiliated issuers, at value (identified cost $1,778,920) | 1,755,613 |
| Receivable for variation margin on open futures contracts | 221,645 |
| Receivable for open forward foreign currency exchange contracts | 4,704,987 |
| Cash denominated in foreign currency, at value (cost $18,991,535) | 18,983,756 |
| Deposits at broker for futures contracts | 3,194,313 |
| Receivable for investments sold | 3,472,787 |
| Receivable for capital shares sold | 1,004,778 |
| Dividends and interest receivable | 5,228,702 |
| Dividends and interest receivable - affiliated | 96,615 |
| Securities lending income receivable | 13,222 |
| Receivable from affiliate | 30,038 |
| Directors' deferred compensation plan | 102,364 |
| Total assets | $ 757,460,476 |
| Liabilities | |
| Payable for open forward foreign currency exchange contracts | $ 404,362 |
| Due to custodian | 96,559 |
| Payable for investments purchased | 19,144,689 |
| Payable for capital shares redeemed | 1,244,759 |
| Distributions payable | 29,031 |
| Deposits for securities loaned | 4,407,338 |
| Payable to affiliates: | |
| Investment advisory fee | 147,867 |
| Administrative fee | 72,045 |
| Distribution and service fees | 13,399 |
| Sub-transfer agency fee | 3,712 |
| Directors' deferred compensation plan | 102,364 |
| Accrued expenses | 239,278 |
| Demand note payable | 8,190,000 |
| Total liabilities | $ 34,095,403 |
| Net Assets | $ 723,365,073 |
| Sources of Net Assets | |
| Paid-in capital | $ 874,947,422 |
| Accumulated loss | (151,582,349) |
| Net Assets | $ 723,365,073 |
| Class A Shares | |
| Net Assets | $ 64,700,082 |
| Shares Outstanding | 4,837,285 |
Net Asset Value and Redemption Price Per Share
(net assets ÷ shares of beneficial interest outstanding) | $ 13.38 |
Maximum Offering Price Per Share
(100 ÷ 96.75 of net asset value per share) | $ 13.83 |
14
See Notes to Financial Statements.
Calvert
Green Bond Fund
September 30, 2023
Statement of Assets and Liabilities — continued
| | September 30, 2023 |
| Class I Shares | |
| Net Assets | $ 617,734,166 |
| Shares Outstanding | 46,126,063 |
Net Asset Value, Offering Price and Redemption Price Per Share
(net assets ÷ shares of beneficial interest outstanding) | $ 13.39 |
| Class R6 Shares | |
| Net Assets | $ 40,930,825 |
| Shares Outstanding | 3,054,227 |
Net Asset Value, Offering Price and Redemption Price Per Share
(net assets ÷ shares of beneficial interest outstanding) | $ 13.40 |
On sales of $100,000 or more, the offering price of Class A shares is reduced.
15
See Notes to Financial Statements.
Calvert
Green Bond Fund
September 30, 2023
| | Year Ended |
| | September 30, 2023 |
| Investment Income | |
| Dividend income (net of foreign taxes withheld of $38,576) | $ 771,334 |
| Dividend income - affiliated issuers | 1,048,576 |
| Interest and other income | 21,086,494 |
| Interest income - affiliated issuers | 56,237 |
| Securities lending income, net | 93,912 |
| Total investment income | $ 23,056,553 |
| Expenses | |
| Investment advisory fee | $ 1,877,848 |
| Administrative fee | 901,367 |
| Distribution and service fees: | |
| Class A | 173,670 |
| Directors' fees and expenses | 50,935 |
| Custodian fees | 25,734 |
| Transfer agency fees and expenses | 669,761 |
| Accounting fees | 171,645 |
| Professional fees | 71,040 |
| Registration fees | 82,019 |
| Reports to shareholders | 61,718 |
| Miscellaneous | 69,206 |
| Total expenses | $ 4,154,943 |
| Waiver and/or reimbursement of expenses by affiliates | $ (400,980) |
| Net expenses | $ 3,753,963 |
| Net investment income | $ 19,302,590 |
| Realized and Unrealized Gain (Loss) | |
| Net realized gain (loss): | |
| Investment securities | $ (51,526,496) |
| Futures contracts | (4,296,624) |
| Foreign currency transactions | (345,216) |
| Forward foreign currency exchange contracts | (7,818,925) |
| Net realized loss | $(63,987,261) |
| Change in unrealized appreciation (depreciation): | |
| Investment securities | $ 61,553,036 |
| Investment securities - affiliated issuers | 120,152 |
| Futures contracts | (5,932,353) |
| Foreign currency | 42,085 |
| Forward foreign currency exchange contracts | 1,147,932 |
| Net change in unrealized appreciation (depreciation) | $ 56,930,852 |
| Net realized and unrealized loss | $ (7,056,409) |
| Net increase in net assets from operations | $ 12,246,181 |
16
See Notes to Financial Statements.
Calvert
Green Bond Fund
September 30, 2023
Statements of Changes in Net Assets
| | Year Ended September 30, |
| | 2023 | 2022 |
| Increase (Decrease) in Net Assets | | |
| From operations: | | |
| Net investment income | $ 19,302,590 | $ 15,456,702 |
| Net realized gain (loss) | (63,987,261) | 23,438,286 |
| Net change in unrealized appreciation (depreciation) | 56,930,852 | (177,706,391) |
| Net increase (decrease) in net assets from operations | $ 12,246,181 | $(138,811,403) |
| Distributions to shareholders: | | |
| Class A | $ (1,696,277) | $ (1,625,234) |
| Class I | (17,290,487) | (17,878,597) |
| Class R6 | (1,101,630) | (513,870) |
| Total distributions to shareholders | $ (20,088,394) | $ (20,017,701) |
| Capital share transactions: | | |
| Class A | $ (5,830,686) | $ (3,742,766) |
| Class I | (37,057,031) | (61,687,103) |
| Class R6 | 3,270,565 | 32,972,662 |
| Net decrease in net assets from capital share transactions | $ (39,617,152) | $ (32,457,207) |
| Net decrease in net assets | $ (47,459,365) | $(191,286,311) |
| Net Assets | | |
| At beginning of year | $ 770,824,438 | $ 962,110,749 |
| At end of year | $723,365,073 | $ 770,824,438 |
17
See Notes to Financial Statements.
Calvert
Green Bond Fund
September 30, 2023
| | Class A |
| | Year Ended September 30, |
| | 2023 | 2022 | 2021 | 2020 | 2019 |
| Net asset value — Beginning of year | $ 13.51 | $ 16.15 | $ 16.36 | $ 15.87 | $ 14.82 |
| Income (Loss) From Operations | | | | | |
| Net investment income(1) | $ 0.32 | $ 0.22 | $ 0.21 | $ 0.28 | $ 0.34 |
| Net realized and unrealized gain (loss) | (0.11) | (2.57) | (0.18) | 0.55 | 1.05 |
| Total income (loss) from operations | $ 0.21 | $ (2.35) | $ 0.03 | $ 0.83 | $ 1.39 |
| Less Distributions | | | | | |
| From net investment income | $ (0.33) | $ (0.24) | $ (0.24) | $ (0.32) | $ (0.34) |
| From net realized gain | (0.01) | (0.05) | — | (0.02) | — |
| Total distributions | $ (0.34) | $ (0.29) | $ (0.24) | $ (0.34) | $ (0.34) |
| Net asset value — End of year | $ 13.38 | $ 13.51 | $ 16.15 | $ 16.36 | $ 15.87 |
| Total Return(2) | 1.49% | (14.67)% | 0.17% | 5.27% | 9.53% |
| Ratios/Supplemental Data | | | | | |
| Net assets, end of year (000’s omitted) | $64,700 | $71,019 | $89,164 | $77,991 | $58,422 |
| Ratios (as a percentage of average daily net assets):(3) | | | | | |
| Total expenses | 0.78% | 0.77% | 0.76% | 0.79% | 0.86% |
| Net expenses | 0.73% (4) | 0.73% (4) | 0.73% | 0.73% | 0.77% |
| Net investment income | 2.34% | 1.49% | 1.28% | 1.77% | 2.21% |
| Portfolio Turnover | 32% | 19% | 23% | 26% | 21% |
| (1) | Computed using average shares outstanding. |
| (2) | Returns are historical and are calculated by determining the percentage change in net asset value with all distributions reinvested and do not reflect the effect of sales charges, if any. |
| (3) | Total expenses do not reflect amounts reimbursed and/or waived by the adviser and certain of its affiliates, if applicable. Net expenses are net of all reductions and represent the net expenses paid by the Fund. |
| (4) | Includes a reduction by the investment adviser of a portion of its advisory fee due to the Fund’s investment in the Liquidity Fund (equal to less than 0.005% of average daily net assets for the years ended September 30, 2023 and 2022). |
18
See Notes to Financial Statements.
Calvert
Green Bond Fund
September 30, 2023
Financial Highlights — continued
| | Class I |
| | Year Ended September 30, |
| | 2023 | 2022 | 2021 | 2020 | 2019 |
| Net asset value — Beginning of year | $ 13.53 | $ 16.17 | $ 16.38 | $ 15.89 | $ 14.83 |
| Income (Loss) From Operations | | | | | |
| Net investment income(1) | $ 0.36 | $ 0.26 | $ 0.25 | $ 0.32 | $ 0.38 |
| Net realized and unrealized gain (loss) | (0.12) | (2.57) | (0.18) | 0.55 | 1.06 |
| Total income (loss) from operations | $ 0.24 | $ (2.31) | $ 0.07 | $ 0.87 | $ 1.44 |
| Less Distributions | | | | | |
| From net investment income | $ (0.37) | $ (0.28) | $ (0.28) | $ (0.36) | $ (0.38) |
| From net realized gain | (0.01) | (0.05) | — | (0.02) | — |
| Total distributions | $ (0.38) | $ (0.33) | $ (0.28) | $ (0.38) | $ (0.38) |
| Net asset value — End of year | $ 13.39 | $ 13.53 | $ 16.17 | $ 16.38 | $ 15.89 |
| Total Return(2) | 1.67% | (14.44)% | 0.42% | 5.53% | 9.84% |
| Ratios/Supplemental Data | | | | | |
| Net assets, end of year (000’s omitted) | $617,734 | $661,646 | $863,670 | $532,149 | $285,796 |
| Ratios (as a percentage of average daily net assets):(3) | | | | | |
| Total expenses | 0.53% | 0.52% | 0.51% | 0.54% | 0.61% |
| Net expenses | 0.48% (4) | 0.48% (4) | 0.48% | 0.48% | 0.48% |
| Net investment income | 2.59% | 1.73% | 1.52% | 2.00% | 2.47% |
| Portfolio Turnover | 32% | 19% | 23% | 26% | 21% |
| (1) | Computed using average shares outstanding. |
| (2) | Returns are historical and are calculated by determining the percentage change in net asset value with all distributions reinvested and do not reflect the effect of sales charges, if any. |
| (3) | Total expenses do not reflect amounts reimbursed and/or waived by the adviser and certain of its affiliates, if applicable. Net expenses are net of all reductions and represent the net expenses paid by the Fund. |
| (4) | Includes a reduction by the investment adviser of a portion of its advisory fee due to the Fund’s investment in the Liquidity Fund (equal to less than 0.005% of average daily net assets for the years ended September 30, 2023 and 2022). |
19
See Notes to Financial Statements.
Calvert
Green Bond Fund
September 30, 2023
Financial Highlights — continued
| | Class R6 |
| | Year Ended September 30, | Period Ended
September 30,
2019(1) |
| | 2023 | 2022 | 2021 | 2020 |
| Net asset value — Beginning of period | $ 13.54 | $ 16.18 | $ 16.39 | $ 15.90 | $ 15.01 |
| Income (Loss) From Operations | | | | | |
| Net investment income(2) | $ 0.36 | $ 0.29 | $ 0.26 | $ 0.32 | $ 0.26 |
| Net realized and unrealized gain (loss) | (0.12) | (2.59) | (0.18) | 0.55 | 0.89 |
| Total income (loss) from operations | $ 0.24 | $ (2.30) | $ 0.08 | $ 0.87 | $ 1.15 |
| Less Distributions | | | | | |
| From net investment income | $ (0.37) | $ (0.29) | $ (0.29) | $ (0.36) | $ (0.26) |
| From net realized gain | (0.01) | (0.05) | — | (0.02) | — |
| Total distributions | $ (0.38) | $ (0.34) | $ (0.29) | $ (0.38) | $ (0.26) |
| Net asset value — End of period | $ 13.40 | $ 13.54 | $16.18 | $16.39 | $15.90 |
| Total Return(3) | 1.72% | (14.39)% | 0.47% | 5.58% | 7.68% (4) |
| Ratios/Supplemental Data | | | | | |
| Net assets, end of period (000’s omitted) | $40,931 | $38,160 | $ 9,277 | $ 3,208 | $ 581 |
| Ratios (as a percentage of average daily net assets):(5) | | | | | |
| Total expenses | 0.48% | 0.47% | 0.46% | 0.49% | 0.54% (6) |
| Net expenses | 0.43% (7) | 0.43% (7) | 0.43% | 0.43% | 0.43% (6) |
| Net investment income | 2.65% | 1.96% | 1.56% | 1.99% | 2.49% (6) |
| Portfolio Turnover | 32% | 19% | 23% | 26% | 21% (8) |
| (1) | For the period from the commencement of operations, February 1, 2019, to September 30, 2019. |
| (2) | Computed using average shares outstanding. |
| (3) | Returns are historical and are calculated by determining the percentage change in net asset value with all distributions reinvested and do not reflect the effect of sales charges, if any. |
| (4) | Not annualized. |
| (5) | Total expenses do not reflect amounts reimbursed and/or waived by the adviser and certain of its affiliates, if applicable. Net expenses are net of all reductions and represent the net expenses paid by the Fund. |
| (6) | Annualized. |
| (7) | Includes a reduction by the investment adviser of a portion of its advisory fee due to the Fund’s investment in the Liquidity Fund (equal to less than 0.005% of average daily net assets for the years ended September 30, 2023 and 2022). |
| (8) | For the year ended September 30, 2019. |
20
See Notes to Financial Statements.
Calvert
Green Bond Fund
September 30, 2023
Notes to Financial Statements
1 Significant Accounting Policies
Calvert Green Bond Fund (the Fund) is a diversified series of Calvert Impact Fund, Inc. (the Corporation). The Corporation is a Maryland corporation registered under the Investment Company Act of 1940, as amended (the 1940 Act), as an open-end management investment company. The investment objective of the Fund is to seek to maximize income, to the extent consistent with preservation of capital, primarily through investment in bonds. The Fund invests primarily in “green” investments which include those issued by companies that develop or provide products or services that seek to provide environmental solutions and/or that support environmental projects, among others.
The Fund offers three classes of shares. Class A shares are generally sold subject to a sales charge imposed at time of purchase. A contingent deferred sales charge of 0.75% may apply to certain redemptions of Class A shares for accounts for which no sales charge was paid, if redeemed within 12 months of purchase. Class I and Class R6 shares are sold at net asset value, are not subject to a sales charge and are sold only to certain eligible investors. Each class represents a pro rata interest in the Fund, but votes separately on class-specific matters and is subject to different expenses.
The Fund applies the accounting and reporting guidance in the Financial Accounting Standards Board (FASB) Accounting Standards Codification Topic 946, Financial Services – Investment Companies (ASC 946). Subsequent events, if any, through the date that the financial statements were issued have been evaluated in the preparation of the financial statements.
A Investment Valuation— Net asset value per share is determined every business day as of the close of the regular session of the New York Stock Exchange (generally 4:00 p.m. Eastern time). The Fund uses independent pricing services approved by the Board of Directors (the Board) to value its investments wherever possible. Investments for which market quotations are not available or deemed not reliable are fair valued in good faith by the Board’s valuation designee.
U.S. generally accepted accounting principles (U.S. GAAP) establishes a disclosure hierarchy that categorizes the inputs to valuation techniques used to value assets and liabilities at measurement date. These inputs are summarized in the three broad levels listed below:
Level 1 - quoted prices in active markets for identical securities
Level 2 - other significant observable inputs (including quoted prices for similar securities, interest rates, prepayment speeds, credit risk, etc.)
Level 3 - significant unobservable inputs (including the Fund’s own assumptions in determining the fair value of investments)
The inputs or methodologies used for valuing securities are not necessarily an indication of the risk associated with investing in those securities.
Valuation techniques used to value the Fund’s investments by major category are as follows:
Equity Securities. Equity securities (including warrants and rights) listed on a U.S. securities exchange generally are valued at the last sale or closing price as reported by an independent pricing service on the primary market or exchange on which they are traded and are categorized as Level 1 in the hierarchy. Equity securities listed on the NASDAQ National Market System are valued at the NASDAQ official closing price and are categorized as Level 1 in the hierarchy. Unlisted or listed securities for which closing sales prices or closing quotations are not available are valued at the mean between the latest available bid and ask prices and are categorized as Level 2 in the hierarchy.
Debt Securities. Debt securities are generally valued based on valuations provided by third party pricing services, as derived from such services’ pricing models. Inputs to the models may include, but are not limited to, reported trades, executable bid and ask prices, broker/dealer quotations, prices or yields of securities with similar characteristics, interest rates, anticipated prepayments, benchmark curves or information pertaining to the issuer, as well as industry and economic events. Accordingly, debt securities are generally categorized as Level 2 in the hierarchy. Short-term debt securities with a remaining maturity at time of purchase of more than sixty days are valued based on valuations provided by a third party pricing service. Such securities are generally categorized as Level 2 in the hierarchy. Short-term debt securities of sufficient credit quality purchased with remaining maturities of sixty days or less for which a valuation from a third party pricing service is not readily available may be valued at amortized cost, which approximates fair value, and are categorized as Level 2 in the hierarchy.
Senior Floating-Rate Loans. Interests in senior-floating rate loans for which reliable market quotations are readily available are valued generally at the average mean of bid and ask quotations obtained from a third party pricing service, and are categorized as Level 2 in the hierarchy.
Other Securities. Investments in management investment companies (including money market funds) that do not trade on an exchange are valued at the net asset value as of the close of each business day and are categorized as Level 1 in the hierarchy.
Derivatives. Futures contracts are valued at unrealized appreciation (depreciation) based on the settlement price established each day by the board of trade or exchange on which they are traded and are categorized as Level 1 in the hierarchy. Forward foreign currency exchange contracts are generally valued at the mean of the average bid and average ask prices that are reported by currency dealers to a third party pricing service at the valuation time. Such third party pricing service valuations are supplied for specific settlement periods and the Fund's forward foreign currency exchange contracts are valued at an interpolated rate between the closest preceding and subsequent settlement period reported by the third party pricing service and are categorized as Level 2 in the hierarchy. U.S. exchange-traded options are valued at the mean between the bid and ask prices at valuation time as reported by the Options Price Reporting Authority and are categorized as Level 1 in the hierarchy.
Calvert
Green Bond Fund
September 30, 2023
Notes to Financial Statements — continued
Fair Valuation. In connection with Rule 2a-5 of the 1940 Act, the Board has designated the Fund’s investment adviser as its valuation designee. Investments for which valuations or market quotations are not readily available or are deemed unreliable are valued by the investment adviser, as valuation designee, at fair value using methods that most fairly reflect the security’s “fair value”, which is the amount that the Fund might reasonably expect to receive for the security upon its current sale in the ordinary course. Each such determination is based on a consideration of relevant factors, which are likely to vary from one pricing context to another. These factors may include, but are not limited to, the type of security, the existence of any contractual restrictions on the security’s disposition, the price and extent of public trading in similar securities of the issuer or of comparable companies or entities, quotations or relevant information obtained from broker/dealers or other market participants, information obtained from the issuer, analysts, and/or the appropriate stock exchange (for exchange-traded securities), an analysis of the company’s or entity’s financial statements, and an evaluation of the forces that influence the issuer and the market(s) in which the security is purchased and sold.
The values assigned to fair value investments are based on available information and do not necessarily represent amounts that might ultimately be realized. Further, due to the inherent uncertainty of valuations of such investments, the fair values may differ significantly from the values that would have been used had an active market existed, and the differences could be material.
The following table summarizes the market value of the Fund's holdings as of September 30, 2023, based on the inputs used to value them:
| Asset Description | Level 1 | Level 2 | Level 3 | Total |
| Asset-Backed Securities | $ — | $ 82,919,235 | $ — | $ 82,919,235 |
| Commercial Mortgage-Backed Securities | — | 58,307,942 | — | 58,307,942 |
| Corporate Bonds | — | 433,186,031 | — | 433,186,031 |
| High Social Impact Investments | — | 1,676,693 | — | 1,676,693 |
| Preferred Stocks | 8,629,910 | — | — | 8,629,910 |
| Sovereign Government Bonds | — | 48,853,528 | — | 48,853,528 |
| Taxable Municipal Obligations | — | 10,604,206 | — | 10,604,206 |
| U.S. Government Agencies and Instrumentalities | — | 7,307,920 | — | 7,307,920 |
| U.S. Government Agency Mortgage-Backed Securities | — | 64,356,140 | — | 64,356,140 |
| Short-Term Investments: | | | | |
| Affiliated Fund | 78,920 | — | — | 78,920 |
| Securities Lending Collateral | 4,407,338 | — | — | 4,407,338 |
| Purchased Call Options | 79,406 | — | — | 79,406 |
| Total Investments | $13,195,574 | $707,211,695 | $ — | $720,407,269 |
| Forward Foreign Currency Exchange Contracts | $ — | $ 4,704,987 | $ — | $ 4,704,987 |
| Futures Contracts | 1,246,456 | — | — | 1,246,456 |
| Total | $14,442,030 | $711,916,682 | $ — | $726,358,712 |
| Liability Description | | | | |
| Forward Foreign Currency Exchange Contracts | $ — | $ (404,362) | $ — | $ (404,362) |
| Futures Contracts | (3,494,149) | — | — | (3,494,149) |
| Total | $ (3,494,149) | $ (404,362) | $ — | $ (3,898,511) |
B Investment Transactions and Income— Investment transactions for financial statement purposes are accounted for on trade date. Realized gains and losses are recorded on an identified cost basis and may include proceeds from litigation. Dividend income is recorded on the ex-dividend date for dividends received in cash and/or securities or, in the case of dividends on certain foreign securities, as soon as the Fund is informed of the ex-dividend date. Non-cash dividends are recorded at the fair value of the securities received. Withholding taxes on foreign dividends, if any, have been provided for in accordance with the Fund’s understanding of the applicable country’s tax rules and rates. Interest income, which includes amortization of premium and accretion of discount on debt securities, is accrued as earned. The Fund may earn certain fees in connection with its investments in senior floating-rate loans. These fees are in addition to interest payments earned and may include amendment fees, consent fees and prepayment fees, which are recorded to income as earned.
C Share Class Accounting— Realized and unrealized gains and losses are allocated daily to each class of shares based upon the relative net assets of each class to the total net assets of the Fund. Net investment income, other than class-specific expenses, is allocated daily to each class of shares based upon the ratio of the value of each class’s paid shares to the total value of all paid shares. Expenses arising in connection with a specific class are charged
Calvert
Green Bond Fund
September 30, 2023
Notes to Financial Statements — continued
directly to that class. Sub-accounting, recordkeeping and similar administrative fees payable to financial intermediaries, which are a component of transfer agency fees and expenses on the Statement of Operations, are not allocated to Class R6 shares.
D Foreign Currency Transactions— The Fund’s accounting records are maintained in U.S. dollars. For valuation of assets and liabilities on each date of net asset value determination, foreign denominations are converted into U.S. dollars using the current exchange rate. Security transactions, income and expenses are translated at the prevailing rate of exchange on the date of the event. Recognized gains or losses on investment transactions attributable to changes in foreign currency exchange rates are recorded for financial statement purposes as net realized gains and losses on investments. That portion of unrealized gains and losses on investments that results from fluctuations in foreign currency exchange rates is not separately disclosed.
E Senior Floating-Rate Loans— The Fund may invest in direct debt instruments, which are interests in amounts owed to lenders or lending syndicates by corporate, governmental, or other borrowers. The Fund’s investment in loans may be in the form of participations in loans or assignments of all or a portion of loans from third parties. A loan is often administered by a bank or other financial institution (the lender) that acts as agent for all holders. The agent administers the terms of the loan, as specified in the loan agreement. The Fund may invest in multiple series or tranches of a loan, which may have varying terms and carry different associated risks. When the Fund purchases assignments from lenders, it acquires direct rights against the borrower of the loan. When investing in a loan participation, the Fund has the right to receive payments of principal, interest and any fees to which it is entitled only from the lender selling the loan agreement and only upon receipt of such payments by the lender from the borrower. The Fund generally has no right to enforce compliance by the borrower with the terms of the loan agreement. As a result, the Fund may be subject to the credit risk of both the borrower and the lender that is issuing the participation interest.
F Futures Contracts— The Fund may enter into futures contracts to buy or sell a financial instrument for a set price at a future date. Initial margin deposits of either cash or securities as required by the broker are made upon entering into the contract. While the contract is open, daily variation margin payments are made to or received from the broker reflecting the daily change in market value of the contract and are recorded for financial reporting purposes as unrealized gains or losses by the Fund. When a futures contract is closed, a realized gain or loss is recorded equal to the difference between the opening and closing value of the contract. The risks associated with entering into futures contracts may include the possible illiquidity of the secondary market which would limit the Fund’s ability to close out a futures contract prior to the settlement date, an imperfect correlation between the value of the contracts and the underlying financial instruments, or that the counterparty will fail to perform its obligations under the contracts’ terms. Futures contracts are designed by boards of trade, which are designated “contracts markets” by the Commodities Futures Trading Commission. Futures contracts trade on the contracts markets in a manner that is similar to the way a stock trades on a stock exchange, and the boards of trade, through their clearing corporations, guarantee the futures contracts against default. As a result, there is minimal counterparty credit risk to the Fund.
G Forward Foreign Currency Exchange Contracts— The Fund may enter into forward foreign currency exchange contracts for the purchase or sale of a specific foreign currency at a fixed price on a future date. The forward foreign currency exchange contracts are adjusted by the daily exchange rate of the underlying currency and any gains or losses are recorded as unrealized until such time as the contracts have been closed. Risks may arise upon entering these contracts from the potential inability of counterparties to meet the terms of their contracts and from movements in the value of a foreign currency relative to the U.S. dollar.
H Options Contracts— Upon the purchase of a call or put option, the premium paid by the Fund is included in the Statement of Assets and Liabilities as an investment. The amount of the investment is subsequently marked-to-market to reflect the current market value of the option purchased, in accordance with the Fund’s policies on investment valuations discussed above. Premiums paid for purchasing options that expire are treated as realized losses. Premiums paid for purchasing options that are exercised or closed are added to the amounts paid or offset against the proceeds on the underlying investment transaction to determine the realized gain or loss. An option on a futures contract gives the holder the right to enter into a specified futures contract. As the purchaser of an index option, the Fund has the right to receive a cash payment equal to any depreciation in the value of the index below the exercise price of the option (in the case of a put) or equal to any appreciation in the value of the index over the exercise price of the option (in the case of a call) as of the valuation date of the option. The risk associated with purchasing options is limited to the premium originally paid. Purchased options traded over-the-counter involve risk that the issuer or counterparty will fail to perform its contractual obligations.
I Restricted Securities— The Fund may invest in securities that are subject to legal or contractual restrictions on resale. Generally, these securities may only be sold publicly upon registration under the Securities Act of 1933 or in transactions exempt from such registration. Information regarding restricted securities (excluding Rule 144A securities) is included at the end of the Schedule of Investments.
J Distributions to Shareholders— Distributions to shareholders are recorded by the Fund on ex-dividend date. The Fund declares income distributions daily to shareholders of record at the time of declaration and generally pays them monthly. The Fund makes distributions of net realized capital gains, if any, at least annually. Distributions are declared separately for each class of shares. Distributions are determined in accordance with income tax regulations, which may differ from U.S. GAAP; accordingly, periodic reclassifications are made within the Fund’s capital accounts to reflect income and gains available for distribution under income tax regulations.
K Estimates— The preparation of financial statements in conformity with U.S. GAAP requires management to make estimates and assumptions that affect the reported amounts of assets and liabilities and disclosure of contingent assets and liabilities at the date of the financial statements and the reported amounts of increases and decreases in net assets from operations during the reporting period. Actual results could differ from those estimates.
Calvert
Green Bond Fund
September 30, 2023
Notes to Financial Statements — continued
L Indemnifications— The Corporation’s By-Laws provide for indemnification for Directors or officers of the Corporation and certain other parties, to the fullest extent permitted by Maryland law and the 1940 Act, provided certain conditions are met. Additionally, in the normal course of business, the Fund enters into agreements with service providers that may contain indemnification clauses. The Fund’s maximum exposure under these arrangements is unknown as this would involve future claims that may be made against the Fund that have not yet occurred.
M Federal Income Taxes— No provision for federal income or excise tax is required since the Fund intends to continue to qualify as a regulated investment company under the Internal Revenue Code and to distribute substantially all of its taxable earnings.
Management has analyzed the Fund's tax positions taken for all open federal income tax years and has concluded that no provision for federal income tax is required in the Fund's financial statements. A Fund's federal tax return is subject to examination by the Internal Revenue Service for a period of three years from the date of filing.
2 Related Party Transactions
The investment advisory fee is earned by Calvert Research and Management (CRM), an indirect, wholly-owned subsidiary of Morgan Stanley, as compensation for investment advisory services rendered to the Fund. The investment advisory fee is computed at the annual rate of 0.25% of the Fund’s average daily net assets and is payable monthly. For the year ended September 30, 2023, the investment advisory fee amounted to $1,877,848.
The Fund may invest in a money market fund, the Institutional Class of the Morgan Stanley Institutional Liquidity Funds - Government Portfolio (the “Liquidity Fund”), an open-end management investment company managed by Morgan Stanley Investment Management Inc., a wholly-owned subsidiary of Morgan Stanley. The investment advisory fee paid by the Fund is reduced by an amount equal to its pro rata share of the advisory and administration fees paid by the Fund due to its investment in the Liquidity Fund. For the year ended September 30, 2023, the investment advisory fee paid was reduced by $33,269 relating to the Fund’s investment in the Liquidity Fund.
CRM has agreed to reimburse the Fund's operating expenses to the extent that total annual operating expenses (relating to ordinary operating expenses only and excluding expenses such as brokerage commissions, acquired fund fees and expenses of unaffiliated funds, borrowing costs, taxes or litigation expenses) exceed 0.73%, 0.48% and 0.43% for Class A, Class I and Class R6, respectively, of such class’s average daily net assets. The expense reimbursement agreement with CRM may be changed or terminated after February 1, 2025. For the year ended September 30, 2023, CRM waived or reimbursed expenses of $367,711.
The administrative fee is earned by CRM as compensation for administrative services rendered to the Fund. The fee is computed at an annual rate of 0.12% of the Fund’s average daily net assets attributable to Class A, Class I and Class R6 and is payable monthly. For the year ended September 30, 2023, CRM was paid administrative fees of $901,367.
The Fund has in effect a distribution plan for Class A shares (Class A Plan) pursuant to Rule 12b-1 under the 1940 Act. Pursuant to the Class A Plan, the Fund pays Eaton Vance Distributors, Inc. (EVD), an affiliate of CRM and the Fund’s principal underwriter, a distribution and service fee of 0.25% per annum of its average daily net assets attributable to Class A shares for distribution services and facilities provided to the Fund by EVD, as well as for personal services and/or the maintenance of shareholder accounts. Distribution and service fees paid or accrued for the year ended September 30, 2023 amounted to $173,670 for Class A shares.
The Fund was informed that EVD received $9,914 as its portion of the sales charge on sales of Class A shares and $1,956 of contingent deferred sales charges paid by Fund shareholders for the year ended September 30, 2023.
Eaton Vance Management (EVM), an affiliate of CRM, provides sub-transfer agency and related services to the Fund pursuant to a Sub-Transfer Agency Support Services Agreement. For the year ended September 30, 2023, sub-transfer agency fees and expenses incurred to EVM amounted to $18,298 and are included in transfer agency fees and expenses on the Statement of Operations.
Each Director of the Fund who is not an employee of CRM or its affiliates receives an annual fee of $214,000, an annual Committee fee ranging from $8,500 to $16,500 depending on the Committee, and may receive a fee of $10,000 for special meetings. The Board chair receives an additional $40,000 ($30,000 prior to January 1, 2023) annual fee, Committee chairs receive an additional $15,000 ($6,000 prior to January 1, 2023) annual fee and the special equities liaison receives an additional $2,500 annual fee. Eligible Directors may participate in a Deferred Compensation Plan (the Plan). Amounts deferred under the Plan are treated as though equal dollar amounts had been invested in shares of the Fund or other Calvert funds selected by the Directors. The Fund purchases shares of the funds selected equal to the dollar amounts deferred under the Plan, resulting in an asset equal to the deferred compensation liability. Obligations of the Plan are paid solely from the Fund's assets. Directors’ fees are allocated to each of the Calvert funds served. Salaries and fees of officers and Directors of the Fund who are employees of CRM or its affiliates are paid by CRM.
Calvert
Green Bond Fund
September 30, 2023
Notes to Financial Statements — continued
3 Investment Activity
During the year ended September 30, 2023, the cost of purchases and proceeds from sales of investments, other than U.S. government and agency securities and short-term securities and including maturities, paydowns and principal repayments on senior floating-rate loans, were $144,965,194 and $264,400,930, respectively. Purchases and sales of U.S. government and agency securities, including paydowns, were $85,416,571 and $4,582,651, respectively.
4 Distributions to Shareholders and Income Tax Information
The tax character of distributions declared for the years ended September 30, 2023 and September 30, 2022 was as follows:
| | Year Ended September 30, |
| | 2023 | 2022 |
| Ordinary income | $20,088,394 | $16,734,788 |
| Long-term capital gains | $ — | $ 3,282,913 |
During the year ended September 30, 2023, accumulated loss was increased by $366,201 and paid-in capital was increased by $366,201 due to the Fund's use of equalization accounting. Tax equalization accounting allows the Fund to treat as a distribution that portion of redemption proceeds representing a redeeming shareholder’s portion of undistributed taxable income and net capital gains. These reclassifications had no effect on the net assets or net asset value per share of the Fund.
As of September 30, 2023, the components of distributable earnings (accumulated loss) on a tax basis were as follows:
| Undistributed ordinary income | $ 2,469,175 |
| Deferred capital losses | (54,320,012) |
| Net unrealized depreciation | (99,702,481) |
| Distributions payable | (29,031) |
| Accumulated loss | $(151,582,349) |
At September 30, 2023, the Fund, for federal income tax purposes, had deferred capital losses of $54,320,012 which would reduce the Fund’s taxable income arising from future net realized gains on investment transactions, if any, to the extent permitted by the Internal Revenue Code, and thus would reduce the amount of distributions to shareholders, which would otherwise be necessary to relieve the Fund of any liability for federal income or excise tax. The deferred capital losses are treated as arising on the first day of the Fund’s next taxable year, can be carried forward for an unlimited period, and retain the same short-term or long-term character as when originally deferred. Of the deferred capital losses at September 30, 2023, $5,493,964 are short-term and $48,826,048 are long-term.
The cost and unrealized appreciation (depreciation) of investments, including open derivative contracts, of the Fund at September 30, 2023, as determined on a federal income tax basis, were as follows:
| Aggregate cost | $ 820,100,686 |
| Gross unrealized appreciation | $ 4,429,542 |
| Gross unrealized depreciation | (104,125,082) |
| Net unrealized depreciation | $ (99,695,540) |
Calvert
Green Bond Fund
September 30, 2023
Notes to Financial Statements — continued
5 Financial Instruments
The Fund may trade in financial instruments with off-balance sheet risk in the normal course of its investing activities. These financial instruments may include forward foreign currency exchange contracts and futures contracts and may involve, to a varying degree, elements of risk in excess of the amounts recognized for financial statement purposes. The notional or contractual amounts of these instruments represent the investment the Fund has in particular classes of financial instruments and do not necessarily represent the amounts potentially subject to risk. The measurement of the risks associated with these instruments is meaningful only when all related and offsetting transactions are considered. A summary of obligations under these financial instruments at September 30, 2023 is included in the Schedule of Investments. At September 30, 2023, the Fund had sufficient cash and/or securities to cover commitments under these contracts.
In the normal course of pursuing its investment objective, the Fund is subject to the following risks:
Foreign Exchange Risk: During the year ended September 30, 2023, the Fund entered into forward foreign currency exchange contracts to seek to hedge against the decline in the value of currencies in which its portfolio holdings are denominated against the U.S. dollar.
Interest Rate Risk: During the year ended September 30, 2023, the Fund used futures contracts and options on futures contracts to hedge interest rate risk and to manage duration.
The Fund enters into forward foreign currency exchange contracts that may contain provisions whereby the counterparty may terminate the contract under certain conditions, including but not limited to a decline in the Fund’s net assets below a certain level over a certain period of time, which would trigger a payment by the Fund for those derivatives in a liability position. At September 30, 2023, the fair value of derivatives with credit-related contingent features in a net liability position was $404,362. At September 30, 2023 there were no assets pledged by the Fund for such liability.
The over-the-counter (OTC) derivatives in which the Fund invests are subject to the risk that the counterparty to the contract fails to perform its obligations under the contract. To mitigate this risk, the Fund has entered into an International Swaps and Derivatives Association, Inc. Master Agreement (“ISDA Master Agreement”) with its derivative counterparties. The ISDA Master Agreement is a bilateral agreement between the Fund and the counterparty that governs certain OTC derivatives and typically contains, among other things, set-off provisions in the event of a default and/or termination event as defined under the ISDA Master Agreement. Under the ISDA Master Agreement, the Fund may, under certain circumstances, offset with the counterparty certain derivative financial instruments’ payables and/or receivables with collateral held and/or posted and create one single net payment. The provisions of the ISDA Master Agreement typically permit a single net payment in the event of default including the bankruptcy or insolvency of the counterparty. However, bankruptcy or insolvency laws of a particular jurisdiction may impose restrictions on or prohibitions against the right of offset in bankruptcy or insolvency. Certain ISDA Master Agreements allow the counterparty to OTC derivatives to terminate derivative contracts prior to maturity in the event the Fund’s net assets decline by a stated percentage or the Fund fails to meet the terms of its ISDA Master Agreements, which would cause the counterparty to accelerate payment by the Fund of any net liability owed to it.
The collateral requirements for derivatives traded under the ISDA Master Agreement are governed by a Credit Support Annex to the ISDA Master Agreement. Collateral requirements are determined at the close of business each day and are typically based on changes in market values for each transaction under the ISDA Master Agreement and netted into one amount for such agreement. Generally, the amount of collateral due from or to a counterparty is subject to a minimum transfer threshold amount before a transfer is required. Collateral pledged for the benefit of the Fund and/or counterparty is held in segregated accounts by the Fund’s custodian and cannot be sold, re-pledged, assigned or otherwise used while pledged. The portion of such collateral representing cash, if any, is reflected as deposits for derivatives collateral and, in the case of cash pledged by a counterparty for the benefit of the Fund, a corresponding liability on the Statement of Assets and Liabilities. Securities pledged by the Fund as collateral, if any, are identified as such in the Schedule of Investments.
At September 30, 2023, the fair value of open derivative instruments (not considered to be hedging instruments for accounting disclosure purposes) by risk exposure was as follows:
Calvert
Green Bond Fund
September 30, 2023
Notes to Financial Statements — continued
| Risk | Derivative | Statement of Assets and Liabilities Caption | Assets | Liabilities |
| Foreign exchange | Forward foreign currency exchange contracts | Receivable/Payable for open forward foreign currency
exchange contracts | $ 4,704,987 | $ (404,362) |
| Interest rate | Futures contracts | Accumulated loss | 1,246,456 (1) | (3,494,149) (1) |
| Interest rate | Purchased options | Investments in securities of unaffiliated issuers, at value | 79,406 | — |
| Total | | | $6,030,849 | $(3,898,511) |
| Derivatives not subject to master netting agreement | $1,325,862 | $(3,494,149) |
| Total Derivatives subject to master netting agreement | $4,704,987 | $ (404,362) |
| (1) | Only the current day's variation margin is reported within the Statement of Assets and Liabilities as Receivable or Payable for variation margin on open futures contracts, as applicable. |
The Fund’s derivative assets and liabilities at fair value by risk, which are reported gross in the Statement of Assets and Liabilities, are presented in the table above. The following tables present the Fund’s derivative assets and liabilities by counterparty, net of amounts available for offset under a master netting agreement and net of the related collateral received by the Fund for such assets and pledged by the Fund for such liabilities as of September 30, 2023.
| Counterparty | Derivative
Assets Subject to
Master Netting
Agreement | Derivatives
Available
for Offset | Non-cash
Collateral
Received(a) | Cash
Collateral
Received(a) | Net Amount
of Derivative
Assets(b) |
| Barclays Bank PLC | $ 169,374 | $ — | $ — | $ — | $ 169,374 |
| Citibank, N.A. | 174,496 | — | — | — | 174,496 |
| JPMorgan Chase Bank, N.A. | 4,359,736 | (3,147) | — | — | 4,356,589 |
| UBS AG | 1,381 | (1,381) | — | — | — |
| | $4,704,987 | $(4,528) | $ — | $ — | $4,700,459 |
| Counterparty | Derivative
Liabilities Subject to
Master Netting
Agreement | Derivatives
Available
for Offset | Non-cash
Collateral
Pledged(a) | Cash
Collateral
Pledged(a) | Net Amount
of Derivative
Liabilities(c) |
| Bank of America, N.A. | $ (377,646) | $ — | $ — | $ — | $ (377,646) |
| JPMorgan Chase Bank, N.A. | (3,147) | 3,147 | — | — | — |
| UBS AG | (23,569) | 1,381 | — | — | (22,188) |
| | $(404,362) | $4,528 | $ — | $ — | $(399,834) |
| (a) | In some instances, the total collateral received and/or pledged may be more than the amount shown due to overcollateralization. |
| (b) | Net amount represents the net amount due from the counterparty in the event of default. |
| (c) | Net amount represents the net amount payable to the counterparty in the event of default. |
Calvert
Green Bond Fund
September 30, 2023
Notes to Financial Statements — continued
The effect of derivative instruments (not considered to be hedging instruments for accounting disclosure purposes) on the Statement of Operations by risk exposure for the year ended September 30, 2023 was as follows:
| Statement of Operations Caption | Foreign exchange | Interest rate | Total |
| Net realized gain (loss): | | | |
| Forward foreign currency exchange contracts | $ (7,818,925) | $ — | $ (7,818,925) |
| Futures contracts | — | (4,296,624) | (4,296,624) |
| Total | $(7,818,925) | $(4,296,624) | $(12,115,549) |
| Change in unrealized appreciation (depreciation): | | | |
| Investment securities(1) | $ — | $ 2,123 | $ 2,123 |
| Forward foreign currency exchange contracts | 1,147,932 | — | 1,147,932 |
| Futures contracts | — | (5,932,353) | (5,932,353) |
| Total | $ 1,147,932 | $(5,930,230) | $ (4,782,298) |
| (1) | Relates to purchased options. |
The average notional cost of futures contracts and average notional amounts of other derivative contracts outstanding during the year ended September 30, 2023, which are indicative of the volume of these derivative types, were approximately as follows:
| Futures Contracts — Long | Futures Contracts — Short | Forward Foreign Currency Exchange Contracts* |
| $158,232,000 | $60,027,000 | $137,641,000 |
| * | The average notional amount for forward foreign currency exchange contracts is based on the absolute value of notional amounts of currency purchased and currency sold. |
The average number of purchased options contracts outstanding during the year ended September 30, 2023, which is indicative of the volume of this derivative type, was 12 contracts.
6 Securities Lending
To generate additional income, the Fund may lend its securities pursuant to a securities lending agency agreement with State Street Bank and Trust Company (SSBT), the securities lending agent. Security loans are subject to termination by the Fund at any time and, therefore, are not considered illiquid investments. The Fund requires that the loan be continuously collateralized by either cash or securities in an amount at least equal to the market value of the securities on loan. The market value of securities loaned is determined daily and any additional required collateral is delivered to the Fund on the next business day. Cash collateral is generally invested in a money market fund registered under the 1940 Act that is managed by an affiliate of SSBT. Any gain or loss in the market price of the loaned securities that might occur and any interest earned or dividends declared during the term of the loan would accrue to the account of the Fund. Income earned on the investment of collateral, net of broker rebates and other expenses incurred by the securities lending agent, is split between the Fund and the securities lending agent based on agreed upon contractual terms. Non-cash collateral, if any, is held by the lending agent on behalf of the Fund and cannot be sold or re-pledged by the Fund; accordingly, such collateral is not reflected in the Statement of Assets and Liabilities.
The risks associated with lending portfolio securities include, but are not limited to, possible delays in receiving additional collateral or in the recovery of the loaned securities, possible loss of rights to the collateral should the borrower fail financially, as well as risk of loss in the value of the collateral or the value of the investments made with the collateral. The securities lending agent shall indemnify the Fund in the case of default of any securities borrower.
At September 30, 2023, the total value of securities on loan, including accrued interest, was $19,909,936 and the total value of collateral received was $20,319,098, comprised cash of $4,407,338 and U.S. government and/or agencies securities of $15,911,760.
Calvert
Green Bond Fund
September 30, 2023
Notes to Financial Statements — continued
The following table provides a breakdown of securities lending transactions accounted for as secured borrowings, the obligations by class of collateral pledged, and the remaining contractual maturity of those transactions as of September 30, 2023.
| | Remaining Contractual Maturity of the Transactions |
| | Overnight and
Continuous | <30 days | 30 to 90 days | >90 days | Total |
| Corporate Bonds | $ 3,194,588 | $ — | $ — | $ — | $ 3,194,588 |
| Sovereign Government Bonds | 1,212,750 | — | — | — | 1,212,750 |
| Total | $4,407,338 | $ — | $ — | $ — | $4,407,338 |
The carrying amount of the liability for deposits for securities loaned at September 30, 2023 approximated its fair value. If measured at fair value, such liability would have been considered as Level 2 in the fair value hierarchy (see Note 1A) at September 30, 2023.
7 Line of Credit
The Fund participates with other portfolios and funds managed by EVM and its affiliates, including CRM, in a $725 million unsecured revolving line of credit agreement with a group of banks, which is in effect through October 24, 2023. Borrowings are made by the Fund solely for temporary purposes related to redemptions and other short-term cash needs. Interest is charged to the Fund based on its borrowings at an amount above either the Secured Overnight Financing Rate (SOFR) or Federal Funds rate. In addition, a fee computed at an annual rate of 0.15% on the daily unused portion of the line of credit is allocated among the participating portfolios and funds at the end of each quarter. In connection with the renewal of the agreement in October 2022, an arrangement fee of $150,000 was incurred that was allocated to the participating portfolios and funds. Because the line of credit is not available exclusively to the Fund, it may be unable to borrow some or all of its requested amounts at any particular time.
At September 30, 2023, the Fund had a balance outstanding pursuant to this line of credit of $8,190,000 at an annual interest rate of 6.33%. Based on the short-term nature of the borrowings under the line of credit and variable interest rate, the carrying value of the borrowings approximated its fair value at September 30, 2023. If measured at fair value, borrowings under the line of credit would have been considered as Level 2 in the fair value hierarchy (see Note 1A) at September 30, 2023. The Fund's average borrowings and allocated fees for the year ended September 30, 2023 were not significant. Effective October 24, 2023, the Fund renewed its line of credit agreement, which expires October 22, 2024. In connection with the renewal, the borrowing limit was decreased to $650 million.
8 Affiliated Investments
The Fund has invested a portion of its assets in notes (the Notes) issued by Calvert Impact Capital, Inc. (CIC) pursuant to exemptive relief granted by the U.S. Securities and Exchange Commission (the SEC). There are certain potential points of affiliation between the Fund and CIC. CRM has licensed use of the Calvert name to CIC and provides other types of support. An officer of CRM's affiliate serves on the CIC Board. In addition, a director/trustee on the Fund Board serves as a director emeritus on the CIC Board.
At September 30, 2023, the value of the Fund's investment in the Notes and in issuers and funds that may be deemed to be affiliated was $1,755,613, which represents 0.2% of the Fund's net assets. Transactions in such investments by the Fund for the year ended September 30, 2023 were as follows:
| Name | Value,
beginning
of period | Purchases | Sales
proceeds | Net
realized
gain
(loss) | Change in
unrealized
appreciation
(depreciation) | Value,
end of
period | Interest/
Dividend
income | Principal amount/
Shares,
end of period |
| Corporate Bonds | | | | | | | | |
| Mitsubishi UFJ Financial Group, Inc., 2.527%, 9/13/23 | $ 1,073,319 | $ — | $ (1,100,000) | $ — | $ 22,351 | $ — | $ 30,737 | $ — |
| High Social Impact Investments | | | | | | | | |
| Calvert Impact Capital, Inc., Community Investment Notes, 1.50%, 12/15/23(1) | 1,578,892 | — | — | — | 97,801 | 1,676,693 | 25,500 | 1,700,000 |
Calvert
Green Bond Fund
September 30, 2023
Notes to Financial Statements — continued
| Name | Value,
beginning
of period | Purchases | Sales
proceeds | Net
realized
gain
(loss) | Change in
unrealized
appreciation
(depreciation) | Value,
end of
period | Interest/
Dividend
income | Principal amount/
Shares,
end of period |
| Short-Term Investments | | | | | | |
| Liquidity Fund | $15,154,018 | $308,249,960 | $(323,325,058) | $ — | $ — | $ 78,920 | $ 1,048,576 | 78,920 |
| Total | | | | $ — | $120,152 | $1,755,613 | $1,104,813 | |
9 Capital Shares
The Corporation may issue its shares in one or more series (such as the Fund). The authorized shares of the Fund consist of 75,000,000 common shares, $0.01 par value, for each Class.
Transactions in capital shares were as follows:
| | Year Ended
September 30, 2023 | | Year Ended
September 30, 2022 |
| | Shares | Amount | | Shares | Amount |
| Class A | | | | | |
| Shares sold | 1,165,520 | $ 15,970,372 | | 986,103 | $ 15,026,712 |
| Reinvestment of distributions | 120,432 | 1,652,381 | | 104,014 | 1,565,708 |
| Shares redeemed | (1,704,109) | (23,453,439) | | (1,354,956) | (20,335,186) |
| Net decrease | (418,157) | $ (5,830,686) | | (264,839) | $ (3,742,766) |
| Class I | | | | | |
| Shares sold | 14,720,475 | $ 202,312,311 | | 23,980,270 | $ 360,371,565 |
| Reinvestment of distributions | 1,254,632 | 17,233,934 | | 1,178,084 | 17,756,011 |
| Shares redeemed | (18,747,571) | (256,603,276) | | (29,658,865) | (439,814,679) |
| Net decrease | (2,772,464) | $ (37,057,031) | | (4,500,511) | $ (61,687,103) |
| Class R6 | | | | | |
| Shares sold | 779,213 | $ 10,723,443 | | 2,818,485 | $ 41,476,746 |
| Reinvestment of distributions | 65,020 | 893,595 | | 25,377 | 363,498 |
| Shares redeemed | (608,213) | (8,346,473) | | (598,929) | (8,867,582) |
| Net increase | 236,020 | $ 3,270,565 | | 2,244,933 | $ 32,972,662 |
10 Risks and Uncertainties
Risks Associated with Foreign Investments
Foreign investments can be adversely affected by political, economic and market developments abroad, including the imposition of economic and other sanctions by the United States or another country. There may be less publicly available information about foreign issuers because they may not be subject to reporting practices, requirements or regulations comparable to those to which United States companies are subject. Foreign markets may be smaller, less liquid and more volatile than the major markets in the United States. Trading in foreign markets typically involves higher expense than trading in the United States. The Fund may have difficulties enforcing its legal or contractual rights in a foreign country. Securities that trade or are denominated in currencies other than the U.S. dollar may be adversely affected by fluctuations in currency exchange rates.
Economic data as reported by sovereign entities may be delayed, inaccurate or fraudulent. In the event of a default by a sovereign entity, there are typically no assets to be seized or cash flows to be attached. Furthermore, the willingness or ability of a sovereign entity to restructure defaulted debt may be limited. Therefore, losses on sovereign defaults may far exceed the losses from the default of a similarly rated U.S. debt issuer.
Calvert
Green Bond Fund
September 30, 2023
Report of Independent Registered Public Accounting Firm
To the Board of Directors of Calvert Impact Fund, Inc. and Shareholders of Calvert Green Bond Fund:
Opinion on the Financial Statements and Financial Highlights
We have audited the accompanying statement of assets and liabilities of Calvert Green Bond Fund (the “Fund”) (one of the funds constituting Calvert Impact Fund, Inc.), including the schedule of investments, as of September 30, 2023, the related statement of operations for the year then ended, the statements of changes in net assets for each of the two years in the period then ended, the financial highlights for each of the three years in the period then ended, and the related notes. In our opinion, the financial statements and financial highlights present fairly, in all material respects, the financial position of the Fund as of September 30, 2023, and the results of its operations for the year then ended, the changes in its net assets for each of the two years in the period then ended, and the financial highlights for each of the three years in the period then ended, in conformity with accounting principles generally accepted in the United States of America. The financial highlights for the years ended September 30, 2020 and 2019 were audited by other auditors whose report, dated November 20, 2020, expressed an unqualified opinion on those financial highlights.
Basis for Opinion
These financial statements and financial highlights are the responsibility of the Fund's management. Our responsibility is to express an opinion on the Fund's financial statements and financial highlights based on our audits. We are a public accounting firm registered with the Public Company Accounting Oversight Board (United States) (PCAOB) and are required to be independent with respect to the Fund in accordance with the U.S. federal securities laws and the applicable rules and regulations of the Securities and Exchange Commission and the PCAOB.
We conducted our audits in accordance with the standards of the PCAOB. Those standards require that we plan and perform the audit to obtain reasonable assurance about whether the financial statements and financial highlights are free of material misstatement, whether due to error or fraud. The Fund is not required to have, nor were we engaged to perform, an audit of its internal control over financial reporting. As part of our audits, we are required to obtain an understanding of internal control over financial reporting but not for the purpose of expressing an opinion on the effectiveness of the Fund’s internal control over financial reporting. Accordingly, we express no such opinion.
Our audits included performing procedures to assess the risks of material misstatement of the financial statements and financial highlights, whether due to error or fraud, and performing procedures that respond to those risks. Such procedures included examining, on a test basis, evidence regarding the amounts and disclosures in the financial statements and financial highlights. Our audits also included evaluating the accounting principles used and significant estimates made by management, as well as evaluating the overall presentation of the financial statements and financial highlights. Our procedures included confirmation of securities owned as of September 30, 2023, by correspondence with the custodian and brokers; when replies were not received from brokers, we performed other auditing procedures. We believe that our audits provide a reasonable basis for our opinion.
/s/ Deloitte & Touche LLP
Boston, Massachusetts
November 22, 2023
We have served as the auditor of one or more Calvert investment companies since 2021.
Calvert
Green Bond Fund
September 30, 2023
Federal Tax Information (Unaudited)
The Form 1099-DIV you receive in February 2024 will show the tax status of all distributions paid to your account in calendar year 2023. Shareholders are advised to consult their own tax adviser with respect to the tax consequences of their investment in the Fund. As required by the Internal Revenue Code and/or regulations, shareholders must be notified regarding the status of 163(j) interest dividends.
163(j) Interest Dividends. For the fiscal year ended September 30, 2023, the Fund designates 75.23% of distributions from net investment income as a 163(j) interest dividend.
Calvert
Green Bond Fund
September 30, 2023
Board of Directors' Contract Approval
Overview of the Contract Review Process
The Investment Company Act of 1940, as amended, provides, in substance, that each investment advisory agreement between a fund and its investment adviser will continue in effect from year to year only if its continuation is approved at least annually by the fund’s board of directors, including by a vote of a majority of the directors who are not “interested persons” of the fund (“Independent Directors”), cast in person at a meeting called for the purpose of considering such approval.
At an in-person meeting of the Boards of Trustees/Directors (each a “Board”) of the registered investment companies advised by Calvert Research and Management (“CRM” or the “Adviser”) (the “Calvert Funds”) held on June 12-13, 2023, the Board, including a majority of the Independent Directors, voted to approve continuation of existing investment advisory and investment sub-advisory agreements for the Calvert Funds for an additional one-year period.
In evaluating the investment advisory and investment sub-advisory agreements for the Calvert Funds, the Board considered a variety of information relating to the Calvert Funds and various service providers, including the Adviser. The Independent Directors reviewed a report prepared by the Adviser regarding various services provided to the Calvert Funds by the Adviser and its affiliates. Such report included, among other data, information regarding the Adviser’s personnel and the Adviser’s revenue and cost of providing services to the Calvert Funds, and a separate report prepared by an independent data provider, which compared each fund’s investment performance, fees and expenses to those of comparable funds as identified by such independent data provider (“comparable funds”).
The Independent Directors were separately represented by independent legal counsel with respect to their consideration of the continuation of the investment advisory and investment sub-advisory agreements for the Calvert Funds. Prior to voting, the Independent Directors reviewed the proposed continuation of the Calvert Funds’ investment advisory and investment sub-advisory agreements with management and also met in private sessions with their counsel at which time no representatives of management were present.
The information that the Board considered included, among other things, the following (for funds that invest through one or more affiliated underlying fund(s), references to “each fund” in this section may include information that was considered at the underlying fund-level):
Information about Fees, Performance and Expenses
| • | A report from an independent data provider comparing the advisory and related fees paid by each fund with fees paid by comparable funds; |
| • | A report from an independent data provider comparing each fund’s total expense ratio and its components to comparable funds; |
| • | A report from an independent data provider comparing the investment performance of each fund to the investment performance of comparable funds over various time periods; |
| • | Data regarding investment performance in comparison to benchmark indices; |
| • | For each fund, comparative information concerning the fees charged and the services provided by the Adviser in managing other accounts (including mutual funds, other collective investment funds and institutional accounts) using investment strategies and techniques similar to those used in managing such fund; |
| • | Profitability analyses for the Adviser with respect to each fund; |
Information about Portfolio Management and Trading
| • | Descriptions of the investment management services provided to each fund, including investment strategies and processes it employs; |
| • | Information about the Adviser’s policies and practices with respect to trading, including the Adviser’s processes for monitoring best execution of portfolio transactions; |
| • | Information about the allocation of brokerage transactions and the benefits received by the Adviser as a result of brokerage allocation, including information concerning the acquisition of research through client commission arrangements and policies with respect to “soft dollars”; |
Information about the Adviser
| • | Reports detailing the financial results and condition of CRM; |
| • | Descriptions of the qualifications, education and experience of the individual investment professionals whose responsibilities include portfolio management and investment research for the funds, and information relating to their compensation and responsibilities with respect to managing other mutual funds and investment accounts; |
| • | Policies and procedures relating to proxy voting and the handling of corporate actions and class actions; |
| • | A description of CRM’s procedures for overseeing sub-advisers, including with respect to regulatory and compliance issues, investment management and other matters; |
Calvert
Green Bond Fund
September 30, 2023
Board of Directors' Contract Approval — continued
Other Relevant Information
| • | Information concerning the nature, cost and character of the administrative and other non-investment advisory services provided by CRM and its affiliates; and |
| • | The terms of each investment advisory agreement. |
Over the course of the year, the Board and its committees held regular quarterly meetings. During these meetings, the Directors participated in investment and performance reviews with the portfolio managers and other investment professionals of the Adviser relating to each fund and considered various investment and trading strategies used in pursuing each fund’s investment objective(s), such as the use of derivative instruments, as well as risk management techniques. The Board and its committees also evaluated issues pertaining to industry and regulatory developments, compliance procedures, corporate governance and other issues with respect to the funds and received and participated in reports and presentations provided by CRM and its affiliates with respect to such matters. In addition to the formal meetings of the Board and its committees, the Independent Directors held regular video conferences in between meetings to discuss, among other topics, matters relating to the continuation of the Calvert Funds’ investment advisory and investment sub-advisory agreements.
For funds that invest through one or more affiliated underlying funds, the Board considered similar information about the underlying fund(s) when considering the approval of investment advisory agreements. In addition, in cases where the Adviser has engaged a sub-adviser, the Board considered similar information about the sub-adviser when considering the approval of any investment sub-advisory agreement.
The Independent Directors were assisted throughout the contract review process by their independent legal counsel. The Independent Directors relied upon the advice of such counsel and their own business judgment in determining the material factors to be considered in evaluating each investment advisory and investment sub-advisory agreement and the weight to be given to each such factor. The Board, including the Independent Directors, did not identify any single factor as controlling, and each Director may have attributed different weight to various factors.
Results of the Contract Review Process
Based on its consideration of the foregoing, and such other information as it deemed relevant, including the factors and conclusions described below, the Board, including the Independent Directors, concluded that the continuation of the investment advisory agreement of Calvert Green Bond Fund (the “Fund”), including the fee payable under the agreement, is in the best interests of the Fund’s shareholders. Accordingly, the Board, including a majority of the Independent Directors, voted to approve the continuation of the investment advisory agreement of the Fund.
Nature, Extent and Quality of Services
In considering the nature, extent and quality of the services provided by the Adviser under the investment advisory agreement, the Board reviewed information provided by the Adviser relating to its operations and personnel, including, among other information, biographical information on the Adviser’s investment personnel and descriptions of its organizational and management structure. The Board also took into account similar information provided periodically throughout the previous year by the Adviser as well as the Board’s familiarity with management through Board meetings, discussions and other reports. The Board considered the Adviser’s management style and its performance in employing its investment strategies as well as its current level of staffing and overall resources. The Board also noted that it reviewed on a quarterly basis information regarding the Adviser’s compliance with applicable policies and procedures, including those related to personal investing. The Board took into account, among other items, periodic reports received from the Adviser over the past year concerning the Adviser’s ongoing review and enhancement of certain processes, policies and procedures of the Calvert Funds and the Adviser. The Board concluded that it was satisfied with the nature, extent and quality of services provided to the Fund by the Adviser under the investment advisory agreement.
Fund Performance
In considering the Fund’s performance, the Board noted that it reviewed on a quarterly basis detailed information about the Fund’s performance results, portfolio composition and investment strategies. The Board compared the Fund’s investment performance to that of the Fund’s peer universe and its benchmark index. The Board’s review included comparative performance data for the one-, three- and five-year periods ended December 31, 2022. This performance data indicated that the Fund had outperformed the median of its peer universe for the one-year period ended December 31, 2022, while it had underperformed the median of its peer universe for the three- and five-year periods ended December 31, 2022. The performance data also indicated that the Fund had outperformed its benchmark index for the one-, three- and five-year periods ended December 31, 2022. The Board took into account management’s discussion of the Fund’s performance. Based upon its review, the Board concluded that the Fund’s performance was satisfactory relative to the performance of its peer universe and its benchmark index.
Management Fees and Expenses
In considering the Fund’s fees and expenses, the Board compared the Fund’s fees and total expense ratio with those of comparable funds in its expense group. Among other findings, the data indicated that the Fund’s advisory and administrative fees (after taking into account waivers and/or reimbursements) (referred to collectively as “management fees”) and the Fund’s total expenses (net of waivers and/or reimbursements) were each below the respective
Calvert
Green Bond Fund
September 30, 2023
Board of Directors' Contract Approval — continued
median of the Fund’s expense group. The Board took into account the Adviser’s current undertaking to maintain expense limitations for the Fund and that the Adviser was waiving and/or reimbursing a portion of the Fund’s expenses. Based upon its review, the Board concluded that the management fees were reasonable in view of the nature, extent and quality of services provided by the Adviser.
Profitability and Other “Fall-Out” Benefits
The Board reviewed the Adviser’s profitability in regard to the Fund and the Calvert Funds in the aggregate. In reviewing the overall profitability of the Fund to the Adviser, the Board also considered the fact that the Adviser and its affiliates provided sub-transfer agency support, administrative and distribution services to the Fund for which they received compensation. The information considered by the Board included the profitability of the Fund to the Adviser and its affiliates without regard to any marketing support or other payments by the Adviser and its affiliates to third parties in respect of distribution services. The Board also considered that the Adviser and its affiliates derived benefits to their reputation and other indirect benefits from their relationships with the Fund. Based upon its review, the Board concluded that the Adviser’s and its affiliates’ level of profitability from their relationships with the Fund was reasonable.
Economies of Scale
The Board considered the effect of the Fund’s current size and its potential growth on its performance and fees. The Board concluded that adding breakpoints to the advisory fee at specified asset levels would not be appropriate at this time. The Board noted that if the Fund’s assets increased over time, the Fund might realize other economies of scale if assets increased proportionally more than certain other expenses.
Calvert
Green Bond Fund
September 30, 2023
Liquidity Risk Management Program
The Fund has implemented a written liquidity risk management program (Program) and related procedures to manage its liquidity in accordance with Rule 22e-4 under the Investment Company Act of 1940, as amended (Liquidity Rule). The Liquidity Rule defines “liquidity risk” as the risk that a fund could not meet requests to redeem shares issued by the fund without significant dilution of the remaining investors’ interests in the fund. The Fund’s Board of Trustees/Directors has designated the investment adviser to serve as the administrator of the Program and the related procedures. The administrator has established a Liquidity Risk Management Oversight Committee (Committee) to perform the functions necessary to administer the Program. As part of the Program, the administrator is responsible for identifying illiquid investments and categorizing the relative liquidity of the Fund’s investments in accordance with the Liquidity Rule. Under the Program, the administrator assesses, manages, and periodically reviews the Fund’s liquidity risk, and is responsible for making certain reports to the Fund’s Board of Trustees/Directors and the Securities and Exchange Commission (SEC) regarding the liquidity of the Fund’s investments, and to notify the Board of Trustees/Directors and the SEC of certain liquidity events specified in the Liquidity Rule. The liquidity of the Fund’s portfolio investments is determined based on a number of factors including, but not limited to, relevant market, trading and investment-specific considerations under the Program.
At a meeting of the Fund’s Board of Trustees/Directors on June 13, 2023, the Committee provided a written report to the Fund’s Board of Trustees/ Directors pertaining to the operation, adequacy, and effectiveness of implementation of the Program, as well as the operation of the highly liquid investment minimum (if applicable) for the period January 1, 2022 through December 31, 2022 (Review Period). The Program operated effectively during the Review Period, supporting the administrator’s ability to assess, manage and monitor Fund liquidity risk, including during periods of market volatility and net redemptions. During the Review Period, the Fund met redemption requests on a timely basis.
There can be no assurance that the Program will achieve its objectives in the future. Please refer to the Fund’s prospectus for more information regarding the Fund’s exposure to liquidity risk and other principal risks to which an investment in the Fund may be subject.
Calvert
Green Bond Fund
September 30, 2023
Management and Organization
Fund Management. The Directors of Calvert Impact Fund, Inc. (the Corporation) are responsible for the overall management and supervision of the affairs of the Corporation. The Board members and officers of the Corporation are listed below. Except as indicated, each individual has held the office shown or other offices in the same company for the last five years. Board members hold indefinite terms of office. Each Board member holds office until his or her successor is elected and qualified, or until his or her earlier death, resignation, retirement, removal or disqualification. Under the terms of the Fund's current Board member retirement policy, an Independent Board member must retire at the end of the calendar year in which he or she turns 75. However, if such retirement would cause the Fund to be out of compliance with Section 16 of the 1940 Act or any other regulations or guidance of the SEC, then such retirement will not become effective until such time as action has been taken for the Fund to be in compliance therewith. The “noninterested Directors” consist of those Directors who are not “interested persons” of the Corporation, as that term is defined under the 1940 Act. The business address of each Board member and the Chief Compliance Officer is 2050 M Street NW, Washington, DC 20036 and the business address of the Secretary, Vice President and Chief Legal Officer and the Treasurer is Two International Place, Boston, Massachusetts 02110. As used below, “CRM” refers to Calvert Research and Management and “Eaton Vance” refers to Eaton Vance Management. Each Director oversees 46 funds in the Calvert fund complex. Each of Eaton Vance and CRM are indirect, wholly owned subsidiaries of Morgan Stanley. Each officer affiliated with CRM may hold a position with other CRM affiliates that is comparable to his or her position with CRM listed below.
| Name and Year of Birth | Corporation
Position(s) | Length of
Service | Principal Occupation(s) and Other Directorships
During Past Five Years and Other Relevant Experience |
| Interested Director | | | |
Theodore H. Eliopoulos(1)
1964 | Director and
President | Since 2022 | President and Chief Executive Officer of CRM and senior sponsor of Morgan Stanley Investment Management’s (MSIM) Diversity Council. Formerly, Vice Chairman & Head of Strategic Partnerships at MSIM (2019-2022). Former Chief Investment Officer and interim Chief Investment Officer (2014-2018) and Senior Investment Officer of Real Estate and Real Assets at California Public Employees’ Retirement System (CalPERS) (2007-2014). Former Chief Deputy Treasurer and Deputy Treasurer at the California State Treasurer's Office (2002-2006). Mr. Eliopoulos is an interested person because of his positions with CRM and certain affiliates.
Other Directorships. The Robert Toigo Foundation; Pacific Pension & Investment Institute (PPI). |
| Noninterested Directors |
Richard L. Baird, Jr.(2)
1948 | Director | Since 2005 | Regional Disaster Recovery Lead, American Red Cross of Greater
Pennsylvania (since 2017). Volunteer, American Red Cross (since 2015).
Former President and CEO of Adagio Health Inc. (retired in 2014) in
Pittsburgh, PA.
Other Directorships. None. |
Alice Gresham Bullock
1950 | Chair and
Director | Since 2016 | Professor Emerita at Howard University School of Law. Dean Emerita of
Howard University School of Law and Deputy Director of the Association
of American Law Schools (1992-1994).
Other Directorships. None. |
Cari M. Dominguez
1949 | Director | Since 2016 | Former Chair of the U.S. Equal Employment Opportunity Commission.
Other Directorships. ManpowerGroup Inc. (workforce solutions company);
Triple S Management Corporation (managed care); National Association of Corporate Directors. |
Karen Fang(3)
1958 | Director | Since 2023 | Formerly, Managing Director, Wealth Management at GAMCO Asset Management (asset management firm) (2020-2023). Formerly, Managing Director, Senior Portfolio Manager of Fiduciary Trust Company International (wealth management firm) (1993-2019).
Other Directorships. None. |
John G. Guffey, Jr.(2)
1948 | Director | Since 2005 | President of Aurora Press Inc., a privately held publisher of trade paperbacks
(since January 1997).
Other Directorships. Calvert Impact Capital, Inc. (through December 31, 2018); Calvert Ventures, LLC. |
Miles D. Harper, III
1962 | Director | Since 2000 | Partner, Carr Riggs & Ingram (public accounting firm) since October 2014.
Partner, Gainer Donnelly & Desroches (public accounting firm) (now Carr
Riggs & Ingram) (November 1999 - September 2014).
Other Directorships. Bridgeway Funds (9) (asset management). |
Joy V. Jones
1950 | Director | Since 2000 | Attorney.
Other Directorships. Palm Management Corporation. |
Calvert
Green Bond Fund
September 30, 2023
Management and Organization — continued
| Name and Year of Birth | Corporation
Position(s) | Length of
Service | Principal Occupation(s) and Other Directorships
During Past Five Years and Other Relevant Experience |
| Noninterested Directors (continued) |
Eddie Ramos(3)
1967 | Director | Since 2023 | Private investor (2022-present). Formerly, Head of External Advisors/Diversity Portfolio Management at the New Jersey Division of Investment (2020-2022). Formerly, Chief Investment Officer and Lead Portfolio Manager – Global Fundamental Equities at Cornerstone Capital Management (asset management firm) (2011-2017).
Other Directorships. Macquarie Optimum Funds (6) (asset management). |
Anthony A. Williams
1951 | Director | Since 2016 | CEO and Executive Director of the Federal City Council (July 2012 to
present); Senior Adviser and Independent Consultant for King and
Spalding LLP (September 2015 to present); Executive Director of Global
Government Practice at the Corporate Executive Board (January 2010 to
January 2012).
Other Directorships. Freddie Mac; Evoq Properties/Meruelo Maddux
Properties, Inc. (real estate management); Weston Solutions, Inc.
(environmental services); Bipartisan Policy Center’s Debt Reduction Task Force;
Chesapeake Bay Foundation; Catholic University of America; Urban Institute (research organization); The Howard Hughes Corporation (real estate development); Old Dominion National Bank. |
| Name and Year of Birth | Corporation
Position(s) | Length of
Service | Principal Occupation(s)
During Past Five Years |
| Principal Officers who are not Directors |
Hope L. Brown
1973 | Chief
Compliance
Officer | Since 2014 | Chief Compliance Officer of 46 registered investment companies advised
by CRM (since 2014). Vice President and Chief Compliance Officer,
Wilmington Funds (2012-2014). |
Deidre E. Walsh
1971 | Secretary,
Vice President
and Chief
Legal Officer | Since 2021 | Vice President of CRM and officer of 46 registered investment companies
advised by CRM (since 2021). Also Vice President of Eaton Vance and
certain of its affiliates and officer of 127 registered investment companies
advised or administered by Eaton Vance. |
James F. Kirchner
1967 | Treasurer | Since 2016 | Vice President of CRM and officer of 46 registered investment companies
advised by CRM (since 2016). Also Vice President of Eaton Vance and
certain of its affiliates and officer of 127 registered investment companies
advised or administered by Eaton Vance. |
| | | | |
| (1) Mr. Eliopoulos is an interested person of the Fund because of his positions with the Fund’s adviser and certain affiliates. |
| (2) Effective December 31, 2023, Richard L. Baird, Jr. and John G. Guffey, Jr. will retire from the Board of Directors. |
| (3) Ms. Fang and Mr. Ramos began serving as Directors effective October 30, 2023. |
The SAI for the Fund includes additional information about the Directors and officers of the Fund and can be obtained without charge on Calvert’s website at www.calvert.com or by calling 1-800-368-2745.
| FACTS | WHAT DOES EATON VANCE DO WITH YOUR
PERSONAL INFORMATION? |
| Why? | Financial companies choose how they share your personal information. Federal law gives consumers the right to limit some but not all sharing. Federal law also requires us to tell you how we collect, share, and protect your personal information. Please read this notice carefully to understand what we do. |
| |
| What? | The types of personal information we collect and share depend on the product or service you have with us. This information can include:■ Social Security number and income
■
investment experience and risk tolerance
■
checking account number and wire transfer instructions |
| |
| How? | All financial companies need to share customers’ personal information to run their everyday business. In the section below, we list the reasons financial companies can share their customers’ personal information; the reasons Eaton Vance chooses to share; and whether you can limit this sharing. |
Reasons we can share your
personal information | Does Eaton Vance
share? | Can you limit
this sharing? |
| For our everyday business purposes — such as to process your transactions, maintain your account(s), respond to court orders and legal investigations, or report to credit bureaus | Yes | No |
| For our marketing purposes — to offer our products and services to you | Yes | No |
| For joint marketing with other financial companies | No | We don’t share |
| For our investment management affiliates’ everyday business purposes — information about your transactions, experiences, and creditworthiness | Yes | Yes |
| For our affiliates’ everyday business purposes — information about your transactions and experiences | Yes | No |
| For our affiliates’ everyday business purposes — information about your creditworthiness | No | We don’t share |
| For our investment management affiliates to market to you | Yes | Yes |
| For our affiliates to market to you | No | We don’t share |
| For nonaffiliates to market to you | No | We don’t share |
To limit our
sharing | Call toll-free 1-800-368-2745 or email: CRMPrivacy@calvert.comPlease note:If you are a new customer, we can begin sharing your information 30 days from the date we sent this notice. When you are no longer our customer, we continue to share your information as described in this notice. However, you can contact us at any time to limit our sharing. |
| Questions? | Call toll-free 1-800-368-2745 or email: CRMPrivacy@calvert.com |
| Privacy Notice — continued | April 2021 |
| Who we are |
| Who is providing this notice? | Eaton Vance Management, Eaton Vance Distributors, Inc., Eaton Vance Trust Company, Eaton Vance Management (International) Limited, Eaton Vance Advisers International Ltd., Eaton Vance Global Advisors Limited, Eaton Vance Management’s Real Estate Investment Group, Boston Management and Research, Calvert Research and Management, Eaton Vance and Calvert Fund Families and our investment advisory affiliates (“Eaton Vance”) (see Investment Management Affiliates definition below) |
| What we do |
How does Eaton Vance
protect my personal
information? | To protect your personal information from unauthorized access and use, we use security measures that comply with federal law. These measures include computer safeguards and secured files and buildings. We have policies governing the proper handling of customer information by personnel and requiring third parties that provide support to adhere to appropriate security standards with respect to such information. |
How does Eaton Vance
collect my personal
information? | We collect your personal information, for example, when you■ open an account or make deposits or withdrawals from your account
■
buy securities from us or make a wire transfer
■
give us your contact informationWe also collect your personal information from others, such as credit bureaus, affiliates, or other companies. |
| Why can’t I limit all sharing? | Federal law gives you the right to limit only■ sharing for affiliates’ everyday business purposes — information about your creditworthiness
■
affiliates from using your information to market to you
■
sharing for nonaffiliates to market to youState laws and individual companies may give you additional rights to limit sharing. See below for more on your rights under state law. |
| Definitions |
Investment Management
Affiliates | Eaton Vance Investment Management Affiliates include registered investment advisers, registered broker- dealers, and registered and unregistered funds. Investment Management Affiliates does not include entities associated with Morgan Stanley Wealth Management, such as Morgan Stanley Smith Barney LLC and Morgan Stanley & Co. |
| Affiliates | Companies related by common ownership or control. They can be financial and nonfinancial companies.■ Our affiliates include companies with a Morgan Stanley name and financial companies such as Morgan Stanley Smith Barney LLC and Morgan Stanley & Co. |
| Nonaffiliates | Companies not related by common ownership or control. They can be financial and nonfinancial companies.■ Eaton Vance does not share with nonaffiliates so they can market to you. |
| Joint marketing | A formal agreement between nonaffiliated financial companies that together market financial products or services to you.■ Eaton Vance doesn’t jointly market. |
| Other important information |
| Vermont: Except as permitted by law, we will not share personal information we collect about Vermont residents with Nonaffiliates unless you provide us with your written consent to share such information.California: Except as permitted by law, we will not share personal information we collect about California residents with Nonaffiliates and we will limit sharing such personal information with our Affiliates to comply with California privacy laws that apply to us. |
Delivery of Shareholder Documents. The Securities and Exchange Commission (SEC) permits funds to deliver only one copy of shareholder documents, including prospectuses, proxy statements and shareholder reports, to fund investors with multiple accounts at the same residential or post office box address. This practice is often called “householding” and it helps eliminate duplicate mailings to shareholders. Calvert funds, or your financial intermediary, may household the mailing of your documents indefinitely unless you instruct Calvert funds, or your financial intermediary, otherwise. If you would prefer that your Calvert fund documents not be householded, please contact Calvert funds at 1-800-368-2745, or contact your financial intermediary. Your instructions that householding not apply to delivery of your Calvert fund documents will typically be effective within 30 days of receipt by Calvert funds or your financial intermediary.
Portfolio Holdings. Each Calvert fund files a schedule of portfolio holdings on Part F to Form N-PORT with the SEC. Certain information filed on Form N-PORT may be viewed on the Calvert website at www.calvert.com, by calling Calvert at 1-800-368-2745 or in the EDGAR database on the SEC’s website at www.sec.gov.
Proxy Voting. The Proxy Voting Guidelines that each Calvert fund uses to determine how to vote proxies relating to portfolio securities is provided as an Appendix to the fund’s Statement of Additional Information. The Statement of Additional Information can be obtained free of charge by calling the Calvert funds at 1-800-368-2745, by visiting the Calvert funds’ website at www.calvert.com or visiting the SEC’s website at www.sec.gov. Information regarding how a Calvert fund voted proxies relating to portfolio securities during the most recent 12-month period ended June 30 is available by calling Calvert funds, by visiting the Calvert funds’ website at www.calvert.com or by visiting the SEC’s website at www.sec.gov.
Tailored Shareholder Reports. Effective January 24, 2023, the SEC adopted rule and form amendments to require open-end mutual funds and ETFs to transmit concise and visually engaging streamlined annual and semiannual reports to shareholders that highlight key information. Other information, including financial statements, will no longer appear in a streamlined shareholder report but must be available online, delivered free of charge upon request, and filed on a semiannual basis on Form N-CSR. The rule and form amendments have a compliance date of July 24, 2024. At this time, management is evaluating the impact of these amendments on the shareholder reports for the Calvert Funds.
This Page Intentionally Left Blank
This Page Intentionally Left Blank
This Page Intentionally Left Blank
Investment Adviser and Administrator
Calvert Research and Management
2050 M Street NW
Washington, DC 20036
Principal Underwriter*
Eaton Vance Distributors, Inc.
Two International Place
Boston, MA 02110
(617) 482-8260
Custodian
State Street Bank and Trust Company
One Congress Street, Suite 1
Boston, MA 02114-2016
Transfer Agent
SS&C Global Investor & Distribution Solutions, Inc.
2000 Crown Colony Drive
Quincy, MA 02169
Independent Registered Public Accounting Firm
Deloitte & Touche LLP
200 Berkeley Street
Boston, MA 02116-5022
Fund Offices
2050 M Street NW
Washington, DC 20036
* FINRA BrokerCheck. Investors may check the background of their Investment Professional by contacting the Financial Industry Regulatory Authority (FINRA). FINRA BrokerCheck is a free tool to help investors check the professional background of current and former FINRA-registered securities firms and brokers. FINRA BrokerCheck is available by calling 1-800-289-9999 and at www.FINRA.org. The FINRA BrokerCheck brochure describing this program is available to investors at www.FINRA.org.
Printed on recycled paper.
24201 9.30.23
Calvert
Small-Cap Fund
Annual Report
September 30, 2023
Commodity Futures Trading Commission Registration. The Commodity Futures Trading Commission (“CFTC”) has adopted regulations that subject registered investment companies and advisers to regulation by the CFTC if a fund invests more than a prescribed level of its assets in certain CFTC-regulated instruments (including futures, certain options and swap agreements) or markets itself as providing investment exposure to such instruments. The adviser has claimed an exclusion from the definition of “commodity pool operator” under the Commodity Exchange Act with respect to its management of the Fund and the other funds it manages. Accordingly, neither the Fund nor the adviser is subject to CFTC regulation.
Fund shares are not insured by the FDIC and are not deposits or other obligations of, or guaranteed by, any depository institution. Shares are subject to investment risks, including possible loss of principal invested.
This report must be preceded or accompanied by a current summary prospectus or prospectus. Before investing, investors should consider carefully the investment objective, risks, and charges and expenses of a mutual fund. This and other important information is contained in the summary prospectus and prospectus, which can be obtained from a financial intermediary. Prospective investors should read the prospectus carefully before investing. For further information, please call 1-800-368-2745.
Choose Planet-friendly E-delivery!
Sign up now for on-line statements, prospectuses, and fund reports. In less than five minutes you can help reduce paper mail and lower fund costs.
Just go to www.calvert.com. If you already have an online account with the Calvert funds, click on Login to access your Account and select the documents you would like to receive via e-mail.
If you’re new to online account access, click on Login, then Register to create your user name and password. Once you’re in, click on the E-delivery sign-up on the Account Portfolio page and follow the quick, easy steps.
Note: If your shares are not held directly with the Calvert funds but through a brokerage firm, you must contact your broker for electronic delivery options available through their firm.
Annual Report September 30, 2023
Calvert
Small-Cap Fund
Calvert
Small-Cap Fund
September 30, 2023
Management's Discussion of Fund Performance†
Economic and Market Conditions
For U.S. equity investors, the 12-month period ended September 30, 2023, was a roller-coaster ride, driven largely by shifting perceptions of whether the U.S. Federal Reserve (the Fed) could bring the world’s largest economy in for a soft landing, and changing expectations of how long interest rates might remain high.
During the opening two months of the period, stocks rallied on strong corporate earnings, attractive valuations, and hope the Fed might slow the pace of its interest rate hikes. But in December 2022, equities lost ground as “higher for longer” interest rate fears returned. A continuing irony throughout the period was that good economic news -- record low unemployment, strong job creation, and robust consumer spending -- was viewed as bad news for inflation and fuel for further rate hikes that would weigh on stock prices.
In January 2023, however, U.S. equities began a rally that lasted through July. The initial tailwind was ChatGPT, an artificial intelligence (AI) application that led investors to perceive AI might become the next big innovation to drive the information technology (IT) sector. As a result, IT -- one of the worst-performing sectors in 2022 -- became the standout sector of the first half of 2023. Earlier recession fears that had weighed on stock prices receded as many investors came around to the view that the U.S. economy was doing surprisingly well.
But in the final two months of the period, the bond market halted the stock market’s momentum. As it became clear the Fed would keep rates higher for longer than investors had anticipated just a few months earlier, longer term bond interest rates rose sharply. Given the potential for relatively attractive returns with lower risk than stocks, many investors shifted from equity assets to bonds. Stock prices ended on a down note as the period came to a close.
For the period as a whole, however, U.S. equity performance was strong. The S&P 500®, a broad measure of U.S. stocks, returned 21.62%; the blue-chip Dow Jones Industrial Average® returned 19.18%; and the tech-heavy Nasdaq Composite Index® returned 26.11%.
Fund Performance
For the 12-month period ended September 30, 2023, Calvert Small-Cap Fund (the Fund) returned 9.63% for Class A shares at net asset value (NAV), outperforming its benchmark, the Russell 2000® Index (the Index), which returned 8.93%.
Stock selections contributed most to relative returns during the period as the Fund outperformed the Index in seven of 11 sectors. Stock selections were particularly strong in the industrials sector during the period.
In contrast, sector allocations were the largest detractor from returns relative to the Index, particularly a lack of exposure to the energy sector during the period. Although security selections contributed overall, selections in the consumer discretionary sector detracted from relative performance.
AZEK Co., Inc. (AZEK), a manufacturer of residential and commercial building products, was a leading contributor to relative returns during the period. AZEK’s share price rose on improving housing industry trends and better-than-expected demand for its products.
AAON, Inc. (AAON), a manufacturer of commercial HVAC units and parts, also contributed to relative returns during the period. AAON’s share price rose after the company reported stronger-than-expected revenues and earnings in the third and fourth quarters of 2022. A 26% increase in dividends and the announcement of a share repurchase program further strengthened AAON’s share price during the period.
The share price of Performance Food Group Co. (Performance Food), a distributor of food products to restaurants and convenience stores, rose in late 2022 as the company reported better-than-expected revenue and earnings for its fiscal first quarter. Performance Food also raised its guidance -- or financial projections -- for fiscal 2023, pushing its share price even higher during the period.
On the down side, Agiliti, Inc. (Agiliti), which rents medical equipment to health care providers, detracted from relative performance during the period. Agiliti’s share price dropped after the company reported disappointing quarterly earnings and reduced its earnings projections. Agiliti’s profitable peak-need rental business declined as health care activity normalized after the pandemic.
Community Bank Systems, Inc. (Community Bank) is a regional commercial and retail institution based in upstate New York. Its share price declined along with its peers in the banking industry as bond yields rose during the period. Although Community Bank outperformed the overall banking industry, it underperformed the broader financials sector, weighing on the Fund’s relative performance.
The share price of Commerce Bancshares, Inc., a midwestern regional bank, also fell along with its peers in the banking sector during the period.
See Endnotes and Additional Disclosures in this report.
Past performance is no guarantee of future results. Returns are historical and are calculated by determining the percentage change in net asset value (NAV) or offering price (as applicable) with all distributions reinvested. Furthermore, returns do not reflect the deduction of taxes that shareholders may have to pay on Fund distributions or upon the redemption of Fund shares. Investment return and principal value will fluctuate so that shares, when redeemed, may be worth more or less than their original cost. Performance for periods less than or equal to one year is cumulative. Performance is for the stated time period only; due to market volatility, current Fund performance may be lower or higher than the quoted return. For performance as of the most recent month-end, please refer to www.calvert.com.
Calvert
Small-Cap Fund
September 30, 2023
Performance
Portfolio Manager(s) Michael D. McLean, CFA and J. Griffith Noble, CFA, each of Calvert Research and Management
| % Average Annual Total Returns1,2 | Class
Inception Date | Performance
Inception Date | One Year | Five Years | Ten Years |
| Class A at NAV | 10/01/2004 | 10/01/2004 | 9.63% | 3.71% | 7.58% |
| Class A with 5.25% Maximum Sales Charge | — | — | 3.89 | 2.60 | 7.00 |
| Class C at NAV | 04/01/2005 | 10/01/2004 | 8.77 | 2.93 | 6.92 |
| Class C with 1% Maximum Deferred Sales Charge | — | — | 7.77 | 2.93 | 6.92 |
| Class I at NAV | 04/29/2005 | 10/01/2004 | 9.90 | 3.98 | 7.96 |
| Class R6 at NAV | 02/01/2019 | 10/01/2004 | 10.00 | 4.04 | 8.00 |
|
| Russell 2000® Index | — | — | 8.93% | 2.39% | 6.64% |
| % Total Annual Operating Expense Ratios3 | Class A | Class C | Class I | Class R6 |
| | 1.19% | 1.94% | 0.94% | 0.85% |
Growth of $10,000
This graph shows the change in value of a hypothetical investment of $10,000 in Class A of the Fund for the period indicated. For comparison, the same investment is shown in the indicated index.
| Growth of Investment2 | Amount Invested | Period Beginning | At NAV | With Maximum Sales Charge |
| Class C | $10,000 | 09/30/2013 | $19,538 | N.A. |
| Class I, at minimum investment | $1,000,000 | 09/30/2013 | $2,152,140 | N.A. |
| Class R6, at minimum investment | $5,000,000 | 09/30/2013 | $10,794,339 | N.A. |
See Endnotes and Additional Disclosures in this report.
Past performance is no guarantee of future results. Returns are historical and are calculated by determining the percentage change in net asset value (NAV) or offering price (as applicable) with all distributions reinvested. Furthermore, returns do not reflect the deduction of taxes that shareholders may have to pay on Fund distributions or upon the redemption of Fund shares. Investment return and principal value will fluctuate so that shares, when redeemed, may be worth more or less than their original cost. Performance for periods less than or equal to one year is cumulative. Performance is for the stated time period only; due to market volatility, current Fund performance may be lower or higher than the quoted return. For performance as of the most recent month-end, please refer to www.calvert.com.
Calvert
Small-Cap Fund
September 30, 2023
| Sector Allocation (% of net assets)1 |
| Top 10 Holdings (% of net assets)1 | |
| CBIZ, Inc. | 3.3% |
| Chemed Corp. | 3.0 |
| Wyndham Hotels & Resorts, Inc. | 2.8 |
| Dorman Products, Inc. | 2.7 |
| Essential Properties Realty Trust, Inc. | 2.6 |
| Selective Insurance Group, Inc. | 2.6 |
| AptarGroup, Inc. | 2.6 |
| ONE Gas, Inc. | 2.6 |
| Woodward, Inc. | 2.5 |
| Core & Main, Inc., Class A | 2.4 |
| Total | 27.1% |
Footnotes:
| 1 | Excludes cash and cash equivalents. |
Calvert
Small-Cap Fund
September 30, 2023
Endnotes and Additional Disclosures
| † | The views expressed in this report are those of the portfolio manager(s) and are current only through the date stated at the top of this page. These views are subject to change at any time based upon market or other conditions, and Calvert and the Fund(s) disclaim any responsibility to update such views. These views may not be relied upon as investment advice and, because investment decisions are based on many factors, may not be relied upon as an indication of trading intent on behalf of any Calvert fund. This commentary may contain statements that are not historical facts, referred to as “forward-looking statements.” The Fund’s actual future results may differ significantly from those stated in any forward-looking statement, depending on factors such as changes in securities or financial markets or general economic conditions, the volume of sales and purchases of Fund shares, the continuation of investment advisory, administrative and service contracts, and other risks discussed from time to time in the Fund’s filings with the Securities and Exchange Commission. |
| | |
| 1 | Russell 2000® Index is an unmanaged index of 2,000 U.S. small-cap stocks. Unless otherwise stated, index returns do not reflect the effect of any applicable sales charges, commissions, expenses, taxes or leverage, as applicable. It is not possible to invest directly in an index. |
| 2 | Total Returns at NAV do not include applicable sales charges. If sales charges were deducted, the returns would be lower. Total Returns shown with maximum sales charge reflect the stated maximum sales charge. Unless otherwise stated, performance does not reflect the deduction of taxes on Fund distributions or redemptions of Fund shares.Performance prior to the inception date of a class may be linked to the performance of an older class of the Fund. This linked performance is adjusted for any applicable sales charge, but is not adjusted for class expense differences. If adjusted for such differences, the performance would be different. The performance of Class R6 is linked to Class I. Performance presented in the Financial Highlights included in the financial statements is not linked.Effective November 5, 2020, Class C shares automatically convert to Class A shares eight years after purchase. The average annual total returns listed for Class C reflect conversion to Class A shares after eight years. Prior to November 5, 2020, Class C shares automatically converted to Class A shares ten years after purchase.Calvert Research and Management became the investment adviser to the Fund on December 31, 2016. Performance reflected prior to such date is that of the Fund’s former investment adviser. |
| 3 | Source: Fund prospectus. The expense ratios for the current reporting period can be found in the Financial Highlights section of this report. Performance reflects expenses waived and/or reimbursed, if applicable. Without such waivers and/or reimbursements, performance would have been lower. |
| | Fund profile subject to change due to active management. |
| | Additional Information |
| | S&P 500® Index is an unmanaged index of large-cap stocks
commonly used as a measure of U.S. stock market performance. Dow Jones Industrial Average® is a price-weighted average of 30 blue-chip stocks that are generally the leaders in their industry. S&P Dow Jones Indices are a product of S&P Dow Jones Indices LLC (“S&P DJI”) and have been licensed for use. S&P® and S&P 500® are registered trademarks of S&P DJI; Dow Jones® is a registered trademark of Dow Jones Trademark Holdings LLC (“Dow Jones”); S&P DJI, Dow Jones and their respective affiliates do not sponsor, endorse, sell or promote the Fund, will not have any liability with respect thereto and do not have any liability for any errors, omissions, or interruptions of the S&P Dow Jones Indices. Nasdaq Composite Index is a market capitalization-weighted index of all domestic and international securities listed on Nasdaq. Source: Nasdaq, Inc. The information is provided by Nasdaq (with its affiliates, are referred to as the “Corporations”) and Nasdaq’s third party licensors on an “as is” basis and the Corporations make no guarantees and bear no liability of any kind with respect to the information or the Fund. |
Calvert
Small-Cap Fund
September 30, 2023
Example
As a Fund shareholder, you incur two types of costs: (1) transaction costs, including sales charges (loads) on purchases; and (2) ongoing costs, including management fees; distribution and/or service fees; and other Fund expenses. This Example is intended to help you understand your ongoing costs (in dollars) of Fund investing and to compare these costs with the ongoing costs of investing in other mutual funds. The Example is based on an investment of $1,000 invested at the beginning of the period and held for the entire period (April 1, 2023 to September 30, 2023).
Actual Expenses
The first section of the table below provides information about actual account values and actual expenses. You may use the information in this section, together with the amount you invested, to estimate the expenses that you paid over the period. Simply divide your account value by $1,000 (for example, an $8,600 account value divided by $1,000 = 8.6), then multiply the result by the number in the first section under the heading entitled “Expenses Paid During Period” to estimate the expenses you paid on your account during this period.
Hypothetical Example for Comparison Purposes
The second section of the table below provides information about hypothetical account values and hypothetical expenses based on the actual Fund expense ratio and an assumed rate of return of 5% per year (before expenses), which is not the actual Fund return. The hypothetical account values and expenses may not be used to estimate the actual ending account balance or expenses you paid for the period. You may use this information to compare the ongoing costs of investing in the Fund and other funds. To do so, compare this 5% hypothetical example with the 5% hypothetical examples that appear in the shareholder reports of the other funds.
Please note that the expenses shown in the table are meant to highlight your ongoing costs only and do not reflect any transactional costs, such as sales charges (loads). Therefore, the second section of the table is useful in comparing ongoing costs only, and will not help you determine the relative total costs of owning different funds. In addition, if these transactional costs were included, your costs would be higher.
| | Beginning
Account Value
(4/1/23) | Ending
Account Value
(9/30/23) | Expenses Paid
During Period*
(4/1/23 – 9/30/23) | Annualized
Expense
Ratio |
| Actual | | | | |
| Class A | $1,000.00 | $ 939.30 | $5.79 | 1.19% |
| Class C | $1,000.00 | $ 935.30 | $9.41 | 1.94% |
| Class I | $1,000.00 | $ 940.50 | $4.57 | 0.94% |
| Class R6 | $1,000.00 | $ 940.50 | $4.18 | 0.86% |
| Hypothetical | | | | |
| (5% return per year before expenses) | | | | |
| Class A | $1,000.00 | $1,019.10 | $6.02 | 1.19% |
| Class C | $1,000.00 | $1,015.34 | $9.80 | 1.94% |
| Class I | $1,000.00 | $1,020.36 | $4.76 | 0.94% |
| Class R6 | $1,000.00 | $1,020.76 | $4.36 | 0.86% |
| * | Expenses are equal to the Fund's annualized expense ratio for the indicated Class, multiplied by the average account value over the period, multiplied by 183/365 (to reflect the one-half year period). The Example assumes that the $1,000 was invested at the net asset value per share determined at the close of business on March 31, 2023. |
Calvert
Small-Cap Fund
September 30, 2023
| Security | Shares | Value |
| Aerospace & Defense — 3.1% | |
| Hexcel Corp. | | 272,511 | $ 17,751,367 |
| Woodward, Inc. | | 577,917 | 71,811,966 |
| | | | $ 89,563,333 |
| Automobile Components — 3.7% | |
| Atmus Filtration Technologies, Inc.(1) | | 498,547 | $ 10,394,705 |
| Dorman Products, Inc.(1) | | 1,027,877 | 77,871,961 |
| Visteon Corp.(1) | | 120,110 | 16,583,588 |
| | | | $ 104,850,254 |
| Automobiles — 0.9% | |
| Harley-Davidson, Inc. | | 787,959 | $ 26,049,925 |
| | | | $ 26,049,925 |
| Banks — 5.4% | |
| Commerce Bancshares, Inc. | | 1,070,731 | $ 51,373,674 |
| Community Bank System, Inc. | | 1,164,887 | 49,169,880 |
| SouthState Corp. | | 663,322 | 44,681,370 |
| Stock Yards Bancorp, Inc. | | 186,831 | 7,340,590 |
| | | | $ 152,565,514 |
| Building Products — 6.1% | |
| AAON, Inc. | | 695,613 | $ 39,559,511 |
| AZEK Co., Inc. (The)(1) | | 1,843,535 | 54,826,731 |
| CSW Industrials, Inc. | | 270,205 | 47,350,724 |
| Hayward Holdings, Inc.(1) | | 1,395,753 | 19,680,117 |
| Janus International Group, Inc.(1) | | 1,006,752 | 10,772,247 |
| | | | $ 172,189,330 |
| Capital Markets — 2.9% | |
| Cohen & Steers, Inc. | | 713,720 | $ 44,743,107 |
| Stifel Financial Corp. | | 626,806 | 38,510,960 |
| | | | $ 83,254,067 |
| Chemicals — 1.9% | |
| Quaker Chemical Corp. | | 336,489 | $ 53,838,240 |
| | | | $ 53,838,240 |
| Consumer Staples Distribution & Retail — 4.4% | |
| Casey's General Stores, Inc. | | 210,041 | $ 57,030,332 |
| Chefs' Warehouse, Inc. (The)(1) | | 840,167 | 17,794,737 |
| Performance Food Group Co.(1) | | 855,257 | 50,340,427 |
| | | | $ 125,165,496 |
| Containers & Packaging — 2.6% | |
| AptarGroup, Inc. | | 590,856 | $ 73,880,634 |
| | | | $ 73,880,634 |
| Security | Shares | Value |
| Diversified Consumer Services — 0.7% | |
| Bright Horizons Family Solutions, Inc.(1) | | 233,520 | $ 19,022,539 |
| | | | $ 19,022,539 |
| Diversified REITs — 2.6% | |
| Essential Properties Realty Trust, Inc. | | 3,478,971 | $ 75,250,143 |
| | | | $ 75,250,143 |
| Electric Utilities — 1.2% | |
| IDACORP, Inc. | | 372,402 | $ 34,875,447 |
| | | | $ 34,875,447 |
| Financial Services — 1.4% | |
| Euronet Worldwide, Inc.(1) | | 511,366 | $ 40,592,233 |
| | | | $ 40,592,233 |
| Food Products — 2.6% | |
| J&J Snack Foods Corp. | | 246,256 | $ 40,299,794 |
| Lancaster Colony Corp. | | 77,558 | 12,799,397 |
| Simply Good Foods Co. (The)(1) | | 565,544 | 19,522,579 |
| | | | $ 72,621,770 |
| Gas Utilities — 2.6% | |
| ONE Gas, Inc. | | 1,080,086 | $ 73,748,272 |
| | | | $ 73,748,272 |
| Ground Transportation — 0.9% | |
| Landstar System, Inc. | | 139,726 | $ 24,723,118 |
| | | | $ 24,723,118 |
| Health Care Equipment & Supplies — 6.1% | |
| Envista Holdings Corp.(1) | | 1,836,056 | $ 51,189,241 |
| ICU Medical, Inc.(1) | | 155,700 | 18,529,857 |
| Integer Holdings Corp.(1) | | 368,780 | 28,923,416 |
| Integra LifeSciences Holdings Corp.(1) | | 658,465 | 25,146,778 |
| Neogen Corp.(1) | | 2,726,924 | 50,557,171 |
| | | | $ 174,346,463 |
| Health Care Providers & Services — 9.6% | |
| Addus HomeCare Corp.(1) | | 191,838 | $ 16,342,679 |
| Agiliti, Inc.(1) | | 2,049,826 | 13,303,371 |
| Chemed Corp. | | 165,377 | 85,946,427 |
| Option Care Health, Inc.(1) | | 742,691 | 24,026,054 |
| Premier, Inc., Class A | | 900,677 | 19,364,555 |
| R1 RCM, Inc.(1) | | 3,469,012 | 52,278,011 |
| US Physical Therapy, Inc. | | 680,222 | 62,396,764 |
| | | | $ 273,657,861 |
| Hotels, Restaurants & Leisure — 4.0% | |
| Papa John's International, Inc.(2) | | 254,004 | $ 17,328,153 |
7
See Notes to Financial Statements.
Calvert
Small-Cap Fund
September 30, 2023
Schedule of Investments — continued
| Security | Shares | Value |
| Hotels, Restaurants & Leisure (continued) | |
| Texas Roadhouse, Inc. | | 172,318 | $ 16,559,760 |
| Wyndham Hotels & Resorts, Inc. | | 1,133,502 | 78,823,729 |
| | | | $ 112,711,642 |
| Industrial REITs — 4.5% | |
| EastGroup Properties, Inc. | | 377,532 | $ 62,870,404 |
| Rexford Industrial Realty, Inc. | | 499,376 | 24,644,206 |
| Terreno Realty Corp. | | 736,655 | 41,842,004 |
| | | | $ 129,356,614 |
| Insurance — 9.5% | |
| AMERISAFE, Inc. | | 476,819 | $ 23,874,327 |
| RLI Corp. | | 385,076 | 52,327,978 |
| Ryan Specialty Holdings, Inc.(1) | | 1,043,127 | 50,487,347 |
| Selective Insurance Group, Inc. | | 728,205 | 75,128,910 |
| White Mountains Insurance Group, Ltd. | | 45,569 | 68,157,097 |
| | | | $ 269,975,659 |
| Leisure Products — 0.8% | |
| Brunswick Corp. | | 286,695 | $ 22,648,905 |
| | | | $ 22,648,905 |
| Machinery — 3.1% | |
| Albany International Corp., Class A | | 375,721 | $ 32,417,208 |
| Middleby Corp. (The)(1) | | 433,966 | 55,547,648 |
| | | | $ 87,964,856 |
| Professional Services — 4.3% | |
| CBIZ, Inc.(1) | | 1,818,705 | $ 94,390,790 |
| NV5 Global, Inc.(1) | | 291,480 | 28,049,120 |
| | | | $ 122,439,910 |
| Retail REITs — 1.3% | |
| NETSTREIT Corp. | | 2,364,179 | $ 36,833,909 |
| | | | $ 36,833,909 |
| Software — 7.4% | |
| Altair Engineering, Inc., Class A(1) | | 432,854 | $ 27,079,346 |
| Clearwater Analytics Holdings, Inc., Class A(1) | | 1,869,554 | 36,157,174 |
| Envestnet, Inc.(1) | | 1,117,507 | 49,203,833 |
| PowerSchool Holdings, Inc., Class A(1)(2) | | 748,425 | 16,959,311 |
| Progress Software Corp. | | 775,887 | 40,796,138 |
| SPS Commerce, Inc.(1) | | 232,752 | 39,709,819 |
| | | | $ 209,905,621 |
| Specialized REITs — 1.4% | |
| CubeSmart | | 1,012,788 | $ 38,617,606 |
| | | | $ 38,617,606 |
| Security | Shares | Value |
| Specialty Retail — 0.3% | |
| RH (1)(2) | | 33,196 | $ 8,775,695 |
| | | | $ 8,775,695 |
| Trading Companies & Distributors — 2.9% | |
| Core & Main, Inc., Class A(1) | | 2,372,633 | $ 68,450,462 |
| Herc Holdings, Inc. | | 108,038 | 12,850,040 |
| | | | $ 81,300,502 |
Total Common Stocks
(identified cost $2,682,510,423) | | | $2,790,725,558 |
| High Social Impact Investments — 0.1% |
| Security | Principal
Amount
(000's omitted) | Value |
| Calvert Impact Capital, Inc., Community Investment Notes, 1.50%, 12/15/23(3)(4) | $ | 2,520 | $ 2,485,451 |
Total High Social Impact Investments
(identified cost $2,520,000) | | | $ 2,485,451 |
| Short-Term Investments — 1.8% | | | |
| Affiliated Fund — 1.7% |
| Security | Shares | Value |
| Morgan Stanley Institutional Liquidity Funds - Government Portfolio, Institutional Class, 5.27%(5) | | 48,525,331 | $ 48,525,331 |
Total Affiliated Fund
(identified cost $48,525,331) | | | $ 48,525,331 |
| Securities Lending Collateral — 0.1% |
| Security | Shares | Value |
| State Street Navigator Securities Lending Government Money Market Portfolio, 5.36%(6) | | 3,220,000 | $ 3,220,000 |
Total Securities Lending Collateral
(identified cost $3,220,000) | | | $ 3,220,000 |
Total Short-Term Investments
(identified cost $51,745,331) | | | $ 51,745,331 |
Total Investments — 100.1%
(identified cost $2,736,775,754) | | | $2,844,956,340 |
| Other Assets, Less Liabilities — (0.1)% | | | $ (2,290,277) |
| Net Assets — 100.0% | | | $ 2,842,666,063 |
8
See Notes to Financial Statements.
Calvert
Small-Cap Fund
September 30, 2023
Schedule of Investments — continued
| The percentage shown for each investment category in the Schedule of Investments is based on net assets. |
| (1) | Non-income producing security. |
| (2) | All or a portion of this security was on loan at September 30, 2023. The aggregate market value of securities on loan at September 30, 2023 was $11,748,322. |
| (3) | May be deemed to be an affiliated company (see Note 7). |
| (4) | Restricted security. Total market value of restricted securities amounts to $2,485,451, which represents 0.1% of the net assets of the Fund as of September 30, 2023. |
| (5) | May be deemed to be an affiliated investment company. The rate shown is the annualized seven-day yield as of September 30, 2023. |
| (6) | Represents investment of cash collateral received in connection with securities lending. |
Restricted Securities
| Description | Acquisition Date | Cost |
| Calvert Impact Capital, Inc., Community Investment Notes, 1.50%, 12/15/23 | 12/14/20 | $2,520,000 |
| Abbreviations: |
| REITs | – Real Estate Investment Trusts |
9
See Notes to Financial Statements.
Calvert
Small-Cap Fund
September 30, 2023
Statement of Assets and Liabilities
| | September 30, 2023 |
| Assets | |
Investments in securities of unaffiliated issuers, at value (identified cost $2,685,730,423) - including
$11,748,322 of securities on loan | $ 2,793,945,558 |
| Investments in securities of affiliated issuers, at value (identified cost $51,045,331) | 51,010,782 |
| Receivable for investments sold | 2,154,852 |
| Receivable for capital shares sold | 5,697,478 |
| Dividends receivable | 3,326,278 |
| Dividends and interest receivable - affiliated | 227,013 |
| Securities lending income receivable | 2,714 |
| Directors' deferred compensation plan | 294,672 |
| Total assets | $2,856,659,347 |
| Liabilities | |
| Payable for investments purchased | $ 3,711,466 |
| Payable for capital shares redeemed | 3,971,298 |
| Deposits for securities loaned | 3,220,000 |
| Payable to affiliates: | |
| Investment advisory fee | 1,647,512 |
| Administrative fee | 291,718 |
| Distribution and service fees | 80,400 |
| Sub-transfer agency fee | 25,819 |
| Directors' deferred compensation plan | 294,672 |
| Other | 1,381 |
| Accrued expenses | 749,018 |
| Total liabilities | $ 13,993,284 |
| Net Assets | $2,842,666,063 |
| Sources of Net Assets | |
| Paid-in capital | $ 2,753,296,774 |
| Distributable earnings | 89,369,289 |
| Net Assets | $2,842,666,063 |
| Class A Shares | |
| Net Assets | $ 262,359,776 |
| Shares Outstanding | 9,576,770 |
Net Asset Value and Redemption Price Per Share
(net assets ÷ shares of beneficial interest outstanding) | $ 27.40 |
Maximum Offering Price Per Share
(100 ÷ 94.75 of net asset value per share) | $ 28.92 |
| Class C Shares | |
| Net Assets | $ 28,169,126 |
| Shares Outstanding | 1,256,201 |
Net Asset Value and Offering Price Per Share*
(net assets ÷ shares of beneficial interest outstanding) | $ 22.42 |
| Class I Shares | |
| Net Assets | $ 2,239,650,312 |
| Shares Outstanding | 74,586,591 |
Net Asset Value, Offering Price and Redemption Price Per Share
(net assets ÷ shares of beneficial interest outstanding) | $ 30.03 |
10
See Notes to Financial Statements.
Calvert
Small-Cap Fund
September 30, 2023
Statement of Assets and Liabilities — continued
| | September 30, 2023 |
| Class R6 Shares | |
| Net Assets | $ 312,486,849 |
| Shares Outstanding | 10,401,716 |
Net Asset Value, Offering Price and Redemption Price Per Share
(net assets ÷ shares of beneficial interest outstanding) | $ 30.04 |
| On sales of $50,000 or more, the offering price of Class A shares is reduced. |
| * | Redemption price per share is equal to the net asset value less any applicable contingent deferred sales charge. |
11
See Notes to Financial Statements.
Calvert
Small-Cap Fund
September 30, 2023
| | Year Ended |
| | September 30, 2023 |
| Investment Income | |
| Dividend income | $ 36,275,446 |
| Dividend income - affiliated issuers | 2,848,287 |
| Interest income - affiliated issuers | 37,800 |
| Securities lending income, net | 63,108 |
| Total investment income | $ 39,224,641 |
| Expenses | |
| Investment advisory fee | $ 19,232,372 |
| Administrative fee | 3,393,948 |
| Distribution and service fees: | |
| Class A | 700,293 |
| Class C | 302,836 |
| Directors' fees and expenses | 191,572 |
| Custodian fees | 46,061 |
| Transfer agency fees and expenses | 2,327,872 |
| Accounting fees | 506,849 |
| Professional fees | 128,261 |
| Registration fees | 159,267 |
| Reports to shareholders | 288,317 |
| Miscellaneous | 102,096 |
| Total expenses | $ 27,379,744 |
| Waiver and/or reimbursement of expenses by affiliates | $ (92,925) |
| Net expenses | $ 27,286,819 |
| Net investment income | $ 11,937,822 |
| Realized and Unrealized Gain (Loss) | |
| Net realized gain (loss): | |
| Investment securities | $ (16,289,221) |
| Net realized loss | $ (16,289,221) |
| Change in unrealized appreciation (depreciation): | |
| Investment securities | $ 225,237,246 |
| Investment securities - affiliated issuers | 144,976 |
| Net change in unrealized appreciation (depreciation) | $225,382,222 |
| Net realized and unrealized gain | $209,093,001 |
| Net increase in net assets from operations | $221,030,823 |
12
See Notes to Financial Statements.
Calvert
Small-Cap Fund
September 30, 2023
Statements of Changes in Net Assets
| | Year Ended September 30, |
| | 2023 | 2022 |
| Increase (Decrease) in Net Assets | | |
| From operations: | | |
| Net investment income | $ 11,937,822 | $ 3,091,563 |
| Net realized gain (loss) | (16,289,221) | 51,032,027 |
| Net change in unrealized appreciation (depreciation) | 225,382,222 | (589,702,568) |
| Net increase (decrease) in net assets from operations | $ 221,030,823 | $ (535,578,978) |
| Distributions to shareholders: | | |
| Class A | $ (3,864,681) | $ (21,285,960) |
| Class C | (489,958) | (2,622,244) |
| Class I | (29,265,276) | (169,776,999) |
| Class R6 | (4,796,514) | (6,322,583) |
| Total distributions to shareholders | $ (38,416,429) | $ (200,007,786) |
| Capital share transactions: | | |
| Class A | $ 361,805 | $ 26,725,533 |
| Class C | (136,441) | 2,508,514 |
| Class I | 244,905,535 | 47,837,245 |
| Class R6 | 5,607,408 | 263,403,378 |
| Net increase in net assets from capital share transactions | $ 250,738,307 | $ 340,474,670 |
| Net increase (decrease) in net assets | $ 433,352,701 | $ (395,112,094) |
| Net Assets | | |
| At beginning of year | $ 2,409,313,362 | $ 2,804,425,456 |
| At end of year | $2,842,666,063 | $2,409,313,362 |
13
See Notes to Financial Statements.
Calvert
Small-Cap Fund
September 30, 2023
| | Class A |
| | Year Ended September 30, |
| | 2023 | 2022 | 2021 | 2020 | 2019 |
| Net asset value — Beginning of year | $ 25.35 | $ 33.14 | $ 23.94 | $ 25.35 | $ 26.61 |
| Income (Loss) From Operations | | | | | |
| Net investment income (loss)(1) | $ 0.06 | $ (0.04) | $ (0.07) | $ (0.01) | $ 0.02 |
| Net realized and unrealized gain (loss) | 2.38 | (5.34) | 9.27 | (1.08) | (0.04) (2) |
| Total income (loss) from operations | $ 2.44 | $ (5.38) | $ 9.20 | $ (1.09) | $ (0.02) |
| Less Distributions | | | | | |
| From net realized gain | $ (0.39) | $ (2.41) | $ — | $ (0.32) | $ (1.24) |
| Total distributions | $ (0.39) | $ (2.41) | $ — | $ (0.32) | $ (1.24) |
| Net asset value — End of year | $ 27.40 | $ 25.35 | $ 33.14 | $ 23.94 | $ 25.35 |
| Total Return(3) | 9.63% | (17.82)% | 38.43% | (4.38)% | 0.61% |
| Ratios/Supplemental Data | | | | | |
| Net assets, end of year (000’s omitted) | $262,360 | $241,335 | $288,922 | $185,777 | $172,277 |
| Ratios (as a percentage of average daily net assets):(4) | | | | | |
| Total expenses | 1.19% | 1.19% | 1.19% | 1.22% | 1.25% |
| Net expenses | 1.19% (5) | 1.19% (5) | 1.19% | 1.21% | 1.23% |
| Net investment income (loss) | 0.20% | (0.12)% | (0.21)% | (0.03)% | 0.07% |
| Portfolio Turnover | 44% | 42% | 53% | 44% | 45% |
| (1) | Computed using average shares outstanding. |
| (2) | The per share amount is not in accord with the net realized and unrealized gain (loss) for the period because of the timing of Fund share transactions and the amount of the per share realized and unrealized gains and losses at such time. |
| (3) | Returns are historical and are calculated by determining the percentage change in net asset value with all distributions reinvested and do not reflect the effect of sales charges, if any. |
| (4) | Total expenses do not reflect amounts reimbursed and/or waived by the adviser and certain of its affiliates, if applicable. Net expenses are net of all reductions and represent the net expenses paid by the Fund. |
| (5) | Includes a reduction by the investment adviser of a portion of its advisory fee due to the Fund’s investment in the Liquidity Fund (equal to less than 0.005% of average daily net assets for the years ended September 30, 2023 and 2022). |
14
See Notes to Financial Statements.
Calvert
Small-Cap Fund
September 30, 2023
Financial Highlights — continued
| | Class C |
| | Year Ended September 30, |
| | 2023 | 2022 | 2021 | 2020 | 2019 |
| Net asset value — Beginning of year | $ 20.97 | $ 27.84 | $ 20.27 | $ 21.63 | $ 22.90 |
| Income (Loss) From Operations | | | | | |
| Net investment loss(1) | $ (0.13) | $ (0.22) | $ (0.26) | $ (0.16) | $ (0.14) |
| Net realized and unrealized gain (loss) | 1.97 | (4.41) | 7.83 | (0.92) | (0.04) (2) |
| Total income (loss) from operations | $ 1.84 | $ (4.63) | $ 7.57 | $ (1.08) | $ (0.18) |
| Less Distributions | | | | | |
| From net realized gain | $ (0.39) | $ (2.24) | $ — | $ (0.28) | $ (1.09) |
| Total distributions | $ (0.39) | $ (2.24) | $ — | $ (0.28) | $ (1.09) |
| Net asset value — End of year | $ 22.42 | $ 20.97 | $ 27.84 | $ 20.27 | $ 21.63 |
| Total Return(3) | 8.77% | (18.42)% | 37.35% | (5.10)% | (0.12)% |
| Ratios/Supplemental Data | | | | | |
| Net assets, end of year (000’s omitted) | $28,169 | $26,452 | $32,596 | $16,992 | $14,775 |
| Ratios (as a percentage of average daily net assets):(4) | | | | | |
| Total expenses | 1.94% | 1.94% | 1.94% | 1.97% | 2.01% |
| Net expenses | 1.94% (5) | 1.94% (5) | 1.94% | 1.96% | 1.99% |
| Net investment loss | (0.56)% | (0.87)% | (0.97)% | (0.78)% | (0.68)% |
| Portfolio Turnover | 44% | 42% | 53% | 44% | 45% |
| (1) | Computed using average shares outstanding. |
| (2) | The per share amount is not in accord with the net realized and unrealized gain (loss) for the period because of the timing of Fund share transactions and the amount of the per share realized and unrealized gains and losses at such time. |
| (3) | Returns are historical and are calculated by determining the percentage change in net asset value with all distributions reinvested and do not reflect the effect of sales charges, if any. |
| (4) | Total expenses do not reflect amounts reimbursed and/or waived by the adviser and certain of its affiliates, if applicable. Net expenses are net of all reductions and represent the net expenses paid by the Fund. |
| (5) | Includes a reduction by the investment adviser of a portion of its advisory fee due to the Fund’s investment in the Liquidity Fund (equal to less than 0.005% of average daily net assets for the years ended September 30, 2023 and 2022). |
15
See Notes to Financial Statements.
Calvert
Small-Cap Fund
September 30, 2023
Financial Highlights — continued
| | Class I |
| | Year Ended September 30, |
| | 2023 | 2022 | 2021 | 2020 | 2019 |
| Net asset value — Beginning of year | $ 27.73 | $ 36.02 | $ 26.00 | $ 27.49 | $ 28.73 |
| Income (Loss) From Operations | | | | | |
| Net investment income(1) | $ 0.14 | $ 0.04 | $ 0.01 | $ 0.06 | $ 0.09 |
| Net realized and unrealized gain (loss) | 2.60 | (5.85) | 10.05 | (1.17) | (0.02) (2) |
| Total income (loss) from operations | $ 2.74 | $ (5.81) | $ 10.06 | $ (1.11) | $ 0.07 |
| Less Distributions | | | | | |
| From net investment income | $ (0.05) | $ (0.03) | $ (0.04) | $ (0.05) | $ (0.06) |
| From net realized gain | (0.39) | (2.45) | — | (0.33) | (1.25) |
| Total distributions | $ (0.44) | $ (2.48) | $ (0.04) | $ (0.38) | $ (1.31) |
| Net asset value — End of year | $ 30.03 | $ 27.73 | $ 36.02 | $ 26.00 | $ 27.49 |
| Total Return(3) | 9.90% | (17.61)% | 38.73% | (4.12)% | 0.92% |
| Ratios/Supplemental Data | | | | | |
| Net assets, end of year (000’s omitted) | $2,239,650 | $1,858,334 | $2,398,219 | $1,211,029 | $461,237 |
| Ratios (as a percentage of average daily net assets):(4) | | | | | |
| Total expenses | 0.94% | 0.94% | 0.94% | 0.97% | 1.00% |
| Net expenses | 0.94% (5) | 0.94% (5) | 0.94% | 0.96% | 0.95% |
| Net investment income | 0.45% | 0.13% | 0.03% | 0.22% | 0.34% |
| Portfolio Turnover | 44% | 42% | 53% | 44% | 45% |
| (1) | Computed using average shares outstanding. |
| (2) | The per share amount is not in accord with the net realized and unrealized gain (loss) for the period because of the timing of Fund share transactions and the amount of the per share realized and unrealized gains and losses at such time. |
| (3) | Returns are historical and are calculated by determining the percentage change in net asset value with all distributions reinvested and do not reflect the effect of sales charges, if any. |
| (4) | Total expenses do not reflect amounts reimbursed and/or waived by the adviser and certain of its affiliates, if applicable. Net expenses are net of all reductions and represent the net expenses paid by the Fund. |
| (5) | Includes a reduction by the investment adviser of a portion of its advisory fee due to the Fund’s investment in the Liquidity Fund (equal to less than 0.005% of average daily net assets for the years ended September 30, 2023 and 2022). |
16
See Notes to Financial Statements.
Calvert
Small-Cap Fund
September 30, 2023
Financial Highlights — continued
| | Class R6 |
| | Year Ended September 30, | Period Ended
September 30,
2019(1) |
| | 2023 | 2022 | 2021 | 2020 |
| Net asset value — Beginning of period | $ 27.75 | $ 36.05 | $ 26.01 | $ 27.50 | $ 24.93 |
| Income (Loss) From Operations | | | | | |
| Net investment income(2) | $ 0.17 | $ 0.08 | $ 0.04 | $ 0.07 | $ 0.07 |
| Net realized and unrealized gain (loss) | 2.60 | (5.87) | 10.05 | (1.16) | 2.50 |
| Total income (loss) from operations | $ 2.77 | $ (5.79) | $ 10.09 | $ (1.09) | $ 2.57 |
| Less Distributions | | | | | |
| From net investment income | $ (0.09) | $ (0.06) | $ (0.05) | $ (0.07) | $ — |
| From net realized gain | (0.39) | (2.45) | — | (0.33) | — |
| Total distributions | $ (0.48) | $ (2.51) | $ (0.05) | $ (0.40) | $ — |
| Net asset value — End of period | $ 30.04 | $ 27.75 | $ 36.05 | $ 26.01 | $ 27.50 |
| Total Return(3) | 10.00% | (17.56)% | 38.83% | (4.07)% | 10.31% (4) |
| Ratios/Supplemental Data | | | | | |
| Net assets, end of period (000’s omitted) | $312,487 | $283,192 | $84,689 | $44,012 | $34,782 |
| Ratios (as a percentage of average daily net assets):(5) | | | | | |
| Total expenses | 0.86% | 0.85% | 0.86% | 0.91% | 0.93% (6) |
| Net expenses | 0.86% (7) | 0.85% (7) | 0.86% | 0.90% | 0.90% (6) |
| Net investment income | 0.53% | 0.26% | 0.11% | 0.28% | 0.37% (6) |
| Portfolio Turnover | 44% | 42% | 53% | 44% | 45% (8) |
| (1) | For the period from the commencement of operations, February 1, 2019, to September 30, 2019. |
| (2) | Computed using average shares outstanding. |
| (3) | Returns are historical and are calculated by determining the percentage change in net asset value with all distributions reinvested and do not reflect the effect of sales charges, if any. |
| (4) | Not annualized. |
| (5) | Total expenses do not reflect amounts reimbursed and/or waived by the adviser and certain of its affiliates, if applicable. Net expenses are net of all reductions and represent the net expenses paid by the Fund. |
| (6) | Annualized. |
| (7) | Includes a reduction by the investment adviser of a portion of its advisory fee due to the Fund’s investment in the Liquidity Fund (equal to less than 0.005% of average daily net assets for the years ended September 30, 2023 and 2022). |
| (8) | For the year ended September 30, 2019. |
17
See Notes to Financial Statements.
Calvert
Small-Cap Fund
September 30, 2023
Notes to Financial Statements
1 Significant Accounting Policies
Calvert Small-Cap Fund (the Fund) is a diversified series of Calvert Impact Fund, Inc. (the Corporation). The Corporation is a Maryland business corporation registered under the Investment Company Act of 1940, as amended (the 1940 Act), as an open-end management investment company. The investment objective of the Fund is to seek to provide long-term capital appreciation through investment primarily in small-cap common stocks of U.S. companies.
The Fund offers four classes of shares. Class A shares are generally sold subject to a sales charge imposed at time of purchase. A contingent deferred sales charge of 1.00% may apply to certain redemptions of Class A shares for accounts for which no sales charge was paid, if redeemed within 12 months of purchase. Class C shares are sold without a front-end sales charge, and with certain exceptions, are charged a contingent deferred sales charge of 1% on shares redeemed within 12 months of purchase. Class C shares are only available for purchase through a financial intermediary. Effective November 5, 2020, Class C shares automatically convert to Class A shares eight years after their purchase as described in the Fund's prospectus. Class I and Class R6 shares are sold at net asset value, are not subject to a sales charge and are sold only to certain eligible investors. Each class represents a pro rata interest in the Fund, but votes separately on class-specific matters and is subject to different expenses.
The Fund applies the accounting and reporting guidance in the Financial Accounting Standards Board (FASB) Accounting Standards Codification Topic 946, Financial Services – Investment Companies (ASC 946). Subsequent events, if any, through the date that the financial statements were issued have been evaluated in the preparation of the financial statements.
A Investment Valuation— Net asset value per share is determined every business day as of the close of the regular session of the New York Stock Exchange (generally 4:00 p.m. Eastern time). The Fund uses independent pricing services approved by the Board of Directors (the Board) to value its investments wherever possible. Investments for which market quotations are not available or deemed not reliable are fair valued in good faith by the Board’s valuation designee.
U.S. generally accepted accounting principles (U.S. GAAP) establishes a disclosure hierarchy that categorizes the inputs to valuation techniques used to value assets and liabilities at measurement date. These inputs are summarized in the three broad levels listed below:
Level 1 - quoted prices in active markets for identical securities
Level 2 - other significant observable inputs (including quoted prices for similar securities, interest rates, prepayment speeds, credit risk, etc.)
Level 3 - significant unobservable inputs (including the Fund’s own assumptions in determining the fair value of investments)
The inputs or methodologies used for valuing securities are not necessarily an indication of the risk associated with investing in those securities.
Valuation techniques used to value the Fund’s investments by major category are as follows:
Equity Securities. Equity securities (including warrants and rights) listed on a U.S. securities exchange generally are valued at the last sale or closing price as reported by an independent pricing service on the primary market or exchange on which they are traded and are categorized as Level 1 in the hierarchy. Equity securities listed on the NASDAQ National Market System are valued at the NASDAQ official closing price and are categorized as Level 1 in the hierarchy. Unlisted or listed securities for which closing sales prices or closing quotations are not available are valued at the mean between the latest available bid and ask prices and are categorized as Level 2 in the hierarchy.
Debt Securities. Debt securities are generally valued based on valuations provided by third party pricing services, as derived from such services’ pricing models. Inputs to the models may include, but are not limited to, reported trades, executable bid and ask prices, broker/dealer quotations, prices or yields of securities with similar characteristics, interest rates, anticipated prepayments, benchmark curves or information pertaining to the issuer, as well as industry and economic events. Accordingly, debt securities are generally categorized as Level 2 in the hierarchy. Short-term debt securities with a remaining maturity at time of purchase of more than sixty days are valued based on valuations provided by a third party pricing service. Such securities are generally categorized as Level 2 in the hierarchy. Short-term debt securities of sufficient credit quality purchased with remaining maturities of sixty days or less for which a valuation from a third party pricing service is not readily available may be valued at amortized cost, which approximates fair value, and are categorized as Level 2 in the hierarchy.
Other Securities. Investments in management investment companies (including money market funds) that do not trade on an exchange are valued at the net asset value as of the close of each business day and are categorized as Level 1 in the hierarchy.
Fair Valuation. In connection with Rule 2a-5 of the 1940 Act, the Board has designated the Fund’s investment adviser as its valuation designee. Investments for which valuations or market quotations are not readily available or are deemed unreliable are valued by the investment adviser, as valuation designee, at fair value using methods that most fairly reflect the security’s “fair value”, which is the amount that the Fund might reasonably expect to receive for the security upon its current sale in the ordinary course. Each such determination is based on a consideration of relevant factors, which are likely to vary from one pricing context to another. These factors may include, but are not limited to, the type of security, the existence of any contractual restrictions on the security’s disposition, the price and extent of public trading in similar securities of the issuer or of comparable companies or entities, quotations or relevant information obtained from broker/dealers or other market participants, information obtained from the issuer, analysts, and/or the appropriate stock exchange (for exchange-traded securities), an analysis of the company’s or entity’s financial statements, and an evaluation of the forces that influence the issuer and the market(s) in which the security is purchased and sold.
Calvert
Small-Cap Fund
September 30, 2023
Notes to Financial Statements — continued
The values assigned to fair value investments are based on available information and do not necessarily represent amounts that might ultimately be realized. Further, due to the inherent uncertainty of valuations of such investments, the fair values may differ significantly from the values that would have been used had an active market existed, and the differences could be material.
The following table summarizes the market value of the Fund's holdings as of September 30, 2023, based on the inputs used to value them:
| Asset Description | Level 1 | Level 2 | Level 3 | Total |
| Common Stocks | $ 2,790,725,558(1) | $ — | $ — | $ 2,790,725,558 |
| High Social Impact Investments | — | 2,485,451 | — | 2,485,451 |
| Short-Term Investments: | | | | |
| Affiliated Fund | 48,525,331 | — | — | 48,525,331 |
| Securities Lending Collateral | 3,220,000 | — | — | 3,220,000 |
| Total Investments | $2,842,470,889 | $2,485,451 | $ — | $2,844,956,340 |
| (1) | The level classification by major category of investments is the same as the category presentation in the Schedule of Investments. |
B Investment Transactions and Income— Investment transactions for financial statement purposes are accounted for on trade date. Realized gains and losses are recorded on an identified cost basis and may include proceeds from litigation. Dividend income is recorded on the ex-dividend date for dividends received in cash and/or securities or, in the case of dividends on certain foreign securities, as soon as the Fund is informed of the ex-dividend date. Non-cash dividends are recorded at the fair value of the securities received. Distributions received that represent a return of capital are recorded as a reduction of cost of investments. Distributions received that represent a capital gain are recorded as a realized gain. Interest income, which includes amortization of premium and accretion of discount on debt securities, is accrued as earned.
C Share Class Accounting— Realized and unrealized gains and losses and net investment income and losses, other than class-specific expenses, are allocated daily to each class of shares based upon the relative net assets of each class to the total net assets of the Fund. Expenses arising in connection with a specific class are charged directly to that class. Sub-accounting, recordkeeping and similar administrative fees payable to financial intermediaries, which are a component of transfer agency fees and expenses on the Statement of Operations, are not allocated to Class R6 shares.
D Restricted Securities��� The Fund may invest in securities that are subject to legal or contractual restrictions on resale. Generally, these securities may only be sold publicly upon registration under the Securities Act of 1933 or in transactions exempt from such registration. Information regarding restricted securities (excluding Rule 144A securities) is included at the end of the Schedule of Investments.
E Distributions to Shareholders— Distributions to shareholders are recorded by the Fund on ex-dividend date. Distributions from net investment income and distributions from net realized capital gains, if any, are paid at least annually. Distributions are declared separately for each class of shares. Distributions are determined in accordance with income tax regulations, which may differ from U.S. GAAP; accordingly, periodic reclassifications are made within the Fund's capital accounts to reflect income and gains available for distribution under income tax regulations.
F Estimates— The preparation of financial statements in conformity with U.S. GAAP requires management to make estimates and assumptions that affect the reported amounts of assets and liabilities and disclosure of contingent assets and liabilities at the date of the financial statements and the reported amounts of increases and decreases in net assets from operations during the reporting period. Actual results could differ from those estimates.
G Indemnifications— The Corporation’s By-Laws provide for indemnification for Directors or officers of the Corporation and certain other parties, to the fullest extent permitted by Maryland law and the 1940 Act, provided certain conditions are met. Additionally, in the normal course of business, the Fund enters into agreements with service providers that may contain indemnification clauses. The Fund’s maximum exposure under these arrangements is unknown as this would involve future claims that may be made against the Fund that have not yet occurred.
H Federal Income Taxes— No provision for federal income or excise tax is required since the Fund intends to continue to qualify as a regulated investment company under the Internal Revenue Code and to distribute substantially all of its taxable earnings.
Management has analyzed the Fund's tax positions taken for all open federal income tax years and has concluded that no provision for federal income tax is required in the Fund's financial statements. A Fund's federal tax return is subject to examination by the Internal Revenue Service for a period of three years from the date of filing.
2 Related Party Transactions
The investment advisory fee is earned by Calvert Research and Management (CRM), an indirect, wholly-owned subsidiary of Morgan Stanley, as compensation for investment advisory services rendered to the Fund. The investment advisory fee is computed at the annual rate of 0.68% of the Fund’s average daily net assets and is payable monthly. For the year ended September 30, 2023, the investment advisory fee amounted to $19,232,372.
Calvert
Small-Cap Fund
September 30, 2023
Notes to Financial Statements — continued
The Fund may invest in a money market fund, the Institutional Class of the Morgan Stanley Institutional Liquidity Funds - Government Portfolio (the “Liquidity Fund”), an open-end management investment company managed by Morgan Stanley Investment Management Inc., a wholly-owned subsidiary of Morgan Stanley. The investment advisory fee paid by the Fund is reduced by an amount equal to its pro rata share of the advisory and administration fees paid by the Fund due to its investment in the Liquidity Fund. For the year ended September 30, 2023, the investment advisory fee paid was reduced by $92,925 relating to the Fund's investment in the Liquidity Fund.
CRM has agreed to reimburse the Fund’s operating expenses to the extent that total annual operating expenses (relating to ordinary operating expenses only and excluding expenses such as brokerage commissions, acquired fund fees and expenses of unaffiliated funds, borrowing costs, taxes or litigation expenses) exceed 1.21%, 1.96%, 0.96% and 0.90% for Class A, Class C, Class I and Class R6, respectively, of such class's average daily net assets. The expense reimbursement agreement with CRM may be changed or terminated after January 31, 2024. For the year ended September 30, 2023, no expenses were waived or reimbursed by CRM.
The administrative fee is earned by CRM as compensation for administrative services rendered to the Fund. The fee is computed at an annual rate of 0.12% of the Fund’s average daily net assets attributable to Class A, Class C, Class I and Class R6 and is payable monthly. For the year ended September 30, 2023, CRM was paid administrative fees of $3,393,948.
The Fund has in effect a distribution plan for Class A shares (Class A Plan) pursuant to Rule 12b-1 under the 1940 Act. Pursuant to the Class A Plan, the Fund pays Eaton Vance Distributors, Inc. (EVD), an affiliate of CRM and the Fund’s principal underwriter, a distribution and service fee of 0.25% per annum of its average daily net assets attributable to Class A shares for distribution services and facilities provided to the Fund by EVD, as well as for personal services and/or the maintenance of shareholder accounts. The Fund also has in effect a distribution plan for Class C shares (Class C Plan) pursuant to Rule 12b-1 under the 1940 Act. Pursuant to the Class C Plan, the Fund pays EVD amounts equal to 0.75% per annum of its average daily net assets attributable to Class C shares for providing ongoing distribution services and facilities to the Fund. In addition, pursuant to the Class C Plan, the Fund also makes payments of service fees to EVD, financial intermediaries and other persons in amounts equal to 0.25% per annum of its average daily net assets attributable to that class. Service fees paid or accrued are for personal services and/or the maintenance of shareholder accounts. Distribution and service fees paid or accrued for the year ended September 30, 2023 amounted to $700,293 and $302,836 for Class A shares and Class C shares, respectively.
The Fund was informed that EVD received $25,342 as its portion of the sales charge on sales of Class A shares for the year ended September 30, 2023. The Fund was also informed that EVD received $899 of contingent deferred sales charges (CDSC) paid by Class C shareholders and no CDSC paid by Class A shareholders for the same period. The Fund was informed that Morgan Stanley affiliated broker-dealers, which may be deemed to be affiliates of CRM and EVD, also received a portion of the sales charge on sales of Class A shares for the year ended September 30, 2023 in the amount of $7,419.
Eaton Vance Management (EVM), an affiliate of CRM, provides sub-transfer agency and related services to the Fund pursuant to a Sub-Transfer Agency Support Services Agreement. For the year ended September 30, 2023, sub-transfer agency fees and expenses incurred to EVM amounted to $107,333 and are included in transfer agency fees and expenses on the Statement of Operations.
Each Director of the Fund who is not an employee of CRM or its affiliates receives an annual fee of $214,000, an annual Committee fee ranging from $8,500 to $16,500 depending on the Committee, and may receive a fee of $10,000 for special meetings. The Board chair receives an additional $40,000 ($30,000 prior to January 1, 2023) annual fee, Committee chairs receive an additional $15,000 ($6,000 prior to January 1, 2023) annual fee and the special equities liaison receives an additional $2,500 annual fee. Eligible Directors may participate in a Deferred Compensation Plan (the Plan). Amounts deferred under the Plan are treated as though equal dollar amounts had been invested in shares of the Fund or other Calvert funds selected by the Directors. The Fund purchases shares of the funds selected equal to the dollar amounts deferred under the Plan, resulting in an asset equal to the deferred compensation liability. Obligations of the Plan are paid solely from the Fund's assets. Directors’ fees are allocated to each of the Calvert funds served. Salaries and fees of officers and Directors of the Fund who are employees of CRM or its affiliates are paid by CRM.
3 Investment Activity
During the year ended September 30, 2023, the cost of purchases and proceeds from sales of investments, other than short-term securities, were $1,424,126,806 and $1,220,451,423, respectively.
Calvert
Small-Cap Fund
September 30, 2023
Notes to Financial Statements — continued
4 Distributions to Shareholders and Income Tax Information
The tax character of distributions declared for the years ended September 30, 2023 and September 30, 2022 was as follows:
| | Year Ended September 30, |
| | 2023 | 2022 |
| Ordinary income | $ 4,731,257 | $ 91,739,873 |
| Long-term capital gains | $33,685,172 | $108,267,913 |
During the year ended September 30, 2023, distributable earnings was decreased by $1,835,880 and paid-in capital was increased by $1,835,880
primarily due to the Fund's use of equalization accounting. Tax equalization accounting allows the Fund to treat as a distribution that portion of redemption proceeds representing a redeeming shareholder’s portion of undistributed taxable income and net capital gains. These reclassifications had no effect on the net assets or net asset value per share of the Fund.
As of September 30, 2023, the components of distributable earnings (accumulated loss) on a tax basis were as follows:
| Undistributed ordinary income | $ 4,022,005 |
| Deferred capital losses | (14,359,503) |
| Net unrealized appreciation | 99,706,787 |
| Distributable earnings | $ 89,369,289 |
At September 30, 2023, the Fund, for federal income tax purposes, had deferred capital losses of $14,359,503 which would reduce the Fund’s taxable income arising from future net realized gains on investment transactions, if any, to the extent permitted by the Internal Revenue Code, and thus would reduce the amount of distributions to shareholders, which would otherwise be necessary to relieve the Fund of any liability for federal income or excise tax. The deferred capital losses are treated as arising on the first day of the Fund’s next taxable year, can be carried forward for an unlimited period, and retain the same short-term or long-term character as when originally deferred. Of the deferred capital losses at September 30, 2023, $14,359,503 are short-term.
The cost and unrealized appreciation (depreciation) of investments of the Fund at September 30, 2023, as determined on a federal income tax basis, were as follows:
| Aggregate cost | $2,745,249,553 |
| Gross unrealized appreciation | $ 330,700,839 |
| Gross unrealized depreciation | (230,994,052) |
| Net unrealized appreciation | $ 99,706,787 |
5 Securities Lending
To generate additional income, the Fund may lend its securities pursuant to a securities lending agency agreement with State Street Bank and Trust Company (SSBT), the securities lending agent. Security loans are subject to termination by the Fund at any time and, therefore, are not considered illiquid investments. The Fund requires that the loan be continuously collateralized by either cash or securities in an amount at least equal to the market value of the securities on loan. The market value of securities loaned is determined daily and any additional required collateral is delivered to the Fund on the next business day. Cash collateral is generally invested in a money market fund registered under the 1940 Act that is managed by an affiliate of SSBT. Any gain or loss in the market price of the loaned securities that might occur and any interest earned or dividends declared during the term of the loan would accrue to the account of the Fund. Income earned on the investment of collateral, net of broker rebates and other expenses incurred by the securities lending agent, is split between the Fund and the securities lending agent based on agreed upon contractual terms. Non-cash collateral, if any, is held by the lending agent on behalf of the Fund and cannot be sold or re-pledged by the Fund; accordingly, such collateral is not reflected in the Statement of Assets and Liabilities.
Calvert
Small-Cap Fund
September 30, 2023
Notes to Financial Statements — continued
The risks associated with lending portfolio securities include, but are not limited to, possible delays in receiving additional collateral or in the recovery of the loaned securities, possible loss of rights to the collateral should the borrower fail financially, as well as risk of loss in the value of the collateral or the value of the investments made with the collateral. The securities lending agent shall indemnify the Fund in the case of default of any securities borrower.
At September 30, 2023, the total value of securities on loan was $11,748,322 and the total value of collateral received was $12,005,484, comprised of cash of $3,220,000 and U.S. government and/or agencies securities of $8,785,484.
The following table provides a breakdown of securities lending transactions accounted for as secured borrowings, the obligations by class of collateral pledged, and the remaining contractual maturity of those transactions as of September 30, 2023.
| | Remaining Contractual Maturity of the Transactions |
| | Overnight and
Continuous | <30 days | 30 to 90 days | >90 days | Total |
| Common Stocks | $3,220,000 | $ — | $ — | $ — | $3,220,000 |
The carrying amount of the liability for deposits for securities loaned at September 30, 2023 approximated its fair value. If measured at fair value, such liability would have been considered as Level 2 in the fair value hierarchy (see Note 1A) at September 30, 2023.
6 Line of Credit
The Fund participates with other portfolios and funds managed by EVM and its affiliates, including CRM, in a $725 million unsecured revolving line of credit agreement with a group of banks, which is in effect through October 24, 2023. Borrowings are made by the Fund solely for temporary purposes related to redemptions and other short-term cash needs. Interest is charged to the Fund based on its borrowings at an amount above either the Secured Overnight Financing Rate (SOFR) or Federal Funds rate. In addition, a fee computed at an annual rate of 0.15% on the daily unused portion of the line of credit is allocated among the participating portfolios and funds at the end of each quarter. In connection with the renewal of the agreement in October 2022, an arrangement fee of $150,000 was incurred that was allocated to the participating portfolios and funds. Because the line of credit is not available exclusively to the Fund, it may be unable to borrow some or all of its requested amounts at any particular time.
The Fund had no borrowings pursuant to its line of credit during the year ended September 30, 2023. Effective October 24, 2023, the Fund renewed its line of credit agreement, which expires October 22, 2024. In connection with the renewal, the borrowing limit was decreased to $650 million.
7 Affiliated Investments
The Fund has invested a portion of its assets in notes (the Notes) issued by Calvert Impact Capital, Inc. (CIC) pursuant to exemptive relief granted by the U.S. Securities and Exchange Commission (the SEC). There are certain potential points of affiliation between the Fund and CIC. CRM has licensed use of the Calvert name to CIC and provides other types of support. An officer of CRM's affiliate serves on the CIC Board. In addition, a director/trustee on the Fund Board serves as a director emeritus on the CIC Board.
At September 30, 2023, the value of the Fund’s investment in the Notes and in funds that may be deemed to be affiliated was $51,010,782, which represents 1.8% of the Fund’s net assets. Transactions in such investments by the Fund for the year ended September 30, 2023 were as follows:
| Name | Value,
beginning
of period | Purchases | Sales
proceeds | Net
realized
gain
(loss) | Change in
unrealized
appreciation
(depreciation) | Value,
end of
period | Interest/
Dividend
income | Principal amount/
Shares,
end of period |
| High Social Impact Investments | | | | | | | | |
| Calvert Impact Capital, Inc., Community Investment Notes, 1.50%, 12/15/23(1) | $2,340,475 | $ — | $ — | $ — | $ 144,976 | $ 2,485,451 | $ 37,800 | $ 2,520,000 |
| Short-Term Investments | | | | | | |
| Liquidity Fund | 1,117,065 | 856,520,848 | (809,112,582) | — | — | 48,525,331 | 2,848,287 | 48,525,331 |
| Total | | | | $ — | $144,976 | $51,010,782 | $2,886,087 | |
Calvert
Small-Cap Fund
September 30, 2023
Notes to Financial Statements — continued
8 Capital Shares
The Corporation may issue its shares in one or more series (such as the Fund). The authorized shares of the Fund consist of 75,000,000 common shares, $0.01 par value, for each Class.
Transactions in capital shares, including direct exchanges pursuant to share class conversions for all periods presented, were as follows:
| | Year Ended
September 30, 2023 | | Year Ended
September 30, 2022 |
| | Shares | Amount | | Shares | Amount |
| Class A | | | | | |
| Shares sold | 1,914,655 | $ 53,992,855 | | 1,857,494 | $ 57,283,312 |
| Reinvestment of distributions | 131,737 | 3,617,501 | | 619,975 | 20,093,380 |
| Shares redeemed | (1,990,578) | (57,248,551) | | (1,675,490) | (50,651,159) |
| Net increase | 55,814 | $ 361,805 | | 801,979 | $ 26,725,533 |
| Class C | | | | | |
| Shares sold | 188,036 | $ 4,444,935 | | 252,638 | $ 6,422,080 |
| Reinvestment of distributions | 19,293 | 436,217 | | 83,591 | 2,255,294 |
| Shares redeemed | (212,721) | (5,017,593) | | (245,363) | (6,168,860) |
| Net increase (decrease) | (5,392) | $ (136,441) | | 90,866 | $ 2,508,514 |
| Class I | | | | | |
| Shares sold | 26,220,090 | $ 828,596,114 | | 29,458,847 | $ 973,920,528 |
| Reinvestment of distributions | 847,259 | 25,451,669 | | 4,002,933 | 141,663,794 |
| Shares redeemed | (19,498,316) | (609,142,248) | | (33,018,459) | (1,067,747,077) |
| Net increase | 7,569,033 | $ 244,905,535 | | 443,321 | $ 47,837,245 |
| Class R6 | | | | | |
| Shares sold | 1,808,454 | $ 56,474,783 | | 9,689,995 | $ 323,085,253 |
| Reinvestment of distributions | 154,735 | 4,646,694 | | 139,405 | 4,933,560 |
| Shares redeemed | (1,765,007) | (55,514,069) | | (1,974,898) | (64,615,435) |
| Net increase | 198,182 | $ 5,607,408 | | 7,854,502 | $ 263,403,378 |
Calvert
Small-Cap Fund
September 30, 2023
Report of Independent Registered Public Accounting Firm
To the Board of Directors of Calvert Impact Fund, Inc. and Shareholders of Calvert Small-Cap Fund:
Opinion on the Financial Statements and Financial Highlights
We have audited the accompanying statement of assets and liabilities of Calvert Small-Cap Fund (the "Fund") (one of the funds constituting Calvert Impact Fund, Inc.), including the schedule of investments, as of September 30, 2023, the related statement of operations for the year then ended, the statements of changes in net assets for each of the two years in the period then ended, the financial highlights for each of the three years in the period then ended, and the related notes. In our opinion, the financial statements and financial highlights present fairly, in all material respects, the financial position of the Fund as of September 30, 2023, and the results of its operations for the year then ended, the changes in its net assets for each of the two years in the period then ended, and the financial highlights for each of the three years in the period then ended, in conformity with accounting principles generally accepted in the United States of America. The financial highlights for the years ended September 30, 2020 and 2019 were audited by other auditors whose report, dated November 20, 2020, expressed an unqualified opinion on those financial highlights.
Basis for Opinion
These financial statements and financial highlights are the responsibility of the Fund's management. Our responsibility is to express an opinion on the Fund's financial statements and financial highlights based on our audits. We are a public accounting firm registered with the Public Company Accounting Oversight Board (United States) (PCAOB) and are required to be independent with respect to the Fund in accordance with the U.S. federal securities laws and the applicable rules and regulations of the Securities and Exchange Commission and the PCAOB.
We conducted our audits in accordance with the standards of the PCAOB. Those standards require that we plan and perform the audit to obtain reasonable assurance about whether the financial statements and financial highlights are free of material misstatement, whether due to error or fraud. The Fund is not required to have, nor were we engaged to perform, an audit of its internal control over financial reporting. As part of our audits, we are required to obtain an understanding of internal control over financial reporting but not for the purpose of expressing an opinion on the effectiveness of the Fund’s internal control over financial reporting. Accordingly, we express no such opinion.
Our audits included performing procedures to assess the risks of material misstatement of the financial statements and financial highlights, whether due to error or fraud, and performing procedures that respond to those risks. Such procedures included examining, on a test basis, evidence regarding the amounts and disclosures in the financial statements and financial highlights. Our audits also included evaluating the accounting principles used and significant estimates made by management, as well as evaluating the overall presentation of the financial statements and financial highlights. Our procedures included confirmation of securities owned as of September 30, 2023, by correspondence with the custodian and brokers; when replies were not received from brokers, we performed other auditing procedures. We believe that our audits provide a reasonable basis for our opinion.
/s/ Deloitte & Touche LLP
Boston, Massachusetts
November 22, 2023
We have served as the auditor of one or more Calvert investment companies since 2021.
Calvert
Small-Cap Fund
September 30, 2023
Federal Tax Information (Unaudited)
The Form 1099-DIV you receive in February 2024 will show the tax status of all distributions paid to your account in calendar year 2023. Shareholders are advised to consult their own tax adviser with respect to the tax consequences of their investment in the Fund. As required by the Internal Revenue Code and/or regulations, shareholders must be notified regarding the status of qualified dividend income for individuals and the dividends received deduction for corporations.
Qualified Dividend Income. For the fiscal year ended September 30, 2023, the Fund designates approximately $26,023,209, or up to the maximum amount of such dividends allowable pursuant to the Internal Revenue Code, as qualified dividend income eligible for the reduced tax rate of 15%.
Dividends Received Deduction. Corporate shareholders are generally entitled to take the dividends received deduction on the portion of the Fund's dividend distribution that qualifies under tax law. For the Fund's fiscal 2023 ordinary income dividends, 100% qualifies for the corporate dividends received deduction.
Calvert
Small-Cap Fund
September 30, 2023
Board of Directors' Contract Approval
Overview of the Contract Review Process
The Investment Company Act of 1940, as amended, provides, in substance, that each investment advisory agreement between a fund and its investment adviser will continue in effect from year to year only if its continuation is approved at least annually by the fund’s board of directors, including by a vote of a majority of the directors who are not “interested persons” of the fund (“Independent Directors”), cast in person at a meeting called for the purpose of considering such approval.
At an in-person meeting of the Boards of Trustees/Directors (each a “Board”) of the registered investment companies advised by Calvert Research and Management (“CRM” or the “Adviser”) (the “Calvert Funds”) held on June 12-13, 2023, the Board, including a majority of the Independent Directors, voted to approve continuation of existing investment advisory and investment sub-advisory agreements for the Calvert Funds for an additional one-year period.
In evaluating the investment advisory and investment sub-advisory agreements for the Calvert Funds, the Board considered a variety of information relating to the Calvert Funds and various service providers, including the Adviser. The Independent Directors reviewed a report prepared by the Adviser regarding various services provided to the Calvert Funds by the Adviser and its affiliates. Such report included, among other data, information regarding the Adviser’s personnel and the Adviser’s revenue and cost of providing services to the Calvert Funds, and a separate report prepared by an independent data provider, which compared each fund’s investment performance, fees and expenses to those of comparable funds as identified by such independent data provider (“comparable funds”).
The Independent Directors were separately represented by independent legal counsel with respect to their consideration of the continuation of the investment advisory and investment sub-advisory agreements for the Calvert Funds. Prior to voting, the Independent Directors reviewed the proposed continuation of the Calvert Funds’ investment advisory and investment sub-advisory agreements with management and also met in private sessions with their counsel at which time no representatives of management were present.
The information that the Board considered included, among other things, the following (for funds that invest through one or more affiliated underlying fund(s), references to “each fund” in this section may include information that was considered at the underlying fund-level):
Information about Fees, Performance and Expenses
| • | A report from an independent data provider comparing the advisory and related fees paid by each fund with fees paid by comparable funds; |
| • | A report from an independent data provider comparing each fund’s total expense ratio and its components to comparable funds; |
| • | A report from an independent data provider comparing the investment performance of each fund to the investment performance of comparable funds over various time periods; |
| • | Data regarding investment performance in comparison to benchmark indices; |
| • | For each fund, comparative information concerning the fees charged and the services provided by the Adviser in managing other accounts (including mutual funds, other collective investment funds and institutional accounts) using investment strategies and techniques similar to those used in managing such fund; |
| • | Profitability analyses for the Adviser with respect to each fund; |
Information about Portfolio Management and Trading
| • | Descriptions of the investment management services provided to each fund, including investment strategies and processes it employs; |
| • | Information about the Adviser’s policies and practices with respect to trading, including the Adviser’s processes for monitoring best execution of portfolio transactions; |
| • | Information about the allocation of brokerage transactions and the benefits received by the Adviser as a result of brokerage allocation, including information concerning the acquisition of research through client commission arrangements and policies with respect to “soft dollars”; |
Information about the Adviser
| • | Reports detailing the financial results and condition of CRM; |
| • | Descriptions of the qualifications, education and experience of the individual investment professionals whose responsibilities include portfolio management and investment research for the funds, and information relating to their compensation and responsibilities with respect to managing other mutual funds and investment accounts; |
| • | Policies and procedures relating to proxy voting and the handling of corporate actions and class actions; |
| • | A description of CRM’s procedures for overseeing sub-advisers, including with respect to regulatory and compliance issues, investment management and other matters; |
Calvert
Small-Cap Fund
September 30, 2023
Board of Directors' Contract Approval — continued
Other Relevant Information
| • | Information concerning the nature, cost and character of the administrative and other non-investment advisory services provided by CRM and its affiliates; and |
| • | The terms of each investment advisory agreement. |
Over the course of the year, the Board and its committees held regular quarterly meetings. During these meetings, the Directors participated in investment and performance reviews with the portfolio managers and other investment professionals of the Adviser relating to each fund and considered various investment and trading strategies used in pursuing each fund’s investment objective(s), such as the use of derivative instruments, as well as risk management techniques. The Board and its committees also evaluated issues pertaining to industry and regulatory developments, compliance procedures, corporate governance and other issues with respect to the funds and received and participated in reports and presentations provided by CRM and its affiliates with respect to such matters. In addition to the formal meetings of the Board and its committees, the Independent Directors held regular video conferences in between meetings to discuss, among other topics, matters relating to the continuation of the Calvert Funds’ investment advisory and investment sub-advisory agreements.
For funds that invest through one or more affiliated underlying funds, the Board considered similar information about the underlying fund(s) when considering the approval of investment advisory agreements. In addition, in cases where the Adviser has engaged a sub-adviser, the Board considered similar information about the sub-adviser when considering the approval of any investment sub-advisory agreement.
The Independent Directors were assisted throughout the contract review process by their independent legal counsel. The Independent Directors relied upon the advice of such counsel and their own business judgment in determining the material factors to be considered in evaluating each investment advisory and investment sub-advisory agreement and the weight to be given to each such factor. The Board, including the Independent Directors, did not identify any single factor as controlling, and each Director may have attributed different weight to various factors.
Results of the Contract Review Process
Based on its consideration of the foregoing, and such other information as it deemed relevant, including the factors and conclusions described below, the Board, including the Independent Directors, concluded that the continuation of the investment advisory agreement of Calvert Small-Cap Fund (the “Fund”), including the fee payable under the agreement, is in the best interests of the Fund’s shareholders. Accordingly, the Board, including a majority of the Independent Directors, voted to approve the continuation of the investment advisory agreement of the Fund.
Nature, Extent and Quality of Services
In considering the nature, extent and quality of the services provided by the Adviser under the investment advisory agreement, the Board reviewed information provided by the Adviser relating to its operations and personnel, including, among other information, biographical information on the Adviser’s investment personnel and descriptions of its organizational and management structure. The Board also took into account similar information provided periodically throughout the previous year by the Adviser as well as the Board’s familiarity with management through Board meetings, discussions and other reports. The Board considered the Adviser’s management style and its performance in employing its investment strategies as well as its current level of staffing and overall resources. The Board also noted that it reviewed on a quarterly basis information regarding the Adviser’s compliance with applicable policies and procedures, including those related to personal investing. The Board took into account, among other items, periodic reports received from the Adviser over the past year concerning the Adviser’s ongoing review and enhancement of certain processes, policies and procedures of the Calvert Funds and the Adviser. The Board concluded that it was satisfied with the nature, extent and quality of services provided to the Fund by the Adviser under the investment advisory agreement.
Fund Performance
In considering the Fund’s performance, the Board noted that it reviewed on a quarterly basis detailed information about the Fund’s performance results, portfolio composition and investment strategies. The Board compared the Fund’s investment performance to that of the Fund’s peer universe and its benchmark index. The Board’s review included comparative performance data for the one-, three- and five-year periods ended December 31, 2022. This performance data indicated that the Fund had outperformed the median of the Fund’s peer universe and its benchmark index for the one-, three- and five-year periods ended December 31, 2022. Based upon its review, the Board concluded that the Fund’s performance was satisfactory relative to the performance of its peer universe and its benchmark index.
Management Fees and Expenses
In considering the Fund’s fees and expenses, the Board compared the Fund’s fees and total expense ratio with those of comparable funds in its expense group. Among other findings, the data indicated that the Fund’s advisory and administrative fees (referred to collectively as “management fees”) were below the median of the Fund’s expense group and the Fund’s total expenses were above the median of the Fund’s expense group. The Board took into
Calvert
Small-Cap Fund
September 30, 2023
Board of Directors' Contract Approval — continued
account the Adviser’s current undertaking to maintain expense limitations for the Fund and that the Adviser was waiving and/or reimbursing a portion of the Fund’s expenses. Based upon its review, the Board concluded that the management fees were reasonable in view of the nature, extent and quality of services provided by the Adviser.
Profitability and Other “Fall-Out” Benefits
The Board reviewed the Adviser’s profitability in regard to the Fund and the Calvert Funds in the aggregate. In reviewing the overall profitability of the Fund to the Adviser, the Board also considered the fact that the Adviser and its affiliates provided sub-transfer agency support, administrative and distribution services to the Fund for which they received compensation. The information considered by the Board included the profitability of the Fund to the Adviser and its affiliates without regard to any marketing support or other payments by the Adviser and its affiliates to third parties in respect of distribution services. The Board also considered that the Adviser and its affiliates derived benefits to their reputation and other indirect benefits from their relationships with the Fund. Based upon its review, the Board concluded that the Adviser’s and its affiliates’ level of profitability from their relationships with the Fund was reasonable.
Economies of Scale
The Board considered the effect of the Fund’s current size and its potential growth on its performance and fees. The Board concluded that adding breakpoints to the advisory fee at specified asset levels would not be appropriate at this time. The Board noted that if the Fund’s assets increased over time, the Fund might realize other economies of scale if assets increased proportionally more than certain other expenses.
Calvert
Small-Cap Fund
September 30, 2023
Liquidity Risk Management Program
The Fund has implemented a written liquidity risk management program (Program) and related procedures to manage its liquidity in accordance with Rule 22e-4 under the Investment Company Act of 1940, as amended (Liquidity Rule). The Liquidity Rule defines “liquidity risk” as the risk that a fund could not meet requests to redeem shares issued by the fund without significant dilution of the remaining investors’ interests in the fund. The Fund’s Board of Trustees/Directors has designated the investment adviser to serve as the administrator of the Program and the related procedures. The administrator has established a Liquidity Risk Management Oversight Committee (Committee) to perform the functions necessary to administer the Program. As part of the Program, the administrator is responsible for identifying illiquid investments and categorizing the relative liquidity of the Fund’s investments in accordance with the Liquidity Rule. Under the Program, the administrator assesses, manages, and periodically reviews the Fund’s liquidity risk, and is responsible for making certain reports to the Fund’s Board of Trustees/Directors and the Securities and Exchange Commission (SEC) regarding the liquidity of the Fund’s investments, and to notify the Board of Trustees/Directors and the SEC of certain liquidity events specified in the Liquidity Rule. The liquidity of the Fund’s portfolio investments is determined based on a number of factors including, but not limited to, relevant market, trading and investment-specific considerations under the Program.
At a meeting of the Fund’s Board of Trustees/Directors on June 13, 2023, the Committee provided a written report to the Fund’s Board of Trustees/ Directors pertaining to the operation, adequacy, and effectiveness of implementation of the Program, as well as the operation of the highly liquid investment minimum (if applicable) for the period January 1, 2022 through December 31, 2022 (Review Period). The Program operated effectively during the Review Period, supporting the administrator’s ability to assess, manage and monitor Fund liquidity risk, including during periods of market volatility and net redemptions. During the Review Period, the Fund met redemption requests on a timely basis.
There can be no assurance that the Program will achieve its objectives in the future. Please refer to the Fund’s prospectus for more information regarding the Fund’s exposure to liquidity risk and other principal risks to which an investment in the Fund may be subject.
Calvert
Small-Cap Fund
September 30, 2023
Management and Organization
Fund Management. The Directors of Calvert Impact Fund, Inc. (the Corporation) are responsible for the overall management and supervision of the affairs of the Corporation. The Board members and officers of the Corporation are listed below. Except as indicated, each individual has held the office shown or other offices in the same company for the last five years. Board members hold indefinite terms of office. Each Board member holds office until his or her successor is elected and qualified, or until his or her earlier death, resignation, retirement, removal or disqualification. Under the terms of the Fund's current Board member retirement policy, an Independent Board member must retire at the end of the calendar year in which he or she turns 75. However, if such retirement would cause the Fund to be out of compliance with Section 16 of the 1940 Act or any other regulations or guidance of the SEC, then such retirement will not become effective until such time as action has been taken for the Fund to be in compliance therewith. The “noninterested Directors” consist of those Directors who are not “interested persons” of the Corporation, as that term is defined under the 1940 Act. The business address of each Board member and the Chief Compliance Officer is 2050 M Street NW, Washington, DC 20036 and the business address of the Secretary, Vice President and Chief Legal Officer and the Treasurer is Two International Place, Boston, Massachusetts 02110. As used below, “CRM” refers to Calvert Research and Management and “Eaton Vance” refers to Eaton Vance Management. Each Director oversees 46 funds in the Calvert fund complex. Each of Eaton Vance and CRM are indirect, wholly owned subsidiaries of Morgan Stanley. Each officer affiliated with CRM may hold a position with other CRM affiliates that is comparable to his or her position with CRM listed below.
| Name and Year of Birth | Corporation
Position(s) | Length of
Service | Principal Occupation(s) and Other Directorships
During Past Five Years and Other Relevant Experience |
| Interested Director | | | |
Theodore H. Eliopoulos(1)
1964 | Director and
President | Since 2022 | President and Chief Executive Officer of CRM and senior sponsor of Morgan Stanley Investment Management’s (MSIM) Diversity Council. Formerly, Vice Chairman & Head of Strategic Partnerships at MSIM (2019-2022). Former Chief Investment Officer and interim Chief Investment Officer (2014-2018) and Senior Investment Officer of Real Estate and Real Assets at California Public Employees’ Retirement System (CalPERS) (2007-2014). Former Chief Deputy Treasurer and Deputy Treasurer at the California State Treasurer's Office (2002-2006). Mr. Eliopoulos is an interested person because of his positions with CRM and certain affiliates.
Other Directorships. The Robert Toigo Foundation; Pacific Pension & Investment Institute (PPI). |
| Noninterested Directors |
Richard L. Baird, Jr.(2)
1948 | Director | Since 2005 | Regional Disaster Recovery Lead, American Red Cross of Greater
Pennsylvania (since 2017). Volunteer, American Red Cross (since 2015).
Former President and CEO of Adagio Health Inc. (retired in 2014) in
Pittsburgh, PA.
Other Directorships. None. |
Alice Gresham Bullock
1950 | Chair and
Director | Since 2016 | Professor Emerita at Howard University School of Law. Dean Emerita of
Howard University School of Law and Deputy Director of the Association
of American Law Schools (1992-1994).
Other Directorships. None. |
Cari M. Dominguez
1949 | Director | Since 2016 | Former Chair of the U.S. Equal Employment Opportunity Commission.
Other Directorships. ManpowerGroup Inc. (workforce solutions company);
Triple S Management Corporation (managed care); National Association of Corporate Directors. |
Karen Fang(3)
1958 | Director | Since 2023 | Formerly, Managing Director, Wealth Management at GAMCO Asset Management (asset management firm) (2020-2023). Formerly, Managing Director, Senior Portfolio Manager of Fiduciary Trust Company International (wealth management firm) (1993-2019).
Other Directorships. None. |
John G. Guffey, Jr.(2)
1948 | Director | Since 2005 | President of Aurora Press Inc., a privately held publisher of trade paperbacks
(since January 1997).
Other Directorships. Calvert Impact Capital, Inc. (through December 31, 2018); Calvert Ventures, LLC. |
Miles D. Harper, III
1962 | Director | Since 2000 | Partner, Carr Riggs & Ingram (public accounting firm) since October 2014.
Partner, Gainer Donnelly & Desroches (public accounting firm) (now Carr
Riggs & Ingram) (November 1999 - September 2014).
Other Directorships. Bridgeway Funds (9) (asset management). |
Joy V. Jones
1950 | Director | Since 2000 | Attorney.
Other Directorships. Palm Management Corporation. |
Calvert
Small-Cap Fund
September 30, 2023
Management and Organization — continued
| Name and Year of Birth | Corporation
Position(s) | Length of
Service | Principal Occupation(s) and Other Directorships
During Past Five Years and Other Relevant Experience |
| Noninterested Directors (continued) |
Eddie Ramos(3)
1967 | Director | Since 2023 | Private investor (2022-present). Formerly, Head of External Advisors/Diversity Portfolio Management at the New Jersey Division of Investment (2020-2022). Formerly, Chief Investment Officer and Lead Portfolio Manager – Global Fundamental Equities at Cornerstone Capital Management (asset management firm) (2011-2017).
Other Directorships. Macquarie Optimum Funds (6) (asset management). |
Anthony A. Williams
1951 | Director | Since 2016 | CEO and Executive Director of the Federal City Council (July 2012 to
present); Senior Adviser and Independent Consultant for King and
Spalding LLP (September 2015 to present); Executive Director of Global
Government Practice at the Corporate Executive Board (January 2010 to
January 2012).
Other Directorships. Freddie Mac; Evoq Properties/Meruelo Maddux
Properties, Inc. (real estate management); Weston Solutions, Inc.
(environmental services); Bipartisan Policy Center’s Debt Reduction Task Force;
Chesapeake Bay Foundation; Catholic University of America; Urban Institute (research organization); The Howard Hughes Corporation (real estate development); Old Dominion National Bank. |
| Name and Year of Birth | Corporation
Position(s) | Length of
Service | Principal Occupation(s)
During Past Five Years |
| Principal Officers who are not Directors |
Hope L. Brown
1973 | Chief
Compliance
Officer | Since 2014 | Chief Compliance Officer of 46 registered investment companies advised
by CRM (since 2014). Vice President and Chief Compliance Officer,
Wilmington Funds (2012-2014). |
Deidre E. Walsh
1971 | Secretary,
Vice President
and Chief
Legal Officer | Since 2021 | Vice President of CRM and officer of 46 registered investment companies
advised by CRM (since 2021). Also Vice President of Eaton Vance and
certain of its affiliates and officer of 127 registered investment companies
advised or administered by Eaton Vance. |
James F. Kirchner
1967 | Treasurer | Since 2016 | Vice President of CRM and officer of 46 registered investment companies
advised by CRM (since 2016). Also Vice President of Eaton Vance and
certain of its affiliates and officer of 127 registered investment companies
advised or administered by Eaton Vance. |
| | | | |
| (1) Mr. Eliopoulos is an interested person of the Fund because of his positions with the Fund’s adviser and certain affiliates. |
| (2) Effective December 31, 2023, Richard L. Baird, Jr. and John G. Guffey, Jr. will retire from the Board of Directors. |
| (3) Ms. Fang and Mr. Ramos began serving as Directors effective October 30, 2023. |
The SAI for the Fund includes additional information about the Directors and officers of the Fund and can be obtained without charge on Calvert’s website at www.calvert.com or by calling 1-800-368-2745.
| FACTS | WHAT DOES EATON VANCE DO WITH YOUR
PERSONAL INFORMATION? |
| Why? | Financial companies choose how they share your personal information. Federal law gives consumers the right to limit some but not all sharing. Federal law also requires us to tell you how we collect, share, and protect your personal information. Please read this notice carefully to understand what we do. |
| |
| What? | The types of personal information we collect and share depend on the product or service you have with us. This information can include:■ Social Security number and income
■
investment experience and risk tolerance
■
checking account number and wire transfer instructions |
| |
| How? | All financial companies need to share customers’ personal information to run their everyday business. In the section below, we list the reasons financial companies can share their customers’ personal information; the reasons Eaton Vance chooses to share; and whether you can limit this sharing. |
Reasons we can share your
personal information | Does Eaton Vance
share? | Can you limit
this sharing? |
| For our everyday business purposes — such as to process your transactions, maintain your account(s), respond to court orders and legal investigations, or report to credit bureaus | Yes | No |
| For our marketing purposes — to offer our products and services to you | Yes | No |
| For joint marketing with other financial companies | No | We don’t share |
| For our investment management affiliates’ everyday business purposes — information about your transactions, experiences, and creditworthiness | Yes | Yes |
| For our affiliates’ everyday business purposes — information about your transactions and experiences | Yes | No |
| For our affiliates’ everyday business purposes — information about your creditworthiness | No | We don’t share |
| For our investment management affiliates to market to you | Yes | Yes |
| For our affiliates to market to you | No | We don’t share |
| For nonaffiliates to market to you | No | We don’t share |
To limit our
sharing | Call toll-free 1-800-368-2745 or email: CRMPrivacy@calvert.comPlease note:If you are a new customer, we can begin sharing your information 30 days from the date we sent this notice. When you are no longer our customer, we continue to share your information as described in this notice. However, you can contact us at any time to limit our sharing. |
| Questions? | Call toll-free 1-800-368-2745 or email: CRMPrivacy@calvert.com |
| Privacy Notice — continued | April 2021 |
| Who we are |
| Who is providing this notice? | Eaton Vance Management, Eaton Vance Distributors, Inc., Eaton Vance Trust Company, Eaton Vance Management (International) Limited, Eaton Vance Advisers International Ltd., Eaton Vance Global Advisors Limited, Eaton Vance Management’s Real Estate Investment Group, Boston Management and Research, Calvert Research and Management, Eaton Vance and Calvert Fund Families and our investment advisory affiliates (“Eaton Vance”) (see Investment Management Affiliates definition below) |
| What we do |
How does Eaton Vance
protect my personal
information? | To protect your personal information from unauthorized access and use, we use security measures that comply with federal law. These measures include computer safeguards and secured files and buildings. We have policies governing the proper handling of customer information by personnel and requiring third parties that provide support to adhere to appropriate security standards with respect to such information. |
How does Eaton Vance
collect my personal
information? | We collect your personal information, for example, when you■ open an account or make deposits or withdrawals from your account
■
buy securities from us or make a wire transfer
■
give us your contact informationWe also collect your personal information from others, such as credit bureaus, affiliates, or other companies. |
| Why can’t I limit all sharing? | Federal law gives you the right to limit only■ sharing for affiliates’ everyday business purposes — information about your creditworthiness
■
affiliates from using your information to market to you
■
sharing for nonaffiliates to market to youState laws and individual companies may give you additional rights to limit sharing. See below for more on your rights under state law. |
| Definitions |
Investment Management
Affiliates | Eaton Vance Investment Management Affiliates include registered investment advisers, registered broker- dealers, and registered and unregistered funds. Investment Management Affiliates does not include entities associated with Morgan Stanley Wealth Management, such as Morgan Stanley Smith Barney LLC and Morgan Stanley & Co. |
| Affiliates | Companies related by common ownership or control. They can be financial and nonfinancial companies.■ Our affiliates include companies with a Morgan Stanley name and financial companies such as Morgan Stanley Smith Barney LLC and Morgan Stanley & Co. |
| Nonaffiliates | Companies not related by common ownership or control. They can be financial and nonfinancial companies.■ Eaton Vance does not share with nonaffiliates so they can market to you. |
| Joint marketing | A formal agreement between nonaffiliated financial companies that together market financial products or services to you.■ Eaton Vance doesn’t jointly market. |
| Other important information |
| Vermont: Except as permitted by law, we will not share personal information we collect about Vermont residents with Nonaffiliates unless you provide us with your written consent to share such information.California: Except as permitted by law, we will not share personal information we collect about California residents with Nonaffiliates and we will limit sharing such personal information with our Affiliates to comply with California privacy laws that apply to us. |
Delivery of Shareholder Documents. The Securities and Exchange Commission (SEC) permits funds to deliver only one copy of shareholder documents, including prospectuses, proxy statements and shareholder reports, to fund investors with multiple accounts at the same residential or post office box address. This practice is often called “householding” and it helps eliminate duplicate mailings to shareholders. Calvert funds, or your financial intermediary, may household the mailing of your documents indefinitely unless you instruct Calvert funds, or your financial intermediary, otherwise. If you would prefer that your Calvert fund documents not be householded, please contact Calvert funds at 1-800-368-2745, or contact your financial intermediary. Your instructions that householding not apply to delivery of your Calvert fund documents will typically be effective within 30 days of receipt by Calvert funds or your financial intermediary.
Portfolio Holdings. Each Calvert fund files a schedule of portfolio holdings on Part F to Form N-PORT with the SEC. Certain information filed on Form N-PORT may be viewed on the Calvert website at www.calvert.com, by calling Calvert at 1-800-368-2745 or in the EDGAR database on the SEC’s website at www.sec.gov.
Proxy Voting. The Proxy Voting Guidelines that each Calvert fund uses to determine how to vote proxies relating to portfolio securities is provided as an Appendix to the fund’s Statement of Additional Information. The Statement of Additional Information can be obtained free of charge by calling the Calvert funds at 1-800-368-2745, by visiting the Calvert funds’ website at www.calvert.com or visiting the SEC’s website at www.sec.gov. Information regarding how a Calvert fund voted proxies relating to portfolio securities during the most recent 12-month period ended June 30 is available by calling Calvert funds, by visiting the Calvert funds’ website at www.calvert.com or by visiting the SEC’s website at www.sec.gov.
Tailored Shareholder Reports. Effective January 24, 2023, the SEC adopted rule and form amendments to require open-end mutual funds and ETFs to transmit concise and visually engaging streamlined annual and semiannual reports to shareholders that highlight key information. Other information, including financial statements, will no longer appear in a streamlined shareholder report but must be available online, delivered free of charge upon request, and filed on a semiannual basis on Form N-CSR. The rule and form amendments have a compliance date of July 24, 2024. At this time, management is evaluating the impact of these amendments on the shareholder reports for the Calvert Funds.
This Page Intentionally Left Blank
This Page Intentionally Left Blank
Investment Adviser and Administrator
Calvert Research and Management
2050 M Street NW
Washington, DC 20036
Principal Underwriter*
Eaton Vance Distributors, Inc.
Two International Place
Boston, MA 02110
(617) 482-8260
Custodian
State Street Bank and Trust Company
One Congress Street, Suite 1
Boston, MA 02114-2016
Transfer Agent
SS&C Global Investor & Distribution Solutions, Inc.
2000 Crown Colony Drive
Quincy, MA 02169
Independent Registered Public Accounting Firm
Deloitte & Touche LLP
200 Berkeley Street
Boston, MA 02116-5022
Fund Offices
2050 M Street NW
Washington, DC 20036
* FINRA BrokerCheck. Investors may check the background of their Investment Professional by contacting the Financial Industry Regulatory Authority (FINRA). FINRA BrokerCheck is a free tool to help investors check the professional background of current and former FINRA-registered securities firms and brokers. FINRA BrokerCheck is available by calling 1-800-289-9999 and at www.FINRA.org. The FINRA BrokerCheck brochure describing this program is available to investors at www.FINRA.org.
Printed on recycled paper.
24197 9.30.23
Calvert
Global Energy Solutions Fund
Global Water Fund
Annual Report
September 30, 2023
Commodity Futures Trading Commission Registration. The Commodity Futures Trading Commission (“CFTC”) has adopted regulations that subject registered investment companies and advisers to regulation by the CFTC if a fund invests more than a prescribed level of its assets in certain CFTC-regulated instruments (including futures, certain options and swap agreements) or markets itself as providing investment exposure to such instruments. The adviser has claimed an exclusion from the definition of “commodity pool operator” under the Commodity Exchange Act with respect to its management of each Fund and the other funds it manages. Accordingly, neither the Funds nor the adviser is subject to CFTC regulation.
Fund shares are not insured by the FDIC and are not deposits or other obligations of, or guaranteed by, any depository institution. Shares are subject to investment risks, including possible loss of principal invested.
This report must be preceded or accompanied by a current summary prospectus or prospectus. Before investing, investors should consider carefully the investment objective, risks, and charges and expenses of a mutual fund. This and other important information is contained in the summary prospectus and prospectus, which can be obtained from a financial intermediary. Prospective investors should read the prospectus carefully before investing. For further information, please call 1-800-368-2745.
Choose Planet-friendly E-delivery!
Sign up now for on-line statements, prospectuses, and fund reports. In less than five minutes you can help reduce paper mail and lower fund costs.
Just go to www.calvert.com. If you already have an online account with the Calvert funds, click on Login to access your Account and select the documents you would like to receive via e-mail.
If you’re new to online account access, click on Login, then Register to create your user name and password. Once you’re in, click on the E-delivery sign-up on the Account Portfolio page and follow the quick, easy steps.
Note: If your shares are not held directly with the Calvert funds but through a brokerage firm, you must contact your broker for electronic delivery options available through their firm.
Annual Report September 30, 2023
Calvert
Global Energy Solutions Fund
Global Water Fund
Calvert
Global Energy Solutions Fund
Global Water Fund
September 30, 2023
Management's Discussion of Fund Performance†
Economic and Market Conditions
For global equity investors, the 12-month period ended September 30, 2023, was a roller-coaster ride, driven largely by shifting perceptions of whether the U.S. Federal Reserve (the Fed) could bring the world’s largest economy in for a soft landing, and changing expectations of how long interest rates might remain high.
During the opening two months of the period, stocks rallied on strong corporate earnings, attractive valuations, and hope the Fed might slow the pace of its interest rate hikes. But in December 2022, equities lost ground as “higher for longer” interest rate fears returned. A continuing irony throughout the period was that good economic news -- record low unemployment, strong job creation, and robust consumer spending -- was viewed as bad news for inflation and fuel for further rate hikes that would weigh on stock prices.
In January 2023, however, global equities began a rally that lasted through July. The initial tailwind was ChatGPT, an artificial intelligence (AI) application that led investors to perceive AI might become the next big innovation to drive the information technology (IT) sector. As a result, IT -- one of the worst-performing sectors in 2022 -- became the standout sector of the first half of 2023.
Earlier recession fears that had weighed on stock prices receded as many investors came around to the view that the U.S. and global economies were doing surprisingly well. European equities received an additional boost as feared continent-wide energy shortages failed to materialize during the winter.
But in the final two months of the period, the bond market halted the stock market’s momentum. As it became clear the Fed would keep rates higher for longer than investors had anticipated just a few months earlier, longer term bond interest rates rose sharply. Given the potential for relatively attractive returns with lower risk than stocks, many investors shifted from equity assets to bonds. Stock prices ended on a down note as the period came to a close.
For the period as a whole, however, global equity performance was strong. The MSCI ACWI Index, a broad measure of global equities, returned 20.80%; the MSCI EAFE Index of developed-market international equities returned 25.65%; and the S&P 500® Index, a broad measure of U.S. stocks, returned 21.62%.
Meanwhile, in the world’s second-largest economy, performance was not as strong. The MSCI Golden Dragon Index, a measure of Chinese large-cap and mid-cap stocks, was one of the weakest performing major global indexes, returning 8.80% during the period. The Chinese equity market was dogged by an ailing real estate sector -- the major investment area for millions of Chinese citizens -- and a failure of many Chinese industries to bounce back after onerous COVID restrictions were lifted.
Fund Performance - Calvert Global Energy Solutions Fund
For the 12-month period ended September 30, 2023, Calvert Global Energy Solutions Fund (the Fund) returned 7.38% for Class A shares at net asset value (NAV). The Fund underperformed its primary benchmark, the MSCI ACWI Index (the Index), which returned 20.80%; and underperformed its secondary benchmark, the Calvert Global Energy Research Index (the Calvert Energy Index), which returned 8.34% during the period.
The Fund’s underperformance relative to the Calvert Energy Index was the result of Fund expenses and fees, which the Calvert Energy Index does not incur.
The Fund invests in five categories of companies involved in the following energy-related business activities (each as defined in the Fund’s prospectus): renewable energy producers/distributors, energy technology providers, energy efficiency providers, energy use leaders, and energy innovators.
Allocations by category was the largest detractor from returns relative to the Index during the period. In particular, the Fund’s overweight exposure to renewable energy producers/distributors weighed on returns as the category underperformed the Index because of higher costs from rising interest rates and supply constraints. Security selections in the category also detracted from relative returns during the period.
An overweight allocation to energy technology providers further dampened relative returns, although security selections in the category were positive during the period.
The Fund’s larger-than-Index exposure to global markets detracted from relative returns as the U.S. market outperformed global markets during the period. While allocations to U.S. companies represented 61% of the Index, the Fund’s U.S. allocation was 34% during the period. The Fund’s overweight exposure to Europe also hurt relative performance.
Not owning large-cap U.S. firms that were not energy-focused -- including NVIDIA Corp. (NVIDIA) and Meta Platforms, Inc. -- had a negative impact on relative returns during the period. In particular, the absence of NVIDIA in the Fund was the leading individual detractor as its share price rose nearly 260% during the period.
See Endnotes and Additional Disclosures in this report.
Past performance is no guarantee of future results. Returns are historical and are calculated by determining the percentage change in net asset value (NAV) or offering price (as applicable) with all distributions reinvested. Furthermore, returns do not reflect the deduction of taxes that shareholders may have to pay on Fund distributions or upon the redemption of Fund shares. Investment return and principal value will fluctuate so that shares, when redeemed, may be worth more or less than their original cost. Performance for periods less than or equal to one year is cumulative. Performance is for the stated time period only; due to market volatility, current Fund performance may be lower or higher than the quoted return. For performance as of the most recent month-end, please refer to www.calvert.com.
Calvert
Global Energy Solutions Fund
Global Water Fund
September 30, 2023
Management's Discussion of Fund Performance† — continued
On the positive side, security selections in energy efficiency providers led contributors during the period, even as an overweight exposure to the category was somewhat offsetting. XPENG, Inc., a Chinese electric vehicle (EV) manufacturer, was a leading contributor in the category as EV sales rose globally during the period.
An overweight exposure to energy technology providers hurt relative returns, while security selections had a positive impact during the period. Leading contributors included EnerSys, a U.S. battery manufacturer; and SMA Solar Technology AG, a German solar energy equipment provider.
Although security selections in the energy use leaders category detracted from relative returns, several selections were beneficial during the period, including FedEx Corp., Bayerische Motoren Werke AG, and Daimler Truck Holding AG.
The Fund’s lack of exposure to the Mideast and South Africa boosted relative returns, and security selections in Latin America further contributed during the period. Among positive selections was Sao Martinho S.A., a Brazilian ethanol provider.
Owning strong-performing stocks not within the Index -- Universal Display Corp., a U.S. developer of organic light emitting diodes; Nordex SE, a German manufacturer of wind turbines; and Munters Group AB, a provider of energy-efficient air treatment based in Sweden -- also bolstered relative returns during the period.
Fund Performance - Calvert Global Water Fund
For the 12-month period ended September 30, 2023, Calvert Global Water Fund (the Fund) returned 16.00% for Class A shares at net asset value (NAV). The Fund underperformed its primary benchmark, the MSCI ACWI Index (the Index), which returned 20.80%; and underperformed its secondary benchmark, the Calvert Global Water Research Index (the Calvert Water Index), which returned 17.00% during the period.
The Fund’s underperformance relative to the Calvert Water Index was the result of Fund expenses and fees, which the Calvert Water Index does not incur.
The Fund invests in five categories of companies involved in the following water-related business activities (each as defined in the Fund’s prospectus): water utilities, water infrastructure providers, water technology providers, water use leaders, and water innovators.
An overweight exposure to water utilities and stock selections in the category combined for the largest detractor from Fund performance relative to the Index during the period. Category holdings in the U.S. particularly weighed on relative returns.
Not owning several top-performing U.S. companies within the Index that were not water related -- particularly NVIDIA Corp., Meta Platforms, Inc., and Microsoft Corp -- also detracted from relative returns during the period. The Fund’s overweight exposure to Japan was a further detriment to relative performance.
Stock selections among water technology providers led contributors, while an overweight exposure to the category erased much of those gains. Leading individual contributors in this category included Pentair Plc., a U.S.-based water treatment company whose share price rose 62% during the period. Badger Meter, Inc., a U.S.-based developer of flow measurement, water quality and other products; and Hawkins, Inc., a U.S.-based manufacturer of water treatment and other chemicals, also contributed. Both companies were out-of-Index holdings whose share prices rose roughly 54% during the period.
The Fund also benefited from a slightly larger-than-Index allocation to water infrastructure providers. Leading individual contributors included Uponor Oyj, a Finland-based plumbing and heating company; and Ferguson Plc., a U.S.-based plumbing and heating products distributor.
Although the water utilities category detracted overall, the Fund’s overweight position in Veolia Environnement SA, a French water and waste management company, contributed to relative performance during the period.
Fund holdings in Latin America, particularly in Brazil and Chile, led contributors by region. The share prices of Aguas Andinas SA, a Chilean water treatment company; and Companhia de Saneamento de Minas Gerais, a Brazilian water supply company, rose more than 50% during the period.
Not owning Index components Tesla, Pfizer, Johnson & Johnson, and UnitedHealth Group also enhanced relative performance during the period.
See Endnotes and Additional Disclosures in this report.
Past performance is no guarantee of future results. Returns are historical and are calculated by determining the percentage change in net asset value (NAV) or offering price (as applicable) with all distributions reinvested. Furthermore, returns do not reflect the deduction of taxes that shareholders may have to pay on Fund distributions or upon the redemption of Fund shares. Investment return and principal value will fluctuate so that shares, when redeemed, may be worth more or less than their original cost. Performance for periods less than or equal to one year is cumulative. Performance is for the stated time period only; due to market volatility, current Fund performance may be lower or higher than the quoted return. For performance as of the most recent month-end, please refer to www.calvert.com.
Calvert
Global Energy Solutions Fund
September 30, 2023
Performance
Portfolio Manager(s) Thomas C. Seto of Calvert Research and Management
| % Average Annual Total Returns1,2 | Class
Inception Date | Performance
Inception Date | One Year | Five Years | Ten Years |
| Class A at NAV | 05/31/2007 | 05/31/2007 | 7.38% | 9.58% | 4.95% |
| Class A with 5.25% Maximum Sales Charge | — | — | 1.71 | 8.39 | 4.39 |
| Class C at NAV | 07/31/2007 | 05/31/2007 | 6.67 | 8.75 | 4.26 |
| Class C with 1% Maximum Deferred Sales Charge | — | — | 5.67 | 8.75 | 4.26 |
| Class I at NAV | 05/31/2007 | 05/31/2007 | 7.69 | 9.84 | 5.29 |
|
| MSCI ACWI Index | — | — | 20.80% | 6.46% | 7.55% |
| Calvert Global Energy Research Spliced Benchmark | — | — | 8.34 | 10.96 | 7.54 |
| Calvert Global Energy Research Index | — | — | 8.34 | 10.96 | — |
| Alerian Global Alternative Energy Index | — | — | 6.12 | 21.54 | 12.22 |
| % Total Annual Operating Expense Ratios3 | Class A | Class C | Class I |
| Gross | 1.40% | 2.15% | 1.15% |
| Net | 1.24 | 1.99 | 0.99 |
Growth of $10,000
This graph shows the change in value of a hypothetical investment of $10,000 in Class A of the Fund for the period indicated. For comparison, the same investment is shown in the indicated index.
| Growth of Investment | Amount Invested | Period Beginning | At NAV | With Maximum Sales Charge |
| Class C | $10,000 | 09/30/2013 | $15,179 | N.A. |
| Class I, at minimum investment | $1,000,000 | 09/30/2013 | $1,674,391 | N.A. |
See Endnotes and Additional Disclosures in this report.
Past performance is no guarantee of future results. Returns are historical and are calculated by determining the percentage change in net asset value (NAV) or offering price (as applicable) with all distributions reinvested. Furthermore, returns do not reflect the deduction of taxes that shareholders may have to pay on Fund distributions or upon the redemption of Fund shares. Investment return and principal value will fluctuate so that shares, when redeemed, may be worth more or less than their original cost. Performance for periods less than or equal to one year is cumulative. Performance is for the stated time period only; due to market volatility, current Fund performance may be lower or higher than the quoted return. For performance as of the most recent month-end, please refer to www.calvert.com.
Calvert
Global Energy Solutions Fund
September 30, 2023
Sector Allocation (% of net assets)1
| Top 10 Holdings (% of net assets)1 | |
| Tesla, Inc. | 0.9% |
| Infratil, Ltd. | 0.8 |
| Verbund AG | 0.8 |
| ON Semiconductor Corp. | 0.8 |
| Meridian Energy, Ltd. | 0.8 |
| Mitsubishi Electric Corp. | 0.8 |
| Schneider Electric SE | 0.8 |
| Orsted A/S | 0.8 |
| Siemens AG | 0.8 |
| Emerson Electric Co. | 0.8 |
| Total | 8.1% |
Footnotes:
| 1 | Excludes cash and cash equivalents. |
Calvert
Global Water Fund
September 30, 2023
Performance
Portfolio Manager(s) Thomas C. Seto of Calvert Research and Management
| % Average Annual Total Returns1,2 | Class
Inception Date | Performance
Inception Date | One Year | Five Years | Ten Years |
| Class A at NAV | 09/30/2008 | 09/30/2008 | 16.00% | 5.74% | 4.86% |
| Class A with 5.25% Maximum Sales Charge | — | — | 9.89 | 4.60 | 4.30 |
| Class C at NAV | 09/30/2008 | 09/30/2008 | 15.16 | 4.95 | 4.25 |
| Class C with 1% Maximum Deferred Sales Charge | — | — | 14.16 | 4.95 | 4.25 |
| Class I at NAV | 01/31/2014 | 09/30/2008 | 16.32 | 6.02 | 5.22 |
|
| MSCI ACWI Index | — | — | 20.80% | 6.46% | 7.55% |
| Calvert Global Water Research Spliced Benchmark | — | — | 17.00 | 6.98 | 7.95 |
| Calvert Global Water Research Index | — | — | 17.00 | 6.98 | — |
| S-Network Global Water Index | — | — | 17.16 | 5.47 | 6.95 |
| % Total Annual Operating Expense Ratios3 | Class A | Class C | Class I |
| Gross | 1.28% | 2.03% | 1.03% |
| Net | 1.24 | 1.99 | 0.99 |
Growth of $10,000
This graph shows the change in value of a hypothetical investment of $10,000 in Class A of the Fund for the period indicated. For comparison, the same investment is shown in the indicated index.
| Growth of Investment | Amount Invested | Period Beginning | At NAV | With Maximum Sales Charge |
| Class C | $10,000 | 09/30/2013 | $15,165 | N.A. |
| Class I, at minimum investment | $1,000,000 | 09/30/2013 | $1,664,220 | N.A. |
See Endnotes and Additional Disclosures in this report.
Past performance is no guarantee of future results. Returns are historical and are calculated by determining the percentage change in net asset value (NAV) or offering price (as applicable) with all distributions reinvested. Furthermore, returns do not reflect the deduction of taxes that shareholders may have to pay on Fund distributions or upon the redemption of Fund shares. Investment return and principal value will fluctuate so that shares, when redeemed, may be worth more or less than their original cost. Performance for periods less than or equal to one year is cumulative. Performance is for the stated time period only; due to market volatility, current Fund performance may be lower or higher than the quoted return. For performance as of the most recent month-end, please refer to www.calvert.com.
Calvert
Global Water Fund
September 30, 2023
Sector Allocation (% of net assets)1
| Top 10 Holdings (% of net assets)1 | |
| Ecolab, Inc. | 2.3% |
| Xylem, Inc. | 2.0 |
| Tetra Tech, Inc. | 2.0 |
| Pentair PLC | 2.0 |
| Veolia Environnement S.A. | 1.9 |
| American Water Works Co., Inc. | 1.8 |
| Zurn Elkay Water Solutions Corp., Class C | 1.8 |
| Watts Water Technologies, Inc., Class A | 1.8 |
| Lixil Corp. | 1.7 |
| United Utilities Group PLC | 1.7 |
| Total | 19.0% |
Footnotes:
| 1 | Excludes cash and cash equivalents. |
Calvert
Global Energy Solutions Fund
Global Water Fund
September 30, 2023
Endnotes and Additional Disclosures
| † | The views expressed in this report are those of the portfolio manager(s) and are current only through the date stated at the top of this page. These views are subject to change at any time based upon market or other conditions, and Calvert and the Fund(s) disclaim any responsibility to update such views. These views may not be relied upon as investment advice and, because investment decisions are based on many factors, may not be relied upon as an indication of trading intent on behalf of any Calvert fund. This commentary may contain statements that are not historical facts, referred to as “forward-looking statements.” The Fund’s actual future results may differ significantly from those stated in any forward-looking statement, depending on factors such as changes in securities or financial markets or general economic conditions, the volume of sales and purchases of Fund shares, the continuation of investment advisory, administrative and service contracts, and other risks discussed from time to time in the Fund’s filings with the Securities and Exchange Commission. |
| | |
| 1 | MSCI ACWI Index is an unmanaged free-float-adjusted, market-capitalization-weighted index designed to measure the equity market performance of developed and emerging markets. MSCI indexes are net of foreign withholding taxes. Source: MSCI. MSCI data may not be reproduced or used for any other purpose. MSCI provides no warranties, has not prepared or approved this report, and has no liability hereunder.The Calvert Global Energy Research Spliced Benchmark is comprised of the Alerian Global Alternative Energy Index prior to October 4, 2016 and the Calvert Global Energy Research Index thereafter. The Calvert Global Energy Research Index includes companies that manage energy use in a sustainable manner or that are actively engaged in facilitating the transition to a more sustainable economy through the reduction of greenhouse gas emissions and the expanded use of renewable energy sources. The Calvert Global Energy Research Index incepted on July 15, 2016; accordingly, the ten year return is not available. The Alerian Global Alternative Energy Index measures the performance of stocks engaged in the field of alternative energy including solar, bioenergy, wind, hydro, and geothermal power sources. |
| | The Calvert Global Water Research Spliced Benchmark is comprised of the S-Network Global Water Index prior to April 11, 2016 and the Calvert Global Water Research Index thereafter. The Calvert Global Water Research Index includes stocks of companies that manage water use in a sustainable manner or that are actively engaged in expanding access to water, improving water quality, promoting the efficient use of water, or providing solutions that address other global water challenges. The Calvert Global Water Research Index incepted on February 5, 2016; accordingly, the ten year return is not available. The S-Network Global Water Index measures the performance of stocks involved in water infrastructure, including utilities, and water technology development.Unless otherwise stated, index returns do not reflect the effect of any applicable sales charges, commissions, expenses, taxes or leverage, as applicable. It is not possible to invest directly in an index. |
| 2 | Total Returns at NAV do not include applicable sales charges. If sales charges were deducted, the returns would be lower. Total Returns shown with maximum sales charge reflect the stated maximum sales charge. Unless otherwise stated, performance does not reflect the deduction of taxes on Fund distributions or redemptions of Fund shares.Effective November 5, 2020, Class C shares automatically convert to Class A shares eight years after purchase. The average annual total returns listed for Class C reflect conversion to Class A shares after eight years. Prior to November 5, 2020, Class C shares automatically converted to Class A shares ten years after purchase.For the Calvert Global Water Fund, performance prior to the inception date of a class may be linked to the performance of an older class of the Fund. This linked performance is adjusted for any applicable sales charge, but is not adjusted for class expense differences. If adjusted for such differences, the performance would be different. The performance of Class I for the Calvert Global Water Fund is linked to Class A. Performance presented in the Financial Highlights included in the financial statements is not linked.Effective October 4, 2016, the Calvert Global Energy Solutions Fund changed its investment objective and principal investment strategies to track the Calvert Global Energy Research Index and implement the Calvert Principles for Responsible Investment. Prior to October 4, 2016, the Fund employed an active management strategy. Performance prior to October 4, 2016 reflects the Fund’s performance under its former investment objective and policies. In connection with such changes, the Fund changed its secondary benchmark from Alerian Global Alternative Energy Index to Calvert Global Energy Research Index. |
Calvert
Global Energy Solutions Fund
Global Water Fund
September 30, 2023
Endnotes and Additional Disclosures — continued
| | Effective April 11, 2016, the Calvert Global Water Fund changed its investment objective and principal investment strategies to track the Calvert Global Water Research Index and implement the Calvert Principles for Responsible Investment. Prior to April 11, 2016, the Fund employed an active management strategy. Performance prior to April 11, 2016 reflects the Fund’s performance under its former investment objective and policies. In connection with such changes, the Fund changed its secondary benchmark from S-Network Global Water Index to Calvert Global Water Research Index.Calvert Research and Management became the investment adviser to each Fund on December 31, 2016. Performance reflected prior to such date is that of each Fund’s former investment adviser. |
| 3 | Source: Fund prospectus. Net expense ratios reflect a contractual expense reimbursement that continues through 1/31/24. The expense ratios for the current reporting period can be found in the Financial Highlights section of this report. Performance reflects expenses waived and/or reimbursed, if applicable. Without such waivers and/or reimbursements, performance would have been lower. |
| | Additional Information |
| | S&P 500® Index is an unmanaged index of large-cap stocks commonly used as a measure of U.S. stock market performance. S&P Dow Jones Indices are a product of S&P Dow Jones Indices LLC (“S&P DJI”) and have been licensed for use. S&P® and S&P 500® are registered trademarks of S&P DJI; Dow Jones® is a registered trademark of Dow Jones Trademark Holdings LLC (“Dow Jones”); S&P DJI, Dow Jones and their respective affiliates do not sponsor, endorse, sell or promote the Fund, will not have any liability with respect thereto and do not have any liability for any errors, omissions, or interruptions of the S&P Dow Jones Indices. MSCI Golden Dragon Index is an unmanaged index of common stocks traded in China, Hong Kong and Taiwan. MSCI EAFE Index is an unmanaged index of equities in the developed markets, excluding the U.S. and Canada. |
Calvert
Global Energy Solutions Fund
Global Water Fund
September 30, 2023
Example
As a Fund shareholder, you incur two types of costs: (1) transaction costs, including sales charges (loads) on purchases; and (2) ongoing costs, including management fees; distribution and/or service fees; and other Fund expenses. This Example is intended to help you understand your ongoing costs (in dollars) of Fund investing and to compare these costs with the ongoing costs of investing in other mutual funds. The Example is based on an investment of $1,000 invested at the beginning of the period and held for the entire period (April 1, 2023 to September 30, 2023).
Actual Expenses
The first section of the tables below provides information about actual account values and actual expenses. You may use the information in this section, together with the amount you invested, to estimate the expenses that you paid over the period. Simply divide your account value by $1,000 (for example, an $8,600 account value divided by $1,000 = 8.6), then multiply the result by the number in the first section under the heading entitled “Expenses Paid During Period” to estimate the expenses you paid on your account during this period.
Hypothetical Example for Comparison Purposes
The second section of the tables below provides information about hypothetical account values and hypothetical expenses based on the actual Fund expense ratio and an assumed rate of return of 5% per year (before expenses), which is not the actual Fund return. The hypothetical account values and expenses may not be used to estimate the actual ending account balance or expenses you paid for the period. You may use this information to compare the ongoing costs of investing in the Fund and other funds. To do so, compare this 5% hypothetical example with the 5% hypothetical examples that appear in the shareholder reports of the other funds.
Please note that the expenses shown in the tables are meant to highlight your ongoing costs only and do not reflect any transactional costs, such as sales charges (loads). Therefore, the second section of the tables is useful in comparing ongoing costs only, and will not help you determine the relative total costs of owning different funds. In addition, if these transactional costs were included, your costs would be higher.
Calvert Global Energy Solutions Fund
| | Beginning
Account Value
(4/1/23) | Ending
Account Value
(9/30/23) | Expenses Paid
During Period*
(4/1/23 – 9/30/23) | Annualized
Expense
Ratio |
| Actual | | | | |
| Class A | $1,000.00 | $ 890.00 | $ 5.88** | 1.24% |
| Class C | $1,000.00 | $ 887.30 | $ 9.42** | 1.99% |
| Class I | $1,000.00 | $ 891.00 | $ 4.69** | 0.99% |
| Hypothetical | | | | |
| (5% return per year before expenses) | | | | |
| Class A | $1,000.00 | $1,018.85 | $ 6.28** | 1.24% |
| Class C | $1,000.00 | $1,015.09 | $10.05 ** | 1.99% |
| Class I | $1,000.00 | $1,020.10 | $ 5.01** | 0.99% |
| * | Expenses are equal to the Fund's annualized expense ratio for the indicated Class, multiplied by the average account value over the period, multiplied by 183/365 (to reflect the one-half year period). The Example assumes that the $1,000 was invested at the net asset value per share determined at the close of business on March 31, 2023. |
| ** | Absent a waiver and/or reimbursement of expenses by affiliate(s), expenses would be higher. |
Calvert
Global Energy Solutions Fund
Global Water Fund
September 30, 2023
Fund Expenses — continued
Calvert Global Water Fund
| | Beginning
Account Value
(4/1/23) | Ending
Account Value
(9/30/23) | Expenses Paid
During Period*
(4/1/23 – 9/30/23) | Annualized
Expense
Ratio |
| Actual | | | | |
| Class A | $1,000.00 | $ 954.70 | $ 6.08** | 1.24% |
| Class C | $1,000.00 | $ 951.10 | $ 9.73** | 1.99% |
| Class I | $1,000.00 | $ 956.10 | $ 4.85** | 0.99% |
| Hypothetical | | | | |
| (5% return per year before expenses) | | | | |
| Class A | $1,000.00 | $1,018.85 | $ 6.28** | 1.24% |
| Class C | $1,000.00 | $1,015.09 | $10.05 ** | 1.99% |
| Class I | $1,000.00 | $1,020.10 | $ 5.01** | 0.99% |
| * | Expenses are equal to the Fund's annualized expense ratio for the indicated Class, multiplied by the average account value over the period, multiplied by 183/365 (to reflect the one-half year period). The Example assumes that the $1,000 was invested at the net asset value per share determined at the close of business on March 31, 2023. |
| ** | Absent a waiver and/or reimbursement of expenses by affiliate(s), expenses would be higher. |
Calvert
Global Energy Solutions Fund
September 30, 2023
| Security | Shares | Value |
| Austria — 0.8% | |
| Verbund AG | | 16,756 | $ 1,363,128 |
| | | | $ 1,363,128 |
| Belgium — 0.6% | |
| Umicore S.A. | | 42,021 | $ 994,913 |
| | | | $ 994,913 |
| Brazil — 0.7% | |
| Sao Martinho S.A. | | 153,652 | $ 1,200,103 |
| | | | $ 1,200,103 |
| Canada — 4.5% | |
| Algonquin Power & Utilities Corp.(1) | | 180,327 | $ 1,067,424 |
| Boralex, Inc., Class A | | 51,298 | 1,102,062 |
| Brookfield Renewable Partners L.P. | | 55,941 | 1,216,158 |
| Canadian Solar, Inc.(1)(2) | | 33,738 | 830,292 |
| Innergex Renewable Energy, Inc.(1) | | 121,829 | 912,204 |
| Northland Power, Inc.(1) | | 71,414 | 1,163,024 |
| TransAlta Renewables, Inc. | | 118,724 | 1,074,263 |
| | | | $ 7,365,427 |
| Chile — 0.7% | |
| Sociedad Quimica y Minera de Chile S.A. ADR | | 19,473 | $ 1,161,954 |
| | | | $ 1,161,954 |
| China — 6.0% | |
| BYD Co., Ltd., Class H | | 38,000 | $ 1,170,788 |
| China Datang Corp. Renewable Power Co., Ltd., Class H | | 4,078,000 | 967,043 |
| China Everbright Environment Group, Ltd. | | 3,123,037 | 1,073,181 |
| Flat Glass Group Co., Ltd., Class H(1) | | 365,000 | 816,583 |
| NIO, Inc. ADR(2) | | 107,785 | 974,376 |
| Xinyi Energy Holdings, Ltd.(1) | | 4,448,000 | 947,710 |
| Xinyi Solar Holdings, Ltd. | | 1,282,000 | 952,989 |
| XPENG, Inc. ADR(2) | | 59,453 | 1,091,557 |
| Yadea Group Holdings, Ltd.(3) | | 456,000 | 844,415 |
| Zhuzhou CRRC Times Electric Co., Ltd. | | 245,900 | 849,323 |
| | | | $ 9,687,965 |
| Denmark — 2.7% | |
| Novozymes A/S, Class B | | 24,056 | $ 967,890 |
| Orsted A/S(3) | | 23,254 | 1,265,092 |
| ROCKWOOL International A/S, Class B | | 3,690 | 891,819 |
| Vestas Wind Systems A/S(2) | | 56,344 | 1,205,417 |
| | | | $ 4,330,218 |
| Finland — 0.5% | |
| Neste Oyj(1) | | 25,924 | $ 878,010 |
| | | | $ 878,010 |
| Security | Shares | Value |
| France — 5.6% | |
| Alstom S.A. | | 34,328 | $ 815,880 |
| Cie de Saint-Gobain S.A. | | 18,192 | 1,088,798 |
| Danone S.A. | | 16,385 | 903,760 |
| Dassault Systemes SE | | 23,920 | 888,447 |
| Engie S.A. | | 58,812 | 901,950 |
| Legrand S.A. | | 11,808 | 1,084,993 |
| Neoen S.A.(3) | | 40,768 | 1,185,566 |
| Nexans S.A. | | 11,515 | 933,590 |
| Schneider Electric SE | | 7,693 | 1,267,745 |
| | | | $ 9,070,729 |
| Germany — 8.2% | |
| Bayerische Motoren Werke AG | | 9,012 | $ 915,323 |
| Daimler Truck Holding AG | | 26,953 | 933,227 |
| Deutsche Post AG | | 20,325 | 824,697 |
| Encavis AG(2) | | 78,750 | 1,105,142 |
| Evonik Industries AG | | 49,420 | 901,430 |
| Infineon Technologies AG | | 34,495 | 1,142,500 |
| Mercedes-Benz Group AG | | 13,059 | 908,864 |
| Nordex SE(2) | | 78,050 | 957,612 |
| SGL Carbon SE(1)(2) | | 125,192 | 871,243 |
| Siemens AG | | 8,811 | 1,259,168 |
| Siemens Energy AG(2) | | 81,080 | 1,056,691 |
| SMA Solar Technology AG(2) | | 11,349 | 734,009 |
| VERBIO Vereinigte BioEnergie AG | | 22,959 | 921,448 |
| Vitesco Technologies Group AG(2) | | 10,556 | 854,271 |
| | | | $ 13,385,625 |
| Greece — 0.6% | |
| Terna Energy S.A. | | 61,018 | $ 942,521 |
| | | | $ 942,521 |
| India — 0.5% | |
| Siemens, Ltd. | | 20,185 | $ 889,253 |
| | | | $ 889,253 |
| Ireland — 1.3% | |
| CRH PLC | | 20,139 | $ 1,102,208 |
| Kingspan Group PLC | | 12,850 | 959,679 |
| | | | $ 2,061,887 |
| Italy — 2.8% | |
| Enel SpA | | 141,016 | $ 864,815 |
| ERG SpA(1) | | 42,840 | 1,031,589 |
| Prysmian SpA | | 23,173 | 930,124 |
| Snam SpA(1) | | 185,145 | 868,751 |
| Terna - Rete Elettrica Nazionale | | 115,752 | 870,621 |
| | | | $ 4,565,900 |
| Japan — 5.0% | |
| Azbil Corp.(1) | | 28,300 | $ 864,549 |
| Daikin Industries, Ltd. | | 7,200 | 1,128,756 |
12
See Notes to Financial Statements.
Calvert
Global Energy Solutions Fund
September 30, 2023
Schedule of Investments — continued
| Security | Shares | Value |
| Japan (continued) | |
| Fuji Electric Co., Ltd. | | 24,000 | $ 1,080,855 |
| GS Yuasa Corp.(1) | | 50,000 | 889,927 |
| Mitsubishi Electric Corp. | | 102,900 | 1,271,274 |
| Nidec Corp. | | 18,100 | 835,739 |
| West Holdings Corp. | | 49,400 | 1,060,566 |
| Yokogawa Electric Corp. | | 48,400 | 934,154 |
| | | | $ 8,065,820 |
| Netherlands — 1.0% | |
| Alfen Beheer NV(1)(2)(3) | | 16,007 | $ 675,735 |
| Signify NV(3) | | 33,107 | 888,351 |
| | | | $ 1,564,086 |
| New Zealand — 2.4% | |
| Infratil, Ltd. | | 224,907 | $ 1,376,801 |
| Mercury NZ, Ltd. | | 336,395 | 1,229,160 |
| Meridian Energy, Ltd. | | 415,693 | 1,278,407 |
| | | | $ 3,884,368 |
| Norway — 1.2% | |
| Norsk Hydro ASA | | 171,068 | $ 1,070,516 |
| Scatec ASA(3) | | 157,744 | 925,771 |
| | | | $ 1,996,287 |
| Singapore — 0.6% | |
| City Developments, Ltd. | | 193,500 | $ 933,809 |
| | | | $ 933,809 |
| South Korea — 2.8% | |
| Doosan Fuel Cell Co., Ltd.(1)(2) | | 46,626 | $ 694,518 |
| LG Chem, Ltd. | | 2,960 | 1,083,763 |
| LG Display Co., Ltd.(2) | | 99,088 | 961,705 |
| LG Energy Solution, Ltd.(2) | | 3,068 | 1,081,956 |
| SK IE Technology Co., Ltd.(2)(3) | | 14,128 | 771,880 |
| | | | $ 4,593,822 |
| Spain — 5.2% | |
| Acciona S.A. | | 9,059 | $ 1,153,708 |
| Atlantica Sustainable Infrastructure PLC | | 51,921 | 991,691 |
| Corp. ACCIONA Energias Renovables S.A.(1) | | 39,794 | 1,025,002 |
| EDP Renovaveis S.A.(1) | | 74,632 | 1,222,279 |
| Ence Energia y Celulosa S.A.(1) | | 305,160 | 1,022,431 |
| Iberdrola S.A. | | 79,900 | 893,638 |
| Redeia Corp. S.A. | | 58,361 | 918,096 |
| Solaria Energia y Medio Ambiente S.A.(1)(2) | | 75,565 | 1,166,788 |
| | | | $ 8,393,633 |
| Sweden — 2.8% | |
| AddTech AB, Class B(1) | | 56,652 | $ 904,124 |
| Castellum AB | | 88,952 | 901,665 |
| Fabege AB(1) | | 110,858 | 882,926 |
| Munters Group AB(3) | | 68,809 | 882,601 |
| Security | Shares | Value |
| Sweden (continued) | |
| Nibe Industrier AB, Class B(1) | | 144,312 | $ 943,475 |
| | | | $ 4,514,791 |
| Switzerland — 1.8% | |
| ABB, Ltd. | | 33,209 | $ 1,185,335 |
| Accelleron Industries AG | | 32,754 | 848,998 |
| Landis+Gyr Group AG | | 11,427 | 824,714 |
| | | | $ 2,859,047 |
| Taiwan — 4.2% | |
| Advanced Energy Solution Holding Co., Ltd. | | 42,000 | $ 833,318 |
| Chroma ATE, Inc. | | 108,000 | 926,182 |
| Delta Electronics, Inc. | | 120,000 | 1,208,630 |
| Everlight Electronics Co., Ltd. | | 497,000 | 722,612 |
| Simplo Technology Co., Ltd. | | 100,000 | 1,039,525 |
| Sino-American Silicon Products, Inc. | | 211,000 | 1,029,033 |
| Voltronic Power Technology Corp. | | 23,000 | 1,132,679 |
| | | | $ 6,891,979 |
| Thailand — 0.6% | |
| Energy Absolute PCL NVDR | | 714,700 | $ 997,914 |
| | | | $ 997,914 |
| United Kingdom — 3.5% | |
| Croda International PLC | | 13,583 | $ 811,334 |
| Johnson Matthey PLC | | 51,550 | 1,020,550 |
| Linde PLC | | 2,456 | 914,491 |
| National Grid PLC | | 98,327 | 1,175,927 |
| Smart Metering Systems PLC | | 104,045 | 789,137 |
| United Utilities Group PLC | | 79,205 | 915,214 |
| | | | $ 5,626,653 |
| United States — 32.8% | |
| AAON, Inc. | | 15,233 | $ 866,301 |
| Acuity Brands, Inc. | | 6,076 | 1,034,803 |
| AECOM | | 10,831 | 899,406 |
| AES Corp. (The) | | 53,009 | 805,737 |
| Alaska Air Group, Inc.(2) | | 22,646 | 839,714 |
| Alphabet, Inc., Class A(2) | | 6,980 | 913,403 |
| Ameresco, Inc., Class A(2) | | 19,265 | 742,858 |
| Applied Materials, Inc. | | 6,222 | 861,436 |
| Aptiv PLC(2) | | 11,629 | 1,146,503 |
| Array Technologies, Inc.(2) | | 52,541 | 1,165,885 |
| Autodesk, Inc.(2) | | 4,282 | 885,989 |
| Bloom Energy Corp., Class A(1)(2) | | 69,218 | 917,831 |
| BorgWarner, Inc. | | 29,254 | 1,180,984 |
| Brookfield Renewable Corp., Class A(1) | | 46,621 | 1,116,107 |
| ChargePoint Holdings, Inc.(1)(2) | | 137,188 | 681,824 |
| Clearway Energy, Inc., Class C | | 50,976 | 1,078,652 |
| Cummins, Inc. | | 4,132 | 943,997 |
| Eaton Corp. PLC | | 5,703 | 1,216,336 |
| Emerson Electric Co. | | 12,795 | 1,235,613 |
13
See Notes to Financial Statements.
Calvert
Global Energy Solutions Fund
September 30, 2023
Schedule of Investments — continued
| Security | Shares | Value |
| United States (continued) | |
| EnerSys | | 10,352 | $ 980,024 |
| Enphase Energy, Inc.(2) | | 9,995 | 1,200,899 |
| Equinix, Inc. | | 1,216 | 883,132 |
| FedEx Corp. | | 3,641 | 964,574 |
| First Solar, Inc.(2) | | 6,784 | 1,096,226 |
| General Mills, Inc. | | 14,047 | 898,867 |
| Gibraltar Industries, Inc.(2) | | 11,833 | 798,846 |
| Hannon Armstrong Sustainable Infrastructure Capital, Inc.(1) | | 42,488 | 900,746 |
| Hubbell, Inc. | | 3,897 | 1,221,359 |
| International Business Machines Corp. | | 6,473 | 908,162 |
| Itron, Inc.(2) | | 13,602 | 824,009 |
| Johnson Controls International PLC | | 20,776 | 1,105,491 |
| Livent Corp.(2) | | 50,003 | 920,555 |
| Microsoft Corp. | | 2,885 | 910,939 |
| MYR Group, Inc.(2) | | 7,098 | 956,526 |
| NextEra Energy Partners, L.P. | | 26,933 | 799,910 |
| NextEra Energy, Inc. | | 14,228 | 815,122 |
| ON Semiconductor Corp.(2) | | 14,077 | 1,308,457 |
| Ormat Technologies, Inc. | | 17,413 | 1,217,517 |
| Owens Corning | | 7,558 | 1,030,987 |
| Plug Power, Inc.(1)(2) | | 130,430 | 991,268 |
| Power Integrations, Inc. | | 13,101 | 999,737 |
| Quanta Services, Inc. | | 4,529 | 847,240 |
| Rockwell Automation, Inc. | | 3,864 | 1,104,602 |
| SolarEdge Technologies, Inc.(2) | | 7,299 | 945,293 |
| Stanley Black & Decker, Inc. | | 10,070 | 841,651 |
| SunPower Corp.(1)(2) | | 142,945 | 881,971 |
| Sunrun, Inc.(1)(2) | | 82,575 | 1,037,142 |
| Tesla, Inc.(2) | | 6,005 | 1,502,571 |
| Trane Technologies PLC | | 6,024 | 1,222,330 |
| Universal Display Corp. | | 7,097 | 1,114,158 |
| Vicor Corp.(2) | | 14,079 | 829,112 |
| Waste Management, Inc. | | 6,062 | 924,091 |
| Whirlpool Corp. | | 6,791 | 907,957 |
| Wolfspeed, Inc.(1)(2) | | 23,550 | 897,255 |
| | | | $ 53,322,105 |
Total Common Stocks
(identified cost $191,842,800) | | | $161,541,947 |
| High Social Impact Investments — 0.1% |
| Security | Principal
Amount
(000's omitted) | Value |
| Calvert Impact Capital, Inc., Community Investment Notes, 1.50%, 12/15/23(4)(5) | $ | 200 | $ 197,258 |
Total High Social Impact Investments
(identified cost $200,000) | | | $ 197,258 |
| Short-Term Investments — 7.4% |
| Affiliated Fund — 0.3% |
| Security | Shares | Value |
| Morgan Stanley Institutional Liquidity Funds - Government Portfolio, Institutional Class, 5.27%(6) | | 551,742 | $ 551,742 |
Total Affiliated Fund
(identified cost $551,742) | | | $ 551,742 |
| Securities Lending Collateral — 7.1% |
| Security | Shares | Value |
| State Street Navigator Securities Lending Government Money Market Portfolio, 5.36%(7) | | 11,519,800 | $ 11,519,800 |
Total Securities Lending Collateral
(identified cost $11,519,800) | | | $ 11,519,800 |
Total Short-Term Investments
(identified cost $12,071,542) | | | $ 12,071,542 |
| | | |
Total Investments — 106.9%
(identified cost $204,114,342) | | $ 173,810,747 |
| Other Assets, Less Liabilities — (6.9)% | | $ (11,180,667) |
| Net Assets — 100.0% | | $ 162,630,080 |
| The percentage shown for each investment category in the Schedule of Investments is based on net assets. |
| (1) | All or a portion of this security was on loan at September 30, 2023. The aggregate market value of securities on loan at September 30, 2023 was $18,472,002. |
| (2) | Non-income producing security. |
| (3) | Security exempt from registration under Rule 144A of the Securities Act of 1933, as amended. These securities may be sold in certain transactions in reliance on an exemption from registration (normally to qualified institutional buyers). At September 30, 2023, the aggregate value of these securities is $7,439,411 or 4.6% of the Fund's net assets. |
| (4) | May be deemed to be an affiliated company (see Note 7). |
| (5) | Restricted security. Total market value of restricted securities amounts to $197,258, which represents 0.1% of the net assets of the Fund as of September 30, 2023. |
| (6) | May be deemed to be an affiliated investment company. The rate shown is the annualized seven-day yield as of September 30, 2023. |
| (7) | Represents investment of cash collateral received in connection with securities lending. |
14
See Notes to Financial Statements.
Calvert
Global Energy Solutions Fund
September 30, 2023
Schedule of Investments — continued
At September 30, 2023, the concentration of the Fund’s investments in the various sectors, determined as a percentage of net assets, was as follows:
| Economic Sectors | % of Net Assets |
| Industrials | 38.6% |
| Utilities | 24.4 |
| Information Technology | 15.9 |
| Materials | 7.1 |
| Consumer Discretionary | 7.1 |
| Real Estate | 2.2 |
| Consumer Staples | 1.8 |
| Energy | 1.1 |
| Communication Services | 0.6 |
| Financials | 0.6 |
| High Social Impact Investments | 0.1 |
| Total | 99.5% |
Restricted Securities
| Description | Acquisition Date | Cost |
| Calvert Impact Capital, Inc., Community Investment Notes, 1.50%, 12/15/23 | 12/14/20 | $200,000 |
| Abbreviations: |
| ADR | – American Depositary Receipt |
| NVDR | – Non-Voting Depository Receipt |
| PCL | – Public Company Limited |
15
See Notes to Financial Statements.
Calvert
Global Water Fund
September 30, 2023
| Security | Shares | Value |
| Australia — 2.5% | |
| Reece, Ltd.(1) | | 382,896 | $ 4,557,742 |
| Reliance Worldwide Corp., Ltd. | | 3,369,658 | 8,374,015 |
| | | | $ 12,931,757 |
| Brazil — 3.0% | |
| Cia de Saneamento Basico do Estado de Sao Paulo (SABESP) ADR(1) | | 739,448 | $ 8,962,110 |
| Cia de Saneamento de Minas Gerais Copasa MG | | 1,866,492 | 6,427,664 |
| | | | $ 15,389,774 |
| Canada — 1.1% | |
| Gildan Activewear, Inc.(1) | | 99,471 | $ 2,788,044 |
| Stantec, Inc.(1) | | 44,412 | 2,881,671 |
| | | | $ 5,669,715 |
| Chile — 1.2% | |
| Aguas Andinas S.A., Class A | | 20,695,152 | $ 6,240,623 |
| | | | $ 6,240,623 |
| China — 5.2% | |
| Beijing Enterprises Water Group, Ltd. | | 30,713,452 | $ 6,685,119 |
| China Everbright Environment Group, Ltd. | | 8,123,666 | 2,791,566 |
| China Lesso Group Holdings, Ltd. | | 7,254,578 | 3,850,308 |
| China Water Affairs Group, Ltd. | | 8,656,421 | 5,593,563 |
| Guangdong Investment, Ltd. | | 10,199,427 | 7,773,887 |
| | | | $ 26,694,443 |
| Denmark — 0.5% | |
| Novozymes A/S, Class B | | 68,161 | $ 2,742,448 |
| | | | $ 2,742,448 |
| Finland — 2.6% | |
| Kemira Oyj | | 558,259 | $ 8,680,215 |
| Uponor Oyj | | 154,477 | 4,635,750 |
| | | | $ 13,315,965 |
| France — 3.9% | |
| Accor S.A. | | 82,500 | $ 2,774,839 |
| Eurofins Scientific SE(1) | | 48,028 | 2,706,722 |
| L'Oreal S.A. | | 6,662 | 2,760,813 |
| LVMH Moet Hennessy Louis Vuitton SE | | 3,490 | 2,634,358 |
| Veolia Environnement S.A. | | 329,948 | 9,537,525 |
| | | | $ 20,414,257 |
| Germany — 1.1% | |
| GEA Group AG | | 74,998 | $ 2,764,003 |
| Henkel AG & Co. KGaA, PFC Shares | | 38,602 | 2,748,828 |
| | | | $ 5,512,831 |
| Italy — 1.6% | |
| ACEA SpA(1) | | 325,137 | $ 3,536,231 |
| Security | Shares | Value |
| Italy (continued) | |
| Interpump Group SpA(1) | | 102,166 | $ 4,673,507 |
| | | | $ 8,209,738 |
| Japan — 7.9% | |
| Ebara Corp. | | 107,456 | $ 5,027,538 |
| Hulic Reit, Inc. | | 2,656 | 2,831,977 |
| Kurita Water Industries, Ltd. | | 251,442 | 8,749,882 |
| Lixil Corp.(1) | | 773,500 | 8,989,397 |
| Organo Corp.(1) | | 280,100 | 7,854,839 |
| Sekisui Chemical Co., Ltd. | | 192,900 | 2,775,243 |
| TOTO, Ltd.(1) | | 189,800 | 4,897,753 |
| | | | $ 41,126,629 |
| Mexico — 0.9% | |
| Orbia Advance Corp. SAB de CV | | 2,154,500 | $ 4,472,805 |
| | | | $ 4,472,805 |
| Netherlands — 1.4% | |
| Aalberts NV | | 126,749 | $ 4,624,874 |
| Arcadis NV | | 63,134 | 2,832,672 |
| | | | $ 7,457,546 |
| Singapore — 1.1% | |
| CDL Hospitality Trusts(1) | | 3,884,901 | $ 2,947,457 |
| City Developments, Ltd. | | 599,000 | 2,890,705 |
| Hyflux, Ltd.(1)(2)(3) | | 16,595,483 | 0 |
| | | | $ 5,838,162 |
| South Korea — 1.0% | |
| Coway Co., Ltd. | | 90,653 | $ 2,767,499 |
| LG Chem, Ltd. | | 6,717 | 2,459,337 |
| | | | $ 5,226,836 |
| Spain — 1.1% | |
| Acciona S.A.(1) | | 20,705 | $ 2,636,883 |
| Iberdrola S.A. | | 249,079 | 2,785,811 |
| | | | $ 5,422,694 |
| Sweden — 0.5% | |
| Fabege AB(1) | | 345,586 | $ 2,752,412 |
| | | | $ 2,752,412 |
| Switzerland — 4.9% | |
| Belimo Holding AG | | 10,328 | $ 4,901,614 |
| Geberit AG | | 11,966 | 5,967,176 |
| Georg Fischer AG | | 84,291 | 4,733,645 |
| Roche Holding AG PC | | 10,054 | 2,744,752 |
| Sika AG | | 10,432 | 2,643,059 |
| Sulzer AG | | 46,592 | 4,443,591 |
| | | | $ 25,433,837 |
16
See Notes to Financial Statements.
Calvert
Global Water Fund
September 30, 2023
Schedule of Investments — continued
| Security | Shares | Value |
| Taiwan — 0.5% | |
| Taiwan Semiconductor Manufacturing Co., Ltd. | | 172,294 | $ 2,809,466 |
| | | | $ 2,809,466 |
| United Kingdom — 8.9% | |
| CNH Industrial NV | | 215,015 | $ 2,601,681 |
| Croda International PLC | | 42,344 | 2,529,274 |
| Ferguson PLC | | 40,986 | 6,740,967 |
| Genuit Group PLC | | 1,083,913 | 4,338,776 |
| Halma PLC | | 109,060 | 2,569,531 |
| Mondi PLC | | 177,949 | 2,968,519 |
| Pennon Group PLC | | 970,081 | 6,925,772 |
| Severn Trent PLC | | 301,742 | 8,700,310 |
| United Utilities Group PLC | | 775,677 | 8,962,948 |
| | | | $ 46,337,778 |
| United States — 48.6% | |
| Advanced Drainage Systems, Inc. | | 45,076 | $ 5,131,002 |
| Agilent Technologies, Inc. | | 24,506 | 2,740,262 |
| American States Water Co. | | 98,744 | 7,769,178 |
| American Water Works Co., Inc. | | 76,101 | 9,423,587 |
| Badger Meter, Inc. | | 60,774 | 8,743,555 |
| Ball Corp. | | 53,700 | 2,673,186 |
| Brookfield Renewable Corp., Class A | | 106,008 | 2,537,832 |
| California Water Service Group | | 164,023 | 7,759,928 |
| Chemed Corp. | | 11,113 | 5,775,426 |
| CMS Energy Corp. | | 52,730 | 2,800,490 |
| Core & Main, Inc., Class A(3) | | 154,896 | 4,468,750 |
| Cousins Properties, Inc. | | 126,081 | 2,568,270 |
| Danaher Corp. | | 11,181 | 2,774,006 |
| Ecolab, Inc. | | 69,566 | 11,784,480 |
| Energy Recovery, Inc.(3) | | 319,903 | 6,785,143 |
| Entegris, Inc. | | 29,258 | 2,747,619 |
| Essential Utilities, Inc. | | 257,583 | 8,842,824 |
| FMC Corp. | | 34,361 | 2,301,156 |
| Fortune Brands Innovations, Inc. | | 83,712 | 5,203,538 |
| Franklin Electric Co., Inc. | | 54,349 | 4,849,561 |
| Gorman-Rupp Co. (The) | | 130,582 | 4,296,148 |
| Hawkins, Inc. | | 135,578 | 7,978,765 |
| IDEXX Laboratories, Inc.(3) | | 5,794 | 2,533,542 |
| Ingersoll Rand, Inc. | | 42,564 | 2,712,178 |
| Intel Corp. | | 84,317 | 2,997,469 |
| Itron, Inc.(3) | | 43,311 | 2,623,780 |
| Levi Strauss & Co., Class A(1) | | 214,252 | 2,909,542 |
| Lindsay Corp. | | 36,720 | 4,321,210 |
| Masco Corp. | | 102,415 | 5,474,082 |
| MasterBrand, Inc.(3) | | 367,558 | 4,465,830 |
| Middlesex Water Co. | | 98,700 | 6,538,875 |
| Mondelez International, Inc., Class A | | 41,579 | 2,885,583 |
| Mueller Industries, Inc. | | 68,781 | 5,169,580 |
| Mueller Water Products, Inc., Class A | | 346,176 | 4,389,512 |
| Nucor Corp. | | 17,216 | 2,691,722 |
| Security | Shares | Value |
| United States (continued) | |
| Parker-Hannifin Corp. | | 7,107 | $ 2,768,319 |
| Pentair PLC | | 158,387 | 10,255,558 |
| Procter & Gamble Co. (The) | | 19,197 | 2,800,074 |
| Roper Technologies, Inc. | | 5,937 | 2,875,170 |
| SJW Group | | 118,800 | 7,141,068 |
| Tetra Tech, Inc. | | 68,231 | 10,373,159 |
| Trimble, Inc.(3) | | 54,078 | 2,912,641 |
| Valmont Industries, Inc. | | 21,507 | 5,166,196 |
| Waters Corp.(3) | | 10,552 | 2,893,464 |
| Watts Water Technologies, Inc., Class A | | 53,786 | 9,295,297 |
| Xylem, Inc. | | 116,039 | 10,563,030 |
| York Water Co. (The) | | 161,422 | 6,051,711 |
| Zurn Elkay Water Solutions Corp., Class C | | 334,894 | 9,383,730 |
| | | | $252,147,028 |
Total Common Stocks
(identified cost $439,438,994) | | | $516,146,744 |
| High Social Impact Investments — 0.1% |
| Security | Principal
Amount
(000's omitted) | Value |
| Calvert Impact Capital, Inc., Community Investment Notes, 1.50%, 12/15/23(4)(5) | $ | 630 | $ 621,363 |
Total High Social Impact Investments
(identified cost $630,000) | | | $ 621,363 |
| Short-Term Investments — 2.3% |
| Affiliated Fund — 0.1% |
| Security | Shares | Value |
| Morgan Stanley Institutional Liquidity Funds - Government Portfolio, Institutional Class, 5.27%(6) | | 362,628 | $ 362,628 |
Total Affiliated Fund
(identified cost $362,628) | | | $ 362,628 |
| Securities Lending Collateral — 2.2% |
| Security | Shares | Value |
| State Street Navigator Securities Lending Government Money Market Portfolio, 5.36%(7) | | 11,475,029 | $ 11,475,029 |
Total Securities Lending Collateral
(identified cost $11,475,029) | | | $ 11,475,029 |
Total Short-Term Investments
(identified cost $11,837,657) | | | $ 11,837,657 |
17
See Notes to Financial Statements.
Calvert
Global Water Fund
September 30, 2023
Schedule of Investments — continued
| | | Value |
Total Investments — 101.9%
(identified cost $451,906,651) | | $ 528,605,764 |
| Other Assets, Less Liabilities — (1.9)% | | $ (10,032,493) |
| Net Assets — 100.0% | | $ 518,573,271 |
| The percentage shown for each investment category in the Schedule of Investments is based on net assets. |
| (1) | All or a portion of this security was on loan at September 30, 2023. The aggregate market value of securities on loan at September 30, 2023 was $33,138,387. |
| (2) | For fair value measurement disclosure purposes, security is categorized as Level 3 (see Note 1A). |
| (3) | Non-income producing security. |
| (4) | May be deemed to be an affiliated company (see Note 7). |
| (5) | Restricted security. Total market value of restricted securities amounts to $621,363, which represents 0.1% of the net assets of the Fund as of September 30, 2023. |
| (6) | May be deemed to be an affiliated investment company. The rate shown is the annualized seven-day yield as of September 30, 2023. |
| (7) | Represents investment of cash collateral received in connection with securities lending. |
At September 30, 2023, the concentration of the Fund’s investments in the various sectors, determined as a percentage of net assets, was as follows:
| Economic Sectors | % of Net Assets |
| Industrials | 43.6% |
| Utilities | 27.7 |
| Materials | 10.4 |
| Information Technology | 5.4 |
| Health Care | 4.3 |
| Consumer Discretionary | 3.2 |
| Real Estate | 2.7 |
| Consumer Staples | 2.2 |
| High Social Impact Investments | 0.1 |
| Total | 99.6% |
Restricted Securities
| Description | Acquisition Date | Cost |
| Calvert Impact Capital, Inc., Community Investment Notes, 1.50%, 12/15/23 | 12/14/20 | $630,000 |
| Abbreviations: |
| ADR | – American Depositary Receipt |
| PC | – Participation Certificate |
| PFC Shares | – Preference Shares |
18
See Notes to Financial Statements.
Calvert
Global Energy Solutions Fund
Global Water Fund
September 30, 2023
Statements of Assets and Liabilities
| | September 30, 2023 |
| | Global Energy Solutions Fund | Global Water Fund |
| Assets | | |
| Investments in securities of unaffiliated issuers, at value (identified cost $203,362,600 and $450,914,023, respectively) - including $18,472,002 and $33,138,387, respectively, of securities on loan | $ 173,061,747 | $ 527,621,773 |
| Investments in securities of affiliated issuers, at value (identified cost $751,742 and $992,628, respectively) | 749,000 | 983,991 |
| Cash | 14,426 | — |
| Cash denominated in foreign currency, at value (cost $96,763 and $215,951, respectively) | 96,622 | 214,467 |
| Receivable for capital shares sold | 132,455 | 337,131 |
| Dividends receivable | 227,372 | 1,668,474 |
| Dividends and interest receivable - affiliated | 3,466 | 10,627 |
| Securities lending income receivable | 13,018 | 4,427 |
| Tax reclaims receivable | 183,434 | 420,108 |
| Receivable from affiliates | 33,233 | 35,177 |
| Directors' deferred compensation plan | 51,224 | 265,477 |
| Total assets | $174,565,997 | $531,561,652 |
| Liabilities | | |
| Due to custodian | $ — | $ 67,484 |
| Payable for capital shares redeemed | 79,965 | 499,416 |
| Deposits for securities loaned | 11,519,800 | 11,475,029 |
| Payable to affiliates: | | |
| Investment advisory fee | 104,819 | 320,458 |
| Administrative fee | 16,776 | 53,189 |
| Distribution and service fees | 25,611 | 63,461 |
| Sub-transfer agency fee | 14,081 | 18,579 |
| Directors' deferred compensation plan | 51,224 | 265,477 |
| Accrued expenses | 123,641 | 225,288 |
| Total liabilities | $ 11,935,917 | $ 12,988,381 |
| Net Assets | $162,630,080 | $518,573,271 |
| Sources of Net Assets | | |
| Paid-in capital | $ 205,135,563 | $ 434,423,786 |
| Distributable earnings (accumulated loss) | (42,505,483) | 84,149,485 |
| Net Assets | $162,630,080 | $518,573,271 |
| Class A Shares | | |
| Net Assets | $ 86,112,460 | $ 217,322,253 |
| Shares Outstanding | 8,184,360 | 8,667,345 |
Net Asset Value and Redemption Price Per Share
(net assets ÷ shares of beneficial interest outstanding) | $ 10.52 | $ 25.07 |
Maximum Offering Price Per Share
(100 ÷ 94.75 of net asset value per share) | $ 11.10 | $ 26.46 |
| Class C Shares | | |
| Net Assets | $ 8,151,339 | $ 19,588,117 |
| Shares Outstanding | 835,304 | 853,957 |
Net Asset Value and Offering Price Per Share*
(net assets ÷ shares of beneficial interest outstanding) | $ 9.76 | $ 22.94 |
19
See Notes to Financial Statements.
Calvert
Global Energy Solutions Fund
Global Water Fund
September 30, 2023
Statements of Assets and Liabilities — continued
| | September 30, 2023 |
| | Global Energy Solutions Fund | Global Water Fund |
| Class I Shares | | |
| Net Assets | $ 68,366,281 | $ 281,662,901 |
| Shares Outstanding | 6,381,106 | 11,143,357 |
Net Asset Value, Offering Price and Redemption Price Per Share
(net assets ÷ shares of beneficial interest outstanding) | $ 10.71 | $ 25.28 |
| On sales of $50,000 or more, the offering price of Class A shares is reduced. |
| * | Redemption price per share is equal to the net asset value less any applicable contingent deferred sales charge. |
20
See Notes to Financial Statements.
Calvert
Global Energy Solutions Fund
Global Water Fund
September 30, 2023
| | Year Ended September 30, 2023 |
| | Global Energy Solutions Fund | Global Water Fund |
| Investment Income | | |
| Dividend income (net of foreign taxes withheld of $435,648 and $875,825, respectively) | $ 3,774,553 | $ 13,101,417 |
| Dividend income - affiliated issuers | 12,504 | 23,809 |
| Interest and other income | 2,116 | 2,818 |
| Interest income - affiliated issuers | 3,000 | 9,450 |
| Securities lending income, net | 74,027 | 60,779 |
| Total investment income | $ 3,866,200 | $13,198,273 |
| Expenses | | |
| Investment advisory fee | $ 1,342,627 | $ 3,906,529 |
| Administrative fee | 214,820 | 648,262 |
| Distribution and service fees: | | |
| Class A | 237,354 | 568,679 |
| Class C | 93,950 | 234,188 |
| Directors' fees and expenses | 12,288 | 36,889 |
| Custodian fees | 35,360 | 50,179 |
| Transfer agency fees and expenses | 288,794 | 632,534 |
| Accounting fees | 57,798 | 132,458 |
| Professional fees | 40,820 | 60,327 |
| Registration fees | 58,230 | 62,196 |
| Reports to shareholders | 31,845 | 63,684 |
| Miscellaneous | 38,042 | 43,280 |
| Total expenses | $ 2,451,928 | $ 6,439,205 |
| Waiver and/or reimbursement of expenses by affiliates | $ (341,052) | $ (284,602) |
| Net expenses | $ 2,110,876 | $ 6,154,603 |
| Net investment income | $ 1,755,324 | $ 7,043,670 |
| Realized and Unrealized Gain (Loss) | | |
| Net realized gain (loss): | | |
| Investment securities (net of foreign capital gains taxes of $111 and $0, respectively) | $ 8,827,879 | $ 9,069,234 |
| Foreign currency transactions | 51,163 | 137,071 |
| Net realized gain | $ 8,879,042 | $ 9,206,305 |
| Change in unrealized appreciation (depreciation): | | |
| Investment securities | $ 1,377,381 | $ 58,850,295 |
| Investment securities - affiliated issuers | 11,506 | 36,244 |
| Foreign currency | 13,017 | 37,556 |
| Net change in unrealized appreciation (depreciation) | $ 1,401,904 | $58,924,095 |
| Net realized and unrealized gain | $10,280,946 | $68,130,400 |
| Net increase in net assets from operations | $12,036,270 | $75,174,070 |
21
See Notes to Financial Statements.
Calvert
Global Energy Solutions Fund
Global Water Fund
September 30, 2023
Statements of Changes in Net Assets
| | Global Energy Solutions Fund | Global Water Fund |
| | Year Ended September 30, |
| | 2023 | 2022 | 2023 | 2022 |
| Increase (Decrease) in Net Assets | | | | |
| From operations: | | | | |
| Net investment income | $ 1,755,324 | $ 1,536,699 | $ 7,043,670 | $ 5,096,840 |
| Net realized gain | 8,879,042 | 15,265,961 | 9,206,305 | 8,296,729 |
| Net change in unrealized appreciation (depreciation) | 1,401,904 | (65,970,225) | 58,924,095 | (147,345,197) |
| Net increase (decrease) in net assets from operations | $ 12,036,270 | $ (49,167,565) | $ 75,174,070 | $(133,951,628) |
| Distributions to shareholders: | | | | |
| Class A | $ (595,608) | $ (270,586) | $ (3,151,056) | $ (2,493,300) |
| Class C | — | — | (165,691) | (110,783) |
| Class I | (647,981) | (624,496) | (4,669,943) | (3,511,660) |
| Total distributions to shareholders | $ (1,243,589) | $ (895,082) | $ (7,986,690) | $ (6,115,743) |
| Capital share transactions: | | | | |
| Class A | $ 967,655 | $ 3,598,277 | $ (7,351,512) | $ 9,262,072 |
| Class C | (779,179) | (173,839) | (7,194,736) | (10,578,890) |
| Class I | (4,844,523) | (22,286,670) | 1,128,518 | 42,992,587 |
| Net increase (decrease) in net assets from capital share transactions | $ (4,656,047) | $ (18,862,232) | $ (13,417,730) | $ 41,675,769 |
| Net increase (decrease) in net assets | $ 6,136,634 | $ (68,924,879) | $ 53,769,650 | $ (98,391,602) |
| Net Assets | | | | |
| At beginning of year | $ 156,493,446 | $ 225,418,325 | $ 464,803,621 | $ 563,195,223 |
| At end of year | $162,630,080 | $156,493,446 | $518,573,271 | $ 464,803,621 |
22
See Notes to Financial Statements.
Calvert
Global Energy Solutions Fund
September 30, 2023
| | Global Energy Solutions Fund — Class A |
| | Year Ended September 30, |
| | 2023 | 2022 | 2021 | 2020 | 2019 |
| Net asset value — Beginning of year | $ 9.86 | $ 12.79 | $ 9.54 | $ 7.08 | $ 6.95 |
| Income (Loss) From Operations | | | | | |
| Net investment income(1) | $ 0.11 | $ 0.08 | $ 0.06 | $ 0.06 | $ 0.08 |
| Net realized and unrealized gain (loss) | 0.62 | (2.98) | 3.27 | 2.48 | 0.15 |
| Total income (loss) from operations | $ 0.73 | $ (2.90) | $ 3.33 | $ 2.54 | $ 0.23 |
| Less Distributions | | | | | |
| From net investment income | $ (0.07) | $ (0.03) | $ (0.08) | $ (0.08) | $ (0.10) |
| Total distributions | $ (0.07) | $ (0.03) | $ (0.08) | $ (0.08) | $ (0.10) |
| Net asset value — End of year | $ 10.52 | $ 9.86 | $ 12.79 | $ 9.54 | $ 7.08 |
| Total Return(2) | 7.38% | (22.71)% | 35.00% | 36.12% | 3.60% |
| Ratios/Supplemental Data | | | | | |
| Net assets, end of year (000’s omitted) | $86,112 | $79,841 | $100,038 | $62,428 | $47,596 |
| Ratios (as a percentage of average daily net assets):(3) | | | | | |
| Total expenses | 1.43% | 1.40% | 1.42% | 1.54% | 1.72% |
| Net expenses | 1.24% (4) | 1.24% (4) | 1.24% | 1.24% | 1.26% |
| Net investment income | 0.93% | 0.65% | 0.48% | 0.76% | 1.27% |
| Portfolio Turnover | 42% | 43% | 50% | 45% | 40% |
| (1) | Computed using average shares outstanding. |
| (2) | Returns are historical and are calculated by determining the percentage change in net asset value with all distributions reinvested and do not reflect the effect of sales charges, if any. |
| (3) | Total expenses do not reflect amounts reimbursed and/or waived by the adviser and certain of its affiliates, if applicable. Net expenses are net of all reductions and represent the net expenses paid by the Fund. |
| (4) | Includes a reduction by the investment adviser of a portion of its advisory fee due to the Fund’s investment in the Liquidity Fund (equal to less than 0.005% of average daily net assets for the years ended September 30, 2023 and 2022). |
23
See Notes to Financial Statements.
Calvert
Global Energy Solutions Fund
September 30, 2023
Financial Highlights — continued
| | Global Energy Solutions Fund — Class C |
| | Year Ended September 30, |
| | 2023 | 2022 | 2021 | 2020 | 2019 |
| Net asset value — Beginning of year | $ 9.15 | $ 11.93 | $ 8.92 | $ 6.63 | $ 6.50 |
| Income (Loss) From Operations | | | | | |
| Net investment income (loss)(1) | $ 0.02 | $ (0.01) | $ (0.03) | $ (0.00)(2) | $ 0.02 |
| Net realized and unrealized gain (loss) | 0.59 | (2.77) | 3.06 | 2.32 | 0.16 |
| Total income (loss) from operations | $ 0.61 | $ (2.78) | $ 3.03 | $ 2.32 | $ 0.18 |
| Less Distributions | | | | | |
| From net investment income | $ — | $ — | $ (0.02) | $ (0.03) | $ (0.05) |
| Total distributions | $ — | $ — | $ (0.02) | $ (0.03) | $ (0.05) |
| Net asset value — End of year | $ 9.76 | $ 9.15 | $ 11.93 | $ 8.92 | $ 6.63 |
| Total Return(3) | 6.67% | (23.30)% | 33.93% | 35.03% | 2.85% |
| Ratios/Supplemental Data | | | | | |
| Net assets, end of year (000’s omitted) | $8,151 | $ 8,304 | $11,009 | $ 7,841 | $6,752 |
| Ratios (as a percentage of average daily net assets):(4) | | | | | |
| Total expenses | 2.18% | 2.16% | 2.17% | 2.29% | 2.48% |
| Net expenses | 1.99% (5) | 1.99% (5) | 1.99% | 1.99% | 2.01% |
| Net investment income (loss) | 0.17% | (0.11)% | (0.27)% | (0.01)% | 0.38% |
| Portfolio Turnover | 42% | 43% | 50% | 45% | 40% |
| (1) | Computed using average shares outstanding. |
| (2) | Amount is less than $(0.005). |
| (3) | Returns are historical and are calculated by determining the percentage change in net asset value with all distributions reinvested and do not reflect the effect of sales charges, if any. |
| (4) | Total expenses do not reflect amounts reimbursed and/or waived by the adviser and certain of its affiliates, if applicable. Net expenses are net of all reductions and represent the net expenses paid by the Fund. |
| (5) | Includes a reduction by the investment adviser of a portion of its advisory fee due to the Fund’s investment in the Liquidity Fund (equal to less than 0.005% of average daily net assets for the years ended September 30, 2023 and 2022). |
24
See Notes to Financial Statements.
Calvert
Global Energy Solutions Fund
September 30, 2023
Financial Highlights — continued
| | Global Energy Solutions Fund — Class I |
| | Year Ended September 30, |
| | 2023 | 2022 | 2021 | 2020 | 2019 |
| Net asset value — Beginning of year | $ 10.03 | $ 13.01 | $ 9.70 | $ 7.20 | $ 7.07 |
| Income (Loss) From Operations | | | | | |
| Net investment income(1) | $ 0.13 | $ 0.11 | $ 0.10 | $ 0.08 | $ 0.11 |
| Net realized and unrealized gain (loss) | 0.64 | (3.02) | 3.31 | 2.52 | 0.14 |
| Total income (loss) from operations | $ 0.77 | $ (2.91) | $ 3.41 | $ 2.60 | $ 0.25 |
| Less Distributions | | | | | |
| From net investment income | $ (0.09) | $ (0.07) | $ (0.10) | $ (0.10) | $ (0.12) |
| Total distributions | $ (0.09) | $ (0.07) | $ (0.10) | $ (0.10) | $ (0.12) |
| Net asset value — End of year | $ 10.71 | $ 10.03 | $ 13.01 | $ 9.70 | $ 7.20 |
| Total Return(2) | 7.69% | (22.52)% | 35.28% | 36.40% | 3.89% |
| Ratios/Supplemental Data | | | | | |
| Net assets, end of year (000’s omitted) | $68,366 | $68,349 | $114,371 | $45,676 | $23,867 |
| Ratios (as a percentage of average daily net assets):(3) | | | | | |
| Total expenses | 1.18% | 1.15% | 1.17% | 1.29% | 1.47% |
| Net expenses | 0.99% (4) | 0.99% (4) | 0.99% | 0.99% | 0.98% |
| Net investment income | 1.15% | 0.88% | 0.80% | 1.08% | 1.60% |
| Portfolio Turnover | 42% | 43% | 50% | 45% | 40% |
| (1) | Computed using average shares outstanding. |
| (2) | Returns are historical and are calculated by determining the percentage change in net asset value with all distributions reinvested and do not reflect the effect of sales charges, if any. |
| (3) | Total expenses do not reflect amounts reimbursed and/or waived by the adviser and certain of its affiliates, if applicable. Net expenses are net of all reductions and represent the net expenses paid by the Fund. |
| (4) | Includes a reduction by the investment adviser of a portion of its advisory fee due to the Fund’s investment in the Liquidity Fund (equal to less than 0.005% of average daily net assets for the years ended September 30, 2023 and 2022). |
25
See Notes to Financial Statements.
Calvert
Global Water Fund
September 30, 2023
| | Global Water Fund — Class A |
| | Year Ended September 30, |
| | 2023 | 2022 | 2021 | 2020 | 2019 |
| Net asset value — Beginning of year | $ 21.93 | $ 28.61 | $ 21.67 | $ 20.70 | $ 20.00 |
| Income (Loss) From Operations | | | | | |
| Net investment income(1) | $ 0.31 | $ 0.22 | $ 0.33 | $ 0.14 | $ 0.23 |
| Net realized and unrealized gain (loss) | 3.19 | (6.62) | 6.80 | 1.02 | 0.70 |
| Total income (loss) from operations | $ 3.50 | $ (6.40) | $ 7.13 | $ 1.16 | $ 0.93 |
| Less Distributions | | | | | |
| From net investment income | $ (0.20) | $ (0.28) | $ (0.19) | $ (0.19) | $ (0.23) |
| From net realized gain | (0.16) | — | — | — | — |
| Total distributions | $ (0.36) | $ (0.28) | $ (0.19) | $ (0.19) | $ (0.23) |
| Net asset value — End of year | $ 25.07 | $ 21.93 | $ 28.61 | $ 21.67 | $ 20.70 |
| Total Return(2) | 16.00% | (22.62)% | 33.05% | 5.57% | 4.86% |
| Ratios/Supplemental Data | | | | | |
| Net assets, end of year (000’s omitted) | $217,322 | $196,323 | $246,978 | $180,956 | $181,139 |
| Ratios (as a percentage of average daily net assets):(3) | | | | | |
| Total expenses | 1.29% | 1.28% | 1.29% | 1.34% | 1.38% |
| Net expenses | 1.24% (4) | 1.24% (4) | 1.24% | 1.24% | 1.25% |
| Net investment income | 1.20% | 0.83% | 1.21% | 0.70% | 1.17% |
| Portfolio Turnover | 30% | 25% | 27% | 35% | 28% |
| (1) | Computed using average shares outstanding. |
| (2) | Returns are historical and are calculated by determining the percentage change in net asset value with all distributions reinvested and do not reflect the effect of sales charges, if any. |
| (3) | Total expenses do not reflect amounts reimbursed and/or waived by the adviser and certain of its affiliates, if applicable. Net expenses are net of all reductions and represent the net expenses paid by the Fund. |
| (4) | Includes a reduction by the investment adviser of a portion of its advisory fee due to the Fund’s investment in the Liquidity Fund (equal to less than 0.005% of average daily net assets for the years ended September 30, 2023 and 2022). |
26
See Notes to Financial Statements.
Calvert
Global Water Fund
September 30, 2023
Financial Highlights — continued
| | Global Water Fund — Class C |
| | Year Ended September 30, |
| | 2023 | 2022 | 2021 | 2020 | 2019 |
| Net asset value — Beginning of year | $ 20.06 | $ 26.19 | $ 19.84 | $ 18.98 | $ 18.32 |
| Income (Loss) From Operations | | | | | |
| Net investment income (loss)(1) | $ 0.09 | $ 0.00(2) | $ 0.10 | $ (0.02) | $ 0.08 |
| Net realized and unrealized gain (loss) | 2.95 | (6.06) | 6.26 | 0.92 | 0.66 |
| Total income (loss) from operations | $ 3.04 | $ (6.06) | $ 6.36 | $ 0.90 | $ 0.74 |
| Less Distributions | | | | | |
| From net investment income | $ — | $ (0.07) | $ (0.01) | $ (0.04) | $ (0.08) |
| From net realized gain | (0.16) | — | — | — | — |
| Total distributions | $ (0.16) | $ (0.07) | $ (0.01) | $ (0.04) | $ (0.08) |
| Net asset value — End of year | $ 22.94 | $ 20.06 | $ 26.19 | $ 19.84 | $ 18.98 |
| Total Return(3) | 15.16% | (23.20)% | 32.05% | 4.75% | 4.08% |
| Ratios/Supplemental Data | | | | | |
| Net assets, end of year (000’s omitted) | $19,588 | $23,291 | $41,631 | $39,358 | $50,369 |
| Ratios (as a percentage of average daily net assets):(4) | | | | | |
| Total expenses | 2.04% | 2.03% | 2.04% | 2.09% | 2.13% |
| Net expenses | 1.99% (5) | 1.99% (5) | 1.99% | 1.99% | 2.01% |
| Net investment income (loss) | 0.40% | 0.02% | 0.42% | (0.08)% | 0.43% |
| Portfolio Turnover | 30% | 25% | 27% | 35% | 28% |
| (1) | Computed using average shares outstanding. |
| (2) | Amount is less than $0.005. |
| (3) | Returns are historical and are calculated by determining the percentage change in net asset value with all distributions reinvested and do not reflect the effect of sales charges, if any. |
| (4) | Total expenses do not reflect amounts reimbursed and/or waived by the adviser and certain of its affiliates, if applicable. Net expenses are net of all reductions and represent the net expenses paid by the Fund. |
| (5) | Includes a reduction by the investment adviser of a portion of its advisory fee due to the Fund’s investment in the Liquidity Fund (equal to less than 0.005% of average daily net assets for the years ended September 30, 2023 and 2022). |
27
See Notes to Financial Statements.
Calvert
Global Water Fund
September 30, 2023
Financial Highlights — continued
| | Global Water Fund — Class I |
| | Year Ended September 30, |
| | 2023 | 2022 | 2021 | 2020 | 2019 |
| Net asset value — Beginning of year | $ 22.11 | $ 28.84 | $ 21.83 | $ 20.85 | $ 20.15 |
| Income (Loss) From Operations | | | | | |
| Net investment income(1) | $ 0.38 | $ 0.30 | $ 0.40 | $ 0.20 | $ 0.29 |
| Net realized and unrealized gain (loss) | 3.22 | (6.68) | 6.86 | 1.02 | 0.70 |
| Total income (loss) from operations | $ 3.60 | $ (6.38) | $ 7.26 | $ 1.22 | $ 0.99 |
| Less Distributions | | | | | |
| From net investment income | $ (0.27) | $ (0.35) | $ (0.25) | $ (0.24) | $ (0.29) |
| From net realized gain | (0.16) | — | — | — | — |
| Total distributions | $ (0.43) | $ (0.35) | $ (0.25) | $ (0.24) | $ (0.29) |
| Net asset value — End of year | $ 25.28 | $ 22.11 | $ 28.84 | $ 21.83 | $ 20.85 |
| Total Return(2) | 16.32% | (22.44)% | 33.41% | 5.83% | 5.18% |
| Ratios/Supplemental Data | | | | | |
| Net assets, end of year (000’s omitted) | $281,663 | $245,189 | $274,586 | $189,141 | $179,839 |
| Ratios (as a percentage of average daily net assets):(3) | | | | | |
| Total expenses | 1.04% | 1.03% | 1.04% | 1.09% | 1.13% |
| Net expenses | 0.99% (4) | 0.99% (4) | 0.99% | 0.99% | 0.97% |
| Net investment income | 1.46% | 1.11% | 1.47% | 0.97% | 1.48% |
| Portfolio Turnover | 30% | 25% | 27% | 35% | 28% |
| (1) | Computed using average shares outstanding. |
| (2) | Returns are historical and are calculated by determining the percentage change in net asset value with all distributions reinvested and do not reflect the effect of sales charges, if any. |
| (3) | Total expenses do not reflect amounts reimbursed and/or waived by the adviser and certain of its affiliates, if applicable. Net expenses are net of all reductions and represent the net expenses paid by the Fund. |
| (4) | Includes a reduction by the investment adviser of a portion of its advisory fee due to the Fund’s investment in the Liquidity Fund (equal to less than 0.005% of average daily net assets for the years ended September 30, 2023 and 2022). |
28
See Notes to Financial Statements.
Calvert
Global Energy Solutions Fund
Global Water Fund
September 30, 2023
Notes to Financial Statements
1 Significant Accounting Policies
Calvert Global Energy Solutions Fund (Global Energy Solutions) and Calvert Global Water Fund (Global Water) (each a Fund and collectively, the Funds) are diversified series of Calvert Impact Fund, Inc. (the Corporation). The Corporation is a Maryland corporation registered under the Investment Company Act of 1940, as amended (the 1940 Act), as an open-end management investment company. The investment objective of Global Energy Solutions is to seek to track the performance of the Calvert Global Energy Research Index. Global Energy Solutions invests in equity securities of U.S. and non-U.S. companies whose main business is sustainable energy solutions, or that are significantly involved in the sustainable energy solutions industry. The investment objective of Global Water is to seek to track the performance of the Calvert Global Water Research Index. Global Water invests in equity securities of U.S. and non-U.S. companies whose main business is in the water industry, or that are significantly involved in water-related services or technologies.
Each Fund offers three classes of shares. Class A shares are generally sold subject to a sales charge imposed at time of purchase. A contingent deferred sales charge of 1.00% may apply to certain redemptions of Class A shares for accounts for which no sales charge was paid, if redeemed within 12 months of purchase. Class C shares are sold without a front-end sales charge, and with certain exceptions, are charged a contingent deferred sales charge of 1% on shares redeemed within 12 months of purchase. Class C shares are only available for purchase through a financial intermediary. Effective November 5, 2020, Class C shares automatically convert to Class A shares eight years after their purchase as described in the Funds’ prospectus. Class I shares are sold at net asset value, are not subject to a sales charge and are sold only to certain eligible investors. Each class represents a pro rata interest in each Fund, but votes separately on class-specific matters and is subject to different expenses.
Each Fund applies the accounting and reporting guidance in the Financial Accounting Standards Board (FASB) Accounting Standards Codification Topic 946, Financial Services – Investment Companies (ASC 946). Subsequent events, if any, through the date that the financial statements were issued have been evaluated in the preparation of the financial statements.
A Investment Valuation— Net asset value per share is determined every business day as of the close of the regular session of the New York Stock Exchange (generally 4:00 p.m. Eastern time). The Funds use independent pricing services approved by the Board of Directors (the Board) to value their investments wherever possible. Investments for which market quotations are not available or deemed not reliable are fair valued in good faith by the Board's valuation designee.
U.S. generally accepted accounting principles (U.S. GAAP) establishes a disclosure hierarchy that categorizes the inputs to valuation techniques used to value assets and liabilities at measurement date. These inputs are summarized in the three broad levels listed below:
Level 1 – quoted prices in active markets for identical securities
Level 2 – other significant observable inputs (including quoted prices for similar securities, interest rates, prepayment speeds, credit risk, etc.)
Level 3 – significant unobservable inputs (including each Fund's own assumptions in determining the fair value of investments)
The inputs or methodologies used for valuing securities are not necessarily an indication of the risk associated with investing in those securities.
Valuation techniques used to value each Fund’s investments by major category are as follows:
Equity Securities. Equity securities (including warrants and rights) listed on a U.S. securities exchange generally are valued at the last sale or closing price as reported by an independent pricing service on the primary market or exchange on which they are traded and are categorized as Level 1 in the hierarchy. Equity securities listed on the NASDAQ National Market System are valued at the NASDAQ official closing price and are categorized as Level 1 in the hierarchy. Unlisted or listed securities for which closing sales prices or closing quotations are not available are valued at the mean between the latest available bid and ask prices and are categorized as Level 2 in the hierarchy. The daily valuation of exchange-traded foreign securities generally is determined as of the close of trading on the principal exchange on which such securities trade. Events occurring after the close of trading on foreign exchanges may result in adjustments to the valuation of foreign securities to more accurately reflect their fair value as of the close of regular trading on the New York Stock Exchange. When valuing foreign equity securities that meet certain criteria, the Funds' Board has approved the use of a fair value service that values such securities to reflect market trading that occurs after the close of the applicable foreign markets of comparable securities or other instruments that have a strong correlation to the fair-valued securities. Such securities are categorized as Level 2 in the hierarchy.
Debt Securities. Debt securities are generally valued based on valuations provided by third party pricing services, as derived from such services’ pricing models. Inputs to the models may include, but are not limited to, reported trades, executable bid and ask prices, broker/dealer quotations, prices or yields of securities with similar characteristics, interest rates, anticipated prepayments, benchmark curves or information pertaining to the issuer, as well as industry and economic events. Accordingly, debt securities are generally categorized as Level 2 in the hierarchy. Short-term debt securities with a remaining maturity at time of purchase of more than sixty days are valued based on valuations provided by a third party pricing service. Such securities are generally categorized as Level 2 in the hierarchy. Short-term debt securities of sufficient credit quality purchased with remaining maturities of sixty days or less for which a valuation from a third party pricing service is not readily available may be valued at amortized cost, which approximates fair value, and are categorized as Level 2 in the hierarchy.
Other Securities. Investments in management investment companies (including money market funds) that do not trade on an exchange are valued at the net asset value as of the close of each business day and are categorized as Level 1 in the hierarchy.
Calvert
Global Energy Solutions Fund
Global Water Fund
September 30, 2023
Notes to Financial Statements — continued
Fair Valuation. In connection with Rule 2a-5 of the 1940 Act, the Board has designated each Fund’s investment adviser as its valuation designee. Investments for which valuations or market quotations are not readily available or are deemed unreliable are valued by the investment adviser, as valuation designee, at fair value using methods that most fairly reflect the security’s “fair value”, which is the amount that the Funds might reasonably expect to receive for the security upon its current sale in the ordinary course. Each such determination is based on a consideration of relevant factors, which are likely to vary from one pricing context to another. These factors may include, but are not limited to, the type of security, the existence of any contractual restrictions on the security’s disposition, the price and extent of public trading in similar securities of the issuer or of comparable companies or entities, quotations or relevant information obtained from broker/dealers or other market participants, information obtained from the issuer, analysts, and/or the appropriate stock exchange (for exchange-traded securities), an analysis of the company’s or entity’s financial statements, and an evaluation of the forces that influence the issuer and the market(s) in which the security is purchased and sold.
The values assigned to fair value investments are based on available information and do not necessarily represent amounts that might ultimately be realized. Further, due to the inherent uncertainty of valuations of such investments, the fair values may differ significantly from the values that would have been used had an active market existed, and the differences could be material.
The following tables summarize the market value of each of the Funds' holdings as of September 30, 2023, based on the inputs used to value them:
Global Energy Solutions
| Asset Description | Level 1 | Level 2 | Level 3 | Total |
| Common Stocks: | | | | |
| Austria | $ — | $ 1,363,128 | $ — | $ 1,363,128 |
| Belgium | — | 994,913 | — | 994,913 |
| Brazil | 1,200,103 | — | — | 1,200,103 |
| Canada | 7,365,427 | — | — | 7,365,427 |
| Chile | 1,161,954 | — | — | 1,161,954 |
| China | 2,065,933 | 7,622,032 | — | 9,687,965 |
| Denmark | — | 4,330,218 | — | 4,330,218 |
| Finland | — | 878,010 | — | 878,010 |
| France | — | 9,070,729 | — | 9,070,729 |
| Germany | — | 13,385,625 | — | 13,385,625 |
| Greece | — | 942,521 | — | 942,521 |
| India | — | 889,253 | — | 889,253 |
| Ireland | 1,102,208 | 959,679 | — | 2,061,887 |
| Italy | — | 4,565,900 | — | 4,565,900 |
| Japan | — | 8,065,820 | — | 8,065,820 |
| Netherlands | — | 1,564,086 | — | 1,564,086 |
| New Zealand | — | 3,884,368 | — | 3,884,368 |
| Norway | — | 1,996,287 | — | 1,996,287 |
| Singapore | — | 933,809 | — | 933,809 |
| South Korea | — | 4,593,822 | — | 4,593,822 |
| Spain | 991,691 | 7,401,942 | — | 8,393,633 |
| Sweden | — | 4,514,791 | — | 4,514,791 |
| Switzerland | — | 2,859,047 | — | 2,859,047 |
| Taiwan | — | 6,891,979 | — | 6,891,979 |
| Thailand | — | 997,914 | — | 997,914 |
| United Kingdom | 914,491 | 4,712,162 | — | 5,626,653 |
| United States | 53,322,105 | — | — | 53,322,105 |
| Total Common Stocks | $68,123,912 | $93,418,035 (1) | $ — | $161,541,947 |
| High Social Impact Investments | $ — | $ 197,258 | $ — | $ 197,258 |
Calvert
Global Energy Solutions Fund
Global Water Fund
September 30, 2023
Notes to Financial Statements — continued
Global Energy Solutions — continued
| Asset Description (continued) | Level 1 | Level 2 | Level 3 | Total |
| Short-Term Investments: | | | | |
| Affiliated Fund | $ 551,742 | $ — | $ — | $ 551,742 |
| Securities Lending Collateral | 11,519,800 | — | — | 11,519,800 |
| Total Investments | $80,195,454 | $93,615,293 | $ — | $173,810,747 |
| (1) | Includes foreign equity securities whose values were adjusted to reflect market trading of comparable securities or other correlated instruments that occurred after the close of trading in their applicable foreign markets. |
Global Water
| Asset Description | Level 1 | Level 2 | Level 3(1) | Total |
| Common Stocks: | | | | |
| Australia | $ — | $ 12,931,757 | $ — | $ 12,931,757 |
| Brazil | 15,389,774 | — | — | 15,389,774 |
| Canada | 5,669,715 | — | — | 5,669,715 |
| Chile | — | 6,240,623 | — | 6,240,623 |
| China | — | 26,694,443 | — | 26,694,443 |
| Denmark | — | 2,742,448 | — | 2,742,448 |
| Finland | — | 13,315,965 | — | 13,315,965 |
| France | — | 20,414,257 | — | 20,414,257 |
| Germany | — | 5,512,831 | — | 5,512,831 |
| Italy | — | 8,209,738 | — | 8,209,738 |
| Japan | — | 41,126,629 | — | 41,126,629 |
| Mexico | 4,472,805 | — | — | 4,472,805 |
| Netherlands | — | 7,457,546 | — | 7,457,546 |
| Singapore | — | 5,838,162 | 0 | 5,838,162 |
| South Korea | — | 5,226,836 | — | 5,226,836 |
| Spain | — | 5,422,694 | — | 5,422,694 |
| Sweden | — | 2,752,412 | — | 2,752,412 |
| Switzerland | — | 25,433,837 | — | 25,433,837 |
| Taiwan | — | 2,809,466 | — | 2,809,466 |
| United Kingdom | 9,342,648 | 36,995,130 | — | 46,337,778 |
| United States | 252,147,028 | — | — | 252,147,028 |
| Total Common Stocks | $287,021,970 | $229,124,774 (2) | $ 0 | $516,146,744 |
| High Social Impact Investments | $ — | $ 621,363 | $ — | $ 621,363 |
| Short-Term Investments: | | | | |
| Affiliated Fund | 362,628 | — | — | 362,628 |
| Securities Lending Collateral | 11,475,029 | — | — | 11,475,029 |
| Total Investments | $298,859,627 | $229,746,137 | $ 0 | $528,605,764 |
| (1) | None of the unobservable inputs for Level 3 assets, individually or collectively, had a material impact on the Fund. |
| (2) | Includes foreign equity securities whose values were adjusted to reflect market trading of comparable securities or other correlated instruments that occurred after the close of trading in their applicable foreign markets. |
Calvert
Global Energy Solutions Fund
Global Water Fund
September 30, 2023
Notes to Financial Statements — continued
Level 3 investments at the beginning and/or end of the period in relation to net assets were not significant and accordingly, a reconciliation of Level 3 assets for the year ended September 30, 2023 is not presented.
B Investment Transactions and Income— Investment transactions for financial statement purposes are accounted for on trade date. Realized gains and losses are recorded on an identified cost basis and may include proceeds from litigation. Dividend income is recorded on the ex-dividend date for dividends received in cash and/or securities or, in the case of dividends on certain foreign securities, as soon as the Fund is informed of the ex-dividend date. Non-cash dividends are recorded at the fair value of the securities received. Withholding taxes on foreign dividends, if any, have been provided for in accordance with the Funds' understanding of the applicable country’s tax rules and rates. In consideration of recent decisions rendered by European courts, the Fund has filed additional tax reclaims for previously withheld taxes on dividends earned in certain European Union countries. These filings are subject to various administrative and judicial proceedings within these countries. Due to the uncertainty as to the ultimate resolution of these proceedings, the likelihood of receipt of these reclaims, and the potential timing of payment, no amounts are reflected in the financial statements for such outstanding reclaims.
Distributions received that represent a return of capital are recorded as a reduction of cost of investments. Distributions received that represent a capital gain are recorded as a realized gain. Interest income, which includes amortization of premium and accretion of discount on debt securities, is accrued as earned.
C Share Class Accounting— Realized and unrealized gains and losses and net investment income and losses, other than class-specific expenses, are allocated daily to each class of shares based upon the relative net assets of each class to the total net assets of each Fund. Expenses arising in connection with a specific class are charged directly to that class.
D Foreign Currency Transactions— The Funds’ accounting records are maintained in U.S. dollars. For valuation of assets and liabilities on each date of net asset value determination, foreign denominations are converted into U.S. dollars using the current exchange rate. Security transactions, income and expenses are translated at the prevailing rate of exchange on the date of the event. Recognized gains or losses on investment transactions attributable to changes in foreign currency exchange rates are recorded for financial statement purposes as net realized gains and losses on investments. That portion of unrealized gains and losses on investments that results from fluctuations in foreign currency exchange rates is not separately disclosed.
E Restricted Securities— The Funds may invest in securities that are subject to legal or contractual restrictions on resale. Generally, these securities may only be sold publicly upon registration under the Securities Act of 1933 or in transactions exempt from such registration. Information regarding restricted securities (excluding Rule 144A securities) is included at the end of each Fund's Schedule of Investments.
F Distributions to Shareholders— Distributions to shareholders are recorded by the Funds on ex-dividend date. Distributions from net investment income and distributions from net realized capital gains, if any, are paid at least annually. Distributions are declared separately for each class of shares. Distributions are determined in accordance with income tax regulations, which may differ from U.S. GAAP; accordingly, periodic reclassifications are made within the Funds' capital accounts to reflect income and gains available for distribution under income tax regulations.
G Estimates— The preparation of financial statements in conformity with U.S. GAAP requires management to make estimates and assumptions that affect the reported amounts of assets and liabilities and disclosure of contingent assets and liabilities at the date of the financial statements and the reported amounts of increases and decreases in net assets from operations during the reporting period. Actual results could differ from those estimates.
H Indemnifications— The Corporation’s By-Laws provide for indemnification for Directors or officers of the Corporation and certain other parties, to the fullest extent permitted by Maryland law and the 1940 Act, provided certain conditions are met. Additionally, in the normal course of business, each Fund enters into agreements with service providers that may contain indemnification clauses. Each Fund’s maximum exposure under these arrangements is unknown as this would involve future claims that may be made against each Fund that have not yet occurred.
I Federal Income Taxes— No provision for federal income or excise tax is required since each Fund intends to continue to qualify as a regulated investment company under the Internal Revenue Code and to distribute substantially all of its taxable earnings.
In addition to the requirements of the Internal Revenue Code, each Fund may also be subject to local taxes on the recognition of capital gains in certain countries. In determining the daily net asset value, each Fund estimates the accrual for such taxes, if any, based on the unrealized appreciation on certain portfolio securities and the related tax rates. Taxes attributable to unrealized appreciation are included in the respective Fund's change in unrealized appreciation (depreciation) on investments. Capital gains taxes on securities sold are included in the respective Fund's net realized gain (loss) on investments.
Management has analyzed the Funds’ tax positions taken for all open federal income tax years and has concluded that no provision for federal income tax is required in the Funds’ financial statements. Each Fund’s federal tax return is subject to examination by the Internal Revenue Service for a period of three years from the date of filing.
Calvert
Global Energy Solutions Fund
Global Water Fund
September 30, 2023
Notes to Financial Statements — continued
2 Related Party Transactions
The investment advisory fee is earned by Calvert Research and Management (CRM), an indirect, wholly-owned subsidiary of Morgan Stanley, as compensation for investment advisory services rendered to each Fund. The investment advisory fee is computed at the following annual rates of each respective Fund's average daily net assets and is payable monthly:
Global Energy Solutions0.75%
Global Water
Up to and including $250 Million0.75%
Over $250 Million0.70%
For the year ended September 30, 2023, the investment advisory fee for Global Energy Solutions and Global Water amounted to $1,342,627 and $3,906,529, respectively, or 0.75% and 0.72%, respectively, of each Fund’s average daily net assets.
Each Fund may invest in a money market fund, the Institutional Class of the Morgan Stanley Institutional Liquidity Funds - Government Portfolio (the “Liquidity Fund”), an open-end management investment company managed by Morgan Stanley Investment Management Inc., a wholly-owned subsidiary of Morgan Stanley. The investment advisory fee paid by each Fund is reduced by an amount equal to its pro rata share of the advisory and administration fees paid by each Fund due to its investment in the Liquidity Fund. For the year ended September 30, 2023, the investment advisory fee paid was reduced by $419 and $725 for Global Energy Solutions and Global Water, respectively, relating to each Fund's investment in the Liquidity Fund.
CRM has agreed to reimburse the Funds' operating expenses to the extent that total annual operating expenses (relating to ordinary operating expenses only and excluding expenses such as brokerage commissions, acquired fund fees and expenses of unaffiliated funds, borrowing costs, taxes or litigation expenses) exceed 1.24%, 1.99% and 0.99% of each Fund’s average daily net assets for Class A, Class C and Class I, respectively. The expense reimbursement agreements with CRM may be changed or terminated after January 31, 2024. For the year ended September 30, 2023, CRM waived or reimbursed expenses of $340,633 and $283,877 for Global Energy Solutions and Global Water, respectively.
The administrative fee is earned by CRM as compensation for administrative services rendered to the Funds. The fee is computed at an annual rate of 0.12% of each Fund’s average daily net assets attributable to Class A, Class C and Class I and is payable monthly. For the year ended September 30, 2023, CRM was paid administrative fees of $214,820 and $648,262 for Global Energy Solutions and Global Water, respectively.
Each Fund has in effect a distribution plan for Class A shares (Class A Plan) pursuant to Rule 12b-1 under the 1940 Act. Pursuant to the Class A Plan, each Fund pays Eaton Vance Distributors, Inc. (EVD), an affiliate of CRM and the Funds' principal underwriter, a distribution and service fee of 0.25% per annum of its average daily net assets attributable to Class A shares for distribution services and facilities provided to the Funds by EVD, as well as for personal services and/or the maintenance of shareholder accounts. Each Fund also has in effect a distribution plan for Class C shares (Class C Plan) pursuant to Rule 12b-1 under the 1940 Act. Pursuant to the Class C Plan, each Fund pays EVD amounts equal to 0.75% per annum of its average daily net assets attributable to Class C shares for providing ongoing distribution services and facilities to the Funds. In addition, pursuant to the Class C Plan, each Fund also makes payments of service fees to EVD, financial intermediaries and other persons in amounts equal to 0.25% per annum of its average daily net assets attributable to that class. Service fees paid or accrued are for personal services and/or the maintenance of shareholder accounts. Distribution and service fees for Global Energy Solutions and Global Water paid or accrued for the year ended September 30, 2023 amounted to $237,354 and $568,679, respectively, for Class A shares and $93,950 and $234,188, respectively, for Class C shares.
The Funds were informed that EVD received $15,524 and $25,923 for Global Energy Solutions and Global Water, respectively, as their portion of the sales charge on sales of Class A shares for the year ended September 30, 2023. The Funds were informed that Morgan Stanley affiliated broker-dealers, which may be deemed to be affiliates of CRM and EVD, also received a portion of the sales charge on sales of Class A shares for the year ended September 30, 2023 in the amount of $2,761 for Global Water and none for Global Energy Solutions.
For the year ended September 30, 2023, the Funds were also informed that EVD received the following amounts of contingent deferred sales charges paid by Class A and Class C shareholders:
| | Global Energy Solutions | Global Water |
| Class A | $ 14 | $7,770 |
| Class C | 351 | 948 |
Eaton Vance Management (EVM), an affiliate of CRM, provides sub-transfer agency and related services to the Funds pursuant to a Sub-Transfer Agency Support Services Agreement. For the year ended September 30, 2023, sub-transfer agency fees and expenses for Global Energy Solutions and Global Water incurred to EVM amounted to $59,130 and $83,204, respectively, and are included in transfer agency fees and expenses on the Statements of Operations.
Calvert
Global Energy Solutions Fund
Global Water Fund
September 30, 2023
Notes to Financial Statements — continued
Each Director of the Funds who is not an employee of CRM or its affiliates receives an annual fee of $214,000, an annual Committee fee ranging from $8,500 to $16,500 depending on the Committee, and may receive a fee of $10,000 for special meetings. The Board chair receives an additional $40,000 ($30,000 prior to January 1, 2023) annual fee, Committee chairs receive an additional $15,000 ($6,000 prior to January 1, 2023) annual fee and the special equities liaison receives an additional $2,500 annual fee. Eligible Directors may participate in a Deferred Compensation Plan (the Plan). Amounts deferred under the Plan are treated as though equal dollar amounts had been invested in shares of the Funds or other Calvert funds selected by the Directors. The Funds purchase shares of the funds selected equal to the dollar amounts deferred under the Plan, resulting in an asset equal to the deferred compensation liability. Obligations of the Plan are paid solely from the Funds' assets. Directors’ fees are allocated to each of the Calvert funds served. Salaries and fees of officers and Directors of the Funds who are employees of CRM or its affiliates are paid by CRM.
3 Investment Activity
During the year ended September 30, 2023, the cost of purchases and proceeds from sales of investments, other than short-term securities, were as follows:
| | Global Energy Solutions | Global Water |
| Purchases | $75,162,365 | $158,784,082 |
| Sales | 79,378,266 | 172,228,619 |
4 Distributions to Shareholders and Income Tax Information
The tax character of distributions declared for the years ended September 30, 2023 and September 30, 2022 was as follows:
| | Global Energy Solutions | Global Water |
| | Year Ended September 30, | Year Ended September 30, |
| | 2023 | 2022 | 2023 | 2022 |
| Ordinary income | $1,243,589 | $895,082 | $4,713,205 | $6,115,743 |
| Long-term capital gains | $ — | $ — | $3,273,485 | $ — |
During the year ended September 30, 2023, the following amounts were reclassified due to the Funds' use of equalization accounting. Tax equalization accounting allows the Funds to treat as a distribution that portion of redemption proceeds representing a redeeming shareholder’s portion of undistributed taxable income and net capital gains. These reclassifications had no effect on the net assets or net asset value per share of the Funds.
| | Global Energy Solutions | Global Water |
| Change in: | | |
| Paid-in capital | $ 129,918 | $ 894,767 |
| Distributable earnings (Accumulated loss) | $(129,918) | $(894,767) |
As of September 30, 2023, the components of distributable earnings (accumulated loss) on a tax basis were as follows:
| | Global Energy Solutions | Global Water |
| Undistributed ordinary income | $ 1,466,308 | $ 6,359,232 |
| Undistributed long-term capital gains | — | 7,793,224 |
| Deferred capital losses | (12,594,656) | — |
| Net unrealized appreciation (depreciation) | (31,377,135) | 69,997,029 |
| Distributable earnings (accumulated loss) | $(42,505,483) | $84,149,485 |
Calvert
Global Energy Solutions Fund
Global Water Fund
September 30, 2023
Notes to Financial Statements — continued
At September 30, 2023, Global Energy Solutions, for federal income tax purposes, had deferred capital losses of $12,594,656 which would reduce the Fund’s taxable income arising from future net realized gains on investment transactions, if any, to the extent permitted by the Internal Revenue Code, and thus would reduce the amount of distributions to shareholders, which would otherwise be necessary to relieve the Fund of any liability for federal income or excise tax. The deferred capital losses are treated as arising on the first day of the Fund's next taxable year, can be carried forward for an unlimited period, and retain the same short-term or long-term character as when originally deferred. Of the deferred capital losses at September 30, 2023, $12,594,656 are long-term.
The cost and unrealized appreciation (depreciation) of investments of the Funds at September 30, 2023, as determined on a federal income tax basis, were as follows:
| | Global Energy Solutions | Global Water |
| Aggregate cost | $205,176,300 | $458,593,856 |
| Gross unrealized appreciation | $ 11,257,791 | $ 118,625,552 |
| Gross unrealized depreciation | (42,623,344) | (48,613,644) |
| Net unrealized appreciation (depreciation) | $ (31,365,553) | $ 70,011,908 |
5 Securities Lending
To generate additional income, the Funds may lend their securities pursuant to a securities lending agency agreement with State Street Bank and Trust Company (SSBT), the securities lending agent. Security loans are subject to termination by the Funds at any time and, therefore, are not considered illiquid investments. The Funds require that the loan be continuously collateralized by either cash or securities in an amount at least equal to the market value of the securities on loan. The market value of securities loaned is determined daily and any additional required collateral is delivered to the Funds on the next business day. Cash collateral is generally invested in a money market fund registered under the 1940 Act that is managed by an affiliate of SSBT. Any gain or loss in the market price of the loaned securities that might occur and any interest earned or dividends declared during the term of the loan would accrue to the account of the Funds. Income earned on the investment of collateral, net of broker rebates and other expenses incurred by the securities lending agent, is split between the Funds and the securities lending agent based on agreed upon contractual terms. Non-cash collateral, if any, is held by the lending agent on behalf of a Fund and cannot be sold or re-pledged by the Fund; accordingly, such collateral is not reflected in the Statements of Assets and Liabilities.
The risks associated with lending portfolio securities include, but are not limited to, possible delays in receiving additional collateral or in the recovery of the loaned securities, possible loss of rights to the collateral should the borrower fail financially, as well as risk of loss in the value of the collateral or the value of the investments made with the collateral. The securities lending agent shall indemnify the Funds in the case of default of any securities borrower.
At September 30, 2023, the total value of securities on loan and the total value of collateral received were as follows:
| | Global Energy Solutions | Global Water |
| Securities on Loan | $ 18,472,002 | $ 33,138,387 |
| Collateral Received: | | |
| Cash | 11,519,800 | 11,475,029 |
| U.S. government and/or agencies securities | 7,773,543 | 23,559,581 |
| Total Collateral Received | $19,293,343 | $35,034,610 |
Calvert
Global Energy Solutions Fund
Global Water Fund
September 30, 2023
Notes to Financial Statements — continued
The following tables provide a breakdown of securities lending transactions accounted for as secured borrowings, the obligations by class of collateral pledged, and the remaining contractual maturity of those transactions as of September 30, 2023.
| Global Energy Solutions | Remaining Contractual Maturity of the Transactions |
| | Overnight and
Continuous | <30 days | 30 to 90 days | >90 days | Total |
| Common Stocks | $11,519,800 | $ — | $ — | $ — | $11,519,800 |
| Global Water | Remaining Contractual Maturity of the Transactions |
| | Overnight and
Continuous | <30 days | 30 to 90 days | >90 days | Total |
| Common Stocks | $11,475,029 | $ — | $ — | $ — | $11,475,029 |
The carrying amounts of the liabilities for deposits for securities loaned at September 30, 2023 approximated their fair value. If measured at fair value, such liabilities would have been considered as Level 2 in the fair value hierarchy (see Note 1A) at September 30, 2023.
6 Line of Credit
The Funds participate with other portfolios and funds managed by EVM and its affiliates, including CRM, in a $725 million unsecured revolving line of credit agreement with a group of banks, which is in effect through October 24, 2023. Borrowings are made by the Funds solely for temporary purposes related to redemptions and other short-term cash needs. Interest is charged to each Fund based on its borrowings at an amount above either the Secured Overnight Financing Rate (SOFR) or Federal Funds rate. In addition, a fee computed at an annual rate of 0.15% on the daily unused portion of the line of credit is allocated among the participating portfolios and funds at the end of each quarter. In connection with the renewal of the agreement in October 2022, an arrangement fee of $150,000 was incurred that was allocated to the participating portfolios and funds. Because the line of credit is not available exclusively to the Funds, a Fund may be unable to borrow some or all of its requested amounts at any particular time.
The Funds had no borrowings outstanding pursuant to their line of credit at September 30, 2023. The Funds did not have any significant borrowings or allocated fees during the year ended September 30, 2023. Effective October 24, 2023, each Fund renewed its line of credit agreement, which expires October 22, 2024. In connection with the renewal, the borrowing limit was decreased to $650 million.
7 Affiliated Investments
Each Fund has invested a portion of its assets in notes (the Notes) issued by Calvert Impact Capital, Inc. (CIC) pursuant to exemptive relief granted by the U.S. Securities and Exchange Commission (the SEC). There are certain potential points of affiliation between the Funds and CIC. CRM has licensed use of the Calvert name to CIC and provides other types of support. An officer of CRM's affiliate serves on the CIC Board. In addition, a director/trustee on the Funds' Board serves as a director emeritus on the CIC Board.
At September 30, 2023, the value of each Fund's investment in the Notes and in funds that may be deemed to be affiliated was $749,000 for Global Energy Solutions, which represents 0.4% of its net assets and $983,991 for Global Water, which represents 0.2% of its net assets. Transactions in such investments by the Funds for the year ended September 30, 2023 were as follows:
Calvert
Global Energy Solutions Fund
Global Water Fund
September 30, 2023
Notes to Financial Statements — continued
Global Energy Solutions
| Name | Value,
beginning
of period | Purchases | Sales
proceeds | Net
realized
gain
(loss) | Change in
unrealized
appreciation
(depreciation) | Value,
end of
period | Interest/
Dividend
income | Principal amount/
Shares,
end of period |
| High Social Impact Investments | | | | | | | | |
| Calvert Impact Capital, Inc., Community Investment Notes, 1.50%, 12/15/23(1) | $185,752 | $ — | $ — | $ — | $ 11,506 | $ 197,258 | $ 3,000 | $200,000 |
| Short-Term Investments | | | | | | |
| Liquidity Fund | 465,140 | 33,007,659 | (32,921,057) | — | — | 551,742 | 12,504 | 551,742 |
| Total | | | | $ — | $11,506 | $749,000 | $15,504 | |
Global Water
| Name | Value,
beginning
of period | Purchases | Sales
proceeds | Net
realized
gain
(loss) | Change in
unrealized
appreciation
(depreciation) | Value,
end of
period | Interest/
Dividend
income | Principal amount/
Shares,
end of period |
| High Social Impact Investments | | | | | | | | |
| Calvert Impact Capital, Inc., Community Investment Notes, 1.50%, 12/15/23(1) | $585,119 | $ — | $ — | $ — | $ 36,244 | $ 621,363 | $ 9,450 | $630,000 |
| Short-Term Investments | | | | | | |
| Liquidity Fund | 7,628 | 39,343,494 | (38,988,494) | — | — | 362,628 | 23,809 | 362,628 |
| Total | | | | $ — | $36,244 | $983,991 | $33,259 | |
8 Capital Shares
The Corporation may issue its shares in one or more series (such as the Funds). The authorized shares of each Fund consists of 75,000,000 common shares, $0.01 par value, for each Class.
Transactions in capital shares, including direct exchanges pursuant to share class conversions for all periods presented, were as follows:
Global Energy Solutions
| | Year Ended
September 30, 2023 | | Year Ended
September 30, 2022 |
| | Shares | Amount | | Shares | Amount |
| Class A | | | | | |
| Shares sold | 1,526,988 | $ 17,497,678 | | 1,238,703 | $ 15,166,726 |
| Reinvestment of distributions | 52,041 | 567,772 | | 19,659 | 256,347 |
| Shares redeemed | (1,493,378) | (17,097,795) | | (984,128) | (11,824,796) |
| Net increase | 85,651 | $ 967,655 | | 274,234 | $ 3,598,277 |
| Class C | | | | | |
| Shares sold | 138,326 | $ 1,451,994 | | 165,232 | $ 1,856,279 |
| Shares redeemed | (210,195) | (2,231,173) | | (180,854) | (2,030,118) |
| Net decrease | (71,869) | $ (779,179) | | (15,622) | $ (173,839) |
Calvert
Global Energy Solutions Fund
Global Water Fund
September 30, 2023
Notes to Financial Statements — continued
Global Energy Solutions — continued
| | Year Ended
September 30, 2023 | | Year Ended
September 30, 2022 |
| | Shares | Amount | | Shares | Amount |
| Class I | | | | | |
| Shares sold | 1,839,563 | $ 21,391,745 | | 3,052,624 | $ 38,468,724 |
| Reinvestment of distributions | 58,005 | 643,274 | | 46,889 | 621,286 |
| Shares redeemed | (2,327,894) | (26,879,542) | | (5,077,253) | (61,376,680) |
| Net decrease | (430,326) | $ (4,844,523) | | (1,977,740) | $(22,286,670) |
Global Water
| | Year Ended
September 30, 2023 | | Year Ended
September 30, 2022 |
| | Shares | Amount | | Shares | Amount |
| Class A | | | | | |
| Shares sold | 769,086 | $ 19,971,487 | | 1,223,866 | $ 33,483,369 |
| Reinvestment of distributions | 115,463 | 2,804,596 | | 74,620 | 2,242,343 |
| Shares redeemed | (1,169,871) | (30,127,595) | | (978,609) | (26,463,640) |
| Net increase (decrease) | (285,322) | $ (7,351,512) | | 319,877 | $ 9,262,072 |
| Class C | | | | | |
| Shares sold | 55,096 | $ 1,304,972 | | 102,398 | $ 2,603,529 |
| Reinvestment of distributions | 6,831 | 152,670 | | 3,634 | 100,493 |
| Shares redeemed | (369,066) | (8,652,378) | | (534,566) | (13,282,912) |
| Net decrease | (307,139) | $ (7,194,736) | | (428,534) | $(10,578,890) |
| Class I | | | | | |
| Shares sold | 1,793,282 | $ 46,423,693 | | 3,334,829 | $ 89,804,141 |
| Reinvestment of distributions | 171,517 | 4,191,867 | | 105,194 | 3,180,003 |
| Shares redeemed | (1,911,412) | (49,487,042) | | (1,872,370) | (49,991,557) |
| Net increase | 53,387 | $ 1,128,518 | | 1,567,653 | $ 42,992,587 |
9 Risks and Uncertainties
Risks Associated with Foreign Investments
Foreign investments can be adversely affected by political, economic and market developments abroad, including the imposition of economic and other sanctions by the United States or another country. There may be less publicly available information about foreign issuers because they may not be subject to reporting practices, requirements or regulations comparable to those to which United States companies are subject. Foreign markets may be smaller, less liquid and more volatile than the major markets in the United States. Trading in foreign markets typically involves higher expense than trading in the United States. The Funds may have difficulties enforcing their legal or contractual rights in a foreign country. Securities that trade or are denominated in currencies other than the U.S. dollar may be adversely affected by fluctuations in currency exchange rates.
Emerging market securities often involve greater risks than developed market securities. Investment markets within emerging market countries are typically smaller, less liquid, less developed and more volatile than those in more developed markets like the United States, and may be focused in certain economic sectors. The information available about an emerging market issuer may be less reliable than for comparable issuers in more developed capital markets. Governmental actions can have a significant effect on the economic conditions in emerging market countries. It may be more difficult to make a claim or
Calvert
Global Energy Solutions Fund
Global Water Fund
September 30, 2023
Notes to Financial Statements — continued
obtain a judgment in the courts of these countries than it is in the United States. The possibility of fraud, negligence, undue influence being exerted by an issuer or refusal to recognize ownership exists in some emerging markets. Disruptions due to work stoppages and trading improprieties in foreign securities markets have caused such markets to close. Emerging market securities are also subject to speculative trading, which contributes to their volatility.
Concentration Risk
Global Energy Solutions concentrates its investments in the sustainable energy solutions industry. This industry can be significantly affected by obsolescence of existing technology, short product lifecycles, falling prices and profits, competition from new market entrants and general economic conditions. The industry can also be significantly affected by fluctuations in energy prices and supply and demand of alternative energy fuels, energy conservation, the success of exploration projects and tax and other government regulations and policies. Companies in this industry could be adversely affected by commodity price volatility, imposition of import controls, increased competition, depletion of resources, technological developments and labor relations.
Global Water concentrates its investments in the water industry. This industry can be significantly affected by economic trends or other conditions or developments, such as the availability of water, the level of rainfall and occurrence of other climatic events, changes in water consumption, new technologies relating to the supply of water, and water conservation. The industry can also be significantly affected by environmental considerations, taxation, government regulation (including the increased cost of compliance), inflation, increases in interest rates, price and supply fluctuations, increases in the cost of raw materials and other operating costs, technological advances, and competition from new market entrants.
Calvert
Global Energy Solutions Fund
Global Water Fund
September 30, 2023
Report of Independent Registered Public Accounting Firm
To the Board of Directors of Calvert Impact Fund, Inc. and Shareholders of Calvert Global Energy Solutions Fund and Calvert Global Water Fund:
Opinion on the Financial Statements and Financial Highlights
We have audited the accompanying statements of assets and liabilities of Calvert Global Energy Solutions Fund and Calvert Global Water Fund (the “Funds") (two of the funds constituting Calvert Impact Fund, Inc.), including the schedules of investments, as of September 30, 2023, the related statements of operations for the year then ended, the statements of changes in net assets for each of the two years in the period then ended, the financial highlights for each of the three years in the period then ended, and the related notes. In our opinion, the financial statements and financial highlights present fairly, in all material respects, the financial position of each of the Funds as of September 30, 2023, and the results of their operations for the year then ended, the changes in their net assets for each of the two years in the period then ended, and the financial highlights for each of the three years in the period then ended, in conformity with accounting principles generally accepted in the United States of America. The financial highlights for the years ended September 30, 2020 and 2019 were audited by other auditors whose report, dated November 20, 2020, expressed an unqualified opinion on those financial highlights.
Basis for Opinion
These financial statements and financial highlights are the responsibility of the Funds’ management. Our responsibility is to express an opinion on the Funds’ financial statements and financial highlights based on our audits. We are a public accounting firm registered with the Public Company Accounting Oversight Board (United States) (PCAOB) and are required to be independent with respect to the Funds in accordance with the U.S. federal securities laws and the applicable rules and regulations of the Securities and Exchange Commission and the PCAOB.
We conducted our audits in accordance with the standards of the PCAOB. Those standards require that we plan and perform the audit to obtain reasonable assurance about whether the financial statements and financial highlights are free of material misstatement, whether due to error or fraud. The Funds are not required to have, nor were we engaged to perform, an audit of their internal control over financial reporting. As part of our audits, we are required to obtain an understanding of internal control over financial reporting but not for the purpose of expressing an opinion on the effectiveness of the Funds’ internal control over financial reporting. Accordingly, we express no such opinion.
Our audits included performing procedures to assess the risks of material misstatement of the financial statements and financial highlights, whether due to error or fraud, and performing procedures that respond to those risks. Such procedures included examining, on a test basis, evidence regarding the amounts and disclosures in the financial statements and financial highlights. Our audits also included evaluating the accounting principles used and significant estimates made by management, as well as evaluating the overall presentation of the financial statements and financial highlights. Our procedures included confirmation of securities owned as of September 30, 2023, by correspondence with the custodian and brokers; when replies were not received from brokers, we performed other auditing procedures. We believe that our audits provide a reasonable basis for our opinion.
/s/ Deloitte & Touche LLP
Boston, Massachusetts
November 22, 2023
We have served as the auditor of one or more Calvert investment companies since 2021.
Calvert
Global Energy Solutions Fund
Global Water Fund
September 30, 2023
Federal Tax Information (Unaudited)
The Form 1099-DIV you receive in February 2024 will show the tax status of all distributions paid to your account in calendar year 2023. Shareholders are advised to consult their own tax adviser with respect to the tax consequences of their investment in the Funds. As required by the Internal Revenue Code and/or regulations, shareholders must be notified regarding the status of qualified dividend income for individuals, the dividends received deduction for corporations, the foreign tax credit and capital gains dividends.
Qualified Dividend Income. For the fiscal year ended September 30, 2023, the Funds designate approximately the following amounts, or up to the maximum amount of such dividends allowable pursuant to the Internal Revenue Code, as qualified dividend income eligible for the reduced tax rate of 15%:
| Global Energy Solutions | $ 3,484,315 |
| Global Water | $ 9,650,044 |
Dividends Received Deduction. Corporate shareholders are generally entitled to take the dividends received deduction on the portion of each Fund's dividend distribution that qualifies under tax law. For each Fund's fiscal 2023 ordinary income dividends, the following qualifies for the corporate dividends received deduction:
| Global Energy Solutions | 34.93% |
| Global Water | 55.60% |
Foreign Tax Credit. For the fiscal year ended September 30, 2023, the Funds paid foreign taxes and recognized foreign source income as follows:
| | Foreign Taxes | | Foreign Source Income |
| Global Energy Solutions | $423,021 | | $ 3,586,468 |
| Global Water | $764,585 | | $10,793,227 |
Capital Gains Dividends. The Funds hereby designate as a capital gain dividend with respect to the taxable year ended September 30, 2023, the following amounts or, if subsequently determined to be different, the net capital gain of such year:
| Global Energy Solutions | $ — |
| Global Water | $ 8,452,731 |
Calvert
Global Energy Solutions Fund
September 30, 2023
Board of Directors' Contract Approval
Overview of the Contract Review Process
The Investment Company Act of 1940, as amended, provides, in substance, that each investment advisory agreement between a fund and its investment adviser will continue in effect from year to year only if its continuation is approved at least annually by the fund’s board of directors, including by a vote of a majority of the directors who are not “interested persons” of the fund (“Independent Directors”), cast in person at a meeting called for the purpose of considering such approval.
At an in-person meeting of the Boards of Trustees/Directors (each a “Board”) of the registered investment companies advised by Calvert Research and Management (“CRM” or the “Adviser”) (the “Calvert Funds”) held on June 12-13, 2023, the Board, including a majority of the Independent Directors, voted to approve continuation of existing investment advisory and investment sub-advisory agreements for the Calvert Funds for an additional one-year period.
In evaluating the investment advisory and investment sub-advisory agreements for the Calvert Funds, the Board considered a variety of information relating to the Calvert Funds and various service providers, including the Adviser. The Independent Directors reviewed a report prepared by the Adviser regarding various services provided to the Calvert Funds by the Adviser and its affiliates. Such report included, among other data, information regarding the Adviser’s personnel and the Adviser’s revenue and cost of providing services to the Calvert Funds, and a separate report prepared by an independent data provider, which compared each fund’s investment performance, fees and expenses to those of comparable funds as identified by such independent data provider (“comparable funds”).
The Independent Directors were separately represented by independent legal counsel with respect to their consideration of the continuation of the investment advisory and investment sub-advisory agreements for the Calvert Funds. Prior to voting, the Independent Directors reviewed the proposed continuation of the Calvert Funds’ investment advisory and investment sub-advisory agreements with management and also met in private sessions with their counsel at which time no representatives of management were present.
The information that the Board considered included, among other things, the following (for funds that invest through one or more affiliated underlying fund(s), references to “each fund” in this section may include information that was considered at the underlying fund-level):
Information about Fees, Performance and Expenses
| • | A report from an independent data provider comparing the advisory and related fees paid by each fund with fees paid by comparable funds; |
| • | A report from an independent data provider comparing each fund’s total expense ratio and its components to comparable funds; |
| • | A report from an independent data provider comparing the investment performance of each fund to the investment performance of comparable funds over various time periods; |
| • | Data regarding investment performance in comparison to benchmark indices; |
| • | For each fund, comparative information concerning the fees charged and the services provided by the Adviser in managing other accounts (including mutual funds, other collective investment funds and institutional accounts) using investment strategies and techniques similar to those used in managing such fund; |
| • | Profitability analyses for the Adviser with respect to each fund; |
Information about Portfolio Management and Trading
| • | Descriptions of the investment management services provided to each fund, including investment strategies and processes it employs; |
| • | Information about the Adviser’s policies and practices with respect to trading, including the Adviser’s processes for monitoring best execution of portfolio transactions; |
| • | Information about the allocation of brokerage transactions and the benefits received by the Adviser as a result of brokerage allocation, including information concerning the acquisition of research through client commission arrangements and policies with respect to “soft dollars”; |
Information about the Adviser
| • | Reports detailing the financial results and condition of CRM; |
| • | Descriptions of the qualifications, education and experience of the individual investment professionals whose responsibilities include portfolio management and investment research for the funds, and information relating to their compensation and responsibilities with respect to managing other mutual funds and investment accounts; |
| • | Policies and procedures relating to proxy voting and the handling of corporate actions and class actions; |
| • | A description of CRM’s procedures for overseeing sub-advisers, including with respect to regulatory and compliance issues, investment management and other matters; |
Calvert
Global Energy Solutions Fund
September 30, 2023
Board of Directors' Contract Approval — continued
Other Relevant Information
| • | Information concerning the nature, cost and character of the administrative and other non-investment advisory services provided by CRM and its affiliates; and |
| • | The terms of each investment advisory agreement. |
Over the course of the year, the Board and its committees held regular quarterly meetings. During these meetings, the Directors participated in investment and performance reviews with the portfolio managers and other investment professionals of the Adviser relating to each fund and considered various investment and trading strategies used in pursuing each fund’s investment objective(s), such as the use of derivative instruments, as well as risk management techniques. The Board and its committees also evaluated issues pertaining to industry and regulatory developments, compliance procedures, corporate governance and other issues with respect to the funds and received and participated in reports and presentations provided by CRM and its affiliates with respect to such matters. In addition to the formal meetings of the Board and its committees, the Independent Directors held regular video conferences in between meetings to discuss, among other topics, matters relating to the continuation of the Calvert Funds’ investment advisory and investment sub-advisory agreements.
For funds that invest through one or more affiliated underlying funds, the Board considered similar information about the underlying fund(s) when considering the approval of investment advisory agreements. In addition, in cases where the Adviser has engaged a sub-adviser, the Board considered similar information about the sub-adviser when considering the approval of any investment sub-advisory agreement.
The Independent Directors were assisted throughout the contract review process by their independent legal counsel. The Independent Directors relied upon the advice of such counsel and their own business judgment in determining the material factors to be considered in evaluating each investment advisory and investment sub-advisory agreement and the weight to be given to each such factor. The Board, including the Independent Directors, did not identify any single factor as controlling, and each Director may have attributed different weight to various factors.
Results of the Contract Review Process
Based on its consideration of the foregoing, and such other information as it deemed relevant, including the factors and conclusions described below, the Board, including the Independent Directors, concluded that the continuation of the investment advisory agreement of Calvert Global Energy Solutions Fund (the “Fund”), including the fee payable under the agreement, is in the best interests of the Fund’s shareholders. Accordingly, the Board, including a majority of the Independent Directors, voted to approve the continuation of the investment advisory agreement of the Fund.
Nature, Extent and Quality of Services
In considering the nature, extent and quality of the services provided by the Adviser under the investment advisory agreement, the Board reviewed information provided by the Adviser relating to its operations and personnel, including, among other information, biographical information on the Adviser’s investment personnel and descriptions of its organizational and management structure. The Board also took into account similar information provided periodically throughout the previous year by the Adviser as well as the Board’s familiarity with management through Board meetings, discussions and other reports. The Board considered the Adviser’s management style and its performance in employing its investment strategies as well as its current level of staffing and overall resources. The Board also noted that it reviewed on a quarterly basis information regarding the Adviser’s compliance with applicable policies and procedures, including those related to personal investing. The Board took into account, among other items, periodic reports received from the Adviser over the past year concerning the Adviser’s ongoing review and enhancement of certain processes, policies and procedures of the Calvert Funds and the Adviser. The Board concluded that it was satisfied with the nature, extent and quality of services provided to the Fund by the Adviser under the investment advisory agreement.
Fund Performance
In considering the Fund’s performance, the Board noted that it reviewed on a quarterly basis detailed information about the Fund’s performance results, portfolio composition and investment strategies. The Board compared the Fund’s investment performance to that of the Fund’s peer universe and its custom benchmark. The Board’s review included comparative performance data for the one-, three- and five-year periods ended December 31, 2022. This performance data indicated that the Fund had outperformed the median of its peer universe for the one-, three- and five-year periods ended December 31, 2022. This performance data also indicated that the Fund had underperformed its custom benchmark for the one-, three- and five-year periods ended December 31, 2022. Based upon its review, the Board concluded that the Fund’s performance was satisfactory relative to the performance of its peer universe and its custom benchmark.
Management Fees and Expenses
In considering the Fund’s fees and expenses, the Board compared the Fund’s fees and total expense ratio with those of comparable funds in its expense group. Among other findings, the data indicated that the Fund’s advisory and administrative fees (after taking into account waivers and/or reimbursements) (referred to collectively as “management fees”) were above the median of the Fund’s expense group and the Fund’s total expenses (net of waivers and/or
Calvert
Global Energy Solutions Fund
September 30, 2023
Board of Directors' Contract Approval — continued
reimbursements) were below the median of the Fund’s expense group. The Board took into account the Adviser’s current undertaking to maintain expense limitations for the Fund and that the Adviser was waiving and/or reimbursing a portion of the Fund’s expenses. Based upon its review, the Board concluded that the management fees were reasonable in view of the nature, extent and quality of services provided by the Adviser.
Profitability and Other “Fall-Out” Benefits
The Board reviewed the Adviser’s profitability in regard to the Fund and the Calvert Funds in the aggregate. In reviewing the overall profitability of the Fund to the Adviser, the Board also considered the fact that the Adviser and its affiliates provided sub-transfer agency support, administrative and distribution services to the Fund for which they received compensation. The information considered by the Board included the profitability of the Fund to the Adviser and its affiliates without regard to any marketing support or other payments by the Adviser and its affiliates to third parties in respect of distribution services. The Board also considered that the Adviser and its affiliates derived benefits to their reputation and other indirect benefits from their relationships with the Fund. Based upon its review, the Board concluded that the Adviser’s and its affiliates’ level of profitability from their relationships with the Fund was reasonable.��
Economies of Scale
The Board considered the effect of the Fund’s current size and its potential growth on its performance and fees. The Board concluded that adding breakpoints to the advisory fee at specified asset levels would not be appropriate at this time. The Board noted that if the Fund’s assets increased over time, the Fund might realize other economies of scale if assets increased proportionally more than certain other expenses.
Calvert
Global Water Fund
September 30, 2023
Board of Directors' Contract Approval
Overview of the Contract Review Process
The Investment Company Act of 1940, as amended, provides, in substance, that each investment advisory agreement between a fund and its investment adviser will continue in effect from year to year only if its continuation is approved at least annually by the fund’s board of directors, including by a vote of a majority of the directors who are not “interested persons” of the fund (“Independent Directors”), cast in person at a meeting called for the purpose of considering such approval.
At an in-person meeting of the Boards of Trustees/Directors (each a “Board”) of the registered investment companies advised by Calvert Research and Management (“CRM” or the “Adviser”) (the “Calvert Funds”) held on June 12-13, 2023, the Board, including a majority of the Independent Directors, voted to approve continuation of existing investment advisory and investment sub-advisory agreements for the Calvert Funds for an additional one-year period.
In evaluating the investment advisory and investment sub-advisory agreements for the Calvert Funds, the Board considered a variety of information relating to the Calvert Funds and various service providers, including the Adviser. The Independent Directors reviewed a report prepared by the Adviser regarding various services provided to the Calvert Funds by the Adviser and its affiliates. Such report included, among other data, information regarding the Adviser’s personnel and the Adviser’s revenue and cost of providing services to the Calvert Funds, and a separate report prepared by an independent data provider, which compared each fund’s investment performance, fees and expenses to those of comparable funds as identified by such independent data provider (“comparable funds”).
The Independent Directors were separately represented by independent legal counsel with respect to their consideration of the continuation of the investment advisory and investment sub-advisory agreements for the Calvert Funds. Prior to voting, the Independent Directors reviewed the proposed continuation of the Calvert Funds’ investment advisory and investment sub-advisory agreements with management and also met in private sessions with their counsel at which time no representatives of management were present.
The information that the Board considered included, among other things, the following (for funds that invest through one or more affiliated underlying fund(s), references to “each fund” in this section may include information that was considered at the underlying fund-level):
Information about Fees, Performance and Expenses
| • | A report from an independent data provider comparing the advisory and related fees paid by each fund with fees paid by comparable funds; |
| • | A report from an independent data provider comparing each fund’s total expense ratio and its components to comparable funds; |
| • | A report from an independent data provider comparing the investment performance of each fund to the investment performance of comparable funds over various time periods; |
| • | Data regarding investment performance in comparison to benchmark indices; |
| • | For each fund, comparative information concerning the fees charged and the services provided by the Adviser in managing other accounts (including mutual funds, other collective investment funds and institutional accounts) using investment strategies and techniques similar to those used in managing such fund; |
| • | Profitability analyses for the Adviser with respect to each fund; |
Information about Portfolio Management and Trading
| • | Descriptions of the investment management services provided to each fund, including investment strategies and processes it employs; |
| • | Information about the Adviser’s policies and practices with respect to trading, including the Adviser’s processes for monitoring best execution of portfolio transactions; |
| • | Information about the allocation of brokerage transactions and the benefits received by the Adviser as a result of brokerage allocation, including information concerning the acquisition of research through client commission arrangements and policies with respect to “soft dollars”; |
Information about the Adviser
| • | Reports detailing the financial results and condition of CRM; |
| • | Descriptions of the qualifications, education and experience of the individual investment professionals whose responsibilities include portfolio management and investment research for the funds, and information relating to their compensation and responsibilities with respect to managing other mutual funds and investment accounts; |
| • | Policies and procedures relating to proxy voting and the handling of corporate actions and class actions; |
| • | A description of CRM’s procedures for overseeing sub-advisers, including with respect to regulatory and compliance issues, investment management and other matters; |
Calvert
Global Water Fund
September 30, 2023
Board of Directors' Contract Approval — continued
Other Relevant Information
| • | Information concerning the nature, cost and character of the administrative and other non-investment advisory services provided by CRM and its affiliates; and |
| • | The terms of each investment advisory agreement. |
Over the course of the year, the Board and its committees held regular quarterly meetings. During these meetings, the Directors participated in investment and performance reviews with the portfolio managers and other investment professionals of the Adviser relating to each fund and considered various investment and trading strategies used in pursuing each fund’s investment objective(s), such as the use of derivative instruments, as well as risk management techniques. The Board and its committees also evaluated issues pertaining to industry and regulatory developments, compliance procedures, corporate governance and other issues with respect to the funds and received and participated in reports and presentations provided by CRM and its affiliates with respect to such matters. In addition to the formal meetings of the Board and its committees, the Independent Directors held regular video conferences in between meetings to discuss, among other topics, matters relating to the continuation of the Calvert Funds’ investment advisory and investment sub-advisory agreements.
For funds that invest through one or more affiliated underlying funds, the Board considered similar information about the underlying fund(s) when considering the approval of investment advisory agreements. In addition, in cases where the Adviser has engaged a sub-adviser, the Board considered similar information about the sub-adviser when considering the approval of any investment sub-advisory agreement.
The Independent Directors were assisted throughout the contract review process by their independent legal counsel. The Independent Directors relied upon the advice of such counsel and their own business judgment in determining the material factors to be considered in evaluating each investment advisory and investment sub-advisory agreement and the weight to be given to each such factor. The Board, including the Independent Directors, did not identify any single factor as controlling, and each Director may have attributed different weight to various factors.
Results of the Contract Review Process
Based on its consideration of the foregoing, and such other information as it deemed relevant, including the factors and conclusions described below, the Board, including the Independent Directors, concluded that the continuation of the investment advisory agreement of Calvert Global Water Fund (the “Fund”), including the fee payable under the agreement, is in the best interests of the Fund’s shareholders. Accordingly, the Board, including a majority of the Independent Directors, voted to approve the continuation of the investment advisory agreement of the Fund.
Nature, Extent and Quality of Services
In considering the nature, extent and quality of the services provided by the Adviser under the investment advisory agreement, the Board reviewed information provided by the Adviser relating to its operations and personnel, including, among other information, biographical information on the Adviser’s investment personnel and descriptions of its organizational and management structure. The Board also took into account similar information provided periodically throughout the previous year by the Adviser as well as the Board’s familiarity with management through Board meetings, discussions and other reports. The Board considered the Adviser’s management style and its performance in employing its investment strategies as well as its current level of staffing and overall resources. The Board also noted that it reviewed on a quarterly basis information regarding the Adviser’s compliance with applicable policies and procedures, including those related to personal investing. The Board took into account, among other items, periodic reports received from the Adviser over the past year concerning the Adviser’s ongoing review and enhancement of certain processes, policies and procedures of the Calvert Funds and the Adviser. The Board concluded that it was satisfied with the nature, extent and quality of services provided to the Fund by the Adviser under the investment advisory agreement.
Fund Performance
In considering the Fund’s performance, the Board noted that it reviewed on a quarterly basis detailed information about the Fund’s performance results, portfolio composition and investment strategies. The Board compared the Fund’s investment performance to that of the Fund’s peer universe and its custom benchmark. The Board’s review included comparative performance data for the one-, three- and five-year periods ended December 31, 2022. This performance data indicated that the Fund had underperformed the median of its peer universe for the one-, three- and five-year periods ended December 31, 2022. This performance data also indicated that the Fund had underperformed its custom benchmark for the one-, three- and five-year periods ended December 31, 2022. The Board took into account management’s discussion of the Fund’s recent performance. Based upon its review, the Board concluded that the Fund’s performance was satisfactory relative to the performance of its peer universe and its custom benchmark.
Mangement Fees and Expenses
In considering the Fund’s fees and expenses, the Board compared the Fund’s fees and total expense ratio with those of comparable funds in its expense group. Among other findings, the data indicated that the Fund’s advisory and administrative fees (after taking into account waivers and/or reimbursements) (referred to collectively as “management fees”) were above the median of the Fund’s expense group and the Fund’s total expenses (net of waivers and/or
Calvert
Global Water Fund
September 30, 2023
Board of Directors' Contract Approval — continued
reimbursements) were at the median of the Fund’s expense group. The Board took into account the Adviser’s current undertaking to maintain expense limitations for the Fund and that the Adviser was waiving and/or reimbursing a portion of the Fund’s expenses. Based upon its review, the Board concluded that the management fees were reasonable in view of the nature, extent and quality of services provided by the Adviser.
Profitability and Other “Fall-Out” Benefits
The Board reviewed the Adviser’s profitability in regard to the Fund and the Calvert Funds in the aggregate. In reviewing the overall profitability of the Fund to the Adviser, the Board also considered the fact that the Adviser and its affiliates provided sub-transfer agency support, administrative and distribution services to the Fund for which they received compensation. The information considered by the Board included the profitability of the Fund to the Adviser and its affiliates without regard to any marketing support or other payments by the Adviser and its affiliates to third parties in respect of distribution services. The Board also considered that the Adviser and its affiliates derived benefits to their reputation and other indirect benefits from their relationships with the Fund. Based upon its review, the Board concluded that the Adviser’s and its affiliates’ level of profitability from their relationships with the Fund was reasonable.
Economies of Scale
The Board considered the effect of the Fund’s current size and its potential growth on its performance and fees. The Board also took into account the breakpoint in the advisory fee schedule for the Fund that would reduce the advisory fee rate on assets above a specific asset level. The Board noted that if the Fund’s assets increased over time, the Fund might realize other economies of scale if assets increased proportionally more than certain other expenses.
Calvert
Global Energy Solutions Fund
Global Water Fund
September 30, 2023
Liquidity Risk Management Program
Each Fund has implemented a written liquidity risk management program (Program) and related procedures to manage its liquidity in accordance with Rule 22e-4 under the Investment Company Act of 1940, as amended (Liquidity Rule). The Liquidity Rule defines “liquidity risk” as the risk that a fund could not meet requests to redeem shares issued by the fund without significant dilution of the remaining investors’ interests in the fund. Each Fund’s Board of Trustees/Directors has designated the investment adviser to serve as the administrator of the Program and the related procedures. The administrator has established a Liquidity Risk Management Oversight Committee (Committee) to perform the functions necessary to administer the Program. As part of the Program, the administrator is responsible for identifying illiquid investments and categorizing the relative liquidity of each Fund’s investments in accordance with the Liquidity Rule. Under the Program, the administrator assesses, manages, and periodically reviews each Fund’s liquidity risk, and is responsible for making certain reports to the Fund’s Board of Trustees/Directors and the Securities and Exchange Commission (SEC) regarding the liquidity of the Fund’s investments, and to notify the Board of Trustees/Directors and the SEC of certain liquidity events specified in the Liquidity Rule. The liquidity of each Fund’s portfolio investments is determined based on a number of factors including, but not limited to, relevant market, trading and investment-specific considerations under the Program.
At a meeting of each Fund’s Board of Trustees/Directors on June 13, 2023, the Committee provided a written report to the Fund’s Board of Trustees/ Directors pertaining to the operation, adequacy, and effectiveness of implementation of the Program, as well as the operation of the highly liquid investment minimum (if applicable) for the period January 1, 2022 through December 31, 2022 (Review Period). The Program operated effectively during the Review Period, supporting the administrator’s ability to assess, manage and monitor Fund liquidity risk, including during periods of market volatility and net redemptions. During the Review Period, each Fund met redemption requests on a timely basis.
There can be no assurance that the Program will achieve its objectives in the future. Please refer to each Fund’s prospectus for more information regarding the Fund’s exposure to liquidity risk and other principal risks to which an investment in the Fund may be subject.
Calvert
Global Energy Solutions Fund
Global Water Fund
September 30, 2023
Management and Organization
Fund Management. The Directors of Calvert Impact Fund, Inc. (the Corporation) are responsible for the overall management and supervision of the affairs of the Corporation. The Board members and officers of the Corporation are listed below. Except as indicated, each individual has held the office shown or other offices in the same company for the last five years. Board members hold indefinite terms of office. Each Board member holds office until his or her successor is elected and qualified, or until his or her earlier death, resignation, retirement, removal or disqualification. Under the terms of the Funds' current Board member retirement policy, an Independent Board member must retire at the end of the calendar year in which he or she turns 75. However, if such retirement would cause the Funds to be out of compliance with Section 16 of the 1940 Act or any other regulations or guidance of the SEC, then such retirement will not become effective until such time as action has been taken for the Funds to be in compliance therewith. The “noninterested Directors” consist of those Directors who are not “interested persons” of the Corporation, as that term is defined under the 1940 Act. The business address of each Board member and the Chief Compliance Officer is 2050 M Street NW, Washington, DC 20036 and the business address of the Secretary, Vice President and Chief Legal Officer and the Treasurer is Two International Place, Boston, Massachusetts 02110. As used below, “CRM” refers to Calvert Research and Management and “Eaton Vance” refers to Eaton Vance Management. Each Director oversees 46 funds in the Calvert fund complex. Each of Eaton Vance and CRM are indirect, wholly owned subsidiaries of Morgan Stanley. Each officer affiliated with CRM may hold a position with other CRM affiliates that is comparable to his or her position with CRM listed below.
| Name and Year of Birth | Corporation
Position(s) | Length of
Service | Principal Occupation(s) and Other Directorships
During Past Five Years and Other Relevant Experience |
| Interested Director | | | |
Theodore H. Eliopoulos(1)
1964 | Director and
President | Since 2022 | President and Chief Executive Officer of CRM and senior sponsor of Morgan Stanley Investment Management’s (MSIM) Diversity Council. Formerly, Vice Chairman & Head of Strategic Partnerships at MSIM (2019-2022). Former Chief Investment Officer and interim Chief Investment Officer (2014-2018) and Senior Investment Officer of Real Estate and Real Assets at California Public Employees’ Retirement System (CalPERS) (2007-2014). Former Chief Deputy Treasurer and Deputy Treasurer at the California State Treasurer's Office (2002-2006). Mr. Eliopoulos is an interested person because of his positions with CRM and certain affiliates.
Other Directorships. The Robert Toigo Foundation; Pacific Pension & Investment Institute (PPI). |
| Noninterested Directors |
Richard L. Baird, Jr.(2)
1948 | Director | Since 2005 | Regional Disaster Recovery Lead, American Red Cross of Greater
Pennsylvania (since 2017). Volunteer, American Red Cross (since 2015).
Former President and CEO of Adagio Health Inc. (retired in 2014) in
Pittsburgh, PA.
Other Directorships. None. |
Alice Gresham Bullock
1950 | Chair and
Director | Since 2016 | Professor Emerita at Howard University School of Law. Dean Emerita of
Howard University School of Law and Deputy Director of the Association
of American Law Schools (1992-1994).
Other Directorships. None. |
Cari M. Dominguez
1949 | Director | Since 2016 | Former Chair of the U.S. Equal Employment Opportunity Commission.
Other Directorships. ManpowerGroup Inc. (workforce solutions company);
Triple S Management Corporation (managed care); National Association of Corporate Directors. |
Karen Fang(3)
1958 | Director | Since 2023 | Formerly, Managing Director, Wealth Management at GAMCO Asset Management (asset management firm) (2020-2023). Formerly, Managing Director, Senior Portfolio Manager of Fiduciary Trust Company International (wealth management firm) (1993-2019).
Other Directorships. None. |
John G. Guffey, Jr.(2)
1948 | Director | Since 2005 | President of Aurora Press Inc., a privately held publisher of trade paperbacks
(since January 1997).
Other Directorships. Calvert Impact Capital, Inc. (through December 31, 2018); Calvert Ventures, LLC. |
Miles D. Harper, III
1962 | Director | Since 2000 | Partner, Carr Riggs & Ingram (public accounting firm) since October 2014.
Partner, Gainer Donnelly & Desroches (public accounting firm) (now Carr
Riggs & Ingram) (November 1999 - September 2014).
Other Directorships. Bridgeway Funds (9) (asset management). |
Joy V. Jones
1950 | Director | Since 2000 | Attorney.
Other Directorships. Palm Management Corporation. |
Calvert
Global Energy Solutions Fund
Global Water Fund
September 30, 2023
Management and Organization — continued
| Name and Year of Birth | Corporation
Position(s) | Length of
Service | Principal Occupation(s) and Other Directorships
During Past Five Years and Other Relevant Experience |
| Noninterested Directors (continued) |
Eddie Ramos(3)
1967 | Director | Since 2023 | Private investor (2022-present). Formerly, Head of External Advisors/Diversity Portfolio Management at the New Jersey Division of Investment (2020-2022). Formerly, Chief Investment Officer and Lead Portfolio Manager – Global Fundamental Equities at Cornerstone Capital Management (asset management firm) (2011-2017).
Other Directorships. Macquarie Optimum Funds (6) (asset management). |
Anthony A. Williams
1951 | Director | Since 2016 | CEO and Executive Director of the Federal City Council (July 2012 to
present); Senior Adviser and Independent Consultant for King and
Spalding LLP (September 2015 to present); Executive Director of Global
Government Practice at the Corporate Executive Board (January 2010 to
January 2012).
Other Directorships. Freddie Mac; Evoq Properties/Meruelo Maddux
Properties, Inc. (real estate management); Weston Solutions, Inc.
(environmental services); Bipartisan Policy Center’s Debt Reduction Task Force;
Chesapeake Bay Foundation; Catholic University of America; Urban Institute (research organization); The Howard Hughes Corporation (real estate development); Old Dominion National Bank. |
| Name and Year of Birth | Corporation
Position(s) | Length of
Service | Principal Occupation(s)
During Past Five Years |
| Principal Officers who are not Directors |
Hope L. Brown
1973 | Chief
Compliance
Officer | Since 2014 | Chief Compliance Officer of 46 registered investment companies advised
by CRM (since 2014). Vice President and Chief Compliance Officer,
Wilmington Funds (2012-2014). |
Deidre E. Walsh
1971 | Secretary,
Vice President
and Chief
Legal Officer | Since 2021 | Vice President of CRM and officer of 46 registered investment companies
advised by CRM (since 2021). Also Vice President of Eaton Vance and
certain of its affiliates and officer of 127 registered investment companies
advised or administered by Eaton Vance. |
James F. Kirchner
1967 | Treasurer | Since 2016 | Vice President of CRM and officer of 46 registered investment companies
advised by CRM (since 2016). Also Vice President of Eaton Vance and
certain of its affiliates and officer of 127 registered investment companies
advised or administered by Eaton Vance. |
| | | | |
| (1) Mr. Eliopoulos is an interested person of the Funds because of his positions with the Funds’ adviser and certain affiliates. |
| (2) Effective December 31, 2023, Richard L. Baird, Jr. and John G. Guffey, Jr. will retire from the Board of Directors. |
| (3) Ms. Fang and Mr. Ramos began serving as Directors effective October 30, 2023. |
The SAI for the Funds includes additional information about the Directors and officers of the Funds and can be obtained without charge on Calvert’s website at www.calvert.com or by calling 1-800-368-2745.
| FACTS | WHAT DOES EATON VANCE DO WITH YOUR
PERSONAL INFORMATION? |
| Why? | Financial companies choose how they share your personal information. Federal law gives consumers the right to limit some but not all sharing. Federal law also requires us to tell you how we collect, share, and protect your personal information. Please read this notice carefully to understand what we do. |
| |
| What? | The types of personal information we collect and share depend on the product or service you have with us. This information can include:■ Social Security number and income
■
investment experience and risk tolerance
■
checking account number and wire transfer instructions |
| |
| How? | All financial companies need to share customers’ personal information to run their everyday business. In the section below, we list the reasons financial companies can share their customers’ personal information; the reasons Eaton Vance chooses to share; and whether you can limit this sharing. |
Reasons we can share your
personal information | Does Eaton Vance
share? | Can you limit
this sharing? |
| For our everyday business purposes — such as to process your transactions, maintain your account(s), respond to court orders and legal investigations, or report to credit bureaus | Yes | No |
| For our marketing purposes — to offer our products and services to you | Yes | No |
| For joint marketing with other financial companies | No | We don’t share |
| For our investment management affiliates’ everyday business purposes — information about your transactions, experiences, and creditworthiness | Yes | Yes |
| For our affiliates’ everyday business purposes — information about your transactions and experiences | Yes | No |
| For our affiliates’ everyday business purposes — information about your creditworthiness | No | We don’t share |
| For our investment management affiliates to market to you | Yes | Yes |
| For our affiliates to market to you | No | We don’t share |
| For nonaffiliates to market to you | No | We don’t share |
To limit our
sharing | Call toll-free 1-800-368-2745 or email: CRMPrivacy@calvert.comPlease note:If you are a new customer, we can begin sharing your information 30 days from the date we sent this notice. When you are no longer our customer, we continue to share your information as described in this notice. However, you can contact us at any time to limit our sharing. |
| Questions? | Call toll-free 1-800-368-2745 or email: CRMPrivacy@calvert.com |
| Privacy Notice — continued | April 2021 |
| Who we are |
| Who is providing this notice? | Eaton Vance Management, Eaton Vance Distributors, Inc., Eaton Vance Trust Company, Eaton Vance Management (International) Limited, Eaton Vance Advisers International Ltd., Eaton Vance Global Advisors Limited, Eaton Vance Management’s Real Estate Investment Group, Boston Management and Research, Calvert Research and Management, Eaton Vance and Calvert Fund Families and our investment advisory affiliates (“Eaton Vance”) (see Investment Management Affiliates definition below) |
| What we do |
How does Eaton Vance
protect my personal
information? | To protect your personal information from unauthorized access and use, we use security measures that comply with federal law. These measures include computer safeguards and secured files and buildings. We have policies governing the proper handling of customer information by personnel and requiring third parties that provide support to adhere to appropriate security standards with respect to such information. |
How does Eaton Vance
collect my personal
information? | We collect your personal information, for example, when you■ open an account or make deposits or withdrawals from your account
■
buy securities from us or make a wire transfer
■
give us your contact informationWe also collect your personal information from others, such as credit bureaus, affiliates, or other companies. |
| Why can’t I limit all sharing? | Federal law gives you the right to limit only■ sharing for affiliates’ everyday business purposes — information about your creditworthiness
■
affiliates from using your information to market to you
■
sharing for nonaffiliates to market to youState laws and individual companies may give you additional rights to limit sharing. See below for more on your rights under state law. |
| Definitions |
Investment Management
Affiliates | Eaton Vance Investment Management Affiliates include registered investment advisers, registered broker- dealers, and registered and unregistered funds. Investment Management Affiliates does not include entities associated with Morgan Stanley Wealth Management, such as Morgan Stanley Smith Barney LLC and Morgan Stanley & Co. |
| Affiliates | Companies related by common ownership or control. They can be financial and nonfinancial companies.■ Our affiliates include companies with a Morgan Stanley name and financial companies such as Morgan Stanley Smith Barney LLC and Morgan Stanley & Co. |
| Nonaffiliates | Companies not related by common ownership or control. They can be financial and nonfinancial companies.■ Eaton Vance does not share with nonaffiliates so they can market to you. |
| Joint marketing | A formal agreement between nonaffiliated financial companies that together market financial products or services to you.■ Eaton Vance doesn’t jointly market. |
| Other important information |
| Vermont: Except as permitted by law, we will not share personal information we collect about Vermont residents with Nonaffiliates unless you provide us with your written consent to share such information.California: Except as permitted by law, we will not share personal information we collect about California residents with Nonaffiliates and we will limit sharing such personal information with our Affiliates to comply with California privacy laws that apply to us. |
Delivery of Shareholder Documents. The Securities and Exchange Commission (SEC) permits funds to deliver only one copy of shareholder documents, including prospectuses, proxy statements and shareholder reports, to fund investors with multiple accounts at the same residential or post office box address. This practice is often called “householding” and it helps eliminate duplicate mailings to shareholders. Calvert funds, or your financial intermediary, may household the mailing of your documents indefinitely unless you instruct Calvert funds, or your financial intermediary, otherwise. If you would prefer that your Calvert fund documents not be householded, please contact Calvert funds at 1-800-368-2745, or contact your financial intermediary. Your instructions that householding not apply to delivery of your Calvert fund documents will typically be effective within 30 days of receipt by Calvert funds or your financial intermediary.
Portfolio Holdings. Each Calvert fund files a schedule of portfolio holdings on Part F to Form N-PORT with the SEC. Certain information filed on Form N-PORT may be viewed on the Calvert website at www.calvert.com, by calling Calvert at 1-800-368-2745 or in the EDGAR database on the SEC’s website at www.sec.gov.
Proxy Voting. The Proxy Voting Guidelines that each Calvert fund uses to determine how to vote proxies relating to portfolio securities is provided as an Appendix to the fund’s Statement of Additional Information. The Statement of Additional Information can be obtained free of charge by calling the Calvert funds at 1-800-368-2745, by visiting the Calvert funds’ website at www.calvert.com or visiting the SEC’s website at www.sec.gov. Information regarding how a Calvert fund voted proxies relating to portfolio securities during the most recent 12-month period ended June 30 is available by calling Calvert funds, by visiting the Calvert funds’ website at www.calvert.com or by visiting the SEC’s website at www.sec.gov.
Tailored Shareholder Reports. Effective January 24, 2023, the SEC adopted rule and form amendments to require open-end mutual funds and ETFs to transmit concise and visually engaging streamlined annual and semiannual reports to shareholders that highlight key information. Other information, including financial statements, will no longer appear in a streamlined shareholder report but must be available online, delivered free of charge upon request, and filed on a semiannual basis on Form N-CSR. The rule and form amendments have a compliance date of July 24, 2024. At this time, management is evaluating the impact of these amendments on the shareholder reports for the Calvert Funds.
This Page Intentionally Left Blank
This Page Intentionally Left Blank
This Page Intentionally Left Blank
Investment Adviser and Administrator
Calvert Research and Management
2050 M Street NW
Washington, DC 20036
Principal Underwriter*
Eaton Vance Distributors, Inc.
Two International Place
Boston, MA 02110
(617) 482-8260
Custodian
State Street Bank and Trust Company
One Congress Street, Suite 1
Boston, MA 02114-2016
Transfer Agent
SS&C Global Investor & Distribution Solutions, Inc.
2000 Crown Colony Drive
Quincy, MA 02169
Independent Registered Public Accounting Firm
Deloitte & Touche LLP
200 Berkeley Street
Boston, MA 02116-5022
Fund Offices
2050 M Street NW
Washington, DC 20036
* FINRA BrokerCheck. Investors may check the background of their Investment Professional by contacting the Financial Industry Regulatory Authority (FINRA). FINRA BrokerCheck is a free tool to help investors check the professional background of current and former FINRA-registered securities firms and brokers. FINRA BrokerCheck is available by calling 1-800-289-9999 and at www.FINRA.org. The FINRA BrokerCheck brochure describing this program is available to investors at www.FINRA.org.
Printed on recycled paper.
24199 9.30.23
Item 2. Code of Ethics
The registrant has adopted a code of ethics applicable to its Principal Executive Officer, Principal Financial Officer and Principal Accounting Officer. The registrant undertakes to provide a copy of such code of ethics to any person upon request, without charge, by calling 1-800-368-2745. The registrant has not amended the code of ethics as described in Form N-CSR during the period covered by this report. The registrant has not granted any waiver, including an implicit waiver, from a provision of the code of ethics as described in Form N-CSR during the period covered by this report.
Item 3. Audit Committee Financial Expert
The registrant’s Board of Directors has determined that Miles D. Harper III, an “independent” Director serving on the registrant’s audit committee, is an “audit committee financial expert,” as defined in Item 3 of Form N-CSR. Under applicable securities laws, a person who is determined to be an audit committee financial expert will not be deemed an “expert” for any purpose, including without limitation for the purposes of Section 11 of the Securities Act of 1933, as a result of being designated or identified as an audit committee financial expert.
The designation or identification of a person as an audit committee financial expert does not impose on such person any duties, obligations, or liabilities that are greater than the duties, obligations, and liabilities imposed on such person as a member of the audit committee and Board of Directors in the absence of such designation or identification.
Item 4. Principal Accountant Fees and Services
(a) – (d)
The following table presents the aggregate fees billed to the registrant for the registrant’s fiscal years ended September 30, 2022 and September 30, 2023 by its principal accountant for professional services rendered for the audit of the registrant’s annual financial statements and fees billed for other services rendered by its principal accountant during such periods.
| | | | | | | | | | | | | | | | |
Fiscal Years Ended | | 9/30/22 | | | %* | | | 9/30/23 | | | %* | |
Audit Fees | | $ | 92,000 | | | | 0 | % | | $ | 101,600 | | | | 0 | % |
Audit-Related Fees(1) | | $ | 0 | | | | 0 | % | | $ | 0 | | | | 0 | % |
Tax Fees(2) | | $ | 0 | | | | 0 | % | | $ | 0 | | | | 0 | % |
All Other Fees(3) | | $ | 0 | | | | 0 | % | | $ | 0 | | | | 0 | % |
| | | | | | | | | | | | | | | | |
Total | | $ | 92,000 | | | | 0 | % | | $ | 101,600 | | | | 0 | % |
| | | | | | | | | | | | | | | | |
| * | Percentage of fees approved by the Audit Committee pursuant to (c )(7)(i)(C ) of Rule 2-01 of Reg. S-X (statutory de minimis waiver of Committee’s requirement to pre-approve). |
| (1) | Audit-related fees consist of the aggregate fees billed for assurance and related services that are reasonably related to the performance of the audit of the registrant’s financial statements and are not reported under the category of audit fees. |
| (2) | Tax fees consist of the aggregate fees billed for professional services rendered by the principal accountant relating to tax compliance, tax advice, and tax planning and specifically include fees for tax return preparation and other related tax compliance/planning matters. |
| (3) | All other fees consist of the aggregate fees billed for products and services provided by the principal accountant other than audit, audit-related, and tax services. |
(e) The Audit Committee is required to pre-approve all audit and non-audit services provided to the registrant by the auditors, and to the registrant’s investment adviser, and any entity controlling, controlled by, or under common control with the adviser that provides ongoing services to the registrant. In determining whether to pre-approve non-audit services, the Audit Committee considers whether the services are consistent with maintaining the independence of the auditors. The Committee may delegate its authority to pre-approve certain matters to one or more of its members. In this regard, the Committee has delegated authority jointly to the Audit Committee Chair together with another Committee member with respect to non-audit services not exceeding $25,000 in each instance. In addition, the Committee has pre-approved the retention of the auditors to provide tax-related services related to the tax treatment and tax accounting of newly acquired securities, upon request by the investment adviser in each instance.
(f) Not applicable.
(g) Aggregate non-audit fees billed by the registrant’s principal accountant for services rendered to the registrant, and rendered to the registrant’s investment adviser, and any entity controlling, controlled by, or under common control with the adviser that provides ongoing services to the registrant for each of the last two fiscal years of the registrant:
| | | | | | | | | | | | |
Fiscal Year ended 9/30/22 | | | Fiscal Year ended 9/30/23 | |
$ | | | % | * | | $ | | | | | % | * |
$0 | | | 0 | % | | $ | 0 | | | | 0 | % |
| * | Percentage of fees approved by the Audit Committee pursuant to (c)(7)(i)(C) of Rule 2-01 of Reg. S-X (statutory de minimis waiver of Committee’s requirement to pre-approve). |
(h) The registrant’s audit committee has considered whether the provision by the registrant’s principal accountant of non-audit services to the registrant’s investment adviser and any entity controlling, controlled by, or under common control with the adviser that provides ongoing services to the registrant that were not pre-approved pursuant to Rule 2-01(c)(7)(ii) of Regulation S-X is compatible with maintaining the principal accountant’s independence.
(i) Not applicable.
(j) Not applicable.
Item 5. Audit Committee of Listed Registrants
Not applicable.
Item 6. Schedule of Investments
Please see schedule of investments contained in the Report to Stockholders included under Item 1 of this Form N-CSR.
Item 7. Disclosure of Proxy Voting Policies and Procedures for Closed-End Management Investment Companies
Not applicable.
Item 8. Portfolio Managers of Closed-End Management Investment Companies
Not applicable.
Item 9. Purchases of Equity Securities by Closed-End Management Investment Company and Affiliated Purchasers
Not applicable.
Item 10. Submission of Matters to a Vote of Security Holders
No material changes.
Item 11. Controls and Procedures
(a) The registrant’s principal executive and principal financial officers have concluded that the registrant’s disclosure controls and procedures (as defined in Rule 30a-3(c) under the Investment Company Act of 1940 Act, as amended (the “1940 Act”) are effective, based on the evaluation of these controls and procedures required by Rule 30a-3(b) under the 1940 Act and Rules 13a-15(b) or 15d-15(b) under the Securities Exchange Act of 1934 (“Exchange Act”), as of a date within 90 days of the filing date of this report.
(b) There was no change in the registrant’s internal control over financial reporting (as defined in Rule 30a-3(d) under the 1940 Act) that occurred during the period covered by this report that has materially affected, or is reasonably likely to materially affect, the registrant’s internal control over financial reporting.
Item 12. Disclosure of Securities Lending Activities for Closed-End Management Investment Companies
Not applicable.
Item 13. Exhibits
| (a)(1) | Registrant’s Code of Ethics – Not applicable (please see Item 2). |
Signatures
Pursuant to the requirements of the Securities Exchange Act of 1934 and the Investment Company Act of 1940, the registrant has duly caused this report to be signed on its behalf by the undersigned, thereunto duly authorized.
| | |
| CALVERT IMPACT FUND, INC. |
| |
| By: | | /s/ Theodore H. Eliopoulos |
| | Theodore H. Eliopoulos |
| | President |
Date: November 22, 2023
Pursuant to the requirements of the Securities Exchange Act of 1934 and the Investment Company Act of 1940, this report has been signed below by the following persons on behalf of the registrant and in the capacities and on the dates indicated.
| | |
| By: | | /s/ James F. Kirchner |
| | James F. Kirchner |
| | Treasurer |
| |
| Date: | | November 22, 2023 |
| |
| By: | | /s/ Theodore H. Eliopoulos |
| | Theodore H. Eliopoulos |
| | President |
| |
| Date: | | November 22, 2023 |