UNITED STATES
SECURITIES AND EXCHANGE COMMISSION
Washington, D.C. 20549
Form N-CSR
CERTIFIED SHAREHOLDER REPORT OF REGISTERED
MANAGEMENT INVESTMENT COMPANIES
Investment Company Act File Number: 811-10045
CALVERT IMPACT FUND, INC.
(Exact Name of Registrant as Specified in Charter)
1825 Connecticut Avenue NW, Suite 400, Washington, DC 20009
(Address of Principal Executive Offices)
Deidre E. Walsh
Two International Place, Boston, Massachusetts 02110
(Name and Address of Agent for Services)
(202) 238-2200
(Registrant’s Telephone Number)
September 30
Date of Fiscal Year End
September 30, 2022
Date of Reporting Period
| Item 1. | Reports to Stockholders |


| % Average Annual Total Returns1,2 | Class Inception Date | Performance Inception Date | One Year | Five Years | Ten Years |
| Class A at NAV | 10/01/2004 | 10/01/2004 | (17.82)% | 5.34% | 9.63% |
| Class A with 5.25% Maximum Sales Charge | — | — | (22.15) | 4.21 | 9.04 |
| Class C at NAV | 04/01/2005 | 10/01/2004 | (18.42) | 4.55 | 8.96 |
| Class C with 1% Maximum Deferred Sales Charge | — | — | (19.18) | 4.55 | 8.96 |
| Class I at NAV | 04/29/2005 | 10/01/2004 | (17.61) | 5.63 | 10.07 |
| Class R6 at NAV | 02/01/2019 | 10/01/2004 | (17.56) | 5.68 | 10.10 |
| Russell 2000® Index | — | — | (23.50)% | 3.55% | 8.55% |
| % Total Annual Operating Expense Ratios3 | Class A | Class C | Class I | Class R6 |
| 1.19% | 1.94% | 0.94% | 0.86% |
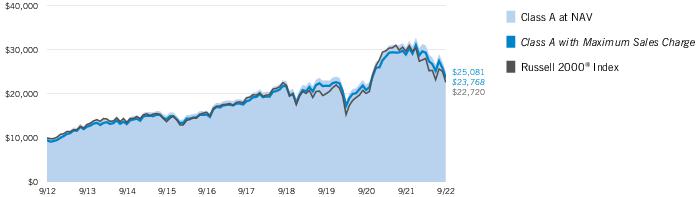
| Growth of Investment2 | Amount Invested | Period Beginning | At NAV | With Maximum Sales Charge |
| Class C | $10,000 | 09/30/2012 | $23,593 | N.A. |
| Class I, at minimum investment | $1,000,000 | 09/30/2012 | $2,612,803 | N.A. |
| Class R6, at minimum investment | $5,000,000 | 09/30/2012 | $13,093,593 | N.A. |
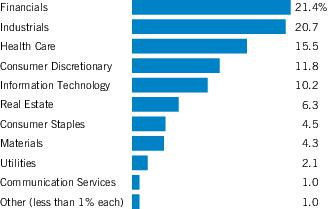
| Sector Allocation (% of net assets)1 |
| Top 10 Holdings (% of net assets)1 | |
| CBIZ, Inc. | 3.3% |
| Performance Food Group Co. | 3.1 |
| Commerce Bancshares, Inc. | 2.6 |
| Chemed Corp. | 2.6 |
| SouthState Corp. | 2.6 |
| Ryan Specialty Holdings, Inc. | 2.4 |
| Addus HomeCare Corp. | 2.4 |
| Dorman Products, Inc. | 2.4 |
| RLI Corp. | 2.1 |
| ONE Gas, Inc. | 2.1 |
| Total | 25.6% |
| 1 | Excludes cash and cash equivalents. |
| † | The views expressed in this report are those of the portfolio manager(s) and are current only through the date stated at the top of this page. These views are subject to change at any time based upon market or other conditions, and Calvert and the Fund(s) disclaim any responsibility to update such views. These views may not be relied upon as investment advice and, because investment decisions are based on many factors, may not be relied upon as an indication of trading intent on behalf of any Calvert fund. This commentary may contain statements that are not historical facts, referred to as “forward-looking statements.” The Fund’s actual future results may differ significantly from those stated in any forward-looking statement, depending on factors such as changes in securities or financial markets or general economic conditions, the volume of sales and purchases of Fund shares, the continuation of investment advisory, administrative and service contracts, and other risks discussed from time to time in the Fund’s filings with the Securities and Exchange Commission. |
| 1 | Russell 2000® Index is an unmanaged index of 2,000 U.S. small-cap stocks. Unless otherwise stated, index returns do not reflect the effect of any applicable sales charges, commissions, expenses, taxes or leverage, as applicable. It is not possible to invest directly in an index. |
| 2 | Total Returns at NAV do not include applicable sales charges. If sales charges were deducted, the returns would be lower. Total Returns shown with maximum sales charge reflect the stated maximum sales charge. Unless otherwise stated, performance does not reflect the deduction of taxes on Fund distributions or redemptions of Fund shares.Performance prior to the inception date of a class may be linked to the performance of an older class of the Fund. This linked performance is adjusted for any applicable sales charge, but is not adjusted for class expense differences. If adjusted for such differences, the performance would be different. The performance of Class R6 is linked to Class I. Performance presented in the Financial Highlights included in the financial statements is not linked.Effective November 5, 2020, Class C shares automatically convert to Class A shares eight years after purchase. The average annual total returns listed for Class C reflect conversion to Class A shares after eight years. Prior to November 5, 2020, Class C shares automatically converted to Class A shares ten years after purchase.Calvert Research and Management became the investment adviser to the Fund on December 31, 2016. Performance reflected prior to such date is that of the Fund’s former investment adviser. |
| 3 | Source: Fund prospectus. The expense ratios for the current reporting period can be found in the Financial Highlights section of this report. Performance reflects expenses waived and/or reimbursed, if applicable. Without such waivers and/or reimbursements, performance would have been lower. |
| Fund profile subject to change due to active management. | |
| Additional Information | |
| S&P 500® Index is an unmanaged index of large-cap stocks commonly used as a measure of U.S. stock market performance. Dow Jones Industrial Average® is a price-weighted average of 30 blue-chip stocks that are generally the leaders in their industry. S&P Dow Jones Indices are a product of S&P Dow Jones Indices LLC (“S&P DJI”) and have been licensed for use. S&P® and S&P 500® are registered trademarks of S&P DJI; Dow Jones® is a registered trademark of Dow Jones Trademark Holdings LLC (“Dow Jones”); S&P DJI, Dow Jones and their respective affiliates do not sponsor, endorse, sell or promote the Fund, will not have any liability with respect thereto and do not have any liability for any errors, omissions, or interruptions of the S&P Dow Jones Indices. Nasdaq Composite Index is a market capitalization-weighted index of all domestic and international securities listed on Nasdaq. Source: Nasdaq, Inc. The information is provided by Nasdaq (with its affiliates, are referred to as the “Corporations”) and Nasdaq’s third party licensors on an “as is” basis and the Corporations make no guarantees and bear no liability of any kind with respect to the information or the Fund. |
| Beginning Account Value (4/1/22) | Ending Account Value (9/30/22) | Expenses Paid During Period* (4/1/22 – 9/30/22) | Annualized Expense Ratio | |
| Actual | ||||
| Class A | $1,000.00 | $ 809.60 | $5.44 | 1.20% |
| Class C | $1,000.00 | $ 806.50 | $8.83 | 1.95% |
| Class I | $1,000.00 | $ 810.60 | $4.31 | 0.95% |
| Class R6 | $1,000.00 | $ 810.90 | $3.90 | 0.86% |
| Hypothetical | ||||
| (5% return per year before expenses) | ||||
| Class A | $1,000.00 | $1,019.05 | $6.07 | 1.20% |
| Class C | $1,000.00 | $1,015.29 | $9.85 | 1.95% |
| Class I | $1,000.00 | $1,020.31 | $4.81 | 0.95% |
| Class R6 | $1,000.00 | $1,020.76 | $4.36 | 0.86% |
| * | Expenses are equal to the Fund's annualized expense ratio for the indicated Class, multiplied by the average account value over the period, multiplied by 183/365 (to reflect the one-half year period). The Example assumes that the $1,000 was invested at the net asset value per share determined at the close of business on March 31, 2022. |
| Common Stocks — 98.7% |
| Security | Shares | Value | |
| Aerospace & Defense — 3.1% | |||
| Hexcel Corp. | 741,341 | $ 38,342,157 | |
| Woodward, Inc. | 444,662 | 35,688,572 | |
| $ 74,030,729 | |||
| Auto Components — 4.3% | |||
| Dana, Inc. | 1,952,797 | $ 22,320,470 | |
| Dorman Products, Inc.(1) | 689,597 | 56,629,705 | |
| Visteon Corp.(1) | 227,751 | 24,155,271 | |
| $ 103,105,446 | |||
| Automobiles — 0.9% | |||
| Harley-Davidson, Inc. | 661,098 | $ 23,059,098 | |
| $ 23,059,098 | |||
| Banks — 12.8% | |||
| Commerce Bancshares, Inc. | 933,056 | $ 61,730,985 | |
| Community Bank System, Inc. | 680,261 | 40,870,081 | |
| CVB Financial Corp. | 1,242,600 | 31,462,632 | |
| Glacier Bancorp, Inc. | 594,276 | 29,196,780 | |
| Independent Bank Corp. | 496,745 | 37,022,405 | |
| SouthState Corp. | 777,054 | 61,480,512 | |
| Stock Yards Bancorp, Inc. | 179,465 | 12,205,415 | |
| Wintrust Financial Corp. | 428,940 | 34,980,057 | |
| $ 308,948,867 | |||
| Biotechnology — 1.1% | |||
| Neurocrine Biosciences, Inc.(1) | 255,098 | $ 27,093,959 | |
| $ 27,093,959 | |||
| Building Products — 5.9% | |||
| AAON, Inc. | 808,747 | $ 43,575,288 | |
| AZEK Co., Inc. (The)(1) | 2,689,843 | 44,705,191 | |
| CSW Industrials, Inc. | 331,686 | 39,735,983 | |
| Hayward Holdings, Inc.(1)(2) | 1,650,362 | 14,638,711 | |
| $ 142,655,173 | |||
| Capital Markets — 2.1% | |||
| Cohen & Steers, Inc. | 408,059 | $ 25,556,735 | |
| Stifel Financial Corp. | 473,897 | 24,599,993 | |
| $ 50,156,728 | |||
| Chemicals — 3.5% | |||
| Minerals Technologies, Inc. | 956,885 | $ 47,279,688 | |
| Security | Shares | Value | |
| Chemicals (continued) | |||
| Quaker Chemical Corp. | 258,936 | $ 37,385,180 | |
| $ 84,664,868 | |||
| Commercial Services & Supplies — 0.2% | |||
| MillerKnoll, Inc. | 351,364 | $ 5,481,278 | |
| $ 5,481,278 | |||
| Containers & Packaging — 0.8% | |||
| AptarGroup, Inc. | 205,381 | $ 19,517,356 | |
| $ 19,517,356 | |||
| Diversified Consumer Services — 2.2% | |||
| Bright Horizons Family Solutions, Inc.(1) | 218,647 | $ 12,604,999 | |
| Terminix Global Holdings, Inc.(1) | 1,065,871 | 40,812,201 | |
| $ 53,417,200 | |||
| Electronic Equipment, Instruments & Components — 1.6% | |||
| National Instruments Corp. | 995,946 | $ 37,587,002 | |
| $ 37,587,002 | |||
| Equity Real Estate Investment Trusts (REITs) — 6.3% | |||
| CubeSmart | 999,099 | $ 40,023,906 | |
| EastGroup Properties, Inc. | 254,760 | 36,772,059 | |
| Essential Properties Realty Trust, Inc. | 2,552,758 | 49,651,143 | |
| Rexford Industrial Realty, Inc. | 478,606 | 24,887,512 | |
| $ 151,334,620 | |||
| Food & Staples Retailing — 3.5% | |||
| Chefs' Warehouse, Inc. (The)(1) | 324,776 | $ 9,408,761 | |
| Performance Food Group Co.(1) | 1,750,549 | 75,186,079 | |
| $ 84,594,840 | |||
| Food Products — 1.0% | |||
| J&J Snack Foods Corp. | 179,830 | $ 23,282,590 | |
| $ 23,282,590 | |||
| Gas Utilities — 2.1% | |||
| ONE Gas, Inc. | 711,095 | $ 50,053,977 | |
| $ 50,053,977 | |||
| Health Care Equipment & Supplies — 5.8% | |||
| Envista Holdings Corp.(1) | 1,275,519 | $ 41,849,779 | |
| ICU Medical, Inc.(1) | 169,307 | 25,497,634 | |
| Integra LifeSciences Holdings Corp.(1) | 818,811 | 34,684,834 | |
| Neogen Corp.(1) | 1,708,787 | 23,871,754 | |
| Security | Shares | Value | |
| Health Care Equipment & Supplies (continued) | |||
| Tandem Diabetes Care, Inc.(1) | 271,091 | $ 12,971,704 | |
| $ 138,875,705 | |||
| Health Care Providers & Services — 8.7% | |||
| Addus HomeCare Corp.(1) | 596,733 | $ 56,832,851 | |
| Agiliti, Inc.(1)(2) | 2,422,309 | 34,663,242 | |
| Chemed Corp. | 141,261 | 61,668,902 | |
| R1 RCM, Inc.(1) | 1,133,199 | 20,998,178 | |
| US Physical Therapy, Inc. | 455,718 | 34,643,682 | |
| $ 208,806,855 | |||
| Hotels, Restaurants & Leisure — 2.3% | |||
| Texas Roadhouse, Inc. | 320,353 | $ 27,954,003 | |
| Wyndham Hotels & Resorts, Inc. | 452,770 | 27,777,439 | |
| $ 55,731,442 | |||
| Insurance — 6.5% | |||
| RLI Corp. | 490,848 | $ 50,253,018 | |
| Ryan Specialty Holdings, Inc.(1) | 1,413,875 | 57,431,603 | |
| Selective Insurance Group, Inc. | 606,805 | 49,393,927 | |
| $ 157,078,548 | |||
| Interactive Media & Services — 1.0% | |||
| CarGurus, Inc.(1) | 1,718,646 | $ 24,353,214 | |
| $ 24,353,214 | |||
| IT Services — 0.6% | |||
| Euronet Worldwide, Inc.(1) | 206,115 | $ 15,615,272 | |
| $ 15,615,272 | |||
| Leisure Products — 0.7% | |||
| Brunswick Corp. | 242,231 | $ 15,854,019 | |
| $ 15,854,019 | |||
| Machinery — 2.9% | |||
| Chart Industries, Inc.(1)(2) | 171,654 | $ 31,644,415 | |
| Middleby Corp. (The)(1) | 298,243 | 38,225,805 | |
| $ 69,870,220 | |||
| Oil, Gas & Consumable Fuels — 0.9% | |||
| Archaea Energy, Inc.(1)(2) | 1,173,322 | $ 21,131,529 | |
| $ 21,131,529 | |||
| Professional Services — 3.3% | |||
| CBIZ, Inc.(1) | 1,851,779 | $ 79,219,106 | |
| $ 79,219,106 | |||
| Security | Shares | Value | |
| Road & Rail — 1.9% | |||
| Landstar System, Inc. | 318,388 | $ 45,965,676 | |
| $ 45,965,676 | |||
| Semiconductors & Semiconductor Equipment — 0.6% | |||
| Ambarella, Inc.(1) | 272,963 | $ 15,335,061 | |
| $ 15,335,061 | |||
| Software — 7.4% | |||
| ACI Worldwide, Inc.(1) | 310,809 | $ 6,495,908 | |
| Altair Engineering, Inc., Class A(1) | 1,012,627 | 44,778,366 | |
| Clearwater Analytics Holdings, Inc., Class A(1)(2) | 1,353,643 | 22,727,666 | |
| Envestnet, Inc.(1) | 821,520 | 36,475,488 | |
| nCino, Inc.(1)(2) | 632,990 | 21,591,289 | |
| SPS Commerce, Inc.(1) | 364,083 | 45,230,031 | |
| $ 177,298,748 | |||
| Specialty Retail — 1.3% | |||
| Five Below, Inc.(1) | 116,706 | $ 16,066,915 | |
| National Vision Holdings, Inc.(1)(2) | 492,568 | 16,082,345 | |
| $ 32,149,260 | |||
| Trading Companies & Distributors — 3.4% | |||
| Core & Main, Inc., Class A(1)(2) | 1,866,016 | $ 42,433,204 | |
| Herc Holdings, Inc. | 381,312 | 39,610,691 | |
| $ 82,043,895 | |||
| Total Common Stocks (identified cost $2,495,334,392) | $2,378,312,281 | ||
| High Social Impact Investments — 0.1% |
| Security | Principal Amount (000's omitted) | Value | |
| Calvert Impact Capital, Inc., Community Investment Notes, 1.50%, 12/15/23(3)(4) | $ | 2,520 | $ 2,340,475 |
| Total High Social Impact Investments (identified cost $2,520,000) | $ 2,340,475 | ||
| Short-Term Investments — 0.8% | |||
| Affiliated Fund — 0.1% | |||
| Security | Shares | Value | |
| Morgan Stanley Institutional Liquidity Funds - Government Portfolio, Institutional Class, 2.80%(5) | 1,117,065 | $ 1,117,065 | |
| Total Affiliated Fund (identified cost $1,117,065) | $ 1,117,065 | ||
| Securities Lending Collateral — 0.7% | |||
| Security | Shares | Value | |
| State Street Navigator Securities Lending Government Money Market Portfolio, 3.07%(6) | 16,817,946 | $ 16,817,946 | |
| Total Securities Lending Collateral (identified cost $16,817,946) | $ 16,817,946 | ||
| Total Short-Term Investments (identified cost $17,935,011) | $ 17,935,011 | ||
| Total Investments — 99.6% (identified cost $2,515,789,403) | $2,398,587,767 | ||
| Other Assets, Less Liabilities — 0.4% | $ 10,725,595 | ||
| Net Assets — 100.0% | $2,409,313,362 | ||
| The percentage shown for each investment category in the Schedule of Investments is based on net assets. | |
| (1) | Non-income producing security. |
| (2) | All or a portion of this security was on loan at September 30, 2022. The aggregate market value of securities on loan at September 30, 2022 was $93,192,669. |
| (3) | May be deemed to be an affiliated company (see Note 7). |
| (4) | Restricted security. Total market value of restricted securities amounts to $2,340,475, which represents 0.1% of the net assets of the Fund as of September 30, 2022. |
| (5) | May be deemed to be an affiliated investment company. The rate shown is the annualized seven-day yield as of September 30, 2022. |
| (6) | Represents investment of cash collateral received in connection with securities lending. |
| Description | Acquisition Date | Cost |
| Calvert Impact Capital, Inc., Community Investment Notes, 1.50%, 12/15/23 | 12/14/20 | $2,520,000 |
| September 30, 2022 | |
| Assets | |
| Investments in securities of unaffiliated issuers, at value (identified cost $2,512,152,338) - including $93,192,669 of securities on loan | $ 2,395,130,227 |
| Investments in securities of affiliated issuers, at value (identified cost $3,637,065) | 3,457,540 |
| Cash | 71 |
| Receivable for investments sold | 7,169,167 |
| Receivable for capital shares sold | 26,876,658 |
| Dividends receivable | 2,648,824 |
| Dividends and interest receivable - affiliated | 112,522 |
| Securities lending income receivable | 8,608 |
| Directors' deferred compensation plan | 252,457 |
| Total assets | $2,435,656,074 |
| Liabilities | |
| Payable for investments purchased | $ 2,598,360 |
| Payable for capital shares redeemed | 4,233,989 |
| Deposits for securities loaned | 16,817,946 |
| Payable to affiliates: | |
| Investment advisory fee | 1,437,430 |
| Administrative fee | 254,700 |
| Distribution and service fees | 76,384 |
| Sub-transfer agency fee | 16,337 |
| Directors' deferred compensation plan | 252,457 |
| Accrued expenses | 655,109 |
| Total liabilities | $ 26,342,712 |
| Net Assets | $2,409,313,362 |
| Sources of Net Assets | |
| Paid-in capital | $ 2,500,722,587 |
| Accumulated loss | (91,409,225) |
| Net Assets | $2,409,313,362 |
| Class A Shares | |
| Net Assets | $ 241,335,414 |
| Shares Outstanding | 9,520,956 |
| Net Asset Value and Redemption Price Per Share (net assets ÷ shares of beneficial interest outstanding) | $ 25.35 |
| Maximum Offering Price Per Share (100 ÷ 94.75 of net asset value per share) | $ 26.75 |
| Class C Shares | |
| Net Assets | $ 26,452,336 |
| Shares Outstanding | 1,261,593 |
| Net Asset Value and Offering Price Per Share* (net assets ÷ shares of beneficial interest outstanding) | $ 20.97 |
| Class I Shares | |
| Net Assets | $ 1,858,333,814 |
| Shares Outstanding | 67,017,558 |
| Net Asset Value, Offering Price and Redemption Price Per Share (net assets ÷ shares of beneficial interest outstanding) | $ 27.73 |
| September 30, 2022 | |
| Class R6 Shares | |
| Net Assets | $ 283,191,798 |
| Shares Outstanding | 10,203,534 |
| Net Asset Value, Offering Price and Redemption Price Per Share (net assets ÷ shares of beneficial interest outstanding) | $ 27.75 |
| On sales of $50,000 or more, the offering price of Class A shares is reduced. | |
| * | Redemption price per share is equal to the net asset value less any applicable contingent deferred sales charge. |
| Year Ended | |
| September 30, 2022 | |
| Investment Income | |
| Dividend income | $ 30,573,300 |
| Dividend income - affiliated issuers | 200,638 |
| Interest income - affiliated issuers | 37,800 |
| Securities lending income, net | 39,661 |
| Total investment income | $ 30,851,399 |
| Expenses | |
| Investment advisory fee | $ 19,557,598 |
| Administrative fee | 3,451,341 |
| Distribution and service fees: | |
| Class A | 714,814 |
| Class C | 314,320 |
| Directors' fees and expenses | 128,833 |
| Custodian fees | 47,838 |
| Transfer agency fees and expenses | 2,448,270 |
| Accounting fees | 514,212 |
| Professional fees | 62,609 |
| Registration fees | 180,918 |
| Reports to shareholders | 257,470 |
| Miscellaneous | 98,806 |
| Total expenses | $ 27,777,029 |
| Waiver and/or reimbursement of expenses by affiliate | $ (17,193) |
| Net expenses | $ 27,759,836 |
| Net investment income | $ 3,091,563 |
| Realized and Unrealized Gain (Loss) | |
| Net realized gain (loss): | |
| Investment securities | $ 51,026,637 |
| Investment securities - affiliated issuers | 5,390 |
| Net realized gain | $ 51,032,027 |
| Change in unrealized appreciation (depreciation): | |
| Investment securities | $ (589,561,943) |
| Investment securities - affiliated issuers | (140,625) |
| Net change in unrealized appreciation (depreciation) | $(589,702,568) |
| Net realized and unrealized loss | $(538,670,541) |
| Net decrease in net assets from operations | $(535,578,978) |
| Year Ended September 30, | ||
| 2022 | 2021 | |
| Increase (Decrease) in Net Assets | ||
| From operations: | ||
| Net investment income (loss) | $ 3,091,563 | $ (136,027) |
| Net realized gain | 51,032,027 | 238,413,599 |
| Net change in unrealized appreciation (depreciation) | (589,702,568) | 379,999,418 |
| Net increase (decrease) in net assets from operations | $ (535,578,978) | $ 618,276,990 |
| Distributions to shareholders: | ||
| Class A | $ (21,285,960) | $ — |
| Class C | (2,622,244) | — |
| Class I | (169,776,999) | (2,198,171) |
| Class R6 | (6,322,583) | (92,105) |
| Total distributions to shareholders | $ (200,007,786) | $ (2,290,276) |
| Capital share transactions: | ||
| Class A | $ 26,725,533 | $ 29,601,756 |
| Class C | 2,508,514 | 8,858,899 |
| Class I | 47,837,245 | 670,027,418 |
| Class R6 | 263,403,378 | 22,140,747 |
| Net increase in net assets from capital share transactions | $ 340,474,670 | $ 730,628,820 |
| Net increase (decrease) in net assets | $ (395,112,094) | $1,346,615,534 |
| Net Assets | ||
| At beginning of year | $ 2,804,425,456 | $ 1,457,809,922 |
| At end of year | $2,409,313,362 | $2,804,425,456 |
| Class A | |||||
| Year Ended September 30, | |||||
| 2022 | 2021 | 2020 | 2019 | 2018 | |
| Net asset value — Beginning of year | $ 33.14 | $ 23.94 | $ 25.35 | $ 26.61 | $ 25.70 |
| Income (Loss) From Operations | |||||
| Net investment income (loss)(1) | $ (0.04) | $ (0.07) | $ (0.01) | $ 0.02 | $ (0.04) |
| Net realized and unrealized gain (loss) | (5.34) | 9.27 | (1.08) | (0.04) (2) | 4.34 |
| Total income (loss) from operations | $ (5.38) | $ 9.20 | $ (1.09) | $ (0.02) | $ 4.30 |
| Less Distributions | |||||
| From net investment income | $ — | $ — | $ — | $ — | $ —(3) |
| From net realized gain | (2.41) | — | (0.32) | (1.24) | (3.39) |
| Total distributions | $ (2.41) | $ — | $ (0.32) | $ (1.24) | $ (3.39) |
| Net asset value — End of year | $ 25.35 | $ 33.14 | $ 23.94 | $ 25.35 | $ 26.61 |
| Total Return(4) | (17.82)% | 38.43% | (4.38)% | 0.61% | 18.55% |
| Ratios/Supplemental Data | |||||
| Net assets, end of year (000’s omitted) | $241,335 | $288,922 | $185,777 | $172,277 | $158,921 |
| Ratios (as a percentage of average daily net assets):(5) | |||||
| Total expenses | 1.19% | 1.19% | 1.22% | 1.25% | 1.28% |
| Net expenses | 1.19% (6) | 1.19% | 1.21% | 1.23% | 1.28% |
| Net investment income (loss) | (0.12)% | (0.21)% | (0.03)% | 0.07% | (0.17)% |
| Portfolio Turnover | 42% | 53% | 44% | 45% | 51% |
| (1) | Computed using average shares outstanding. |
| (2) | The per share amount is not in accord with the net realized and unrealized gain (loss) for the period because of the timing of Fund share transactions and the amount of the per share realized and unrealized gains and losses at such time. |
| (3) | Amount is less than $0.005. |
| (4) | Returns are historical and are calculated by determining the percentage change in net asset value with all distributions reinvested and do not reflect the effect of sales charges, if any. |
| (5) | Total expenses do not reflect amounts reimbursed and/or waived by the adviser and certain of its affiliates, if applicable. Net expenses are net of all reductions and represent the net expenses paid by the Fund. |
| (6) | Includes a reduction by the investment adviser of a portion of its advisory fee due to the Fund’s investment in the Liquidity Fund (equal to less than 0.005% of average daily net assets for the year ended September 30, 2022). |
| Class C | |||||
| Year Ended September 30, | |||||
| 2022 | 2021 | 2020 | 2019 | 2018 | |
| Net asset value — Beginning of year | $ 27.84 | $ 20.27 | $ 21.63 | $ 22.90 | $ 22.58 |
| Income (Loss) From Operations | |||||
| Net investment loss(1) | $ (0.22) | $ (0.26) | $ (0.16) | $ (0.14) | $ (0.20) |
| Net realized and unrealized gain (loss) | (4.41) | 7.83 | (0.92) | (0.04) (2) | 3.77 |
| Total income (loss) from operations | $ (4.63) | $ 7.57 | $ (1.08) | $ (0.18) | $ 3.57 |
| Less Distributions | |||||
| From net realized gain | $ (2.24) | $ — | $ (0.28) | $ (1.09) | $ (3.25) |
| Total distributions | $ (2.24) | $ — | $ (0.28) | $ (1.09) | $ (3.25) |
| Net asset value — End of year | $ 20.97 | $ 27.84 | $ 20.27 | $ 21.63 | $ 22.90 |
| Total Return(3) | (18.42)% | 37.35% | (5.10)% | (0.12)% | 17.66% |
| Ratios/Supplemental Data | |||||
| Net assets, end of year (000’s omitted) | $26,452 | $32,596 | $16,992 | $14,775 | $18,945 |
| Ratios (as a percentage of average daily net assets):(4) | |||||
| Total expenses | 1.94% | 1.94% | 1.97% | 2.01% | 2.03% |
| Net expenses | 1.94% (5) | 1.94% | 1.96% | 1.99% | 2.03% |
| Net investment loss | (0.87)% | (0.97)% | (0.78)% | (0.68)% | (0.91)% |
| Portfolio Turnover | 42% | 53% | 44% | 45% | 51% |
| (1) | Computed using average shares outstanding. |
| (2) | The per share amount is not in accord with the net realized and unrealized gain (loss) for the period because of the timing of Fund share transactions and the amount of the per share realized and unrealized gains and losses at such time. |
| (3) | Returns are historical and are calculated by determining the percentage change in net asset value with all distributions reinvested and do not reflect the effect of sales charges, if any. |
| (4) | Total expenses do not reflect amounts reimbursed and/or waived by the adviser and certain of its affiliates, if applicable. Net expenses are net of all reductions and represent the net expenses paid by the Fund. |
| (5) | Includes a reduction by the investment adviser of a portion of its advisory fee due to the Fund’s investment in the Liquidity Fund (equal to less than 0.005% of average daily net assets for the year ended September 30, 2022). |
| Class I | |||||
| Year Ended September 30, | |||||
| 2022 | 2021 | 2020 | 2019 | 2018 | |
| Net asset value — Beginning of year | $ 36.02 | $ 26.00 | $ 27.49 | $ 28.73 | $ 27.51 |
| Income (Loss) From Operations | |||||
| Net investment income(1) | $ 0.04 | $ 0.01 | $ 0.06 | $ 0.09 | $ 0.05 |
| Net realized and unrealized gain (loss) | (5.85) | 10.05 | (1.17) | (0.02) (2) | 4.67 |
| Total income (loss) from operations | $ (5.81) | $ 10.06 | $ (1.11) | $ 0.07 | $ 4.72 |
| Less Distributions | |||||
| From net investment income | $ (0.03) | $ (0.04) | $ (0.05) | $ (0.06) | $ (0.08) |
| From net realized gain | (2.45) | — | (0.33) | (1.25) | (3.42) |
| Total distributions | $ (2.48) | $ (0.04) | $ (0.38) | $ (1.31) | $ (3.50) |
| Net asset value — End of year | $ 27.73 | $ 36.02 | $ 26.00 | $ 27.49 | $ 28.73 |
| Total Return(3) | (17.61)% | 38.73% | (4.12)% | 0.92% | 18.92% |
| Ratios/Supplemental Data | |||||
| Net assets, end of year (000’s omitted) | $1,858,334 | $2,398,219 | $1,211,029 | $461,237 | $257,089 |
| Ratios (as a percentage of average daily net assets):(4) | |||||
| Total expenses | 0.94% | 0.94% | 0.97% | 1.00% | 1.04% |
| Net expenses | 0.94% (5) | 0.94% | 0.96% | 0.95% | 0.92% |
| Net investment income | 0.13% | 0.03% | 0.22% | 0.34% | 0.19% |
| Portfolio Turnover | 42% | 53% | 44% | 45% | 51% |
| (1) | Computed using average shares outstanding. |
| (2) | The per share amount is not in accord with the net realized and unrealized gain (loss) for the period because of the timing of Fund share transactions and the amount of the per share realized and unrealized gains and losses at such time. |
| (3) | Returns are historical and are calculated by determining the percentage change in net asset value with all distributions reinvested and do not reflect the effect of sales charges, if any. |
| (4) | Total expenses do not reflect amounts reimbursed and/or waived by the adviser and certain of its affiliates, if applicable. Net expenses are net of all reductions and represent the net expenses paid by the Fund. |
| (5) | Includes a reduction by the investment adviser of a portion of its advisory fee due to the Fund’s investment in the Liquidity Fund (equal to less than 0.005% of average daily net assets for the year ended September 30, 2022). |
| Class R6 | ||||
| Year Ended September 30, | Period Ended September 30, | |||
| 2022 | 2021 | 2020 | 2019 (1) | |
| Net asset value — Beginning of period | $ 36.05 | $ 26.01 | $ 27.50 | $ 24.93 |
| Income (Loss) From Operations | ||||
| Net investment income(2) | $ 0.08 | $ 0.04 | $ 0.07 | $ 0.07 |
| Net realized and unrealized gain (loss) | (5.87) | 10.05 | (1.16) | 2.50 |
| Total income (loss) from operations | $ (5.79) | $ 10.09 | $ (1.09) | $ 2.57 |
| Less Distributions | ||||
| From net investment income | $ (0.06) | $ (0.05) | $ (0.07) | $ — |
| From net realized gain | (2.45) | — | (0.33) | — |
| Total distributions | $ (2.51) | $ (0.05) | $ (0.40) | $ — |
| Net asset value — End of period | $ 27.75 | $ 36.05 | $ 26.01 | $ 27.50 |
| Total Return(3) | (17.56)% | 38.83% | (4.07)% | 10.31% (4) |
| Ratios/Supplemental Data | ||||
| Net assets, end of period (000’s omitted) | $283,192 | $84,689 | $44,012 | $34,782 |
| Ratios (as a percentage of average daily net assets):(5) | ||||
| Total expenses | 0.85% | 0.86% | 0.91% | 0.93% (6) |
| Net expenses | 0.85% (7) | 0.86% | 0.90% | 0.90% (6) |
| Net investment income | 0.26% | 0.11% | 0.28% | 0.37% (6) |
| Portfolio Turnover | 42% | 53% | 44% | 45% (8) |
| (1) | For the period from the commencement of operations, February 1, 2019, to September 30, 2019. |
| (2) | Computed using average shares outstanding. |
| (3) | Returns are historical and are calculated by determining the percentage change in net asset value with all distributions reinvested and do not reflect the effect of sales charges, if any. |
| (4) | Not annualized. |
| (5) | Total expenses do not reflect amounts reimbursed and/or waived by the adviser and certain of its affiliates, if applicable. Net expenses are net of all reductions and represent the net expenses paid by the Fund. |
| (6) | Annualized. |
| (7) | Includes a reduction by the investment adviser of a portion of its advisory fee due to the Fund’s investment in the Liquidity Fund (equal to less than 0.005% of average daily net assets for the year ended September 30, 2022). |
| (8) | For the year ended September 30, 2019. |
| Asset Description | Level 1 | Level 2 | Level 3 | Total |
| Common Stocks | $ 2,378,312,281(1) | $ — | $ — | $ 2,378,312,281 |
| High Social Impact Investments | — | 2,340,475 | — | 2,340,475 |
| Short-Term Investments: | ||||
| Affiliated Fund | 1,117,065 | — | — | 1,117,065 |
| Securities Lending Collateral | 16,817,946 | — | — | 16,817,946 |
| Total Investments | $2,396,247,292 | $2,340,475 | $ — | $2,398,587,767 |
| (1) | The level classification by major category of investments is the same as the category presentation in the Schedule of Investments. |
| Year Ended September 30, | ||
| 2022 | 2021 | |
| Ordinary income | $ 91,739,873 | $2,290,276 |
| Long-term capital gains | $108,267,913 | $ — |
| Undistributed long-term capital gains | $ 33,996,246 |
| Net unrealized depreciation | (125,405,471) |
| Accumulated loss | $ (91,409,225) |
| Aggregate cost | $2,523,993,238 |
| Gross unrealized appreciation | $ 185,676,325 |
| Gross unrealized depreciation | (311,081,796) |
| Net unrealized depreciation | $ (125,405,471) |
| Remaining Contractual Maturity of the Transactions | |||||
| Overnight and Continuous | <30 days | 30 to 90 days | >90 days | Total | |
| Common Stocks | $16,817,946 | $ — | $ — | $ — | $16,817,946 |
| Name | Value, beginning of period | Purchases | Sales proceeds | Net realized gain (loss) | Change in unrealized appreciation (depreciation) | Value, end of period | Interest/ Dividend income | Principal amount/ Shares/Units, end of period |
| High Social Impact Investments | ||||||||
| Calvert Impact Capital, Inc., Community Investment Notes, 1.50%, 12/15/23(1) | $ 2,476,732 | $ — | $ — | $ — | $ (136,257) | $ 2,340,475 | $ 37,800 | $2,520,000 |
| Short-Term Investments | ||||||||
| Cash Reserves Fund | 43,689,895 | 589,096,691 | (632,787,608) | 5,390 | (4,368) | — | 16,226 | — |
| Liquidity Fund | — | 354,034,164 | (352,917,099) | — | — | 1,117,065 | 184,412 | 1,117,065 |
| Total | $5,390 | $(140,625) | $3,457,540 | $238,438 | ||||
| (1) | Restricted security. |
| Year Ended September 30, 2022 | Year Ended September 30, 2021 | ||||
| Shares | Amount | Shares | Amount | ||
| Class A | |||||
| Shares sold | 1,832,019 | $ 56,461,753 | 2,511,035 | $ 77,975,808 | |
| Reinvestment of distributions | 619,975 | 20,093,380 | — | — | |
| Shares redeemed | (1,675,490) | (50,651,159) | (1,588,951) | (49,469,166) | |
| Converted from Class C | 25,475 | 821,559 | 38,198 | 1,095,114 | |
| Net increase | 801,979 | $ 26,725,533 | 960,282 | $ 29,601,756 | |
| Class C | |||||
| Shares sold | 252,638 | $ 6,422,080 | 525,736 | $ 13,902,600 | |
| Reinvestment of distributions | 83,591 | 2,255,294 | — | — | |
| Shares redeemed | (214,851) | (5,347,301) | (148,104) | (3,948,587) | |
| Converted to Class A | (30,512) | (821,559) | (45,209) | (1,095,114) | |
| Net increase | 90,866 | $ 2,508,514 | 332,423 | $ 8,858,899 | |
| Class I | |||||
| Shares sold | 29,458,847 | $ 973,920,528 | 35,089,756 | $1,189,109,366 | |
| Reinvestment of distributions | 4,002,933 | 141,663,794 | 60,642 | 1,893,863 | |
| Shares redeemed | (33,018,459) | (1,067,747,077) | (15,153,155) | (520,975,811) | |
| Net increase | 443,321 | $ 47,837,245 | 19,997,243 | $ 670,027,418 | |
| Class R6 | |||||
| Shares sold | 9,689,995 | $ 323,085,253 | 1,071,248 | $ 36,569,790 | |
| Reinvestment of distributions | 139,405 | 4,933,560 | 2,905 | 90,728 | |
| Shares redeemed | (1,974,898) | (64,615,435) | (417,221) | (14,519,771) | |
| Net increase | 7,854,502 | $ 263,403,378 | 656,932 | $ 22,140,747 | |
Boston, Massachusetts
November 22, 2022
| • | A report from an independent data provider comparing the advisory and related fees paid by each fund with fees paid by comparable funds; |
| • | A report from an independent data provider comparing each fund’s total expense ratio and its components to comparable funds; |
| • | A report from an independent data provider comparing the investment performance of each fund to the investment performance of comparable funds over various time periods; |
| • | Data regarding investment performance in comparison to benchmark indices; |
| • | For each fund, comparative information concerning the fees charged and the services provided by the Adviser in managing other accounts (including mutual funds, other collective investment funds and institutional accounts) using investment strategies and techniques similar to those used in managing such fund; |
| • | Profitability analyses for the Adviser with respect to each fund; |
| • | Descriptions of the investment management services provided to each fund, including investment strategies and processes it employs; |
| • | Information about the Adviser’s policies and practices with respect to trading, including the Adviser’s processes for monitoring best execution of portfolio transactions; |
| • | Information about the allocation of brokerage transactions and the benefits received by the Adviser as a result of brokerage allocation, including information concerning the acquisition of research through client commission arrangements and policies with respect to “soft dollars”; |
| • | Reports detailing the financial results and condition of CRM; |
| • | Descriptions of the qualifications, education and experience of the individual investment professionals whose responsibilities include portfolio management and investment research for the funds, and information relating to their compensation and responsibilities with respect to managing other mutual funds and investment accounts; |
| • | Policies and procedures relating to proxy voting and the handling of corporate actions and class actions; |
| • | A description of CRM’s procedures for overseeing sub-advisers, including with respect to regulatory and compliance issues, investment management and other matters; |
Other Relevant Information
| • | Information concerning the nature, cost and character of the administrative and other non-investment advisory services provided by CRM and its affiliates; and |
| • | The terms of each investment advisory agreement. |
| Name and Year of Birth | Corporation Position(s) | Length of Service | Principal Occupation(s) and Other Directorships During Past Five Years and Other Relevant Experience |
| Interested Director | |||
| John H. Streur(1) 1960 | Director and President | Since 2015 | President and Chief Executive Officer of CRM (since December 31, 2016). President and Chief Executive Officer of Calvert Investments, Inc. (January 2015 - December 2016); Chief Executive Officer of Calvert Investment Distributors, Inc. (August 2015 - December 2016); Chief Compliance Officer of Calvert Investment Management, Inc. (August 2015 - April 2016); President and Director, Portfolio 21 Investments, Inc. (through October 2014); President, Chief Executive Officer and Director, Managers Investment Group LLC (through January 2012); President and Director, The Managers Funds and Managers AMG Funds (through January 2012). Other Directorships. Portfolio 21 Investments, Inc. (asset management) (through October 2014); Managers Investment Group LLC (asset management) (through January 2012); The Managers Funds (asset management) (through January 2012); Managers AMG Funds (asset management) (through January 2012); Calvert Impact Capital, Inc. |
| Noninterested Directors | |||
| Richard L. Baird, Jr. 1948 | Director | Since 2005 | Regional Disaster Recovery Lead, American Red Cross of Greater Pennsylvania (since 2017). Volunteer, American Red Cross (since 2015). Former President and CEO of Adagio Health Inc. (retired in 2014) in Pittsburgh, PA. Other Directorships. None. |
| Alice Gresham Bullock 1950 | Chair and Director | Since 2016 | Professor Emerita at Howard University School of Law. Dean Emerita of Howard University School of Law and Deputy Director of the Association of American Law Schools (1992-1994). Other Directorships. None. |
| Cari M. Dominguez 1949 | Director | Since 2016 | Former Chair of the U.S. Equal Employment Opportunity Commission. Other Directorships. ManpowerGroup Inc. (workforce solutions company); Triple S Management Corporation (managed care); National Association of Corporate Directors. |
| John G. Guffey, Jr. 1948 | Director | Since 2005 | President of Aurora Press Inc., a privately held publisher of trade paperbacks (since January 1997). Other Directorships. Calvert Impact Capital, Inc. (through December 31, 2018); Calvert Ventures, LLC. |
| Miles D. Harper, III 1962 | Director | Since 2000 | Partner, Carr Riggs & Ingram (public accounting firm) since October 2014. Partner, Gainer Donnelly & Desroches (public accounting firm) (now Carr Riggs & Ingram) (November 1999 - September 2014). Other Directorships. Bridgeway Funds (9) (asset management). |
| Joy V. Jones 1950 | Director | Since 2000 | Attorney. Other Directorships. Palm Management Corporation. |
| Name and Year of Birth | Corporation Position(s) | Length of Service | Principal Occupation(s) and Other Directorships During Past Five Years and Other Relevant Experience |
| Noninterested Directors (continued) | |||
| Anthony A. Williams 1951 | Director | Since 2016 | CEO and Executive Director of the Federal City Council (July 2012 to present); Senior Adviser and Independent Consultant for King and Spalding LLP (September 2015 to present); Executive Director of Global Government Practice at the Corporate Executive Board (January 2010 to January 2012). Other Directorships. Freddie Mac; Evoq Properties/Meruelo Maddux Properties, Inc. (real estate management); Weston Solutions, Inc. (environmental services); Bipartisan Policy Center’s Debt Reduction Task Force; Chesapeake Bay Foundation; Catholic University of America; Urban Institute (research organization); The Howard Hughes Corporation (real estate development); Old Dominion National Bank. |
| Name and Year of Birth | Corporation Position(s) | Length of Service | Principal Occupation(s) During Past Five Years |
| Principal Officers who are not Directors | |||
| Hope L. Brown 1973 | Chief Compliance Officer | Since 2014 | Chief Compliance Officer of 42 registered investment companies advised by CRM (since 2014). Vice President and Chief Compliance Officer, Wilmington Funds (2012-2014). |
| Deidre E. Walsh 1971 | Secretary, Vice President and Chief Legal Officer | Since 2021 | Vice President of CRM and officer of 42 registered investment companies advised by CRM (since 2021). Also Vice President of Eaton Vance and certain of its affiliates and officer of 136 registered investment companies advised or administered by Eaton Vance. |
| James F. Kirchner 1967 | Treasurer | Since 2016 | Vice President of CRM and officer of 42 registered investment companies advised by CRM (since 2016). Also Vice President of Eaton Vance and certain of its affiliates and officer of 136 registered investment companies advised or administered by Eaton Vance. |
| (1) Mr. Streur is an interested person of the Fund because of his positions with the Fund’s adviser and certain affiliates. | |||
| Privacy Notice | April 2021 |
| FACTS | WHAT DOES EATON VANCE DO WITH YOUR PERSONAL INFORMATION? |
| Why? | Financial companies choose how they share your personal information. Federal law gives consumers the right to limit some but not all sharing. Federal law also requires us to tell you how we collect, share, and protect your personal information. Please read this notice carefully to understand what we do. |
| What? | The types of personal information we collect and share depend on the product or service you have with us. This information can include:■ Social Security number and income ■ investment experience and risk tolerance ■ checking account number and wire transfer instructions |
| How? | All financial companies need to share customers’ personal information to run their everyday business. In the section below, we list the reasons financial companies can share their customers’ personal information; the reasons Eaton Vance chooses to share; and whether you can limit this sharing. |
| Reasons we can share your personal information | Does Eaton Vance share? | Can you limit this sharing? |
| For our everyday business purposes — such as to process your transactions, maintain your account(s), respond to court orders and legal investigations, or report to credit bureaus | Yes | No |
| For our marketing purposes — to offer our products and services to you | Yes | No |
| For joint marketing with other financial companies | No | We don’t share |
| For our investment management affiliates’ everyday business purposes — information about your transactions, experiences, and creditworthiness | Yes | Yes |
| For our affiliates’ everyday business purposes — information about your transactions and experiences | Yes | No |
| For our affiliates’ everyday business purposes — information about your creditworthiness | No | We don’t share |
| For our investment management affiliates to market to you | Yes | Yes |
| For our affiliates to market to you | No | We don’t share |
| For nonaffiliates to market to you | No | We don’t share |
| To limit our sharing | Call toll-free 1-800-368-2745 or email: CRMPrivacy@calvert.comPlease note:If you are a new customer, we can begin sharing your information 30 days from the date we sent this notice. When you are no longer our customer, we continue to share your information as described in this notice. However, you can contact us at any time to limit our sharing. |
| Questions? | Call toll-free 1-800-368-2745 or email: CRMPrivacy@calvert.com |
| Privacy Notice — continued | April 2021 |
| Who we are | |
| Who is providing this notice? | Eaton Vance Management, Eaton Vance Distributors, Inc., Eaton Vance Trust Company, Eaton Vance Management (International) Limited, Eaton Vance Advisers International Ltd., Eaton Vance Global Advisors Limited, Eaton Vance Management’s Real Estate Investment Group, Boston Management and Research, Calvert Research and Management, Eaton Vance and Calvert Fund Families and our investment advisory affiliates (“Eaton Vance”) (see Investment Management Affiliates definition below) |
| What we do | |
| How does Eaton Vance protect my personal information? | To protect your personal information from unauthorized access and use, we use security measures that comply with federal law. These measures include computer safeguards and secured files and buildings. We have policies governing the proper handling of customer information by personnel and requiring third parties that provide support to adhere to appropriate security standards with respect to such information. |
| How does Eaton Vance collect my personal information? | We collect your personal information, for example, when you■ open an account or make deposits or withdrawals from your account ■ buy securities from us or make a wire transfer ■ give us your contact informationWe also collect your personal information from others, such as credit bureaus, affiliates, or other companies. |
| Why can’t I limit all sharing? | Federal law gives you the right to limit only■ sharing for affiliates’ everyday business purposes — information about your creditworthiness ■ affiliates from using your information to market to you ■ sharing for nonaffiliates to market to youState laws and individual companies may give you additional rights to limit sharing. See below for more on your rights under state law. |
| Definitions | |
| Investment Management Affiliates | Eaton Vance Investment Management Affiliates include registered investment advisers, registered broker- dealers, and registered and unregistered funds. Investment Management Affiliates does not include entities associated with Morgan Stanley Wealth Management, such as Morgan Stanley Smith Barney LLC and Morgan Stanley & Co. |
| Affiliates | Companies related by common ownership or control. They can be financial and nonfinancial companies.■ Our affiliates include companies with a Morgan Stanley name and financial companies such as Morgan Stanley Smith Barney LLC and Morgan Stanley & Co. |
| Nonaffiliates | Companies not related by common ownership or control. They can be financial and nonfinancial companies.■ Eaton Vance does not share with nonaffiliates so they can market to you. |
| Joint marketing | A formal agreement between nonaffiliated financial companies that together market financial products or services to you.■ Eaton Vance doesn’t jointly market. |
| Other important information | |
| Vermont: Except as permitted by law, we will not share personal information we collect about Vermont residents with Nonaffiliates unless you provide us with your written consent to share such information.California: Except as permitted by law, we will not share personal information we collect about California residents with Nonaffiliates and we will limit sharing such personal information with our Affiliates to comply with California privacy laws that apply to us. | |

Global Water Fund

| % Average Annual Total Returns1,2 | Class Inception Date | Performance Inception Date | One Year | Five Years | Ten Years |
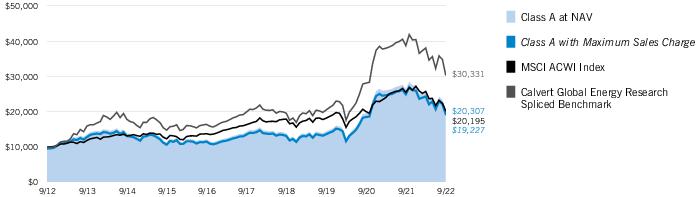
| Class A at NAV | 05/31/2007 | 05/31/2007 | (22.71)% | 7.43% | 7.34% |
| Class A with 5.25% Maximum Sales Charge | — | — | (26.77) | 6.28 | 6.75 |
| Class C at NAV | 07/31/2007 | 05/31/2007 | (23.30) | 6.64 | 6.61 |
| Class C with 1% Maximum Deferred Sales Charge | — | — | (24.07) | 6.64 | 6.61 |
| Class I at NAV | 05/31/2007 | 05/31/2007 | (22.52) | 7.72 | 7.71 |
| MSCI ACWI Index | — | — | (20.66)% | 4.44% | 7.28% |
| Calvert Global Energy Research Spliced Benchmark | — | — | (21.63) | 8.85 | 11.72 |
| Calvert Global Energy Research Index | — | — | (21.63) | 8.85 | — |
| Alerian Global Alternative Energy Index | — | — | (16.84) | 19.92 | 16.82 |
| % Total Annual Operating Expense Ratios3 | Class A | Class C | Class I |
| Gross | 1.42% | 2.17% | 1.17% |
| Net | 1.24 | 1.99 | 0.99 |
| Growth of Investment | Amount Invested | Period Beginning | At NAV | With Maximum Sales Charge |
| Class C | $10,000 | 09/30/2012 | $18,980 | N.A. |
| Class I, at minimum investment | $1,000,000 | 09/30/2012 | $2,103,029 | N.A. |
| Top 10 Holdings (% of net assets)1 | |
| Enphase Energy, Inc. | 1.3% |
| First Solar, Inc. | 1.2 |
| ON Semiconductor Corp. | 1.2 |
| Livent Corp. | 1.0 |
| SolarEdge Technologies, Inc. | 1.0 |
| Umicore S.A. | 1.0 |
| Siemens Gamesa Renewable Energy S.A. | 1.0 |
| LG Chem, Ltd. | 1.0 |
| Arcosa, Inc. | 1.0 |
| Power Integrations, Inc. | 0.9 |
| Total | 10.6% |
| 1 | Excludes cash and cash equivalents. |
| % Average Annual Total Returns1,2 | Class Inception Date | Performance Inception Date | One Year | Five Years | Ten Years |
| Class A at NAV | 09/30/2008 | 09/30/2008 | (22.62)% | 2.92% | 5.72% |
| Class A with 5.25% Maximum Sales Charge | — | — | (26.70) | 1.82 | 5.14 |
| Class C at NAV | 09/30/2008 | 09/30/2008 | (23.20) | 2.15 | 5.08 |
| Class C with 1% Maximum Deferred Sales Charge | — | — | (23.97) | 2.15 | 5.08 |
| Class I at NAV | 01/31/2014 | 09/30/2008 | (22.44) | 3.21 | 6.05 |
| MSCI ACWI Index | — | — | (20.66)% | 4.44% | 7.28% |
| Calvert Global Water Research Spliced Benchmark | — | — | (21.82) | 4.28 | 8.54 |
| Calvert Global Water Research Index | — | — | (21.82) | 4.28 | — |
| S-Network Global Water Index | — | — | (24.46) | 2.49 | 7.52 |
| % Total Annual Operating Expense Ratios3 | Class A | Class C | Class I |
| Gross | 1.29% | 2.04% | 1.04% |
| Net | 1.24 | 1.99 | 0.99 |

| Growth of Investment | Amount Invested | Period Beginning | At NAV | With Maximum Sales Charge |
| Class C | $10,000 | 09/30/2012 | $16,417 | N.A. |
| Class I, at minimum investment | $1,000,000 | 09/30/2012 | $1,799,960 | N.A. |

| Top 10 Holdings (% of net assets)1 | |
| IDEX Corp. | 2.1% |
| Ecolab, Inc. | 2.1 |
| Xylem, Inc. | 2.1 |
| Tetra Tech, Inc. | 1.9 |
| Pentair PLC | 1.8 |
| Evoqua Water Technologies Corp. | 1.7 |
| Badger Meter, Inc. | 1.7 |
| Watts Water Technologies, Inc., Class A | 1.7 |
| Kurita Water Industries, Ltd. | 1.7 |
| Zurn Elkay Water Solutions Corp. | 1.6 |
| Total | 18.4% |
| 1 | Excludes cash and cash equivalents. |
| † | The views expressed in this report are those of the portfolio manager(s) and are current only through the date stated at the top of this page. These views are subject to change at any time based upon market or other conditions, and Calvert and the Fund(s) disclaim any responsibility to update such views. These views may not be relied upon as investment advice and, because investment decisions are based on many factors, may not be relied upon as an indication of trading intent on behalf of any Calvert fund. This commentary may contain statements that are not historical facts, referred to as “forward-looking statements.” The Fund’s actual future results may differ significantly from those stated in any forward-looking statement, depending on factors such as changes in securities or financial markets or general economic conditions, the volume of sales and purchases of Fund shares, the continuation of investment advisory, administrative and service contracts, and other risks discussed from time to time in the Fund’s filings with the Securities and Exchange Commission. |
| 1 | MSCI ACWI Index is an unmanaged free-float-adjusted, market-capitalization-weighted index designed to measure the equity market performance of developed and emerging markets. MSCI indexes are net of foreign withholding taxes. Source: MSCI. MSCI data may not be reproduced or used for any other purpose. MSCI provides no warranties, has not prepared or approved this report, and has no liability hereunder.The Calvert Global Energy Research Spliced Benchmark is comprised of the Alerian Global Alternative Energy Index prior to October 4, 2016 and the Calvert Global Energy Research Index thereafter. The Calvert Global Energy Research Index includes companies that manage energy use in a sustainable manner or that are actively engaged in facilitating the transition to a more sustainable economy through the reduction of greenhouse gas emissions and the expanded use of renewable energy sources. The Calvert Global Energy Research Index incepted on July 15, 2016; accordingly, the ten year return is not available. The Alerian Global Alternative Energy Index measures the performance of stocks engaged in the field of alternative energy including solar, bioenergy, wind, hydro, and geothermal power sources. |
| The Calvert Global Water Research Spliced Benchmark is comprised of the S-Network Global Water Index prior to April 11, 2016 and the Calvert Global Water Research Index thereafter. The Calvert Global Water Research Index includes stocks of companies that manage water use in a sustainable manner or that are actively engaged in expanding access to water, improving water quality, promoting the efficient use of water, or providing solutions that address other global water challenges. The Calvert Global Water Research Index incepted on February 5, 2016; accordingly, the ten year return is not available. The S-Network Global Water Index measures the performance of stocks involved in water infrastructure, including utilities, and water technology development.Unless otherwise stated, index returns do not reflect the effect of any applicable sales charges, commissions, expenses, taxes or leverage, as applicable. It is not possible to invest directly in an index. | |
| 2 | Total Returns at NAV do not include applicable sales charges. If sales charges were deducted, the returns would be lower. Total Returns shown with maximum sales charge reflect the stated maximum sales charge. Unless otherwise stated, performance does not reflect the deduction of taxes on Fund distributions or redemptions of Fund shares.Effective November 5, 2020, Class C shares automatically convert to Class A shares eight years after purchase. The average annual total returns listed for Class C reflect conversion to Class A shares after eight years. Prior to November 5, 2020, Class C shares automatically converted to Class A shares ten years after purchase.For the Calvert Global Water Fund, performance prior to the inception date of a class may be linked to the performance of an older class of the Fund. This linked performance is adjusted for any applicable sales charge, but is not adjusted for class expense differences. If adjusted for such differences, the performance would be different. The performance of Class I for the Calvert Global Water Fund is linked to Class A. Performance presented in the Financial Highlights included in the financial statements is not linked.Effective October 4, 2016, the Calvert Global Energy Solutions Fund changed its investment objective and principal investment strategies to track the Calvert Global Energy Research Index and implement the Calvert Principles for Responsible Investment. Prior to October 4, 2016, the Fund employed an active management strategy. Performance prior to October 4, 2016 reflects the Fund’s performance under its former investment objective and policies. In connection with such changes, the Fund changed its secondary benchmark from Alerian Global Alternative Energy Index to Calvert Global Energy Research Index. |
| Effective April 11, 2016, the Calvert Global Water Fund changed its investment objective and principal investment strategies to track the Calvert Global Water Research Index and implement the Calvert Principles for Responsible Investment. Prior to April 11, 2016, the Fund employed an active management strategy. Performance prior to April 11, 2016 reflects the Fund’s performance under its former investment objective and policies. In connection with such changes, the Fund changed its secondary benchmark from S-Network Global Water Index to Calvert Global Water Research Index.Calvert Research and Management became the investment adviser to each Fund on December 31, 2016. Performance reflected prior to such date is that of each Fund’s former investment adviser. | |
| 3 | Source: Fund prospectus. Net expense ratios reflect a contractual expense reimbursement that continues through 1/31/23. The expense ratios for the current reporting period can be found in the Financial Highlights section of this report. Performance reflects expenses waived and/or reimbursed, if applicable. Without such waivers and/or reimbursements, performance would have been lower. |
| Additional Information | |
| S&P 500® Index is an unmanaged index of large-cap stocks commonly used as a measure of U.S. stock market performance. S&P Dow Jones Indices are a product of S&P Dow Jones Indices LLC (“S&P DJI”) and have been licensed for use. S&P® and S&P 500® are registered trademarks of S&P DJI; Dow Jones® is a registered trademark of Dow Jones Trademark Holdings LLC (“Dow Jones”); S&P DJI, Dow Jones and their respective affiliates do not sponsor, endorse, sell or promote the Fund, will not have any liability with respect thereto and do not have any liability for any errors, omissions, or interruptions of the S&P Dow Jones Indices. Nasdaq Composite Index is a market capitalization-weighted index of all domestic and international securities listed on Nasdaq. Source: Nasdaq, Inc. The information is provided by Nasdaq (with its affiliates, are referred to as the “Corporations”) and Nasdaq’s third party licensors on an “as is” basis and the Corporations make no guarantees and bear no liability of any kind with respect to the information or the Fund. MSCI Golden Dragon Index is an unmanaged index of common stocks traded in China, Hong Kong and Taiwan. MSCI EAFE Index is an unmanaged index of equities in the developed markets, excluding the U.S. and Canada. MSCI Emerging Markets Index is an unmanaged index of emerging markets common stocks. |
| Beginning Account Value (4/1/22) | Ending Account Value (9/30/22) | Expenses Paid During Period* (4/1/22 – 9/30/22) | Annualized Expense Ratio | |
| Actual | ||||
| Class A | $1,000.00 | $ 792.60 | $ 5.57** | 1.24% |
| Class C | $1,000.00 | $ 789.50 | $ 8.93** | 1.99% |
| Class I | $1,000.00 | $ 793.50 | $ 4.45** | 0.99% |
| Hypothetical | ||||
| (5% return per year before expenses) | ||||
| Class A | $1,000.00 | $1,018.85 | $ 6.28** | 1.24% |
| Class C | $1,000.00 | $1,015.09 | $10.05 ** | 1.99% |
| Class I | $1,000.00 | $1,020.10 | $ 5.01** | 0.99% |
| * | Expenses are equal to the Fund's annualized expense ratio for the indicated Class, multiplied by the average account value over the period, multiplied by 183/365 (to reflect the one-half year period). The Example assumes that the $1,000 was invested at the net asset value per share determined at the close of business on March 31, 2022. |
| ** | Absent a waiver and/or reimbursement of expenses by an affiliate, expenses would be higher. |
| Beginning Account Value (4/1/22) | Ending Account Value (9/30/22) | Expenses Paid During Period* (4/1/22 – 9/30/22) | Annualized Expense Ratio | |
| Actual | ||||
| Class A | $1,000.00 | $ 796.30 | $ 5.58** | 1.24% |
| Class C | $1,000.00 | $ 793.20 | $ 8.95** | 1.99% |
| Class I | $1,000.00 | $ 797.30 | $ 4.46** | 0.99% |
| Hypothetical | ||||
| (5% return per year before expenses) | ||||
| Class A | $1,000.00 | $1,018.85 | $ 6.28** | 1.24% |
| Class C | $1,000.00 | $1,015.09 | $10.05 ** | 1.99% |
| Class I | $1,000.00 | $1,020.10 | $ 5.01** | 0.99% |
| * | Expenses are equal to the Fund's annualized expense ratio for the indicated Class, multiplied by the average account value over the period, multiplied by 183/365 (to reflect the one-half year period). The Example assumes that the $1,000 was invested at the net asset value per share determined at the close of business on March 31, 2022. |
| ** | Absent a waiver and/or reimbursement of expenses by an affiliate, expenses would be higher. |
| Common Stocks — 99.4% |
| Security | Shares | Value | |
| Austria — 0.8% | |||
| Verbund AG | 13,943 | $ 1,190,417 | |
| $ 1,190,417 | |||
| Belgium — 1.0% | |||
| Umicore S.A. | 54,239 | $ 1,592,310 | |
| $ 1,592,310 | |||
| Brazil — 0.5% | |||
| Sao Martinho S.A. | 170,052 | $ 804,495 | |
| $ 804,495 | |||
| Canada — 5.3% | |||
| Algonquin Power & Utilities Corp.(1) | 100,949 | $ 1,102,776 | |
| Boralex, Inc., Class A | 33,175 | 1,053,598 | |
| Brookfield Renewable Partners L.P. | 38,069 | 1,191,560 | |
| Canadian Solar, Inc.(2) | 33,805 | 1,259,236 | |
| Innergex Renewable Energy, Inc. | 77,728 | 978,528 | |
| NFI Group, Inc.(1) | 71,248 | 626,163 | |
| Northland Power, Inc. | 39,727 | 1,163,324 | |
| TransAlta Renewables, Inc. | 83,201 | 880,587 | |
| $ 8,255,772 | |||
| China — 4.4% | |||
| BYD Co., Ltd., Class H | 36,000 | $ 886,880 | |
| China Everbright Environment Group, Ltd. | 2,290,037 | 948,025 | |
| NIO, Inc. ADR(2) | 55,425 | 874,052 | |
| Xinyi Energy Holdings, Ltd. | 2,462,000 | 755,842 | |
| Xinyi Solar Holdings, Ltd. | 1,250,000 | 1,312,669 | |
| XPENG, Inc. ADR(1)(2) | 54,151 | 647,105 | |
| Yadea Group Holdings, Ltd.(3) | 436,000 | 696,848 | |
| Zhuzhou CRRC Times Electric Co., Ltd. | 173,600 | 726,652 | |
| $ 6,848,073 | |||
| Denmark — 2.5% | |||
| Novozymes A/S, Class B | 17,648 | $ 886,849 | |
| Orsted A/S(3) | 15,214 | 1,212,567 | |
| ROCKWOOL International A/S, Class B | 4,184 | 659,974 | |
| Vestas Wind Systems A/S | 61,761 | 1,137,197 | |
| $ 3,896,587 | |||
| Finland — 0.6% | |||
| Neste Oyj | 20,150 | $ 878,328 | |
| $ 878,328 | |||
| France — 4.8% | |||
| Alstom S.A. | 48,347 | $ 782,049 | |
| Security | Shares | Value | |
| France (continued) | |||
| Cie de Saint-Gobain | 26,348 | $ 942,088 | |
| Danone S.A. | 18,931 | 895,158 | |
| Engie S.A. | 83,743 | 963,873 | |
| Legrand S.A. | 14,673 | 948,742 | |
| Neoen S.A.(3) | 27,925 | 930,619 | |
| Nexans S.A. | 10,910 | 971,187 | |
| Schneider Electric SE | 10,040 | 1,134,026 | |
| $ 7,567,742 | |||
| Germany — 8.6% | |||
| Bayerische Motoren Werke AG | 13,529 | $ 916,962 | |
| Daimler Truck Holding AG(2) | 38,943 | 880,402 | |
| Deutsche Post AG | 27,312 | 823,174 | |
| Encavis AG | 56,802 | 1,015,217 | |
| Evonik Industries AG | 47,706 | 798,962 | |
| Infineon Technologies AG | 45,958 | 1,005,746 | |
| Mercedes-Benz Group AG | 17,711 | 895,593 | |
| Nordex SE(2) | 147,484 | 1,162,119 | |
| SGL Carbon SE(1)(2) | 146,155 | 847,025 | |
| Siemens AG | 11,977 | 1,170,666 | |
| Siemens Energy AG | 90,151 | 992,631 | |
| SMA Solar Technology AG(2) | 24,693 | 1,145,185 | |
| VERBIO Vereinigte BioEnergie AG | 16,916 | 998,165 | |
| Vitesco Technologies Group AG(2) | 15,173 | 737,665 | |
| $ 13,389,512 | |||
| Greece — 0.6% | |||
| Terna Energy S.A. | 58,493 | $ 945,752 | |
| $ 945,752 | |||
| Ireland — 1.0% | |||
| CRH PLC | 27,015 | $ 866,552 | |
| Kingspan Group PLC | 17,259 | 777,596 | |
| $ 1,644,148 | |||
| Italy — 2.3% | |||
| Enel SpA | 211,677 | $ 868,135 | |
| ERG SpA | 35,771 | 984,688 | |
| Snam SpA | 209,880 | 848,320 | |
| Terna - Rete Elettrica Nazionale | 140,001 | 852,680 | |
| $ 3,553,823 | |||
| Japan — 6.1% | |||
| Azbil Corp. | 30,300 | $ 789,834 | |
| Daikin Industries, Ltd. | 6,500 | 1,000,148 | |
| Fuji Electric Co., Ltd. | 38,900 | 1,425,719 | |
| GS Yuasa Corp. | 54,400 | 848,873 | |
| Hitachi Metals, Ltd.(2) | 61,300 | 922,242 | |
| Security | Shares | Value | |
| Japan (continued) | |||
| Meidensha Corp. | 83,800 | $ 1,145,428 | |
| Mitsubishi Electric Corp. | 103,800 | 939,187 | |
| Nidec Corp. | 15,100 | 845,239 | |
| West Holdings Corp. | 31,100 | 888,811 | |
| Yokogawa Electric Corp. | 51,600 | 812,914 | |
| $ 9,618,395 | |||
| Netherlands — 1.3% | |||
| Alfen Beheer B.V.(2)(3) | 13,588 | $ 1,244,345 | |
| Signify NV(3) | 31,067 | 799,583 | |
| $ 2,043,928 | |||
| New Zealand — 2.1% | |||
| Infratil, Ltd. | 226,282 | $ 1,094,838 | |
| Mercury NZ, Ltd. | 336,385 | 1,070,872 | |
| Meridian Energy, Ltd. | 407,207 | 1,092,660 | |
| $ 3,258,370 | |||
| Norway — 1.0% | |||
| Norsk Hydro ASA | 144,821 | $ 777,098 | |
| Scatec ASA(3) | 104,937 | 717,645 | |
| $ 1,494,743 | |||
| Singapore — 1.1% | |||
| City Developments, Ltd. | 173,800 | $ 915,948 | |
| XP Power, Ltd. | 43,918 | 816,607 | |
| $ 1,732,555 | |||
| South Korea — 2.2% | |||
| LG Chem, Ltd. | 4,249 | $ 1,568,881 | |
| LG Display Co., Ltd. | 133,222 | 1,104,062 | |
| SK IE Technology Co., Ltd.(2)(3) | 22,945 | 828,842 | |
| $ 3,501,785 | |||
| Spain — 5.2% | |||
| Acciona S.A. | 6,546 | $ 1,150,499 | |
| Atlantica Sustainable Infrastructure PLC | 34,950 | 919,185 | |
| EDP Renovaveis S.A. | 54,458 | 1,120,210 | |
| Ence Energia y Celulosa S.A. | 264,632 | 787,834 | |
| Iberdrola S.A. | 98,120 | 914,889 | |
| Red Electrica Corp. S.A. | 54,513 | 836,534 | |
| Siemens Gamesa Renewable Energy S.A.(2) | 91,016 | 1,586,855 | |
| Solaria Energia y Medio Ambiente S.A.(2) | 53,094 | 835,081 | |
| $ 8,151,087 | |||
| Sweden — 2.1% | |||
| AddTech AB, Class B | 62,360 | $ 819,202 | |
| Fabege AB | 112,430 | 763,692 | |
| Security | Shares | Value | |
| Sweden (continued) | |||
| Munters Group AB(3) | 103,140 | $ 721,482 | |
| Nibe Industrier AB, Class B | 110,453 | 985,265 | |
| $ 3,289,641 | |||
| Switzerland — 1.1% | |||
| ABB, Ltd. | 42,058 | $ 1,085,913 | |
| Landis+Gyr Group AG | 13,188 | 717,395 | |
| $ 1,803,308 | |||
| Taiwan — 4.3% | |||
| Chroma ATE, Inc. | 161,000 | $ 905,841 | |
| Delta Electronics, Inc. | 123,000 | 977,004 | |
| Everlight Electronics Co., Ltd. | 526,000 | 575,286 | |
| OptoTech Corp. | 509,200 | 534,854 | |
| Simplo Technology Co., Ltd. | 154,000 | 1,274,175 | |
| Sino-American Silicon Products, Inc. | 283,000 | 1,156,044 | |
| Voltronic Power Technology Corp. | 29,000 | 1,275,435 | |
| $ 6,698,639 | |||
| Thailand — 1.3% | |||
| BCPG PCL, Foreign Shares | 3,471,037 | $ 842,704 | |
| Energy Absolute PCL NVDR | 544,200 | 1,268,283 | |
| $ 2,110,987 | |||
| United Kingdom — 4.1% | |||
| Croda International PLC | 12,771 | $ 912,156 | |
| easyJet PLC(2) | 238,756 | 779,030 | |
| Johnson Matthey PLC | 38,596 | 779,222 | |
| Linde PLC | 3,534 | 952,731 | |
| National Grid PLC | 92,632 | 953,563 | |
| Smart Metering Systems PLC | 133,751 | 1,193,956 | |
| United Utilities Group PLC | 81,308 | 802,848 | |
| $ 6,373,506 | |||
| United States — 35.1% | |||
| AAON, Inc. | 14,665 | $ 790,150 | |
| Acuity Brands, Inc. | 5,750 | 905,453 | |
| AECOM | 13,642 | 932,704 | |
| AES Corp. (The) | 39,210 | 886,146 | |
| Alaska Air Group, Inc.(2) | 22,944 | 898,258 | |
| Alphabet, Inc., Class A(2) | 9,236 | 883,423 | |
| Ameresco, Inc., Class A(2) | 12,074 | 802,680 | |
| Aptiv PLC(2) | 11,750 | 918,968 | |
| Arcosa, Inc. | 26,789 | 1,531,795 | |
| BorgWarner, Inc. | 26,507 | 832,320 | |
| Brookfield Renewable Corp., Class A | 34,822 | 1,137,983 | |
| Clearway Energy, Inc., Class C | 32,857 | 1,046,495 | |
| Cummins, Inc. | 4,633 | 942,862 | |
| Security | Shares | Value | |
| United States (continued) | |||
| Eaton Corp. PLC | 8,630 | $ 1,150,897 | |
| Emerson Electric Co. | 14,285 | 1,045,948 | |
| EnerSys | 24,779 | 1,441,394 | |
| Enphase Energy, Inc.(2) | 7,325 | 2,032,468 | |
| Enviva, Inc.(1) | 17,132 | 1,028,948 | |
| Equinix, Inc. | 1,542 | 877,151 | |
| FedEx Corp. | 4,742 | 704,045 | |
| First Solar, Inc.(2) | 14,768 | 1,953,363 | |
| General Mills, Inc. | 12,994 | 995,470 | |
| Gibraltar Industries, Inc.(2) | 18,560 | 759,661 | |
| Hannon Armstrong Sustainable Infrastructure Capital, Inc.(1) | 25,251 | 755,762 | |
| International Business Machines Corp. | 7,781 | 924,461 | |
| Itron, Inc.(2) | 17,458 | 735,156 | |
| Johnson Controls International PLC | 21,021 | 1,034,654 | |
| Livent Corp.(2) | 52,472 | 1,608,267 | |
| Microsoft Corp. | 3,877 | 902,953 | |
| MYR Group, Inc.(2) | 15,554 | 1,317,890 | |
| NextEra Energy Partners, L.P. | 16,335 | 1,181,184 | |
| NextEra Energy, Inc. | 11,732 | 919,906 | |
| ON Semiconductor Corp.(2) | 29,818 | 1,858,556 | |
| Ormat Technologies, Inc.(1) | 13,568 | 1,169,562 | |
| Owens Corning | 11,883 | 934,123 | |
| Power Integrations, Inc. | 22,917 | 1,474,021 | |
| Quanta Services, Inc. | 7,062 | 899,628 | |
| Rockwell Automation, Inc. | 4,664 | 1,003,273 | |
| SolarEdge Technologies, Inc.(2) | 6,885 | 1,593,602 | |
| Stanley Black & Decker, Inc. | 11,346 | 853,333 | |
| SunPower Corp.(1)(2) | 48,239 | 1,111,427 | |
| Sunrun, Inc.(2) | 40,583 | 1,119,685 | |
| Tenneco, Inc., Class A(2) | 42,055 | 731,336 | |
| Tesla, Inc.(2) | 5,294 | 1,404,233 | |
| TPI Composites, Inc.(2) | 69,226 | 780,869 | |
| Trane Technologies PLC | 7,358 | 1,065,512 | |
| Universal Display Corp. | 15,011 | 1,416,288 | |
| Vicor Corp.(2) | 20,453 | 1,209,590 | |
| Waste Management, Inc. | 5,904 | 945,880 | |
| Whirlpool Corp. | 6,383 | 860,492 | |
| Willdan Group, Inc.(2) | 43,934 | 650,662 | |
| $ 54,960,887 | |||
| Total Common Stocks (identified cost $187,283,024) | $155,604,790 | ||
| High Social Impact Investments — 0.1% |
| Security | Principal Amount (000's omitted) | Value | |
| Calvert Impact Capital, Inc., Community Investment Notes, 1.50%, 12/15/23(4)(5) | $ | 200 | $ 185,752 |
| Total High Social Impact Investments (identified cost $200,000) | $ 185,752 | ||
| Short-Term Investments — 3.1% |
| Affiliated Fund — 0.3% | |||
| Security | Shares | Value | |
| Morgan Stanley Institutional Liquidity Funds - Government Portfolio, Institutional Class, 2.80%(6) | 465,140 | $ 465,140 | |
| Total Affiliated Fund (identified cost $465,140) | $ 465,140 | ||
| Securities Lending Collateral — 2.8% | |||
| Security | Shares | Value | |
| State Street Navigator Securities Lending Government Money Market Portfolio, 3.07%(7) | 4,338,128 | $ 4,338,128 | |
| Total Securities Lending Collateral (identified cost $4,338,128) | $ 4,338,128 | ||
| Total Short-Term Investments (identified cost $4,803,268) | $ 4,803,268 | ||
| Total Investments — 102.6% (identified cost $192,286,292) | $ 160,593,810 | |
| Other Assets, Less Liabilities — (2.6)% | $ (4,100,364) | |
| Net Assets — 100.0% | $ 156,493,446 |
| The percentage shown for each investment category in the Schedule of Investments is based on net assets. | |
| (1) | All or a portion of this security was on loan at September 30, 2022. The aggregate market value of securities on loan at September 30, 2022 was $6,035,396. |
| (2) | Non-income producing security. |
| (3) | Security exempt from registration under Rule 144A of the Securities Act of 1933, as amended. These securities may be sold in certain transactions in reliance on an exemption from registration (normally to qualified institutional buyers). At September 30, 2022, the aggregate value of these securities is $7,151,931 or 4.6% of the Fund's net assets. |
| (4) | May be deemed to be an affiliated company (see Note 7). |
| (5) | Restricted security. Total market value of restricted securities amounts to $185,752, which represents 0.1% of the net assets of the Fund as of September 30, 2022. |
| (6) | May be deemed to be an affiliated investment company. The rate shown is the annualized seven-day yield as of September 30, 2022. |
| (7) | Represents investment of cash collateral received in connection with securities lending. |
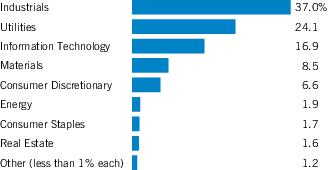
| Economic Sectors | % of Net Assets |
| Industrials | 37.0% |
| Utilities | 24.1 |
| Information Technology | 16.9 |
| Materials | 8.5 |
| Consumer Discretionary | 6.6 |
| Energy | 1.9 |
| Consumer Staples | 1.7 |
| Real Estate | 1.6 |
| Communication Services | 0.6 |
| Financials | 0.5 |
| High Social Impact Investments | 0.1 |
| Total | 99.5% |
| Description | Acquisition Date | Cost |
| Calvert Impact Capital, Inc., Community Investment Notes, 1.50%, 12/15/23 | 12/14/20 | $200,000 |
| Abbreviations: | |
| ADR | – American Depositary Receipt |
| NVDR | – Non-Voting Depository Receipt |
| PCL | – Public Company Limited |
| Common Stocks — 99.4% |
| Security | Shares | Value | |
| Australia — 2.3% | |||
| Reece, Ltd.(1) | 466,474 | $ 4,191,797 | |
| Reliance Worldwide Corp., Ltd. | 2,929,519 | 6,374,151 | |
| $ 10,565,948 | |||
| Brazil — 3.4% | |||
| Cia de Saneamento Basico do Estado de Sao Paulo ADR(1) | 709,834 | $ 6,466,588 | |
| Cia de Saneamento de Minas Gerais | 1,956,892 | 4,788,524 | |
| Cia de Saneamento do Parana, PFC Shares | 6,820,382 | 4,425,248 | |
| $ 15,680,360 | |||
| Canada — 1.7% | |||
| Gildan Activewear, Inc.(1) | 95,298 | $ 2,694,022 | |
| Nutrien, Ltd.(1) | 30,719 | 2,561,863 | |
| Stantec, Inc. | 58,604 | 2,570,116 | |
| $ 7,826,001 | |||
| Chile — 1.8% | |||
| Aguas Andinas S.A., Class A | 23,745,325 | $ 4,612,218 | |
| Inversiones Aguas Metropolitanas S.A. | 8,750,540 | 3,706,088 | |
| $ 8,318,306 | |||
| China — 4.6% | |||
| Beijing Enterprises Water Group, Ltd. | 22,229,452 | $ 5,097,911 | |
| China Everbright Environment Group, Ltd. | 5,629,666 | 2,330,559 | |
| China Lesso Group Holdings, Ltd. | 3,707,578 | 3,431,762 | |
| China Water Affairs Group, Ltd. | 5,944,421 | 4,701,729 | |
| Guangdong Investment, Ltd. | 7,043,427 | 5,626,429 | |
| $ 21,188,390 | |||
| Denmark — 0.5% | |||
| Novozymes A/S, Class B | 48,491 | $ 2,436,775 | |
| $ 2,436,775 | |||
| Finland — 1.4% | |||
| Kemira Oyj | 605,692 | $ 6,711,497 | |
| $ 6,711,497 | |||
| France — 3.6% | |||
| Accor S.A.(2) | 116,245 | $ 2,433,659 | |
| Eurofins Scientific SE | 40,157 | 2,383,893 | |
| L'Oreal S.A. | 8,081 | 2,583,835 | |
| LVMH Moet Hennessy Louis Vuitton SE | 4,284 | 2,525,738 | |
| Veolia Environnement S.A. | 355,966 | 6,803,287 | |
| $ 16,730,412 | |||
| Germany — 1.1% | |||
| GEA Group AG | 79,989 | $ 2,588,680 | |
| Security | Shares | Value | |
| Germany (continued) | |||
| Henkel AG & Co. KGaA, PFC Shares | 43,776 | $ 2,599,727 | |
| $ 5,188,407 | |||
| Italy — 1.7% | |||
| ACEA SpA | 324,661 | $ 3,524,806 | |
| Interpump Group SpA | 137,353 | 4,442,269 | |
| $ 7,967,075 | |||
| Japan — 8.7% | |||
| Ebara Corp. | 133,056 | $ 4,335,656 | |
| Hitachi Zosen Corp. | 677,927 | 4,014,048 | |
| Hulic Reit, Inc. | 2,360 | 2,701,355 | |
| Kurita Water Industries, Ltd.(1) | 215,742 | 7,659,526 | |
| Lixil Corp. | 495,800 | 7,274,766 | |
| METAWATER Co., Ltd. | 246,634 | 3,228,315 | |
| Sekisui Chemical Co., Ltd. | 205,700 | 2,516,519 | |
| TOTO, Ltd. | 151,300 | 5,052,438 | |
| Tsurumi Manufacturing Co., Ltd. | 219,400 | 3,467,392 | |
| $ 40,250,015 | |||
| Netherlands — 1.6% | |||
| Aalberts NV | 139,298 | $ 4,542,928 | |
| Arcadis NV | 87,202 | 2,838,101 | |
| $ 7,381,029 | |||
| Singapore — 1.1% | |||
| CDL Hospitality Trusts(1) | 3,138,101 | $ 2,539,018 | |
| City Developments, Ltd.(1) | 483,800 | 2,549,687 | |
| Hyflux, Ltd.(1)(2)(3) | 16,595,483 | 0 | |
| $ 5,088,705 | |||
| South Korea — 0.9% | |||
| Coway Co., Ltd. | 58,591 | $ 2,191,095 | |
| LG Chem, Ltd. | 5,903 | 2,179,596 | |
| $ 4,370,691 | |||
| Spain — 1.1% | |||
| Acciona S.A. | 14,218 | $ 2,498,898 | |
| Iberdrola S.A. | 273,910 | 2,553,987 | |
| $ 5,052,885 | |||
| Switzerland — 4.2% | |||
| Geberit AG | 13,069 | $ 5,603,832 | |
| Georg Fischer AG | 97,612 | 4,650,437 | |
| Roche Holding AG PC | 8,745 | 2,846,782 | |
| Sika AG | 12,355 | 2,483,252 | |
| Sulzer AG | 72,345 | 4,161,803 | |
| $ 19,746,106 | |||
| Security | Shares | Value | |
| Taiwan — 0.5% | |||
| Taiwan Semiconductor Manufacturing Co., Ltd. | 168,294 | $ 2,230,803 | |
| $ 2,230,803 | |||
| Thailand — 1.7% | |||
| Eastern Water Resources Development and Management PCL, Foreign Shares | 21,503,800 | $ 3,242,001 | |
| TTW PCL, Foreign Shares | 17,210,900 | 4,518,708 | |
| $ 7,760,709 | |||
| United Kingdom — 7.8% | |||
| CNH Industrial NV | 228,144 | $ 2,548,369 | |
| Croda International PLC | 35,651 | 2,546,338 | |
| Ferguson PLC | 54,446 | 5,647,641 | |
| Genuit Group PLC | 1,037,537 | 3,358,519 | |
| Halma PLC | 115,562 | 2,599,262 | |
| Mondi PLC | 163,569 | 2,512,817 | |
| Pennon Group PLC | 601,404 | 5,247,381 | |
| Severn Trent PLC | 226,660 | 5,925,251 | |
| United Utilities Group PLC | 607,883 | 6,002,332 | |
| $ 36,387,910 | |||
| United States — 49.7% | |||
| Advanced Drainage Systems, Inc. | 41,675 | $ 5,183,120 | |
| American States Water Co. | 80,071 | 6,241,534 | |
| American Water Works Co., Inc. | 56,897 | 7,405,714 | |
| Badger Meter, Inc. | 86,045 | 7,949,698 | |
| Ball Corp. | 49,994 | 2,415,710 | |
| Brookfield Renewable Corp., Class A | 72,655 | 2,374,365 | |
| California Water Service Group | 114,051 | 6,009,347 | |
| Chemed Corp. | 11,644 | 5,083,305 | |
| CMS Energy Corp. | 41,852 | 2,437,460 | |
| Cousins Properties, Inc. | 103,918 | 2,426,485 | |
| Danaher Corp. | 10,334 | 2,669,169 | |
| Ecolab, Inc. | 66,699 | 9,632,670 | |
| Energy Recovery, Inc.(2) | 320,493 | 6,967,518 | |
| Entegris, Inc. | 29,408 | 2,441,452 | |
| Essential Utilities, Inc. | 157,377 | 6,512,260 | |
| Evoqua Water Technologies Corp.(2) | 244,571 | 8,087,963 | |
| Flowserve Corp. | 171,941 | 4,178,166 | |
| Fortune Brands Home & Security, Inc. | 91,579 | 4,916,876 | |
| Franklin Electric Co., Inc. | 58,577 | 4,786,327 | |
| Gorman-Rupp Co. (The) | 151,608 | 3,606,754 | |
| Hawkins, Inc. | 177,081 | 6,904,388 | |
| Hyatt Hotels Corp., Class A(2) | 31,123 | 2,519,718 | |
| IDEX Corp. | 49,176 | 9,827,824 | |
| IDEXX Laboratories, Inc.(2) | 8,027 | 2,615,197 | |
| Intel Corp. | 87,415 | 2,252,685 | |
| Itron, Inc.(2) | 58,641 | 2,469,372 | |
| Security | Shares | Value | |
| United States (continued) | |||
| Levi Strauss & Co., Class A(1) | 165,197 | $ 2,390,401 | |
| Lindsay Corp. | 29,175 | 4,180,194 | |
| Masco Corp. | 115,115 | 5,374,719 | |
| Middlesex Water Co. | 67,954 | 5,246,049 | |
| Minerals Technologies, Inc. | 47,892 | 2,366,344 | |
| Mondelez International, Inc., Class A | 45,851 | 2,514,010 | |
| Mueller Industries, Inc. | 80,864 | 4,806,556 | |
| Mueller Water Products, Inc., Class A | 414,508 | 4,256,997 | |
| Nucor Corp. | 20,981 | 2,244,757 | |
| Parker-Hannifin Corp. | 10,704 | 2,593,686 | |
| Pentair PLC | 205,612 | 8,354,016 | |
| Procter & Gamble Co. (The) | 20,228 | 2,553,785 | |
| Roper Technologies, Inc. | 6,931 | 2,492,665 | |
| Sherwin-Williams Co. (The) | 12,022 | 2,461,504 | |
| SJW Group | 95,256 | 5,486,746 | |
| Tetra Tech, Inc. | 67,222 | 8,640,044 | |
| Trimble, Inc.(2) | 44,114 | 2,394,067 | |
| Valmont Industries, Inc. | 19,606 | 5,266,564 | |
| Watts Water Technologies, Inc., Class A | 61,084 | 7,680,091 | |
| Xylem, Inc. | 109,477 | 9,563,911 | |
| York Water Co. (The) | 120,231 | 4,620,477 | |
| Zurn Elkay Water Solutions Corp. | 303,310 | 7,431,095 | |
| $230,833,755 | |||
| Total Common Stocks (identified cost $443,858,324) | $461,715,779 | ||
| High Social Impact Investments — 0.1% |
| Security | Principal Amount (000's omitted) | Value | |
| Calvert Impact Capital, Inc., Community Investment Notes, 1.50%, 12/15/23(4)(5) | $ | 630 | $ 585,119 |
| Total High Social Impact Investments (identified cost $630,000) | $ 585,119 | ||
| Short-Term Investments — 0.0%(6) |
| Affiliated Fund — 0.0%(6) | |||
| Security | Shares | Value | |
| Morgan Stanley Institutional Liquidity Funds - Government Portfolio, Institutional Class, 2.80%(7) | 7,628 | $ 7,628 | |
| Total Affiliated Fund (identified cost $7,628) | $ 7,628 | ||
| Securities Lending Collateral — 0.0%(6) | |||
| Security | Shares | Value | |
| State Street Navigator Securities Lending Government Money Market Portfolio, 3.07%(8) | 219,097 | $ 219,097 | |
| Total Securities Lending Collateral (identified cost $219,097) | $ 219,097 | ||
| Total Short-Term Investments (identified cost $226,725) | $ 226,725 | ||
| Total Investments — 99.5% (identified cost $444,715,049) | $462,527,623 | |
| Other Assets, Less Liabilities — 0.5% | $ 2,275,998 | |
| Net Assets — 100.0% | $464,803,621 |
| The percentage shown for each investment category in the Schedule of Investments is based on net assets. | |
| (1) | All or a portion of this security was on loan at September 30, 2022. The aggregate market value of securities on loan at September 30, 2022 was $6,889,642. |
| (2) | Non-income producing security. |
| (3) | For fair value measurement disclosure purposes, security is categorized as Level 3 (see Note 1A). |
| (4) | May be deemed to be an affiliated company (see Note 7). |
| (5) | Restricted security. Total market value of restricted securities amounts to $585,119, which represents 0.1% of the net assets of the Fund as of September 30, 2022. |
| (6) | Amount is less than 0.05%. |
| (7) | May be deemed to be an affiliated investment company. The rate shown is the annualized seven-day yield as of September 30, 2022. |
| (8) | Represents investment of cash collateral received in connection with securities lending. |
| Economic Sectors | % of Net Assets |
| Industrials | 45.2% |
| Utilities | 27.1 |
| Materials | 10.2 |
| Information Technology | 5.4 |
| Consumer Discretionary | 3.7 |
| Health Care | 3.4 |
| Consumer Staples | 2.2 |
| Real Estate | 2.2 |
| High Social Impact Investments | 0.1 |
| Total | 99.5% |
| Description | Acquisition Date | Cost |
| Calvert Impact Capital, Inc., Community Investment Notes, 1.50%, 12/15/23 | 12/14/20 | $630,000 |
| Abbreviations: | |
| ADR | – American Depositary Receipt |
| PC | – Participation Certificate |
| PCL | – Public Company Limited |
| PFC Shares | – Preference Shares |
| September 30, 2022 | ||
| Global Energy Solutions Fund | Global Water Fund | |
| Assets | ||
| Investments in securities of unaffiliated issuers, at value (identified cost $191,621,152 and $444,077,421, respectively) - including $6,035,396 and $6,889,642, respectively, of securities on loan | $ 159,942,918 | $ 461,934,876 |
| Investments in securities of affiliated issuers, at value (identified cost $665,140 and $637,628, respectively) | 650,892 | 592,747 |
| Cash | — | 63 |
| Cash denominated in foreign currency, at value (cost $116,541 and $704,248, respectively) | 114,894 | 693,353 |
| Receivable for investments sold | — | 104,055 |
| Receivable for capital shares sold | 186,623 | 1,049,950 |
| Dividends receivable | 234,652 | 1,266,748 |
| Dividends and interest receivable - affiliated | 2,913 | 8,843 |
| Securities lending income receivable | 4,151 | 2,381 |
| Tax reclaims receivable | 134,228 | 377,370 |
| Receivable from affiliate | 17,078 | 13,981 |
| Directors' deferred compensation plan | 46,082 | 241,888 |
| Total assets | $161,334,431 | $466,286,255 |
| Liabilities | ||
| Due to custodian | $ 1,803 | $ — |
| Payable for capital shares redeemed | 182,430 | 411,949 |
| Deposits for securities loaned | 4,338,128 | 219,097 |
| Payable to affiliates: | ||
| Investment advisory fee | 106,921 | 297,704 |
| Administrative fee | 17,113 | 49,294 |
| Distribution and service fees | 25,794 | 64,607 |
| Sub-transfer agency fee | 9,045 | 12,432 |
| Directors' deferred compensation plan | 46,082 | 241,888 |
| Accrued expenses | 113,669 | 185,663 |
| Total liabilities | $ 4,840,985 | $ 1,482,634 |
| Net Assets | $156,493,446 | $464,803,621 |
| Sources of Net Assets | ||
| Paid-in capital | $ 209,661,692 | $ 446,946,749 |
| Distributable earnings (Accumulated loss) | (53,168,246) | 17,856,872 |
| Net Assets | $156,493,446 | $464,803,621 |
| Class A Shares | ||
| Net Assets | $ 79,840,619 | $ 196,323,474 |
| Shares Outstanding | 8,098,709 | 8,952,667 |
| Net Asset Value and Redemption Price Per Share (net assets ÷ shares of beneficial interest outstanding) | $ 9.86 | $ 21.93 |
| Maximum Offering Price Per Share (100 ÷ 94.75 of net asset value per share) | $ 10.41 | $ 23.15 |
| Class C Shares | ||
| Net Assets | $ 8,303,729 | $ 23,291,240 |
| Shares Outstanding | 907,173 | 1,161,096 |
| Net Asset Value and Offering Price Per Share* (net assets ÷ shares of beneficial interest outstanding) | $ 9.15 | $ 20.06 |
| September 30, 2022 | ||
| Global Energy Solutions Fund | Global Water Fund | |
| Class I Shares | ||
| Net Assets | $ 68,349,098 | $ 245,188,907 |
| Shares Outstanding | 6,811,432 | 11,089,970 |
| Net Asset Value, Offering Price and Redemption Price Per Share (net assets ÷ shares of beneficial interest outstanding) | $ 10.03 | $ 22.11 |
| On sales of $50,000 or more, the offering price of Class A shares is reduced. | |
| * | Redemption price per share is equal to the net asset value less any applicable contingent deferred sales charge. |
| Year Ended September 30, 2022 | ||
| Global Energy Solutions Fund | Global Water Fund | |
| Investment Income | ||
| Dividend income (net of foreign taxes withheld of $404,981 and $753,848, respectively) | $ 3,944,171 | $ 11,473,767 |
| Dividend income - affiliated issuers | 2,766 | 4,313 |
| Interest and other income | 2,747 | 2,891 |
| Interest income - affiliated issuers | 3,000 | 9,450 |
| Securities lending income, net | 36,948 | 25,762 |
| Total investment income | $ 3,989,632 | $ 11,516,183 |
| Expenses | ||
| Investment advisory fee | $ 1,591,101 | $ 3,996,835 |
| Administrative fee | 254,576 | 663,743 |
| Distribution and service fees: | ||
| Class A | 241,649 | 596,628 |
| Class C | 102,411 | 342,764 |
| Directors' fees and expenses | 9,223 | 24,639 |
| Custodian fees | 44,233 | 56,833 |
| Transfer agency fees and expenses | 317,296 | 617,015 |
| Accounting fees | 62,144 | 133,443 |
| Professional fees | 37,721 | 41,435 |
| Registration fees | 67,285 | 71,495 |
| Reports to shareholders | 25,221 | 50,804 |
| Miscellaneous | 32,542 | 36,225 |
| Total expenses | $ 2,785,402 | $ 6,631,859 |
| Waiver and/or reimbursement of expenses by affiliate | $ (332,469) | $ (212,516) |
| Net expenses | $ 2,452,933 | $ 6,419,343 |
| Net investment income | $ 1,536,699 | $ 5,096,840 |
| Realized and Unrealized Gain (Loss) | ||
| Net realized gain (loss): | ||
| Investment securities | $ 15,233,991 | $ 8,609,427 |
| Investment securities - affiliated issuers | (47) | 547 |
| Foreign currency transactions | 32,017 | (313,245) |
| Net realized gain | $ 15,265,961 | $ 8,296,729 |
| Change in unrealized appreciation (depreciation): | ||
| Investment securities | $ (65,962,201) | $ (147,265,756) |
| Investment securities - affiliated issuers | (10,893) | (34,250) |
| Foreign currency | 2,869 | (45,191) |
| Net change in unrealized appreciation (depreciation) | $(65,970,225) | $(147,345,197) |
| Net realized and unrealized loss | $(50,704,264) | $(139,048,468) |
| Net decrease in net assets from operations | $(49,167,565) | $(133,951,628) |
| Global Energy Solutions Fund | Global Water Fund | |||
| Year Ended September 30, | ||||
| 2022 | 2021 | 2022 | 2021 | |
| Increase (Decrease) in Net Assets | ||||
| From operations: | ||||
| Net investment income | $ 1,536,699 | $ 1,158,939 | $ 5,096,840 | $ 6,548,443 |
| Net realized gain | 15,265,961 | 29,955,347 | 8,296,729 | 31,547,709 |
| Net change in unrealized appreciation (depreciation) | (65,970,225) | 9,604,773 | (147,345,197) | 96,641,421 |
| Net increase (decrease) in net assets from operations | $ (49,167,565) | $ 40,719,059 | $(133,951,628) | $134,737,573 |
| Distributions to shareholders: | ||||
| Class A | $ (270,586) | $ (576,225) | $ (2,493,300) | $ (1,611,609) |
| Class C | — | (12,463) | (110,783) | (12,508) |
| Class I | (624,496) | (567,285) | (3,511,660) | (2,142,987) |
| Total distributions to shareholders | $ (895,082) | $ (1,155,973) | $ (6,115,743) | $ (3,767,104) |
| Capital share transactions: | ||||
| Class A | $ 3,598,277 | $ 15,894,369 | $ 9,262,072 | $ 8,216,239 |
| Class C | (173,839) | 671,750 | (10,578,890) | (9,252,815) |
| Class I | (22,286,670) | 53,344,764 | 42,992,587 | 23,806,274 |
| Net increase (decrease) in net assets from capital share transactions | $ (18,862,232) | $ 69,910,883 | $ 41,675,769 | $ 22,769,698 |
| Net increase (decrease) in net assets | $ (68,924,879) | $109,473,969 | $ (98,391,602) | $153,740,167 |
| Net Assets | ||||
| At beginning of year | $ 225,418,325 | $ 115,944,356 | $ 563,195,223 | $ 409,455,056 |
| At end of year | $156,493,446 | $225,418,325 | $ 464,803,621 | $563,195,223 |
| Global Energy Solutions Fund — Class A | |||||
| Year Ended September 30, | |||||
| 2022 | 2021 | 2020 | 2019 | 2018 | |
| Net asset value — Beginning of year | $ 12.79 | $ 9.54 | $ 7.08 | $ 6.95 | $ 7.23 |
| Income (Loss) From Operations | |||||
| Net investment income(1) | $ 0.08 | $ 0.06 | $ 0.06 | $ 0.08 | $ 0.10 |
| Net realized and unrealized gain (loss) | (2.98) | 3.27 | 2.48 | 0.15 | (0.29) |
| Total income (loss) from operations | $ (2.90) | $ 3.33 | $ 2.54 | $ 0.23 | $ (0.19) |
| Less Distributions | |||||
| From net investment income | $ (0.03) | $ (0.08) | $ (0.08) | $ (0.10) | $ (0.09) |
| Total distributions | $ (0.03) | $ (0.08) | $ (0.08) | $ (0.10) | $ (0.09) |
| Net asset value — End of year | $ 9.86 | $ 12.79 | $ 9.54 | $ 7.08 | $ 6.95 |
| Total Return(2) | (22.71)% | 35.00% | 36.12% | 3.60% | (2.73)% |
| Ratios/Supplemental Data | |||||
| Net assets, end of year (000’s omitted) | $79,841 | $100,038 | $62,428 | $47,596 | $51,502 |
| Ratios (as a percentage of average daily net assets):(3) | |||||
| Total expenses | 1.40% | 1.42% | 1.54% | 1.72% | 1.69% |
| Net expenses | 1.24% (4) | 1.24% | 1.24% | 1.26% | 1.28% |
| Net investment income | 0.65% | 0.48% | 0.76% | 1.27% | 1.34% |
| Portfolio Turnover | 43% | 50% | 45% | 40% | 38% |
| (1) | Computed using average shares outstanding. |
| (2) | Returns are historical and are calculated by determining the percentage change in net asset value with all distributions reinvested and do not reflect the effect of sales charges, if any. |
| (3) | Total expenses do not reflect amounts reimbursed and/or waived by the adviser and certain of its affiliates, if applicable. Net expenses are net of all reductions and represent the net expenses paid by the Fund. |
| (4) | Includes a reduction by the investment adviser of a portion of its advisory fee due to the Fund's investment in the Liquidity Fund (equal to less than 0.005% of average daily net assets for the year ended September 30, 2022). |
| Global Energy Solutions Fund — Class C | |||||
| Year Ended September 30, | |||||
| 2022 | 2021 | 2020 | 2019 | 2018 | |
| Net asset value — Beginning of year | $ 11.93 | $ 8.92 | $ 6.63 | $ 6.50 | $ 6.76 |
| Income (Loss) From Operations | |||||
| Net investment income (loss)(1) | $ (0.01) | $ (0.03) | $ (0.00)(2) | $ 0.02 | $ 0.04 |
| Net realized and unrealized gain (loss) | (2.77) | 3.06 | 2.32 | 0.16 | (0.26) |
| Total income (loss) from operations | $ (2.78) | $ 3.03 | $ 2.32 | $ 0.18 | $ (0.22) |
| Less Distributions | |||||
| From net investment income | $ — | $ (0.02) | $ (0.03) | $ (0.05) | $ (0.04) |
| Total distributions | $ — | $ (0.02) | $ (0.03) | $ (0.05) | $ (0.04) |
| Net asset value — End of year | $ 9.15 | $ 11.93 | $ 8.92 | $ 6.63 | $ 6.50 |
| Total Return(3) | (23.30)% | 33.93% | 35.03% | 2.85% | (3.31)% |
| Ratios/Supplemental Data | |||||
| Net assets, end of year (000’s omitted) | $ 8,304 | $11,009 | $ 7,841 | $6,752 | $9,996 |
| Ratios (as a percentage of average daily net assets):(4) | |||||
| Total expenses | 2.16% | 2.17% | 2.29% | 2.48% | 2.44% |
| Net expenses | 1.99% (5) | 1.99% | 1.99% | 2.01% | 2.03% |
| Net investment income (loss) | (0.11)% | (0.27)% | (0.01)% | 0.38% | 0.59% |
| Portfolio Turnover | 43% | 50% | 45% | 40% | 38% |
| (1) | Computed using average shares outstanding. |
| (2) | Amount is less than $(0.005). |
| (3) | Returns are historical and are calculated by determining the percentage change in net asset value with all distributions reinvested and do not reflect the effect of sales charges, if any. |
| (4) | Total expenses do not reflect amounts reimbursed and/or waived by the adviser and certain of its affiliates, if applicable. Net expenses are net of all reductions and represent the net expenses paid by the Fund. |
| (5) | Includes a reduction by the investment adviser of a portion of its advisory fee due to the Fund's investment in the Liquidity Fund (equal to less than 0.005% of average daily net assets for the year ended September 30, 2022). |
| Global Energy Solutions Fund — Class I | |||||
| Year Ended September 30, | |||||
| 2022 | 2021 | 2020 | 2019 | 2018 | |
| Net asset value — Beginning of year | $ 13.01 | $ 9.70 | $ 7.20 | $ 7.07 | $ 7.34 |
| Income (Loss) From Operations | |||||
| Net investment income(1) | $ 0.11 | $ 0.10 | $ 0.08 | $ 0.11 | $ 0.15 |
| Net realized and unrealized gain (loss) | (3.02) | 3.31 | 2.52 | 0.14 | (0.31) |
| Total income (loss) from operations | $ (2.91) | $ 3.41 | $ 2.60 | $ 0.25 | $ (0.16) |
| Less Distributions | |||||
| From net investment income | $ (0.07) | $ (0.10) | $ (0.10) | $ (0.12) | $ (0.11) |
| Total distributions | $ (0.07) | $ (0.10) | $ (0.10) | $ (0.12) | $ (0.11) |
| Net asset value — End of year | $ 10.03 | $ 13.01 | $ 9.70 | $ 7.20 | $ 7.07 |
| Total Return(2) | (22.52)% | 35.28% | 36.40% | 3.89% | (2.33)% |
| Ratios/Supplemental Data | |||||
| Net assets, end of year (000’s omitted) | $68,349 | $114,371 | $45,676 | $23,867 | $19,178 |
| Ratios (as a percentage of average daily net assets):(3) | |||||
| Total expenses | 1.15% | 1.17% | 1.29% | 1.47% | 1.43% |
| Net expenses | 0.99% (4) | 0.99% | 0.99% | 0.98% | 0.93% |
| Net investment income | 0.88% | 0.80% | 1.08% | 1.60% | 2.00% |
| Portfolio Turnover | 43% | 50% | 45% | 40% | 38% |
| (1) | Computed using average shares outstanding. |
| (2) | Returns are historical and are calculated by determining the percentage change in net asset value with all distributions reinvested and do not reflect the effect of sales charges, if any. |
| (3) | Total expenses do not reflect amounts reimbursed and/or waived by the adviser and certain of its affiliates, if applicable. Net expenses are net of all reductions and represent the net expenses paid by the Fund. |
| (4) | Includes a reduction by the investment adviser of a portion of its advisory fee due to the Fund's investment in the Liquidity Fund (equal to less than 0.005% of average daily net assets for the year ended September 30, 2022). |
| Global Water Fund — Class A | |||||
| Year Ended September 30, | |||||
| 2022 | 2021 | 2020 | 2019 | 2018 | |
| Net asset value — Beginning of year | $ 28.61 | $ 21.67 | $ 20.70 | $ 20.00 | $ 19.92 |
| Income (Loss) From Operations | |||||
| Net investment income(1) | $ 0.22 | $ 0.33 | $ 0.14 | $ 0.23 | $ 0.23 |
| Net realized and unrealized gain (loss) | (6.62) | 6.80 | 1.02 | 0.70 | 0.04 |
| Total income (loss) from operations | $ (6.40) | $ 7.13 | $ 1.16 | $ 0.93 | $ 0.27 |
| Less Distributions | |||||
| From net investment income | $ (0.28) | $ (0.19) | $ (0.19) | $ (0.23) | $ (0.19) |
| Total distributions | $ (0.28) | $ (0.19) | $ (0.19) | $ (0.23) | $ (0.19) |
| Net asset value — End of year | $ 21.93 | $ 28.61 | $ 21.67 | $ 20.70 | $ 20.00 |
| Total Return(2) | (22.62)% | 33.05% | 5.57% | 4.86% | 1.34% |
| Ratios/Supplemental Data | |||||
| Net assets, end of year (000’s omitted) | $196,323 | $246,978 | $180,956 | $181,139 | $201,243 |
| Ratios (as a percentage of average daily net assets):(3) | |||||
| Total expenses | 1.28% | 1.29% | 1.34% | 1.38% | 1.39% |
| Net expenses | 1.24% (4) | 1.24% | 1.24% | 1.25% | 1.28% |
| Net investment income | 0.83% | 1.21% | 0.70% | 1.17% | 1.14% |
| Portfolio Turnover | 25% | 27% | 35% | 28% | 40% |
| (1) | Computed using average shares outstanding. |
| (2) | Returns are historical and are calculated by determining the percentage change in net asset value with all distributions reinvested and do not reflect the effect of sales charges, if any. |
| (3) | Total expenses do not reflect amounts reimbursed and/or waived by the adviser and certain of its affiliates, if applicable. Net expenses are net of all reductions and represent the net expenses paid by the Fund. |
| (4) | Includes a reduction by the investment adviser of a portion of its advisory fee due to the Fund's investment in the Liquidity Fund (equal to less than 0.005% of average daily net assets for the year ended September 30, 2022). |
| Global Water Fund — Class C | |||||
| Year Ended September 30, | |||||
| 2022 | 2021 | 2020 | 2019 | 2018 | |
| Net asset value — Beginning of year | $ 26.19 | $ 19.84 | $ 18.98 | $ 18.32 | $ 18.28 |
| Income (Loss) From Operations | |||||
| Net investment income (loss)(1) | $ 0.00(2) | $ 0.10 | $ (0.02) | $ 0.08 | $ 0.07 |
| Net realized and unrealized gain (loss) | (6.06) | 6.26 | 0.92 | 0.66 | 0.03 |
| Total income (loss) from operations | $ (6.06) | $ 6.36 | $ 0.90 | $ 0.74 | $ 0.10 |
| Less Distributions | |||||
| From net investment income | $ (0.07) | $ (0.01) | $ (0.04) | $ (0.08) | $ (0.06) |
| Total distributions | $ (0.07) | $ (0.01) | $ (0.04) | $ (0.08) | $ (0.06) |
| Net asset value — End of year | $ 20.06 | $ 26.19 | $ 19.84 | $ 18.98 | $ 18.32 |
| Total Return(3) | (23.20)% | 32.05% | 4.75% | 4.08% | 0.61% |
| Ratios/Supplemental Data | |||||
| Net assets, end of year (000’s omitted) | $23,291 | $41,631 | $39,358 | $50,369 | $58,455 |
| Ratios (as a percentage of average daily net assets):(4) | |||||
| Total expenses | 2.03% | 2.04% | 2.09% | 2.13% | 2.14% |
| Net expenses | 1.99% (5) | 1.99% | 1.99% | 2.01% | 2.03% |
| Net investment income (loss) | 0.02% | 0.42% | (0.08)% | 0.43% | 0.40% |
| Portfolio Turnover | 25% | 27% | 35% | 28% | 40% |
| (1) | Computed using average shares outstanding. |
| (2) | Amount is less than $0.005. |
| (3) | Returns are historical and are calculated by determining the percentage change in net asset value with all distributions reinvested and do not reflect the effect of sales charges, if any. |
| (4) | Total expenses do not reflect amounts reimbursed and/or waived by the adviser and certain of its affiliates, if applicable. Net expenses are net of all reductions and represent the net expenses paid by the Fund. |
| (5) | Includes a reduction by the investment adviser of a portion of its advisory fee due to the Fund's investment in the Liquidity Fund (equal to less than 0.005% of average daily net assets for the year ended September 30, 2022). |
| Global Water Fund — Class I | |||||
| Year Ended September 30, | |||||
| 2022 | 2021 | 2020 | 2019 | 2018 | |
| Net asset value — Beginning of year | $ 28.84 | $ 21.83 | $ 20.85 | $ 20.15 | $ 20.08 |
| Income (Loss) From Operations | |||||
| Net investment income(1) | $ 0.30 | $ 0.40 | $ 0.20 | $ 0.29 | $ 0.36 |
| Net realized and unrealized gain (loss) | (6.68) | 6.86 | 1.02 | 0.70 | (0.02) |
| Total income (loss) from operations | $ (6.38) | $ 7.26 | $ 1.22 | $ 0.99 | $ 0.34 |
| Less Distributions | |||||
| From net investment income | $ (0.35) | $ (0.25) | $ (0.24) | $ (0.29) | $ (0.27) |
| Total distributions | $ (0.35) | $ (0.25) | $ (0.24) | $ (0.29) | $ (0.27) |
| Net asset value — End of year | $ 22.11 | $ 28.84 | $ 21.83 | $ 20.85 | $ 20.15 |
| Total Return(2) | (22.44)% | 33.41% | 5.83% | 5.18% | 1.68% |
| Ratios/Supplemental Data | |||||
| Net assets, end of year (000’s omitted) | $245,189 | $274,586 | $189,141 | $179,839 | $170,996 |
| Ratios (as a percentage of average daily net assets):(3) | |||||
| Total expenses | 1.03% | 1.04% | 1.09% | 1.13% | 1.14% |
| Net expenses | 0.99% (4) | 0.99% | 0.99% | 0.97% | 0.93% |
| Net investment income | 1.11% | 1.47% | 0.97% | 1.48% | 1.78% |
| Portfolio Turnover | 25% | 27% | 35% | 28% | 40% |
| (1) | Computed using average shares outstanding. |
| (2) | Returns are historical and are calculated by determining the percentage change in net asset value with all distributions reinvested and do not reflect the effect of sales charges, if any. |
| (3) | Total expenses do not reflect amounts reimbursed and/or waived by the adviser and certain of its affiliates, if applicable. Net expenses are net of all reductions and represent the net expenses paid by the Fund. |
| (4) | Includes a reduction by the investment adviser of a portion of its advisory fee due to the Fund's investment in the Liquidity Fund (equal to less than 0.005% of average daily net assets for the year ended September 30, 2022). |
| Asset Description | Level 1 | Level 2 | Level 3 | Total |
| Common Stocks: | ||||
| Austria | $ — | $ 1,190,417 | $ — | $ 1,190,417 |
| Belgium | — | 1,592,310 | — | 1,592,310 |
| Brazil | 804,495 | — | — | 804,495 |
| Canada | 8,255,772 | — | — | 8,255,772 |
| China | 1,521,157 | 5,326,916 | — | 6,848,073 |
| Denmark | — | 3,896,587 | — | 3,896,587 |
| Finland | — | 878,328 | — | 878,328 |
| France | — | 7,567,742 | — | 7,567,742 |
| Germany | — | 13,389,512 | — | 13,389,512 |
| Greece | — | 945,752 | — | 945,752 |
| Ireland | — | 1,644,148 | — | 1,644,148 |
| Italy | — | 3,553,823 | — | 3,553,823 |
| Japan | — | 9,618,395 | — | 9,618,395 |
| Netherlands | — | 2,043,928 | — | 2,043,928 |
| New Zealand | — | 3,258,370 | — | 3,258,370 |
| Norway | — | 1,494,743 | — | 1,494,743 |
| Singapore | — | 1,732,555 | — | 1,732,555 |
| South Korea | — | 3,501,785 | — | 3,501,785 |
| Spain | 919,185 | 7,231,902 | — | 8,151,087 |
| Sweden | — | 3,289,641 | — | 3,289,641 |
| Switzerland | — | 1,803,308 | — | 1,803,308 |
| Taiwan | — | 6,698,639 | — | 6,698,639 |
| Thailand | — | 2,110,987 | — | 2,110,987 |
| United Kingdom | 952,731 | 5,420,775 | — | 6,373,506 |
| United States | 54,960,887 | — | — | 54,960,887 |
| Total Common Stocks | $67,414,227 | $88,190,563 (1) | $ — | $155,604,790 |
| High Social Impact Investments | $ — | $ 185,752 | $ — | $ 185,752 |
| Short-Term Investments: | ||||
| Affiliated Fund | 465,140 | — | — | 465,140 |
| Asset Description (continued) | Level 1 | Level 2 | Level 3 | Total |
| Securities Lending Collateral | $ 4,338,128 | $ — | $ — | $ 4,338,128 |
| Total Investments | $72,217,495 | $88,376,315 | $ — | $160,593,810 |
| (1) | Includes foreign equity securities whose values were adjusted to reflect market trading of comparable securities or other correlated instruments that occurred after the close of trading in their applicable foreign markets. |
| Asset Description | Level 1 | Level 2 | Level 3(1) | Total |
| Common Stocks: | ||||
| Australia | $ — | $ 10,565,948 | $ — | $ 10,565,948 |
| Brazil | 15,680,360 | — | — | 15,680,360 |
| Canada | 7,826,001 | — | — | 7,826,001 |
| Chile | — | 8,318,306 | — | 8,318,306 |
| China | — | 21,188,390 | — | 21,188,390 |
| Denmark | — | 2,436,775 | — | 2,436,775 |
| Finland | — | 6,711,497 | — | 6,711,497 |
| France | — | 16,730,412 | — | 16,730,412 |
| Germany | — | 5,188,407 | — | 5,188,407 |
| Italy | — | 7,967,075 | — | 7,967,075 |
| Japan | — | 40,250,015 | — | 40,250,015 |
| Netherlands | — | 7,381,029 | — | 7,381,029 |
| Singapore | — | 5,088,705 | 0 | 5,088,705 |
| South Korea | — | 4,370,691 | — | 4,370,691 |
| Spain | — | 5,052,885 | — | 5,052,885 |
| Switzerland | — | 19,746,106 | — | 19,746,106 |
| Taiwan | — | 2,230,803 | — | 2,230,803 |
| Thailand | — | 7,760,709 | — | 7,760,709 |
| United Kingdom | 2,548,369 | 33,839,541 | — | 36,387,910 |
| United States | 230,833,755 | — | — | 230,833,755 |
| Total Common Stocks | $256,888,485 | $204,827,294 (2) | $ 0 | $461,715,779 |
| High Social Impact Investments | $ — | $ 585,119 | $ — | $ 585,119 |
| Short-Term Investments: | ||||
| Affiliated Fund | 7,628 | — | — | 7,628 |
| Securities Lending Collateral | 219,097 | — | — | 219,097 |
| Total Investments | $257,115,210 | $205,412,413 | $ 0 | $462,527,623 |
| (1) | None of the unobservable inputs for Level 3 assets, individually or collectively, had a material impact on the Fund. |
| (2) | Includes foreign equity securities whose values were adjusted to reflect market trading of comparable securities or other correlated instruments that occurred after the close of trading in their applicable foreign markets. |
| Global Energy Solutions | Global Water | |
| Class A | $ 99 | $1,697 |
| Class C | 1,809 | 2,160 |
| Global Energy Solutions | Global Water | |
| Purchases | $ 90,561,706 | $174,793,402 |
| Sales | 106,817,077 | 134,236,174 |
| Global Energy Solutions | Global Water | |||
| Year Ended September 30, | Year Ended September 30, | |||
| 2022 | 2021 | 2022 | 2021 | |
| Ordinary income | $895,082 | $1,155,973 | $6,115,743 | $3,767,104 |
| Global Energy Solutions | Global Water | |
| Change in: | ||
| Paid-in capital | $ 223,526 | $ 519,440 |
| Distributable earnings (Accumulated loss) | $(223,526) | $(519,440) |
| Global Energy Solutions | Global Water | |
| Undistributed ordinary income | $ 1,171,941 | $ 4,334,047 |
| Undistributed long-term capital gains | — | 3,272,029 |
| Deferred capital losses | (20,856,419) | — |
| Net unrealized appreciation (depreciation) | (33,483,768) | 10,250,796 |
| Distributable earnings (Accumulated loss) | $(53,168,246) | $17,856,872 |
| Global Energy Solutions | Global Water | |
| Aggregate cost | $194,052,978 | $452,224,394 |
| Gross unrealized appreciation | $ 12,012,502 | $ 79,234,697 |
| Gross unrealized depreciation | (45,471,670) | (68,931,468) |
| Net unrealized appreciation (depreciation) | $ (33,459,168) | $ 10,303,229 |
| Global Energy Solutions | Global Water | |
| Securities on Loan | $ 6,035,396 | $ 6,889,642 |
| Collateral Received: | ||
| Cash | 4,338,128 | 219,097 |
| U.S. government and/or agencies securities | 1,935,235 | 7,358,881 |
| Total Collateral Received | $6,273,363 | $7,577,978 |
| Global Energy Solutions | Remaining Contractual Maturity of the Transactions | ||||
| Overnight and Continuous | <30 days | 30 to 90 days | >90 days | Total | |
| Common Stocks | $4,338,128 | $ — | $ — | $ — | $4,338,128 |
| Global Water | Remaining Contractual Maturity of the Transactions | ||||
| Overnight and Continuous | <30 days | 30 to 90 days | >90 days | Total | |
| Common Stocks | $219,097 | $ — | $ — | $ — | $219,097 |
| Name | Value, beginning of period | Purchases | Sales proceeds | Net realized gain (loss) | Change in unrealized appreciation (depreciation) | Value, end of period | Interest/ Dividend income | Principal amount/ Units/Shares, end of period |
| High Social Impact Investments | ||||||||
| Calvert Impact Capital, Inc., Community Investment Notes, 1.50%, 12/15/23(1) | $ 196,566 | $ — | $ — | $ — | $ (10,814) | $ 185,752 | $ 3,000 | $200,000 |
| Short-Term Investments | ||||||||
| Cash Reserves Fund | 970,203 | 15,624,079 | (16,594,156) | (47) | (79) | — | 208 | — |
| Liquidity Fund | — | 12,338,377 | (11,873,237) | — | — | 465,140 | 2,558 | 465,140 |
| Total | $ (47) | $(10,893) | $650,892 | $ 5,766 | ||||
| (1) | Restricted security. |
| Name | Value, beginning of period | Purchases | Sales proceeds | Net realized gain (loss) | Change in unrealized appreciation (depreciation) | Value, end of period | Interest/ Dividend income | Principal amount/ Units/Shares, end of period |
| High Social Impact Investments | ||||||||
| Calvert Impact Capital, Inc., Community Investment Notes, 1.50%, 12/15/23(1) | $ 619,183 | $ — | $ — | $ — | $ (34,064) | $ 585,119 | $ 9,450 | $630,000 |
| Short-Term Investments | ||||||||
| Cash Reserves Fund | 2,930,857 | 35,179,881 | (38,111,099) | 547 | (186) | — | 706 | — |
| Liquidity Fund | — | 19,504,818 | (19,497,190) | — | — | 7,628 | 3,607 | 7,628 |
| Total | $ 547 | $(34,250) | $592,747 | $13,763 | ||||
| (1) | Restricted security. |
| Year Ended September 30, 2022 | Year Ended September 30, 2021 | ||||
| Shares | Amount | Shares | Amount | ||
| Class A | |||||
| Shares sold | 1,176,586 | $ 14,413,761 | 2,383,314 | $ 30,070,042 | |
| Reinvestment of distributions | 19,659 | 256,347 | 44,331 | 530,637 | |
| Shares redeemed | (984,128) | (11,824,796) | (1,288,358) | (16,341,022) | |
| Converted from Class C | 62,117 | 752,965 | 140,620 | 1,634,712 | |
| Net increase | 274,234 | $ 3,598,277 | 1,279,907 | $ 15,894,369 | |
| Class C | |||||
| Shares sold | 165,232 | $ 1,856,279 | 340,490 | $ 4,055,452 | |
| Reinvestment of distributions | — | — | 1,094 | 12,290 | |
| Shares redeemed | (114,176) | (1,277,153) | (147,435) | (1,761,280) | |
| Converted to Class A | (66,678) | (752,965) | (150,565) | (1,634,712) | |
| Net increase (decrease) | (15,622) | $ (173,839) | 43,584 | $ 671,750 | |
| Class I | |||||
| Shares sold | 3,052,624 | $ 38,468,724 | 6,761,201 | $ 87,955,567 | |
| Reinvestment of distributions | 46,889 | 621,286 | 46,193 | 561,712 | |
| Shares redeemed | (5,077,253) | (61,376,680) | (2,727,005) | (35,172,515) | |
| Net increase (decrease) | (1,977,740) | $(22,286,670) | 4,080,389 | $ 53,344,764 | |
| Year Ended September 30, 2022 | Year Ended September 30, 2021 | ||||
| Shares | Amount | Shares | Amount | ||
| Class A | |||||
| Shares sold | 932,979 | $ 25,627,985 | 1,224,165 | $ 33,471,723 | |
| Reinvestment of distributions | 74,620 | 2,242,343 | 58,166 | 1,458,802 | |
| Shares redeemed | (978,609) | (26,463,640) | (1,232,467) | (32,868,802) | |
| Converted from Class C | 290,887 | 7,855,384 | 233,616 | 6,154,516 | |
| Net increase | 319,877 | $ 9,262,072 | 283,480 | $ 8,216,239 | |
| Class C | |||||
| Shares sold | 102,398 | $ 2,603,529 | 231,435 | $ 5,877,257 | |
| Reinvestment of distributions | 3,634 | 100,493 | 497 | 11,475 | |
| Shares redeemed | (217,427) | (5,427,528) | (371,062) | (8,987,031) | |
| Converted to Class A | (317,139) | (7,855,384) | (254,816) | (6,154,516) | |
| Net decrease | (428,534) | $(10,578,890) | (393,946) | $ (9,252,815) | |
| Year Ended September 30, 2022 | Year Ended September 30, 2021 | ||||
| Shares | Amount | Shares | Amount | ||
| Class I | |||||
| Shares sold | 3,334,829 | $ 89,804,141 | 2,444,848 | $ 67,005,702 | |
| Reinvestment of distributions | 105,194 | 3,180,003 | 77,478 | 1,954,775 | |
| Shares redeemed | (1,872,370) | (49,991,557) | (1,662,422) | (45,154,203) | |
| Net increase | 1,567,653 | $ 42,992,587 | 859,904 | $ 23,806,274 | |
Boston, Massachusetts
November 22, 2022
| Global Energy Solutions | $ 334 |
| Global Water | $ 805 |
| Global Energy Solutions | $3,580,912 |
| Global Water | $8,583,485 |
| Global Energy Solutions | 34.88% |
| Global Water | 32.35% |
| Foreign Taxes | Foreign Source Income | ||
| Global Energy Solutions | $ 330,320 | $ 3,692,513 | |
| Global Water | $ — | $ — |
| Global Energy Solutions | $ — |
| Global Water | $ 3,495,485 |
| • | A report from an independent data provider comparing the advisory and related fees paid by each fund with fees paid by comparable funds; |
| • | A report from an independent data provider comparing the investment performance of each fund to the investment performance of comparable funds over various time periods; |
| • | Data regarding investment performance in comparison to benchmark indices; |
| • | For each fund, comparative information concerning the fees charged and the services provided by the Adviser in managing other accounts (including mutual funds, other collective investment funds and institutional accounts) using investment strategies and techniques similar to those used in managing such fund; |
| • | Profitability analyses for the Adviser with respect to each fund; |
| • | Descriptions of the investment management services provided to each fund, including investment strategies and processes it employs; |
| • | Information about the Adviser’s policies and practices with respect to trading, including the Adviser’s processes for monitoring best execution of portfolio transactions; |
| • | Information about the allocation of brokerage transactions and the benefits received by the Adviser as a result of brokerage allocation, including information concerning the acquisition of research through client commission arrangements and policies with respect to “soft dollars”; |
| • | Reports detailing the financial results and condition of CRM; |
| • | Descriptions of the qualifications, education and experience of the individual investment professionals whose responsibilities include portfolio management and investment research for the funds, and information relating to their compensation and responsibilities with respect to managing other mutual funds and investment accounts; |
| • | Policies and procedures relating to proxy voting and the handling of corporate actions and class actions; |
| • | A description of CRM’s procedures for overseeing sub-advisers, including with respect to regulatory and compliance issues, investment management and other matters; |
| • | Information concerning the nature, cost and character of the administrative and other non-investment advisory services provided by CRM and its affiliates; and |
| • | The terms of each investment advisory agreement. |
| • | A report from an independent data provider comparing the advisory and related fees paid by each fund with fees paid by comparable funds; |
| • | A report from an independent data provider comparing each fund’s total expense ratio and its components to comparable funds; |
| • | A report from an independent data provider comparing the investment performance of each fund to the investment performance of comparable funds over various time periods; |
| • | Data regarding investment performance in comparison to benchmark indices; |
| • | For each fund, comparative information concerning the fees charged and the services provided by the Adviser in managing other accounts (including mutual funds, other collective investment funds and institutional accounts) using investment strategies and techniques similar to those used in managing such fund; |
| • | Profitability analyses for the Adviser with respect to each fund; |
| • | Descriptions of the investment management services provided to each fund, including investment strategies and processes it employs; |
| • | Information about the Adviser’s policies and practices with respect to trading, including the Adviser’s processes for monitoring best execution of portfolio transactions; |
| • | Information about the allocation of brokerage transactions and the benefits received by the Adviser as a result of brokerage allocation, including information concerning the acquisition of research through client commission arrangements and policies with respect to “soft dollars”; |
| • | Reports detailing the financial results and condition of CRM; |
| • | Descriptions of the qualifications, education and experience of the individual investment professionals whose responsibilities include portfolio management and investment research for the funds, and information relating to their compensation and responsibilities with respect to managing other mutual funds and investment accounts; |
| • | Policies and procedures relating to proxy voting and the handling of corporate actions and class actions; |
| • | A description of CRM’s procedures for overseeing sub-advisers, including with respect to regulatory and compliance issues, investment management and other matters; |
| • | Information concerning the nature, cost and character of the administrative and other non-investment advisory services provided by CRM and its affiliates; and |
| • | The terms of each investment advisory agreement. |
| Name and Year of Birth | Corporation Position(s) | Length of Service | Principal Occupation(s) and Other Directorships During Past Five Years and Other Relevant Experience |
| Interested Director | |||
| John H. Streur(1) 1960 | Director and President | Since 2015 | President and Chief Executive Officer of CRM (since December 31, 2016). President and Chief Executive Officer of Calvert Investments, Inc. (January 2015 - December 2016); Chief Executive Officer of Calvert Investment Distributors, Inc. (August 2015 - December 2016); Chief Compliance Officer of Calvert Investment Management, Inc. (August 2015 - April 2016); President and Director, Portfolio 21 Investments, Inc. (through October 2014); President, Chief Executive Officer and Director, Managers Investment Group LLC (through January 2012); President and Director, The Managers Funds and Managers AMG Funds (through January 2012). Other Directorships. Portfolio 21 Investments, Inc. (asset management) (through October 2014); Managers Investment Group LLC (asset management) (through January 2012); The Managers Funds (asset management) (through January 2012); Managers AMG Funds (asset management) (through January 2012); Calvert Impact Capital, Inc. |
| Noninterested Directors | |||
| Richard L. Baird, Jr. 1948 | Director | Since 2005 | Regional Disaster Recovery Lead, American Red Cross of Greater Pennsylvania (since 2017). Volunteer, American Red Cross (since 2015). Former President and CEO of Adagio Health Inc. (retired in 2014) in Pittsburgh, PA. Other Directorships. None. |
| Alice Gresham Bullock 1950 | Chair and Director | Since 2016 | Professor Emerita at Howard University School of Law. Dean Emerita of Howard University School of Law and Deputy Director of the Association of American Law Schools (1992-1994). Other Directorships. None. |
| Cari M. Dominguez 1949 | Director | Since 2016 | Former Chair of the U.S. Equal Employment Opportunity Commission. Other Directorships. ManpowerGroup Inc. (workforce solutions company); Triple S Management Corporation (managed care); National Association of Corporate Directors. |
| John G. Guffey, Jr. 1948 | Director | Since 2005 | President of Aurora Press Inc., a privately held publisher of trade paperbacks (since January 1997). Other Directorships. Calvert Impact Capital, Inc. (through December 31, 2018); Calvert Ventures, LLC. |
| Miles D. Harper, III 1962 | Director | Since 2000 | Partner, Carr Riggs & Ingram (public accounting firm) since October 2014. Partner, Gainer Donnelly & Desroches (public accounting firm) (now Carr Riggs & Ingram) (November 1999 - September 2014). Other Directorships. Bridgeway Funds (9) (asset management). |
| Joy V. Jones 1950 | Director | Since 2000 | Attorney. Other Directorships. Palm Management Corporation. |
| Name and Year of Birth | Corporation Position(s) | Length of Service | Principal Occupation(s) and Other Directorships During Past Five Years and Other Relevant Experience |
| Noninterested Directors (continued) | |||
| Anthony A. Williams 1951 | Director | Since 2016 | CEO and Executive Director of the Federal City Council (July 2012 to present); Senior Adviser and Independent Consultant for King and Spalding LLP (September 2015 to present); Executive Director of Global Government Practice at the Corporate Executive Board (January 2010 to January 2012). Other Directorships. Freddie Mac; Evoq Properties/Meruelo Maddux Properties, Inc. (real estate management); Weston Solutions, Inc. (environmental services); Bipartisan Policy Center’s Debt Reduction Task Force; Chesapeake Bay Foundation; Catholic University of America; Urban Institute (research organization); The Howard Hughes Corporation (real estate development); Old Dominion National Bank. |
| Name and Year of Birth | Corporation Position(s) | Length of Service | Principal Occupation(s) During Past Five Years |
| Principal Officers who are not Directors | |||
| Hope L. Brown 1973 | Chief Compliance Officer | Since 2014 | Chief Compliance Officer of 42 registered investment companies advised by CRM (since 2014). Vice President and Chief Compliance Officer, Wilmington Funds (2012-2014). |
| Deidre E. Walsh 1971 | Secretary, Vice President and Chief Legal Officer | Since 2021 | Vice President of CRM and officer of 42 registered investment companies advised by CRM (since 2021). Also Vice President of Eaton Vance and certain of its affiliates and officer of 136 registered investment companies advised or administered by Eaton Vance. |
| James F. Kirchner 1967 | Treasurer | Since 2016 | Vice President of CRM and officer of 42 registered investment companies advised by CRM (since 2016). Also Vice President of Eaton Vance and certain of its affiliates and officer of 136 registered investment companies advised or administered by Eaton Vance. |
| (1) Mr. Streur is an interested person of the Funds because of his positions with the Funds' adviser and certain affiliates. | |||
| Privacy Notice | April 2021 |
| FACTS | WHAT DOES EATON VANCE DO WITH YOUR PERSONAL INFORMATION? |
| Why? | Financial companies choose how they share your personal information. Federal law gives consumers the right to limit some but not all sharing. Federal law also requires us to tell you how we collect, share, and protect your personal information. Please read this notice carefully to understand what we do. |
| What? | The types of personal information we collect and share depend on the product or service you have with us. This information can include:■ Social Security number and income ■ investment experience and risk tolerance ■ checking account number and wire transfer instructions |
| How? | All financial companies need to share customers’ personal information to run their everyday business. In the section below, we list the reasons financial companies can share their customers’ personal information; the reasons Eaton Vance chooses to share; and whether you can limit this sharing. |
| Reasons we can share your personal information | Does Eaton Vance share? | Can you limit this sharing? |
| For our everyday business purposes — such as to process your transactions, maintain your account(s), respond to court orders and legal investigations, or report to credit bureaus | Yes | No |
| For our marketing purposes — to offer our products and services to you | Yes | No |
| For joint marketing with other financial companies | No | We don’t share |
| For our investment management affiliates’ everyday business purposes — information about your transactions, experiences, and creditworthiness | Yes | Yes |
| For our affiliates’ everyday business purposes — information about your transactions and experiences | Yes | No |
| For our affiliates’ everyday business purposes — information about your creditworthiness | No | We don’t share |
| For our investment management affiliates to market to you | Yes | Yes |
| For our affiliates to market to you | No | We don’t share |
| For nonaffiliates to market to you | No | We don’t share |
| To limit our sharing | Call toll-free 1-800-368-2745 or email: CRMPrivacy@calvert.comPlease note:If you are a new customer, we can begin sharing your information 30 days from the date we sent this notice. When you are no longer our customer, we continue to share your information as described in this notice. However, you can contact us at any time to limit our sharing. |
| Questions? | Call toll-free 1-800-368-2745 or email: CRMPrivacy@calvert.com |
| Privacy Notice — continued | April 2021 |
| Who we are | |
| Who is providing this notice? | Eaton Vance Management, Eaton Vance Distributors, Inc., Eaton Vance Trust Company, Eaton Vance Management (International) Limited, Eaton Vance Advisers International Ltd., Eaton Vance Global Advisors Limited, Eaton Vance Management’s Real Estate Investment Group, Boston Management and Research, Calvert Research and Management, Eaton Vance and Calvert Fund Families and our investment advisory affiliates (“Eaton Vance”) (see Investment Management Affiliates definition below) |
| What we do | |
| How does Eaton Vance protect my personal information? | To protect your personal information from unauthorized access and use, we use security measures that comply with federal law. These measures include computer safeguards and secured files and buildings. We have policies governing the proper handling of customer information by personnel and requiring third parties that provide support to adhere to appropriate security standards with respect to such information. |
| How does Eaton Vance collect my personal information? | We collect your personal information, for example, when you■ open an account or make deposits or withdrawals from your account ■ buy securities from us or make a wire transfer ■ give us your contact informationWe also collect your personal information from others, such as credit bureaus, affiliates, or other companies. |
| Why can’t I limit all sharing? | Federal law gives you the right to limit only■ sharing for affiliates’ everyday business purposes — information about your creditworthiness ■ affiliates from using your information to market to you ■ sharing for nonaffiliates to market to youState laws and individual companies may give you additional rights to limit sharing. See below for more on your rights under state law. |
| Definitions | |
| Investment Management Affiliates | Eaton Vance Investment Management Affiliates include registered investment advisers, registered broker- dealers, and registered and unregistered funds. Investment Management Affiliates does not include entities associated with Morgan Stanley Wealth Management, such as Morgan Stanley Smith Barney LLC and Morgan Stanley & Co. |
| Affiliates | Companies related by common ownership or control. They can be financial and nonfinancial companies.■ Our affiliates include companies with a Morgan Stanley name and financial companies such as Morgan Stanley Smith Barney LLC and Morgan Stanley & Co. |
| Nonaffiliates | Companies not related by common ownership or control. They can be financial and nonfinancial companies.■ Eaton Vance does not share with nonaffiliates so they can market to you. |
| Joint marketing | A formal agreement between nonaffiliated financial companies that together market financial products or services to you.■ Eaton Vance doesn’t jointly market. |
| Other important information | |
| Vermont: Except as permitted by law, we will not share personal information we collect about Vermont residents with Nonaffiliates unless you provide us with your written consent to share such information.California: Except as permitted by law, we will not share personal information we collect about California residents with Nonaffiliates and we will limit sharing such personal information with our Affiliates to comply with California privacy laws that apply to us. | |


| % Average Annual Total Returns1,2 | Class Inception Date | Performance Inception Date | One Year | Five Years | Since Inception |
| Class A at NAV | 10/31/2013 | 10/31/2013 | (14.67)% | (0.46)% | 0.87% |
| Class A with 3.25% Maximum Sales Charge | — | — | (17.44) | (1.10) | 0.50 |
| Class I at NAV | 10/31/2013 | 10/31/2013 | (14.44) | (0.18) | 1.19 |
| Class R6 at NAV | 02/01/2019 | 10/31/2013 | (14.39) | (0.12) | 1.23 |
| ICE BofA Green Bond Index - Hedged USD | — | — | (17.78)% | (0.52)% | 1.17% |
| % Total Annual Operating Expense Ratios3 | Class A | Class I | Class R6 |
| Gross | 0.76% | 0.51% | 0.46% |
| Net | 0.73 | 0.48 | 0.43 |

| Growth of Investment2 | Amount Invested | Period Beginning | At NAV | With Maximum Sales Charge |
| Class I, at minimum investment | $1,000,000 | 10/31/2013 | $1,111,780 | N.A. |
| Class R6, at minimum investment | $5,000,000 | 10/31/2013 | $5,573,709 | N.A. |
| Asset Allocation (% of total investments) |

| Country Allocation (% of total investments) | |
| United States | 70.6% |
| France | 4.1 |
| Netherlands | 4.0 |
| Canada | 4.0 |
| Luxembourg | 3.7 |
| Italy | 3.2 |
| Germany | 2.1 |
| Sweden | 1.2 |
| Other (less than 1.0% each) | 7.1 |
| Total | 100.0% |
| Credit Quality (% of bond holdings)1 |
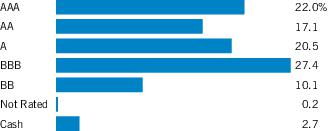
| 1 | For purposes of the Fund's rating restrictions, ratings are based on Moody's Investors Service, Inc. (“Moody's”), S&P Global Ratings (“S&P”) or Fitch Ratings (“Fitch”), or Kroll Bond Rating Agency, LLC (“Kroll”) for securitized debt instruments only (such as asset-backed securities (“ABS”) and mortgage-backed securities (“MBS”)), as applicable. If securities are rated differently by the ratings agencies, the highest rating is applied. Ratings, which are subject to change, apply to the creditworthiness of the issuers of the underlying securities and not to the Fund or its shares. Credit ratings measure the quality of an issuance based on the issuer's creditworthiness, with ratings ranging from AAA, being the highest, to D, being the lowest based on S&P's measures. Ratings of BBB or higher by S&P, Fitch or Kroll (Baa or higher by Moody's) are considered to be investment-grade quality. Credit ratings are based largely on the ratings agency's analysis at the time of rating. The rating assigned to any particular security is not necessarily a reflection of the issuer's current financial condition and does not necessarily reflect its assessment of the volatility of a security's market value or of the liquidity of an investment in the security. Holdings designated as “Not Rated” (if any) are not rated by the national ratings agencies stated above. |
| † | The views expressed in this report are those of the portfolio manager(s) and are current only through the date stated at the top of this page. These views are subject to change at any time based upon market or other conditions, and Calvert and the Fund(s) disclaim any responsibility to update such views. These views may not be relied upon as investment advice and, because investment decisions are based on many factors, may not be relied upon as an indication of trading intent on behalf of any Calvert fund. This commentary may contain statements that are not historical facts, referred to as “forward-looking statements.” The Fund’s actual future results may differ significantly from those stated in any forward-looking statement, depending on factors such as changes in securities or financial markets or general economic conditions, the volume of sales and purchases of Fund shares, the continuation of investment advisory, administrative and service contracts, and other risks discussed from time to time in the Fund’s filings with the Securities and Exchange Commission. |
| 1 | ICE BofA Green Bond Index - Hedged USD tracks the performance of securities issued for qualified “green” purposes. Qualifying bonds must have a clearly designated use of proceeds that is solely applied toward projects or activities that promote climate change mitigation or adaptation or other environmental sustainability purposes. ICE® BofA® indices are not for redistribution or other uses; provided “as is”, without warranties, and with no liability. Eaton Vance has prepared this report and ICE Data Indices, LLC does not endorse it, or guarantee, review, or endorse Eaton Vance’s products. BofA® is a licensed registered trademark of Bank of America Corporation in the United States and other countries. Unless otherwise stated, index returns do not reflect the effect of any applicable sales charges, commissions, expenses, taxes or leverage, as applicable. It is not possible to invest directly in an index. |
| 2 | Total Returns at NAV do not include applicable sales charges. If sales charges were deducted, the returns would be lower. Total Returns shown with maximum sales charge reflect the stated maximum sales charge. Unless otherwise stated, performance does not reflect the deduction of taxes on Fund distributions or redemptions of Fund shares.Performance prior to the inception date of a class may be linked to the performance of an older class of the Fund. This linked performance is adjusted for any applicable sales charge, but is not adjusted for class expense differences. If adjusted for such differences, the performance would be different. The performance of Class R6 is linked to Class I. Performance since inception for an index, if presented, is the performance since the Fund’s or oldest share class’s inception, as applicable. Performance presented in the Financial Highlights included in the financial statements is not linked. |
| Calvert Research and Management became the investment adviser to the Fund on December 31, 2016. Performance reflected prior to such date is that of the Fund’s former investment adviser. | |
| 3 | Source: Fund prospectus. Net expense ratios reflect a contractual expense reimbursement that continues through 1/31/23. The expense ratios for the current reporting period can be found in the Financial Highlights section of this report. Performance reflects expenses waived and/or reimbursed, if applicable. Without such waivers and/or reimbursements, performance would have been lower. |
| Fund profile subject to change due to active management. | |
| Additional Information | |
| Bloomberg U.S. Treasury Index measures the performance of U.S. Treasuries with a maturity of one year or more. Bloomberg U.S. Corporate Bond Index measures the performance of investment-grade U.S. corporate securities with a maturity of one year or more. Bloomberg U.S. Corporate High Yield Index measures USD-denominated, non-investment grade corporate securities. Bloomberg U.S. Mortgage-Backed Securities Index measures agency mortgage-backed pass-through securities issued by Ginnie Mae (GNMA), Fannie Mae (FNMA), and Freddie Mac (FHLMC). Bloomberg Asset-Backed Securities Index tracks the performance of U.S. dollar denominated investment grade, fixed rate asset-backed securities publicly issued in the U.S. domestic market. | |
| Spread is the difference in yield between a U.S. Treasury bond and another debt security of the same maturity but different credit quality. | |
| Duration is a measure of the expected change in price of a bond — in percentage terms — given a one percent change in interest rates, all else being constant. Securities with lower durations tend to be less sensitive to interest rate changes. |
| Beginning Account Value (4/1/22) | Ending Account Value (9/30/22) | Expenses Paid During Period* (4/1/22 – 9/30/22) | Annualized Expense Ratio | |
| Actual | ||||
| Class A | $1,000.00 | $ 910.60 | $3.50 ** | 0.73% |
| Class I | $1,000.00 | $ 911.80 | $2.30 ** | 0.48% |
| Class R6 | $1,000.00 | $ 912.70 | $2.06 ** | 0.43% |
| Hypothetical | ||||
| (5% return per year before expenses) | ||||
| Class A | $1,000.00 | $1,021.41 | $3.70 ** | 0.73% |
| Class I | $1,000.00 | $1,022.66 | $2.43 ** | 0.48% |
| Class R6 | $1,000.00 | $1,022.91 | $2.18 ** | 0.43% |
| * | Expenses are equal to the Fund’s annualized expense ratio for the indicated Class, multiplied by the average account value over the period, multiplied by 183/365 (to reflect the one-half year period). The Example assumes that the $1,000 was invested at the net asset value per share determined at the close of business on March 31, 2022. |
| ** | Absent a waiver and/or reimbursement of expenses by an affiliate, expenses would be higher. |
| Asset-Backed Securities — 12.8% |
| Security | Principal Amount (000's omitted) | Value | |
| GoodLeap Sustainable Home Solutions Trust: | |||
| Series 2021-4GS, Class A, 1.93%, 7/20/48(1) | $ | 1,720 | $ 1,385,242 |
| Series 2021-5CS, Class A, 2.31%, 10/20/48(1) | 1,483 | 1,236,161 | |
| Series 2022-2CS, Class A, 4.00%, 4/20/49(1) | 3,381 | 3,093,002 | |
| Loanpal Solar Loan, Ltd., Series 2020-1GS, Class C, 2.00%, 6/20/47(1) | 4,463 | 3,449,562 | |
| Luminace Issuer, LLC, Series 2022-1, Class A, 4.88%, 7/31/62(1) | 2,964 | 2,755,837 | |
| Mill City Solar Loan, Ltd., Series 2020-1A, Class C, 2.00%, 6/20/47(1) | 526 | 428,782 | |
| Mosaic Solar Loan Trust: | |||
| Series 2018-1A, Class A, 4.01%, 6/22/43(1) | 557 | 518,805 | |
| Series 2018-1A, Class B, 2.00%, 6/22/43(1) | 1,803 | 1,582,971 | |
| Series 2019-1A, Class A, 4.37%, 12/21/43(1) | 817 | 768,319 | |
| Series 2019-2A, Class A, 2.88%, 9/20/40(1) | 2,764 | 2,402,239 | |
| Series 2019-2A, Class B, 3.28%, 9/20/40(1) | 2,687 | 2,412,936 | |
| Series 2019-2A, Class C, 4.35%, 9/20/40(1) | 81 | 80,668 | |
| Series 2020-1A, Class A, 2.10%, 4/20/46(1) | 1,217 | 1,051,199 | |
| Series 2020-1A, Class B, 3.10%, 4/20/46(1) | 1,399 | 1,232,021 | |
| Series 2020-2A, Class B, 2.21%, 8/20/46(1) | 1,708 | 1,454,868 | |
| Series 2021-1A, Class A, 1.51%, 12/20/46(1) | 2,028 | 1,585,446 | |
| Series 2021-1A, Class B, 2.05%, 12/20/46(1) | 973 | 768,005 | |
| Series 2021-1A, Class C, 2.25%, 12/20/46(1) | 813 | 722,557 | |
| Series 2021-2A, Class A, 1.64%, 4/22/47(1) | 2,219 | 1,823,716 | |
| Series 2022-2A, Class B, 5.13%, 1/21/53(1) | 2,176 | 2,059,405 | |
| Mosaic Solar Loans, LLC: | |||
| Series 2017-1A, Class A, 4.45%, 6/20/42(1) | 399 | 381,536 | |
| Series 2017-2A, Class A, 3.82%, 6/22/43(1) | 46 | 42,353 | |
| Series 2017-2A, Class C, 2.00%, 6/22/43(1) | 425 | 410,153 | |
| SolarCity LMC Series I, LLC, Series 2013-1, Class A, 4.80%, 11/20/38(1) | 114 | 110,093 | |
| Sunnova Helios II Issuer, LLC: | |||
| Series 2019-AA, Class C, 5.32%, 6/20/46(1) | 1,163 | 997,665 | |
| Series 2021-B, Class B, 2.01%, 7/20/48(1) | 3,400 | 2,728,994 | |
| Sunnova Helios IV Issuer, LLC, Series 2020-AA, Class A, 2.98%, 6/20/47(1) | 6,427 | 5,596,970 | |
| Sunnova Helios V Issuer, LLC: | |||
| Series 2021-A, Class A, 1.80%, 2/20/48(1) | 2,627 | 2,118,067 | |
| Series 2021-A, Class B, 3.15%, 2/20/48(1) | 4,774 | 3,780,502 | |
| Sunnova Sol II Issuer, LLC: | |||
| Series 2020-2A, Class A, 2.73%, 11/1/55(1) | 1,915 | 1,512,892 | |
| Series 2020-2A, Class B, 5.47%, 11/1/55(1) | 7,101 | 5,637,178 | |
| Sunnova Sol Issuer, LLC: | |||
| Series 2020-1A, Class A, 3.35%, 2/1/55(1) | 2,783 | 2,338,294 | |
| Series 2020-1A, Class B, 5.54%, 2/1/55(1) | 1,692 | 1,458,945 | |
| Security | Principal Amount (000's omitted) | Value | |
| Sunrun Atlas Issuer, LLC, Series 2019-2, Class A, 3.61%, 2/1/55(1) | $ | 2,338 | $ 2,075,031 |
| Sunrun Callisto Issuer, LLC, Series 2015-1A, Class B, 5.38%, 7/20/45(1) | 708 | 658,618 | |
| Sunrun Demeter Issuer, LLC, Series 2021-2A, Class A, 2.27%, 1/30/57(1) | 8,006 | 6,187,634 | |
| Sunrun Jupiter Issuer, LLC, Series 2022-1A, Class A, 4.75%, 7/30/57(1) | 4,343 | 3,951,141 | |
| Sunrun Vulcan Issuer, LLC, Series 2021-1A, Class A, 2.46%, 1/30/52(1) | 5,149 | 4,276,328 | |
| Sunrun Xanadu Issuer, LLC, Series 2019-1A, Class A, 3.98%, 6/30/54(1) | 2,068 | 1,883,796 | |
| Tesla Auto Lease Trust: | |||
| Series 2019-A, Class B, 2.41%, 12/20/22(1) | 630 | 629,266 | |
| Series 2019-A, Class E, 5.48%, 5/22/23(1) | 1,545 | 1,547,631 | |
| Series 2020-A, Class A3, 0.68%, 12/20/23(1) | 2,329 | 2,309,030 | |
| Series 2020-A, Class C, 1.68%, 2/20/24(1) | 2,000 | 1,968,333 | |
| Series 2020-A, Class D, 2.33%, 2/20/24(1) | 2,295 | 2,251,359 | |
| Series 2020-A, Class E, 4.64%, 8/20/24(1) | 3,123 | 3,086,689 | |
| Series 2021-A, Class B, 1.02%, 3/20/25(1) | 1,700 | 1,617,979 | |
| Series 2021-A, Class D, 1.34%, 3/20/25(1) | 3,500 | 3,243,498 | |
| Vivint Solar Financing V, LLC, Series 2018-1A, Class A, 4.73%, 4/30/48(1) | 1,395 | 1,236,880 | |
| Vivint Solar Financing VII, LLC, Series 2020-1A, Class A, 2.21%, 7/31/51(1) | 4,948 | 4,026,038 | |
| Total Asset-Backed Securities (identified cost $114,328,385) | $ 98,874,634 | ||
| Commercial Mortgage-Backed Securities — 6.5% |
| Security | Principal Amount (000's omitted) | Value | |
| Federal Home Loan Mortgage Corp. Multifamily Structured Pass Through Certificates: | |||
| Series KG02, Class A2, 2.412%, 8/25/29 | $ | 4,050 | $ 3,548,435 |
| Series KG03, Class A2, 1.297%, 6/25/30(2) | 1,360 | 1,077,027 | |
| Series KG04, Class A1, 0.845%, 6/25/30 | 3,742 | 3,143,535 | |
| Federal National Mortgage Association: | |||
| Series 2017-M13, Class A2, 3.028%, 9/25/27(2) | 4,962 | 4,642,462 | |
| Series 2018-M4, Class A2, 3.158%, 3/25/28(2) | 5,623 | 5,220,516 | |
| Series 2018-M13, Class A2, 3.867%, 9/25/30(2) | 3,173 | 3,023,874 | |
| Series 2019-M1, Class A2, 3.666%, 9/25/28(2) | 3,644 | 3,462,121 | |
| Series 2019-M22, Class A2, 2.522%, 8/25/29 | 6,924 | 6,148,540 | |
| Series 2020-M1, Class A2, 2.444%, 10/25/29 | 7,842 | 6,872,942 | |
| Series 2020-M20, Class A2, 1.435%, 10/25/29 | 4,250 | 3,502,645 | |
| Security | Principal Amount (000's omitted) | Value | |
| SLG Office Trust, Series 2021-OVA, Class A, 2.585%, 7/15/41(1) | $ | 12,179 | $ 9,788,919 |
| Total Commercial Mortgage-Backed Securities (identified cost $58,006,596) | $ 50,431,016 | ||
| Corporate Bonds — 60.6% |
| Security | Principal Amount (000's omitted)* | Value | |
| Communications — 1.6% | |||
| Verizon Communications, Inc.: | |||
| 1.50%, 9/18/30 | 10,734 | $ 8,085,318 | |
| 2.85%, 9/3/41 | 3,000 | 2,008,675 | |
| 3.875%, 3/1/52 | 3,000 | 2,240,010 | |
| $ 12,334,003 | |||
| Consumer, Cyclical — 2.8% | |||
| Aptiv PLC, 3.10%, 12/1/51 | 3,255 | $ 1,829,224 | |
| Ford Motor Co., 3.25%, 2/12/32 | 7,121 | 5,141,754 | |
| General Motors Co., 5.60%, 10/15/32 | 13,327 | 11,913,338 | |
| Walmart, Inc., 1.80%, 9/22/31 | 2,982 | 2,374,262 | |
| $ 21,258,578 | |||
| Consumer, Non-cyclical — 1.4% | |||
| Coca-Cola Femsa SAB de CV, 1.85%, 9/1/32 | 3,470 | $ 2,562,248 | |
| Conservation Fund (The), Green Bonds, 3.474%, 12/15/29 | 2,345 | 2,007,397 | |
| Kaiser Foundation Hospitals, 3.15%, 5/1/27 | 1,208 | 1,120,865 | |
| PepsiCo, Inc.: | |||
| 2.875%, 10/15/49(3) | 3,815 | 2,685,797 | |
| 3.90%, 7/18/32 | 2,175 | 2,013,641 | |
| $ 10,389,948 | |||
| Energy — 2.1% | |||
| TerraForm Power Operating, LLC: | |||
| 4.75%, 1/15/30(1) | 18,294 | $ 15,567,188 | |
| 5.00%, 1/31/28(1) | 867 | 765,028 | |
| $ 16,332,216 | |||
| Financial — 23.8% | |||
| Alexandria Real Estate Equities, Inc., 2.00%, 5/18/32 | 6,900 | $ 5,082,180 | |
| Bank Hapoalim BM, 3.255% to 1/21/27, 1/21/32(1)(4)(5) | 7,600 | 6,352,604 | |
| Bank of America Corp., 2.456% to 10/22/24, 10/22/25(4) | 27,225 | 25,502,087 | |
| Bank of Nova Scotia (The), 2.375%, 1/18/23 | 1,408 | 1,399,302 | |
| BNP Paribas S.A.: | |||
| 0.375% to 10/14/26, 10/14/27(3)(4)(5) | EUR | 7,500 | 6,287,181 |
| 1.675% to 6/30/26, 6/30/27(1)(4) | 3,000 | 2,541,149 | |
| Security | Principal Amount (000's omitted)* | Value | |
| Financial (continued) | |||
| Boston Properties, L.P.: | |||
| 2.45%, 10/1/33 | 11,083 | $ 7,820,923 | |
| 3.40%, 6/21/29 | 4,950 | 4,200,807 | |
| Canadian Imperial Bank of Commerce, 0.95%, 10/23/25 | 4,770 | 4,208,186 | |
| Citigroup, Inc., 1.678% to 5/15/23, 5/15/24(4) | 8,575 | 8,393,464 | |
| Cooperatieve Rabobank UA, 1.106% to 2/24/26, 2/24/27(1)(3)(4) | 7,021 | 6,017,935 | |
| Digital Dutch Finco BV, 1.50%, 3/15/30(5) | EUR | 6,300 | 4,738,830 |
| Digital Euro Finco, LLC, 2.50%, 1/16/26(5) | EUR | 8,700 | 7,908,944 |
| Equinix, Inc.: | |||
| 2.50%, 5/15/31 | 8,700 | 6,712,582 | |
| 3.90%, 4/15/32 | 3,700 | 3,149,107 | |
| HAT Holdings I, LLC/HAT Holdings II, LLC: | |||
| 3.375%, 6/15/26(1) | 12,396 | 9,963,099 | |
| 3.75%, 9/15/30(1) | 6,592 | 4,807,381 | |
| 6.00%, 4/15/25(1) | 76 | 71,660 | |
| ING Groep NV: | |||
| 1.40% to 7/1/25, 7/1/26(1)(4) | 6,632 | 5,861,965 | |
| 4.625%, 1/6/26(1) | 3,025 | 2,912,250 | |
| JPMorgan Chase & Co., 0.653% to 9/16/23, 9/16/24(4) | 6,862 | 6,547,053 | |
| Kimco Realty Corp., 2.70%, 10/1/30 | 3,000 | 2,421,032 | |
| Metropolitan Life Global Funding I, 0.95%, 7/2/25(1)(3) | 5,720 | 5,132,189 | |
| Mitsubishi UFJ Financial Group, Inc., 2.527%, 9/13/23(6) | 1,100 | 1,073,319 | |
| National Australia Bank, Ltd., 3.625%, 6/20/23 | 3,243 | 3,234,536 | |
| PNC Financial Services Group, Inc. (The), 2.20%, 11/1/24 | 8,027 | 7,633,229 | |
| Prologis Euro Finance, LLC, 0.375%, 2/6/28 | EUR | 6,700 | 5,437,254 |
| Prologis, L.P., 1.25%, 10/15/30 | 3,727 | 2,781,943 | |
| Prudential Financial, Inc., 1.50%, 3/10/26 | 3,431 | 3,072,139 | |
| Regency Centers, L.P., 3.75%, 6/15/24(3) | 2,500 | 2,425,411 | |
| Royal Bank of Canada, 0.25%, 5/2/24(3)(5) | EUR | 8,600 | 8,060,985 |
| Sumitomo Mitsui Financial Group, Inc., 0.508%, 1/12/24 | 3,000 | 2,828,090 | |
| Vornado Realty L.P., 2.15%, 6/1/26 | 4,900 | 4,106,160 | |
| Welltower, Inc., 2.70%, 2/15/27 | 5,380 | 4,811,834 | |
| $183,496,810 | |||
| Government - Multinational — 6.0% | |||
| Asian Development Bank: | |||
| 2.125%, 3/19/25 | 750 | $ 710,203 | |
| 2.375%, 8/10/27 | 750 | 690,634 | |
| 3.125%, 9/26/28 | 800 | 752,237 | |
| European Bank for Reconstruction & Development: | |||
| 1.50%, 2/13/25 | 3,045 | 2,851,075 | |
| 1.625%, 9/27/24 | 2,635 | 2,499,797 | |
| European Investment Bank: | |||
| 1.00%, 11/14/42(5) | EUR | 3,400 | 2,350,483 |
| Security | Principal Amount (000's omitted)* | Value | |
| Government - Multinational (continued) | |||
| European Investment Bank: (continued) | |||
| 1.625%, 5/13/31 | 3,960 | $ 3,313,726 | |
| 2.375%, 5/24/27 | 8,671 | 8,025,016 | |
| 2.50%, 10/15/24(3) | 6,200 | 5,984,803 | |
| 2.875%, 6/13/25(1) | 8,202 | 7,904,823 | |
| 3.30%, 2/3/28 | AUD | 1,300 | 782,486 |
| International Bank for Reconstruction & Development: | |||
| 0.625%, 11/22/27 | EUR | 3,550 | 3,112,285 |
| 2.125%, 3/3/25 | 2,000 | 1,903,834 | |
| 3.125%, 11/20/25 | 4,150 | 4,003,028 | |
| International Finance Corp., 2.125%, 4/7/26 | 1,547 | 1,436,147 | |
| $ 46,320,577 | |||
| Government - Regional — 0.6% | |||
| Kommuninvest I Sverige AB, 0.375%, 6/19/24(1) | 4,785 | $ 4,469,269 | |
| $ 4,469,269 | |||
| Industrial — 3.2% | |||
| Jabil, Inc., 4.25%, 5/15/27 | 5,000 | $ 4,666,083 | |
| Johnson Controls International plc/Tyco Fire & Security Finance SCA, 1.75%, 9/15/30 | 6,950 | 5,381,418 | |
| Owens Corning, 3.95%, 8/15/29 | 11,882 | 10,649,081 | |
| Xylem, Inc.: | |||
| 1.95%, 1/30/28 | 3,400 | 2,875,008 | |
| 2.25%, 1/30/31 | 1,821 | 1,458,498 | |
| $ 25,030,088 | |||
| Technology — 4.3% | |||
| Apple, Inc., 0.50%, 11/15/31 | EUR | 22,438 | $ 17,371,486 |
| Micron Technology, Inc., 2.703%, 4/15/32 | 5,340 | 3,893,176 | |
| NXP BV/NXP Funding, LLC/NXP USA, Inc.: | |||
| 2.50%, 5/11/31 | 5,000 | 3,765,081 | |
| 3.40%, 5/1/30 | 2,861 | 2,388,469 | |
| SK Hynix, Inc., 2.375%, 1/19/31(1) | 8,000 | 5,926,920 | |
| $ 33,345,132 | |||
| Utilities — 14.8% | |||
| AES Corp. (The), 2.45%, 1/15/31 | 18,302 | $ 14,028,665 | |
| Avangrid, Inc.: | |||
| 3.15%, 12/1/24 | 3,029 | 2,898,664 | |
| 3.80%, 6/1/29 | 8,600 | 7,652,510 | |
| Brookfield Renewable Partners ULC, 3.33%, 8/13/50 | CAD | 4,000 | 2,050,603 |
| Clearway Energy Operating, LLC: | |||
| 3.75%, 1/15/32(1) | 5,463 | 4,244,642 | |
| 4.75%, 3/15/28(1) | 4,300 | 3,835,238 | |
| Security | Principal Amount (000's omitted)* | Value | |
| Utilities (continued) | |||
| Consolidated Edison Co. of New York, Inc., 3.60%, 6/15/61 | 3,000 | $ 2,068,233 | |
| Enel Finance International N.V.: | |||
| 1.125%, 9/16/26(5) | EUR | 6,100 | 5,394,667 |
| 1.375%, 7/12/26(1) | 3,197 | 2,704,675 | |
| 4.625%, 6/15/27(1) | 6,500 | 6,060,214 | |
| 5.00%, 6/15/32(1) | 2,692 | 2,299,524 | |
| Liberty Utilities Finance GP 1, 2.05%, 9/15/30(1) | 12,994 | 9,850,243 | |
| MidAmerican Energy Co.: | |||
| 3.15%, 4/15/50 | 1,600 | 1,092,240 | |
| 3.65%, 8/1/48 | 4,490 | 3,408,664 | |
| 4.25%, 7/15/49 | 3,190 | 2,665,967 | |
| NextEra Energy Capital Holdings, Inc., 1.90%, 6/15/28 | 9,715 | 8,053,215 | |
| NextEra Energy Operating Partners, L.P.: | |||
| 4.25%, 9/15/24(1) | 257 | 246,653 | |
| 4.50%, 9/15/27(1) | 8,404 | 7,666,423 | |
| Niagara Mohawk Power Corp., 1.96%, 6/27/30(1) | 4,182 | 3,233,041 | |
| Northern States Power Co., 2.60%, 6/1/51 | 6,100 | 3,810,100 | |
| NSTAR Electric Co., 3.25%, 5/15/29 | 4,000 | 3,597,974 | |
| Pattern Energy Operations, L.P./Pattern Energy Operations, Inc., 4.50%, 8/15/28(1) | 9,916 | 8,617,996 | |
| Public Service Co. of Colorado: | |||
| 3.20%, 3/1/50 | 5,000 | 3,513,763 | |
| 4.10%, 6/15/48 | 1,000 | 817,576 | |
| Terraform Global Operating, LLC, 6.125%, 3/1/26(1) | 1,595 | 1,501,549 | |
| Tucson Electric Power Co., 1.50%, 8/1/30 | 3,300 | 2,492,769 | |
| $113,805,808 | |||
| Total Corporate Bonds (identified cost $571,394,447) | $466,782,429 | ||
| High Social Impact Investments — 0.2% |
| Security | Principal Amount (000's omitted) | Value | |
| Calvert Impact Capital, Inc., Community Investment Notes, 1.50%, 12/15/23(7)(8) | $ | 1,700 | $ 1,578,892 |
| Total High Social Impact Investments (identified cost $1,700,000) | $ 1,578,892 | ||
| Preferred Stocks — 1.4% |
| Security | Shares | Value | |
| Electric Utilities — 0.8% | |||
| Brookfield BRP Holdings Canada, Inc., 4.625% | 353,000 | $ 5,983,350 | |
| $ 5,983,350 | |||
| Security | Shares | Value | |
| Real Estate Management & Development — 0.6% | |||
| Brookfield Property Partners, L.P.: | |||
| Series A, 5.75% | 92,000 | $ 1,564,000 | |
| Series A2, 6.375% | 169,100 | 3,124,968 | |
| $ 4,688,968 | |||
| Total Preferred Stocks (identified cost $15,400,394) | $ 10,672,318 | ||
| Senior Floating-Rate Loans — 0.7%(9) |
| Borrower/Description | Principal Amount (000's omitted) | Value | |
| Machinery — 0.7% | |||
| EWT Holdings III Corp., Term Loan, 5.625%, (1 mo. USD LIBOR + 2.50%), 4/1/28 | $ | 5,742 | $ 5,620,446 |
| Total Senior Floating-Rate Loans (identified cost $5,730,837) | $ 5,620,446 | ||
| Sovereign Government Bonds — 10.0% |
| Security | Principal Amount (000's omitted)* | Value | |
| Canada — 1.1% | |||
| Province of Ontario Canada: | |||
| 1.95%, 1/27/23 | CAD | 3,200 | $ 2,303,694 |
| 2.65%, 2/5/25 | CAD | 5,000 | 3,515,583 |
| South Coast British Columbia Transportation Authority, 2.65%, 10/29/50 | CAD | 5,490 | 2,850,460 |
| $ 8,669,737 | |||
| Chile — 0.1% | |||
| Chile Government International Bond, 2.55%, 1/27/32(3) | 1,500 | $ 1,180,319 | |
| $ 1,180,319 | |||
| Finland — 0.4% | |||
| Kuntarahoitus Oyj, 0.05%, 9/6/29(5) | EUR | 3,750 | $ 3,015,525 |
| $ 3,015,525 | |||
| France — 2.9% | |||
| French Republic Government Bond OAT, 0.50%, 6/25/44(1)(5) | EUR | 36,790 | $ 22,015,892 |
| $ 22,015,892 | |||
| Germany — 2.1% | |||
| Kreditanstalt fuer Wiederaufbau: | |||
| 0.75%, 9/30/30 | 3,034 | $ 2,363,441 | |
| 1.00%, 10/1/26 | 5,023 | 4,417,408 | |
| Security | Principal Amount (000's omitted)* | Value | |
| Germany (continued) | |||
| Kreditanstalt fuer Wiederaufbau: (continued) | |||
| 1.375%, 6/7/32(5) | EUR | 8,700 | $ 7,501,644 |
| 1.75%, 9/14/29 | 2,200 | 1,895,306 | |
| $ 16,177,799 | |||
| Italy — 1.0% | |||
| Buoni del Tesoro Poliennali, 1.50%, 4/30/45(1)(5) | EUR | 13,400 | $ 7,759,522 |
| $ 7,759,522 | |||
| Netherlands — 1.4% | |||
| Nederlandse Waterschapsbank NV: | |||
| 1.00%, 5/28/30(1) | 2,400 | $ 1,908,933 | |
| 2.375%, 3/24/26(1) | 4,866 | 4,554,860 | |
| Netherlands Government Bond, 0.50%, 1/15/40(1)(5) | EUR | 6,400 | 4,452,678 |
| $ 10,916,471 | |||
| Norway — 0.4% | |||
| Kommunalbanken AS, 2.125%, 2/11/25(1) | 3,000 | $ 2,853,315 | |
| $ 2,853,315 | |||
| Sweden — 0.6% | |||
| Sweden Government International Bond, 0.125%, 9/9/30(1) | SEK | 61,500 | $ 4,706,827 |
| $ 4,706,827 | |||
| Total Sovereign Government Bonds (identified cost $105,517,862) | $ 77,295,407 | ||
| Taxable Municipal Obligations — 2.6% |
| Security | Principal Amount (000's omitted) | Value | |
| General Obligations — 0.8% | |||
| Massachusetts, Green Bonds, 3.277%, 6/1/46 | $ | 8,240 | $ 6,309,697 |
| $ 6,309,697 | |||
| Water and Sewer — 1.8% | |||
| District of Columbia Water & Sewer Authority, Green Bonds, 4.814%, 10/1/2114 | $ | 1,665 | $ 1,465,367 |
| Massachusetts Water Pollution Abatement Trust, 5.192%, 8/1/40(10) | 135 | 136,250 | |
| Narragansett Bay Commission, RI, Wastewater System Revenue: | |||
| Green Bonds, 2.094%, 9/1/30 | 620 | 506,360 | |
| Green Bonds, 2.184%, 9/1/31 | 500 | 401,240 | |
| Green Bonds, 2.264%, 9/1/32 | 445 | 350,874 | |
| Security | Principal Amount (000's omitted) | Value | |
| Water and Sewer (continued) | |||
| Narragansett Bay Commission, RI, Wastewater System Revenue: (continued) | |||
| Green Bonds, 2.344%, 9/1/33 | $ | 1,445 | $ 1,123,603 |
| New York City Municipal Water Finance Authority, NY, (Water and Sewer System), 5.882%, 6/15/44(10) | 605 | 663,570 | |
| San Francisco City and County Public Utilities Commission, CA, Water Revenue, Green Bonds, 3.303%, 11/1/39 | 10,705 | 8,752,729 | |
| $ 13,399,993 | |||
| Total Taxable Municipal Obligations (identified cost $24,883,932) | $ 19,709,690 | ||
| U.S. Government Agencies and Instrumentalities — 1.2% |
| Security | Principal Amount (000's omitted) | Value | |
| U.S. International Development Finance Corp.: | |||
| 1.79%, 10/15/29 | $ | 3,720 | $ 3,358,162 |
| 2.36%, 10/15/29 | 2,410 | 2,222,254 | |
| 3.16%, 6/1/33 | 159 | 147,609 | |
| 3.22%, 9/15/29 | 585 | 556,077 | |
| 3.52%, 9/20/32 | 2,714 | 2,582,453 | |
| Total U.S. Government Agencies and Instrumentalities (identified cost $9,588,476) | $ 8,866,555 | ||
| U.S. Government Agency Mortgage-Backed Securities — 0.2% |
| Security | Principal Amount (000's omitted) | Value | |
| Federal National Mortgage Association, Pool #AN1909, 2.68%, 7/1/26 | $ | 1,958 | $ 1,831,729 |
| Total U.S. Government Agency Mortgage-Backed Securities (identified cost $1,979,796) | $ 1,831,729 | ||
| Short-Term Investments — 2.5% | |||
| Affiliated Fund — 2.0% | |||
| Security | Shares | Value | |
| Morgan Stanley Institutional Liquidity Funds - Government Portfolio, Institutional Class, 2.80%(11) | 15,154,018 | $ 15,154,018 | |
| Total Affiliated Fund (identified cost $15,154,018) | $ 15,154,018 | ||
| Securities Lending Collateral — 0.5% | |||
| Security | Shares | Value | |
| State Street Navigator Securities Lending Government Money Market Portfolio, 3.07%(12) | 3,652,992 | $ 3,652,992 | |
| Total Securities Lending Collateral (identified cost $3,652,992) | $ 3,652,992 | ||
| Total Short-Term Investments (identified cost $18,807,010) | $ 18,807,010 | ||
| Total Investments — 98.7% (identified cost $927,337,735) | $760,470,126 | ||
| Other Assets, Less Liabilities — 1.3% | $ 10,354,312 | ||
| Net Assets — 100.0% | $770,824,438 | ||
| The percentage shown for each investment category in the Schedule of Investments is based on net assets. | |
| * | In U.S. dollars unless otherwise indicated. |
| (1) | Security exempt from registration under Rule 144A of the Securities Act of 1933, as amended. These securities may be sold in certain transactions in reliance on an exemption from registration (normally to qualified institutional buyers). At September 30, 2022, the aggregate value of these securities is $285,469,238 or 37.0% of the Fund's net assets. |
| (2) | Weighted average fixed-rate coupon that changes/updates monthly. Rate shown is the rate at September 30, 2022. |
| (3) | All or a portion of this security was on loan at September 30, 2022. The aggregate market value of securities on loan at September 30, 2022 was $3,553,196. |
| (4) | Security converts to variable rate after the indicated fixed-rate coupon period. |
| (5) | Security exempt from registration under Regulation S of the Securities Act of 1933, as amended, which exempts from registration securities offered and sold outside the United States. Security may not be offered or sold in the United States except pursuant to an exemption from, or in a transaction not subject to, the registration requirements of the Securities Act of 1933, as amended. At September 30, 2022, the aggregate value of these securities is $85,838,955 or 11.1% of the Fund's net assets. |
| (6) | Represents an investment in an issuer that may be deemed to be an affiliate (see Note 8). |
| (7) | May be deemed to be an affiliated company (see Note 8). |
| (8) | Restricted security. Total market value of restricted securities amounts to $1,578,892, which represents 0.2% of the net assets of the Fund as of September 30, 2022. |
| (9) | Senior floating-rate loans (Senior Loans) often require prepayments from excess cash flows or permit the borrowers to repay at their election. The degree to which borrowers repay, whether as a contractual requirement or at their election, cannot be predicted with accuracy. As a result, the actual remaining maturity may be substantially less than the stated maturities shown. However, Senior Loans will typically have an expected average life of approximately two to four years. Senior Loans typically have rates of interest which are redetermined periodically by reference to a base lending rate, plus a spread. These base lending rates are primarily the London Interbank Offered Rate (“LIBOR”) or the Secured Overnight Financing Rate (“SOFR”) and secondarily, the prime rate offered by one or more major United States banks (the “Prime Rate”). Base lending rates may be subject to a floor, or minimum rate. Rates for SOFR are generally 1 or 3-month tenors and may also be subject to a credit spread adjustment. Senior Loans are generally subject to contractual restrictions that must be satisfied before they can be bought or sold. |
| (10) | Build America Bond. Represents taxable municipal obligation issued pursuant to the American Recovery and Reinvestment Act of 2009 or other legislation providing for the issuance of taxable municipal debt on which the issuer receives federal support. |
| (11) | May be deemed to be an affiliated investment company. The rate shown is the annualized seven-day yield as of September 30, 2022. |
| (12) | Represents investment of cash collateral received in connection with securities lending. |
| Country Allocation (% of Total Investments) | |
| United States | 70.6% |
| France | 4.1 |
| Netherlands | 4.0 |
| Canada | 4.0 |
| Luxembourg | 3.7 |
| Italy | 3.2 |
| Other (less than 3.0% each) | 10.4 |
| Total | 100.0% |
| Currency Purchased | Currency Sold | Counterparty | Settlement Date | Unrealized Appreciation | Unrealized (Depreciation) | ||
| EUR | 4,064,404 | USD | 4,088,014 | State Street Bank and Trust Company | 11/30/22 | $ — | $ (88,955) |
| EUR | 9,223,951 | USD | 9,277,810 | State Street Bank and Trust Company | 11/30/22 | — | (202,155) |
| USD | 863,099 | AUD | 1,247,865 | State Street Bank and Trust Company | 11/30/22 | 64,272 | — |
| USD | 11,844,741 | CAD | 15,364,000 | State Street Bank and Trust Company | 11/30/22 | 722,103 | — |
| USD | 127,191,113 | EUR | 126,819,114 | State Street Bank and Trust Company | 11/30/22 | 2,410,903 | — |
| USD | 5,129,776 | SEK | 54,036,847 | State Street Bank and Trust Company | 11/30/22 | 246,525 | — |
| $3,443,803 | $(291,110) | ||||||
| Description | Number of Contracts | Position | Expiration Date | Notional Amount | Value/ Unrealized Appreciation (Depreciation) |
| Interest Rate Futures | |||||
| U.S. 2-Year Treasury Note | 303 | Long | 12/30/22 | $ 62,233,360 | $ (1,063,048) |
| U.S. 5-Year Treasury Note | 91 | Long | 12/30/22 | 9,783,211 | (337,039) |
| U.S. 10-Year Treasury Note | 178 | Long | 12/20/22 | 19,947,125 | (1,025,024) |
| U.S. Long Treasury Bond | (78) | Short | 12/20/22 | (9,859,688) | 737,614 |
| U.S. Ultra 10-Year Treasury Note | (602) | Short | 12/20/22 | (71,327,594) | 4,526,456 |
| U.S. Ultra-Long Treasury Bond | (66) | Short | 12/20/22 | (9,042,000) | 845,701 |
| $ 3,684,660 |
| Description | Acquisition Date | Cost |
| Calvert Impact Capital, Inc., Community Investment Notes, 1.50%, 12/15/23 | 12/14/20 | $1,700,000 |
| Abbreviations: | |
| LIBOR | – London Interbank Offered Rate |
| Currency Abbreviations: | |
| AUD | – Australian Dollar |
| CAD | – Canadian Dollar |
| EUR | – Euro |
| SEK | – Swedish Krona |
| USD | – United States Dollar |
| September 30, 2022 | |
| Assets | |
| Investments in securities of unaffiliated issuers, at value (identified cost $909,388,047) - including $3,553,196 of securities on loan | $ 742,663,897 |
| Investments in securities of affiliated issuers, at value (identified cost $17,949,688) | 17,806,229 |
| Receivable for variation margin on open futures contracts | 320,779 |
| Receivable for open forward foreign currency exchange contracts | 3,443,803 |
| Cash | 8,639 |
| Deposits at broker for futures contracts | 2,565,313 |
| Deposits for derivatives collateral - forward foreign currency exchange contracts | 3,470,000 |
| Receivable for investments sold | 1,950,000 |
| Receivable for capital shares sold | 2,598,866 |
| Interest receivable | 5,020,215 |
| Dividends and interest receivable - affiliated | 90,396 |
| Securities lending income receivable | 1,062 |
| Receivable from affiliate | 28,163 |
| Directors' deferred compensation plan | 89,047 |
| Total assets | $ 780,056,409 |
| Liabilities | |
| Cash collateral due to broker | $ 3,470,000 |
| Payable for open forward foreign currency exchange contracts | 291,110 |
| Due to custodian - foreign currency, at value (cost $1,849) | 1,813 |
| Payable for capital shares redeemed | 1,206,039 |
| Distributions payable | 21,827 |
| Deposits for securities loaned | 3,652,992 |
| Payable to affiliates: | |
| Investment advisory fee | 164,809 |
| Administrative fee | 81,473 |
| Distribution and service fees | 14,946 |
| Sub-transfer agency fee | 2,646 |
| Directors' deferred compensation plan | 89,047 |
| Accrued expenses | 235,269 |
| Total liabilities | $ 9,231,971 |
| Net Assets | $ 770,824,438 |
| Sources of Net Assets | |
| Paid-in capital | $ 914,198,373 |
| Accumulated loss | (143,373,935) |
| Net Assets | $ 770,824,438 |
| Class A Shares | |
| Net Assets | $ 71,019,120 |
| Shares Outstanding | 5,255,442 |
| Net Asset Value and Redemption Price Per Share (net assets ÷ shares of beneficial interest outstanding) | $ 13.51 |
| Maximum Offering Price Per Share (100 ÷ 96.75 of net asset value per share) | $ 13.96 |
| September 30, 2022 | |
| Class I Shares | |
| Net Assets | $ 661,645,721 |
| Shares Outstanding | 48,898,527 |
| Net Asset Value, Offering Price and Redemption Price Per Share (net assets ÷ shares of beneficial interest outstanding) | $ 13.53 |
| Class R6 Shares | |
| Net Assets | $ 38,159,597 |
| Shares Outstanding | 2,818,207 |
| Net Asset Value, Offering Price and Redemption Price Per Share (net assets ÷ shares of beneficial interest outstanding) | $ 13.54 |
| Year Ended | |
| September 30, 2022 | |
| Investment Income | |
| Dividend income (net of foreign taxes withheld of $8,877) | $ 801,032 |
| Dividend income - affiliated issuers | 225,804 |
| Interest and other income | 18,871,635 |
| Interest income - affiliated issuers | 57,693 |
| Securities lending income, net | 18,305 |
| Total investment income | $ 19,974,469 |
| Expenses | |
| Investment advisory fee | $ 2,250,193 |
| Administrative fee | 1,080,093 |
| Distribution and service fees: | |
| Class A | 204,202 |
| Directors' fees and expenses | 40,486 |
| Custodian fees | 29,779 |
| Transfer agency fees and expenses | 779,800 |
| Accounting fees | 204,065 |
| Professional fees | 48,154 |
| Registration fees | 111,949 |
| Reports to shareholders | 49,449 |
| Miscellaneous | 65,795 |
| Total expenses | $ 4,863,965 |
| Waiver and/or reimbursement of expenses by affiliate | $ (346,198) |
| Net expenses | $ 4,517,767 |
| Net investment income | $ 15,456,702 |
| Realized and Unrealized Gain (Loss) | |
| Net realized gain (loss): | |
| Investment securities | $ (18,809,367) |
| Investment securities - affiliated issuers | 3,690 |
| Futures contracts | 11,707,024 |
| Foreign currency transactions | (53,063) |
| Forward foreign currency exchange contracts | 30,590,002 |
| Net realized gain | $ 23,438,286 |
| Change in unrealized appreciation (depreciation): | |
| Investment securities | $ (178,811,248) |
| Investment securities - affiliated issuers | (170,686) |
| Futures contracts | 1,822,822 |
| Foreign currency | (25,906) |
| Forward foreign currency exchange contracts | (521,373) |
| Net change in unrealized appreciation (depreciation) | $(177,706,391) |
| Net realized and unrealized loss | $(154,268,105) |
| Net decrease in net assets from operations | $(138,811,403) |
| Year Ended September 30, | ||
| 2022 | 2021 | |
| Increase (Decrease) in Net Assets | ||
| From operations: | ||
| Net investment income | $ 15,456,702 | $ 12,471,816 |
| Net realized gain | 23,438,286 | 6,324,066 |
| Net change in unrealized appreciation (depreciation) | (177,706,391) | (17,472,142) |
| Net increase (decrease) in net assets from operations | $(138,811,403) | $ 1,323,740 |
| Distributions to shareholders: | ||
| Class A | $ (1,625,234) | $ (1,216,394) |
| Class I | (17,878,597) | (12,377,377) |
| Class R6 | (513,870) | (106,700) |
| Total distributions to shareholders | $ (20,017,701) | $ (13,700,471) |
| Capital share transactions: | ||
| Class A | $ (3,742,766) | $ 12,296,351 |
| Class I | (61,687,103) | 342,690,445 |
| Class R6 | 32,972,662 | 6,153,046 |
| Net increase (decrease) in net assets from capital share transactions | $ (32,457,207) | $361,139,842 |
| Net increase (decrease) in net assets | $(191,286,311) | $348,763,111 |
| Net Assets | ||
| At beginning of year | $ 962,110,749 | $ 613,347,638 |
| At end of year | $ 770,824,438 | $962,110,749 |
| Class A | |||||
| Year Ended September 30, | |||||
| 2022 | 2021 | 2020 | 2019 | 2018 | |
| Net asset value — Beginning of year | $ 16.15 | $ 16.36 | $ 15.87 | $ 14.82 | $ 15.32 |
| Income (Loss) From Operations | |||||
| Net investment income(1) | $ 0.22 | $ 0.21 | $ 0.28 | $ 0.34 | $ 0.27 |
| Net realized and unrealized gain (loss) | (2.57) | (0.18) | 0.55 | 1.05 | (0.39) |
| Total income (loss) from operations | $ (2.35) | $ 0.03 | $ 0.83 | $ 1.39 | $ (0.12) |
| Less Distributions | |||||
| From net investment income | $ (0.24) | $ (0.24) | $ (0.32) | $ (0.34) | $ (0.27) |
| From net realized gain | (0.05) | — | (0.02) | — | (0.11) |
| Total distributions | $ (0.29) | $ (0.24) | $ (0.34) | $ (0.34) | $ (0.38) |
| Net asset value — End of year | $ 13.51 | $ 16.15 | $ 16.36 | $ 15.87 | $ 14.82 |
| Total Return(2) | (14.67)% | 0.17% | 5.27% | 9.53% | (0.80)% |
| Ratios/Supplemental Data | |||||
| Net assets, end of year (000’s omitted) | $71,019 | $89,164 | $77,991 | $58,422 | $42,611 |
| Ratios (as a percentage of average daily net assets):(3) | |||||
| Total expenses | 0.77% | 0.76% | 0.79% | 0.86% | 0.99% |
| Net expenses | 0.73% (4) | 0.73% | 0.73% | 0.77% | 0.85% |
| Net investment income | 1.49% | 1.28% | 1.77% | 2.21% | 1.83% |
| Portfolio Turnover | 19% | 23% | 26% | 21% | 16% |
| (1) | Computed using average shares outstanding. |
| (2) | Returns are historical and are calculated by determining the percentage change in net asset value with all distributions reinvested and do not reflect the effect of sales charges, if any. |
| (3) | Total expenses do not reflect amounts reimbursed and/or waived by the adviser and certain of its affiliates, if applicable. Net expenses are net of all reductions and represent the net expenses paid by the Fund. |
| (4) | Includes a reduction by the investment adviser of a portion of its advisory fee due to the Fund's investment in the Liquidity Fund (equal to less than 0.005% of average daily net assets for the year ended September 30, 2022). |
| Class I | |||||
| Year Ended September 30, | |||||
| 2022 | 2021 | 2020 | 2019 | 2018 | |
| Net asset value — Beginning of year | $ 16.17 | $ 16.38 | $ 15.89 | $ 14.83 | $ 15.32 |
| Income (Loss) From Operations | |||||
| Net investment income(1) | $ 0.26 | $ 0.25 | $ 0.32 | $ 0.38 | $ 0.33 |
| Net realized and unrealized gain (loss) | (2.57) | (0.18) | 0.55 | 1.06 | (0.40) |
| Total income (loss) from operations | $ (2.31) | $ 0.07 | $ 0.87 | $ 1.44 | $ (0.07) |
| Less Distributions | |||||
| From net investment income | $ (0.28) | $ (0.28) | $ (0.36) | $ (0.38) | $ (0.31) |
| From net realized gain | (0.05) | — | (0.02) | — | (0.11) |
| Total distributions | $ (0.33) | $ (0.28) | $ (0.38) | $ (0.38) | $ (0.42) |
| Net asset value — End of year | $ 13.53 | $ 16.17 | $ 16.38 | $ 15.89 | $ 14.83 |
| Total Return(2) | (14.44)% | 0.42% | 5.53% | 9.84% | (0.48)% |
| Ratios/Supplemental Data | |||||
| Net assets, end of year (000’s omitted) | $661,646 | $863,670 | $532,149 | $285,796 | $113,097 |
| Ratios (as a percentage of average daily net assets):(3) | |||||
| Total expenses | 0.52% | 0.51% | 0.54% | 0.61% | 0.74% |
| Net expenses | 0.48% (4) | 0.48% | 0.48% | 0.48% | 0.50% |
| Net investment income | 1.73% | 1.52% | 2.00% | 2.47% | 2.24% |
| Portfolio Turnover | 19% | 23% | 26% | 21% | 16% |
| (1) | Computed using average shares outstanding. |
| (2) | Returns are historical and are calculated by determining the percentage change in net asset value with all distributions reinvested and do not reflect the effect of sales charges, if any. |
| (3) | Total expenses do not reflect amounts reimbursed and/or waived by the adviser and certain of its affiliates, if applicable. Net expenses are net of all reductions and represent the net expenses paid by the Fund. |
| (4) | Includes a reduction by the investment adviser of a portion of its advisory fee due to the Fund's investment in the Liquidity Fund (equal to less than 0.005% of average daily net assets for the year ended September 30, 2022). |
| Class R6 | ||||
| Year Ended September 30, | Period Ended September 30, | |||
| 2022 | 2021 | 2020 | 2019 (1) | |
| Net asset value — Beginning of period | $ 16.18 | $ 16.39 | $ 15.90 | $ 15.01 |
| Income (Loss) From Operations | ||||
| Net investment income(2) | $ 0.29 | $ 0.26 | $ 0.32 | $ 0.26 |
| Net realized and unrealized gain (loss) | (2.59) | (0.18) | 0.55 | 0.89 |
| Total income (loss) from operations | $ (2.30) | $ 0.08 | $ 0.87 | $ 1.15 |
| Less Distributions | ||||
| From net investment income | $ (0.29) | $ (0.29) | $ (0.36) | $ (0.26) |
| From net realized gain | (0.05) | — | (0.02) | — |
| Total distributions | $ (0.34) | $ (0.29) | $ (0.38) | $ (0.26) |
| Net asset value — End of period | $ 13.54 | $16.18 | $16.39 | $15.90 |
| Total Return(3) | (14.39)% | 0.47% | 5.58% | 7.68% (4) |
| Ratios/Supplemental Data | ||||
| Net assets, end of period (000’s omitted) | $38,160 | $ 9,277 | $ 3,208 | $ 581 |
| Ratios (as a percentage of average daily net assets):(5) | ||||
| Total expenses | 0.47% | 0.46% | 0.49% | 0.54% (6) |
| Net expenses | 0.43% (7) | 0.43% | 0.43% | 0.43% (6) |
| Net investment income | 1.96% | 1.56% | 1.99% | 2.49% (6) |
| Portfolio Turnover | 19% | 23% | 26% | 21% (8) |
| (1) | For the period from the commencement of operations, February 1, 2019, to September 30, 2019. |
| (2) | Computed using average shares outstanding. |
| (3) | Returns are historical and are calculated by determining the percentage change in net asset value with all distributions reinvested and do not reflect the effect of sales charges, if any. |
| (4) | Not annualized. |
| (5) | Total expenses do not reflect amounts reimbursed and/or waived by the adviser and certain of its affiliates, if applicable. Net expenses are net of all reductions and represent the net expenses paid by the Fund. |
| (6) | Annualized. |
| (7) | Includes a reduction by the investment adviser of a portion of its advisory fee due to the Fund's investment in the Liquidity Fund (equal to less than 0.005% of average daily net assets for the year ended September 30, 2022). |
| (8) | For the year ended September 30, 2019. |
| Asset Description | Level 1 | Level 2 | Level 3 | Total |
| Asset-Backed Securities | $ — | $ 98,874,634 | $ — | $ 98,874,634 |
| Commercial Mortgage-Backed Securities | — | 50,431,016 | — | 50,431,016 |
| Corporate Bonds | — | 466,782,429 | — | 466,782,429 |
| High Social Impact Investments | — | 1,578,892 | — | 1,578,892 |
| Preferred Stocks | 10,672,318 | — | — | 10,672,318 |
| Senior Floating-Rate Loans | — | 5,620,446 | — | 5,620,446 |
| Sovereign Government Bonds | — | 77,295,407 | — | 77,295,407 |
| Taxable Municipal Obligations | — | 19,709,690 | — | 19,709,690 |
| U.S. Government Agencies and Instrumentalities | — | 8,866,555 | — | 8,866,555 |
| U.S. Government Agency Mortgage-Backed Securities | — | 1,831,729 | — | 1,831,729 |
| Short-Term Investments: | ||||
| Affiliated Fund | 15,154,018 | — | — | 15,154,018 |
| Securities Lending Collateral | 3,652,992 | — | — | 3,652,992 |
| Total Investments | $29,479,328 | $730,990,798 | $ — | $760,470,126 |
| Forward Foreign Currency Exchange Contracts | $ — | $ 3,443,803 | $ — | $ 3,443,803 |
| Futures Contracts | 6,109,771 | — | — | 6,109,771 |
| Total | $35,589,099 | $734,434,601 | $ — | $770,023,700 |
| Liability Description | ||||
| Forward Foreign Currency Exchange Contracts | $ — | $ (291,110) | $ — | $ (291,110) |
| Futures Contracts | (2,425,111) | — | — | (2,425,111) |
| Total | $ (2,425,111) | $ (291,110) | $ — | $ (2,716,221) |
| Year Ended September 30, | ||
| 2022 | 2021 | |
| Ordinary income | $16,734,788 | $13,700,471 |
| Long-term capital gains | $ 3,282,913 | $ — |
| Undistributed ordinary income | $ 389,648 |
| Net unrealized depreciation | (143,741,756) |
| Distributions payable | (21,827) |
| Accumulated loss | $(143,373,935) |
| Aggregate cost | $ 904,162,857 |
| Gross unrealized appreciation | $ 6,840,057 |
| Gross unrealized depreciation | (150,532,788) |
| Net unrealized depreciation | $(143,692,731) |
| Risk | Derivative | Statement of Assets and Liabilities Caption | Assets | Liabilities |
| Foreign exchange | Forward foreign currency exchange contracts | Receivable/Payable for open forward foreign currency exchange contracts | $ 3,443,803 | $ (291,110) |
| Interest rate | Futures contracts | Accumulated loss | 6,109,771 (1) | (2,425,111) (1) |
| Total | $9,553,574 | $(2,716,221) | ||
| Derivatives not subject to master netting agreement | $6,109,771 | $(2,425,111) | ||
| Total Derivatives subject to master netting agreement | $3,443,803 | $ (291,110) | ||
| (1) | Only the current day's variation margin is reported within the Statement of Assets and Liabilities as Receivable or Payable for variation margin on open futures contracts, as applicable. |
| Counterparty | Derivative Assets Subject to Master Netting Agreement | Derivatives Available for Offset | Non-cash Collateral Received(a) | Cash Collateral Received(a) | Net Amount of Derivative Assets(b) |
| State Street Bank and Trust Company | $3,443,803 | $(291,110) | $ — | $(3,152,693) | $ — |
| Counterparty | Derivative Liabilities Subject to Master Netting Agreement | Derivatives Available for Offset | Non-cash Collateral Pledged(a) | Cash Collateral Pledged(a) | Net Amount of Derivative Liabilities(c) |
| State Street Bank and Trust Company | $(291,110) | $291,110 | $ — | $ — | $ — |
| (a) | In some instances, the total collateral received and/or pledged may be more than the amount shown due to overcollateralization. |
| (b) | Net amount represents the net amount due from the counterparty in the event of default. |
| (c) | Net amount represents the net amount payable to the counterparty in the event of default. |
| Statement of Operations Caption | Foreign exchange | Interest rate | Total |
| Net realized gain (loss): | |||
| Investment securities(1) | $ — | $ (170,642) | $ (170,642) |
| Forward foreign currency exchange contracts | 30,590,002 | — | 30,590,002 |
| Futures contracts | — | 11,707,024 | 11,707,024 |
| Total | $30,590,002 | $11,536,382 | $42,126,384 |
| Change in unrealized appreciation (depreciation): | |||
| Forward foreign currency exchange contracts | $ (521,373) | $ — | $ (521,373) |
| Futures contracts | — | 1,822,822 | 1,822,822 |
| Total | $ (521,373) | $ 1,822,822 | $ 1,301,449 |
| (1) | Relates to purchased options. |
| Futures Contracts — Long | Futures Contracts — Short | Forward Foreign Currency Exchange Contracts* |
| $111,397,000 | $120,993,000 | $188,183,000 |
| * | The average notional amount for forward foreign currency exchange contracts is based on the absolute value of notional amounts of currency purchased and currency sold. |
| Remaining Contractual Maturity of the Transactions | |||||
| Overnight and Continuous | <30 days | 30 to 90 days | >90 days | Total | |
| Corporate Bonds | $ 2,469,642 | $ — | $ — | $ — | $ 2,469,642 |
| Sovereign Government Bonds | 1,183,350 | — | — | — | 1,183,350 |
| Total | $3,652,992 | $ — | $ — | $ — | $3,652,992 |
| Name | Value, beginning of period | Purchases | Sales proceeds | Net realized gain (loss) | Change in unrealized appreciation (depreciation) | Value, end of period | Interest/ Dividend income | Principal amount/ Units/Shares, end of period |
| Corporate Bonds | ||||||||
| Mitsubishi UFJ Financial Group, Inc., 2.527%, 9/13/23 | $ 1,144,169 | $ — | $ — | $ — | $ (75,246) | $ 1,073,319 | $ 32,193 | $ 1,100,000 |
| High Social Impact Investments | ||||||||
| Calvert Impact Capital, Inc., Community Investment Notes, 1.50%, 12/15/23(1) | 1,670,811 | — | — | — | (91,919) | 1,578,892 | 25,500 | 1,700,000 |
| Short-Term Investments | ||||||||
| Cash Reserves Fund | 35,218,651 | 189,412,024 | (224,630,844) | 3,690 | (3,521) | — | 18,181 | — |
| Liquidity Fund | — | 222,039,116 | (206,885,098) | — | — | 15,154,018 | 207,623 | 15,154,018 |
| Total | $3,690 | $(170,686) | $17,806,229 | $283,497 | ||||
| (1) | Restricted security. |
| Year Ended September 30, 2022 | Year Ended September 30, 2021 | ||||
| Shares | Amount | Shares | Amount | ||
| Class A | |||||
| Shares sold | 986,103 | $ 15,026,712 | 1,872,632 | $ 30,546,215 | |
| Reinvestment of distributions | 104,014 | 1,565,708 | 70,723 | 1,153,006 | |
| Shares redeemed | (1,354,956) | (20,335,186) | (1,190,930) | (19,402,870) | |
| Net increase (decrease) | (264,839) | $ (3,742,766) | 752,425 | $ 12,296,351 | |
| Class I | |||||
| Shares sold | 23,980,270 | $ 360,371,565 | 34,965,708 | $ 571,139,915 | |
| Reinvestment of distributions | 1,178,084 | 17,756,011 | 744,904 | 12,148,463 | |
| Shares redeemed | (29,658,865) | (439,814,679) | (14,799,489) | (240,597,933) | |
| Net increase (decrease) | (4,500,511) | $ (61,687,103) | 20,911,123 | $ 342,690,445 | |
| Class R6 | |||||
| Shares sold | 2,818,485 | $ 41,476,746 | 449,216 | $ 7,321,761 | |
| Reinvestment of distributions | 25,377 | 363,498 | 2,804 | 45,742 | |
| Shares redeemed | (598,929) | (8,867,582) | (74,497) | (1,214,457) | |
| Net increase | 2,244,933 | $ 32,972,662 | 377,523 | $ 6,153,046 | |
Boston, Massachusetts
November 22, 2022
| • | A report from an independent data provider comparing the advisory and related fees paid by each fund with fees paid by comparable funds; |
| • | A report from an independent data provider comparing each fund’s total expense ratio and its components to comparable funds; |
| • | A report from an independent data provider comparing the investment performance of each fund to the investment performance of comparable funds over various time periods; |
| • | Data regarding investment performance in comparison to benchmark indices; |
| • | For each fund, comparative information concerning the fees charged and the services provided by the Adviser in managing other accounts (including mutual funds, other collective investment funds and institutional accounts) using investment strategies and techniques similar to those used in managing such fund; |
| • | Profitability analyses for the Adviser with respect to each fund; |
| • | Descriptions of the investment management services provided to each fund, including investment strategies and processes it employs; |
| • | Information about the Adviser’s policies and practices with respect to trading, including the Adviser’s processes for monitoring best execution of portfolio transactions; |
| • | Information about the allocation of brokerage transactions and the benefits received by the Adviser as a result of brokerage allocation, including information concerning the acquisition of research through client commission arrangements and policies with respect to “soft dollars”; |
| • | Reports detailing the financial results and condition of CRM; |
| • | Descriptions of the qualifications, education and experience of the individual investment professionals whose responsibilities include portfolio management and investment research for the funds, and information relating to their compensation and responsibilities with respect to managing other mutual funds and investment accounts; |
| • | Policies and procedures relating to proxy voting and the handling of corporate actions and class actions; |
| • | A description of CRM’s procedures for overseeing sub-advisers, including with respect to regulatory and compliance issues, investment management and other matters; |
| • | Information concerning the nature, cost and character of the administrative and other non-investment advisory services provided by CRM and its affiliates; and |
| • | The terms of each investment advisory agreement. |
| Name and Year of Birth | Corporation Position(s) | Length of Service | Principal Occupation(s) and Other Directorships During Past Five Years and Other Relevant Experience |
| Interested Director | |||
| John H. Streur(1) 1960 | Director and President | Since 2015 | President and Chief Executive Officer of CRM (since December 31, 2016). President and Chief Executive Officer of Calvert Investments, Inc. (January 2015 - December 2016); Chief Executive Officer of Calvert Investment Distributors, Inc. (August 2015 - December 2016); Chief Compliance Officer of Calvert Investment Management, Inc. (August 2015 - April 2016); President and Director, Portfolio 21 Investments, Inc. (through October 2014); President, Chief Executive Officer and Director, Managers Investment Group LLC (through January 2012); President and Director, The Managers Funds and Managers AMG Funds (through January 2012). Other Directorships. Portfolio 21 Investments, Inc. (asset management) (through October 2014); Managers Investment Group LLC (asset management) (through January 2012); The Managers Funds (asset management) (through January 2012); Managers AMG Funds (asset management) (through January 2012); Calvert Impact Capital, Inc. |
| Noninterested Directors | |||
| Richard L. Baird, Jr. 1948 | Director | Since 2005 | Regional Disaster Recovery Lead, American Red Cross of Greater Pennsylvania (since 2017). Volunteer, American Red Cross (since 2015). Former President and CEO of Adagio Health Inc. (retired in 2014) in Pittsburgh, PA. Other Directorships. None. |
| Alice Gresham Bullock 1950 | Chair and Director | Since 2016 | Professor Emerita at Howard University School of Law. Dean Emerita of Howard University School of Law and Deputy Director of the Association of American Law Schools (1992-1994). Other Directorships. None. |
| Cari M. Dominguez 1949 | Director | Since 2016 | Former Chair of the U.S. Equal Employment Opportunity Commission. Other Directorships. ManpowerGroup Inc. (workforce solutions company); Triple S Management Corporation (managed care); National Association of Corporate Directors. |
| John G. Guffey, Jr. 1948 | Director | Since 2005 | President of Aurora Press Inc., a privately held publisher of trade paperbacks (since January 1997). Other Directorships. Calvert Impact Capital, Inc. (through December 31, 2018); Calvert Ventures, LLC. |
| Miles D. Harper, III 1962 | Director | Since 2000 | Partner, Carr Riggs & Ingram (public accounting firm) since October 2014. Partner, Gainer Donnelly & Desroches (public accounting firm) (now Carr Riggs & Ingram) (November 1999 - September 2014). Other Directorships. Bridgeway Funds (9) (asset management). |
| Joy V. Jones 1950 | Director | Since 2000 | Attorney. Other Directorships. Palm Management Corporation. |
| Name and Year of Birth | Corporation Position(s) | Length of Service | Principal Occupation(s) and Other Directorships During Past Five Years and Other Relevant Experience |
| Noninterested Directors (continued) | |||
| Anthony A. Williams 1951 | Director | Since 2016 | CEO and Executive Director of the Federal City Council (July 2012 to present); Senior Adviser and Independent Consultant for King and Spalding LLP (September 2015 to present); Executive Director of Global Government Practice at the Corporate Executive Board (January 2010 to January 2012). Other Directorships. Freddie Mac; Evoq Properties/Meruelo Maddux Properties, Inc. (real estate management); Weston Solutions, Inc. (environmental services); Bipartisan Policy Center’s Debt Reduction Task Force; Chesapeake Bay Foundation; Catholic University of America; Urban Institute (research organization); The Howard Hughes Corporation (real estate development); Old Dominion National Bank. |
| Name and Year of Birth | Corporation Position(s) | Length of Service | Principal Occupation(s) During Past Five Years |
| Principal Officers who are not Directors | |||
| Hope L. Brown 1973 | Chief Compliance Officer | Since 2014 | Chief Compliance Officer of 42 registered investment companies advised by CRM (since 2014). Vice President and Chief Compliance Officer, Wilmington Funds (2012-2014). |
| Deidre E. Walsh 1971 | Secretary, Vice President and Chief Legal Officer | Since 2021 | Vice President of CRM and officer of 42 registered investment companies advised by CRM (since 2021). Also Vice President of Eaton Vance and certain of its affiliates and officer of 136 registered investment companies advised or administered by Eaton Vance. |
| James F. Kirchner 1967 | Treasurer | Since 2016 | Vice President of CRM and officer of 42 registered investment companies advised by CRM (since 2016). Also Vice President of Eaton Vance and certain of its affiliates and officer of 136 registered investment companies advised or administered by Eaton Vance. |
| (1) Mr. Streur is an interested person of the Fund because of his positions with the Fund’s adviser and certain affiliates. | |||
| Privacy Notice | April 2021 |
| FACTS | WHAT DOES EATON VANCE DO WITH YOUR PERSONAL INFORMATION? |
| Why? | Financial companies choose how they share your personal information. Federal law gives consumers the right to limit some but not all sharing. Federal law also requires us to tell you how we collect, share, and protect your personal information. Please read this notice carefully to understand what we do. |
| What? | The types of personal information we collect and share depend on the product or service you have with us. This information can include:■ Social Security number and income ■ investment experience and risk tolerance ■ checking account number and wire transfer instructions |
| How? | All financial companies need to share customers’ personal information to run their everyday business. In the section below, we list the reasons financial companies can share their customers’ personal information; the reasons Eaton Vance chooses to share; and whether you can limit this sharing. |
| Reasons we can share your personal information | Does Eaton Vance share? | Can you limit this sharing? |
| For our everyday business purposes — such as to process your transactions, maintain your account(s), respond to court orders and legal investigations, or report to credit bureaus | Yes | No |
| For our marketing purposes — to offer our products and services to you | Yes | No |
| For joint marketing with other financial companies | No | We don’t share |
| For our investment management affiliates’ everyday business purposes — information about your transactions, experiences, and creditworthiness | Yes | Yes |
| For our affiliates’ everyday business purposes — information about your transactions and experiences | Yes | No |
| For our affiliates’ everyday business purposes — information about your creditworthiness | No | We don’t share |
| For our investment management affiliates to market to you | Yes | Yes |
| For our affiliates to market to you | No | We don’t share |
| For nonaffiliates to market to you | No | We don’t share |
| To limit our sharing | Call toll-free 1-800-368-2745 or email: CRMPrivacy@calvert.comPlease note:If you are a new customer, we can begin sharing your information 30 days from the date we sent this notice. When you are no longer our customer, we continue to share your information as described in this notice. However, you can contact us at any time to limit our sharing. |
| Questions? | Call toll-free 1-800-368-2745 or email: CRMPrivacy@calvert.com |
| Privacy Notice — continued | April 2021 |
| Who we are | |
| Who is providing this notice? | Eaton Vance Management, Eaton Vance Distributors, Inc., Eaton Vance Trust Company, Eaton Vance Management (International) Limited, Eaton Vance Advisers International Ltd., Eaton Vance Global Advisors Limited, Eaton Vance Management’s Real Estate Investment Group, Boston Management and Research, Calvert Research and Management, Eaton Vance and Calvert Fund Families and our investment advisory affiliates (“Eaton Vance”) (see Investment Management Affiliates definition below) |
| What we do | |
| How does Eaton Vance protect my personal information? | To protect your personal information from unauthorized access and use, we use security measures that comply with federal law. These measures include computer safeguards and secured files and buildings. We have policies governing the proper handling of customer information by personnel and requiring third parties that provide support to adhere to appropriate security standards with respect to such information. |
| How does Eaton Vance collect my personal information? | We collect your personal information, for example, when you■ open an account or make deposits or withdrawals from your account ■ buy securities from us or make a wire transfer ■ give us your contact informationWe also collect your personal information from others, such as credit bureaus, affiliates, or other companies. |
| Why can’t I limit all sharing? | Federal law gives you the right to limit only■ sharing for affiliates’ everyday business purposes — information about your creditworthiness ■ affiliates from using your information to market to you ■ sharing for nonaffiliates to market to youState laws and individual companies may give you additional rights to limit sharing. See below for more on your rights under state law. |
| Definitions | |
| Investment Management Affiliates | Eaton Vance Investment Management Affiliates include registered investment advisers, registered broker- dealers, and registered and unregistered funds. Investment Management Affiliates does not include entities associated with Morgan Stanley Wealth Management, such as Morgan Stanley Smith Barney LLC and Morgan Stanley & Co. |
| Affiliates | Companies related by common ownership or control. They can be financial and nonfinancial companies.■ Our affiliates include companies with a Morgan Stanley name and financial companies such as Morgan Stanley Smith Barney LLC and Morgan Stanley & Co. |
| Nonaffiliates | Companies not related by common ownership or control. They can be financial and nonfinancial companies.■ Eaton Vance does not share with nonaffiliates so they can market to you. |
| Joint marketing | A formal agreement between nonaffiliated financial companies that together market financial products or services to you.■ Eaton Vance doesn’t jointly market. |
| Other important information | |
| Vermont: Except as permitted by law, we will not share personal information we collect about Vermont residents with Nonaffiliates unless you provide us with your written consent to share such information.California: Except as permitted by law, we will not share personal information we collect about California residents with Nonaffiliates and we will limit sharing such personal information with our Affiliates to comply with California privacy laws that apply to us. | |
| Item 2. | Code of Ethics |
The registrant has adopted a code of ethics applicable to its Principal Executive Officer, Principal Financial Officer and Principal Accounting Officer. The registrant undertakes to provide a copy of such code of ethics to any person upon request, without charge, by calling 1-800-368-2745. The registrant has not amended the code of ethics as described in Form N-CSR during the period covered by this report. The registrant has not granted any waiver, including an implicit waiver, from a provision of the code of ethics as described in Form N-CSR during the period covered by this report.
| Item 3. | Audit Committee Financial Expert |
The registrant’s Board of Directors has determined that Miles D. Harper III, an “independent” Director serving on the registrant’s audit committee, is an “audit committee financial expert,” as defined in Item 3 of Form N-CSR. Under applicable securities laws, a person who is determined to be an audit committee financial expert will not be deemed an “expert” for any purpose, including without limitation for the purposes of Section 11 of the Securities Act of 1933, as a result of being designated or identified as an audit committee financial expert.
The designation or identification of a person as an audit committee financial expert does not impose on such person any duties, obligations, or liabilities that are greater than the duties, obligations, and liabilities imposed on such person as a member of the audit committee and Board of Directors in the absence of such designation or identification.
| Item 4. | Principal Accountant Fees and Services |
(a) –(d)
The following table presents the aggregate fees billed to the registrant for the registrant’s fiscal years ended September 30, 2021 and September 30, 2022 by its principal accountant for professional services rendered for the audit of the registrant’s annual financial statements and fees billed for other services rendered by its principal accountant during such periods.
Fiscal Years Ended | 9/30/21 | %* | 9/30/22 | %* | ||||||||||||
Audit Fees | $ | 92,000 | 0 | % | $ | 92,000 | 0 | % | ||||||||
Audit-Related Fees(1) | $ | 0 | 0 | % | $ | 0 | 0 | % | ||||||||
Tax Fees(2) | $ | 19,275 | 0 | % | $ | 0 | 0 | % | ||||||||
All Other Fees(3) | $ | 0 | 0 | % | $ | 0 | 0 | % | ||||||||
|
|
|
|
|
|
|
| |||||||||
Total | $ | 111,275 | 0 | % | $ | 92,000 | 0 | % | ||||||||
|
|
|
|
|
|
|
| |||||||||
| * | Percentage of fees approved by the Audit Committee pursuant to (c )(7)(i)(C ) of Rule 2-01 of Reg. S-X (statutory de minimis waiver of Committee’s requirement to pre-approve). |
| (1) | Audit-related fees consist of the aggregate fees billed for assurance and related services that are reasonably related to the performance of the audit of the registrant’s financial statements and are not reported under the category of audit fees. |
| (2) | Tax fees consist of the aggregate fees billed for professional services rendered by the principal accountant relating to tax compliance, tax advice, and tax planning and specifically include fees for tax return preparation and other related tax compliance/planning matters. |
| (3) | All other fees consist of the aggregate fees billed for products and services provided by the principal accountant other than audit, audit-related, and tax services. |
(e) The Audit Committee is required to pre-approve all audit and non-audit services provided to the registrant by the auditors, and to the registrant’s investment adviser, and any entity controlling, controlled by, or under common control with the adviser that provides ongoing services to the registrant. In determining whether to pre-approve non-audit services, the Audit Committee considers whether the services are consistent with maintaining the independence of the auditors. The Committee may delegate its authority to pre-approve certain matters to one or more of its members. In this regard, the Committee has delegated authority jointly to the Audit Committee Chair together with another Committee member with respect to non-audit services not exceeding $25,000 in each instance. In addition, the Committee has pre-approved the retention of the auditors to provide tax-related services related to the tax treatment and tax accounting of newly acquired securities, upon request by the investment adviser in each instance.
(f) Not applicable.
(g) Aggregate non-audit fees billed by the registrant’s principal accountant for services rendered to the registrant, and rendered to the registrant’s investment adviser, and any entity controlling, controlled by, or under common control with the adviser that provides ongoing services to the registrant for each of the last two fiscal years of the registrant:
| Fiscal Year ended 9/30/21 | Fiscal Year ended 9/30/22 | |||||||||||||
| $ | %* | $ | %* | |||||||||||
| $ 19,275 | 0 | % | $ | 0 | 0 | % | ||||||||
| * | Percentage of fees approved by the Audit Committee pursuant to (c)(7)(i)(C) of Rule 2-01 of Reg. S-X (statutory de minimis waiver of Committee’s requirement to pre-approve). |
(h) The registrant’s audit committee has considered whether the provision by the registrant’s principal accountant of non-audit services to the registrant’s investment adviser and any entity controlling, controlled by, or under common control with the adviser that provides ongoing services to the registrant that were not pre-approved pursuant to Rule 2-01(c)(7)(ii) of Regulation S-X is compatible with maintaining the principal accountant’s independence.
| Item 5. | Audit Committee of Listed Registrants |
Not applicable.
| Item 6. | Schedule of Investments |
Please see schedule of investments contained in the Report to Stockholders included under Item 1 of this Form N-CSR.
| Item 7. | Disclosure of Proxy Voting Policies and Procedures for Closed-End Management Investment Companies |
Not applicable.
| Item 8. | Portfolio Managers of Closed-End Management Investment Companies |
Not applicable.
| Item 9. | Purchases of Equity Securities by Closed-End Management Investment Company and Affiliated Purchasers |
Not applicable.
| Item 10. | Submission of Matters to a Vote of Security Holders |
No material changes.
| Item 11. | Controls and Procedures |
(a) The registrant’s principal executive and principal financial officers have concluded that the registrant’s disclosure controls and procedures (as defined in Rule 30a-3(c) under the Investment Company Act of 1940 Act, as amended (the “1940 Act”) are effective, based on the evaluation of these controls and procedures required by Rule 30a-3(b) under the 1940 Act and Rules 13a-15(b) or 15d-15(b) under the Securities Exchange Act of 1934 (“Exchange Act”), as of a date within 90 days of the filing date of this report.
(b) There was no change in the registrant’s internal control over financial reporting (as defined in Rule 30a-3(d) under the 1940 Act) that occurred during the period covered by this report that has materially affected, or is reasonably likely to materially affect, the registrant’s internal control over financial reporting.
| Item 12. | Disclosure of Securities Lending Activities for Closed-End Management Investment Companies |
Not applicable.
| Item 13. | Exhibits |
(a)(1) | Registrant’s Code of Ethics – Not applicable (please see Item 2). | |
(a)(2)(i) | Treasurer’s Section 302 certification. | |
(a)(2)(ii) | President’s Section 302 certification | |
(b) | Combined Section 906 certification. | |
Signatures
Pursuant to the requirements of the Securities Exchange Act of 1934 and the Investment Company Act of 1940, the registrant has duly caused this report to be signed on its behalf by the undersigned, thereunto duly authorized.
| CALVERT IMPACT FUND, INC. | ||
| By: | /s/ John H. Streur | |
| John H. Streur | ||
| President | ||
| Date: | November 22, 2022 | |
Pursuant to the requirements of the Securities Exchange Act of 1934 and the Investment Company Act of 1940, this report has been signed below by the following persons on behalf of the registrant and in the capacities and on the dates indicated.
| By: | /s/ James F. Kirchner | |
| James F. Kirchner | ||
| Treasurer | ||
| Date: | November 22, 2022 | |
| By: | /s/ John H. Streur | |
| John H. Streur | ||
| President | ||
| Date: | November 22, 2022 | |