UNITED STATES
SECURITIES AND EXCHANGE COMMISSION
Washington, D.C. 20549
FORM N-CSR
CERTIFIED SHAREHOLDER REPORT OF REGISTERED
MANAGEMENT INVESTMENT COMPANIES
Investment Company Act file number | 811-10067 |
|
Eaton Vance Variable Trust |
(Exact name of registrant as specified in charter) |
|
The Eaton Vance Building, 255 State Street, Boston, Massachusetts | | 02109 |
(Address of principal executive offices) | | (Zip code) |
|
Alan R. Dynner The Eaton Vance Building, 255 State Street, Boston, Massachusetts 02109 |
(Name and address of agent for service) |
|
Registrant’s telephone number, including area code: | (617) 482-8260 | |
|
Date of fiscal year end: | December 31 | |
|
Date of reporting period: | December 31, 2005 | |
| | | | | | | | | |
Item 1. Reports to Stockholders

Annual Report December 31, 2005


EATON VANCE
VT
FLOATING-
RATE
INCOME
FUND
IMPORTANT NOTICES REGARDING PRIVACY,
DELIVERY OF SHAREHOLDER DOCUMENTS,
PORTFOLIO HOLDINGS, AND PROXY VOTING
Privacy. The Eaton Vance organization is committed to ensuring your financial privacy. Each of the financial institutions identified below has in effect the following policy ("Privacy Policy") with respect to nonpublic personal information about its customers:
• Only such information received from you, through application forms or otherwise, and information about your Eaton Vance fund transactions will be collected. This may include information such as name, address, social security number, tax status, account balances and transactions.
• None of such information about you (or former customers) will be disclosed to anyone, except as permitted by law (which includes disclosure to employees necessary to service your account). In the normal course of servicing a customer's account, Eaton Vance may share information with unaffiliated third parties that perform various required services such as transfer agents, custodians and broker/dealers.
• Policies and procedures (including physical, electronic and procedural safeguards) are in place that are designed to protect the confidentiality of such information.
• We reserve the right to change our Privacy Policy at any time upon proper notification to you. Customers may want to review our Policy periodically for changes by accessing the link on our homepage: www.eatonvance.com.
Our pledge of privacy applies to the following entities within the Eaton Vance organization: the Eaton Vance Family of Funds, Eaton Vance Management, Eaton Vance Investment Counsel, Boston Management and Research, and Eaton Vance Distributors, Inc.
In addition, our Privacy Policy only applies to those Eaton Vance customers who are individuals and who have a direct relationship with us. If a customer's account (i.e., fund shares) is held in the name of a third-party financial adviser/broker-dealer, it is likely that only such adviser's privacy policies apply to the customer. This notice supersedes all previously issued privacy disclosures.
For more information about Eaton Vance's Privacy Policy, please call 1-800-262-1122.
Delivery of Shareholder Documents. The Securities and Exchange Commission (the "SEC") permits funds to deliver only one copy of shareholder documents, including prospectuses, proxy statements and shareholder reports, to fund investors with multiple accounts at the same residential or post office box address. This practice is often called "householding" and it helps eliminate duplicate mailings to shareholders.
Eaton Vance, or your financial adviser, may household the mailing of your documents indefinitely unless you instruct Eaton Vance, or your financial adviser, otherwise.
If you would prefer that your Eaton Vance documents not be householded, please contact Eaton Vance at 1-800-262-1122, or contact your financial adviser.
Your instructions that householding not apply to delivery of your Eaton Vance documents will be effective within 30 days of receipt by Eaton Vance or your financial adviser.
Portfolio Holdings. Each Eaton Vance Fund and its underlying Portfolio (if applicable) will file a schedule of its portfolio holdings on Form N-Q with the SEC for the first and third quarters of each fiscal year. The Form N-Q will be available on the Eaton Vance website www.eatonvance.com, by calling Eaton Vance at 1-800-262-1122 or in the EDGAR database on the Securities and Exchange Commision's website at www.sec.gov. Form N-Q may also be reviewed and copied at the SEC's public reference room in Washington, D.C. (call 1-800-732-0330 for information on the operation of the public reference room).
Proxy Voting. From time to time, funds are required to vote proxies related to the securities held by the funds. The Eaton Vance Funds or their underlying Portfolios (if applicable) vote proxies according to a set of policies and procedures approved by the Funds' and Portfolios' Boards. You may obtain a description of these policies and procedures and information on how the Funds or Portfolios voted proxies relating to Portfolio securities during the most recent 12 month period ended June 30, without charge, upon request, by calling 1-800-262-1122. This description is also available on the SEC's website at www.sec.gov.
Eaton Vance VT Floating-Rate Income Fund as of December 31, 2005
MANAGEMENT'S DISCUSSION OF FUND PERFORMANCE
The Fund
Performance for the year ended December 31, 2005
• The Fund distributed $0.402 in income dividends during the year ended December 31, 2005. Based on a $10.08 net asset value on December 31, 2005, the Fund had a distribution rate of 4.82%.(1) The Fund’s SEC 30-day yield at December 31, 2005 was 4.81%.(2)
• The Fund had a total return of 3.86% during the year ended December 31, 2005.(3) That return was the result of a decrease in net asset value per share to $10.08 on December 31, 2005 from $10.10 on December 31, 2004 and the reinvestment of all dividends.
• For comparison, the S&P/LSTA Leveraged Loan Index – an unmanaged loan market index – had a return of 5.06% for the year ended December 31, 2005.(4)
Investment Environment
• Loan market fundamentals remained relatively strong during the fiscal year ended December 31, 2005. Despite historically low credit spreads, default rates remained below historical averages. Technical factors, meanwhile, have also been favorable. Demand outstripped supply for much of the period; however, in recent months, increasing supply has brought demand/supply into better balance.
• The Federal Reserve continued to push short-term interest rates higher, raising its Federal Funds rate – a short-term interest rate benchmark – by 25 basis points (0.25%) on eight occasions during the year ended December 31, 2005. With their interest rate reset provisions, floating-rate loans have historically generated higher income returns in response to increases in the short-term interest rate level.
The Fund’s Investments
• The Fund’s investment objective is to provide a high level of current income. To do so, the Fund invests primarily in income producing, floating rate loans and other floating rate debt securities.
• The Fund’s investments included 254 borrowers at December 31, 2005, ranging across 35 different industries. The Fund’s average loan size was just 0.35% of net assets, and no industry constituted more than 6% of the Fund. Building and development (including manufacturers of building products and companies that manage/own apartments, shopping malls and commercial office buildings, among others), chemicals and plastics, health care, telecommunications and containers and glass were the Fund’s largest industry weightings.*
• The loan market performed well, as short-term interest rates rose throughout the fiscal year. The London-Interbank Offered Rate (LIBOR) – the benchmark over which loan interest rates are typically set – kept pace with the Federal Reserve’s rate hikes; and, yield spreads narrowed to just below their historical range.
• In the wake of Hurricanes Katrina and Rita, management identified several companies that were directly impacted by the storms. While these loans suffered very little price impact, management nonetheless reduced exposure to the hardest-hit companies, generally at prices above par. The hurricanes had little initial overall impact on the Fund.
• We continued to emphasize the importance of rigorous credit selection, discipline and careful monitoring. We believe that the difference in performance between the Fund and the S&P/LSTA Leveraged Loan Index was the result of our more defensive stance versus this unmanaged Index; a stance, we believe, that may produce higher and more stable risk-adjusted total returns over time.(4)
* Holdings and industry weightings are subject to change due to active management.
The views expressed in this report are those of the portfolio managers and are current only through the end of the period of the report as stated on the cover. These views are subject to change at any time based upon market or other conditions, and Eaton Vance disclaims any responsibility to update such views. These views may not be relied on as investment advice and, because investment decisions for an Eaton Vance fund are based on many factors, may not be relied on as an indication of trading intent on behalf of any Eaton Vance fund.
(1) The Fund’s distribution rate represents actual distributions paid to shareholders and is calculated daily by dividing the last distribution per share (annualized) by the net asset value.
(2) The Fund’s SEC yield is calculated by dividing the net investment income per share for the 30-day period by the net asset value at the end of the period and annualizing the result.
(3)There is no sales charge. Insurance-related charges are not included in calculations of returns. Please refer to the report for your insurance contract for performance data reflecting insurance-related charges.
(4) It is not possible to invest directly in an Index. The Index’s total return does not reflect the commissions or expenses that would have been incurred if an investor individually purchased or sold the securities represented in the Index.
Fund shares are not insured by the FDIC and are not deposits or other obligations of, or guaranteed by, any depository institution. Shares are subject to investment risks, including possible loss of principal invested. Yield will vary.
Past performance is no guarantee of future results. Returns are historical and are calculated by determining the percentage change in net asset value or offering price (as applicable) with all distributions reinvested. Investment return and principal value will fluctuate so that shares, when redeemed, may be worth more or less than their original cost. Performance is for the stated time period only; due to market volatility, the Fund’s current performance may be lower or higher than the quoted return. For performance as of the most recent month-end, please refer to www.eatonvance.com.
2
Eaton Vance VT Floating-Rate Income Fund as of December 31, 2005
FUND PERFORMANCE
The line graph and table set forth below provide information about the Fund’s performance. The line graph compares the performance of the Fund with that of the S&P/LSTA Leveraged Loan Index, an unmanaged loan market index. The lines on the graph represent the total returns of a hypothetical investment of $10,000 in each of the Fund and the S&P/LSTA Leveraged Loan Index. The table includes the total returns of the Fund at net asset value. There is no sales charge. Insurance-related sales charges are not included in calculations of returns. Please refer to the report for your insurance contract for performance data reflecting insurance-related charges.
Performance(1)
Average Annual Total Return (at net asset value) | | | |
| | | |
One Year | | 3.86 | % |
Life of Fund (5/2/01) | | 2.40 | |
(1) The Fund has no sales charge. Returns do not include insurance-related charges.
Past performance is no guarantee of future results. Returns are historical and are calculated by determining the percentage change in net asset value or offering price (as applicable) with all distributions reinvested. Investment return and principal value will fluctuate so that shares, when redeemed, may be worth more or less than their original cost. Performance is for the stated time period only; due to market volatility, the Fund’s current performance may be lower or higher than the quoted return. For performance as of the most recent month-end, please refer to www.eatonvance.com.
Fund Allocations(2)
By total investments
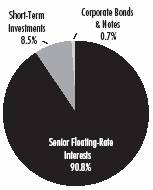
(2) Fund Allocations are shown as a percentage of total investments as of December 31, 2005. Allocations may not be representative of current or future investments and are subject to change due to active management.
Comparison of Change in Value of a $10,000 Investment in Eatan Vance VT Floating-Rate Income Fund vs. the S&P/LSTA Leveraged Loan Index*
May 31, 2001 – December 31, 2005
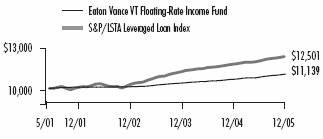
* Sources: Thomson Financial; Bloomberg, L.P.; Fund operations commenced 5/2/01.
It is not possible to invest directly in an Index. The Index’s total return does not reflect the expenses that would have been incurred if an investor individually purchased or sold the securities represented in the Index. Because Index is based on month-end data, chart begins on 5/31/01.
Diversification by Industries(3)
By total investments
Building & Development | | 5.9 | % |
Chemicals & Plastics | | 5.2 | |
Telecommunications | | 5.1 | |
Health Care | | 4.7 | |
Containers & Glass Products | | 4.6 | |
Publishing | | 4.5 | |
Cable & Satellite Television | | 4.3 | |
Leisure Goods/Activities/Movies | | 3.9 | |
Radio & Television | | 3.7 | |
Lodging & Casinos | | 3.5 | |
Retailers (Except Food & Drug) | | 3.3 | |
Business Equip. & Services | | 3.1 | |
Aerospace & Defense | | 3.1 | |
Food Products | | 3.1 | |
Utilities | | 2.9 | |
Oil & Gas | | 2.8 | |
Forest Products | | 2.8 | |
Conglomerates | | 2.8 | |
Automotive | | 2.7 | % |
Financial Intermediaries | | 2.7 | |
Electronics/Electrical | | 2.6 | |
Nonferrous Metals/Minerals | | 1.7 | |
Food Service | | 1.6 | |
Beverage & Tobacco | | 1.5 | |
Industrial Equipment | | 1.3 | |
Home Furnishings | | 1.3 | |
Equipment Leasing | | 1.2 | |
Food/Drug Retailers | | 1.2 | |
Insurance | | 1.1 | |
Ecological Services & Equip. | | 1.0 | |
Rail Industries | | 0.7 | |
Farming/Agriculture | | 0.4 | |
Drugs | | 0.4 | |
Cosmetics/Toiletries | | 0.3 | |
Air Transport | | 0.3 | |
Surface Transport | | 0.2 | |
(3) Reflects the Fund’s investments as of December 31, 2005. Industries are shown as a percentage of the Fund’s total investments. Statistics may not be representative of current or future investments and are subject to change due to active management.
3
Eaton Vance VT Floating-Rate Income Fund as of December 31, 2005
FUND EXPENSES
Example: As a shareholder of the Fund, you incur ongoing costs, including transaction costs; management fees; distribution or service fees; and other Fund expenses. This Example is intended to help you understand your ongoing costs (in dollars) of investing in the Fund and to compare these costs with the ongoing costs of investing in other mutual funds. The Example is based on an investment of $1,000 invested at the beginning of the period and held for the entire period (July 1, 2005 – December 31, 2005).
Actual Expenses: The first section of the table below provides information about actual account values and actual expenses. You may use the information in this section, together with the amount you invested, to estimate the expenses that you paid over the period. Simply divide your account value by $1,000 (for example, an $8,600 account value divided by $1,000 = 8.6), then multiply the result by the number in the first line under the heading entitled “Expenses Paid During Period” to estimate the expenses you paid on your account during this period.
Hypothetical Example for Comparison Purposes: The second section of the table below provides information about hypothetical account values and hypothetical expenses based on the actual Fund expense ratio and an assumed rate of return of 5% per year (before expenses), which is not the actual return of the Fund. The hypothetical account values and expenses may not be used to estimate the actual ending account balance or expenses you paid for the period. You may use this information to compare the ongoing costs of investing in your Fund and other funds. To do so, compare this 5% hypothetical example with the 5% hypothetical examples that appear in the shareholder reports of the other funds.
Please note that the expenses shown in the table are meant to highlight your ongoing costs only and do not reflect any transactional costs, such as insurance-related charges, sales charges (loads) or redemption fees (if applicable). Therefore, the second section of the table is useful in comparing ongoing costs only, and will not help you determine the relative total costs of owning different funds. In addition, if these transactional costs were included, your costs would have been higher.
Eaton Vance VT Floating-Rate Income Fund
| | Beginning Account Value | | Ending Account Value | | Expenses Paid During Period* | |
| | (7/1/05) | | (12/31/05) | | (7/1/05 – 12/31/05) | |
| | | | | | | |
Actual | | | | | | | |
| | $ | 1,000.00 | | $ | 1,022.60 | | $ | 6.37 | |
| | | | | | | |
Hypothetical | | | | | | | |
(5% return before expenses) | | | | | | | |
| | $ | 1,000.00 | | $ | 1,018.90 | | $ | 6.36 | |
* Expenses are equal to the Fund’s annualized expense ratio of 1.25%, multiplied by the average account value over the period, multiplied by 184/365 (to reflect the one-half year period). The example assumes that the $1,000 was invested at the net asset value per share determined at the close of business on June 30, 2005. |
4
Eaton Vance VT Floating-Rate Income Fund as of December 31, 2005
PORTFOLIO OF INVESTMENTS
| Senior, Floating Rate Interests — 87.4%(1) | | | |
Principal
Amount | |
Borrower/Tranche Description | |
Value | |
| Aerospace and Defense — 3.0% | | | |
| Delta Air Lines, Inc. | |
| $ | 250,000 | | | Term Loan, 11.01%, Maturing March 27, 2008 | | $ | 259,583 | | |
| Dresser Rand Group, Inc. | | | |
| | 687,639 | | | Term Loan, 6.28%, Maturing October 29, 2011 | | | 699,566 | | |
| DRS Technologies, Inc. | | | |
| | 226,344 | | | Term Loan, 5.94%, Maturing November 4, 2010 | | | 228,466 | | |
| Hexcel Corp. | | | |
| | 452,222 | | | Term Loan, 5.88%, Maturing March 1, 2012 | | | 456,744 | | |
| K&F Industries, Inc. | | | |
| | 395,614 | | | Term Loan, 6.28%, Maturing November 18, 2012 | | | 400,374 | | |
| Mid-Western Aircraft Systems, Inc. | | | |
| | 398,000 | | | Term Loan, 6.78%, Maturing December 31, 2011 | | | 403,929 | | |
| Transdigm, Inc. | | | |
| | 490,000 | | | Term Loan, 6.58%, Maturing July 22, 2010 | | | 496,814 | | |
| | | | | | | $ | 2,945,476 | | |
| Air Transport — 0.3% | | | |
| United Airlines, Inc. | |
| $ | 250,000 | | | DIP Loan, 0.00%, Maturing March 31, 2006(2) | | $ | 251,562 | | |
| | | | | | | $ | 251,562 | | |
| Automotive — 2.6% | | | |
| Accuride Corp. | |
| $ | 385,252 | | | Term Loan, 6.55%, Maturing January 31, 2012 | | $ | 388,904 | | |
| Affina Group, Inc. | |
| | 281,914 | | | Term Loan, 7.10%, Maturing November 30, 2011 | | | 279,870 | | |
| Dayco Products, LLC | |
| | 147,224 | | | Term Loan, 5.94%, Maturing June 23, 2011 | | | 148,604 | | |
| Exide Technologies, Inc. | |
| | 83,895 | | | Term Loan, 9.38%, Maturing May 5, 2010 | | | 84,315 | | |
| | 83,982 | | | Term Loan, 9.38%, Maturing May 5, 2010 | | | 84,402 | | |
| Federal-Mogul Corp. | |
| | 350,000 | | | Term Loan, 8.14%, Maturing December 9, 2006 | | | 350,875 | | |
| TI Automotive, Ltd. | |
| | 69,841 | | | Term Loan, 7.94%, Maturing June 30, 2011 | | | 69,143 | | |
| Trimas Corp. | |
| | 267,439 | | | Term Loan, 8.02%, Maturing December 31, 2009 | | | 270,114 | | |
| TRW Automotive, Inc. | |
| | 148,875 | | | Term Loan, 6.00%, Maturing October 31, 2010 | | | 149,545 | | |
| | 411,969 | | | Term Loan, 5.25%, Maturing June 30, 2012 | | | 414,061 | | |
| United Components, Inc. | |
| | 346,187 | | | Term Loan, 7.28%, Maturing June 30, 2010 | | | 350,947 | | |
| | | | | | | $ | 2,590,780 | | |
Principal
Amount | |
Borrower/Tranche Description | |
Value | |
| Beverage and Tobacco — 1.4% | | | |
| Constellation Brands, Inc. | |
| $ | 313,111 | | | Term Loan, 5.66%, Maturing November 30, 2011 | | $ | 316,927 | | |
| Culligan International Co. | | | |
| | 346,500 | | | Term Loan, 6.87%, Maturing September 30, 2011 | | | 351,264 | | |
| National Dairy Holdings, L.P. | | | |
| | 397,000 | | | Term Loan, 7.39%, Maturing March 15, 2012 | | | 399,233 | | |
| Southern Wine & Spirits of America, Inc. | | | |
| | 338,688 | | | Term Loan, 6.03%, Maturing May 31, 2012 | | | 342,075 | | |
| | | | | | | $ | 1,409,499 | | |
| Building and Development — 5.7% | | | |
| Biomed Realty, L.P. | |
| $ | 295,000 | | | Term Loan, 6.54%, Maturing May 31, 2010 | | $ | 295,737 | | |
| Epco/Fantome, LLC | | | |
| | 250,000 | | | Term Loan, 7.90%, Maturing November 23, 2010 | | | 250,000 | | |
| General Growth Properties, Inc. | | | |
| | 698,961 | | | Term Loan, 6.35%, Maturing November 12, 2008 | | | 704,670 | | |
| Kyle Acquisition Group, LLC | | | |
| | 300,000 | | | Term Loan, 6.50%, Maturing July 20, 2010 | | | 301,687 | | |
| Landsource Communities, LLC | | | |
| | 251,000 | | | Term Loan, 6.88%, Maturing March 31, 2010 | | | 253,745 | | |
| Lion's Gables Realty Limited | | | |
| | 234,342 | | | Term Loan, 6.19%, Maturing September 30, 2006 | | | 235,587 | | |
| LNR Property Corp. | | | |
| | 342,990 | | | Term Loan, 7.27%, Maturing February 3, 2008 | | | 344,812 | | |
| LNR Property Holdings | | | |
| | 75,000 | | | Term Loan, 8.77%, Maturing February 3, 2008 | | | 75,750 | | |
| Mueller Group, Inc. | | | |
| | 249,375 | | | Term Loan, 6.54%, Maturing October 3, 2012 | | | 252,737 | | |
| Newkirk Master, L.P. | | | |
| | 316,514 | | | Term Loan, 6.05%, Maturing August 11, 2008 | | | 319,184 | | |
| Nortek, Inc. | | | |
| | 325,875 | | | Term Loan, 6.95%, Maturing August 27, 2011 | | | 329,174 | | |
| Ply Gem Industries, Inc. | | | |
| | 24,513 | | | Term Loan, 6.16%, Maturing February 12, 2011 | | | 24,666 | | |
| | 141,817 | | | Term Loan, 6.40%, Maturing February 12, 2011 | | | 142,704 | | |
| St. Marys Cement, Inc. | | | |
| | 343,000 | | | Term Loan, 6.53%, Maturing December 4, 2010 | | | 348,359 | | |
| Stile Acquisition Corp. | | | |
| | 327,246 | | | Term Loan, 6.43%, Maturing April 6, 2013 | | | 324,366 | | |
| Stile U.S. Acquisition Corp. | | | |
| | 327,804 | | | Term Loan, 6.43%, Maturing April 6, 2013 | | | 324,918 | | |
| Sugarloaf Mills, L.P. | | | |
| | 400,000 | | | Term Loan, 6.12%, Maturing April 7, 2007 | | | 402,000 | | |
See notes to financial statements
5
Eaton Vance VT Floating-Rate Income Fund as of December 31, 2005
PORTFOLIO OF INVESTMENTS CONT'D
Principal
Amount | |
Borrower/Tranche Description | |
Value | |
| Building and Development (continued) | | | |
| TE / Tousa Senior, LLC | | | |
| $ | 200,000 | | | Term Loan, 7.94%, Maturing July 29, 2008 | | $ | 201,750 | | |
| Tru 2005 Re Holding Co. | | | |
| | 450,000 | | | Term Loan, 7.46%, Maturing December 9, 2008 | | | 449,344 | | |
| | | | | | | $ | 5,581,190 | | |
| Business Equipment and Services — 3.0% | | | |
| Affinion Group, Inc. | |
| $ | 229,535 | | | Term Loan, 7.10%, Maturing October 17, 2012 | | $ | 226,307 | | |
| Buhrmann US, Inc. | |
| | 295,500 | | | Term Loan, 6.20%, Maturing December 31, 2010 | | | 300,056 | | |
| DynCorp International, LLC | |
| | 104,475 | | | Term Loan, 7.13%, Maturing February 11, 2011 | | | 105,084 | | |
| Iron Mountain, Inc. | |
| | 537,052 | | | Term Loan, 6.19%, Maturing April 2, 2011 | | | 542,003 | | |
| | 198,000 | | | Term Loan, 6.71%, Maturing April 2, 2011 | | | 199,609 | | |
| N.E.W. Holdings I, LLC | |
| | 271,296 | | | Term Loan, 6.52%, Maturing July 1, 2011 | | | 275,195 | | |
| Sungard Data Systems, Inc. | |
| | 1,288,525 | | | Term Loan, 6.81%, Maturing February 11, 2013 | | | 1,298,524 | | |
| | | | | | | $ | 2,946,778 | | |
| Cable and Satellite Television — 4.2% | | | |
| Adelphia Communications Corp. | | | |
| $ | 288,471 | | | DIP Loan, 6.31%, Maturing March 31, 2006 | | $ | 289,913 | | |
| Atlantic Broadband Finance, LLC | | | |
| | 350,000 | | | Term Loan, 7.20%, Maturing September 1, 2011 | | | 355,031 | | |
| Bresnan Communications, LLC | | | |
| | 300,000 | | | Term Loan, 7.83%, Maturing March 31, 2010 | | | 303,375 | | |
| Persona Communications | | | |
| | 344,750 | | | Term Loan, 7.53%, Maturing July 30, 2011 | | | 349,706 | | |
| Charter Communications Operating, LLC | | | |
| | 1,034,442 | | | Term Loan, 7.50%, Maturing April 27, 2011 | | | 1,038,362 | | |
| Insight Midwest Holdings, LLC | | | |
| | 343,000 | | | Term Loan, 6.56%, Maturing December 31, 2009 | | | 347,824 | | |
| MCC Iowa, LLC | | | |
| | 308,000 | | | Term Loan, 5.76%, Maturing March 31, 2010 | | | 307,725 | | |
| Mediacom Illinois, LLC | | | |
| | 198,000 | | | Term Loan, 6.57%, Maturing March 31, 2013 | | | 200,908 | | |
| NTL, Inc. | | | |
| | 300,000 | | | Term Loan, 7.14%, Maturing April 13, 2012 | | | 301,525 | | |
| UGS Corp. | | | |
| | 373,177 | | | Term Loan, 7.28%, Maturing March 31, 2012 | | | 378,308 | | |
| UPC Broadband Holdings B.V. | | | |
| | 210,000 | | | Term Loan, 6.80%, Maturing September 30, 2012 | | | 212,156 | | |
| | | | | | | $ | 4,084,833 | | |
Principal
Amount | |
Borrower/Tranche Description | |
Value | |
| Chemicals and Plastics — 5.0% | | | |
| Basell Af S.A.R.L. | |
| $ | 125,000 | | | Term Loan, 6.91%, Maturing August 1, 2013 | | $ | 127,168 | | |
| | 25,000 | | | Term Loan, 6.91%, Maturing August 1, 2013 | | | 25,350 | | |
| | 125,000 | | | Term Loan, 6.82%, Maturing August 1, 2014 | | | 127,168 | | |
| | 25,000 | | | Term Loan, 7.24%, Maturing August 1, 2014 | | | 25,386 | | |
| Brenntag AG | |
| | 250,000 | | | Term Loan, 7.83%, Maturing February 27, 2012 | | | 250,792 | | |
| Celanese Holdings, LLC | |
| | 277,900 | | | Term Loan, 6.53%, Maturing April 6, 2011 | | | 281,061 | | |
| Hercules, Inc. | |
| | 393,748 | | | Term Loan, 5.88%, Maturing October 8, 2010 | | | 398,768 | | |
| Huntsman International, LLC | |
| | 578,413 | | | Term Loan, 6.12%, Maturing August 16, 2012 | | | 582,073 | | |
| Innophos, Inc. | |
| | 284,075 | | | Term Loan, 6.71%, Maturing August 13, 2010 | | | 287,626 | | |
| Invista B.V. | |
| | 98,582 | | | Term Loan, 6.13%, Maturing April 29, 2011 | | | 99,629 | | |
| | 229,409 | | | Term Loan, 6.69%, Maturing April 29, 2011 | | | 231,846 | | |
| Kraton Polymer, LLC | |
| | 255,367 | | | Term Loan, 7.02%, Maturing December 23, 2010 | | | 259,037 | | |
| Mosaic Co. | |
| | 198,500 | | | Term Loan, 5.95%, Maturing February 21, 2012 | | | 200,386 | | |
| Nalco Co. | |
| | 925,338 | | | Term Loan, 6.32%, Maturing November 4, 2010 | | | 938,467 | | |
| PQ Corp. | |
| | 397,995 | | | Term Loan, 5.91%, Maturing February 11, 2012 | | | 402,804 | | |
| Rockwood Specialties Group, Inc. | |
| | 407,950 | | | Term Loan, 6.22%, Maturing December 10, 2012 | | | 412,826 | | |
| Solo Cup Co. | |
| | 297,706 | | | Term Loan, 7.03%, Maturing February 27, 2011 | | | 300,187 | | |
| | | | | | | $ | 4,950,574 | | |
| Conglomerates — 2.7% | | | |
| Amsted Industries, Inc. | |
| $ | 523,785 | | | Term Loan, 6.68%, Maturing October 15, 2010 | | $ | 532,296 | | |
| Goodman Global Holdings, Inc. | |
| | 84,516 | | | Term Loan, 6.38%, Maturing December 23, 2011 | | | 85,801 | | |
| Jarden Corp. | |
| | 114,347 | | | Term Loan, 6.28%, Maturing January 24, 2012 | | | 114,776 | | |
| | 199,102 | | | Term Loan, 6.53%, Maturing January 24, 2012 | | | 200,240 | | |
| Johnson Diversey, Inc. | |
| | 407,452 | | | Term Loan, 6.80%, Maturing December 16, 2011 | | | 411,679 | | |
| Polymer Group, Inc. | |
| | 275,000 | | | Term Loan, 6.77%, Maturing November 22, 2012 | | | 277,922 | | |
| PP Acquisition Corp. | |
| | 332,584 | | | Term Loan, 6.56%, Maturing November 12, 2011 | | | 331,060 | | |
See notes to financial statements
6
Eaton Vance VT Floating-Rate Income Fund as of December 31, 2005
PORTFOLIO OF INVESTMENTS CONT'D
Principal
Amount | |
Borrower/Tranche Description | |
Value | |
| Conglomerates (continued) | | | |
| Rexnord Corp. | |
| $ | 508,773 | | | Term Loan, 6.15%, Maturing December 31, 2011 | | $ | 515,345 | | |
| Roper Industries, Inc. | |
| | 135,455 | | | Term Loan, 5.48%, Maturing December 13, 2009 | | | 135,991 | | |
| | | | | | | $ | 2,605,110 | | |
| Containers and Glass Products — 4.5% | | | |
| Berry Plastics Corp. | |
| $ | 471,678 | | | Term Loan, 6.45%, Maturing December 2, 2011 | | $ | 477,820 | | |
| BWAY Corp. | |
| | 152,059 | | | Term Loan, 6.56%, Maturing June 30, 2011 | | | 153,865 | | |
| Dr. Pepper/Seven Up Bottling Group, Inc. | |
| | 290,102 | | | Term Loan, 6.20%, Maturing December 19, 2010 | | | 294,490 | | |
| Graham Packaging Holdings Co. | |
| | 509,850 | | | Term Loan, 6.48%, Maturing October 7, 2011 | | | 516,422 | | |
| Graphic Packaging International, Inc. | |
| | 482,443 | | | Term Loan, 6.60%, Maturing August 8, 2010 | | | 488,895 | | |
| IPG (US), Inc. | |
| | 345,625 | | | Term Loan, 6.13%, Maturing July 28, 2011 | | | 350,665 | | |
| JSG Acquisitions | |
| | 195,000 | | | Term Loan, 7.11%, Maturing December 31, 2013 | | | 194,902 | | |
| | 195,000 | | | Term Loan, 7.61%, Maturing December 13, 2014 | | | 194,902 | | |
| Kranson Industries, Inc. | |
| | 49,250 | | | Term Loan, 7.28%, Maturing July 30, 2011 | | | 49,866 | | |
| Owens-Illinois, Inc. | |
| | 500,000 | | | Term Loan, 6.10%, Maturing April 1, 2007 | | | 502,708 | | |
| | 91,983 | | | Term Loan, 6.15%, Maturing April 1, 2008 | | | 92,702 | | |
| Pregis Corp. | |
| | 299,250 | | | Term Loan, 6.37%, Maturing October 12, 2011 | | | 301,806 | | |
| Smurfit-Stone Container Corp. | |
| | 42,866 | | | Term Loan, 2.35%, Maturing November 1, 2010 | | | 43,315 | | |
| | 450,544 | | | Term Loan, 6.69%, Maturing November 1, 2011 | | | 455,261 | | |
| | 249,834 | | | Term Loan, 6.69%, Maturing November 1, 2011 | | | 252,450 | | |
| | | | | | | $ | 4,370,069 | | |
| Cosmetics/Toiletries — 0.3% | | | |
| Prestige Brands, Inc. | |
| $ | 294,750 | | | Term Loan, 6.31%, Maturing April 7, 2011 | | $ | 297,820 | | |
| | | | | | | $ | 297,820 | | |
| Drugs — 0.4% | | | |
| Warner Chilcott Corp. | |
| $ | 95,634 | | | Term Loan, 7.28%, Maturing January 18, 2012 | | $ | 95,677 | | |
| | 44,180 | | | Term Loan, 7.28%, Maturing January 18, 2012 | | | 44,200 | | |
Principal
Amount | |
Borrower/Tranche Description | |
Value | |
| Drugs (continued) | | | |
| $ | 237,335 | | | Term Loan, 7.28%, Maturing January 18, 2012 | | $ | 237,441 | | |
| | | | | | | $ | 377,318 | | |
| Ecological Services and Equipment — 0.9% | | | |
| Alderwoods Group, Inc. | |
| $ | 86,789 | | | Term Loan, 6.25%, Maturing September 29, 2009 | | $ | 87,793 | | |
| Allied Waste Industries, Inc. | |
| | 221,984 | | | Term Loan, 6.18%, Maturing January 15, 2012 | | | 223,447 | | |
| | 86,184 | | | Term Loan, 6.59%, Maturing January 15, 2012 | | | 86,747 | | |
| Envirocare of Utah, LLC | |
| | 259,091 | | | Term Loan, 6.95%, Maturing April 15, 2010 | | | 262,707 | | |
| Environmental Systems, Inc. | |
| | 251,845 | | | Term Loan, 5.55%, Maturing December 12, 2008 | | | 256,646 | | |
| | | | | | | $ | 917,340 | | |
| Electronics/Electrical — 2.5% | | | |
| AMI Semiconductor, Inc. | |
| | 248,748 | | | Term Loan, 5.89%, Maturing April 1, 2012 | | $ | 250,406 | | |
| Aspect Software, Inc. | |
| | 250,000 | | | Term Loan, 6.56%, Maturing September 22, 2010 | | | 253,125 | | |
| Avago Technologies Finance PTE | |
| | 250,000 | | | Term Loan, 6.82%, Maturing December 1, 2012 | | | 251,484 | | |
| Fairchild Semiconductor Corp. | |
| | 442,884 | | | Term Loan, 6.31%, Maturing December 31, 2010 | | | 446,205 | | |
| Invensys International Holdings Ltd. | |
| | 197,586 | | | Term Loan, 7.79%, Maturing September 4, 2009 | | | 200,994 | | |
| Rayovac Corp. | |
| | 447,622 | | | Term Loan, 6.44%, Maturing February 7, 2012 | | | 450,887 | | |
| Security Co., Inc. | |
| | 98,501 | | | Term Loan, 9.25%, Maturing June 30, 2010 | | | 99,240 | | |
| Telcordia Technologies, Inc. | |
| | 474,125 | | | Term Loan, 6.64%, Maturing September 15, 2012 | | | 470,273 | | |
| | | | | | | $ | 2,422,614 | | |
| Equipment Leasing — 1.1% | | | |
| Ashtead Group, PLC | |
| $ | 198,000 | | | Term Loan, 6.13%, Maturing November 12, 2009 | | $ | 199,691 | | |
| The Hertz Corp. | |
| | 48,182 | | | Term Loan, 0.00%, Maturing December 21, 2012(2) | | | 48,841 | | |
| | 41,111 | | | Term Loan, 5.88%, Maturing December 21, 2012 | | | 41,673 | | |
| | 280,707 | | | Term Loan, 8.50%, Maturing December 21, 2012 | | | 284,544 | | |
| United Rentals, Inc. | |
| | 91,876 | | | Term Loan, 6.03%, Maturing February 14, 2011 | | | 92,979 | | |
| | 451,342 | | | Term Loan, 6.03%, Maturing February 14, 2011 | | | 456,758 | | |
| | | | | | | $ | 1,124,486 | | |
See notes to financial statements
7
Eaton Vance VT Floating-Rate Income Fund as of December 31, 2005
PORTFOLIO OF INVESTMENTS CONT'D
Principal
Amount | |
Borrower/Tranche Description | |
Value | |
| Farming/Agriculture — 0.4% | | | |
| Central Garden & Pet Co. | |
| $ | 395,965 | | | Term Loan, 5.57%, Maturing May 15, 2009 | | $ | 401,657 | | |
| | | | | | | $ | 401,657 | | |
| Financial Intermediaries — 2.6% | | | |
| AIMCO Properties, L.P. | |
| $ | 125,000 | | | Term Loan, 6.03%, Maturing November 2, 2009 | | $ | 126,758 | | |
| | 600,000 | | | Term Loan, 6.23%, Maturing November 2, 2009 | | | 609,188 | | |
| Corrections Corp. of America | |
| | 496,250 | | | Term Loan, 6.02%, Maturing March 31, 2008 | | | 504,004 | | |
| Fidelity National Information Solutions, Inc. | |
| | 528,000 | | | Term Loan, 6.11%, Maturing March 9, 2013 | | | 530,728 | | |
| Geo Group, Inc. | |
| | 299,250 | | | Term Loan, 5.77%, Maturing September 14, 2011 | | | 301,868 | | |
| The Macerich Partnership, L.P. | |
| | 500,000 | | | Term Loan, 5.81%, Maturing April 25, 2010 | | | 503,229 | | |
| | | | | | | $ | 2,575,775 | | |
| Food Products — 3.0% | | | |
| Acosta, Inc. | |
| $ | 400,000 | | | Term Loan, 6.60%, Maturing December 6, 2012 | | $ | 404,500 | | |
| American Seafoods Group, LLC | |
| | 493,750 | | | Term Loan, 6.28%, Maturing September 30, 2011 | | | 500,848 | | |
| BF Bolthouse Holdco, LLC | |
| | 200,000 | | | Term Loan, 8.75%, Maturing December 16, 2012 | | | 203,208 | | |
| Chiquita Brands, LLC | |
| | 298,500 | | | Term Loan, 6.38%, Maturing June 28, 2012 | | | 301,983 | | |
| Dole Food Company, Inc. | |
| | 177,555 | | | Term Loan, 6.06%, Maturing April 18, 2012 | | | 178,461 | | |
| Michael Foods, Inc. | |
| | 319,463 | | | Term Loan, 6.66%, Maturing November 21, 2010 | | | 323,922 | | |
| Nash-Finch Co. | |
| | 198,843 | | | Term Loan, 6.69%, Maturing November 12, 2010 | | | 200,334 | | |
| Pinnacle Foods Holdings Corp. | |
| | 313,515 | | | Term Loan, 7.32%, Maturing November 25, 2010 | | | 317,982 | | |
| Reddy Ice Group, Inc. | |
| | 500,000 | | | Term Loan, 5.87%, Maturing August 9, 2012 | | | 505,157 | | |
| | | | | | | $ | 2,936,395 | | |
| Food Service — 1.6% | | | |
| AFC Enterprises, Inc. | |
| $ | 258,700 | | | Term Loan, 6.81%, Maturing May 11, 2011 | | $ | 261,934 | | |
| Burger King Corp. | |
| | 298,500 | | | Term Loan, 6.31%, Maturing June 30, 2012 | | | 302,441 | | |
Principal
Amount | |
Borrower/Tranche Description | |
Value | |
| Food Service (continued) | | | |
| Domino's, Inc. | |
| $ | 262,794 | | | Term Loan, 6.06%, Maturing June 25, 2010 | | $ | 266,025 | | |
| Jack in the Box, Inc. | |
| | 343,875 | | | Term Loan, 5.69%, Maturing January 8, 2011 | | | 347,529 | | |
| Weight Watchers International, Inc. | |
| | 343,000 | | | Term Loan, 6.25%, Maturing March 31, 2010 | | | 347,573 | | |
| | | | | | | $ | 1,525,502 | | |
| Food/Drug Retailers — 1.1% | | | |
| General Nutrition Centers, Inc. | |
| $ | 84,358 | | | Term Loan, 7.39%, Maturing December 7, 2009 | | $ | 85,518 | | |
| Giant Eagle, Inc. | |
| | 200,000 | | | Term Loan, 6.35%, Maturing November 7, 2012 | | | 201,063 | | |
| Roundy's, Inc. | |
| | 350,000 | | | Term Loan, 7.33%, Maturing November 3, 2011 | | | 348,425 | | |
| The Jean Coutu Group (PJC), Inc. | |
| | 484,221 | | | Term Loan, 6.50%, Maturing July 30, 2011 | | | 489,433 | | |
| | | | | | | $ | 1,124,439 | | |
| Forest Products — 2.7% | | | |
| Appleton Papers, Inc. | |
| $ | 278,966 | | | Term Loan, 6.58%, Maturing June 11, 2010 | | $ | 281,930 | | |
| Boise Cascade Holdings, LLC | |
| | 388,821 | | | Term Loan, 6.26%, Maturing October 29, 2011 | | | 394,410 | | |
| Buckeye Technologies, Inc. | |
| | 229,243 | | | Term Loan, 6.19%, Maturing March 15, 2008 | | | 231,010 | | |
| NewPage Corp. | |
| | 498,750 | | | Term Loan, 7.56%, Maturing May 2, 2011 | | | 504,984 | | |
| RLC Industries Co. | |
| | 435,909 | | | Term Loan, 6.03%, Maturing February 24, 2010 | | | 438,088 | | |
| Xerium Technologies, Inc. | |
| | 796,000 | | | Term Loan, 6.70%, Maturing November 19, 2011 | | | 801,224 | | |
| | | | | | | $ | 2,651,646 | | |
| Healthcare — 4.6% | | | |
| Colgate Medical, Ltd. | |
| $ | 49,402 | | | Term Loan, 5.68%, Maturing December 30, 2008 | | $ | 49,896 | | |
| Community Health Systems, Inc. | |
| | 438,678 | | | Term Loan, 6.16%, Maturing August 19, 2011 | | | 444,755 | | |
| Concentra Operating Corp. | |
| | 250,000 | | | Term Loan, 6.62%, Maturing September 30, 2011 | | | 253,333 | | |
| Conmed Corp. | |
| | 160,206 | | | Term Loan, 6.62%, Maturing December 31, 2007 | | | 162,209 | | |
See notes to financial statements
8
Eaton Vance VT Floating-Rate Income Fund as of December 31, 2005
PORTFOLIO OF INVESTMENTS CONT'D
Principal
Amount | |
Borrower/Tranche Description | |
Value | |
| Healthcare (continued) | | | |
| Davita, Inc. | |
| $ | 723,188 | | | Term Loan, 6.73%, Maturing October 5, 2012 | | $ | 733,784 | | |
| Encore Medical IHC, Inc. | |
| | 225,901 | | | Term Loan, 7.46%, Maturing October 4, 2010 | | | 228,443 | | |
| Healthsouth Corp. | |
| | 248,750 | | | Term Loan, 6.89%, Maturing June 14, 2007 | | | 250,072 | | |
| Kinetic Concepts, Inc. | |
| | 455,590 | | | Term Loan, 6.28%, Maturing August 11, 2010 | | | 460,336 | | |
| Leiner Health Products, Inc. | |
| | 236,319 | | | Term Loan, 7.70%, Maturing May 27, 2011 | | | 239,347 | | |
| Lifepoint Hospitals, Inc. | |
| | 771,903 | | | Term Loan, 6.19%, Maturing April 15, 2012 | | | 777,370 | | |
| Magellan Health Services, Inc. | |
| | 97,222 | | | Term Loan, 4.19%, Maturing August 15, 2008 | | | 98,316 | | |
| | 121,528 | | | Term Loan, 6.74%, Maturing August 15, 2008 | | | 122,895 | | |
| Select Medical Holding Corp. | |
| | 299,246 | | | Term Loan, 6.12%, Maturing February 24, 2012 | | | 299,724 | | |
| Sybron Dental Management, Inc. | |
| | 100,585 | | | Term Loan, 6.23%, Maturing June 6, 2009 | | | 101,465 | | |
| VWR International, Inc. | |
| | 241,533 | | | Term Loan, 6.69%, Maturing April 7, 2011 | | | 245,232 | | |
| | | | | | | $ | 4,467,177 | | |
| Home Furnishings — 1.2% | | | |
| Knoll, Inc. | |
| $ | 139,650 | | | Term Loan, 6.53%, Maturing October 3, 2012 | | $ | 141,505 | | |
| National Bedding Company, LLC | |
| | 300,000 | | | Term Loan, 6.17%, Maturing August 31, 2011 | | | 302,775 | | |
| Sealy Mattress Co. | |
| | 431,540 | | | Term Loan, 6.13%, Maturing April 6, 2012 | | | 436,732 | | |
| Simmons Co. | |
| | 319,695 | | | Term Loan, 5.87%, Maturing December 19, 2011 | | | 323,341 | | |
| | | | | | | $ | 1,204,353 | | |
| Industrial Equipment — 1.2% | | | |
| Alliance Laundry Holdings, LLC | |
| | 177,000 | | | Term Loan, 5.86%, Maturing January 27, 2012 | | $ | 179,655 | | |
| Douglas Dynamics Holdings, Inc. | |
| | 299,247 | | | Term Loan, 6.28%, Maturing December 16, 2010 | | | 301,491 | | |
| Flowserve Corp. | |
| | 241,042 | | | Term Loan, 6.36%, Maturing August 10, 2012 | | | 244,243 | | |
| MTD Products, Inc. | |
| | 496,222 | | | Term Loan, 6.06%, Maturing June 1, 2010 | | | 500,564 | | |
| | | | | | | $ | 1,225,953 | | |
Principal
Amount | |
Borrower/Tranche Description | |
Value | |
| Insurance — 1.1% | | | |
| Conseco, Inc. | |
| | 280,917 | | | Term Loan, 6.28%, Maturing June 22, 2010 | | $ | 283,258 | | |
| Hilb, Rogal & Hobbs Co. | |
| | 636,448 | | | Term Loan, 5.88%, Maturing June 30, 2007 | | | 644,006 | | |
| U.S.I. Holdings Corp. | |
| | 104,213 | | | Term Loan, 6.80%, Maturing August 11, 2008 | | | 104,668 | | |
| | | | | | | $ | 1,031,932 | | |
| Leisure Goods/Activities/Movies — 3.8% | | | |
| AMF Bowling Worldwide, Inc. | |
| | 202,247 | | | Term Loan, 7.28%, Maturing August 27, 2009 | | $ | 204,080 | | |
| Cinemark, Inc. | |
| | 393,000 | | | Term Loan, 6.53%, Maturing March 31, 2011 | | | 398,207 | | |
| Loews Cineplex Entertainment Corp. | |
| | 448,085 | | | Term Loan, 6.45%, Maturing July 30, 2011 | | | 450,955 | | |
| Metro-Goldwyn-Mayer Holdings, Inc. | |
| | 880,000 | | | Term Loan, 6.78%, Maturing April 8, 2012 | | | 886,900 | | |
| Regal Cinemas Corp. | |
| | 381,061 | | | Term Loan, 6.53%, Maturing November 10, 2010 | | | 385,771 | | |
| Riddell Bell Holdings, Inc. | |
| | 248,115 | | | Term Loan, 7.03%, Maturing September 30, 2011 | | | 252,096 | | |
| Six Flags Theme Parks, Inc. | |
| | 459,901 | | | Term Loan, 6.67%, Maturing June 30, 2009 | | | 465,979 | | |
| Universal City Development Partners, Ltd. | |
| | 346,500 | | | Term Loan, 7.28%, Maturing June 9, 2011 | | | 351,048 | | |
| WMG Acquisition Corp. | |
| | 318,917 | | | Term Loan, 6.41%, Maturing February 28, 2011 | | | 322,676 | | |
| | | | | | | $ | 3,717,712 | | |
| Lodging and Casinos — 3.3% | | | |
| Alliance Gaming Corp. | |
| $ | 313,132 | | | Term Loan, 11.00%, Maturing September 4, 2009 | | $ | 313,670 | | |
| Ameristar Casinos, Inc. | |
| | 250,000 | | | Term Loan, 6.56%, Maturing November 10, 2012 | | | 251,875 | | |
| Boyd Gaming Corp. | |
| | 369,375 | | | Term Loan, 5.86%, Maturing June 30, 2011 | | | 374,108 | | |
| CCM Merger, Inc. | |
| | 199,000 | | | Term Loan, 6.49%, Maturing July 13, 2012 | | | 200,642 | | |
| Globalcash Access, LLC | |
| | 129,740 | | | Term Loan, 6.64%, Maturing March 10, 2010 | | | 131,686 | | |
| Isle of Capri Casinos, Inc. | |
| | 391,050 | | | Term Loan, 6.06%, Maturing February 4, 2011 | | | 395,449 | | |
| Marina District Finance Co., Inc. | |
| | 247,500 | | | Term Loan, 6.14%, Maturing October 20, 2011 | | | 249,408 | | |
See notes to financial statements
9
Eaton Vance VT Floating-Rate Income Fund as of December 31, 2005
PORTFOLIO OF INVESTMENTS CONT'D
Principal
Amount | |
Borrower/Tranche Description | |
Value | |
| Lodging and Casinos (continued) | | | |
| Penn National Gaming, Inc. | |
| $ | 635,408 | | | Term Loan, 6.05%, Maturing October 3, 2012 | | $ | 643,797 | | |
| Resorts International Holdings, LLC | |
| | 288,189 | | | Term Loan, 7.53%, Maturing April 26, 2012 | | | 289,540 | | |
| Venetian Casino Resort, LLC | |
| | 259,679 | | | Term Loan, 6.28%, Maturing June 15, 2011 | | | 261,667 | | |
| | 53,542 | | | Term Loan, 6.78%, Maturing June 15, 2011 | | | 53,952 | | |
| Wynn Las Vegas, LLC | |
| | 100,000 | | | Term Loan, 6.53%, Maturing December 14, 2011 | | | 101,167 | | |
| | | | | | | $ | 3,266,961 | | |
| Nonferrous Metals/Minerals — 1.7% | | | |
| Alpha Natural Resources, LLC | |
| $ | 300,000 | | | Term Loan, 6.32%, Maturing October 26, 2012 | | $ | 302,375 | | |
| Foundation Coal Corp. | |
| | 285,106 | | | Term Loan, 6.35%, Maturing July 30, 2011 | | | 289,898 | | |
| ICG, LLC | |
| | 18,600 | | | Term Loan, 7.13%, Maturing November 5, 2010 | | | 18,693 | | |
| International Mill Service, Inc. | |
| | 248,748 | | | Term Loan, 5.81%, Maturing December 31, 2010 | | | 251,236 | | |
| Murray Energy Corp. | |
| | 347,375 | | | Term Loan, 7.39%, Maturing January 28, 2010 | | | 348,895 | | |
| Novelis, Inc. | |
| | 275,972 | | | Term Loan, 6.01%, Maturing January 6, 2012 | | | 279,249 | | |
| | 159,873 | | | Term Loan, 6.95%, Maturing January 6, 2012 | | | 161,772 | | |
| | | | | | | $ | 1,652,118 | | |
| Oil and Gas — 2.7% | | | |
| Citgo Petroleum Corp. | |
| $ | 500,000 | | | Term Loan, 5.68%, Maturing November 15, 2012 | | $ | 504,219 | | |
| Dresser, Inc. | |
| | 123,780 | | | Term Loan, 6.28%, Maturing March 31, 2007 | | | 125,637 | | |
| El Paso Corp. | |
| | 409,750 | | | Term Loan, 4.00%, Maturing November 23, 2009 | | | 411,600 | | |
| | 260,925 | | | Term Loan, 7.31%, Maturing November 23, 2009 | | | 262,411 | | |
| Epco Holdings, Inc. | |
| | 247,500 | | | Term Loan, 6.52%, Maturing August 18, 2010 | | | 251,270 | | |
| Targa Resources, Inc. | |
| | 175,000 | | | Term Loan, 6.83%, Maturing October 31, 2007 | | | 175,656 | | |
| | 38,226 | | | Term Loan, 4.40%, Maturing October 31, 2012 | | | 38,572 | | |
| | 236,182 | | | Term Loan, 6.64%, Maturing October 31, 2012 | | | 238,323 | | |
| Universal Compression, Inc. | |
| | 297,751 | | | Term Loan, 6.03%, Maturing February 15, 2012 | | | 301,100 | | |
| Williams Production RMT Co. | |
| | 343,000 | | | Term Loan, 6.62%, Maturing May 30, 2008 | | | 346,859 | | |
| | | | | | | $ | 2,655,647 | | |
Principal
Amount | |
Borrower/Tranche Description | |
Value | |
| Publishing — 4.3% | | | |
| American Media Operations, Inc. | |
| $ | 317,952 | | | Term Loan, 6.28%, Maturing April 1, 2007 | | $ | 320,204 | | |
| Dex Media West, LLC | |
| | 117,128 | | | Term Loan, 6.05%, Maturing March 9, 2010 | | | 117,907 | | |
| Endurance Business Media, Inc. | |
| | 160,000 | | | Term Loan, 6.62%, Maturing March 8, 2012 | | | 161,500 | | |
| Herald Media, Inc. | |
| | 296,807 | | | Term Loan, 7.28%, Maturing July 22, 2011 | | | 298,662 | | |
| Journal Register Co. | |
| | 385,000 | | | Term Loan, 5.69%, Maturing August 12, 2012 | | | 387,346 | | |
| Liberty Group Operating, Inc. | |
| | 250,000 | | | Term Loan, 8.25%, Maturing February 28, 2012 | | | 252,422 | | |
| Medianews Group, Inc. | |
| | 407,491 | | | Term Loan, 5.64%, Maturing August 25, 2010 | | | 408,680 | | |
| Merrill Communications, LLC | |
| | 197,547 | | | Term Loan, 6.82%, Maturing July 30, 2009 | | | 199,152 | | |
| Nebraska Book Co., Inc. | |
| | 343,875 | | | Term Loan, 6.52%, Maturing March 4, 2011 | | | 347,314 | | |
| Newspaper Holdings, Inc. | |
| | 300,000 | | | Term Loan, 6.19%, Maturing August 24, 2012 | | | 302,063 | | |
| R.H. Donnelley Corp. | |
| | 12,851 | | | Term Loan, 6.15%, Maturing December 31, 2009 | | | 12,911 | | |
| | 443,868 | | | Term Loan, 6.15%, Maturing June 30, 2011 | | | 446,536 | | |
| Source Media, Inc. | |
| | 91,176 | | | Term Loan, 6.63%, Maturing January 30, 2006 | | | 92,259 | | |
| SP Newsprint Co. | |
| | 87,208 | | | Term Loan, 6.43%, Maturing January 9, 2010 | | | 88,462 | | |
| | 225,556 | | | Term Loan, 6.43%, Maturing January 9, 2010 | | | 228,798 | | |
| Sun Media Corp. | |
| | 315,679 | | | Term Loan, 6.81%, Maturing February 7, 2009 | | | 317,258 | | |
| Xsys US, Inc. | |
| | 132,027 | | | Term Loan, 6.77%, Maturing December 31, 2012 | | | 133,182 | | |
| | 134,855 | | | Term Loan, 7.27%, Maturing December 31, 2013 | | | 136,710 | | |
| | | | | | | $ | 4,251,366 | | |
| Radio and Television — 3.3% | | | |
| Adams Outdoor Advertising, L.P. | |
| $ | 310,265 | | | Term Loan, 6.20%, Maturing November 18, 2012 | | $ | 314,855 | | |
| DirecTV Holdings, LLC | |
| | 340,000 | | | Term Loan, 5.87%, Maturing April 13, 2013 | | | 343,506 | | |
| Emmis Operating Co. | |
| | 200,383 | | | Term Loan, 6.12%, Maturing November 10, 2011 | | | 201,579 | | |
| Entravision Communications Corp. | |
| | 250,000 | | | Term Loan, 5.55%, Maturing September 29, 2013 | | | 251,875 | | |
| Nexstar Broadcasting, Inc. | |
| | 160,137 | | | Term Loan, 6.28%, Maturing October 1, 2012 | | | 161,271 | | |
| | 163,011 | | | Term Loan, 6.28%, Maturing October 1, 2012 | | | 164,166 | | |
See notes to financial statements
10
Eaton Vance VT Floating-Rate Income Fund as of December 31, 2005
PORTFOLIO OF INVESTMENTS CONT'D
Principal
Amount | |
Borrower/Tranche Description | |
Value | |
| Radio and Television (continued) | | | |
| PanAmSat Corp. | |
| $ | 792,989 | | | Term Loan, 6.49%, Maturing August 20, 2011 | | $ | 803,298 | | |
| Rainbow National Services, LLC | |
| | 187,439 | | | Term Loan, 9.02%, Maturing March 31, 2012 | | | 189,149 | | |
| Raycom TV Broadcasting, Inc. | |
| | 360,000 | | | Term Loan, 6.44%, Maturing February 24, 2012 | | | 361,350 | | |
| Spanish Broadcasting System | |
| | 173,688 | | | Term Loan, 6.53%, Maturing June 10, 2012 | | | 176,293 | | |
| Young Broadcasting, Inc. | |
| | 248,750 | | | Term Loan, 6.70%, Maturing November 3, 2012 | | | 250,110 | | |
| | | | | | | $ | 3,217,452 | | |
| Rail Industries — 0.6% | | | |
| Kansas City Southern Industries, Inc. | |
| $ | 344,768 | | | Term Loan, 5.80%, Maturing March 30, 2008 | | $ | 346,779 | | |
| Railamerica, Inc. | |
| | 28,922 | | | Term Loan, 6.69%, Maturing September 29, 2011 | | | 29,386 | | |
| | 244,663 | | | Term Loan, 9.02%, Maturing September 29, 2011 | | | 248,588 | | |
| | | | | | | $ | 624,753 | | |
| Retailers (Except Food and Drug) — 3.1% | | | |
| Advance Stores Company, Inc. | |
| $ | 94,643 | | | Term Loan, 5.89%, Maturing September 30, 2010 | | $ | 95,797 | | |
| | 56,261 | | | Term Loan, 5.91%, Maturing September 30, 2010 | | | 56,823 | | |
| Alimentation Couche-Tard, Inc. | |
| | 309,032 | | | Term Loan, 6.19%, Maturing December 17, 2010 | | | 312,895 | | |
| Coinmach Laundry Corp. | |
| | 375,000 | | | Term Loan, 6.38%, Maturing December 19, 2012(2) | | | 380,625 | | |
| Harbor Freight Tools USA, Inc. | |
| | 228,723 | | | Term Loan, 6.94%, Maturing July 15, 2010 | | | 231,182 | | |
| Josten's Corp. | |
| | 375,402 | | | Term Loan, 6.80%, Maturing October 4, 2010 | | | 380,846 | | |
| Oriental Trading Co., Inc. | |
| | 216,325 | | | Term Loan, 6.81%, Maturing August 4, 2010 | | | 217,677 | | |
| Rent-A-Center, Inc. | |
| | 298,460 | | | Term Loan, 6.27%, Maturing June 30, 2010 | | | 301,818 | | |
| Savers, Inc. | |
| | 249,367 | | | Term Loan, 7.53%, Maturing August 4, 2009 | | | 252,796 | | |
| School Specialty, Inc. | |
| | 550,000 | | | Term Loan, 6.71%, Maturing September 29, 2012 | | | 550,000 | | |
| Travelcenters of America, Inc. | |
| | 300,000 | | | Term Loan, 6.28%, Maturing November 30, 2008 | | | 303,375 | | |
| | | | | | | $ | 3,083,834 | | |
Principal
Amount | |
Borrower/Tranche Description | |
Value | |
| Surface Transport — 0.2% | | | |
| Sirva Worldwide, Inc. | |
| $ | 164,354 | | | Term Loan, 8.16%, Maturing December 1, 2010 | | $ | 157,780 | | |
| | | | | | | $ | 157,780 | | |
| Telecommunications — 4.5% | | | |
| Alaska Communications Systems Holdings, Inc. | |
| $ | 300,000 | | | Term Loan, 6.53%, Maturing February 11, 2012 | | $ | 303,375 | | |
| Cellular South, Inc. | |
| | 249,367 | | | Term Loan, 6.04%, Maturing May 4, 2011 | | | 252,484 | | |
| Centennial Cellular Operating Co., LLC | |
| | 320,833 | | | Term Loan, 6.62%, Maturing February 9, 2011 | | | 325,119 | | |
| Cincinnati Bell, Inc. | |
| | 249,375 | | | Term Loan, 5.90%, Maturing August 31, 2012 | | | 250,934 | | |
| Consolidated Communications, Inc. | |
| | 296,250 | | | Term Loan, 5.93%, Maturing July 27, 2015 | | | 299,213 | | |
| Fairpoint Communications, Inc. | |
| | 340,000 | | | Term Loan, 6.31%, Maturing February 8, 2012 | | | 341,403 | | |
| Hawaiian Telcom Communications, Inc. | |
| | 300,000 | | | Term Loan, 6.78%, Maturing October 31, 2012 | | | 302,063 | | |
| Intelsat, Ltd. | |
| | 596,992 | | | Term Loan, 5.81%, Maturing July 28, 2011 | | | 603,336 | | |
| Iowa Telecommunications Services | |
| | 450,000 | | | Term Loan, 6.13%, Maturing November 23, 2011 | | | 454,711 | | |
| Nextel Partners Operation Corp. | |
| | 340,000 | | | Term Loan, 5.91%, Maturing May 31, 2012 | | | 341,204 | | |
| Qwest Corp. | |
| | 100,000 | | | Term Loan, 9.02%, Maturing June 4, 2007 | | | 102,488 | | |
| Syniverse Holdings, Inc. | |
| | 298,702 | | | Term Loan, 6.28%, Maturing February 15, 2012 | | | 302,809 | | |
| Triton PCS, Inc. | |
| | 322,246 | | | Term Loan, 7.64%, Maturing November 18, 2009 | | | 324,502 | | |
| Valor Telecom Enterprise, LLC | |
| | 203,000 | | | Term Loan, 6.02%, Maturing February 14, 2012 | | | 204,063 | | |
| | | | | | | $ | 4,407,704 | | |
| Utilities — 2.8% | | | |
| Allegheny Energy Supply Co., LLC | |
| $ | 484,812 | | | Term Loan, 5.86%, Maturing March 8, 2011 | | $ | 490,973 | | |
| Cogentrix Delaware Holdings, Inc. | |
| | 261,190 | | | Term Loan, 6.28%, Maturing April 14, 2012 | | | 263,992 | | |
| Covanta Energy Corp. | |
| | 110,569 | | | Term Loan, 6.02%, Maturing June 24, 2012 | | | 112,366 | | |
| | 74,573 | | | Term Loan, 7.51%, Maturing June 24, 2012 | | | 75,785 | | |
See notes to financial statements
11
Eaton Vance VT Floating-Rate Income Fund as of December 31, 2005
PORTFOLIO OF INVESTMENTS CONT'D
Principal
Amount | |
Borrower/Tranche Description | |
Value | |
| Utilities (continued) | | | |
| Energy Transfer Company, L.P. | |
| $ | 248,750 | | | Term Loan, 7.44%, Maturing June 16, 2012 | | $ | 249,714 | | |
| NRG Energy, Inc. | |
| | 177,528 | | | Term Loan, 4.43%, Maturing December 24, 2011 | | | 178,268 | | |
| | 223,536 | | | Term Loan, 6.26%, Maturing December 24, 2011 | | | 224,468 | | |
| Pike Electric, Inc. | |
| | 185,220 | | | Term Loan, 6.13%, Maturing July 1, 2012 | | | 187,535 | | |
| Plains Resources, Inc. | |
| | 299,250 | | | Term Loan, 6.40%, Maturing July 23, 2010 | | | 302,430 | | |
| Reliant Energy, Inc. | |
| | 174,042 | | | Term Loan, 6.09%, Maturing December 22, 2010 | | | 173,825 | | |
| Texas Genco, LLC | |
| | 142,592 | | | Term Loan, 6.37%, Maturing December 14, 2011 | | | 143,060 | | |
| | 344,355 | | | Term Loan, 6.37%, Maturing December 14, 2011 | | | 345,485 | | |
| | | | | | | $ | 2,747,901 | | |
| | Total Senior, Floating Rate Interests
(identified cost $85,311,569) | | | | | $ | 85,803,506 | | |
| Floating Rate Notes — 0.7% | | | |
Principal Amount
(000's omitted) | | Security | | Value | |
| Radio and Television — 0.3% | | | |
| Paxson Communications Corp., Variable Rate | |
| $ | 300 | | | 6.90%, 1/15/10(3) | | $ | 302,250 | | |
| | | | | | | $ | 302,250 | | |
| Telecommunications — 0.4% | | | |
| Qwest Corp., Variable Rate | |
| $ | 300 | | | 7.741%, 6/15/13(3) | | $ | 325,125 | | |
| Rogers Wireless, Inc., Variable Rate | |
| | 93 | | | 7.616%, 12/15/10 | | | 96,487 | | |
| | | | | | | $ | 421,612 | | |
| | Total Floating Rate Notes
(identified cost $693,000) | | | | | $ | 723,862 | | |
| Short-Term Investments — 8.2% | | | |
Principal
Amount | | Maturity
Date | | Borrower | | Rate | | Amount | |
| $ | 1,906,000 | | | 01/04/06 | | Abbey National North
America, LLC | | | 4.33 | % | | $ | 1,905,312 | | |
| | 1,653,000 | | | 01/03/06 | | General Electric
Capital Corp. | | | 4.20 | % | | | 1,652,614 | | |
| | 1,908,000 | | | 01/03/06 | | Investors Bank and Trust
Company, Time Deposit | | | 4.23 | % | | | 1,908,000 | | |
| | 1,039,000 | | | 01/06/06 | | Old Line Funding, LLC | | | 4.35 | % | | | 1,038,372 | | |
| | 1,500,000 | | | 01/03/06 | | Yorktown Capital, LLC | | | 4.35 | % | | | 1,499,638 | | |
Total Short-Term Investments
(at amortized cost) | | $ | 8,003,936 | | |
Total Investments — 96.3%
(identified cost $94,008,505) | | $ | 94,531,304 | | |
Less Unfunded Loan
Commitments — (0.5)% | | $ | (521,866 | ) | |
Net Investments — 95.8%
(identified cost $93,486,639) | | $ | 94,009,438 | | |
| Other Assets, Less Liabilities — 4.2% | | $ | 4,173,761 | | |
| Net Assets — 100.0% | | $ | 98,183,199 | | |
(1) Senior floating-rate interests often require prepayments from excess cash flows or permit the borrower to repay at its election. The degree to which borrowers repay, whether as a contractual requirement or at their election, cannot be predicted with accuracy. As a result, the actual remaining maturity may be substantially less than the stated maturities shown. However, it is anticipated that the senior floating-rate interests will have an expected average life of approximately two to three years. The stated interest rate represents the weighted average interest rate of all contracts within the senior loan facility. Senior Loans typically have rates of interest which are redetermined either daily, monthly, quarterly or semi-annually by reference to a base lending rate, plus a premium. These base lending rates are primarily the London - -Interbank Offered Rate ("LIBOR"), and secondarily the prime rate offered by one or more major United States banks (the "Prime Rate") and the certificate of deposit ("CD") rate or other base lending rates used by commercial lenders.
(2) Unfunded loan commitments. See Note 1E for description.
(3) Security exempt from registration under Rule 144A of the Securities Act of 1933. These securities may be sold in transactions exempt from registration, normally to qualified institutional buyers. At December 31, 2005, the aggregate value of the securities is $627,375 or 0.7% of the Fund's net assets.
See notes to financial statements
12
Eaton Vance VT Floating-Rate Income Fund as of December 31, 2005
FINANCIAL STATEMENTS
Statement of Assets and Liabilities
As of December 31, 2005
| Assets | |
| Investments, at value (identified cost, $93,486,639) | | $ | 94,009,438 | | |
| Cash | | | 1,518,667 | | |
| Receivable for investments sold | | | 29,927 | | |
| Receivable for Fund shares sold | | | 2,403,424 | | |
| Interest receivable | | | 428,659 | | |
| Prepaid expenses | | | 3,507 | | |
| Total assets | | $ | 98,393,622 | | |
| Liabilities | |
| Payable to affiliate for investment advisory fees | | $ | 46,387 | | |
| Dividends payable | | | 24,819 | | |
| Payable to affiliate for administration fees | | | 20,168 | | |
| Payable for Fund shares redeemed | | | 2,245 | | |
| Payable to affiliate for Trustees' fees | | | 1,930 | | |
| Accrued expenses | | | 114,874 | | |
| Total liabilities | | $ | 210,423 | | |
| Net Assets for 9,744,054 shares of beneficial interest outstanding | | $ | 98,183,199 | | |
| Sources of Net Assets | |
| Paid-in capital | | $ | 97,959,801 | | |
| Accumulated net realized loss (computed on the basis of identified cost) | | | (321,514 | ) | |
| Accumulated undistributed net investment income | | | 22,112 | | |
| Net unrealized appreciation (computed on the basis of identified cost) | | | 522,800 | | |
| Total | | $ | 98,183,199 | | |
Net Asset Value, Offering Price and
Redemption Price Per Share | |
| ($98,183,199 ÷ 9,744,054 shares of beneficial interest outstanding) | | $ | 10.08 | | |
Statement of Operations
For the Year Ended
December 31, 2005
| Investment Income | |
| Interest | | $ | 4,668,937 | | |
| Total investment income | | $ | 4,668,937 | | |
| Expenses | |
| Investment adviser fee | | $ | 508,858 | | |
| Administration fee | | | 221,243 | | |
| Trustees' fees and expenses | | | 7,116 | | |
| Service fees | | | 221,243 | | |
| Custodian fee | | | 96,621 | | |
| Legal and accounting services | | | 40,350 | | |
| Transfer and dividend disbursing agent fees | | | 10,902 | | |
| Printing and postage | | | 4,700 | | |
| Registration fees | | | 4,055 | | |
| Miscellaneous | | | 13,852 | | |
| Total expenses | | $ | 1,128,940 | | |
Deduct —
Reduction of custodian fee | | $ | 25,741 | | |
| Total expense reductions | | $ | 25,741 | | |
| Net expenses | | $ | 1,103,199 | | |
| Net investment income | | $ | 3,565,738 | | |
| Realized and Unrealized Gain (Loss) | |
Net realized gain (loss) —
Investment transactions (identified cost basis) | | $ | (233,885 | ) | |
| Net realized loss | | $ | (233,885 | ) | |
Change in unrealized appreciation (depreciation) —
Investments (identified cost basis) | | $ | (9,239 | ) | |
| Net change in unrealized appreciation (depreciation) | | $ | (9,239 | ) | |
| Net realized and unrealized loss | | $ | (243,124 | ) | |
| Net increase in net assets from operations | | $ | 3,322,614 | | |
See notes to financial statements
13
Eaton Vance VT Floating-Rate Income Fund as of December 31, 2005
FINANCIAL STATEMENTS CONT'D
Statements of Changes in Net Assets
Increase (Decrease)
in Net Assets | | Year Ended
December 31, 2005 | | Year Ended
December 31, 2004 | |
From operations —
Net investment income | | $ | 3,565,738 | | | $ | 1,621,678 | | |
Net realized loss from
Investment transactions | | | (233,885 | ) | | | (87,629 | ) | |
Net change in unrealized
appreciation (depreciation)
from investments | | | (9,239 | ) | | | 278,521 | | |
| Net increase in net assets from operations | | $ | 3,322,614 | | | $ | 1,812,570 | | |
Distributions to shareholders —
From net investment income | | $ | (3,564,220 | ) | | $ | (1,622,175 | ) | |
| Total distributions to shareholders | | $ | (3,564,220 | ) | | $ | (1,622,175 | ) | |
Transactions in shares of beneficial interest —
Proceeds from sale of shares | | $ | 37,756,714 | | | $ | 47,887,259 | | |
Net asset value of shares issued to
shareholders in payment of
distributions declared | | | 3,471,078 | | | | 1,622,162 | | |
| Cost of shares redeemed | | | (17,786,686 | ) | | | (20,128,267 | ) | |
Net increase in net assets from
Fund share transactions | | $ | 23,441,106 | | | $ | 29,381,154 | | |
| Net increase in net assets | | $ | 23,199,500 | | | $ | 29,571,549 | | |
| Net Assets | |
| At beginning of year | | $ | 74,983,699 | | | $ | 45,412,150 | | |
| At end of year | | $ | 98,183,199 | | | $ | 74,983,699 | | |
Accumulated
undistributed net
investment income
included in net assets | |
| At end of year | | $ | 22,112 | | | $ | 20,594 | | |
See notes to financial statements
14
Eaton Vance VT Floating-Rate Income Fund as of December 31, 2005
FINANCIAL STATEMENTS CONT'D
Financial Highlights
| | | Year Ended December 31, | |
| | | 2005(1) | | 2004(1) | | 2003 | | 2002(1) | | 2001(1)(2) | |
| Net asset value — Beginning of year | | $ | 10.100 | | | $ | 10.070 | | | $ | 10.000 | | | $ | 10.000 | | | $ | 10.000 | | |
| Income (loss) from operations | |
| Net investment income | | $ | 0.406 | | | $ | 0.257 | | | $ | 0.222 | | | $ | 0.031 | | | $ | 0.129 | | |
| Net realized and unrealized gain (loss) | | | (0.024 | ) | | | 0.026 | | | | 0.070 | | | | — | | | | — | | |
| Total income from operations | | $ | 0.382 | | | $ | 0.283 | | | $ | 0.292 | | | $ | 0.031 | | | $ | 0.129 | | |
| Less distributions | |
| From net investment income | | $ | (0.402 | ) | | $ | (0.253 | ) | | $ | (0.222 | ) | | $ | (0.031 | ) | | $ | (0.129 | ) | |
| Total distributions | | $ | (0.402 | ) | | $ | (0.253 | ) | | $ | (0.222 | ) | | $ | (0.031 | ) | | $ | (0.129 | ) | |
| Net asset value — End of year | | $ | 10.080 | | | $ | 10.100 | | | $ | 10.070 | | | $ | 10.000 | | | $ | 10.000 | | |
| Total Return(3) | | | 3.86 | % | | | 2.82 | % | | | 2.93 | % | | | 0.31 | % | | | 1.29 | % | |
| Ratios/Supplemental Data† | |
| Net assets, end of year (000's omitted) | | $ | 98,183 | | | $ | 74,984 | | | $ | 45,412 | | | $ | 36,552 | | | $ | 15,789 | | |
| Ratios (As a percentage of average daily net assets): | |
| Net expenses | | | 1.27 | % | | | 1.27 | % | | | 1.36 | % | | | 1.47 | % | | | 1.26 | %(4) | |
| Net expenses after custodian fee reduction | | | 1.25 | % | | | 1.26 | % | | | 1.36 | % | | | 1.47 | % | | | 1.26 | %(4) | |
| Net investment income | | | 4.03 | % | | | 2.55 | % | | | 2.18 | % | | | 0.31 | % | | | 1.37 | %(4) | |
| Portfolio Turnover | | | 60 | % | | | 61 | % | | | 65 | % | | | 0 | % | | | — | | |
† The operating expenses of the Fund reflect a reduction of the investment advisor fee. Had such action not been taken, the ratios and net investment gain per share would have been as follows:
| Ratios (As a percentage of average daily net assets): | |
| Expenses | | | 1.28 | %(4) | |
| Expenses after custodian fee reduction | | | 1.28 | %(4) | |
| Net investment income | | | 1.35 | %(4) | |
| Net investment income per share | | $ | 0.127 | | |
(1) Net investment income per share was computed using average shares outstanding.
(2) For the period from the start of business, May 2, 2001, to December 31, 2001.
(3) Returns are historical and are calculated by determining the percentage change in net asset value with all distributions reinvested. Total return is not computed on an annualized basis.
(4) Annualized.
See notes to financial statements
15
Eaton Vance VT Floating-Rate Income Fund as of December 31, 2005
NOTES TO FINANCIAL STATEMENT
1 Significant Accounting Policies
Eaton Vance VT Floating-Rate Income Fund (the Fund) is a non-diversified series of Eaton Vance Variable Trust (the Trust). The Trust, which was organized under Massachusetts law on August 14, 2000, is an entity of the type commonly known as a Massachusetts business trust and is registered under the Investment Company Act of 1940, as amended, as an open-end management investment company. The Fund seeks to provide a high level of current income by investing primarily in income producing floating rate loans. The Fund is made available only to separate accounts issued by participating insurance companies. The following is a summary of significant accounting policies consistently followed by the Fund in the preparation of its financial statements. The policies are in conformity with accounting principles generally accepted in the United States of America.
A Investment Valuations — Certain Senior Loans are deemed to be liquid because reliable market quotations are readily available for them. Liquid Senior Loans are valued on the basis of prices furnished by a pricing service. Other Senior Loans are valued at fair value by the Fund's investment adviser, Eaton Vance Management (EVM), under procedures approved by the Trustees. In connection with determining the fair value of a Senior Loan, the investment adviser makes an assessment of the likelihood that the borrower will make a full repayment of the Senior Loan. The primary factors considered by the investment adviser when making this assessment are (i) the creditworthiness of the borrower, (ii) the value of the collateral backing the Senior Loan, and (iii) the priority of th e Senior Loan versus other creditors of the borrower. If, based on its assessment, the investment adviser believes there is a reasonable likelihood that the borrower will make a full repayment of the Senior Loan, the investment adviser will determine the fair value of the Senior Loan using a matrix pricing approach that considers the yield on the Senior Loan relative to yields on other loan interests issued by companies of comparable credit quality. If, based on its assessment, the investment adviser believes there is not a reasonable likelihood that the borrower will make a full repayment of the Senior Loan, the investment adviser will determine the fair value of the Senior Loan using analyses that include, but are not limited to (i) a comparison of the value of the borrower's outstanding equity and debt to that of comparable public companies; (ii) a discounted cash flow analysis; or (iii) when the investment adviser believes it is likely that a borrower will be liquidated or sold, an analysis of the terms of such liquidation or sale. In certain cases, the investment adviser will use a combination of analytical methods to determine fair value, such as when only a portion of a borrower's assets are likely to be sold. In conducting its assessment and analyses for purposes of determining fair value of a Senior Loan, the investment adviser will use its discretion and judgment in considering and appraising such factors, data and information and the relative weight to be given thereto as it deems relevant, including without limitation, some or all of the following: (i) the fundamental characteristics of and fundamental analytical data relating to the Senior Loan, including the cost, size, current interest rate, maturity and base lending rate of the Senior Loan, the terms and conditions of the Senior Loan and any related agreements, and the position of the Senior Loan in the Borrower's debt structure; (ii) the nature, adequacy and value of the co llateral securing the Senior Loan, including the Fund's rights, remedies and interests with respect to the collateral; (iii) the creditworthiness of the Borrower, based on an evaluation of, among other things, its financial condition, financial statements and information about the Borrower's business, cash flows, capital structure and future prospects; (iv) information relating to the market for the Senior Loan, including price quotations for and trading in the Senior Loan and interests in similar Senior Loans and the market environment and investor attitudes towards the Senior Loan and interests in similar Senior Loans; (v) the experience, reputation, stability and financial condition of the agent and any intermediate participants in the Senior Loan; and (vi) general economic and market conditions affecting the fair value of the Senior Loan.
Debt obligations (other than short-term obligations maturing in sixty days or less), including listed securities and securities for which price quotations are available and forward contracts, will normally be valued on the basis of market valuations furnished by dealers or pricing services. Financial futures contracts listed on commodity exchanges and exchange-traded options are valued at closing settlement prices. Over-the-counter options are valued at the mean between the bid and asked prices provided by dealers. Marketable securities listed on the NASDAQ National Market System are valued at the NASDAQ official closing price. The value of interest rate swaps will be based upon a dealer quotation. Short-term obligations and money market securities maturing in sixty days or less are valued at amortized cost which approximates value. Investments for which reliable market quotations are unavailable are valued at fair value using m ethods determined in good faith by or at the direction of the Trustees of the Fund. Occasionally, events affecting the value of foreign securities may occur between the time trading is completed abroad and the close of the Exchange which will not be reflected in the computation of the
16
Eaton Vance VT Floating-Rate Income Fund as of December 31, 2005
NOTES TO FINANCIAL STATEMENT CONT'D
Fund's net asset value (unless the Fund deems that such event would materially affect its net asset value in which case an adjustment would be made and reflected in such computation). The Fund may rely on an independent fair valuation service in making any such adjustment.
B Income — Interest income from Senior Loans is recorded on the accrual basis at the then-current interest rate, while all other interest income is determined on the basis of interest accrued, adjusted for amortization of premium or discount. Facility fees received are recognized as income over the expected term of the loan.
C Income Taxes — The Fund has elected to be treated as a regulated investment company (RIC) for United States federal tax purposes. The Fund's policy is to comply with the provisions of Section 817-(h) of the Internal Revenue Code regarding Variable Trusts. No provision is made by the Fund for federal or state taxes on any taxable income of the Fund because each separate account in the Fund is ultimately responsible for the payment of any taxes. The Fund will distribute at least annually all of the Fund's net investment income and net realized capital gains, if any. At December 31, 2005, the Fund, for federal income tax purposes, had a capital loss carryover of $296,534, which will reduce the Fund's taxable income arising from future net realized gains on investments, if any, to the extent permitted by the Internal Revenue Code and thus will reduce the amount of distributions to shareholders which would otherwise be necessary to relieve the Fund of any liability for federal income tax. Such capital loss carryover expires on December 31, 2012, $48,462 and December 31, 2013, $248,072. Additionally, at December 31, 2005, the Fund had a net capital loss of $24,980 attributable to security transactions incurred after October 31, 2005. This capital loss is treated as arising on the first day of the Fund's taxable year ending December 31, 2006.
D Expense Reduction — Investors Bank & Trust Company (IBT) serves as custodian to the Fund. Pursuant to the custodian agreement, IBT receives a fee reduced by credits which are determined based on the average daily cash balance the Fund maintains with IBT. All credit balances used to reduce the Fund's custodian fees are reported as a reduction of total expenses in the Statement of Operations.
E Unfunded Loan Commitments — The Fund may enter into certain credit agreements all or a portion of which may be unfunded. The Fund is obligated to fund these loan commitments at the borrower's discretion. These commitments are disclosed in the accompanying Portfolio of Investments.
F Use of Estimates — The preparation of financial statements in conformity with accounting principles generally accepted in the United States of America requires management to make estimates and assumptions that affect the reported amounts of assets and liabilities at the date of the financial statements and the reported amounts of income and expense during the reporting period. Actual results could differ from those estimates.
G Indemnifications — Under the Trust's organizational documents, its officers and Trustees may be indemnified against certain liabilities and expenses arising out of the performance of their duties to the Fund and shareholders and indemnified against personal liability for the obligations of the Trust. Additionally, in the normal course of business, the Fund enters into agreements with service providers that may contain indemnification clauses. The Fund's maximum exposure under these arrangements is unknown as this would involve future claims that may be made against the Fund that have not yet occurred.
H Expenses — The majority of expenses of the Trust are directly identifiable to an individual fund. Expenses which are not readily identifiable to a specific fund are allocated taking into consideration, among other things, the nature and type of expense and the relative size of the funds.
I Other — Investment transactions are accounted for on a trade date basis.
2 Distributions to Shareholders
The net income of the Fund is determined daily and substantially all of the net income so determined is declared as a dividend to shareholders of record at the time of declaration. Distributions of net income are paid monthly. Distributions are paid in the form of additional shares unless an election is made on behalf of a separate account to receive some or all of the distribution in cash.
The Fund distinguishes between distributions on a tax basis and a financial reporting basis. Accounting principles generally accepted in the United States of America require that only distributions in excess of tax basis earnings and profits be reported in the financial statements as a return of capital. Differences in the recognition or classification of income between the financial statements and tax earnings and profits which result in temporary over distributions for
17
Eaton Vance VT Floating-Rate Income Fund as of December 31, 2005
NOTES TO FINANCIAL STATEMENT CONT'D
financial statement purposes are classified as distributions in excess of net investment income or accumulated net realized gains. Permanent differences between book and tax accounting relating to distributions are reclassified to paid-in capital.
The tax character of distributions paid for the years ended December 31, 2004 and December 31, 2005 was as follows:
| | | Year Ended December 31, | |
| | | 2005 | | 2004 | |
| Distributions declared from: | |
| Ordinary income | | $ | 3,564,220 | | | $ | 1,622,175 | | |
As of December 31, 2005, the components of distributable earnings (accumulated losses) on a tax basis were as follows:
| Undistributed income | | $ | 46,931 | | |
| Capital loss carryforwards | | $ | (296,534 | ) | |
| Unrealized Appreciation | | $ | 522,800 | | |
| Other temporary differences | | $ | (49,799 | ) | |
3 Shares of Beneficial Interest
The Trust has an underwriting agreement relating to the Fund with Eaton Vance Distributors, Inc. (EVD). The underwriting agreement presently provides that EVD, through the Fund's transfer agent, accepts orders for shares at net asset value and no sales commission or load is charged. EVD may, at its expense, provide promotional incentives to dealers that sell variable insurance products. The Fund's Declaration of Trust permits the Trustees to issue an unlimited number of full and fractional shares of beneficial interest (without par value). At December 31, 2005, separate accounts of two insurance companies each owned more than 10% of the Fund's shares outstanding aggregating 99% of the Fund's shares outstanding. Transactions in Fund shares were as follows:
| | | Year Ended December 31, | |
| | | 2005 | | 2004 | |
| Sales | | | 3,739,600 | | | | 4,745,774 | | |
Issued to shareholders electing to
receive payments of distributions in
Fund shares | | | 343,954 | | | | 160,700 | | |
| Redemptions | | | (1,762,104 | ) | | | (1,994,161 | ) | |
| Net increase | | | 2,321,450 | | | | 2,912,313 | | |
4 Investment Adviser Fee and Other Transactions with Affiliates
The investment adviser fee, computed at the monthly rate of 0.575% per annum of the average daily net assets up to $1 billion, and at reduced rates as daily net assets exceed that level, was earned by Eaton Vance Management (EVM) as compensation for management and investment advisory services rendered to the Fund. For the year ended December 31, 2005, the fee amounted to $508,858. Except as to Trustees of the Fund who are not members of EVM's organization, officers and Trustees receive remuneration for their services to the Fund out of such investment adviser fee.
The Fund is authorized to pay EVM a fee as compensation for administrative services necessary to conduct the Fund's business. The fee is computed at the annual rate of 0.25% of the Fund's average daily net assets. For the year ended December 31, 2005, the fee amounted to $221,243.
Certain officers and Trustees of the Fund are officers of the above organizations.
5 Service Fees
The Fund has adopted a service plan that allows the Fund to pay service fees to insurance companies for providing personal and/or account services to account holders of insurance product separate accounts, which will be equal to 0.25% (annualized) of daily average net assets. Service fee payments for the year ended December 31, 2005 amounted to $221,243.
6 Purchases and Sales of Investments
The Fund invests primarily in Senior Loans. The ability of the issuers of the Senior Loans to meet their obligations may be affected by economic developments in a specific industry. The cost of purchases and the proceeds from principal repayments of Senior Loans for the year ended December 31, 2005 aggregated $62,906,505 and $46,730,462, respectively.
7 Line of Credit
The Fund participates with other portfolios and funds managed by EVM and affiliates in a $500 million unsecured line of credit with a group of banks. Borrowings will be made by the Fund solely to facilitate the handling of unusual and/or unanticipated short-term cash requirements. Interest is charged to each participating portfolio or fund based on its borrowings at the bank's base rate or at an amount above LIBOR. In addition, a fee
18
Eaton Vance VT Floating-Rate Income Fund as of December 31, 2005
NOTES TO FINANCIAL STATEMENT CONT'D
computed at an annual rate of 0.09% on the daily unused portion of the line of credit is allocated among the participating portfolios and funds at the end of each quarter. The Fund did not have any borrowings or allocated fees during the year ended December 31, 2005.
8 Federal Income Tax Basis of Unrealized Appreciation (Depreciation)
The cost and unrealized appreciation (depreciation) in the value of the investments owned at December 31, 2005, as computed on a federal income tax basis, were as follows:
| Aggregate cost | | $ | 93,486,639 | | |
| Gross unrealized appreciation | | $ | 572,141 | | |
| Gross unrealized depreciation | | | (49,341 | ) | |
| Net unrealized appreciation | | $ | 522,800 | | |
19
Eaton Vance VT Floating-Rate Income Fund as of December 31, 2005
REPORT OF INDEPENDENT REGISTERED PUBLIC ACCOUNTING FIRM
To the Trustees of Eaton Vance Variable Trust and Shareholders of Eaton Vance VT Floating-Rate Income Fund:
We have audited the accompanying statement of assets and liabilities, of Eaton Vance VT Floating-Rate Income Fund (the Fund), one of the series constituting Eaton Vance Variable Trust, including the portfolio of investments as of December 31, 2005, and the related statement of operations for the year then ended, the statements of changes in net assets for the two years then ended and the financial highlights for the four years ended December 31, 2005 and for the period from the start of business, May 2, 2001, to December 31, 2001. These financial statements and financial highlights are the responsibility of the Fund's management. Our responsibility is to express an opinion on these financial statements and financial highlights based on our audits.
We conducted our audits in accordance with the standards of the Public Company Accounting Oversight Board (United States). Those standards require that we plan and perform the audit to obtain reasonable assurance about whether the financial statements and supplementary data are free of material misstatement. The Fund is not required to have, nor were we engaged to perform, an audit of its internal control over financial reporting. Our audits included consideration of internal control over financial reporting as a basis for designing audit procedures that are appropriate in the circumstances, but not for the purpose of expressing an opinion on the effectiveness of the Fund's internal control over financial reporting. Accordingly, we express no such opinion. An audit also includes examining, on a test basis, evidence supporting the amounts and disclosures in the financial statements, assessing the accounting principles used and si gnificant estimates made by management, as well as evaluating the overall financial statement presentation. Our procedures included confirmation of securities and Senior Loans owned as of December 31, 2005, by correspondence with the custodian and selling or agent banks; where replies were not received from selling or agent banks, we performed other auditing procedures. We believe that our audits provide a reasonable basis for our opinion.
In our opinion, such financial statements and financial highlights present fairly, in all material respects, the financial position of the Eaton Vance VT Floating-Rate Income Fund at December 31, 2005, the results of its operations for the year then ended, the changes in its net assets and the financial highlights for the four years ended December 31, 2005 and for the period from the start of business, May 2, 2001, to December 31, 2001 in conformity with accounting principles generally accepted in the United States of America.
DELOITTE & TOUCHE LLP
Boston, Massachusetts
February 13, 2006
20
Eaton Vance VT Floating-Rate Income Fund
BOARD OF TRUSTEES' ANNUAL APPROVAL OF THE INVESTMENT ADVISORY AGREEMENT
The investment advisory agreement between Eaton Vance VT Floating-Rate Income Fund (the "Fund") and its investment adviser, Eaton Vance Management ("Eaton Vance"), provides that the agreement will continue in effect from year to year so long as its continuance is approved at least annually (i) by a vote of a majority of the noninterested Trustees of the Fund cast in person at a meeting called for the purpose of voting on such approval and (ii) by the Trustees of the Fund or by vote of a majority of the outstanding interests of the Fund.
In considering the annual approval of the investment advisory agreement between the Fund and the investment adviser, the Special Committee of the Board of Trustees considered information that had been provided throughout the year at regular Board meetings, as well as information furnished to the Special Committee for a series of meetings held in February and March in preparation for a Board meeting held on March 21, 2005 to specifically consider the renewal of the investment advisory agreement. Such information included, among other things, the following:
• An independent report comparing the Fund's advisory fees with those of comparable funds;
• An independent report comparing the Fund's expense ratio to those of comparable funds;
• Information regarding the Fund's investment performance in comparison to a relevant peer group of funds and appropriate indices;
• The economic outlook and the general investment outlook in relevant investment markets;
• The investment adviser's results and financial condition and the overall organization of the investment adviser;
• The procedures and processes used to determine the fair value of Fund assets (including the valuation of senior loan portfolios) and actions taken to monitor and test the effectiveness of such procedures and processes;
• The investment adviser's management of the relationship with the custodian, subcustodians and fund accountants;
• The resources devoted to compliance efforts undertaken by Eaton Vance on behalf of the funds it manages and the record of compliance with the investment policies and restrictions and with policies on personal securities transactions;
• The quality, nature, cost and character of the administrative and other non-investment management services provided by Eaton Vance and its affiliates; and
• The terms of the advisory agreement and the reasonableness and appropriateness of the particular fee paid by the Fund for the services describe herein.
The Special Committee also considered the investment adviser's portfolio management capabilities, including information relating to the education, experience, and number of investment professionals and other personnel who provide services under the investment advisory agreement. The Special Committee considered the investment adviser's experience in managing senior loan portfolios. The Special Committee noted the experience of the 26 bank loan investment professionals and other personnel who would provide services under the Fund investment advisory agreement, including 4 portfolio managers and 15 analysts. Many of these portfolio managers and analysts have previous experience working for commercial banks and other lending institutions. The Special Committee evaluated the level of skill required to manage the Fund and concluded that the human resources available at the investment adviser were appropriate to fulfill effectively it s duties on behalf of the Fund.
In its review of information with respect to the Fund's investment performance, the Special Committee concluded that the performance of the Fund was within a range that the Special Committee determined was competitive on a risk-adjusted basis. With respect to its review of investment advisory fees, the Special
21
Eaton Vance VT Floating-Rate Income Fund
BOARD OF TRUSTEES' ANNUAL APPROVAL OF THE INVESTMENT ADVISORY AGREEMENT CONT'D
Committee concluded that such fees are within the range of those paid by comparable funds within the variable insurance product sector. In reviewing the information regarding the expense ratio of the Fund, the Special Committee concluded that, in light of the size of the Fund and the specialized investment profile of the Fund, the expense ratio of the Fund is reasonable.
In addition to the factors mentioned above, the Special Committee reviewed the profits of Eaton Vance and it affiliates in providing investment management services for the Fund and for all Eaton Vance funds as a group. The Special Committee also reviewed the level of profits of Eaton Vance and its affiliates for providing administration services for the Fund and for all Eaton Vance funds as a group. In addition, the Special Committee considered the fiduciary duty assumed by the investment adviser in connection with the services rendered to the Fund and the business reputation of the investment adviser and their financial resources. The Trustees concluded that, in light of the services rendered, the profits realized by the investment adviser are not unreasonable. The Special Committee also considered the extent to which the investment adviser of the Fund appears to be realizing benefits from economies of scale in managing the Fun d, and concluded that the fee breakpoints which are in place will allow for an equitable sharing of such benefits, when realized, with the shareholders of the Fund.
The Special Committee did not consider any single factor as controlling in determining whether or not to renew the investment advisory agreement. Nor are the items described herein all the matters considered by the Special Committee. In assessing the information provided by Eaton Vance and its affiliates, the Special Committee also took into consideration the benefits to shareholders of investing in a fund that is a part of a large family of funds which provides a large variety of shareholder services.
Based on its consideration of the foregoing factors and conclusions, and such other factors and conclusions as it deemed relevant, and assisted by independent counsel, the Special Committee concluded that the approval of the investment advisory agreement, including the fee structure, is in the interests of shareholders.
22
Eaton Vance VT Floating-Rate Income Fund
MANAGEMENT AND ORGANIZATION
Fund Management. The Trustees of Eaton Vance Variable Trust (the Trust) are responsible for the overall management and supervision of the Trust's affairs. The Trustees and officers of the Trust are listed below. Except as indicated, each individual has held the office shown or other offices in the same company for the last five years. Trustees and officers of the Trust hold indefinite terms of office. The "noninterested Trustees" consist of those Trustees who are not "interested persons" of the Trust, as that term is defined under the 1940 Act. The business address of each Trustee and officer is The Eaton Vance Building, 255 State Street, Boston, Massachusetts 02109. As used below, "EVC" refers to Eaton Vance Corp., "EV" refers to Eaton Vance, Inc., "EVM" refers to Eaton Vance Management, "BMR" refers to Boston Management and Research, "EVD" refers to Eaton Vance Distributors, Inc., and "Lloyd George" refers to Lloyd George Investment Management (Bermuda) Limited. EVC and EV are the corporate parent and trustee, respectively, of EVM and BMR. EVD is the Fund's principal underwriter and a wholly-owned subsidiary of EVM. Each officer affiliated with Eaton Vance may hold a position with other Eaton Vance affiliates that is comparable to his or her position with EVM listed below.
Name and
Date of Birth | | Position
with the
Trust | | Term of
Office and
Length of
Service | | Principal Occupation(s)
During Past Five Years | | Number of Portfolios
in Fund Complex
Overseen By
Trustee(1) | | Other Directorships Held | |
| Interested Trustee | |
|
| James B. Hawkes 11/9/41 | | Trustee and President | | Since 2000 | | Chairman, President and Chief Executive Officer of BMR, EVM and EV; Chairman and Chief Exectuive Officer of EVC; Director of EV; Vice President and Director of EVD. Trustee and/or officer of 161 registered investment companies in the Eaton Vance Fund Complex. Mr. Hawkes is an interested person because of his positions with BMR, EVM, EVC and EV, which are affiliates of the Trust. | | | 161 | | | Director of EVC | |
|
| Noninterested Trustee(s) | |
|
| Benjamin C. Esty 1/2/63 | | Trustee | | Since 2005 | | Roy and Elizabeth Simmons Professor of Business Administration, Harvard University Graduate School of Business Administration (since 2003). Formerly, Associate Professor, Harvard University Graduate School of Business Administration (2000-2003). | | | 152 | | | None | |
|
| Samuel L. Hayes, III 2/23/35 | | Trustee and Chairman of the Board | | Trustee since 2000 and Chairman of the Board since 2005 | | Jacob H. Schiff Professor of Investment Banking Emeritus, Harvard University Graduate School of Business Administration. Director of Yakima Products, Inc. (manufacturer of automotive accessories) (since 2001) and Director of Telect, Inc. (telecommunications services company) (since 2000). | | | 161 | | | Director of Tiffany & Co. (specialty retailer) | |
|
| William H. Park 9/19/47 | | Trustee | | Since 2003 | | Vice Chairman, Commercial Industrial Finance Corp. (specialty finance company) (since 2005). Formerly, President and Chief Executive Officer, Prizm Capital Management, LLC (investment management firm) (2002-2005). Formerly, Executive Vice President and Chief Financial Officer, United Asset Management Corporation (a holding company owning institutional investment management firms) (1982-2001). | | | 161 | | | None | |
|
| Ronald A. Pearlman 7/10/40 | | Trustee | | Since 2003 | | Professor of Law, Georgetown University Law Center (since 1999). Formerly, Tax Partner, Covington & Burling, Washington, DC (1991-2000). | | | 161 | | | None | |
|
23
Eaton Vance VT Floating-Rate Income Fund
MANAGEMENT AND ORGANIZATION CONT'D
Name and
Date of Birth | | Position
with the
Trust | | Term of
Office and
Length of
Service | | Principal Occupation(s)
During Past Five Years | | Number of Portfolios
in Fund Complex
Overseen By
Trustee(1) | | Other Directorships Held | |
| Noninterested Trustee(s) (continued) | |
|
| Norton H. Reamer 9/21/35 | | Trustee | | Since 2000 | | President, Chief Executive Officer and a Director of Asset Management Finance Corp. (a specialty finance company serving the investment management industry) (since October 2003). President, Unicorn Corporation (an investment and financial advisory services company) (since September 2000). Formerly, Chairman, Hellman, Jordan Management Co., Inc. (an investment management company) (2000-2003). Formerly, Advisory Director of Berkshire Capital Corporation (investment banking firm) (2002-2003). Formerly Chairman of the Board, United Asset Management Corporation (a holding company owning institutional investment management firms) and Chairman, President and Director, UAM Funds (mutual funds) (1980-2000). | | | 161 | | | None | |
|
| Lynn A. Stout 9/14/57 | | Trustee | | Since 2000 | | Professor of Law, University of California at Los Angeles School of Law (since July 2001). Formerly, Professor of Law, Georgetown University Law Center. | | | 161 | | | None | |
|
| Ralph F. Verni 1/26/43 | | Trustee | | Since 2005 | | Consultant and private investor (since 2000). Formerly, President and Chief Executive Officer, Redwood Investment Systems, Inc. (software developer) (2000). Formerly, President and Chief Executive Officer, State Street Research & Management (investment advisor), SSRM Holdings (parent of State Street Research & Management), and SSR Realty (institutional realty manager) (1992-2000). | | | 152 | | | Director of W.P. Carey & Company LLC (manager of real estate investment trusts) | |
|
| Principal Officers who are not Trustees | |
|
Name and
Date of Birth | | Position
with the
Trust | | Term of
Office and
Length of
Service | | Principal Occupation(s)
During Past Five Years | |
| Samuel D. Isaly 3/12/45 | | Vice President | | Since 2000 | | Managing Partner of OrbiMed Advisors LLC. Officer of 3 registered investment companies managed by EVM or BMR. | |
|
| Scott H. Page 11/30/59 | | Vice President | | Since 2000 | | Vice President of EVM and BMR. Officer of 14 registered investment companies managed by EVM or BMR. | |
|
| Duncan W. Richardson 10/26/57 | | Vice President | | Since 2000 | | Senior Vice President and Chief Equity Investment Officer of EVM and BMR and Executive Vice President of EVC. Officer of 51 registered investment companies managed by EVM or BMR. | |
|
| Payson F. Swaffield 8/13/56 | | Vice President | | Since 2000 | | Vice President of EVM and BMR. Officer of 14 registered investment companies managed by EVM or BMR. | |
|
| Barbara E. Campbell 6/19/57 | | Treasurer | | Since 2005(2) | | Vice President of EVM and BMR. Officer of 161 registered investment companies managed by EVM or BMR. | |
|
| Alan R. Dynner 10/10/40 | | Secretary | | Since 2000 | | Vice President, Secretary and Chief Legal Officer of BMR, EVM, EVD, EV and EVC. Officer of 161 registered investment companies managed by EVM or BMR. | |
|
| Paul M. O'Neil 7/11/53 | | Chief Compliance
Officer | | Since 2004 | | Vice President of EVM and BMR. Officer of 161 registered investment companies managed by EVM or BMR. | |
|
(1) Includes both master and feeder funds in a master-feeder structure.
(2) Prior to 2005, Ms. Campbell served as Assistant Treasurer of the Trust since 2000.
The SAI for the Fund includes additional information about the Trustees and officers of the Fund and can be obtained without charge by calling 1-800-225-6265.
24
This Page Intentionally Left Blank
This Page Intentionally Left Blank
This Page Intentionally Left Blank
Investment Adviser and Administrator of Eaton Vance VT Floating-Rate Income Fund
Eaton Vance Management
The Eaton Vance Building
255 State Street
Boston, MA 02109
Principal Underwriter
Eaton Vance Distributors, Inc.
The Eaton Vance Building
255 State Street
Boston, MA 02109
(617) 482-8260
Custodian
Investors Bank & Trust Company
200 Clarendon Street
Boston, MA 02116
Transfer Agent
Investors Bank & Trust Company
200 Clarendon Street
Boston, MA 02116
Independent Registered Public Accounting Firm
Deloitte & Touche LLP
200 Berkeley Street
Boston, MA 02116-5022
Eaton Vance VT Floating-Rate Income Fund
The Eaton Vance Building
255 State Street
Boston, MA 02109
This report must be preceded or accompanied by a current prospectus. Before investing, investors should consider carefully the Fund's investment objective(s), risks, and charges and expenses. The Fund's current prospectus contains this and other information about the Fund and is available through your financial advisor. Please read the prospectus carefully before you invest or send money. For further information please call 1-800-225-6265.
1939-2/06 VTFRHSRC

Annual Report December 31, 2005


EATON VANCE
VT
WORLDWIDE
HEALTH
SCIENCES
FUND
IMPORTANT NOTICES REGARDING PRIVACY,
DELIVERY OF SHAREHOLDER DOCUMENTS,
PORTFOLIO HOLDINGS, AND PROXY VOTING
Privacy. The Eaton Vance organization is committed to ensuring your financial privacy. Each of the financial institutions identified below has in effect the following policy ("Privacy Policy") with respect to nonpublic personal information about its customers:
• Only such information received from you, through application forms or otherwise, and information about your Eaton Vance fund transactions will be collected. This may include information such as name, address, social security number, tax status, account balances and transactions.
• None of such information about you (or former customers) will be disclosed to anyone, except as permitted by law (which includes disclosure to employees necessary to service your account). In the normal course of servicing a customer's account, Eaton Vance may share information with unaffiliated third parties that perform various required services such as transfer agents, custodians and broker/dealers.
• Policies and procedures (including physical, electronic and procedural safeguards) are in place that are designed to protect the confidentiality of such information.
• We reserve the right to change our Privacy Policy at any time upon proper notification to you. Customers may want to review our Policy periodically for changes by accessing the link on our homepage: www.eatonvance.com.
Our pledge of privacy applies to the following entities within the Eaton Vance organization: the Eaton Vance Family of Funds, Eaton Vance Management, Eaton Vance Investment Counsel, Boston Management and Research, and Eaton Vance Distributors, Inc.
In addition, our Privacy Policy only applies to those Eaton Vance customers who are individuals and who have a direct relationship with us. If a customer's account (i.e., fund shares) is held in the name of a third-party financial adviser/broker-dealer, it is likely that only such adviser's privacy policies apply to the customer. This notice supersedes all previously issued privacy disclosures.
For more information about Eaton Vance's Privacy Policy, please call 1-800-262-1122.
Delivery of Shareholder Documents. The Securities and Exchange Commission (the "SEC") permits funds to deliver only one copy of shareholder documents, including prospectuses, proxy statements and shareholder reports, to fund investors with multiple accounts at the same residential or post office box address. This practice is often called "householding" and it helps eliminate duplicate mailings to shareholders.
Eaton Vance, or your financial adviser, may household the mailing of your documents indefinitely unless you instruct Eaton Vance, or your financial adviser, otherwise.
If you would prefer that your Eaton Vance documents not be householded, please contact Eaton Vance at 1-800-262-1122, or contact your financial adviser.
Your instructions that householding not apply to delivery of your Eaton Vance documents will be effective within 30 days of receipt by Eaton Vance or your financial adviser.
Portfolio Holdings. Each Eaton Vance Fund and its underlying Portfolio (if applicable) will file a schedule of its portfolio holdings on Form N-Q with the SEC for the first and third quarters of each fiscal year. The Form N-Q will be available on the Eaton Vance website www.eatonvance.com, by calling Eaton Vance at 1-800-262-1122 or in the EDGAR database on the SEC's website at www.sec.gov. Form N-Q may also be reviewed and copied at the SEC's public reference room in Washington, D.C. (call 1-800-732-0330 for information on the operation of the public reference room).
Proxy Voting. From time to time, funds are required to vote proxies related to the securities held by the funds. The Eaton Vance Funds or their underlying Portfolios (if applicable) vote proxies according to a set of policies and procedures approved by the Funds' and Portfolios' Boards. You may obtain a description of these policies and procedures and information on how the Funds or Portfolios voted proxies relating to Portfolio securities during the most recent 12 month period ended June 30, without charge, upon request, by calling 1-800-262-1122. This description is also available on the SEC's website at www.sec.gov.
Eaton Vance VT Worldwide Health Sciences Fund as of December 31, 2005
MANAGEMENT’S DISCUSSION OF FUND PERFORMANCE
The Fund
• For the year ended December 31, 2005, the Fund’s shares had a total return of 7.03%.(1) This return was the result of an increase in net asset value to $12.03 on December 31, 2005, from $11.24 on December 31, 2004.
• The Fund underperformed its peer group, the Lipper Health/Biotechnology Fund Classification, which had an average return of 9.33%, but outperformed the 4.91% return of its primary benchmark, the S&P 500 Index. The Fund also outperperformed its secondary benchmark, the Morgan Stanley Capital International (MSCI) World Pharmaceuticals and Biotechnology USD Index, which returned 6.06% during the same period.(2)
Management Discussion
• The 12-month period ending December 31, 2005, was split between a difficult first six months, followed by a strong recovery in the second half of the period. Pharmaceutical shares led health care stocks during the first half of the year, showing slightly positive returns at mid-year. Returns in the biotechnology sector were relatively flat, primarily due to a sharp drop in new product introductions, and smaller, emerging biotech stocks generally had negative results for the first six months of the year.
• In the second half of the period, the biotech sector recovered, with emerging biotech stocks leading the sector’s performance. Several factors drove returns. First, there was a flood of acquisitions of small biotech companies. Second, large pharmaceutical companies received a boost from a positive FDA meeting on Cox (2) inhibitors — a new class of nonsteroidal anti-inflam- matory drugs designed to have fewer side effects. Third, in April, a large, well-known pharmaceutical firm forecasted better-than-expected double-digit earnings growth through 2008, which bolstered the sector in the second half. And finally, an established biotechnology firm saw an increase in revenues from a colon cancer drug, which was also shown to be useful in clinical trials, and this positive news also helped improve sentiment for the industry as a whole.
• With nearly half of the Fund’s assets in biotechnology shares, the “biotech bear market” in the first half of the period hurt the Fund’s overall returns. However, biotech stocks rallied strongly in the latter six months of the year, helping the Fund to outperform its Lipper peer group average and the market indexes during the second half of the period.
• Three key holdings were responsible for most of the Fund’s underperformance of its Lipper peer group average during the period. One company, which had been working on a treatment for multiple sclerosis, withdrew that product (the Fund no longer holds this stock). A second company, which specializes in osteoporosis and central nervous system disorders, had a delay in a significant product approval, which caused its shares to decline. And finally, a company that develops oncology-related products had disappointing sales during the first year of an approved drug. Management remained committed to these latter two stocks at period end. The Fund’s holdings in pharma- ceutical and established biotech stocks performed well throughout the year, helping offset the biotech decline during the first half. A few key holdings in the Fund, acquired late in the period, experienced price increases and contributed significantly to the Fund’s performance.
• Throughout the year, the Fund continued to focus on companies believed to possess significant new product launch potential from recently launched (or soon to launch) therapeutics. During periods of weakness, management sought to take advantage of lower prices in certain drug development companies by adding to positions believed to have near-term catalysts that could spur revenue growth.
(1) There is no sales charge. Insurance-related charges are not included in calculations of returns. Please refer to the report for your insurance contract for performance data reflecting insurance-related charges.
(2) It is not possible to invest directly in an Index or a Lipper Classification. The Index’s total return does not reflect commissions or expenses that would have been incurred if an investor individually purchased or sold the securities represented in the Index. The S&P 500 Index is a broad-based, unmanaged market index commonly used as a measure of overall U.S. stock market performance. The Morgan Stanley Capital International (MSCI) World Pharmaceuticals and Biotechnology USD Index is an unmanaged global index of common stocks in the pharmaceutical and biotechnology industries.
Past performance is no guarantee of future results. Returns are historical and are calculated by determining the percentage change in net asset value or offering price (as applicable) with all distributions reinvested. Investment return and principal value will fluctuate so that shares, when redeemed, may be worth more or less than their original cost. Performance is for the stated time period only; due to market volatility, the Fund’s current performance may be lower or higher than the quoted return. For performance as of the most recent month-end, please refer to www.eatonvance.com.
Fund shares are not insured by the FDIC and are not deposits or other obligations of, or guaranteed by, any depository institution. Shares are subject to investment risks, including possible loss of principal invested.
The views expressed in this report are those of the portfolio manager and are current only through the end of the period of the report as stated on the cover. These views are subject to change at any time based upon market or other conditions, and the investment adviser disclaims any responsibility to update such views. These views may not be relied on as investment advice and, because investment decisions for a fund are based on many factors, may not be relied on as an indication of trading intent on behalf of any Eaton Vance fund.
2
Eaton Vance VT Worldwide Health Sciences Fund as of December 31, 2005
FUND PERFORMANCE
The line graph and table set forth below provide information about the Fund’s performance. The line graph compares the performance of the Fund with that of the S&P 500 Index, a broad-based, unmanaged market index commonly used as a measure of overall U.S. stock market performance, and the Morgan Stanley Capital International (MSCI) World Pharmaceuticals and Biotechnology USD Index, an unmanaged index of global pharmaceutical and biotechnology stocks denominated in U.S. dollars. The lines on the graph represent the total returns of a hypothetical investment of $10,000 in each of Fund shares and the S&P 500 Index and MSCI World Pharmaceuticals and Biotechnology USD Index. Fund returns are presented at net asset value. The performance presented below does not reflect the deduction insurance-related charges or of taxes, if any, that a shareholder would pay on distributions or redemptions of Fund shares.
Performance(1)
Average Annual Total Returns at net asset value
One Year | | 7.03 | % |
Life of Fund† | | 4.04 | |
†Inception Date – 5/2/01
(1) The Fund has no sales charge. Returns do not include insurance-related charges.
Past performance is no guarantee of future results. Returns are historical and are calculated by determining the percentage change in net asset value or offering price (as applicable) with all distributions reinvested. Investment return and principal value will fluctuate so that shares, when redeemed, may be worth more or less than their original cost. Performance is for the stated time period only; due to market volatility, the Fund’s current performance may be lower or higher than the quoted return. For performance as of the most recent month-end, please refer to www.eatonvance.com.
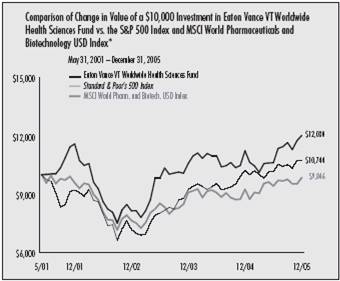
* Source: Thomson Financial. Investment operations commenced 5/2/01. The chart uses closest month-end after inception.
The performance chart above compares the Fund’s total return with that of broad based securities market Indexes. Returns are calculated by determining the percentage change in net asset value (NAV) with all distributions reinvested. The lines on the chart represent the total returns of $10,000 hypothetical investments in the Fund, the S&P 500 Index, a broad-based, unmanaged market index commonly used as a measure of overall U.S. stock market performance, and the Morgan Stanley Capital International (MSCI) World Pharmaceuticals and Biotechnology USD Index, an unmanaged index of global pharmaceutical and biotechnology stocks denominated in U.S. dollars. Returns are calculated by determining the percentage change in net asset value with all distributions reinvested. The graph and performance table do not reflect the deduction of insurance-related charges or taxes that a shareholder would pay on Fund distributions or the redemption of Fund shares. The Indexes’ total returns do not reflect any commissions or expenses that would have been incurred if an investor individually purchased or sold the securities represented in the Indexes. Indexes are unmanaged and it is not possible to invest directly in an Index. Index performance is available as of month-end only.
3
Eaton Vance VT Worldwide Health Sciences Fund as of December 31, 2005
PORTFOLIO INFORMATION
Sector Distribution†
As a percentage of the Fund’s net assets
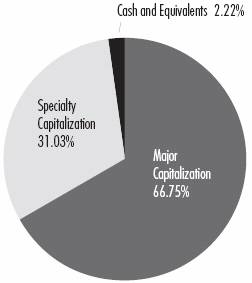
Regional Distribution†
As a percentage of the Fund’s net assets

† As of December 31, 2005. Portfolio information may not be representative of the Fund’s current or future investments and may change due to active management.
Top Ten Common Stock Holdings*
As a percentage of the Fund’s net assets
Novartis | | 7.59 | % |
Amgen Inc. | | 7.27 | |
Genentech Inc | | 6.39 | |
Medimmune Inc. | | 5.81 | |
Genzyme Corp | | 4.89 | |
Takeda Pharmaceutical Co Ltd. | | 4.73 | |
Schering-Plough Corporation | | 4.39 | |
Chugai Pharmaceutical Co Ltd | | 4.31 | |
Serono SA | | 4.10 | |
Astellas Pharma | | 3.92 | |
* Top Ten Holdings represented 53.4% of total net assets as of December 31, 2005. Portfolio information may not be representative of the Fund’s current or future investments and may change due to active management.
4
Eaton Vance VT Worldwide Health Sciences Fund as of December 31, 2005
FUND EXPENSES
Example: As a shareholder of the Fund, you incur ongoing costs including management fees; distribution or service fees; and other Fund expenses. This Example is intended to help you understand your ongoing costs (in dollars) of investing in the Fund and to compare these costs with the ongoing costs of investing in other mutual funds. The Example is based on an investment of $1,000 invested at the beginning of the period and held for the entire period (July 1, 2005 – December 31, 2005).
Actual Expenses: The first section of the table below provides information about actual account values and actual expenses. You may use the information in this line, together with the amount you invested, to estimate the expenses that you paid over the period. Simply divide your account value by $1,000 (for example, an $8,600 account value divided by $1,000 = 8.6), then multiply the result by the number in the first line under the heading entitled “Expenses Paid During Period” to estimate the expenses you paid on your account during this period.
Hypothetical Example for Comparison Purposes: The second section of the table below provides information about hypothetical account values and hypothetical expenses based on the actual Fund expense ratio and an assumed rate of return of 5% per year (before expenses), which is not the actual return of the Fund. The hypothetical account values and expenses may not be used to estimate the actual ending account balance or expenses you paid for the period. You may use this information to compare the ongoing costs of investing in your Fund and other funds. To do so, compare this 5% hypothetical example with the 5% hypothetical examples that appear in the shareholder reports of the other funds.
Please note that the expenses shown in the table are meant to highlight your ongoing costs only and do not reflect expenses and charges which are, or may be, imposed under your variable annuity contract or variable life insurance policy (“variable contracts”) (if applicable). Therefore, the second line of the table is useful in comparing ongoing costs associated with an investment in vehicles which fund benefits under variable contracts and will not help you determine the relative total costs of owning different funds. In addition, if these expenses and charges imposed under the variable contracts were included, your costs would have been higher.
Eaton Vance VT Worldwide Health Sciences Fund
| | Beginning Account Value | | Ending Account Value | | Expenses Paid During Period* | |
| | (7/1/05) | | (12/31/05) | | (7/1/05 – 12/31/05) | |
| | | | | | | |
Actual | | | | | | | |
| | $ | 1,000.00 | | $ | 1,132.80 | | $ | 9.46 | |
| | | | | | | |
Hypothetical | | | | | | | |
(5% return per year before expenses) | | | | | | | |
| | $ | 1,000.00 | | $ | 1,016.30 | | $ | 8.94 | |
* Expenses are equal to the Fund’s annualized expense ratio of 1.76% multiplied by the average account value over the period, multiplied by 184/365 (to reflect the one-half year period). The example assumes that the $1,000 was invested at the net asset value per share determined at the close of business on June 30, 2005. Returns do not include insurance-related charges. |
5
Eaton Vance VT Worldwide Health Sciences Fund as of December 31, 2005
PORTFOLIO OF INVESTMENTS
| Common Stocks — 97.78% | |
| Security | | Shares | | Value | | Percentage of
Net Assets | |
| Major Capitalization-Europe — 15.05%(1) | |
| Altana AG | | | 18,000 | | | $ | 972,589 | | | | 3.36 | % | |
| Novartis AG | | | 42,000 | | | | 2,196,382 | | | | 7.59 | % | |
| Serono SA, Class B | | | 1,500 | | | | 1,187,632 | | | | 4.10 | % | |
| | | $ | 4,356,603 | | | | 15.05 | % | |
| Major Capitalization-Far East — 12.96%(1) | |
| Astellas Pharma, Inc. | | | 29,090 | | | $ | 1,135,960 | | | | 3.92 | % | |
| Chugai Pharmaceuticals Co., Ltd. | | | 58,000 | | | | 1,246,936 | | | | 4.31 | % | |
| Takeda Pharmaceutical Co., Ltd. | | | 25,300 | | | | 1,369,750 | | | | 4.73 | % | |
| | | $ | 3,752,646 | | | | 12.96 | % | |
| Major Capitalization-North America — 38.74%(1) | |
| Amgen, Inc.(3) | | | 26,700 | | | $ | 2,105,562 | | | | 7.27 | % | |
| Genentech, Inc.(3) | | | 20,000 | | | | 1,850,000 | | | | 6.39 | % | |
| Genzyme Corp.(3) | | | 20,000 | | | | 1,415,600 | | | | 4.89 | % | |
| Lilly (Eli) & Co. | | | 19,400 | | | | 1,097,846 | | | | 3.79 | % | |
| Medimmune, Inc.(3) | | | 48,000 | | | | 1,680,960 | | | | 5.81 | % | |
| Pfizer, Inc. | | | 34,500 | | | | 804,540 | | | | 2.78 | % | |
| Schering-Plough Corp. | | | 61,000 | | | | 1,271,850 | | | | 4.39 | % | |
| Wyeth | | | 21,500 | | | | 990,505 | | | | 3.42 | % | |
| | | $ | 11,216,863 | | | | 38.74 | % | |
| Specialty Capitalization-Europe — 2.18%(2) | |
| Acambis plc(3) | | | 64,000 | | | $ | 226,967 | | | | 0.78 | % | |
| Berna Biotech AG(3) | | | 34,000 | | | | 403,733 | | | | 1.40 | % | |
| | | $ | 630,700 | | | | 2.18 | % | |
| Specialty Capitalization-North America — 28.85%(2) | |
| Abgenix, Inc.(3) | | | 43,000 | | | $ | 924,930 | | | | 3.20 | % | |
| Affymetrix, Inc.(3) | | | 20,000 | | | | 955,000 | | | | 3.30 | % | |
| Enzon Pharmaceuticals, Inc.(3) | | | 32,000 | | | | 236,800 | | | | 0.82 | % | |
| Exelixis, Inc.(3) | | | 45,000 | | | | 423,900 | | | | 1.47 | % | |
| Gen-Probe, Inc.(3) | | | 22,500 | | | | 1,097,775 | | | | 3.79 | % | |
| ICOS Corp.(3) | | | 30,000 | | | | 828,900 | | | | 2.86 | % | |
| Ligand Pharmaceuticals, Inc., Class B(3) | | | 42,000 | | | | 468,300 | | | | 1.62 | % | |
| Millennium Pharmaceuticals, Inc.(3) | | | 84,000 | | | | 814,800 | | | | 2.82 | % | |
| NPS Pharmaceuticals, Inc.(3) | | | 34,800 | | | | 412,032 | | | | 1.42 | % | |
| Security | | Shares | | Value | | Percentage of
Net Assets | |
| Specialty Capitalization-North America (continued) | |
| OSI Pharmaceuticals, Inc.(3) | | | 22,000 | | | $ | 616,880 | | | | 2.13 | % | |
| Savient Pharmaceuticals, Inc.(3) | | | 44,300 | | | | 165,682 | | | | 0.57 | % | |
| Tanox, Inc.(3) | | | 30,000 | | | | 491,100 | | | | 1.70 | % | |
| Vertex Pharmaceuticals, Inc.(3) | | | 33,000 | | | | 913,110 | | | | 3.15 | % | |
| | | $ | 8,349,209 | | | | 28.85 | % | |
Total Common Stocks
(identified cost $23,499,241) | | | | | | $ | 28,306,021 | | | | | | |
| Commercial Paper — 0.55% | |
| Security | | Principal
Amount
(000's omitted) | | Value | | Percentage of
Net Assets | |
General Electric Capital Corp.,
4.20%, 1/3/06 | | $ | 158 | | | $ | 157,963 | | | | 0.55 | % | |
Total Commercial Paper
(at amortized cost, $157,963) | | | | | | $ | 157,963 | | | | | | |
| Short-Term Investments — 1.96% | |
| Security | | Principal
Amount
(000's omitted) | | Value | | Percentage of
Net Assets | |
Investors Bank and Trust Company Time
Deposit, 4.23%, 1/3/06 | | $ | 568 | | | $ | 568,000 | | | | 1.96 | % | |
Total Short-Term Investments
(at amortized cost, $568,000) | | | | | | $ | 568,000 | | | | | | |
Total Investments
(identified cost $24,225,204) | | | | | | $ | 29,031,984 | | | | 100.29 | % | |
| Other Assets, Less Liabilities | | | | | | $ | (83,352 | ) | | | (0.29 | )% | |
| Net Assets | | | | | | $ | 28,948,632 | | | | 100.00 | % | |
(1) Major capitalization is defined as market value of $5 billion or more.
(2) Specialty capitalization is defined as market value of less than $5 billion.
(3) Non-income producing security.
See notes to financial statements
6
Eaton Vance VT Worldwide Health Sciences Fund as of December 31, 2005
PORTFOLIO OF INVESTMENTS CONT'D
| Country Concentration of Portfolio | |
| Country | | Percentage
of Net Assets | | Value | |
| United States | | | 70.10 | % | | $ | 20,292,035 | | |
| Switzerland | | | 13.09 | | | | 3,787,747 | | |
| Japan | | | 12.96 | | | | 3,752,646 | | |
| Germany | | | 3.36 | | | | 972,589 | | |
| United Kingdom | | | 0.78 | | | | 226,967 | | |
See notes to financial statements
7
Eaton Vance VT Worldwide Health Sciences Fund as of December 31, 2005
FINANCIAL STATEMENTS
Statement of Assets and Liabilities
As of December 31, 2005
| Assets | |
| Investments, at value (identified cost, $24,225,204) | | $ | 29,031,984 | | |
| Cash | | | 473 | | |
| Receivable for Fund shares sold | | | 1,146 | | |
| Dividends and interest receivable | | | 5,634 | | |
| Tax reclaim receivable | | | 14,720 | | |
| Total assets | | $ | 29,053,957 | | |
| Liabilities | |
| Payable for Fund shares redeemed | | $ | 34,725 | | |
| Payable to affiliate for investment advisory fees | | | 23,550 | | |
| Payable to affiliate for service fees | | | 17,828 | | |
| Payable to affiliate for administration fees | | | 6,126 | | |
| Payable to affiliate for Trustees' fees | | | 482 | | |
| Accrued expenses | | | 22,614 | | |
| Total liabilities | | $ | 105,325 | | |
| Net Assets for 2,406,512 shares of beneficial interest outstanding | | $ | 28,948,632 | | |
| Sources of Net Assets | |
| Paid-in capital | | $ | 24,305,949 | | |
| Accumulated net realized loss (computed on the basis of identified cost) | | | (162,723 | ) | |
| Net unrealized appreciation (computed on the basis of identified cost) | | | 4,805,406 | | |
| Total | | $ | 28,948,632 | | |
Net Asset Value, Offering Price and
Redemption Price Per Share | |
| ($28,948,632 ÷ 2,406,512 shares of beneficial interest outstanding) | | $ | 12.03 | | |
Statement of Operations
For the Year Ended
December 31, 2005
| Investment Income | |
| Dividends (net of foreign taxes, $13,833) | | $ | 198,645 | | |
| Interest | | | 48,469 | | |
| Total investment income | | $ | 247,114 | | |
| Expenses | |
| Investment adviser fee | | $ | 247,484 | | |
| Administration fee | | | 68,377 | | |
| Trustees' fees and expenses | | | 1,736 | | |
| Service fees | | | 68,377 | | |
| Custodian fee | | | 42,251 | | |
| Legal and accounting services | | | 26,168 | | |
| Transfer and dividend disbursing agent fees | | | 12,033 | | |
| Registration fees | | | 300 | | |
| Miscellaneous | | | 4,013 | | |
| Total expenses | | $ | 470,739 | | |
Deduct —
Reduction of investment adviser fee | | $ | 143 | | |
| Total expense reductions | | $ | 143 | | |
| Net expenses | | $ | 470,596 | | |
| Net investment loss | | $ | (223,482 | ) | |
| Realized and Unrealized Gain (Loss) | |
Net realized gain (loss) —
Investment transactions (identified cost basis) | | $ | (80,818 | ) | |
| Foreign currency transactions | | | (3,064 | ) | |
| Net realized loss | | $ | (83,882 | ) | |
Change in unrealized appreciation (depreciation) —
Investments (identified cost basis) | | $ | 2,264,223 | | |
| Foreign currency | | | (2,066 | ) | |
| Net change in unrealized appreciation (depreciation) | | $ | 2,262,157 | | |
| Net realized and unrealized gain | | $ | 2,178,275 | | |
| Net increase in net assets from operations | | $ | 1,954,793 | | |
See notes to financial statements
8
Eaton Vance VT Worldwide Health Sciences Fund as of December 31, 2005
FINANCIAL STATEMENTS CONT'D
Statements of Changes in Net Assets
Increase (Decrease)
in Net Assets | | Year Ended
December 31, 2005 | | Year Ended
December 31, 2004 | |
From operations —
Net investment loss | | $ | (223,482 | ) | | $ | (316,802 | ) | |
Net realized gain (loss)
from investment and foreign
currency transactions | | | (83,882 | ) | | | 1,165,560 | | |
Net change in unrealized
appreciation (depreciation)
from investments and
foreign currency | | | 2,262,157 | | | | 666,034 | | |
| Net increase in net assets from operations | | $ | 1,954,793 | | | $ | 1,514,792 | | |
Transactions in shares of beneficial interest —
Proceeds from sale of shares | | $ | 4,082,618 | | | $ | 7,695,207 | | |
| Cost of shares redeemed | | | (5,296,792 | ) | | | (5,286,085 | ) | |
Net increase (decrease) in net assets from
Fund share transactions | | $ | (1,214,174 | ) | | $ | 2,409,122 | | |
| Net increase in net assets | | $ | 740,619 | | | $ | 3,923,914 | | |
| Net Assets | |
| At beginning of year | | $ | 28,208,013 | | | $ | 24,284,099 | | |
| At end of year | | $ | 28,948,632 | | | $ | 28,208,013 | | |
See notes to financial statements
9
Eaton Vance VT Worldwide Health Sciences Fund as of December 31, 2005
FINANCIAL STATEMENTS CONT'D
Financial Highlights
| | | Year Ended December 31, | |
| | | 2005(1) | | 2004(1) | | 2003(1) | | 2002(1) | | 2001(1)(2) | |
| Net asset value — Beginning of year | | $ | 11.240 | | | $ | 10.580 | | | $ | 8.140 | | | $ | 11.590 | | | $ | 10.000 | | |
| Income (loss) from operations | |
| Net investment loss | | $ | (0.090 | ) | | $ | (0.127 | ) | | $ | (0.141 | ) | | $ | (0.150 | ) | | $ | (0.213 | ) | |
| Net realized and unrealized gain (loss) | | | 0.880 | | | | 0.787 | | | | 2.581 | | | | (3.300 | ) | | | 1.803 | | |
| Total income (loss) from operations | | $ | 0.790 | | | $ | 0.660 | | | $ | 2.440 | | | $ | (3.450 | ) | | $ | 1.590 | | |
| Net asset value — End of year | | $ | 12.030 | | | $ | 11.240 | | | $ | 10.580 | | | $ | 8.140 | | | $ | 11.590 | | |
| Total Return(3) | | | 7.03 | % | | | 6.24 | % | | | 29.98 | % | | | (29.77 | )% | | | 15.90 | % | |
| Ratios/Supplemental Data | |
| Net assets, end of year (000's omitted) | | $ | 28,949 | | | $ | 28,208 | | | $ | 24,284 | | | $ | 13,086 | | | $ | 7,874 | | |
| Ratios (As a percentage of average daily net assets): | | | | | | | | | |
| Expenses | | | 1.72 | %† | | | 1.88 | % | | | 2.19 | % | | | 2.50 | % | | | 3.80 | %(4) | |
| Expenses after custodian fee reduction | | | 1.72 | %† | | | 1.88 | % | | | 2.19 | % | | | 2.50 | % | | | 3.80 | %(4) | |
| Net investment loss | | | (0.82 | )%† | | | (1.18 | )% | | | (1.48 | )% | | | (1.70 | )% | | | (2.90 | )%(4) | |
| Portfolio Turnover | | | 14 | % | | | 21 | % | | | 29 | % | | | 0 | %(5) | | | 0 | %(5) | |
† The operating expenses of the Fund reflect a reduction of the investment adviser fee. Had such action not been taken, the ratios would have been the same.
(1) Net investment loss was computed using average shares outstanding.
(2) For the period from the start of business, May 2, 2001, to December 31, 2001.
(3) Returns are historical and are calculated by determining the percentage change in net asset value with all distributions reinvested. Total return is not computed on an annualized basis.
(4) Annualized.
(5) Portfolio turnover is less than 1%.
See notes to financial statements
10
Eaton Vance VT Worldwide Health Sciences Fund as of December 31, 2005
NOTES TO FINANCIAL STATEMENTS
1 Significant Accounting Policies
Eaton Vance VT Worldwide Health Sciences Fund (the Fund) is a diversified series of Eaton Vance Variable Trust (the Trust). The Trust is an entity of the type commonly known as a Massachusetts business trust and is registered under the Investment Company Act of 1940, as amended, as an open-end management investment company. The Fund seeks long-term capital growth by investing in a worldwide and diversified portfolio of securities of health sciences companies. The Fund is made available only to separate accounts issued by participating insurance companies. The following is a summary of significant accounting policies consistently followed by the Fund in the preparation of its financial statements. The policies are in conformity with accounting principles generally accepted in the United States of America.
A Investment Valuations — Securities listed on a U.S. securities exchange generally are valued at the last sale price on the day of valuation or, if no sales took place on such date, at the mean between the closing bid and asked prices therefore on the exchange where such securities are principally traded. Equity securities listed on the NASDAQ National Market System generally are valued at the official NASDAQ closing price. Unlisted or listed securities for which closing sales prices or closing quotations are not available are valued at the mean between the latest available bid and asked prices or, in the case of preferred equity securities that are not listed or traded in the over-the-counter market , by an independent pricing service. The value of preferred equity securities that are valued by a pricing service on a bond basis will be adjusted by an income factor, to be determined by the investment adviser, to reflect the next anticipated regular dividend. Exchange-traded options are valued at the last sale price for the day of valuation as quoted on the principal exchange or board of trade on which the options are traded or, in the absence of sales on such date, at the mean between the latest bid and asked prices therefore. Futures positions on securities and currencies generally are valued at closing settlement prices. Short-term debt securities with a remaining maturity of 60 days or less are valued at amortized cost. If short-term debt securities were acquired with a remaining maturity of more than 60 days, their amortized cost value will be based on their value on the sixty-first day prior to maturity. Ot her fixed income and debt securities, including listed securities and securities for which price quotations are available, will normally be valued on the basis of valuations furnished by a pricing service. The daily valuation of foreign securities generally is determined as of the close of trading on the principal exchange on which such securities trade. Events occurring after the close of trading on foreign exchanges may result in adjustments to the valuation of foreign securities to more accurately reflect their fair value as of the close of regular trading on the New York Stock Exchange. The Fund may rely on an independent fair valuation service in adjusting the valuations of foreign securities. Foreign securities and currencies are valued in U.S. dollars, based on foreign currency exchange rate quotations supplied by an independent quotation service. Investments held by the Fund for which valuations or market quotations are unavailab le are valued at fair value using methods determined in good faith by or at the direction of the Trustees of the Fund considering relevant factors, data and information including the market value of freely tradable securities of the same class in the principal market on which such securities are normally traded.
B Income — Interest income is determined on the basis of interest accrued, adjusted for amortization of premium or accretion of discount. Dividend income is recorded on the ex-dividend date for dividends received in cash and/or securities. However, if the ex-dividend date has passed, certain dividends from foreign securities are recorded as the Fund is informed of the ex-dividend date. Withholding taxes on foreign dividends and capital gains have been provided for in accordance with the Fund's understanding of the applicable countries' tax rules and rates.
C Federal Taxes — The Fund's policy is to comply with the provisions of the Internal Revenue Code applicable to regulated investment companies and to distribute to shareholders each year all of its taxable income, including any net realized capital gains. Accordingly, no provision for federal income or excise tax is necessary. At December 31, 2005, the Fund, for federal income tax purposes had a capital loss carryover of $147,673 which will reduce the Fund's taxable income arising from future net realized gains on investments, if any, to the extent permitted by the Internal Revenue Code and thus will reduce the amount of distributions to shareholders which would otherwise be necessary to relieve the F und of any liability for federal income tax. Such capital loss carryover will expire December 31, 2011 ($66,856) and December 31, 2013 ($80,817).
D Expense Reduction — Investors Bank & Trust Company (IBT) serves as custodian of the Fund. Pursuant to the custodian agreement, IBT receives a fee reduced by credits which are determined based on the average daily cash balance the Fund maintains with IBT. All credit balances used to reduce the Fund's custodian fees are reported as a reduction of total expenses in the Statement of Operations.
11
Eaton Vance VT Worldwide Health Sciences Fund as of December 31, 2005
NOTES TO FINANCIAL STATEMENTS CONT'D
For the year ended December 31, 2005, there were no credit balances used to reduce the Fund's custodian fee.
E Use of Estimates — The preparation of financial statements in conformity with accounting principles generally accepted in the United States of America requires management to make estimates and assumptions that affect the reported amounts of assets and liabilities at the date of the financial statements and the reported amounts of revenue and expense during the reporting period. Actual results could differ from those estimates.
F Indemnifications — Under the Trust's organizational documents, its officers and trustees may be indemnified against certain liabilities and expenses arising out of the performance of their duties to the Fund and shareholders are indemnified against personal liability for the obligations of the Trust. Additionally, in the normal course of business, the Fund enters into agreements with service providers that may contain indemnification clauses. The Fund's maximum exposure under these arrangements is unknown as this would involve future claims that may be made against the Fund that have not yet occurred.
G Expenses — The majority of expenses of the Trust are directly identifiable to an individual fund. Expenses which are not readily identifiable to a specific fund are allocated taking into consideration, among other things, the nature and type of expense and the relative size of the funds.
H Foreign Currency Translation — Investment valuations, other assets, and liabilities initially expressed in foreign currencies are converted each business day into U.S. dollars based upon current exchange rates. Purchases and sales of foreign investment securities and income and expenses are converted into U.S. dollars based upon currency exchange rates prevailing on the respective dates of such transactions. Realized gains or losses on investment transactions attributable to changes in foreign currency exchange rates are recorded for financial statement purposes as net realized gains and losses on investments. That portion of unrealized gains and losses on investments that results from fluctuations in foreign currency exchange rates is not separately disclosed.
I Forward Foreign Currency Exchange Contracts — The Fund may enter into forward foreign currency exchange contracts for the purchase or sale of a specific foreign currency at a fixed price on a future date. Risks may arise upon entering these contracts from the potential inability of counterparties to meet the terms of their contracts and from movements in the value of a foreign currency relative to the U.S. dollar. The Fund will enter into forward contracts for hedging purposes as well as nonhedging purposes. The forward foreign currency exchange contracts are adjusted by the daily exchange rate of the underlying currency and any gains and losses are recorded for financial statement purposes as unrealized until such time as the contracts have been closed.
J Other — Investment transactions are accounted for on a trade date basis. Realized gains and losses are computed based on the specific identification of the securities sold.
2 Distributions to Shareholders
It is the present policy of the Fund to make at least one distribution annually (normally in December) of all or substantially all of its net investment income and at least one distribution annually of all of its net realized capital gains. Distributions are paid in the form of additional shares of the Fund unless an election is made on behalf of a separate account to receive some or all of the distribution in cash. Shareholders may reinvest all distributions in shares of the Fund at the net asset value as of the close of business on the ex-dividend date.
The Fund distinguishes between distributions on a tax basis and a financial reporting basis. Accounting principles generally accepted in the United States of America require that only distributions in excess of tax basis earnings and profits be reported in the financial statements as a return of capital. Permanent differences between book and tax accounting relating to distributions are reclassified to paid-in capital.
During the year ended December 31, 2005, paid-in-capital was decreased by $226,547, accumulated net investment loss was decreased by $223,482, and accumulated net realized loss was decreased by $3,065 primarily due to differences between book and tax policies for net operating losses and foreign currency gain/loss. This change had no effect on the net assets or the net asset value per share.
As of December 31, 2005 the components of distributable earnings (accumulated losses) on a tax basis were as follows:
| Capital Loss carryforwards: | | $ | (147,673 | ) | |
The temporary differences between book and tax basis distributable earnings (accumulated losses) are due to wash sales.
12
Eaton Vance VT Worldwide Health Sciences Fund as of December 31, 2005
NOTES TO FINANCIAL STATEMENTS CONT'D
3 Shares of Beneficial Interest
The Trust has an underwriting agreement relating to the Fund with Eaton Vance Distributors, Inc. (EVD). The underwriting agreement presently provides that EVD, through the Fund's transfer agent, accepts orders for shares at net asset value and no sales commission or load is charged. EVD may, at its expense, provide promotional incentives to dealers that sell variable insurance products. The Fund's Declaration of Trust permits the Trustees to issue an unlimited number of full and fractional shares of beneficial interest (without par value). At December 31, 2005, separate accounts of two insurance companies owned 50% and 43%, respectively, of the Fund's shares outstanding. Transactions in Fund shares were as follows:
| | | Year Ended December 31, | |
| | | 2005 | | 2004 | |
| Sales | | | 374,847 | | | | 711,324 | | |
| Redemptions | | | (477,399 | ) | | | (497,128 | ) | |
| Net increase (decrease) | | | (102,552 | ) | | | 214,196 | | |
4 Investment Adviser Fee and Other Transactions with Affiliates
Pursuant to the Advisory Agreement, OrbiMed Advisors, LLC (OrbiMed) serves as the Investment Adviser of the Fund. Under this agreement, OrbiMed receives a monthly fee at the annual rate of 1% of the Fund's first $30 million in average net assets, 0.90% of the next $20 million in average net assets, 0.75% of the next $450 million in average net assets, and 0.70% of the next $500 million in average net assets. The fee rate declines for net assets of $1 billion and greater. In addition, effective May 1, 2002, OrbiMed's fee is subject to an upward or downward performance fee adjustment of up to 0.25% of the average daily net assets of the Fund based upon the investment performance of the Fund compared to the Standard & Poor's Index over specified periods. For the year ended December 31, 2005, the fee was equivalent to 0.90% of the Fund' s average daily net assets and amounted to $247,484.
The Adviser has agreed to reduce the investment adviser fee by an amount equal to that portion of commissions paid to broker dealers in execution of Fund portfolio transactions that is consideration for third-party research services. For the year ended December 31, 2005, the Investment Adviser waived $143 of its advisory fee.
Under an Administration Agreement between the Fund and its Administrator, Eaton Vance Management (EVM), EVM manages and administers the affairs of the Fund. EVM earns a monthly fee at the annual rate of 0.25% of average daily net assets. For the year ended December 31, 2005, the administration fee was 0.25% of average net assets and amounted to $68,377.
Except for Trustees of the Fund who are not members of the Adviser or EVM's organization, officers and Trustees receive remuneration for their services to the Fund out of such investment adviser and administration fees. Certain officers and Trustees of the Fund are officers of the above organizations.
5 Service Fees
The Fund has adopted a service plan that allows the Fund to pay service fees to insurance companies for providing personal and/or account services to account holders of insurance product separate accounts, which is equal to 0.25% of daily average net assets. Service fees for the year ended December 31, 2005 amounted to $68,377.
6 Risks Associated with Foreign Investments
Investing in securities issued by companies whose principal business activities are outside the United States may involve significant risks not present in domestic investments. For example, there is generally less publicly available information about foreign companies, particularly those not subject to the disclosure and reporting requirements of the U.S. securities laws. Foreign issuers are generally not bound by uniform accounting, auditing, and financial reporting requirements and standards of practice comparable to those applicable to domestic issuers. Investments in foreign securities also involve the risk of possible adverse changes in investment or exchange control regulations, expropriation or confiscatory taxation, limitation on the removal of funds or other assets of the Fund, political or financial instability or diplomatic and other developments which could affect such investments. Foreign stock markets, while growin g in volume and sophistication, are generally not as developed as those in the United States, and securities of some foreign issuers (particularly those in developing countries) may be less liquid and more volatile than securities of comparable U.S. companies. In general, there is less overall governmental supervision and regulation of foreign securities markets, broker-dealers, and issuers than in the United States.
7 Purchases and Sales of Investments
Purchases and sales of investments, other than short-term obligations, aggregated $3,792,746 and $4,941,704 respectively, for the year ended December 31, 2005.
13
Eaton Vance VT Worldwide Health Sciences Fund as of December 31, 2005
NOTES TO FINANCIAL STATEMENTS CONT'D
8 Line of Credit
The Fund participates with other portfolios and funds managed by EVM and its affiliates in a $150 million unsecured line of credit agreement with a group of banks. Borrowings will be made by the Fund solely to facilitate the handling of unusual and/or unanticipated short-term cash requirements. Interest is charged to each participating portfolio or fund based on its borrowings at an amount above the Eurodollar rate or federal funds rate. In addition, a fee computed at an annual rate of 0.10% on the daily unused portion of the line of credit is allocated among the participating portfolios and funds at the end of each quarter. The Fund did not have any significant borrowings or allocated fees during the year ended December 31, 2005.
9 Federal Income Tax Basis of Unrealized Appreciation (Depreciation)
The cost and unrealized appreciation (depreciation) in value of the investment securities of the Fund at December 31, 2005, as computed on a federal income tax basis, were as follows:
| Aggregate cost | | $ | 24,240,254 | | |
| Gross unrealized appreciation | | $ | 7,269,566 | | |
| Gross unrealized depreciation | | | (2,477,836 | ) | |
| Net unrealized appreciation | | $ | 4,791,730 | | |
The net unrealized depreciation on foreign currency was $1,374 at December 31, 2005.
14
Eaton Vance VT Worldwide Health Sciences Fund as of December 31, 2005
REPORT OF INDEPENDENT REGISTERED PUBLIC ACCOUNTING FIRM
To the Trustees and Shareholders
of Eaton Vance VT Worldwide Health Sciences Fund
In our opinion, the accompanying statement of assets and liabilities, including the portfolio of investments, and the related statements of operations and of changes in net assets and the financial highlights present fairly, in all material respects, the financial position of Eaton Vance VT Worldwide Health Sciences Fund, a series of Eaton Vance Variable Trust, (the "Fund") at December 31, 2005, and the results of its operations, the changes in its net assets and the financial highlights for each of the periods indicated, in conformity with accounting principles generally accepted in the United States of America. These financial statements and financial highlights (hereafter referred to as "financial statements") are the responsibility of the Fund's management; our responsibility is to express an opinion on these financial statements based on our audits. We conducted our audits of these financial statements in accordance with th e standards of the Public Company Accounting Oversight Board (United States). Those standards require that we plan and perform the audit to obtain reasonable assurance about whether the financial statements are free of material misstatement. An audit includes examining, on a test basis, evidence supporting the amounts and disclosures in the financial statements, assessing the accounting principles used and significant estimates made by management, and evaluating the overall financial statement presentation. We believe that our audits, which included confirmation of securities at December 31, 2005 by correspondence with the custodian, provide a reasonable basis for our opinion.
PricewaterhouseCoopers LLP
Boston, Massachusetts
February 13, 2006
15
VT Worldwide Health Sciences Fund
BOARD OF TRUSTEES' ANNUAL APPROVAL OF THE INVESTMENT ADVISORY AGREEMENT
The investment advisory agreement between Eaton Vance VT Worldwide Health Sciences Fund (the "Fund") and its investment adviser, Orbimed Advisers LLC, provides that the agreement will continue in effect from year to year so long as its continuance is approved at least annually (i) by a vote of a majority of the noninterested Trustees of the Fund cast in person at a meeting called for the purpose of voting on such approval and (ii) by the Trustees of the Fund or by vote of a majority of the outstanding interests of the Fund.
In considering the annual approval of the investment advisory agreement between the Fund and the investment adviser, the Special Committee of the Board of Trustees considered information that had been provided throughout the year at regular Board meetings, as well as information furnished to the Special Committee for a series of meetings held in February and March in preparation for a Board meeting held on March 21, 2005 to specifically consider the renewal of the investment advisory agreement. Such information included, among other things, the following:
• An independent report comparing the Fund's advisory fees with those of comparable funds;
• An independent report comparing the Fund's expense ratio to those of comparable funds;
• Information regarding the Fund's investment performance in comparison to a relevant peer group of funds and appropriate indices;
• The economic outlook and the general investment outlook in relevant investment markets;
• The investment adviser's results and financial condition and the overall organization of the investment adviser;
• The procedures and processes used to determine the fair value of Fund assets and actions taken to monitor and test the effectiveness of such procedures and processes;
• The allocation of brokerage and the benefits received by the investment adviser as a result of brokerage allocation;
• The investment adviser's management of the relationship with the custodian, subcustodians and fund accountants;
• The resources devoted to compliance efforts undertaken by the investment adviser on behalf of the funds it manages and the record of compliance with the investment policies and restrictions and with policies on personal securities transactions;
• The quality, nature, cost and character of the administrative and other non-investment management services provided by Eaton Vance and its affiliates; and
• The terms of the advisory agreement and the reasonableness and appropriateness of the particular fee paid by the Fund for the services describe herein.
The Special Committee also considered the investment adviser's portfolio management capabilities, including information relating to the education, experience, and number of investment professionals and other personnel who provide services under the investment advisory agreement. The Special Committee considered the investment adviser's experience in managing health sciences portfolios. The Special Committee noted the experience of the 21 professional and 9 support staff including portfolio managers, traders and analysts who would provide services under the investment advisory agreement. Several of these individuals hold advanced degrees in science and medicine and have worked in the healthcare industry. The Special Committee evaluated the level of skill required to manage the Fund and concluded that the human resources available at the investment adviser were appropriate to fulfill effectively its duties on behalf of the Fund.
In its review of information with respect to the Fund's investment performance, the Special Committee concluded that the performance of the Fund was acceptable, given the long-term performance record of the investment adviser and the prospects for improved performance of the Fund. With respect to its review of
16
VT Worldwide Health Sciences Fund
BOARD OF TRUSTEES' ANNUAL APPROVAL OF THE INVESTMENT ADVISORY AGREEMENT CONT'D
investment advisory fees, the Special Committee concluded that such fees are reasonable in light of the long-term performance record achieved by the Fund's investment adviser in managing assets using the Fund's strategy. In reviewing the information regarding the expense ratio of the Fund, the Special Committee concluded that, in light of the size of the Fund and the specialized investment profile of the Fund, the expense ratio of the Fund is reasonable.
In addition to the factors mentioned above, the Special Committee reviewed the level of the investment adviser's profits in providing investment management services for the Fund, as well as the investment adviser's implementation of a soft dollar reimbursement program. Pursuant to the soft dollar reimbursement program, the Fund may receive reimbursement payments in respect of third party research services obtained by the investment adviser as a result of soft dollar credits generated through trading on behalf of the Fund. The Special Committee also reviewed the level of profits of Eaton Vance Management and its affiliates for providing administration services for the Fund and for all Eaton Vance funds as a group. In addition, the Special Committee considered the fiduciary duty assumed by the investment adviser in connection with the services rendered to the Fund and the business reputation of the investment adviser and their fin ancial resources. The Trustees concluded that, in light of the services rendered, the profits realized by the investment adviser are not unreasonable. The Special Committee also considered the extent to which the investment adviser of the Fund appears to be realizing benefits from economies of scale in managing the Fund, and concluded that the fee breakpoints which are in place will allow for an equitable sharing of such benefits, when realized, with the shareholders of the Fund.
The Special Committee did not consider any single factor as controlling in determining whether or not to renew the investment advisory agreement. Nor are the items described herein all the matters considered by the Special Committee. In assessing the information provided by Eaton Vance and its affiliates, the Special Committee also took into consideration the benefits to shareholders of investing in a fund that is a part of a large family of funds which provides a large variety of shareholder services.
Based on its consideration of the foregoing factors and conclusions, and such other factors and conclusions as it deemed relevant, and assisted by independent counsel, the Special Committee concluded that the approval of the investment advisory agreement, including the fee structure, is in the interests of shareholders.
17
Eaton Vance VT Worldwide Health Sciences Fund
MANAGEMENT AND ORGANIZATION
Fund Management. The Trustees of Eaton Vance Variable Trust (the Trust) are responsible for the overall management and supervision of the Trust's affairs. The Trustees and officers of the Trust are listed below. Except as indicated, each individual has held the office shown or other offices in the same company for the last five years. Trustees and officers of the Trust hold indefinite terms of office. The "noninterested Trustees" consist of those Trustees who are not "interested persons" of the Trust, as that term is defined under the 1940 Act. The business address of each Trustee and officer is The Eaton Vance Building, 255 State Street, Boston, Massachusetts 02109. As used below, "EVC" refers to Eaton Vance Corp., "EV" refers to Eaton Vance, Inc., "EVM" refers to Eaton Vance Management, "BMR" refers to Boston Management and Research, "EVD" refers to Eaton Vance Distributors, Inc., and "Lloyd George" refers to Lloyd George Investment Management (Bermuda) Limited. EVC and EV are the corporate parent and trustee, respectively, of EVM and BMR. EVD is the Fund's principal underwriter and a wholly-owned subsidiary of EVM. Each officer affiliated with Eaton Vance may hold a position with other Eaton Vance affiliates that is comparable to his or her position with EVM listed below.
Name and
Date of Birth | | Position
with the
Trust | | Term of
Office and
Length of
Service | | Principal Occupation(s)
During Past Five Years | | Number of Portfolios
in Fund Complex
Overseen By
Trustee(1) | | Other Directorships Held | |
| Interested Trustee | | | | | | | | | | | | | |
|
| James B. Hawkes 11/9/41 | | Trustee and President | | Since 2000 | | Chairman, President and Chief Executive Officer of BMR, EVM and EV; Director of EV; Chairman and Chief Executive Officer of EVC; Vice President and Director of EVD. Trustee and/or officer of 161 registered investment companies in the Eaton Vance Fund Complex. Mr. Hawkes is an interested person because of his positions with BMR, EVM, EVC and EV, which are affiliates of the Trust. | | | 161 | | | Director of EVC | |
|
| Noninterested Trustee(s) | | | | | | | | | | | | | |
|
| Benjamin C. Esty 1/2/63 | | Trustee | | Since 2005 | | Roy and Elizabeth Simmons Professor of Business Administration, Harvard University Graduate School of Business Administration (since 2003). Formerly, Associate Professor, Harvard University Graduate School of Business Administration (2000-2003). | | | 152 | | | None | |
|
| Samuel L. Hayes, III 2/23/35 | | Trustee and Chairman of the Board | | Trustee since 2000 and Chairman of the Board since 2005 | | Jacob H. Schiff Professor of Investment Banking Emeritus, Harvard University Graduate School of Business Administration. Director of Yakima Products, Inc. (manufacturer of automotive accessories) (since 2001) and Director of Telect, Inc. (telecommunications services company) (since 2000). | | | 161 | | | Director of Tiffany & Co. (specialty retailer) | |
|
| William H. Park 9/19/47 | | Trustee | | Since 2003 | | Vice Chairman, Commercial Industrial Finance Corp. (specialty finance company) (since 2005). Formerly, President and Chief Executive Officer, Prizm Capital Management, LLC (investment management firm) (2002-2005). Formerly, Executive Vice President and Chief Financial Officer, United Asset Management Corporation (a holding company owning institutional investment management firms) (1982-2001). | | | 161 | | | None | |
|
| Ronald A. Pearlman 7/10/40 | | Trustee | | Since 2003 | | Professor of Law, Georgetown University Law Center (since 1999). Formerly, Tax Partner, Covington & Burling, Washington, DC (1991-2000). | | | 161 | | | None | |
|
18
Eaton Vance VT Worldwide Health Sciences Fund
MANAGEMENT AND ORGANIZATION CONT'D
Name and
Date of Birth | | Position
with the
Trust | | Term of
Office and
Length of
Service | | Principal Occupation(s)
During Past Five Years | | Number of Portfolios
in Fund Complex
Overseen By
Trustee(1) | | Other Directorships Held | |
| Noninterested Trustee(s) (continued) | | | | | | | | | | | | | |
|
| Norton H. Reamer 9/21/35 | | Trustee | | Since 2000 | | President, Chief Executive Officer and a Director of Asset Management Finance Corp. (a specialty finance company serving the investment management industry) (since October 2003). President, Unicorn Corporation (an investment and financial advisory services company) (since September 2000). Formerly, Chairman, Hellman, Jordan Management Co., Inc. (an investment management company) (2000-2003). Formerly, Advisory Director of Berkshire Capital Corporation (investment banking firm) (2002-2003). Formerly Chairman of the Board, United Asset Management Corporation (a holding company owning institutional investment management firms) and Chairman, President and Director, UAM Funds (mutual funds) (1980-2000). | | | 161 | | | None | |
|
| Lynn A. Stout 9/14/57 | | Trustee | | Since 2000 | | Professor of Law, University of California at Los Angeles School of Law (since July 2001). Formerly, Professor of Law, Georgetown University Law Center. | | | 161 | | | None | |
|
| Ralph F. Verni 1/26/43 | | Trustee | | Since 2005 | | Consultant and private investor (since 2000). Formerly, President and Chief Executive Officer, Redwood Investment Systems, Inc. (software developer) (2000). Formerly, President and Chief Executive Officer, State Street Research & Management (investment advisor), SSRM Holdings (parent of State Street Research & Management), and SSR Realty (institutional realty manager) (1992-2000). | | | 161 | | | Director of W.P. Carey & Company LLC
(manager of real estate investment trusts) | |
|
| Principal Officers who are not Trustees | |
|
Name and
Date of Birth | | Position
with the
Trust | | Term of
Office and
Length of
Service | | Principal Occupation(s)
During Past Five Years | |
| Samuel D. Isaly 3/12/45 | | Vice President | | Since 2000 | | Managing Partner of OrbiMed Advisors LLC. Officer of 3 registered investment companies managed by EVM or BMR. | |
|
| Scott H. Page 11/30/59 | | Vice President | | Since 2000 | | Vice President of EVM and BMR. Officer of 14 registered investment companies managed by EVM or BMR. | |
|
| Duncan W. Richardson 10/26/57 | | Vice President | | Since 2000 | | Senior Vice President and Chief Equity Investment Officer of EVM and BMR and Executive Vice President of EVC. Officer of 51 registered investment companies managed by EVM or BMR. | |
|
| Payson F. Swaffield 8/13/56 | | Vice President | | Since 2000 | | Vice President of EVM and BMR. Officer of 14 registered investment companies managed by EVM or BMR. | |
|
| Barbara E. Campbell 6/19/57 | | Treasurer | | Since 2005(2) | | Vice President of EVM and BMR. Officer of 161 registered investment companies managed by EVM or BMR. | |
|
| Alan R. Dynner 10/10/40 | | Secretary | | Since 2000 | | Vice President, Secretary and Chief Legal Officer of BMR, EVM, EVD, EV and EVC. Officer of 161 registered investment companies managed by EVM or BMR. | |
|
| Paul M. O'Neil 7/11/53 | | Chief Compliance Officer | | Since 2004 | | Vice President of EVM and BMR. Officer of 161 registered investment companies managed by EVM or BMR. | |
|
(1) Includes both master and feeder funds in a master-feeder structure.
(2) Prior to 2005, Ms. Campbell served as Assistant Treasurer of the Trust since 2000.
The SAI for the Fund includes additional information about the Trustees and officers of the Fund and can be obtained without charge by calling 1-800-225-6265.
19
This Page Intentionally Left Blank
This Page Intentionally Left Blank
Administrator of Eaton Vance VT Worldwide Health Sciences Fund
Eaton Vance Management
The Eaton Vance Building
255 State Street
Boston, MA 02109
Adviser of Eaton Vance VT Worldwide Health Sciences Fund
OrbiMed Advisors LLC
767 3rd Avenue
New York, NY 10017
Principal Underwriter
Eaton Vance Distributors, Inc.
The Eaton Vance Building
255 State Street
Boston, MA 02109
(617) 482-8260
Custodian
Investors Bank & Trust Company
200 Clarendon Street
Boston, MA 02116
Transfer Agent
Investors Bank & Trust Company
200 Clarendon Street
Boston, MA 02116
Independent Registered Public Accounting Firm
PricewaterhouseCoopers LLP
125 High Street
Boston, MA 02110
Eaton Vance VT Worldwide Health Sciences Fund
The Eaton Vance Building
255 State Street
Boston, MA 02109
This report must be preceded or accompanied by a current prospectus. Before investing, investors should consider carefully the Fund's investment objective(s), risks, and charges and expenses. The Fund's current prospectus contains this and other information about the Fund and is available through your financial advisor. Please read the prospectus carefully before you invest or send money. For further information please call 1-800-225-6265.
VTHSSRC
Item 2. Code of Ethics
The registrant has adopted a code of ethics applicable to its Principal Executive Officer, Principal Financial Officer and Principal Accounting Officer. The registrant undertakes to provide a copy of such code of ethics to any person upon request, without charge, by calling 1-800-262-1122.
Item 3. Audit Committee Financial Expert
The registrant’s Board has designated William H. Park, Samuel L. Hayes, III and Norton H. Reamer, each an independent trustee, as its audit committee financial experts. Mr. Park is a certified public accountant who is the President and Chief Executive Officer of Prizm Capital Management, LLC (investment management firm). Previously, he served as Executive Vice President and Chief Financial Officer of United Asset Management Corporation (“UAM”) (a holding company owning institutional investment management firms). Mr. Hayes is the Jacob H. Schiff Professor of Investment Banking Emeritus of the Harvard University Graduate School of Business Administration. Mr. Reamer is the President, Chief Executive Officer and a Director of Asset Management Finance Corp. (a specialty finance company serving the investment management industry) and is President of Unicorn Corporation (an investment and financial advisory services company). Formerly, Mr. Reamer was Chairman of Hellman, Jordan Management Co., Inc. (an investment management company) and Advisory Director of Berkshire Capital Corporation (an investment banking firm), Chairman of the Board of UAM and Chairman, President and Director of the UAM Funds (mutual funds).
Item 4. Principal Accountant Fees and Services
(a)-(d)
The following table presents aggregate fees billed to the registrant for the fiscal years ended December 31, 2004, and December 31, 2005 by the registrant’s principal accountant for professional services rendered for the audit of the registrant’s annual financial statements and fees billed for other services rendered by the principal accountant during those periods.
Eaton Vance VT Floating-Rate Fund
Fiscal Years Ended | | 12/31/04 | | 12/31/05 | |
| | | | | |
Audit Fees | | $ | 23,880 | | $ | 25,565 | |
| | | | | |
Audit-Related Fees(1) | | $ | 0 | | $ | 0 | |
| | | | | |
Tax Fees(2) | | $ | 6,100 | | $ | 6,405 | |
| | | | | |
All Other Fees(3) | | $ | 0 | | $ | 0 | |
| | | | | |
Total | | $ | 29,980 | | $ | 31,970 | |
Eaton Vance VT Worldwide Health Sciences Fund
Fiscal Years Ended | | 12/31/04 | | 12/31/05 | |
| | | | | |
Audit Fees | | $ | 21,650 | | $ | 22,900 | |
| | | | | |
Audit-Related Fees(1) | | $ | 0 | | $ | 0 | |
| | | | | |
Tax Fees(2) | | $ | 2,925 | | $ | 3,100 | |
| | | | | |
All Other Fees(3) | | $ | 0 | | $ | 0 | |
| | | | | |
Total | | $ | 24,575 | | $ | 26,000 | |
(1) Audit-related fees consist of the aggregate fees billed for assurance and related services that are reasonably related to the performance of the audit of the registrant’s financial statements and are not reported under the category of audit fees.
(2) Tax fees consist of the aggregate fees billed for professional services rendered by the principal accountant relating to tax compliance, tax advice, and tax planning and specifically include fees for tax return preparation.
(3) All other fees consist of the aggregate fees billed for products and services provided by the registrant’s principal accountant other than audit, audit-related, and tax services.
During each of the fiscal years ended December 31, 2004 and December 31, 2005, $35,000 was billed by D&T, the principal accountant to certain Series of the Trust for work done in connection with its Rule 17Ad-13 examination of Eaton Vance Management’s assertion that it has maintained an effective internal control structure over sub-transfer agent and registrar functions, such services being pre-approved in accordance with Rule 2-01(c)(7)(ii) of Regulation S-X.
(e)(1) The registrant’s audit committee has adopted policies and procedures relating to the pre-approval of services provided by the registrant’s principal accountant (the “Pre-Approval Policies”). The Pre-Approval Policies establish a framework intended to assist the audit committee in the proper discharge of its pre-approval responsibilities. As a general matter, the Pre-Approval Policies (i) specify certain types of audit, audit-related, tax, and other services determined to be pre-approved by the audit committee; and (ii) delineate specific procedures governing the mechanics of the pre-approval process, including the approval and monitoring of audit and non-audit service fees. Unless a service is specifically pre-approved under the Pre-Approval Policies, it must be separately pre-approved by the audit committee.
The Pre-Approval Policies and the types of audit and non-audit services pre-approved therein must be reviewed and ratified by the registrant’s audit committee at least annually. The registrant’s audit committee maintains full responsibility for the appointment, compensation, and oversight of the work of the registrant’s principal accountant.
(e)(2) No services described in paragraphs (b)-(d) above were approved by the registrant’s audit committee pursuant to the “de minimis exception” set forth in Rule 2-01 (c)(7)(i)(C) of Regulation S-X.
(f) Not applicable.
(g) The following table presents (i) the aggregate non-audit fees (i.e., fees for audit-related, tax, and other services) billed to the registrant by the registrant’s principal accountant for the last two fiscal years of the registrant; and (ii) the aggregate non-audit fees (i.e., fees for audit-related, tax, and other services) billed to the Eaton Vance organization by the registrant’s principal accountant for the last two fiscal years of the registrant.
| | 12/31/04 | | 12/31/05 | |
Fiscal Years Ended | | PwC | | D&T | | PwC | | D&T | |
| | | | | | | | | |
Registrant | | $ | 2,925 | | $ | 6,100 | | $ | 3,100 | | $ | 6,405 | |
| | | | | | | | | |
Eaton Vance(1) | | $ | 84,490 | | $ | 334,713 | | $ | 61,422 | | $ | 179,500 | |
| | | | | | | | | |
Total | | $ | 87,415 | | $ | 340,813 | | $ | 64,522 | | $ | 185,905 | |
(1) The investment adviser to the registrant, as well as any of its affiliates that provide ongoing services to the registrant, are subsidiaries of Eaton Vance Corp.
(h) The registrant’s audit committee has considered whether the provision by the registrant’s principal accountant of non-audit services to the registrant’s investment adviser and any entity controlling, controlled by, or under common control with the adviser that provides ongoing services to the registrant that were not pre-approved pursuant to Rule 2-01(c)(7)(ii) of Regulation S-X is compatible with maintaining the principal accountant’s independence.
Item 5. Audit Committee of Listed registrants
Not required in this filing.
Item 6. Schedule of Investments
Please see schedule of investments contained in the Report to Stockholders included under Item 1 of this Form N-CSR.
Item 7. Disclosure of Proxy Voting Policies and Procedures for Closed-End Management Investment Companies
Not required in this filing.
Item 8. Portfolio Managers of Closed-End Management Investment Companies
Not required in this filing.
Item 9. Purchase of Equity Securities by Closed-End Management Investment Company and Affiliated Purchases.
Not required in this filing.
Item 10. Submission of Matters to a Vote of Security Holders.
Effective February 7, 2005, the Governance Committee of the Board of Trustees revised the procedures by which a Fund’s shareholders may recommend nominees to the registrant’s Board of Trustees to add the following (highlighted):
The Governance Committee shall, when identifying candidates for the position of Independent Trustee, consider any such candidate recommended by a shareholder of a Fund if such recommendation contains (i)sufficient background information concerning the candidate, including evidence the candidate is
willing to serve as an Independent Trustee if selected for the position; and (ii) is received in a sufficiently timely manner (and in any event no later than the date specified for receipt of shareholder proposals in any applicable proxy statement with respect to a Fund). Shareholders shall be directed to address any such recommendations in writing to the attention of the Governance Committee, c/o the Secretary of the Fund. The Secretary shall retain copies of any shareholder recommendations which meet the foregoing requirements for a period of not more than 12 months following receipt. The Secretary shall have no obligation to acknowledge receipt of any shareholder recommendations.
Item 11. Controls and Procedures
(a) It is the conclusion of the registrant’s principal executive officer and principal financial officer that the effectiveness of the registrant’s current disclosure controls and procedures (such disclosure controls and procedures having been evaluated within 90 days of the date of this filing) provide reasonable assurance that the information required to be disclosed by the registrant has been recorded, processed, summarized and reported within the time period specified in the Commission’s rules and forms and that the information required to be disclosed by the registrant has been accumulated and communicated to the registrant’s principal executive officer and principal financial officer in order to allow timely decisions regarding required disclosure.
(b) There have been no changes in the registrant’s internal controls over financial reporting during the second fiscal quarter of the period covered by this report that has materially affected, or is reasonably likely to materially affect the registrant’s internal control over financial reporting.
Item 12. Exhibits
(a)(1) | | Registrant’s Code of Ethics – Not applicable (please see Item 2). |
(a)(2)(i) | | Treasurer’s Section 302 certification. |
(a)(2)(ii) | | President’s Section 302 certification. |
(b) | | Combined Section 906 certification. |
Signatures
Pursuant to the requirements of the Securities Exchange Act of 1934 and the Investment Company Act of 1940, the registrant has duly caused this report to be signed on its behalf by the undersigned, thereunto duly authorized.
Eaton Vance Variable Trust | | |
| |
By: | /s/ James B. Hawkes | | |
| James B. Hawkes | |
| President | |
| |
| |
Date: | February 15, 2006 | | |
| | | | | |
Pursuant to the requirements of the Securities Exchange Act of 1934 and the Investment Company Act of 1940, this report has been signed below by the following persons on behalf of the registrant and in the capacities and on the dates indicated.
By: | /s/ Barbara E. Campbell | | |
| Barbara E. Campbell | |
| Treasurer | |
| |
| |
Date: | February 15, 2006 | | |
| | |
| | |
By: | /s/ James B. Hawkes | | |
| James B. Hawkes | |
| President | |
| |
| |
Date: | February 15, 2006 | | |
| | | | |