united states
securities and exchange commission
washington, d.c. 20549
form n-csr
certified shareholder report of registered management
investment companies
Investment Company Act file number 811-10123
The North Country Funds
(Exact name of Registrant as specified in charter)
80 Arkay Drive, Hauppauge, NY 11788
(Address of principal executive offices) (Zip code)
James Ash
c/o Gemini Fund Services, LLC., 80 Arkay Drive, Hauppauge, NY 11788
(Name and address of agent for service)
Registrant's telephone number, including area code: 631-470-2619
Date of fiscal year end: 11/30
Date of reporting period: 11/30/16
Item 1. Reports to Stockholders.
Investment Adviser
North Country Investment Advisers, Inc.
250 Glen Street
Glens Falls, NY 12801
Administrator and
Fund Accountant
Gemini Fund Services, LLC
80 Arkay Drive
Hauppauge, NY 11788
Investor Information: (888) 350- 2990
The North Country Funds
Equity Growth Fund
Intermediate Bond Fund

Annual Report
November 30, 2016
This report and the financial statements contained herein are submitted for the general information of shareholders and are not authorized for distribution to prospective investors unless preceded or accompanied by an effective prospectus. Nothing herein contained is to be considered an offer of sale or solicitation of an offer to buy shares of the North Country Funds. Such offering is made only by prospectus, which includes details as to offering price and other material information.
The North Country Funds
ANNUAL REPORT
November 30, 2016
ECONOMIC SUMMARY
With an uptick in U.S. Gross Domestic Product (GDP) for the third quarter to 2.9% from a dismal Q1 0.8% and Q2 1.4%, combined with the sudden increased optimism following the Trump Presidential victory, the outlook for the economy and the markets has turned markedly positive. Economic data has improved somewhat recently compared to the ever so slight improvements we had been seeing for many months. These positive contributions to the economy could very well be the spark that investors have been waiting. With markets holding steady near their all-time highs we remain encouraged for the prospects of continued improvements into 2017. The Federal Reserve Open Market Committee’s GDP forecast for 2017 is 1.6%-2.4% and their longer-run forecast for the U.S. economy is 1.8%-2.0%.
Interest rate futures imply an increased likelihood that the Federal Reserve will raise interest rates in December of 2016, and this is in line with consensus forecasts. Federal Funds probabilities indicate the next Federal Reserve Open Market Committee (FOMC) rate hike, after December of 2016, is likely to occur in June or July of 2017. Recent FOMC comments continue to indicate that the pace of any future increases will be slow.
Inflation remains modest; however both the Consumer Price Index and Personal Consumption Expenditure Index measures of inflation have risen on a month-to-month and year-to-year basis. For the one year period ending September 30, 2016 the Personal Consumption Expenditure deflator rose 1.20% and the Personal Consumption Expenditure Core Index rose 1.7% for the same period. The September 2016 Consumer Price Index was reported at 1.50% year-over-year, compared to 1.1% in August. Labor market conditions remain positive with 161,000 new jobs added to non-farm payrolls in October. The unemployment rate was unchanged at 4.9%, while the participation rate declined from 62.9% to 62.8%.
Wage Pressure remains modest. However, wages may be beginning to show a modest upward trend with October’s average hourly earnings up 2.8% year-over-year. The average hourly work week was unchanged in October at 34.4 hours.
The Equity Growth Fund
For the six months and one year ended November 30, 2016 the North Country Equity Growth Fund returned 4.65% and 2.33% while the S&P 5001 returned 6.01% and 8.06% respectively. On an annualized basis, the three, five, and ten year total returns for the North Country Equity Growth
| 1 | The S&P 500 is an unmanaged market capitalization-weighted index of common stocks. You cannot invest directly in an index. |
Fund were 7.08%, 12.50% and 5.37% versus the S&P 500 at 9.07%, 14.45% and 6.89% respectively.
The Equity Fund began the fiscal year in December of 2015 with an over-weight, relative to the S&P 500 in the consumer discretionary, healthcare and information technology sectors. We carried a marketweight in the financials, industrials, and material sectors. The telecommunications, utility, energy and consumer staples sectors were at an underweight.
In March 2016, the healthcare sector was reduced to a marketweight from an overweight and the energy sector was increased from an underweight to marketweight. Healthcare was reduced due to valuations and potential political and regulatory headwinds facing the industry. We raised energy to a market weight due to valuations and signs that oil prices were bottoming. Earnings estimates were increasing and the sector offered attractive dividend yields.
In November 2016, the industrial sector was increased from an underweight to marketweight. Valuations were attractive and the sector stands to benefit from a potential increase in infrastructure spending in the U.S.
The Intermediate Bond Fund
The North Country Intermediate Bond Fund returned -0.35% for the six month period ending November 30, 2016; while its benchmark, the Barclays U.S. Aggregate Bond Index2 returned -0.92%. Effective April 1, 2015, the North Country Intermediate Bond Fund changed its benchmark from the Bank of America Merrill Lynch Corporate/Government “A” Rated or better 1-10 Year Index to the Barclays U.S. Aggregate Bond Index The North Country Intermediate Bond Fund had annualized total returns for the one year, three year, five year and ten year periods ending November 30, 2016 of 1.25%, 1.37%, 1.73% and 2.72% while the Barclays U.S. Aggregate Bond Index returned 2.17%, 2.79%, 2.43% and 4.27% for the respective time periods. The returns of the Bank of America Merrill Lynch Corporate/Government “A” Rated or better 1-10 Year Index for the one year, three year, five year and ten year periods ending November 30, 2016 were 1.28%, 1.71%, 1.73% and 3.53% for the respective time periods.
The North Country Intermediate Bond Fund outperformed its benchmark for the six-month and one year period ending November 30, 2016 due to an average maturity than its benchmark in a time period where interest rates rose in general and as credit spreads narrowed. The North Country Intermediate Bond Fund underperformed it benchmark for one year period ending November 30, 2016 as The North Country Intermediate Bond Fund had sought to benefit from a low interest rate environment accompanied by expectations of modest economic growth and inflation, and attractive yields in corporate bonds relative to U.S. Treasuries.
| 2 | The Barclays US Aggregate Bond Index measures a broad spectrum of U.S. investment grade taxable fixed income securities including treasury, agency, corporate, mortgage-backed, asset backed and international dollar denominated issues with maturities of 1 year or more. Effective April 1, 2015 the fund changed its benchmark to the Barclays US Aggregate Bond Index. |
For the three year and five year periods ending November 30, 2016 the North Country Intermediate Bond Fund underperformed its benchmark as we sought to benefit from opportunities for attractive yields in corporate bonds by maintaining an overweight in corporate bonds relative to our benchmark.
The relative investment performance for the ten-year period ending November 30, 2016 was impacted by the fund maintaining a shorter than benchmark duration during the period from November 2006 into the first quarter of 2007, when the yield curve was at first flat and then inverted. These occurrences negatively impacted the returns of short-term bonds, those maturing within two years, relative to longer term bonds, those maturing in ten years or beyond, and consequently our performance relative to our benchmark was negatively impacted. Additionally, an overweight in corporate bonds relative to our benchmark during the credit crisis, and a widening of credit spreads during that time frame, detracted from our relative performance.
Equity Growth Fund:
| Annual Fund Operating Expenses: | | (As a Percentage of Net Assets) |
| Total Annual Operating Expenses: | | 1.03% |
| | | |
| Intermediate Bond Fund: | | |
| | | |
| Annual Fund Operating Expenses: | | (As a Percentage of Net Assets) |
| Total Annual Operating Expenses: | | 0.82% |
Average Annual Total Returns as of September 30, 2016 (Latest Calendar Quarter)
| | | 1 Year | | 5 Years | | 10 Years |
| | | | | | | |
| North Country Equity Growth Fund | | 9.95% | | 14.32% | | 5.69% |
| | | | | | | |
| North Country Intermediate Bond Fund | | 4.30% | | 2.40% | | 3.17% |
| | | | | | | |
| Average Annual Total Returns as of November 30, 2016 (Fiscal Year-End) |
| | | | | | | |
| | | 1 Year | | 5 Years | | 10 Years |
| | | | | | | |
| North Country Equity Growth Fund | | 2.33% | | 12.50% | | 5.37% |
| | | | | | | |
| North Country Intermediate Bond Fund | | 1.25% | | 1.73% | | 2.72% |
Performance data quoted above is historical and is no guarantee of future results. Current performance may be higher or lower than the performance data quoted. The principal value and investment return of an investment will fluctuate so that your shares, when redeemed, may be
worth more or less than their original cost. You can obtain performance data current to the most recent month-end by calling 1-888-350-2990. Information provided is unaudited.
The views expressed are as November 30, 2016 and are those of the adviser, North Country Investment Advisers, Inc. The views are subject to change at any time in response to changing circumstances in the markets and are not intended to predict or guarantee the future performance of any individual security market sector or the markets generally, or the North Country Funds.
Not FDIC insured. Not obligations of or guaranteed by the bank. May involve investment risks, including possible loss of the principal invested.
5708-NLD-12/20/2016
North Country Equity Growth Fund
Growth of $10,000 Investment |
This chart illustrates the comparison of a hypothetical investment of $10,000 in the North Country Equity Growth Fund (assuming reinvestment of all dividends and distributions) versus the Fund’s benchmark index.
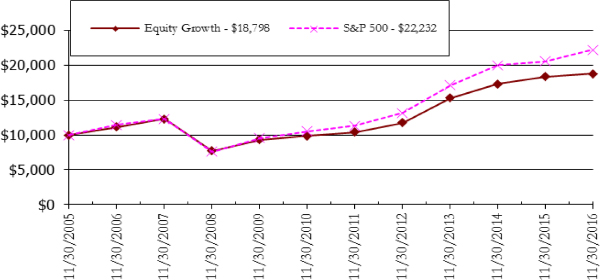
Average Annual Total Returns as of November 30, 2016
| | | 1 Year | | 5 Years | | 10 Years |
| North Country Equity Growth Fund | | 2.33% | | 12.50% | | 5.37% |
| S&P 500 | | 8.06% | | 14.45% | | 6.89% |
The S&P 500 is a market capitalization-weighted index of 500 widely held common stocks. Indexes and benchmarks are unmanaged and do not reflect the deduction of expenses associated with a mutual fund, such as investment management and fund accounting fees. Investors cannot invest directly in an index or benchmark, although they can invest in its underlying securities or funds.
Past performance is not indicative of future results. The investment return and NAV will fluctuate, so that an investor’s shares, when redeemed, may be worth more or less than their original cost. Total returns are calculated assuming reinvestment of all dividends and capital gains distributions.
The returns do not reflect a reduction for taxes a shareholder would pay on the redemption of fund shares or fund distributions.
North Country Intermediate Bond Fund
Growth of $10,000 Investment |
This chart illustrates the comparison of a hypothetical investment of $10,000 in the North Country Intermediate Bond Fund (assuming reinvestment of all dividends and distributions) versus the Fund’s benchmark index.
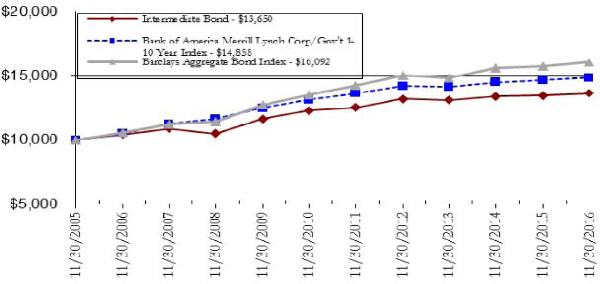
Average Annual Total Returns as of November 30, 2016
| | | 1 Year | | 5 Years | | 10 Years |
| North Country Intermediate Bond Fund | | 1.25% | | 1.73 % | | 2.72% |
| BofAML Corp/Govt. 1-10 year Index | | 1.28% | | 1.73% | | 3.53% |
| Barclays Aggregate Bond Index | | 2.17% | | 2.43% | | 4.27% |
The Bank of America Merrill Lynch Corporate/Government 1-10 year maturity “A” rated or better index is widely used as a broad measure of performance of bonds with maturities of less than 10 years. The Barclays Aggregate Bond Index is an unmanaged index which represents the U.S. investment-grade fixed-rate bond market (including government and corporate securities, mortgage pass-through securities and asset-backed securities). Investors cannot invest directly in an index or benchmark. The indexes are unmanaged and do not reflect the deduction of expenses associated with a mutual fund, such as investment management and fund accounting fees. Investors cannot invest directly in an index, although they can invest in its underlying securities.
Past performance is not indicative of future results. The investment return and NAV will fluctuate, so that an investor’s shares, when redeemed, may be worth more or less than their original cost. Total returns are calculated assuming reinvestment of all dividends and capital gains distributions.
The returns do not reflect a reduction for taxes a shareholder would pay on the redemption of fund shares or fund distributions.
North Country Equity Growth Fund
Portfolio Summary
November 30, 2016 |
| Industries | | % of Net Assets | | | Industries | | % of Net Assets | |
| Common Stock | | | 94.8 | % | | Airlines | | | 1.6 | % |
| Internet | | | 14.8 | % | | Healthcare-Services | | | 1.6 | % |
| Banks | | | 12.4 | % | | Miscellaneous Manufacturing | | | 1.3 | % |
| Retail | | | 6.8 | % | | Beverages | | | 1.2 | % |
| Pharmaceuticals | | | 6.2 | % | | Oil & Gas Services | | | 1.2 | % |
| Diversified Finanancial Services | | 5.9 | % | | Auto Manufacturers | | | 1.1 | % |
| Software | | | 5.8 | % | | Cosmetics/Personal Care | | | 1.1 | % |
| Oil & Gas | | | 5.6 | % | | Electronics | | | 0.9 | % |
| Biotechnology | | | 4.7 | % | | Machinery-Diversified | | | 0.9 | % |
| Computers | | | 3.7 | % | | Chemicals | | | 0.8 | % |
| Transportation | | | 3.5 | % | | Commercial Services | | | 0.8 | % |
| Building Materials | | | 2.8 | % | | Healthcare-Products | | | 0.7 | % |
| Food | | | 2.4 | % | | Electric | | | 0.5 | % |
| Media | | | 2.4 | % | | Telecommunications | | | 0.2 | % |
| Insurance | | | 2.0 | % | | Money Market Fund | | | 5.1 | % |
| Apparel | | | 1.9 | % | | Other assets in excess of liabilities | | 0.1 | % |
| | | | | | | Total Net Assets | | | 100.0 | % |
| Top Ten Holdings | | % of Net Assets | | | Top Ten Holdings | | % of Net Assets | |
| Amazon.com, Inc. | | | 4.4 | % | | Microsoft Corp. | | | 2.5 | % |
| Facebook, Inc. | | | 3.9 | % | | Alphabet, Inc. - Class A | | | 2.2 | % |
| Visa, Inc. | | | 3.9 | % | | JPMorgan Chase & Co. | | | 2.1 | % |
| Apple, Inc. | | | 3.7 | % | | Berkshire Hathaway, Inc. | | | 2.0 | % |
| Alphabet, Inc. - Class C | | | 2.6 | % | | FedEx Corp. | | | 1.8 | % |
North Country Intermediate Bond Fund
Portfolio Summary
November 30, 2016 |
| Industries | | % of Net Assets | | | Industries | | % of Net Assets | |
| Corporate Bonds | | | 57.2 | % | | Transportation | | | 1.0 | % |
| Banks | | | 15.1 | % | | Electrical Components & Equipment | | 0.7 | % |
| Telecommunications | | | 8.0 | % | | Healthcare-Products | | | 0.7 | % |
| Oil & Gas | | | 7.0 | % | | Iron / Steel | | | 0.7 | % |
| Chemicals | | | 3.2 | % | | Oil & Gas Services | | | 0.7 | % |
| Insurance | | | 2.7 | % | | Miscellaneous Manufacturering | | 0.6 | % |
| Aerospace / Defense | | | 2.3 | % | | Household Products/Wares | | | 0.6 | % |
| Software | | | 2.3 | % | | Beverages | | | 0.6 | % |
| Retail | | | 2.3 | % | | Media | | | 0.3 | % |
| Electric | | | 1.6 | % | | Diversified Financial Services | | | 0.3 | % |
| Pharmaceutical | | | 1.6 | % | | Biotechnology | | | 0.3 | % |
| Food | | | 1.3 | % | | U.S. Government Agency Obligations | | 39.2 | % |
| Computers | | | 1.3 | % | | Government Agencies | | | 39.2 | % |
| Semiconductors | | | 1.0 | % | | Money Market Fund | | | 2.9 | % |
| Healthcare-Services | | | 1.0 | % | | Other Assets Less Liabilites | | | 0.7 | % |
| | | | | | | Total Net Assets | | | 100.0 | % |
| Top Ten Holdings | | % of Net Assets | |
| Federal Home Loan Bank, 2.795, due 10/17/2023 | | | 2.6 | % |
| Federal Home Loan Bank, 2.5%, due 12/9/2022 | | | 2.6 | % |
| Federal National Mortgage Association, 2.625%, due 9/6/2024 | | | 2.6 | % |
| Federal Farm Credit Bank, 2.6%, due 5/26/2026 | | | 2.6 | % |
| Wells Fargo & Co 3.45%, due 2/13/2023 | | | 2.5 | % |
| Federal Farm Credit Bank, 2.35%, due 8/14/2024 | | | 2.5 | % |
| Federal National Mortgage Association 2.125%, due 4/24/2026 | | | 2.4 | % |
| AT&T, Inc. 3.0%, due 2/15/2022 | | | 2.3 | % |
| Federal National Mortgage Association 1.625% due 11/27/2018 | | | 1.9 | % |
| Federal Home Loan Mortgage Corp. 2.0%, due 12/10/2021 | | | 1.9 | % |
| | THE NORTH COUNTRY FUNDS | |
| |
EQUITY GROWTH FUND
SCHEDULE OF INVESTMENTS |
| November 30, 2016 |
| | | | | | Fair | |
| Shares | | | | | Value | |
| COMMON STOCK - 94.8 % | | | | |
| Airlines - 1.6% | | | | |
| | 40,000 | | | Southwest Airlines Co. | | $ | 1,864,400 | |
| | | | | | | | | |
| Apparel - 1.9% | | | | |
| | 45,500 | | | Under Armour, Inc. - Class A * | | | 1,401,400 | |
| | 34,999 | | | Under Armour, Inc. - Class C * | | | 902,274 | |
| | | | | | | | 2,303,674 | |
| Auto Manufacturers - 1.1% | | | | |
| | 7,000 | | | Tesla Motors, Inc. * | | | 1,325,800 | |
| | | | | | | | | |
| Banks - 12.4% | | | | |
| | 100,385 | | | Bank of America Corp. | | | 2,120,131 | |
| | 25,000 | | | BB&T Corp. | | | 1,131,250 | |
| | 20,000 | | | Capital One Financial Corp. | | | 1,680,800 | |
| | 10,000 | | | Goldman Sachs Group, Inc. | | | 2,192,900 | |
| | 32,000 | | | JPMorgan Chase & Co. | | | 2,565,440 | |
| | 50,000 | | | Morgan Stanley | | | 2,068,000 | |
| | 32,300 | | | US BanCorp. | | | 1,602,726 | |
| | 30,000 | | | Wells Fargo & Co. | | | 1,587,600 | |
| | | | | | | | 14,948,847 | |
| Beverages - 1.2% | | | | |
| | 14,200 | | | PepsiCo, Inc. | | | 1,421,420 | |
| | | | | | | | | |
| Biotechnology - 4.7% | | | | |
| | 12,500 | | | Amgen, Inc. | | | 1,800,875 | |
| | 6,000 | | | Biogen, Inc. * | | | 1,764,420 | |
| | 11,000 | | | Celgene Corp. * | | | 1,303,610 | |
| | 10,000 | | | Gilead Sciences, Inc. | | | 737,000 | |
| | | | | | | | 5,605,905 | |
| Building Materials - 2.8% | | | | |
| | 55,000 | | | Masco Corp. | | | 1,740,750 | |
| | 12,500 | | | Vulcan Materials Co. | | | 1,570,625 | |
| | | | | | | | 3,311,375 | |
| Chemicals - 0.8% | | | | |
| | 8,000 | | | International Flavors & Fragrances, Inc. | | | 968,400 | |
| | | | | | | | | |
| Commercial Services - 0.8% | | | | |
| | 25,000 | | | PayPal Holdings, Inc. * | | | 982,000 | |
| | | | | | | | | |
| Computers / Network Products - 3.7% | | | | |
| | 40,000 | | | Apple, Inc. | | | 4,420,800 | |
| | | | | | | | | |
| Cosmetics/Personal Care - 1.1% | | | | |
| | 15,500 | | | Procter & Gamble Co. | | | 1,278,130 | |
| | | | | | | | | |
| Diversified Financial Services - 5.9% | | | | |
| | 3,570 | | | BlackRock, Inc. | | | 1,323,720 | |
| | 20,000 | | | Intercontinental Exchange, Inc. | | | 1,108,000 | |
| | 60,000 | | | Visa, Inc. | | | 4,639,200 | |
| | | | | | | | 7,070,920 | |
| | | | | | Fair | |
| Shares | | | | | Value | |
| | | | | | | | | |
| Electric - 0.5% | | | | |
| | 5,000 | | | NextEra Energy, Inc. | | $ | 571,150 | |
| | | | | | | | | |
| Electronics - 0.9% | | | | |
| | 10,000 | | | Honeywell International, Inc. | | | 1,139,400 | |
| | | | | | | | | |
| Food - 2.4% | | | | |
| | 20,000 | | | General Mills, Inc. | | | 1,218,800 | |
| | 50,000 | | | Kroger Co. | | | 1,615,000 | |
| | | | | | | | 2,833,800 | |
| Healthcare-Products - 0.7% | | | | |
| | 7,500 | | | Stryker Corp. | | | 852,450 | |
| | | | | | | | | |
| Healthcare-Services - 1.6% | | | | |
| | 12,500 | | | UnitedHealth Group, Inc. | | | 1,979,000 | |
| | | | | | | | | |
| Insurance - 2.0% | | | | |
| | 15,500 | | | Berkshire Hathaway, Inc. * | | | 2,440,320 | |
| | | | | | | | | |
| Internet - 14.8% | | | | |
| | 3,499 | | | Alphabet, Inc. - Class A * | | | 2,652,382 | |
| | 4,000 | | | Alphabet, Inc. - Class C * | | | 3,103,520 | |
| | 7,000 | | | Amazon.com, Inc. * | | | 5,253,990 | |
| | 40,000 | | | Facebook, Inc. * | | | 4,736,800 | |
| | 13,000 | | | Netflix, Inc. * | | | 1,521,000 | |
| | 30,000 | | | Twitter, Inc. * | | | 554,700 | |
| | | | | | | | 17,822,392 | |
| Machinery - Diversified - 0.9% | | | | |
| | 8,000 | | | Cummins, Inc. | | | 1,134,240 | |
| | | | | | | | | |
| Media - 2.4% | | | | |
| | 15,000 | | | Time Warner, Inc. | | | 1,377,300 | |
| | 15,345 | | | Walt Disney Co. | | | 1,520,997 | |
| | | | | | | | 2,898,297 | |
| Miscellaneous Manufacturing - 1.3% | | | | |
| | 50,000 | | | General Electric Co. | | | 1,538,000 | |
| | | | | | | | | |
| Oil & Gas Producers - 5.6% | | | | |
| | 15,000 | | | Apache Corp. | | | 989,250 | |
| | 12,500 | | | Chevron Corp. | | | 1,394,500 | |
| | 14,750 | | | ConocoPhillips | | | 715,670 | |
| | 5,000 | | | EOG Resources, Inc. | | | 512,600 | |
| | 17,000 | | | Exxon Mobil Corp. | | | 1,484,100 | |
| | 20,000 | | | Phillips 66 | | | 1,661,600 | |
| | | | | | | | 6,757,720 | |
| Oil & Gas Services - 1.2% | | | | |
| | 10,000 | | | Baker Hughes, Inc. | | | 643,300 | |
| | 10,000 | | | Schlumberger, Ltd. | | | 840,500 | |
| | | | | | | | 1,483,800 | |
The accompanying notes are an integral part of these financial statements
| | THE NORTH COUNTRY FUNDS | |
| |
EQUITY GROWTH FUND
SCHEDULE OF INVESTMENTS (Continued) |
| November 30, 2016 |
| | | | | | Fair | |
| Shares | | | | | Value | |
| Pharmaceuticals - 6.2% | | | | |
| | 20,000 | | | AmerisourceBergen Corp. | | $ | 1,559,800 | |
| | 15,000 | | | Bristol-Myers Squibb Co. | | | 846,600 | |
| | 15,000 | | | Johnson & Johnson | | | 1,669,500 | |
| | 27,900 | | | Merck & Co, Inc. | | | 1,707,201 | |
| | 52,000 | | | Pfizer, Inc. | | | 1,671,280 | |
| | | | | | | | 7,454,381 | |
| Retail - 6.8% | | | | |
| | 10,000 | | | Costco Wholesale Corp. | | | 1,501,100 | |
| | 16,000 | | | CVS Health Corp. | | | 1,230,240 | |
| | 20,000 | | | Dick’s Sporting Goods, Inc. | | | 1,181,400 | |
| | 12,500 | | | Domino’s Pizza, Inc. | | | 2,100,500 | |
| | 10,000 | | | Starbucks Corp. | | | 579,700 | |
| | 22,500 | | | Wal-Mart Stores, Inc. | | | 1,584,675 | |
| | | | | | | | 8,177,615 | |
| Software - 5.8% | | | | |
| | 27,500 | | | Activision Blizzard, Inc. | | | 1,006,775 | |
| | 15,000 | | | Cerner Corp. * | | | 746,700 | |
| | 50,000 | | | Microsoft Corp. | | | 3,013,000 | |
| | 30,000 | | | salesforce.com, Inc. * | | | 2,160,000 | |
| | | | | | | | 6,926,475 | |
| | | | | | Fair | |
| Shares | | | | | Value | |
| Telecommunications - 0.2% | | | | |
| | 5,000 | | | Verizon Communications, Inc. | | $ | 249,500 | |
| | | | | | | | | |
| Transportation - 3.5% | | | | |
| | 11,500 | | | FedEx Corp. | | | 2,204,205 | |
| | 10,000 | | | Union Pacific Corp. | | | 1,013,300 | |
| | 9,000 | | | United Parcel Service, Inc. | | | 1,043,280 | |
| | | | | | | | 4,260,785 | |
| | | | | | | | | |
| TOTAL COMMON STOCK (Cost - $66,571,946) | | | 114,020,996 | |
| | | | | | | | | |
| MONEY MARKET FUND - 5.1% | | | | |
| | 6,175,193 | | | BlackRock Liquidity TempCash | | | | |
| | | | | Fund - Dollar Shares, 0.24% (a) | | | 6,175,193 | |
| TOTAL MONEY MARKET FUND | | | 6,175,193 | |
| (Cost - $6,175,193) | | | | |
| | | | | | | | | |
| TOTAL INVESTMENTS - 99.9% | | | | |
| (Cost - $72,747,139)(b) | | $ | 120,196,189 | |
| Other assets less liabilities - 0.1% | | | 42,195 | |
| TOTAL NET ASSETS - 100.0% | | $ | 120,238,384 | |
| * | Non-income producing security. |
| (a) | Variable rate yield; the coupon rate shown represents the rate as of November 30, 2016. |
| (b) | Represents cost for financial reporting purposes. Aggregate cost for federal tax purposes is $72,747,139 and differs from market value by unrealized appreciation (depreciation) of securities as follows: |
| | Unrealized Appreciation: | | $ | 47,897,534 | |
| | Unrealized Depreciation: | | | (448,484 | ) |
| | Net Unrealized Appreciation | | $ | 47,449,050 | |
The accompanying notes are an integral part of these financial statements
| | THE NORTH COUNTRY FUNDS | |
| |
| INTERMEDIATE BOND FUND |
| SCHEDULE OF INVESTMENTS |
| November 30, 2016 |
| Principal | | | | | Fair | |
| Amount | | | | | Value | |
| CORPORATE BONDS - 57.2% | | | | |
| Aerospace / Defense - 2.3% | | | | |
| | | | | Boeing Co. | | | | |
| $ | 250,000 | | | 2.25%, due 6/15/2026 | | $ | 234,642 | |
| | | | | General Dynamics Corp. | | | | |
| | 500,000 | | | 2.25%, due 11/15/2022 | | | 494,186 | |
| | | | | Lockheed Martin Corp. | | | | |
| | 500,000 | | | 3.35%, due 9/15/2021 | | | 518,816 | |
| | | | | Rockwell Collins, Inc. | | | | |
| | 500,000 | | | 5.25%, due 7/15/2019 | | | 538,381 | |
| | | | | | | | 1,786,025 | |
| Banks - 15.1% | | | | |
| | | | | Bank of America Corp. | | | | |
| | 500,000 | | | 2.65%, due 4/1/2019 | | | 505,473 | |
| | 1,000,000 | | | 4%, due 1/22/2025 | | | 1,001,694 | |
| | | | | BB&T Corp. | | | | |
| | 500,000 | | | 5.25%, due 11/1/2019 | | | 541,106 | |
| | | | | Goldman Sachs Group, Inc. | | | | |
| | 500,000 | | | 3.625%, due 1/22/2023 | | | 512,671 | |
| | 500,000 | | | 2.9%, due 7/19/2018 | | | 507,641 | |
| | | | | JPMorgan Chase & Co. | | | | |
| | 250,000 | | | 2.35%, due 1/28/2019 | | | 252,043 | |
| | 1,000,000 | | | 3.875%, due 9/10/2024 | | | 1,013,610 | |
| | 1,000,000 | | | 3.125%, due 1/23/2025 | | | 981,909 | |
| | 500,000 | | | 3.3%, due 4/1/2026 | | | 492,275 | |
| | | | | Morgan Stanley | | | | |
| | 500,000 | | | 2.125%, due 4/25/2018 | | | 501,761 | |
| | 500,000 | | | 2.2%, due 12/7/2018 | | | 502,530 | |
| | 500,000 | | | 2.5%, due 1/24/2019 | | | 504,627 | |
| | 500,000 | | | 5.5%, due 7/28/2021 | | | 556,763 | |
| | | | | US BanCorp. | | | | |
| | 500,000 | | | 3.6%, due 9/11/2024 | | | 512,099 | |
| | 500,000 | | | 3.1%, due 4/27/2026 | | | 489,651 | |
| | | | | Wells Fargo & Co. | | | | |
| | 2,000,000 | | | 3.45%, due 2/13/2023 | | | 1,997,874 | |
| | 1,000,000 | | | 3%, due 2/19/2025 | | | 971,464 | |
| | | | | | | | 11,845,191 | |
| Beverages - 0.6% | | | | |
| | | | | Coca-Cola Co. | | | | |
| | 500,000 | | | 2.55%, due 6/1/2026 | | | 483,844 | |
| | | | | | | | | |
| Biotechnology - 0.3% | | | | |
| | | | | Amgen, Inc. | | | | |
| | 250,000 | | | 3.45%, due 10/1/2020 | | | 258,816 | |
| | | | | | | | | |
| Chemicals - 3.2% | | | | |
| | | | | Air Products & Chemicals, Inc. | | | | |
| | 500,000 | | | 3%, due 11/3/2021 | | | 516,216 | |
| | 500,000 | | | 2.75%, due 2/3/2023 | | | 497,971 | |
| | | | | EI du Pont de Nemours & Co. | | | | |
| | 500,000 | | | 3.625%, due 1/15/2021 | | | 520,134 | |
| Principal | | | | | Fair | |
| Amount | | | | | Value | |
| Chemicals - 3.2% (Continued) | | | | |
| | | | | EI du Pont de Nemours & Co. | | | | |
| $ | 500,000 | | | 2.8%, due 2/15/2023 | | $ | 492,905 | |
| | | | | Praxair, Inc. | | | | |
| | 500,000 | | | 2.45%, due 2/15/2022 | | | 498,346 | |
| | | | | | | | 2,525,572 | |
| Computers - 1.3% | | | | |
| | | | | HP, Inc. | | | | |
| | 1,000,000 | | | 3.75%, due 12/1/2020 | | | 1,039,108 | |
| | | | | | | | | |
| Diversified Financial Services - 0.3% | | | | |
| | | | | Ameriprise Financial, Inc. | | | | |
| | 250,000 | | | 5.3%, due 3/15/2020 | | | 272,160 | |
| | | | | | | | | |
| Electric - 1.6% | | | | |
| | | | | Duke Energy Corp. | | | | |
| | 1,000,000 | | | 3.55%, due 9/15/2021 | | | 1,039,579 | |
| | | | | Duke Energy Florida LLC | | | | |
| | 250,000 | | | 3.1%, due 8/15/2021 | | | 257,460 | |
| | | | | | | | 1,297,039 | |
| Electrical Components & Equipment - 0.7% | | | | |
| | | | | Emerson Electric Co. | | | | |
| | 500,000 | | | 4.875%, due 10/15/2019 | | | 542,012 | |
| | | | | | | | | |
| Food - 1.3% | | | | |
| | | | | Campbell Soup Co. | | | | |
| | 500,000 | | | 4.5%, due 2/15/2019 | | | 527,802 | |
| | | | | Kroger Co./The | | | | |
| | 500,000 | | | 3.3%, due 1/15/2021 | | | 513,204 | |
| | | | | | | | 1,041,006 | |
| Healthcare-Products - 0.7% | | | | |
| | | | | Stryker Corp. | | | | |
| | 500,000 | | | 4.375%, due 1/15/2020 | | | 530,967 | |
| | | | | | | | | |
| Healthcare-Services - 1.0% | | | | |
| | | | | UnitedHealth Group, Inc. | | | | |
| | 250,000 | | | 4.7%, due 2/15/2021 | | | 271,902 | |
| | 500,000 | | | 1.625%, due 3/15/2019 | | | 498,517 | |
| | | | | | | | 770,419 | |
| Household Products/Wares - 0.6% | | | | |
| | | | | Kimberly-Clark Corp. | | | | |
| | 500,000 | | | 2.4%, due 3/1/2022 | | | 499,171 | |
| | | | | | | | | |
| Insurance - 2.7% | | | | |
| | | | | Aflac, Inc. | | | | |
| | 1,000,000 | | | 4%, due 2/15/2022 | | | 1,065,471 | |
| | | | | American International Group, Inc. | | | | |
| | 1,000,000 | | | 3.9%, due 4/1/2026 | | | 1,016,871 | |
| | | | | | | | 2,082,342 | |
The accompanying notes are an integral part of these financial statements
| | THE NORTH COUNTRY FUNDS | |
| |
| INTERMEDIATE BOND FUND |
| SCHEDULE OF INVESTMENTS (Continued) |
| November 30, 2016 |
| Principal | | | | | Fair | |
| Amount | | | | | Value | |
| Iron / Steel - 0.7% | | | | |
| | | | | Nucor Corp. | | | | |
| $ | 500,000 | | | 5.85%, due 6/1/2018 | | $ | 529,915 | |
| | | | | | | | | |
| Media - 0.3% | | | | |
| | | | | Comcast Corp. | | | | |
| | 250,000 | | | 5.7%, due 7/1/2019 | | | 273,966 | |
| | | | | | | | | |
| Miscellaneous Manufacturing - 0.6% | | | | |
| | | | | General Electric Co. | | | | |
| | 500,000 | | | 3.1%, due 1/9/2023 | | | 509,482 | |
| | | | | | | | | |
| Oil & Gas - 7.0% | | | | |
| | | | | BP Capital Markets PLC | | | | |
| | 1,000,000 | | | 2.75%, due 5/10/2023 | | | 977,834 | |
| | 500,000 | | | 2.237%, due 5/10/2019 | | | 502,745 | |
| | 1,000,000 | | | 3.535%, due 11/4/2024 | | | 1,010,302 | |
| | | | | Chevron Corp. | | | | |
| | 1,000,000 | | | 2.954%, due 5/16/2026 | | | 979,374 | |
| | | | | EOG Resources, Inc. | | | | |
| | 1,000,000 | | | 4.1%, due 2/1/2021 | | | 1,053,509 | |
| | | | | Occidental Petroleum Corp. | | | | |
| | 1,000,000 | | | 3.4%, due 4/15/2026 | | | 1,000,391 | |
| | | | | | | | 5,524,155 | |
| Oil & Gas Services- 0.7% | | | | |
| | | | | Schlumberger Investment SA | | | | |
| | 500,000 | | | 3.3%, due 9/14/2021 | | | 515,174 | |
| | | | | | | | | |
| Pharmaceutical - 1.6% | | | | |
| | | | | Merck & Co., Inc. | | | | |
| | 1,000,000 | | | 2.8%, due 5/18/2023 | | | 998,893 | |
| | | | | Pfizer, Inc. | | | | |
| | 250,000 | | | 2.75%, due 6/3/2026 | | | 242,839 | |
| | | | | | | | 1,241,732 | |
| Retail - 2.3% | | | | |
| | | | | Lowe’s Cos, Inc. | | | | |
| | 1,000,000 | | | 4.625%, due 4/15/2020 | | | 1,072,483 | |
| | | | | McDonald’s Corp. | | | | |
| | 500,000 | | | 2.625%, due 1/15/2022 | | | 499,143 | |
| | | | | Target Corp. | | | | |
| | 250,000 | | | 2.50%, due 4/15/2026 | | | 237,930 | |
| | | | | | | | 1,809,556 | |
| Semiconductors - 1.0% | | | | |
| | | | | Intel Corp. | | | | |
| | 750,000 | | | 3.30%, due 10/1/2021 | | | 781,420 | |
| | | | | | | | | |
| Software - 2.3% | | | | |
| | | | | Oracle Corp. | | | | |
| | 200,000 | | | 5%, due 7/8/2019 | | | 216,023 | |
| | 1,000,000 | | | 3.625%, due 7/15/2023 | | | 1,043,519 | |
| | 500,000 | | | 3.4%, due 7/8/2024 | | | 510,210 | |
| | | | | | | | 1,769,752 | |
| Principal | | | | | Fair | |
| Amount | | | | �� | Value | |
| Telecommunications - 8.0% | | | | |
| | | | | AT&T, Inc. | | | | |
| $ | 1,800,000 | | | 3%, due 2/15/2022 | | $ | 1,787,130 | |
| | 1,000,000 | | | 3.6%, due 2/17/2023 | | | 1,002,790 | |
| | | | | Cisco Systems, Inc. | | | | |
| | 1,000,000 | | | 3.5%, due 6/15/2025 | | | 1,040,958 | |
| | | | | Verizon Communications, Inc. | | | | |
| | 500,000 | | | 4.6%, due 4/1/2021 | | | 537,612 | |
| | 1,000,000 | | | 5.15%, due 9/15/2023 | | | 1,108,741 | |
| | 500,000 | | | 4.15%, due 3/15/2024 | | | 525,061 | |
| | | | | Vodafone Group PLC | | | | |
| | 250,000 | | | 4.375%, due 3/16/2021 | | | 266,093 | |
| | | | | | | | 6,268,385 | |
| Transportation - 1.0% | | | | |
| | | | | Union Pacific Corp. | | | | |
| | 500,000 | | | 2.75%, due 4/15/2023 | | | 499,217 | |
| | | | | United Parcel Service, Inc. | | | | |
| | 250,000 | | | 3.125%, due 1/15/2021 | | | 259,731 | |
| | | | | | | | 758,948 | |
| TOTAL CORPORATE BONDS | | | | |
| (Cost - $45,012,750) | | | 44,956,157 | |
| | | | | |
| U.S. GOVERNMENT AGENCY OBLIGATIONS - 39.2% | | | | |
| Government Agencies - 39.2% | | | | |
| | | | | Federal Farm Credit Bank | | | | |
| | 2,000,000 | | | 2.35%, due 8/14/2024 | | | 1,971,089 | |
| | 1,000,000 | | | 2.53%, due 12/26/2023 | | | 1,003,941 | |
| | 1,000,000 | | | 2.28%, due 10/30/2024 | | | 979,287 | |
| | 500,000 | | | 2.57%, due 5/11/2026 | | | 495,242 | |
| | 1,000,000 | | | 1.66%, due 9/17/2020 | | | 991,974 | |
| | 2,000,000 | | | 2.6%, due 5/26/2026 | | | 2,000,900 | |
| | 1,500,000 | | | 2.09%, due 9/8/2026 | | | 1,433,669 | |
| | | | | Federal Home Loan Bank | | | | |
| | 2,000,000 | | | 2.5%, due 12/9/2022 | | | 2,045,699 | |
| | 1,000,000 | | | 1.875%, due 12/11/2020 | | | 1,005,989 | |
| | 1,000,000 | | | 2.25%, due 12/8/2023 | | | 998,349 | |
| | 500,000 | | | 2.375%, due 6/10/2022 | | | 509,518 | |
| | 1,000,000 | | | 2.625%, due 9/12/2025 | | | 1,010,108 | |
| | 1,000,000 | | | 2.6%, due 12/4/2025 | | | 996,225 | |
| | 500,000 | | | 2.7%, due 12/29/2025 | | | 502,399 | |
| | 500,000 | | | 2.875%, due 9/11/2020 | | | 521,750 | |
| | 1,000,000 | | | 3.125%, due 12/11/2020 | | | 1,049,381 | |
| | 2,000,000 | | | 2.795%, due 10/17/2023 | | | 2,058,113 | |
| | 500,000 | | | 2.375%, due 9/10/2021 | | | 508,720 | |
| | 1,000,000 | | | 2.0%, due 9/9/2022 | | | 1,003,652 | |
| | 250,000 | | | 2.0%, due 9/13/2019 | | | 253,807 | |
| | 500,000 | | | 3.0%, due 9/10/2021 | | | 523,391 | |
| | | | | Federal Home Loan Mortgage Corp. | | | | |
| | 1,000,000 | | | 2.0%, due 11/30/2020 | | | 1,005,217 | |
| | 1,500,000 | | | 2.0%, due 12/10/2021 | | | 1,497,536 | |
The accompanying notes are an integral part of these financial statements
| | THE NORTH COUNTRY FUNDS | |
| |
| INTERMEDIATE BOND FUND |
| SCHEDULE OF INVESTMENTS (Continued) |
| November 30, 2016 |
| Principal | | | | | Fair | |
| Amount | | | | | Value | |
| Government Agencies - 39.2% (Continued) | | | | |
| | | | | Federal National Mortgage Association | | | | |
| $ | 2,000,000 | | | 2.125%, due 4/24/2026 | | $ | 1,904,632 | |
| | 1,500,000 | | | 1.625%, due 11/27/2018 | | | 1,513,589 | |
| | 2,000,000 | | | 2.625%, due 9/6/2024 | | | 2,032,530 | |
| | 1,000,000 | | | 1.7%, due 11/13/2020 | | | 990,326 | |
| | | | | | | | 30,807,033 | |
| | | | | | | | | |
| TOTAL U.S. GOVERNMENT AGENCY OBLIGATIONS | | | | |
| (Cost - $31,390,211) | | | 30,807,033 | |
| | | | | | Fair | |
| Shares | | | | | Value | |
| MONEY MARKET FUND - 2.9% | | | | |
| | | | | BlackRock Liquidity TempCash | | | | |
| | 2,286,504 | | | Fund - Dollar Shares, 0.24% (a) | | $ | 2,286,504 | |
| TOTAL MONEY MARKET FUND (Cost - $2,286,504) | | | | |
| | | | | | | | | |
| TOTAL INVESTMENTS - 99.3% | | | | |
| (Cost - $78,689,465) (b) | | $ | 78,049,694 | |
| Other assets less liabilities - 0.7% | | | 515,719 | |
| TOTAL NET ASSETS - 100.0% | | $ | 78,565,413 | |
LLC - Limited Limited Company
PLC - Public Limited Company
| (a) | Variable rate yield; the coupon rate shown represents the rate as of November 30, 2016. |
| (b) | Represents cost for financial reporting purposes. Aggregate cost for federal tax purposes is $78,689,465 and differs from market value by unrealized appreciation (depreciation) of securities as follows: |
| | Unrealized Appreciation: | | $ | 472,404 | |
| | Unrealized Depreciation: | | | (1,112,175 | ) |
| | Net Unrealized Appreciation | | $ | (639,771 | ) |
The accompanying notes are an integral part of these financial statements
| | THE NORTH COUNTRY FUNDS | |
| |
| STATEMENTS OF ASSETS AND LIABILITIES |
| November 30, 2016 |
| | | Equity | | | Intermediate | |
| | | Growth Fund | | | Bond Fund | |
| ASSETS: | | | | | | | | |
| Investments in securities, at fair value (Cost $72,747,139 and $78,689,465 respectively) | | $ | 120,196,189 | | | $ | 78,049,694 | |
| Receivable for fund shares sold | | | 2,989 | | | | 1,339 | |
| Dividends and interest receivable | | | 216,293 | | | | 586,761 | |
| Prepaid expenses and other assets | | | 6,076 | | | | 6,486 | |
| Total Assets | | | 120,421,547 | | | | 78,644,280 | |
| | | | | | | | | |
| LIABILITIES: | | | | | | | | |
| Accrued advisory fees | | | 73,289 | | | | 32,629 | |
| Payable for fund shares redeemed | | | 44,946 | | | | 6,815 | |
| Accrued trustee fees | | | 3,551 | | | | 820 | |
| Payable to related parties | | | 23,990 | | | | 9,984 | |
| Accrued expenses and other liabilities | | | 37,387 | | | | 28,619 | |
| Total Liabilities | | | 183,163 | | | | 78,867 | |
| Net Assets | | $ | 120,238,384 | | | $ | 78,565,413 | |
| | | | | | | | | |
| NET ASSETS CONSIST OF: | | | | | | | | |
| Paid in capital | | $ | 70,272,475 | | | $ | 79,623,975 | |
| Accumulated net investment income | | | 525,860 | | | | 80,389 | |
| Accumulated net realized gain (loss) from investment transactions | | | 1,990,999 | | | | (499,180 | ) |
| Net unrealized appreciation (depreciation) on investments | | | 47,449,050 | | | | (639,771 | ) |
| Net Assets | | $ | 120,238,384 | | | $ | 78,565,413 | |
| | | | | | | | | |
| Shares outstanding (unlimited number of shares authorized; no par value) | | | 7,735,711 | | | | 7,749,273 | |
| | | | | | | | | |
| Net asset value, offering and redemption price per share ($120,238,384/7,735,711 and $78,565,413/7,749,273, respectively) | | $ | 15.54 | | | $ | 10.14 | |
The accompanying notes are an integral part of these financial statements
| | THE NORTH COUNTRY FUNDS | |
| |
| STATEMENTS OF OPERATIONS |
| For the Year Ended November 30, 2016 |
| | | Equity | | | Intermediate | |
| | | Growth Fund | | | Bond Fund | |
| INVESTMENT INCOME: | | | | | | | | |
| Interest | | $ | 11,702 | | | $ | 1,985,763 | |
| Dividends | | | 1,778,782 | | | | — | |
| Total investment income | | | 1,790,484 | | | | 1,985,763 | |
| | | | | | | | | |
| EXPENSES: | | | | | | | | |
| Investment advisory fees | | | 920,401 | | | | 401,178 | |
| Administration and fund accounting fees | | | 176,406 | | | | 137,328 | |
| Transfer agency fees | | | 38,001 | | | | 32,870 | |
| Legal fees | | | 31,067 | | | | 30,082 | |
| Audit fees | | | 17,547 | | | | 17,547 | |
| Trustees’ fees | | | 16,917 | | | | 11,031 | |
| Printing expense | | | 15,043 | | | | 8,028 | |
| Custody fees | | | 14,511 | | | | 9,320 | |
| Chief Compliance Officer fees | | | 14,337 | | | | 7,761 | |
| Registration and filing fees | | | 12,034 | | | | 12,034 | |
| Insurance expense | | | 6,940 | | | | 4,011 | |
| Miscellaneous expenses | | | 518 | | | | 2,006 | |
| Total expenses | | | 1,263,722 | | | | 673,196 | |
| | | | | | | | | |
| Less: Advisory fee waiver (Note 3) | | | — | | | | (12,946 | ) |
| Net expenses | | | 1,263,722 | | | | 660,250 | |
| | | | | | | | | |
| Net investment income | | | 526,762 | | | | 1,325,513 | |
| | | | | | | | | |
| NET REALIZED AND UNREALIZED GAIN (LOSS) ON INVESTMENTS: | | | | | | | | |
| Net realized gain from investment transactions | | | 1,995,855 | | | | 530,599 | |
| Net change in unrealized appreciation (depreciation) of investments | | | 466,618 | | | | (890,949 | ) |
| Net realized and unrealized gain (loss) on investments | | | 2,462,473 | | | | (360,350 | ) |
| Net increase in net assets resulting from operations | | $ | 2,989,235 | | | $ | 965,163 | |
The accompanying notes are an integral part of these financial statements
| | THE NORTH COUNTRY FUNDS | |
| |
| EQUITY GROWTH FUND |
| STATEMENTS OF CHANGES IN NET ASSETS |
| | | For the Year | | | For the Year | |
| | | Ended | | | Ended | |
| | | November 30, 2016 | | | November 30, 2015 | |
| | | | | | | | | |
| INCREASE IN NET ASSETS RESULTING FROM OPERATIONS: | | | | | | | | |
| Net investment income | | $ | 526,762 | | | $ | 430,876 | |
| Net realized gain from investment transactions | | | 1,995,855 | | | | 6,064,515 | |
| Net change in unrealized appreciation (depreciation) | | | 466,618 | | | | 766,240 | |
| Net increase in net assets resulting from operations | | | 2,989,235 | | | | 7,261,631 | |
| | | | | | | | | |
| DISTRIBUTIONS TO SHAREHOLDERS: | | | | | | | | |
| Distributions from net investment income ($0.05 and $0.06 per share, respectively) | | | (430,539 | ) | | | (481,115 | ) |
| Distributions from net realized gains on investments ($0.74 and $1.05 per share, respectively) | | | (5,974,940 | ) | | | (8,023,905 | ) |
| Total distributions to shareholders | | | (6,405,479 | ) | | | (8,505,020 | ) |
| | | | | | | | | |
| CAPITAL SHARE TRANSACTIONS (Note 4) | | | (6,053,409 | ) | | | 5,958,246 | |
| | | | | | | | | |
| Net increase (decrease) in net assets | | | (9,469,653 | ) | | | 4,714,857 | |
| | | | | | | | | |
| NET ASSETS: | | | | | | | | |
| Beginning of year | | | 129,708,037 | | | | 124,993,180 | |
| | | | | | | | | |
| End of year (including undistributed net investment income of $525,860 and $430,175, respectively) | | $ | 120,238,384 | | | $ | 129,708,037 | |
The accompanying notes are an integral part of these financial statements
| | THE NORTH COUNTRY FUNDS | |
| |
| INTERMEDIATE BOND FUND |
| STATEMENTS OF CHANGES IN NET ASSETS |
| | | For the Year | | | For the Year | |
| | | Ended | | | Ended | |
| | | November 30, 2016 | | | November 30, 2015 | |
| | | | | | | | | |
| INCREASE IN NET ASSETS RESULTING FROM OPERATIONS: | | | | | | | | |
| Net investment income | | $ | 1,325,513 | | | $ | 1,175,522 | |
| Net realized gain from investment transactions | | | 530,599 | | | | 683,331 | |
| Net change in unrealized appreciation (depreciation) | | | (890,949 | ) | | | (1,573,487 | ) |
| Net increase in net assets resulting from operations | | | 965,163 | | | | 285,366 | |
| | | | | | | | | |
| DISTRIBUTIONS TO SHAREHOLDERS: | | | | | | | | |
| Distributions from net investment income ($0.17 and $0.17 per share, respectively) | | | (1,318,863 | ) | | | (1,157,256 | ) |
| | | | | | | | | |
| CAPITAL SHARE TRANSACTIONS (Note 4) | | | 2,918,582 | | | | 10,839,699 | |
| | | | | | | | | |
| Net increase in net assets | | | 2,564,882 | | | | 9,967,809 | |
| | | | | | | | | |
| NET ASSETS: | | | | | | | | |
| Beginning of year | | | 76,000,531 | | | | 66,032,722 | |
| | | | | | | | | |
| End of year (including undistributed net investment income of $80,389 and $71,895, respectively) | | $ | 78,565,413 | | | $ | 76,000,531 | |
The accompanying notes are an integral part of these financial statements
| | THE NORTH COUNTRY FUNDS | |
| |
| EQUITY GROWTH FUND |
| FINANCIAL HIGHLIGHTS |
(For a fund share outstanding throughout each year)
| | | For the Year Ended November 30, | |
| | | 2016 | | | 2015 | | | 2014 | | | 2013 | | | 2012 | |
| | | | | | | | | | | | | | | | | | | | | |
| Net asset value, beginning of year | | $ | 16.00 | | | $ | 16.21 | | | $ | 14.77 | | | $ | 11.37 | | | $ | 10.17 | |
| | | | | | | | | | | | | | | | | | | | | |
| INCOME FROM INVESTMENT OPERATIONS: | | | | | | | | | | | | | | | | | | | | |
| Net investment income (1) | | | 0.06 | | | | 0.06 | | | | 0.06 | | | | 0.10 | | | | 0.11 | |
| Net realized and unrealized gains on investments | | | 0.27 | | | | 0.84 | | | | 1.79 | | | | 3.31 | | | | 1.20 | |
| Total from investment operations | | | 0.33 | | | | 0.90 | | | | 1.85 | | | | 3.41 | | | | 1.31 | |
| | | | | | | | | | | | | | | | | | | | | |
| LESS DISTRIBUTIONS: | | | | | | | | | | | | | | | | | | | | |
| Dividends from net investment income | | | (0.05 | ) | | | (0.06 | ) | | | (0.10 | ) | | | (0.01 | ) | | | (0.11 | ) |
| Distribution from net realized gains from security transactions | | | (0.74 | ) | | | (1.05 | ) | | | (0.31 | ) | | | — | | | | — | |
| Total distributions | | | (0.79 | ) | | | (1.11 | ) | | | (0.41 | ) | | | (0.01 | ) | | | (0.11 | ) |
| | | | | | | | | | | | | | | | | | | | | |
| Net asset value, end of year | | $ | 15.54 | | | $ | 16.00 | | | $ | 16.21 | | | $ | 14.77 | | | $ | 11.37 | |
| | | | | | | | | | | | | | | | | | | | | |
| Total return (2) | | | 2.33 | % | | | 6.24 | % | | | 12.93 | % | | | 30.00 | % | | | 12.91 | % |
| | | | | | | | | | | | | | | | | | | | | |
| RATIOS/SUPPLEMENTAL DATA: | | | | | | | | | | | | | | | | | | | | |
| Net assets, end of year (in 000’s) | | $ | 120,238 | | | $ | 129,708 | | | $ | 124,993 | | | $ | 119,705 | | | $ | 103,358 | |
| Ratios to average net assets: | | | | | | | | | | | | | | | | | | | | |
| Expenses | | | 1.03 | % | | | 1.02 | % | | | 1.03 | % | | | 1.02 | % | | | 1.06 | % |
| Net investment income | | | 0.43 | % | | | 0.36 | % | | | 0.41 | % | | | 0.80 | % | | | 0.95 | % |
| Portfolio turnover rate | | | 21 | % | | | 28 | % | | | 29 | % | | | 41 | % | | | 55 | % |
| (1) | Net investment income per share is based on average shares outstanding during the period. |
| (2) | Total returns are historical and assume changes in share price and reinvestment of dividends and capital gain distributions, if any. Total return does not reflect the deductions of taxes that a shareholder would pay on distributions or on the redemption of shares. |
The accompanying notes are an integral part of these financial statements
| | THE NORTH COUNTRY FUNDS | |
| |
| INTERMEDIATE BOND FUND |
| FINANCIAL HIGHLIGHTS |
(For a fund share outstanding throughout each year)
| | | For the Year Ended November 30, | |
| | | 2016 | | | 2015 | | | 2014 | | | 2013 | | | 2012 | |
| | | | | | | | | | | | | | | | | | | | | |
| Net asset value, beginning of year | | $ | 10.18 | | | $ | 10.31 | | | $ | 10.25 | | | $ | 10.57 | | | $ | 10.24 | |
| | | | | | | | | | | | | | | | | | | | | |
| INCOME (LOSS) FROM INVESTMENT OPERATIONS: | | | | | | | | | | | | | | | | | | | | |
| Net investment income (1) | | | 0.17 | | | | 0.18 | | | | 0.19 | | | | 0.23 | | | | 0.24 | |
| Net realized and unrealized gains (losses) on investments | | | (0.04 | ) | | | (0.14 | ) | | | 0.06 | | | | (0.33 | ) | | | 0.33 | |
| Total from investment operations | | | 0.13 | | | | 0.04 | | | | 0.25 | | | | (0.10 | ) | | | 0.57 | |
| | | | | | | | | | | | | | | | | | | | | |
| LESS DISTRIBUTIONS: | | | | | | | | | | | | | | | | | | | | |
| Dividends from net investment income | | | (0.17 | ) | | | (0.17 | ) | | | (0.19 | ) | | | (0.22 | ) | | | (0.24 | ) |
| Total distributions | | | (0.17 | ) | | | (0.17 | ) | | | (0.19 | ) | | | (0.22 | ) | | | (0.24 | ) |
| | | | | | | | | | | | | | | | | | | | | |
| Net asset value, end of year | | $ | 10.14 | | | $ | 10.18 | | | $ | 10.31 | | | $ | 10.25 | | | $ | 10.57 | |
| | | | | | | | | | | | | | | | | | | | | |
| Total return (2) | | | 1.25 | % | | | 0.42 | % | | | 2.44 | % | | | (0.92 | )% | | | 5.57 | % |
| | | | | | | | | | | | | | | | | | | | | |
| RATIOS/SUPPLEMENTAL DATA: | | | | | | | | | | | | | | | | | | | | |
| Net assets, end of period (in 000’s) | | $ | 78,565 | | | $ | 76,001 | | | $ | 66,033 | | | $ | 60,442 | | | $ | 61,892 | |
| Ratios to average net assets: | | | | | | | | | | | | | | | | | | | | |
| Expenses, before waiver | | | 0.84 | % | | | 0.84 | % | | | 0.88 | % | | | 0.86 | % | | | 0.91 | % |
| Expenses, after waiver | | | 0.82 | % | | | 0.81 | % | | | 0.88 | % | | | 0.86 | % | | | 0.91 | % |
| Net investment income | | | 1.65 | % | | | 1.72 | % | | | 1.85 | % | | | 2.17 | % | | | 2.28 | % |
| Portfolio turnover rate | | | 31 | % | | | 51 | % | | | 25 | % | | | 29 | % | | | 24 | % |
| (1) | Net investment income per share is based on average shares outstanding during the period. |
| (2) | Total returns are historical and assume changes in share price and reinvestment of dividends and capital gain distributions, if any. Total return does not reflect the deductions of taxes that a shareholder would pay on distributions or on the redemption of shares. |
The accompanying notes are an integral part of these financial statements
| | THE NORTH COUNTRY FUNDS | |
| | | |
| NOTES TO FINANCIAL STATEMENTS |
| November 30, 2016 |
NOTE 1. ORGANIZATION
The North Country Funds (the “Trust”) was organized as a Massachusetts business trust on June 1, 2000, and registered under the Investment Company Act of 1940 as an open-end, diversified, management investment company on September 11, 2000. The Trust currently offers two series: the North Country Equity Growth Fund (the “Growth Fund”) and the North Country Intermediate Bond Fund (the “Bond Fund”, and together with the Growth Fund, the “Funds”). The Growth Fund’s principal investment objective is to provide investors with long-term capital appreciation while the Bond Fund seeks to provide investors with current income and total return with minimum fluctuations of principal value. Both Funds commenced operations on March 1, 2001.
The Bond Fund and the Growth Fund were initially organized on March 26, 1984 under New York law as Collective Investment Trusts sponsored by Glens Falls National Bank & Trust Company. Prior to their conversion to regulated investment companies (mutual funds) investor participation was limited to qualified employee benefit plans.
NOTE 2. SUMMARY OF SIGNIFICANT ACCOUNTING POLICIES
The following is a summary of the significant accounting policies followed by the Trust in the preparation of its financial statements. These policies are in conformity with accounting principles generally accepted in the United States of America (“GAAP”). The preparation of financial statements in conformity with these generally accepted accounting principles requires management to make estimates and assumptions that affect the reported amounts of assets and liabilities and disclosure of contingent assets and liabilities at the date of the financial statements and the reported amounts of revenue and expenses during the year. Actual results could differ from these estimates. The Funds follow the specialized accounting and reporting requirements under GAAP that are applicable to investment companies. The Funds are investment companies and accordingly follow the investment company accounting and reporting guidance of the Financial Accounting Standards Board (FASB) Accounting Standard Codification Topic 946 Financial Services - Investment Companies.
Security Valuation – Securities which are traded on a national securities exchange are valued at the last quoted sale price. NASDAQ traded securities are valued using the NASDAQ official closing price (“NOCP”). Investments for which no sales are reported are valued at the mean between the current bid and ask prices on the day of valuation. To the extent these securities are actively traded and valuation adjustments are not applied, they are categorized in level 1 of the fair value hierarchy described below. When an equity security is valued by the independent pricing service using factors other than market quotations or the market is considered inactive, they will be categorized in level 2.
Fixed income securities such as corporate bonds, municipal bonds, and U.S. government and agency obligations, when valued using market quotations in an active market, are categorized as level 1 securities. However, fair value may be determined using an independent pricing service that considers market observable data such as reported sales of similar securities, broker quotes, yields, bids, offers, and other reference data. These securities would be categorized as level 2 securities.
| | THE NORTH COUNTRY FUNDS | |
| | | |
| NOTES TO FINANCIAL STATEMENTS (Continued) |
| November 30, 2016 |
The fair value of mortgage-backed securities is estimated by an independent pricing service which uses models that consider interest rate movements, new issue information and other security pertinent data. Evaluations of tranches (non-volatile, volatile, or credit sensitive) are based on interpretations of accepted Wall Street modeling and pricing conventions. Mortgage-backed securities are categorized in level 2 of the fair value hierarchy described below to the extent the inputs are observable and timely.
Any securities or other assets for which market quotations are not readily available, or securities for which the last bid price does not accurately reflect the current value, are valued at fair value as determined by the Trust’s Fair Value Committee (the “Committee”) in accordance with the Trust’s Portfolio Securities Valuation Procedures (the “Procedures”). Pursuant to the Procedures, the Committee will consider, among others, the following factors to determine a security’s fair value: (i) the nature and pricing history (if any) of the security; (ii) whether any dealer quotations for the security are available; and (iii) possible valuation methodologies that could be used to determine the fair value of the security. In the absence of readily available market quotations, or other observable inputs, securities valued at fair value pursuant to the Procedures would be categorized as level 3.
Money market funds are valued at their net asset value of $1.00 per share and are categorized as level 1. Securities with maturities of 60 days or less may be valued at amortized cost, which approximates fair value and would be categorized as level 2. The ability of issuers of debt securities held by the Funds to meet their obligations may be affected by economic or political developments in a specific country or region.
The Funds utilize various methods to measure the fair value of most of their investments on a recurring basis. GAAP establishes a hierarchy that prioritizes inputs to valuation methods. The three levels of input are:
Level 1 – Unadjusted quoted prices in active markets for identical assets and liabilities that the Funds have the ability to access.
Level 2 – Observable inputs other than quoted prices included in level 1 that are observable for the asset or liability, either directly or indirectly. These inputs may include quoted prices for the identical instrument on an inactive market, prices for similar instruments, interest rates, prepayment speeds, credit risk, yield curves, default rates and similar data.
Level 3 – Unobservable inputs for the asset or liability, to the extent relevant observable inputs are not available, representing the Funds’ own assumptions about the assumptions a market participant would use in valuing the asset or liability, and would be based on the best information available.
The availability of observable inputs can vary from security to security and is affected by a wide variety of factors, including, for example, the type of security, whether the security is new and not yet established in the marketplace, the liquidity of markets, and other characteristics particular to the security. To the extent that valuation is based on models or inputs that are less observable or unobservable in the market, the
| | THE NORTH COUNTRY FUNDS | |
| | | |
| NOTES TO FINANCIAL STATEMENTS (Continued) |
| November 30, 2016 |
determination of fair value requires more judgment. Accordingly, the degree of judgment exercised in determining fair value is greatest for instruments categorized in Level 3.
The inputs used to measure fair value may fall into different levels of the fair value hierarchy. In such cases, for disclosure purposes, the level in the fair value hierarchy within which the fair value measurement falls in its entirety, is determined based on the lowest level input that is significant to the fair value measurement in its entirety.
The following is a summary of inputs used as of November 30, 2016, in valuing the Funds’ assets carried at fair value.
North Country Equity Growth Fund:
| Assets | | Level 1 | | | Level 2 | | | Level 3* | | | Total | |
| Common Stock ** | | $ | 114,020,996 | | | $ | — | | | $ | — | | | $ | 114,020,996 | |
| Money Market Fund | | | 6,175,193 | | | | — | | | | — | | | | 6,175,193 | |
| Total | | $ | 120,196,189 | | | $ | — | | | $ | — | | | $ | 120,196,189 | |
| | | | | | | | | | | | | | | | | |
| North Country Intermediate Bond Fund: | |
| | | | | | | | | | | | | | | | | |
| Assets | | Level 1 | | | Level 2 | | | Level 3* | | | Total | |
| Corporate Bonds** | | $ | — | | | $ | 44,956,157 | | | $ | — | | | $ | 44,956,157 | |
| U.S. Government Agency Obligations | | | — | | | | 30,807,033 | | | | — | | | | 30,807,033 | |
| Money Market Fund | | | 2,286,504 | | | | — | | | | — | | | | 2,286,504 | |
| Total | | $ | 2,286,504 | | | $ | 75,763,190 | | | $ | — | | | $ | 78,049,694 | |
| * | The Funds did not hold any Level 3 investments during the period. |
| ** | See Schedule of Investments for industry classifications. |
There were no transfers into and out of Level 1 and Level 2 during the period. It is the Funds’ policy to recognize transfers into and out of Level 1 and Level 2 at the end of the reporting period.
Federal Income Taxes – The Funds make no provision for federal income or excise tax. The Funds intend to qualify each year as regulated investment companies (“RICs”) under subchapter M of the Internal Revenue Code of 1986, as amended, by complying with the requirements applicable to RICs and by distributing substantially all of their taxable income. The Funds also intend to distribute sufficient net investment income and net capital gains, if any, so that they will not be subject to excise tax on undistributed income and gains. If the required amount of net investment income or gains is not distributed, the Funds could incur a tax expense.
| | THE NORTH COUNTRY FUNDS | |
| | | |
| NOTES TO FINANCIAL STATEMENTS (Continued) |
| November 30, 2016 |
Management has analyzed the Fund’s tax positions and has concluded that no liability for unrecognized tax benefits should be recorded related to uncertain tax positions taken on returns filed for open tax years November 30, 2013 to November 30, 2015, or expected to be taken in the Fund’s November 30, 2016 year-end tax returns. The Funds recognize interest and penalties, if any, related to unrecognized tax benefits as income tax expense in the statements of operations. During the period, the Funds did not incur any interest or penalties. The Funds identify their major tax jurisdictions as U.S. Federal and New York State.
Dividends and Distributions – The Bond Fund pays dividends from net investment income on a monthly basis. The Growth Fund will pay dividends from net investment income, if any, on an annual basis. Both Funds will declare and pay distributions from net realized capital gains, if any, annually. Income and capital gain distributions to shareholders are recorded on the ex-dividend date and are determined in accordance with income tax regulations, which may differ from generally accepted accounting principles.
Security Transactions – Securities transactions are recorded no later than the first business day after the trade date, except for reporting purposes when trade date is used. Realized gains and losses on sales of securities are calculated on the identified cost basis. Dividend income is recorded on the ex-dividend date and interest income is recorded on an accrual basis. Discounts and premiums on securities purchased are amortized over the life of the respective securities. Withholding taxes on foreign dividends have been provided for in accordance with the Funds’ understanding of the applicable country’s tax rules and rates.
Expenses – Most expenses of the Trust can be directly attributed to a Fund. Expenses which are not readily identifiable to a specific Fund are allocated in such a manner as deemed equitable, taking into consideration the nature and type of expense and the relative sizes of the Funds.
Indemnification – The Trust indemnifies its officers and trustees for certain liabilities that may arise from the performance of their duties to the Trust. Additionally, in the normal course of business, each Fund enters into contracts that contain a variety of representations and warranties and which provide general indemnities. A Fund’s maximum exposure under these arrangements is unknown, as this would involve future claims that may be made against the Fund that have not yet occurred. However, based on experience, the Funds expect the risk of loss due to these warranties and indemnities to be remote.
NOTE 3. INVESTMENT ADVISORY FEE AND OTHER RELATED PARTY TRANSACTIONS
The Trust has entered into an investment advisory agreement (the “Advisory Agreement”) with North Country Investment Advisers, Inc. (the “Adviser”). Pursuant to the Advisory Agreement, the Adviser is responsible for formulating the Trust’s investment programs, making day-to-day investment decisions and engaging in portfolio transactions, subject to the authority of the Board of Trustees. Under the terms of the agreement, each Fund pays a fee, calculated daily and paid monthly, at an annual rate of 0.75% and 0.50% of the average daily net assets of the Growth Fund and Bond Fund, respectively. For the year ended November 30, 2016, the Adviser received advisory fees of $920,401 from the Growth Fund and $401,178 from the Bond Fund. The
| | THE NORTH COUNTRY FUNDS | |
| | | |
| NOTES TO FINANCIAL STATEMENTS (Continued) |
| November 30, 2016 |
Advisor voluntarily waived 0.05% of the Advisory fee it receives from the Bond Fund for the period starting April 1, 2015 through March 31, 2016. For the year ended November 30, 2016, the Adviser waived $12,946 of its advisory fee. This amount waived is not subject to recoupment.
The Trust has entered into an Underwriting Agreement with Northern Lights Distributors, LLC (“the Distributor”) to serve as the principal underwriter for each Fund and distributor for each Fund’s shares.
In addition, certain affiliates of the Distributor provide services to the Funds as follows:
Gemini Fund Services, LLC (“GFS”) - GFS, an affiliate of the Distributor, provides administration, fund accounting, and transfer agent services to the Trust. Pursuant to separate servicing agreements with GFS, the Fund pays GFS customary fees for providing administration, fund accounting, and transfer agency services to the Fund. Certain officers of the Trust are also officers of GFS, and are not paid any fees directly by the Funds for serving in such capacities.
Northern Lights Compliance Services, LLC (“NLCS”) - NLCS, an affiliate of GFS and the Distributor, provides a Chief Compliance Officer to the Trust, as well as related compliance services, pursuant to a consulting agreement between NLCS and the Trust. Under the terms of such agreement, NLCS receives customary fees from the Funds.
BluGiant, LLC (“BluGiant”), an affiliate of GFS and the Distributor, provides EDGAR conversion and filing services as well as print management services for the Funds on an ad-hoc basis. For the provision of these services, BluGiant receives customary fees from the Funds.
Certain officers and/or trustees of the Adviser and Administrator are also officers/trustees of the Trust.
NOTE 4. CAPITAL SHARE TRANSACTIONS
At November 30, 2016, there were an unlimited number of shares authorized with no par value. Paid in capital for the Growth Fund and Bond Fund amounted to $70,272,475 and $79,623,975, respectively.
| | THE NORTH COUNTRY FUNDS | |
| | | |
| NOTES TO FINANCIAL STATEMENTS (Continued) |
| November 30, 2016 |
Transactions in capital shares were as follows:
Growth Fund:
| | | For the year | | | For the year | |
| | | ended | | | ended | |
| | | November 30, 2016 | | | November 30, 2015 | |
| | | Shares | | | Amount | | | Shares | | | Amount | |
| | | | | | | | | | | | | |
| Shares sold | | | 957,056 | | | $ | 13,834,911 | | | | 1,135,386 | | | $ | 17,520,864 | |
| Shares issued for reinvestment of dividends | | | 75,160 | | | | 1,110,111 | | | | 101,207 | | | | 1,472,240 | |
| Shares redeemed | | | (1,401,715 | ) | | | (20,998,431 | ) | | | (841,971 | ) | | | (13,034,858 | ) |
| Net increase | | | (369,499 | ) | | $ | (6,053,409 | ) | | | 394,622 | | | | 5,958,246 | |
Bond Fund:
| | | For the year | | | For the year | |
| | | ended | | | ended | |
| | | November 30, 2016 | | | November 30, 2015 | |
| | | Shares | | | Amount | | | Shares | | | Amount | |
| | | | | | | | | | | | | |
| Shares sold | | | 1,301,151 | | | $ | 13,428,290 | | | | 1,913,249 | | | $ | 19,616,507 | |
| Shares issued for reinvestment of dividends | | | 7,778 | | | | 80,582 | | | | 8,514 | | | | 87,193 | |
| Shares redeemed | | | (1,022,475 | ) | | | (10,590,290 | ) | | | (863,792 | ) | | | (8,864,001 | ) |
| Net increase | | | 286,454 | | | $ | 2,918,582 | | | | 1,057,971 | | | $ | 10,839,699 | |
| | THE NORTH COUNTRY FUNDS | |
| | | |
| NOTES TO FINANCIAL STATEMENTS (Continued) |
| November 30, 2016 |
NOTE 5. INVESTMENTS
Investment transactions, excluding short-term securities, for the year ended November 30, 2016 were as follows:
| | | | | | Bond Fund | |
| | | | | | Excluding U.S. | | | U.S. | |
| | | | | | Government | | | Government | |
| | | Growth Fund | | | Securities | | | Securities | |
| Purchases | | $ | 23,861,830 | | | $ | 14,982,150 | | | $ | 12,344,540 | |
| Sales | | $ | 35,451,822 | | | $ | 14,506,522 | | | $ | 9,384,450 | |
NOTE 6. TAX INFORMATION
The tax character of distributions paid during the fiscal year ended November 30, 2016 and fiscal year ended November 30, 2015 was as follows:
| For the year ended November 30, 2016: | |
| | |
| | | Ordinary | | | Long-Term | | | | |
| Fund | | Income | | | Capital Gains | | | Total | |
| Growth Fund | | $ | 604,535 | | | $ | 5,800,944 | | | $ | 6,405,479 | |
| Bond Fund | | | 1,318,863 | | | | — | | | | 1,318,863 | |
| | | | | | | | | | | | | |
| For the year ended November 30, 2015: | |
| | |
| | | Ordinary | | | Long-Term | | | | |
| Fund | | Income | | | Capital Gains | | | Total | |
| Growth Fund | | $ | 970,967 | | | $ | 7,534,053 | | | $ | 8,505,020 | |
| Bond Fund | | | 1,157,256 | | | | — | | | | 1,157,256 | |
On December 12, 2016, the Growth Fund paid an ordinary income dividend of $0.0681 per share and a long-term capital gain dividend of $0.2583 per share to shareholders of record on December 9, 2016.
On December 29, 2016, the Bond Fund paid an ordinary income dividend of $0.0250 per share to shareholders of record on December 28, 2015.
As of November 30, 2016, the components of distributable earnings/ (deficit) on a tax basis were as follows:
| | | Undistributed | | | Undistributed | | | | | | Capital Loss | | | Unrealized | | | Total | |
| | | Ordinary | | | Long-Term | | | | | | Carry | | | Appreciation/ | | | Accumulated | |
| Fund | | Income | | | Capital Gains | | | Late Year Loss | | | Forwards | | | (Depreciation) | | | Earnings | |
| Growth Fund | | $ | 525,860 | | | $ | 1,990,999 | | | $ | — | | | $ | — | | | $ | 47,449,050 | | | $ | 49,965,909 | |
| Bond Fund | | | 80,389 | | | | — | | | | — | | | | (499,180 | ) | | | (639,771 | ) | | | (1,058,562 | ) |
| | THE NORTH COUNTRY FUNDS | |
| | | |
| NOTES TO FINANCIAL STATEMENTS (Continued) |
| November 30, 2016 |
The difference between book basis and tax basis distributable earnings, if any, is primarily attributable to the tax deferral of losses on wash sales.
As of November 30, 2016, the Bond Fund had unused capital loss carry forwards of $499,180 available, for federal income tax purposes, to offset future capital gains. Such capital loss carry forwards expire on November 30, 2017. The Bond Fund utilized $530,599 in capital losses in the current fiscal year.
Permanent book and tax differences, primarily attributable to the book/tax basis treatment of non-deductible expenses, and the reclass of Fund distributions, resulted in reclassifications for the Funds for the fiscal year ended November 30, 2016 as follows:
| | | Paid | | | Undistributed | | | Undistributed | |
| | | In | | | Ordinary | | | Long-Term | |
| Fund | | Capital | | | Income (Loss) | | | Gains (Loss) | |
| Growth Fund | | $ | — | | | $ | (538 | ) | | $ | 538 | |
| Bond Fund | | | (1,844 | ) | | | 1,844 | | | | — | |
NOTE 7. CONTROL OWNERSHIP
The beneficial ownership, either directly or indirectly, of more than 25% of the voting securities of a Fund creates presumption of control of the Fund, under Section 2(a) 9 of the Act. As of November 30, 2016, SEI Private Trust, an account holding shares for the benefit of others in nominee name, held approximately 88% of the voting securities of the Growth Fund and approximately 96% of the Bond Fund.
NOTE 8. NEW ACCOUNTING PRONOUNCEMENT
On October 13, 2016 the Securities and Exchange Commission amended existing rules intended to modernize reporting and disclosure of information. These amendments relate to Regulation S-X which sets forth the form and content of financial statements. At this time, management is evaluating the implications of adopting these amendments and their impact on the financial statements and accompanying notes.
NOTE 9. SUBSEQUENT EVENTS
Subsequent events after the date of the Statements of Assets and Liabilities have been evaluated through the date the financial statements were issued. Management has concluded that there is no impact requiring additional adjustment or disclosure in the financial statements.
REPORT OF INDEPENDENT REGISTERED PUBLIC ACCOUNTING FIRM
To the Shareholders and Board of Trustees
of The North Country Funds
We have audited the accompanying statements of assets and liabilities, including the schedules of investments, of The North Country Funds, comprising North Country Equity Growth Fund and North Country Intermediate Bond Fund (the “Funds”), as of November 30, 2016, and the related statements of operations for the year then ended, the statements of changes in net assets for each of the two years in the period then ended, and the financial highlights for each of the five years in the period then ended. These financial statements and financial highlights are the responsibility of the Funds’ management. Our responsibility is to express an opinion on these financial statements and financial highlights based on our audits.
We conducted our audits in accordance with the standards of the Public Company Accounting Oversight Board (United States). Those standards require that we plan and perform the audit to obtain reasonable assurance about whether the financial statements and financial highlights are free of material misstatement. An audit includes examining, on a test basis, evidence supporting the amounts and disclosures in the financial statements. Our procedures included confirmation of securities owned as of November 30, 2016, by correspondence with the custodian. An audit also includes assessing the accounting principles used and significant estimates made by management, as well as evaluating the overall financial statement presentation. We believe that our audits provide a reasonable basis for our opinion.
In our opinion, the financial statements and financial highlights referred to above present fairly, in all material respects, the financial position of each of the Funds constituting The North Country Funds as of November 30, 2016, the results of their operations for the year then ended, the changes in their net assets for each of the two years in the period then ended, and the financial highlights for each of the five years in the period then ended, in conformity with accounting principles generally accepted in the United States of America.
COHEN & COMPANY, LTD.
Cleveland, Ohio
January 26, 2017
| | THE NORTH COUNTRY FUNDS | |
| | | |
| INFORMATION REGARDING |
| TRUSTEES AND OFFICERS (Unaudited) |
The Trustees and officers of The North Country Funds (the “Trust”) are listed below, together with their principal occupations during the past five years. The term of office for trustees is for the duration of the Trust or until removal, resignation or retirement; officers are elected annually. Each individual listed below oversees both portfolios currently existing within the complex.
The following table provides information regarding each Trustee who is an “interested person” of the Trust, as defined in the Investment Company Act of 1940.
| Name, Address and Age | Position &
Length of Time
Served with the
Trust | Principal Occupations During Past
5 Years and Current Directorships |
John E. Arsenault*
c/o Gemini Fund Services, LLC
80 Arkay Drive, Suite 110
Hauppauge, NY 11788
Age: 69 | Trustee
since 2009 | Retired (2013-Present); President, North Country Investment Advisers, Inc. (2012 – 2013; 2000-2011); Retired (2011- 2012); Executive Vice President & Head of the Trust and Investment Group, Glens Falls National Bank (1997-2009). |
Thomas L. Hoy**
Age: 67 | Trustee since
2015 | Consultant and Chairman of the Board, Arrow Financial Corp. and Glen Falls National Bank (2005-Present); President and Chief Executive Officer, Arrow Financial Corp. and Glen Falls National Bank (1997-2012); Director, New York Business Development Corp. (2012-Present); Chairman of the Board, AAA Northway (travel insurance and auto services) (1990- Present) |
The following table provides information regarding each Trustee who is not an “interested person” of the Trust, as defined in the Investment Company Act of 1940. Unless otherwise noted, the address for each Trustee is c/o Gemini Fund Services, LLC, 80 Arkay Drive, Suite 110, Hauppauge, NY 11788.
| Name, Address and Age | Position &
Length of Time
Served with the
Trust | Principal Occupations During Past
5 Years and Current Directorships |
George R. Coughlan, III
Age: 78 | Trustee
since 2001 | Retired; Vice President & Branch Manager, Smith Barney (1974-1998). |
Alan E. Redeker
Age: 72 | Chairman of the
Board since 2009
and Trustee
Since 2000 | Member, Redeker Management Consulting, LLC (formerly Independent Consultant dba Redeker Management Consulting) (2005 – Present); President, Glens Falls Lehigh Cement Company (1999- 2005) |
Joseph M. Grossi
Age: 77 | Trustee
since 2001 | Retired; General Manager - Northeast Region, Niagara Mohawk (Gas & Electric Utility Co.) (1964-1999). |
John C. Olsen
Age: 61 | Trustee
since 2004 | CPA, Partner of Bonadio & Co., LLP (2008-Present); Shareholder of Dorfman-Robbie CPA PC (1978- 2008). (Dorfman-Robbie CPA PC merged with Bonadio & Co., LLP effective October 1, 2008). |
| | THE NORTH COUNTRY FUNDS | |
| | | |
| INFORMATION REGARDING |
| TRUSTEES AND OFFICERS (Unaudited) (Continued) |
The following table provides information regarding each officer who is not a Trustee of the Trust. Unless otherwise noted, the address for each officer is c/o Gemini Fund Services, LLC, 80 Arkay Drive, Suite 110 Hauppauge, NY 11788.
| Name, Address and Age | Position &
Length of Time
Served with the
Trust | Principal Occupations During Past
5 Years and Current Directorships |
James R. Colantino
Age: 47 | President since
2012 | Senior Vice President – Fund Administration (2012- Present); Vice President (2004-2012); Gemini Fund Services, LLC. Treasurer (2006-2012), North Country Funds. |
Colleen A. Murray
Age: 45 | AML Compliance
Officer since 2013 | Assistant Vice President (2010-Present); SNB Bank Secrecy Act Officer/GFN/BSA Specialist (2009 -Present); Assistant Compliance and Training Officer/BSA Specialist (2004-2009), Glens Falls National Bank & Trust Co. |
Michael J. Wagner
Age: 66 | Chief Compliance
Officer
since 2006 | President (2006- Present); Chief Operating Officer (2004 to present), Northern Lights Compliance Services, LLC (formerly known as Fund Compliance Services, LLC);Vice President of Blu Giant LLC (formerly GemCom, LLC) (2004- present) |
Rose Anne Casaburri
Age: 64 | Secretary
since 2001 | Chief Paralegal, Gemini Fund Services, LLC. (2001- Present). |
Harris Cohen
Age: 35 | Treasurer
since 2012 | Assistant Vice President of Fund Administration (2016 – Present); Manager of Fund Administration (2011-2016); Senior Fund Administrator (2005-2011), Gemini Fund Services, LLC |
| * | John E. Arsenault is deemed to be an “interested person” of The North Country Funds, as defined by the 1940 Act because prior to May 1, 2013 he was an officer of The North Country Funds’ investment adviser. |
| ** | Mr. Hoy is an “interested person” because of his position with Arrow Financial Corp., the parent holding company of the Adviser and GFNB. |
The Trust’s Statement of Additional Information includes additional information about the Trustees of the Trust and is available, without charge, upon request by calling 1-888-350-2990.
| | THE NORTH COUNTRY FUNDS | |
| | | |
| DISCLOSURE OF FUND EXPENSES (Unaudited) |
As a shareholder of a Fund in The North Country Funds, you incur ongoing costs, including management fees and other Fund expenses. This example is intended to help you understand your ongoing costs (in dollars) of investing in the Funds and to compare these costs with the ongoing costs of investing in other mutual funds. Please note, the expenses shown in the tables are meant to highlight ongoing costs only and do not reflect any transactional costs, such as sales charges (loads), or contingent deferred sales charges (CDSCs) on redemptions.
This example is based on an investment of $1,000 invested at June 1, 2016 and held until November 30, 2016.
Actual Expenses: The “Actual” section of the table provides information about actual account values and actual expenses. You may use the information in this line, together with the amount you invested, to estimate the expenses that you paid over the period. Simply divide your account value by $1,000 (for example, an $8,600 account value divided by $1,000 = 8.6), then multiply the result by the number in the column under the heading entitled “Expenses Paid During the Period” to estimate the expenses you paid on your account during the period.
Hypothetical Examples for Comparison Purposes: The “Hypothetical” section of the table below provides information about hypothetical account values and hypothetical expenses based on the Fund’s actual expense ratio and an assumed rate of return of 5% per year before expenses, which is not the Fund’s actual return. The hypothetical account values and expenses may not be used to estimate the actual ending account balance or expenses you paid for the period. You may use this information to compare the ongoing costs of investing in the Fund with other funds. To do so, compare this 5% hypothetical example with the 5% hypothetical examples that appear in the shareholder reports of other funds.
Please note that the expenses shown in the table are meant to highlight your ongoing costs only and do not reflect any transactional costs which may be applicable to your account. Therefore, the “Hypothetical” example is useful in comparing ongoing costs only, and will not help you determine the relative total costs of owning different funds. In addition, if transactional costs were included, your costs would have been higher.
| | Beginning | Ending | Expense | Expenses Paid During |
| | Account Value | Account Value | Ratio | the Period* |
| | (6/1/16) | (11/30/16) | (Annualized) | (6/1/16 – 11/30/16) |
| Equity Growth Fund | | | | |
| Actual | $1,000.00 | $1,046.50 | 1.03% | $5.29 |
| Hypothetical | | | | |
| (5% return before expenses) | $1,000.00 | $1,019.83 | 1.03% | $5.22 |
| Intermediate Bond Fund | | | | |
| Actual | $1,000.00 | $ 986.50 | 0.82% | $4.09 |
| Hypothetical | | | | |
| (5% return before expenses) | $1,000.00 | $1,020.89 | 0.82% | $4.16 |
| * | Expenses are equal to the Fund’s annualized expense ratio multiplied by the average account value over the period, multiplied by 183 days divided by 366 days. |
| | THE NORTH COUNTRY FUNDS | |
| | | |
| ADDITIONAL INFORMATION (Unaudited) |
FACTORS CONSIDERED BY THE INDEPENDENT TRUSTEES IN APPROVING THE INVESTMENT ADVISORY AGREEMENT
At a meeting (the “Meeting”) of the Board of Trustees (the “Board” or the “Trustees”) held on January 26, 2016, a majority of the Board, including a majority of trustees who are not “interested persons” of the Trust, as that term is defined in Section 2(a)(19) of the Investment Company Act of 1940, as amended (hereafter, the “Independent Trustees”), unanimously approved the continuance of the investment advisory agreement (the “Advisory Agreement”) between North Country Investment Advisers, Inc. (“NCIA” or the “Adviser”) and the Funds. Fund counsel discussed with the Board its fiduciary responsibility to shareholders and the importance of assessing certain specific factors in its deliberations. Prior to the Meeting, the Adviser provided the Board with a number of written materials, including information relating to: a) the terms of the Advisory Agreement and fee arrangements with the Funds; b) the Adviser’s management and investment personnel; c) the financial condition and stability of the Adviser; d) data comparing each Fund’s fees, operating expenses and performance with that of a group of mutual funds in the same category, as determined by Lipper, Inc., that the Funds’ Administrator determined were similar in size to the Funds (each, a “Peer Group”); and e) past performance of each Fund as compared to its respective benchmark. In addition, the Board engaged in in-person discussions with representatives of the Adviser. The Board also met outside the presence of the Adviser to consider this matter and consulted with independent counsel and the Funds’ Chief Compliance Officer.
The Board, including the Independent Trustees, unanimously approved continuance of the Advisory Agreement based upon its review of the written materials provided at the Meeting, the reports provided at each quarterly meeting of the Board, the Board’s discussions with key personnel of the Adviser, and the Board’s deliberations. In their deliberations, the Trustees did not identify any particular information that was all-important or controlling, and individual Trustees may have attributed different weights to the various factors. Below is a summary of the Board’s conclusions regarding various factors relevant to approval of continuance of the Advisory Agreement:
Nature, Extent and Quality of Services. The Board examined the nature, extent and quality of the services provided by the Adviser to the Funds. The Board, including the Independent Trustees, reviewed the qualifications of the Adviser’s key personnel, including the experience of the Funds’ portfolio managers, and agreed that sharing resources with its parent bank is a positive aspect of the Adviser’s services to the Funds. The Trustees discussed the Adviser’s compliance program. They also discussed the financial strength and stability of the Adviser. Based on these considerations, the Trustees determined that the Adviser has the capabilities, resources and personnel necessary to manage the Funds and concluded that they were satisfied with the nature, extent and quality of the services provided to the Funds under the Advisory Agreement.
Performance of the Adviser. The Independent Trustees discussed in detail the information provided to them regarding each Fund’s performance compared to its benchmark and an arithmetic average of the total return of the thirty largest funds in each Fund’s Lipper category. The Trustees noted that the Bond Fund had outperformed its Lipper category average for the 1-year period ended December 31, 2015 and had underperformed its Lipper category average for the 3-, 5- and 10-year periods ended December 31, 2015. The Trustees also noted that the Bond Fund performed in-line with the Barclays U.S. Aggregate Bond Index (the “Barclays Index”) and underperformed its former index, the Bank of America Merrill Lynch 1-10 Year AAA-A U.S. Corporate & Government Index (the “BofA Index”), for the 1-year period; underperformed the Barclays Index and its former BofA Index for the 3-year period; underperformed the Barclays Index and was in-line with its former BofA Index for the 5-year period; and
| | THE NORTH COUNTRY FUNDS | |
| | | |
| ADDITIONAL INFORMATION (Unaudited) (Continued) |
underperformed both indexes for the 10-year period. When evaluating the Bond Fund’s more recent performance, the Trustees took into account that the Bond Fund’s portfolio had been slightly altered when the Fund’s benchmark was changed to the Barclays Index on April 1, 2015. The Trustees noted that the Growth Fund had outperformed its Lipper category average and its benchmark for the 1-year period and, for the 3- and 5-year periods, the Growth Fund outperformed its Lipper category average and slightly underperformed its benchmark. The Trustees further noted that for the 10-year period, the Growth Fund underperformed or was in-line with its Lipper category average and benchmark. The Trustees considered that the Funds’ performance reflects, in part, the conservative manner in which they are managed and concluded that the investment performance of each Fund was sufficient to warrant continuation of the Advisory Agreement.
Cost of Services. With regard to cost of services and fees and expenses, the Trustees reviewed comparative fees charged by advisers to the Peer Group. The Trustees noted that the Bond Fund’s effective management fee was above average relative to the Peer Group, while net expenses as of November 30, 2015 were below the median and higher than the average for the Peer Group. The Trustees also noted that the Growth Fund’s effective management fee and net expenses as of November 30, 2015 were both higher than the average for the Peer Group. The Trustees considered that the Adviser’s voluntary waiver of 0.05% of its advisory fees for the Bond Fund would expire at the end of March. Overall, the Trustees concluded that the cost of the services provided by the Adviser is within a reasonable range and supported continuation of the Advisory Agreement.
Profitability. The Trustees considered the Adviser’s profits realized in connection with the operation of the Funds. The Trustees noted that the Adviser was not receiving 12b-1 fees, soft dollars or affiliated brokerage fees in connection with its services to the Funds. The Independent Trustees considered that NCIA had voluntarily limited the overall expense ratio of each Fund from its inception through the fiscal year ended November 30, 2009 and noted that the Funds are continuing to operate within those limitations. The Trustees concluded that, based on the quality of services provided, the profitability of the Adviser’s relationship with the Funds warranted continuation of the Advisory Agreement.
Economies of Scale. The Trustees noted that the Adviser represented that certain efficiencies may be realized when the level of assets under management in each Fund nears $500 million. The Trustees concluded that they would re-visit the issue of certain benefits to the Funds’ shareholders that might ensue from economies of scale following any significant growth in Fund assets or other change in circumstances.
Conclusion. Having requested and received such information from the Adviser as the Board believed to be reasonably necessary to evaluate the terms of the Advisory Agreement, and with the assistance of independent legal counsel, the Board concluded that the overall arrangements provided under the terms of the Advisory Agreement were reasonable, and that continuance of the Advisory Agreement was in the best interests of the Funds’ shareholders.
Rev July 2011
| FACTS | WHAT DO THE NORTH COUNTRY FUNDS DO WITH YOUR PERSONAL INFORMATION? |
| Why? | Financial companies choose how they share your personal information. Federal law gives consumers the right to limit some but not all sharing. Federal law also requires us to tell you how we collect, share, and protect your personal information. Please read this notice carefully to understand what we do. |
| What? | The types of personal information we collect and share depend on the product or service you have with us. This information can include: ● Social Security number and wire transfer instructions ● account transactions and transaction history ● investment experience and purchase history When you are no longer our customer, we continue to share your information as described in this notice. |
| How? | All financial companies need to share customers’ personal information to run their everyday business. In the section below, we list the reasons financial companies can share their customers’ personal information; the reasons The North Country Funds (“The Funds”) choose to share; and whether you can limit this sharing. |
| Reasons we can share your personal information | | Do The Funds share? | | Can you limit this sharing? |
| For our everyday business purposes — such as to process your transactions, maintain your account(s), respond to court orders and legal investigations, or report to credit bureaus | | Yes | | No |
| For our marketing purposes — to offer our products and services to you | | Yes | | No |
| For joint marketing with other financial companies | | Yes | | No |
| For our affiliates’ everyday business purposes — information about your transactions and experiences | | Yes | | No |
| For our affiliates’ everyday business purposes — information about your creditworthiness | | No | | We don’t share |
| For our affiliates to market to you | | No | | We don’t share |
| For nonaffiliates to market to you | | No | | We don’t share |
| Questions? | Call 1-888-350-2990 |
| Who we are |
Who is providing this notice? | The North Country Funds |
| What we do |
How do The Funds protect my personal information? | To protect your personal information from unauthorized access and use, we use security measures that comply with federal law. These measures include computer safeguards and secured files and buildings. We restrict access to nonpublic personal information about you to those employees who need to know that information to provide products or services to you. |
How do The Funds collect my personal information? | We collect your personal information, for example, when you ● open an account or deposit money ● direct us to buy securities or direct us to sell your securities ● seek advice about your investments We also collect your personal information from others, such as credit bureaus, affiliates, or other companies. |
Why can’t I limit all sharing? | Federal law gives you the right to limit only ● sharing for affiliates’ everyday business purposes — information about your creditworthiness ● affiliates from using your information to market to you ● sharing for non-affiliates to market to you ● State laws and individual companies may give you additional rights to limit sharing. |
| Definitions |
| Affiliates | Companies related by common ownership or control. They can be financial and nonfinancial companies. ● Our affiliates include financial companies such as Glens Falls National Bank and Trust Company and North Country Investment Advisers. |
| Nonaffiliates | Companies not related by common ownership or control. They can be financial and nonfinancial companies. ● The Funds do not share with nonaffiliates so they can market you. |
| Joint marketing | A formal agreement between nonaffiliated financial companies that together market financial products or services to you. ● The Funds do not jointly market. |
How to Obtain Proxy Voting Information
Information regarding how the Funds voted proxies relating to portfolio securities during the most recent 12-month period ending June 30, as well as a description of the policies and procedures that the Funds use to determine how to vote proxies is available without charge, upon request, by calling toll-free 1-888-350-2990 or by referring to the Securities and Exchange
Commission’s (“SEC”) website at http://www.sec.gov.
How to Obtain 1st and 3rd Fiscal Quarter Portfolio Holdings
Each Fund files its complete schedule of portfolio holdings with the SEC for the first and third quarters of each fiscal year on Form N-Q. Form N-Q is available on the SEC’s website at http://www.sec.gov and may be reviewed and copied at the SEC’s Public Reference Room in Washington, DC (1-800-SEC-0330). The information on Form N-Q is available without charge, upon request, by calling 1-888-350-2990.
Item 2. Code of Ethics.
As of the end of the period covered by this report, the Registrant has adopted a code of ethics that applies to the Registrant's principal executive officer and principal financial officer.
Item 3. Audit Committee Financial Expert.
The Registrant’s board of trustees has determined that John C. Olsen is an audit committee financial expert, as defined in Item 3 of Form N-CSR. Mr. Olsen is independent for purposes of this Item 3.
Item 4. Principal Accountant Fees and Services.
For the fiscal year ended November 30, 2016, the aggregate audit, audit-related and tax fees billed by Cohen Fund Audit Services, Ltd. for professional services rendered for the audits of the financial statement, or services that are normally provided in connection with statutory and regulatory filings or engagements for that fiscal year, for The North Country Funds are shown below. The aggregate tax fees billed by Cohen Fund Audit Services, Ltd. were rendered for tax compliance, tax advice and tax planning for each fund.
FY 2016 $ 26,000
FY 2015 $ 26,000
FY 2016 $ 0
FY 2015 $ 0
FY 2016 $ 5,000
FY 2015 $ 5,000
FY 2016 $ 0
FY 2015 $ 0
| (e) | (1) Audit Committee’s Pre-Approval Policies |
The Registrant’s Audit Committee is required to pre-approve all audit services and, when appropriate, any non-audit services (including audit-related, tax and all other services) to the Registrant. The Registrant’s Audit Committee also is required to pre-approve, when appropriate, any non-audit services (including audit-related, tax and all other services) to its adviser, or any entity controlling, controlled by or under common control with the adviser that provides ongoing services to the Registrant, to the extent that the services may be determined to have an impact on the operations or financial reporting of the Registrant. Services are reviewed on an engagement by engagement basis by the Audit Committee.
| (2) | There were no amounts that were approved by the Audit Committee pursuant to paragraph (c)(7)(i)(c) of Rule 2-01 of Regulation S-X for the fiscal year ended November 30, 2016. |
(f) During the audit of Registrant's financial statements for the most recent fiscal year, less than 50 percent of the hours expended on the principal accountant's engagement were attributed to work performed by persons other than the principal accountant's full-time, permanent employees.
(g) The aggregate non-audit fees billed by the Registrant's accountant for services rendered to the Registrant, and rendered to the Registrant's investment adviser (not including any sub-adviser whose role is primarily portfolio management and is subcontracted with or overseen by another investment adviser), and any entity controlling, controlled by, or under common control with the adviser that provides ongoing services to the Registrant:
| | Registrant | Adviser |
| FY 2016 | $5,000 | $0 |
| FY 2015 | $5,000 | $0 |
(h) Not applicable. All non-audit services to the Registrant were pre-approved by the Audit Committee for FY 2016.
Item 5. Audit Committee of Listed Registrants. Not applicable to open-end investment companies.
Item 6. Schedule of Investments. Not applicable.
Item 7. Disclosure of Proxy Voting Policies and Procedures for Closed-End Management Investment Companies. Not applicable to open-end investment companies.
Item 8. Portfolio Managers of Closed-End Management Investment Companies. Not applicable to open-end investment companies.
Item 9. Purchases of Equity Securities by Closed-End Management Investment Company and Affiliated Purchases . Not applicable to open-end investment companies.
Item 10. Submission of Matters to a Vote of Security Holders. None
Item 11. Controls and Procedures.
(a) Based on an evaluation of the Registrant’s disclosure controls and procedures as of a date within 90 days of filing date of this Form N-CSR, the principal executive officer and principal financial officer of the Registrant have concluded that the disclosure controls and procedures of the Registrant are reasonably designed to ensure that the information required in filings on Form N-CSR is recorded, processed, summarized, and reported by the filing date, including that information required to be disclosed is accumulated and communicated to the Registrant’s management, including the Registrant’s principal executive officer and principal financial officer, as appropriate to allow timely decisions regarding required disclosure.
(b) There were no significant changes in the Registrant’s internal control over financial reporting that occurred during the Registrant’s second fiscal quarter of the period covered by this report that has materially affected, or are reasonably likely to materially affect, the Registrant’s internal control over financial reporting.
Item 12. Exhibits.
(a)(1) Code of Ethics filed herewith.
(a)(2) Certifications required by Section 302 of the Sarbanes-Oxley Act of 2002 (and Item 11(a)(2) of Form N-CSR) are filed herewith.
(a)(3) Not applicable for open-end investment companies.
(b) Certifications required by Section 906 of the Sarbanes-Oxley Act of 2002 (and Item 11(b) of Form N-CSR) are filed herewith.
SIGNATURES
Pursuant to the requirements of the Securities Exchange Act of 1934 and the Investment Company Act of 1940, the Registrant has duly caused this report to be signed on its behalf by the undersigned, thereunto duly authorized.
(Registrant) The North Country Funds
By (Signature and Title)
/s/ James Colantino
James Colantino, President
Date 2/6/17
Pursuant to the requirements of the Securities Exchange Act of 1934 and the Investment Company Act of 1940, this report has been signed below by the following persons on behalf of the Registrant and in the capacities and on the dates indicated.
By (Signature and Title)
/s/ James Colantino
James Colantino, President
Date 2/6/17
By (Signature and Title)
/s/ Harris Cohen
Harris Cohen, Treasurer
Date 2/6/17