Exhibit 99.2
Performance of Wipro Limited for Quarter ended -September 30, 2012 Suresh Senapaty Executive Director and Chief Financial Officer November 02, 2012 © 2012 WIPRO LTD | WWW.WIPRO.COM
Safe Harbor This presentation may contain certain “forward looking” statements, which involve a number of risks, uncertainties and other factors that could cause actual results to differ materially from those that may be projected by these forward looking statements. These uncertainties have been detailed in the reports filed by Wipro with the Securities and Exchange Commission and these filings are available at www.sec.gov. This presentation also contains references to findings of various reports available in the public domain. Wipro makes no representation as to their accuracy or that the company subscribes to those findings.
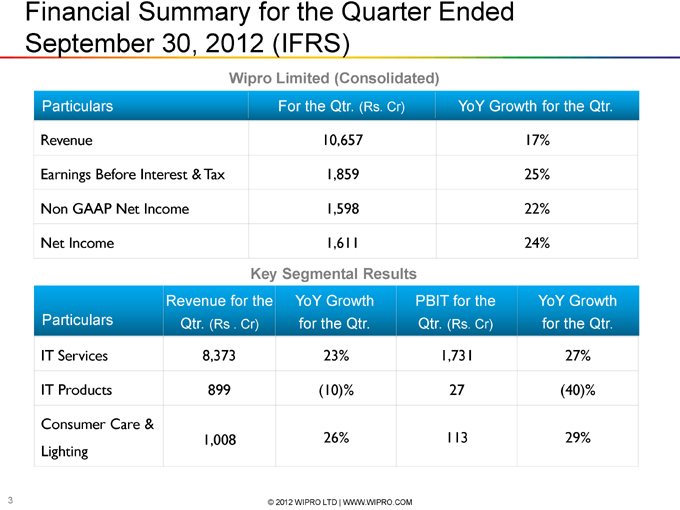
Financial Summary for the Quarter Ended September 30, 2012 (IFRS) Wipro Limited (Consolidated) Particulars For the Qtr. (Rs. Cr) YoY Growth for the Qtr. Revenue 10,657 17% Earnings Before Interest & Tax 1,859 25% Non GAAP Net Income 1,598 22% Net Income 1,611 24% Key Segmental Results Revenue for the YoY Growth PBIT for the YoY Growth Particulars Qtr. (Rs . Cr) for the Qtr. Qtr. (Rs. Cr) for the Qtr. IT Services 8,373 23% 1,731 27% IT Products 899 (10)% 27 (40)% Consumer Care & 1,008 26% 113 29% Lighting
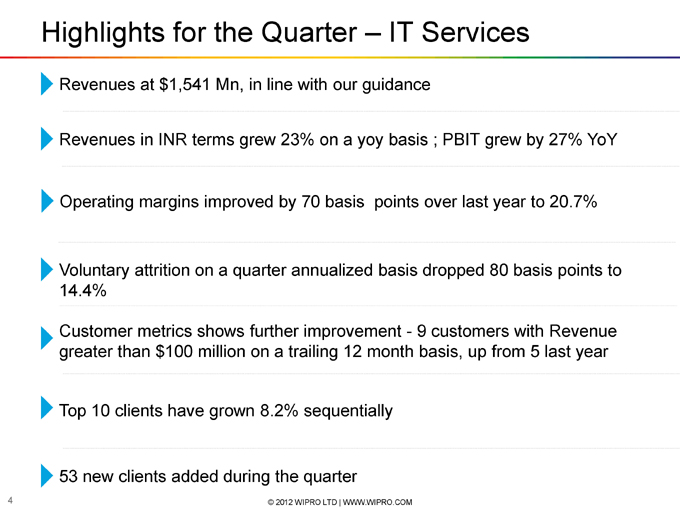
Highlights for the Quarter – IT Services Revenues at $1,541 Mn, in line with our guidance Revenues in INR terms grew 23% on a yoy basis ; PBIT grew by 27% YoY Operating margins improved by 70 basis points over last year to 20.7% Voluntary attrition on a quarter annualized basis dropped 80 basis points to 14.4% Customer metrics shows further improvement—9 customers with Revenue greater than $100 million on a trailing 12 month basis, up from 5 last year Top 10 clients have grown 8.2% sequentially 53 new clients added during the quarter
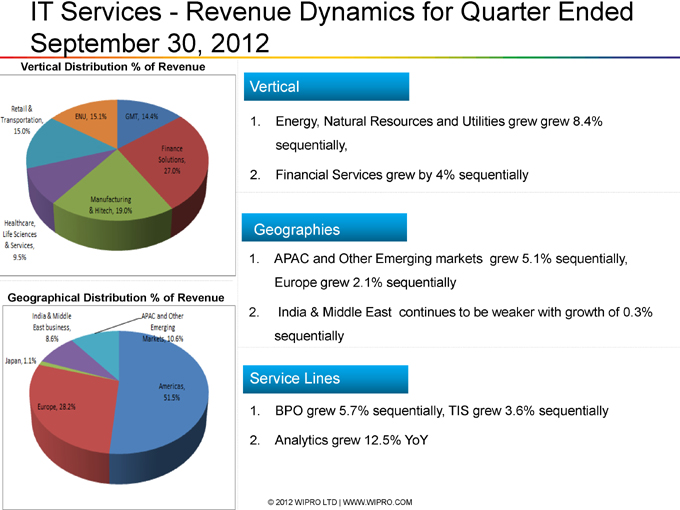
IT Services—Revenue Dynamics for Quarter Ended September 30, 2012 Vertical Distribution % of Revenue Vertical 1. Energy, Natural Resources and Utilities grew grew 8.4% sequentially, 2. Financial Services grew by 4% sequentially Geographies 1. APAC and Other Emerging markets grew 5.1% sequentially, Europe grew 2.1% sequentially Geographical Distribution % of Revenue 2. India & Middle East continues to be weaker with growth of 0.3% sequentially Service Lines 1. BPO grew 5.7% sequentially, TIS grew 3.6% sequentially 2. Analytics grew 12.5% YoY
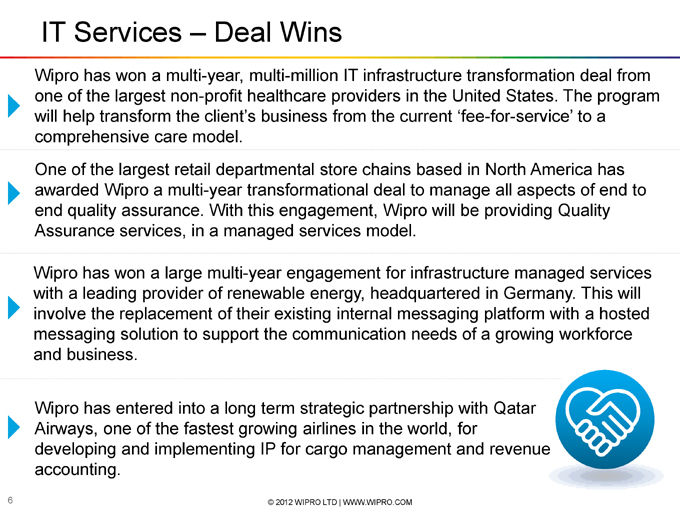
IT Services – Deal Wins Wipro has won a multi-year, multi-million IT infrastructure transformation deal from one of the largest non-profit healthcare providers in the United States. The program will help transform the client?s business from the current „fee-for-service? to a comprehensive care model. One of the largest retail departmental store chains based in North America has awarded Wipro a multi-year transformational deal to manage all aspects of end to end quality assurance. With this engagement, Wipro will be providing Quality Assurance services, in a managed services model. Wipro has won a large multi-year engagement for infrastructure managed services with a leading provider of renewable energy, headquartered in Germany. This will involve the replacement of their existing internal messaging platform with a hosted messaging solution to support the communication needs of a growing workforce and business. Wipro has entered into a long term strategic partnership with Qatar Airways, one of the fastest growing airlines in the world, for developing and implementing IP for cargo management and revenue accounting.
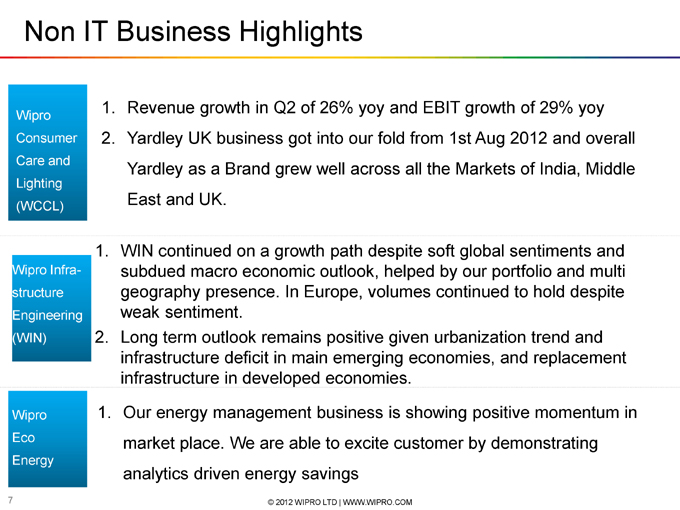
Non IT Business Highlights 1. Revenue growth in Q2 of 26% yoy and EBIT growth of 29% yoy Wipro Consumer 2. Yardley UK business got into our fold from 1st Aug 2012 and overall Care and Yardley as a Brand grew well across all the Markets of India, Middle Lighting (WCCL) East and UK. 1. WIN continued on a growth path despite soft global sentiments and Wipro Infra- subdued macro economic outlook, helped by our portfolio and multi structure geography presence. In Europe, volumes continued to hold despite Engineering weak sentiment. (WIN) 2. Long term outlook remains positive given urbanization trend and infrastructure deficit in main emerging economies, and replacement infrastructure in developed economies. Wipro 1. Our energy management business is showing positive momentum in Eco market place. We are able to excite customer by demonstrating Energy analytics driven energy savings
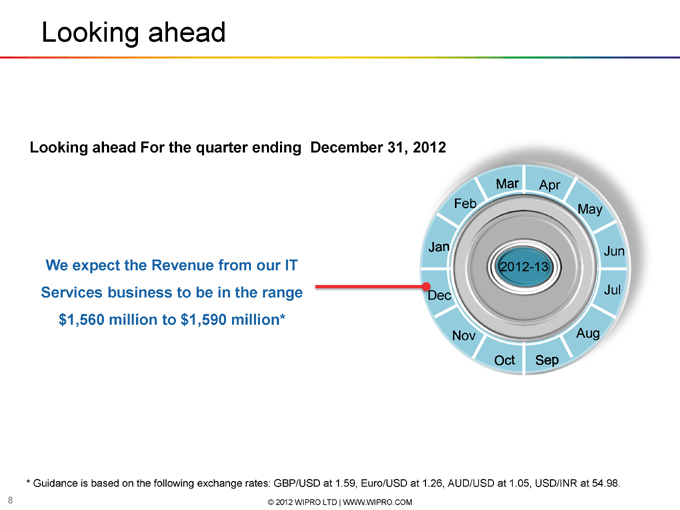
Looking ahead Looking ahead For the quarter ending December 31, Apr Feb May Jun We expect the Revenue from our IT 2012-13 Services business to be in the range Dec Jul $1,560 million to $1,590 million* Nov Aug * Guidance is based on the following exchange rates: GBP/USD at 1.59, Euro/USD at 1.26, AUD/USD at 1.05, USD/INR at 54.98.
Supplemental Data Key Operating Metrics of IT Services
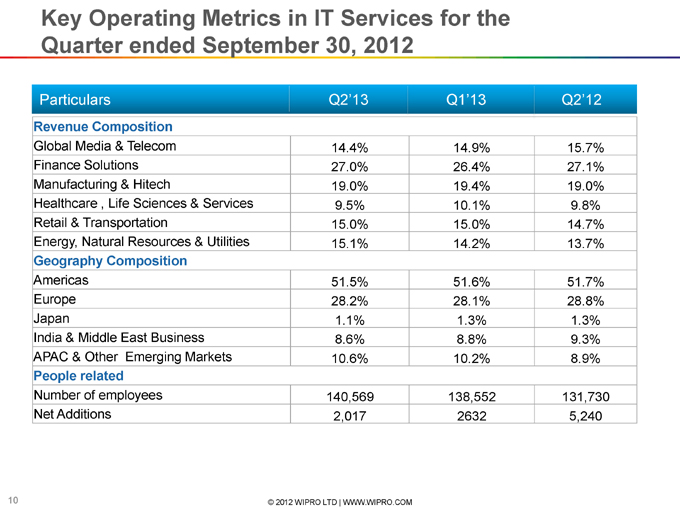
Key Operating Metrics in IT Services for the Quarter ended September 30, 2012 Particulars Q2?13 Q1?13 Q2?12 Revenue Composition Global Media & Telecom 14.4% 14.9% 15.7% Finance Solutions 27.0% 26.4% 27.1% Manufacturing & Hitech 19.0% 19.4% 19.0% Healthcare , Life Sciences & Services 9.5% 10.1% 9.8% Retail & Transportation 15.0% 15.0% 14.7% Energy, Natural Resources & Utilities 15.1% 14.2% 13.7% Geography Composition Americas 51.5% 51.6% 51.7% Europe 28.2% 28.1% 28.8% Japan 1.1% 1.3% 1.3% India & Middle East Business 8.6% 8.8% 9.3% APAC & Other Emerging Markets 10.6% 10.2% 8.9% People related Number of employees 140,569 138,552 131,730 Net Additions 2,017 2632 5,240
Thank You Suresh Senapaty Executive Director and CFO suresh.senapaty@wipro.com