Exhibit 99.2
Performance of Wipro Limited for Quarter and Year ended - March 31, 2013 Suresh Senapaty Executive Director and Chief Financial Officer April 19, 2013
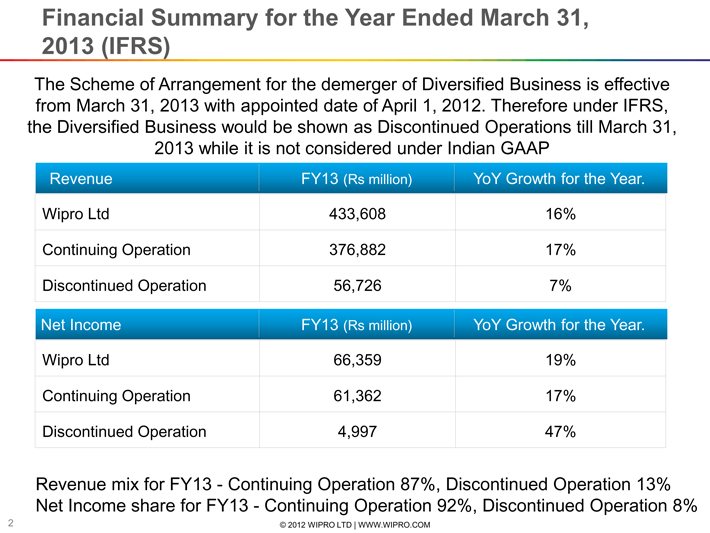
Financial Summary for the Year Ended March 31, 2013 (IFRS) The Scheme of Arrangement for the demerger of Diversified Business is effective from March 31, 2013 with appointed date of April 1, 2012. Therefore under IFRS, the Diversified Business would be shown as Discontinued Operations till March 31, 2013 while it is not considered under Indian GAAPRevenue Wipro Ltd 433,608 16% Continuing Operation 376,882 17% Discontinued Operation 56,726 7% Net Income Wipro Ltd 66,359 19% Continuing Operation 61,362 17% Discontinued Operation 4,997 47% Revenue mix for FY13 - Continuing Operation 87%, Discontinued Operation 13% Net Income share for FY13 - Continuing Operation 92%, Discontinued Operation 8%
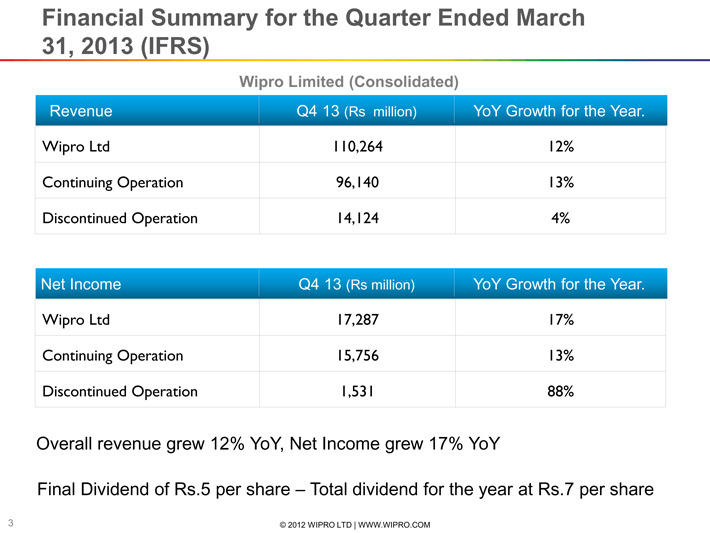
Financial Summary for the Quarter Ended March 31, 2013 (IFRS) Wipro Limited (Consolidated) Wipro Ltd 110,264 12% Continuing Operation 96,140 13% Discontinued Operation 14,124 4% Wipro Ltd 17,287 17% Continuing Operation 15,756 13% Discontinued Operation 1,531 88% Overall revenue grew 12% YoY, Net Income grew 17% YoY Final Dividend of Rs.5 per share – Total dividend for the year at Rs.7 per share
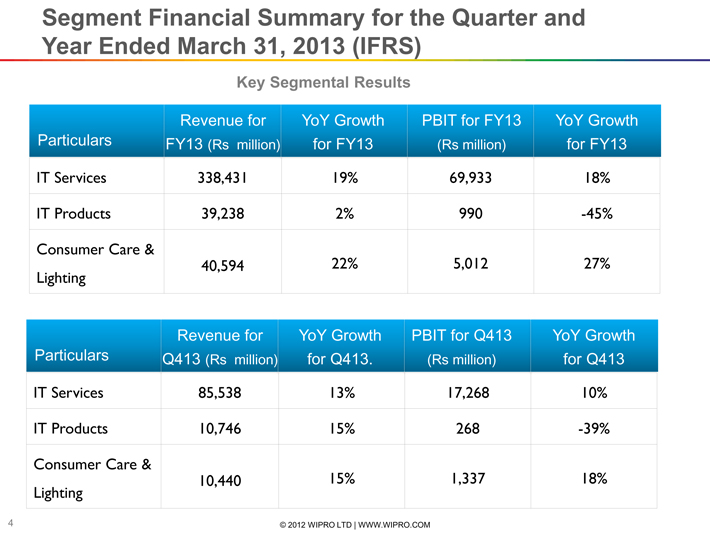
Segment Financial Summary for the Quarter and Year Ended March 31, 2013 (IFRS) Key Segmental Results IT Services 338,431 19% 69,933 18% IT Products 39,238 2% 990 -45% Consumer Care & Lighting 40,594 22% 5,012 27% IT Services 85,538 13% 17,268 10% IT Products 10,746 15% 268 -39% Consumer Care & Lighting 10,440 15% 1,337 18%
Highlights for the Quarter – IT Services IT Services Revenue in constant currency was $1,598.6 million, within our guidance. Revenues in INR terms grew 13% on a yoy basis ; PBIT also grew by 10% YoY 52 new clients added during the quarter Healthy volume growth sequentially of 2.5% Strong cash flow generation – Operating cash flow at 105% of PAT for Continued Operations
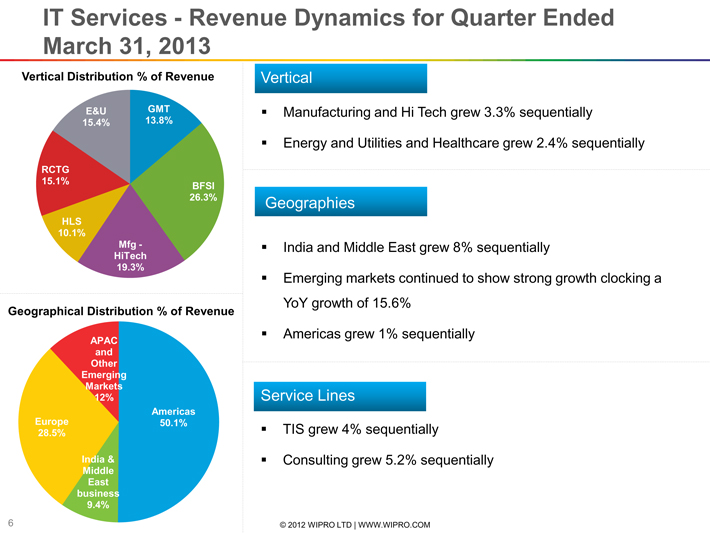
IT Services - Revenue Dynamics for Quarter Ended March 31, 2013 Manufacturing and Hi Tech grew 3.3% sequentially Energy and Utilities and Healthcare grew 2.4% sequentially Vertical Vertical Distribution % of Revenue India and Middle East grew 8% sequentially Emerging markets continued to show strong growth clocking a YoY growth of 15.6% Americas grew 1% sequentially Geographies Geographical Distribution % of Revenue TIS grew 4% sequentially Consulting grew 5.2% sequentially
IT Services – Deal Wins Wipro has secured a contract from a large Europe-based universal bank to build a “Centralized Testing Unit” that will help the bank achieve higher production stability and lower cost of avoidance in its Testing processes. Wipro’s Transformation Services and Data Obfuscation Services along with industry leading testing services will help the bank achieve standardized Testing processes across the organization. GVK-led Mumbai International Airport Pvt. Ltd. (MIAL), the operator of the Chhatrapati Shivaji International Airport (CSIA) in Mumbai has chosen Wipro to provide world-class IT services for the new integrated terminal “T2”. Wipro will be responsible for providing Managed Services across the entire IT landscape at MIAL and deliver high availability and operational efficiency across all the critical airport processes. A leading European telecom vendor has extended its existing partnership with Wipro to design and maintain its network management product portfolio. Wipro has won an ERP deal for Asset and Infrastructure Management from a key national defense
Non IT Business (Discontinued Operations) Highlights Revenue growth in Q4 of 15% yoy and EBIT growth of 18% yoy Santoor Soap placed strongly as Number 3 brand position at All India level and Number 1 brand in South + West market regions combined Growth in International businesses driven by Indonesia up 21.3%, China grew 29.5%, Middle East up 19.3% and Vietnam grew 24.5%. Top brands Enchanteur grew by 15%, Romano grew by 48% and Safi grew by 19% We continue our investments in US, Brazil, China and Europe We have seen a slowdown in Q4, particularly in India due to macroeconomic conditions. However, we do believe that demand in India will improve in the coming quarters WIN is positioned strongly, as a global player and partner of choice.
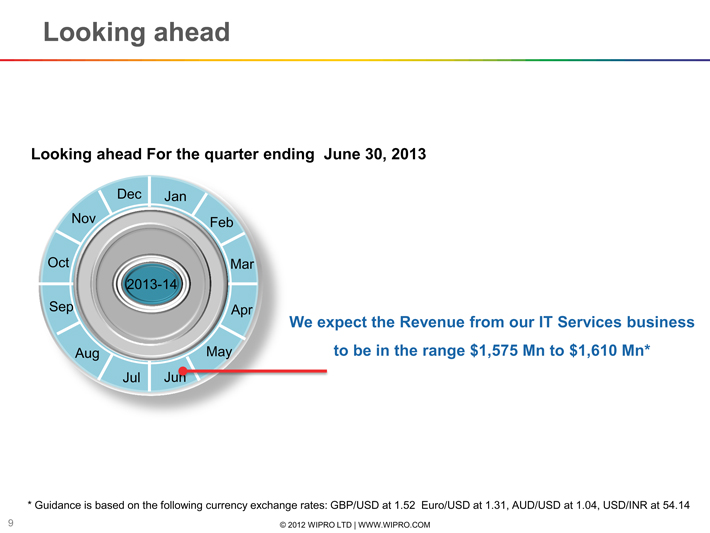
Looking ahead Looking ahead For the quarter ending June 30, 2013 We expect the Revenue from our IT Services business to be in the range $1,575 Mn to $1,610 Mn** Guidance is based on the following currency exchange rates: GBP/USD at 1.52 Euro/USD at 1.31, AUD/USD at 1.04, USD/INR at 54.14
Supplemental Data Key Operating Metrics of IT Services
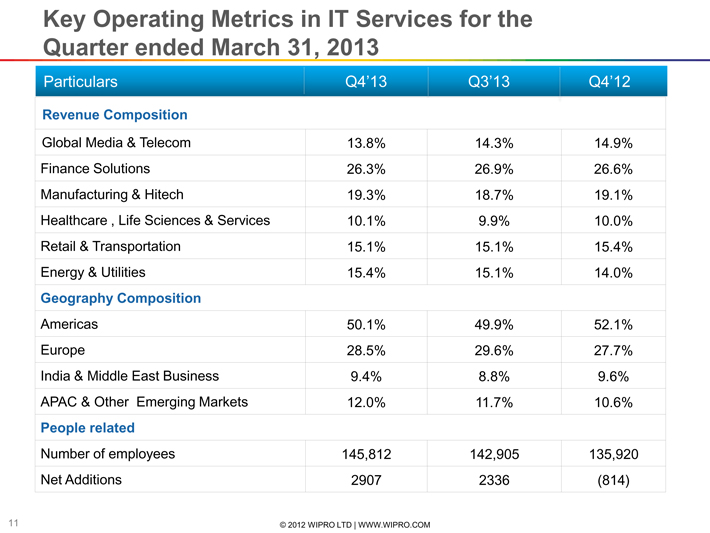
Key Operating Metrics in IT Services for the Quarter ended March 31, 2013 Revenue Composition Global Media & Telecom 13.8% 14.3% 14.9% Finance Solutions 26.3% 26.9% 26.6% Manufacturing & Hitech 19.3% 18.7% 19.1% Healthcare , Life Sciences & Services 10.1% 9.9% 10.0% Retail & Transportation 15.1% 15.1% 15.4% Energy & Utilities 15.4% 15.1% 14.0% Geography Composition Americas 50.1% 49.9% 52.1% Europe 28.5% 29.6% 27.7% India & Middle East Business 9.4% 8.8% 9.6% APAC & Other Emerging Markets 12.0% 11.7% 10.6% People related Number of employees 145,812 142,905 135,920 Net Additions 2907 2336 (814)
Thank You suresh.senapaty@wipro.com Suresh Senapaty Executive Director and CFO