Exhibit 99.3
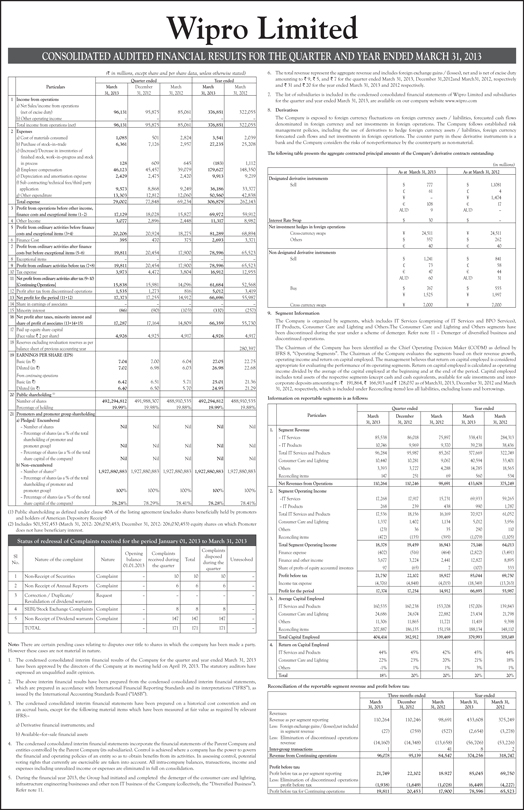
Wipro Limited CONSOLIDATED AUDITED FINANCIAL RESULTS FOR THE QUARTER AND YEAR ENDED MARCH 31, 2013(‘ in millions, except share and per share data, unless otherwise stated) Note: There are certain pending cases relating to disputes over title to shares in which the company has been made a party. However these cases are not material in nature. 1. The condensed consolidated interim financial results of the Company for the quarter and year ended March 31, 2013 have been approved by the directors of the Company at its meeting held on April 19, 2013. The statutory auditors have expressed an unqualified audit opinion. 2. The above interim financial results have been prepared from the condensed consolidated interim financial statements, which are prepared in accordance with International Financial Reporting Standards and its interpretations (“IFRS”), as issued by the International Accounting Standards Board (“IASB”). 3. The condensed consolidated interim financial statements have been prepared on a historical cost convention and on an accrual basis, except for the following material items which have been measured at fair value as required by relevant IFRS:– a) Derivative financial instruments; and b) Available–for–sale financial assets 4. The condensed consolidated interim financial statements incorporate the financial statements of the Parent Company and entities controlled by the Parent Company (its subsidiaries). Control is achieved where a company has the power to govern the financial and operating policies of an entity so as to obtain benefits from its activities. In assessing control, potential voting rights that currently are exercisable are taken into account. All intra-company balances, transactions, income and expenses including unrealized income or expenses are eliminated in full on consolidation. 5. During the financial year 2013, the Group had initiated and completed the demerger of the consumer care and lighting, infrastructure engineering businesses and other non IT business of the Company (collectively, the “Diversified Business”). Refer note 11. Three months ended Year ended March 31, 2013 December 31, 2012 March 31, 2012 March 31, 2013 March 31, 2012 Revenues: Revenue as per segment reporting 110,264 110,246 98,691 433,608 375,249 Less: Foreign exchange gains / (losses),net included in segment revenue (27) (759) (527) (2,654) (3,278) Less: Elimination of discontinued operations revenue (14,160) (14,348) (13,658) (56,706) (53,226) Inter-group transactions 1 – 41 8 2 Revenue from Continuing operations 96,078 95,139 84,547 374,256 318,747 Profit before tax: Profit before tax as per segment reporting 21,749 22,102 18.927 85,045 69,750 Less: Elimination of discontinued operations profit before tax (1,938) (1,649) (1,028) (6,449) (4,227) Profit before tax for Continuing operations 19,811 20,453 17,900 78,596 65,523 Particulars Quarter ended Year ended March 31, 2013 December 31, 2012 March 31, 2012 March 31, 2013 March 31, 2012 1 Income from operations a) Net Sales/income from operations (net of excise duty) 96,131 95,875 85,061 376,851 322,055 b) Other operating income – – – – – Total income from operations (net) 96,131 95,875 85,061 376,851 322,055 2 Expenses a) Cost of materials consumed 1,085 501 2,824 3,541 2,039 b) Purchase of stock–in–trade 6,361 7,126 2,957 27,235 25,208 c) (Increase)/Decrease in inventories of finished stock, work–in–progress and stock in process 128 609 645 (183) 1,112 d) Employee compensation 46,123 45,457 39,079 179,627 148,350 e) Depreciation and amortisation expense 2,429 2,475 2,420 9,913 9,219 f) Sub contracting/technical fees/third party application 9,573 8,868 9,249 36,186 33,377 g) Other expenditure 13,303 12,812 12,060 50,560 42,838 Total expense 79,002 77,848 69,234 306,879 262,143 3 Profit from operations before other income, finance costs and exceptional items (1–2) 17,129 18,028 15,827 69,972 59,912 4 Other Income 3,077 2,896 2,448 11,317 8,982 5 Profit from ordinary activities before finance costs and exceptional items (3+4) 20,206 20,924 18,275 81,289 68,894 6 Finance Cost 395 470 375 2,693 3,371 7 Profit from ordinary activities after finance costs but before exceptional items (5–6) 19,811 20,454 17,900 78,596 65,523 8 Exceptional items – – – – – 9 Profit from ordinary activities before tax (7+8) 19,811 20,454 17,900 78,596 65,523 10 Tax expense 3,973 4,472 3,804 16,912 12,955 11 Net profit from ordinary activities after tax (9–10) [Continuing Operations] 15,838 15,981 14,096 61,684 52,568 12 Profit after tax from discontinued operations 1,535 1,273 816 5,012 3,419 13 Net profit for the period (11+12) 17,373 17,255 14,912 66,696 55,987 14 Share in earnings of associates – – – – – 15 Minority interest (86) (90) (103) (337) (257) 16 Net profit after taxes, minority interest and share of profit of associates (13+14+15) 17,287 17,164 14,809 66,359 55,730 17 Paid up equity share capital (Face value ‘ 2 per share) 4,926 4,925 4,917 4,926 4,917 18 Reserves excluding revaluation reserves as per balance sheet of previous accounting year 280,397 19 EARNINGS PER SHARE (EPS) Basic (in ‘) 7.04 7.00 6.04 27.05 22.75 Diluted (in ‘) 7.02 6.98 6.03 26.98 22.68 From continuing operations Basic (in ‘) 6.42 6.51 5.71 25.01 21.36 Diluted (in ‘) 6.40 6.50 5.70 24.95 21.29 20 Public shareholding (1) Number of shares 492,294,812 491,988,307 488,910,535 492,294,812 488,910,535 Percentage of holding 19.99% 19.98% 19.88% 19.99% 19.88% 21 Promoters and promoter group shareholding a) Pledged/ Encumbered – Number of shares Nil Nil Nil Nil Nil – Percentage of shares (as a % of the total shareholding of promoter and promoter group) Nil Nil Nil Nil Nil – Percentage of shares (as a % of the total share capital of the company) Nil Nil Nil Nil Nil b) Non–encumbered – Number of shares(2) 1,927,880,883 1,927,880,883 1,927,880,883 1,927,880,883 1,927,880,883 – Percentage of shares (as a % of the total shareholding of promoter and promoter group) 100% 100% 100% 100% 100% – Percentage of shares (as a % of the total share capital of the company) 78.28% 78.29% 78.41% 78.28% 78.41% (1) Public shareholding as defined under clause 40A of the listing agreement (excludes shares beneficially held by promoters and holders of American Depository Receipt) (2) Includes 501,557,453 (March 31, 2012: 206,030,453; December 31, 2012: 206,030,453) equity shares on which Promoter does not have beneficiary interest. Status of redressal of Complaints received for the period January 01, 2013 to March 31, 2013 Sl No. Nature of the complaint Nature Opening balance 01.01.2013 Complaints received during the quarter Total Complaints disposed during the quarter Unresolved 1 Non-Receipt of Securities Complaint – 10 10 10 – 2 Non Receipt of Annual Reports Complaint – 6 6 6 – 3 Correction / Duplicate/ Revalidation of dividend warrants Request – – – – – 4 SEBI/Stock Exchange Complaints Complaint – 8 8 8 – 5 Non Receipt of Dividend warrants Complaint – 147 147 147 – TOTAL – 171 171 171 –The total revenue represent the aggregate revenue and includes foreign exchange gains / (losses), net and is net of excise duty amounting to ‘ 9, ‘ 5, and ‘ 7 for the quarter ended March 31, 2013, December 31,2012and March31, 2012, respectively and ‘ 31 and ‘ 20 for the year ended March 31, 2013 and 2012 respectively. 7. The list of subsidiaries is included in the condensed consolidated financial statements of Wipro Limited and subsidiaries for the quarter and year ended March 31, 2013, are available on our company website www.wipro.com 8. Derivatives The Company is exposed to foreign currency fluctuations on foreign currency assets / liabilities, forecasted cash flows denominated in foreign currency and net investments in foreign operations. The Company follows established risk management policies, including the use of derivatives to hedge foreign currency assets / liabilities, foreign currency forecasted cash flows and net investments in foreign operations. The counter party in these derivative instruments is a bank and the Company considers the risks of non-performance by the counterparty as non-material. The following table presents the aggregate contracted principal amounts of the Company’s derivative contracts outstanding: (in millions) As at March 31, 2013 As at March 31, 2012 Designated derivative instruments Sell $ 777 $ 1,1081 £ 61 £ 4 ¥ – ¥ 1,474 € AUD 108 9 € AUD 17 – Interest Rate Swap $ 30 $ – Net investment hedges in foreign operations Cross-currency swaps ¥ 24,511 ¥ 24,511 Others $ 357 $ 262 € 40 € 40 Non designated derivative instruments Sell $ 1,241 $ 841 £ 73 £ 58 € 47 € 44 AUD 60 AUD 31 Buy $ 767 $ 555 ¥ 1,525 ¥ 1,997 Cross currency swaps ¥ 7,000 ¥ 7,000 9. Segment Information The Company is organized by segments, which includes IT Services (comprising of IT Services and BPO Services), IT Products, Consumer Care and Lighting and Others.The Consumer Care and Lighting and Others segments have been discontinued during the year under a scheme of demerger. Refer note 11 – Demerger of diversified business and discontinued operations. The Chairman of the Company has been identified as the Chief Operating Decision Maker (CODM) as defined by IFRS 8, “Operating Segments”. The Chairman of the Company evaluates the segments based on their revenue growth, operating income and return on capital employed. The management believes that return on capital employed is considered appropriate for evaluating the performance of its operating segments. Return on capital employed is calculated as operating income divided by the average of the capital employed at the b
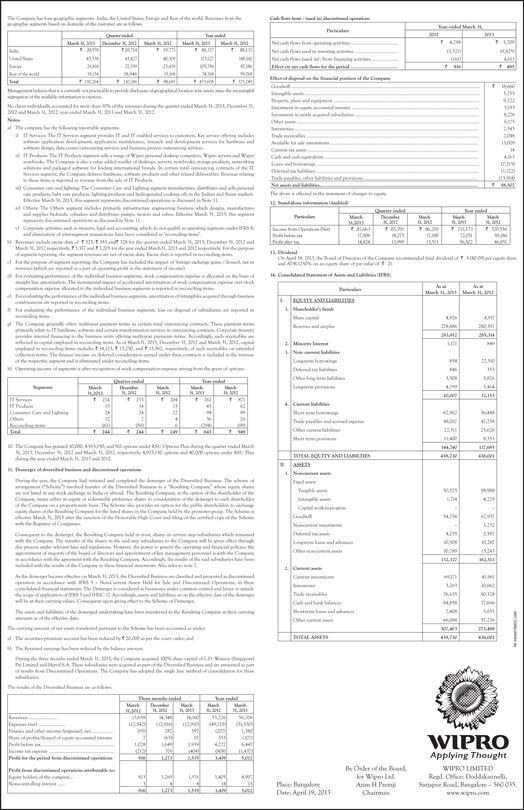
The Company has four geographic segments: India, the United States, Europe and Rest of the world. Revenues from the geographic segments based on domicile of the customer are as follows Quarter ended Year ended March 31, 2013 December 31, 2012 March 31, 2012 March 31, 2013 March 31, 2012 India ‘ 20,978 ‘ 20,714 ‘ 19,775 ‘ 80,357 ‘ 80,135 United States 43,338 43,427 40,309 173,127 148,160 Europe 26,814 27,339 23,439 105,356 87,186 Rest of the world 19,134 18,946 15,168 74,768 59,768 Total ‘ 110,264 ‘ 110,246 ‘ 98,691 ‘ 433,608 ‘ 375,249 Management believes that it is currently not practicable to provide disclosure of geographical location wise assets, since the meaningful segregation of the available information is onerous. No client individually accounted for more than 10% of the revenues during the quarter ended March 31, 2013, December 31, 2012 and March 31, 2012, year ended March 31, 2013 and March 31, 2012. Notes: a) The company has the following reportable segments: i) IT Services: The IT Services segment provides IT and IT enabled services to customers. Key service offering includes software application development, application maintenance, research and development services for hardware and software design, data center outsourcing services and business process outsourcing services. ii) IT Products: The IT Products segment sells a range of Wipro personal desktop computers, Wipro servers and Wipro notebooks. The Company is also a value added reseller of desktops, servers, notebooks, storage products, networking solutions and packaged software for leading international brands. In certain total outsourcing contracts of the IT Services segment, the Company delivers hardware, software products and other related deliverables. Revenue relating to these items is reported as revenue from the sale of IT Products. iii) Consumer care and lighting: The Consumer Care and Lighting segment manufactures, distributes and sells personal care products, baby care products, lighting products and hydrogenated cooking oils in the Indian and Asian markets. Effective March 31, 2013, this segment represents discontinued operations as discussed in Note 11. iv) Others: The Others segment includes primarily infrastructure engineering business which designs, manufactures and supplies hydraulic cylinders and distributes pumps, motors and valves. Effective March 31, 2013, this segment represents discontinued operations as discussed in Note 11. v) Corporate activities such as treasury, legal and accounting, which do not qualify as operating segments under IFRS 8, and elimination of inter-segment transactions have been considered as ‘reconciling items’. b) Revenues include excise duty of ‘ 325, ‘ 355 and’ 328 for the quarter ended March 31, 2013, December 31, 2012 and March 31, 2012 respectively, ‘ 1,377 and ‘ 1,205 for the year ended March31, 2013 and 2012 respectively. For the purpose of segment reporting, the segment revenues are net of excise duty. Excise duty is reported in reconciling items. c) For the purpose of segment reporting, the Company has included the impact of ‘foreign exchange gains / (losses), net in revenues (which are reported as a part of operating profit in the statement of income). d) For evaluating performance of the individual business segments, stock compensation expense is allocated on the basis of straight line amortization. The incremental impact of accelerated amortization of stock compensation expense over stock compensation expense allocated to the individual business segments is reported in reconciling items. e) For evaluating the performance of the individual business segments, amortization of intangibles acquired through business combinations are reported in reconciling items. f) For evaluating the performance of the individual business segments, loss on disposal of subsidiaries are reported in reconciling items. g) The Company generally offers multi-year payment terms in certain total outsourcing contracts. These payment terms primarily relate to IT hardware, software and certain transformation services in outsourcing contracts. Corporate treasury provides internal financing to the business units offering multi-year payments terms. Accordingly, such receivables are reflected in capital employed in reconciling items. As of March31, 2013, December 31, 2012 and March 31, 2012, capital employed in reconciling items includes ‘ 14,123, ‘ 13,250, and ‘ 13,562, respectively, of such receivables on extended collection terms. The finance income on deferred consideration earned under these contracts is included in the revenue of the respective segment and is eliminated under reconciling items. h) Operating income of segments is after recognition of stock compensation expense arising from the grant of options: Segments Quarter ended Year ended March 31,2013 December 31, 2012 March 31, 2012 March 31, 2013 March 31, 2012 IT Services ‘ 254 ‘ 255 ‘ 204 ‘ 762 ‘ 871 IT Products 15 14 13 45 62 Consumer Care and Lighting 24 24 22 94 89 Others 12 7 4 36 26 Reconciling items (61) (56) 6 (294) (99) Total ‘ 244 ‘ 244 ‘ 249 ‘ 643 ‘ 949 10. The Company has granted 10,000; 4,915,150; and Nil options under RSU Options Plan during the quarter ended March 31, 2013, December 31, 2012 and March 31, 2012, respectively; 4,925,150 options and 40,000 options under RSU Plan during the year ended March 31, 2013 and 2012. 11. Demerger of diversified business and discontinued operations During the year, the Company had initiated and completed the demerger of the Diversified Business. The scheme of arrangement (“Scheme”) involved transfer of the Diversified Business to a “Resulting Company” whose equity shares are not listed in any stock exchange in India or abroad. The Resulting Company, at the option of the shareholder of the Company, issues either its equity or redeemable preference shares in consideration of the demerger to each shareholder of the Company on a proportionate basis. The Scheme also provides an option for the public shareholders to exchange equity shares of the Resulting Company for the listed shares in the Company held by the promoter group. The Scheme is effective March 31, 2013 after the sanction of the Honorable High Court and filing of the certified copy of the Scheme with the Registrar of Companies. Consequent to the demerger, the Resulting Company held in trust, shares in certain step subsidiaries which remained with the Company. The transfer of the shares in the said step subsidiaries to the Company will be given effect through due process under relevant laws and regulations. However, the power to govern the operating and financial policies, the appointment of majority of the board of directors and appointment of key management personnel is with the Company in accordance with the agreement with the Resulting Company. Accordingly, the results of the said subsidiaries have been included with the results of the Company in these financial statements. Also refer to note 7. As the demerger became effective on March 31, 2013, the Diversified Business are classified and presented as discontinued operation in accordance with IFRS 5 – Non-Current Assets Held for Sale and Discontinued Operations, in these consolidated financial statements. The Demerger is considered as businesses under common control and hence is outside the scope of application of IFRS 3 and IFRIC 17. Accordingly, assets and liabilities as on the effective date of the demerger will be at their carrying values. Consequent upon giving effect to the Scheme of Demerger, The assets and liabilities of the demerged undertaking have been transferred to the Resulting Company at their carrying amounts as of the effective date; The carrying amount of net assets transferred pursuant to the Scheme has been accounted as under: a) The securities premium account has been reduced by ‘ 20,000 as per the court order; and b) The Retained earnings has been reduced by the balance amount. During the three months ended March 31, 2013, the Company acquired 100% share capital of L.D. Waxson (Singapore) Pte Limited and Hervil S.A. These subsidiaries were acquired as part of the Diversified Business and are presented as part of results from Discontinued Operations. The Company has adopted the single line method of consolidation for these subsidiaries. The results of the Diversified Business are as follows: Three months ended Year ended March 31,2012 December 31, 2012 March 31, 2013 March 31, 2012 March 31, 2013 Revenues ………………….. 13,658 14,348 14,160 53,226 56,706 Expenses (net) …………………. (12,542) (12,916) (12,910) (49,125) (51,530) Finance and other income/(expense), net……………… (95) 282 592 (207) 1,380 Share of profits/(losses) of equity accounted investee 7 (65) 97 333 (107) Profit before tax…………………………………………............ 1,028 1,649 1,939 4,227 6,447 Income tax expense ……………...................................... (212) 376 (404) (808) (1,437) Profit for the period from discontinued operations 816 1,273 1,535 3,419 5,012 Profit from discontinued operations attributable to: Equity holders of the company… 813 1,269 1,531 3,405 4,997 Non-controlling interest …… 3 4 4 14 15 816 1,273 1,535 3,419 5,012 RK SWAMY/BBDO 2280Cash flows from / (used in) discontinued operations Particulars Year ended March 31, 2012 2013 Net cash flows from operating activities ……………….................... ‘ 4,298 ‘ 5,709 Net cash flows used in investing activities ………………................. (3,321) (9,825) Net cash flows (used in) /from financing activities ………………... (161) 4,611 Effect on net cash flows for the period ..…………….................. ‘ 816 ‘ 495 Effect of disposal on the financial positio
n of the Company Goodwill ............................... ‘ 18,660 Intangible assets ..… 3,255 Property, plant and equipment . 9,722 Investment in equity accounted investee 3,193 Investment in newly acquired subsidiaries 8,276 Other assets . 6,175 Inventories 7,543 Trade receivables . 7,048 Available for sale investments 13,009 Current tax assets .. 14 Cash and cash equivalents . 4,163 Loans and borrowings ... (7,515) Deferred tax liabilities ………………………………………....................................................................................... (1,122) Trade payables, other liabilities and provisions ..…………............................................................................... (13,914) Net assets and liabilities…………………………………............................................................................... ‘ 58,507 The above is effected in the statement of changes in equity. By Order of the Board, for Wipro Ltd. Azim H Premji Chairman Place: Bangalore Date: April 19, 2013 WIPRO LIMITED Regd. Office: Doddakannelli, Sarjapur Road, Bangalore – 560 035. www.wipro.com 12. Stand-alone information (Audited) Particulars Quarter ended Year ended March 31,2013 December 31, 2012 March 31, 2012 March 31, 2013 March 31, 2012 Income from Operations (Net) ‘ 85,663 ‘ 85,391 ‘ 86,210 ‘ 335,173 ‘ 320,536 Profit before tax 17,908 18,275 17,190 72,051 59,186 Profit after tax 14,824 13,999 13,513 56,502 46,851 13. Dividend On April 18, 2013, the Board of Directors of the Company recommended final dividend of ‘ 5 ($0.09) per equity share and ADR (250% on an equity share of par value of ‘ 2). 14. Consolidated Statement of Assets and Liabilities (IFRS) Particulars As at March 31, 2013 As at March 31, 2012 I. EQUITY AND LIABILITIES 1. Shareholder’s funds Share capital 4,926 4,917 Reserves and surplus 278,886 280,397 283,812 285,314 2. Minority Interest 1,171 849 3. Non- current liabilities Long-term borrowings 854 22,510 Deferred tax liabilities 846 353 Other long term liabilities 3,508 3,826 Long-term provisions 4,799 5,464 10,007 32,153 4. Current liabilities Short term borrowings 62,962 36,448 Trade payables and accrued expense 48,067 47,258 Other current liabilities 22,311 25,626 Short term provisions 11,400 8,353 144,740 117,685 TOTAL EQUITY AND LIABILTIES 439,730 436,001 II ASSETS 1. Non-current assets Fixed assets Tangible assets 50,525 58,988 Intangible assets 1,714 4,229 Capital work-in-progress – – Goodwill 54,756 67,937 Non-current investments – 3,232 Deferred tax assets 4,235 2,597 Long-term loans and advances 10,308 10,287 Other non-current assets 10,789 15,243 132,327 162,513 2. Current assets Current investments 69,171 41,961 Inventories 3,263 10,662 Trade receivables 76,635 80,328 Cash and bank balances 84,838 77,666 Short-term loans and advances 7,408 5,635 Other current assets 66,088 57,236 307,403 273,488 TOTAL ASSETS 439,730 436,001