Exhibit 99.2
|
Exhibit 99.2Performance for Quarter ended March 31, 2017
Jatin Dalal
Chief Financial Officer
April 25, 2017
1 © 2017 WIPRO LTD | WWW.WIPRO.COM
|
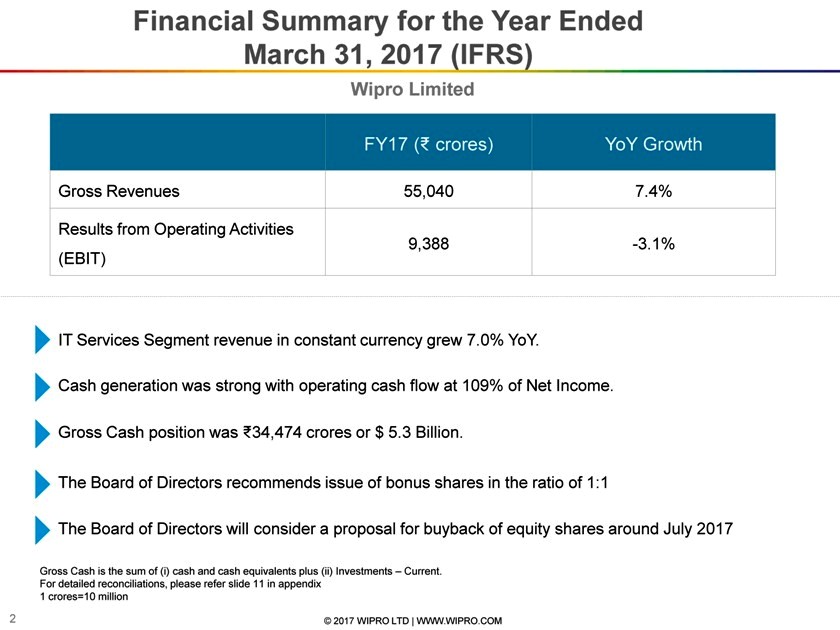
Financial Summary for the Year Ended
March 31, 2017 (IFRS)
Wipro Limited
FY17 ( crores) YoY Growth
Gross Revenues 55,040 7.4%
Results from Operating Activities
9,388 -3.1%
(EBIT)
IT Services Segment revenue in constant currency grew 7.0% YoY.
Cash generation was strong with operating cash flow at 109% of Net Income.
Gross Cash position was 34,474 crores or $ 5.3 Billion.
The Board of Directors recommends issue of bonus shares in the ratio of 1:1
The Board of Directors will consider a proposal for buyback of equity shares around July 2017
Gross Cash is the sum of (i) cash and cash equivalents plus (ii) Investments – Current.
For detailed reconciliations, please refer slide 11 in appendix
1 crores=10 million
2 © 2017 WIPRO LTD | WWW.WIPRO.COM
|
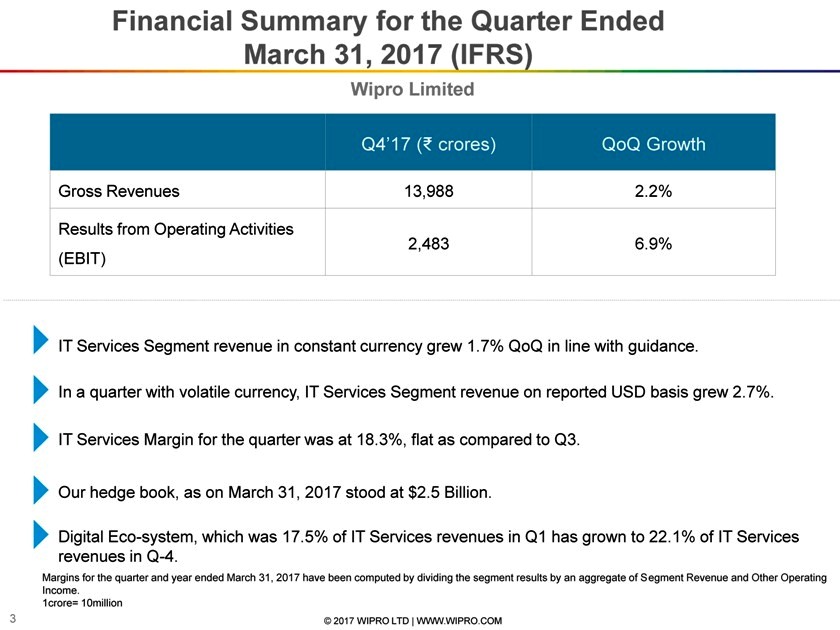
Financial Summary for the Quarter Ended
March 31, 2017 (IFRS)
Wipro Limited
Q4’17 ( crores) QoQ Growth
Gross Revenues 13,988 2.2%
Results from Operating Activities
2,483 6.9%
(EBIT)
IT Services Segment revenue in constant currency grew 1.7% QoQ in line with guidance.
In a quarter with volatile currency, IT Services Segment revenue on reported USD basis grew 2.7%.
IT Services Margin for the quarter was at 18.3%, flat as compared to Q3.
Our hedge book, as on March 31, 2017 stood at $2.5 Billion.
DigitalEco-system, which was 17.5% of IT Services revenues in Q1 has grown to 22.1% of IT Services
revenues inQ-4.
Margins for the quarter and year ended March 31, 2017 have been computed by dividing the segment results by an aggregate of S egment Revenue and Other Operating
Income.
1crore= 10million
3 © 2017 WIPRO LTD | WWW.WIPRO.COM
|
Highlights for the quarter
Net Addition to Employee count was 1,305.
Gross Utilization at record high, has increased 150 sequentially basis points to 73.1%.
Quarterly Annualized Attrition has reduced to 14.8% from 15.4% in Q3.
Revenues from Fixed Price Projects grew from 57.7% in Q3 to 58.3% in Q4
The number of customers in >75, >50, >20 buckets all increased by one each sequentially.
For reconciliation of non-GAAP constant currency IT Services USD revenues please refer to slide 11 Segment Profit refers to Segment Results 1 crores= 10 million
4 © 2017 WIPRO LTD | WWW.WIPRO.COM
|
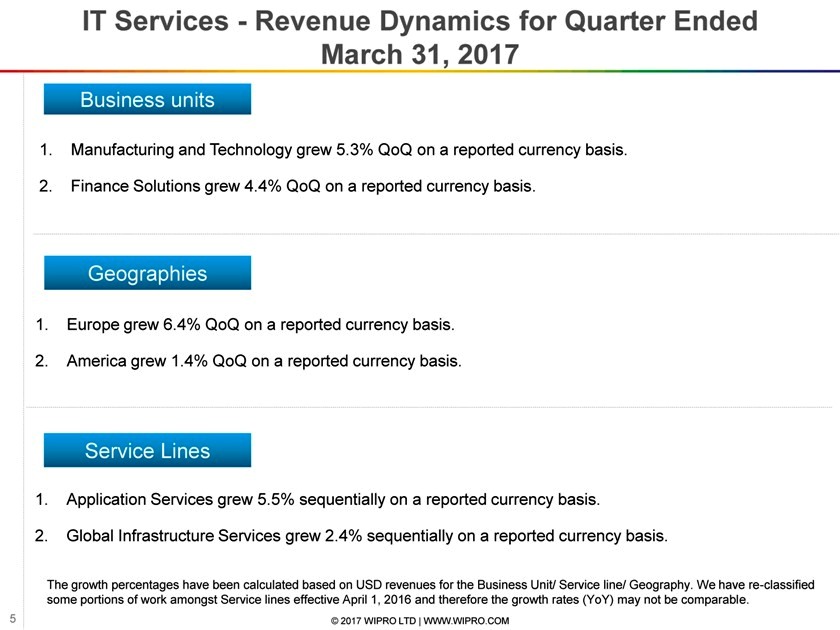
IT Services—Revenue Dynamics for Quarter Ended March 31, 2017
Business units
1. Manufacturing and Technology grew 5.3% QoQ on a reported currency basis.
2. Finance Solutions grew 4.4% QoQ on a reported currency basis.
Geographies
1. Europe grew 6.4% QoQ on a reported currency basis.
2. America grew 1.4% QoQ on a reported currency basis.
Service Lines
1. Application Services grew 5.5% sequentially on a reported currency basis.
2. Global Infrastructure Services grew 2.4% sequentially on a reported currency basis.
The growth percentages have been calculated based on USD revenues for the Business Unit/ Service line/ Geography. We have re -classified some portions of work amongst Service lines effective April 1, 2016 and therefore the growth rates (YoY) may not be comparabl e.
5 © 2017 WIPRO LTD | WWW.WIPRO.COM
|
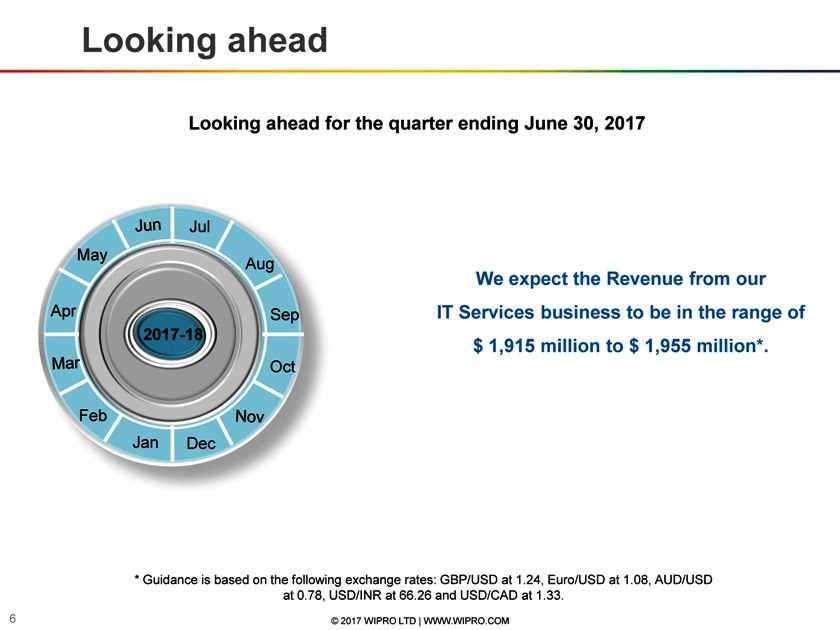
Looking ahead
Looking ahead for the quarter ending June 30, 2017
Jul May
Aug We expect the Revenue from our Apr Sep IT Services business to be in the range of
2017-18 $ 1,915 million to $ 1,955 million*.
Oct
Feb
Jan Dec Jun Nov Mar
* Guidance is based on the following exchange rates: GBP/USD at 1.24, Euro/USD at 1.08, AUD/USD at 0.78, USD/INR at 66.26 and USD/CAD at 1.33.
6 © 2017 WIPRO LTD | WWW.WIPRO.COM
|
Supplemental Data
Key Operating Metrics of IT Services
7 © 2017 WIPRO LTD | WWW.WIPRO.COM
|
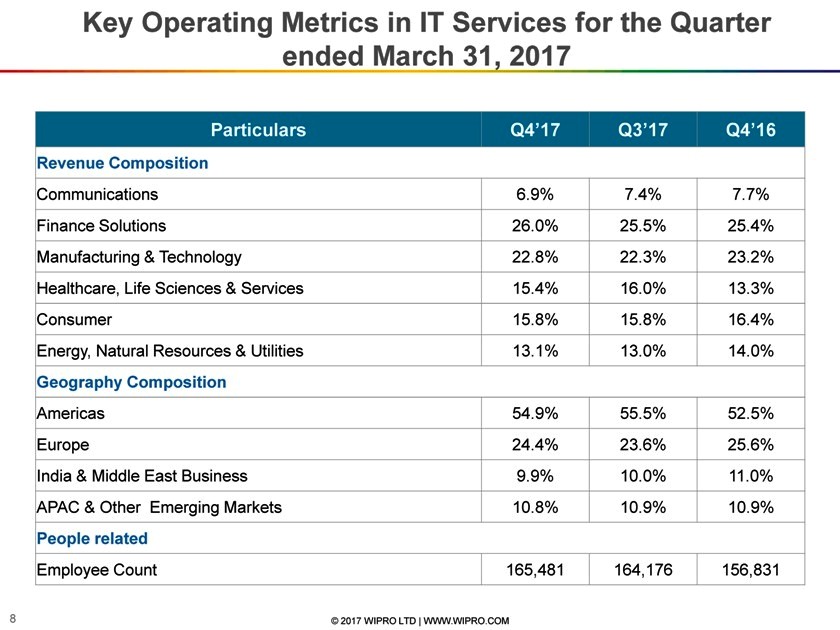
Key Operating Metrics in IT Services for the Quarter
ended March 31, 2017
Particulars Q4’17 Q3’17 Q4’16
Revenue Composition
Communications 6.9% 7.4% 7.7%
Finance Solutions 26.0% 25.5% 25.4%
Manufacturing & Technology 22.8% 22.3% 23.2%
Healthcare, Life Sciences & Services 15.4% 16.0% 13.3%
Consumer 15.8% 15.8% 16.4%
Energy, Natural Resources & Utilities 13.1% 13.0% 14.0%
Geography Composition
Americas 54.9% 55.5% 52.5%
Europe 24.4% 23.6% 25.6%
India & Middle East Business 9.9% 10.0% 11.0%
APAC & Other Emerging Markets 10.8% 10.9% 10.9%
People related
Employee Count 165,481 164,176 156,831
8 © 2017 WIPRO LTD | WWW.WIPRO.COM
|

Thank You
Jatin Dalal
Chief Financial Officer Jatin.Dalal@wipro.com
9 © 2017 WIPRO LTD | WWW.WIPRO.COM
|
Appendix
10 © 2017 WIPRO LTD | WWW.WIPRO.COM
|
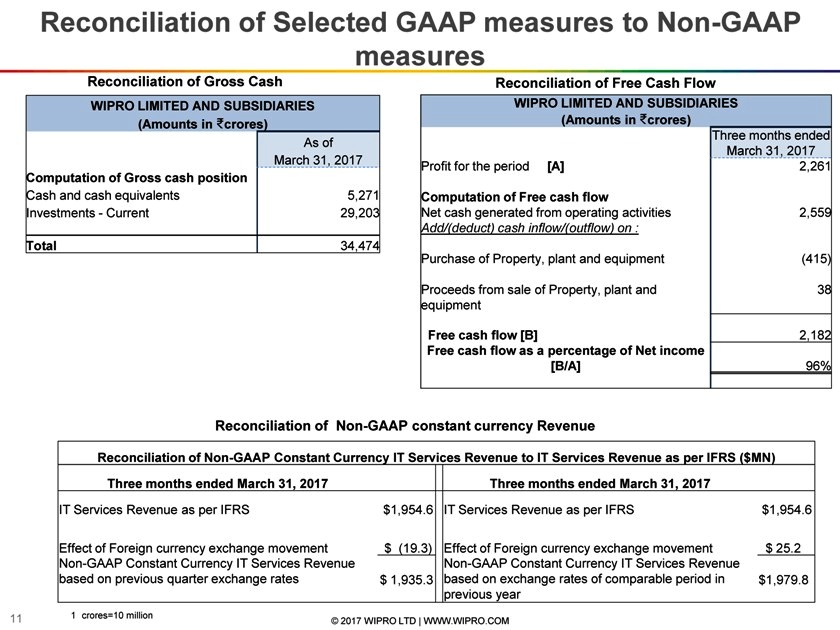
Reconciliation of Selected GAAP measures toNon-GAAP measures
Reconciliation of Gross Cash
WIPRO LIMITED AND SUBSIDIARIES (Amounts in₹ crores)
As of March 31, 2017
Computation of Gross cash position
Cash and cash equivalents 5,271 Investments—Current 29,203
Total 34,474
Reconciliation of Free Cash Flow
WIPRO LIMITED AND SUBSIDIARIES (Amounts in₹ crores)
Three months ended March 31, 2017
Profit for the period [A] 2,261
Computation of Free cash flow
Net cash generated from operating activities 2,559
Add/(deduct) cash inflow/(outflow) on :
Purchase of Property, plant and equipment (415)
Proceeds from sale of Property, plant and 38 equipment
Free cash flow [B] 2,182 Free cash flow as a percentage of Net income [B/A] 96%
Reconciliation of Non-GAAP constant currency Revenue
Reconciliation ofNon-GAAP Constant Currency IT Services Revenue to IT Services Revenue as per IFRS ($MN)
Three months ended March 31, 2017 Three months ended March 31, 2017
IT Services Revenue as per IFRS $1,954.6 IT Services Revenue as per IFRS $1,954.6
Effect of Foreign currency exchange movement $ (19.3) Effect of Foreign currency exchange movement $ 25.2Non-GAAP Constant Currency IT Services RevenueNon-GAAP Constant Currency IT Services Revenue based on previous quarter exchange rates $ 1,935.3 based on exchange rates of comparable period in $1,979.8 previous year
11 1 crores=10 million
© 2017 WIPRO LTD | WWW.WIPRO.COM
|
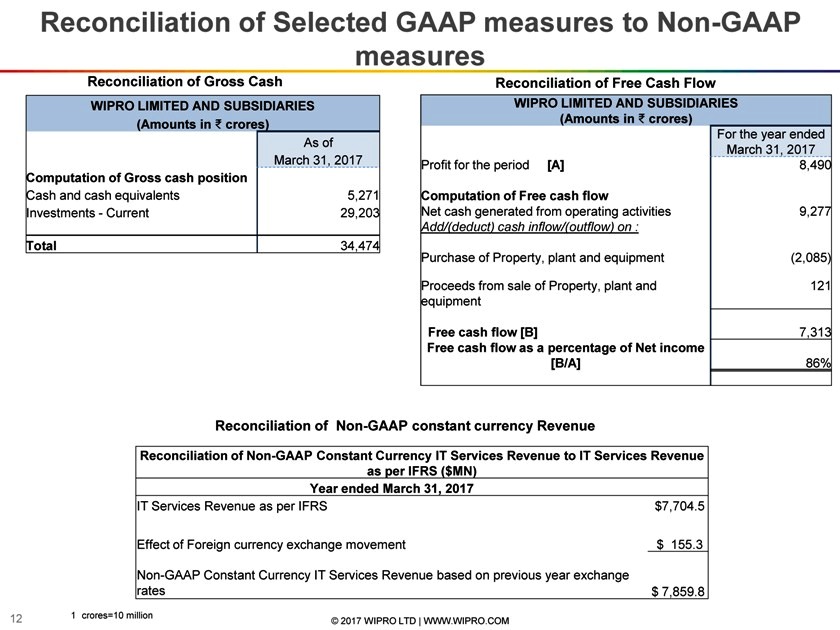
Reconciliation of Selected GAAP measures toNon-GAAP measures
Reconciliation of Gross Cash
WIPRO LIMITED AND SUBSIDIARIES (Amounts in₹ crores)
As of March 31, 2017
Computation of Gross cash position
Cash and cash equivalents 5,271 Investments—Current 29,203
Total 34,474
Reconciliation of Free Cash Flow
WIPRO LIMITED AND SUBSIDIARIES (Amounts in₹ crores)
For the year ended March 31, 2017
Profit for the period [A] 8,490
Computation of Free cash flow
Net cash generated from operating activities 9,277
Add/(deduct) cash inflow/(outflow) on :
Purchase of Property, plant and equipment (2,085)
Proceeds from sale of Property, plant and 121 equipment
Free cash flow [B] 7,313 Free cash flow as a percentage of Net income [B/A] 86%
Reconciliation of Non-GAAP constant currency Revenue
Reconciliation ofNon-GAAP Constant Currency IT Services Revenue to IT Services Revenue as per IFRS ($MN) Year ended March 31, 2017
IT Services Revenue as per IFRS $7,704.5
Effect of Foreign currency exchange movement $ 155.3
Non-GAAP Constant Currency IT Services Revenue based on previous year exchange rates $ 7,859.8
12 1 crores=10 million
© 2017 WIPRO LTD | WWW.WIPRO.COM
|
Wipro Applying Thoughts