Performance for the Quarter & Year ended March 31, 2019 Jatin Dalal Chief Financial Officer Wipro Limited Exhibit 99.2
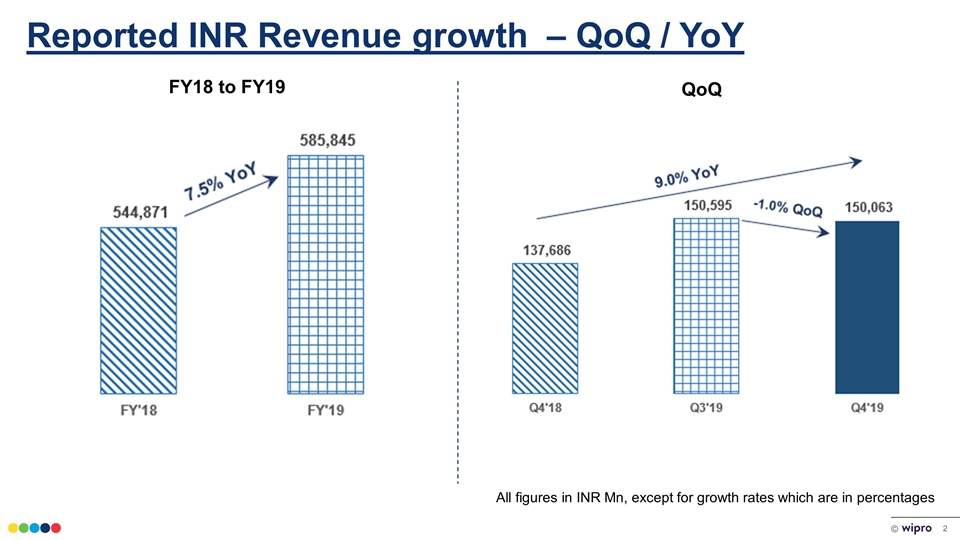
Reported INR Revenue growth – QoQ / YoY All figures in INR Mn, except for growth rates which are in percentages FY18 to FY19 QoQ
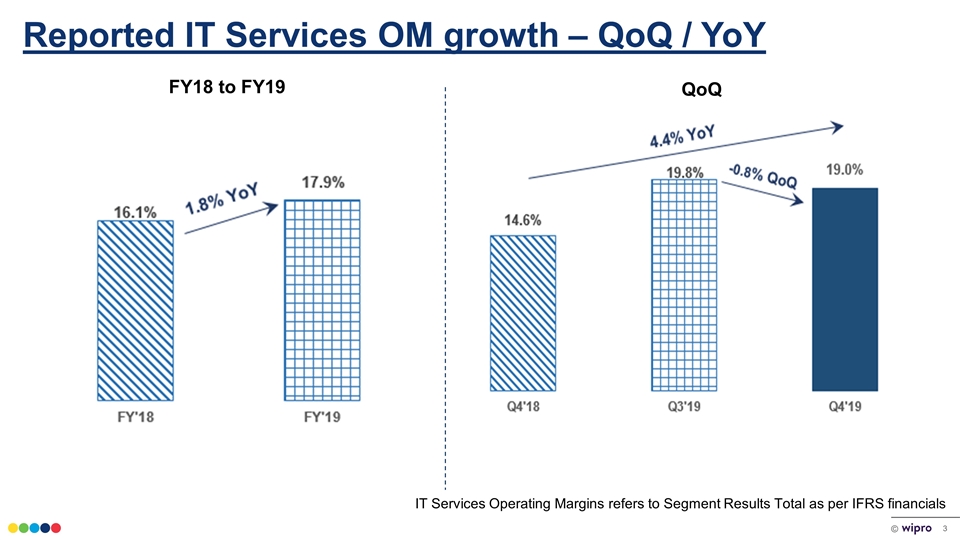
Reported IT Services OM growth – QoQ / YoY FY18 to FY19 QoQ IT Services Operating Margins refers to Segment Results Total as per IFRS financials
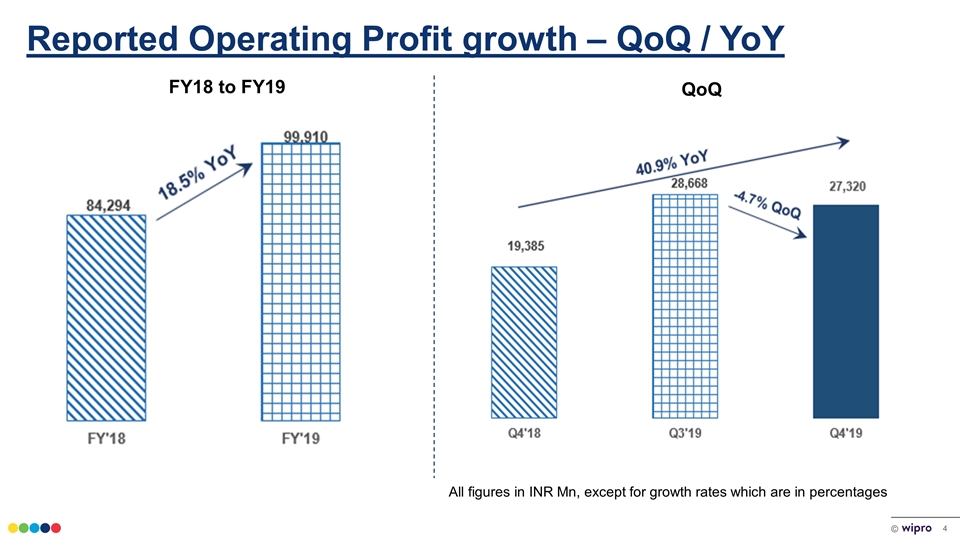
Reported Operating Profit growth – QoQ / YoY FY18 to FY19 QoQ All figures in INR Mn, except for growth rates which are in percentages
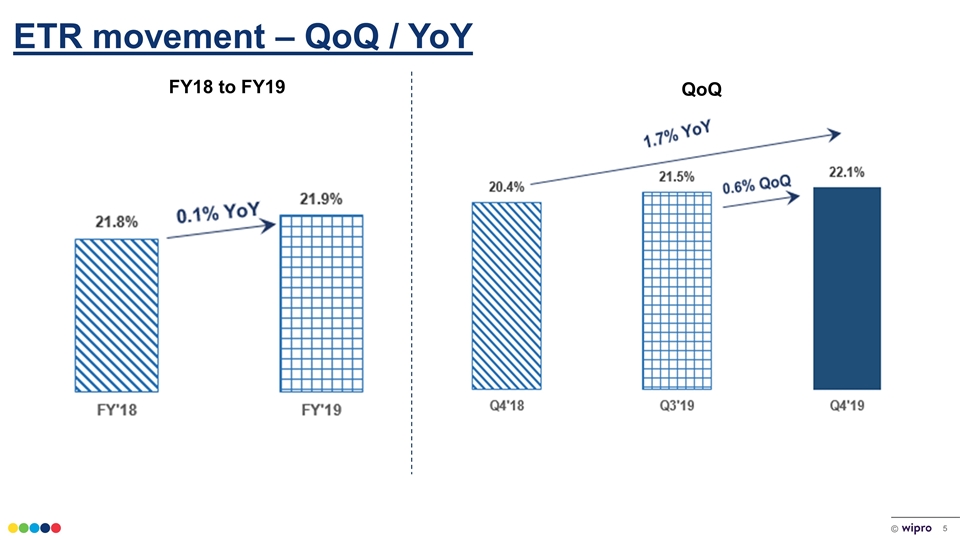
ETR movement – QoQ / YoY FY18 to FY19 QoQ
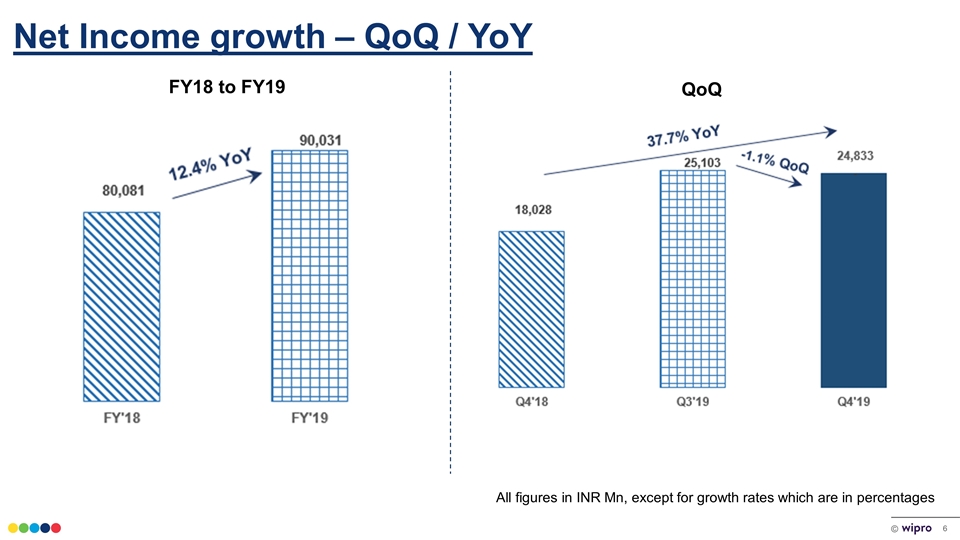
Net Income growth – QoQ / YoY FY18 to FY19 QoQ All figures in INR Mn, except for growth rates which are in percentages
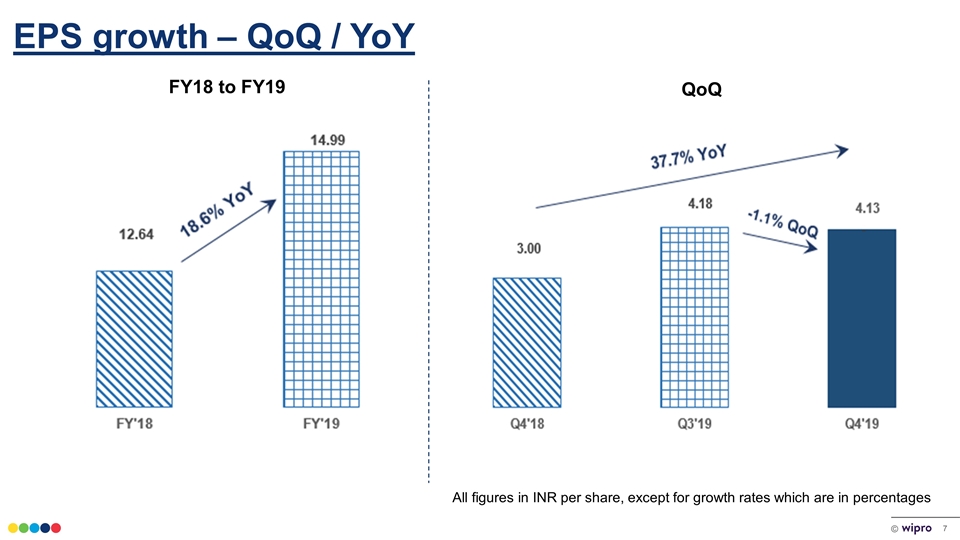
EPS growth – QoQ / YoY FY18 to FY19 QoQ All figures in INR per share, except for growth rates which are in percentages
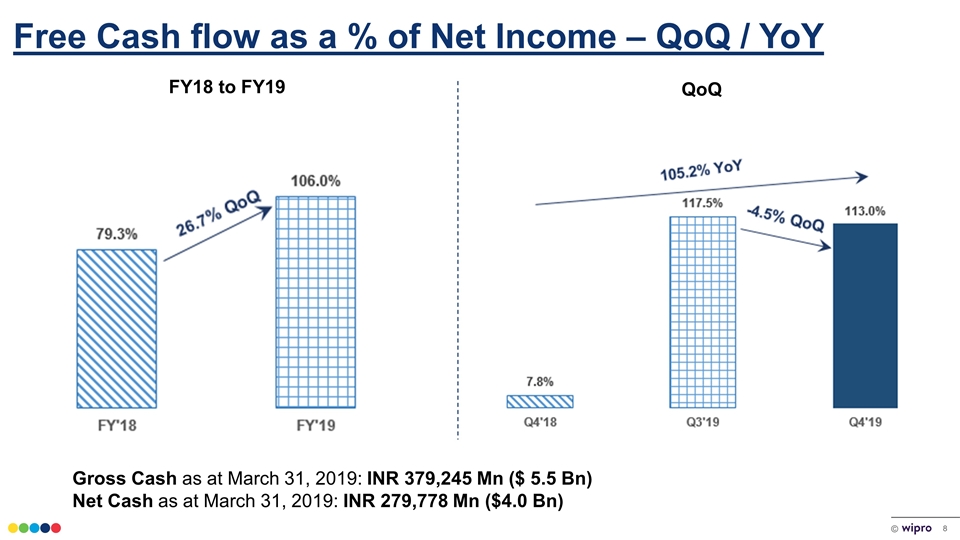
Free Cash flow as a % of Net Income – QoQ / YoY FY18 to FY19 QoQ Gross Cash as at March 31, 2019: INR 379,245 Mn ($ 5.5 Bn) Net Cash as at March 31, 2019: INR 279,778 Mn ($4.0 Bn)
Shareholder Returns We are happy to announce a share buyback by the Company as follows: 5.35% of paid up share capital Total size of buyback: INR 10,500 crores Buyback price INR 325 per share Subject to shareholders’ approval In FY 19, our payout was 122.7% of our Net Income including buyback and dividend
Other highlights Year Highlights : On a full year basis for FY’19, our IT Services revenue grew 5.4% in constant currency terms Our full year margin grew by 1.8% from 16.1% to 17.9% For the full year the Operating Cash Flows are ₹116.3 billion, at 129.2% of our Net Income Digital grew 6.4% QoQ and is now at 34.8% of our revenue Top 10 Customers grew by 9.6% YoY Quarter Highlights : Added 3 accounts to $75+ revenue bucket Localization in US now at 64.0% FPP mix is at its highest at 60% Offshore mix is at its highest at 48.5% Operating Cash Flows at 134% of our Net Income
Outlook for quarter ending June 30, 2019 QoQ growth -1.0% to 1.0% We expect Revenue from our IT Services business to be in the range of $2,046 million to $2,087 million*. This translates to a sequential growth of -1.0% to 1.0% excluding the impact of the divestment of our Workday and Cornerstone On Demand business which was concluded in the quarter ended March 31, 2019. * Outlook is based on the following exchange rates: GBP/USD at 1.32, Euro/USD at 1.14, AUD/USD at 0.71, USD/INR at 70.16 and USD/CAD at 1.33
Thank You
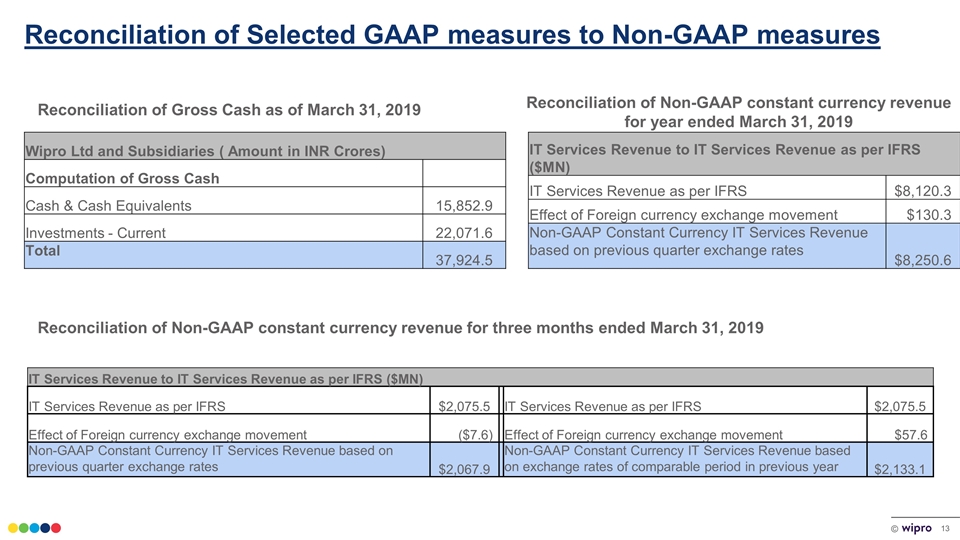
Reconciliation of Selected GAAP measures to Non-GAAP measures Reconciliation of Non-GAAP constant currency revenue for three months ended March 31, 2019 Reconciliation of Gross Cash as of March 31, 2019 IT Services Revenue to IT Services Revenue as per IFRS ($MN) IT Services Revenue as per IFRS $2,075.5 IT Services Revenue as per IFRS $2,075.5 Effect of Foreign currency exchange movement ($7.6) Effect of Foreign currency exchange movement $57.6 Non-GAAP Constant Currency IT Services Revenue based on previous quarter exchange rates $2,067.9 Non-GAAP Constant Currency IT Services Revenue based on exchange rates of comparable period in previous year $2,133.1 Wipro Ltd and Subsidiaries ( Amount in INR Crores) Computation of Gross Cash Cash & Cash Equivalents 15,852.9 Investments - Current 22,071.6 Total 37,924.5 IT Services Revenue to IT Services Revenue as per IFRS ($MN) IT Services Revenue as per IFRS $8,120.3 Effect of Foreign currency exchange movement $130.3 Non-GAAP Constant Currency IT Services Revenue based on previous quarter exchange rates $8,250.6 Reconciliation of Non-GAAP constant currency revenue for year ended March 31, 2019