UNITED STATES
SECURITIES AND EXCHANGE COMMISSION
Washington, D.C. 20549
FORM N-CSR
CERTIFIED SHAREHOLDER REPORT OF REGISTERED
MANAGEMENT INVESTMENT COMPANIES
| Investment Company Act file number | 811-10155 |
| | |
| | |
| | |
| AMERICAN CENTURY VARIABLE PORTFOLIOS II, INC. |
| (Exact name of registrant as specified in charter) |
| | |
| | |
| | |
| 4500 MAIN STREET, KANSAS CITY, MISSOURI | 64111 |
| (Address of principal executive offices) | (Zip Code) |
| | |
| | |
| | |
CHARLES A. ETHERINGTON 4500 MAIN STREET, KANSAS CITY, MISSOURI 64111 |
| (Name and address of agent for service) |
| | |
| | |
| Registrant’s telephone number, including area code: | 816-531-5575 |
| | |
| | |
| Date of fiscal year end: | 12-31 |
| | |
| | |
| Date of reporting period: | 06-30-2009 |
ITEM 1. REPORTS TO STOCKHOLDERS.
|
| Semiannual Report |
| June 30, 2009 |
|
| American Century Variable Portfolios II |
VP Inflation Protection Fund
| |
| Market Perspective | 2 |
| U.S. Fixed-Income Total Returns | 2 |
| |
| VP Inflation Protection | |
| |
| Performance | 3 |
| Portfolio Commentary | 5 |
| Asset Allocation | 7 |
| Portfolio at a Glance | 7 |
| |
| Shareholder Fee Example | 8 |
| |
| Financial Statements | |
| |
| Schedule of Investments | 9 |
| Statement of Assets and Liabilities | 16 |
| Statement of Operations | 17 |
| Statement of Changes in Net Assets | 18 |
| Notes to Financial Statements | 19 |
| Financial Highlights | 27 |
| |
| Other Information | |
| |
| Approval of Management Agreement | 29 |
| Additional Information | 34 |
| Index Definitions | 35 |
The opinions expressed in the Market Perspective and the Portfolio Commentary reflect those of the portfolio management team as of the date of the report, and do not necessarily represent the opinions of American Century Investments or any other person in the American Century Investments organization. Any such opinions are subject to change at any time based upon market or other conditions and American Century Investments disclaims any responsibility to update such opinions. These opinions may not be relied upon as investment advice and, because investment decisions made by American Century Investments funds are based on numerous factors, may not be relied upon as an indication of trading intent on behalf of any American Century Investments fund. Security examples are used for representational purposes only and are not intended as recommendations to purchase or sell securities. Performance information for comparative indices and securities is provided to American Century Investments by third party vendors. To the best of American Century Investments’ knowledge, such information is accurate at the time of printing.

By David MacEwen, Chief Investment Officer, Fixed Income
Investors Returned to Riskier Assets
The “flight to quality” that characterized much of the past two-year recessionary period reversed during the six months ended June 30, 2009. After outperforming in 2007, 2008 and early 2009, “safe-haven” assets took a back seat to lower-rated, riskier asset classes. For the first six months of 2009, Treasuries were the poorest-performing asset class, while high-yield corporate bonds were the best.
Technical factors (supply and demand), rather than solid economic fundamentals, set the rally in motion. At the height of the credit crisis, yields among the highest-quality securities fell to record lows, while yield spreads (the yield differences between Treasuries and non-Treasury securities) expanded to historically wide levels. Midway through the reporting period, on a burst of economic optimism, these attractive yield spreads lured investors off the sidelines. Growing demand for risk, combined with credit crisis-constrained bond supply, caused spreads to tighten and total returns to soar in the corporate bond sector.
Although economic optimism helped fuel the rebound among risk assets, economic data were mixed. Unemployment climbed to 9.5% in June, home prices continued to tumble, and consumer confidence was tepid. On the other hand, positive manufacturing data and financial-sector improvements suggested to recession-weary investors that the worst may be over.
Inflation Outlook Boosted TIPS
While nominal Treasury prices declined and yields rose due to concerns surrounding the U.S. government’s record issuance of debt, TIPS (Treasury inflation-protected securities) benefited from the market’s mounting inflation expectations along with a limited supply of inflation-linked securities. The 10-year breakeven rate (the difference between the yield on the 10-year nominal Treasury and 10-year TIPS) increased 1.68 percentage points in the first half of the year, highlighting the market’s growing inflation expectations.
The compound annual inflation rate for the three months ended June 30, 2009, as measured by Consumer Price Index (CPI), was 3.3%, well ahead of the Federal Reserve’s long-term target range of 1% to 2%. The second quarter’s economic optimism led to rising commodity prices, which pushed the inflation rate higher.
| | | | |
| U.S. Fixed-Income Total Returns | | | | |
| For the six months ended June 30, 2009* | | | | |
| Citigroup U.S. Bond Market Indices | | | Treasury Bellwethers | |
| Treasury | -4.42% | | 3-Month Treasury Bill | 0.11% |
| Credit (investment-grade corporate) | 7.08% | | 10-Year Treasury Note | -8.73% |
| High-Yield Market (corporate) | 28.60% | | | |
| Inflation-Linked Securities | 4.72% | | *Total returns for periods less than one year are not annualized. |
2
| | | | | | |
| VP Inflation Protection | | | | |
| |
| Total Returns as of June 30, 2009 | | | | |
| | | | | Average Annual Returns | |
| | | | | | Since | Inception |
| | | 6 months(1) | 1 year | 5 years | Inception | Date |
| Class II | 4.78% | -0.46% | 4.10% | 4.14% | 12/31/02 |
| Citigroup US Inflation-Linked | | | | | |
| Securities Index(2) | 4.72% | -1.30% | 4.88% | 5.31% | — |
| Class I | 4.84% | -0.28% | 4.35% | 4.66% | 5/7/04 |
| (1) | Total returns for periods less than one year are not annualized. | | | | |
| (2) | The Citigroup US Inflation-Linked Securities Index is not subject to the tax code diversification and other regulatory requirements limiting the |
| | type and amount of securities that the fund may own | | | | |
The performance information presented does not include charges and deductions imposed by the insurance company separate account under the variable annuity or variable life insurance contracts. The inclusion of such charges could significantly lower performance. Please refer to the insurance company separate account prospectus for a discussion of the charges related to insurance contracts.
Data presented reflect past performance. Past performance is no guarantee of future results. Current performance may be higher or lower than the performance shown. Investment return and principal value will fluctuate, and redemption value may be more or less than original cost. To obtain performance data current to the most recent month end, please call 1-800-345-6488. As interest rates rise, bond values will decline.
Unless otherwise indicated, performance reflects Class II shares; performance for other share classes will vary due to differences in fee structure. For information about other share classes available, please consult the prospectus. Data assumes reinvestment of dividends and capital gains, and none of the charts reflect the deduction of taxes that a shareholder would pay on fund distributions or the redemption of fund shares. Returns for the index are provided for comparison. The fund’s total returns include operating expenses (such as transaction costs and management fees) that reduce returns, while the total returns of the index do not.
3
VP Inflation Protection
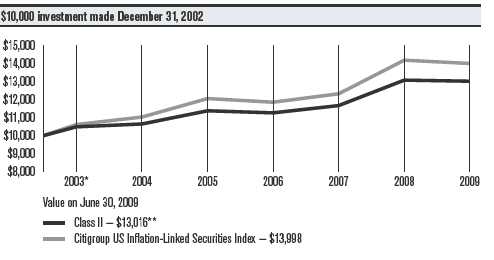
Growth of $10,000 Over Life of Class
| | | | | | | |
| One-Year Returns Over Life of Class | | | | | | |
| Periods ended June 30 | | | | | | | |
| | 2003* | 2004 | 2005 | 2006 | 2007 | 2008 | 2009 |
| Class II | 4.89%** | 1.51% | 6.86% | -1.00% | 3.58% | 12.08% | -0.46% |
| Citigroup US Inflation-Linked | | | | | | | |
| Securities Index | 6.15% | 3.91% | 9.30% | -1.68% | 3.93% | 15.12% | -1.30% |
| * From 12/31/02, Class II’s inception date. Not annualized. | | | | | |
| ** Returns would have been lower, along with ending value, if distribution fees had not been waived from 12/31/02 to 3/31/03. | |
| |
| Total Annual Fund Operating Expenses | | | | | |
| Class I | | Class II | |
| 0.49% | | 0.74% | |
The total annual fund operating expenses shown is as stated in the fund’s prospectus current as of the date of this report. The prospectus may vary from the expense ratio shown elsewhere in this report because it is based on a different time period, includes acquired fund fees and expenses, and, if applicable, does not include fee waivers or expense reimbursements.
Data presented reflect past performance. Past performance is no guarantee of future results. Current performance may be higher or lowerd than the performance shown. Investment return and principal value will fluctuate, and redemption value may be more or less than original cost. To obtain performance data current to the most recent month end, please call 1-800-345-6488. As interest rates rise, bond values will decline.
Unless otherwise indicated, performance reflects Class II shares; performance for other share classes will vary due to differences in fee structure. For information about other share classes available, please consult the prospectus. Data assumes reinvestment of dividends and capital gains, and none of the charts reflect the deduction of taxes that a shareholder would pay on fund distributions or the redemption of fund shares. Returns for the index are provided for comparison. The fund’s total returns include operating expenses (such as transaction costs and management fees) that reduce returns, while the total returns of the index do not.
4
VP Inflation Protection
Portfolio Managers: Bob Gahagan, Brian Howell, and Jim Platz
Performance Summary
VP Inflation Protection returned 4.84%* for the six months ended June 30, 2009. The portfolio’s benchmark, the Citigroup US Inflation-Linked Securities Index, returned 4.72%. Portfolio returns reflect operating expenses, while benchmark returns do not.
The portfolio’s performance benefited from the generally favorable climate for TIPS (Treasury inflation-protected securities). As mentioned in the Market Perspective on page 2, TIPS bucked the trend of nominal Treasury securities, showing positive results in an environment of growing inflation expectations and a tight supply of inflation-linked securities. In addition, the portfolio’s substantial high-quality non-TIPS holdings—an allocation mandated by IRS portfolio diversification regulations for insurance products—helped drive the portfolio’s outperformance versus the benchmark. Most non-Treasury “spread” sectors outperformed TIPS during the six-month period.
Market Backdrop
Oil prices plunged early in 2009, but they quickly reversed course in early March, when the period’s economic optimism was starting to blossom. Investors took comfort in data suggesting the economic downturn was stabilizing, which led to expectations for growing worldwide demand for commodities. Oil prices started the period at $45 a barrel before falling to a period low of $34 on February 12. From there, oil climbed to $71 a barrel by June 30. Other commodity prices also advanced, as indicated by the six-month gain of 40.45% for the Rogers International Commodities Index, a measure of energy, agriculture, and metals products.
Rising prices for oil and other commodities helped trigger higher inflation for the period. Headline inflation, as measured by the six-month change in the Consumer Price Index (CPI), was up 2.7% as of June 30, 2009. This compares with a headline inflation rate of 0.1% for all of 2008. Overall, the energy component of the CPI advanced 14.8% during the first six months of 2009, largely due to the component’s energy commodities segment, which increased 52% for the year-to-date period.
The rising inflation rate drove up the market’s longer-term inflation outlook, as indicated by the Treasury breakeven rate. For example, the breakeven rate, or yield difference, between 10-year TIPS and nominal 10-year Treasuries increased from 0.09 percentage points at the end of December to 1.77 percentage points at the end of June. The breakeven rate is a measure of the market’s inflation expectation for the next 10 years.
*All fund returns referenced in this commentary are for Class I shares. Total returns for periods less than one year are not annualized.
5
VP Inflation Protection
Portfolio Positioning
We continued to invest more than half of the portfolio in TIPS, remaining as fully invested as allowed by IRS portfolio diversification regulations for insurance products. Late in the period, in an effort to enhance the portfolio’s inflation protection, we added a modest weighting in non-dollar inflation-linked securities. This strategy enabled the portfolio to take full advantage of the global marketplace.
We also maintained exposure to high-quality corporate, municipal, agency, and mortgage securities, which helped the portfolio outpace the benchmark for the six months. These spread sectors outperformed Treasuries and showed mixed results relative to TIPS for the six-month period. In particular, within our spread-sector allocation, we increased exposure to high-quality corporate bonds, which we believed offered good relative value. Corporate bonds were among the market’s top performers for the six-month period.
Additionally, we continued to complement our spread-sector investments with inflation swaps, or strategies that synthetically create inflation-linked exposure. We believe the combination of TIPS, inflation swaps, global inflation-linked securities, and spread securities may enhance the portfolio’s yield and outperform Treasury securities over time.
Outlook
Near-term inflation concerns remain subdued, due to weak global economic fundamentals and lower year-over-year commodity prices. Longer term, we believe inflationary pressures are likely to build, given historical patterns (the average annual inflation rate for the last 30 years was approximately 3.25%) and the amount of inflationary economic stimulus from the government and Federal Reserve. Therefore, the long-term inflation outlook, along with a relatively low 10-year breakeven rate of 1.77%, suggests TIPS continue to offer attractive long-term value.
6
| | |
| VP Inflation Protection | | |
| |
| Asset Allocation | | |
| | % of net assets | % of net assets |
| | as of 6/30/09 | as of 12/31/08 |
| U.S. Treasury Securities & Equivalents | 56.6% | 52.7% |
| Sovereign Governments & Agencies | 14.1% | 0.6% |
| U.S. Government Agency Securities and Equivalents | 10.0% | 14.9% |
| Corporate Bonds | 6.5% | 5.2% |
| U.S. Government Agency Mortgage-Backed Securities | 3.5% | 21.2% |
| Municipal Securities | 3.0% | 3.2% |
| Commercial Mortgage-Backed Securities | 2.9% | 4.3% |
| Collateralized Mortgage Obligations | 0.5% | 1.6% |
| Asset-Backed Securities | —(1) | —(1) |
| Temporary Cash Investments | 3.1% | —(1) |
| Other Assets and Liabilities | (0.2)% | (3.7)% |
| (1) Category is less than 0.05% of total net assets. | | |
| |
| Portfolio at a Glance | | |
| | As of 6/30/09 | As of 12/31/08 |
| 30-Day SEC Yield | | |
| Class I | 3.85% | -3.19% |
| Class II | 3.60% | -3.43% |
| Weighted Average Life | 9.5 years | 8.8 years |
| Average Duration (effective) | 6.0 years | 5.6 years |
7
|
| Shareholder Fee Example (Unaudited) |
Fund shareholders may incur two types of costs: (1) transaction costs, including sales charges (loads) on purchase payments and redemption/ exchange fees; and (2) ongoing costs, including management fees; distribution and service (12b-1) fees; and other fund expenses. This example is intended to help you understand your ongoing costs (in dollars) of investing in your fund and to compare these costs with the ongoing cost of investing in other mutual funds.
The example is based on an investment of $1,000 made at the beginning of the period and held for the entire period from January 1, 2009 to June 30, 2009.
Actual Expenses
The table provides information about actual account values and actual expenses for each class. You may use the information, together with the amount you invested, to estimate the expenses that you paid over the period. First, identify the share class you own. Then simply divide your account value by $1,000 (for example, an $8,600 account value divided by $1,000 = 8.6), then multiply the result by the number under the heading “Expenses Paid During Period” to estimate the expenses you paid on your account during this period.
Hypothetical Example for Comparison Purposes
The table also provides information about hypothetical account values and hypothetical expenses based on the actual expense ratio of each class of your fund and an assumed rate of return of 5% per year before expenses, which is not the actual return of a fund’s share class. The hypothetical account values and expenses may not be used to estimate the actual ending account balance or expenses you paid for the period. You may use this information to compare the ongoing costs of investing in your fund and other funds. To do so, compare this 5% hypothetical example with the 5% hypothetical examples that appear in the shareholder reports of the other funds.
Please note that the expenses shown in the table are meant to highlight your ongoing costs only and do not reflect any transactional costs, such as sales charges (loads) or redemption/exchange fees. Therefore, the table is useful in comparing ongoing costs only, and will not help you determine the relative total costs of owning different funds. In addition, if these transactional costs were included, your costs would have been higher.
| | | | |
| | Beginning | Ending | Expenses Paid | |
| | Account Value | Account Value | During Period* | Annualized |
| | 1/1/09 | 6/30/09 | 1/1/09 – 6/30/09 | Expense Ratio* |
| Actual | | | | |
| Class I | $1,000 | $1,048.40 | $2.49 | 0.49% |
| Class II | $1,000 | $1,047.80 | $3.76 | 0.74% |
| Hypothetical | | | | |
| Class I | $1,000 | $1,022.36 | $2.46 | 0.49% |
| Class II | $1,000 | $1,021.12 | $3.71 | 0.74% |
| *Expenses are equal to the class’s annualized expense ratio listed in the table above, multiplied by the average account value over the period, |
| multiplied by 181, the number of days in the most recent fiscal half-year, divided by 365, to reflect the one-half year period. |
8
| | | | | | |
| VP Inflation Protection | | | | | |
| |
| JUNE 30, 2009 (UNAUDITED) | | | | | | |
| |
| | Principal | | | | Principal | |
| | Amount | Value | | | Amount | Value |
| U.S. Treasury Securities and | | | U.S. Treasury Inflation | | |
| | | | | Indexed Notes, | | |
| Equivalents — 56.6% | | | | 3.00%, 7/15/12(1) | $ 10,673,820 | $ 11,310,919 |
| FIXED-RATE U.S. TREASURY SECURITIES | | | U.S. Treasury Inflation | | |
| AND EQUIVALENTS — 56.2% | | | | Indexed Notes, | | |
| AID (Egypt), | | | | 0.625%, 4/15/13(1) | 10,088,700 | 9,968,897 |
| 4.45%, 9/15/15(1) | $ 1,500,000 | $ 1,565,052 | | U.S. Treasury Inflation | | |
| U.S. Treasury Inflation | | | | Indexed Notes, | | |
| Indexed Bonds, | | | | 1.875%, 7/15/13(1) | 4,644,120 | 4,761,672 |
| 2.375%, 1/15/25(1) | 42,648,879 | 43,795,068 | | U.S. Treasury Inflation | | |
| U.S. Treasury Inflation | | | | Indexed Notes, | | |
| Indexed Bonds, | | | | 2.00%, 1/15/14(1) | 15,499,026 | 15,847,754 |
| 2.00%, 1/15/26(1) | 42,115,696 | 41,207,597 | | U.S. Treasury Inflation | | |
| U.S. Treasury Inflation | | | | Indexed Notes, | | |
| Indexed Bonds, | | | | 2.00%, 7/15/14(1) | 15,950,907 | 16,319,772 |
| 2.375%, 1/15/27(1) | 21,570,960 | 22,312,462 | | U.S. Treasury Inflation | | |
| U.S. Treasury Inflation | | | | Indexed Notes, | | |
| Indexed Bonds, | | | | 1.625%, 1/15/15(1) | 33,837,828 | 33,668,639 |
| 1.75%, 1/15/28(1) | 29,854,127 | 28,174,832 | | U.S. Treasury Inflation | | |
| U.S. Treasury Inflation | | | | Indexed Notes, | | |
| Indexed Bonds, | | | | 1.875%, 7/15/15(1) | 25,214,900 | 25,482,808 |
| 3.625%, 4/15/28(1) | 22,544,811 | 27,420,126 | | U.S. Treasury Inflation | | |
| U.S. Treasury Inflation | | | | Indexed Notes, | | |
| Indexed Bonds, | | | | 2.00%, 1/15/16(1) | 32,392,557 | 32,868,339 |
| 2.50%, 1/15/29(1) | 8,243,560 | 8,745,906 | | U.S. Treasury Inflation | | |
| U.S. Treasury Inflation | | | | Indexed Notes, | | |
| Indexed Bonds, | | | | 2.50%, 7/15/16(1) | 29,037,250 | 30,461,876 |
| 3.875%, 4/15/29(1) | 30,242,586 | 38,275,773 | | U.S. Treasury Inflation | | |
| U.S. Treasury Inflation | | | | Indexed Notes, | | |
| Indexed Bonds, | | | | 2.375%, 1/15/17(1) | 21,042,260 | 21,943,121 |
| 3.375%, 4/15/32(1) | 18,903,242 | 23,664,496 | | U.S. Treasury Inflation | | |
| U.S. Treasury Inflation | | | | Indexed Notes, | | |
| Indexed Notes, | | | | 2.625%, 7/15/17(1) | 14,949,481 | 15,916,533 |
| 4.25%, 1/15/10(1) | 5,893,596 | 6,011,468 | | U.S. Treasury Inflation | | |
| U.S. Treasury Inflation | | | | Indexed Notes, | | |
| Indexed Notes, | | | | 1.625%, 1/15/18(1) | 19,797,572 | 19,587,222 |
| 0.875%, 4/15/10(1) | 3,798,900 | 3,802,463 | | U.S. Treasury Inflation | | |
| U.S. Treasury Inflation | | | | Indexed Notes, | | |
| Indexed Notes, | | | | 1.375%, 7/15/18(1) | 4,944,350 | 4,794,477 |
| 3.50%, 1/15/11(1) | 7,596,240 | 7,933,323 | | U.S. Treasury Inflation | | |
| U.S. Treasury Inflation | | | | Indexed Notes, | | |
| Indexed Notes, | | | | 2.125%, 1/15/19(1) | 1,738,100 | 1,793,502 |
| 2.375%, 4/15/11(1) | 31,424,153 | 32,366,877 | | | | 539,282,101 |
| U.S. Treasury Inflation | | | | ZERO-COUPON U.S. TREASURY SECURITIES |
| Indexed Notes, | | | | AND EQUIVALENTS — 0.4% | | |
| 3.375%, 1/15/12(1) | 3,692,829 | 3,928,247 | | AID (Israel), | | |
| U.S. Treasury Inflation | | | | 4.70%, 5/1/15(1)(2) | 5,000,000 | 4,048,065 |
| Indexed Notes, | | | | TOTAL U.S. TREASURY SECURITIES | |
| 2.00%, 4/15/12(1) | 5,201,708 | 5,352,880 | | AND EQUIVALENTS | | |
| | | | | (Cost $529,266,954) | | 543,330,166 |
9
| | | | | | | |
| VP Inflation Protection | | | | | |
| |
| | | Principal | | | | Principal | |
| | | Amount | Value | | | Amount | Value |
| Sovereign Governments | | | GOVERNMENT-BACKED CORPORATE BONDS — 2.3% |
| & Agencies — 14.1% | | | | Bank of America Corp., | | |
| | | | | | 3.125%, 6/15/12(1)(4) | $ 8,500,000 | $ 8,774,865 |
| Bundesobligation | | | | | General Electric Capital | | |
| Inflation Linked, | | | | | Corp., 2.20%, 6/8/12(1)(4) | 8,300,000 | 8,350,481 |
| 2.25%, 4/15/13 | EUR | 12,643,440 | $ 18,539,584 | | | | |
| | | | | | Goldman Sachs Group, Inc. | | |
| France Government | | | | | (The), 3.25%, 6/15/12(1)(4) | 5,200,000 | 5,386,633 |
| Bond OAT, | | | | | | | |
| 2.25%, 7/25/20 | EUR | 13,491,360 | 19,632,534 | | | | 22,511,979 |
| International Bank | | | | | TOTAL U.S. GOVERNMENT AGENCY | |
| for Reconstruction & | | | | | SECURITIES AND EQUIVALENTS | |
| Development, | | | | | (Cost $93,018,663) | | 95,916,987 |
| 7.625%, 1/19/23(1) | $ 9,500,000 | 12,147,555 | | Corporate Bonds — 6.5% | |
| Italy Buoni Poliennali | | | | | BEVERAGES — 0.6% | | |
| Del Tesoro, | | | | | | | |
| 2.35%, 9/15/19 | EUR | 14,279,020 | 19,800,442 | | Anheuser-Busch InBev | | |
| | | | | | Worldwide, Inc., | | |
| Japanese Government | | | | | 6.875%, 11/15/19(3) | 1,430,000 | 1,485,643 |
| CPI Linked Bond, | | | | | | | |
| 1.10%, 12/10/16 | JPY | 2,106,300,000 | 19,310,815 | | Coca-Cola Co. (The), | | |
| | | | | | 3.625%, 3/15/14(1) | 1,220,000 | 1,235,728 |
| KfW, 4.75%, 5/15/12(1) | $ 5,000,000 | 5,367,185 | | | | |
| | | | | | Coca-Cola Enterprises, Inc., | | |
| United Kingdom | | | | | 4.25%, 3/1/15(1) | 1,150,000 | 1,165,022 |
| Gilt Inflation Linked, | | | | | | | |
| 2.50%, 7/26/16 | GBP | 4,400,000 | 20,210,229 | | Dr Pepper Snapple Group, | | |
| | | | | | Inc., 6.82%, 5/1/18(1) | 1,450,000 | 1,535,946 |
| United Kingdom Gilt | | | | | | | |
| Inflation Linked, | | | | | | | 5,422,339 |
| 1.25%, 11/22/17 | GBP | 12,008,920 | 20,330,900 | | CAPITAL MARKETS — 0.5% | | |
| TOTAL SOVEREIGN GOVERNMENTS | | | Credit Suisse (New York), | | |
| & AGENCIES | | | | | 5.50%, 5/1/14(1) | 1,720,000 | 1,789,617 |
| (Cost $129,585,098) | | | 135,339,244 | | Goldman Sachs Group, Inc. | | |
| | | | | | (The), 7.50%, 2/15/19(1) | 1,610,000 | 1,726,917 |
| U.S. Government Agency Securities | | | | |
| | | | | | Morgan Stanley, | | |
| and Equivalents — 10.0% | | | 7.30%, 5/13/19(1) | 1,360,000 | 1,412,727 |
| FIXED-RATE U.S. GOVERNMENT AGENCY | | | | | 4,929,261 |
| SECURITIES — 7.7% | | | | | CHEMICALS — 0.1% | | |
| FAMCA, 4.875%, 1/14/11(1)(3) | $ 4,000,000 | 4,248,934 | | | | |
| | | | | | Dow Chemical Co. (The), | | |
| FAMCA, 5.50%, 7/15/11(1)(3) | 3,750,000 | 4,003,103 | | 8.55%, 5/15/19(1) | 720,000 | 722,469 |
| FAMCA, 5.40%, 10/14/11(1) | 1,000,000 | 1,086,124 | | CONSUMER FINANCE — 2.1% | |
| FAMCA, 6.71%, 7/28/14(1) | 3,974,000 | 4,680,665 | | SLM Corp., VRN, 1.766%, | | |
| FFCB, 4.875%, 12/16/15(1) | 2,000,000 | 2,155,358 | | 7/1/09, resets monthly off | | |
| | | | | | the Consumer Price Index | | |
| FFCB, 4.875%, 1/17/17(1) | | 5,000,000 | 5,329,725 | | Year over Year plus 2.15% | | |
| FHLB, 4.875%, 5/17/17(1) | | 1,030,000 | 1,107,771 | | with no caps, Final | | |
| | | | | | Maturity 2/1/14(1) | 490,000 | 298,459 |
| FNMA, 6.625%, 11/15/30(1) | 18,244,000 | 22,386,282 | | | | |
| PEFCO, 4.97%, 8/15/13(1) | 2,845,000 | 3,088,128 | | SLM Corp., | | |
| | | | | | 1.32%, 1/25/10(1) | 11,165,700 | 10,561,189 |
| PEFCO, 4.55%, 5/15/15(1) | 4,000,000 | 4,269,864 | | | | |
| | | | | | Toyota Motor Credit | | |
| TVA Inflation Index Notes, | | | | Corp. Inflation | | |
| 6.79%, 5/23/12(1) | | 13,800,000 | 15,591,626 | | Indexed Bonds, VRN, | | |
| TVA Inflation Index Notes, | | | | 1.22%, 10/1/09, Final | | |
| 4.875%, 12/15/16(1) | | 1,750,000 | 1,829,903 | | Maturity 10/1/09(1) | 9,006,960 | 9,002,456 |
| TVA Inflation Index Notes, | | | | | | 19,862,104 |
| 4.50%, 4/1/18(1) | | 3,550,000 | 3,627,525 | | | | |
| | | | 73,405,008 | | | | |
10
| | | | | | |
| VP Inflation Protection | | | | | |
| |
| |
| | Principal | | | | Principal | |
| | Amount | Value | | | Amount | Value |
| DIVERSIFIED TELECOMMUNICATION | | | METALS & MINING — 0.1% | | |
| SERVICES — 0.4% | | | | BHP Billiton Finance USA | | |
| AT&T, Inc., | | | | Ltd., 6.50%, 4/1/19(1) | $ 780,000 | $ 867,797 |
| 6.70%, 11/15/13(1) | $ 1,000,000 | $ 1,099,601 | | MULTI-UTILITIES — 0.1% | | |
| AT&T, Inc., 5.10%, 9/15/14(1) | 770,000 | 801,067 | | PG&E Corp., | | |
| Verizon Wireless Capital | | | | 5.75%, 4/1/14(1) | 610,000 | 650,856 |
| LLC, 5.55%, 2/1/14(1)(3) | 1,160,000 | 1,233,129 | | Sempra Energy, | | |
| Verizon Wireless Capital | | | | 6.50%, 6/1/16(1) | 570,000 | 595,750 |
| LLC, 8.50%, 11/15/18(1)(3) | 720,000 | 861,795 | | | | 1,246,606 |
| | | 3,995,592 | | OIL, GAS & CONSUMABLE FUELS — 0.9% | |
| ELECTRIC UTILITIES — 0.1% | | | | BP Capital Markets | | |
| Pacific Gas & Electric Co., | | | | plc, 3.125%, | | |
| 6.25%, 12/1/13(1) | 1,000,000 | 1,099,488 | | 3/10/12(1) | 860,000 | 877,938 |
| FOOD PRODUCTS — 0.1% | | | | Chevron Corp., | | |
| Kraft Foods, Inc., | | | | 3.95%, 3/3/14 | 1,220,000 | 1,257,932 |
| 6.125%, 2/1/18(1) | 820,000 | 849,226 | | ConocoPhillips, | | |
| GAS UTILITIES — 0.2% | | | | 4.75%, 2/1/14(1) | 3,060,000 | 3,190,595 |
| Enterprise Products | | | | Shell International Finance | | |
| Operating LLC, | | | | BV, 4.00%, 3/21/14(1) | 1,960,000 | 2,015,419 |
| 4.60%, 8/1/12(1) | 2,170,000 | 2,187,017 | | XTO Energy, Inc., | | |
| | | | | 6.50%, 12/15/18(1) | 860,000 | 924,281 |
| INSURANCE(5) | | | | | | |
| John Hancock Life | | | | | | 8,266,165 |
| Insurance Co., VRN, 0.39%, | | | | PHARMACEUTICALS — 0.1% | | |
| 7/15/09, resets monthly off | | | | Roche Holdings, Inc., | | |
| the Consumer Price Index | | | | 6.00%, 3/1/19(1)(3) | 1,070,000 | 1,143,022 |
| Year over Year plus 1.13% | | | | SOFTWARE — 0.1% | | |
| with no caps, Final | | | | | | |
| aturity 6/15/10(1) | 40,000 | 38,976 | | Oracle Corp., | | |
| John Hancock Life | | | | 6.125%, 7/8/39 | 1,350,000 | 1,341,009 |
| Insurance Co., VRN, 0.88%, | | | | THRIFTS & MORTGAGE FINANCE — 0.4% | |
| 7/15/09, resets monthly off | | | | HSBC Finance Corp., VRN, | | |
| the Consumer Price Index | | | | 0.34%, 7/10/09, resets | | |
| Year over Year plus 1.62% | | | | monthly off the Consumer | | |
| with no caps, Final | | | | Price Index Year over Year | | |
| Maturity 11/15/10(1) | 179,000 | 173,498 | | plus 1.08% with no caps, | | |
| Prudential Financial, Inc., | | | | Final Maturity 9/10/09(1) | 706,000 | 701,990 |
| VRN, 1.62%, 7/1/09, resets | | | | HSBC Finance Corp., VRN, | | |
| monthly off the Consumer | | | | 0.37%, 7/10/09, resets | | |
| Price Index Year over Year | | | | monthly off the Consumer | | |
| plus 2.00% with no caps, | | | | Price Index Year over Year | | |
| Final Maturity 11/2/20(1) | 303,000 | 203,004 | | plus 1.11% with no caps, | | |
| | | 415,478 | | Final Maturity 2/10/10(1) | 3,000,000 | 2,895,810 |
| MEDIA — 0.3% | | | | | | 3,597,800 |
| Time Warner Cable, Inc., | | | | TOBACCO — 0.3% | | |
| 8.25%, 2/14/14(1) | 670,000 | 751,958 | | Altria Group, Inc., | | |
| Time Warner Cable, Inc., | | | | 9.25%, 8/6/19(1) | 2,190,000 | 2,463,312 |
| 6.75%, 7/1/18(1) | 1,700,000 | 1,773,408 | | WIRELESS TELECOMMUNICATION SERVICES — 0.1% |
| | | 2,525,366 | | Vodafone Group plc, | | |
| | | | | 5.45%, 6/10/19(1) | 1,080,000 | 1,063,868 |
| | | | | TOTAL CORPORATE BONDS | | |
| | | | | (Cost $61,617,290) | | 61,997,919 |
11
| | | | | | |
| VP Inflation Protection | | | | | |
| |
| |
| | Principal | | | | Principal | |
| | Amount | Value | | | Amount | Value |
| U.S. Government Agency | | | Massachusetts Bay | | |
| | | | | Transportation Auth. Sales | | |
| Mortgage-Backed Securities(6) — 3.5% | | Tax. Rev., Series 2006 A, | | |
| ADJUSTABLE-RATE U.S. GOVERNMENT AGENCY | | 5.25%, 7/1/34(1) | $ 5,000,000 | $ 5,378,900 |
| MORTGAGE-BACKED SECURITIES — 0.7% | | | Massachusetts Health | | |
| FHLMC, VRN, 5.774%, | | | | & Educational Facilities | | |
| 11/1/12, thereafter resets | | | | Auth. Rev., Series 2002 K, | | |
| monthly off the 1-month | | | | (Massachusetts Institute of | | |
| LIBOR plus 1.97% | | | | Technology), 5.50%, 7/1/32 | | |
| with no caps, Final | | | | (GO of Institute)(1) | 8,800,000 | 10,163,648 |
| Maturity 1/1/38(1) | | | | TOTAL MUNICIPAL SECURITIES | |
| (Cost $6,706,112) | $ 6,556,322 | $ 6,868,416 | | (Cost $25,877,657) | | 28,960,307 |
| FIXED-RATE U.S. GOVERNMENT AGENCY | | | Commercial Mortgage-Backed | |
| MORTGAGE-BACKED SECURITIES — 2.8% | | | | | |
| FHLMC, 4.50%, 5/1/19(1) | 616,701 | 634,020 | | Securities(6) — 2.9% | | |
| FHLMC, 5.00%, 4/1/21(1) | 2,900,594 | 3,017,796 | | Banc of America | | |
| | | | | Commercial Mortgage, Inc., | | |
| FHLMC, 5.50%, 12/1/33(1) | 301,611 | 312,824 | | Series 2004-2, Class A3 | | |
| FHLMC, 5.50%, 12/1/36(1) | 3,191,265 | 3,299,936 | | SEQ, 4.05%, 11/10/38(1) | 2,430,000 | 2,338,850 |
| FHLMC, 5.50%, 1/1/38(1) | 1,681,915 | 1,739,189 | | Banc of America Large Loan, | | |
| FHLMC, 5.50%, 4/1/38(1) | 199,238 | 205,929 | | Series 2005 MIB1, Class A1, | | |
| | | | | VRN, 0.47%, 7/15/09, | | |
| FNMA, 5.00%, 9/1/20(1) | 798,347 | 831,853 | | resets monthly off the | | |
| FNMA, 6.00%, 10/1/37(1) | 5,848,347 | 6,121,688 | | 1-month LIBOR plus | | |
| FNMA, 6.00%, 6/1/38(1) | 3,018,386 | 3,158,819 | | 0.15% with no caps, | | |
| | | | | Final Maturity 3/15/22(1)(3) | 813,178 | 689,785 |
| FNMA, 6.00%, 7/1/38(1) | 4,236,212 | 4,433,305 | | Bear Stearns Commercial | | |
| GNMA, 6.00%, 6/20/17(1) | 98,389 | 103,415 | | Mortgage Securities Trust, | | |
| GNMA, 6.00%, 7/20/17(1) | 90,070 | 94,672 | | Series 2003 T12, Class A2 | | |
| | | | | SEQ, 3.88%, 8/13/39(1) | 3,964 | 3,957 |
| GNMA, 6.00%, 5/15/24(1) | 582,761 | 611,548 | | | | |
| | | | | Credit Suisse Mortgage | | |
| GNMA, 5.50%, 9/20/34(1) | 2,209,020 | 2,278,949 | | Capital Certificates, Series | | |
| | | 26,843,943 | | 2007 TF2A, Class A1, VRN, | | |
| TOTAL U.S. GOVERNMENT AGENCY | | | 0.50%, 7/15/09, | | |
| MORTGAGE-BACKED SECURITIES | | | resets monthly off the | | |
| (Cost $32,487,031) | | 33,712,359 | | 1-month LIBOR plus | | |
| | | | | 0.18% with no caps, Final | | |
| Municipal Securities — 3.0% | | | Maturity 4/15/22(1)(3) | 6,956,625 | 5,345,238 |
| California Educational | | | | GMAC Commercial | | |
| Facilities Auth. Rev., | | | | Mortgage Securities, Inc., | | |
| Series 2007 T1, | | | | Series 2005 C1, Class A2 | | |
| (Stanford University), | | | | SEQ, 4.47%, 5/10/43(1) | 3,960,833 | 3,973,681 |
| 5.00%, 3/15/39(1) | 8,000,000 | 8,461,280 | | LB-UBS Commercial | | |
| California GO, | | | | Mortgage Trust, Series 2003 | | |
| 7.55%, 4/1/39(1) | 700,000 | 641,879 | | C3, Class A3 SEQ, | | |
| | | | | 3.85%, 5/15/27(1) | 5,366,368 | 5,179,318 |
| Massachusetts Bay | | | | | | |
| Transportation Auth. Sales | | | | LB-UBS Commercial | | |
| Tax. Rev., Series 2006 A, | | | | Mortgage Trust, Series 2005 | | |
| 5.25%, 7/1/33(1) | 4,000,000 | 4,314,600 | | C2, Class A2 SEQ, | | |
| | | | | 4.82%, 4/15/30(1) | 3,599,850 | 3,539,497 |
| | | | | LB-UBS Commercial | | |
| | | | | Mortgage Trust, Series 2005 | | |
| | | | | C3, Class A3 SEQ, | | |
| | | | | 4.65%, 7/15/30(1) | 2,590,000 | 2,445,397 |
12
| | | | | | |
| VP Inflation Protection | | | | |
| |
| |
| | Principal | | | | Principal | |
| | Amount | Value | | | Amount/ | |
| Lehman Brothers Floating | | | | | Shares | Value |
| Rate Commercial Mortgage | | | | Temporary Cash Investments — 3.1% |
| Trust, Series 2007 LLFA, | | | | | | |
| Class A1, VRN, 0.62%, | | | | BNP Paribas Finance, Inc., | | |
| 7/15/09, resets monthly off | | | | 0.07%, 7/1/09(7) | $ 29,900,000 | $ 29,899,701 |
| the 1-month LIBOR plus | | | | JPMorgan U.S. Treasury | | |
| 0.30% with no caps, Final | | | | Plus Money Market Fund | | |
| Maturity 6/15/22(1)(3) | $ 5,480,206 | $ 4,071,890 | | Agency Shares(1)(5) | 80,736 | 80,736 |
| TOTAL COMMERCIAL MORTGAGE- | | | TOTAL TEMPORARY | | |
| BACKED SECURITIES | | | | CASH INVESTMENTS | | |
| (Cost $30,787,811) | | 27,587,613 | | (Cost $29,980,736) | | 29,980,437 |
| Collateralized Mortgage | | | TOTAL INVESTMENT | | |
| | | | | SECURITIES — 100.2% | | |
| Obligations(6) — 0.5% | | | | (Cost $938,864,012) | | 962,138,766 |
| PRIVATE SPONSOR COLLATERALIZED | | | OTHER ASSETS | | |
| MORTGAGE OBLIGATIONS — 0.2% | | | AND LIABILITIES — (0.2)% | | (1,958,272) |
| Banc of America Alternative | | | | TOTAL NET ASSETS — 100.0% | $960,180,494 |
| Loan Trust, Series 2007-2, | | | | | | |
| Class 2A4, 5.75%, 6/25/37(1) | 2,934,919 | 1,869,284 | | | | |
| U.S. GOVERNMENT AGENCY COLLATERALIZED | | Geographic Diversification | |
| MORTGAGE OBLIGATIONS — 0.3% | | | (as a % of net assets) | | |
| FHLMC, Series 2508, Class | | | | United States | | 82.3% |
| UL SEQ, 5.00%, 12/15/16(1) | 817,394 | 844,119 | | | | |
| | | | | United Kingdom | | 4.4% |
| GNMA, Series 2003-46, | | | | Germany | | 2.5% |
| Class PA, 5.00%, 5/20/29(1) | 524,928 | 534,409 | | | | |
| GNMA, Series 2005-24, Class | | | | Italy | | 2.1% |
| UB SEQ, 5.00%, 1/20/31(1) | 2,000,000 | 2,050,374 | | France | | 2.0% |
| | | 3,428,902 | | Japan | | 2.0% |
| TOTAL COLLATERALIZED MORTGAGE | | | Supranational | | 1.3% |
| OBLIGATIONS | | | | Netherlands | | 0.2% |
| (Cost $6,227,242) | | 5,298,186 | | Switzerland | | 0.2% |
| Asset-Backed Securities(5)(6) | | | Australia | | 0.1% |
| Atlantic City Electric | | | | Cash and Equivalents* | | 2.9% |
| Transition Funding LLC, | | | | *Includes temporary cash investments and other assets and liabilities. |
| Series 2003-1, Class A1 | | | | | | |
| SEQ, 2.89%, 7/20/11(1) | | | | | | |
| (Cost $15,530) | 15,530 | 15,548 | | | | |
| | | | |
| Forward Foreign Currency Exchange Contracts | | |
| Contracts to Sell | Settlement Date | Value | Unrealized Gain (Loss) |
| 41,489,015 | EUR for USD | 8/28/09 | $ 58,202,864 | $230,679 |
| 24,753,958 | GBP for USD | 8/28/09 | 40,722,984 | 25,008 |
| 1,862,958,768 | JPY for USD | 8/28/09 | 19,351,143 | 215,902 |
| | | | $118,276,991 | $471,589 |
| (Value on Settlement Date $118,748,580) | | | |
13
| | | |
| VP Inflation Protection | | |
| |
| |
| Swap Agreements | | |
| Notional Amount | Description of Agreement | Premiums Paid (Received) | Value |
| CREDIT DEFAULT - BUY PROTECTION | | |
| $ 4,750,000 | Pay quarterly a fixed rate equal to 0.20% | — | $ 200,293 |
| | multiplied by the notional amount and receive | | |
| | from Merrill Lynch International upon each | | |
| | default event of HSBC Finance Corp., par | | |
| | value of the proportional notional amount | | |
| | of HSBC Finance Corp., 7.00%, 5/15/12. | | |
| | Expires June 2010. | | |
| TOTAL RETURN | | | |
| 44,000,000 | Pay a fixed rate equal to 1.08% and receive the | — | (1,774,168) |
| | return of the U.S. CPI Urban Consumers NSA | | |
| | Index upon the termination date with Barclays | | |
| | Bank plc. Expires July 2010. | | |
| 20,000,000 | Pay a fixed rate equal to 1.13% and receive the | — | (801,419) |
| | return of the U.S. CPI Urban Consumers NSA | | |
| | Index upon the termination date with Barclays | | |
| | Bank plc. Expires January 2012. | | |
| 35,000,000 | Pay a fixed rate equal to 1.14% and receive the | — | (1,785,174) |
| | return of the U.S. CPI Urban Consumers NSA | | |
| | Index upon the termination date with Barclays | | |
| | Bank plc. Expires March 2012. | | |
| 33,275,000 | Pay a fixed rate equal to 3.065% and receive | — | (3,247,160) |
| | the return of the U.S. CPI Urban Consumers NSA | | |
| | Index upon the termination date with Bank of | | |
| | America N.A. Expires July 2013. | | |
| 13,000,000 | Pay a fixed rate equal to 0.08% and receive the | — | (345,909) |
| | return of the U.S. CPI Urban Consumers NSA | | |
| | Index upon the termination date with UBS AG. | | |
| | Expires November 2013. | | |
| 20,000,000 | Pay a fixed rate equal to 1.21% and receive the | — | (1,343,553) |
| | return of the U.S. CPI Urban Consumers NSA | | |
| | Index upon the termination date with Barclays | | |
| | Bank plc. Expires June 2014. | | |
| 20,000,000 | Pay a fixed rate equal to 1.31% and receive the | — | (953,718) |
| | return of the U.S. CPI Urban Consumers NSA | | |
| | Index upon the termination date with Barclays | | |
| | Bank plc. Expires April 2017. | | |
| 40,000,000 | Pay a fixed rate equal to 1.31% and receive the | — | (2,172,276) |
| | return of the U.S. CPI Urban Consumers NSA | | |
| | Index upon the termination date with Barclays | | |
| | Bank plc. Expires April 2018. | | |
| 30,100,000 | Pay a fixed rate equal to 1.77% and receive the | — | (992,016) |
| | return of the U.S. CPI Urban Consumers NSA | | |
| | Index upon the termination date with Barclays | | |
| | Bank plc. Expires December 2027. | | |
| | | — | (13,415,393) |
| | | — | $(13,215,100) |
14
| | |
| VP Inflation Protection | | |
| |
| Notes to Schedule of Investments | | |
| AID = Agency for International Development | TVA = Tennessee Valley Authority |
| CPI = Consumer Price Index | USD = United States Dollar |
| Equivalent = Security whose principal payments are secured by US | VRN = Variable Rate Note. Interest reset date is indicated. Rate shown |
| Treasuries or backed by the full faith and credit of the United States. | is effective at the period end. |
| EUR = Euro | (1) | Security, or a portion thereof, has been segregated for swap |
| FAMCA = Federal Agricultural Mortgage Corporation | | agreements. At the period end, the aggregate value of securities |
| | | pledged was $13,616,000. |
| FFCB = Federal Farm Credit Bank | (2) | The rate indicated is the yield to maturity at purchase. These |
| FHLB = Federal Home Loan Bank | | securities are issued at a substantial discount from their value |
| FHLMC = Federal Home Loan Mortgage Corporation | | at maturity. |
| FNMA = Federal National Mortgage Association | (3) | Security was purchased under Rule 144A of the Securities Act of |
| GBP = British Pound | | 1933 or is a private placement and, unless registered under the |
| GMAC = General Motors Acceptance Corporation | | Act or exempted from registration, may only be sold to qualified |
| | | institutional investors. The aggregate value of these securities at |
| GNMA = Government National Mortgage Association | | the period end was $23,082,539, which represented 2.4% of total |
| GO = General Obligation | | net assets. |
| JPY = Japanese Yen | (4) | The debt is guaranteed under the Federal Deposit Insurance |
| LB-UBS = Lehman Brothers, Inc. — UBS AG | | Corporation’s (FDIC) Temporary Liquidity Guarantee Program and |
| | | is backed by the full faith and credit of the United States. The |
| LIBOR = London Interbank Offered Rate | | expiration date of the FDIC’s guarantee is the earlier of the maturity |
| PEFCO = Private Export Funding Corporation | | date of the debt or June 30, 2012. |
| resets = The frequency with which a security’s coupon changes, | (5) | Category is less than 0.05% of total net assets. |
| based on current market conditions or an underlying index. The more | (6) | Final maturity indicated, unless otherwise noted. |
| frequently a security resets, the less risk the investor is taking that the | | |
| coupon will vary significantly from current market rates. | (7) | The rate indicated is the yield to maturity at purchase. |
| SEQ = Sequential Payer | | |
| |
| | See Notes to Financial Statements. |
15
| |
| Statement of Assets and Liabilities | |
| |
| |
| |
| JUNE 30, 2009 (UNAUDITED) | |
| Assets | |
| Investment securities, at value (cost of $938,864,012) | $962,138,766 |
| Receivable for investments sold | 173,973 |
| Receivable for capital shares sold | 6,870,365 |
| Receivable for forward foreign currency exchange contracts | 471,589 |
| Receivable for swap agreements, at value | 200,293 |
| Dividends and interest receivable | 8,264,941 |
| | 978,119,927 |
| | |
| Liabilities | |
| Payable for investments purchased | 1,990,793 |
| Payable for capital shares redeemed | 1,990,665 |
| Payable for swap agreements, at value | 13,415,393 |
| Accrued management fees | 369,388 |
| Distribution fees payable | 173,194 |
| | 17,939,433 |
| | |
| Net Assets | $960,180,494 |
| | |
| Net Assets Consist of: | |
| Capital (par value and paid-in surplus) | $964,699,124 |
| Undistributed net investment income | 5,489,526 |
| Accumulated net realized loss on investment and foreign currency transactions | (20,549,615) |
| Net unrealized appreciation on investments and translation of assets | |
| and liabilities in foreign currencies | 10,541,459 |
| | $960,180,494 |
| | |
| Class I, $0.01 Par Value | |
| Net assets | $89,017,016 |
| Shares outstanding | 8,582,754 |
| Net asset value per share | $10.37 |
| | |
| Class II, $0.01 Par Value | |
| Net assets | $871,163,478 |
| Shares outstanding | 84,091,191 |
| Net asset value per share | $10.36 |
| |
| |
| See Notes to Financial Statements. | |
16
| |
| FOR THE SIX MONTHS ENDED JUNE 30, 2009 (UNAUDITED) | |
| Investment Income (Loss) | |
| Income: | |
| Interest | $ 9,956,102 |
| | |
| Expenses: | |
| Management fees | 2,110,010 |
| Distribution fees | 979,431 |
| Directors’ fees and expenses | 37,922 |
| Other expenses | 1,085 |
| | 3,128,448 |
| | |
| Net investment income (loss) | 6,827,654 |
| | |
| Realized and Unrealized Gain (Loss) | |
| Net realized gain (loss) on: | |
| Investment transactions | 5,803,096 |
| Futures contract transactions | (2,285,080) |
| Swap agreement transactions | (4,750) |
| Foreign currency transactions | (5,325,425) |
| | (1,812,159) |
| | |
| Change in net unrealized appreciation (depreciation) on: | |
| Investments | 17,239,944 |
| Futures contracts | 1,704,251 |
| Swap agreements | 16,211,332 |
| Translation of assets and liabilities in foreign currencies | 481,805 |
| | 35,637,332 |
| | |
| Net realized and unrealized gain (loss) | 33,825,173 |
| | |
| Net Increase (Decrease) in Net Assets Resulting from Operations | $40,652,827 |
| |
| |
| See Notes to Financial Statements. | |
17
|
| Statement of Changes in Net Assets |
| | |
| SIX MONTHS ENDED JUNE 30, 2009 (UNAUDITED) AND YEAR ENDED DECEMBER 31, 2008 | |
| Increase (Decrease) in Net Assets | 2009 | 2008 |
| Operations | | |
| Net investment income (loss) | $ 6,827,654 | $ 34,802,277 |
| Net realized gain (loss) | (1,812,159) | (9,111,059) |
| Change in net unrealized appreciation (depreciation) | 35,637,332 | (46,984,435) |
| Net increase (decrease) in net assets resulting from operations | 40,652,827 | (21,293,217) |
| | | |
| Distributions to Shareholders | | |
| From net investment income: | | |
| Class I | (171,704) | (4,545,420) |
| Class II | (1,023,366) | (30,440,780) |
| From return of capital: | | |
| Class I | — | (319,743) |
| Class II | — | (2,141,327) |
| Decrease in net assets from distributions | (1,195,070) | (37,447,270) |
| | | |
| Capital Share Transactions | | |
| Net increase (decrease) in net assets from capital share transactions | 73,376,654 | 299,743,448 |
| | | |
| | | |
| Net increase (decrease) in net assets | 112,834,411 | 241,002,961 |
| | | |
| Net Assets | | |
| Beginning of period | 847,346,083 | 606,343,122 |
| End of period | $960,180,494 | $847,346,083 |
| | | |
| Accumulated undistributed net investment income (loss) | $5,489,526 | $(143,058) |
| |
| |
| See Notes to Financial Statements. | | |
18
|
| Notes to Financial Statements |
JUNE 30, 2009 (UNAUDITED)
1. Organization and Summary of Significant Accounting Policies
Organization — American Century Variable Portfolios II, Inc. (the corporation) is registered under the Investment Company Act of 1940 (the 1940 Act) as an open-end management investment company. VP Inflation Protection Fund (the fund) is one fund in a series issued by the corporation. The fund is diversified under the 1940 Act. The fund’s investment objective is to pursue long-term total return using a strategy that seeks to protect against U.S. inflation. The fund pursues its investment objective by investing substantially all of its assets in investment-grade debt securities. The fund normally invests over 50% of its assets in inflation-adjusted debt securities that are designed to protect the future purchasing power of the money invested in them. The following is a summary of the fund’s significant accounting policies.
Multiple Class — The fund is authorized to issue Class I and Class II. The share classes differ principally in their respective distribution and shareholder servicing expenses and arrangements. All shares of the fund represent an equal pro rata interest in the net assets of the class to which such shares belong, and have identical voting, dividend, liquidation and other rights and the same terms and conditions, except for class specific expenses and exclusive rights to vote on matters affecting only individual classes. Income, non-class specific expenses, and realized and unrealized capital gains and losses of the fund are allocated to each class of shares based on their relative net assets.
Security Valuations — Debt securities maturing in greater than 60 days at the time of purchase are valued at current market value as provided by a commercial pricing service or at the mean of the most recent bid and asked prices. Debt securities maturing within 60 days at the time of purchase may be valued at cost, plus or minus any amortized discount or premium. Investments in open-end management investment companies are valued at the reported net asset value. If an event occurs after the value of a security was established but before the net asset value per share was determined that was likely to materially change the net asset value, that security would be valued as determined in accordance with procedures adopted by the Board of Directors. If the fund determines that the market price of a portfolio security is not readily available, or that the valuation methods mentioned above do not reflect the security’s fair value, such security is valued as determined by the Board of Directors or its designee, in accordance with procedures adopted by the Board of Directors, if such determination would materially impact a fund’s net asset value. Certain other circumstances may cause the fund to use alternative procedures to value a security such as: a security has been declared in default; trading in a security has been halted during the trading day; or there is a foreign market holiday and no trading will commence.
Security Transactions — For financial reporting purposes, security transactions are accounted for as of the trade date. Net realized gains and losses are determined on the identified cost basis, which is also used for federal income tax purposes.
Investment Income — Interest income is recorded on the accrual basis and includes paydown gain (loss) and accretion of discounts and amortization of premiums. Inflation adjustments related to inflation-linked debt securities are reflected as interest income.
Foreign Currency Transactions — All assets and liabilities initially expressed in foreign currencies are translated into U.S. dollars at prevailing exchange rates at period end. The fund may enter into spot foreign currency exchange contracts to facilitate transactions denominated in a foreign currency. Purchases and sales of investment securities, dividend and interest income, spot foreign currency exchange contracts, and certain expenses are translated at the rates of exchange prevailing on the respective dates of such transactions. For assets and liabilities, other than investments in securities, net realized and unrealized gains and losses from foreign currency translations arise from changes in currency exchange rates.
19
Net realized and unrealized foreign currency exchange gains or losses occurring during the holding period of investment securities are a component of realized gain (loss) on investment transactions and unrealized appreciation (depreciation) on investments, respectively. Certain countries may impose taxes on the contract amount of purchases and sales of foreign currency contracts in their currency. The fund records the foreign tax expense, if any, as a reduction to the net realized gain (loss) on foreign currency transactions.
When-Issued and Forward Commitments — The fund may engage in securities transactions on a when-issued or forward commitment basis. In these transactions, the securities’ prices and yields are fixed on the date of the commitment. In a when-issued transaction, the payment and delivery are scheduled for a future date and during this period, securities are subject to market fluctuations. In a forward commitment transaction, the fund may sell a security and at the same time make a commitment to purchase the same security at a future date at a specified price. Conversely, the fund may purchase a security and at the same time make a commitment to sell the same security at a future date at a specified price. These types of transactions are executed simultaneously in what are known as “roll” transactions. The fund will segregate cash, cash equivalents or other appropriate liquid securities on its records in amounts sufficient to meet the purchase price. The fund accounts for “roll” transactions as purchases and sales; as such these transactions may increase portfolio turnover.
Repurchase Agreements — The fund may enter into repurchase agreements with institutions that American Century Investment Management, Inc. (ACIM) (the investment advisor) has determined are creditworthy pursuant to criteria adopted by the Board of Directors. Each repurchase agreement is recorded at cost. The fund requires that the collateral, represented by securities, received in a repurchase transaction be transferred to the custodian in a manner sufficient to enable the fund to obtain those securities in the event of a default under the repurchase agreement. ACIM monitors, on a daily basis, the securities transferred to ensure the value, including accrued interest, of the securities under each repurchase agreement is equal to or greater than amounts owed to the fund under each repurchase agreement.
Joint Trading Account — Pursuant to an Exemptive Order issued by the Securities and Exchange Commission, the fund, along with certain other funds in the American Century Investments family of funds, may transfer uninvested cash balances into a joint trading account. These balances are invested in one or more repurchase agreements that are collateralized by U.S. Treasury or Agency obligations.
Income Tax Status — It is the fund’s policy to distribute substantially all net investment income and net realized gains to shareholders and to otherwise qualify as a regulated investment company under provisions of the Internal Revenue Code. The fund is no longer subject to examination by tax authorities for years prior to 2005. At this time, management believes there are no uncertain tax positions which, based on their technical merit, would not be sustained upon examination and for which it is reasonably possible that the total amounts of unrecognized tax benefits will significantly change in the next twelve months. Accordingly, no provision has been made for federal or state income taxes. Interest and penalties associated with any federal or state income tax obligations, if any, are recorded as interest expense.
Distributions to Shareholders — Distributions to shareholders are recorded on the ex-dividend date. Distributions from net investment income, if any, are generally declared daily and paid monthly. Distributions from net realized gains, if any, are generally declared and paid annually.
The book-basis character of distributions made during the year from net investment income or net realized gains may differ from their ultimate characterization for federal income tax purposes. These differences reflect the differing character of paydown losses, interest on swap agreements, certain income items and net realized gains and losses for financial statement and tax purposes, and may result in reclassification among certain capital accounts on the financial statements.
20
As of December 31, 2008, the fund had accumulated net realized capital loss carryovers for federal income tax purposes of $(10,505,309), which may be used to offset future taxable gains. Capital loss carryovers of $(721,603), $(3,476,419), $(3,811,535) and $(2,495,752) expire in 2013, 2014, 2015 and 2016, respectively.
The fund has elected to treat $(7,813,145) of net capital losses incurred in the two-month period ended December 31, 2008, as having been incurred in the following fiscal year for federal income tax purposes.
Indemnifications — Under the corporation’s organizational documents, its officers and directors are indemnified against certain liabilities arising out of the performance of their duties to the fund. In addition, in the normal course of business, the fund enters into contracts that provide general indemnifications. The fund’s maximum exposure under these arrangements is unknown as this would involve future claims that may be made against the fund. The risk of material loss from such claims is considered by management to be remote.
Use of Estimates — The financial statements are prepared in conformity with accounting principles generally accepted in the United States of America, which may require management to make certain estimates and assumptions at the date of the financial statements. Actual results could differ from these estimates.
Subsequent Events — Management has evaluated events or transactions that may have occurred since June 30, 2009, that would merit recognition or disclosure in the financial statements. This evaluation was completed through August 14, 2009, the date the financial statements were issued.
2. Fees and Transactions with Related Parties
Management Fees — The corporation has entered into a Management Agreement with ACIM, under which ACIM provides the fund with investment advisory and management services in exchange for a single, unified management fee (the fee) per class. The Agreement provides that all expenses of the fund, except brokerage commissions, taxes, interest, fees and expenses of those directors who are not considered “interested persons” as defined in the 1940 Act (including counsel fees) and extraordinary expenses, will be paid by ACIM. The fee is computed and accrued daily based on the daily net assets of the specific class of shares of the fund and paid monthly in arrears. The fee consists of (1) an Investment Category Fee based on the daily net assets of the fund and certain other accounts managed by the investment advisor that are in the same broad investment category as the fund and (2) a Complex Fee based on the assets of all the funds in the American Century Investments family of funds. The rates for the Investment Category Fee range from 0.1625% to 0.2800%. The rates for the Complex Fee range from 0.2500% to 0.3100%. The effective annual management fee for each class of the fund for the six months ended June 30, 2009 was 0.48% for Class I and Class II.
Distribution Fees — The Board of Directors has adopted the Master Distribution Plan (the plan) for Class II, pursuant to Rule 12b-1 of the 1940 Act. The plan provides that Class II will pay American Century Investment Services, Inc. (ACIS) an annual distribution fee equal to 0.25%. The fee is computed and accrued daily based on the Class II daily net assets and paid monthly in arrears. The distribution fee provides compensation for expenses incurred in connection with distributing shares of Class II including, but not limited to, payments to brokers, dealers, and financial institutions that have entered into sales agreements with respect to shares of the fund. Fees incurred under the plan during the six months ended June 30, 2009, are detailed in the Statement of Operations.
21
Related Parties — Certain officers and directors of the corporation are also officers and/ or directors of American Century Companies, Inc. (ACC), the parent of the corporation’s investment advisor, ACIM, the distributor of the corporation, ACIS, and the corporation’s transfer agent, American Century Services, LLC.
The fund is eligible to invest in a money market fund for temporary purposes, which is managed by J.P. Morgan Investment Management, Inc. (JPMIM). The fund has a Mutual Funds Services Agreement with J.P. Morgan Investor Services Co. (JPMIS). JPMorgan Chase Bank (JPMCB) is a custodian of the fund. JPMIM, JPMIS and JPMCB are wholly owned subsidiaries of JPMorgan Chase & Co. (JPM). JPM is an equity investor in ACC.
3. Investment Transactions
Purchases of investment securities, excluding short-term investments, for the six months ended June 30, 2009, totaled $294,438,984, of which $158,212,552 represented U.S. Treasury and Agency obligations.
Sales of investment securities, excluding short-term investments, for the six months ended June 30, 2009, totaled $240,904,598, of which $228,747,493 represented U.S. Treasury and Agency obligations.
As of June 30, 2009, the composition of unrealized appreciation and depreciation of investment securities based on the aggregate cost of investments for federal income tax purposes was as follows:
| |
| Federal tax cost of investments | $940,987,265 |
| Gross tax appreciation of investments | $28,676,796 |
| Gross tax depreciation of investments | (7,525,295) |
| Net tax appreciation (depreciation) of investments | $21,151,501 |
The difference between book-basis and tax-basis cost and unrealized appreciation (depreciation) is attributable primarily to the tax deferral of losses on wash sales.
| | | | |
| 4. Capital Share Transactions | | | | |
| |
| Transactions in shares of the fund were as follows: | | |
| |
| | Six months ended June 30, 2009 | Year ended December 31, 2008 |
| | Shares | Amount | Shares | Amount |
| Class I/Shares Authorized | 250,000,000 | | 250,000,000 | |
| Sold | 1,109,661 | $11,336,667 | 8,387,913 | $ 89,512,577 |
| Issued in reinvestment of distributions | 16,740 | 171,704 | 462,552 | 4,865,163 |
| Redeemed | (1,709,137) | (17,229,863) | (4,924,432) | (48,906,593) |
| | (582,736) | (5,721,492) | 3,926,033 | 45,471,147 |
| Class II/Shares Authorized | 250,000,000 | | 250,000,000 | |
| Sold | 15,037,206 | 152,682,463 | 43,783,025 | 453,101,513 |
| Issued in reinvestment of distributions | 99,904 | 1,023,366 | 3,090,387 | 32,582,107 |
| Redeemed | (7,420,937) | (74,607,683) | (22,753,017) | (231,411,319) |
| | 7,716,173 | 79,098,146 | 24,120,395 | 254,272,301 |
| Net increase (decrease) | 7,133,437 | $73,376,654 | 28,046,428 | $299,743,448 |
22
5. Fair Value Measurements
The fund’s securities valuation process is based on several considerations and may use multiple inputs to determine the fair value of the positions held by the fund. In conformity with accounting principles generally accepted in the United States of America, the inputs used to determine a valuation are classified into three broad levels as follows:
• Level 1 valuation inputs consist of actual quoted prices in an active market for identical securities;
• Level 2 valuation inputs consist of significant direct or indirect observable market data (including quoted prices for similar securities, interest rates, prepayment speeds, credit risk, etc.); or
• Level 3 valuation inputs consist of significant unobservable inputs (including a fund’s own assumptions).
The level classification is based on the lowest level input that is significant to the fair valuation measurement. The valuation inputs are not an indication of the risks associated with investing in these securities or other financial instruments.
The following is a summary of the valuation inputs used to determine the fair value of the fund’s securities and other financial instruments as of June 30, 2009:
| | | |
| | Level 1 | Level 2 | Level 3 |
| Investment Securities | | | |
| U.S. Treasury Securities and Equivalents | — | $543,330,166 | — |
| Sovereign Governments & Agencies | — | 135,339,244 | — |
| U.S. Government Agency Securities and Equivalents | — | 95,916,987 | — |
| Corporate Bonds | — | 61,997,919 | — |
| U.S. Government Agency Mortgage-Backed Securities | — | 33,712,359 | — |
| Municipal Securities | — | 28,960,307 | — |
| Commercial Mortgage-Backed Securities | — | 27,587,613 | — |
| Collateralized Mortgage Obligations | — | 5,298,186 | — |
| Asset-Backed Securities | — | 15,548 | — |
| Temporary Cash Investments | $80,736 | 29,899,701 | — |
| Total Value of Investment Securities | $80,736 | $962,058,030 | — |
| | | | |
| Other Financial Instruments | | | |
| Forward Foreign Currency Exchange Contracts | — | $ 471,589 | — |
| Swap Agreements | — | (13,215,100) | — |
| Total Unrealized Gain (Loss) | | | |
| on Other Financial Instruments | — | $(12,743,511) | — |
23
6. Derivative Instruments
Credit Risk — The fund is subject to credit risk in the normal course of pursuing its investment objectives. The value of a bond generally declines as the credit quality of its issuer declines. Credit default swaps enable a fund to buy/sell protection against a credit event of a specific issuer or index. A fund may attempt to enhance returns by selling protection or attempt to mitigate credit risk by buying protection. The buyer/seller of credit protection against a security or basket of securities may pay/receive an up-front or periodic payment to compensate for/against potential default events. A fund will segregate cash, cash equivalents or other appropriate liquid securities on its records in amounts sufficient to meet requirements. Swap agreements are valued daily at current market value as provided by a commercial pricing service and/or independent brokers. Changes in value, including the periodic amounts of interest to be paid or received on swaps, are recorded as unrealized appreciation (depreciation) on swap agreements. Realized gain or loss is recorded upon receipt or payment of a periodic settlement or termination of swap agreements. Net realized and unrealized gains or losses occurring during the holding period of swap agreements are a component of net realized gain (loss) on swap agreement transactions and change in net unrealized appreciation (depreciation) on swap agreements, respectively. The risks of entering into swap agreements include the possible lack of liquidity, failure of the counterparty to meet its obligations, and that there may be unfavorable changes in the underlying investments or instruments. During the six months ended June 30, 2009, the fund participated in credit default swap agreements to buy protection.
Foreign Currency Risk — The fund is subject to foreign currency exchange rate risk in the normal course of pursuing its investment objectives. The value of foreign investments held by a fund may be significantly affected by changes in foreign currency exchange rates. The dollar value of a foreign security generally decreases when the value of the dollar rises against the foreign currency in which the security is denominated and tends to increase when the value of the dollar declines against such foreign currency. A fund may enter into forward foreign currency exchange contracts to reduce a fund’s exposure to foreign currency exchange rate fluctuations. The net U.S. dollar value of foreign currency underlying all contractual commitments held by a fund and the resulting unrealized appreciation or depreciation are determined daily using prevailing exchange rates. Realized gain or loss is recorded upon the termination of the contract. Net realized and unrealized gains or losses occurring during the holding period of forward foreign currency exchange contracts are a component of net realized gain (loss) on foreign currency transactions and change in net unrealized appreciation (depreciation) on translation of assets and liabilities in foreign currencies, respectively. A fund bears the risk of an unfavorable change in the foreign currency exchange rate underlying the forward contract. Additionally, losses, up to the fair value, may arise if the counterparties do not perform under the contract terms. The risk of loss from non-performance by the counterparty may be reduced by the use of master netting agreements. During the six months ended June 30, 2009, the fund participated in forward foreign currency exchange contracts.
Interest Rate Risk — The fund is subject to interest rate risk in the normal course of pursuing its investment objectives. The value of bonds generally declines as interest rates rise. A fund may enter into futures contracts based on a bond index or a specific underlying security. A fund may purchase futures contracts to gain exposure to increases in market value or sell futures contracts to protect against a decline in market value. Upon entering into a futures contract, a fund will segregate cash, cash equivalents or other appropriate liquid securities on its records in amounts sufficient to meet requirements. Subsequent payments (variation margin) are made or received daily, in cash, by a fund. The variation margin is equal to the daily change in the contract value and is recorded as unrealized gains and losses. A fund recognizes a realized gain or loss when the futures contract is closed or expires. Net realized and unrealized gains or losses occurring during the holding period of futures contracts are a component of net realized gain (loss) on futures contract transactions and change in net unrealized appreciation (depreciation) on futures contracts, respectively. One of the risks of entering into futures contracts is the possibility that the change in value of the contract may not correlate with the changes in value of the underlying securities. During the six months June 30, 2009 the fund sold futures contracts.
24
Other Contracts — A fund may enter into total return swap agreements in order to attempt to obtain or preserve a particular return or spread at a lower cost than obtaining a return or spread through purchases and/or sales of instruments in other markets or gain exposure to certain markets in the most economical way possible. A fund will segregate cash, cash equivalents or other appropriate liquid securities on its records in amounts sufficient to meet requirements. Swap agreements are valued daily at current market value as provided by a commercial pricing service and/or independent brokers. Changes in value, including the periodic amounts of interest to be paid or received on swaps, are recorded as unrealized appreciation (depreciation) on swap agreements. Realized gain or loss is recorded upon receipt or payment of a periodic settlement or termination of swap agreements. Net realized and unrealized gains or losses occurring during the holding period of swap agreements are a component of net realized gain (loss) on swap agreement transactions and change in net unrealized appreciation (depreciation) on swap agreements, respectively. The risks of entering into swap agreements include the possible lack of liquidity, failure of the counterparty to meet its obligations, and that there may be unfavorable changes in the underlying investments or instruments. During the six months ended June 30, 2009 the fund participated in total return swap agreements.
| | | | |
| Value of Derivative Instruments as of June 30, 2009: | | |
| |
| | Asset Derivatives | | Liability Derivatives |
| | Location on Statement | | Location on Statement | |
| Type of Derivative | of Assets and Liabilities | Value | of Assets and Liabilities | Value |
| Credit Risk | Receivable for | $200,293 | Payable for | — |
| | swap agreements | | swap agreements | |
| Foreign | Receivable for forward foreign | 471,589 | Payable for forward foreign | — |
| Currency Risk | currency exchange contracts | | currency exchange contracts | |
| Other Contracts | Receivable for swap | — | Payable for swap agreements | $(13,415,393) |
| | agreements | | | |
| | | $671,882 | | $(13,415,393) |
Effect of Derivative Instruments on the Statement of Operations for the six months ended June 30, 2009:
| | | | |
| | | | Change in Net Unrealized |
| | Net Realized Gain (Loss) | Appreciation (Depreciation) |
| | Location on | | Location on | |
| Type of Derivative | Statement of Operations | | Statement of Operations | |
| Credit Risk | Net realized gain (loss) on | $ (4,750) | Change in net unrealized | $ (224,018) |
| | swap agreement transactions | | appreciation (depreciation) | |
| | | | on swap agreements | |
| Foreign | Net realized gain (loss) on | (5,042,992) | Change in net unrealized | 471,589 |
| Currency Risk | foreign currency transactions | | appreciation (depreciation) | |
| | | | on translation of assets | |
| | | | and liabilities in | |
| | | | foreign currencies | |
| Interest Rate Risk | Net realized gain (loss) on | (2,285,080) | Change in net unrealized | 1,704,251 |
| | futures contract transactions | | appreciation (depreciation) | |
| | | | on futures contracts | |
| Other Contracts | Net realized gain (loss) on | — | Change in net unrealized | 16,435,350 |
| | swap agreement transactions | | appreciation (depreciation) on | |
| | | | swap agreements | |
| | | $(7,332,822) | | $18,387,172 |
The value of derivative instruments at period end and the effect of derivatives on the Statement of Operations is indicative of the fund’s typical volume.
25
7. Interfund Lending
The fund, along with certain other funds in the American Century Investments family of funds, may participate in an interfund lending program, pursuant to an Exemptive Order issued by the Securities and Exchange Commission (SEC). This program provides an alternative credit facility allowing the fund to borrow from or lend to other funds in the American Century Investments family of funds that permit such transactions. Interfund lending transactions are subject to each fund’s investment policies and borrowing and lending limits. The interfund loan rate earned/paid on interfund lending transactions is determined daily based on the average of certain current market rates. Interfund lending transactions normally extend only overnight, but can have a maximum duration of seven days. The program is subject to annual approval by the Board of Directors. During the six months ended June 30, 2009, the fund did not utilize the program.
8. Recently Issued Accounting Standards
In March 2008, the Financial Accounting Standards Board (FASB) issued Statement of Financial Accounting Standards No. 161, “Disclosures about Derivative Instruments and Hedging Activities — an amendment of FASB Statement No. 133” (FAS 161). FAS 161 is effective for interim periods beginning after November 15, 2008 and has been adopted by the fund. FAS 161 amends and expands disclosures about derivative instruments and hedging activities. FAS 161 requires qualitative disclosures about the objectives and strategies of derivative instruments, quantitative disclosures about the fair value amounts of and gains and losses on derivative instruments, and disclosures of credit-risk-related contingent features in hedging activities.
26
| | | | | | | |
| VP Inflation Protection | | | | |
| |
| Class I | | | | | | |
| For a Share Outstanding Throughout the Years Ended December 31 (except as noted) | | |
| | | 2009(1) | 2008 | 2007 | 2006 | 2005 | 2004(2) |
| Per-Share Data | | | | | | |
| Net Asset Value, | | | | | | |
| Beginning of Period | $9.91 | $10.55 | $10.09 | $10.26 | $10.55 | $10.07 |
| Income From | | | | | | |
| Investment Operations | | | | | | |
| Net Investment | | | | | | |
| Income (Loss) | 0.08(3) | 0.49(3) | 0.49 | 0.34(3) | 0.47 | 0.24 |
| Net Realized and | | | | | | |
| Unrealized Gain (Loss) | 0.40 | (0.60) | 0.46 | (0.15) | (0.28) | 0.48 |
| Total From | | | | | | |
| Investment Operations | 0.48 | (0.11) | 0.95 | 0.19 | 0.19 | 0.72 |
| Distributions | | | | | | |
| From Net | | | | | | |
| Investment Income | (0.02) | (0.50) | (0.49) | (0.36) | (0.47) | (0.24) |
| From Net | | | | | | |
| Realized Gains | — | — | — | — | (0.01) | — |
| From Return | | | | | | |
| of Capital | — | (0.03) | — | — | — | — |
| Total Distributions | (0.02) | (0.53) | (0.49) | (0.36) | (0.48) | (0.24) |
| Net Asset Value, | | | | | | |
| End of Period | $10.37 | $9.91 | $10.55 | $10.09 | $10.26 | $10.55 |
| |
| Total Return(4) | 4.84% | (1.26)% | 9.66% | 1.90% | 1.81% | 7.37% |
| |
| Ratios/Supplemental Data | | | | | | |
| Ratio of Operating | | | | | | |
| Expenses to Average | | | | | | |
| Net Assets | 0.49%(5) | 0.49% | 0.50% | 0.50% | 0.50% | 0.49%(5) |
| Ratio of Net Investment | | | | | | |
| Income (Loss) to Average | | | | | | |
| Net Assets | 1.79%(5) | 4.62% | 4.75% | 3.37% | 4.85% | 3.52%(5) |
| Portfolio Turnover Rate | 28% | 49% | 109% | 96% | 82% | 108%(6) |
| Net Assets, End of Period | | | | | | |
| (in thousands) | $89,017 | $90,845 | $55,277 | $39,096 | $29,040 | $11,319 |
| (1) | Six months ended June 30, 2009 (unaudited). | | | | | |
| (2) | May 7, 2004 (commencement of sale) through December 31, 2004. | | | | |
| (3) | Computed using average shares outstanding throughout the period. | | | | |
| (4) | Total return assumes reinvestment of net investment income and capital gains distributions, if any. Total returns for periods less than one year |
| | are not annualized. The total return of the classes may not precisely reflect the class expense differences because of the impact of calculating |
| | the net asset values to two decimal places. If net asset values were calculated to three decimal places, the total return differences would |
| | more closely reflect the class expense differences. The calculation of net asset values to two decimal places is made in accordance with SEC |
| | guidelines and does not result in any gain or loss of value between one class and another. | | | |
| (5) | Annualized. | | | | | | |
| (6) | Portfolio turnover is calculated at the fund level. Percentage indicated was calculated for the year ended December 31, 2004. | |
See Notes to Financial Statements.
27
| | | | | | | |
| VP Inflation Protection | | | | |
| |
| Class II | | | | | | |
| For a Share Outstanding Throughout the Years Ended December 31 (except as noted) | | |
| | | 2009(1) | 2008 | 2007 | 2006 | 2005 | 2004 |
| Per-Share Data | | | | | | |
| Net Asset Value, | | | | | | |
| Beginning of Period | $9.91 | $10.55 | $10.08 | $10.26 | $10.55 | $10.31 |
| Income From | | | | | | |
| Investment Operations | | | | | | |
| Net Investment | | | | | | |
| Income (Loss) | 0.08(2) | 0.45(2) | 0.46 | 0.32(2) | 0.45 | 0.35 |
| Net Realized and | | | | | | |
| Unrealized Gain (Loss) | 0.38 | (0.59) | 0.47 | (0.16) | (0.28) | 0.25 |
| Total From | | | | | | |
| Investment Operations | 0.46 | (0.14) | 0.93 | 0.16 | 0.17 | 0.60 |
| Distributions | | | | | | |
| From Net | | | | | | |
| Investment Income | (0.01) | (0.47) | (0.46) | (0.34) | (0.45) | (0.35) |
| From Net | | | | | | |
| Realized Gains | — | — | — | — | (0.01) | (0.01) |
| From Return | | | | | | |
| of Capital | — | (0.03) | — | — | — | — |
| Total Distributions | (0.01) | (0.50) | (0.46) | (0.34) | (0.46) | (0.36) |
| Net Asset Value, | | | | | | |
| End of Period | $10.36 | $9.91 | $10.55 | $10.08 | $10.26 | $10.55 |
| |
| Total Return(3) | 4.78% | (1.59)% | 9.49% | 1.59% | 1.56% | 5.81% |
| |
| Ratios/Supplemental Data | | | | | | |
| Ratio of Operating | | | | | | |
| Expenses to Average | | | | | | |
| Net Assets | 0.74%(4) | 0.74% | 0.75% | 0.75% | 0.75% | 0.74% |
| Ratio of Net Investment | | | | | | |
| Income (Loss) to Average | | | | | | |
| Net Assets | 1.54%(4) | 4.37% | 4.50% | 3.12% | 4.60% | 3.40% |
| Portfolio Turnover Rate | 28% | 49% | 109% | 96% | 82% | 108% |
| Net Assets, End of Period | | | | | | |
| (in thousands) | $871,163 | $756,501 | $551,066 | $483,692 | $418,424 | $199,885 |
| (1) | Six months ended June 30, 2009 (unaudited). | | | | | |
| (2) | Computed using average shares outstanding throughout the period. | | | | |
| (3) | Total return assumes reinvestment of net investment income and capital gains distributions, if any. Total returns for periods less than one year |
| | are not annualized. The total return of the classes may not precisely reflect the class expense differences because of the impact of calculating |
| | the net asset values to two decimal places. If net asset values were calculated to three decimal places, the total return differences would |
| | more closely reflect the class expense differences. The calculation of net asset values to two decimal places is made in accordance with SEC |
| | guidelines and does not result in any gain or loss of value between one class and another. | | | |
| (4) | Annualized. | | | | | | |
See Notes to Financial Statements.
28
|
| Approval of Management Agreement |
Under Section 15(c) of the Investment Company Act, contracts for investment advisory services to a mutual fund are required to be reviewed, evaluated and approved each year by the fund’s board of directors/ trustees, including a majority of a fund’s independent directors/trustees (the “Directors”). At American Century Investments, this process is referred to as the “15(c) Process.” The board oversees on a continuous basis and evaluates at its quarterly meetings, directly and through the committees of the board, the nature and quality of significant services provided by the advisor, the investment performance of the funds, shareholder services, audit and compliance functions and a variety of other matters relating to fund operations. Each year, it also holds a special meeting in connection with determining whether to renew the contracts for advisory services, to review fund performance, shareholder services, adviser profitability, audit and compliance matters, and other fund operational matters.
Under a Securities and Exchange Commission rule, each fund is required to disclose in its annual or semiannual report, as appropriate, the material factors and conclusions that formed the basis for the board’s approval or renewal of any advisory agreements within the fund’s most recently completed fiscal half-year period.
Annual Contract Review Process
As part of the annual 15(c) Process, the Directors requested and reviewed extensive data and information compiled by the advisor and certain independent providers of evaluative data (the “15(c) Providers”) concerning the VP Inflation Protection Fund (the “fund”) and the services provided to the fund under the management agreement. The information considered and the discussions held at the meetings included, but were not limited to:
• the nature, extent and quality of investment management, shareholder services and other services that the advisor provides to the fund;
• the wide range of programs and services the advisor provides to the fund and its shareholders on a routine and non-routine basis;
• the compliance policies, procedures, and regulatory experience of the advisor;
• data comparing the cost of owning the fund to the cost of owning a similar fund;
• data comparing the fund’s performance to appropriate benchmarks and/or a peer group of other mutual funds with similar investment objectives and strategies;
• financial data showing the profitability of the fund to the advisor and the overall profitability of the advisor;
• data comparing services provided and charges to other non-fund investment management clients of the advisor; and
29
• collateral or “fall-out” benefits derived by the advisor from the manage-ment of the fund, and potential sharing of economies of scale in connection with the management of the fund.
In keeping with its practice, the Directors at a special meeting and at a regularly scheduled quarterly meeting reviewed and discussed the information provided by the advisor throughout the year and to negotiate with the advisor the renewal of the management agreement, including the setting of the applicable management fee. The Directors had the benefit of the advice of their independent counsel throughout the period.
Factors Considered
The Directors considered all of the information provided by the advisor, independent data providers, and the board’s independent counsel, and evaluated such information for each fund the board oversees. The Directors did not identify any single factor as being all-important or controlling, and each Director may have attributed different levels of importance to different factors. In deciding to renew the agreement under the terms ultimately determined by the board to be appropriate, the Directors’ decision was based on a number of factors, including the following.
Nature, Extent and Quality of Services - Generally. Under the management agreement, the advisor is responsible for providing or arranging for all services necessary for the operation of the fund. The board noted that under the management agreement, the advisor provides or arranges at its own expense a wide variety of services including:
• fund construction and design
• initial capitalization/funding
• portfolio research and security selection
• securities trading
• fund administration
• custody of fund assets
• daily valuation of the fund’s portfolio
• shareholder servicing and transfer agency, including shareholder confirmations, recordkeeping and communications
• legal services
• regulatory and portfolio compliance
• financial reporting
• marketing and distribution
30
The Directors noted that many of these services have expanded over time both in terms of quantity and complexity in response to shareholder demands, competition in the industry, changing distribution channels and the changing regulatory environment. In performing their evaluation, the Directors considered information received in connection with the annual review, as well as information provided on an ongoing basis throughout the year and at their regularly scheduled board and committee meetings.
Investment Management Services. The nature of the investment management services provided is quite complex and allows fund shareholders access to professional money management, instant diversification of their investments within an asset class, the opportunity to easily diversify among asset classes, and liquidity. In evaluating investment performance, the board expects the advisor to manage the fund in accordance with its investment objectives and approved strategies. In providing these services, the advisor utilizes teams of investment professionals (portfolio managers, analysts, research assistants, and securities traders) who require extensive information technology, research, training, compliance and other systems to conduct their business. At each quarterly meeting and at the special meeting to consider renewal of the management agreement, the Directors, directly and through its Portfolio Committee, review investment performance information for the fund, together with comparative information for appropriate benchmarks and/or peer groups of similarly-managed funds, over different time horizons. If performance concerns are identified, the underperforming fund receives special reviews until performance improves, during which Directors discuss with the advisor the reasons for such underperformance (e.g., market conditions, security and sector selection) and any efforts being undertaken to improve performance. The Fund’s performance was above its benchmark for the one-year period and below its benchmark for the three-year period.
Shareholder and Other Services. The advisor provides the fund with a comprehensive package of transfer agency, shareholder, and other services. The Directors, directly and through the various Committees of the Board, review reports and evaluations of such services at their regular quarterly meetings and at their special meeting to consider renewal of the management agreement, including the annual meeting concerning contract review, and other reports to the board. These reports include, but are not limited to, information regarding the operational efficiency and accuracy of the shareholder and transfer agency services provided, staffing levels, shareholder satisfaction (as measured by external as well as internal sources), technology support, new products and services offered to fund shareholders, securities trading activities, portfolio valuation services, auditing services, and legal and operational compliance activities. Certain aspects of shareholder and transfer agency service level efficiency and the quality of securities trading activities are measured by independent third party providers and are presented in comparison to other fund groups not managed by the advisor.
31
Costs of Services Provided and Profitability. The advisor provides detailed information concerning its cost of providing various services to the fund, its profitability in managing the fund, its overall profitability, and its financial condition. The Directors have reviewed with the advisor the methodology used to prepare this financial information. The Directors have also reviewed with the advisor its methodology for compensating the investment professionals that provide services to the fund. This financial information regarding the advisor is considered in order to evaluate the advisor’s financial condition, its ability to continue to provide services under the management agreement, and the reasonableness of the current management fee.
Ethics. The Directors generally consider the advisor’s commitment to providing quality services to shareholders and to conducting its business ethically. They noted that the advisor’s practices generally meet or exceed industry best practices.
Economies of Scale. The Directors review information provided by the advisor regarding the existence of economies of scale in connection with the investment management of the funds. The Directors concluded that economies of scale are difficult to measure and predict with precision, especially on a fund-by-fund basis. The analysis of economies of scale is further complicated by the additional services and content provided by the advisor and its reinvestment in its ability to provide and expand those services. Accordingly, the Directors seek to evaluate economies of scale by reviewing information, such as year-over-year profitability of the advisor generally, the profitability of its management of the fund specifically, and the expenses incurred by the advisor in providing various functions to the fund. The Directors believe the advisor is appropriately sharing economies of scale through its competitive fee structure, fee breakpoints as the fund complex and the fund increases in size, and through reinvestment in its business to provide shareholders additional services and enhancements to existing services. In particular, separate breakpoint schedules based on the size of the entire fund complex and on the size of the fund reflect the complexity of assessing economies of scale.
Comparison to Other Funds’ Fees. The fund pays the advisor a single, all-inclusive (or unified) management fee for providing all services necessary for the management and operation of the fund, other than brokerage expenses, taxes, interest, extraordinary expenses, and the fees and expenses of the fund’s independent directors (including their independent legal counsel). Under the unified fee structure, the advisor is responsible for providing all investment advisory, custody, audit, administrative, compliance, record-keeping, marketing and shareholder services, or arranging and supervising third parties to provide such services. By contrast, most other funds are charged a variety of fees, including an investment advisory fee, a transfer agency fee, an administrative fee, distribution charges and other expenses. Other than their investment advisory fees and Rule 12b-1 distribution fees, the components of the total fees charged by these other funds may be increased without shareholder approval. The board believes the unified fee structure is a benefit to fund shareholders because it clearly discloses to shareholders the cost of owning fund shares, and, since the unified fee
32
cannot be increased without a vote of fund shareholders, it shifts to the advisor the risk of increased costs of operating the fund and provides a direct incentive to minimize administrative inefficiencies. Part of the Directors’ analysis of fee levels involves reviewing certain evaluative data compiled by an independent provider and comparing the fund’s unified fee to the total expense ratio of other funds in the fund’s peer group. The Directors also reviewed updated fee level data provided by the advisor, but recognized that comparative data was particularly difficult to evaluate given the significant market developments during the past year impacting fund assets. The unified fee charged to shareholders of the fund was in the lowest quartile of the total expense ratios of its peer group.
Comparison to Fees and Services Provided to Other Clients of the Advisor. The Directors also requested and received information from the advisor concerning the nature and extent of the services, fees, and profitability of its advisory services to advisory clients other than the fund. They observed that these varying types of client accounts require different services and involve different regulatory and entrepreneurial risks than the management of the fund. The Directors analyzed this information and concluded that the fees charged and services provided to the fund were reasonable by comparison.
Collateral or “Fall-Out” Benefits Derived by the Advisor. The Directors considered the existence of collateral benefits the advisor may receive as a result of its relationship with the fund. They concluded that the advisor’s primary business is managing mutual funds and it generally does not use fund or shareholder information to generate profits in other lines of business, and therefore does not derive any significant collateral benefits from them. The Directors noted that the advisor receives proprietary research from broker dealers that execute fund portfolio transactions but concluded that this research is likely to benefit fund shareholders. The Directors also determined that the advisor is able to provide investment management services to certain clients other than the fund, at least in part, due to its existing infrastructure built to serve the fund complex. The Directors concluded, however, that the assets of those other clients are not material to the analysis and, in any event, are included with the assets of the fund to determine breakpoints in the fund’s fee schedule, provided they are managed using the same investment team and strategy.
Conclusions of the Directors
As a result of this process, the Directors, in the absence of particular circumstances and assisted by the advice of their independent legal counsel, taking into account all of the factors discussed above and the information provided by the advisor and others, concluded that the investment management agreement between the fund and the advisor, including the management fee, is fair and reasonable in light of the services provided and should be renewed for a one-year term. Also, as part of this process, the advisor and the Directors concluded that it would be appropriate to discuss over the coming year the possibility of changes in the overall fee structure of the fund.
33
Proxy Voting Guidelines
American Century Investment Management, Inc., the fund’s investment advisor, is responsible for exercising the voting rights associated with the securities purchased and/or held by the fund. A description of the policies and procedures the advisor uses in fulfilling this responsibility is available without charge, upon request, by calling 1-800-378-9878. It is also available on American Century Investments’ website at americancentury.com and on the Securities and Exchange Commission’s website at sec.gov. Information regarding how the investment advisor voted proxies relating to portfolio securities during the most recent 12-month period ended June 30 is available on the “About Us” page at americancentury.com. It is also available at sec.gov.
Quarterly Portfolio Disclosure
The fund files its complete schedule of portfolio holdings with the Securities and Exchange Commission (SEC) for the first and third quarters of each fiscal year on Form N-Q. The fund’s Form N-Q is available on the SEC’s website at sec.gov, and may be reviewed and copied at the SEC’s Public Reference Room in Washington, DC. Information on the operation of the Public Reference Room may be obtained by calling 1-800-SEC-0330. The fund also makes its complete schedule of portfolio holdings for the most recent quarter of its fiscal year available on its website at ipro.americancentury.com (for Investment Professionals) and, upon request, by calling 1-800-378-9878.
34
The following indices are used to illustrate investment market, sector, or style performance or to serve as fund performance comparisons. They are not investment products available for purchase.
The Citigroup Credit Index includes US and non-US corporate securities and non-US sovereign and provincial securities.
The Citigroup Treasury Index is comprised of US Treasury securities with an amount outstanding of at least $5 billion and a remaining maturity of at least one year.
The Citigroup High-Yield Market Index captures the performance of below-investment-grade debt issued by corporations. This index includes cash-pay and deferred-interest securities that are publicly placed, have a fixed coupon, and are nonconvertible
The Citigroup US Inflation-Linked Securities Index (ILSI)SM measures the return of bonds with fixed-rate coupon payments that adjust for inflation as measured by the Consumer Price Index (CPI).
The Rogers International Commodities Index (RICI) was developed by Jim Rogers in 1998. It represents the value of a basket of 35 commodities used in the global economy, including agricultural and energy products, metals, and minerals.
35
36

| |
| Contact Us | |
| americancentury.com | |
| Automated Information Line | 1-800-345-8765 |
| Investment Professional Service Representatives | 1-800-345-6488 |
| Telecommunications Device for the Deaf | 1-800-634-4113 |
| American Century Variable Portfolios II, Inc. | |
| Investment Advisor: | |
| American Century Investment Management, Inc. | |
| Kansas City, Missouri | |
This report and the statements it contains are submitted for the general
information of our shareholders. The report is not authorized for distribution to
prospective investors unless preceded or accompanied by an effective prospectus.
American Century Investment Services, Inc., Distributor
©2009 American Century Proprietary Holdings, Inc. All rights reserved.
0908
CL-SAN-66146
ITEM 2. CODE OF ETHICS.
Not applicable for semiannual report filings.
ITEM 3. AUDIT COMMITTEE FINANCIAL EXPERT.
Not applicable for semiannual report filings.
ITEM 4. PRINCIPAL ACCOUNTANT FEES AND SERVICES.
Not applicable for semiannual report filings.
ITEM 5. AUDIT COMMITTEE OF LISTED REGISTRANTS.
Not applicable.
ITEM 6. INVESTMENTS.
| (a) | The schedule of investments is included as part of the report to stockholders filed under Item 1 of this Form. |
ITEM 7. DISCLOSURE OF PROXY VOTING POLICIES AND PROCEDURES FOR CLOSED-END MANAGEMENT INVESTMENT COMPANIES.
Not applicable.
ITEM 8. PORTFOLIO MANAGERS OF CLOSED-END MANAGEMENT INVESTMENT COMPANIES.
Not applicable.
ITEM 9. PURCHASES OF EQUITY SECURITIES BY CLOSED-END MANAGEMENT INVESTMENT COMPANY AND AFFILIATED PURCHASERS.
Not applicable.
ITEM 10. SUBMISSION OF MATTERS TO A VOTE OF SECURITY HOLDERS.
During the reporting period, there were no material changes to the procedures by which shareholders may recommend nominees to the registrant’s board.
ITEM 11. CONTROLS AND PROCEDURES.
| (a) | The registrant's principal executive officer and principal financial officer have concluded that the registrant's disclosure controls and procedures (as defined in Rule 30a-3(c) under the Investment Company Act of 1940) are effective based on their evaluation of these controls and procedures as of a date within 90 days of the filing date of this report. |
| (b) | There were no changes in the registrant's internal control over financial reporting (as defined in Rule 30a-3(d) under the Investment Company Act of 1940) that occurred during the registrant's second fiscal quarter of the period covered by this report that have materially affected, or are reasonably likely to materially affect, the registrant's internal control over financial reporting. |
ITEM 12. EXHIBITS.
| (a)(1) | Not applicable for semiannual report filings. |
| (a)(2) | Separate certifications by the registrant’s principal executive officer and principal financial officer, pursuant to Section 302 of the Sarbanes-Oxley Act of 2002 and Rule 30a-2(a) under the Investment Company Act of 1940, are filed and attached hereto as EX-99.CERT. |
| (b) | A certification by the registrant’s chief executive officer and chief financial officer, pursuant to Section 906 of the Sarbanes-Oxley Act of 2002, is furnished and attached hereto as EX- 99.906CERT. |
SIGNATURES
Pursuant to the requirements of the Securities Exchange Act of 1934 and the Investment Company Act of 1940, the registrant has duly caused this report to be signed on its behalf by the undersigned, thereunto duly authorized.
| Registrant: | American Century Variable Portfolios II, Inc. | |
| | | | |
| | | | |
| By: | /s/ Jonathan S. Thomas | |
| | Name: | Jonathan S. Thomas | |
| | Title: | President | |
| | | | |
| Date: | August 17, 2009 | |
| | | |
Pursuant to the requirements of the Securities Exchange Act of 1934 and the Investment Company Act of 1940, this report has been signed below by the following persons on behalf of the registrant and in the capacities and on the dates indicated.
| By: | /s/ Jonathan S. Thomas | |
| | Name: | Jonathan S. Thomas | |
| | Title: | President | |
| | | (principal executive officer) | |
| | | | |
| | | | |
| Date: | August 17, 2009 | |
| By: | /s/ Robert J. Leach | |
| | Name: | Robert J. Leach | |
| | Title: | Vice President, Treasurer, and | |
| | | Chief Financial Officer | |
| | | (principal financial officer) | |
| | | | |
| Date: | August 17, 2009 | |