| | |
| UNITED STATES |
| SECURITIES AND EXCHANGE COMMISSION |
|
| Washington, D.C. 20549 |
| FORM N-CSR |
|
| CERTIFIED SHAREHOLDER REPORT OF REGISTERED |
| MANAGEMENT INVESTMENT COMPANIES |
|
| Investment Company Act file number | 811-10155 |
| |
| AMERICAN CENTURY VARIABLE PORTFOLIOS II, INC. |
| (Exact name of registrant as specified in charter) |
| |
| 4500 MAIN STREET, KANSAS CITY, MISSOURI | 64111 |
| (Address of principal executive offices) | (Zip Code) |
| |
| CHARLES A. ETHERINGTON |
| 4500 MAIN STREET, KANSAS CITY, MISSOURI 64111 |
| (Name and address of agent for service) |
|
| Registrant’s telephone number, including area code: | 816-531-5575 |
| |
| Date of fiscal year end: | 12-31 |
| |
| Date of reporting period: | 06-30-2010 |
| |
| |
| |
| | |
| |
| ITEM 1. REPORTS TO STOCKHOLDERS. |
|
| Semiannual Report | |
| June 30, 2010 | |

|
| American Century Investments® |
VP Inflation Protection Fund
| |
| Market Perspective | 2 |
| U.S. Fixed-Income Total Returns | 2 |
| |
| VP Inflation Protection | |
| |
| Performance | 3 |
| Portfolio Commentary | 5 |
| Asset Allocation | 7 |
| Portfolio at a Glance | 7 |
| |
| Shareholder Fee Example | 8 |
| |
| Financial Statements | |
| |
| Schedule of Investments | 9 |
| Statement of Assets and Liabilities | 17 |
| Statement of Operations | 18 |
| Statement of Changes in Net Assets | 19 |
| Notes to Financial Statements | 20 |
| Financial Highlights | 27 |
| |
| Other Information | |
| |
| Proxy Voting Results | 29 |
| Board Approval of Management Agreements | 30 |
| Additional Information | 36 |
| Index Definitions | 37 |
Any opinions expressed in this report reflect those of the author as of the date of the report, and do not necessarily represent the opinions of American Century Investments or any other person in the American Century Investments organization. Any such opinions are subject to change at any time based upon market or other conditions and American Century Investments disclaims any responsibility to update such opinions. These opinions may not be relied upon as investment advice and, because investment decisions made by American Century Investments funds are based on numerous factors, may not be relied upon as an indication of trading intent on behalf of any American Century Investments fund. Security examples are used for representational purposes only and are not intended as recommendations to purchase or sell securities. Performance information for comparative indices and securities is provided to American Cent ury Investments by third party vendors. To the best of American Century Investments’ knowledge, such information is accurate at the time of printing.

By David MacEwen, Chief Investment Officer, Fixed Income
Risk Went In and Out of Favor
Changing investor risk preferences characterized the first half of 2010. Most fixed-income returns were positive during the first quarter, with the riskier “spread” (higher-yielding, non-Treasury) segments—especially high-yield corporate—significantly outperforming Treasuries. Yield-hungry investors took comfort in data suggesting the economic recovery was progressing, despite significant headwinds, including excessive debt levels, high unemployment, and a still-struggling housing market.
During the second quarter, those headwinds gathered strength, evaporating the first quarter’s optimism and blowing in fears of a double-dip recession. Deteriorating credit conditions in Europe combined with further labor-, housing- and consumer-related setbacks and a plunging U.S. stock market sent nervous investors seeking the relative safety of U.S. Treasuries. Questions about the strength of the U.S. economy also raised doubts about credit-sensitive sectors, such as corporate securities, but demand for high-quality U.S. bonds in general was so strong (and Treasury yields were so low) that the investment-grade spread sectors also participated in the rally.
TIPS Advanced Despite Subdued Inflation
In the first half of the period, the absence of near-term inflationary pressures combined with a mounting supply of U.S. Treasury securities led to lagging performance for TIPS (Treasury inflation-protected securities). But, in the second half of the period, the broad Treasury rally was strong enough for TIPS to participate and generate a positive six-month return, even as inflation concerns remained muted.
Throughout the period, prices for oil and other commodities retreated on slowing demand and a stronger U.S. dollar, particularly against the euro. Headline inflation, as measured by the 12-month change in the Consumer Price Index (CPI), was up 1.1% as of June 30, 2010. In this environment of sluggish growth and low inflation, expectations for future inflation fell significantly during the period, as indicated by the sharp drop in the 10-year TIPS breakeven rate. The breakeven rate, which measures the yield difference between 10-year TIPS and nominal Treasuries and indicates the market’s inflation expectations for the next 10 years, fell from 2.41% on December 31, 2009, to 1.84% on June 30, 2010.
| | | | |
| U.S. Fixed-Income Total Returns | | | | |
| For the six months ended June 30, 2010* | | | | |
| Barclays Capital U.S. Bond Market Indices | | | Treasury Bellwethers | |
| Corporate High-Yield | 4.51% | | 3-Month Treasury Bill | 0.06% |
| Corporate Investment-Grade | 5.79% | | 10-Year Treasury Note | 9.43% |
| TIPS (inflation-linked) | 4.41% | | *Total returns for periods less than one year are not annualized. |
| Mortgage (mortgage-backed) | 4.46% | | | |
| Agencies | 3.76% | | | |
| Treasury | 5.86% | | | |
2
| | | | | | | |
| VP Inflation Protection | | | | | |
| |
| Total Returns as of June 30, 2010 | | | | | |
| | | | | | Average Annual Returns | |
| | | Ticker | | | | Since | Inception |
| | | Symbol | 6 months(1) | 1 year | 5 years | Inception | Date |
| Class II | AIPTX | 3.42% | 8.79% | 4.47% | 4.75% | 12/31/02 |
| Barclays Capital | | | | | | |
| U.S. TIPS Index(2) | — | 4.41% | 9.52% | 4.98% | 5.92% | — |
| Citigroup US Inflation-Linked | | | | | | |
| Securities Index(3) | — | 4.43% | 9.82% | 4.98% | 5.90% | — |
| Class I | APTIX | 3.52% | 9.04% | 4.72% | 5.36% | 5/7/04 |
| (1) | Total returns for periods less than one year are not annualized. | | | | |
| (2) | In January 2010, the fund’s benchmark changed from the Citigroup US Inflation-Linked Securities Index to the Barclays Capital U.S. TIPS |
| | Index. This reflects a change in the portfolio management analytics software used by American Century Investments’ fixed-income teams. The |
| | investment process remains unchanged. | | | | | | |
| (3) | The Citigroup US Inflation-Linked Securities Index is not subject to the tax code diversification and other regulatory requirements limiting the |
| | type and amount of securities that the fund may own. | | | | | |
The performance information presented does not include charges and deductions imposed by the insurance company separate account under the variable annuity or variable life insurance contracts. The inclusion of such charges could significantly lower performance. Please refer to the insurance company separate account prospectus for a discussion of the charges related to insurance contracts.
Data presented reflect past performance. Past performance is no guarantee of future results. Current performance may be higher or lower than the performance shown. Investment return and principal value will fluctuate, and redemption value may be more or less than original cost. To obtain performance data current to the most recent month end, please call 1-800-345-6488. As interest rates rise, bond values will decline.
Unless otherwise indicated, performance reflects Class II shares; performance for other share classes will vary due to differences in fee structure. For information about other share classes available, please consult the prospectus. Data assumes reinvestment of dividends and capital gains, and none of the charts reflect the deduction of taxes that a shareholder would pay on fund distributions or the redemption of fund shares. Returns for the indices are provided for comparison. The fund’s total returns include operating expenses (such as transaction costs and management fees) that reduce returns, while the total returns of the indices do not.
3
VP Inflation Protection
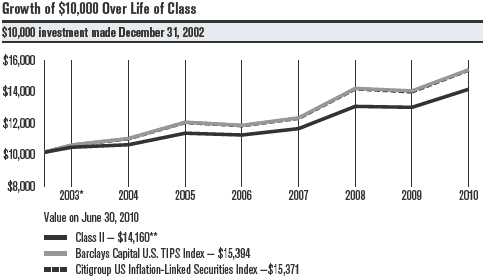
| |
| * From 12/31/02, Class II’s inception date. Not annualized. | |
| **Ending value would have been lower if distribution fees had not been waived. | |
| |
| Total Annual Fund Operating Expenses | |
| Class I | Class II |
| 0.49% | 0.74% |
The total annual fund operating expenses shown is as stated in the fund’s prospectus current as of the date of this report. The prospectus may vary from the expense ratio shown elsewhere in this report because it is based on a different time period, includes acquired fund fees and expenses, and, if applicable, does not include fee waivers or expense reimbursements.
Data presented reflect past performance. Past performance is no guarantee of future results. Current performance may be higher or lower than the performance shown. Investment return and principal value will fluctuate, and redemption value may be more or less than original cost. To obtain performance data current to the most recent month end, please call 1-800-345-6488. As interest rates rise, bond values will decline.
Unless otherwise indicated, performance reflects Class II shares; performance for other share classes will vary due to differences in fee structure. For information about other share classes available, please consult the prospectus. Data assumes reinvestment of dividends and capital gains, and none of the charts reflect the deduction of taxes that a shareholder would pay on fund distributions or the redemption of fund shares. Returns for the indices are provided for comparison. The fund’s total returns include operating expenses (such as transaction costs and management fees) that reduce returns, while the total returns of the indices do not.
4
VP Inflation Protection
Portfolio Managers: Bob Gahagan, Brian Howell, and Jim Platz
Performance Summary
VP Inflation Protection returned 3.52%* for the six months ended June 30, 2010. The portfolio’s benchmark, the Barclays Capital U.S. TIPS Index,** returned 4.41% for the same time period. Portfolio returns reflect operating expenses, while benchmark returns do not.
Performance among TIPS (Treasury inflation-protected securities) was weak early in the period, as subdued inflation stifled demand for TIPS. But, beginning in May, economic uncertainty roiled the financial markets, sending nervous investors scurrying back to so-called “safe-haven” assets, including U.S. Treasury securities. Treasury prices rose and yields plunged, with the yield on the traditional 10-year Treasury falling from 3.84% on December 31, 2009, to 2.93% on June 30, 2010. Similarly, yields on 10-year TIPS fell from 1.43% to 1.09%. In this environment, maturity spreads, or the difference in yield between short- and longer-maturity bonds, tightened, and the traditional Treasury and TIPS yield curves flattened.
TIPS benefited from the Treasury-market rally, even as inflation remained restrained. The portfolio’s underperformance relative to the benchmark was primarily due to the portfolio’s specific TIPS holdings and to a position in investment-grade corporate securities, which underperformed TIPS in the second half of the period.
Market Backdrop
Oil prices, which ended 2009 at $79 a barrel, declined slightly to $76 on June 30, 2010. Other commodity prices declined more sharply, as indicated by the -9.28% six-month decline of the Rogers International Commodities Index, a measure of energy, agriculture, and metals products.
Falling commodity prices and weak global economic fundamentals led to lower inflation. Headline inflation, as measured by the month-to-month change in the Consumer Price Index (CPI), was -0.1% in June, marking the third-consecutive monthly decline in the index.
This climate led to tumbling inflation expectations. The 10-year breakeven rate, which declined 0.57 of a percentage point to end the period at 1.84 percentage points, reflects the inflation rate required for TIPS to outperform nominal Treasuries in the next 10 years. The current rate suggests TIPS offer long-term value (it will require a higher inflation rate than 1.84% for TIPS to outperform traditional Treasuries), especially given the potential for higher inflation to emerge due to the extraordinary amounts of monetary and fiscal stimulus still working through the financial system.
|
| * All fund returns referenced in this commentary are for Class I shares. Total returns for periods less than one year are not annualized. |
| **As of January 1, 2010, the portfolio’s benchmark changed from the Citigroup US Inflation-Linked Securities Index to the Barclays Capital U.S. |
| TIPS Index to reflect a change in the portfolio management analytics software used by American Century Investments’ fixed-income teams. The |
| investment process remains unchanged. |
5
VP Inflation Protection
Portfolio Positioning
The portfolio was as fully invested in TIPS as allowed by IRS portfolio diversification regulations for insurance products (55% of the portfolio). The remainder of the portfolio included non-dollar inflation-linked bonds and investment-grade spread (non-Treasury) sectors.
Within the portfolio’s TIPS allocation was an overweight to “high accretion” TIPS, or bonds with larger accrued inflation adjustments built into them. These securities underperformed lower accretion bonds due to lower-than-expected inflation reports.
In an effort to maintain maximum inflation protection without investing further in TIPS, the investment team used inflation “swaps” to synthetically create an inflation-linked “overlay” for the spread securities. Inflation swaps are fixed-maturity instruments, negotiated through a counterparty (investment bank), that return the rate of inflation (CPI). All swaps bear counterparty credit risk, but American Century Investments applies stringent controls and oversight with regard to counterparty credit risk. The portfolio’s swaps underperformed, primarily because the investment team used corporate securities, which lagged late in the period, as the counterparts to the swap agreements.
In a similar vein, the portfolio held a modest weighting in non-U.S.-dollar inflation-linked securities to help maintain maximum inflation protection without investing further in TIPS. The investment team hedged the currency risk associated with these positions by purchasing foreign currency forwards.
The investment team also continued to position the portfolio for a flattening of the yield curve. The team believes this strategy may provide longer-term value, as maturity spreads continue to tighten, either due to lower long-term yields or rising short-term yields.
Outlook
Despite the absence of near-term inflationary pressures, fiscal and monetary stimulus eventually may lead to significantly higher inflation and a weaker dollar than are currently priced into the market. These factors, combined with a lower-than-historical-average breakeven rate, suggest TIPS may represent good long-term value. We believe the combination of TIPS, inflation swaps, global inflation-linked securities, and spread securities will enhance the portfolio’s yield and outperform TIPS over time.
6
| |
| VP Inflation Protection | |
| |
| Asset Allocation | |
| | % of net assets |
| | as of 6/30/10 |
| U.S. Treasury Securities and Equivalents | 55.6% |
| Sovereign Governments & Agencies | 18.0% |
| U.S. Government Agency Securities and Equivalents | 10.2% |
| Corporate Bonds | 10.0% |
| Commercial Mortgage-Backed Securities | 2.8% |
| Municipal Securities | 1.1% |
| Collateralized Mortgage Obligations | 1.0% |
| U.S. Government Agency Mortgage-Backed Securities | 0.8% |
| Asset-Backed Securities | 0.4% |
| Temporary Cash Investments | 0.6% |
| Other Assets and Liabilities | (0.5)% |
| |
| Portfolio at a Glance | |
| | As of 6/30/10 |
| 30-Day SEC Yield | |
| Class I | 2.76% |
| Class II | 2.51% |
| Weighted Average Life | 9.0 years |
| Average Duration (effective) | 4.6 years |
7
|
| Shareholder Fee Example (Unaudited) |
Fund shareholders may incur two types of costs: (1) transaction costs, including sales charges (loads) on purchase payments and redemption/ exchange fees; and (2) ongoing costs, including management fees; distribution and service (12b-1) fees; and other fund expenses. This example is intended to help you understand your ongoing costs (in dollars) of investing in your fund and to compare these costs with the ongoing cost of investing in other mutual funds.
The example is based on an investment of $1,000 made at the beginning of the period and held for the entire period from January 1, 2010 to June 30, 2010.
Actual Expenses
The table provides information about actual account values and actual expenses for each class. You may use the information, together with the amount you invested, to estimate the expenses that you paid over the period. First, identify the share class you own. Then simply divide your account value by $1,000 (for example, an $8,600 account value divided by $1,000 = 8.6), then multiply the result by the number under the heading “Expenses Paid During Period” to estimate the expenses you paid on your account during this period.
Hypothetical Example for Comparison Purposes
The table also provides information about hypothetical account values and hypothetical expenses based on the actual expense ratio of each class of your fund and an assumed rate of return of 5% per year before expenses, which is not the actual return of a fund’s share class. The hypothetical account values and expenses may not be used to estimate the actual ending account balance or expenses you paid for the period. You may use this information to compare the ongoing costs of investing in your fund and other funds. To do so, compare this 5% hypothetical example with the 5% hypothetical examples that appear in the shareholder reports of the other funds.
Please note that the expenses shown in the table are meant to highlight your ongoing costs only and do not reflect any transactional costs, such as sales charges (loads) or redemption/exchange fees. Therefore, the table is useful in comparing ongoing costs only, and will not help you determine the relative total costs of owning different funds. In addition, if these transactional costs were included, your costs would have been higher.
| | | | |
| | Beginning | Ending | Expenses Paid | |
| | Account Value | Account Value | During Period* | Annualized |
| | 1/1/10 | 6/30/10 | 1/1/10 - 6/30/10 | Expense Ratio* |
| Actual | | | | |
| Class I | $1,000 | $1,035.20 | $2.47 | 0.49% |
| Class II | $1,000 | $1,034.20 | $3.73 | 0.74% |
| Hypothetical | | | | |
| Class I | $1,000 | $1,022.36 | $2.46 | 0.49% |
| Class II | $1,000 | $1,021.12 | $3.71 | 0.74% |
| *Expenses are equal to the class’s annualized expense ratio listed in the table above, multiplied by the average account value over the period, |
| multiplied by 181, the number of days in the most recent fiscal half-year, divided by 365, to reflect the one-half year period. |
8
| | | | | | | |
| VP Inflation Protection | | | | | | |
| |
| JUNE 30, 2010 (UNAUDITED) | | | | | | | |
| | Principal | | | | | Principal | |
| | Amount | Value | | | | Amount | Value |
| U.S. Treasury Securities and | | | U.S. Treasury Inflation | | |
| | | | | Indexed Notes, | | | |
| Equivalents — 55.6% | | | | 2.00%, 7/15/14(1) | | $ 17,464,207 | $ 18,757,659 |
| FIXED-RATE U.S. TREASURY SECURITIES | | | U.S. Treasury Inflation | | |
| AND EQUIVALENTS — 55.2% | | | | Indexed Notes, | | | |
| AID (Egypt), | | | | 1.625%, 1/15/15(1) | | 39,504,204 | 41,754,087 |
| 4.45%, 9/15/15(1) | $ 1,500,000 | $ 1,655,065 | | U.S. Treasury Inflation | | |
| U.S. Treasury Inflation | | | | Indexed Notes, | | | |
| Indexed Bonds, | | | | 1.875%, 7/15/15(1) | | 25,778,630 | 27,653,613 |
| 2.375%, 1/15/25(1) | 60,372,954 | 67,122,469 | | U.S. Treasury Inflation | | |
| U.S. Treasury Inflation | | | | Indexed Notes, | | | |
| Indexed Bonds, | | | | 2.00%, 1/15/16(1) | | 33,117,062 | 35,766,426 |
| 2.00%, 1/15/26(1) | 52,174,475 | 55,296,804 | | U.S. Treasury Inflation | | |
| U.S. Treasury Inflation | | | | Indexed Notes, | | | |
| Indexed Bonds, | | | | 2.50%, 7/15/16(1) | | 29,686,525 | 33,074,975 |
| 2.375%, 1/15/27(1) | 37,728,645 | 41,884,682 | | U.S. Treasury Inflation | | |
| U.S. Treasury Inflation | | | | Indexed Notes, | | | |
| Indexed Bonds, | | | | 2.375%, 1/15/17(1) | | 21,512,895 | 23,771,749 |
| 1.75%, 1/15/28(1) | 26,359,158 | 26,803,969 | | U.S. Treasury Inflation | | |
| U.S. Treasury Inflation | | | | Indexed Notes, | | | |
| Indexed Bonds, | | | | 2.625%, 7/15/17(1) | | 15,283,816 | 17,257,584 |
| 3.625%, 4/15/28(1) | 29,653,800 | 38,464,211 | | U.S. Treasury Inflation | | |
| U.S. Treasury Inflation | | | | Indexed Notes, | | | |
| Indexed Bonds, | | | | 1.625%, 1/15/18(1) | | 20,240,254 | 21,353,467 |
| 2.50%, 1/15/29(1) | 18,582,003 | 21,068,795 | | U.S. Treasury Inflation | | |
| U.S. Treasury Inflation | | | | Indexed Notes, | | | |
| Indexed Bonds, | | | | 1.375%, 7/15/18(1) | | 5,054,950 | 5,245,693 |
| 3.875%, 4/15/29(1) | 21,370,746 | 28,753,676 | | U.S. Treasury Inflation | | |
| U.S. Treasury Inflation | | | | Indexed Notes, | | | |
| Indexed Bonds, | | | | 2.125%, 1/15/19(1) | | 1,776,968 | 1,942,309 |
| 3.375%, 4/15/32(1) | 8,886,172 | 11,599,227 | | U.S. Treasury Inflation | | |
| U.S. Treasury Inflation | | | | Indexed Notes, | | | |
| Indexed Bonds, | | | | 1.875%, 7/15/19(1) | | 7,147,210 | 7,671,522 |
| 2.125%, 2/15/40(1) | 16,541,860 | 18,193,465 | | U.S. Treasury Inflation | | |
| U.S. Treasury Inflation | | | | Indexed Notes, | | | |
| Indexed Notes, | | | | 1.375%, 1/15/20(1) | | 11,694,540 | 11,995,125 |
| 3.50%, 1/15/11(1) | 20,292,120 | 20,644,067 | | | | | 663,067,293 |
| U.S. Treasury Inflation | | | | ZERO-COUPON U.S. TREASURY SECURITIES | |
| Indexed Notes, | | | | AND EQUIVALENTS — 0.4% | | |
| 3.375%, 1/15/12(1) | 22,191,943 | 23,407,307 | | AID (Israel), | | | |
| U.S. Treasury Inflation | | | | 4.70%, 5/1/15(1)(2) | | 5,000,000 | 4,498,240 |
| Indexed Notes, | | | | TOTAL U.S. TREASURY SECURITIES | |
| 2.00%, 4/15/12(1) | 25,193,508 | 26,120,553 | | AND EQUIVALENTS | | |
| U.S. Treasury Inflation | | | | (Cost $619,927,459) | | | 667,565,533 |
| Indexed Notes, | | | | | | | |
| 3.00%, 7/15/12(1) | 10,912,590 | 11,619,355 | | Sovereign Governments | |
| U.S. Treasury Inflation | | | | & Agencies — 18.0% | | |
| Indexed Notes, | | | | CANADA — 1.8% | | | |
| 1.875%, 7/15/13(1) | 2,374,000 | 2,513,472 | | | | | |
| | | | | Government | | | |
| U.S. Treasury Inflation | | | | of Canada, | | | |
| Indexed Notes, | | | | 4.25%, 12/1/26 | CAD | 16,508,125 | 22,000,289 |
| 2.00%, 1/15/14(1) | 20,329,160 | 21,675,967 | | | | | |
9
| | | | | | | |
| VP Inflation Protection | | | | | |
| |
| | | Principal | | | | Principal | |
| | | Amount | Value | | | Amount | Value |
| FRANCE — 2.4% | | | | | FNMA, 3.00%, 9/16/14(1) | $23,000,000 | $ 24,169,665 |
| Government | | | | | FNMA, 5.625%, 7/15/37(1) | 3,410,000 | 4,009,468 |
| of France, | | | | | TVA Inflation Index Notes, | | |
| 2.25%, 7/25/20 | EUR | 21,323,049 | $ 28,467,835 | | 4.875%, 12/15/16(1) | 1,750,000 | 1,974,744 |
| GERMANY — 2.5% | | | | | TVA Inflation Index Notes, | | |
| German Federal | | | | | 4.50%, 4/1/18(1) | 3,550,000 | 3,933,936 |
| Republic Inflation | | | | | | | 73,331,736 |
| Linked, | | | | | | | |
| 2.25%, 4/15/13 | EUR | 19,576,935 | 25,590,366 | | GOVERNMENT-BACKED | | |
| | | | | | CORPORATE BONDS(5) — 4.1% | |
| KfW, 4.75%, 5/15/12(1) | | 5,000,000 | 5,342,580 | | | | |
| | | | | | Ally Financial, Inc., | | |
| | | | 30,932,946 | | 1.75%, 10/30/12(1) | 10,000,000 | 10,181,590 |
| ITALY — 2.1% | | | | | Bank of America Corp., | | |
| Republic of Italy, | | | | | 3.125%, 6/15/12(1) | 8,500,000 | 8,882,687 |
| 2.35%, 9/15/19 | EUR | 20,957,552 | 25,246,624 | | Citigroup Funding, Inc., | | |
| JAPAN — 1.9% | | | | | 1.875%, 10/22/12 | 16,000,000 | 16,349,200 |
| Government of Japan | | | | | General Electric Capital | | |
| CPI Linked Bond, | | | | | Corp., 2.20%, 6/8/12(1) | 8,300,000 | 8,524,648 |
| 1.10%, 12/10/16 | JPY | 2,076,900,000 | 23,015,923 | | Goldman Sachs Group, Inc. | | |
| NORWAY — 0.2% | | | | | (The), 3.25%, 6/15/12(1) | 5,200,000 | 5,448,674 |
| Government | | | | | | | 49,386,799 |
| of Norway, | | | | | TOTAL U.S. GOVERNMENT AGENCY | |
| 6.00%, 5/16/11 | NOK | 12,170,000 | 1,930,669 | | SECURITIES AND EQUIVALENTS | |
| UNITED KINGDOM — 7.1% | | | | (Cost $116,330,123) | | 122,718,535 |
| Government of | | | | | Corporate Bonds — 10.0% | |
| United Kingdom | | | | | | | |
| Inflation Linked, | | | | | AEROSPACE & DEFENSE — 0.2% | |
| 2.50%, 8/16/13 | GBP | 9,015,000 | 37,346,050 | | L-3 Communications Corp., | | |
| Government of | | | | | 5.20%, 10/15/19(1) | 500,000 | 522,985 |
| United Kingdom | | | | | United Technologies Corp., | | |
| Inflation Linked, | | | | | 5.70%, 4/15/40(1) | 1,140,000 | 1,279,368 |
| 2.50%, 7/26/16 | GBP | 5,200,000 | 24,078,545 | | | | 1,802,353 |
| Government of | | | | | BEVERAGES — 0.6% | | |
| United Kingdom | | | | | | | |
| Inflation Linked, | | | | | Anheuser-Busch InBev | | |
| 1.25%, 11/22/17 | GBP | 14,371,500 | 23,304,789 | | Worldwide, Inc., | | |
| | | | | | 6.875%, 11/15/19(3) | 1,430,000 | 1,653,230 |
| | | | 84,729,384 | | | | |
| | | | | | Coca-Cola Co. (The), | | |
| TOTAL SOVEREIGN GOVERNMENTS | | | 3.625%, 3/15/14(1) | 1,220,000 | 1,304,791 |
| & AGENCIES | | | | | | | |
| (Cost $220,135,237) | | | 216,323,670 | | Coca-Cola Enterprises, Inc., | | |
| | | | | | 4.25%, 3/1/15(1) | 1,150,000 | 1,245,476 |
| U.S. Government Agency Securities | | Dr Pepper Snapple Group, | | |
| and Equivalents — 10.2% | | | Inc., 6.82%, 5/1/18(1) | 1,450,000 | 1,733,133 |
| FIXED-RATE U.S. GOVERNMENT AGENCY | | | PepsiCo, Inc., | | |
| SECURITIES — 6.1% | | | | | 3.10%, 1/15/15(1) | 1,210,000 | 1,261,701 |
| FAMCA, 5.50%, 7/15/11(1)(3) | $3,750,000 | 3,941,430 | | | | 7,198,331 |
| FAMCA, 5.40%, 10/14/11(1) | 1,000,000 | 1,061,601 | | BIOTECHNOLOGY — 0.1% | | |
| FAMCA, 6.71%, 7/28/14(1) | 3,974,000 | 4,768,434 | | Amgen, Inc., | | |
| | | | | | 5.85%, 6/1/17(1) | 1,020,000 | 1,184,724 |
| FFCB, 4.875%, 12/16/15(1) | 2,000,000 | 2,262,510 | | | | |
| | | | | | CAPITAL MARKETS — 0.7% | | |
| FFCB, 4.875%, 1/17/17(1) | | 5,000,000 | 5,663,850 | | Credit Suisse (New York), | | |
| FHLB, 4.875%, 5/17/17(1) | 1,030,000 | 1,175,515 | | 5.50%, 5/1/14(1) | 1,720,000 | 1,882,612 |
| FHLMC, 5.00%, 2/16/17(1) | 6,900,000 | 7,891,061 | | Credit Suisse (New York), | | |
| | | | | | 5.30%, 8/13/19(1) | 1,370,000 | 1,455,961 |
| FHLMC, 4.875%, 6/13/18(1) | 11,000,000 | 12,479,522 | | | | |
10
| | | | | | |
| VP Inflation Protection | | | | | |
| |
| | Principal | | | | Principal | |
| | Amount | Value | | | Amount | Value |
| Credit Suisse AG, 5.40%, | | | | DIVERSIFIED TELECOMMUNICATION | |
| 1/14/20(1) | $ 360,000 | $ 358,858 | | SERVICES — 0.8% | | |
| Goldman Sachs Group, Inc. | | | | AT&T, Inc., | | |
| (The), 7.50%, 2/15/19(1) | 1,610,000 | 1,803,686 | | 6.70%, 11/15/13(1) | $ 1,000,000 | $ 1,155,348 |
| Goldman Sachs Group, Inc. | | | | AT&T, Inc., 5.10%, 9/15/14(1) | 770,000 | 855,332 |
| (The), 5.375%, 3/15/20(1) | 660,000 | 653,863 | | AT&T, Inc., | | |
| Morgan Stanley, | | | | 6.55%, 2/15/39(1) | 1,220,000 | 1,374,203 |
| 4.20%, 11/20/14(1) | 1,250,000 | 1,236,005 | | Cellco Partnership/Verizon | | |
| Morgan Stanley, | | | | Wireless Capital LLC, | | |
| 7.30%, 5/13/19(1) | 1,360,000 | 1,465,933 | | 5.55%, 2/1/14(1) | 1,160,000 | 1,302,019 |
| | | 8,856,918 | | Cellco Partnership/Verizon | | |
| CHEMICALS — 0.1% | | | | Wireless Capital LLC, | | |
| | | | | 8.50%, 11/15/18(1) | 720,000 | 938,353 |
| Dow Chemical Co. (The), | | | | | | |
| 8.55%, 5/15/19(1) | 1,080,000 | 1,325,046 | | Deutsche Telekom | | |
| COMMERCIAL BANKS — 1.2% | | | International Finance BV, | | |
| | | | | 5.25%, 7/22/13(1) | 350,000 | 376,954 |
| International Bank | | | | | | |
| for Reconstruction | | | | Deutsche Telekom | | |
| & Development, | | | | International Finance BV, | | |
| | | | | 6.75%, 8/20/18(1) | 1,470,000 | 1,707,502 |
| 7.625%, 1/19/23(1) | 9,500,000 | 13,311,970 | | | | |
| PNC Bank N.A., | | | | Telecom Italia Capital SA, | | |
| | | | | 6.18%, 6/18/14(1) | 1,800,000 | 1,884,087 |
| 6.00%, 12/7/17(1) | 500,000 | 546,411 | | | | |
| PNC Funding Corp., | | | | | | 9,593,798 |
| 3.625%, 2/8/15(1) | 370,000 | 381,423 | | ELECTRIC UTILITIES — 0.3% | | |
| | | 14,239,804 | | Duke Energy Ohio, Inc., | | |
| | | | | 2.10%, 6/15/13(1) | 730,000 | 742,513 |
| COMMUNICATIONS EQUIPMENT — 0.1% | | | | | |
| | | | | EDF SA, 4.60%, 1/27/20(1)(3) | 1,190,000 | 1,225,709 |
| Cisco Systems, Inc., | | | | | | |
| 5.90%, 2/15/39(1) | 1,350,000 | 1,508,252 | | FirstEnergy Solutions Corp., | | |
| | | | | 6.05%, 8/15/21(1) | 1,000,000 | 1,023,069 |
| CONSUMER FINANCE — 0.4% | | | | | |
| General Electric Capital | | | | | | 2,991,291 |
| Corp., 3.75%, 11/14/14(1) | 1,790,000 | 1,833,705 | | FOOD & STAPLES RETAILING — 0.2% | |
| General Electric Capital | | | | CVS Caremark Corp., | | |
| Corp., 6.00%, 8/7/19(1) | 1,000,000 | 1,085,248 | | 6.60%, 3/15/19(1) | 1,730,000 | 2,017,945 |
| General Electric Capital | | | | Wal-Mart Stores, Inc., | | |
| Corp., 5.50%, 1/8/20 | 750,000 | 794,626 | | 2.875%, 4/1/15(1) | 680,000 | 706,373 |
| SLM Corp., VRN, 4.46%, | | | | | | 2,724,318 |
| 7/1/10, resets monthly off | | | | FOOD PRODUCTS — 0.3% | | |
| the Consumer Price Index | | | | Kraft Foods, Inc., | | |
| Year over Year plus 2.15% | | | | 5.375%, 2/10/20(1) | 800,000 | 859,505 |
| with no caps, Final | | | | | | |
| Maturity 2/1/14(1) | 490,000 | 416,084 | | Kraft Foods, Inc., | | |
| | | | | 6.50%, 2/9/40(1) | 1,780,000 | 2,000,348 |
| | | 4,129,663 | | | | |
| | | | | Mead Johnson Nutrition Co., | | |
| DIVERSIFIED FINANCIAL SERVICES — 0.4% | | | 5.90%, 11/1/39(1)(3) | 500,000 | 536,930 |
| Bank of America Corp., | | | | | | 3,396,783 |
| 6.50%, 8/1/16(1) | 1,780,000 | 1,929,753 | | | | |
| Citigroup, Inc., | | | | HEALTH CARE EQUIPMENT & SUPPLIES — 0.2% |
| 6.01%, 1/15/15(1) | 1,480,000 | 1,554,494 | | Medtronic, Inc., | | |
| | | | | 3.00%, 3/15/15(1) | 2,030,000 | 2,106,117 |
| CME Group Index Services | | | | | | |
| LLC, 4.40%, 3/15/18(1)(3) | 760,000 | 776,214 | | Stryker Corp., | | |
| | | | | 3.00%, 1/15/15(1) | 550,000 | 568,730 |
| | | 4,260,461 | | | | |
| | | | | | | 2,674,847 |
11
| | | | | | |
| VP Inflation Protection | | | | | |
| |
| | Principal | | | | Principal | |
| | Amount | Value | | | Amount | Value |
| HOTELS, RESTAURANTS & LEISURE — 0.1% | | | METALS & MINING — 0.4% | | |
| Yum! Brands, Inc., | | | | Barrick Gold Corp., | | |
| 5.30%, 9/15/19(1) | $ 1,300,000 | $ 1,401,347 | | 6.95%, 4/1/19 | $ 1,770,000 | $ 2,127,756 |
| INDUSTRIAL CONGLOMERATES — 0.2% | | | Newmont Mining Corp., | | |
| General Electric Co., | | | | 6.25%, 10/1/39(1) | 2,000,000 | 2,193,370 |
| 5.00%, 2/1/13(1) | 1,000,000 | 1,073,265 | | Rio Tinto Finance USA Ltd., | | |
| General Electric Co., | | | | 5.875%, 7/15/13(1) | 750,000 | 822,565 |
| 5.25%, 12/6/17(1) | 1,100,000 | 1,198,736 | | | | 5,143,691 |
| | | 2,272,001 | | MULTI-UTILITIES — 0.5% | | |
| INSURANCE — 0.1% | | | | Dominion Resources, Inc., | | |
| John Hancock Life | | | | 6.40%, 6/15/18(1) | 1,200,000 | 1,392,938 |
| Insurance Co., VRN, 3.86%, | | | | Pacific Gas & Electric Co., | | |
| 7/15/10, resets monthly off | | | | 6.25%, 12/1/13(1) | 1,000,000 | 1,137,272 |
| the Consumer Price Index | | | | Pacific Gas & Electric Co., | | |
| Year over Year plus 1.62% | | | | 5.80%, 3/1/37(1) | 1,790,000 | 1,956,694 |
| with no caps, Final | | | | PG&E Corp., 5.75%, 4/1/14(1) | 1,100,000 | 1,220,074 |
| Maturity 11/15/10(1) | 179,000 | 178,778 | | | | |
| Prudential Financial, Inc., | | | | Sempra Energy, | | |
| VRN, 4.31%, 7/1/10, resets | | | | 6.50%, 6/1/16(1) | 570,000 | 655,214 |
| monthly off the Consumer | | | | | | 6,362,192 |
| Price Index Year over Year | | | | OIL, GAS & CONSUMABLE FUELS — 1.1% | |
| plus 2.00% with no caps, | | | | Chevron Corp., | | |
| Final Maturity 11/2/20(1) | 303,000 | 299,906 | | | | |
| | | | | 3.95%, 3/3/14 | 1,220,000 | 1,308,986 |
| Prudential Financial, Inc., | | | | ConocoPhillips, | | |
| 2.75%, 1/14/13(1) | 500,000 | 502,869 | | | | |
| | | | | 4.75%, 2/1/14(1) | 3,060,000 | 3,368,261 |
| | | 981,553 | | Enterprise Products | | |
| MACHINERY — 0.1% | | | | Operating LLC, | | |
| Deere & Co., | | | | 4.60%, 8/1/12(1) | 2,170,000 | 2,271,122 |
| 5.375%, 10/16/29(1) | 750,000 | 823,213 | | Enterprise Products | | |
| MEDIA — 0.7% | | | | Operating LLC, | | |
| Comcast Corp., | | | | 3.70%, 6/1/15(1) | 750,000 | 759,884 |
| 5.90%, 3/15/16(1) | 800,000 | 903,102 | | Enterprise Products | | |
| DIRECTV Holdings LLC, | | | | Operating LLC, | | |
| 3.55%, 3/15/15(1) | 1,150,000 | 1,159,371 | | 6.45%, 9/1/40(1) | 700,000 | 739,131 |
| DirecTV Holdings LLC/ | | | | Nexen, Inc., | | |
| DirecTV Financing Co., Inc., | | | | 6.20%, 7/30/19(1) | 805,000 | 906,254 |
| 4.75%, 10/1/14(1) | 620,000 | 657,508 | | Shell International Finance | | |
| News America, Inc., | | | | BV, 4.30%, 9/22/19(1) | 1,260,000 | 1,304,053 |
| 6.90%, 8/15/39(1) | 1,130,000 | 1,302,979 | | Talisman Energy, Inc., | | |
| Time Warner Cable, Inc., | | | | 7.75%, 6/1/19(1) | 600,000 | 738,486 |
| 5.40%, 7/2/12(1) | 500,000 | 534,423 | | Williams Partners LP, | | |
| Time Warner Cable, Inc., | | | | 5.25%, 3/15/20(1)(3) | 490,000 | 502,499 |
| 8.25%, 2/14/14(1) | 670,000 | 792,854 | | XTO Energy, Inc., | | |
| Time Warner Cable, Inc., | | | | 6.50%, 12/15/18(1) | 860,000 | 1,046,087 |
| 6.75%, 7/1/18(1) | 1,700,000 | 1,956,064 | | | | 12,944,763 |
| Time Warner, Inc., | | | | PAPER & FOREST PRODUCTS — 0.2% | |
| 4.875%, 3/15/20(1) | 1,150,000 | 1,189,439 | | International Paper Co., | | |
| | | 8,495,740 | | 9.375%, 5/15/19(1) | 750,000 | 970,865 |
| | | | | International Paper Co., | | |
| | | | | 7.30%, 11/15/39(1) | 750,000 | 830,756 |
| | | | | | | 1,801,621 |
12
| | | | | | |
| VP Inflation Protection | | | | | |
| |
| | Principal | | | | Principal | |
| | Amount | Value | | | Amount | Value |
| PHARMACEUTICALS — 0.4% | | | | LB-UBS Commercial | | |
| Abbott Laboratories, | | | | Mortgage Trust, Series | | |
| 2.70%, 5/27/15(1) | $ 580,000 | $ 594,051 | | 2003 C3, Class A3 SEQ, | | |
| | | | | 3.85%, 5/15/27(1) | $ 3,500,834 | $ 3,582,204 |
| Abbott Laboratories, | | | | | | |
| 5.30%, 5/27/40(1) | 560,000 | 590,836 | | LB-UBS Commercial | | |
| | | | | Mortgage Trust, Series | | |
| Pfizer, Inc., 6.20%, | | | | 2005 C2, Class A2 SEQ, | | |
| 3/15/19(1) | 1,220,000 | 1,453,353 | | | | |
| | | | | 4.82%, 4/15/30(1) | 2,521,345 | 2,521,345 |
| Pfizer, Inc., 7.20%, | | | | LB-UBS Commercial | | |
| 3/15/39(1) | 1,000,000 | 1,321,057 | | | | |
| | | | | Mortgage Trust, Series | | |
| Roche Holdings, Inc., | | | | 2005 C3, Class A3 SEQ, | | |
| 6.00%, 3/1/19(1)(3) | 1,070,000 | 1,249,450 | | 4.65%, 7/15/30(1) | 2,590,000 | 2,650,653 |
| | | 5,208,747 | | Lehman Brothers Floating | | |
| REAL ESTATE INVESTMENT TRUSTS (REITs)(4) | | Rate Commercial Mortgage | | |
| ProLogis, | | | | Trust, Series 2007 LLFA, | | |
| 7.375%, 10/30/19(1) | 500,000 | 490,823 | | Class A1, VRN, 0.65%, | | |
| | | | | 7/15/10, resets monthly off | | |
| ROAD & RAIL — 0.1% | | | | the 1-month LIBOR plus | | |
| Union Pacific Corp., | | | | 0.30% with no caps, Final | | |
| 7.875%, 1/15/19(1) | 1,120,000 | 1,429,135 | | Maturity 6/15/22(1)(3) | 5,207,605 | 4,810,100 |
| SOFTWARE — 0.2% | | | | Wachovia Bank Commercial | | |
| Oracle Corp., | | | | Mortgage Trust, Series | | |
| 5.75%, 4/15/18(1) | 1,600,000 | 1,856,424 | | 2005 C20, Class A6A, VRN, | | |
| | | | | 5.11%, 7/1/10(1) | 4,800,000 | 4,987,924 |
| TOBACCO — 0.2% | | | | | | |
| | | | | Wachovia Bank Commercial | | |
| Altria Group, Inc., | | | | Mortgage Trust, Series | | |
| 9.25%, 8/6/19(1) | 2,190,000 | 2,739,552 | | | | |
| | | | | 2006 C23, Class A4, VRN, | | |
| WIRELESS TELECOMMUNICATION SERVICES — 0.1% | | 5.42%, 7/1/10(1) | 5,700,000 | 5,953,758 |
| America Movil SAB de CV, | | | | TOTAL COMMERCIAL | | |
| 5.00%, 3/30/20(1)(3) | 450,000 | 467,642 | | MORTGAGE-BACKED SECURITIES | |
| Vodafone Group plc, | | | | (Cost $33,480,575) | | 33,197,877 |
| 5.45%, 6/10/19(1) | 800,000 | 858,689 | | | | |
| | | 1,326,331 | | Municipal Securities — 1.1% | |
| | | | | California GO, (Building | | |
| TOTAL CORPORATE BONDS | | | | Bonds), 7.55%, 4/1/39(1) | 700,000 | 765,807 |
| (Cost $110,149,340) | | 119,163,722 | | | | |
| | | | | California State Department | | |
| Commercial Mortgage-Backed | | | of Water Resources Power | | |
| Securities(6) — 2.8% | | | | Rev., Series 2010 L, | | |
| | | | | 5.00%, 5/1/20(1) | 9,350,000 | 10,639,178 |
| Credit Suisse Mortgage | | | | | | |
| Capital Certificates, Series | | | | Los Angeles Department | | |
| 2007 TF2A, Class A1, | | | | of Water & Power Rev., | | |
| VRN, 0.53%, 7/15/10, | | | | (Building Bonds), | | |
| | | | | 5.72%, 7/1/39(1) | 320,000 | 323,818 |
| resets monthly off the | | | | | | |
| 1-month LIBOR plus 0.18% | | | | New York State Dormitory | | |
| with no caps, Final | | | | Auth. Rev., (Building Bonds), | | |
| Maturity 4/15/22(1)(3) | 3,454,752 | 2,993,680 | | 5.63%, 3/15/39(1) | 370,000 | 382,865 |
| GS Mortgage Securities | | | | Texas GO, (Building Bonds), | | |
| Corp. II, Series 2005 | | | | 5.52%, 4/1/39(1) | 690,000 | 750,720 |
| GG4, Class A4A SEQ, | | | | TOTAL MUNICIPAL SECURITIES | |
| 4.75%, 7/10/39(1) | 5,500,000 | 5,698,213 | | (Cost $12,504,434) | | 12,862,388 |
13
| | | | | | | |
| VP Inflation Protection | | | | | | |
| |
| | Principal | | | | Principal | | |
| | Amount | Value | | | Amount | | Value |
| Collateralized Mortgage | | | U.S. Government Agency | | |
| Obligations(6) — 1.0% | | | | Mortgage-Backed Securities(6) — 0.8% |
| PRIVATE SPONSOR COLLATERALIZED | | | FHLMC, 4.50%, 5/1/19(1) | $ 472,237 | $ 503,353 |
| MORTGAGE OBLIGATIONS — 0.8% | | | FHLMC, 5.00%, 4/1/21(1) | 2,115,534 | | 2,270,398 |
| Banc of America Mortgage | | | | FHLMC, 5.50%, 12/1/33(1) | 248,760 | | 268,482 |
| Securities, Inc., Series | | | | | | | |
| 2004-4, Class 2A1 SEQ, | | | | FHLMC, 5.50%, 1/1/38(1) | 1,205,064 | | 1,295,331 |
| 5.50%, 5/25/34(1) | $ 3,178,096 | $ 3,249,513 | | FNMA, 5.00%, 9/1/20(1) | 627,835 | | 674,285 |
| Countrywide Home Loan | | | | FNMA, 6.00%, 6/1/38(1) | 2,018,543 | | 2,192,137 |
| Mortgage Pass Through | | | | GNMA, 6.00%, 6/20/17(1) | 76,731 | | 83,475 |
| Trust, Series 2003-35, Class | | | | | | | |
| 1A3 SEQ, 5.00%, 9/25/18(1) | 2,089,149 | 2,165,604 | | GNMA, 6.00%, 7/20/17(1) | 77,160 | | 83,941 |
| Countrywide Home Loan | | | | GNMA, 6.00%, 5/15/24(1) | 557,295 | | 613,777 |
| Mortgage Pass-Through | | | | GNMA, 5.50%, 9/20/34(1) | 1,669,047 | | 1,815,840 |
| Trust, Series 2003 J13, Class | | | | | | | |
| 1A1 SEQ, 5.25%, 1/25/34(1) | 2,119,810 | 2,165,966 | | TOTAL U.S. GOVERNMENT AGENCY | | |
| | | | | MORTGAGE-BACKED SECURITIES | | |
| First Horizon Mortgage Pass | | | | (Cost $9,035,363) | | | 9,801,019 |
| Through Trust, Series | | | | | | | |
| 2004-2, Class 1A2 SEQ, | | | | Asset-Backed Securities(6) — 0.4% | |
| 5.50%, 5/25/34(1) | 2,481,698 | 2,518,658 | | | | | |
| | | | | CenterPoint Energy | | | |
| | | 10,099,741 | | Transition Bond Co. LLC, | | | |
| U.S. GOVERNMENT AGENCY COLLATERALIZED | | Series 2009-1, Class A1 | | | |
| | | | | SEQ, 1.83%, 2/15/16 | | | |
| MORTGAGE OBLIGATIONS — 0.2% | | | (Cost $4,499,890) | 4,500,000 | | 4,586,058 |
| FHLMC, Series 2508, Class | | | | | | | |
| UL SEQ, 5.00%, 12/15/16(1) | 410,157 | 419,200 | | Temporary Cash Investments — 0.6% |
| GNMA, Series 2003-46, | | | | BNP Paribas Finance, Inc., | | | |
| Class PA, 5.00%, 5/20/29(1) | 48,724 | 48,753 | | 0.03%, 7/1/10(7) | 7,900,000 | | 7,900,000 |
| GNMA, Series 2005-24, Class | | | | JPMorgan U.S. Treasury | | | |
| UB SEQ, 5.00%, 1/20/31(1) | 1,646,821 | 1,673,768 | | Plus Money Market Fund | | | |
| | | | | Agency Shares(1) | 40,837 | | 40,837 |
| | | 2,141,721 | | | | | |
| TOTAL COLLATERALIZED | | | | TOTAL TEMPORARY | | | |
| MORTGAGE OBLIGATIONS | | | | CASH INVESTMENTS | | | |
| (Cost $12,186,019) | | 12,241,462 | | (Cost $7,940,837) | | | 7,940,837 |
| | | | | TOTAL INVESTMENT | | | |
| | | | | SECURITIES — 100.5% | | | |
| | | | | (Cost $1,146,189,277) | | 1,206,401,101 |
| | | | | OTHER ASSETS | | | |
| | | | | AND LIABILITIES — (0.5)% | | | (6,226,193) |
| | | | | TOTAL NET ASSETS — 100.0% | | $1,200,174,908 |
| | | | |
| Forward Foreign Currency Exchange Contracts | | |
| Contracts to Sell | Settlement Date | Value | Unrealized Gain (Loss) |
| 20,062,857 | CAD for USD | 7/30/10 | $ 18,843,022 | $ 1,072,045 |
| 62,551,721 | EUR for USD | 7/30/10 | 76,497,210 | 6,649,040 |
| 1,240,000 | EUR for USD | 7/30/10 | 1,516,450 | 69,386 |
| 1,900,000 | EUR for USD | 7/30/10 | 2,323,592 | 93,692 |
| 53,739,580 | GBP for USD | 7/30/10 | 80,292,307 | 2,068,436 |
| 1,410,000 | GBP for USD | 7/30/10 | 2,106,681 | (75,005) |
| 1,100,000 | GBP for USD | 7/30/10 | 1,643,510 | 3,696 |
| 2,037,559,981 | JPY for USD | 7/30/10 | 23,055,853 | (1,235,880) |
| | | | $206,278,625 | $ 8,645,410 |
| (Value on Settlement Date $214,924,035) | | | |
14
| | | |
| VP Inflation Protection | | |
| |
| Swap Agreements | | |
| Notional Amount | Description of Agreement | Premiums Paid (Received) | Value |
| TOTAL RETURN | | | |
| $44,000,000 | Pay a fixed rate equal to 1.08 multiplied by the | — | $ (1,106,512) |
| | notional amount and receive the return of the | | |
| | U.S. CPI Urban Consumers NSA Index upon the | | |
| | termination date with Barclays Bank plc. Expires | | |
| | July 2010. | | |
| 20,000,000 | Pay a fixed rate equal to 1.13 multiplied by the | — | (743,627) |
| | notional amount and receive the return of the | | |
| | U.S. CPI Urban Consumers NSA Index upon the | | |
| | termination date with Barclays Bank plc. Expires | | |
| | January 2012. | | |
| 35,000,000 | Pay a fixed rate equal to 1.14 multiplied by the | — | (1,716,021) |
| | notional amount and receive the return of the | | |
| | U.S. CPI Urban Consumers NSA Index upon the | | |
| | termination date with Barclays Bank plc. Expires | | |
| | March 2012. | | |
| 33,275,000 | Pay a fixed rate equal to 0.16 multiplied by the | — | (3,548,869) |
| | notional amount and receive the return of the | | |
| | U.S. CPI Urban Consumers NSA Index upon the | | |
| | termination date with Bank of America N.A. | | |
| | Expires July 2013. | | |
| 13,000,000 | Pay a fixed rate equal to 0.08 multiplied by the | — | (424,060) |
| | notional amount and receive the return of the | | |
| | U.S. CPI Urban Consumers NSA Index upon | | |
| | the termination date with UBS AG. Expires | | |
| | November 2013. | | |
| 20,000,000 | Pay a fixed rate equal to 1.21 multiplied by the | — | (1,589,137) |
| | notional amount and receive the return of the | | |
| | U.S. CPI Urban Consumers NSA Index upon the | | |
| | termination date with Barclays Bank plc. Expires | | |
| | June 2014. | | |
| 6,000,000 | Pay a fixed rate equal to 0.12 multiplied by the | — | (189,343) |
| | notional amount and receive the return of the | | |
| | U.S. CPI Urban Consumers NSA Index upon the | | |
| | termination date with Bank of America N.A. | | |
| | Expires January 2015. | | |
| 20,000,000 | Pay a fixed rate equal to 1.31 multiplied by the | — | (1,355,561) |
| | notional amount and receive the return of the | | |
| | U.S. CPI Urban Consumers NSA Index upon the | | |
| | termination date with Barclays Bank plc. Expires | | |
| | April 2017. | | |
| 5,000,000 | Pay a fixed rate equal to 0.21 multiplied by the | — | (104,709) |
| | notional amount and receive the return of the | | |
| | U.S. CPI Urban Consumers NSA Index upon the | | |
| | termination date with Bank of America N.A. | | |
| | Expires April 2018. | | |
| 40,000,000 | Pay a fixed rate equal to 1.31 multiplied by the | — | (3,120,011) |
| | notional amount and receive the return of the | | |
| | U.S. CPI Urban Consumers NSA Index upon the | | |
| | termination date with Barclays Bank plc. Expires | | |
| | April 2018. | | |
| 55,000,000 | Pay a fixed rate equal to 0.30 multiplied by the | — | (1,862,129) |
| | notional amount and receive the return of the | | |
| | U.S. CPI Urban Consumers NSA Index upon the | | |
| | termination date with Bank of America N.A. | | |
| | Expires December 2019. | | |
15
| | | |
| VP Inflation Protection | | |
| |
| Notional Amount | Description of Agreement | Premiums Paid (Received) | Value |
| $ 5,000,000 | Pay a fixed rate equal to 0.37 multiplied by the | — | $ (140,637) |
| | notional amount and receive the return of the | | |
| | U.S. CPI Urban Consumers NSA Index upon the | | |
| | termination date with Bank of America N.A. | | |
| | Expires April 2022. | | |
| 30,100,000 | Pay a fixed rate equal to 1.77 multiplied by the | — | (2,325,564) |
| | notional amount and receive the return of the | | |
| | U.S. CPI Urban Consumers NSA Index upon the | | |
| | termination date with Barclays Bank plc. Expires | | |
| | December 2027. | | |
| | | — | $(18,226,180) |
| | |
| Notes to Schedule of Investments | | |
| AID = Agency for International Development | (1) | Security, or a portion thereof, has been segregated for swap |
| CAD = Canadian Dollar | | agreements. At the period end, the aggregate value of securities |
| | | pledged was $18,227,000. |
| CPI = Consumer Price Index | | |
| | (2) | The rate indicated is the yield to maturity at purchase. These |
| Equivalent = Security whose principal payments are secured by US | | securities are issued at a substantial discount from their value |
| Treasuries or backed by the full faith and credit of the United States | | at maturity. |
| EUR = Euro | (3) | Security was purchased under Rule 144A of the Securities Act of |
| FAMCA = Federal Agricultural Mortgage Corporation | | 1933 or is a private placement and, unless registered under the |
| FFCB = Federal Farm Credit Bank | | Act or exempted from registration, may only be sold to qualified |
| | | institutional investors. The aggregate value of these securities at |
| FHLB = Federal Home Loan Bank | | the period end was $18,156,884, which represented 1.5% of total |
| FHLMC = Federal Home Loan Mortgage Corporation | | net assets. |
| FNMA = Federal National Mortgage Association | (4) | Industry is less than 0.05% of total net assets. |
| GBP = British Pound | (5) | The debt is guaranteed under the Federal Deposit Insurance |
| GNMA = Government National Mortgage Association | | Corporation’s (FDIC) Temporary Liquidity Guarantee Program and |
| GO = General Obligation | | is backed by the full faith and credit of the United States. The |
| | | expiration date of the FDIC’s guarantee is the earlier of the maturity |
| JPY = Japanese Yen | | date of the debt or December 31, 2012. |
| LB-UBS = Lehman Brothers, Inc. — UBS AG | (6) | Final maturity indicated, unless otherwise noted. |
| LIBOR = London Interbank Offered Rate | (7) | The rate indicated is the yield to maturity at purchase. |
| NOK = Norwegian Krone | | |
| NSA = Not Seasonally Adjusted | | |
| resets = The frequency with which a security’s coupon changes, | See Notes to Financial Statements. |
| based on current market conditions or an underlying index. The more | | |
| frequently a security resets, the less risk the investor is taking that the | | |
| coupon will vary significantly from current market rates. | | |
| SEQ = Sequential Payer | | |
| TVA = Tennessee Valley Authority | | |
| USD = United States Dollar | | |
| VRN = Variable Rate Note. Interest reset date is indicated. Rate shown | | |
| is effective at the period end. | | |
16
|
| Statement of Assets and Liabilities |
| |
| JUNE 30, 2010 (UNAUDITED) | |
| Assets | |
| Investment securities, at value (cost of $1,146,189,277) | $1,206,401,101 |
| Foreign currency holdings, at value (cost of $702,587) | 702,782 |
| Receivable for capital shares sold | 486,670 |
| Receivable for forward foreign currency exchange contracts | 9,956,295 |
| Interest receivable | 10,441,135 |
| | 1,227,987,983 |
| | |
| Liabilities | |
| Payable for capital shares redeemed | 7,583,706 |
| Payable for forward foreign currency exchange contracts | 1,310,885 |
| Accrued management fees | 468,124 |
| Distribution fees payable | 224,180 |
| Swap agreements, at value | 18,226,180 |
| | 27,813,075 |
| | |
| Net Assets | $1,200,174,908 |
| | |
| Net Assets Consist of: | |
| Capital (par value and paid-in surplus) | $1,144,005,849 |
| Undistributed net investment income | 3,145,582 |
| Undistributed net realized gain on investment and foreign currency transactions | 2,439,554 |
| Net unrealized appreciation on investments and translation of assets and | |
| liabilities in foreign currencies | 50,583,923 |
| | $1,200,174,908 |
| | | |
| | Net assets | Shares outstanding | Net asset value per share |
| Class I, $0.01 Par Value | $110,280,486 | 10,052,637 | $10.97 |
| Class II, $0.01 Par Value | $1,089,894,422 | 99,478,985 | $10.96 |
| |
| |
| See Notes to Financial Statements. | | | |
17
| |
| FOR THE SIX MONTHS ENDED JUNE 30, 2010 (UNAUDITED) | |
| Investment Income (Loss) | |
| Income: | |
| Interest | $20,836,342 |
| | |
| Expenses: | |
| Management fees | 2,763,398 |
| Distribution fees – Class II | 1,321,201 |
| Directors’ fees and expenses | 43,144 |
| Other expenses | 67,641 |
| | 4,195,384 |
| | |
| Net investment income (loss) | 16,640,958 |
| | |
| Realized and Unrealized Gain (Loss) | |
| Net realized gain (loss) on: | |
| Investment transactions | 3,671,598 |
| Swap agreement transactions | (4,803) |
| Foreign currency transactions | 14,634,390 |
| | 18,301,185 |
| | |
| Change in net unrealized appreciation (depreciation) on: | |
| Investments | 9,422,672 |
| Swap agreements | (10,371,252) |
| Translation of assets and liabilities in foreign currencies | 4,991,669 |
| | 4,043,089 |
| | |
| Net realized and unrealized gain (loss) | 22,344,274 |
| | |
| Net Increase (Decrease) in Net Assets Resulting from Operations | $38,985,232 |
| |
| |
| See Notes to Financial Statements. | |
18
|
| Statement of Changes in Net Assets |
| | |
| SIX MONTHS ENDED JUNE 30, 2010 (UNAUDITED) AND YEAR ENDED DECEMBER 31, 2009 | |
| Increase (Decrease) in Net Assets | 2010 | 2009 |
| Operations | | |
| Net investment income (loss) | $ 16,640,958 | $ 23,129,029 |
| Net realized gain (loss) | 18,301,185 | (1,123,565) |
| Change in net unrealized appreciation (depreciation) | 4,043,089 | 71,636,707 |
| Net increase (decrease) in net assets resulting from operations | 38,985,232 | 93,642,171 |
| | | |
| Distributions to Shareholders | | |
| From net investment income: | | |
| Class I | (1,442,099) | (1,742,731) |
| Class II | (13,337,798) | (15,959,329) |
| Decrease in net assets from distributions | (14,779,897) | (17,702,060) |
| | | |
| Capital Share Transactions | | |
| Net increase (decrease) in net assets from capital share transactions | 15,727,876 | 236,955,503 |
| | | |
| Net increase (decrease) in net assets | 39,933,211 | 312,895,614 |
| | | |
| Net Assets | | |
| Beginning of period | 1,160,241,697 | 847,346,083 |
| End of period | $1,200,174,908 | $1,160,241,697 |
| | | |
| Undistributed net investment income | $3,145,582 | $1,284,521 |
| |
| |
| See Notes to Financial Statements. | | |
19
|
| Notes to Financial Statements |
JUNE 30, 2010 (UNAUDITED)
1. Organization and Summary of Significant Accounting Policies
Organization — American Century Variable Portfolios II, Inc. (the corporation) is registered under the Investment Company Act of 1940 (the 1940 Act) as an open-end management investment company. VP Inflation Protection Fund (the fund) is one fund in a series issued by the corporation. The fund is diversified under the 1940 Act. The fund’s investment objective is to pursue long-term total return using a strategy that seeks to protect against U.S. inflation. The fund pursues its investment objective by investing substantially all of its assets in investment-grade debt securities. The fund normally invests over 50% of its assets in inflation-adjusted debt securities that are designed to protect the future purchasing power of the money invested in them. The following is a summary of the fund’s significant accounting pol icies.
Multiple Class — The fund is authorized to issue Class I and Class II. The share classes differ principally in their respective distribution and shareholder servicing expenses and arrangements. All shares of the fund represent an equal pro rata interest in the net assets of the class to which such shares belong, and have identical voting, dividend, liquidation and other rights and the same terms and conditions, except for class specific expenses and exclusive rights to vote on matters affecting only individual classes. Income, non-class specific expenses, and realized and unrealized capital gains and losses of the fund are allocated to each class of shares based on their relative net assets.
Security Valuations — Debt securities maturing in greater than 60 days at the time of purchase are valued at current market value as provided by a commercial pricing service or at the mean of the most recent bid and asked prices. Debt securities maturing within 60 days at the time of purchase may be valued at cost, plus or minus any amortized discount or premium. Investments in open-end management investment companies are valued at the reported net asset value. Securities traded on foreign securities exchanges and over-the-counter markets are normally completed before the close of business on days that the New York Stock Exchange (the Exchange) is open and may also take place on days when the Exchange is not open. If an event occurs after the value of a security was established but before the net asset value per share was det ermined that was likely to materially change the net asset value, that security would be valued as determined in accordance with procedures adopted by the Board of Directors. If the fund determines that the market price of a portfolio security is not readily available, or that the valuation methods mentioned above do not reflect the security’s fair value, such security is valued as determined by the Board of Directors or its designee, in accordance with procedures adopted by the Board of Directors, if such determination would materially impact a fund’s net asset value. Certain other circumstances may cause the fund to use alternative procedures to value a security such as: a security has been declared in default; trading in a security has been halted during the trading day; or there is a foreign market holiday and no trading will commence.
Security Transactions — For financial reporting purposes, security transactions are accounted for as of the trade date. Net realized gains and losses are determined on the identified cost basis, which is also used for federal income tax purposes.
Investment Income — Interest income is recorded on the accrual basis and includes paydown gain (loss) and accretion of discounts and amortization of premiums. Inflation adjustments related to inflation-linked debt securities are reflected as interest income.
Foreign Currency Translations — All assets and liabilities initially expressed in foreign currencies are translated into U.S. dollars at prevailing exchange rates at period end. The fund may enter into spot foreign currency exchange contracts to facilitate transactions denominated in a foreign currency. Purchases and sales of investment securities, dividend and interest income, spot foreign currency exchange contracts, and certain expenses are translated at the rates of exchange prevailing on the respective dates of such transactions. For assets and liabilities, other than investments in securities, net realized and unrealized gains and losses from foreign currency translations arise from changes in currency exchange rates.
20
Net realized and unrealized foreign currency exchange gains or losses occurring during the holding period of investment securities are a component of net realized gain (loss) on investment transactions and net unrealized appreciation (depreciation) on investments, respectively. Certain countries may impose taxes on the contract amount of purchases and sales of foreign currency contracts in their currency. The fund records the foreign tax expense, if any, as a reduction to the net realized gain (loss) on foreign currency transactions.
Repurchase Agreements — The fund may enter into repurchase agreements with institutions that American Century Investment Management, Inc. (ACIM) (the investment advisor) has determined are creditworthy pursuant to criteria adopted by the Board of Directors. Each repurchase agreement is recorded at cost. The fund requires that the collateral, represented by securities, received in a repurchase transaction be transferred to the custodian in a manner sufficient to enable the fund to obtain those securities in the event of a default under the repurchase agreement. ACIM monitors, on a daily basis, the securities transferred to ensure the value, including accrued interest, of the securities under each repurchase agreement is equal to or greater than amounts owed to the fund under each repurchase agreement.
Joint Trading Account — Pursuant to an Exemptive Order issued by the Securities and Exchange Commission, the fund, along with certain other funds in the American Century Investments family of funds, may transfer uninvested cash balances into a joint trading account. These balances are invested in one or more repurchase agreements that are collateralized by U.S. Treasury or Agency obligations.
Income Tax Status — It is the fund’s policy to distribute substantially all net investment income and net realized gains to shareholders and to otherwise qualify as a regulated investment company under provisions of the Internal Revenue Code. The fund is no longer subject to examination by tax authorities for years prior to 2006. At this time, management believes there are no uncertain tax positions which, based on their technical merit, would not be sustained upon examination and for which it is reasonably possible that the total amounts of unrecognized tax benefits will significantly change in the next twelve months. Accordingly, no provision has been made for federal or state income taxes.
Distributions to Shareholders — Distributions to shareholders are recorded on the ex-dividend date. Distributions from net investment income are declared and paid quarterly. Prior to May 3, 2010, distributions from net investment income were declared daily and paid monthly. Distributions from net realized gains, if any, are generally declared and paid annually.
The book-basis character of distributions made during the year from net investment income or net realized gains may differ from their ultimate characterization for federal income tax purposes. These differences reflect the differing character of paydown losses, interest on swap agreements, certain income items and net realized gains and losses for financial statement and tax purposes, and may result in reclassification among certain capital accounts on the financial statements.
As of December 31, 2009, the fund had accumulated capital losses of $(7,743,486), which represent net capital loss carryovers that may be used to offset future realized capital gains for federal income tax purposes. Future capital loss carryover utilization in any given year may be subject to Internal Revenue Code limitations. Capital loss carryovers of $(1,436,199), $(3,811,535) and $(2,495,752) expire in 2014, 2015 and 2016, respectively.
Indemnifications — Under the corporation’s organizational documents, its officers and directors are indemnified against certain liabilities arising out of the performance of their duties to the fund. In addition, in the normal course of business, the fund enters into contracts that provide general indemnifications. The maximum exposure under these arrangements is unknown as this would involve future claims that may be made against a fund. The risk of material loss from such claims is considered by management to be remote.
21
Use of Estimates — The financial statements are prepared in conformity with accounting principles generally accepted in the United States of America, which may require management to make certain estimates and assumptions at the date of the financial statements. Actual results could differ from these estimates.
Subsequent Events — In preparing the financial statements, management evaluated the impact of events or transactions occurring through the date the financial statements were issued that would merit recognition or disclosure.
2. Fees and Transactions with Related Parties
Management Fees — The corporation has entered into a Management Agreement with ACIM, under which ACIM provides the fund with investment advisory and management services in exchange for a single, unified management fee (the fee) per class. The Agreement provides that all expenses of managing and operating the fund, except brokerage expenses, taxes, interest, fees and expenses of the independent directors (including legal counsel fees), and extraordinary expenses, will be paid by ACIM. The fee is computed and accrued daily based on the daily net assets of the specific class of shares of the fund and paid monthly in arrears. The fee consists of (1) an Investment Category Fee based on the daily net assets of the fund and certain other accounts managed by the investment advisor that are in the same broad investment category as the fund and (2) a Complex Fee based on the assets of all the funds in the American Century Investments family of funds. The rates for the Investment Category Fee range from 0.1625% to 0.2800%. The rates for the Complex Fee range from 0.2500% to 0.3100%. The effective annual management fee for each class for the six months ended June 30, 2010 was 0.48%.
Distribution Fees — The Board of Directors has adopted the Master Distribution Plan (the plan) for Class II, pursuant to Rule 12b-1 of the 1940 Act. The plan provides that Class II will pay American Century Investment Services, Inc. (ACIS) an annual distribution fee equal to 0.25%. The fee is computed and accrued daily based on the Class II daily net assets and paid monthly in arrears. The distribution fee provides compensation for expenses incurred in connection with distributing shares of Class II including, but not limited to, payments to brokers, dealers, and financial institutions that have entered into sales agreements with respect to shares of the fund. Fees incurred under the plan during the six months ended June 30, 2010, are detailed in the Statement of Operations.
Related Parties — Certain officers and directors of the corporation are also officers and/ or directors of American Century Companies, Inc. (ACC), the parent of the corporation’s investment advisor, ACIM, the distributor of the corporation, ACIS, and the corporation’s transfer agent, American Century Services, LLC.
The fund is eligible to invest in a money market fund for temporary purposes, which is managed by J.P. Morgan Investment Management, Inc. (JPMIM). The fund has a Mutual Funds Services Agreement with J.P. Morgan Investor Services Co. (JPMIS). JPMorgan Chase Bank (JPMCB) is a custodian of the fund. JPMIM, JPMIS and JPMCB are wholly owned subsidiaries of JPMorgan Chase & Co. (JPM). JPM is an equity investor in ACC.
3. Investment Transactions
Purchases of investment securities, excluding short-term investments, for the six months ended June 30, 2010, totaled $284,461,359, of which $193,648,124 represented U.S. Treasury and Agency obligations.
Sales of investment securities, excluding short-term investments, for the six months ended June 30, 2010, totaled $237,895,299, of which $196,054,326 represented U.S. Treasury and Agency obligations.
22
As of June 30, 2010, the composition of unrealized appreciation and depreciation of investment securities based on the aggregate cost of investments for federal income tax purposes was as follows:
| |
| Federal tax cost of investments | $1,147,822,819 |
| Gross tax appreciation of investments | $70,113,276 |
| Gross tax depreciation of investments | (11,534,994) |
| Net tax appreciation (depreciation) of investments | $58,578,282 |
The difference between book-basis and tax-basis cost and unrealized appreciation (depreciation) is attributable primarily to the tax deferral of losses on wash sales.
| | | | |
| 4. Capital Share Transactions | | | | |
| |
| Transactions in shares of the fund were as follows: | | |
| | Six months ended June 30, 2010 | Year ended December 31, 2009 |
| | Shares | Amount | Shares | Amount |
| Class I/Shares Authorized | 250,000,000 | | 250,000,000 | |
| Sold | 1,181,709 | $ 12,815,496 | 2,563,052 | $ 26,789,214 |
| Issued in reinvestment of distributions | 130,465 | 1,420,154 | 164,965 | 1,742,731 |
| Redeemed | (752,648) | (8,137,583) | (2,400,396) | (24,485,157) |
| | 559,526 | 6,098,067 | 327,621 | 4,046,788 |
| Class II/Shares Authorized | 250,000,000 | | 250,000,000 | |
| Sold | 12,336,729 | 133,493,408 | 32,069,029 | 332,796,504 |
| Issued in reinvestment of distributions | 1,207,568 | 13,131,721 | 1,510,903 | 15,959,329 |
| Redeemed | (12,705,955) | (136,995,320) | (11,314,307) | (115,847,118) |
| | 838,342 | 9,629,809 | 22,265,625 | 232,908,715 |
| Net increase (decrease) | 1,397,868 | $ 15,727,876 | 22,593,246 | $236,955,503 |
5. Fair Value Measurements
The fund’s securities valuation process is based on several considerations and may use multiple inputs to determine the fair value of the positions held by the fund. In conformity with accounting principles generally accepted in the United States of America, the inputs used to determine a valuation are classified into three broad levels as follows:
• Level 1 valuation inputs consist of unadjusted quoted prices in an active market for identical securities;
• Level 2 valuation inputs consist of significant direct or indirect observable market data (including quoted prices for similar securities, evaluations of subsequent market events, interest rates, prepayment speeds, credit risk, etc.); or
• Level 3 valuation inputs consist of significant unobservable inputs (including a fund’s own assumptions).
The level classification is based on the lowest level input that is significant to the fair valuation measurement. The valuation inputs are not an indication of the risks associated with investing in these securities or other financial instruments.
23
The following is a summary of the valuation inputs used to determine the fair value of the fund’s securities and other financial instruments as of June 30, 2010. The Schedule of Investments provides additional details on the fund’s portfolio holdings.
| | | |
| | Level 1 | Level 2 | Level 3 |
| Investment Securities | | | |
| U.S. Treasury Securities and Equivalents | — | $667,565,533 | — |
| Sovereign Governments & Agencies | — | 216,323,670 | — |
| U.S. Government Agency Securities and Equivalents | — | 122,718,535 | — |
| Corporate Bonds | — | 119,163,722 | — |
| Commercial Mortgage-Backed Securities | — | 33,197,877 | — |
| Municipal Securities | — | 12,862,388 | — |
| Collateralized Mortgage Obligations | — | 12,241,462 | — |
| U.S. Government Agency Mortgage-Backed Securities | — | 9,801,019 | — |
| Asset-Backed Securities | — | 4,586,058 | — |
| Temporary Cash Investments | $40,837 | 7,900,000 | — |
| Total Value of Investment Securities | $40,837 | $1,206,360,264 | — |
| | | | |
| Other Financial Instruments | | | |
| Forward Foreign Currency Exchange Contracts | — | $8,645,410 | — |
| Swap Agreements | — | (18,226,180) | — |
| Total Unrealized Gain (Loss) on Other Financial Instruments | — | $(9,580,770) | — |
6. Derivative Instruments
Credit Risk — The fund is subject to credit risk in the normal course of pursuing its investment objectives. The value of a bond generally declines as the credit quality of its issuer declines. Credit default swap agreements enable a fund to buy/sell protection against a credit event of a specific issuer or index. A fund may attempt to enhance returns by selling protection or attempt to mitigate credit risk by buying protection. The buyer/ seller of credit protection against a security or basket of securities may pay/receive an up-front or periodic payment to compensate for/against potential default events. A fund will segregate cash, cash equivalents or other appropriate liquid securities on its records in amounts sufficient to meet requirements. Swap agreements are valued daily at current market value as provided by a comme rcial pricing service and/or independent brokers. Changes in value, including the periodic amounts of interest to be paid or received on swap agreements, are recorded as unrealized appreciation (depreciation) on swap agreements. Realized gain or loss is recorded upon receipt or payment of a periodic settlement or termination of swap agreements. Net realized and unrealized gains or losses occurring during the holding period of swap agreements are a component of net realized gain (loss) on swap agreement transactions and change in net unrealized appreciation (depreciation) on swap agreements, respectively. The risks of entering into swap agreements include the possible lack of liquidity, failure of the counterparty to meet its obligations, and that there may be unfavorable changes in the underlying investments or instruments. The fund held no credit risk derivative instruments at period end. The fund participated in one credit risk derivative instrument to buy protection during the period.
Foreign Currency Risk — The fund is subject to foreign currency exchange rate risk in the normal course of pursuing its investment objectives. The value of foreign investments held by a fund may be significantly affected by changes in foreign currency exchange rates. The dollar value of a foreign security generally decreases when the value of the dollar rises against the foreign currency in which the security is denominated and tends to increase when the value of the dollar declines against such foreign currency. A fund
24
may enter into forward foreign currency exchange contracts to reduce a fund’s exposure to foreign currency exchange rate fluctuations. The net U.S. dollar value of foreign currency underlying all contractual commitments held by a fund and the resulting unrealized appreciation or depreciation are determined daily using prevailing exchange rates. Realized gain or loss is recorded upon the termination of the contract. Net realized and unrealized gains or losses occurring during the holding period of forward foreign currency exchange contracts are a component of net realized gain (loss) on foreign currency transactions and change in net unrealized appreciation (depreciation) on translation of assets and liabilities in foreign currencies, respectively. A fund bears the risk of an unfavorable change in the foreign currency exchange rate underlying the forward contract. Additionally, losses, up to the fair value, ma y arise if the counterparties do not perform under the contract terms. The foreign currency risk derivative instruments held at period end as disclosed on the Schedule of Investments are indicative of the fund’s typical volume during the period.
Other Contracts — A fund may enter into total return swap agreements in order to attempt to obtain or preserve a particular return or spread at a lower cost than obtaining a return or spread through purchases and/or sales of instruments in other markets or gain exposure to certain markets in the most economical way possible. A fund will segregate cash, cash equivalents or other appropriate liquid securities on its records in amounts sufficient to meet requirements. Swap agreements are valued daily at current market value as provided by a commercial pricing service and/or independent brokers. Changes in value, including the periodic amounts of interest to be paid or received on swap agreements, are recorded as unrealized appreciation (depreciation) on swap agreements. Realized gain or loss is recorded upon receipt or payment o f a periodic settlement or termination of swap agreements. Net realized and unrealized gains or losses occurring during the holding period of swap agreements are a component of net realized gain (loss) on swap agreement transactions and change in net unrealized appreciation (depreciation) on swap agreements, respectively. The risks of entering into swap agreements include the possible lack of liquidity, failure of the counterparty to meet its obligations, and that there may be unfavorable changes in the underlying investments or instruments. The other contract derivative instruments held at period end as disclosed on the Schedule of Investments are indicative of the fund’s typical volume during the period.
Effect of Derivative Instruments on the Statement of Operations for the Six Months Ended June 30, 2010
| | | | |
| | | | Change in Net Unrealized |
| | Net Realized Gain (Loss) | | Appreciation (Depreciation) |
| | Location on Statement | | Location on Statement | |
| Type of Derivative | of Operations | Value | of Operations | Value |
| Credit Risk | Net realized gain (loss) | $ (4,803) | Change in net unrealized | $ (7,005) |
| | on swap agreement | | appreciation (depreciation) on | |
| | transactions | | swap agreements | |
| Foreign Currency Risk | Net realized gain (loss) | 14,617,205 | Change in net unrealized | 5,028,397 |
| | on foreign currency | | appreciation (depreciation) | |
| | transactions | | on translation of assets and | |
| | | | liabilities in foreign currencies | |
| Other Contracts | Net realized gain (loss) | — | Change in net unrealized | (10,364,247) |
| | on swap agreement | | appreciation (depreciation) | |
| | transactions | | on swap agreements | |
| | | $14,612,402 | | $ (5,342,855) |
25
7. Interfund Lending
The fund, along with certain other funds in the American Century Investments family of funds, may participate in an interfund lending program, pursuant to an Exemptive Order issued by the Securities and Exchange Commission (SEC). This program provides an alternative credit facility allowing the fund to borrow from or lend to other funds in the American Century Investments family of funds that permit such transactions. Interfund lending transactions are subject to each fund’s investment policies and borrowing and lending limits. The interfund loan rate earned/paid on interfund lending transactions is determined daily based on the average of certain current market rates. Interfund lending transactions normally extend only overnight, but can have a maximum duration of seven days. The program is subject to annual approval by the Board of Directors. During the six months ended June 30, 2010, the fund did not utili ze the program.
8. Risk Factors
There are certain risks involved in investing in foreign securities. These risks include those resulting from future adverse political, social, and economic developments, fluctuations in currency exchange rates, the possible imposition of exchange controls, and other foreign laws or restrictions.
9. Corporate Event
As part of a long-standing estate and business succession plan established by ACC Co-Chairman James E. Stowers, Jr., the founder of American Century Investments, ACC Co-Chairman Richard W. Brown succeeded Mr. Stowers as trustee of a trust that holds a greater-than-25% voting interest in ACC, the parent corporation of the fund’s advisor. Under the 1940 Act, this is presumed to represent control of ACC even though it is less than a majority interest. The change of trustee may technically be considered a “change of control” of ACC and therefore also a change of control of the fund’s advisor even though there has been no change to its management and none is anticipated. The “change of control” resulted in the assignment of the fund’s investment advisory agreement. Under the 1940 Act, an assignment automatically terminated such agreement, making the approval of a new agreement necessa ry.
On February 18, 2010, the Board of Trustees approved an interim investment advisory agreement under which the fund will be managed until a new agreement is approved by fund shareholders. On April 1, 2010, the Board of Trustees approved a new investment advisory agreement. The interim agreement and the new agreement are substantially identical to the terminated agreements (with the exception of different effective and termination dates) and will not result in changes in the management of American Century Investments, the fund, its investment objectives, fees or services provided. The new agreement for the fund was approved by shareholders at a Special Meeting of Shareholders on June 16, 2010. The new agreement went into effect on July 16, 2010.
26
| | | | | | | |
| VP Inflation Protection | | | | |
| |
| Class I | | | | | | |
| For a Share Outstanding Throughout the Years Ended December 31 (except as noted) | | |
| | | 2010(1) | 2009 | 2008 | 2007 | 2006 | 2005 |
| Per-Share Data | | | | | | |
| Net Asset Value, | | | | | | |
| Beginning of Period | $10.74 | $9.91 | $10.55 | $10.09 | $10.26 | $10.55 |
| Income From | | | | | | |
| Investment Operations | | | | | | |
| Net Investment | | | | | | |
| Income (Loss) | 0.17(2) | 0.26(2) | 0.49(2) | 0.49 | 0.34(2) | 0.47 |
| Net Realized and | | | | | | |
| Unrealized Gain (Loss) | 0.21 | 0.77 | (0.60) | 0.46 | (0.15) | (0.28) |
| Total From | | | | | | |
| Investment Operations | 0.38 | 1.03 | (0.11) | 0.95 | 0.19 | 0.19 |
| Distributions | | | | | | |
| From Net | | | | | | |
| Investment Income | (0.15) | (0.20) | (0.50) | (0.49) | (0.36) | (0.47) |
| From Net Realized Gains | — | — | — | — | — | (0.01) |
| From Return of Capital | — | — | (0.03) | — | — | — |
| Total Distributions | (0.15) | (0.20) | (0.53) | (0.49) | (0.36) | (0.48) |
| Net Asset Value, | | | | | | |
| End of Period | $10.97 | $10.74 | $9.91 | $10.55 | $10.09 | $10.26 |
| |
| Total Return(3) | 3.52% | 10.43% | (1.26)% | 9.66% | 1.90% | 1.81% |
| | | | | | | |
| Ratios/Supplemental Data | | | | | | |
| Ratio of Operating | | | | | | |
| Expenses to Average | | | | | | |
| Net Assets | 0.49%(4) | 0.49% | 0.49% | 0.50% | 0.50% | 0.50% |
| Ratio of Net Investment | | | | | | |
| Income (Loss) to Average | | | | | | |
| Net Assets | 3.10%(4) | 2.61% | 4.62% | 4.75% | 3.37% | 4.85% |
| Portfolio Turnover Rate | 21% | 43% | 49% | 109% | 96% | 82% |
| Net Assets, End of Period | | | | | | |
| (in thousands) | $110,280 | $101,956 | $90,845 | $55,277 | $39,096 | $29,040 |
| (1) | Six months ended June 30, 2010 (unaudited). | | | | | |
| (2) | Computed using average shares outstanding throughout the period | | | | |
| (3) | Total return assumes reinvestment of net investment income and capital gains distributions, if any. Total returns for periods less than one year |
| | are not annualized. Total returns are calculated based on the net asset value of the last business day. The total return of the classes may not |
| | precisely reflect the class expense differences because of the impact of calculating the net asset values to two decimal places. If net asset |
| | values were calculated to three decimal places, the total return differences would more closely reflect the class expense differences. The |
| | calculation of net asset values to two decimal places is made in accordance with SEC guidelines and does not result in any gain or loss of value |
| | between one class and another. | | | | | |
| (4) | Annualized. | | | | | | |
See Notes to Financial Statements.
27
| | | | | | | |
| VP Inflation Protection | | | | |
| |
| Class II | | | | | | |
| For a Share Outstanding Throughout the Years Ended December 31 (except as noted) | | |
| | | 2010(1) | 2009 | 2008 | 2007 | 2006 | 2005 |
| Per-Share Data | | | | | | |
| Net Asset Value, | | | | | | |
| Beginning of Period | $10.73 | $9.91 | $10.55 | $10.08 | $10.26 | $10.55 |
| Income From | | | | | | |
| Investment Operations | | | | | | |
| Net Investment | | | | | | |
| Income (Loss) | 0.15(2) | 0.25(2) | 0.45(2) | 0.46 | 0.32(2) | 0.45 |
| Net Realized and | | | | | | |
| Unrealized Gain (Loss) | 0.20 | 0.75 | (0.59) | 0.47 | (0.16) | (0.28) |
| Total From | | | | | | |
| Investment Operations | 0.35 | 1.00 | (0.14) | 0.93 | 0.16 | 0.17 |
| Distributions | | | | | | |
| From Net | | | | | | |
| Investment Income | (0.12) | (0.18) | (0.47) | (0.46) | (0.34) | (0.45) |
| From Net Realized Gains | — | — | — | — | — | (0.01) |
| From Return of Capital | — | — | (0.03) | — | — | — |
| Total Distributions | (0.12) | (0.18) | (0.50) | (0.46) | (0.34) | (0.46) |
| Net Asset Value, | | | | | | |
| End of Period | $10.96 | $10.73 | $9.91 | $10.55 | $10.08 | $10.26 |
| |
| Total Return(3) | 3.42% | 10.22% | (1.59)% | 9.49% | 1.59% | 1.56% |
| | | | | | | |
| Ratios/Supplemental Data | | | | | | |
| Ratio of Operating | | | | | | |
| Expenses to Average | | | | | | |
| Net Assets | 0.74%(4) | 0.74% | 0.74% | 0.75% | 0.75% | 0.75% |
| Ratio of Net Investment | | | | | | |
| Income (Loss) to Average | | | | | | |
| Net Assets | 2.85%(4) | 2.36% | 4.37% | 4.50% | 3.12% | 4.60% |
| Portfolio Turnover Rate | 21% | 43% | 49% | 109% | 96% | 82% |
| Net Assets, End of Period | | | | | | |
| (in thousands) | $1,089,894 | $1,058,286 | $756,501 | $551,066 | $483,692 | $418,424 |
| (1) | Six months ended June 30, 2010 (unaudited). | | | | | |
| (2) | Computed using average shares outstanding throughout the period | | | | |
| (3) | Total return assumes reinvestment of net investment income and capital gains distributions, if any. Total returns for periods less than one year |
| | are not annualized. Total returns are calculated based on the net asset value of the last business day. The total return of the classes may not |
| | precisely reflect the class expense differences because of the impact of calculating the net asset values to two decimal places. If net asset |
| | values were calculated to three decimal places, the total return differences would more closely reflect the class expense differences. The |
| | calculation of net asset values to two decimal places is made in accordance with SEC guidelines and does not result in any gain or loss of value |
| | between one class and another. | | | | | |
| (4) | Annualized. | | | | | | |
See Notes to Financial Statements.
28
A special meeting of shareholders was held on June 16, 2010, to vote on the following proposals. Each proposal received the required number of votes and was adopted. A summary of voting results is listed below each proposal.
Proposal 1:
To elect one Director to the Board of Directors of American Century Variable Portfolios II, Inc.:
| | |
| Frederick L.A. Grauer | For: | 1,005,031,953 |
| | Withhold: | 58,060,556 |
| | Abstain: | 0 |
| | Broker Non-Vote: | 0 |
The other directors whose term of office continued after the meeting include Jonathan S. Thomas, John Freidenrich, Ronald J. Gilson, Peter F. Pervere, Myron S. Scholes, and John B. Shoven.
Proposal 2:
To approve a management agreement between the fund and American Century Investment Management, Inc.:
| | |
| Class I and Class II | | |
| | For: | 969,846,898 |
| | Against: | 27,395,407 |
| | Abstain: | 65,850,203 |
| | Broker Non-Vote: | 0 |
29
|
| Board Approval of Management Agreements |
American Century Investment Management, Inc. (“ACIM” or the “Advisor”) currently serves as investment advisor to the Fund under a management agreement (the “Current Management Agreement”) that took effect on July 16, 2010, following approval by the Fund’s Board of Directors (the “Board”) and shareholders. The Advisor previously served as investment advisor to the Fund pursuant to a prior management agreement (the “Prior Management Agreement”) and an interim management agreement (the “Interim Management Agreeement”). The Interim Management Agreement terminated in accordance with its terms on July 16, 2010, upon the effectiveness of the Current Management Agreement. The Prior Management Agreement terminated on February 16, 2010, as a result of a change of control of the Advisor’s parent company, American Century Companies, Inc. (“ACC”). The change in control occurred as the result of a change in the trustee of a trust created by James E. Stowers, Jr., the founder of American Century Investments that holds shares representing a significant interest in ACC stock. Mr. Stowers previously served as the trustee of the trust. On February 16, 2010, Richard W. Brown, Co-Chairman of ACC with Mr. Stowers, became the trustee in accordance with the terms of the trust and Mr. Stowers’ long-standing estate and succession plan.
On February 18, 2010, the Board approved the Interim Management Agreement in accordance with Rule 15a-4 under the Investment Company Act to ensure continued management of the Fund by the Advisor after the termination of the Prior Management Agreement and until shareholder approval of a new management agreement (the “Current Management Agreement”) as required under the Act. The Board approved the Current Management Agreement and recommended its approval to shareholders. Fund shareholders approved the Current Management Agreement at a meeting held on June 16, 2010.
The Interim Management Agreement and the Current Management Agreement are substantially identical to the Prior Management Agreement except for their effective dates and the termination provisions of the Interim Management Agreement. Under the Interim and Current Management Agreements, the Advisor will provide the same services to the Fund and receive the same compensation rate as under the Prior Management Agreement.
Basis for Board Approval of Interim Management Agreement
In considering the approval of the Interim Management Agreement, Rule 15a-4 requires the Board to approve the contract within ten business days of the termination of the prior agreement and to determine that the compensation to be received under the interim agreement is no greater than would have been received under the prior agreement. In connection with the approval, the Board noted that it oversees on a continuous basis and evaluates at its quarterly meetings, directly and through the committees of the Board, the nature and quality of significant services provided by the Advisor, the investment performance of the Fund, shareholder services, audit and compliance functions and a variety of other matters relating to the Fund’s operations.
30
In evaluating the Interim Management Agreement, the Board, assisted by the advice of its independent legal counsel, considered a number of factors in addition to those required by the rule with no one factor being determinative to its analysis. Among the factors considered by the Board were the circumstances and effect of the change of control, the fact that the Advisor will provide the same services and receive the same compensation rate as under the Prior Management Agreement, and that the change of control did not result in a change of the personnel managing the Fund. Upon completion of its analysis, the Board approved the Interim Management Agreement, determining that the continued management of the Fund by the Advisor was in the best interests of the Fund and Fund shareholders.
Basis for Board Approval of Current Management Agreement
At a meeting held on April 1, 2010, after considering all information presented, the Board approved, and determined to recommend that shareholders approve, the Current Management Agreement. In connection with that approval, the Board requested and reviewed extensive data and information compiled by the Advisor and certain independent providers of evaluation data concerning the Fund and services provided to the Fund by the Advisor. The Board oversees on a continuous basis and evaluates at its quarterly meetings, directly and through the committees of the Board, the nature and quality of significant services provided by the Advisor, the investment performance of the Fund, shareholder services, audit and compliance functions and a variety of other matters relating to the Fund’s operations. The information considered and the discussions held at the meetings included, but were not limited to:
• the nature, extent and quality of investment management, shareholder services and other services provided to the Fund;
• the wide range of programs and services the Advisor provides to the Fund and its shareholders on a routine and non-routine basis;
• the compliance policies, procedures, and regulatory experience of the Advisor;
• data comparing the cost of owning the Fund to the cost of owning similar funds;
• the fact that there will be no changes to the fees, services, or personnel who provide such services as compared to the Prior Management Agreement;
• data comparing the Fund’s performance to appropriate benchmarks and/ or a peer group of other mutual funds with similar investment objectives and strategies;
• financial data showing the profitability of the Fund to the Advisor and the overall profitability of the Advisor;
31
• data comparing services provided and charges to the Fund with those for other non-fund investment management clients of the Advisor; and
• consideration of collateral or “fall-out” benefits derived by the Advisor from the management of the Fund and potential sharing of economies of scale in connection with the management of the Fund.
The Board also considered whether there was any reason for not continuing the existing arrangement with the Advisor. In particular, the Board recognized that shareholders may have invested in the Fund on the strength of the Advisor’s industry standing and reputation and in the expectation that the Advisor will have a continuing role in providing advisory services to the Fund.
The Board considered all of the information provided by the Advisor, the independent data providers, and the Board’s independent legal counsel, and evaluated such information for the Fund. The Board did not identify any single factor as being all-important or controlling, and each Board member may have attributed different levels of importance to different factors. In deciding to approve the Current Management Agreement under the terms ultimately determined by the Board to be appropriate, the Board based its decision on a number of factors, including the following:
Nature, Extent and Quality of Services – Generally. Under the Current Management Agreement, the Advisor is responsible for providing or arranging for all services necessary for the operation of the Fund. The Board noted that under the Current Management Agreement, the Advisor provides or arranges at its own expense a wide variety of services including:
• constructing and designing the Fund
• portfolio research and security selection
• initial capitalization/funding
• securities trading
• Fund administration
• custody of Fund assets
• daily valuation of the Fund’s portfolio
• shareholder servicing and transfer agency, including shareholder confir-
mations, recordkeeping and communications
• legal services
• regulatory and portfolio compliance
• financial reporting
• marketing and distribution
32
The Board noted that many of these services have expanded over time both in terms of quantity and complexity in response to shareholder demands, competition in the industry, changing distribution channels and the changing regulatory environment.
Investment Management Services. The investment management services provided to the Fund are complex and provide Fund shareholders access to professional money management, instant diversification of their investments within an asset class, the opportunity to easily diversify among asset classes, and liquidity. As a part of its general oversight and in evaluating investment performance, the Board expects the Advisor to manage the Fund in accordance with its investment objectives and approved strategies. In providing these services, the Advisor utilizes teams of investment professionals who require extensive information technology, research, training, compliance and other systems to conduct their business. The Board, directly and through its Portfolio Committee, regularly reviews investment performance information for the Fund, t ogether with comparative information for appropriate benchmarks and/or peer groups of similarly-managed funds, over different time horizons. If performance concerns are identified, the underperforming Fund receives special reviews until performance improves, during which time the Board discusses with the Advisor the reasons for such underperformance and any efforts being undertaken to improve performance.
Shareholder and Other Services. Under the Current Management Agreement, the Advisor will also provide the Fund with a comprehensive package of transfer agency, shareholder, and other services. The Board, directly and through the various committees of the Board, regularly reviews reports and evaluations of such services. These reports include, but are not limited to, information regarding the operational efficiency and accuracy of the shareholder and transfer agency services provided, staffing levels, shareholder satisfaction (as measured by external as well as internal sources), technology support, new products and services offered to Fund shareholders, securities trading activities, portfolio valuation services, auditing services, and legal and operational compliance activities. Certain aspects of shareholder and transfer age ncy service level efficiency and the quality of securities trading activities are measured by independent third party providers and are presented in comparison to other fund groups not managed by the Advisor.
Costs of Services Provided and Profitability. The Advisor provided detailed information concerning its cost of providing various services to the Fund, its profitability in managing the Fund, its overall profitability, and its financial condition. The Board reviewed with the Advisor the methodology used to prepare this financial information. The Board has also reviewed with the Advisor its methodology for compensating the investment professionals that provide services to the Fund as well as compensation to the five highest paid personnel of the Advisor. This financial information regarding the Advisor is considered in order to evaluate the Advisor’s financial condition, its ability to continue to provide services under the Current Management Agreement, and the reasonableness of the current management fees.
33
Ethics. The Board generally considers the Advisor’s commitment to providing quality services to shareholders and to conducting its business ethically. It noted that the Advisor’s practices generally meet or exceed industry best practices.
Economies of Scale. The Board also reviewed information provided by the Advisor regarding the possible existence of economies of scale in connection with the management of the Fund. The Board concluded that economies of scale are difficult to measure and predict with precision, especially on a fund-by-fund basis. The analysis of economies of scale is further complicated by the additional services and content provided by the Advisor and its reinvestment in its ability to provide and expand those services. Accordingly, the Board seeks to evaluate economies of scale by reviewing information, such as year-over-ye r profitability of the Advisor generally, the profitability of its management of the Fund specifically, and the expenses incurred by the Advisor in providing various functions to the Fund. The Board believes the Advisor i s appropriately sharing economies of scale through its competitive fee structure, offering competitive fees from fund inception, fee breakpoints as the fund complex and the Fund increases in size, and through reinvestment in its business to provide shareholders additional services and enhancements to existing services. In particular, separate breakpoint schedules based on the size of the entire fund complex and on the size of the Fund reflect the complexity of assessing economies of scale.
Comparison to Fees of Funds not Managed by the Advisor. Both the Prior and Current Management Agreements provide that the Fund pays the Advisor a single, all-inclusive (or unified) management fee for providing all services necessary for the management and operation of the Fund, other than brokerage expenses, taxes, interest, extraordinary expenses, and the fees and expenses of the Fund’s Independent Directors (including their independent legal counsel) and expenses incurred in connection with the provision of shareholder services and distribution services under a plan adopted pursuant to Rule 12b-1 under the 1940 Act. Under the unified fee structure, the Advisor is responsible for providing all investment advisory, custody, audit, administrative, compliance, recordkeeping, marketing and shareholder services, or arranging and supervising third parties that provide such services. By contrast, most other funds are charged a variety of fees, including an investment advisory fee, a transfer agency fee, an administrative fee, distribution charges and other expenses. Other than their investment advisory fees and any applicable Rule 12b-1 distribution fees, the components of the total fees charged by these other funds may be increased without shareholder approval. The Board believes the unified fee structure is a benefit to Fund shareholders because it clearly discloses to shareholders the cost of owning Fund shares, and, since the unified fee cannot be increased without a vote of Fund shareholders, it shifts to the Advisor the risk of increased costs of operating the Fund and provides a direct incentive to minimize administrative inefficiencies. Part of the Board’s analysis of fee levels involves reviewing certain evaluative data compiled by an independent provider comparing the Fund’s unified fee to the total expense rat ios of similar funds not managed by the Advisor. The
34
Board concluded that the management fee to be paid by the Fund to the Advisor under the Current Management Agreement is reasonable in light of the services to be provided to the Fund.
Comparison to Fees and Services Provided to Other Clients of the Advisor. The Board also requested and received information from the Advisor concerning the nature and extent of the services, fees, and profitability of its advisory services to advisory clients other than the Fund. They observed that these varying types of client accounts require different services and involve different regulatory and entrepreneurial risks than the management of the Fund. The Board analyzed this information and concluded that the fees charged and services provided to the Fund were reasonable by comparison.
Collateral or “Fall-Out” Benefits Derived by the Advisor. The Board considered the existence of collateral benefits the Advisor may receive as a result of its relationship with the Fund. The Board concluded that the Advisor’s primary business is managing mutual funds and it generally does not use Fund or shareholder information to generate profits in other lines of business, and therefore does not derive any significant collateral benefits from them. The Board noted that the Advisor receives proprietary research from broker-dealers that execute Fund portfolio transactions and concluded that this research is likely to benefit Fund shareholders. The Board also determined that the Advisor is able to provide investment management services to certain clients other than the Fund, at least in part, due to its existing infrastructure built to serve the fund complex. The Board concluded, however, that the assets of those other clients are not material to the analysis and, in any event, are included with the assets of the Fund to determine breakpoints in the Fund’s fee schedule, provided they are managed using the same investment team and strategy.
Conclusion of the Board. As a result of this process, the Board, in the absence of particular circumstances and assisted by the advice of its independent legal counsel, taking into account all of the factors discussed above and the information provided by the Advisor and others, concluded that the Current Management Agreement be approved and recommended its approval to Fund shareholders.
35
Proxy Voting Guidelines
American Century Investment Management, Inc., the fund’s investment advisor, is responsible for exercising the voting rights associated with the securities purchased and/or held by the fund. A description of the policies and procedures the advisor uses in fulfilling this responsibility is available without charge, upon request, by calling 1-800-378-9878. It is also available on American Century Investments’ website at americancentury.com and on the Securities and Exchange Commission’s website at sec.gov. Information regarding how the investment advisor voted proxies relating to portfolio securities during the most recent 12-month period ended June 30 is available on the “About Us” page at americancentury.com. It is also available at sec.gov.
Quarterly Portfolio Disclosure
The fund files its complete schedule of portfolio holdings with the Securities and Exchange Commission (SEC) for the first and third quarters of each fiscal year on Form N-Q. The fund’s Forms N-Q are available on the SEC’s website at sec.gov, and may be reviewed and copied at the SEC’s Public Reference Room in Washington, DC. Information on the operation of the Public Reference Room may be obtained by calling 1-800-SEC-0330. The fund also makes its complete schedule of portfolio holdings for the most recent quarter of its fiscal year available on its website at ipro.americancentury.com (for Investment Professionals) and, upon request, by calling 1-800-378-9878.
36
The following indices are used to illustrate investment market, sector, or style performance or to serve as fund performance comparisons. They are not investment products available for purchase.
The Barclays Capital U.S. Agencies Index is the agencies component of the U.S. Aggregate: Government-Related Index, a subset of the broader Barclays Capital U.S. Aggregate Index.
The Barclays Capital U.S. Aggregate Index represents securities that are taxable, registered with the Securities and Exchange Commission, and U.S. dollar-denominated. The index covers the U.S. investment-grade fixed-rate bond market, with index components for government and corporate securities, mortgage pass-through securities, and asset-backed securities.
The Barclays Capital U.S. Corporate High-Yield Index covers the universe of fixed-rate, non-investment grade corporate debt of issuers in non-emerging market countries.
The Barclays Capital U.S. Corporate Investment-Grade Index is the U.S. corporate component of the U.S. Government/Credit Index, a subset of the of the Barclays Capital U.S. Aggregate Index, and includes publicly issued U.S. corporate and specified foreign debentures and secured notes.
The Barclays Capital U.S. Mortgage-Backed Securities Index is a component of the U.S. Aggregate Index and covers the mortgage-backed pass-through securities of Ginnie Mae (GNMA), Fannie Mae (FNMA) and Freddie Mac (FHLMC).
The Barclays Capital U.S. Treasury Index is composed of those securities included in the Barclays Capital U.S. Aggregate Index that are public obligations of the U.S. Treasury with a remaining maturity of one year or more.
The Barclays Capital U.S. Treasury Inflation Protected Securities (TIPS) Index consists of Treasury inflation-protected securities with a remaining maturity of one year or more.
The Citigroup US Inflation-Linked Securities Index (ILSI)SM measures the return of bonds with fixed-rate coupon payments that adjust for inflation as measured by the Consumer Price Index (CPI).
The Rogers International Commodities Index (RICI) was developed by Jim Rogers in 1998. It represents the value of a basket of 35 commodities used in the global economy, including agricultural and energy products, metals, and minerals.
37
38
39
40

| |
| |
| Contact Us | |
| americancentury.com | |
| Automated Information Line | 1-800-345-8765 |
| Investment Professional Service Representatives | 1-800-345-6488 |
| Telecommunications Device for the Deaf | 1-800-634-4113 |
| American Century Variable Portfolios II, Inc. | |
| Investment Advisor: | |
| American Century Investment Management, Inc. | |
| Kansas City, Missouri | |
This report and the statements it contains are submitted for the general
information of our shareholders. The report is not authorized for distribution to
prospective investors unless preceded or accompanied by an effective prospectus.
American Century Investment Services, Inc., Distributor
©2010 American Century Proprietary Holdings, Inc. All rights reserved.
1008
CL-SAN-68994
| |
| ITEM 2. CODE OF ETHICS. |
|
| Not applicable for semiannual report filings. |
|
| ITEM 3. AUDIT COMMITTEE FINANCIAL EXPERT. |
|
| Not applicable for semiannual report filings. |
|
| ITEM 4. PRINCIPAL ACCOUNTANT FEES AND SERVICES. |
|
| Not applicable for semiannual report filings. |
|
| ITEM 5. AUDIT COMMITTEE OF LISTED REGISTRANTS. |
|
| Not applicable. |
|
| ITEM 6. INVESTMENTS. |
| |
| (a) | The schedule of investments is included as part of the report to stockholders filed under Item 1 |
| | of this Form. |
| |
| (b) | Not applicable. |
|
| ITEM 7. DISCLOSURE OF PROXY VOTING POLICIES AND PROCEDURES FOR |
| CLOSED-END MANAGEMENT INVESTMENT COMPANIES. |
|
| Not applicable. |
|
| ITEM 8. PORTFOLIO MANAGERS OF CLOSED-END MANAGEMENT |
| INVESTMENT COMPANIES. |
|
| Not applicable. |
|
| ITEM 9. PURCHASES OF EQUITY SECURITIES BY CLOSED-END MANAGEMENT |
| INVESTMENT COMPANY AND AFFILIATED PURCHASERS. |
|
| Not applicable. |
|
| ITEM 10. SUBMISSION OF MATTERS TO A VOTE OF SECURITY HOLDERS. |
|
| During the reporting period, there were no material changes to the procedures by which shareholders may |
| recommend nominees to the registrant’s board. |
| | |
| ITEM 11. CONTROLS AND PROCEDURES. |
| |
| (a) | The registrant's principal executive officer and principal financial officer have concluded that |
| | | the registrant's disclosure controls and procedures (as defined in Rule 30a-3(c) under the |
| | | Investment Company Act of 1940) are effective based on their evaluation of these controls and |
| | | procedures as of a date within 90 days of the filing date of this report. |
| |
| (b) | There were no changes in the registrant's internal control over financial reporting (as defined in |
| | | Rule 30a-3(d) under the Investment Company Act of 1940) that occurred during the registrant's |
| | | second fiscal quarter of the period covered by this report that have materially affected, or are |
| | | reasonably likely to materially affect, the registrant's internal control over financial reporting. |
| |
| ITEM 12. EXHIBITS. |
| |
| (a) | (1) | Not applicable for semiannual report filings. |
| |
| (a) | (2) | Separate certifications by the registrant’s principal executive officer and principal financial |
| | | officer, pursuant to Section 302 of the Sarbanes-Oxley Act of 2002 and Rule 30a-2(a) under the |
| | | Investment Company Act of 1940, are filed and attached hereto as EX-99.CERT. |
| |
| (a) | (3) | Not applicable. |
| |
| (b) | | A certification by the registrant’s chief executive officer and chief financial officer, pursuant to |
| | | Section 906 of the Sarbanes-Oxley Act of 2002, is furnished and attached hereto as EX- |
| | | 99.906CERT. |
SIGNATURES
Pursuant to the requirements of the Securities Exchange Act of 1934 and the Investment Company Act of 1940, the registrant has duly caused this report to be signed on its behalf by the undersigned, thereunto duly authorized.
| | |
| Registrant: | American Century Variable Portfolios II, Inc. |
| |
| By: | /s/ Jonathan S. Thomas |
| | Name: | Jonathan S. Thomas |
| | Title: | President |
| |
| Date: | August 16, 2010 |
Pursuant to the requirements of the Securities Exchange Act of 1934 and the Investment Company Act of 1940, this report has been signed below by the following persons on behalf of the registrant and in the capacities and on the dates indicated.
| | |
| By: | /s/ Jonathan S. Thomas |
| | Name: | Jonathan S. Thomas |
| | Title: | President |
| | | (principal executive officer) |
| |
| Date: | August 16, 2010 |
| | |
| By: | /s/ Robert J. Leach |
| | Name: | Robert J. Leach |
| | Title: | Vice President, Treasurer, and |
| | | Chief Financial Officer |
| | | (principal financial officer) |
| |
| Date: | August 16, 2010 |