FRANKLIN
LARGE CAP EQUITY FUND
1
Semiannual Report
Franklin Large Cap Equity Fund
Your Fund’s Goal and Main Investments: Franklin Large Cap Equity Fund seeks long-term growth of principal and income through normally investing at least 80% of its net assets in equity securities of large capitalization companies with market capitalizations within the top 50% of companies in the Russell 1000® Index, or of more than $5 billion, at the time of purchase.1 The Fund attempts to keep taxable capital gains distributions relatively low.
Performance data represent past performance, which does not guarantee future results. Investment return and principal value will fluctuate, and you may have a gain or loss when you sell your shares. Current performance may differ from figures shown. Please visit franklintempleton.com or call (800) 342-5236 for most recent month-end performance.
We are pleased to bring you Franklin Large Cap Equity Fund’s semiannual report for the period ended January 31, 2011.
Performance Overview
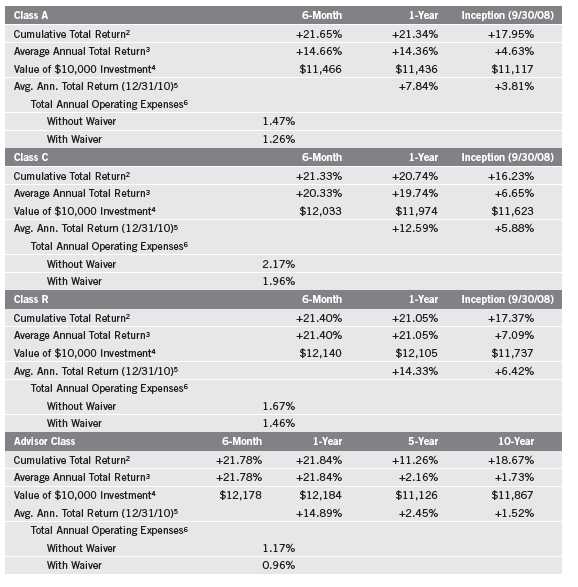
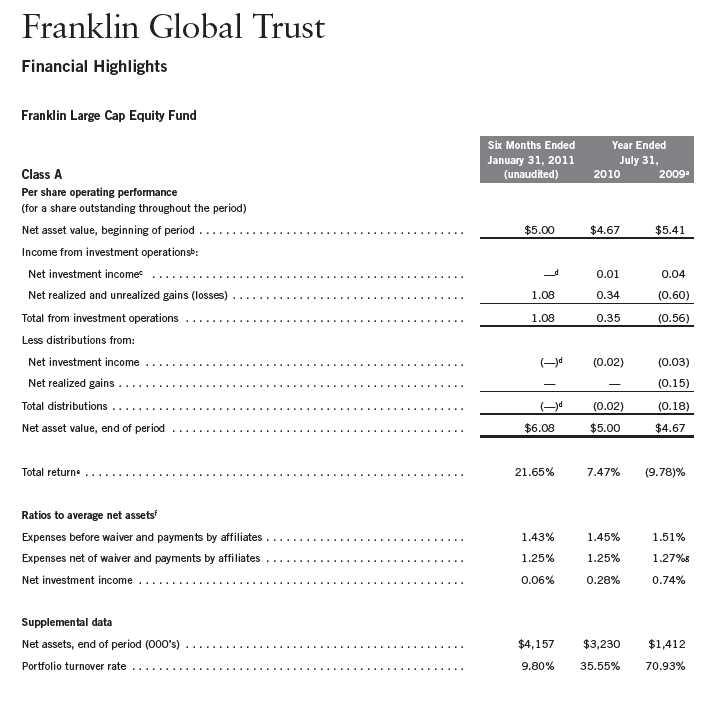
Franklin Large Cap Equity Fund – Class A delivered a +21.65% cumulative total return for the six months ended January 31, 2011. The Fund outperformed U.S. stocks as measured by its benchmark, the Standard & Poor’s 500 Index (S&P 500), which posted a +17.93% total return during the same period.2 You can find other Fund performance data in the Performance Summary beginning on page 7.
Economic and Market Overview
During the six-month period ended January 31, 2011, the U.S. economic recovery continued. In 2010’s third quarter, U.S. gross domestic product (GDP) growth increased at a modest 2.6% annualized rate as trade dynamics turned negative and government spending waned. In the fourth quarter, GDP rose at an annualized 2.8% rate amid rising exports, shrinking imports, and increased
1. The Russell 1000 Index is market capitalization weighted and measures performance of the largest companies in the Russell 3000 Index, which represent the majority of the U.S. market’s total capitalization.
2. Source: © 2011 Morningstar. All Rights Reserved. The information contained herein: (1) is proprietary to Morningstar and/or its content providers; (2) may not be copied or distributed; and (3) is not warranted to be accurate, complete or timely. Neither Morningstar nor its content providers are responsible for any damages or losses arising from any use of this information. STANDARD & POOR’S®, S&P® and S&P 500® are registered trademarks of Standard & Poor’s Financial Services LLC. Standard & Poor’s does not sponsor, endorse, sell or promote any S&P index-based product. The index is unmanaged and includes reinvested distributions. One cannot invest directly in an index, and an index is not representative of the Fund’s portfolio.
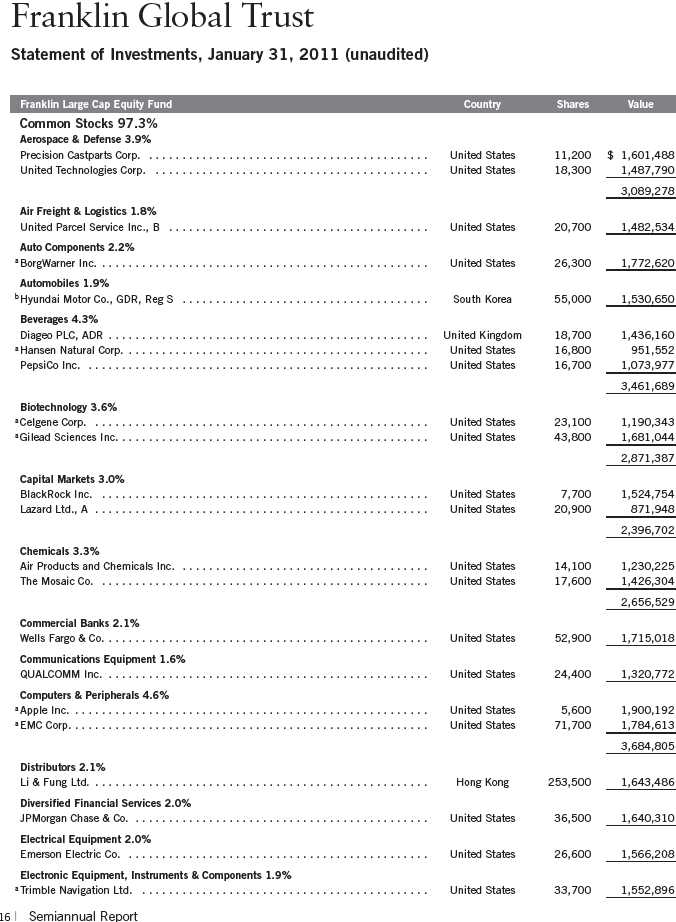
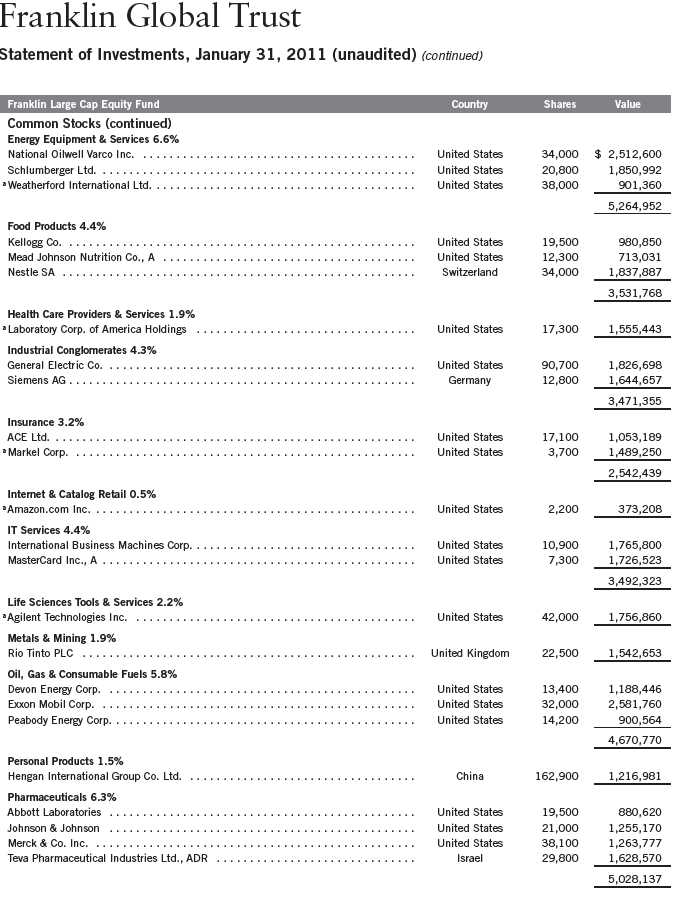
The dollar value, number of shares or principal amount, and names of all portfolio holdings are listed in the Fund’s Statement of Investments (SOI). The SOI begins on page 16.
Semiannual Report | 3
consumer and business spending. Corporate profits largely surpassed consensus estimates during the period, and many businesses restocked depleted inventories. Challenges remained as mixed economic data, elevated debt concerns surrounding the U.S. budget deficit and a lack of job prospects for the unemployed reflected considerable slack in the economy.
Amid signs of a demand-led global recovery, oil prices rose from $79 per barrel at the end of July to a six-month high of $92 at period-end. The January 2011 inflation rate was an annualized 1.6%, while core inflation, which excludes volatile food and energy costs, stood at a 1.0% annualized rate.3 During the reporting period, companies generally added jobs, and the unemployment rate fell from 9.5% in July to 9.0% in January.3 However, job gains were generally weak during the period, and the declining unemployment rate was partly attributable to a shrinking labor force as some unemployed workers stopped looking for jobs.
Given lingering uncertainty surrounding the economic recovery and few inflationary pressures, the Federal Open Market Committee (FOMC) made no major changes to its monetary policy early in the period. The FOMC kept the federal funds target rate within the exceptionally low 0% to 0.25% range while shifting its focus to its outlook and the status of its current holdings. In September, the FOMC revealed concerns about the subdued recovery and said inflation was below the pace “consistent with its mandate.” Having already lowered interest rates effectively to zero, the FOMC announced its intention to purchase government securities to stimulate the economy and promote a low level of inflation consistent with healthy economic growth.
Equity markets were volatile as investor confidence shifted with each release of encouraging or discouraging economic, regulatory and political news. Ultimately, stock indexes experienced solid gains during the six months under review amid generally improving economic signs and rising consumer spending. Overall, the blue-chip stocks of the Dow Jones Industrial Average posted a +15.16% total return, while the broader S&P 500 generated a +17.93% total return and the technology-heavy NASDAQ Composite Index produced a +20.34% total return.2 During the period, growth stocks outperformed their value counterparts. Performance among the major sectors was positive, with energy, materials and industrials making the largest gains, while utilities and consumer staples had weaker results.
3. Source: Bureau of Labor Statistics.
4 | Semiannual Report
Investment Strategy
We are research-driven, fundamental investors, pursuing a blend of growth and value strategies. We use a top-down analysis of macroeconomic trends, market sectors (with some attention to the sector weightings in the Fund’s comparative index) and industries combined with a bottom-up analysis of individual securities. In selecting investments for the Fund, we look for companies we believe are positioned for growth in revenues, earnings or assets, and are selling at reasonable prices. We also consider the level of dividends a company has paid. We employ a thematic approach to identify sectors that may benefit from longer term dynamic growth. Within these sectors, we consider the basic financial and operating strength and quality of a company and company management. The Fund, from time to time, may have significant positions in particular sectors such as technology or industrials. We also seek to identify companies that we believe are temporarily out of favor with investors, but have a good intermediate- or long-term outlook.
Manager’s Discussion
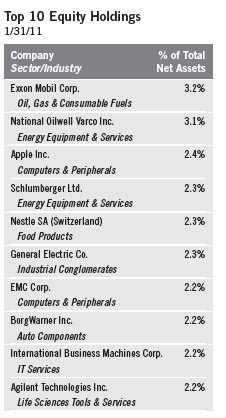
During the period under review, most of the Fund’s holdings rose in value. The consumer discretionary sector was a major contributor to performance relative to the benchmark S&P 500, as were the information technology (IT), energy and materials sectors, mainly due to stock selection.4 In the consumer discretionary sector, automotive industry-related companies Hyundai Motor5 and BorgWarner5 performed well, as did apparel industry holdings Li & Fung5 and Polo Ralph Lauren. In the IT sector, strong performance from Trimble Navigation,5 a manufacturer of global positioning systems for the engineering, construction and agriculture industries, benefited relative performance. QUALCOMM, which detracted from results in some prior periods, rebounded strongly during the six months under review and was also a key contributor in the IT sector. The Fund’s investments in energy sector holding National Oilwell Varco, a manufacturer of oil and gas drilling and production products, and materials sector position The Mosaic Co.,5 a fertilizer company, each performed well during the period and were leading contributors.
Significant detractors from relative Fund results included stock selection in the consumer staples sector, where Chinese disposable diapers manufacturer Hengan International Group5 largely accounted for the sector’s relatively
4. The consumer discretionary sector comprises auto components; automobiles; distributors; Internet and catalog retail; specialty retail; and textiles, apparel and luxury goods in the SOI. The IT sector comprises communications equipment; computers and peripherals; electronic equipment, instruments and components; IT services; semiconductors and semiconductor equipment; and software in the SOI. The energy sector comprises energy equipment and services; and oil, gas and consumable fuels in the SOI. The materials sector comprises chemicals and metals and mining in the SOI.
5. This holding is not a component of the S&P 500.
Semiannual Report | 5
weak performance.6 We continued to hold the stock at period-end given what we believe is a potentially bright future for the company due to China’s expanding middle class. The Fund’s cash position also hindered relative results in a period of generally rising stock prices.
Thank you for your continued participation in Franklin Large Cap Equity Fund. We look forward to serving your future investment needs.

Portfolio Management Team
Franklin Large Cap Equity Fund
The foregoing information reflects our analysis, opinions and portfolio holdings as of January 31, 2011, the end of the reporting period. The way we implement our main investment strategies and the resulting portfolio holdings may change depending on factors such as market and economic conditions. These opinions may not be relied upon as investment advice or an offer for a particular security. The information is not a complete analysis of every aspect of any market, country, industry, security or the Fund. Statements of fact are from sources considered reliable, but the investment manager makes no representation or warranty as to their completeness or accuracy. Although historical performance is no guarantee of future results, these insights may help you understand our investment management philosophy.
6. The consumer staples sector comprises beverages, food products and personal products in the SOI.
6 | Semiannual Report
Performance Summary as of 1/31/11
Your dividend income will vary depending on dividends or interest paid by securities in the Fund’s portfolio, adjusted for operating expenses of each class. Capital gain distributions are net profits realized from the sale of portfolio securities. The performance table does not reflect any taxes that a shareholder would pay on Fund dividends, capital gain distributions, if any, or any realized gains on the sale of Fund shares. Total return reflects reinvestment of the Fund’s dividends and capital gain distributions, if any, and any unrealized gains or losses.
Semiannual Report | 7
Performance Summary (continued)
Performance1
Cumulative total return excludes sales charges. Average annual total returns and value of $10,000 investment include maximum sales charges. Class A: 5.75% maximum initial sales charge; Class C: 1% contingent deferred sales charge in first year only; Class R/Advisor Class: no sales charges.
Performance data represent past performance, which does not guarantee future results. Investment return and principal value will fluctuate, and you may have a gain or loss when you sell your shares. Current performance may differ from figures shown. For most recent month-end performance, go to franklintempleton.com or call (800) 342-5236.
The investment manager and administrator have contractually agreed to waive or to assume certain expenses so that common expenses (excluding Rule 12b-1 fees and acquired fund fees and expenses) for each class of the Fund do not exceed 0.95% (other than certain nonroutine expenses) until 11/30/11.
8 | Semiannual Report
Performance Summary (continued)
Endnotes
While stocks have historically outperformed other asset classes over the long term, they tend to fluctuate more dramatically over the short term. There are special risks involved with significant exposure to a particular sector, including increased susceptibility related to economic, business, or other developments affecting that sector, which may result in increased volatility. The Fund’s investments in foreign company stocks involve special risks including currency fluctuations and political uncertainty. The manager applies various techniques and analyses in making investment decisions for the Fund, but there can be no guarantee that these decisions will produce the desired results. The Fund’s prospectus also includes a description of the main investment risks.
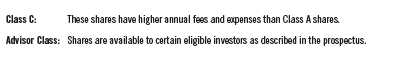
Class C: These shares have higher annual fees and expenses than Class A shares.
Class R: Shares are available to certain eligible investors as described in the prospectus. These shares have higher annual fees and expenses than Class A shares.
Advisor Class: Shares are available to certain eligible investors as described in the prospectus.
1. If the manager and administrator had not waived fees, the Fund’s total returns would have been lower. 2. Cumulative total return represents the change in value of an investment over the periods indicated.
3. Average annual total return represents the average annual change in value of an investment over the periods indicated. Six-month return has not been annualized.
4. These figures represent the value of a hypothetical $10,000 investment in the Fund over the periods indicated.
5. In accordance with SEC rules, we provide standardized average annual total return information through the latest calendar quarter.
6. Figures are as stated in the Fund’s prospectus current as of the date of this report. In periods of market volatility, assets may decline significantly, causing total annual Fund operating expenses to become higher than the figures shown.
Semiannual Report | 9
Your Fund’s Expenses
As a Fund shareholder, you can incur two types of costs:
- Transaction costs, including sales charges (loads) on Fund purchases, if applicable; and
- Ongoing Fund costs, including management fees, distribution and service (12b-1) fees, if appli- cable, and other Fund expenses. All mutual funds have ongoing costs, sometimes referred to as operating expenses.
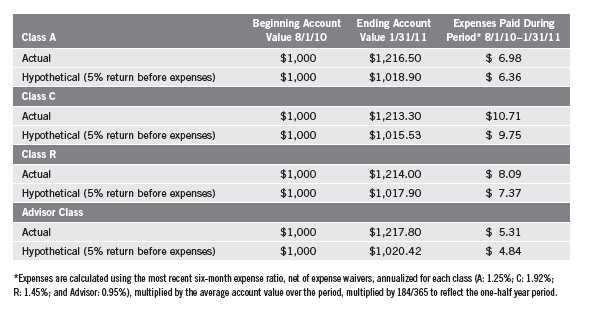
The following table shows ongoing costs of investing in the Fund and can help you understand these costs and compare them with those of other mutual funds. The table assumes a $1,000 investment held for the six months indicated.
Actual Fund Expenses
The first line (Actual) for each share class listed in the table provides actual account values and expenses. The “Ending Account Value” is derived from the Fund’s actual return, which includes the effect of Fund expenses.
You can estimate the expenses you paid during the period by following these steps. Of course, your account value and expenses will differ from those in this illustration:
| 1. | Divide your account value by $1,000. |
| | If an account had an $8,600 value, then $8,600 ÷ $1,000 = 8.6. |
| 2. | Multiply the result by the number under the heading “Expenses Paid During Period.” |
| | If Expenses Paid During Period were $7.50, then 8.6 x $7.50 = $64.50. |
In this illustration, the estimated expenses paid this period are $64.50.
Hypothetical Example for Comparison with Other Funds
Information in the second line (Hypothetical) for each class in the table can help you compare ongoing costs of investing in the Fund with those of other mutual funds. This information may not be used to estimate the actual ending account balance or expenses you paid during the period. The hypothetical “Ending Account Value” is based on the actual expense ratio for each class and an assumed 5% annual rate of return before expenses, which does not represent the Fund’s actual return. The figure under the heading “Expenses Paid During Period” shows the hypothetical expenses your account would have incurred under this scenario. You can compare this figure with the 5% hypothetical examples that appear in shareholder reports of other funds.
10 | Semiannual Report
Your Fund’s Expenses (continued)
Please note that expenses shown in the table are meant to highlight ongoing costs and do not reflect any transaction costs, such as sales charges. Therefore, the second line of the table is useful in comparing ongoing costs only, and will not help you compare total costs of owning different funds. In addition, if transaction costs were included, your total costs would have been higher. Please refer to the Fund prospectus for additional information on operating expenses.
Semiannual Report | 11
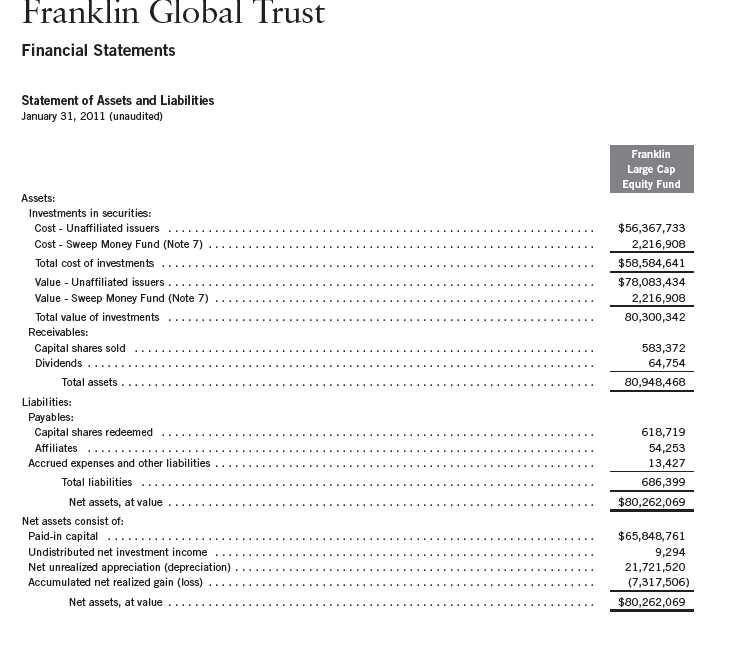
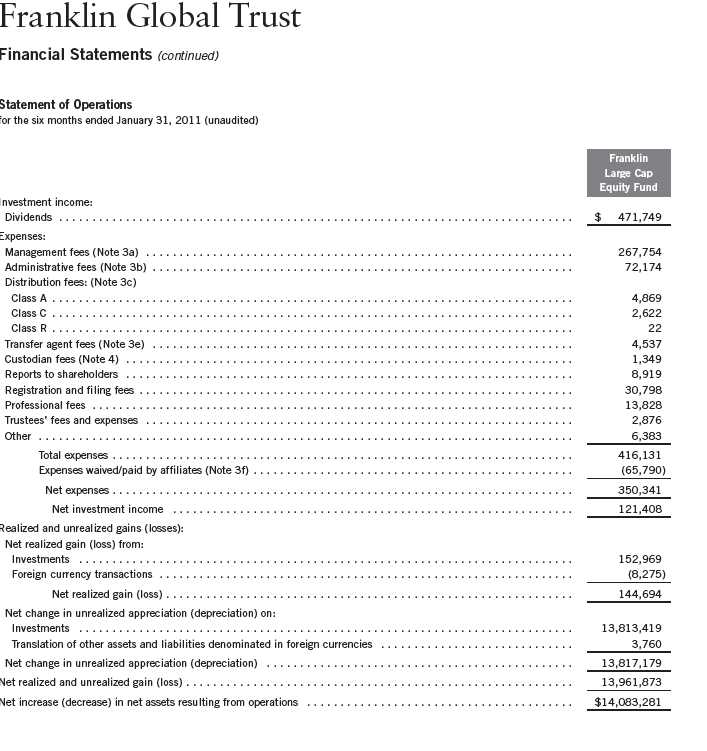
12 | The accompanying notes are an integral part of these financial statements. | Semiannual Report
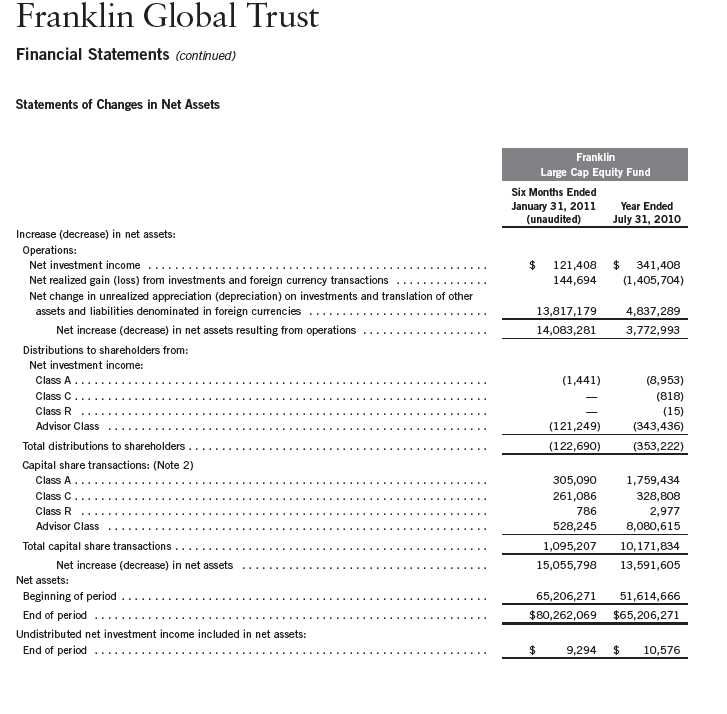
Semiannual Report | The accompanying notes are an integral part of these financial statements. | 13

14 | The accompanying notes are an integral part of these financial statements. | Semiannual Report

Semiannual Report | The accompanying notes are an integral part of these financial statements. | 15
Semiannual Report | 17
Semiannual Report | The accompanying notes are an integral part of these financial statements. | 19

20 | The accompanying notes are an integral part of these financial statements. | Semiannual Report
Semiannual Report | The accompanying notes are an integral part of these financial statements. | 21
22 | The accompanying notes are an integral part of these financial statements. | Semiannual Report
Franklin Global Trust
Notes to Financial Statements (unaudited)
Franklin Large Cap Equity Fund
1. ORGANIZATION AND SIGNIFICANT ACCOUNTING POLICIES
Franklin Global Trust (Trust) is registered under the Investment Company Act of 1940, as amended, (1940 Act) as an open-end investment company, consisting of five separate funds. The Franklin Large Cap Equity Fund (Fund) is included in this report. The financial statements of the remaining funds in the Trust are presented separately. The Fund offers four classes of shares: Class A, Class C, Class R, and Advisor Class. Each class of shares differs by its initial sales load, contingent deferred sales charges, distribution fees, voting rights on matters affecting a single class and its exchange privilege.
The following summarizes the Fund’s significant accounting policies.
a. Financial Instrument Valuation
The Fund values its investments in securities and other financial instruments carried at fair value daily. Fair value is the price that would be received to sell an asset or paid to transfer a liability in an orderly transaction between market participants on the measurement date. Under procedures approved by the Trust’s Board of Trustees, the Fund may utilize independent pricing services, quotations from securities and financial instrument dealers, and other market sources to determine fair value.
Equity securities listed on an exchange or on the NASDAQ National Market System are valued at the last quoted sale price or the official closing price of the day, respectively. Foreign equity securities are valued as of the close of trading on the foreign stock exchange on which the security is primarily traded, or the NYSE, whichever is earlier. The value is then converted into its U.S. dollar equivalent at the foreign exchange rate in effect at the close of the NYSE on the day that the value of the security is determined. Over-the-counter securities are valued within the range of the most recent quoted bid and ask prices. Securities that trade in multiple markets or on multiple exchanges are valued according to the broadest and most representative market. Certain equity securities are valued based upon fundamental characteristics or relationships to similar securities. Investments in open-end mutual funds are valued at the closing net asset value.
The Fund has procedures to determine the fair value of securities and other financial instruments for which market prices are not readily available or which may not be reliably priced. Under these procedures, the Fund primarily employs a market-based approach which may use related or comparable assets or liabilities, recent transactions, market multiples, book values, and other relevant information for the investment to determine the fair value of the investment. The Fund may also use an income-based valuation approach in which the anticipated future cash flows of the investment are discounted to calculate fair value. Discounts may also be applied due to the nature or duration of any restrictions on the disposition of the investments. Due to the inherent uncertainty of valuations of such investments, the fair values may differ significantly from the values that would have been used had an active market existed.
Semiannual Report | 23
Franklin Global Trust
Notes to Financial Statements (unaudited) (continued)
Franklin Large Cap Equity Fund
| 1. | ORGANIZATION AND SIGNIFICANT ACCOUNTING POLICIES (continued) |
| a. | Financial Instrument Valuation (continued) |
Trading in securities on foreign securities stock exchanges and over-the-counter markets may be completed before the daily close of business on the NYSE. Occasionally, events occur between the time at which trading in a foreign security is completed and the close of the NYSE that might call into question the reliability of the value of a portfolio security held by the Fund. As a result, differences may arise between the value of the Fund’s portfolio securities as determined at the foreign market close and the latest indications of value at the close of the NYSE. In order to minimize the potential for these differences, the investment manager monitors price movements following the close of trading in foreign stock markets through a series of country specific market proxies (such as baskets of American Depository Receipts, futures contracts and exchange traded funds). These price movements are measured against established trigger thresholds for each specific market proxy to assist in determining if an event has occurred that may call into question the reliability of the values of the foreign securities held by the Fund. If such an event occurs, the securities may be valued using fair value procedures, which may include the use of independent pricing services.
b. Foreign Currency Translation
Portfolio securities and other assets and liabilities denominated in foreign currencies are translated into U.S. dollars based on the exchange rate of such currencies against U.S. dollars on the date of valuation. The Fund may enter into foreign currency exchange contracts to facilitate transactions denominated in a foreign currency. Purchases and sales of securities, income and expense items denominated in foreign currencies are translated into U.S. dollars at the exchange rate in effect on the transaction date. Portfolio securities and assets and liabilities denominated in foreign currencies contain risks that those currencies will decline in value relative to the U.S. dollar. Occasionally, events may impact the availability or reliability of foreign exchange rates used to convert the U.S. dollar equivalent value. If such an event occurs, the foreign exchange rate will be valued at fair value using procedures established and approved by the Trust’s Board of Trustees.
The Fund does not separately report the effect of changes in foreign exchange rates from changes in market prices on securities held. Such changes are included in net realized and unrealized gain or loss from investments on the Statement of Operations.
Realized foreign exchange gains or losses arise from sales of foreign currencies, currency gains or losses realized between the trade and settlement dates on securities transactions and the difference between the recorded amounts of dividends, interest, and foreign withholding taxes and the U.S. dollar equivalent of the amounts actually received or paid. Net unrealized foreign exchange gains and losses arise from changes in foreign exchange rates on foreign denominated assets and liabilities other than investments in securities held at the end of the reporting period.
24 | Semiannual Report
Franklin Global Trust
Notes to Financial Statements (unaudited) (continued)
Franklin Large Cap Equity Fund
| 1. | ORGANIZATION AND SIGNIFICANT ACCOUNTING POLICIES (continued) |
| c. | Income Taxes |
It is the Fund’s policy to qualify as a regulated investment company under the Internal Revenue Code. The Fund intends to distribute to shareholders substantially all of its taxable income and net realized gains to relieve it from federal income and excise taxes. As a result, no provision for U.S. federal income taxes is required. The Fund files U.S. income tax returns as well as tax returns in certain other jurisdictions. The Fund’s application of those tax rules is subject to its understanding. The Fund records a provision for taxes in its financial statements including penalties and interest, if any, for a tax position taken on a tax return (or expected to be taken) when it fails to meet the more likely than not (a greater than 50% probability) threshold and based on the technical merits, the tax position may not be sustained upon examination by the tax authorities. As of January 31, 2011, and for all open tax years, the Fund has determined that no provision for income tax is required in the Fund’s financial statements. Open tax years are those that remain subject to examination and are based on each tax jurisdiction statute of limitation. The Fund is not aware of any tax position for which it is reasonably possible that the total amounts of unrecognized tax effects will significantly change in the next twelve months.
d. Security Transactions, Investment Income, Expenses and Distributions
Security transactions are accounted for on trade date. Realized gains and losses on security transactions are determined on a specific identification basis. Estimated expenses are accrued daily. Dividend income is recorded on the ex-dividend date except that certain dividends from foreign securities are recognized as soon as the Fund is notified of the ex-dividend date. Distributions to shareholders are recorded on the ex-dividend date and are determined according to income tax regulations (tax basis). Distributable earnings determined on a tax basis may differ from earnings recorded in accordance with accounting principles generally accepted in the United States of America. These differences may be permanent or temporary. Permanent differences are reclassified among capital accounts to reflect their tax character. These reclassifications have no impact on net assets or the results of operations. Temporary differences are not reclassified, as they may reverse in subsequent periods.
Common expenses incurred by the Trust are allocated among the funds based on the ratio of net assets of each fund to the combined net assets of the Trust. Fund specific expenses are charged directly to the fund that incurred the expense.
Realized and unrealized gains and losses and net investment income, not including class specific expenses, are allocated daily to each class of shares based upon the relative proportion of net assets of each class. Differences in per share distributions, by class, are generally due to differences in class specific expenses.
Semiannual Report | 25
Franklin Global Trust
Notes to Financial Statements (unaudited) (continued)
Franklin Large Cap Equity Fund
| 1. | ORGANIZATION AND SIGNIFICANT ACCOUNTING POLICIES (continued) |
| e. | Accounting Estimates |
The preparation of financial statements in accordance with accounting principles generally accepted in the United States of America requires management to make estimates and assumptions that affect the reported amounts of assets and liabilities at the date of the financial statements and the amounts of income and expenses during the reporting period. Actual results could differ from those estimates.
f. Guarantees and Indemnifications
Under the Trust’s organizational documents, its officers and trustees are indemnified by the Trust against certain liabilities arising out of the performance of their duties to the Trust. Additionally, in the normal course of business, the Trust, on behalf of the Fund, enters into contracts with service providers that contain general indemnification clauses. The Trust’s maximum exposure under these arrangements is unknown as this would involve future claims that may be made against the Trust that have not yet occurred. Currently, the Trust expects the risk of loss to be remote.
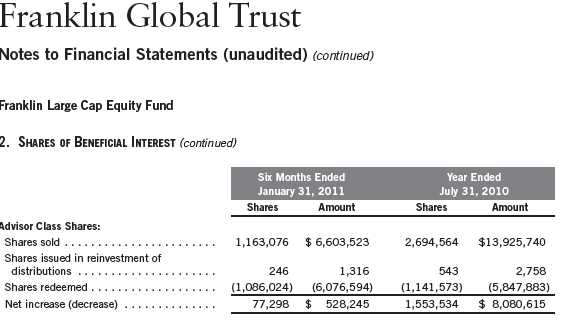
2. SHARES OF BENEFICIAL INTEREST
At January 31, 2011, there were an unlimited number of shares authorized (without par value).
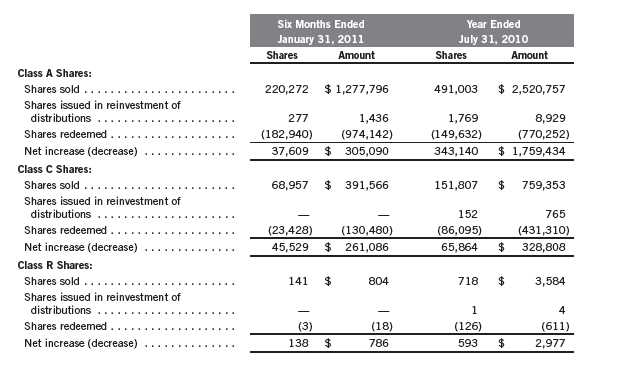
Transactions in the Fund’s shares were as follows:
26 | Semiannual Report
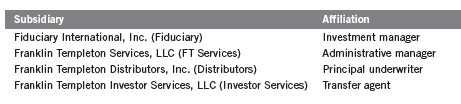
3. TRANSACTIONS WITH AFFILIATES
Franklin Resources, Inc. is the holding company for various subsidiaries that together are referred to as Franklin Templeton Investments. Certain officers and trustees of the Trust are also officers and/or directors of the following subsidiaries:
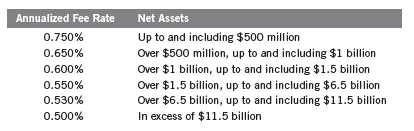
a. Management Fees
The Fund pays an investment management fee to Fiduciary based on the average daily net assets of the Fund as follows:
b. Administrative Fees
The Fund pays an administrative fee to FT Services of 0.20% per year of the average daily net assets of the Fund.
Semiannual Report | 27
Franklin Global Trust
Notes to Financial Statements (unaudited) (continued)
Franklin Large Cap Equity Fund
| 3. | TRANSACTIONS WITH AFFILIATES (continued) |
| c. | Distribution Fees |
The Trust’s Board of Trustees has adopted distribution plans for each share class, with the exception of Advisor Class shares, pursuant to Rule 12b-1 under the 1940 Act. Under the Fund’s Class A reimbursement distribution plan, the Fund reimburses Distributors for costs incurred in connection with the servicing, sale and distribution of the Fund’s shares up to the maximum annual plan rate. Under the Class A reimbursement distribution plan, costs exceeding the maximum for the current plan year cannot be reimbursed in subsequent periods.
In addition, under the Fund’s Class C and R compensation distribution plans, the Fund pays Distributors for costs incurred in connection with the servicing, sale and distribution of the Fund’s shares up to the maximum annual plan rate for each class.
The maximum annual plan rates, based on the average daily net assets, for each class, are as follows:
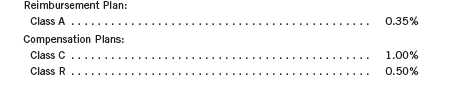
The Board of Trustees has set the current rate at 0.30% per year for Class A shares until further notice and approval by the Board.
d. Sales Charges/Underwriting Agreements
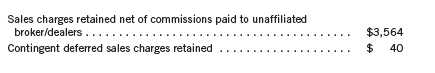
Distributors has advised the Fund of the following commission transactions related to the sales and redemptions of the Fund’s shares for the period:
e. Transfer Agent Fees
For the period ended January 31, 2011, the Fund paid transfer agent fees of $4,537, of which $3,416 was retained by Investor Services.
28 | Semiannual Report
Franklin Global Trust
Notes to Financial Statements (unaudited) (continued)
Franklin Large Cap Equity Fund
| 3. | TRANSACTIONS WITH AFFILIATES (continued) |
| f. | Waiver and Expense Reimbursements |
Fiduciary has contractually agreed in advance to waive or limit its respective fees and to assume as its own expense certain expenses otherwise payable by the fund so that the common expenses (i.e. a combination of management fees, administrative fees, and other expenses, but excluding distribution fees and acquired fund fees and expenses) for each class of the Fund do not exceed 0.95% (other than certain non-routine expenses or costs, including those relating to litigation, indemnification, reorganizations, and liquidations) until November 30, 2011.
4. EXPENSE OFFSET ARRANGEMENT
The Fund has entered into an arrangement with its custodian whereby credits realized as a result of uninvested cash balances are used to reduce a portion of the Fund’s custodian expenses. During the period ended January 31, 2011, there were no credits earned.
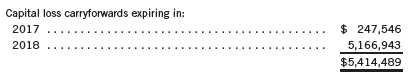
5. INCOME TAXES
For tax purposes, capital losses may be carried over to offset future capital gains, if any. At July 31, 2010, the capital loss carryforwards were as follows:
For tax purposes, realized capital losses and realized currency losses occurring subsequent to October 31 may be deferred and treated as occurring on the first day of the following fiscal year. At July 31, 2010, the Fund deferred realized capital losses and realized currency losses of $2,028,363 and $19,347, respectively.
At January 31, 2011, the cost of investments and net unrealized appreciation (depreciation) for income tax purposes were as follows:
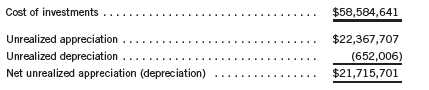
Net investment income and net realized gains (losses) differ for financial statement and tax purposes primarily due to differing treatment of foreign currency transactions.
Semiannual Report | 29
Franklin Global Trust
Notes to Financial Statements (unaudited) (continued)
Franklin Large Cap Equity Fund
6. INVESTMENT TRANSACTIONS
Purchases and sales of investments (excluding short term securities) for the period ended January 31, 2011, aggregated $11,710,836 and $6,659,276, respectively.
7. INVESTMENTS IN INSTITUTIONAL FIDUCIARY TRUST MONEY MARKET PORTFOLIO
The Fund may invest in the Institutional Fiduciary Trust Money Market Portfolio (Sweep Money Fund), an open-end investment company managed by Franklin Advisers, Inc. (an affiliate of the investment manager). Management fees paid by the Fund are reduced on assets invested in the Sweep Money Fund, in an amount not to exceed the management and administrative fees paid by the Sweep Money Fund.
8. CREDIT FACILITY
The Fund, together with other U.S. registered and foreign investment funds (collectively “Borrowers”), managed by Franklin Templeton Investments, are borrowers in a joint syndicated senior unsecured credit facility totaling $750 million (Global Credit Facility) which matures on January 20, 2012. This Global Credit Facility provides a source of funds to the Borrowers for temporary and emergency purposes, including the ability to meet future unanticipated or unusually large redemption requests.
Under the terms of the Global Credit Facility, the Fund shall, in addition to interest charged on any borrowings made by the Fund and other costs incurred by the Fund, pay its share of fees and expenses incurred in connection with the implementation and maintenance of the Global Credit Facility, based upon its relative share of the aggregate net assets of all of the Borrowers, including an annual commitment fee of 0.08% based upon the unused portion of the Global Credit Facility, which is reflected in other expenses on the Statement of Operations. During the period ended January 31, 2011, the Fund did not use the Global Credit Facility.
30 | Semiannual Report
Franklin Global Trust
Notes to Financial Statements (unaudited) (continued)
Franklin Large Cap Equity Fund
9. FAIR VALUE MEASUREMENTS
The Fund follows a fair value hierarchy that distinguishes between market data obtained from independent sources (observable inputs) and the Fund’s own market assumptions (unobservable inputs). These inputs are used in determining the value of the Fund’s investments and are summarized in the following fair value hierarchy:
- Level 1 – quoted prices in active markets for identical securities
- Level 2 – other significant observable inputs (including quoted prices for similar securities, interest rates, prepayment speed, credit risk, etc.)
- Level 3 – significant unobservable inputs (including the Fund’s own assumptions in determining the fair value of investments)
The inputs or methodology used for valuing securities are not an indication of the risk associated with investing in those securities.
For movements between the levels within the fair value hierarchy, the Fund has adopted a policy of recognizing the transfers as of the date of the underlying event which caused the movement.
At January 31, 2011, all of the Fund’s investments in securities carried at fair value were in Level 1 inputs. For detailed industry descriptions, see the accompanying Statement of Investments.
10. SUBSEQUENT EVENTS
The Fund has evaluated subsequent events through the issuance of the financial statements and determined that no events have occurred that require disclosure.
ABBREVIATIONS
Selected Portfolio
ADR - American Depository Receipt
GDR - Global Depository Receipt
Semiannual Report | 31
Franklin Global Trust
Shareholder Information
Franklin Large Cap Equity Fund
Proxy Voting Policies and Procedures
The Trust’s investment manager has established Proxy Voting Policies and Procedures (Policies) that the Trust uses to determine how to vote proxies relating to portfolio securities. Shareholders may view the Trust’s complete Policies online at franklintempleton.com. Alternatively, shareholders may request copies of the Policies free of charge by calling the Proxy Group collect at (954) 527-7678 or by sending a written request to: Franklin Templeton Companies, LLC, 500 East Broward Boulevard, Suite 1500, Fort Lauderdale, FL 33394, Attention: Proxy Group. Copies of the Trust’s proxy voting records are also made available online at franklintempleton.com and posted on the U.S. Securities and Exchange Commission’s website at sec.gov and reflect the most recent 12-month period ended June 30.
Quarterly Statement of Investments
The Trust files a complete statement of investments with the U.S. Securities and Exchange Commission for the first and third quarters for each fiscal year on Form N-Q. Shareholders may view the filed Form N-Q by visiting the Commission’s website at sec.gov. The filed form may also be viewed and copied at the Commission’s Public Reference Room in Washington, DC. Information regarding the operations of the Public Reference Room may be obtained by calling (800) SEC-0330.
32 | Semiannual Report

FRANKLIN
GLOBAL REAL ESTATE FUND

1
Semiannual Report
Franklin Global Real Estate Fund
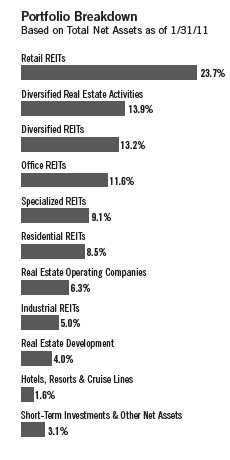
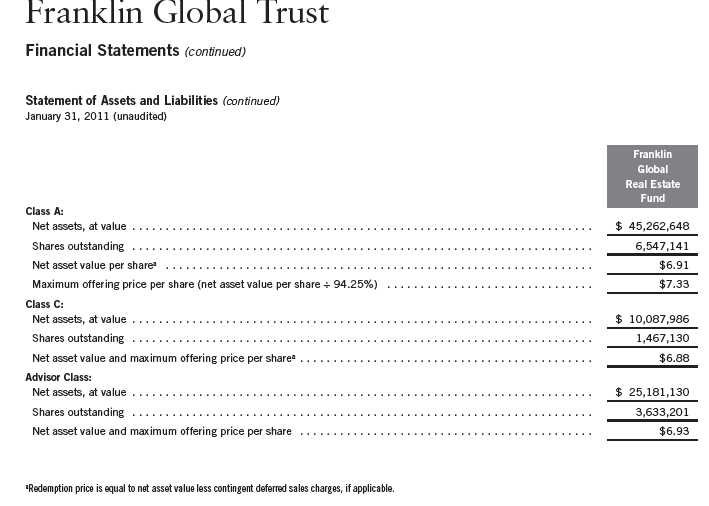
Your Fund’s Goal and Main Investments: Franklin Global Real Estate Fund seeks high total return. Under normal market conditions, the Fund will invest at least 80% of its net assets in securities of companies located anywhere in the world that operate in the real estate sector, including mainly real estate investment trusts (REITs) and REIT-like entities.1
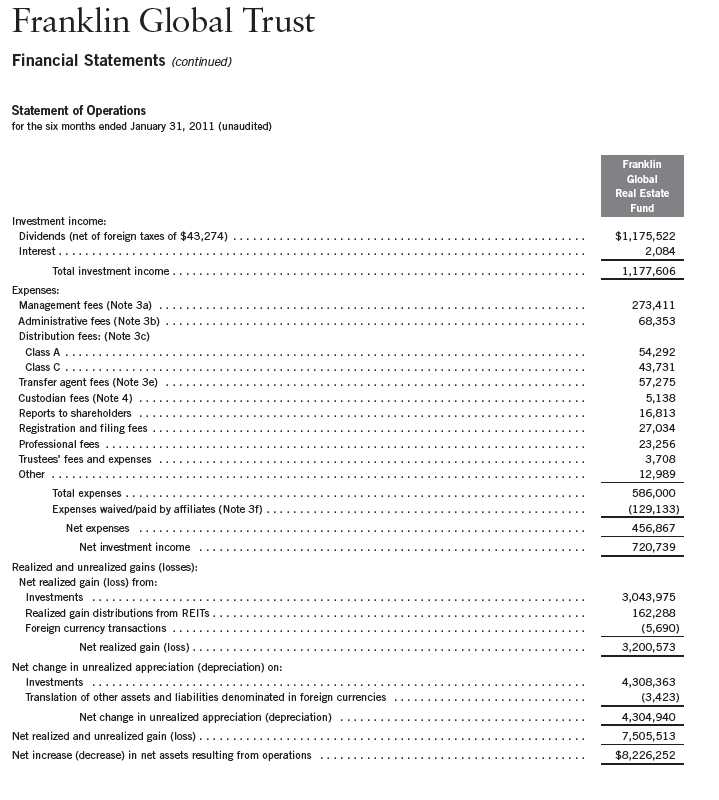
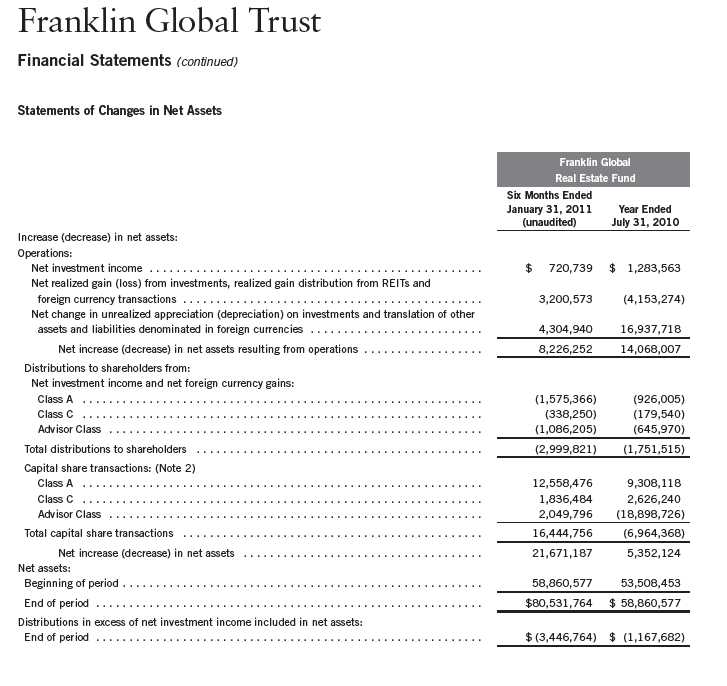
This semiannual report for Franklin Global Real Estate Fund covers the period ended January 31, 2011.
Performance Overview
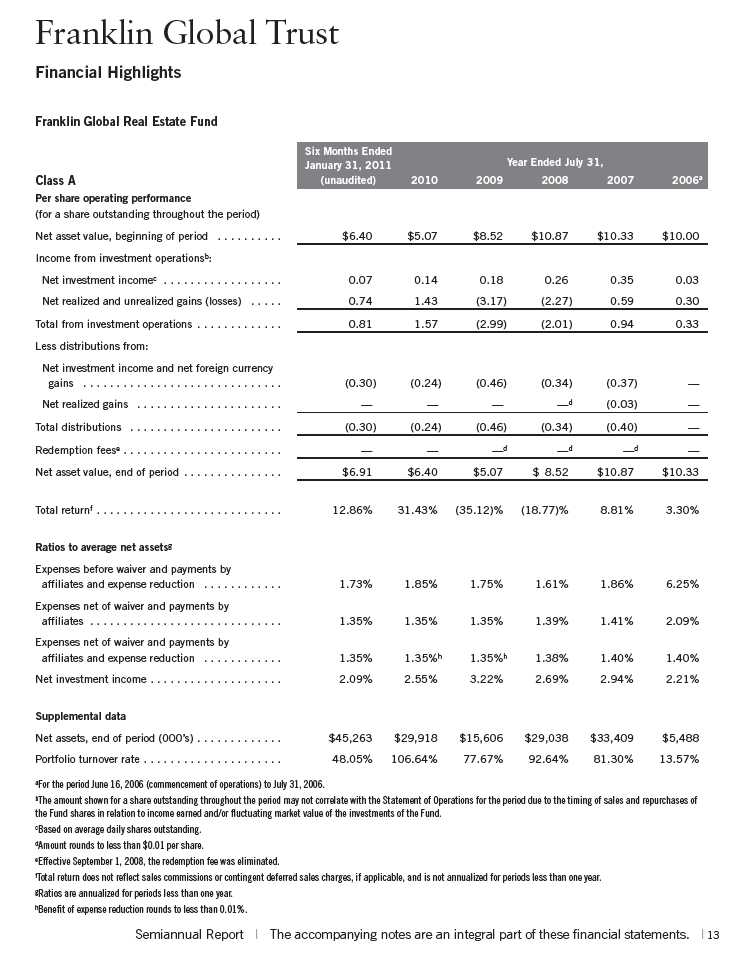
Franklin Global Real Estate Fund – Class A delivered a +12.86% cumulative total return for the six months under review. The Fund underperformed the +15.71% total return of its benchmark the Standard & Poor’s (S&P) Global REIT Index, which measures performance of global real estate equities.2 For comparison, the Fund underperformed the FTSE EPRA/NAREIT Developed Index, which measures global real estate markets in North America, Europe and Asia, and which generated a +16.23% return.2 You can find more of the Fund’s performance data in the Performance Summary beginning on page 8.
Economic and Market Overview
Global equity markets rose during the six months under review, as government stimulus in the developed world supported economic expansion. Emerging market regions primarily led growth, as they were generally unconstrained by the debt overhang burdening western economies and benefited from strong
1. REITs are real estate investment trust companies, usually with publicly traded stock, that manage a portfolio of income-producing real estate properties such as apartments, hotels, industrial properties, office buildings or shopping centers. The Fund predominantly invests in “equity” REITs, which also take ownership positions in real estate. Shareholders of equity REITs generally receive income from rents received and receive capital gains when properties are sold at a profit. REITs are generally operated by experienced property management teams and typically concentrate on a specific geographic region or property type.
2. Source: © 2011 Morningstar. All Rights Reserved. The information contained herein: (1) is proprietary to Morningstar and/or its content providers; (2) may not be copied or distributed; and (3) is not warranted to be accurate, complete or timely. Neither Morningstar nor its content providers are responsible for any damages or losses arising from any use of this information. STANDARD & POOR’S®, S&P® and S&P 500® are registered trademarks of Standard & Poor’s Financial Services LLC. Standard & Poor’s does not sponsor, endorse, sell or promote any S&P index-based product. The indexes are unmanaged and include reinvested dividends. One cannot invest directly in an index and an index is not representative of the Fund’s portfolio.
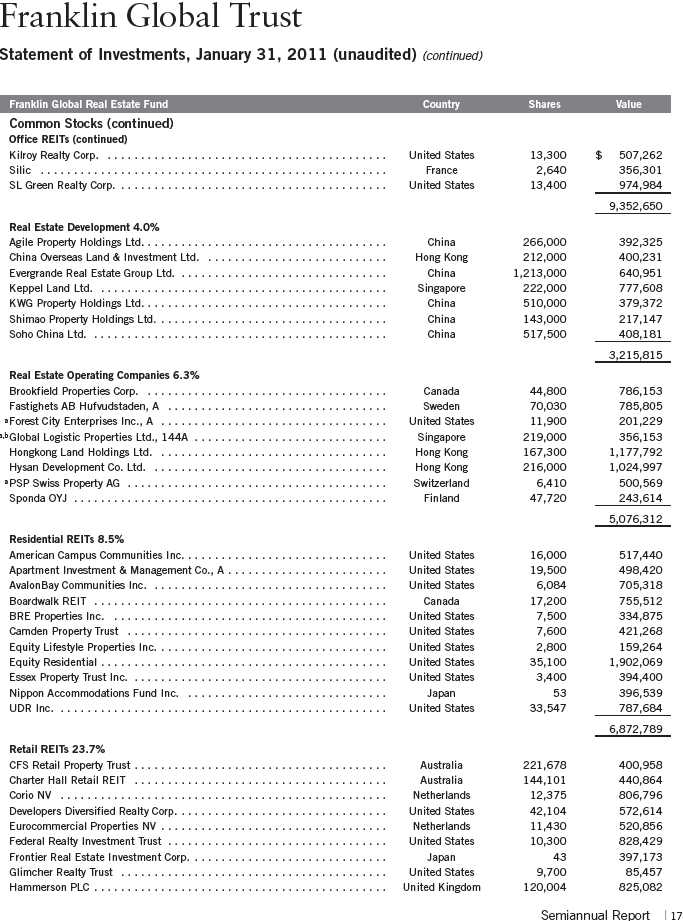
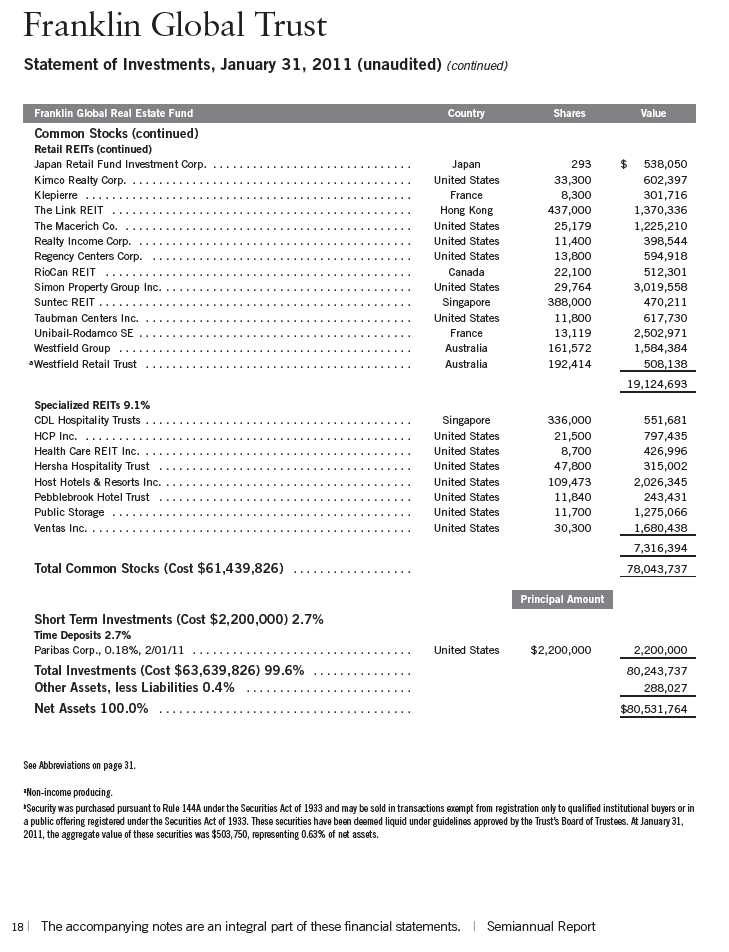
The dollar value, number of shares or principal amount, and names of all portfolio holdings are listed in the Fund’s Statement of Investments (SOI). The SOI begins on page 16.
Semiannual Report | 3
intrinsic demand and significant capital inflows. Policymakers in these regions began raising interest rates toward period-end to combat inflation and speculative investment. Developed economies grew at a more subdued pace, with demand recovery and asset price reflation heavily underpinned by government sponsored, liquidity-enhancing measures. The U.S. Federal Reserve Board (Fed), having already brought official interest rates close to zero, began directly purchasing government securities as part of an extreme policy measure known as quantitative easing. Further promoting the U.S. recovery, the traditionally pro-business Republican Party gained control of the House of Representatives in November elections and President Obama extended Bush-era tax cuts. In Europe, ballooning fiscal deficits took their toll on some nations and growing concerns of potential sovereign defaults significantly roiled equity markets on several occasions during the period. Ireland came under pressure in November and was forced to take rescue funds from the European Union and International Monetary Fund.
Business activity was strong, and corporations generally reported healthy profits. Commodities surged in the second half of 2010 due to near-term supply constraints and emerging market demand increases, as well as longer term fears that overly accommodative monetary policies would ultimately have negative inflationary consequences. The dollar strengthened relative to the euro, which bore the burden of the region’s fiscal crisis, but weakened against the yen, which hit multi-decade highs amid persistent deflationary pressures. Meanwhile, U.S. Treasury prices declined as Fed policies appeared to improve growth expectations. Although market conditions remained accommodative and corporate profitability improved, critical economic fundamentals such as employment, home prices and rising global food prices posed challenges to global economies.
During the six months under review, most global REITs continued to generate positive performance, as measured by the S&P Global REIT Index. The best performing real estate market was Italy, with a +39.89% total return, followed by Japan (+31.38%) and Turkey (+27.33%).2 South Africa (+5.18%) and Belgium (+11.96%) were the weakest markets.2
Investment Strategy
We are research-driven, fundamental investors. We seek to limit price volatility by investing across markets and property types. We also seek to provide a consistently high level of income. We center our active investment strategy on the belief that unsynchronized regional economic activity within the global economy can provide consistent, attractive return opportunities in the global real estate markets. We use a bottom-up, value-oriented stock selection process that incorporates macro-level views in the evaluation process. We use top-down
4 | Semiannual Report
macro overlays to provide country/regional, property type, and company size perspectives in identifying international/local cyclical and thematic trends that highlight investment opportunities. We may use forward currency exchange contracts from time to time to help manage currency risk and the Fund’s exposure to various currencies.
Manager’s Discussion
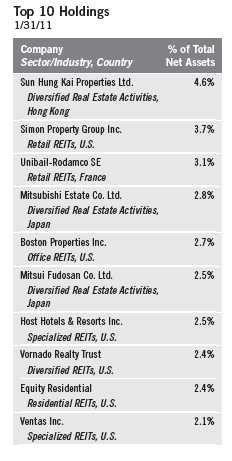
During the six months under review, major contributors to Fund performance relative to the S&P Global REIT Index included positions in U.S.-based luxury hotel REIT Host Hotels & Resorts, Japanese real estate management and development company Mitsui Fudosan and Japanese office REIT Kenedix Realty Investment. Host Hotels & Resorts experienced a rise in value during the period as hotel room demand continued to recover. In addition, Host Hotel’s management reported strong revenue per available room (RevPAR), an important hotel industry performance metric, for the third quarter and raised estimates for RevPAR for fiscal year 2010. Mitsui Fudosan outperformed the index during the six-month period largely due to improvement in market vacancy rates and an attractively low valuation.3 Japanese office REIT Kenedix Realty Investment’s share price increased during the period mainly due to improved office vacancy rates in central Tokyo and the Bank of Japan’s decision to invest 50 billion yen in Japanese REITs as part of its asset purchase program that began in December.
It is important to recognize the effect of currency movements on the Fund’s performance. In general, if the value of the U.S. dollar goes up compared with a foreign currency, an investment traded in that foreign currency will go down in value because it will be worth fewer U.S. dollars. This can have a negative effect on Fund performance. Conversely, when the U.S. dollar weakens in relation to a foreign currency, an investment traded in that foreign currency will increase in value, which can contribute to Fund performance. For the six months ended January 31, 2011, the U.S. dollar declined in value relative to most currencies. As a result, the Fund’s performance was positively affected by the portfolio’s substantial investment in securities denominated in currencies with non-U.S. exposure. However, one cannot expect the same result in future periods.
Significant detractors from relative Fund performance during the period included Sun Hung Kai Properties,3 ProLogis and Dupont Fabros Technology. Our investment in Hong Kong-based Sun Hung Kai, Asia’s largest property developer, weighed on relative Fund performance after investors worried that new government regulations would slow short-term real estate market speculation. The Fund’s underweighted position in U.S.-based industrial property REIT
3. This holding is not an index component.
Geographic Breakdown
Based on Total Net Assets as of 1/31/11
U.S.
40.7%
Hong Kong
14.2%
Japan
10.5%
Australia
7.6%
U.K.
5.4%
Singapore
4.4%
Canada
4.1%
France
3.9%
China
2.6%
Other
3.5%
Short-Term Investments & Other Net Assets
3.1%
Semiannual Report | 5
ProLogis pressured relative results after the REIT outperformed. In addition, shares of U.S.-based industrial REIT Dupont Fabros Technology, which owns, develops, operates and manages large-scale data center facilities, lost value late in the period after management lowered its fiscal year 2010 profitability estimates. We sold our position in Dupont Fabros Technology by period end.
Thank you for your continued participation in Franklin Global Real Estate Fund. We look forward to serving your future investment needs.

Portfolio Management Team
Franklin Global Real Estate Fund
The foregoing information reflects our analysis, opinions and portfolio holdings as of January 31, 2011, the end of the reporting period. The way we implement our main investment strategies and the resulting portfolio holdings may change depending on factors such as market and economic conditions. These opinions may not be relied upon as investment advice or an offer for a particular security. The information is not a complete analysis of every aspect of any market, country, industry, security or the Fund. Statements of fact are from sources considered reliable, but the investment manager makes no representation or warranty as to their completeness or accuracy. Although historical performance is no guarantee of future results, these insights may help you understand our investment management philosophy.
6 | Semiannual Report
Wilson Magee assumed portfolio manager responsibilities for Franklin Global Real Estate Fund in September 2010. He joined Franklin Templeton as Director of Global REITs in August 2010. Mr. Magee has managed U.S. and global real estate securities portfolios, including long, long/short and income strategies, since 1997. He has experience in public and private property investments since 1981. Prior to joining Franklin Templeton, Mr. Magee was president and portfolio manager for Colony Investment Management. He previously was a portfolio manager at Goldman Sachs Asset Management and Grantham Mayo Van Otterloo (GMO) and an investor at AEW Capital Management. He also served on the boards of several private real estate funds sponsored by Citigroup. Mr. Magee serves as Chair, Dean’s Advisory Council of Tulane University where he graduated with a B.A. in English literature and history.
Semiannual Report | 7
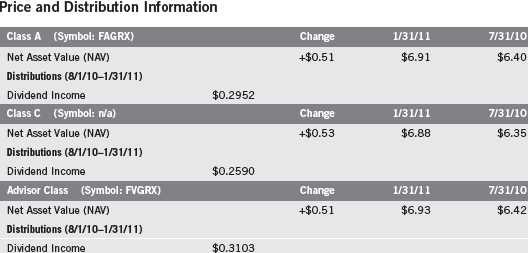
Performance Summary as of 1/31/11
Your dividend income will vary depending on dividends or interest paid by securities in the Fund’s portfolio, adjusted for operating expenses of each class. Capital gain distributions are net profits realized from the sale of portfolio securities. The performance table does not reflect any taxes that a shareholder would pay on Fund dividends, capital gain distributions, if any, or any realized gains on the sale of Fund shares. Total return reflects reinvestment of the Fund’s dividends and capital gain distributions, if any, and any unrealized gains or losses.
8 | Semiannual Report
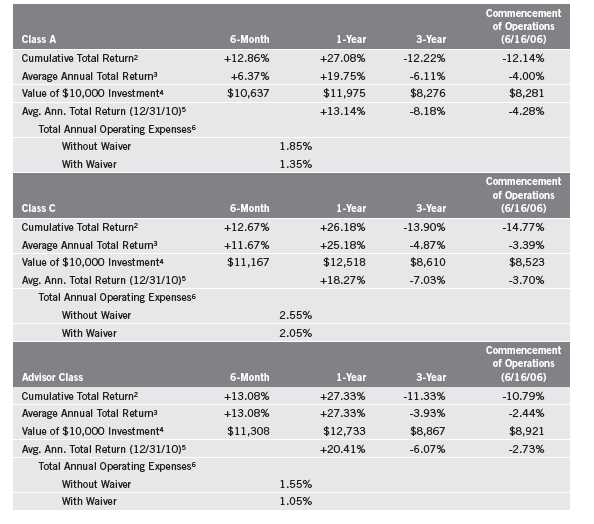
Performance Summary (continued)
Performance1
Cumulative total return excludes sales charges. Average annual total returns and value of $10,000 investment include maximum sales charges. Class A: 5.75% maximum initial sales charge; Class C: 1% contingent deferred sales charge in first year only; Advisor Class: no sales charges.
Performance data represent past performance, which does not guarantee future results. Investment return and principal value will fluctuate, and you may have a gain or loss when you sell your shares. Current performance may differ from figures shown. For most recent month-end performance, go to franklintempleton.com or call (800) 342-5236.
The investment manager and administrator have contractually agreed to waive or assume certain expenses so that common expenses (excluding Rule 12b-1 fees) for each class of the Fund do not exceed 1.05% (other than certain nonroutine expenses) until 11/30/11.
Semiannual Report | 9
Performance Summary (continued)
Endnotes
The Fund concentrates in real estate securities, which involves special risks, such as declines in the value of real estate and increased susceptibility to adverse economic or regulatory developments affecting the sector. The Fund’s investments in REITs involves additional risks, since REITS typically are invested in a limited number of projects or in a particular market segment they are more susceptible to adverse developments affecting a single project or market segment than more broadly diversified investments. Foreign investing, especially in emerging markets, involves additional risk such as currency and market volatility, as well as political and social instability. Also, the Fund is a nondiversified Fund and investing in a nondiversified Fund involves the risk of greater price fluctuation than a more diversified portfolio. The manager applies various techniques and analyses in making investment decisions for the Fund, but there can be no guarantee that these decisions will produce the desired results. The Fund’s prospectus also includes a description of the main investment risks.
1. If the manager and administrator had not waived fees, the Fund’s total returns would have been lower. 2. Cumulative total return represents the change in value of an investment over the periods indicated.
3. Average annual total return represents the average annual change in value of an investment over the periods indicated. Six-month return has not been annualized.
4. These figures represent the value of a hypothetical $10,000 investment in the Fund over the periods indicated.
5. In accordance with SEC rules, we provide standardized average annual total return information through the latest calendar quarter.
6. Figures are as stated in the Fund’s prospectus current as of the date of this report. In periods of market volatility, assets may decline significantly, causing total annual Fund operating expenses to become higher than the figures shown.
10 | Semiannual Report
Your Fund’s Expenses
As a Fund shareholder, you can incur two types of costs:
- Transaction costs, including sales charges (loads) on Fund purchases; and
- Ongoing Fund costs, including management fees, distribution and service (12b-1) fees, and other Fund expenses. All mutual funds have ongoing costs, sometimes referred to as operating expenses.
The following table shows ongoing costs of investing in the Fund and can help you understand these costs and compare them with those of other mutual funds. The table assumes a $1,000 investment held for the six months indicated.
Actual Fund Expenses
The first line (Actual) for each share class listed in the table provides actual account values and expenses. The “Ending Account Value” is derived from the Fund’s actual return, which includes the effect of Fund expenses.
You can estimate the expenses you paid during the period by following these steps. Of course, your account value and expenses will differ from those in this illustration:
| 1. | Divide your account value by $1,000. |
| | If an account had an $8,600 value, then $8,600 ÷ $1,000 = 8.6. |
| 2. | Multiply the result by the number under the heading “Expenses Paid During Period.” |
| | If Expenses Paid During Period were $7.50, then 8.6 x $7.50 = $64.50. |
In this illustration, the estimated expenses paid this period are $64.50.
Hypothetical Example for Comparison with Other Funds
Information in the second line (Hypothetical) for each class in the table can help you compare ongoing costs of investing in the Fund with those of other mutual funds. This information may not be used to estimate the actual ending account balance or expenses you paid during the period. The hypothetical “Ending Account Value” is based on the actual expense ratio for each class and an assumed 5% annual rate of return before expenses, which does not represent the Fund’s actual return. The figure under the heading “Expenses Paid During Period” shows the hypothetical expenses your account would have incurred under this scenario. You can compare this figure with the 5% hypothetical examples that appear in shareholder reports of other funds.
Semiannual Report | 11
Your Fund’s Expenses (continued)
Please note that expenses shown in the table are meant to highlight ongoing costs and do not reflect any transaction costs, such as sales charges. Therefore, the second line for each class is useful in comparing ongoing costs only, and will not help you compare total costs of owning different funds. In addition, if transaction costs were included, your total costs would have been higher. Please refer to the Fund prospectus for additional information on operating expenses.
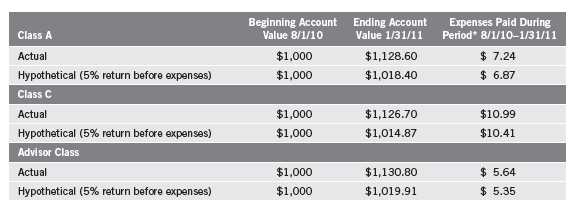
*Expenses are calculated using the most recent six-month expense ratio, net of expense waivers, annualized for each class (A: 1.35%; C: 2.05%; and Advisor: 1.05%), multiplied by the average account value over the period, multiplied by 184/365 to reflect the one-half year period.
12 | Semiannual Report

Semiannual Report | The accompanying notes are an integral part of these financial statements. | 19
20 | The accompanying notes are an integral part of these financial statements. | Semiannual Report
Semiannual Report | The accompanying notes are an integral part of these financial statements. | 21
22 | The accompanying notes are an integral part of these financial statements. | Semiannual Report
Franklin Global Trust
Notes to Financial Statements (unaudited)
Franklin Global Real Estate Fund
1. ORGANIZATION AND SIGNIFICANT ACCOUNTING POLICIES
Franklin Global Trust (Trust) is registered under the Investment Company Act of 1940, as amended, (1940 Act) as an open-end investment company, consisting of five separate funds. The Franklin Global Real Estate Fund (Fund) is included in this report. The financial statements of the remaining funds in the Trust are presented separately. The Fund offers three classes of shares: Class A, Class C, and Advisor Class. Each class of shares differs by its initial sales load, contingent deferred sales charges, distribution fees, voting rights on matters affecting a single class and its exchange privilege.
The following summarizes the Fund’s significant accounting policies.
a. Financial Instrument Valuation
The Fund’s investments in securities and other financial instruments are carried at fair value daily. Fair value is the price that would be received to sell an asset or paid to transfer a liability in an orderly transaction between market participants on the measurement date. Under procedures approved by the Trust’s Board of Trustees, the Fund may utilize independent pricing services, quotations from securities and financial instrument dealers, and other market sources to determine fair value.
Equity securities listed on an exchange or on the NASDAQ National Market System are valued at the last quoted sale price or the official closing price of the day, respectively. Foreign equity securities are valued as of the close of trading on the foreign stock exchange on which the security is primarily traded, or the NYSE, whichever is earlier. The value is then converted into its U.S. dollar equivalent at the foreign exchange rate in effect at the close of the NYSE on the day that the value of the security is determined. Over-the-counter securities are valued within the range of the most recent quoted bid and ask prices. Securities that trade in multiple markets or on multiple exchanges are valued according to the broadest and most representative market. Certain equity securities are valued based upon fundamental characteristics or relationships to similar securities. Time deposits are valued at cost, which approximates market value.
The Fund has procedures to determine the fair value of securities and other financial instruments for which market prices are not readily available or which may not be reliably priced. Under these procedures, the Fund primarily employs a market-based approach which may use related or comparable assets or liabilities, recent transactions, market multiples, book values, and other relevant information for the investment to determine the fair value of the investment. The Fund may also use an income-based valuation approach in which the anticipated future cash flows of the investment are discounted to calculate fair value. Discounts may also be applied due to the nature or duration of any restrictions on the disposition of the investments. Due to the inherent uncertainty of valuations of such investments, the fair values may differ significantly from the values that would have been used had an active market existed.
Semiannual Report | 23
Franklin Global Trust
Notes to Financial Statements (unaudited) (continued)
Franklin Global Real Estate Fund
| 1. | ORGANIZATION AND SIGNIFICANT ACCOUNTING POLICIES (continued) |
| a. | Financial Instrument Valuation (continued) |
Trading in securities on foreign securities stock exchanges and over-the-counter markets may be completed before the daily close of business on the NYSE. Occasionally, events occur between the time at which trading in a foreign security is completed and the close of the NYSE that might call into question the reliability of the value of a portfolio security held by the Fund. As a result, differences may arise between the value of the Fund’s portfolio securities as determined at the foreign market close and the latest indications of value at the close of the NYSE. In order to minimize the potential for these differences, the investment manager monitors price movements following the close of trading in foreign stock markets through a series of country specific market proxies (such as baskets of American Depository Receipts, futures contracts and exchange traded funds). These price movements are measured against established trigger thresholds for each specific market proxy to assist in determining if an event has occurred that may call into question the reliability of the values of the foreign securities held by the Fund. If such an event occurs, the securities may be valued using fair value procedures, which may include the use of independent pricing services.
b. Foreign Currency Translation
Portfolio securities and other assets and liabilities denominated in foreign currencies are translated into U.S. dollars based on the exchange rate of such currencies against U.S. dollars on the date of valuation. The Fund may enter into foreign currency exchange contracts to facilitate transactions denominated in a foreign currency. Purchases and sales of securities, income and expense items denominated in foreign currencies are translated into U.S. dollars at the exchange rate in effect on the transaction date. Portfolio securities and assets and liabilities denominated in foreign currencies contain risks that those currencies will decline in value relative to the U.S. dollar. Occasionally, events may impact the availability or reliability of foreign exchange rates used to convert the U.S. dollar equivalent value. If such an event occurs, the foreign exchange rate will be valued at fair value using procedures established and approved by the Trust’s Board of Trustees.
The Fund does not separately report the effect of changes in foreign exchange rates from changes in market prices on securities held. Such changes are included in net realized and unrealized gain or loss from investments on the Statement of Operations.
Realized foreign exchange gains or losses arise from sales of foreign currencies, currency gains or losses realized between the trade and settlement dates on securities transactions and the difference between the recorded amounts of dividends, interest, and foreign withholding taxes and the U.S. dollar equivalent of the amounts actually received or paid. Net unrealized foreign exchange gains and losses arise from changes in foreign exchange rates on foreign denominated assets and liabilities other than investments in securities held at the end of the reporting period.
24 | Semiannual Report
Franklin Global Trust
Notes to Financial Statements (unaudited) (continued)
Franklin Global Real Estate Fund
| 1. | ORGANIZATION AND SIGNIFICANT ACCOUNTING POLICIES (continued) |
| c. | Income Taxes |
It is the Fund’s policy to qualify as a regulated investment company under the Internal Revenue Code. The Fund intends to distribute to shareholders substantially all of its taxable income and net realized gains to relieve it from federal income and excise taxes. As a result, no provision for U.S. federal income taxes is required. The Fund files U.S. income tax returns as well as tax returns in certain other jurisdictions. The Fund’s application of those tax rules is subject to its understanding. The Fund records a provision for taxes in its financial statements including penalties and interest, if any, for a tax position taken on a tax return (or expected to be taken) when it fails to meet the more likely than not (a greater than 50% probability) threshold and based on the technical merits, the tax position may not be sustained upon examination by the tax authorities. As of January 31, 2011, and for all open tax years, the Fund has determined that no provision for income tax is required in the Fund’s financial statements. Open tax years are those that remain subject to examination and are based on each tax jurisdiction statute of limitation. The Fund is not aware of any tax position for which it is reasonably possible that the total amounts of unrecognized tax effects will significantly change in the next twelve months.
The Fund may be subject to foreign taxation related to income received, capital gains on the sale of securities and certain foreign currency transactions in the foreign jurisdictions in which it invests. Foreign taxes, if any, are recorded based on the tax regulations and rates that exist in the foreign markets in which the Fund invests. When a capital gain tax is determined to apply the Fund records an estimated deferred tax liability for unrealized gains on these securities in an amount that would be payable if the securities were disposed of on the valuation date.
d. Security Transactions, Investment Income, Expenses and Distributions
Security transactions are accounted for on trade date. Realized gains and losses on security transactions are determined on a specific identification basis. Interest income and estimated expenses are accrued daily. Dividend income is recorded on the ex-dividend date except that certain dividends from foreign securities are recognized as soon as the Fund is notified of the ex-dividend date. Distributions to shareholders are recorded on the ex-dividend date and are determined according to income tax regulations (tax basis). Distributable earnings determined on a tax basis may differ from earnings recorded in accordance with accounting principles generally accepted in the United States of America. These differences may be permanent or temporary. Permanent differences are reclassified among capital accounts to reflect their tax character. These reclassifications have no impact on net assets or the results of operations. Temporary differences are not reclassified, as they may reverse in subsequent periods.
Common expenses incurred by the Trust are allocated among the Funds based on the ratio of net assets of each fund to the combined net assets of the Trust. Fund specific expenses are charged directly to the fund that incurred the expense.
Semiannual Report | 25
Franklin Global Trust
Notes to Financial Statements (unaudited) (continued)
Franklin Global Real Estate Fund
| 1. | ORGANIZATION AND SIGNIFICANT ACCOUNTING POLICIES (continued) |
| d. | Security Transactions, Investment Income, Expenses and Distributions (continued) |
Realized and unrealized gains and losses and net investment income, not including class specific expenses, are allocated daily to each class of shares based upon the relative proportion of net assets of each class. Differences in per share distributions, by class, are generally due to differences in class specific expenses.
Distributions received by the Fund from certain securities may be a return of capital (ROC). Such distributions reduce the cost basis of the securities, and any distributions in excess of the cost basis are recognized as capital gains.
e. Accounting Estimates
The preparation of financial statements in accordance with accounting principles generally accepted in the United States of America requires management to make estimates and assumptions that affect the reported amounts of assets and liabilities at the date of the financial statements and the amounts of income and expenses during the reporting period. Actual results could differ from those estimates.
f. Guarantees and Indemnifications
Under the Trust’s organizational documents, its officers and trustees are indemnified by the Trust against certain liabilities arising out of the performance of their duties to the Trust. Additionally, in the normal course of business, the Trust, on behalf of the Fund, enters into contracts with service providers that contain general indemnification clauses. The Trust’s maximum exposure under these arrangements is unknown as this would involve future claims that may be made against the Trust that have not yet occurred. Currently, the Trust expects the risk of loss to be remote.
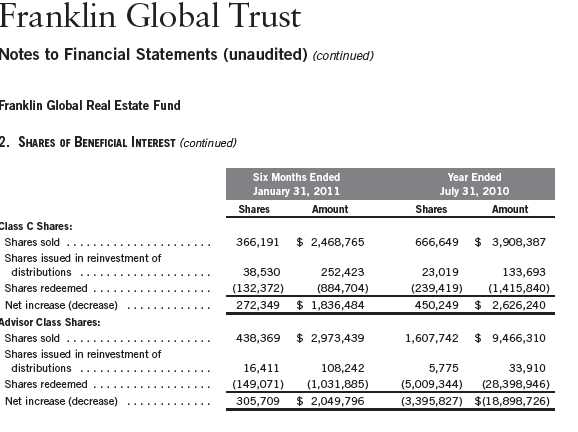
2. SHARES OF BENEFICIAL INTEREST
At January 31, 2011, there were an unlimited number of shares authorized (without par value).
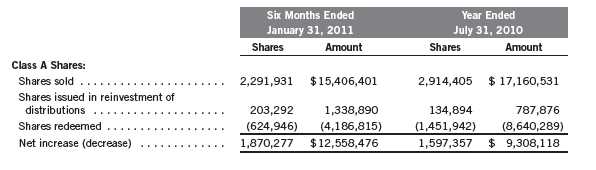
Transactions in the Fund’s shares were as follows:
26 | Semiannual Report
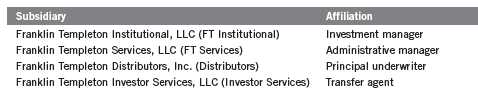
3. TRANSACTIONS WITH AFFILIATES
Franklin Resources, Inc. is the holding company for various subsidiaries that together are referred to as Franklin Templeton Investments. Certain officers and trustees of the Trust are also officers and/or directors of the following subsidiaries:
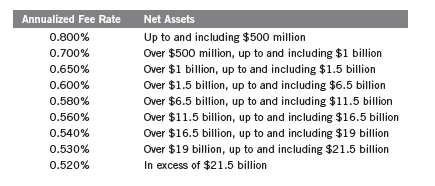
a. Management Fees
The Fund pays an investment management fee to FT Institutional based on the average daily net assets of the Fund as follows:
Semiannual Report | 27
Franklin Global Trust
Notes to Financial Statements (unaudited) (continued)
Franklin Global Real Estate Fund
| 3. | TRANSACTIONS WITH AFFILIATES (continued) |
| b. | Administrative Fees |
The Fund pays an administrative fee to FT Services of 0.20% per year of the average daily net assets of the Fund.
c. Distribution Fees
The Trust’s Board of Trustees has adopted distribution plans for each share class, with the exception of Advisor Class shares, pursuant to Rule 12b-1 under the 1940 Act. Under the Fund’s Class A reimbursement distribution plan, the Fund reimburses Distributors for costs incurred in connection with the servicing, sale and distribution of the Fund’s shares up to the maximum annual plan rate. Under the Class A reimbursement distribution plan, costs exceeding the maximum for the current plan year cannot be reimbursed in subsequent periods.
In addition, under the Fund’s Class C compensation distribution plan, the Fund pays Distributors for costs incurred in connection with the servicing, sale and distribution of the Fund’s shares up to the maximum annual plan rate.
The maximum annual plan rates, based on the average daily net assets, for each class, are as follows:
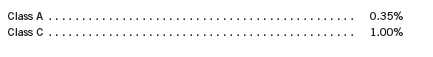
The Board of Trustees has set the current rate at 0.30% per year for Class A shares until further notice and approval by the Board.
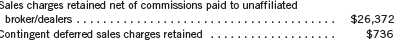
d. Sales Charges/Underwriting Agreements
Distributors has advised the Fund of the following commission transactions related to the sales and redemptions of the Fund’s shares for the period:
e. Transfer Agent Fees
For the period ended January 31, 2011, the Fund paid transfer agent fees of $57,275, of which $36,361 was retained by Investor Services.
f. Waiver and Expense Reimbursements
FT Services and FT Institutional have contractually agreed in advance to waive or limit their respective fees and to assume as their own expense certain expenses otherwise payable by the
28 | Semiannual Report
Franklin Global Trust
Notes to Financial Statements (unaudited) (continued)
Franklin Global Real Estate Fund
| 3. | TRANSACTIONS WITH AFFILIATES (continued) |
| f. | Waiver and Expense Reimbursements (continued) |
fund so that the common expenses (i.e. a combination of management fees, administrative fees, and other expenses, but excluding distribution fees, and acquired fund fees and expenses) for each class of the Fund do not exceed 1.05% (other than certain non-routine expenses or costs, including those relating to litigation, indemnification, reorganizations, and liquidations) until November 30, 2011.
4. EXPENSE OFFSET ARRANGEMENT
The Fund has entered into an arrangement with its custodian whereby credits realized as a result of uninvested cash balances are used to reduce a portion of the Fund’s custodian expenses. During the period ended January 31, 2011, there were no credits earned.
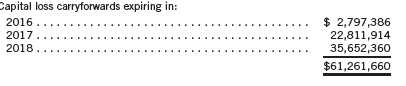
5. INCOME TAXES
For tax purposes, capital losses may be carried over to offset future capital gains, if any. At July 31, 2010, the capital loss carryforwards were as follows:
For tax purposes, realized capital losses occurring subsequent to October 31 may be deferred and treated as occurring on the first day of the following fiscal year. At July 31, 2010, the Fund deferred realized capital losses of $630,008.
At January 31, 2011, the cost of investments and net unrealized appreciation (depreciation) for income tax purposes were as follows:
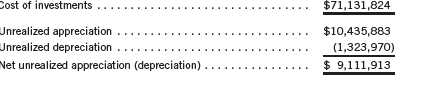
Net investment income and net realized gains (losses) differ for financial statement and tax purposes primarily due to differing treatments of wash sales, foreign currency transactions and passive foreign investment company shares.
Semiannual Report | 29
Franklin Global Trust
Notes to Financial Statements (unaudited) (continued)
Franklin Global Real Estate Fund
6. INVESTMENT TRANSACTIONS
Purchases and sales of investments (excluding short term securities) for the period ended January 31, 2011, aggregated $45,598,462and $31,481,080, respectively.
7. CREDIT FACILITY
The Fund, together with other U.S. registered and foreign investment funds (collectively “Borrowers”), managed by Franklin Templeton Investments, are borrowers in a joint syndicated senior unsecured credit facility totaling $750 million (Global Credit Facility) which matures on January 20, 2012. This Global Credit Facility provides a source of funds to the Borrowers for temporary and emergency purposes, including the ability to meet future unanticipated or unusually large redemption requests.
Under the terms of the Global Credit Facility, the Fund shall, in addition to interest charged on any borrowings made by the Fund and other costs incurred by the Fund, pay its share of fees and expenses incurred in connection with the implementation and maintenance of the Global Credit Facility, based upon its relative share of the aggregate net assets of all of the Borrowers, including an annual commitment fee of 0.08% based upon the unused portion of the Global Credit Facility, which is reflected in other expenses on the Statement of Operations. During the period ended January 31, 2011, the Fund did not use the Global Credit Facility.
8. FAIR VALUE MEASUREMENTS
The Fund follows a fair value hierarchy that distinguishes between market data obtained from independent sources (observable inputs) and the Fund’s own market assumptions (unobservable inputs). These inputs are used in determining the value of the Fund’s investments and are summarized in the following fair value hierarchy:
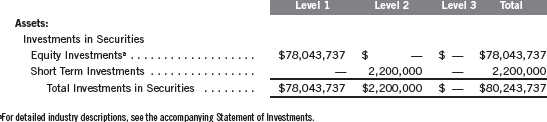
- Level 1 – quoted prices in active markets for identical securities
- Level 2 – other significant observable inputs (including quoted prices for similar securities, interest rates, prepayment speed, credit risk, etc.)
- Level 3 – significant unobservable inputs (including the Fund’s own assumptions in determining the fair value of investments)
The inputs or methodology used for valuing securities are not an indication of the risk associated with investing in those securities.
For movements between the levels within the fair value hierarchy, the Fund has adopted a policy of recognizing the transfers as of the date of the underlying event which caused the movement.
30 | Semiannual Report
Franklin Global Trust
Notes to Financial Statements (unaudited) (continued)
Franklin Global Real Estate Fund
8. FAIR VALUE MEASUREMENTS (continued)
The following is a summary of the inputs used as of January 31, 2011, in valuing the Fund’s assets and liabilities carried at fair value:
9. SUBSEQUENT EVENTS
The Fund has evaluated subsequent events through the issuance of the financial statements and determined that no events have occurred that require disclosure.
ABBREVIATIONS
Selected Portfolio
REIT - Real Estate Investment Trust
Semiannual Report | 31
Franklin Global Trust
Shareholder Information
Franklin Global Real Estate Fund
Proxy Voting Policies and Procedures
The Trust’s investment manager has established Proxy Voting Policies and Procedures (Policies) that the Trust uses to determine how to vote proxies relating to portfolio securities. Shareholders may view the Trust’s complete Policies online at franklintempleton.com. Alternatively, shareholders may request copies of the Policies free of charge by calling the Proxy Group collect at (954) 527-7678 or by sending a written request to: Franklin Templeton Companies, LLC, 500 East Broward Boulevard, Suite 1500, Fort Lauderdale, FL 33394, Attention: Proxy Group. Copies of the Trust’s proxy voting records are also made available online at franklintempleton.com and posted on the U.S. Securities and Exchange Commission’s website at sec.gov and reflect the most recent 12-month period ended June 30.
Quarterly Statement of Investments
The Trust files a complete statement of investments with the U.S. Securities and Exchange Commission for the first and third quarters for each fiscal year on Form N-Q. Shareholders may view the filed Form N-Q by visiting the Commission’s website at sec.gov. The filed form may also be viewed and copied at the Commission’s Public Reference Room in Washington, DC. Information regarding the operations of the Public Reference Room may be obtained by calling (800) SEC-0330.
32 | Semiannual Report

FRANKLIN GLOBAL TRUST

1
Semiannual Report
Economic and Market Overview
Global equity markets rose during the six months under review, as government stimulus in the developed world supported economic expansion. Emerging market regions primarily led growth, as they were generally unconstrained by the debt overhang burdening western economies and benefited from strong intrinsic demand and significant capital inflows. Policymakers in these regions began raising interest rates toward period-end to combat inflation and speculative investment. Developed economies grew at a more subdued pace, with demand recovery and asset price reflation heavily underpinned by government-sponsored, liquidity-enhancing measures. The U.S. Federal Reserve Board (Fed), having already brought official interest rates close to zero, began directly purchasing government securities as part of an extreme policy measure known as quantitative easing. Further promoting the U.S. recovery, the traditionally pro-business Republican Party gained control of the House of Representatives in November elections and President Obama extended Bush-era tax cuts. In Europe, ballooning fiscal deficits took their toll on some nations and growing concerns of potential sovereign defaults significantly roiled equity markets on several occasions during the period. Ireland came under pressure in November and was forced to take rescue funds from the European Union and International Monetary Fund.
Business activity was strong, and corporations generally reported healthy profits. Commodities surged in the second half of 2010 due to near-term supply constraints and emerging market demand increases, as well as longer term fears that overly accommodative monetary policies would ultimately have negative inflationary consequences. The dollar strengthened relative to the euro, which bore the burden of the region’s fiscal crisis, but weakened against the yen, which hit multi-decade highs amid persistent deflationary pressures. Meanwhile, U.S Treasury prices declined as Fed policies appeared to improve growth expectations. Although market conditions remained accommodative and corporate profitability improved, critical economic fundamentals such as employment, home prices and rising global food prices posed challenges to global economies.
The foregoing information reflects our analysis and opinions as of January 31, 2011. The information is not a complete analysis of every aspect of any market, country, industry, security or fund. Statements of fact are from sources considered reliable.
Semiannual Report | 3
Franklin International Growth Fund
Your Fund’s Goal and Main Investments: The Fund seeks long-term capital appreciation by investing predominantly in equity securities of mid- and large-capitalization companies, generally those with market capitalizations greater than $2 billion, located outside the U.S., including developing or emerging market countries. The Fund considers international companies to be those organized under the laws of a country outside the U.S. or having a principal office in a country outside the U.S., or whose securities are listed or traded principally on a recognized stock exchange or over-the-counter market outside the U.S.
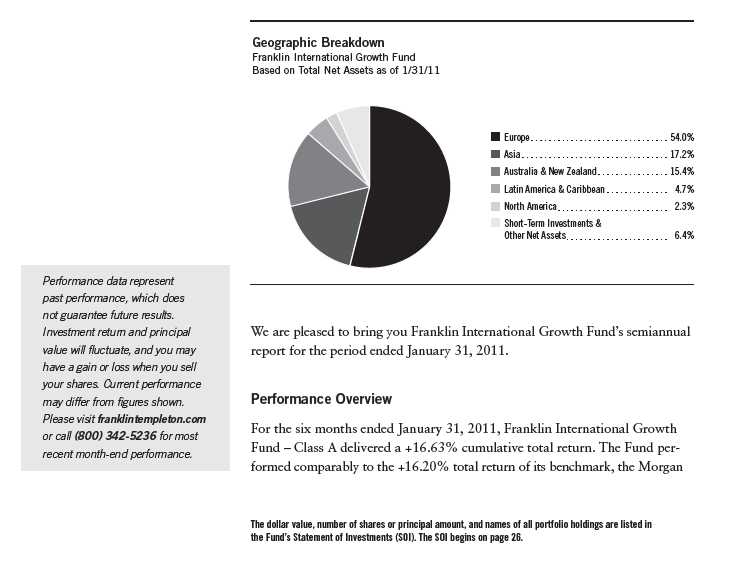
4 | Semiannual Report
Stanley Capital International (MSCI) Europe, Australasia, Far East (EAFE) Index, which measures global equity performance in developed countries excluding the U.S. and Canada.1 You can find more of the Fund’s performance data in the Performance Summary beginning on page 8.
Investment Strategy
In choosing individual equity investments, we employ a disciplined, bottom-up approach to identify attractive investment opportunities that have higher expected revenue and earnings growth than their peers. We use a growth investment style and in-depth, fundamental research to identify high-quality companies, across all industry groups, with sustainable business models that offer the most attractive combination of growth and quality.
Manager’s Discussion
From a sector perspective, financials and energy were major contributors to Fund performance relative to the MSCI EAFE Index.2 The Fund’s financials sector holdings benefited results mainly due to underweighting and stock selection. Notable contributors included U.K.-based alternative investment manager Man Group and Australian investment bank Macquarie Group. The Fund’s stock selection in the energy sector also aided relative results, and key contributors included pipeline product producer Wellstream Holdings3, 4 (U.K.), and energy services providers Saipem (Italy) and WorleyParsons (Australia). In information technology, The Sage Group, a U.K.-based global enterprise software company, also helped Fund performance.5
In contrast, the Fund’s consumer discretionary, health care and consumer staples holdings detracted from relative performance.6 Stock selection in the consumer discretionary sector weighed on results, particularly Chinese
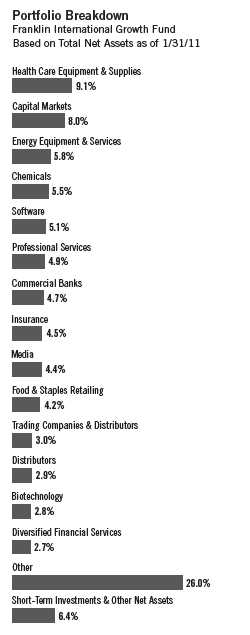
1. Source: © 2011 Morningstar. All Rights Reserved. The information contained herein: (1) is proprietary to Morningstar and/or its content providers; (2) may not be copied or distributed; and (3) is not warranted to be accurate, complete or timely. Neither Morningstar nor its content providers are responsible for any damages or losses arising from any use of this information. The index is unmanaged and includes reinvested distributions. One cannot invest directly in an index, and an index is not representative of the Fund’s portfolio.
2. The financials sector comprises capital markets, commercial banks, diversified financial services, insurance, and real estate management and development in the SOI. The energy sector comprises energy equipment and services in the SOI. 3. This holding was sold by period-end.
4. This holding is not an index component.
5. The information technology sector comprises Internet software and services, semiconductors and semiconductor equipment, and software in the SOI.
6. The consumer discretionary sector comprises distributors; media; specialty retail; and textiles, apparel and luxury goods in the SOI. The health care sector comprises biotechnology, health care equipment and supplies, and life sciences tools and services in the SOI. The consumer staples sector comprises food and staples retailing, household products, and personal products in the SOI.
Semiannual Report | 5
Top 10 Countries
Franklin International Growth Fund 1/31/11
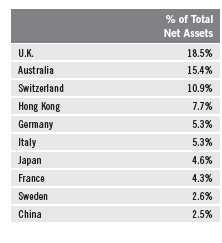
footwear, apparel and accessories maker Li Ning Company,3, 4 French satellite telecommunications provider Eutelsat Communications and U.K.-based educational media producer Pearson. The Fund’s stock selection in health care was detrimental, and key detractors included Netherlands-based biological research tools developer QIAGEN, Japanese medical device manufacturer Terumo and French optics maker Essilor International. In consumer staples, Chinese toiletry products producer Hengan International Group also hurt Fund performance.4
From a geographic perspective, our stock selection in Europe, especially the U.K., Italy and Switzerland, as well as in Australia, contributed to Fund performance. In contrast, our stock selection in Asia, particularly in Japan, and exposure to non-index China detracted from results.
It is important to recognize the effect of currency movements on the Fund’s performance. In general, if the value of the U.S. dollar goes up compared with a foreign currency, an investment traded in that foreign currency will go down in value because it will be worth fewer U.S. dollars. This can have a negative effect on Fund performance. Conversely, when the U.S. dollar weakens in relation to a foreign currency, an investment traded in that foreign currency will increase in value, which can contribute to Fund performance. For the six months ended January 31, 2011, the U.S. dollar declined in value relative to most currencies. As a result, the Fund’s performance was positively affected by the portfolio’s investment predominantly in securities with non-U.S. currency exposure. However, one cannot expect the same result in future periods.
6 | Semiannual Report
Thank you for your participation in Franklin International Growth Fund.
We look forward to serving your future investment needs.

CFA® is a trademark owned by CFA Institute.
The foregoing information reflects our analysis, opinions and portfolio holdings as of January 31, 2011, the end of the reporting period. The way we implement our main investment strategies and the resulting portfolio holdings may change depending on factors such as market and economic conditions. These opinions may not be relied upon as investment advice or an offer for a particular security. The information is not a complete analysis of every aspect of any market, country, industry, security or the Fund. Statements of fact are from sources considered reliable, but the investment manager makes no representation or warranty as to their completeness or accuracy. Although historical performance is no guarantee of future results, these insights may help you understand our investment management philosophy.
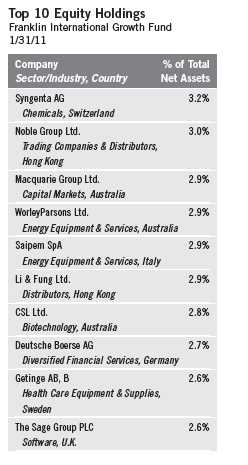
Performance Summary as of 1/31/11
Franklin International Growth Fund
Your dividend income will vary depending on dividends or interest paid by securities in the Fund’s portfolio, adjusted for operating expenses of each class. Capital gain distributions are net profits realized from the sale of portfolio securities. The performance table does not reflect any taxes that a shareholder would pay on Fund dividends, capital gain distributions, if any, or any realized gains on the sale of Fund shares. Total return reflects reinvestment of the Fund’s dividends and capital gain distributions, if any, and any unrealized gains or losses.
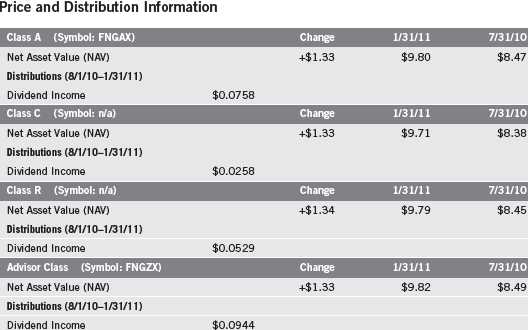
8 | Semiannual Report
Performance Summary (continued)
Performance1
Cumulative total return excludes sales charges. Average annual total returns and value of $10,000 investment include maximum sales charges. Class A: 5.75% maximum initial sales charge; Class C: 1% contingent deferred sales charge in first year only; Class R/Advisor Class: no sales charges.
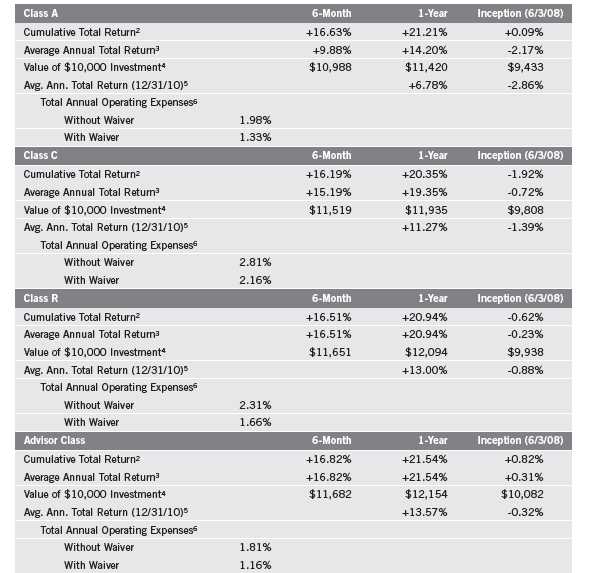
Performance data represent past performance, which does not guarantee future results. Investment return and principal value will fluctuate, and you may have a gain or loss when you sell your shares. Current performance may differ from figures shown. For most recent month-end performance, go to franklintempleton.com or call (800) 342-5236.
The investment manager and administrator have contractually agreed to waive or assume certain expenses so that common expenses (excluding Rule 12b-1 fees and acquired fund fees and expenses) for each class of the Fund do not exceed 1.15% (other than certain nonroutine expenses) until 11/30/11.
Semiannual Report | 9
Performance Summary (continued)
Endnotes
Special risks are associated with foreign investing, including currency fluctuations, economic instability and political developments. Investments in developing markets involve heightened risks related to the same factors, in addition to those associated with these markets’ smaller size and lesser liquidity. The manager applies various techniques and analyses in making investment decisions for the Fund, but there can be no guarantee that these decisions will produce the desired results. The Fund’s prospectus also includes a description of the main investment risks.
| |
Class C: Class R: | These shares have higher annual fees and expenses than Class A shares. Shares are available to certain eligible investors as described in the prospectus. These shares have higher annual fees and expenses than Class A shares. |
Advisor Class: | Shares are available to certain eligible investors as described in the prospectus. |
1. If the manager and administrator had not waived fees, the Fund’s total returns would have been lower. 2. Cumulative total return represents the change in value of an investment over the periods indicated.
3. Average annual total return represents the average annual change in value of an investment over the periods indicated. Six-month return has not been annualized.
4. These figures represent the value of a hypothetical $10,000 investment in the Fund over the periods indicated.
5. In accordance with SEC rules, we provide standardized average annual total return information through the latest calendar quarter.
6. Figures are as stated in the Fund’s prospectus current as of the date of this report. In periods of market volatility, assets may decline significantly, causing total annual Fund operating expenses to become higher than the figures shown.
10 | Semiannual Report
Your Fund’s Expenses
Franklin International Growth Fund
As a Fund shareholder, you can incur two types of costs:
- Transaction costs, including sales charges (loads) on Fund purchases; and
- Ongoing Fund costs, including management fees, distribution and service (12b-1) fees, and other Fund expenses. All mutual funds have ongoing costs, sometimes referred to as operating expenses.
The following table shows ongoing costs of investing in the Fund and can help you understand these costs and compare them with those of other mutual funds. The table assumes a $1,000 investment held for the six months indicated.
Actual Fund Expenses
The first line (Actual) for each share class listed in the table provides actual account values and expenses. The “Ending Account Value” is derived from the Fund’s actual return, which includes the effect of Fund expenses.
You can estimate the expenses you paid during the period by following these steps. Of course, your account value and expenses will differ from those in this illustration:
| 1. | Divide your account value by $1,000. |
| | If an account had an $8,600 value, then $8,600 ÷ $1,000 = 8.6. |
| 2. | Multiply the result by the number under the heading “Expenses Paid During Period.” |
| | If Expenses Paid During Period were $7.50, then 8.6 x $7.50 = $64.50. |
In this illustration, the estimated expenses paid this period are $64.50.
Hypothetical Example for Comparison with Other Funds
Information in the second line (Hypothetical) for each class in the table can help you compare ongoing costs of investing in the Fund with those of other mutual funds. This information may not be used to estimate the actual ending account balance or expenses you paid during the period. The hypothetical “Ending Account Value” is based on the actual expense ratio for each class and an assumed 5% annual rate of return before expenses, which does not represent the Fund’s actual return. The figure under the heading “Expenses Paid During Period” shows the hypothetical expenses your account would have incurred under this scenario. You can compare this figure with the 5% hypothetical examples that appear in shareholder reports of other funds.
Semiannual Report | 11
Your Fund’s Expenses (continued)
Please note that expenses shown in the table are meant to highlight ongoing costs and do not reflect any transaction costs, such as sales charges. Therefore, the second line for each class is useful in comparing ongoing costs only, and will not help you compare total costs of owning different funds. In addition, if transaction costs were included, your total costs would have been higher. Please refer to the Fund prospectus for additional information on operating expenses.
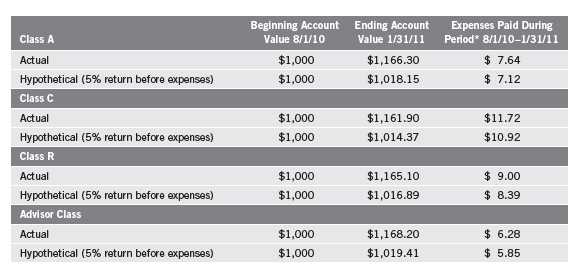
*Expenses are calculated using the most recent six-month expense ratio, net of expense waivers, annualized for each class (A: 1.40%; C: 2.15%; R: 1.65%; and Advisor: 1.15%), multiplied by the average account value over the period, multiplied by 184/365 to reflect the one-half year period.
12 | Semiannual Report
Franklin International Small Cap Growth Fund
Your Fund’s Goal and Main Investments: The Fund seeks long-term capital appreciation by investing at least 80% of its net assets in a diversified portfolio of marketable equity and equity-related securities of smaller international companies with market capitalizations not exceeding $5 billion (or the equivalent in local currencies), or the highest market capitalization of the Morgan Stanley Capital International (MSCI) Europe, Australasia, Far East (EAFE) Small Cap Index, whichever is greater, at the time of purchase. The Fund considers international companies to be those organized under the laws of a country outside North America or having a principal office in a country outside North America, or whose securities are listed or traded principally on a recognized stock exchange or over-the-counter market outside North America.
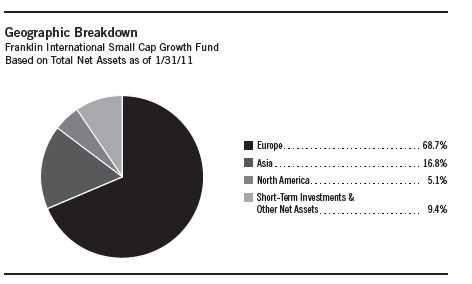
Performance data represent past performance, which does not guarantee future results. Investment return and principal value will fluctuate, and you may have a gain or loss when you sell your shares. Current performance may differ from figures shown. Please visit franklintempleton.com or call (800) 342-5236 for most recent month-end performance.

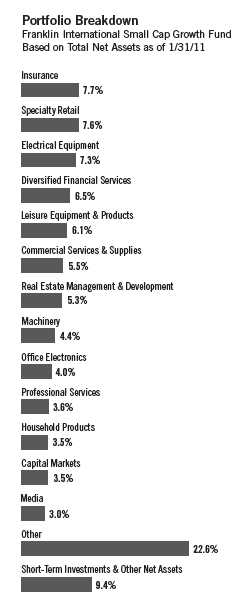
MSCI EAFE Small Cap Index, which tracks small cap equity performance in global developed markets excluding the U.S. and Canada.1 You can find more of the Fund’s performance data in the Performance Summary beginning on page 17.
Investment Strategy
In choosing individual equity investments, we utilize a fundamental, bottom-up approach involving in-depth analysis of individual equity securities. We employ a quantitative and qualitative approach to identify smaller international companies that we believe have the potential to generate attractive returns with lower downside risk. Such companies tend to have proprietary products and services, which can sustain a longer term competitive advantage, and they tend to have a higher probability of maintaining a strong balance sheet and/or generating cash flow. After we identify a company, we conduct thorough analysis to establish its earning prospects and determine its value. Overall, we seek to invest in companies with attractive valuations.
We do not select investments for the Fund that are merely representative of the small cap asset class but instead aim to produce a portfolio of securities of exceptional companies operating in sectors that offer attractive growth potential. While we seek to outperform the MSCI EAFE Small Cap Index, the Fund may take positions that are not represented in the index.
Manager’s Discussion
During the period under review, several individual holdings helped the Fund’s performance relative to the MSCI EAFE Small Cap Index. In the financials sector, Singaporean real estate fund management company ARA Asset Management was a key contributor to Fund performance.2 Our position in Germany’s Pfeiffer Vacuum Technology, a leader in vacuum technology used for making computer chips and other products, helped Fund results. The Fund’s investment in U.K.-based camera and staging equipment supplier Vitec Group also aided Fund returns.3 In addition, U.K.-based global credit-reporting agency Experian contributed to performance.3 Our sole position in the health care
1. Source: © 2011 Morningstar. All Rights Reserved. The information contained herein: (1) is proprietary to Morningstar and/or its content providers; (2) may not be copied or distributed; and (3) is not warranted to be accurate, complete or timely. Neither Morningstar nor its content providers are responsible for any damages or losses arising from any use of this information. The index is unmanaged and includes reinvested distributions. One cannot invest directly in an index, and an index is not representative of the Fund’s portfolio.
2. The financials sector comprises capital markets, diversified financial services, insurance, and real estate management and development in the SOI.
3. Not part of the index.
14 | Semiannual Report
sector, Genus, which specializes in the genetics of animal breeding, also benefited the Fund.4 By period-end, we sold Pfeiffer Vacuum Technology.
It is important to recognize the effect of currency movements on the Fund’s performance. In general, if the value of the U.S. dollar goes up compared with a foreign currency, an investment traded in that foreign currency will go down in value because it will be worth fewer U.S. dollars. This can have a negative effect on Fund performance. Conversely, when the U.S. dollar weakens in relation to a foreign currency, an investment traded in that foreign currency will increase in value, which can contribute to Fund performance. For the six months ended January 31, 2011, the U.S. dollar declined in value relative to most currencies. As a result, the Fund’s performance was positively affected by the portfolio’s predominant investment in securities with non-U.S. currency exposure. However, one cannot expect the same result in future periods.
Several sectors detracted from relative results, namely, consumer discretionary, industrials and consumer staples.5 Among consumer discretionary holdings, specialty retailer industry stocks such as Greek toy retailer Jumbo and leading U.K.-based floor maker Carpetright detracted from performance. The Fund’s stock selection in the industrials sector hurt relative performance, particularly U.K. financial printer De La Rue. In the consumer staples sector, overweighting and stock selection weighed on relative returns. Our investment in Japanese hair product company Unihair Co. was a major detractor.
From a geographic perspective, several country allocations helped relative performance. The Fund’s stock selection in Singapore and Italy aided returns as well. In contrast, the Fund’s overweighting and stock selection in the U.K. hindered results. Overweighting in Greece was also detrimental as that country suffered from the effects of a sovereign debt crisis. Our allocation to Canada also hurt relative returns.3
Overall, we continue to find quality companies at what we consider discounted prices despite the recent increase in stock prices over the past six months. More recently, we have found more ideas in both Europe and Japan, in sectors that include consumer staples and consumer discretionary. In contrast, areas such as emerging markets and industries such as materials remain unattractive to us due to valuation. Given our bottom-up approach, valuation drives allocations in the Fund.
4. The health care sector comprises biotechnology in the SOI.
5. The consumer discretionary sector comprises diversified consumer services; hotels, restaurants and leisure; leisure equipment and products; media; and specialty retail in the SOI. The industrials sector comprises aerospace and defense, commercial services and supplies, construction and engineering, electrical equipment, industrial conglomerates, machinery, professional services, and transportation infrastructure in the SOI. The consumer staples sector comprises beverages, food products, household products, and personal products in the SOI.
Semiannual Report | 15
Top 10 Equity Holdings
Franklin International Small Cap Growth Fund 1/31/11
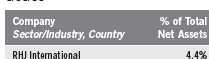
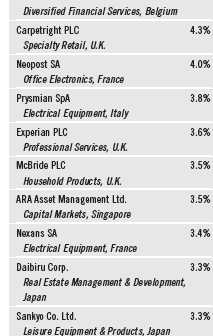
Thank you for your continued participation in Franklin International Small Cap Growth Fund. We look forward to serving your future investment needs.


Edwin Lugo, CFA Portfolio Manager
Franklin International Small Cap Growth Fund
The foregoing information reflects our analysis, opinions and portfolio holdings as of January 31, 2011, the end of the reporting period. The way we implement our main investment strategies and the resulting portfolio holdings may change depending on factors such as market and economic conditions. These opinions may not be relied upon as investment advice or an offer for a particular security. The information is not a complete analysis of every aspect of any market, country, industry, security or the Fund. Statements of fact are from sources considered reliable, but the investment manager makes no representation or warranty as to their completeness or accuracy. Although historical performance is no guarantee of future results, these insights may help you understand our investment management philosophy.
16 | Semiannual Report
Performance Summary as of 1/31/11
Franklin International Small Cap Growth Fund
Your dividend income will vary depending on dividends or interest paid by securities in the Fund’s portfolio, adjusted for operating expenses of each class. Capital gain distributions are net profits realized from the sale of portfolio securities. The performance table does not reflect any taxes that a shareholder would pay on Fund dividends, capital gain distributions, if any, or any realized gains on the sale of Fund shares. Total return reflects reinvestment of the Fund’s dividends and capital gain distributions, if any, and any unrealized gains or losses.
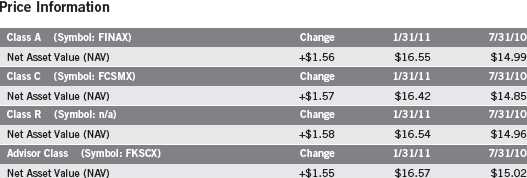
Semiannual Report | 17
Performance Summary (continued)
Performance1
Cumulative total return excludes sales charges. Average annual total returns and value of $10,000 investment include maximum sales charges. Class A: 5.75% maximum initial sales charge; Class C: 1% contingent deferred sales charge in first year only; Class R/Advisor Class: no sales charges.
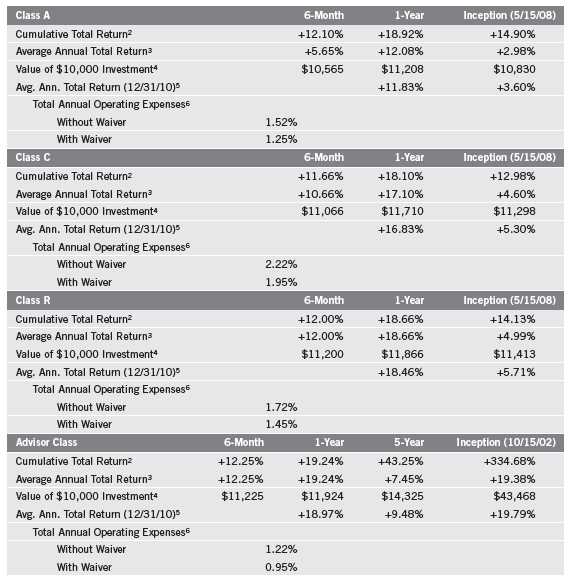
Performance data represent past performance, which does not guarantee future results. Investment return and principal value will fluctuate, and you may have a gain or loss when you sell your shares. Current performance may differ from figures shown. For most recent month-end performance, go to franklintempleton.com or call (800) 342-5236.
The investment manager and administrator have contractually agreed to waive or assume certain expenses so that common expenses (excluding Rule 12b-1 fees and acquired fund fees and expenses) for each class of the Fund do not exceed 0.95% (other than certainnonroutine expenses) until 11/30/11.
18 | Semiannual Report
Performance Summary (continued)
Endnotes
The Fund is intended for long-term investors who are comfortable with fluctuation in the value of their investment, especially over the short term. Smaller, relatively new and/or unseasoned companies can be particularly sensitive to changing economic conditions, and their prospects for growth are less certain than those of larger, more established companies. Foreign investing involves additional risks such as currency and market volatility, as well as political and social instability. Emerging markets involve heightened risks relating to the same factors. The Fund also invests in technology stocks, which can be highly volatile. The manager applies various techniques and analyses in making investment decisions for the Fund, but there can be no guarantee that these decisions will produce the desired results. The Fund’s prospectus also includes a description of the main investment risks.
| |
Class C: Class R: | These shares have higher annual fees and expenses than Class A shares. Shares are available to certain eligible investors as described in the prospectus. These shares have higher annual fees and expenses than Class A shares. |
Advisor Class: | Shares are available to certain eligible investors as described in the prospectus. |
1. If the manager and administrator had not waived fees, the Fund’s total returns would have been lower. 2. Cumulative total return represents the change in value of an investment over the periods indicated.
3. Average annual total return represents the average annual change in value of an investment over the periods indicated. Six-month return has not been annualized.
4. These figures represent the value of a hypothetical $10,000 investment in the Fund over the periods indicated.
5. In accordance with SEC rules, we provide standardized average annual total return information through the latest calendar quarter.
6. Figures are as stated in the Fund’s prospectus current as of the date of this report. In periods of market volatility, assets may decline significantly, causing total annual Fund operating expenses to become higher than the figures shown.
Semiannual Report | 19
Your Fund’s Expenses
Franklin International Small Cap Growth Fund
As a Fund shareholder, you can incur two types of costs:
- Transaction costs, including sales charges (loads) on Fund purchases; and
- Ongoing Fund costs, including management fees, distribution and service (12b-1) fees, and other Fund expenses. All mutual funds have ongoing costs, sometimes referred to as operating expenses.
The following table shows ongoing costs of investing in the Fund and can help you understand these costs and compare them with those of other mutual funds. The table assumes a $1,000 investment held for the six months indicated.
Actual Fund Expenses
The first line (Actual) for each share class listed in the table provides actual account values and expenses. The “Ending Account Value” is derived from the Fund’s actual return, which includes the effect of Fund expenses.
You can estimate the expenses you paid during the period by following these steps. Of course, your account value and expenses will differ from those in this illustration:
| 1. | Divide your account value by $1,000. |
| | If an account had an $8,600 value, then $8,600 ÷ $1,000 = 8.6. |
| 2. | Multiply the result by the number under the heading “Expenses Paid During Period.” |
| | If Expenses Paid During Period were $7.50, then 8.6 x $7.50 = $64.50. |
In this illustration, the estimated expenses paid this period are $64.50.
Hypothetical Example for Comparison with Other Funds
Information in the second line (Hypothetical) for each class in the table can help you compare ongoing costs of investing in the Fund with those of other mutual funds. This information may not be used to estimate the actual ending account balance or expenses you paid during the period. The hypothetical “Ending Account Value” is based on the actual expense ratio for each class and an assumed 5% annual rate of return before expenses, which does not represent the Fund’s actual return. The figure under the heading “Expenses Paid During Period” shows the hypothetical expenses your account would have incurred under this scenario. You can compare this figure with the 5% hypothetical examples that appear in shareholder reports of other funds.
20 | Semiannual Report
Your Fund’s Expenses (continued)
Please note that expenses shown in the table are meant to highlight ongoing costs and do not reflect any transaction costs, such as sales charges. Therefore, the second line for each class is useful in comparing ongoing costs only, and will not help you compare total costs of owning different funds. In addition, if transaction costs were included, your total costs would have been higher. Please refer to the Fund prospectus for additional information on operating expenses.
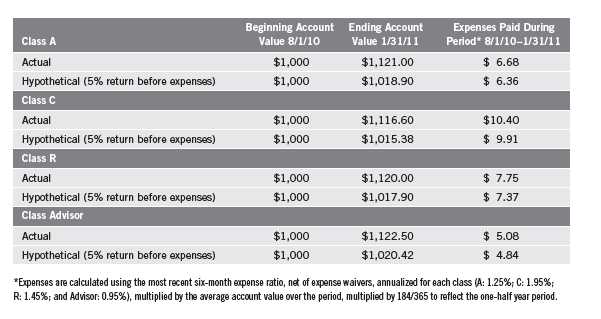
Semiannual Report | 21
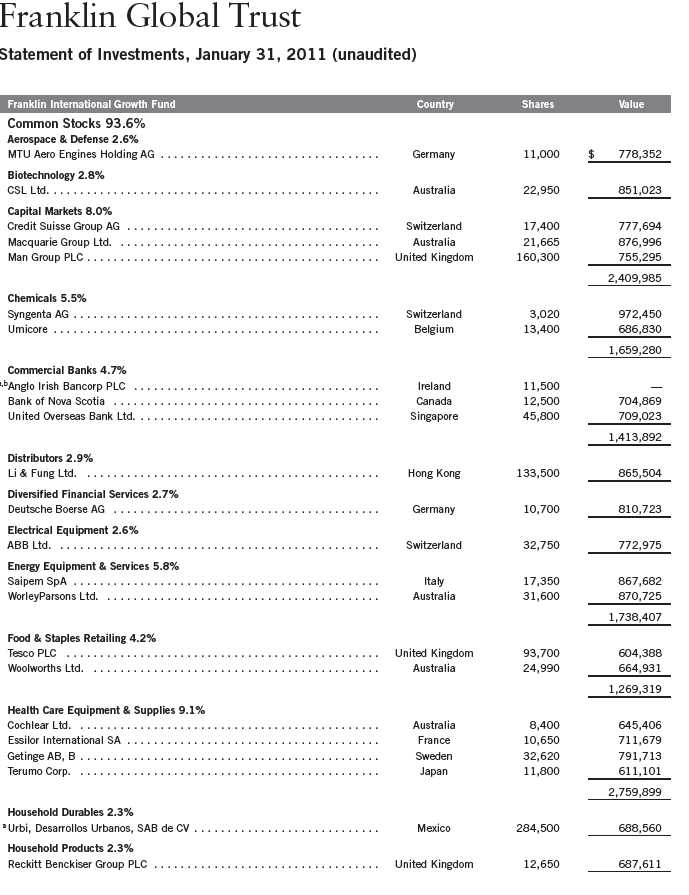
26 | Semiannual Report
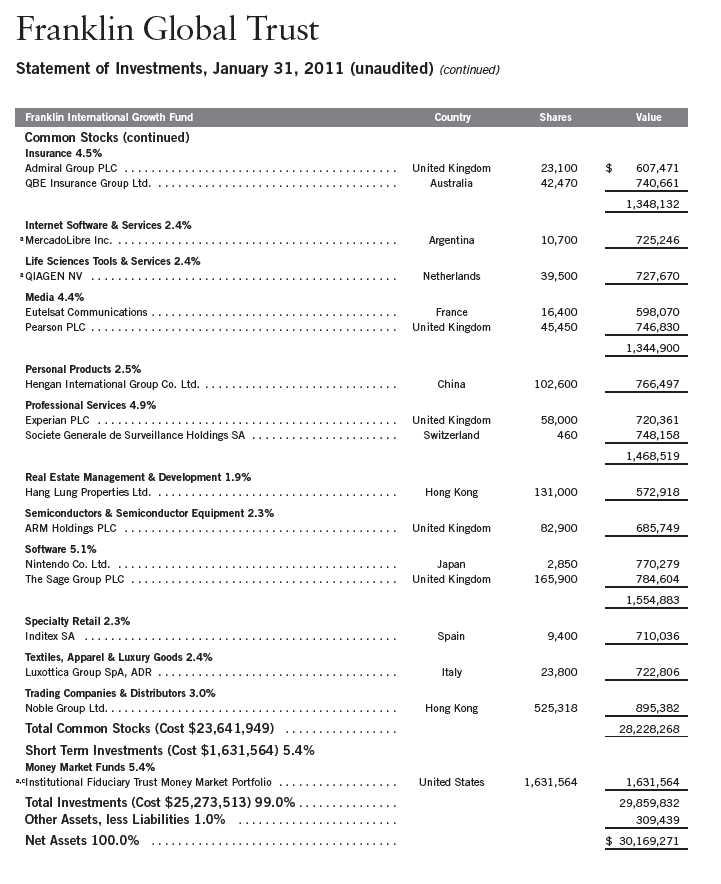
Semiannual Report | 27
Franklin Global Trust
Statement of Investments, January 31, 2011 (unaudited) (continued)
Franklin International Growth Fund
See Abbreviations on page 50.
aNon-income producing. bSecurity has been deemed illiquid because it may not be able to be sold within seven days. cSee Note 7 regarding investments in the Institutional Fiduciary Trust Money Market Portfolio.
28 | The accompanying notes are an integral part of these financial statements. | Semiannual Report
Franklin Global Trust
Statement of Investments, January 31, 2011 (unaudited)
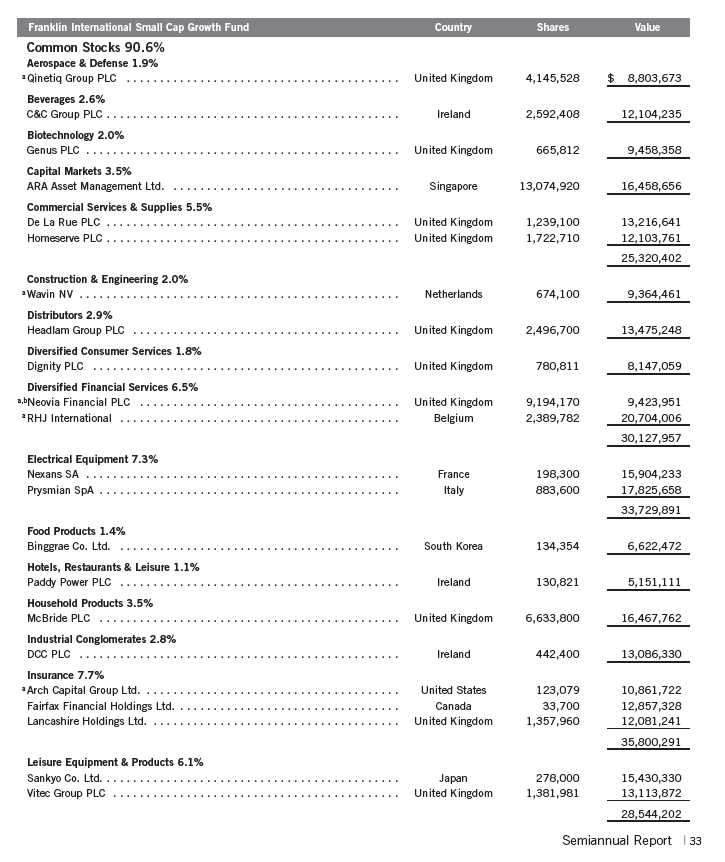
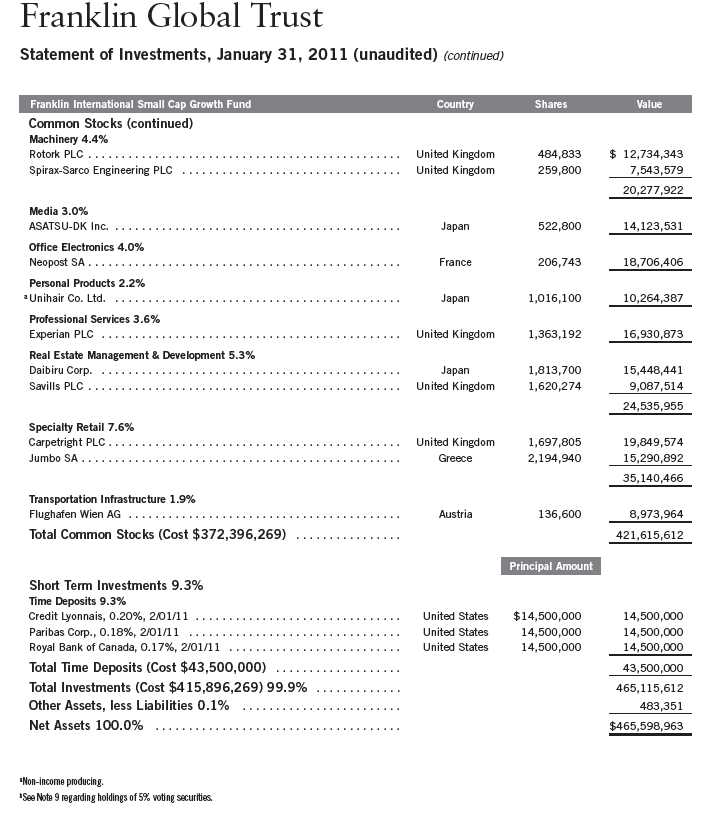
34 | The accompanying notes are an integral part of these financial statements. | Semiannual Report

Semiannual Report | The accompanying notes are an integral part of these financial statements. | 35
Franklin Global Trust
Financial Statements (continued)
Statements of Assets and Liabilities (continued)
January 31, 2011 (unaudited)
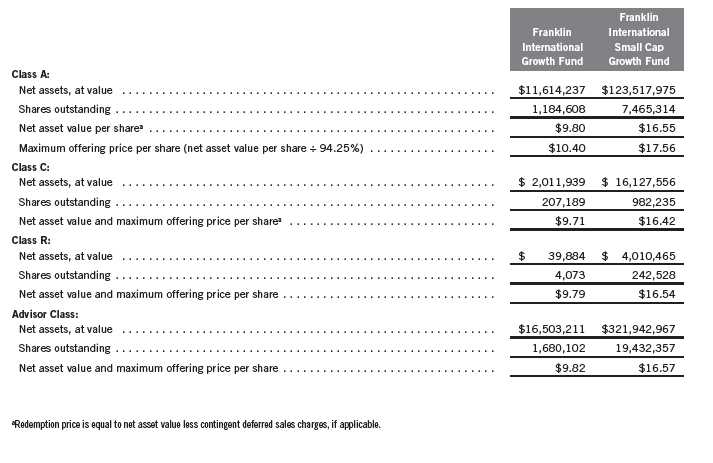
36 | The accompanying notes are an integral part of these financial statements. | Semiannual Report

Semiannual Report | The accompanying notes are an integral part of these financial statements. | 37
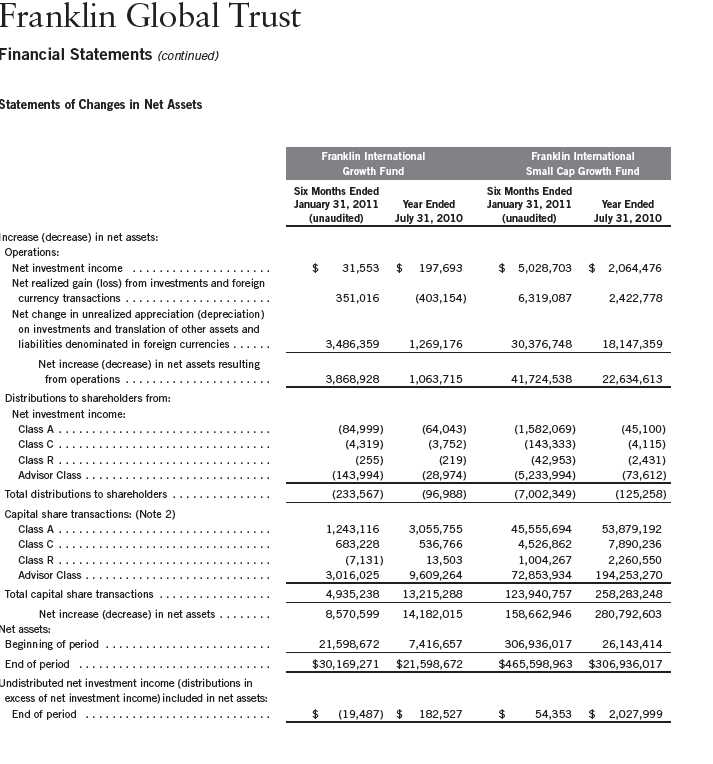
38 | The accompanying notes are an integral part of these financial statements. | Semiannual Report
Franklin Global Trust
Notes to Financial Statements (unaudited)
1. ORGANIZATION AND SIGNIFICANT ACCOUNTING POLICIES
Franklin Global Trust (Trust) is registered under the Investment Company Act of 1940, as amended, (1940 Act) as an open-end investment company, consisting of five separate funds, two of which are included in this report (Funds). The financial statements of the remaining funds in the Trust are presented separately. The Funds offer four classes of shares: Class A, Class C, Class R, and Advisor Class. Each class of shares differs by its initial sales load, contingent deferred sales charges, distribution fees, voting rights on matters affecting a single class and its exchange privilege.
The following summarizes the Funds’ significant accounting policies.
a. Financial Instrument Valuation
The Funds value their investments in securities and other financial instruments carried at fair value daily. Fair value is the price that would be received to sell an asset or paid to transfer a liability in an orderly transaction between market participants on the measurement date. Under procedures approved by the Trust’s Board of Trustees, the Funds may utilize independent pricing services, quotations from securities and financial instrument dealers, and other market sources to determine fair value.
Equity securities listed on an exchange or on the NASDAQ National Market System are valued at the last quoted sale price or the official closing price of the day, respectively. Foreign equity securities are valued as of the close of trading on the foreign stock exchange on which the security is primarily traded, or the NYSE, whichever is earlier. The value is then converted into its U.S. dollar equivalent at the foreign exchange rate in effect at the close of the NYSE on the day that the value of the security is determined. Over-the-counter securities are valued within the range of the most recent quoted bid and ask prices. Securities that trade in multiple markets or on multiple exchanges are valued according to the broadest and most representative market. Certain equity securities are valued based upon fundamental characteristics or relationships to similar securities. Investments in open-end mutual funds are valued at the closing net asset value. Time deposits are valued at cost, which approximates market value.
The Funds have procedures to determine the fair value of securities and other financial instruments for which market prices are not readily available or which may not be reliably priced. Under these procedures, the Funds primarily employ a market-based approach which may use related or comparable assets or liabilities, recent transactions, market multiples, book values, and other relevant information for the investment to determine the fair value of the investment. The Funds may also use an income-based valuation approach in which the anticipated future cash flows of the investment are discounted to calculate fair value. Discounts may also be applied due to the nature or duration of any restrictions on the disposition of the investments. Due to the inherent uncertainty of valuations of such investments, the fair values may differ significantly from the values that would have been used had an active market existed.
Semiannual Report | 39
Franklin Global Trust
Notes to Financial Statements (unaudited) (continued)
| 1. | ORGANIZATION AND SIGNIFICANT ACCOUNTING POLICIES (continued) |
| a. | Financial Instrument Valuation (continued) |
Trading in securities on foreign securities stock exchanges and over-the-counter markets may be completed before the daily close of business on the NYSE. Occasionally, events occur between the time at which trading in a foreign security is completed and the close of the NYSE that might call into question the reliability of the value of a portfolio security held by the fund. As a result, differences may arise between the value of the Funds’ portfolio securities as determined at the foreign market close and the latest indications of value at the close of the NYSE. In order to minimize the potential for these differences, the investment manager monitors price movements following the close of trading in foreign stock markets through a series of country specific market proxies (such as baskets of American Depository Receipts, futures contracts and exchange traded funds). These price movements are measured against established trigger thresholds for each specific market proxy to assist in determining if an event has occurred that may call into question the reliability of the values of the foreign securities held by the Funds. If such an event occurs, the securities may be valued using fair value procedures, which may include the use of independent pricing services. At January 31, 2011, a market event occurred resulting in a portion of the securities held by the Franklin International Small Cap Growth Fund being valued using fair value procedures.
b. Foreign Currency Translation
Portfolio securities and other assets and liabilities denominated in foreign currencies are translated into U.S. dollars based on the exchange rate of such currencies against U.S. dollars on the date of valuation. The Funds may enter into foreign currency exchange contracts to facilitate transactions denominated in a foreign currency. Purchases and sales of securities, income and expense items denominated in foreign currencies are translated into U.S. dollars at the exchange rate in effect on the transaction date. Portfolio securities and assets and liabilities denominated in foreign currencies contain risks that those currencies will decline in value relative to the U.S. dollar. Occasionally, events may impact the availability or reliability of foreign exchange rates used to convert the U.S. dollar equivalent value. If such an event occurs, the foreign exchange rate will be valued at fair value using procedures established and approved by the Trust’s Board of Trustees.
The Funds do not separately report the effect of changes in foreign exchange rates from changes in market prices on securities held. Such changes are included in net realized and unrealized gain or loss from investments on the Statement of Operations.
Realized foreign exchange gains or losses arise from sales of foreign currencies, currency gains or losses realized between the trade and settlement dates on securities transactions and the difference between the recorded amounts of dividends, interest, and foreign withholding taxes and the U.S. dollar equivalent of the amounts actually received or paid. Net unrealized foreign exchange gains and losses arise from changes in foreign exchange rates on foreign denominated assets and liabilities other than investments in securities held at the end of the reporting period.
40 | Semiannual Report
Franklin Global Trust
Notes to Financial Statements (unaudited) (continued)
| 1. | ORGANIZATION AND SIGNIFICANT ACCOUNTING POLICIES (continued) |
| c. | Income Taxes |
It is each fund’s policy to qualify as a regulated investment company under the Internal Revenue Code. Each fund intends to distribute to shareholders substantially all of its taxable income and net realized gains to relieve it from federal income and excise taxes. As a result, no provision for U.S. federal income taxes is required. Each fund files U.S. income tax returns as well as tax returns in certain other jurisdictions. Each fund’s application of those tax rules is subject to its understanding. Each fund records a provision for taxes in its financial statements including penalties and interest, if any, for a tax position taken on a tax return (or expected to be taken) when it fails to meet the more likely than not (a greater than 50% probability) threshold and based on the technical merits, the tax position may not be sustained upon examination by the tax authorities. As of January 31, 2011, and for all open tax years, each fund has determined that no provision for income tax is required in each fund’s financial statements. Open tax years are those that remain subject to examination and are based on each tax jurisdiction statute of limitation. Each fund is not aware of any tax position for which it is reasonably possible that the total amounts of unrecognized tax effects will significantly change in the next twelve months.
The Funds may be subject to foreign taxation related to income received, capital gains on the sale of securities and certain foreign currency transactions in the foreign jurisdictions in which it invests. Foreign taxes, if any, are recorded based on the tax regulations and rates that exist in the foreign markets in which the Funds invest. When a capital gain tax is determined to apply the Funds record an estimated deferred tax liability for net unrealized gains on these securities in an amount that would be payable if the securities were disposed of on the valuation date.
d. Security Transactions, Investment Income, Expenses and Distributions
Security transactions are accounted for on trade date. Realized gains and losses on security transactions are determined on a specific identification basis. Interest income and estimated expenses are accrued daily. Dividend income is recorded on the ex-dividend date except that certain dividends from foreign securities are recognized as soon as the Funds are notified of the ex-dividend date. Distributions to shareholders are recorded on the ex-dividend date and are determined according to income tax regulations (tax basis). Distributable earnings determined on a tax basis may differ from earnings recorded in accordance with accounting principles generally accepted in the United States of America. These differences may be permanent or temporary. Permanent differences are reclassified among capital accounts to reflect their tax character. These reclassifications have no impact on net assets or the results of operations. Temporary differences are not reclassified, as they may reverse in subsequent periods.
Common expenses incurred by the Trust are allocated among the funds based on the ratio of net assets of each fund to the combined net assets of the Trust. Fund specific expenses are charged directly to the fund that incurred the expense.
Semiannual Report | 41
Franklin Global Trust
Notes to Financial Statements (unaudited) (continued)
| 1. | ORGANIZATION AND SIGNIFICANT ACCOUNTING POLICIES (continued) |
| d. | Security Transactions, Investment Income, Expenses and Distributions (continued) |
Realized and unrealized gains and losses and net investment income, not including class specific expenses, are allocated daily to each class of shares based upon the relative proportion of net assets of each class. Differences in per share distributions, by class, are generally due to differences in class specific expenses.
e. Accounting Estimates
The preparation of financial statements in accordance with accounting principles generally accepted in the United States of America requires management to make estimates and assumptions that affect the reported amounts of assets and liabilities at the date of the financial statements and the amounts of income and expenses during the reporting period. Actual results could differ from those estimates.
f. Guarantees and Indemnifications
Under the Trust’s organizational documents, its officers and trustees are indemnified by the Trust against certain liabilities arising out of the performance of their duties to the Trust. Additionally, in the normal course of business, the Trust, on behalf of the Funds, enters into contracts with service providers that contain general indemnification clauses. The Trust’s maximum exposure under these arrangements is unknown as this would involve future claims that may be made against the Trust that have not yet occurred. Currently, the Trust expects the risk of loss to be remote.
2. SHARES OF BENEFICIAL INTEREST
At January 31, 2011, there were an unlimited number of shares authorized (without par value).
Transactions in the Funds’ shares were as follows:
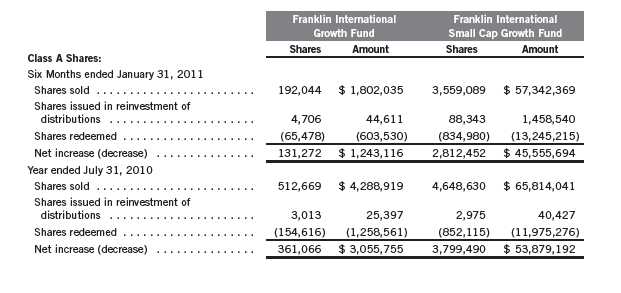
42 | Semiannual Report

Semiannual Report | 43
Franklin Global Trust
Notes to Financial Statements (unaudited) (continued)
3. TRANSACTIONS WITH AFFILIATES
Franklin Resources, Inc. is the holding company for various subsidiaries that together are referred to as Franklin Templeton Investments. Certain officers and trustees of the Trust are also officers and/or directors of the following subsidiaries:
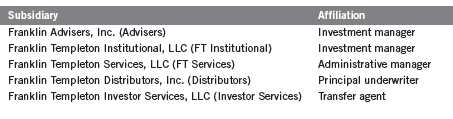
a. Management Fees
The Franklin International Growth Fund pays an investment management fee to FT Institutional based on the average daily net assets of the fund as follows:
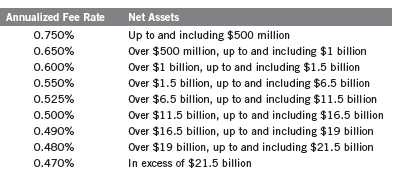
The Franklin International Small Cap Growth Fund pays an investment management fee to Advisers of 0.75% per year of the average daily net assets of the fund.
Under a subadvisory agreement, FT Institutional, an affiliate of Advisers, provides subadvisory services to the Franklin International Small Cap Growth Fund. The subadvisory fee is paid by Advisers based on the average daily net assets, and is not an additional expense of the fund.
b. Administrative Fees
The Funds pay an administrative fee to FT Services of 0.20% per year of the average daily net assets of each of the Funds.
c. Distribution Fees
The Trust’s Board of Trustees has adopted distribution plans for each share class, with the exception of Advisor Class shares, pursuant to Rule 12b-1 under the 1940 Act. Under the Funds’ Class A reimbursement distribution plans, the Funds reimburse Distributors for costs incurred in connection with the servicing, sale and distribution of the Funds’ shares up to the
44 | Semiannual Report
Franklin Global Trust
Notes to Financial Statements (unaudited) (continued)
| 3. | TRANSACTIONS WITH AFFILIATES (continued) |
| c. | Distribution Fees (continued) |
maximum annual plan rate. Under the Class A reimbursement distribution plans, costs exceeding the maximum for the current plan year cannot be reimbursed in subsequent periods.
In addition, under the Funds’ Class C and R compensation distribution plans, the Funds pay Distributors for costs incurred in connection with the servicing, sale and distribution of each fund’s shares up to the maximum annual plan rate for each class.
The maximum annual plan rates, based on the average daily net assets, for each class, are as follows:
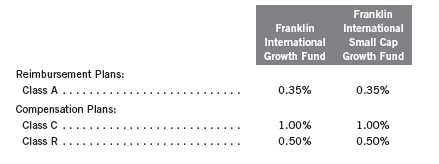
The Board of Trustees has set the current rate at 0.30% per year for Class A shares until further notice and approval by the Board.
d. Sales Charges/Underwriting Agreements
Distributors has advised the Funds of the following commission transactions related to the sales and redemptions of the Funds’ shares for the period:
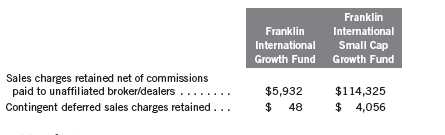
e. Transfer Agent Fees
For the period ended January 31, 2011, the Funds paid transfer agent fees as noted in the Statements of Operations of which the following amounts were retained by Investor Services:
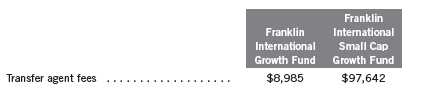
Semiannual Report | 45
Franklin Global Trust
Notes to Financial Statements (unaudited) (continued)
| 3. | TRANSACTIONS WITH AFFILIATES (continued) |
| f. | Waiver and Expense Reimbursements |
Advisers, FT Institutional, and FT Services have contractually agreed in advance to waive or limit their respective fees and to assume as their own expense certain expenses otherwise payable by the Franklin International Growth Fund and the Franklin International Small Cap Growth Fund so that the common expenses (i.e. a combination of management fees, administrative fees, and other expenses, but excluding distribution fees and acquired fund fees and expenses) for each class of the Funds do not exceed 1.15% and 0.95%, respectively (other than certain non-routine expenses or costs, including those relating to litigation, indemnification, reorganizations, and liquidations) until November 30, 2011.
g. Other Affiliated Transactions
At January 31, 2011, Advisers owned 16.16% of the Franklin International Growth Fund’s outstanding shares.
4. EXPENSE OFFSET ARRANGEMENT
The Funds have entered into an arrangement with their custodian whereby credits realized as a result of uninvested cash balances are used to reduce a portion of the Funds’ custodian expenses. During the period ended January 31, 2011, there were no credits earned.
5. INCOME TAXES
For tax purposes, capital losses may be carried over to offset future capital gains, if any. At July 31, 2010, the capital loss carryforwards were as follows:
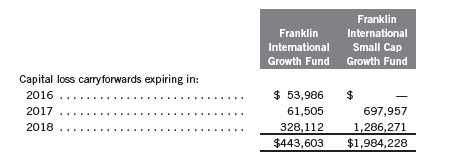
For tax purposes, realized capital losses occurring subsequent to October 31 may be deferred and treated as occurring on the first day of the following fiscal year. At July 31, 2010, the Franklin International Growth Fund deferred realized capital losses of $249,717.
46 | Semiannual Report
Franklin Global Trust
Notes to Financial Statements (unaudited) (continued)
5. INCOME TAXES (continued)
At January 31, 2011, the cost of investments and net unrealized appreciation (depreciation) for income tax purposes were as follows:
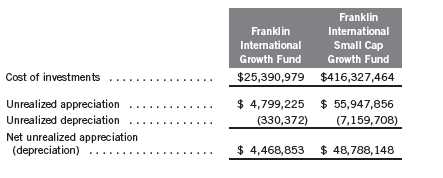
Net investment income differs for financial statement and tax purposes primarily due to differing treatment of foreign currency transactions.
Net realized gains (losses) differ for financial statement and tax purposes primarily due to differing treatments of wash sales, foreign currency transactions, and passive foreign investment company shares.
6. INVESTMENT TRANSACTIONS
Purchases and sales of investments (excluding short term securities) for the period ended January 31, 2011, were as follows:

7. INVESTMENTS IN INSTITUTIONAL FIDUCIARY TRUST MONEY MARKET PORTFOLIO
The Funds may invest in the Institutional Fiduciary Trust Money Market Portfolio (Sweep Money Fund), an open-end investment company managed by Advisers. Management fees paid by the Funds are reduced on assets invested in the Sweep Money Fund, in an amount not to exceed the management and administrative fees paid by the Sweep Money Fund.
Semiannual Report | 47
Franklin Global Trust
Notes to Financial Statements (unaudited) (continued)
8. CONCENTRATION OF RISK
Investing in foreign securities may include certain risks and considerations not typically associated with investing in U.S. securities, such as fluctuating currency values and changing local and regional economic, political and social conditions, which may result in greater market volatility. In addition, certain foreign securities may not be as liquid as U.S. securities.
9. HOLDINGS OF 5% VOTING SECURITIES OF PORTFOLIO COMPANIES
The 1940 Act defines “affiliated companies” to include investments in portfolio companies in which a fund owns 5% or more of the outstanding voting securities. Investments in “affiliated companies” for the Franklin International Small Cap Growth Fund for the period ended January 31, 2011, were as shown below.
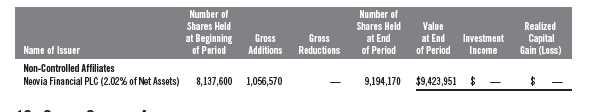
10. SPECIAL SERVICING AGREEMENT
The Franklin International Small Cap Growth Fund, which is an eligible underlying investment of one or more of the Franklin Templeton Fund Allocator Series Funds (Allocator Funds), participates in a Special Servicing Agreement (SSA) with the Allocator Funds and certain service providers of the fund and the Allocator Funds. Under the SSA, the fund may pay a portion of the Allocator Funds’ expenses (other than any asset allocation, administrative, and distribution fees) to the extent such payments are less than the amount of the benefits realized or expected to be realized by the fund (e.g., due to reduced costs associated with servicing accounts) from the investment in the fund by the Allocator Funds. The Allocator Funds and the fund are either managed by Advisers or administered by FT Services. For the period ended January 31, 2011, the fund was held by one or more of the Allocator Funds and the amount of expenses borne by the fund is noted in the Statement of Operations. At January 31, 2011, 20.72% of the fund’s outstanding shares was held by one or more of the Allocator Funds.
11. CREDIT FACILITY
The Funds, together with other U.S. registered and foreign investment funds (collectively “Borrowers”), managed by Franklin Templeton Investments, are borrowers in a joint syndicated senior unsecured credit facility totaling $750 million (Global Credit Facility) which matures on January 20, 2012. This Global Credit Facility provides a source of funds to the Borrowers for temporary and emergency purposes, including the ability to meet future unanticipated or unusually large redemption requests.
48 | Semiannual Report
Franklin Global Trust
Notes to Financial Statements (unaudited) (continued)
11. CREDIT FACILITY (continued)
Under the terms of the Global Credit Facility, the Funds shall, in addition to interest charged on any borrowings made by the Funds and other costs incurred by the Funds, pay their share of fees and expenses incurred in connection with the implementation and maintenance of the Global Credit Facility, based upon its relative share of the aggregate net assets of all of the Borrowers, including an annual commitment fee of 0.08% based upon the unused portion of the Global Credit Facility, which is reflected in other expenses on the Statements of Operations. During the period ended January 31, 2011, the Funds did not use the Global Credit Facility.
12. FAIR VALUE MEASUREMENTS
The Funds follow a fair value hierarchy that distinguishes between market data obtained from independent sources (observable inputs) and the Funds’ own market assumptions (unobservable inputs). These inputs are used in determining the value of the Funds’ investments and are summarized in the following fair value hierarchy:
- Level 1 – quoted prices in active markets for identical securities
- Level 2 – other significant observable inputs (including quoted prices for similar securities, interest rates, prepayment speed, credit risk, etc.)
- Level 3 – significant unobservable inputs (including the Funds’ own assumptions in determining the fair value of investments)
The inputs or methodology used for valuing securities are not an indication of the risk associated with investing in those securities.
For movements between the levels within the fair value hierarchy, the Funds have adopted a policy of recognizing the transfers as of the date of the underlying event which caused the movement.
The following is a summary of the inputs used as of January 31, 2011, in valuing the Funds’ assets and liabilities carried at fair value:
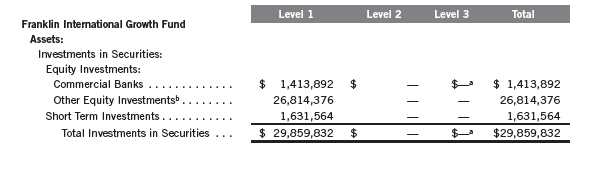
Semiannual Report | 49
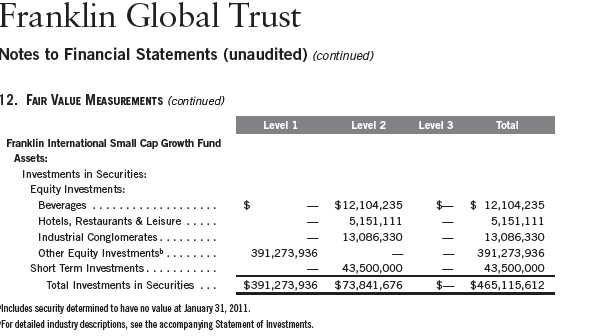
13. SUBSEQUENT EVENTS
The Funds have evaluated subsequent events through the issuance of the financial statements and determined that no events have occurred that require disclosure.
ABBREVIATIONS
Selected Portfolio
ADR - American Depository Receipt
50 | Semiannual Report
Franklin Global Trust
Shareholder Information
Proxy Voting Policies and Procedures
The Trust’s investment manager has established Proxy Voting Policies and Procedures (Policies) that the Trust uses to determine how to vote proxies relating to portfolio securities. Shareholders may view the Trust’s complete Policies online at franklintempleton.com. Alternatively, shareholders may request copies of the Policies free of charge by calling the Proxy Group collect at (954) 527-7678 or by sending a written request to: Franklin Templeton Companies, LLC, 500 East Broward Boulevard, Suite 1500, Fort Lauderdale, FL 33394, Attention: Proxy Group. Copies of the Trust’s proxy voting records are also made available online at franklintempleton.com and posted on the U.S. Securities and Exchange Commission’s website at sec.gov and reflect the most recent 12-month period ended June 30.
Quarterly Statement of Investments
The Trust files a complete statement of investments with the U.S. Securities and Exchange Commission for the first and third quarters for each fiscal year on Form N-Q. Shareholders may view the filed Form N-Q by visiting the Commission’s website at sec.gov. The filed form may also be viewed and copied at the Commission’s Public Reference Room in Washington, DC. Information regarding the operations of the Public Reference Room may be obtained by calling (800) SEC-0330.
Semiannual Report | 51
This page intentionally left blank.
JANUARY 31, 2011
A series of Franklin Global Trust
SEMIANNUAL REPORT
FRANKLIN TEMPLETON EMERGING MARKET
DEBT OPPORTUNITIES FUND

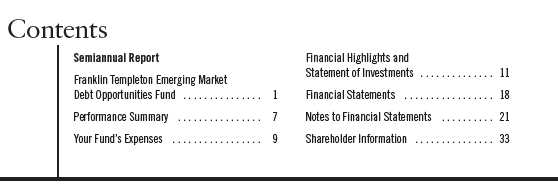
Semiannual Report
Franklin Templeton Emerging Market Debt Opportunities Fund
Your Fund’s Goal and Main Investments: Franklin Templeton Emerging Market Debt Opportunities Fund seeks high total return through investing in debt securities of emerging market countries, mainly securities issued by sovereign and sub-sovereign government entities, but also including securities issued by corporate entities.
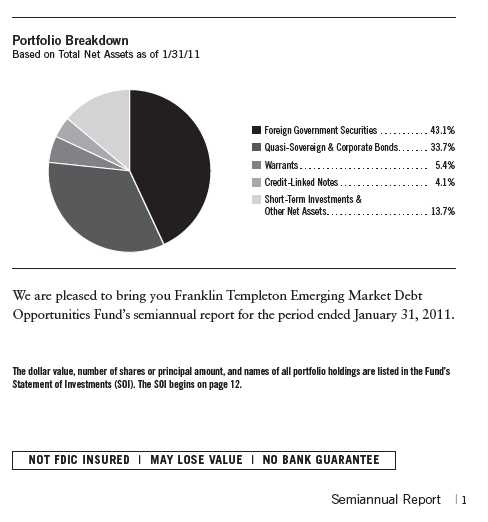
Performance Overview
Performance data represent past performance, which does not guarantee future results. Investment return and principal value will fluctuate, and you may have a gain or loss when you sell your shares. Current performance may differ from figures shown. Please call a Franklin Templeton Institutional Services representative at (800) 321-8563 for most recent month-end performance.
Franklin Templeton Emerging Market Debt Opportunities Fund delivered a +5.31% cumulative total return for the six months ended January 31, 2011. The Fund outperformed the +1.56% total return of its benchmark, the J.P. Morgan (JPM) Emerging Markets Bond Index (EMBI) Global Diversified Index, which tracks total returns for U.S. dollar-denominated debt instruments issued by emerging market sovereign and quasi-sovereign entities.1 The Fund also outperformed its second benchmark, the JPM Global Bond Index (GBI) Emerging Markets (EM) Broad Diversified Index, which produced a +4.09% total return for the same period and which tracks local currency bonds issued by emerging markets.1 The Fund outperformed the +4.06% total return of its third benchmark, the BofA Merrill Lynch (BofAML) Emerging Market Credit Plus (EMC+) Index (100% $US Hedged), which tracks performance of U.S. dollar-denominated and euro-denominated debt of sovereign issuers with a BBB or lower foreign currency long-term debt rating, in addition to corporate issuers domiciled in countries with a below-investment-grade foreign currency long-term debt rating.2 You can find more performance data in the Performance Summary beginning on page 7.
Economic and Market Overview
The six-month reporting period was relatively volatile. First, risk appetite for global financial assets was strong after the release of the European banks’ stress tests at the end of July 2010, followed by the U.S. Federal Reserve Board’s (Fed’s) August announcement of an upcoming second phase to its quantitative easing monetary policy (QE2). QE2 was an attempt at further economic stimulus via Treasury bond buybacks. In reaction to the news, U.S. Treasuries rallied strongly in August. However, the implementation of QE2 as confirmed by the central bank’s Federal Open Market Committee on November 3, followed by the absence of a decisive tax reform that would have enabled a more rapid decline of the U.S. fiscal deficit, raised some concerns. Shortly thereafter, the government of Ireland reacted to the deterioration of its leveraged local banking sector by seeking to receive external emergency funding from the European Union, the European Monetary Union and the International Monetary Fund at the end of November.
1. Source: © 2011 Morningstar. All Rights Reserved. The information contained herein: (1) is proprietary to Morningstar and/or its content providers; (2) may not be copied or distributed; and (3) is not warranted to be accurate, complete or timely. Neither Morningstar nor its content providers are responsible for any damages or losses arising from any use of this information.
2. Source: Merrill Lynch.
The indexes are unmanaged and include reinvested interest. One cannot invest directly in an index, and an index is not representative of the Fund’s portfolio.
2 | Semiannual Report
The U.S. Treasury yield curve steepened over the six-month reporting period, and 10- to 30-year bond yields rose about 50 basis points (bps; 100 basis points equal one percentage point). Similarly, the German Bund yield curve rose, with medium-term (1- to 10-year) bonds moving up about 60 bps while long maturities (30-year) increased about 20 bps.3
Most commodity prices escalated during the period. Crude oil — perhaps the most important commodity used to gauge emerging market debt — rose from $79 per barrel at the end of July to $92 per barrel by period-end. In this environment, the average option-adjusted spread of U.S. dollar-denominated external government debt of emerging markets absorbed most of the volatility of U.S. Treasuries and stabilized around 291 bps over U.S. Treasuries.4 However, local nominal rates in emerging markets took off in January, signaling global capital markets’ general disapproval of the timid tightening monetary policies of most emerging market central banks. As a result of skyrocketing raw materials costs, particularly among agricultural goods, commodity and food inflation expectations rose dramatically by January 2011. Yet, hard currency bonds issued by governments and companies domiciled in emerging markets remained in high demand, and the market easily absorbed more than $173 billion equivalent of Eurobonds issued by emerging markets during the period.
The yield on bonds in the JPM EMBI Global Diversified Index increased less than 20 bps, or from 5.94% to 6.13%, over the period.1 Meanwhile, the yield on bonds in the JPM GBI EM Broad Diversified Index rose 55 bps, from 6.28% to 6.83%.1
U.S. dollar-denominated emerging market sovereign bonds, represented by the JPM EMBI Global Diversified Index, rose 1.56% over the period.1 Local currency-denominated emerging market bonds, represented by the JPM GBI EM Broad Diversified Index, outperformed their U.S. dollar-denominated counterparts, gaining 4.09% as the U.S. dollar weakened 3.82% versus a broad basket of global currencies.5 Finally, G-76 currency-denominated quasi-sovereign and corporate debt, represented by the BofAML EMC+ Index, posted a +4.06% total return.2
3. Source: BGN.
4. Source: Barclays Capital.
5. Source: Federal Reserve H10 Report.
6. The G-7, or Group of Seven, is an informal forum of finance ministers from seven industrialized nations who meet periodically to discuss economic policies. The G-7 includes Canada, France, Germany, Italy, Japan, the U.K. and the U.S.
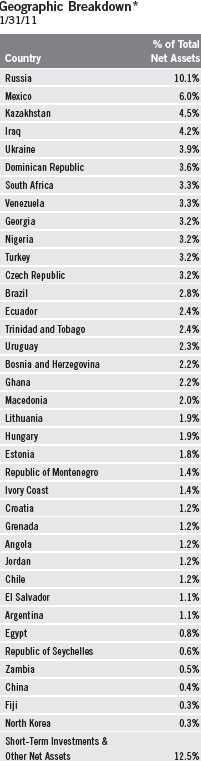
*May differ from the SOI because percentages reflect the issuing country of the Fund’s long-term securities and include the effect of interest receivable balances.
Semiannual Report | 3

*Percentages include the effect of interest receivable balances.
**Holding is a negative percentage because of the Fund’s holdings of forward currency exchange contracts.
Investment Strategy
Our portfolio construction process can be summarized in three integral steps — country allocation, currency allocation and issue selection. The first stage of our emerging market debt investment process is identifying the countries for which we have a favorable outlook, which we manage with a bottom-up, research-driven perspective. Since the portfolio is constructed through bottom-up, fundamental research and not relative to a benchmark index, there is no requirement to hold issues in any one country. The next decision is whether to take exposure in the form of “hard currency” or local currency instruments. Hard currencies are typically currencies of economically and politically stable industrialized nations. The last decision concerns security selection. This depends on a number of factors including the security’s coupon type (fixed or floating). We may seek to manage the Fund’s exposure to various currencies, and may from time to time seek to hedge (protect) against currency risk, largely by using forward currency exchange contracts.
Manager’s Discussion
During the reporting period, the Fund’s major contributors to outperformance of its benchmark indexes were commodity exporting economies such as Nigeria, Venezuela, Ecuador, Iraq and Angola, which benefited from rising oil prices. In addition, selected emerging market corporate bonds from issuers such as South African retailer Edcon Proprietary; Kazakh bank Halyk Savings Bank of Kazakhstan;7 state-owned railway company Kazakhstan Temir Zholy; quasi-sovereign Dominican Republic utility producer EGE Haina Finance; Georgian Railway, a state-owned railway operator; the state-owned oil company Petro Co. of Trinidad and Tobago; and the third-largest Russian oil exporter, TNK-BP Finance, also performed well. Finally, the Letras Financeiras do Tesouro, a Brazilian note denominated in real and linked to the central bank’s SELIC rate, benefited from Brazil’s monetary tightening of its interest rate by 50 bps in January. The Fund’s use of foreign currency forward contracts, credit-linked notes and oil-indexed payment obligations (Government of Venezuela warrants) also made a small contribution during the reporting period.
7. HSBK (Europe) in the SOI.
4 | Semiannual Report
There was one detractor from performance worth mentioning, although the negative impact was limited over the reporting period due to the Fund’s small position in the Ivory Coast Eurobond. Ivory Coast, following the second round of long-awaited presidential elections, fell into much uncertainty in December, missed the coupon payment due at the end of 2010 and was unable to make any payments by the end of January 2011 when the 30-day grace period ended. The 2032 Ivory Coast Eurobond issued in April 2010 following a decade of default and more than a year of restructuring negotiations lost a third of its value over the reporting period. Yet, the Fund’s unrealized loss was limited, as the Fund had been purchasing the defaulted Brady Bond before we exchanged it for the 2032 bond, as we discussed in the July 2010 shareholder report.
On January 31, 2011, the Fund had exposure to 38 emerging market countries. The largest single country exposure was Russia (10.1% of total net assets) followed by Mexico (6.0%), Kazakhstan (4.5%) and Iraq (4.2%). Long-term securities denominated in G-7 currencies constituted 71.3% of total net assets with 51.8% denominated in the U.S. dollar, 16.4% in the euro and 3.1% in the Japanese yen. The Fund’s exposures to the euro and yen were fully hedged back into the U.S. dollar. In addition, 17.4% of total net assets were denominated in 10 local currencies, of which the largest was the Mexican peso at 3.9% of total net assets.
During the reporting period, we added several new securities to the portfolio. We made purchases in Montenegro, Russia, Ukraine and Dominican Republic sovereign bonds. In addition, we bought four new corporate debt issues out of Russia, Turkey, Chile and China on the secondary and primary markets. Respectively from these countries, the bonds were in the energy (LUKOIL Holdings), retail (Yasar Holdings and Cencosud) and construction materials (West China Cement) sectors. We added one quasi-sovereign Eurobond, the state-owned Georgian Railway. The Fund’s two new currencies were the Dominican Republic peso and the Ukrainian hryvnia. We increased the Fund’s positions in many other holdings.
We sold the newly issued, long-duration Egypt U.S. dollar-denominated 2040 Eurobond in mid-November and eliminated exposure to Polish media group TVN Finance.
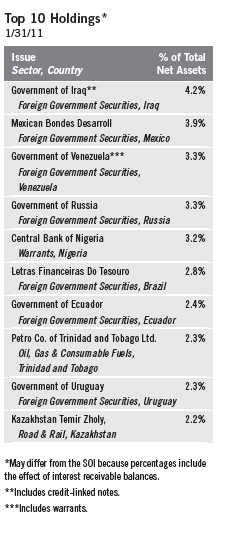
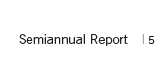
We thank you for your confidence in Franklin Templeton Emerging Market Debt Opportunities Fund and hope to serve your investment needs at the highest level of expectations.


William Ledward
Portfolio Manager and Research Analyst of Franklin Templeton Investment Management Ltd. Fixed Income Group

Claire Husson, CFA
Portfolio Manager and Research Analyst of Franklin Templeton Investment Management Ltd. Fixed Income Group
Portfolio Management Team
Franklin Templeton Emerging Market
Debt Opportunities Fund
CFA® is a trademark owned by CFA Institute.
The foregoing information reflects our analysis, opinions and portfolio holdings as of January 31, 2011, the end of the reporting period. The way we implement our main investment strategies and the resulting portfolio holdings may change depending on factors such as market and economic conditions. These opinions may not be relied upon as investment advice or an offer for a particular security. The information is not a complete analysis of every aspect of any market, country, industry, security or the Fund. Statements of fact are from sources considered reliable, but the investment manager makes no representation or warranty as to their completeness or accuracy. Although historical performance is no guarantee of future results, these insights may help you understand our investment management philosophy.
6 | Semiannual Report
Performance Summary as of 1/31/11
Your dividend income will vary depending on dividends or interest paid by securities in the Fund’s portfolio, adjusted for operating expenses. Capital gain distributions are net profits realized from the sale of portfolio securities. The performance table does not reflect any taxes that a shareholder would pay on Fund dividends, capital gain distributions, if any, or any realized gains on the sale of Fund shares. Total return reflects reinvestment of the Fund’s dividends and capital gain distributions, if any, and any unrealized gains or losses.
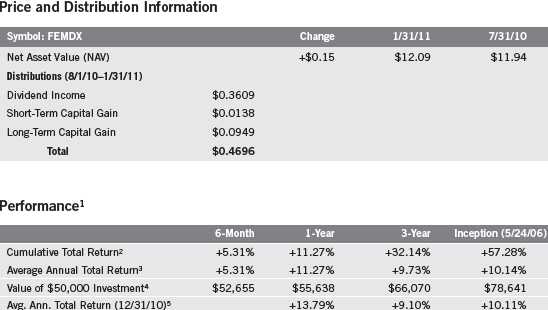

Performance data represent past performance, which does not guarantee future results. Investment return and principal value will fluctuate, and you may have a gain or loss when you sell your shares. Current performance may differ from figures shown. For most recent month-end performance, please call a Franklin Templeton Institutional Services representative at (800) 321-8563.
The investment manager and administrator have contractually agreed to waive or assume certain expenses so that Fund expenses (excluding acquired fund fees and expenses) do not exceed 1.00% (other than nonroutine expenses) until 11/30/11.
Semiannual Report | 7
Performance Summary (continued)
Endnotes
Special risks are associated with foreign investing, including currency volatility, economic instability, and social and political developments of countries where the Fund invests. Emerging markets involve heightened risks related to the same factors, in addition to those associated with their relatively small size and lesser liquidity. Also, as a nondiversified investment company, the Fund may invest in a relatively small number of issuers and, as a result, be subject to a greater risk of loss with respect to its portfolio securities. The manager applies various techniques and analyses in making investment decisions for the Fund, but there can be no guarantee that these decisions will produce the desired results. The Fund’s prospectus also includes a description of the main investment risks.
1. If the manager and administrator had not waived fees, the Fund’s total returns would have been lower. 2. Cumulative total return represents the change in value of an investment over the periods indicated.
3. Average annual total return represents the average annual change in value of an investment over the periods indicated. Six-month return has not been annualized.
4. These figures represent the value of a hypothetical $50,000 investment in the Fund over the periods indicated.
5. In accordance with SEC rules, we provide standardized average annual total return information through the latest calendar quarter.
6. Figures are as stated in the Fund’s prospectus current as of the date of this report. In periods of market volatility, assets may decline significantly, causing total annual Fund operating expenses to become higher than the figures shown.
8 | Semiannual Report
Your Fund’s Expenses
As a Fund shareholder, you can incur two types of costs:
- Transaction costs, including sales charges (loads) on Fund purchases and redemption fees; and
- Ongoing Fund costs, including management fees, distribution and service (12b-1) fees, and other Fund expenses. All mutual funds have ongoing costs, sometimes referred to as operating expenses.
The following table shows ongoing costs of investing in the Fund and can help you understand these costs and compare them with those of other mutual funds. The table assumes a $1,000 investment held for the six months indicated.
Actual Fund Expenses
The first line (Actual) of the table provides actual account values and expenses. The “Ending Account Value” is derived from the Fund’s actual return, which includes the effect of Fund expenses.
You can estimate the expenses you paid during the period by following these steps. Of course, your account value and expenses will differ from those in this illustration:
| 1. | Divide your account value by $1,000. |
| | If an account had an $8,600 value, then $8,600 ÷ $1,000 = 8.6. |
| 2. | Multiply the result by the number under the heading “Expenses Paid During Period.” |
| | If Expenses Paid During Period were $7.50, then 8.6 x $7.50 = $64.50. |
In this illustration, the estimated expenses paid this period are $64.50.
Hypothetical Example for Comparison with Other Funds
Information in the second line (Hypothetical) of the table can help you compare ongoing costs of investing in the Fund with those of other mutual funds. This information may not be used to estimate the actual ending account balance or expenses you paid during the period. The hypothetical “Ending Account Value” is based on the Fund’s actual expense ratio and an assumed 5% annual rate of return before expenses, which does not represent the Fund’s actual return. The figure under the heading “Expenses Paid During Period” shows the hypothetical expenses your account would have incurred under this scenario. You can compare this figure with the 5% hypothetical examples that appear in shareholder reports of other funds.
Semiannual Report | 9
Your Fund’s Expenses (continued)
Please note that expenses shown in the table are meant to highlight ongoing costs and do not reflect any transaction costs, such as sales charges or redemption fees, if applicable. Therefore, the second line of the table is useful in comparing ongoing costs only, and will not help you compare total costs of owning different funds. In addition, if transaction costs were included, your total costs would have been higher. Please refer to the Fund prospectus for additional information on operating expenses.
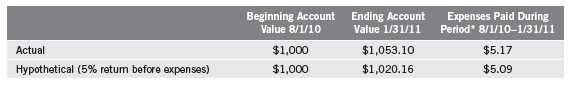
*Expenses are calculated using the most recent six-month annualized expense ratio, net of expense waivers, of 1.00%, multiplied by the average account value over the period, multiplied by 184/365 to reflect the one-half year period.
10 | Semiannual Report
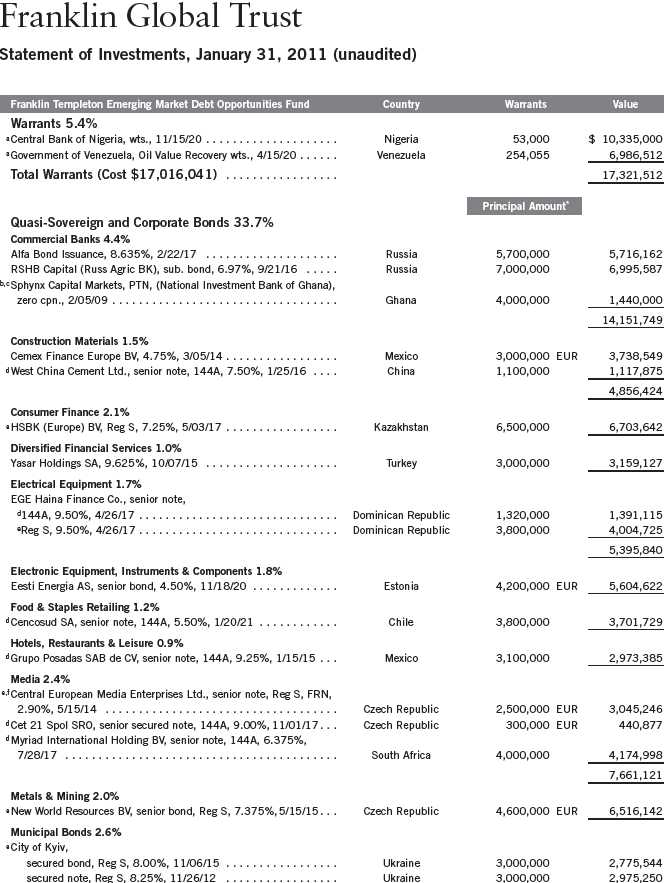
12 | Semiannual Report
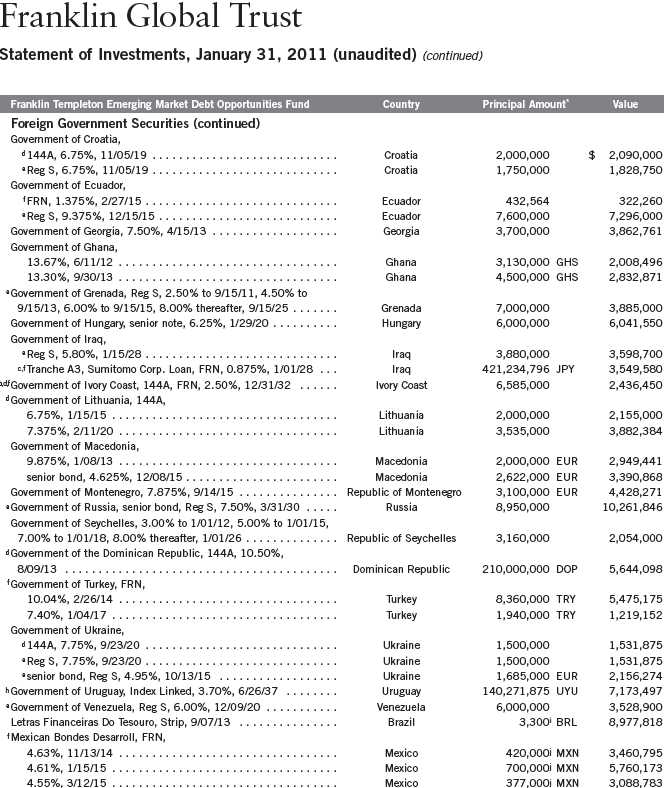
14 | Semiannual Report
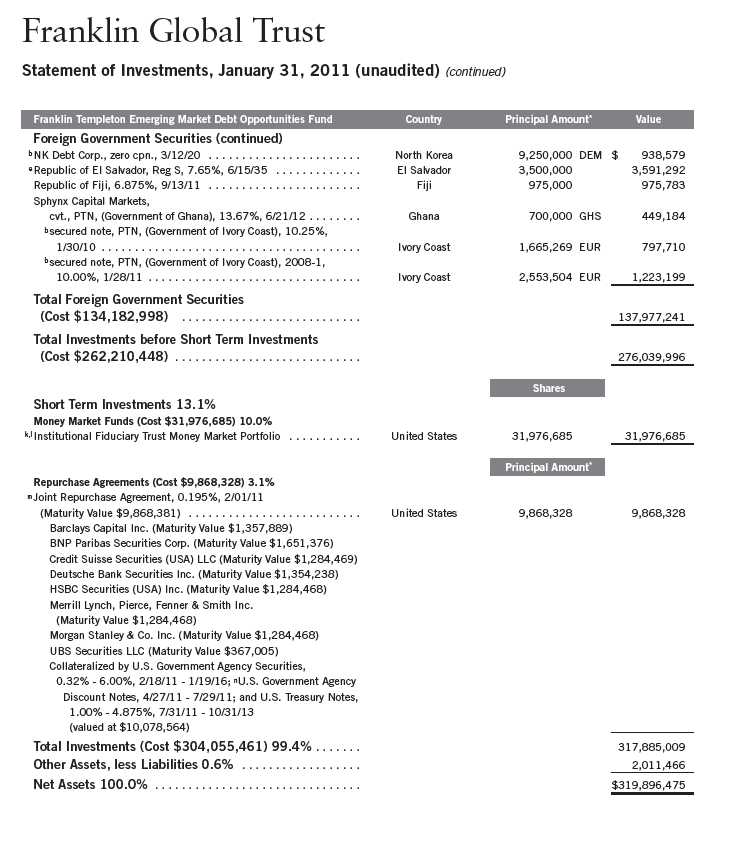
Semiannual Report | 15
Franklin Global Trust
Statement of Investments, January 31, 2011 (unaudited) (continued)
Franklin Templeton Emerging Market Debt Opportunities Fund
At January 31, 2011, the Fund had the following forward exchange contracts outstanding. See Note 1(d).
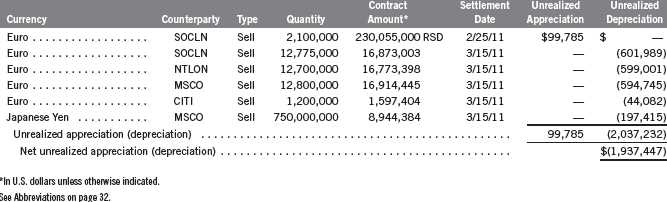
Semiannual Report | The accompanying notes are an integral part of these financial statements. | 17
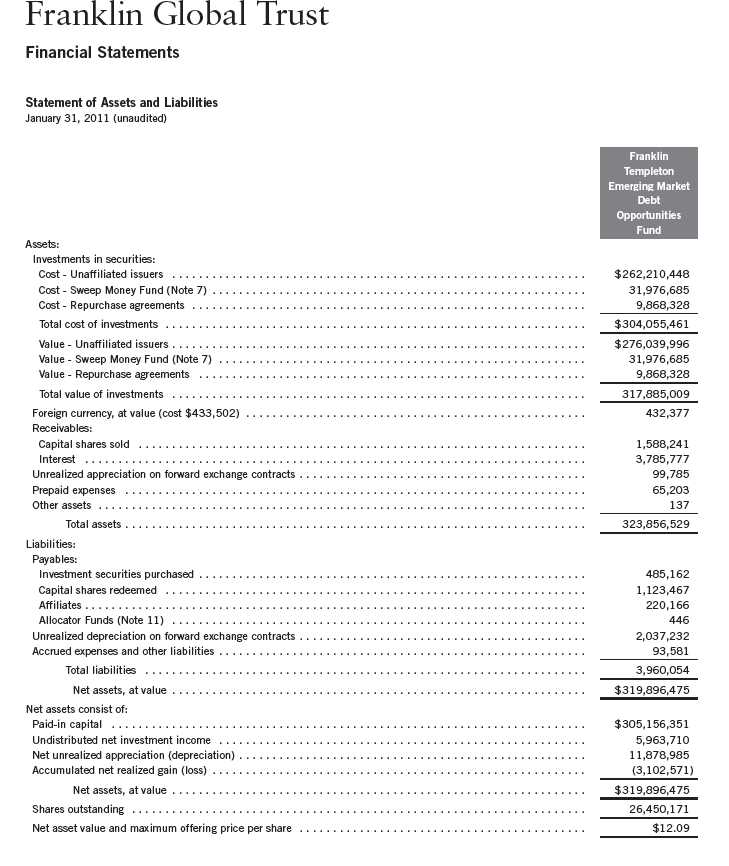
18 | The accompanying notes are an integral part of these financial statements. | Semiannual Report
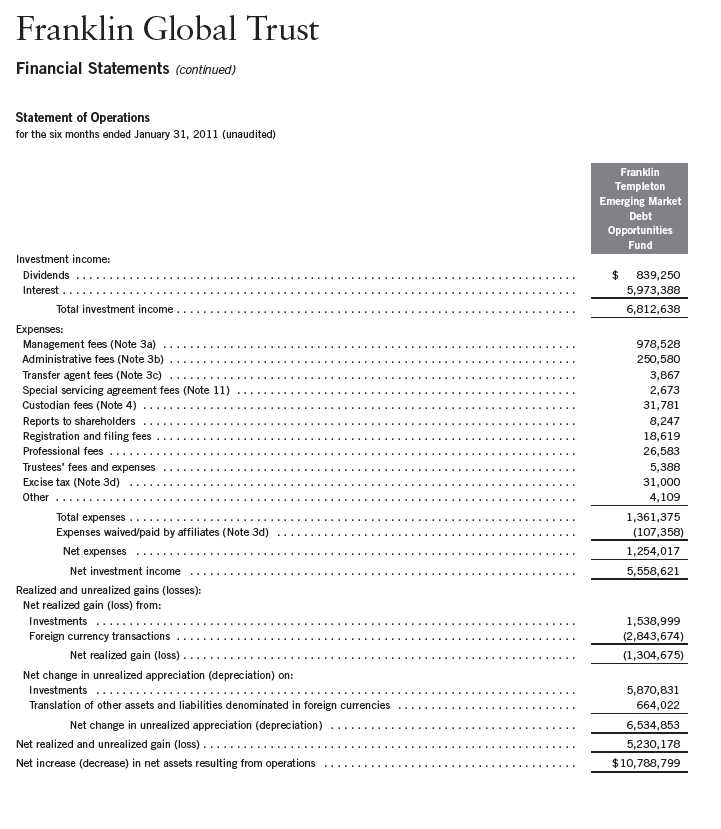
Semiannual Report | The accompanying notes are an integral part of these financial statements. | 19

20 | The accompanying notes are an integral part of these financial statements. | Semiannual Report
Franklin Global Trust
Notes to Financial Statements (unaudited)
Franklin Templeton Emerging Market Debt Opportunities Fund
1. ORGANIZATION AND SIGNIFICANT ACCOUNTING POLICIES
Franklin Global Trust (Trust) is registered under the Investment Company Act of 1940, as amended, (1940 Act) as an open-end investment company, consisting of five separate funds. The Franklin Templeton Emerging Market Debt Opportunities Fund (Fund) is included in this report. The financial statements of the remaining funds in the Trust are presented separately.
The following summarizes the Fund’s significant accounting policies.
a. Financial Instrument Valuation
The Fund’s investments in securities and other financial instruments are carried at fair value daily. Fair value is the price that would be received to sell an asset or paid to transfer a liability in an orderly transaction between market participants on the measurement date. Under procedures approved by the Trust’s Board of Trustees, the Fund may utilize independent pricing services, quotations from securities and financial instrument dealers, and other market sources to determine fair value.
Equity securities listed on an exchange or on the NASDAQ National Market System are valued at the last quoted sale price or the official closing price of the day, respectively. Foreign equity securities are valued as of the close of trading on the foreign stock exchange on which the security is primarily traded, or the NYSE, whichever is earlier. The value is then converted into its U.S. dollar equivalent at the foreign exchange rate in effect at the close of the NYSE on the day that the value of the security is determined. Over-the-counter securities are valued within the range of the most recent quoted bid and ask prices. Securities that trade in multiple markets or on multiple exchanges are valued according to the broadest and most representative market. Certain equity securities are valued based upon fundamental characteristics or relationships to similar securities. Investments in open-end mutual funds are valued at the closing net asset value.
Debt securities generally trade in the over-the-counter market rather than on a securities exchange. The Fund’s pricing services use multiple valuation techniques to determine fair value. In instances where sufficient market activity exists, the pricing services may utilize a market-based approach through which quotes from market makers are used to determine fair value. In instances where sufficient market activity may not exist or is limited, the pricing services also utilize proprietary valuation models which may consider market characteristics such as benchmark yield curves, option-adjusted spreads, credit spreads, estimated default rates, coupon rates, anticipated timing of principal repayments, underlying collateral, and other unique security features in order to estimate the relevant cash flows, which are then discounted to calculate the fair value. Securities denominated in a foreign currency are converted into their U.S. dollar equivalent at the foreign exchange rate in effect at the close of the NYSE on the date that the values of the foreign debt securities are determined. Repurchase agreements are valued at cost, which approximates market value.
Semiannual Report | 21
Franklin Global Trust
Notes to Financial Statements (unaudited) (continued)
Franklin Templeton Emerging Market Debt Opportunities Fund
| 1. | ORGANIZATION AND SIGNIFICANT ACCOUNTING POLICIES (continued) |
| a. | Financial Instrument Valuation (continued) |
Certain derivative financial instruments (derivatives) trade in the over-the-counter market. The Fund’s pricing services use various techniques including industry standard option pricing models and proprietary discounted cash flow models to determine the fair value of those instruments. The Fund’s net benefit or obligation under the derivative contract, as measured by the fair market value of the contract, is included in net assets.
The Fund has procedures to determine the fair value of securities and other financial instruments for which market prices are not readily available or which may not be reliably priced. Under these procedures, the Fund primarily employs a market-based approach which may use related or comparable assets or liabilities, recent transactions, market multiples, book values, and other relevant information for the investment to determine the fair value of the investment. The Fund may also use an income-based valuation approach in which the anticipated future cash flows of the investment are discounted to calculate fair value. Discounts may also be applied due to the nature or duration of any restrictions on the disposition of the investments. Due to the inherent uncertainty of valuations of such investments, the fair values may differ significantly from the values that would have been used had an active market existed.
Trading in securities on foreign securities stock exchanges and over-the-counter markets may be completed before the daily close of business on the NYSE. Occasionally, events occur between the time at which trading in a foreign security is completed and the close of the NYSE that might call into question the reliability of the value of a portfolio security held by the Fund. As a result, differences may arise between the value of the Fund’s portfolio securities as determined at the foreign market close and the latest indications of value at the close of the NYSE. In order to minimize the potential for these differences, the investment manager monitors price movements following the close of trading in foreign stock markets through a series of country specific market proxies (such as baskets of American Depository Receipts, futures contracts and exchange traded funds). These price movements are measured against established trigger thresholds for each specific market proxy to assist in determining if an event has occurred that may call into question the reliability of the values of the foreign securities held by the Fund. If such an event occurs, the securities may be valued using fair value procedures, which may include the use of independent pricing services.
b. Foreign Currency Translation
Portfolio securities and other assets and liabilities denominated in foreign currencies are translated into U.S. dollars based on the exchange rate of such currencies against U.S. dollars on the date of valuation. The Fund may enter into foreign currency exchange contracts to facilitate transactions denominated in a foreign currency. Purchases and sales of securities, income and expense items denominated in foreign currencies are translated into U.S. dollars at the exchange rate in effect on the transaction date. Portfolio securities and assets and liabilities denominated in
22 | Semiannual Report
Franklin Global Trust
Notes to Financial Statements (unaudited) (continued)
Franklin Templeton Emerging Market Debt Opportunities Fund
| 1. | ORGANIZATION AND SIGNIFICANT ACCOUNTING POLICIES (continued) |
| b. | Foreign Currency Translation (continued) |
foreign currencies contain risks that those currencies will decline in value relative to the U.S. dollar. Occasionally, events may impact the availability or reliability of foreign exchange rates used to convert the U.S. dollar equivalent value. If such an event occurs, the foreign exchange rate will be valued at fair value using procedures established and approved by the Trust’s Board of Trustees.
The Fund does not separately report the effect of changes in foreign exchange rates from changes in market prices on securities held. Such changes are included in net realized and unrealized gain or loss from investments on the Statement of Operations.
Realized foreign exchange gains or losses arise from sales of foreign currencies, currency gains or losses realized between the trade and settlement dates on securities transactions and the difference between the recorded amounts of dividends, interest, and foreign withholding taxes and the U.S. dollar equivalent of the amounts actually received or paid. Net unrealized foreign exchange gains and losses arise from changes in foreign exchange rates on foreign denominated assets and liabilities other than investments in securities held at the end of the reporting period.
c. Joint Repurchase Agreement
The Fund may enter into a joint repurchase agreement whereby its uninvested cash balance is deposited into a joint cash account with other funds managed by the investment manager or an affiliate of the investment manager and is used to invest in one or more repurchase agreements. The value and face amount of the joint repurchase agreement are allocated to the funds based on their pro-rata interest. A repurchase agreement is accounted for as a loan by the fund to the seller, collateralized by securities which are delivered to the fund’s custodian. The market value, including accrued interest, of the initial collateralization is required to be at least 102% of the dollar amount invested by the funds, with the value of the underlying securities marked to market daily to maintain coverage of at least 100%. The joint repurchase agreement held by the Fund at period end had been entered into on January 31, 2011.
d. Derivative Financial Instruments
The Fund invested in derivatives in order to manage risk or gain exposure to various other investments or markets. Derivatives are financial contracts based on an underlying or notional amount, require no initial investment or an initial net investment that is smaller than would normally be required to have a similar response to changes in market factors, and require or permit net settlement. Derivatives contain various risks including the potential inability of the counter-party to fulfill their obligations under the terms of the contract, the potential for an illiquid secondary market, and/or the potential for market movements which expose the Fund to gains or losses in excess of the amounts shown on the Statement of Assets and Liabilities. Realized
Semiannual Report | 23
Franklin Global Trust
Notes to Financial Statements (unaudited) (continued)
Franklin Templeton Emerging Market Debt Opportunities Fund
| 1. | ORGANIZATION AND SIGNIFICANT ACCOUNTING POLICIES (continued) |
| d. | Derivative Financial Instruments (continued) |
gain and loss and unrealized appreciation and depreciation on these contracts for the period are included in the Statement of Operations.
The Fund entered into forward exchange contracts primarily to manage and/or gain exposure to certain foreign currencies. A forward exchange contract is an agreement between the Fund and a counterparty to buy or sell a foreign currency for a specific exchange rate on a future date. Pursuant to the terms of the forward exchange contracts, cash or securities may be required to be deposited as collateral. Unrestricted cash may be invested according to the Fund’s investment objectives.
See Note 10 regarding other derivative information.
e. Credit-Linked Notes
The Fund purchased credit-linked notes. Credit-linked notes are intended to replicate the economic effects that would apply had the Fund directly purchased the underlying reference asset. The risks of credit-linked notes include the potential default of the underlying reference asset, the movement in the value of the currency of the underlying reference asset relative to the credit-linked note, the potential inability of the Fund to dispose of the credit-linked note in the normal course of business, and the possible inability of the counterparties to fulfill their obligations under the contracts.
f. Investment in Alternative Strategies Ltd.
The Fund invests in certain securities, warrants or commodities through its investment in Alternative Strategies (FT) Ltd, a Cayman Islands exempted limited liability company and a wholly-owned subsidiary (Subsidiary) of the Fund. The Subsidiary has the ability to invest in commodities and securities, consistent with the investment objective of the Fund. At January 31, 2011, all Subsidiary investments as well as any payables or receivables are reflected in the Fund’s Statement of Investments and Statement of Assets and Liabilities. All income and expenses of the Subsidiary during the period ended January 31, 2011, have been included in the Fund’s Statement of Operations.
g. Income Taxes
It is the Fund’s policy to qualify as a regulated investment company under the Internal Revenue Code. The Fund intends to distribute to shareholders substantially all of its taxable income and net realized gains to relieve it from federal income and excise taxes. As a result, no provision for U.S. federal income taxes is required. The Fund files U.S. income tax returns as well as tax returns in certain other jurisdictions. The Fund’s application of those tax rules is subject to its understanding. The Fund records a provision for taxes in its financial statements including penalties and interest,
24 | Semiannual Report
Franklin Global Trust
Notes to Financial Statements (unaudited) (continued)
Franklin Templeton Emerging Market Debt Opportunities Fund
| 1. | ORGANIZATION AND SIGNIFICANT ACCOUNTING POLICIES (continued) |
| g. | Income Taxes (continued) |
if any, for a tax position taken on a tax return (or expected to be taken) when it fails to meet the more likely than not (a greater than 50% probability) threshold and based on the technical merits, the tax position may not be sustained upon examination by the tax authorities. As of January 31, 2011, and for all open tax years, the Fund has determined that no provision for income tax is required in the Fund’s financial statements. Open tax years are those that remain subject to examination and are based on each tax jurisdiction statute of limitation. The Fund is not aware of any tax position for which it is reasonably possible that the total amounts of unrecognized tax effects will significantly change in the next twelve months.
h. Security Transactions, Investment Income, Expenses and Distributions
Security transactions are accounted for on trade date. Realized gains and losses on security transactions are determined on a specific identification basis. Interest income and estimated expenses are accrued daily. Amortization of premium and accretion of discount on debt securities are included in interest income. Dividend income is recorded on the ex-dividend date except that certain dividends from foreign securities are recognized as soon as the Fund is notified of the ex-dividend date. Distributions to shareholders are recorded on the ex-dividend date and are determined according to income tax regulations (tax basis). Distributable earnings determined on a tax basis may differ from earnings recorded in accordance with accounting principles generally accepted in the United States of America. These differences may be permanent or temporary. Permanent differences are reclassified among capital accounts to reflect their tax character. These reclassifications have no impact on net assets or the results of operations. Temporary differences are not reclassified, as they may reverse in subsequent periods.
Common expenses incurred by the Trust are allocated among the funds based on the ratio of net assets of each fund to the combined net assets of the Trust. Fund specific expenses are charged directly to the fund that incurred the expense.
Inflation-indexed bonds are adjusted for inflation through periodic increases or decreases in the security’s interest accruals, face amount, or principal redemption value, by amounts corresponding to the rate of inflation as measured by an index. Any increase or decrease in the face amount or principal redemption value will be included as interest income on the Statement of Operations.
i. Accounting Estimates
The preparation of financial statements in accordance with accounting principles generally accepted in the United States of America requires management to make estimates and assumptions that affect the reported amounts of assets and liabilities at the date of the financial statements and the amounts of income and expenses during the reporting period. Actual results could differ from those estimates.
Semiannual Report | 25
Franklin Global Trust
Notes to Financial Statements (unaudited) (continued)
Franklin Templeton Emerging Market Debt Opportunities Fund
| 1. | ORGANIZATION AND SIGNIFICANT ACCOUNTING POLICIES (continued) |
| j. | Guarantees and Indemnifications |
Under the Trust’s organizational documents, its officers and trustees are indemnified by the Trust against certain liabilities arising out of the performance of their duties to the Trust. Additionally, in the normal course of business, the Trust, on behalf of the Fund, enters into contracts with service providers that contain general indemnification clauses. The Trust’s maximum exposure under these arrangements is unknown as this would involve future claims that may be made against the Trust that have not yet occurred. Currently, the Trust expects the risk of loss to be remote.
2. SHARES OF BENEFICIAL INTEREST
At January 31, 2011, there were an unlimited number of shares authorized (without par value).
Transactions in the Fund’s shares were as follows:
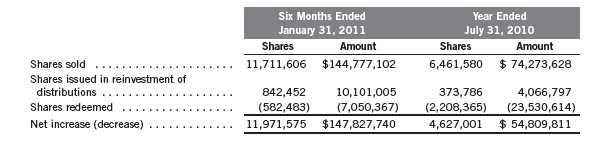
3. TRANSACTIONS WITH AFFILIATES
Franklin Resources, Inc. is the holding company for various subsidiaries that together are referred to as Franklin Templeton Investments. Certain officers and trustees of the Trust are also officers and/or directors of the following subsidiaries:
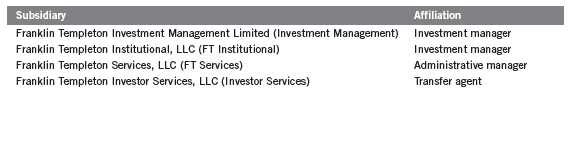
26 | Semiannual Report
Franklin Global Trust
Notes to Financial Statements (unaudited) (continued)
Franklin Templeton Emerging Market Debt Opportunities Fund
| 3. | TRANSACTIONS WITH AFFILIATES (continued) |
| a. | Management Fees |
The Fund pays an investment management fee to Investment Management based on the average daily net assets of the Fund as follows:
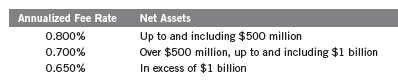
Under a subadvisory agreement, FT Institutional, an affiliate of Investment Management, provides subadvisory services to the Fund and receives from Investment Management fees based on the average daily net assets of the Fund.
b. Administrative Fees
The Fund pays an administrative fee to FT Services of 0.20% per year of the average daily net assets of the Fund.
c. Transfer Agent Fees
For the period ended January 31, 2011, the Fund paid transfer agent fees of $3,867, of which $3,676 was retained by Investor Services.
d. Waiver and Expense Reimbursements
FT Services has contractually agreed in advance to waive or limit its fees and to assume as its own expense certain expenses otherwise payable by the fund so that the common expenses (i.e. a combination of management fees, administrative fees, and other expenses, but excluding acquired fund fees and expenses) do not exceed 1.00% (other than certain non-routine expenses or costs, including those relating to litigation, indemnification, reorganizations, and liquidations) until November 30, 2011.
The Fund incurred excise taxes which FT Services voluntarily agreed to reimburse as noted in the Statement of Operations.
4. EXPENSE OFFSET ARRANGEMENT
The Fund has entered into an arrangement with its custodian whereby credits realized as a result of uninvested cash balances are used to reduce a portion of the Fund’s custodian expenses. During the period ended January 31, 2011, there were no credits earned.
Semiannual Report | 27
Franklin Global Trust
Notes to Financial Statements (unaudited) (continued)
Franklin Templeton Emerging Market Debt Opportunities Fund
5. INCOME TAXES
At January 31, 2011, the cost of investments and net unrealized appreciation (depreciation) for income tax purposes were as follows:
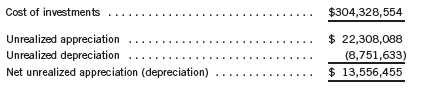
Net investment income differs for financial statement and tax purposes primarily due to differing treatments of defaulted securities, foreign currency transactions, payments-in-kind, bond discounts and premiums, tax straddles, and inflation related adjustments on foreign securities.
Net realized gains (losses) differ for financial statement and tax purposes primarily due to differing treatments of foreign currency transactions, bond discounts and premiums, and inflation related adjustments on foreign securities.
6. INVESTMENT TRANSACTIONS
Purchases and sales of investments (excluding short term securities) for the period ended January 31, 2011, aggregated $131,202,747 and $20,067,121, respectively.
7. INVESTMENTS IN INSTITUTIONAL FIDUCIARY TRUST MONEY MARKET PORTFOLIO
The Fund may invest in the Institutional Fiduciary Trust Money Market Portfolio (Sweep Money Fund), an open-end investment company managed by Franklin Advisers, Inc. (an affiliate of the investment manager). Management fees paid by the Fund are reduced on assets invested in the Sweep Money Fund, in an amount not to exceed the management and administrative fees paid by the Sweep Money Fund.
8. CREDIT RISK AND DEFAULTED SECURITIES
At January 31, 2011, the Fund had 59.11% of its portfolio invested in high yield or other securities rated below investment grade. These securities may be more sensitive to economic conditions causing greater price volatility and are potentially subject to a greater risk of loss due to default than higher rated securities.
28 | Semiannual Report
Franklin Global Trust
Notes to Financial Statements (unaudited) (continued)
Franklin Templeton Emerging Market Debt Opportunities Fund
8. CREDIT RISK AND DEFAULTED SECURITIES (continued)
The Fund held defaulted securities and/or other securities for which the income has been deemed uncollectible. At January 31, 2011, the aggregate value of these securities was $8,091,772, representing 2.53% of the Fund’s net assets. The Fund discontinues accruing income on securities for which income has been deemed uncollectible and provides an estimate for losses on interest receivable. The securities have been identified on the accompanying Statement of Investments.
9. CONCENTRATION OF RISK
Investing in foreign securities may include certain risks and considerations not typically associated with investing in U.S. securities, such as fluctuating currency values and changing local and regional economic, political and social conditions, which may result in greater market volatility. In addition, certain foreign securities may not be as liquid as U.S. securities.
10. OTHER DERIVATIVE INFORMATION
At January 31, 2011, the Fund has invested in derivative contracts which are reflected on the Statement of Assets and Liabilities as follows:
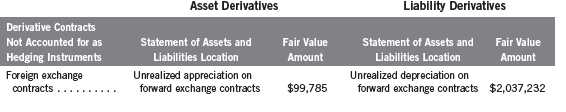
For the period ended January 31, 2011, the effect of derivative contracts on the Fund’s Statement of Operations was as follows:
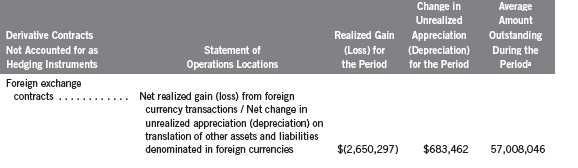
aRepresents the average notional amount for other derivative contracts outstanding during the period. For derivative contracts denominated in foreign currencies, notional amounts are converted into U.S. dollars.
See Note 1(d) regarding derivative financial instruments.
Semiannual Report | 29
Franklin Global Trust
Notes to Financial Statements (unaudited) (continued)
Franklin Templeton Emerging Market Debt Opportunities Fund
11. SPECIAL SERVICING AGREEMENT
The Fund, which is an eligible underlying investment of one or more of the Franklin Templeton Fund Allocator Series Funds (Allocator Funds), participates in a Special Servicing Agreement (SSA) with the Allocator Funds and certain service providers of the Fund and the Allocator Funds. Under the SSA, the Fund may pay a portion of the Allocator Funds’ expenses (other than any asset allocation, administrative, and distribution fees) to the extent such payments are less than the amount of the benefits realized or expected to be realized by the Fund (e.g., due to reduced costs associated with servicing accounts) from the investment in the Fund by the Allocator Funds. The Allocator Funds are either managed by Franklin Advisers, Inc. or administered by FT Services, affiliates of Investment Management. For the period ended January 31, 2011, the Fund was held by one or more of the Allocator Funds and the amount of expenses borne by the Fund is noted in the Statement of Operations. At January 31, 2011, 12.74% of the Fund’s outstanding shares was held by one or more of the Allocator Funds.
12. CREDIT FACILITY
The Fund, together with other U.S. registered and foreign investment funds (collectively “Borrowers”), managed by Franklin Templeton Investments, are borrowers in a joint syndicated senior unsecured credit facility totaling $750 million (Global Credit Facility) which matures on January 20, 2012. This Global Credit Facility provides a source of funds to the Borrowers for temporary and emergency purposes, including the ability to meet future unanticipated or unusually large redemption requests.
Under the terms of the Global Credit Facility, the Fund shall, in addition to interest charged on any borrowings made by the Fund and other costs incurred by the Fund, pay its share of fees and expenses incurred in connection with the implementation and maintenance of the Global Credit Facility, based upon its relative share of the aggregate net assets of all of the Borrowers, including an annual commitment fee of 0.08% based upon the unused portion of the Global Credit Facility, which is reflected in other expenses on the Statement of Operations. During the period ended January 31, 2011, the Fund did not use the Global Credit Facility.
30 | Semiannual Report
Franklin Global Trust
Notes to Financial Statements (unaudited) (continued)
Franklin Templeton Emerging Market Debt Opportunities Fund
13. FAIR VALUE MEASUREMENTS
The Fund follows a fair value hierarchy that distinguishes between market data obtained from independent sources (observable inputs) and the Fund’s own market assumptions (unobservable inputs). These inputs are used in determining the value of the Fund’s investments and are summarized in the following fair value hierarchy:
- Level 1 – quoted prices in active markets for identical securities
- Level 2 – other significant observable inputs (including quoted prices for similar securities, interest rates, prepayment speed, credit risk, etc.)
- Level 3 – significant unobservable inputs (including the Fund’s own assumptions in determining the fair value of investments)
The inputs or methodology used for valuing securities are not an indication of the risk associated with investing in those securities.
For movements between the levels within the fair value hierarchy, the Fund has adopted a policy of recognizing the transfers as of the date of the underlying event which caused the movement.
The following is a summary of the inputs used as of January 31, 2011, in valuing the Fund’s assets and liabilities carried at fair value:

Semiannual Report | 31
Franklin Global Trust
Notes to Financial Statements (unaudited) (continued)
Franklin Templeton Emerging Market Debt Opportunities Fund
13. FAIR VALUE MEASUREMENTS (continued)
At January 31, 2011, the reconciliation of assets in which significant unobservable inputs (Level 3) were used in determining fair value, is as follows:
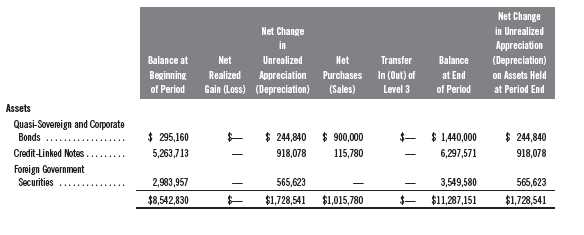
14. SUBSEQUENT EVENTS
The Fund has evaluated subsequent events through the issuance of the financial statements and determined that no events have occurred that require disclosure.
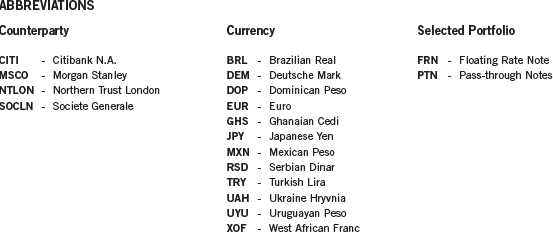
32 | Semiannual Report
Franklin Global Trust
Shareholder Information
Franklin Templeton Emerging Market Debt Opportunities Fund
Proxy Voting Policies and Procedures
The Trust’s investment manager has established Proxy Voting Policies and Procedures (Policies) that the Trust uses to determine how to vote proxies relating to portfolio securities. Shareholders may view the Trust’s complete Policies online at franklintempleton.com. Alternatively, shareholders may request copies of the Policies free of charge by calling the Proxy Group collect at (954) 527-7678 or by sending a written request to: Franklin Templeton Companies, LLC, 500 East Broward Boulevard, Suite 1500, Fort Lauderdale, FL 33394, Attention: Proxy Group. Copies of the Trust’s proxy voting records are also made available online at franklintempleton.com and posted on the U.S. Securities and Exchange Commission’s website at sec.gov and reflect the most recent 12-month period ended June 30.
Quarterly Statement of Investments
The Trust files a complete statement of investments with the U.S. Securities and Exchange Commission for the first and third quarters for each fiscal year on Form N-Q. Shareholders may view the filed Form N-Q by visiting the Commission’s website at sec.gov. The filed form may also be viewed and copied at the Commission’s Public Reference Room in Washington, DC. Information regarding the operations of the Public Reference Room may be obtained by calling (800) SEC-0330.
Semiannual Report | 33
This page intentionally left blank.
This page intentionally left blank.
This page intentionally left blank.

Semiannual Report
FRANKLIN TEMPLETON EMERGING MARKET
DEBT OPPORTUNITIES FUND
Investment Manager
Franklin Templeton Investment Management Limited
Subadvisor
Franklin Templeton Institutional, LLC
Distributor
Franklin Templeton Distributors, Inc.
Franklin Templeton Institutional Services
(800) 321-8563
ftinstitutional.com
Authorized for distribution only when accompanied or preceded by a summary prospectus and/or prospectus. Investors should carefully consider a fund’s investment goals, risks, charges and expenses before investing. A prospectus contains this and other information; please read it carefully before investing.
To ensure the highest quality of service, telephone calls to or from our service departments may be monitored, recorded and accessed. These calls can be identified by the presence of a regular beeping tone.

Item 2. Code of Ethics.
(a) The Registrant has adopted a code of ethics that applies to its principal executive officers and principal financial and accounting officer.
| (c) | N/A |
| (d) | N/A |
| (f) | Pursuant to Item 12(a)(1), the Registrant is attaching as an |
exhibit a copy of its code of ethics that applies to its principal executive officers and principal financial and accounting officer.
Item 3. Audit Committee Financial Expert.
(a)(1) The Registrant has an audit committee financial expert serving on its audit committee.
(2) The audit committee financial expert is John B. Wilson and he is "independent" as defined under the relevant Securities and Exchange Commission Rules and Releases.

Item 7. Disclosure of Proxy Voting Policies and Procedures for Closed-End Management Investment Companies. N/A
Item 8. Portfolio Managers of Closed-End Management Investment Companies. N/A
Item 9. Purchases of Equity Securities by Closed-End Management Investment Company and Affiliated Purchasers. N/A
Item 10. Submission of Matters to a Vote of Security Holders.
There have been no changes to the procedures by which shareholders may recommend nominees to the Registrant's Board of Trustees that would require disclosure herein.
Item 11. Controls and Procedures.
(a) Evaluation of Disclosure Controls and Procedures. The Registrant maintains disclosure controls and procedures that are designed to
2
FGT N-CSRS PE 1/31/11
ensure that information required to be disclosed in the Registrant’s filings under the Securities Exchange Act of 1934 and the Investment Company Act of 1940 is recorded, processed, summarized and reported within the periods specified in the rules and forms of the Securities and Exchange Commission. Such information is accumulated and communicated to the Registrant’s management, including its principal executive officer and principal financial officer, as appropriate, to allow timely decisions regarding required disclosure. The Registrant’s management, including the principal executive officer and the principal financial officer, recognizes that any set of controls and procedures, no matter how well designed and operated, can provide only reasonable assurance of achieving the desired control objectives.
Within 90 days prior to the filing date of this Shareholder Report on Form N-CSR, the Registrant had carried out an evaluation, under the supervision and with the participation of the Registrant’s management, including the Registrant’s principal executive officer and the Registrant’s principal financial officer, of the effectiveness of the design and operation of the Registrant’s disclosure controls and procedures. Based on such evaluation, the Registrant’s principal executive officer and principal financial officer concluded that the Registrant’s disclosure controls and procedures are effective.
(b) Changes in Internal Controls. There have been no significant changes in the Registrant’s internal controls or in other factors that could significantly affect the internal controls subsequent to the date of their evaluation in connection with the preparation of this Shareholder Report on Form N-CSR.
Item 12. Exhibits.
(a)(1) Code of Ethics
(a)(2) Certifications pursuant to Section 302 of the Sarbanes-Oxley Act of 2002 of Laura F. Fergerson, Chief Executive Officer - Finance and Administration, and Gaston Gardey, Chief Financial Officer, Chief Accounting Officer and Treasurer
(b) Certifications pursuant to Section 906 of the Sarbanes-Oxley Act of 2002 of Laura F. Fergerson, Chief Executive Officer - Finance and Administration, and Gaston Gardey, Chief Financial Officer, Chief Accounting Officer and Treasurer
SIGNATURES
Pursuant to the requirements of the Securities Exchange Act of 1934 and the Investment Company Act of 1940, the registrant has duly caused this report to be signed on its behalf by the undersigned, thereunto duly authorized.
FRANKLIN GLOBAL TRUST
By /s/LAURA F. FERGERSON
Laura F. Fergerson
Chief Executive Officer –
Finance and Administration
3
FGT N-CSRS PE 1/31/11
Date March 30, 2011
Pursuant to the requirements of the Securities Exchange Act of 1934 and the Investment Company Act of 1940, this report has been signed below by the following persons on behalf of the registrant and in the capacities and on the dates indicated.
By /s/LAURA F. FERGERSON
Laura F. Fergerson
Chief Executive Officer –
Finance and Administration
Date March 30, 2011
By /s/GASTON GARDEY
Gaston Gardey
Chief Financial Officer and
Chief Accounting Officer
Date March 30, 2011
4
FGT N-CSRS PE 1/31/11