

| 1
Semiannual Report
Franklin Large Cap Equity Fund
Your Fund’s Goal and Main Investments: Franklin Large Cap Equity Fund seeks long-term growth of principal and income through investing at least 80% of its net assets in equity securities of large capitalization companies with market capitalizations within the top 50% of companies in the Russell 1000® Index, or of more than $5 billion, at the time of purchase.1 The Fund attempts to keep taxable capital gains distributions relatively low.
Performance data represent past performance, which does not guarantee future results. Investment return and principal value will fluctuate, and you may have a gain or loss when you sell your shares. Current performance may differ from figures shown. Please visit franklintempleton.com or call (800) 342-5236 for most recent month-end performance.
This semiannual report for Franklin Large Cap Equity Fund covers the period ended January 31, 2012.
Performance Overview
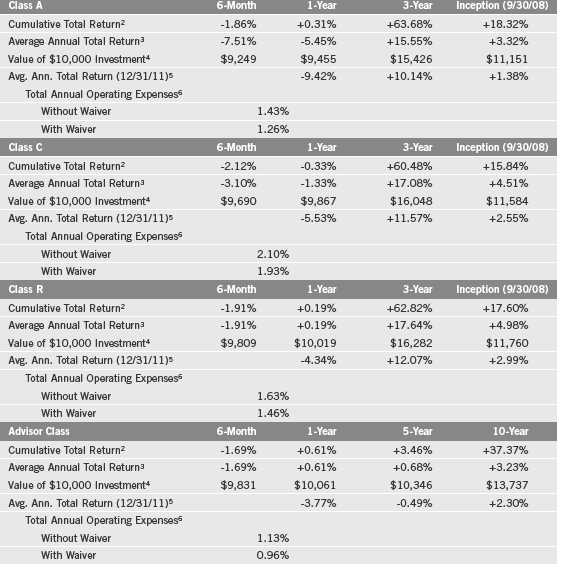
Franklin Large Cap Equity Fund – Class A had a -1.86% cumulative total return for the six months ended January 31, 2012. The Fund underperformed the +2.71% total return of its benchmark, the Standard & Poor’s 500® Index (S&P 500®), which is a broad measure of U.S. stock performance.2 You can find other Fund performance data in the Performance Summary beginning on page 7.
Economic and Market Overview
The U.S. economy improved during the six months ended January 31, 2012, despite geopolitical, fiscal, employment and housing pressures. In contrast, growth outside the U.S. generally slowed, which some attributed to the effects of Japan’s earthquake and Thailand’s flooding on the global supply chain, pop-ulist uprisings across the oil-and-gas-producing regions of the Middle East and North Africa, and the eurozone sovereign debt crisis. Although U.S. manufacturing growth slowed in the first half of the period as high commodity prices
1. The Russell 1000® Index is market capitalization weighted and measures performance of the largest companies in the Russell 3000® Index, which represent the majority of the U.S. market’s total capitalization. Russell 1000® and Russell 3000® are trademarks of the Frank Russell Company.
2. Source: © 2012 Morningstar. All Rights Reserved. The information contained herein: (1) is proprietary to Morningstar and/or its content providers; (2) may not be copied or distributed; and (3) is not warranted to be accurate, complete or timely. Neither Morningstar nor its content providers are responsible for any damages or losses arising from any use of this information. STANDARD & POOR’S®, S&P® and S&P 500® are registered trademarks of Standard & Poor’s Financial Services LLC. Standard & Poor’s does not sponsor, endorse, sell or promote any S&P index-based product. The index is unmanaged and includes reinvested distributions. One cannot invest directly in an index, and an index is not representative of the Fund’s portfolio.
The dollar value, number of shares or principal amount, and names of all portfolio holdings are listed in the Fund’s Statement of Investments (SOI). The SOI begins on page 16.
Semiannual Report | 3
reduced purchasing power and demand ebbed, the trend began to reverse near period-end. The U.S. manufacturing sector helped power the domestic economy and, along with India, led global manufacturing growth at period-end. European and Asian manufacturing, however, generally weakened through most of the six-month reporting period before stabilizing at period-end.
The U.S. financial system and household balance sheets continued to improve, but the country still faced persistently high unemployment, a prolonged housing market slump and massive national debt. Inflation rose across much of the world but stayed relatively contained in the U.S. The Federal Reserve Board (Fed) sought to boost economic growth by implementing its new bond-buying program, dubbed “Operation Twist” by commentators, which is intended to further lower long-term bond yields. The Fed also anticipated it would keep the federal funds target rate at 0% to 0.25% at least through late 2014. Outside the U.S., European policymakers stepped up their response to their sovereign debt and banking crisis. The European Central Bank cut short-term interest rates and expanded bank lending facilities, and six key global central banks agreed to lower dollar funding costs for Europe’s distressed commercial banks. Chinese policymakers lowered commercial bank reserve requirements and the International Monetary Fund revamped its credit line and eased its lending terms.
Worrisome global events and slowing global growth dampened investor sentiment and market volatility surged. Through most of the period, risk-averse investors sought perceived safe havens and seemed to ignore that many companies generated record profits. As 2012 began, better-than-expected U.S. economic reports renewed many investors’ risk appetite. Despite large swings, U.S. stocks as measured by the S&P 500 Index gained 2.71% for the six months ended January 31, 2012.2 The Dow Jones Industrial Average rose 5.52%, reflecting investors’ general preference for large, established U.S. companies.2 In contrast, developed and emerging world stocks as measured by the MSCI All Country World Index fell 4.58%.2 Amid general global market declines, U.S. Treasuries and perceived safe-haven currencies such as the U.S. dollar and Japanese yen delivered solid returns.
Investment Strategy
We are research-driven, fundamental investors pursuing a blend of growth and value strategies. We use a top-down analysis of macroeconomic trends, market sectors (with some attention to the sector weightings in the Fund’s comparative index) and industries combined with a bottom-up analysis of individual securities. In selecting investments for the Fund, we look for companies we believe are positioned for growth in revenues, earnings or assets, and are selling at reasonable prices. We also consider the level of dividends a company has paid.
4 | Semiannual Report
We employ a thematic approach to identify sectors that may benefit from longer term dynamic growth. Within these sectors, we consider the basic financial and operating strength and quality of a company and company management. The Fund, from time to time, may have significant positions in particular sectors such as technology or industrials. We also seek to identify companies that we believe are temporarily out of favor with investors, but have a good intermediate-or long-term outlook.
Manager’s Discussion
During the six months under review, stock selection in the information technology sector contributed significantly to the Fund’s performance relative to the benchmark S&P 500.3 Strong performers within the sector included global positioning systems manufacturer Trimble Navigation,4 voice and language solutions provider Nuance Communications,4 integrated circuits and semiconductor devices company Taiwan Semiconductor Manufacturing,4 and global payments solution company MasterCard. Stock selection in the financials sector also boosted relative results, supported by commercial bank Wells Fargo and insurance company ACE.5 Other key contributors to relative performance included apparel and home fashions retailer TJX, footwear and apparel company NIKE, global alcoholic beverages company Diageo,4 and global bio-pharmaceutical companies Celgene and Gilead Sciences.
In contrast, stock selection in the industrials, consumer discretionary and materials sectors detracted considerably from the Fund’s performance relative to the S&P 500.6 In the industrials sector, German industrial conglomerate Siemens7 and Canadian transport solutions manufacturer Bombardier hurt relative results.4 Consumer discretionary holdings including South Korea’s largest automaker Hyundai Motor4 and global business efficiency and automotive components company Johnson Controls weighed on returns. In the materials sector, diversified metals and mining company Rio Tinto4 and agricultural chemicals manufacturer The Mosaic Co. were key detractors.7 Other
3. The information technology sector comprises communications equipment; computers and peripherals; electronic equipment, instruments and components; Internet software and services; IT services; semiconductors and semiconductor equipment; and software in the SOI.
4. Not a component of the S&P 500.
5. The financials sector comprises capital markets, commercial banks, consumer finance, diversified financial services and insurance in the SOI.
6. The industrials sector comprises aerospace and defense, air freight and logistics, electrical equipment, industrial conglomerates, and machinery in the SOI. The consumer discretionary sector comprises auto components; automobiles; Internet and catalog retail; specialty retail; and textiles, apparel and luxury goods in the SOI. The materials sector comprises chemicals in the SOI.
7. Sold by period-end.
Semiannual Report | 5
major detractors included financial advisory and asset management firm Lazard,7 energy equipment and services company Weatherford International, and Swiss food products manufacturer Nestle.4
Thank you for your continued participation in Franklin Large Cap Equity Fund. We look forward to serving your future investment needs.

Portfolio Management Team
Franklin Large Cap Equity Fund
The foregoing information reflects our analysis, opinions and portfolio holdings as of January 31, 2012, the end of the reporting period. The way we implement our main investment strategies and the resulting portfolio holdings may change depending on factors such as market and economic conditions. These opinions may not be relied upon as investment advice or an offer for a particular security. The information is not a complete analysis of every aspect of any market, country, industry, security or the Fund. Statements of fact are from sources considered reliable, but the investment manager makes no representation or warranty as to their completeness or accuracy. Although historical performance is no guarantee of future results, these insights may help you understand our investment management philosophy.
6 | Semiannual Report
Performance Summary as of 1/31/12
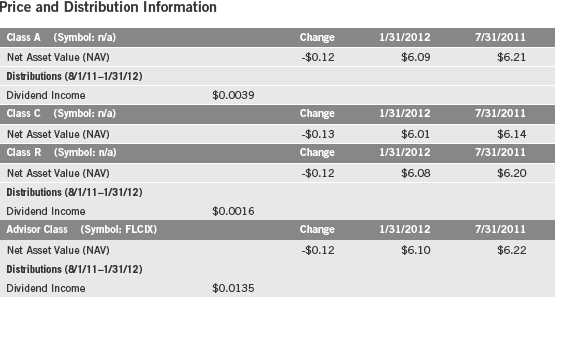
Your dividend income will vary depending on dividends or interest paid by securities in the Fund’s portfolio, adjusted for operating expenses of each class. Capital gain distributions are net profits realized from the sale of portfolio securities. The performance table does not reflect any taxes that a shareholder would pay on Fund dividends, capital gain distributions, if any, or any realized gains on the sale of Fund shares. Total return reflects reinvestment of the Fund’s dividends and capital gain distributions, if any, and any unrealized gains or losses.
Semiannual Report | 7
Performance Summary (continued)
Performance1
Cumulative total return excludes sales charges. Average annual total returns and value of $10,000 investment include maximum sales charges. Class A: 5.75% maximum initial sales charge; Class C: 1% contingent deferred sales charge in first year only; Class R/Advisor Class: no sales charges.
Performance data represent past performance, which does not guarantee future results. Investment return and principal value will fluctuate, and you may have a gain or loss when you sell your shares. Current performance may differ from figures shown. For most recent month-end performance, go to franklintempleton.com or call (800) 342-5236.
The investment manager and administrator have contractually agreed to waive or to assume certain expenses so that common expenses (excluding Rule 12b-1 fees and acquired fund fees and expenses) for each class of the Fund do not exceed 0.95% (other than certain nonroutine expenses) until 11/30/12.
8 | Semiannual Report
Performance Summary (continued)
Endnotes
All investments involve risks. Stock prices fluctuate, sometimes rapidly and dramatically, due to factors affecting individual companies, particular industries or sectors, or general market conditions. The Fund’s investments in foreign company stocks involve special risks including currency fluctuations and political uncertainty. There are special risks involved with significant exposure to a particular sector, including increased susceptibility related to economic, business or other developments affecting that sector, which may result in increased volatility. The Fund is actively managed but there is no guarantee that the manager’s investment decisions will produce the desired results. The Fund’s prospectus also includes a description of the main investment risks.
| |
Class C: Class R: | These shares have higher annual fees and expenses than Class A shares. Shares are available to certain eligible investors as described in the prospectus. These shares have higher annual fees and expenses than class A shares. |
Advisor Class: | Shares are available to certain eligible investors as described in the prospectus. |
1. If the manager and administrator had not waived fees, the Fund’s total returns would have been lower. 2. Cumulative total return represents the change in value of an investment over the periods indicated.
3. Average annual total return represents the average annual change in value of an investment over the periods indicated. Six-month return has not been annualized.
4. These figures represent the value of a hypothetical $10,000 investment in the Fund over the periods indicated.
5. In accordance with SEC rules, we provide standardized average annual total return information through the latest calendar quarter.
6. Figures are as stated in the Fund’s prospectus current as of the date of this report. In periods of market volatility, assets may decline significantly, causing total annual Fund operating expenses to become higher than the figures shown.
Semiannual Report | 9
Your Fund’s Expenses
As a Fund shareholder, you can incur two types of costs:
- Transaction costs, including sales charges (loads) on Fund purchases, if applicable; and
- Ongoing Fund costs, including management fees, distribution and service (12b-1) fees, if appli- cable, and other Fund expenses. All mutual funds have ongoing costs, sometimes referred to as operating expenses.
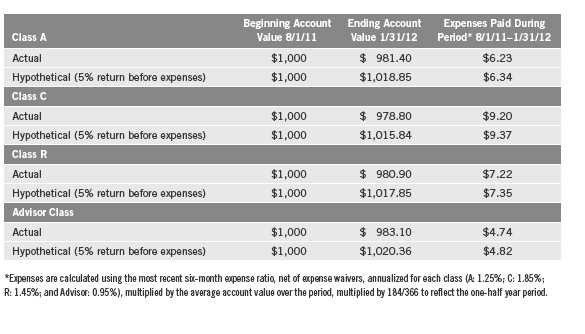
The following table shows ongoing costs of investing in the Fund and can help you understand these costs and compare them with those of other mutual funds. The table assumes a $1,000 investment held for the six months indicated.
Actual Fund Expenses
The first line (Actual) of the table provides actual account values and expenses. The “Ending Account Value” is derived from the Fund’s actual return, which includes the effect of Fund expenses.
You can estimate the expenses you paid during the period by following these steps. Of course, your account value and expenses will differ from those in this illustration:
| 1. | Divide your account value by $1,000. |
| | If an account had an $8,600 value, then $8,600 ÷ $1,000 = 8.6. |
| 2. | Multiply the result by the number under the heading “Expenses Paid During Period.” |
| | If Expenses Paid During Period were $7.50, then 8.6 x $7.50 = $64.50. |
In this illustration, the estimated expenses paid this period are $64.50.
Hypothetical Example for Comparison with Other Funds
Information in the second line (Hypothetical) of the table can help you compare ongoing costs of investing in the Fund with those of other mutual funds. This information may not be used to estimate the actual ending account balance or expenses you paid during the period. The hypothetical “Ending Account Value” is based on the Fund’s actual expense ratio and an assumed 5% annual rate of return before expenses, which does not represent the Fund’s actual return. The figure under the heading “Expenses Paid During Period” shows the hypothetical expenses your account would have incurred under this scenario. You can compare this figure with the 5% hypothetical examples that appear in shareholder reports of other funds.
10 | Semiannual Report
Your Fund’s Expenses (continued)
Please note that expenses shown in the table are meant to highlight ongoing costs and do not reflect any transaction costs, such as sales charges. Therefore, the second line of the table is useful in comparing ongoing costs only, and will not help you compare total costs of owning different funds. In addition, if transaction costs were included, your total costs would have been higher. Please refer to the Fund prospectus for additional information on operating expenses.
Semiannual Report | 11
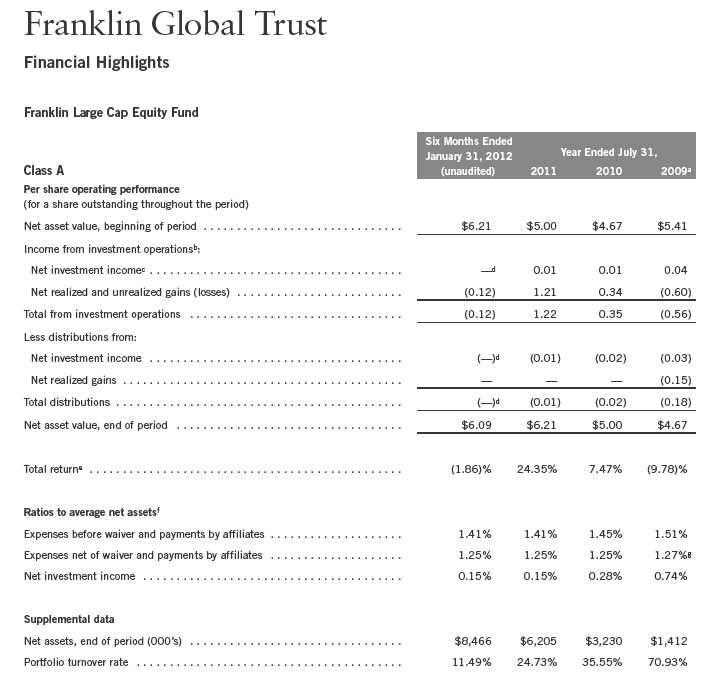
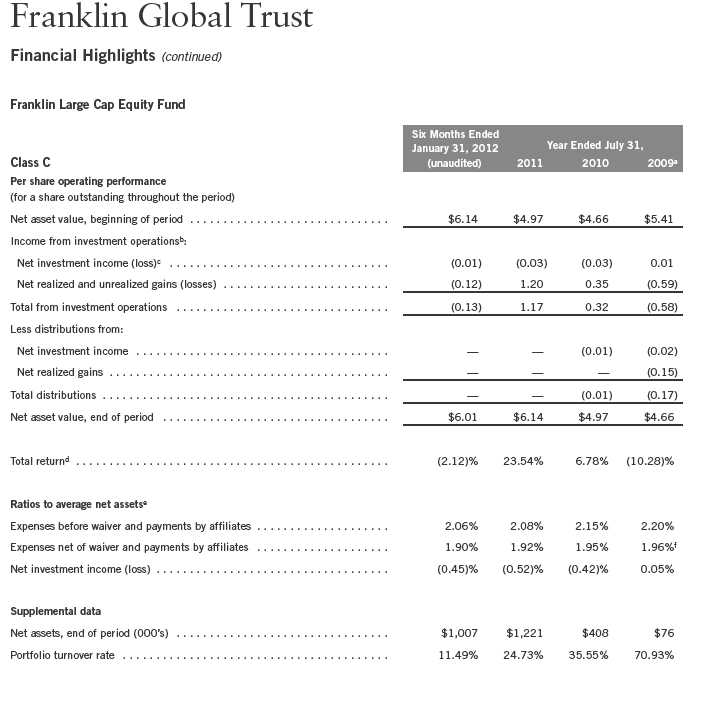
aFor the period September 30, 2008 (effective date) to July 31, 2009.
bThe amount shown for a share outstanding throughout the period may not correlate with the Statement of Operations for the period due to the timing of sales and repurchases of
the Fund shares in relation to income earned and/or fluctuating market value of the investments of the Fund.
cBased on average daily shares outstanding.
dAmount rounds to less than $0.01 per share.
eTotal return does not reflect sales commissions or contingent deferred sales charges, if applicable, and is not annualized for periods less than one year.
fRatios are annualized for periods less than one year.
gBenefit of expense reduction rounds to less than 0.01%.
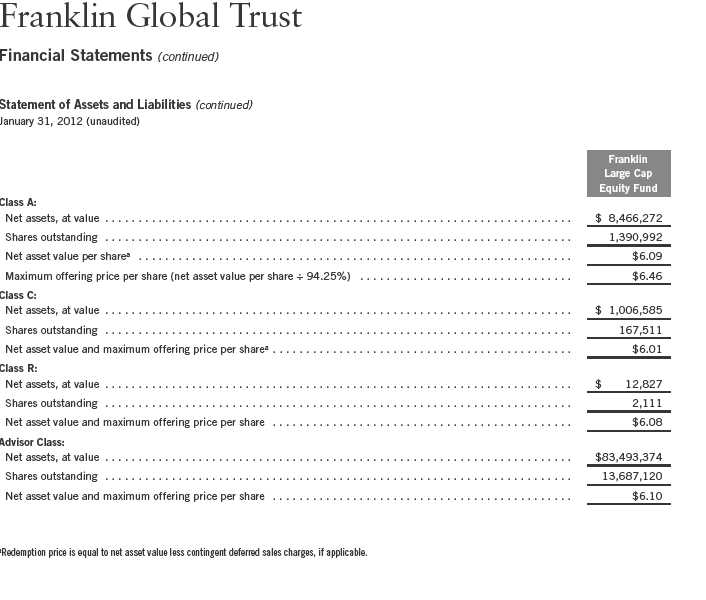
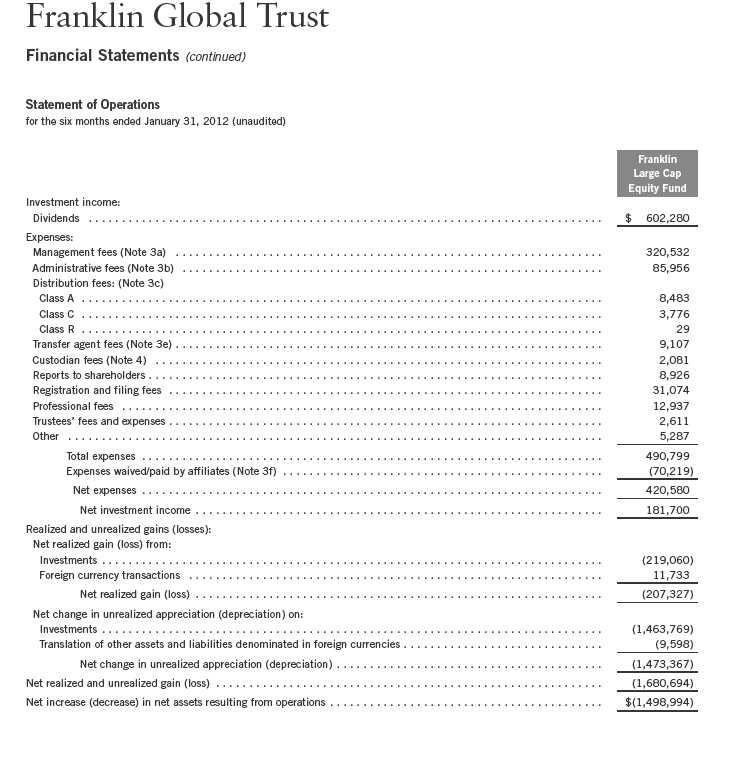
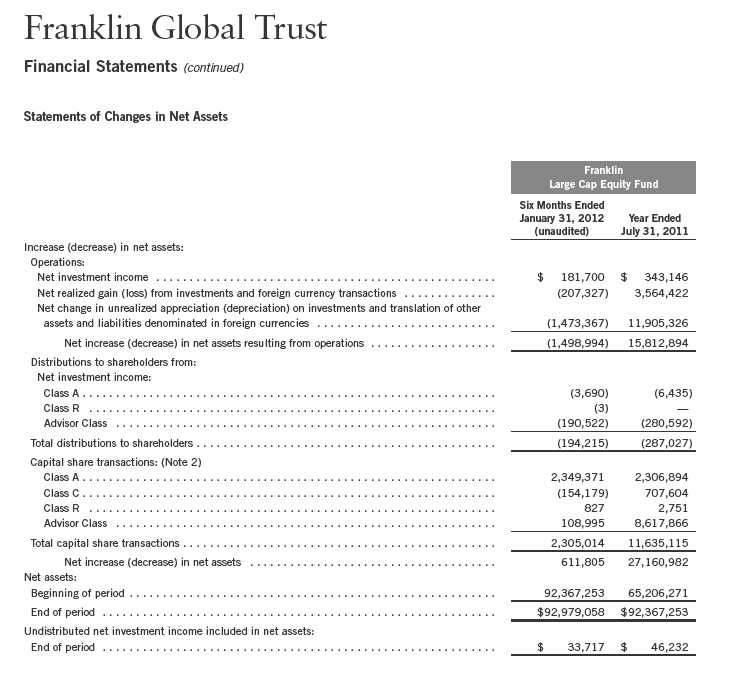
12 | The accompanying notes are an integral part of these financial statements. | Semiannual Report
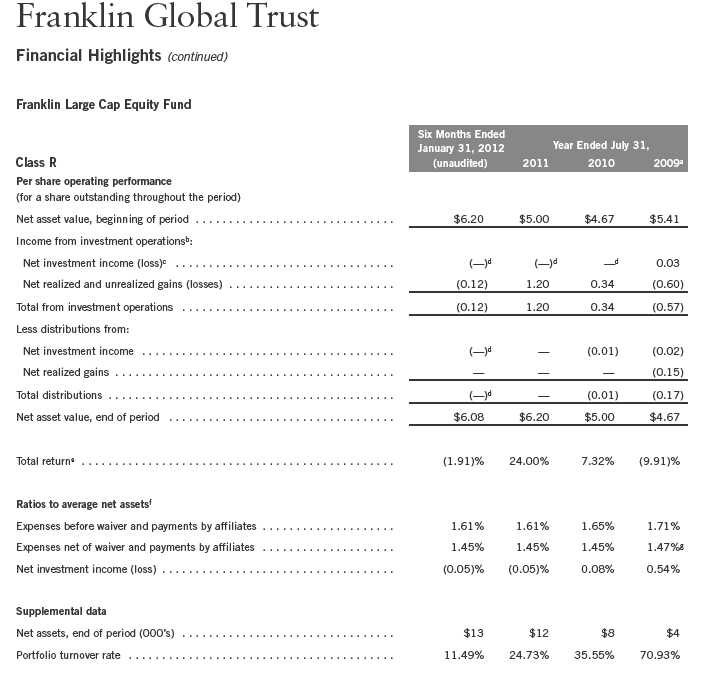
aFor the period September 30, 2008 (effective date) to July 31, 2009.
bThe amount shown for a share outstanding throughout the period may not correlate with the Statement of Operations for the period due to the timing of sales and repurchases of
the Fund shares in relation to income earned and/or fluctuating market value of the investments of the Fund.
cBased on average daily shares outstanding.
dTotal return does not reflect sales commissions or contingent deferred sales charges, if applicable, and is not annualized for periods less than one year.
eRatios are annualized for periods less than one year.
fBenefit of expense reduction rounds to less than 0.01%.
Semiannual Report | The accompanying notes are an integral part of these financial statements. | 13
aFor the period September 30, 2008 (effective date) to July 31, 2009.
bThe amount shown for a share outstanding throughout the period may not correlate with the Statement of Operations for the period due to the timing of sales and repurchases of
the Fund shares in relation to income earned and/or fluctuating market value of the investments of the Fund.
cBased on average daily shares outstanding.
dAmount rounds to less than $0.01 per share.
eTotal return does not reflect sales commissions or contingent deferred sales charges, if applicable, and is not annualized for periods less than one year.
fRatios are annualized for periods less than one year.
gBenefit of expense reduction rounds to less than 0.01%.
14 | The accompanying notes are an integral part of these financial statements. | Semiannual Report

aThe amount shown for a share outstanding throughout the period may not correlate with the Statement of Operations for the period due to the timing of sales and repurchases of
the Fund shares in relation to income earned and/or fluctuating market value of the investments of the Fund.
bBased on average daily shares outstanding.
cEffective September 1, 2008, the redemption fee was eliminated.
dAmount rounds to less than $0.01 per share.
eTotal return is not annualized for periods less than one year.
fRatios are annualized for periods less than one year.
gBenefit of expense reduction rounds to less than 0.01%.
Semiannual Report | The accompanying notes are an integral part of these financial statements. | 15

16 | Semiannual Report
Semiannual Report | 17
Franklin Global Trust
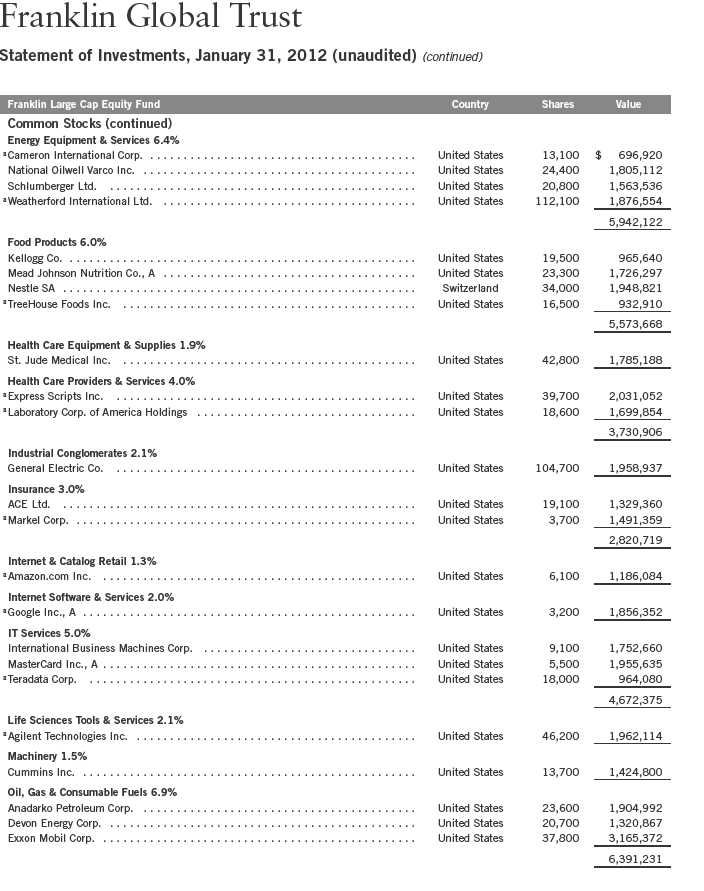
Statement of Investments, January 31, 2012 (unaudited) (continued)

See Abbreviations on page 32.
aNon-income producing.
bSecurity was purchased pursuant to Regulation S under the Securities Act of 1933, which exempts from registration securities offered and sold outside of the United States.
Such a security cannot be sold in the United States without either an effective registration statement filed pursuant to the Securities Act of 1933, or pursuant to an exemption
from registration. This security has been deemed liquid under guidelines approved by the Trust’s Board of Trustees.
cSee Note 7 regarding investments in the Institutional Fiduciary Trust Money Market Portfolio.
18 | The accompanying notes are an integral part of these financial statements. | Semiannual Report
Semiannual Report | The accompanying notes are an integral part of these financial statements. | 19
20 | The accompanying notes are an integral part of these financial statements. | Semiannual Report
Semiannual Report | The accompanying notes are an integral part of these financial statements. | 21
22 | The accompanying notes are an integral part of these financial statements. | Semiannual Report
Franklin Global Trust
Notes to Financial Statements (unaudited)
Franklin Large Cap Equity Fund
1. ORGANIZATION AND SIGNIFICANT ACCOUNTING POLICIES
Franklin Global Trust (Trust) is registered under the Investment Company Act of 1940, as amended, (1940 Act) as an open-end investment company, consisting of five separate funds. The Franklin Large Cap Equity Fund (Fund) is included in this report. The financial statements of the remaining funds in the Trust are presented separately. The Fund offers four classes of shares: Class A, Class C, Class R, and Advisor Class. Each class of shares differs by its initial sales load, contingent deferred sales charges, distribution fees, voting rights on matters affecting a single class and its exchange privilege.
The following summarizes the Fund’s significant accounting policies.
a. Financial Instrument Valuation
The Fund’s investments in securities and other financial instruments are carried at fair value daily. Fair value is the price that would be received to sell an asset or paid to transfer a liability in an orderly transaction between market participants on the measurement date. Under procedures approved by the Trust’s Board of Trustees, the Fund may utilize independent pricing services, quotations from securities and financial instrument dealers, and other market sources to determine fair value.
Equity securities listed on an exchange or on the NASDAQ National Market System are valued at the last quoted sale price or the official closing price of the day, respectively. Foreign equity securities are valued as of the close of trading on the foreign stock exchange on which the security is primarily traded, or the NYSE, whichever is earlier. The value is then converted into its U.S. dollar equivalent at the foreign exchange rate in effect at the close of the NYSE on the day that the value of the security is determined. Over-the-counter securities are valued within the range of the most recent quoted bid and ask prices. Securities that trade in multiple markets or on multiple exchanges are valued according to the broadest and most representative market. Certain equity securities are valued based upon fundamental characteristics or relationships to similar securities. Investments in open-end mutual funds are valued at the closing net asset value.
The Fund has procedures to determine the fair value of securities and other financial instruments for which market prices are not readily available or which may not be reliably priced. Under these procedures, the Fund primarily employs a market-based approach which may use related or comparable assets or liabilities, recent transactions, market multiples, book values, and other relevant information for the investment to determine the fair value of the investment. The Fund may also use an income-based valuation approach in which the anticipated future cash flows of the investment are discounted to calculate fair value. Discounts may also be applied due to the nature or duration of any restrictions on the disposition of the investments. Due to the inherent uncertainty of valuations of such investments, the fair values may differ significantly from the values that would have been used had an active market existed.
Semiannual Report | 23
Franklin Global Trust
Notes to Financial Statements (unaudited) (continued)
Franklin Large Cap Equity Fund
| 1. | ORGANIZATION AND SIGNIFICANT ACCOUNTING POLICIES (continued) |
| a. | Financial Instrument Valuation (continued) |
Trading in securities on foreign securities stock exchanges and over-the-counter markets may be completed before the daily close of business on the NYSE. Occasionally, events occur between the time at which trading in a foreign security is completed and the close of the NYSE that might call into question the reliability of the value of a portfolio security held by the Fund. As a result, differences may arise between the value of the Fund’s portfolio securities as determined at the foreign market close and the latest indications of value at the close of the NYSE. In order to minimize the potential for these differences, the investment manager monitors price movements following the close of trading in foreign stock markets through a series of country specific market proxies (such as baskets of American Depositary Receipts, futures contracts and exchange traded funds). These price movements are measured against established trigger thresholds for each specific market proxy to assist in determining if an event has occurred that may call into question the reliability of the values of the foreign securities held by the Fund. If such an event occurs, the securities may be valued using fair value procedures, which may include the use of independent pricing services.
b. Foreign Currency Translation
Portfolio securities and other assets and liabilities denominated in foreign currencies are translated into U.S. dollars based on the exchange rate of such currencies against U.S. dollars on the date of valuation. The Fund may enter into foreign currency exchange contracts to facilitate transactions denominated in a foreign currency. Purchases and sales of securities, income and expense items denominated in foreign currencies are translated into U.S. dollars at the exchange rate in effect on the transaction date. Portfolio securities and assets and liabilities denominated in foreign currencies contain risks that those currencies will decline in value relative to the U.S. dollar. Occasionally, events may impact the availability or reliability of foreign exchange rates used to convert the U.S. dollar equivalent value. If such an event occurs, the foreign exchange rate will be valued at fair value using procedures established and approved by the Trust’s Board of Trustees.
The Fund does not separately report the effect of changes in foreign exchange rates from changes in market prices on securities held. Such changes are included in net realized and unrealized gain or loss from investments on the Statement of Operations.
Realized foreign exchange gains or losses arise from sales of foreign currencies, currency gains or losses realized between the trade and settlement dates on securities transactions and the difference between the recorded amounts of dividends, interest, and foreign withholding taxes and the U.S. dollar equivalent of the amounts actually received or paid. Net unrealized foreign exchange gains and losses arise from changes in foreign exchange rates on foreign denominated assets and liabilities other than investments in securities held at the end of the reporting period.
24 | Semiannual Report
Franklin Global Trust
Notes to Financial Statements (unaudited) (continued)
Franklin Large Cap Equity Fund
| 1. | ORGANIZATION AND SIGNIFICANT ACCOUNTING POLICIES (continued) |
| c. | Income Taxes |
It is the Fund’s policy to qualify as a regulated investment company under the Internal Revenue Code. The Fund intends to distribute to shareholders substantially all of its taxable income and net realized gains to relieve it from federal income and excise taxes. As a result, no provision for U.S. federal income taxes is required.
The Fund may be subject to foreign taxation related to income received, capital gains on the sale of securities and certain foreign currency transactions in the foreign jurisdictions in which it invests. Foreign taxes, if any, are recorded based on the tax regulations and rates that exist in the foreign markets in which the Fund invests. When a capital gain tax is determined to apply the Fund records an estimated deferred tax liability in an amount that would be payable if the securities were disposed of on the valuation date.
The Fund recognizes the tax benefits of uncertain tax positions only when the position is “more likely than not” to be sustained upon examination by the tax authorities based on the technical merits of the tax position. As of January 31, 2012, and for all open tax years, the Fund has determined that no liability for unrecognized tax benefits is required in the Fund’s financial statements related to uncertain tax positions taken on a tax return (or expected to be taken on future tax returns). Open tax years are those that remain subject to examination and are based on each tax jurisdiction statute of limitation.
d. Security Transactions, Investment Income, Expenses and Distributions
Security transactions are accounted for on trade date. Realized gains and losses on security transactions are determined on a specific identification basis. Estimated expenses are accrued daily. Dividend income is recorded on the ex-dividend date except that certain dividends from foreign securities are recognized as soon as the Fund is notified of the ex-dividend date. Distributions to shareholders are recorded on the ex-dividend date and are determined according to income tax regulations (tax basis). Distributable earnings determined on a tax basis may differ from earnings recorded in accordance with accounting principles generally accepted in the United States of America. These differences may be permanent or temporary. Permanent differences are reclassified among capital accounts to reflect their tax character. These reclassifications have no impact on net assets or the results of operations. Temporary differences are not reclassified, as they may reverse in subsequent periods.
Common expenses incurred by the Trust are allocated among the funds based on the ratio of net assets of each fund to the combined net assets of the Trust. Fund specific expenses are charged directly to the fund that incurred the expense.
Semiannual Report | 25
Franklin Global Trust
Notes to Financial Statements (unaudited) (continued)
Franklin Large Cap Equity Fund
| 1. | ORGANIZATION AND SIGNIFICANT ACCOUNTING POLICIES (continued) |
| d. | Security Transactions, Investment Income, Expenses and Distributions (continued) |
Realized and unrealized gains and losses and net investment income, not including class specific expenses, are allocated daily to each class of shares based upon the relative proportion of net assets of each class. Differences in per share distributions, by class, are generally due to differences in class specific expenses.
e. Accounting Estimates
The preparation of financial statements in accordance with accounting principles generally accepted in the United States of America requires management to make estimates and assumptions that affect the reported amounts of assets and liabilities at the date of the financial statements and the amounts of income and expenses during the reporting period. Actual results could differ from those estimates.
f. Guarantees and Indemnifications
Under the Trust’s organizational documents, its officers and trustees are indemnified by the Trust against certain liabilities arising out of the performance of their duties to the Trust. Additionally, in the normal course of business, the Trust, on behalf of the Fund, enters into contracts with service providers that contain general indemnification clauses. The Trust’s maximum exposure under these arrangements is unknown as this would involve future claims that may be made against the Trust that have not yet occurred. Currently, the Trust expects the risk of loss to be remote.
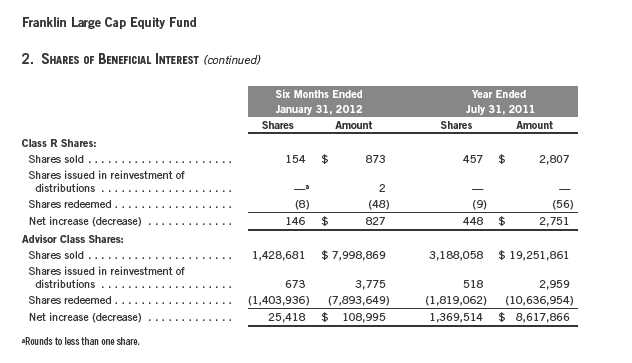
2. SHARES OF BENEFICIAL INTEREST
At January 31, 2012, there were an unlimited number of shares authorized (without par value).
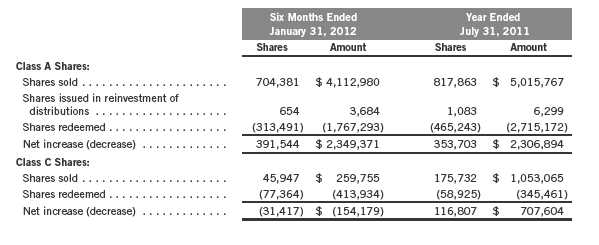
Transactions in the Fund’s shares were as follows:
26 | Semiannual Report
Franklin Global Trust
Notes to Financial Statements (unaudited) (continued)
3. TRANSACTIONS WITH AFFILIATES
Franklin Resources, Inc. is the holding company for various subsidiaries that together are referred to as Franklin Templeton Investments. Certain officers and trustees of the Fund are also officers and/or directors of the following subsidiaries:
| |
| Subsidiary | Affiliation |
| Fiduciary International, Inc. (Fiduciary) | Investment manager |
| Franklin Templeton Services, LLC (FT Services) | Administrative manager |
| Franklin Templeton Distributors, Inc. (Distributors) | Principal underwriter |
| Franklin Templeton Investor Services, LLC (Investor Services) | Transfer agent |
a. Management Fees
The Fund pays an investment management fee to Fiduciary based on the average daily net assets of the Fund as follows:
| | |
| Annualized Fee Rate | | Net Assets |
| 0.750 | % | Up to and including $500 million |
| 0.650 | % | Over $500 million, up to and including $1 billion |
| 0.600 | % | Over $1 billion, up to and including $1.5 billion |
| 0.550 | % | Over $1.5 billion, up to and including $6.5 billion |
| 0.530 | % | Over $6.5 billion, up to and including $11.5 billion |
| 0.500 | % | In excess of $11.5 billion |
Semiannual Report | 27
Franklin Global Trust
Notes to Financial Statements (unaudited) (continued)
Franklin Large Cap Equity Fund
| 3. | TRANSACTIONS WITH AFFILIATES (continued) |
| b. | Administrative Fees |
The Fund pays an administrative fee to FT Services of 0.20% per year of the average daily net assets of the Fund.
c. Distribution Fees
The Trust’s Board of Trustees has adopted distribution plans for each share class, with the exception of Advisor Class shares, pursuant to Rule 12b-1 under the 1940 Act. Under the Fund’s Class A reimbursement distribution plan, the Fund reimburses Distributors for costs incurred in connection with the servicing, sale and distribution of the Fund’s shares up to the maximum annual plan rate. Under the Class A reimbursement distribution plan, costs exceeding the maximum for the current plan year cannot be reimbursed in subsequent periods.
In addition, under the Fund’s Class C and R compensation distribution plans, the Fund pays Distributors for costs incurred in connection with the servicing, sale and distribution of the Fund’s shares up to the maximum annual plan rate for each class.
The maximum annual plan rates, based on the average daily net assets, for each class, are as follows:
| | |
| Reimbursement Plan: | | |
| Class A | 0.35 | % |
| Compensation Plans: | | |
| Class C | 1.00 | % |
| Class R | 0.50 | % |
The Board of Trustees has set the current rate at 0.30% per year for Class A shares until further notice and approval by the Board.
d. Sales Charges/Underwriting Agreements
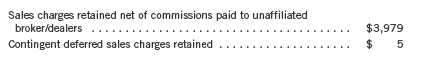
Front-end sales charges and contingent deferred sales charges (CDSC) do not represent expenses of the Fund. These charges are deducted from the proceeds of sales of Fund shares prior to investment or from redemption proceeds prior to remittance, as applicable. Distributors has advised the Fund of the following commission transactions related to the sales and redemptions of the Fund’s shares for the period:
28 | Semiannual Report
Franklin Global Trust
Notes to Financial Statements (unaudited) (continued)
Franklin Large Cap Equity Fund
| 3. | TRANSACTIONS WITH AFFILIATES (continued) |
| e. | Transfer Agent Fees |
For the period ended January 31, 2012, the Fund paid transfer agent fees of $9,107, of which $6,321 was retained by Investor Services.
f. Waiver and Expense Reimbursements
FT Services has contractually agreed in advance to waive or limit its fees and to assume as its own expense certain expenses otherwise payable by the Fund so that the common expenses (i.e. a combination of management fees, administrative fees, and other expenses, but excluding distribution fees, and acquired fund fees and expenses) for each class of the Fund do not exceed 0.95% (other than certain non-routine expenses or costs, including those relating to litigation, indemnification, reorganizations, and liquidations) until November 30, 2012.
4. EXPENSE OFFSET ARRANGEMENT
The Fund has entered into an arrangement with its custodian whereby credits realized as a result of uninvested cash balances are used to reduce a portion of the Fund’s custodian expenses. During the period ended January 31, 2012, there were no credits earned.
5. INCOME TAXES
For tax purposes, capital losses may be carried over to offset future capital gains, if any. At July 31, 2011, the Fund had capital loss carryforwards of $3,861,459 expiring in 2018.
Under the Regulated Investment Company Modernization Act of 2010, the Fund will be permitted to carry forward capital losses incurred in taxable years beginning after December 22, 2010 for an unlimited period. Post-enactment capital loss carryforwards will retain their character as either short-term or long-term capital losses rather than being considered short-term as under previous law. Any post-enactment capital losses generated will be required to be utilized prior to the losses incurred in pre-enactment tax years.
For tax purposes, realized currency losses occurring subsequent to October 31 may be deferred and treated as occurring on the first day of the following fiscal year. At July 31, 2011, the Fund deferred realized currency losses of $15,856.
Semiannual Report | 29
Franklin Global Trust
Notes to Financial Statements (unaudited) (continued)
Franklin Large Cap Equity Fund
5. INCOME TAXES (continued)
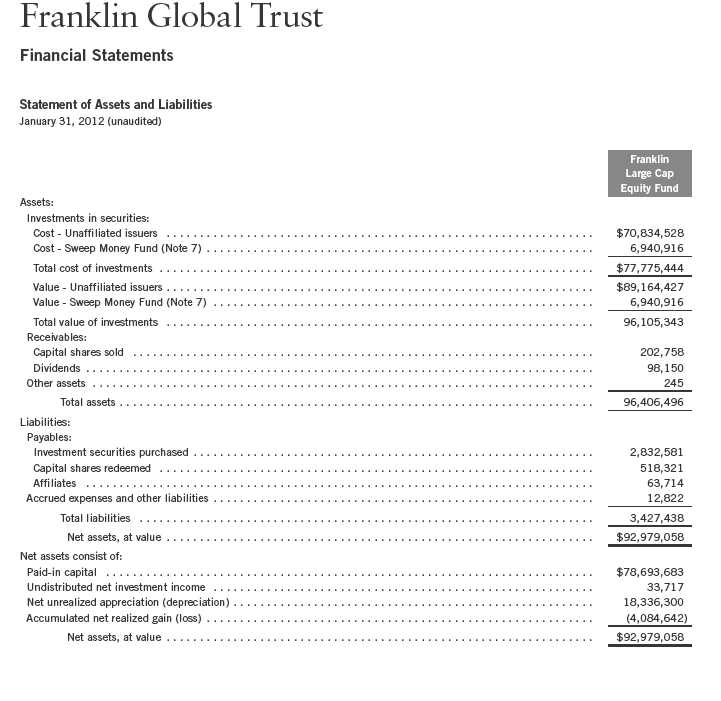
At January 31, 2012, the cost of investments and net unrealized appreciation (depreciation) for income tax purposes were as follows:
| | | |
| Cost of investments | $ | 77,775,444 | |
| |
| Unrealized appreciation | $ | 20,186,287 | |
| Unrealized depreciation | | (1,856,388 | ) |
| Net unrealized appreciation (depreciation) | $ | 18,329,899 | |
Differences between income and/or capital gains as determined on a book basis and a tax basis are primarily due to differing treatments of foreign currency transactions and pass-through entity income.
6. INVESTMENT TRANSACTIONS
Purchases and sales of investments (excluding short term securities) for the period ended January 31, 2012, aggregated $10,868,393 and $9,668,481, respectively.
7. INVESTMENTS IN INSTITUTIONAL FIDUCIARY TRUST MONEY MARKET PORTFOLIO
The Fund invests in the Institutional Fiduciary Trust Money Market Portfolio (Sweep Money Fund), an open-end investment company managed by Franklin Advisers, Inc. (an affiliate of the investment manager). Management fees paid by the Fund are reduced on assets invested in the Sweep Money Fund, in an amount not to exceed the management and administrative fees paid by the Sweep Money Fund.
8. CREDIT FACILITY
The Fund, together with other U.S. registered and foreign investment funds (collectively, Borrowers), managed by Franklin Templeton Investments, are borrowers in a joint syndicated senior unsecured credit facility totaling $1.5 billion (Global Credit Facility) which matures on January 18, 2013. This Global Credit Facility provides a source of funds to the Borrowers for temporary and emergency purposes, including the ability to meet future unanticipated or unusually large redemption requests.
Under the terms of the Global Credit Facility, the Fund shall, in addition to interest charged on any borrowings made by the Fund and other costs incurred by the Fund, pay its share of fees and expenses incurred in connection with the implementation and maintenance of the Global Credit
30 | Semiannual Report
Franklin Global Trust
Notes to Financial Statements (unaudited) (continued)
Franklin Large Cap Equity Fund
8. CREDIT FACILITY (continued)
Facility, based upon its relative share of the aggregate net assets of all of the Borrowers, including an annual commitment fee of 0.08% based upon the unused portion of the Global Credit Facility, which is reflected in other expenses on the Statement of Operations. During the period ended January 31, 2012, the Fund did not use the Global Credit Facility.
9. FAIR VALUE MEASUREMENTS
The Fund follows a fair value hierarchy that distinguishes between market data obtained from independent sources (observable inputs) and the Fund’s own market assumptions (unobservable inputs). These inputs are used in determining the value of the Fund’s investments and are summarized in the following fair value hierarchy:
- Level 1 – quoted prices in active markets for identical securities
- Level 2 – other significant observable inputs (including quoted prices for similar securities, interest rates, prepayment speed, credit risk, etc.)
- Level 3 – significant unobservable inputs (including the Fund’s own assumptions in determining the fair value of investments)
The inputs or methodology used for valuing securities are not an indication of the risk associated with investing in those securities.
For movements between the levels within the fair value hierarchy, the Fund has adopted a policy of recognizing the transfers as of the date of the underlying event which caused the movement.
At January 31, 2012, all of the Fund’s investments in securities carried at fair value were valued using Level 1 inputs. For detailed categories, see the accompanying Statement of Investments.
10. NEW ACCOUNTING PRONOUNCEMENTS
In May 2011, the Financial Accounting Standards Board (FASB) issued Accounting Standards Update (ASU) No. 2011-04, Fair Value Measurement (Topic 820): Amendments to Achieve Common Fair Value Measurement and Disclosure Requirements in U.S. GAAP and IFRSs. The amendments in the ASU will improve the comparability of fair value measurements presented and disclosed in financial statements prepared in accordance with U.S. GAAP (Generally Accepted Accounting Principles) and IFRS (International Financial Reporting Standards) and include new guidance for certain fair value measurement principles and disclosure requirements. The ASU is effective for interim and annual periods beginning after December 15, 2011. The Fund believes the adoption of this ASU will not have a material impact on its financial statements.
Semiannual Report | 31
Franklin Global Trust
Notes to Financial Statements (unaudited) (continued)
Franklin Large Cap Equity Fund
11. SUBSEQUENT EVENTS
The Fund has evaluated subsequent events through the issuance of the financial statements and determined that no events have occurred that require disclosure.
ABBREVIATIONS
Selected Portfolio
ADR - American Depositary Receipt
GDR - Global Depositary Receipt
32 | Semiannual Report
Franklin Global Trust
Shareholder Information
Franklin Large Cap Equity Fund
Proxy Voting Policies and Procedures
The Trust’s investment manager has established Proxy Voting Policies and Procedures (Policies) that the Trust uses to determine how to vote proxies relating to portfolio securities. Shareholders may view the Trust’s complete Policies online at franklintempleton.com. Alternatively, shareholders may request copies of the Policies free of charge by calling the Proxy Group collect at (954) 527-7678 or by sending a written request to: Franklin Templeton Companies, LLC, 300 S.E. 2nd Street, Fort Lauderdale, FL 33301, Attention: Proxy Group. Copies of the Trust’s proxy voting records are also made available online at franklintempleton.com and posted on the U.S. Securities and Exchange Commission’s website at sec.gov and reflect the most recent 12-month period ended June 30.
Quarterly Statement of Investments
The Trust files a complete statement of investments with the U.S. Securities and Exchange Commission for the first and third quarters for each fiscal year on Form N-Q. Shareholders may view the filed Form N-Q by visiting the Commission’s website at sec.gov. The filed form may also be viewed and copied at the Commission’s Public Reference Room in Washington, DC. Information regarding the operations of the Public Reference Room may be obtained by calling (800) SEC-0330.
Semiannual Report | 33
This page intentionally left blank.

1
Semiannual Report
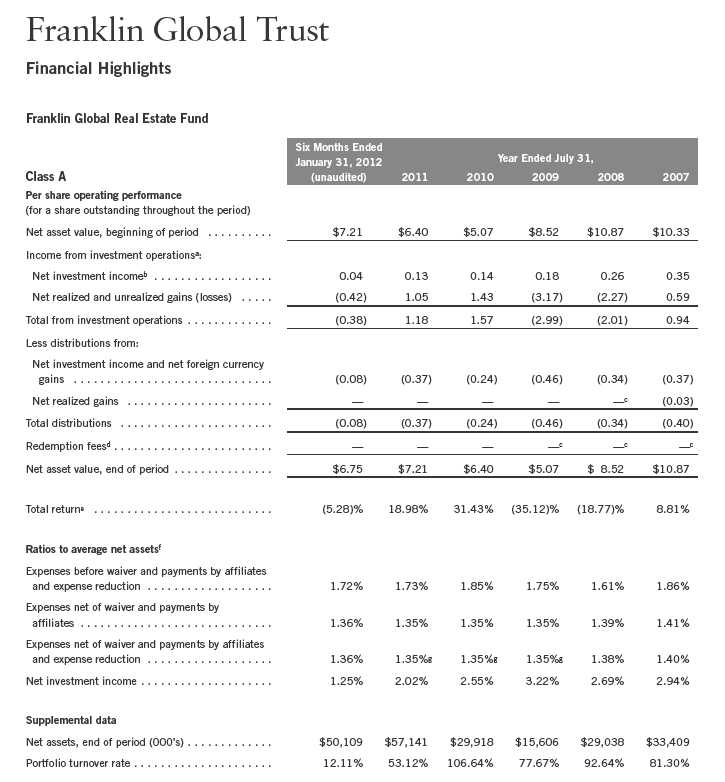
Franklin Global Real Estate Fund
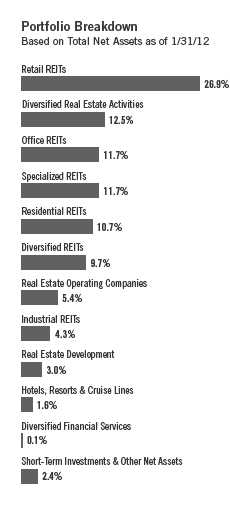
Your Fund’s Goal and Main Investments: Franklin Global Real Estate Fund seeks high total return. Under normal market conditions, the Fund invests at least 80% of its net assets in securities of companies located anywhere in the world that operate in the real estate sector, including mainly real estate investment trusts (REITs) and REIT-like entities.1
Performance data represent past performance, which does not guarantee future results. Investment return and principal value will fluctuate, and you may have a gain or loss when you sell your shares. Current performance may differ from figures shown. Please visit franklintempleton.com or call (800) 342-5236 for most recent month-end performance.
This semiannual report for Franklin Global Real Estate Fund covers the period ended January 31, 2012.
Performance Overview
Franklin Global Real Estate Fund – Class A had a -5.28% cumulative total return for the six months under review. The Fund performed comparably to the -5.02% total return of its benchmark, the FTSE® EPRA/NAREIT Developed Index, which measures global real estate markets in North America, Europe and Asia.2 You can find more of the Fund’s performance data in the Performance Summary beginning on page 8.
Economic and Market Overview
The U.S. economy improved during the six months ended January 31, 2012, despite geopolitical, fiscal, employment and housing pressures. In contrast,
1. REITs are real estate investment trust companies, usually with publicly traded stock, that manage a portfolio of income-producing real estate properties such as apartments, hotels, industrial properties, office buildings or shopping centers. The Fund predominantly invests in “equity” REITs, which also take ownership positions in real estate. Shareholders of equity REITs generally receive income from rents received and receive capital gains when properties are sold at a profit. REITs are generally operated by experienced property management teams and typically concentrate on a specific geographic region or property type.
2. Source: © 2012 Morningstar. All Rights Reserved. The information contained herein: (1) is proprietary to Morningstar and/or its content providers; (2) may not be copied or distributed; and (3) is not warranted to be accurate, complete or timely. Neither Morningstar nor its content providers are responsible for any damages or losses arising from any use of this information. FTSE® is a trademark of London Stock Exchange Plc and the Financial Times Limited. The index is unmanaged and includes reinvestment of any income or distributions. One cannot invest directly in an index, and an index is not representative of the Fund’s portfolio.
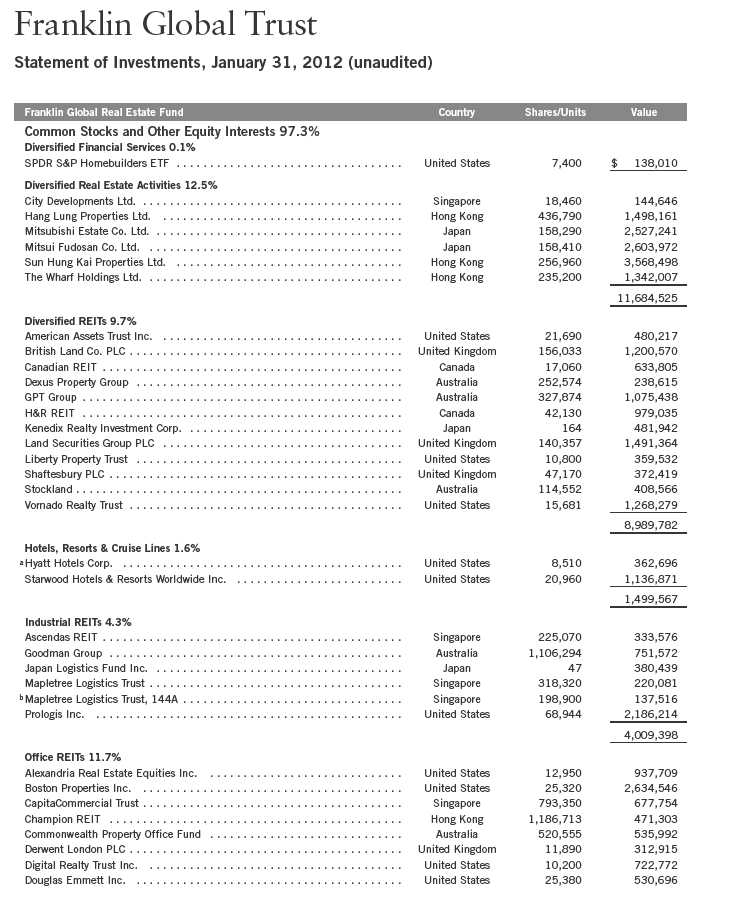
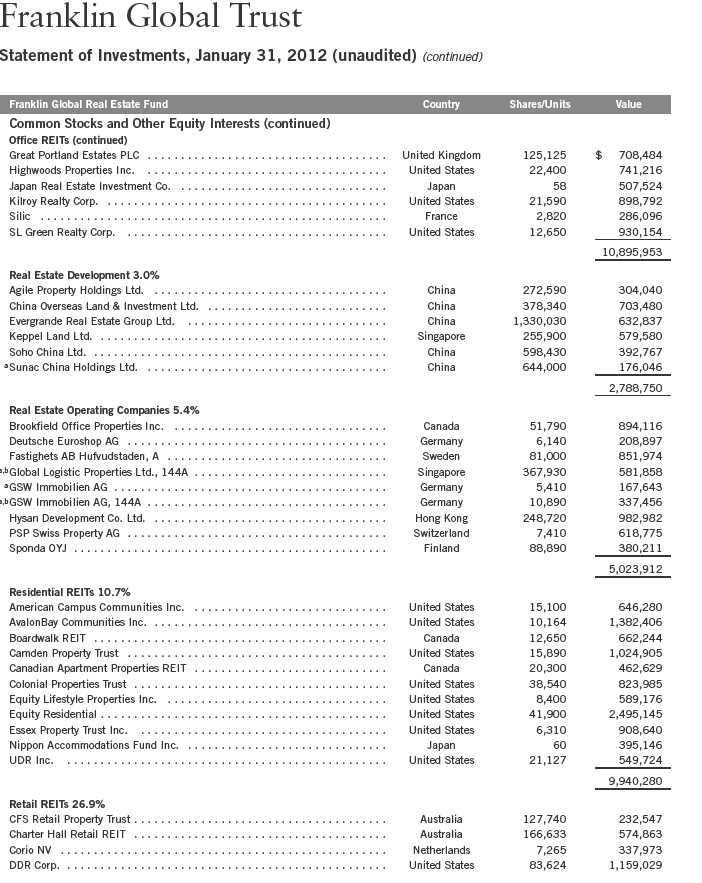
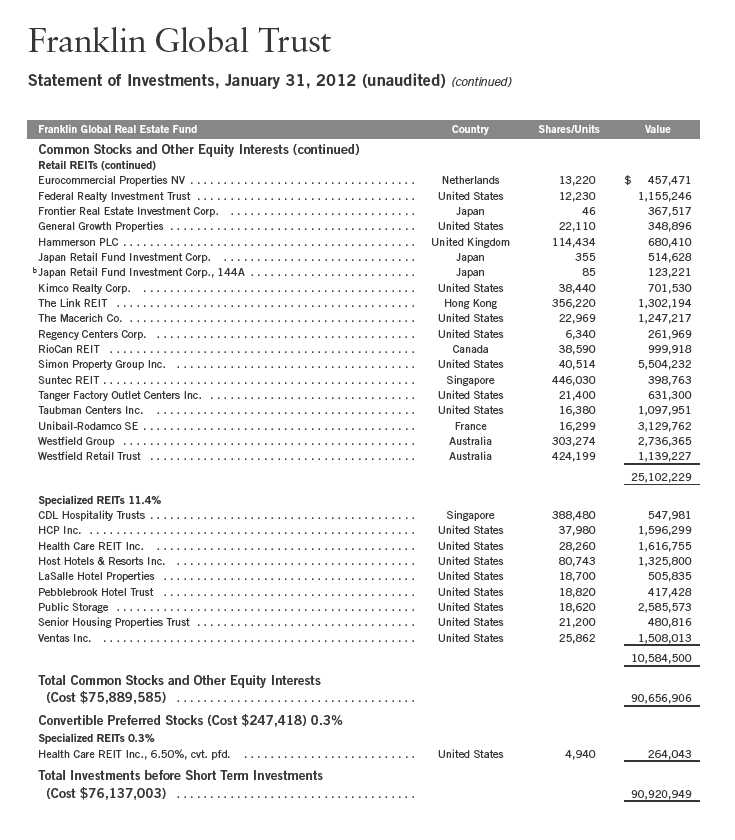
The dollar value, number of shares or principal amount, and names of all portfolio holdings are listed in the Fund’s Statement of Investments (SOI). The SOI begins on page 16.
Semiannual Report | 3
growth outside the U.S. generally slowed, which some attributed to the effects of Japan’s earthquake and Thailand’s flooding on the global supply chain, pop-ulist uprisings across the oil-and-gas-producing regions of the Middle East and North Africa, and the eurozone sovereign debt crisis. Although U.S. manufacturing growth slowed in the first half of the period as high commodity prices reduced purchasing power and demand ebbed, the trend began to reverse near period-end. The U.S. manufacturing sector helped power the domestic economy and, along with India, led global manufacturing growth at period-end. European and Asian manufacturing, however, generally weakened through most of the six-month reporting period before stabilizing at period-end.
The U.S. financial system and household balance sheets continued to improve, but the country still faced persistently high unemployment, a prolonged housing market slump and massive national debt. Inflation rose across much of the world but stayed relatively contained in the U.S. The Federal Reserve Board (Fed) sought to boost economic growth by implementing its new bond-buying program, dubbed “Operation Twist” by commentators, which is intended to further lower long-term bond yields. The Fed also anticipated it would keep the federal funds target rate at 0% to 0.25% at least through late 2014. Outside the U.S., European policymakers stepped up their response to their sovereign debt and banking crisis. The European Central Bank cut short-term interest rates and expanded bank lending facilities, and six key global central banks agreed to lower dollar funding costs for Europe’s distressed commercial banks. Chinese policymakers lowered commercial bank reserve requirements and the International Monetary Fund revamped its credit line and eased its lending terms.
Worrisome global events and slowing global growth dampened investor sentiment and market volatility surged. Through most of the period, risk-averse investors sought perceived safe havens and seemed to ignore that many companies generated record profits. As 2012 began, better-than-expected U.S. economic reports renewed many investors’ risk appetite. Despite large swings, U.S. stocks as measured by the Standard & Poor’s® 500 Index gained 2.71% for the six months ended January 31, 2012.3 The Dow Jones Industrial Average rose 5.52%, reflecting investors’ general preference for large, established U.S. companies.3 In contrast, developed and emerging world stocks as measured by the MSCI All Country World Index fell 4.58%.3 Amid general global market declines, U.S. Treasuries and perceived safe-haven currencies such as the U.S. dollar and Japanese yen delivered solid returns.
3. Source: © 2012 Morningstar. STANDARD & POOR’S®, S&P® and S&P 500® are registered trademarks of Standard & Poor’s Financial Services LLC. Standard & Poor’s does not sponsor, endorse, sell or promote any S&P index-based product.
4 | Semiannual Report
Global Real Estate Market Overview
Most global real estate markets declined during the reporting period, especially across Europe due to concerns about the European sovereign debt crisis and fears of a Greek sovereign debt default. Real estate markets in Asia were hurt by concerns about rising inflation and a possible Chinese economic slowdown. According to the FTSE EPRA/NAREIT Developed Index, in U.S. dollar terms, Australia, the U.S., New Zealand and Canada posted modest gains, while all other countries had declines.
Investment Strategy
We are research-driven, fundamental investors. We seek to limit price volatility by investing across markets and property types. We also seek to provide a consistently high level of income. We center our active investment strategy on the belief that unsynchronized regional economic activity within the global economy can provide consistent, attractive return opportunities in the global real estate markets. We use a bottom-up, value-oriented stock selection process that incorporates macro-level views in the evaluation process. We use top-down macro overlays to provide country/regional, property type, and company size perspectives in identifying international/local cyclical and thematic trends that highlight investment opportunities. We may use currency forward contracts from time to time to help manage currency risk and the Fund’s exposure to various currencies.
Manager’s Discussion
During the six months under review, major contributors to Fund performance relative to the FTSE EPRA/NAREIT Developed Index included positions in U.S.-based shopping mall operators Taubman Centers and Simon Property Group, along with U.S.-based office space REIT Kilroy Realty. Shares of luxury mall owner Taubman Centers and the largest U.S. shopping mall owner, Simon Property Group, rose sharply during the period as sales for tenant stores at better quality shopping centers held up well despite slow U.S. economic growth earlier in the period. As a result of the strong performances, management at Taubman Centers and Simon Property Group raised their guidance in October for funds from operation (FFO) in 2011. FFO per share, calculated primarily by adding back depreciation and amortization expenses to earnings, is used as a barometer of performance by REITs instead of earnings per share, the measure used by publicly traded companies in other sectors. In the second half of the period, these REITs also benefited from robust holiday shopping revenues and signs of an improving U.S. economy.
What is a currency forward contract?
A currency forward contract is an agreement between the Fund and a counterparty to buy or sell a foreign currency for a specific exchange rate on a future date.
Semiannual Report | 5

Kilroy Realty’s stock price surged late in the period after management reported strong third-quarter financial results in early November. Also favorable for the company were positive economic reports in the fourth quarter, such as a modest decline in the unemployment rate and a higher economic growth rate. Such improvements could indicate that demand for corporate office space would likely continue to rise, particularly due to technology sector strength in some of Kilroy’s west coast markets.
Significant detractors from relative Fund performance included Evergrande Real Estate Group, Keppel Land and CapitaCommercial Trust. Although its sales exceeded analysts’ expectations, Evergrande Real Estate Group, a diversified Chinese property company not held in the benchmark, hindered relative Fund performance largely due to investor concerns about China’s moderating economy and government limitations on real estate development and mortgage loans as well as property prices. Singapore-based Keppel Land is a diversified property company that owns many different real estate-related subsidiaries. Its share price was negatively affected by market uncertainty caused by the European sovereign debt crisis. Keppel suffered to a greater degree than more specialized real estate companies that derive most of their revenue from leases. Shares of Singapore-based office space REIT CapitaCommercial Trust fell during the period largely due to rising inflation in the region, negative news flow from western countries, especially those in Europe, concerns about slowing global economic growth and a potential oversupply in the Singapore office market.
It is important to recognize the effect of currency movements on the Fund’s performance. In general, if the value of the U.S. dollar goes up compared with a foreign currency, an investment traded in that foreign currency will go down in value because it will be worth fewer U.S. dollars. This can have a negative effect on Fund performance. Conversely, when the U.S. dollar weakens in relation to a foreign currency, an investment traded in that foreign currency will increase in value, which can contribute to Fund performance. For the six months ended January 31, 2012, the U.S. dollar rose in value relative to most currencies. As a result, the Fund’s performance was negatively affected by the portfolio’s substantial investment in securities denominated in currencies with non-U.S. exposure.
6 | Semiannual Report
Thank you for your continued participation in Franklin Global Real Estate Fund. We look forward to serving your future investment needs.

Portfolio Management Team
Franklin Global Real Estate Fund
The foregoing information reflects our analysis, opinions and portfolio holdings as of January 31, 2012, the end of the reporting period. The way we implement our main investment strategies and the resulting portfolio holdings may change depending on factors such as market and economic conditions. These opinions may not be relied upon as investment advice or an offer for a particular security. The information is not a complete analysis of every aspect of any market, country, industry, security or the Fund. Statements of fact are from sources considered reliable, but the investment manager makes no representation or warranty as to their completeness or accuracy. Although historical performance is no guarantee of future results, these insights may help you understand our investment management philosophy.
| | |
| Top 10 Holdings | | |
| 1/31/12 | | |
| |
| Company | % of Total | |
| Sector/Industry, Country | Net Assets | |
| Simon Property Group Inc. | 5.9 | % |
| Retail REITs, U.S. | | |
| Sun Hung Kai Properties Ltd. | 3.8 | % |
| Diversified Real Estate Activities, | | |
| Hong Kong | | |
| Unibail-Rodamco SE | 3.4 | % |
| Retail REITs, France | | |
| Westfield Group | 2.9 | % |
| Retail REITs, Australia | | |
| Boston Properties Inc. | 2.8 | % |
| Office REITs, U.S. | | |
| Mitsui Fudosan Co. Ltd. | 2.8 | % |
| | |
| Diversified Real Estate Activities, Japan | | |
| Public Storage | 2.8 | % |
| Specialized REITs, U.S. | | |
| Mitsubishi Estate Co. Ltd. | 2.7 | % |
| Diversified Real Estate Activities, Japan | | |
| Equity Residential | 2.7 | % |
| Residential REITs, U.S. | | |
| Prologis Inc. | 2.3 | % |
| Industrial REITs, U.S. | | |
Semiannual Report | 7
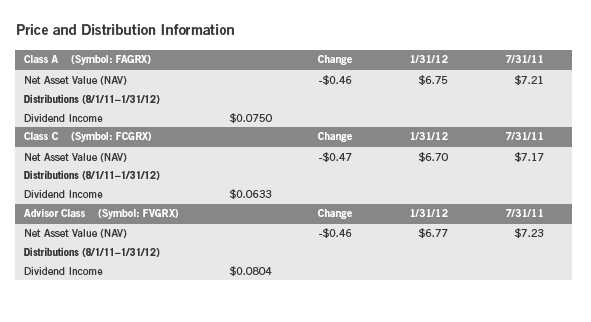
Performance Summary as of 1/31/12
Your dividend income will vary depending on dividends or interest paid by securities in the Fund’s portfolio, adjusted for operating expenses of each class. Capital gain distributions are net profits realized from the sale of portfolio securities. The performance table does not reflect any taxes that a shareholder would pay on Fund dividends, capital gain distributions, if any, or any realized gains on the sale of Fund shares. Total return reflects reinvestment of the Fund’s dividends and capital gain distributions, if any, and any unrealized gains or losses.
8 | Semiannual Report
Performance Summary (continued)
Performance1
Cumulative total return excludes sales charges. Average annual total returns and value of $10,000 investment include maximum sales charges. Class A: 5.75% maximum initial sales charge; Class C: 1% contingent deferred sales charge in first year only; Advisor Class: no sales charges.
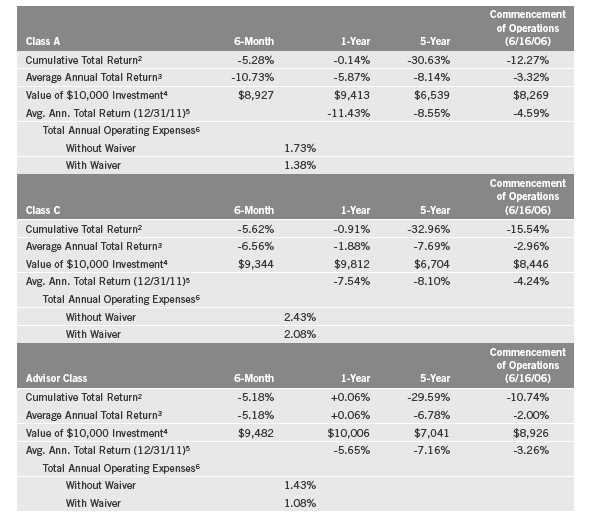
Performance data represent past performance, which does not guarantee future results. Investment return and principal value will fluctuate, and you may have a gain or loss when you sell your shares. Current performance may differ from figures shown. For most recent month-end performance, go to franklintempleton.com or call (800) 342-5236.
The investment manager and administrator have contractually agreed to waive or assume certain expenses so that common expenses (excluding Rule 12b-1 fees) for each class of the Fund do not exceed 1.08% (other than certain nonroutine expenses) until 11/30/12.
Semiannual Report | 9
1. If the manager and administrator had not waived fees, the Fund’s total returns would have been lower.
2. Cumulative total return represents the change in value of an investment over the periods indicated.
3. Average annual total return represents the average annual change in value of an investment over the periods indicated. Six-month return has not
been annualized.
4. These figures represent the value of a hypothetical $10,000 investment in the Fund over the periods indicated.
5. In accordance with SEC rules, we provide standardized average annual total return information through the latest calendar quarter.
6. Figures are as stated in the Fund’s prospectus current as of the date of this report. In periods of market volatility, assets may decline significantly,
causing total annual Fund operating expenses to become higher than the figures shown.
10 | Semiannual Report
Your Fund’s Expenses
As a Fund shareholder, you can incur two types of costs:
- Transaction costs, including sales charges (loads) on Fund purchases; and
- Ongoing Fund costs, including management fees, distribution and service (12b-1) fees, and other Fund expenses. All mutual funds have ongoing costs, sometimes referred to as operating expenses.
The following table shows ongoing costs of investing in the Fund and can help you understand these costs and compare them with those of other mutual funds. The table assumes a $1,000 investment held for the six months indicated.
Actual Fund Expenses
The first line (Actual) for each share class listed in the table provides actual account values and expenses. The “Ending Account Value” is derived from the Fund’s actual return, which includes the effect of Fund expenses.
You can estimate the expenses you paid during the period by following these steps. Of course, your account value and expenses will differ from those in this illustration:
| 1. | Divide your account value by $1,000. |
| | If an account had an $8,600 value, then $8,60 ÷ $1,000 = 8.6. |
| 2. | Multiply the result by the number under the heading “Expenses Paid During Period.” |
| | If Expenses Paid During Period were $7.50, then 8.6 x $7.50 = $64.50. |
In this illustration, the estimated expenses paid this period are $64.50.
Hypothetical Example for Comparison with Other Funds
Information in the second line (Hypothetical) for each class in the table can help you compare ongoing costs of investing in the Fund with those of other mutual funds. This information may not be used to estimate the actual ending account balance or expenses you paid during the period. The hypothetical “Ending Account Value” is based on the actual expense ratio for each class and an assumed 5% annual rate of return before expenses, which does not represent the Fund’s actual return. The figure under the heading “Expenses Paid During Period” shows the hypothetical expenses your account would have incurred under this scenario. You can compare this figure with the 5% hypothetical examples that appear in shareholder reports of other funds.
Semiannual Report | 11
Your Fund’s Expenses (continued)
Please note that expenses shown in the table are meant to highlight ongoing costs and do not reflect any transaction costs, such as sales charges. Therefore, the second line for each class is useful in comparing ongoing costs only, and will not help you compare total costs of owning different funds. In addition, if transaction costs were included, your total costs would have been higher. Please refer to the Fund prospectus for additional information on operating expenses.
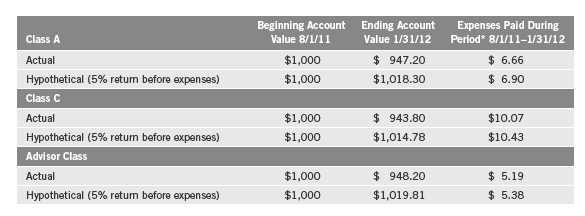
*Expenses are calculated using the most recent six-month expense ratio, net of expense waivers, annualized for each class (A: 1.36%; C: 2.06%; and Advisor: 1.06%), multiplied by the average account value over the period, multiplied by 184/366 to reflect the one-half year period.
12 | Semiannual Report
aThe amount shown for a share outstanding throughout the period may not correlate with the Statement of Operations for the period due to the timing of sales and repurchases of
the Fund shares in relation to income earned and/or fluctuating market value of the investments of the Fund.
bBased on average daily shares outstanding.
cAmount rounds to less than $0.01 per share.
dEffective September 1, 2008, the redemption fee was eliminated.
eTotal return does not reflect sales commissions or contingent deferred sales charges, if applicable, and is not annualized for periods less than one year.
fRatios are annualized for periods less than one year.
gBenefit of expense reduction rounds to less than 0.01%.
Semiannual Report | The accompanying notes are an integral part of these financial statements. | 13
aThe amount shown for a share outstanding throughout the period may not correlate with the Statement of Operations for the period due to the timing of sales and repurchases of
the Fund shares in relation to income earned and/or fluctuating market value of the investments of the Fund.
bBased on average daily shares outstanding.
cAmount rounds to less than $0.01 per share.
dEffective September 1, 2008, the redemption fee was eliminated.
eTotal return does not reflect sales commissions or contingent deferred sales charges, if applicable, and is not annualized for periods less than one year.
fRatios are annualized for periods less than one year.
gBenefit of expense reduction rounds to less than 0.01%.
14 | The accompanying notes are an integral part of these financial statements. | Semiannual Report

aThe amount shown for a share outstanding throughout the period may not correlate with the Statement of Operations for the period due to the timing of sales and repurchases of
the Fund shares in relation to income earned and/or fluctuating market value of the investments of the Fund.
bBased on average daily shares outstanding.
cAmount rounds to less than $0.01 per share.
dEffective September 1, 2008, the redemption fee was eliminated.
eTotal return is not annualized for periods less than one year.
fRatios are annualized for periods less than one year.
gBenefit of expense reduction rounds to less than 0.01%.
Semiannual Report | The accompanying notes are an integral part of these financial statements. | 15
16 | Semiannual Report
Semiannual Report | 17
18 | Semiannual Report
| | | | | |
| Franklin Global Trust | | | | | |
| |
| Statement of Investments, January 31, 2012 (unaudited) (continued) | | | | |
| |
| Franklin Global Real Estate Fund | Country | | Principal Amount | | Value |
| Short Term Investments (Cost $2,000,000) 2.2% | | | | | |
| Time Deposits 2.2% | | | | | |
| Royal Bank of Canada, 0.07%, 2/01/12 | United States | $ | 2,000,000 | $ | 2,000,000 |
| Total Investments (Cost $78,137,003) 99.8% | | | | | 92,920,949 |
| Other Assets, less Liabilities 0.2% | | | | | 231,424 |
| Net Assets 100.0% | | | | $ | 93,152,373 |
| |
| |
| See Abbreviations on page 33. | | | | | |
| |
| aNon-income producing. | | | | | |
| bSecurity was purchased pursuant to Rule 144A under the Securities Act of 1933 and may be sold in transactions exempt from registration only to qualified institutional buyers or in |
| a public offering registered under the Securities Act of 1933. These securities have been deemed liquid under guidelines approved by the Trust’s Board of Trustees. At January 31, |
| 2012, the aggregate value of these securities was $1,180,051, representing 1.27% of net assets. | | | | | |
Semiannual Report | The accompanying notes are an integral part of these financial statements. | 19

20 | The accompanying notes are an integral part of these financial statements. | Semiannual Report
Semiannual Report | The accompanying notes are an integral part of these financial statements. | 21

22 | The accompanying notes are an integral part of these financial statements. | Semiannual Report

Semiannual Report | The accompanying notes are an integral part of these financial statements. | 23
Franklin Global Trust
Notes to Financial Statements (unaudited)
Franklin Global Real Estate Fund
1. ORGANIZATION AND SIGNIFICANT ACCOUNTING POLICIES
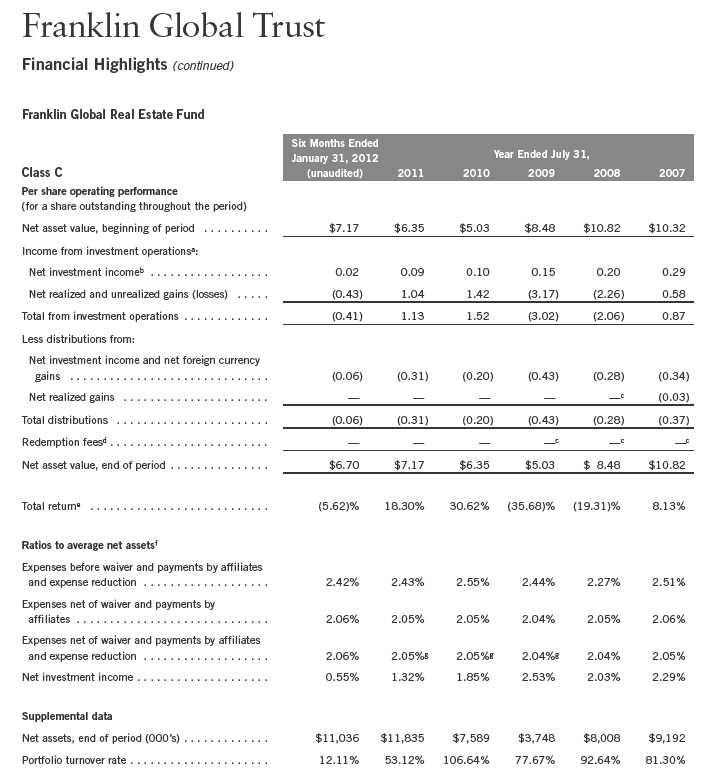
Franklin Global Trust (Trust) is registered under the Investment Company Act of 1940, as amended, (1940 Act) as an open-end investment company, consisting of five separate funds. The Franklin Global Real Estate Fund (Fund) is included in this report. The financial statements of the remaining funds in the Trust are presented separately. The Fund offers three classes of shares: Class A, Class C, and Advisor Class. Each class of shares differs by its initial sales load, contingent deferred sales charges, distribution fees, voting rights on matters affecting a single class and its exchange privilege.
The following summarizes the Fund’s significant accounting policies.
a. Financial Instrument Valuation
The Fund’s investments in securities and other financial instruments are carried at fair value daily. Fair value is the price that would be received to sell an asset or paid to transfer a liability in an orderly transaction between market participants on the measurement date. Under procedures approved by the Trust’s Board of Trustees, the Fund may utilize independent pricing services, quotations from securities and financial instrument dealers, and other market sources to determine fair value.
Equity securities and exchange traded funds listed on an exchange or on the NASDAQ National Market System are valued at the last quoted sale price or the official closing price of the day, respectively. Foreign equity securities are valued as of the close of trading on the foreign stock exchange on which the security is primarily traded, or the NYSE, whichever is earlier. The value is then converted into its U.S. dollar equivalent at the foreign exchange rate in effect at the close of the NYSE on the day that the value of the security is determined. Over-the-counter securities are valued within the range of the most recent quoted bid and ask prices. Securities that trade in multiple markets or on multiple exchanges are valued according to the broadest and most representative market. Certain equity securities are valued based upon fundamental characteristics or relationships to similar securities. Time deposits are valued at cost, which approximates market value.
The Fund has procedures to determine the fair value of securities and other financial instruments for which market prices are not readily available or which may not be reliably priced. Under these procedures, the Fund primarily employs a market-based approach which may use related or comparable assets or liabilities, recent transactions, market multiples, book values, and other relevant information for the investment to determine the fair value of the investment. The Fund may also use an income-based valuation approach in which the anticipated future cash flows of the investment are discounted to calculate fair value. Discounts may also be applied due to the nature or duration of any restrictions on the disposition of the investments. Due to the inherent uncertainty of valuations of such investments, the fair values may differ significantly from the values that would have been used had an active market existed.
24 | Semiannual Report
Franklin Global Trust
Notes to Financial Statements (unaudited) (continued)
Franklin Global Real Estate Fund
| 1. | ORGANIZATION AND SIGNIFICANT ACCOUNTING POLICIES (continued) |
| a. | Financial Instrument Valuation (continued) |
Trading in securities on foreign securities stock exchanges and over-the-counter markets may be completed before the daily close of business on the NYSE. Occasionally, events occur between the time at which trading in a foreign security is completed and the close of the NYSE that might call into question the reliability of the value of a portfolio security held by the Fund. As a result, differences may arise between the value of the Fund’s portfolio securities as determined at the foreign market close and the latest indications of value at the close of the NYSE. In order to minimize the potential for these differences, the investment manager monitors price movements following the close of trading in foreign stock markets through a series of country specific market proxies (such as baskets of American Depositary Receipts, futures contracts and exchange traded funds). These price movements are measured against established trigger thresholds for each specific market proxy to assist in determining if an event has occurred that may call into question the reliability of the values of the foreign securities held by the Fund. If such an event occurs, the securities may be valued using fair value procedures, which may include the use of independent pricing services.
b. Foreign Currency Translation
Portfolio securities and other assets and liabilities denominated in foreign currencies are translated into U.S. dollars based on the exchange rate of such currencies against U.S. dollars on the date of valuation. The Fund may enter into foreign currency exchange contracts to facilitate transactions denominated in a foreign currency. Purchases and sales of securities, income and expense items denominated in foreign currencies are translated into U.S. dollars at the exchange rate in effect on the transaction date. Portfolio securities and assets and liabilities denominated in foreign currencies contain risks that those currencies will decline in value relative to the U.S. dollar. Occasionally, events may impact the availability or reliability of foreign exchange rates used to convert the U.S. dollar equivalent value. If such an event occurs, the foreign exchange rate will be valued at fair value using procedures established and approved by the Trust’s Board of Trustees.
The Fund does not separately report the effect of changes in foreign exchange rates from changes in market prices on securities held. Such changes are included in net realized and unrealized gain or loss from investments on the Statement of Operations.
Realized foreign exchange gains or losses arise from sales of foreign currencies, currency gains or losses realized between the trade and settlement dates on securities transactions and the difference between the recorded amounts of dividends, interest, and foreign withholding taxes and the U.S. dollar equivalent of the amounts actually received or paid. Net unrealized foreign exchange gains and losses arise from changes in foreign exchange rates on foreign denominated assets and liabilities other than investments in securities held at the end of the reporting period.
Semiannual Report | 25
Franklin Global Trust
Notes to Financial Statements (unaudited) (continued)
Franklin Global Real Estate Fund
| 1. | ORGANIZATION AND SIGNIFICANT ACCOUNTING POLICIES (continued) |
| c. | Income Taxes |
It is the Fund’s policy to qualify as a regulated investment company under the Internal Revenue Code. The Fund intends to distribute to shareholders substantially all of its taxable income and net realized gains to relieve it from federal income and excise taxes. As a result, no provision for U.S. federal income taxes is required.
The Fund may be subject to foreign taxation related to income received, capital gains on the sale of securities and certain foreign currency transactions in the foreign jurisdictions in which it invests. Foreign taxes, if any, are recorded based on the tax regulations and rates that exist in the foreign markets in which the Fund invests. When a capital gain tax is determined to apply the Fund records an estimated deferred tax liability in an amount that would be payable if the securities were disposed of on the valuation date.
The Fund recognizes the tax benefits of uncertain tax positions only when the position is “more likely than not” to be sustained upon examination by the tax authorities based on the technical merits of the tax position. As of January 31, 2012, and for all open tax years, the Fund has determined that no liability for unrecognized tax benefits is required in the Fund’s financial statements related to uncertain tax positions taken on a tax return (or expected to be taken on future tax returns). Open tax years are those that remain subject to examination and are based on each tax jurisdiction statute of limitation.
d. Security Transactions, Investment Income, Expenses and Distributions
Security transactions are accounted for on trade date. Realized gains and losses on security transactions are determined on a specific identification basis. Interest income and estimated expenses are accrued daily. Dividend income is recorded on the ex-dividend date except that certain dividends from foreign securities are recognized as soon as the Fund is notified of the ex-dividend date. Distributions to shareholders are recorded on the ex-dividend date and are determined according to income tax regulations (tax basis). Distributable earnings determined on a tax basis may differ from earnings recorded in accordance with accounting principles generally accepted in the United States of America. These differences may be permanent or temporary. Permanent differences are reclassified among capital accounts to reflect their tax character. These reclassifications have no impact on net assets or the results of operations. Temporary differences are not reclassified, as they may reverse in subsequent periods.
Common expenses incurred by the Trust are allocated among the funds based on the ratio of net assets of each fund to the combined net assets of the Trust. Fund specific expenses are charged directly to the fund that incurred the expense.
26 | Semiannual Report
Franklin Global Trust
Notes to Financial Statements (unaudited) (continued)
Franklin Global Real Estate Fund
| 1. | ORGANIZATION AND SIGNIFICANT ACCOUNTING POLICIES (continued) |
| d. | Security Transactions, Investment Income, Expenses and Distributions (continued) |
Realized and unrealized gains and losses and net investment income, not including class specific expenses, are allocated daily to each class of shares based upon the relative proportion of net assets of each class. Differences in per share distributions, by class, are generally due to differences in class specific expenses.
Distributions received by the Fund from certain securities may be a return of capital (ROC). Such distributions reduce the cost basis of the securities, and any distributions in excess of the cost basis are recognized as capital gains.
e. Accounting Estimates
The preparation of financial statements in accordance with accounting principles generally accepted in the United States of America requires management to make estimates and assumptions that affect the reported amounts of assets and liabilities at the date of the financial statements and the amounts of income and expenses during the reporting period. Actual results could differ from those estimates.
f. Guarantees and Indemnifications
Under the Trust’s organizational documents, its officers and trustees are indemnified by the Trust against certain liabilities arising out of the performance of their duties to the Trust. Additionally, in the normal course of business, the Trust, on behalf of the Funds, enters into contracts with service providers that contain general indemnification clauses. The Trust’s maximum exposure under these arrangements is unknown as this would involve future claims that may be made against the Trust that have not yet occurred. Currently, the Trust expects the risk of loss to be remote.
2. SHARES OF BENEFICIAL INTEREST
At January 31, 2012, there were an unlimited number of shares authorized (without par value).
Transactions in the Fund’s shares were as follows:

Semiannual Report | 27
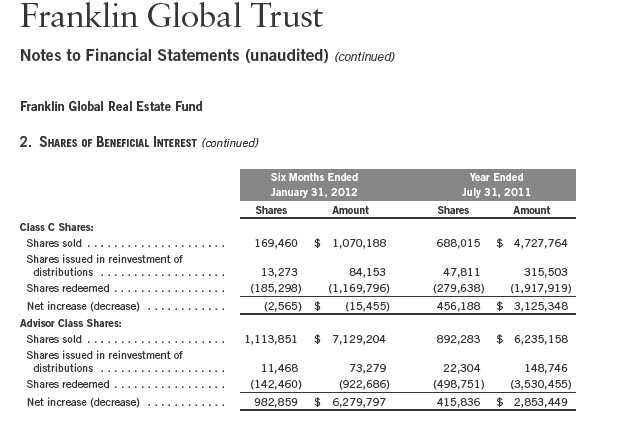
3. TRANSACTIONS WITH AFFILIATES
Franklin Resources, Inc. is the holding company for various subsidiaries that together are referred to as Franklin Templeton Investments. Certain officers and trustees of the Trust are also officers and/or directors of the following subsidiaries:
| |
| Subsidiary | Affiliation |
| Franklin Templeton Institutional, LLC (FT Institutional) | Investment manager |
| Franklin Templeton Services, LLC (FT Services) | Administrative manager |
| Franklin Templeton Distributors, Inc. (Distributors) | Principal underwriter |
| Franklin Templeton Investor Services, LLC (Investor Services) | Transfer agent |
a. Management Fees
The Fund pays an investment management fee to FT Institutional based on the average daily net assets of the Fund as follows:
| | |
| Annualized Fee Rate | | Net Assets |
| 0.800 | % | Up to and including $500 million |
| 0.700 | % | Over $500 million, up to and including $1 billion |
| 0.650 | % | Over $1 billion, up to and including $1.5 billion |
| 0.600 | % | Over $1.5,billion, up to and including $6.5 billion |
| 0.580 | % | Over $6.5 billion, up to and including $11.5 billion |
| 0.560 | % | Over $11.5 billion, up to and including $16.5 billion |
| 0.540 | % | Over $16.5 billion, up to and including $19 billion |
| 0.530 | % | Over $19 billion, up to and including $21.5 billion |
| 0.520 | % | In excess of $21.5 billion |
28 | Semiannual Report
Franklin Global Trust
Notes to Financial Statements (unaudited) (continued)
Franklin Global Real Estate Fund
| 3. | TRANSACTIONS WITH AFFILIATES (continued) |
| b. | Administrative Fees |
The Fund pays an administrative fee to FT Services of 0.20% per year of the average daily net assets of the Fund.
c. Distribution Fees
The Trust’s Board of Trustees has adopted distribution plans for each share class, with the exception of Advisor Class shares, pursuant to Rule 12b-1 under the 1940 Act. Under the Fund’s Class A reimbursement distribution plan, the Fund reimburses Distributors for costs incurred in connection with the servicing, sale and distribution of the Fund’s shares up to the maximum annual plan rate. Under the Class A reimbursement distribution plan, costs exceeding the maximum for the current plan year cannot be reimbursed in subsequent periods.
In addition, under the Fund’s Class C compensation distribution plan, the Fund pays Distributors for costs incurred in connection with the servicing, sale and distribution of the Fund’s shares up to the maximum annual plan rate.
The maximum annual plan rates, based on the average daily net assets, for each class, are as follows:
The Board of Trustees has set the current rate at 0.30% per year for Class A shares until further notice and approval by the Board.
d. Sales Charges/Underwriting Agreements
Front-end sales charges and contingent deferred sales charges (CDSC) do not represent expenses of the Fund. These charges are deducted from the proceeds of sales of Fund shares prior to investment or from redemption proceeds prior to remittance, as applicable. Distributors has advised the Fund of the following commission transactions related to the sales and redemptions of the Fund’s shares for the period:
| | |
| Sales charges retained net of commissions paid to unaffiliated | | |
| broker/dealers | $ | 19,199 |
| CDSC retained | $ | 953 |
e. Transfer Agent Fees
For the period ended January 31, 2012, the Fund paid transfer agent fees of $86,617, of which $48,354 was retained by Investor Services.
Semiannual Report | 29
Franklin Global Trust
Notes to Financial Statements (unaudited) (continued)
Franklin Global Real Estate Fund
| 3. | TRANSACTIONS WITH AFFILIATES (continued) |
| f. | Waiver and Expense Reimbursements |
FT Institutional and FT Services have contractually agreed in advance to waive or limit their respective fees and to assume as their own expense certain expenses otherwise payable by the fund so that the common expenses (i.e. a combination of management fees, administrative fees, and other expenses, but excluding distribution fees and acquired fund fees and expenses) for each class of the Fund do not exceed 1.08% (other than certain non-routine expenses or costs, including those relating to litigation, indemnification, reorganizations, and liquidations) until November 30, 2012. Prior to December 1, 2011, common expenses were limited to 1.05%.
4. EXPENSE OFFSET ARRANGEMENT
The Fund has entered into an arrangement with its custodian whereby credits realized as a result of uninvested cash balances are used to reduce a portion of the Fund’s custodian expenses. During the period ended January 31, 2012, there were no credits earned.
5. INCOME TAXES
For tax purposes, capital losses may be carried over to offset future capital gains, if any.
At July 31, 2011, the capital loss carryforwards were as follows:
| | |
| Capital loss carryforwards expiring in: | | |
| 2016 | $ | 2,797,386 |
| 2017 | | 22,811,914 |
| 2018 | | 35,647,494 |
| 2019 | | 640,292 |
| | $ | 61,897,086 |
Under the Regulated Investment Company Modernization Act of 2010, the Fund will be permitted to carry forward capital losses incurred in taxable years beginning after December 22, 2010 for an unlimited period. Post-enactment capital loss carryforwards will retain their character as either short-term or long-term capital losses rather than being considered short-term as under previous law. Any post-enactment capital losses generated will be required to be utilized prior to the losses incurred in pre-enactment tax years.
30 | Semiannual Report
Franklin Global Trust
Notes to Financial Statements (unaudited) (continued)
Franklin Global Real Estate Fund
5. INCOME TAXES (continued)
At January 31, 2012, the cost of investments and net unrealized appreciation (depreciation) for income tax purposes were as follows:
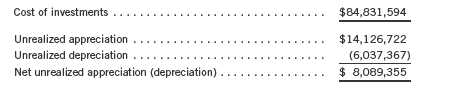
Differences between income and/or capital gains as determined on a book basis and a tax basis are primarily due to differing treatments of passive foreign investment company shares and wash sales.
6. INVESTMENT TRANSACTIONS
Purchases and sales of investments (excluding short term securities) for the period ended January 31, 2012, aggregated $14,019,709 and $10,553,125, respectively.
7. CONCENTRATION OF RISK
Investing in foreign securities may include certain risks and considerations not typically associated with investing in U.S. securities, such as fluctuating currency values and changing local and regional economic, political and social conditions, which may result in greater market volatility. In addition, certain foreign securities may not be as liquid as U.S. securities.
8. CREDIT FACILITY
The Fund, together with other U.S. registered and foreign investment funds (collectively, Borrowers), managed by Franklin Templeton Investments, are borrowers in a joint syndicated senior unsecured credit facility totaling $1.5 billion (Global Credit Facility) which matures on January 18, 2013. This Global Credit Facility provides a source of funds to the Borrowers for temporary and emergency purposes, including the ability to meet future unanticipated or unusually large redemption requests.
Semiannual Report | 31
Franklin Global Trust
Notes to Financial Statements (unaudited) (continued)
Franklin Global Real Estate Fund
8. CREDIT FACILITY (continued)
Under the terms of the Global Credit Facility, the Fund shall, in addition to interest charged on any borrowings made by the Fund and other costs incurred by the Fund, pay its share of fees and expenses incurred in connection with the implementation and maintenance of the Global Credit Facility, based upon its relative share of the aggregate net assets of all of the Borrowers, including an annual commitment fee of 0.08% based upon the unused portion of the Global Credit Facility, which is reflected in other expenses on the Statement of Operations. During the period ended January 31, 2012, the Fund did not use the Global Credit Facility.
9. FAIR VALUE MEASUREMENTS
The Fund follows a fair value hierarchy that distinguishes between market data obtained from independent sources (observable inputs) and the Fund’s own market assumptions (unobservable inputs). These inputs are used in determining the value of the Fund’s investments and are summarized in the following fair value hierarchy:
- Level 1 – quoted prices in active markets for identical securities
- Level 2 – other significant observable inputs (including quoted prices for similar securities, interest rates, prepayment speed, credit risk, etc.)
- Level 3 – significant unobservable inputs (including the Fund’s own assumptions in determining the fair value of investments)
The inputs or methodology used for valuing securities are not an indication of the risk associated with investing in those securities.
For movements between the levels within the fair value hierarchy, the Fund has adopted a policy of recognizing the transfers as of the date of the underlying event which caused the movement.
The following is a summary of the inputs used as of January 31, 2012, in valuing the Fund’s assets carried at fair value:

32 | Semiannual Report
Franklin Global Trust
Notes to Financial Statements (unaudited) (continued)
Franklin Global Real Estate Fund
10. NEW ACCOUNTING PRONOUNCEMENTS
In May 2011, the Financial Accounting Standards Board (FASB) issued Accounting Standards Update (ASU) No. 2011-04, Fair Value Measurement (Topic 820): Amendments to Achieve Common Fair Value Measurement and Disclosure Requirements in U.S. GAAP and IFRSs. The amendments in the ASU will improve the comparability of fair value measurements presented and disclosed in financial statements prepared in accordance with U.S. GAAP (Generally Accepted Accounting Principles) and IFRS (International Financial Reporting Standards) and include new guidance for certain fair value measurement principles and disclosure requirements. The ASU is effective for interim and annual periods beginning after December 15, 2011. The Fund believes the adoption of this ASU will not have a material impact on its financial statements.
11. SUBSEQUENT EVENTS
The Fund has evaluated subsequent events through the issuance of the financial statements and determined that no events have occurred that require disclosure.
ABBREVIATIONS
Selected Portfolio
| | |
| ETF | - | Exchange Traded Fund |
| REIT | - | Real Estate Investment Trust |
| SPDR | - | S&P Depositary Receipt |
Semiannual Report | 33
Franklin Global Trust
Shareholder Information
Franklin Global Real Estate Fund
Proxy Voting Policies and Procedures
The Trust’s investment manager has established Proxy Voting Policies and Procedures (Policies) that the Trust uses to determine how to vote proxies relating to portfolio securities. Shareholders may view the Trust’s complete Policies online at franklintempleton.com. Alternatively, shareholders may request copies of the Policies free of charge by calling the Proxy Group collect at (954) 527-7678 or by sending a written request to: Franklin Templeton Companies, LLC, 300 S.E. 2nd Street, Fort Lauderdale, FL 33301, Attention: Proxy Group. Copies of the Trust’s proxy voting records are also made available online at franklintempleton.com and posted on the U.S. Securities and Exchange Commission’s website at sec.gov and reflect the most recent 12-month period ended June 30.
Quarterly Statement of Investments
The Trust files a complete statement of investments with the U.S. Securities and Exchange Commission for the first and third quarters for each fiscal year on Form N-Q. Shareholders may view the filed Form N-Q by visiting the Commission’s website at sec.gov. The filed form may also be viewed and copied at the Commission’s Public Reference Room in Washington, DC. Information regarding the operations of the Public Reference Room may be obtained by calling (800) SEC-0330.
34 | Semiannual Report

INTERNATIONAL
FRANKLIN GLOBAL TRUST

| 1
Semiannual Report
Economic and Market Overview
The U.S. economy improved during the six months ended January 31, 2012, despite geopolitical, fiscal, employment and housing pressures. In contrast, growth outside the U.S. generally slowed, which some attributed to the effects of Japan’s earthquake and Thailand’s flooding on the global supply chain, pop-ulist uprisings across the oil-and-gas-producing regions of the Middle East and North Africa, and the eurozone sovereign debt crisis. Although U.S. manufacturing growth slowed in the first half of the period as high commodity prices reduced purchasing power and demand ebbed, the trend began to reverse near period-end. The U.S. manufacturing sector helped power the domestic economy and, along with India, led global manufacturing growth at period-end. European and Asian manufacturing, however, generally weakened through most of the six-month reporting period before stabilizing at period-end.
The U.S. financial system and household balance sheets continued to improve, but the country still faced persistently high unemployment, a prolonged housing market slump and massive national debt. Inflation rose across much of the world but stayed relatively contained in the U.S. The Federal Reserve Board (Fed) sought to boost economic growth by implementing its new bond-buying program, dubbed “Operation Twist” by commentators, which is intended to further lower long-term bond yields. The Fed also anticipated it would keep the federal funds target rate at 0% to 0.25% at least through late 2014. Outside the U.S., European policymakers stepped up their response to their sovereign debt and banking crisis. The European Central Bank cut short-term interest rates and expanded bank lending facilities, and six key global central banks agreed to lower dollar funding costs for Europe’s distressed commercial banks. Chinese policymakers lowered commercial bank reserve requirements and the International Monetary Fund revamped its credit line and eased its lending terms.
Worrisome global events and slowing global growth dampened investor sentiment and market volatility surged. Through most of the period, risk-averse investors sought perceived safe havens and seemed to ignore that many companies generated record profits. As 2012 began, better-than-expected U.S. economic reports renewed many investors’ risk appetite. Despite large swings, U.S. stocks as measured by the Standard & Poor’s® 500 Index gained 2.71%
Semiannual Report | 3
for the six months ended January 31, 2012.1 The Dow Jones Industrial Average rose 5.52%, reflecting investors’ general preference for large, established U.S. companies.1 In contrast, developed and emerging world stocks as measured by the MSCI All Country World Index fell 4.58%.1 Amid general global market declines, U.S. Treasuries and perceived safe-haven currencies such as the U.S. dollar and Japanese yen delivered solid returns.
The foregoing information reflects our analysis and opinions as of January 31, 2012. The information is not a complete analysis of every aspect of any market, country, industry, security or fund. Statements of fact are from sources considered reliable.
1. Source: © 2012 Morningstar. All Rights Reserved. The information contained herein: (1) is proprietary to Morningstar and/or its content providers; (2) may not be copied or distributed; and (3) is not warranted to be accurate, complete or timely. Neither Morningstar nor its content providers are responsible for any damages or losses arising from any use of this information. Past performance is no guarantee of future results. STANDARD & POOR’S®, S&P® and S&P 500® are registered trademarks of Standard & Poor’s Financial Services LLC. Standard & Poor’s does not sponsor, endorse, sell or promote any S&P index-based product.
4 | Semiannual Report
Franklin International Growth Fund
Your Fund’s Goal and Main Investments: The Fund seeks long-term capital appreciation by investing predominantly in equity securities of mid- and large-capitalization companies, generally those with market capitalizations greater than $2 billion, located outside the U.S., including developing or emerging market countries. The Fund considers international companies to be those organized under the laws of a country outside the U.S. or having a principal office in a country outside the U.S., or whose securities are listed or traded principally on a recognized stock exchange or over-the-counter market outside the U.S.
Performance data represent past performance, which does not guarantee future results. Investment return and principal value will fluctuate, and you may have a gain or loss when you sell your shares. Current performance may differ from figures shown. Please visit franklintempleton.com or call (800) 342-5236 for most recent month-end performance.
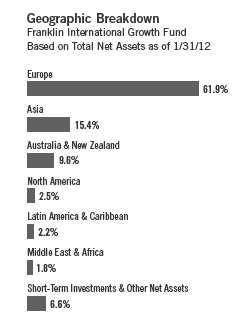
This semiannual report for Franklin International Growth Fund covers the period ended January 31, 2012.
Performance Overview
For the six months ended January 31, 2012, Franklin International Growth Fund – Class A had a -7.89% cumulative total return. The Fund performed better than the -10.32% total return of its benchmark, the MSCI Europe, Australasia, Far East (EAFE) Index, which measures global equity performance excluding the U.S. and Canada.1 You can find more of the Fund’s performance data in the Performance Summary beginning on page 8.
Investment Strategy
In choosing individual equity investments, we employ a disciplined, bottom-up approach to identify attractive investment opportunities that have higher expected revenue and earnings growth than their peers. We use a growth investment style and in-depth, fundamental research to identify high-quality companies, across all industry groups, with sustainable business models that offer the most attractive combination of growth and quality.
1. Source: © 2012 Morningstar. All Rights Reserved. The information contained herein: (1) is proprietary to Morningstar and/or its content providers; (2) may not be copied or distributed; and (3) is not warranted to be accurate, complete or timely. Neither Morningstar nor its content providers are responsible for any damages or losses arising from any use of this information. The index is unmanaged and includes reinvested distributions. One cannot invest directly in an index, and an index is not representative of the Fund’s portfolio.
The dollar value, number of shares or principal amount, and names of all portfolio holdings are listed in the Fund’s Statement of Investments (SOI). The SOI begins on page 26.
Semiannual Report | 5

Manager’s Discussion
The Fund’s stock selection in the consumer discretionary, information technology and materials sectors helped drive performance relative to the MSCI EAFE Index.2 In the consumer discretionary sector, share prices advanced for holdings such as Italian fashion eyewear firm Luxottica Group and Hong Kong-based consumer goods distributor Li & Fung. An overweighted allocation in the distributors industry relative to the benchmark added to favorable performance. In the information technology sector, gains for the Fund’s positions in Argentina-based e-commerce website provider MercadoLibre3 and U.K.-based software firm Sage Group provided contributions during the six-month period. Among the Fund’s materials sector positions contributing to relative performance were chemicals firms Symrise,3 based in Germany, and Syngenta, based in Switzerland.
Other key holdings that boosted relative returns included non-index companies Elekta, a Sweden-based global distributor of radiation therapy and radiosurgery equipment for cancer treatment, and U.K.-based Aberdeen Asset Management, a global asset management group.
Conversely, the Fund’s stock selection in the financials sector was a major detractor from relative performance.4 U.K.-based alternative investment manager Man Group5 was a key underperformer. Insurers Admiral Group from the U.K. and QBE Insurance Group5 from Australia also experienced poor performance during the six-month period, as did Switzerland-based Credit Suisse Group, a leading global financial services firm, and German trading exchange Deutsche Boerse.
Regionally, stock selection in European countries such as Germany, France and Spain was positive for relative performance and overcame the drag of stock selection in the U.K. Stock selection in Asia aided relative results, led by Chinese personal products manufacturer Hengan International Group.3
It is important to recognize the effect of currency movements on the Fund’s performance. In general, if the value of the U.S. dollar goes up compared with a foreign currency, an investment traded in that foreign currency will go down
2. The consumer discretionary sector comprises distributors; media; specialty retail; and textiles, apparel and luxury goods in the SOI. The information technology sector comprises Internet software and services, semiconductors and semiconductor equipment, and software in the SOI. The materials sector comprises chemicals in the SOI.
3. This holding is not an index component.
4. The financials sector comprises capital markets, commercial banks, diversified financial services, insurance, and real estate management and development in the SOI.
5. Sold by period-end.
6 | Semiannual Report
in value because it will be worth fewer U.S. dollars. This can have a negative effect on Fund performance. Conversely, when the U.S. dollar weakens in relation to a foreign currency, an investment traded in that foreign currency will increase in value, which can contribute to Fund performance. For the six months ended January 31, 2012, the U.S. dollar rose in value relative to most currencies. As a result, the Fund’s performance was negatively affected by the portfolio’s investment predominantly in securities with non-U.S. currency exposure.
Thank you for your participation in Franklin International Growth Fund. We look forward to serving your future investment needs.

CFA® is a trademark owned by CFA Institute.
The foregoing information reflects our analysis, opinions and portfolio holdings as of January 31, 2012, the end of the reporting period. The way we implement our main investment strategies and the resulting portfolio holdings may change depending on factors such as market and economic conditions. These opinions may not be relied upon as investment advice or an offer for a particular security. The information is not a complete analysis of every aspect of any market, country, industry, security or the Fund. Statements of fact are from sources considered reliable, but the investment manager makes no representation or warranty as to their completeness or accuracy. Although historical performance is no guarantee of future results, these insights may help you understand our investment management philosophy.
Top 10 Equity Holdings
Franklin International Growth Fund 1/31/12
| | |
| Company | % of Total | |
| Sector/Industry, Country | Net Assets | |
| Noble Group Ltd. | 3.0 | % |
| Trading Companies & Distributors, | | |
| Hong Kong | | |
| United Overseas Bank Ltd. | 2.7 | % |
| Commercial Banks, Singapore | | |
| ARM Holdings PLC | 2.7 | % |
| Semiconductors & Semiconductor | | |
| Equipment, U.K. | | |
| WorleyParsons Ltd. | 2.7 | % |
| | |
| Energy Equipment & Services, Australia | | |
| Societe Generale de Surveillance | | |
| Holdings SA | 2.7 | % |
| Professional Services, Switzerland | | |
| Hang Lung Properties Ltd. | 2.6 | % |
| Real Estate Management & | | |
| Development, Hong Kong | | |
| Elekta AB, B | 2.6 | % |
| Health Care Equipment & Supplies, | | |
| Sweden | | |
| Credit Suisse Group AG | 2.6 | % |
| Capital Markets, Switzerland | | |
| Saipem SpA | 2.6 | % |
| Energy Equipment & Services, Italy | | |
| The Sage Group PLC | 2.6 | % |
| Software, U.K. | | |
Semiannual Report | 7
Performance Summary as of 1/31/12
Franklin International Growth Fund
Your dividend income will vary depending on dividends or interest paid by securities in the Fund’s portfolio, adjusted for operating expenses of each class. Capital gain distributions are net profits realized from the sale of portfolio securities. The performance table does not reflect any taxes that a shareholder would pay on Fund dividends, capital gain distributions, if any, or any realized gains on the sale of Fund shares. Total return reflects reinvestment of the Fund’s dividends and capital gain distributions, if any, and any unrealized gains or losses.
| | | | | | | | |
| Price and Distribution Information | | | | | | |
| |
| Class A (Symbol: FNGAX) | | | | Change | | 1/31/12 | | 7/31/11 |
| Net Asset Value (NAV) | | | -$ | 0.89 | $ | 8.97 | $ | 9.86 |
| Distributions (8/1/11–1/31/12) | | | | | | | | |
| Dividend Income | $ | 0.1013 | | | | | | |
| Class C (Symbol: n/a) | | | | Change | | 1/31/12 | | 7/31/11 |
| Net Asset Value (NAV) | | | -$ | 0.83 | $ | 8.90 | $ | 9.73 |
| Distributions (8/1/11–1/31/12) | | | | | | | | |
| Dividend Income | $ | 0.0373 | | | | | | |
| Class R (Symbol: n/a) | | | | Change | | 1/31/12 | | 7/31/11 |
| Net Asset Value (NAV) | | | -$ | 0.87 | $ | 8.96 | $ | 9.83 |
| Distributions (8/1/11–1/31/12) | | | | | | | | |
| Dividend Income | $ | 0.0826 | | | | | | |
| Advisor Class (Symbol: FNGZX) | | | | Change | | 1/31/12 | | 7/31/11 |
| Net Asset Value (NAV) | | | -$ | 0.91 | $ | 8.98 | $ | 9.89 |
| Distributions (8/1/11–1/31/12) | | | | | | | | |
| Dividend Income | $ | 0.1322 | | | | | | |
8 | Semiannual Report
Performance Summary (continued)
Performance1
Cumulative total return excludes sales charges. Average annual total returns and value of $10,000 investment include maximum sales charges. Class A: 5.75% maximum initial sales charge; Class C: 1% contingent deferred sales charge in first year only; Class R/Advisor Class: no sales charges.
| | | | | | | | | | | | | | |
| Class A | | 6-Month | | | | | 1-Year | | | 3-Year | | | Inception (6/3/08) | |
| Cumulative Total Return2 | | -7.89 | % | | | | -7.33 | % | + | 76.94 | % | | -7.25 | % |
| Average Annual Total Return3 | | -13.18 | % | | | | -12.68 | % | + | 18.58 | % | | -3.60 | % |
| Value of $10,000 Investment4 | $ | 8,682 | | | | $ | 8,732 | | $ | 16,672 | | $ | 8,742 | |
| Avg. Ann. Total Return (12/31/11)5 | | | | | | | -17.06 | % | + | 14.16 | % | | -5.50 | % |
| Total Annual Operating Expenses6 | | | | | | | | | | | | | | |
| Without Waiver | | | | 1.66 | % | | | | | | | | | |
| With Waiver | | | | 1.42 | % | | | | | | | | | |
| Class C | | 6-Month | | | | | 1-Year | | | 3-Year | | | Inception (6/3/08) | |
| Cumulative Total Return2 | | -8.11 | % | | | | -7.92 | % | + | 72.90 | % | | -9.68 | % |
| Average Annual Total Return3 | | -9.02 | % | | | | -8.84 | % | + | 20.02 | % | | -2.74 | % |
| Value of $10,000 Investment4 | $ | 9,098 | | | | $ | 9,116 | | $ | 17,290 | | $ | 9,032 | |
| Avg. Ann. Total Return (12/31/11)5 | | | | | | | -13.45 | % | + | 15.49 | % | | -4.65 | % |
| Total Annual Operating Expenses6 | | | | | | | | | | | | | | |
| Without Waiver | | | | 2.44 | % | | | | | | | | | |
| With Waiver | | | | 2.20 | % | | | | | | | | | |
| Class R | | 6-Month | | | | | 1-Year | | | 3-Year | | | Inception (6/3/08) | |
| Cumulative Total Return2 | | -8.02 | % | | | | -7.55 | % | + | 75.56 | % | | -8.12 | % |
| Average Annual Total Return3 | | -8.02 | % | | | | -7.55 | % | + | 20.64 | % | | -2.29 | % |
| Value of $10,000 Investment4 | $ | 9,198 | | | | $ | 9,245 | | $ | 17,556 | | $ | 9,188 | |
| Avg. Ann. Total Return (12/31/11)5 | | | | | | | -12.20 | % | + | 16.03 | % | | -4.18 | % |
| Total Annual Operating Expenses6 | | | | | | | | | | | | | | |
| Without Waiver | | | | 1.94 | % | | | | | | | | | |
| With Waiver | | | | 1.70 | % | | | | | | | | | |
| Advisor Class | | 6-Month | | | | | 1-Year | | | 3-Year | | | Inception (6/3/08) | |
| Cumulative Total Return2 | | -7.73 | % | | | | -7.07 | % | + | 78.36 | % | | -6.31 | % |
| Average Annual Total Return3 | | -7.73 | % | | | | -7.07 | % | + | 21.27 | % | | -1.76 | % |
| Value of $10,000 Investment4 | $ | 9,227 | | | | $ | 9,293 | | $ | 17,836 | | $ | 9,369 | |
| Avg. Ann. Total Return (12/31/11)5 | | | | | | | -11.84 | % | + | 16.68 | % | | -3.68 | % |
| Total Annual Operating Expenses6 | | | | | | | | | | | | | | |
| Without Waiver | | | | 1.44 | % | | | | | | | | | |
| With Waiver | | | | 1.20 | % | | | | | | | | | |
Performance data represent past performance, which does not guarantee future results. Investment return and principal value will fluctuate, and you may have a gain or loss when you sell your shares. Current performance may differ from figures shown. For most recent month-end performance, go to franklintempleton.com or call (800) 342-5236.
The investment manager and administrator have contractually agreed to waive or assume certain expenses so that common expenses (excluding Rule 12b-1 fees and acquired fund fees and expenses) for each class of the Fund do not exceed 1.19% (other than certain nonroutine expenses) until 11/30/12.
Semiannual Report | 9
Performance Summary (continued)
Endnotes
All investments involve risks. Special risks are associated with foreign investing, including currency fluctuations, economic instability and political developments. Investments in developing markets involve heightened risks related to the same factors, in addition to those associated with these markets’ smaller size and lesser liquidity. The Fund is actively managed but there is no guarantee that the manager’s investment decisions will produce the desired results. The Fund’s prospectus also includes a description of the main investment risks.
Class C: These shares have higher annual fees and expenses than Class A shares.
Class R: Shares are available to certain eligible investors as described in the prospectus. These shares have higher annual fees and
expenses than Class A shares.
Advisor Class: Shares are available to certain eligible investors as described in the prospectus.
1. If the manager and administrator had not waived fees, the Fund’s total returns would have been lower. 2. Cumulative total return represents the change in value of an investment over the periods indicated.
3. Average annual total return represents the average annual change in value of an investment over the periods indicated. Six-month return has not been annualized.
4. These figures represent the value of a hypothetical $10,000 investment in the Fund over the periods indicated.
5. In accordance with SEC rules, we provide standardized average annual total return information through the latest calendar quarter.
6. Figures are as stated in the Fund’s prospectus current as of the date of this report. In periods of market volatility, assets may decline significantly, causing total annual Fund operating expenses to become higher than the figures shown.
10 | Semiannual Report
Your Fund’s Expenses
Franklin International Growth Fund
As a Fund shareholder, you can incur two types of costs:
- Transaction costs, including sales charges (loads) on Fund purchases; and
- Ongoing Fund costs, including management fees, distribution and service (12b-1) fees, and other Fund expenses. All mutual funds have ongoing costs, sometimes referred to as operating expenses.
The following table shows ongoing costs of investing in the Fund and can help you understand these costs and compare them with those of other mutual funds. The table assumes a $1,000 investment held for the six months indicated.
Actual Fund Expenses
The first line (Actual) for each share class listed in the table provides actual account values and expenses. The “Ending Account Value” is derived from the Fund’s actual return, which includes the effect of Fund expenses.
You can estimate the expenses you paid during the period by following these steps. Of course, your account value and expenses will differ from those in this illustration:
| 1. | Divide your account value by $1,000. |
| | If an account had an $8,600 value, then $8,600 ÷ $1,000 = 8.6. |
| 2. | Multiply the result by the number under the heading “Expenses Paid During Period.” |
| | If Expenses Paid During Period were $7.50, then 8.6 x $7.50 = $64.50. |
In this illustration, the estimated expenses paid this period are $64.50.
Hypothetical Example for Comparison with Other Funds
Information in the second line (Hypothetical) for each class in the table can help you compare ongoing costs of investing in the Fund with those of other mutual funds. This information may not be used to estimate the actual ending account balance or expenses you paid during the period. The hypothetical “Ending Account Value” is based on the actual expense ratio for each class and an assumed 5% annual rate of return before expenses, which does not represent the Fund’s actual return. The figure under the heading “Expenses Paid During Period” shows the hypothetical expenses your account would have incurred under this scenario. You can compare this figure with the 5% hypothetical examples that appear in shareholder reports of other funds.
Semiannual Report | 11
Your Fund’s Expenses (continued)
Please note that expenses shown in the table are meant to highlight ongoing costs and do not reflect any transaction costs, such as sales charges. Therefore, the second line for each class is useful in comparing ongoing costs only, and will not help you compare total costs of owning different funds. In addition, if transaction costs were included, your total costs would have been higher. Please refer to the Fund prospectus for additional information on operating expenses.
| | | | | | |
| | | Beginning Account | | Ending Account | | Expenses Paid During |
| Class A | | Value 8/1/11 | | Value 1/31/12 | | Period* 8/1/11–1/31/12 |
| Actual | $ | 1,000 | $ | 921.10 | $ | 7.15 |
| Hypothetical (5% return before expenses) | $ | 1,000 | $ | 1,017.70 | $ | 7.51 |
| Class C | | | | | | |
| Actual | $ | 1,000 | $ | 918.90 | $ | 10.42 |
| Hypothetical (5% return before expenses) | $ | 1,000 | $ | 1,014.28 | $ | 10.94 |
| Class R | | | | | | |
| Actual | $ | 1,000 | $ | 919.80 | $ | 8.01 |
| Hypothetical (5% return before expenses) | $ | 1,000 | $ | 1,016.79 | $ | 8.42 |
| Advisor Class | | | | | | |
| Actual | $ | 1,000 | $ | 922.70 | $ | 5.61 |
| Hypothetical (5% return before expenses) | $ | 1,000 | $ | 1,019.30 | $ | 5.89 |
*Expenses are calculated using the most recent six-month expense ratio, net of expense waivers, annualized for each class (A: 1.48%; C: 2.16%; R: 1.66%; and Advisor: 1.16%), multiplied by the average account value over the period, multiplied by 184/366 to reflect the one-half year period.
12 | Semiannual Report
Franklin International Small Cap Growth Fund
Your Fund’s Goal and Main Investments: The Fund seeks long-term capital appreciation by investing at least 80% of its net assets in a diversified portfolio of marketable equity and equity-related securities of smaller international companies with market capitalizations not exceeding $5 billion (or the equivalent in local currencies), or the highest market capitalization of the MSCI Europe, Australasia, Far East (EAFE) Small Cap Index, whichever is greater, at the time of purchase. The Fund considers international companies to be those organized under the laws of a country outside North America or having a principal office in a country outside North America, or whose securities are listed or traded principally on a recognized stock exchange or over-the-counter market outside North America.
Performance data represent past performance, which does not guarantee future results. Investment return and principal value will fluctuate, and you may have a gain or loss when you sell your shares. Current performance may differ from figures shown. Please visit franklintempleton.com or call (800) 342-5236 for most recent month-end performance.
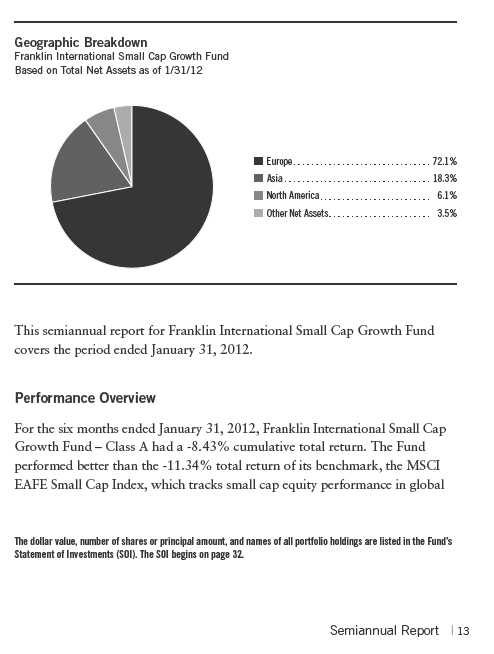
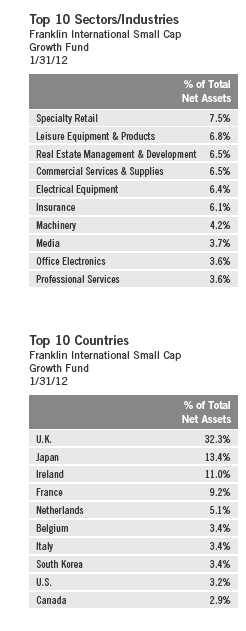
developed markets excluding the U.S. and Canada.1 You can find more of the Fund’s performance data in the Performance Summary beginning on page 17.
Investment Strategy
In choosing individual equity investments, we utilize a fundamental, bottom-up approach involving in-depth analysis of individual equity securities. We employ a quantitative and qualitative approach to identify smaller international companies that we believe have the potential to generate attractive returns with lower downside risk. Such companies tend to have proprietary products and services, which can sustain a longer term competitive advantage, and they tend to have a higher probability of maintaining a strong balance sheet and/or generating cash flow. After we identify a company, we conduct thorough analysis to establish its earning prospects and determine its value. Overall, we seek to invest in companies with attractive valuations.
We do not select investments for the Fund that are merely representative of the small cap asset class but instead aim to produce a portfolio of securities of exceptional companies operating in sectors that offer attractive growth potential. While we seek to outperform the MSCI EAFE Small Cap Index, the Fund may take positions that are not represented in the index.
Manager’s Discussion
Stock selection and allocations in several sectors benefited the Fund’s performance relative to the MSCI EAFE Small Cap Index during the six months under review. Fund holdings in the financials sector provided notable contributions to relative performance.2 Insurer Arch Capital Group,3 which provides insurance and reinsurance globally with a focus on specialty line insurance, and Fairfax Financial Holdings,3 a Canada-based provider of property and casualty insurance operating through subsidiaries including Odyssey Re and Northbridge Financial,3 were positive performers. In addition, real estate advisor and management firm Savills boosted Fund performance. Based in the U.K., Savills has more than 200 offices across the globe.
1. Source: © 2012 Morningstar. All Rights Reserved. The information contained herein: (1) is proprietary to Morningstar and/or its content providers; (2) may not be copied or distributed; and (3) is not warranted to be accurate, complete or timely. Neither Morningstar nor its content providers are responsible for any damages or losses arising from any use of this information. The index is unmanaged and includes reinvested dividends. One cannot invest directly in an index, and an index is not representative of the Fund’s portfolio.
2. The financials sector comprises capital markets, diversified financial services, insurance, and real estate management and development in the SOI.
3. This holding is not an index component.
14 | Semiannual Report
Machinery firms Rotork and Spirax-Sarco Engineering were leading contributors from the industrials sector.4 U.K.-based Rotork is a global leader in manufacturing valve actuators and control systems, gearboxes and accessories, and U.K.-based Spirax-Sarco Engineering manufactures control valves for steam heating, processing and packaging plants. Other key holdings included Aderans, a Japanese wig manufacturer and hair restoration services provider, and one of Japan’s leading advertising agencies, ASATSU-DK, which added to absolute and relative returns.
In contrast, two specialty retail firms were major detractors from the Fund’s absolute performance. Shares of Greece-based Jumbo, which produces toys, baby items and seasonal products, declined in value during the six-month period, as did British floor coverings retailer Carpetright. Also hindering returns was Sligro Food Group, a Dutch food and staples retailer operating 130 full-service supermarkets in addition to “cash and carry” and delivery services. Similarly, the Fund’s position in Irish cider and beer producer C&C Group weighed on absolute and relative performance.
From a regional perspective, stock selection in Asia and Europe, particularly in Japan and the U.K., helped boost relative performance. The Fund had small weightings in the U.S. and Canada that enhanced absolute performance. Stock selection in and an overweighted allocation to France and Belgium detracted from relative performance.
It is important to recognize the effect of currency movements on the Fund’s performance. In general, if the value of the U.S. dollar goes up compared with a foreign currency, an investment traded in that foreign currency will go down in value because it will be worth fewer U.S. dollars. This can have a negative effect on Fund performance. Conversely, when the U.S. dollar weakens in relation to a foreign currency, an investment traded in that foreign currency will increase in value, which can contribute to Fund performance. For the six months ended January 31, 2012, the U.S. dollar rose in value relative to most currencies. As a result, the Fund’s performance was negatively affected by the portfolio’s investment predominantly in securities with non-U.S. currency exposure.
4. The industrials sector comprises aerospace and defense, building products, commercial services and supplies, construction and engineering, electrical equipment, industrial conglomerates, machinery, marine, professional services, trading companies and distributors, and transportation infrastructure in the SOI.
Semiannual Report | 15
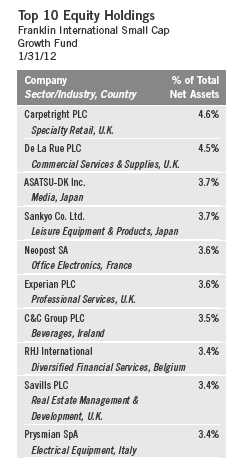
Thank you for your continued participation in Franklin International Small Cap Growth Fund. We look forward to serving your future investment needs.
The foregoing information reflects our analysis, opinions and portfolio holdings as of January 31, 2012, the end of the reporting period. The way we implement our main investment strategies and the resulting portfolio holdings may change depending on factors such as market and economic conditions. These opinions may not be relied upon as investment advice or an offer for a particular security. The information is not a complete analysis of every aspect of any market, country, industry, security or the Fund. Statements of fact are from sources considered reliable, but the investment manager makes no representation or warranty as to their completeness or accuracy. Although historical performance is no guarantee of future results, these insights may help you understand our investment management philosophy.
16 | Semiannual Report
Performance Summary as of 1/31/12
Franklin International Small Cap Growth Fund
Your dividend income will vary depending on dividends or interest paid by securities in the Fund’s portfolio, adjusted for operating expenses of each class. Capital gain distributions are net profits realized from the sale of portfolio securities. The performance table does not reflect any taxes that a shareholder would pay on Fund dividends, capital gain distributions, if any, or any realized gains on the sale of Fund shares. Total return reflects reinvestment of the Fund’s dividends and capital gain distributions, if any, and any unrealized gains or losses.
| | | | | | | | |
| Price and Distribution Information | | | | | | |
| |
| Class A (Symbol: FINAX) | | | | Change | | 1/31/12 | | 7/31/11 |
| Net Asset Value (NAV) | | | -$ | 2.13 | $ | 14.18 | $ | 16.31 |
| Distributions (8/1/11–1/31/12) | | | | | | | | |
| Dividend Income | $ | 0.1998 | | | | | | |
| Short–Term Capital Gain | $ | 0.1923 | | | | | | |
| Long–Term Capital Gain | $ | 0.3080 | | | | | | |
| Total | $ | 0.7001 | | | | | | |
| Class C (Symbol: FCSMX) | | | | Change | | 1/31/12 | | 7/31/11 |
| Net Asset Value (NAV) | | | -$ | 2.03 | $ | 14.10 | $ | 16.13 |
| Distributions (8/1/11–1/31/12) | | | | | | | | |
| Dividend Income | $ | 0.0702 | | | | | | |
| Short–Term Capital Gain | $ | 0.1923 | | | | | | |
| Long–Term Capital Gain | $ | 0.3080 | | | | | | |
| Total | $ | 0.5705 | | | | | | |
| Class R (Symbol: n/a) | | | | Change | | 1/31/12 | | 7/31/11 |
| Net Asset Value (NAV) | | | -$ | 2.12 | $ | 14.17 | $ | 16.29 |
| Distributions (8/1/11–1/31/12) | | | | | | | | |
| Dividend Income | $ | 0.1771 | | | | | | |
| Short–Term Capital Gain | $ | 0.1923 | | | | | | |
| Long–Term Capital Gain | $ | 0.3080 | | | | | | |
| Total | $ | 0.6774 | | | | | | |
| Advisor Class (Symbol: FKSCX) | | | | Change | | 1/31/12 | | 7/31/11 |
| Net Asset Value (NAV) | | | -$ | 2.16 | $ | 14.20 | $ | 16.36 |
| Distributions (8/1/11–1/31/12) | | | | | | | | |
| Dividend Income | $ | 0.2367 | | | | | | |
| Short–Term Capital Gain | $ | 0.1923 | | | | | | |
| Long–Term Capital Gain | $ | 0.3080 | | | | | | |
| Total | $ | 0.7370 | | | | | | |
Semiannual Report | 17
Performance Summary (continued)
Performance1
Cumulative total return excludes sales charges. Average annual total returns and value of $10,000 investment include maximum sales charges. Class A: 5.75% maximum initial sales charge; Class C: 1% contingent deferred sales charge in first year only; Class R/Advisor Class: no sales charges.
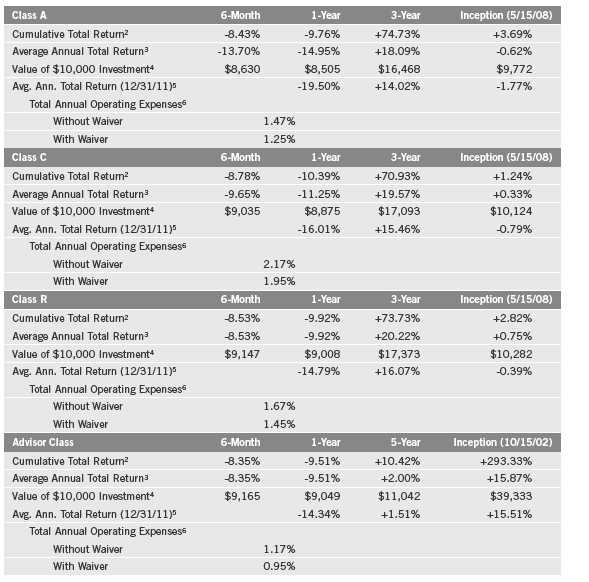
Performance data represent past performance, which does not guarantee future results. Investment return and principal value will fluctuate, and you may have a gain or loss when you sell your shares. Current performance may differ from figures shown. For most recent month-end performance, go to franklintempleton.com or call (800) 342-5236.
The investment manager and administrator have contractually agreed to waive or assume certain expenses so that common expenses (excluding Rule 12b-1 fees and acquired fund fees and expenses) for each class of the Fund do not exceed 0.95% (other than certain nonroutine expenses) until 11/30/12.
18 | Semiannual Report
Performance Summary (continued)
Endnotes
All investments involve risks. The Fund is intended for long-term investors who are comfortable with fluctuation in the value of their investment, especially over the short term. Smaller, relatively new and/or unseasoned companies can be particularly sensitive to changing economic conditions, and their prospects for growth are less certain than those of larger, more established companies. Foreign investing involves additional risks such as currency and market volatility, as well as political and social instability. Emerging markets involve heightened risks relating to the same factors. The Fund also invests in technology stocks, which can be highly volatile. The Fund is actively managed but there is no guarantee that the manager’s investment decisions will produce the desired results. The Fund’s prospectus also includes a description of the main investment risks.
| |
Class C: Class R: | These shares have higher annual fees and expenses than Class A shares. Shares are available to certain eligible investors as described in the prospectus. These shares have higher annual fees and expenses than Class A shares. |
Advisor Class: | Shares are available to certain eligible investors as described in the prospectus. |
1. If the manager and administrator had not waived fees, the Fund’s total returns would have been lower. 2. Cumulative total return represents the change in value of an investment over the periods indicated.
3. Average annual total return represents the average annual change in value of an investment over the periods indicated. Six-month return has not been annualized.
4. These figures represent the value of a hypothetical $10,000 investment in the Fund over the periods indicated.
5. In accordance with SEC rules, we provide standardized average annual total return information through the latest calendar quarter.
6. Figures are as stated in the Fund’s prospectus current as of the date of this report. In periods of market volatility, assets may decline significantly, causing total annual Fund operating expenses to become higher than the figures shown.
Semiannual Report | 19
Your Fund’s Expenses
Franklin International Small Cap Growth Fund
As a Fund shareholder, you can incur two types of costs:
- Transaction costs, including sales charges (loads) on Fund purchases; and
- Ongoing Fund costs, including management fees, distribution and service (12b-1) fees, and other Fund expenses. All mutual funds have ongoing costs, sometimes referred to as operating expenses.
The following table shows ongoing costs of investing in the Fund and can help you understand these costs and compare them with those of other mutual funds. The table assumes a $1,000 investment held for the six months indicated.
Actual Fund Expenses
The first line (Actual) for each share class listed in the table provides actual account values and expenses. The “Ending Account Value” is derived from the Fund’s actual return, which includes the effect of Fund expenses.
You can estimate the expenses you paid during the period by following these steps. Of course, your account value and expenses will differ from those in this illustration:
| 1. | Divide your account value by $1,000. |
| | If an account had an $8,600 value, then $8,600 ÷ $1,000 = 8.6. |
| 2. | Multiply the result by the number under the heading “Expenses Paid During Period.” |
| | If Expenses Paid During Period were $7.50, then 8.6 x $7.50 = $64.50. |
In this illustration, the estimated expenses paid this period are $64.50.
Hypothetical Example for Comparison with Other Funds
Information in the second line (Hypothetical) for each class in the table can help you compare ongoing costs of investing in the Fund with those of other mutual funds. This information may not be used to estimate the actual ending account balance or expenses you paid during the period. The hypothetical “Ending Account Value” is based on the actual expense ratio for each class and an assumed 5% annual rate of return before expenses, which does not represent the Fund’s actual return. The figure under the heading “Expenses Paid During Period” shows the hypothetical expenses your account would have incurred under this scenario. You can compare this figure with the 5% hypothetical examples that appear in shareholder reports of other funds.
20 | Semiannual Report
Your Fund’s Expenses (continued)
Please note that expenses shown in the table are meant to highlight ongoing costs and do not reflect any transaction costs, such as sales charges. Therefore, the second line for each class is useful in comparing ongoing costs only, and will not help you compare total costs of owning different funds. In addition, if transaction costs were included, your total costs would have been higher. Please refer to the Fund prospectus for additional information on operating expenses.
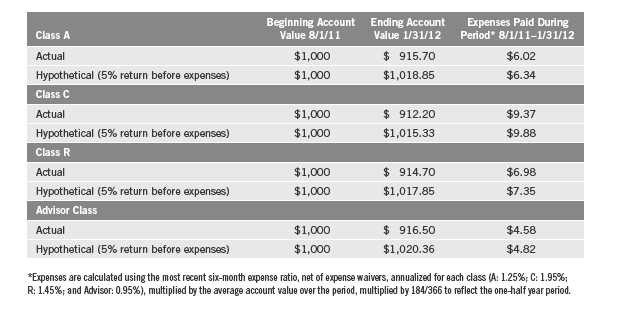
Semiannual Report | 21
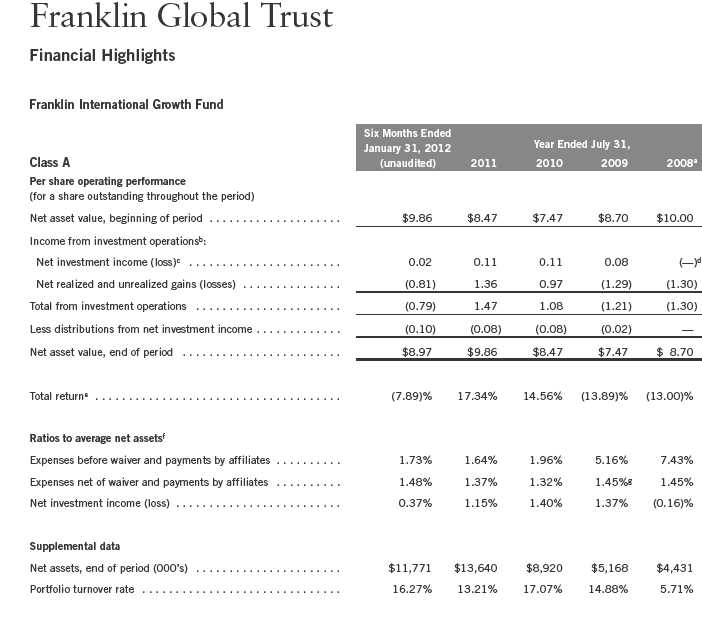
aFor the period June 3, 2008 (commencement of operations) to July 31, 2008.
bThe amount shown for a share outstanding throughout the period may not correlate with the Statement of Operations for the period due to the timing of sales and repurchases of
the Fund shares in relation to income earned and/or fluctuating market value of the investments of the Fund.
cBased on average daily shares outstanding.
dAmount rounds to less than $0.01 per share.
eTotal return does not reflect sales commissions or contingent deferred sales charges, if applicable, and is not annualized for periods less than one year.
fRatios are annualized for periods less than one year.
gBenefit of expense reduction rounds to less than 0.01%.
22 | The accompanying notes are an integral part of these financial statements. | Semiannual Report

aFor the period June 3, 2008 (commencement of operations) to July 31, 2008.
bThe amount shown for a share outstanding throughout the period may not correlate with the Statement of Operations for the period due to the timing of sales and repurchases of
the Fund shares in relation to income earned and/or fluctuating market value of the investments of the Fund.
cBased on average daily shares outstanding.
dTotal return does not reflect sales commissions or contingent deferred sales charges, if applicable, and is not annualized for periods less than one year.
eRatios are annualized for periods less than one year.
fBenefit of expense reduction rounds to less than 0.01%.
Semiannual Report | The accompanying notes are an integral part of these financial statements. | 23
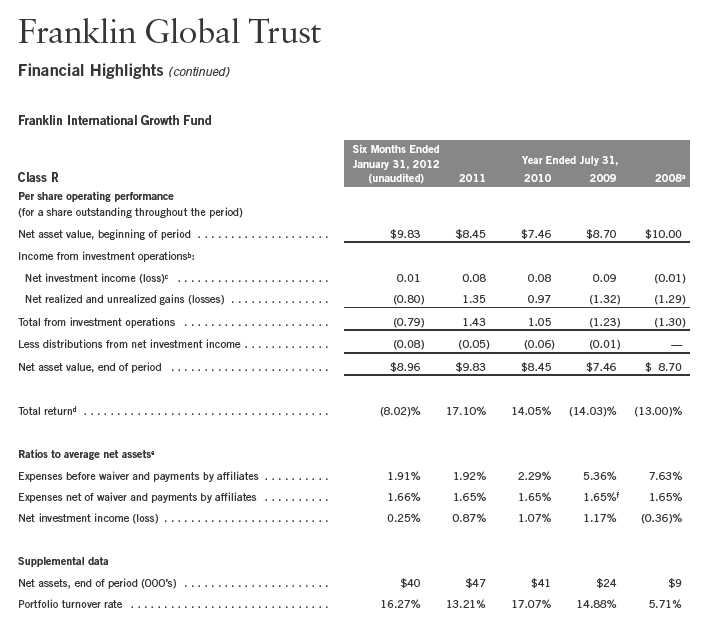
aFor the period June 3, 2008 (commencement of operations) to July 31, 2008.
bThe amount shown for a share outstanding throughout the period may not correlate with the Statement of Operations for the period due to the timing of sales and repurchases of
the Fund shares in relation to income earned and/or fluctuating market value of the investments of the Fund.
cBased on average daily shares outstanding.
dTotal return does not reflect sales commissions or contingent deferred sales charges, if applicable, and is not annualized for periods less than one year.
eRatios are annualized for periods less than one year.
fBenefit of expense reduction rounds to less than 0.01%.
24 | The accompanying notes are an integral part of these financial statements. | Semiannual Report
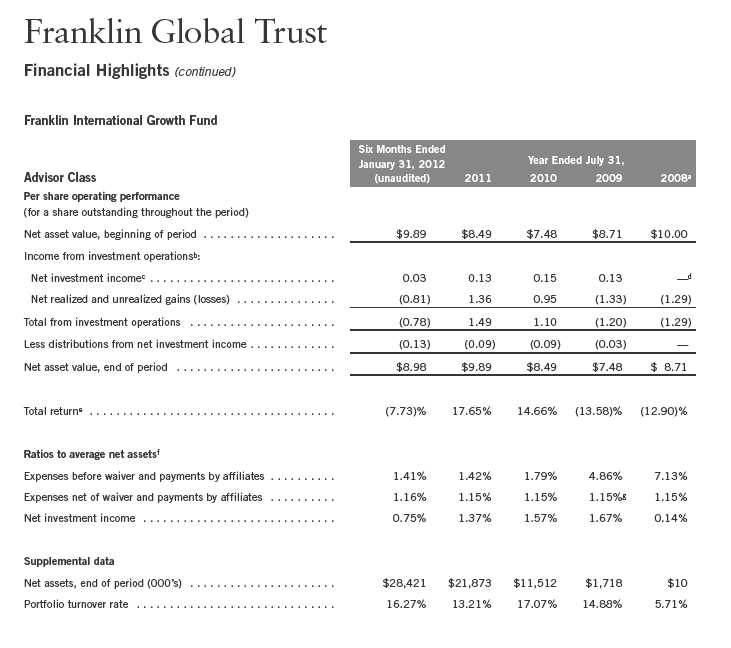
aFor the period June 3, 2008 (commencement of operations) to July 31, 2008.
bThe amount shown for a share outstanding throughout the period may not correlate with the Statement of Operations for the period due to the timing of sales and repurchases of
the Fund shares in relation to income earned and/or fluctuating market value of the investments of the Fund.
cBased on average daily shares outstanding.
dAmount rounds to less than $0.01 per share.
eTotal return is not annualized for periods less than one year.
fRatios are annualized for periods less than one year.
gBenefit of expense reduction rounds to less than 0.01%.
Semiannual Report | The accompanying notes are an integral part of these financial statements. | 25
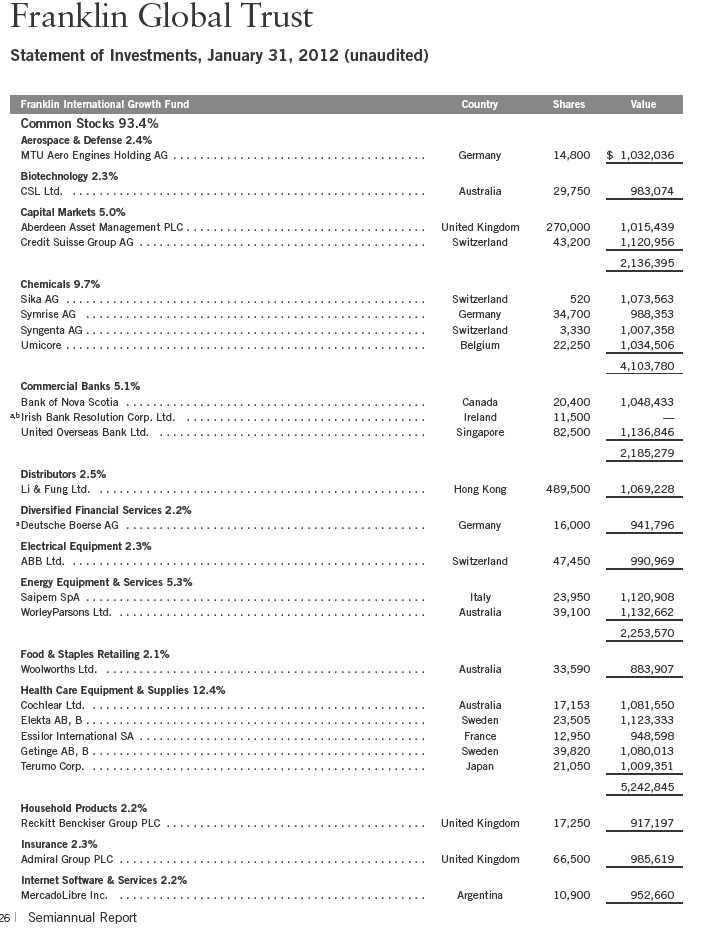
Franklin Global Trust
Statement of Investments, January 31, 2012 (unaudited) (continued)

| | |
| See Abbreviations on page 49. | | |
| |
| aNon-income producing. | | |
| bSecurity has been deemed illiquid because it may not be able to be sold within seven days. | | |
| cSee Note 7 regarding investments in the Institutional Fiduciary Trust Money Market Portfolio. | | |
| |
| Semiannual Report | The accompanying notes are an integral part of these financial statements. | | | 27 |

aFor the period May 15, 2008 (effective date) to July 31, 2008.
bThe amount shown for a share outstanding throughout the period may not correlate with the Statement of Operations for the period due to the timing of sales and repurchases of
the Fund shares in relation to income earned and/or fluctuating market value of the investments of the Fund.
cBased on average daily shares outstanding.
dEffective September 1, 2008, the redemption fee was eliminated.
eAmount rounds to less than $0.01 per share.
fTotal return does not reflect sales commissions or contingent deferred sales charges, if applicable, and is not annualized for periods less than one year.
gRatios are annualized for periods less than one year.
hBenefit of expense reduction rounds to less than 0.01%.
28 | The accompanying notes are an integral part of these financial statements. | Semiannual Report
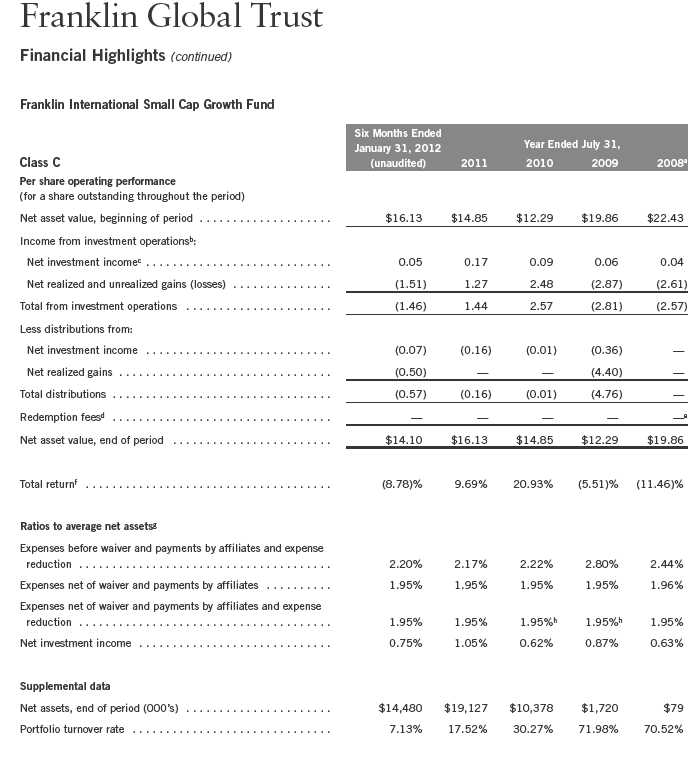
aFor the period May 15, 2008 (effective date) to July 31, 2008.
bThe amount shown for a share outstanding throughout the period may not correlate with the Statement of Operations for the period due to the timing of sales and repurchases of
the Fund shares in relation to income earned and/or fluctuating market value of the investments of the Fund.
cBased on average daily shares outstanding.
dEffective September 1, 2008, the redemption fee was eliminated.
eAmount rounds to less than $0.01 per share.
fTotal return does not reflect sales commissions or contingent deferred sales charges, if applicable, and is not annualized for periods less than one year.
gRatios are annualized for periods less than one year.
hBenefit of expense reduction rounds to less than 0.01%.
Semiannual Report | The accompanying notes are an integral part of these financial statements. | 29
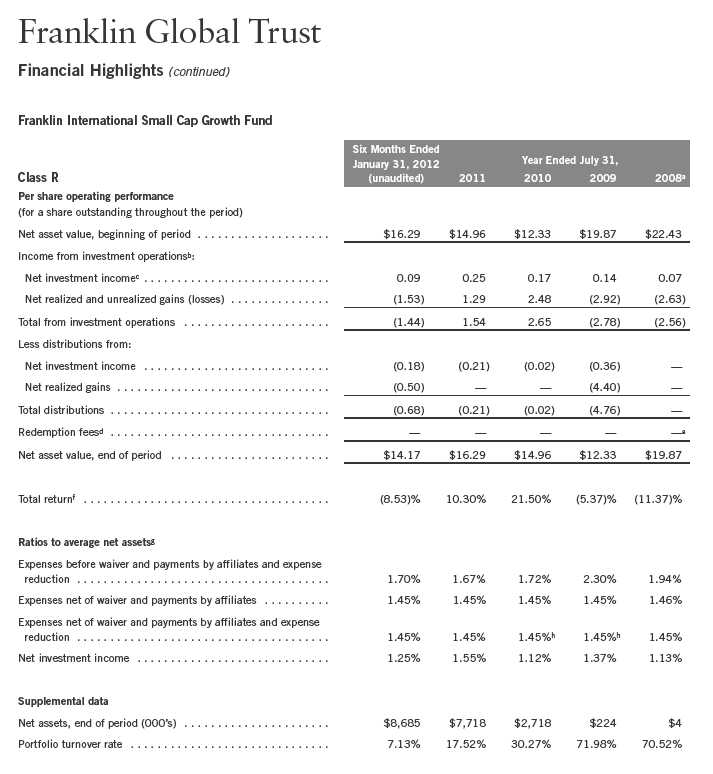
aFor the period May 15, 2008 (effective date) to July 31, 2008.
bThe amount shown for a share outstanding throughout the period may not correlate with the Statement of Operations for the period due to the timing of sales and repurchases of
the Fund shares in relation to income earned and/or fluctuating market value of the investments of the Fund.
cBased on average daily shares outstanding.
dEffective September 1, 2008, the redemption fee was eliminated.
eAmount rounds to less than $0.01 per share.
fTotal return does not reflect sales commissions or contingent deferred sales charges, if applicable, and is not annualized for periods less than one year.
gRatios are annualized for periods less than one year.
hBenefit of expense reduction rounds to less than 0.01%.
30 | The accompanying notes are an integral part of these financial statements. | Semiannual Report
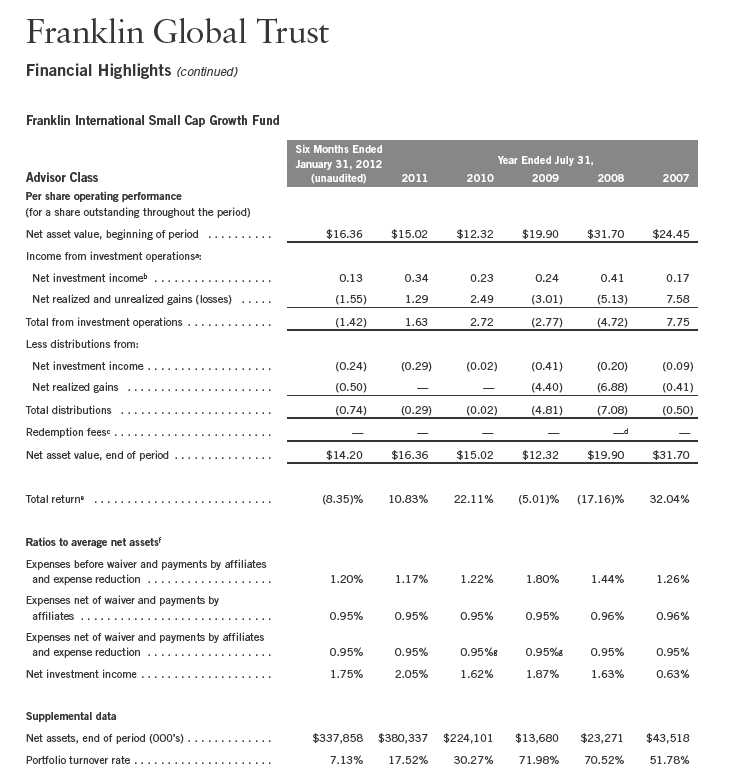
aThe amount shown for a share outstanding throughout the period may not correlate with the Statement of Operations for the period due to the timing of sales and repurchases of
the Fund shares in relation to income earned and/or fluctuating market value of the investments of the Fund.
bBased on average daily shares outstanding.
cEffective September 1, 2008, the redemption fee was eliminated.
dAmount rounds to less than $0.01 per share.
eTotal return is not annualized for periods less than one year.
fRatios are annualized for periods less than one year.
gBenefit of expense reduction rounds to less than 0.01%.
Semiannual Report | The accompanying notes are an integral part of these financial statements. | 31

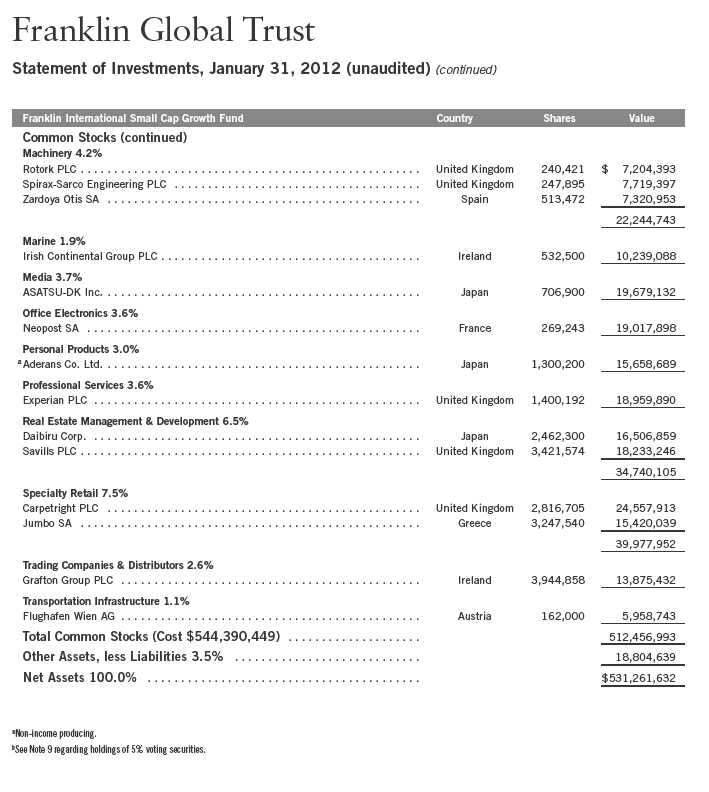
Semiannual Report | The accompanying notes are an integral part of these financial statements. | 33
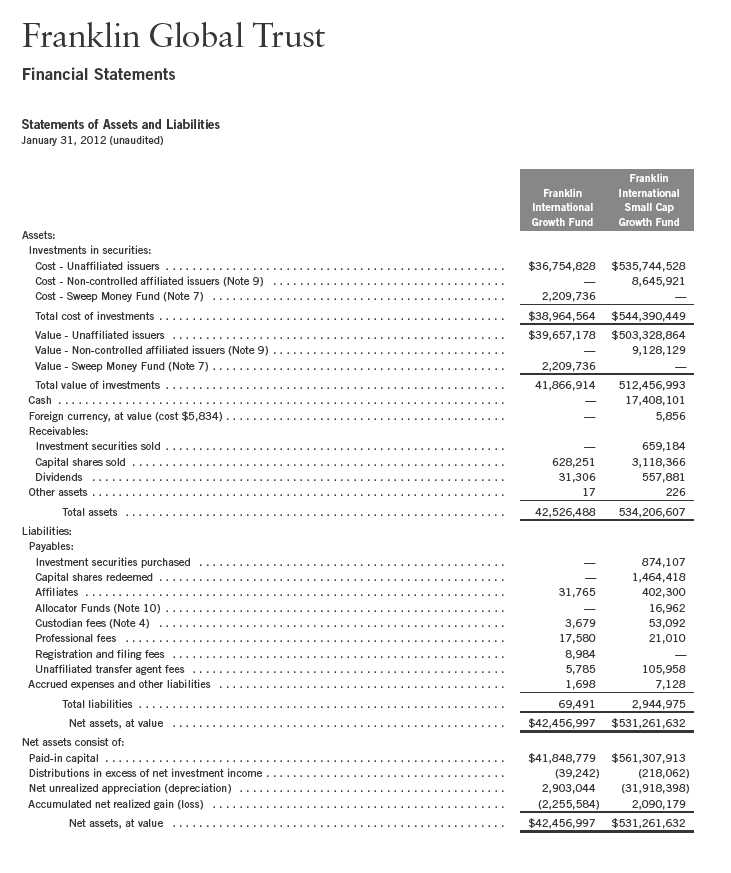
34 | The accompanying notes are an integral part of these financial statements. | Semiannual Report
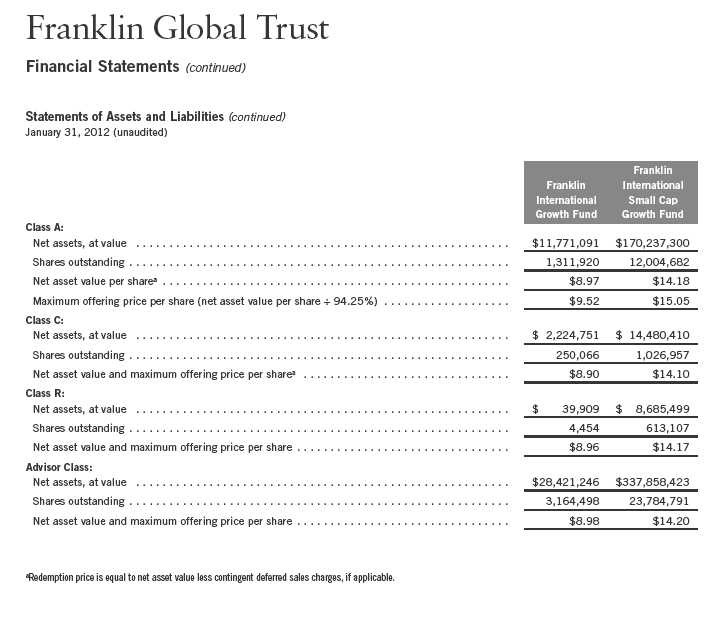
Semiannual Report | The accompanying notes are an integral part of these financial statements. | 35
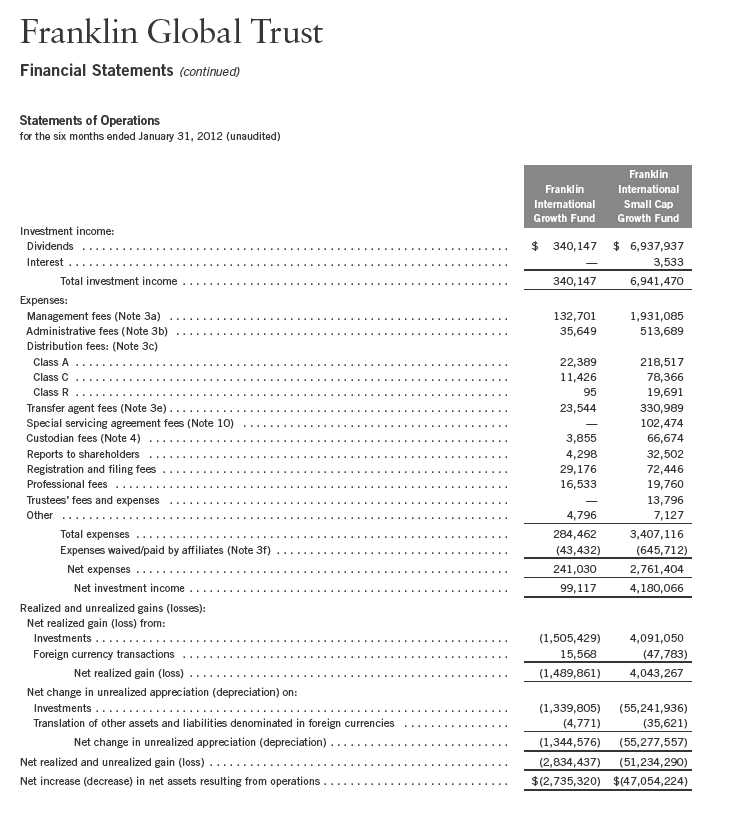
36 | The accompanying notes are an integral part of these financial statements. | Semiannual Report
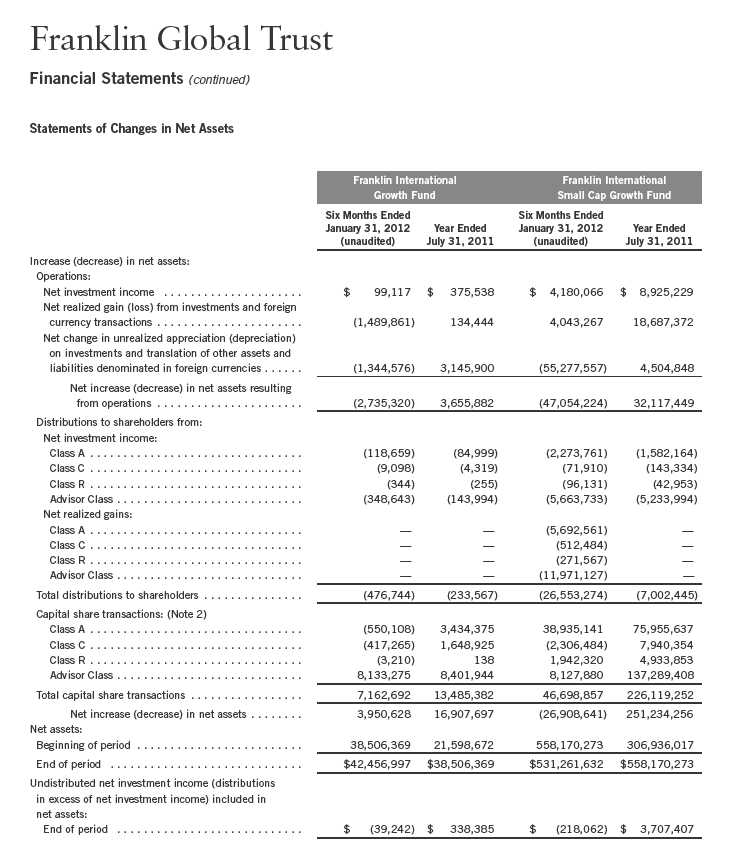
Semiannual Report | The accompanying notes are an integral part of these financial statements. | 37
Franklin Global Trust
Notes to Financial Statements (unaudited)
1. ORGANIZATION AND SIGNIFICANT ACCOUNTING POLICIES
Franklin Global Trust (Trust) is registered under the Investment Company Act of 1940, as amended, (1940 Act) as an open-end investment company, consisting of five separate funds, two of which are included in this report (Funds). The financial statements of the remaining funds in the Trust are presented separately. The Funds offer four classes of shares: Class A, Class C, Class R, and Advisor Class. Each class of shares differs by its initial sales load, contingent deferred sales charges, distribution fees, voting rights on matters affecting a single class and its exchange privilege.
The following summarizes the Funds’ significant accounting policies.
a. Financial Instrument Valuation
The Funds’ investments in securities and other financial instruments are carried at fair value daily. Fair value is the price that would be received to sell an asset or paid to transfer a liability in an orderly transaction between market participants on the measurement date. Under procedures approved by the Trust’s Board of Trustees, the Funds may utilize independent pricing services, quotations from securities and financial instrument dealers, and other market sources to determine fair value.
Equity securities listed on an exchange or on the NASDAQ National Market System are valued at the last quoted sale price or the official closing price of the day, respectively. Foreign equity securities are valued as of the close of trading on the foreign stock exchange on which the security is primarily traded, or the NYSE, whichever is earlier. The value is then converted into its U.S. dollar equivalent at the foreign exchange rate in effect at the close of the NYSE on the day that the value of the security is determined. Over-the-counter securities are valued within the range of the most recent quoted bid and ask prices. Securities that trade in multiple markets or on multiple exchanges are valued according to the broadest and most representative market. Certain equity securities are valued based upon fundamental characteristics or relationships to similar securities. Investments in open-end mutual funds are valued at the closing net asset value.
The Funds have procedures to determine the fair value of securities and other financial instruments for which market prices are not readily available or which may not be reliably priced. Under these procedures, the Funds primarily employ a market-based approach which may use related or comparable assets or liabilities, recent transactions, market multiples, book values, and other relevant information for the investment to determine the fair value of the investment. The Funds may also use an income-based valuation approach in which the anticipated future cash flows of the investment are discounted to calculate fair value. Discounts may also be applied due to the nature or duration of any restrictions on the disposition of the investments. Due to the inherent uncertainty of valuations of such investments, the fair values may differ significantly from the values that would have been used had an active market existed.
38 | Semiannual Report
Franklin Global Trust
Notes to Financial Statements (unaudited) (continued)
| 1. | ORGANIZATION AND SIGNIFICANT ACCOUNTING POLICIES (continued) |
| a. | Financial Instrument Valuation (continued) |
Trading in securities on foreign securities stock exchanges and over-the-counter markets may be completed before the daily close of business on the NYSE. Occasionally, events occur between the time at which trading in a foreign security is completed and the close of the NYSE that might call into question the reliability of the value of a portfolio security held by the fund. As a result, differences may arise between the value of the Funds’ portfolio securities as determined at the foreign market close and the latest indications of value at the close of the NYSE. In order to minimize the potential for these differences, the investment manager monitors price movements following the close of trading in foreign stock markets through a series of country specific market proxies (such as baskets of American Depositary Receipts, futures contracts and exchange traded funds). These price movements are measured against established trigger thresholds for each specific market proxy to assist in determining if an event has occurred that may call into question the reliability of the values of the foreign securities held by the Funds. If such an event occurs, the securities may be valued using fair value procedures, which may include the use of independent pricing services.
b. Foreign Currency Translation
Portfolio securities and other assets and liabilities denominated in foreign currencies are translated into U.S. dollars based on the exchange rate of such currencies against U.S. dollars on the date of valuation. The Funds may enter into foreign currency exchange contracts to facilitate transactions denominated in a foreign currency. Purchases and sales of securities, income and expense items denominated in foreign currencies are translated into U.S. dollars at the exchange rate in effect on the transaction date. Portfolio securities and assets and liabilities denominated in foreign currencies contain risks that those currencies will decline in value relative to the U.S. dollar. Occasionally, events may impact the availability or reliability of foreign exchange rates used to convert the U.S. dollar equivalent value. If such an event occurs, the foreign exchange rate will be valued at fair value using procedures established and approved by the Trust’s Board of Trustees.
The Funds do not separately report the effect of changes in foreign exchange rates from changes in market prices on securities held. Such changes are included in net realized and unrealized gain or loss from investments on the Statement of Operations.
Realized foreign exchange gains or losses arise from sales of foreign currencies, currency gains or losses realized between the trade and settlement dates on securities transactions and the difference between the recorded amounts of dividends, interest, and foreign withholding taxes and the U.S. dollar equivalent of the amounts actually received or paid. Net unrealized foreign exchange gains and losses arise from changes in foreign exchange rates on foreign denominated assets and liabilities other than investments in securities held at the end of the reporting period.
Semiannual Report | 39
Franklin Global Trust
Notes to Financial Statements (unaudited) (continued)
| 1. | ORGANIZATION AND SIGNIFICANT ACCOUNTING POLICIES (continued) |
| c. | Income Taxes |
It is each fund’s policy to qualify as a regulated investment company under the Internal Revenue Code. Each fund intends to distribute to shareholders substantially all of its taxable income and net realized gains to relieve it from federal income and excise taxes. As a result, no provision for U.S. federal income taxes is required.
The Funds may be subject to foreign taxation related to income received, capital gains on the sale of securities and certain foreign currency transactions in the foreign jurisdictions in which it invests. Foreign taxes, if any, are recorded based on the tax regulations and rates that exist in the foreign markets in which the Funds invest. When a capital gain tax is determined to apply the Funds record an estimated deferred tax liability in an amount that would be payable if the securities were disposed of on the valuation date.
Each fund recognizes the tax benefits of uncertain tax positions only when the position is “more likely than not” to be sustained upon examination by the tax authorities based on the technical merits of the tax position. As of January 31, 2012, and for all open tax years, each fund has determined that no liability for unrecognized tax benefits is required in each fund’s financial statements related to uncertain tax positions taken on a tax return (or expected to be taken on future tax returns). Open tax years are those that remain subject to examination and are based on each tax jurisdiction statute of limitation.
d. Security Transactions, Investment Income, Expenses and Distributions
Security transactions are accounted for on trade date. Realized gains and losses on security transactions are determined on a specific identification basis. Interest income and estimated expenses are accrued daily. Dividend income is recorded on the ex-dividend date except that certain dividends from foreign securities are recognized as soon as the Funds are notified of the ex-dividend date. Distributions to shareholders are recorded on the ex-dividend date and are determined according to income tax regulations (tax basis). Distributable earnings determined on a tax basis may differ from earnings recorded in accordance with accounting principles generally accepted in the United States of America. These differences may be permanent or temporary. Permanent differences are reclassified among capital accounts to reflect their tax character. These reclassifications have no impact on net assets or the results of operations. Temporary differences are not reclassified, as they may reverse in subsequent periods.
Common expenses incurred by the Trust are allocated among the funds based on the ratio of net assets of each fund to the combined net assets of the Trust. Fund specific expenses are charged directly to the fund that incurred the expense.
40 | Semiannual Report
Franklin Global Trust
Notes to Financial Statements (unaudited) (continued)
| 1. | ORGANIZATION AND SIGNIFICANT ACCOUNTING POLICIES (continued) |
| d. | Security Transactions, Investment Income, Expenses and Distributions (continued) |
Realized and unrealized gains and losses and net investment income, not including class specific expenses, are allocated daily to each class of shares based upon the relative proportion of net assets of each class. Differences in per share distributions, by class, are generally due to differences in class specific expenses.
e. Accounting Estimates
The preparation of financial statements in accordance with accounting principles generally accepted in the United States of America requires management to make estimates and assumptions that affect the reported amounts of assets and liabilities at the date of the financial statements and the amounts of income and expenses during the reporting period. Actual results could differ from those estimates.
f. Guarantees and Indemnifications
Under the Trust’s organizational documents, its officers and trustees are indemnified by the Trust against certain liabilities arising out of the performance of their duties to the Trust. Additionally, in the normal course of business, the Trust, on behalf of the Funds, enters into contracts with service providers that contain general indemnification clauses. The Trust’s maximum exposure under these arrangements is unknown as this would involve future claims that may be made against the Trust that have not yet occurred. Currently, the Trust expects the risk of loss to be remote.
2. SHARES OF BENEFICIAL INTEREST
At January 31, 2012, there were an unlimited number of shares authorized (without par value).
Transactions in the Funds’ shares were as follows:
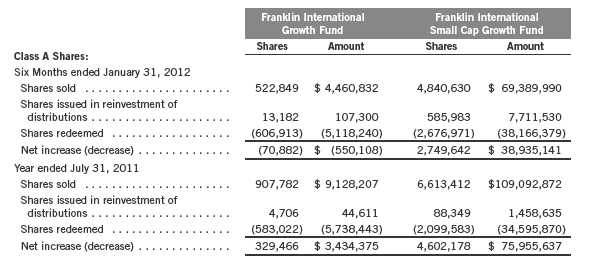
Semiannual Report | 41

42 | Semiannual Report
Franklin Global Trust
Notes to Financial Statements (unaudited) (continued)
3. TRANSACTIONS WITH AFFILIATES
Franklin Resources, Inc. is the holding company for various subsidiaries that together are referred to as Franklin Templeton Investments. Certain officers and trustees of the Trust are also officers and/or directors of the following subsidiaries:
| |
| Subsidiary | Affiliation |
| Franklin Advisers, Inc. (Advisers) | Investment manager |
| Franklin Templeton Institutional, LLC (FT Institutional) | Investment manager |
| Franklin Templeton Services, LLC (FT Services) | Administrative manager |
| Franklin Templeton Distributors, Inc. (Distributors) | Principal underwriter |
| Franklin Templeton Investor Services, LLC (Investor Services) | Transfer agent |
a. Management Fees
The Franklin International Growth Fund pays an investment management fee to FT Institutional based on the average daily net assets of the fund as follows:
| | |
| Annualized Fee Rate | | Net Assets |
| 0.750 | % | Up to and including $500 million |
| 0.650 | % | Over $500 million, up to and including $1 billion |
| 0.600 | % | Over $1 billion, up to and including $1.5 billion |
| 0.550 | % | Over $1.5 billion, up to and including $6.5 billion |
| 0.525 | % | Over $6.5 billion, up to and including $11.5 billion |
| 0.500 | % | Over $11.5 billion, up to and including $16.5 billion |
| 0.490 | % | Over $16.5 billion, up to and including $19 billion |
| 0.480 | % | Over $19 billion, up to and including $21.5 billion |
| 0.470 | % | In excess of $21.5 billion |
The Franklin International Small Cap Growth Fund pays an investment management fee to Advisers of 0.75% per year of the average daily net assets of the fund.
Under a subadvisory agreement, FT Institutional, an affiliate of Advisers, provides subadvisory services to the Franklin International Small Cap Growth Fund. The subadvisory fee is paid by Advisers based on the average daily net assets, and is not an additional expense of the fund.
b. Administrative Fees
The Funds pay an administrative fee to FT Services of 0.20% per year of the average daily net assets of each of the Funds.
c. Distribution Fees
The Trust’s Board of Trustees has adopted distribution plans for each share class, with the exception of Advisor Class shares, pursuant to Rule 12b-1 under the 1940 Act. Under the Funds’ Class A reimbursement distribution plans, the Funds reimburse Distributors for costs incurred in connection with the servicing, sale and distribution of the Funds’ shares up to the maximum annual plan rate. Under the Class A reimbursement distribution plans, costs exceeding the maximum for the current plan year cannot be reimbursed in subsequent periods.
Semiannual Report | 43
Franklin Global Trust
Notes to Financial Statements (unaudited) (continued)
| 3. | TRANSACTIONS WITH AFFILIATES (continued) |
| c. | Distribution Fees (continued) |
In addition, under the Funds’ Class C and R compensation distribution plans, the Funds pay Distributors for costs incurred in connection with the servicing, sale and distribution of each fund’s shares up to the maximum annual plan rate for each class.
The maximum annual plan rates, based on the average daily net assets, for each class, are as follows:
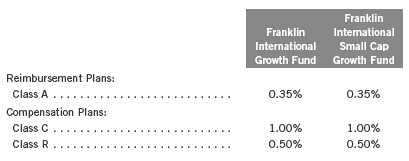
The Board of Trustees has set the current rate at 0.30% per year for Class A shares until further notice and approval by the Board.
d. Sales Charges/Underwriting Agreements
Front-end sales charges and contingent deferred sales charges (CDSC) do not represent expenses of the Funds. These charges are deducted from the proceeds of sales of fund shares prior to investment or from redemption proceeds prior to remittance, as applicable. Distributors has advised the Funds of the following commission transactions related to the sales and redemptions of the Funds’ shares for the period:
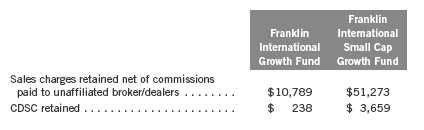
e. Transfer Agent Fees
For the period ended January 31, 2012, the Funds paid transfer agent fees as noted in the Statements of Operations of which the following amounts were retained by Investor Services:
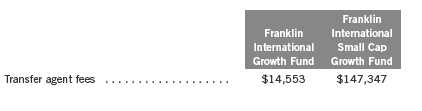
44 | Semiannual Report
Franklin Global Trust
Notes to Financial Statements (unaudited) (continued)
| 3. | TRANSACTIONS WITH AFFILIATES (continued) |
| f. | Waiver and Expense Reimbursements |
Advisers, FT Institutional, and FT Services have contractually agreed in advance to waive or limit their respective fees and to assume as their own expense certain expenses otherwise payable by the Franklin International Growth Fund and the Franklin International Small Cap Growth Fund so that the common expenses (i.e. a combination of management fees, administrative fees, and other expenses, but excluding distribution fees, and acquired fund fees and expenses) for each class of the funds do not exceed 1.19% and 0.95%, respectively (other than certain non-routine expenses or costs, including those relating to litigation, indemnification, reorganizations, and liquidations) until November 30, 2012.
4. EXPENSE OFFSET ARRANGEMENT
The Funds have entered into an arrangement with their custodian whereby credits realized as a result of uninvested cash balances are used to reduce a portion of the Funds’ custodian expenses. During the period ended January 31, 2012, there were no credits earned.
5. INCOME TAXES
For tax purposes, capital losses may be carried over to offset future capital gains, if any.
At July 31, 2011, the capital loss carryforwards were as follows:

Under the Regulated Investment Company Modernization Act of 2010, the Funds will be permitted to carry forward capital losses incurred in taxable years beginning after December 22, 2010 for an unlimited period. Post-enactment capital loss carryforwards will retain their character as either short-term or long-term capital losses rather than being considered short-term as under previous law. Any post-enactment capital losses generated will be required to be utilized prior to the losses incurred in pre-enactment tax years.
For tax purposes, realized capital losses occurring subsequent to October 31 may be deferred and treated as occurring on the first day of the following fiscal year. At July 31, 2011, the Franklin International Growth deferred realized capital losses $98,371.
Semiannual Report | 45
Franklin Global Trust
Notes to Financial Statements (unaudited) (continued)
5. INCOME TAXES (continued)
At January 31, 2012, the cost of investments and net unrealized appreciation (depreciation) for income tax purposes were as follows:
| | | | | | |
| | | | | | Franklin | |
| | | Franklin | | | International | |
| | | International | | | Small Cap | |
| | | Growth Fund | | | Growth Fund | |
| Cost of investments | $ | 39,097,468 | | $ | 544,920,351 | |
| |
| Unrealized appreciation | $ | 4,472,192 | | $ | 36,313,938 | |
| Unrealized depreciation | | (1,702,746 | ) | | (68,777,296 | ) |
| Net unrealized appreciation (depreciation) | $ | 2,769,446 | | $ | (32,463,358 | ) |
Differences between income and/or capital gains as determined on a book basis and a tax basis are primarily due to differing treatments of foreign currency transactions and wash sales.
6. INVESTMENT TRANSACTIONS
Purchases and sales of investments (excluding short term securities) for the period ended January 31, 2012, were as follows:
| | | | |
| | | | | Franklin |
| | | Franklin | | International |
| | | International | | Small Cap |
| | | Growth Fund | | Growth Fund |
| Purchases | $ | 8,781,171 | $ | 89,715,073 |
| Sales | $ | 5,701,027 | $ | 35,253,300 |
7. INVESTMENTS IN INSTITUTIONAL FIDUCIARY TRUST MONEY MARKET PORTFOLIO
The Franklin International Growth Fund invests in the Institutional Fiduciary Trust Money Market Portfolio (Sweep Money Fund), an open-end investment company managed by Advisers. Management fees paid by the fund are reduced on assets invested in the Sweep Money Fund, in an amount not to exceed the management and administrative fees paid by the Sweep Money Fund.
8. CONCENTRATION OF RISK
Investing in foreign securities may include certain risks and considerations not typically associated with investing in U.S. securities, such as fluctuating currency values and changing local and regional economic, political and social conditions, which may result in greater market volatility. In addition, certain foreign securities may not be as liquid as U.S. securities.
46 | Semiannual Report
Franklin Global Trust
Notes to Financial Statements (unaudited) (continued)
9. HOLDINGS OF 5% VOTING SECURITIES OF PORTFOLIO COMPANIES
The 1940 Act defines “affiliated companies” to include investments in portfolio companies in which a fund owns 5% or more of the outstanding voting securities. Investments in “affiliated companies” for the Franklin International Small Cap Growth Fund for the period ended January 31, 2012, were as shown below.
| | | | | | | | |
| | Number of | | | Number of | | | | |
| | Shares Held | | | Shares Held | | Value | | Realized |
| | at Beginning | Gross | Gross | at End | | at End | Investment | Capital |
| Name of Issuer | of Period | Additions | Reductions | of Period | | of Period | Income | Gain (Loss) |
| |
| Non-Controlled Affiliates | | | | | | | | |
| Optimal Payments PLC | | | | | | | | |
| (1.72% of Net Assets) | 9,194,170 | — | — | 9,194,170 | $ | 9,128,129 | $ — | $ — |
10. SPECIAL SERVICING AGREEMENT
The Franklin International Small Cap Growth Fund, which is an eligible underlying investment of one or more of the Franklin Templeton Fund Allocator Series Funds (Allocator Funds), participates in a Special Servicing Agreement (SSA) with the Allocator Funds and certain service providers of the fund and the Allocator Funds. Under the SSA, the fund may pay a portion of the Allocator Funds’ expenses (other than any asset allocation, administrative, and distribution fees) to the extent such payments are less than the amount of the benefits realized or expected to be realized by the fund (e.g., due to reduced costs associated with servicing accounts) from the investment in the fund by the Allocator Funds. The Allocator Funds are either managed by Advisers or administered by FT Services. For the period ended January 31, 2012, the fund was held by one or more of the Allocator Funds and the amount of expenses borne by the fund is noted in the Statement of Operations. At January 31, 2012, 23.07% of the fund’s outstanding shares was held by one or more of the Allocator Funds.
11. CREDIT FACILITY
The Funds, together with other U.S. registered and foreign investment funds (collectively, Borrowers), managed by Franklin Templeton Investments, are borrowers in a joint syndicated senior unsecured credit facility totaling $1.5 billion (Global Credit Facility) which matures on January 18, 2013. This Global Credit Facility provides a source of funds to the Borrowers for temporary and emergency purposes, including the ability to meet future unanticipated or unusually large redemption requests.
Under the terms of the Global Credit Facility, the Funds shall, in addition to interest charged on any borrowings made by the Funds and other costs incurred by the Funds, pay their share of fees and expenses incurred in connection with the implementation and maintenance of the Global Credit Facility, based upon its relative share of the aggregate net assets of all of the
Semiannual Report | 47
Franklin Global Trust
Notes to Financial Statements (unaudited) (continued)
11. CREDIT FACILITY (continued)
Borrowers, including an annual commitment fee of 0.08% based upon the unused portion of the Global Credit Facility, which is reflected in other expenses on the Statements of Operations. During the period ended January 31, 2012, the Funds did not use the Global Credit Facility.
12. FAIR VALUE MEASUREMENTS
The Funds follow a fair value hierarchy that distinguishes between market data obtained from independent sources (observable inputs) and the Funds’ own market assumptions (unobservable inputs). These inputs are used in determining the value of the Funds’ investments and are summarized in the following fair value hierarchy:
- Level 1 – quoted prices in active markets for identical securities
- Level 2 – other significant observable inputs (including quoted prices for similar securities, interest rates, prepayment speed, credit risk, etc.)
- Level 3 – significant unobservable inputs (including the Funds’ own assumptions in determining the fair value of investments)
The inputs or methodology used for valuing securities are not an indication of the risk associated with investing in those securities.
For movements between the levels within the fair value hierarchy, the Funds have adopted a policy of recognizing the transfers as of the date of the underlying event which caused the movement.
The following is a summary of the inputs used as of January 31, 2012, in valuing the Funds’ assets and liabilities carried at fair value:
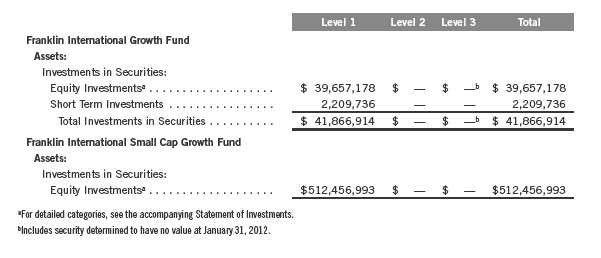
48 | Semiannual Report
Franklin Global Trust
Notes to Financial Statements (unaudited) (continued)
13. NEW ACCOUNTING PRONOUNCEMENTS
In May 2011, the Financial Accounting Standards Board (FASB) issued Accounting Standards Update (ASU) No. 2011-04, Fair Value Measurement (Topic 820): Amendments to Achieve Common Fair Value Measurement and Disclosure Requirements in U.S. GAAP and IFRSs. The amendments in the ASU will improve the comparability of fair value measurements presented and disclosed in financial statements prepared in accordance with U.S. GAAP (Generally Accepted Accounting Principles) and IFRS (International Financial Reporting Standards) and include new guidance for certain fair value measurement principles and disclosure requirements. The ASU is effective for interim and annual periods beginning after December 15, 2011. The Funds believe the adoption of this ASU will not have a material impact on their financial statements.
14. SUBSEQUENT EVENTS
The Funds have evaluated subsequent events through the issuance of the financial statements and determined that no events have occurred that require disclosure.
ABBREVIATIONS
Selected Portfolio
ADR - American Depositary Receipt
Semiannual Report | 49
Franklin Global Trust
Shareholder Information
Proxy Voting Policies and Procedures
The Trust’s investment manager has established Proxy Voting Policies and Procedures (Policies) that the Trust uses to determine how to vote proxies relating to portfolio securities. Shareholders may view the Trust’s complete Policies online at franklintempleton.com. Alternatively, shareholders may request copies of the Policies free of charge by calling the Proxy Group collect at (954) 527-7678 or by sending a written request to: Franklin Templeton Companies, LLC, 300 S.E. 2nd Street, Fort Lauderdale, FL 33394, Attention: Proxy Group. Copies of the Trust’s proxy voting records are also made available online at franklintempleton.com and posted on the U.S. Securities and Exchange Commission’s website at sec.gov and reflect the most recent 12-month period ended June 30.
Quarterly Statement of Investments
The Trust files a complete statement of investments with the U.S. Securities and Exchange Commission for the first and third quarters for each fiscal year on Form N-Q. Shareholders may view the filed Form N-Q by visiting the Commission’s website at sec.gov. The filed form may also be viewed and copied at the Commission’s Public Reference Room in Washington, DC. Information regarding the operations of the Public Reference Room may be obtained by calling (800) SEC-0330.
50 | Semiannual Report

Semiannual Report
Franklin Templeton Emerging Market Debt Opportunities Fund
Your Fund’s Goal and Main Investments: Franklin Templeton Emerging Market Debt Opportunities Fund seeks high total return through investing in debt securities of emerging market countries, mainly securities issued by sovereign and sub-sovereign government entities, but also including securities issued by corporate entities.
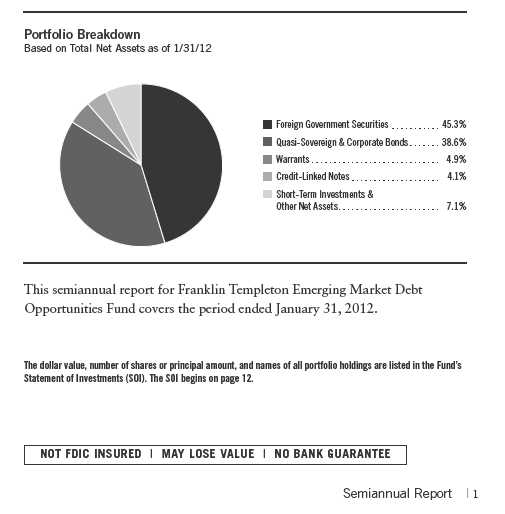
Performance Overview
Performance data represent past performance, which does not guarantee future results. Investment return and principal value will fluctuate, and you may have a gain or loss when you sell your shares. Current performance may differ from figures shown. Please call a Franklin Templeton Institutional Services representative at (800) 321-8563 for most recent month-end performance.
Franklin Templeton Emerging Market Debt Opportunities Fund had a -1.82% cumulative total return for the six months ended January 31, 2012. The Fund underperformed the +2.20% total return of the J.P. Morgan (JPM) Emerging Markets Bond Index (EMBI) Global Diversified Index, which tracks total returns for U.S. dollar-denominated debt instruments issued by emerging market sovereign and quasi-sovereign entities.1 However, the Fund outperformed its secondary benchmark, the JPM Global Bond Index (GBI) Emerging Markets (EM) Broad Diversified Index ($US unhedged), which tracks local currency bonds issued in emerging markets, and which had a -2.03% total return for the same period.1 Finally, the Fund underperformed the +1.11% total return of the Bank of America Merrill Lynch (BofAML) Emerging Markets Credit Plus (EMC+) Index (100% $US Hedged), which tracks the performance of U.S. dollar-denominated and euro-denominated emerging market, cross-over quasi-government and corporate debt of issuers whose country of risk has a BBB or lower foreign currency long-term debt rating.2 You can find more performance data in the Performance Summary beginning on page 7.
Economic and Market Overview
The six-month reporting period was marked by sudden deterioration of liquidity conditions in the European banking sector, a phenomenon fostered by the fiscal crises of certain European Monetary Union member countries and by capital repatriation following Standard & Poor’s downgrade of U.S. sovereign debt on August 5. As a result, the U.S. Treasury yield curve, which had been relatively stable in the first half of 2011, experienced drastic flattening as long-term yields declined more than 100 basis points (bps; 100 bps equal one percentage point) over the period. In Europe, Germany benefited most from the flight to quality with sharp drops in yields of its short-term and medium-term Bunds. Yield spreads for most bonds over U.S. Treasuries and German Bunds widened steeply, affecting global high yield issues most. Meanwhile, capital outflows from emerging market equities, especially in August and September, led to depreciation for many emerging market currencies against the U.S. dollar.
1. Source: © 2012 Morningstar. All Rights Reserved. The information contained herein: (1) is proprietary to Morningstar and/or its content providers; (2) may not be copied or distributed; and (3) is not warranted to be accurate, complete or timely. Neither Morningstar nor its content providers are responsible for any damages or losses arising from any use of this information. The indexes are unmanaged and include reinvested interest. One cannot invest directly in an index, and an index is not representative of the Fund’s portfolio.
2. Source: BofA Merrill Lynch. The index is unmanaged and includes reinvested interest. One cannot invest directly in an index, and an index is not representative of the Fund’s portfolio.
2 | Semiannual Report
Early in the reporting period, investors shifted their asset allocation strategies, leading to substantial flows from global high yield and emerging market equities into emerging market bonds. This trend buoyed issues denominated in hard currencies and local currencies alike. Emerging market nominal rates fell steadily at first. However, emerging market currencies soon followed the euro in its depreciation versus the U.S. dollar, notably the Brazilian real, which fell 14.44% versus the U.S. dollar in September alone.3
Debt markets troughed in early October, when the second debt restructuring of the Belgian-French quasi-sovereign bank Dexia was finalized in an emergency cross-border plan. The average credit risk premium of emerging market debt reached 455 bps over U.S. Treasuries on October 4, up more than 180 bps since the beginning of August.4 Concurrently, energy and agricultural commodity prices fell, lending some relief to most emerging market governments, whose budgets are often used to finance domestic consumption of natural resources. Oil prices rebounded following the international sanctions imposed on Iran. Although the supply of emerging market Eurobonds slowed in the third quarter of 2011, issuance over the reporting period stood at approximately $115 billion, in U.S. dollar terms.
The yield on bonds in the JPM EMBI Global Diversified Index rose 80 bps, from 5.60% at the beginning of the reporting period to 6.40% in early October, and then decreased to 5.69% at period-end.4 In contrast, the yield on bonds in the JPM GBI EM Broad Diversified Index began the period at 6.70% and dropped 50 bps to 6.20% at the end of January.4
U.S. dollar-denominated emerging market sovereign bonds, represented by the JPM EMBI Global Diversified Index, rose 2.20% over the period.1 Local currency-denominated emerging market bonds, represented by the JPM GBI EM Broad Diversified Index, underperformed their U.S. dollar-denominated counterparts with the weakest total return of the three subsegments of the asset class, down 2.03%, as the U.S. dollar strengthened.1 Finally, G-7 currency-denominated quasi-sovereign and corporate debt, represented by the BofAML EMC+ Index, posted a modest +1.11% total return in U.S. dollar hedged terms.2, 5
3. Source: IDC/Exshare.
4. Source: J.P. Morgan.
5. The G-7, or Group of Seven, is an informal forum of finance ministers from seven industrialized nations who meet periodically to discuss economic policies. The G-7 includes Canada, France, Germany, Italy, Japan, the U.K. and the U.S.

*May differ from the SOI because percentages reflect the issuing country of the Fund’s long-term securities and include the effect of interest receivable balances.
Semiannual Report | 3
What is a currency forward contract?
A currency forward contract is an agreement between the Fund and a counterparty to buy or sell a foreign currency for a specific exchange rate on a future date.
Investment Strategy
Our portfolio construction process can be summarized in three integral steps —country allocation, currency allocation and issue selection. The first stage of our emerging market debt investment process is identifying the countries for which we have a favorable outlook, which we manage with a bottom-up, research-driven perspective. Since the portfolio is constructed through bottom-up, fundamental research and not relative to a benchmark index, there is no requirement to hold issues in any one country. The next decision is whether to take exposure in the form of “hard currency” or local currency instruments. Hard currencies are typically currencies of economically and politically stable industrialized nations, such as the G-7.5 The last decision concerns security selection. This depends on the shape of the sovereign spread curve and the type of the issue’s coupon (fixed or floating). We may seek to manage the Fund’s exposure to various currencies, and may from time to time seek to hedge (protect) against currency risk, largely by using currency forward contracts.
Manager’s Discussion
During the reporting period, the Fund’s exposures to commodity-exporting economies, such as those of Nigeria, Venezuela, Ecuador and Angola, were major contributors to performance. Our exposures to these countries significantly aided the Fund’s return as expectations of a global economic slowdown, rising tensions in the Middle East and the imposition of international sanctions against Iran led to volatility and an overall rise in oil prices.
Additionally, we added exposure to certain emerging market corporate bonds whose prices had fallen significantly over the summer and that performed well during the period. Top performing holdings included Mexican cement giant, Cemex, the largest Russian private bank, Alfa Bank, Croatian retailer Agrokor, Brazilian meat producer JBS and Brazilian utility Celpa.6 Our holdings of local currency-denominated government obligations of the Dominican Republic and Uganda also contributed to performance.
Three main factors detracted from performance. First was the sudden depreciation of most emerging market currencies against the U.S. dollar, which occurred
6. Celpa is listed as Centrais Electricas do Para in the SOI.
4 | Semiannual Report
over August, September and to a lesser extent, November. In particular, some of the most traded emerging market currencies, such as the Brazilian real and the Mexican peso, performed worst. Second, certain corporate bonds in Mexico, Hungary, Ukraine, the Czech Republic and China, as well as select sovereign bonds, such as those of Croatia, Montenegro, Bosnia & Herzegovina, Iraq and Uruguay, lost value as investor appetite for risk declined. Finally, the Fund’s short duration positioning in the U.S. dollar hurt performance as flattening of the U.S. Treasury yield curve provided a major boost to performance of longer term U.S. dollar-denominated emerging market sovereign bonds over the period.
The Fund’s use of derivatives was limited to currency forward contracts, credit-linked notes and oil-indexed payment obligations. Overall, derivatives contributed positively to the Fund’s return.
On January 31, 2012, the Fund had exposure to 40 emerging market countries, most of which are shown in the table on page 3. Securities denominated in G-7 currencies constituted 74.0% of total net assets: 53.4% of total net assets were denominated in the U.S. dollar, 18.6% in the euro, 1.9% in the Japanese yen and 0.1% in Swiss franc. The Fund’s exposures to the euro, Swiss franc and yen were fully hedged to the U.S. dollar. In addition, 22.2% of the Fund’s total net assets were denominated in fourteen local currencies, of which our largest exposure was to the Brazilian real at 3.7% of total net assets.
During the reporting period, we added several new securities to the portfolio. Among corporate debt, we added instruments issued by Brazilian meat producer JBS, Croatian retailer Agrokor, Indian metals and mining firm, Vedanta Resources, Mexican low-income residential builder Urbi, and Ukrainian iron-ore producer Ferrexpo. Among quasi-sovereign issuers, we added debt of Chinese real estate developer Franshion Development, Russian bank Sberbank and Export Credit Bank of Turkey.7 Regarding sovereign issuers, we exchanged Brazilian indexed principal-only strips for longer-term inflation-linked notes and added to holdings of U.S. dollar-denominated Lithuanian government debt. We also initiated new positions in local currency-denominated Nigerian and Ugandan Treasury bills and medium-term South African government debt. Thus, the Fund added three new currencies: the Nigerian naira, the Ugandan shilling and the South African rand. We took profits in liquidating holdings of Chilean and Mexican retailers, Cencosud and Sigma Alimentos.
7. Sberbank is listed as SB Capital in the SOI.
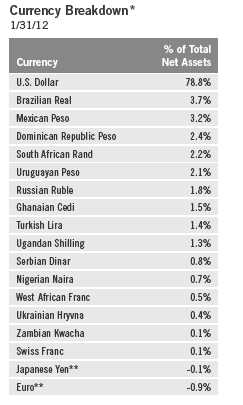
*Percentages may differ from the SOI due to the under-lying currency exposure on credit-linked notes and pass-through notes and include the effect of interest receivable balances.
**Holding is a negative percentage because of the Fund’s holdings of currency forward contracts.
Semiannual Report | 5

We thank you for your confidence in Franklin Templeton Emerging Market Debt Opportunities Fund and hope to serve your investment needs at the highest level of expectations.

CFA® is a trademark owned by CFA Institute.
The foregoing information reflects our analysis, opinions and portfolio holdings as of January 31, 2012, the end of the reporting period. The way we implement our main investment strategies and the resulting portfolio holdings may change depending on factors such as market and economic conditions. These opinions may not be relied upon as investment advice or an offer for a particular security. The information is not a complete analysis of every aspect of any market, country, industry, security or the Fund. Statements of fact are from sources considered reliable, but the investment manager makes no representation or warranty as to their completeness or accuracy. Although historical performance is no guarantee of future results, these insights may help you understand our investment management philosophy.
6 | Semiannual Report
Performance Summary as of 1/31/12
Your dividend income will vary depending on dividends or interest paid by securities in the Fund’s portfolio, adjusted for operating expenses. Capital gain distributions are net profits realized from the sale of portfolio securities. The performance table does not reflect any taxes that a shareholder would pay on Fund dividends, capital gain distributions, if any, or any realized gains on the sale of Fund shares. Total return reflects reinvestment of the Fund’s dividends and capital gain distributions, if any, and any unrealized gains or losses.
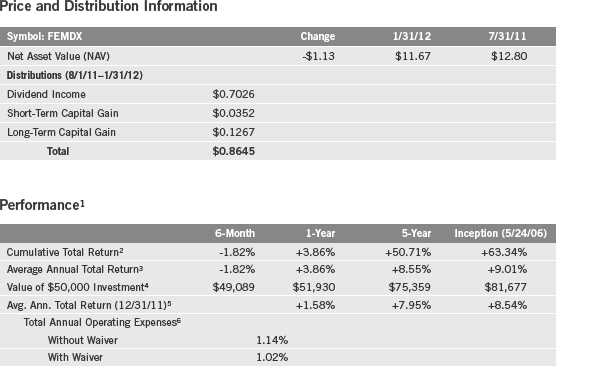
Performance data represent past performance, which does not guarantee future results. Investment return and principal value will fluctuate, and you may have a gain or loss when you sell your shares. Current performance may differ from figures shown. For most recent month-end performance, please call a Franklin Templeton Institutional Services representative at (800) 321-8563.
The investment manager and administrator have contractually agreed to waive or assume certain expenses so that Fund expenses (excluding acquired fund fees and expenses) do not exceed 1.00% (other than nonroutine expenses) until 11/30/12.
Semiannual Report | 7
Performance Summary (continued)
Endnotes
All investments involve risks. Special risks are associated with foreign investing, including currency volatility, economic instability, and social and political developments of countries where the Fund invests. Emerging markets involve heightened risks related to the same factors, in addition to those associated with their relatively small size and lesser liquidity. Also, as a nondiversified investment company, the Fund may invest in a relatively small number of issuers and, as a result, be subject to a greater risk of loss with respect to its portfolio securities. The Fund is actively managed but there is no guarantee that the manager’s investment decisions will produce the desired results. The Fund’s prospectus also includes a description of the main investment risks.
1. If the manager and administrator had not waived fees, the Fund’s total returns would have been lower. 2. Cumulative total return represents the change in value of an investment over the periods indicated.
3. Average annual total return represents the average annual change in value of an investment over the periods indicated. Six-month return has not been annualized.
4. These figures represent the value of a hypothetical $50,000 investment in the Fund over the periods indicated.
5. In accordance with SEC rules, we provide standardized average annual total return information through the latest calendar quarter.
6. Figures are as stated in the Fund’s prospectus current as of the date of this report. In periods of market volatility, assets may decline significantly, causing total annual Fund operating expenses to become higher than the figures shown.
8 | Semiannual Report
Your Fund’s Expenses
As a Fund shareholder, you can incur two types of costs:
- Transaction costs, including sales charges (loads) on Fund purchases and redemption fees; and
- Ongoing Fund costs, including management fees, distribution and service (12b-1) fees, and other Fund expenses. All mutual funds have ongoing costs, sometimes referred to as operating expenses.
The following table shows ongoing costs of investing in the Fund and can help you understand these costs and compare them with those of other mutual funds. The table assumes a $1,000 investment held for the six months indicated.
Actual Fund Expenses
The first line (Actual) of the table provides actual account values and expenses. The “Ending Account Value” is derived from the Fund’s actual return, which includes the effect of Fund expenses.
You can estimate the expenses you paid during the period by following these steps. Of course, your account value and expenses will differ from those in this illustration:
| 1. | Divide your account value by $1,000. |
| | If an account had an $8,600 value, then $8,600 ÷ $1,000 = 8.6. |
| 2. | Multiply the result by the number under the heading “Expenses Paid During Period.” |
| | If Expenses Paid During Period were $7.50, then 8.6 x $7.50 = $64.50. |
In this illustration, the estimated expenses paid this period are $64.50.
Hypothetical Example for Comparison with Other Funds
Information in the second line (Hypothetical) of the table can help you compare ongoing costs of investing in the Fund with those of other mutual funds. This information may not be used to estimate the actual ending account balance or expenses you paid during the period. The hypothetical “Ending Account Value” is based on the Fund’s actual expense ratio and an assumed 5% annual rate of return before expenses, which does not represent the Fund’s actual return. The figure under the heading “Expenses Paid During Period” shows the hypothetical expenses your account would have incurred under this scenario. You can compare this figure with the 5% hypothetical examples that appear in shareholder reports of other funds.
Semiannual Report | 9
Your Fund’s Expenses (continued)
Please note that expenses shown in the table are meant to highlight ongoing costs and do not reflect any transaction costs, such as sales charges or redemption fees, if applicable. Therefore, the second line of the table is useful in comparing ongoing costs only, and will not help you compare total costs of owning different funds. In addition, if transaction costs were included, your total costs would have been higher. Please refer to the Fund prospectus for additional information on operating expenses.
| | | | | | |
| | | Beginning Account | | Ending Account | | Expenses Paid During |
| | | Value 8/1/11 | | Value 1/31/12 | | Period* 8/1/11–1/31/12 |
| Actual | $ | 1,000 | $ | 981.80 | $ | 4.98 |
| Hypothetical (5% return before expenses) | $ | 1,000 | $ | 1,020.11 | $ | 5.08 |
*Expenses are calculated using the most recent six-month annualized expense ratio, net of expense waivers, of 1.00%, multiplied by the average account value over the period, multiplied by 184/366 to reflect the one-half year period.
10 | Semiannual Report
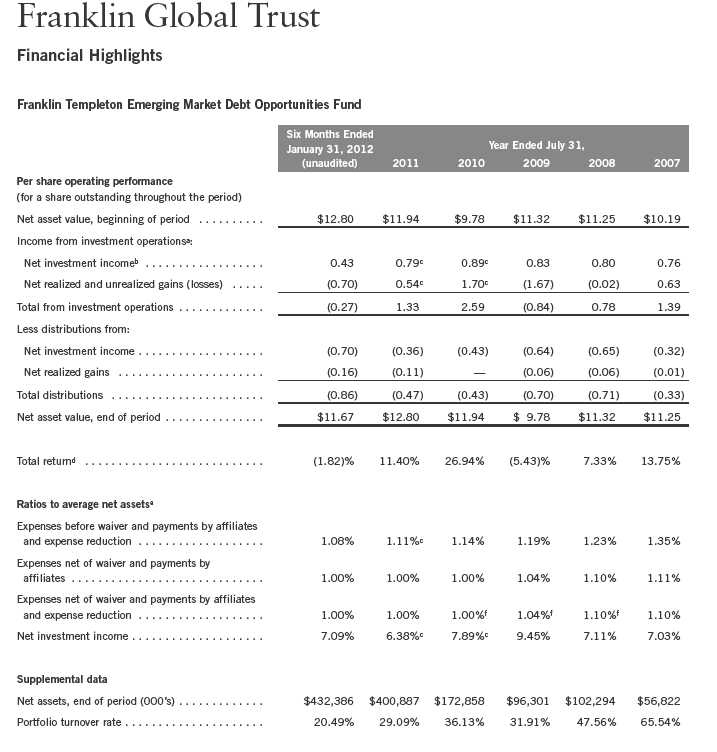
aThe amount shown for a share outstanding throughout the period may not correlate with the Statement of Operations for the period due to the timing of sales and repurchases of
the Fund shares in relation to income earned and/or fluctuating market value of the investments of the Fund.
bBased on average daily shares outstanding.
cSee Note 14 regarding revisions to previously issued financial statements.
dTotal return is not annualized for periods less than one year.
eRatios are annualized for periods less than one year.
fBenefit of expense reduction rounds to less than 0.01%.
Semiannual Report | The accompanying notes are an integral part of these financial statements. | 11
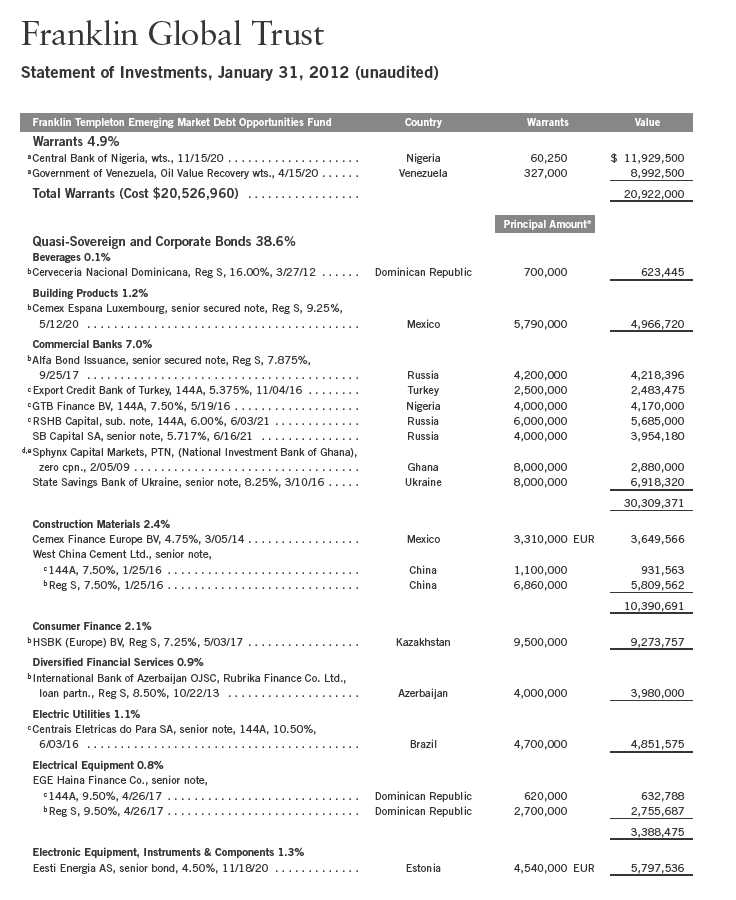
12 | Semiannual Report
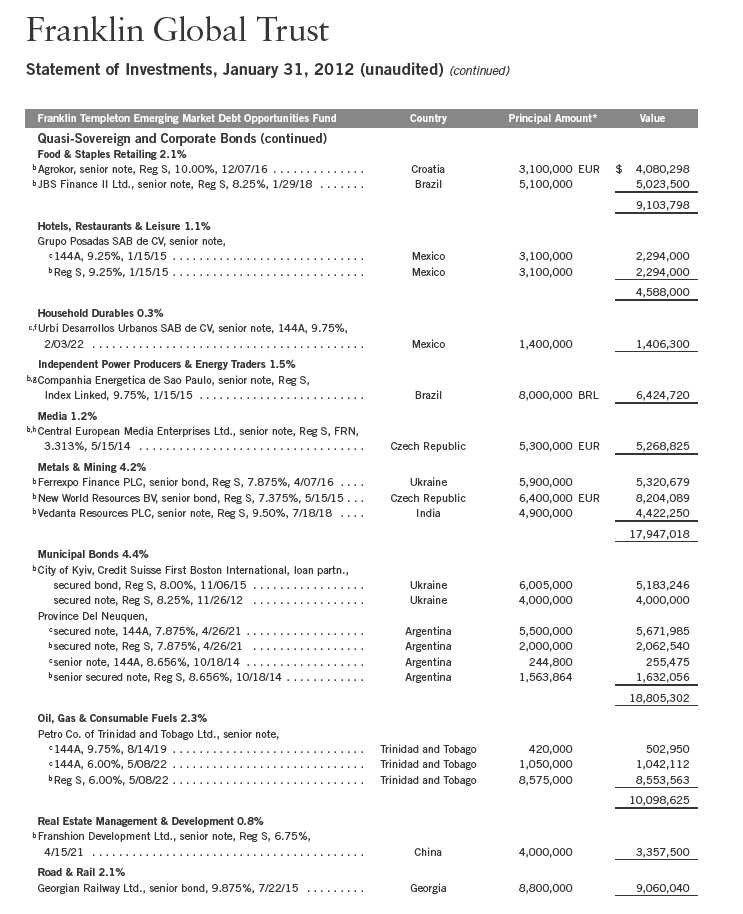
Semiannual Report | 13
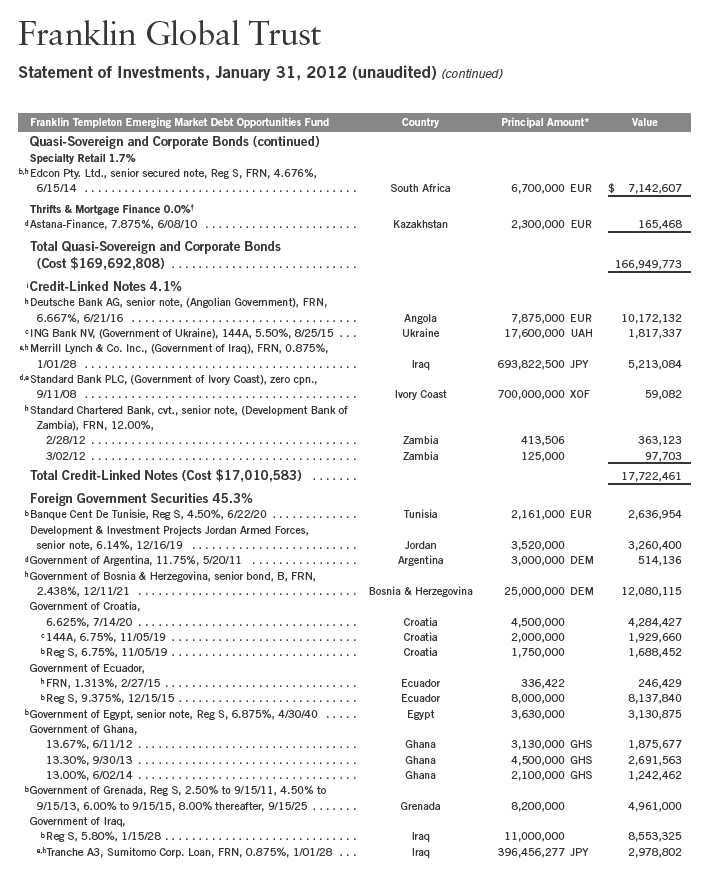
14 | Semiannual Report
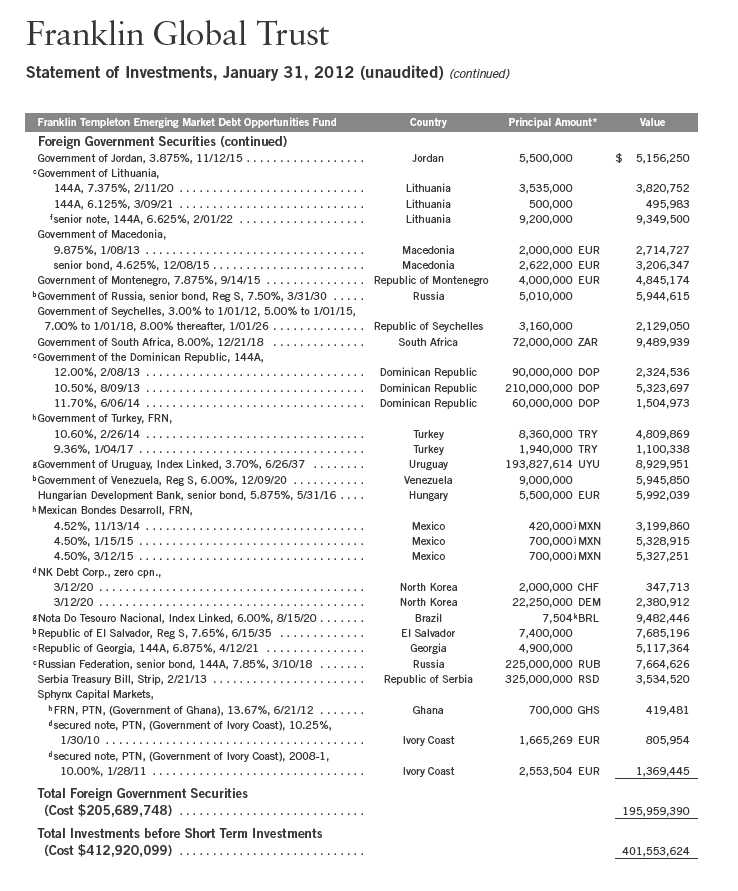
Semiannual Report | 15
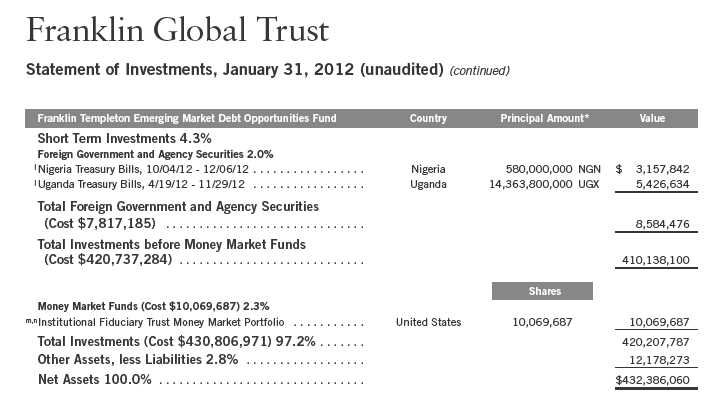
†Rounds to less than 0.1% of net assets.
*The principal amount is stated in U.S. dollars unless otherwise indicated.
aSee Note 1(f) regarding investment in Alternative Strategies Ltd.
bSecurity was purchased pursuant to Regulation S under the Securities Act of 1933, which exempts from registration securities offered and sold outside of the United States. Such
a security cannot be sold in the United States without either an effective registration statement filed pursuant to the Securities Act of 1933, or pursuant to an exemption from regis-
tration. These securities have been deemed liquid under guidelines approved by the Trust’s Board of Trustees. At January 31, 2012, the aggregate value of these securities was
$153,281,547, representing 35.45% of net assets.
cSecurity was purchased pursuant to Rule 144A under the Securities Act of 1933 and may be sold in transactions exempt from registration only to qualified institutional buyers or
in a public offering registered under the Securities Act of 1933. These securities have been deemed liquid under guidelines approved by the Trust’s Board of Trustees. At January 31,
2012, the aggregate value of these securities was $69,275,651, representing 16.02% of net assets.
dSee Note 8 regarding defaulted securities.
eSecurity has been deemed illiquid because it may not be able to be sold within seven days. At January 31, 2012, the aggregate value of these securities was $11,130,968,
representing 2.57% of net assets.
fA portion or all of the security purchased on a when-issued basis. See Note 1(c).
gRedemption price at maturity is adjusted for inflation. See Note 1(i).
hThe coupon rate shown represents the rate at period end.
iSee Note 1(e) regarding credit-linked notes.
jPrincipal amount is stated in 100 Mexican Peso Units.
kPrincipal amount is stated in 1,000 Brazilian Real Units.
lThe security is traded on a discount basis with no stated coupon rate.
mNon-income producing.
nSee Note 7 regarding investments in the Institutional Fiduciary Trust Money Market Portfolio.
16 | Semiannual Report
| | | | | | | | | | | |
| Franklin Global Trust | | | | | | | | | |
| |
| Statement of Investments, January 31, 2012 (unaudited) (continued) | | | | | |
| |
| |
| Franklin Templeton Emerging Market Debt Opportunities Fund | | | | | | | | |
| |
| At January 31, 2012, the Fund had the following forward exchange contracts outstanding. See Note 1(d). | | |
| |
| Forward Exchange Contracts | | | | | | | | | | | |
| | | | | | Contract | Settlement | | Unrealized | Unrealized | |
| Currency | Counterparty | Type | Quantity | | Amount | Date | | Appreciation | Depreciation | |
| Euro | MSCO | Buy | 3,500,000 | $ | 4,484,816 | 3/12/12 | $ | 93,793 | $ | — | |
| Euro | RBCCM | Sell | 24,000,000 | | 32,098,140 | 3/12/12 | | 701,963 | | — | |
| Euro | CITI | Sell | 23,400,000 | | 31,306,454 | 3/12/12 | | 695,181 | | — | |
| Euro | MSCO | Sell | 20,500,000 | | 27,406,115 | 3/12/12 | | 588,547 | | — | |
| Japanese Yen | CITI | Sell | 400,000,000 | | 5,151,884 | 3/12/12 | | — | | (98,176 | ) |
| Japanese Yen | MSCO | Sell | 290,000,000 | | 3,738,202 | 3/12/12 | | — | | (68,092 | ) |
| Unrealized appreciation (depreciation) | | | | | | | 2,079,484 | | (166,268 | ) |
| Net unrealized appreciation (depreciation) | | | | | | $ | 1,913,216 | | | |
| |
| See Abbreviations on page 34. | | | | | | | | | | | |
Semiannual Report | The accompanying notes are an integral part of these financial statements. | 17

18 | The accompanying notes are an integral part of these financial statements. | Semiannual Report
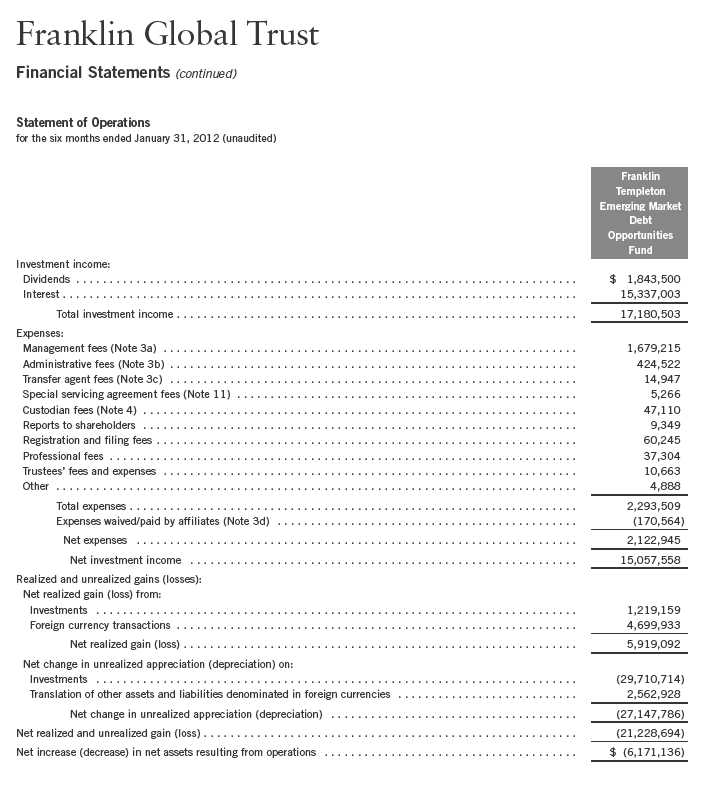
Semiannual Report | The accompanying notes are an integral part of these financial statements. | 19
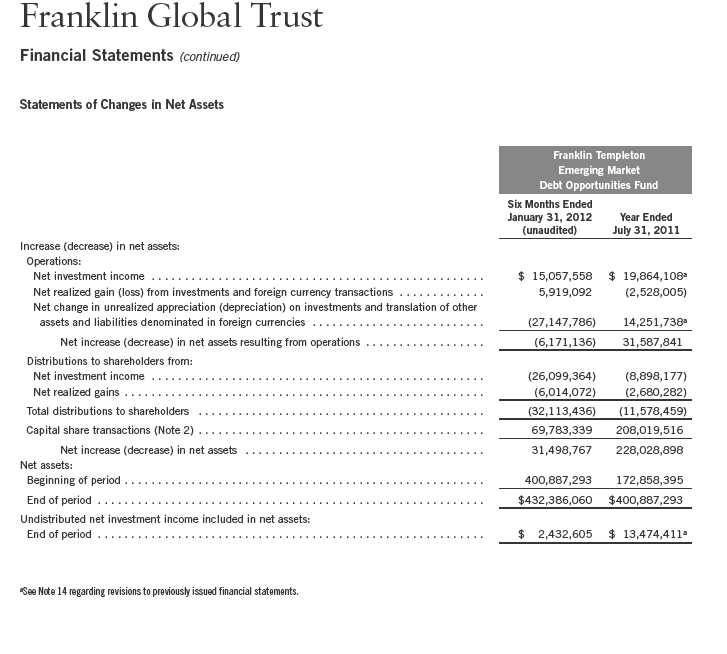
20 | The accompanying notes are an integral part of these financial statements. | Semiannual Report
Franklin Global Trust
Notes to Financial Statements (unaudited)
Franklin Templeton Emerging Market Debt Opportunities Fund
1. ORGANIZATION AND SIGNIFICANT ACCOUNTING POLICIES
Franklin Global Trust (Trust) is registered under the Investment Company Act of 1940, as amended, (1940 Act) as an open-end investment company, consisting of five separate funds. The Franklin Templeton Emerging Market Debt Opportunities Fund (Fund) is included in this report. The financial statements of the remaining funds in the Trust are presented separately.
The following summarizes the Fund’s significant accounting policies.
a. Financial Instrument Valuation
The Fund’s investments in securities and other financial instruments are carried at fair value daily. Fair value is the price that would be received to sell an asset or paid to transfer a liability in an orderly transaction between market participants on the measurement date. Under procedures approved by the Trust’s Board of Trustees, the Fund may utilize independent pricing services, quotations from securities and financial instrument dealers, and other market sources to determine fair value.
Equity securities listed on an exchange or on the NASDAQ National Market System are valued at the last quoted sale price or the official closing price of the day, respectively. Foreign equity securities are valued as of the close of trading on the foreign stock exchange on which the security is primarily traded, or the NYSE, whichever is earlier. The value is then converted into its U.S. dollar equivalent at the foreign exchange rate in effect at the close of the NYSE on the day that the value of the security is determined. Over-the-counter securities are valued within the range of the most recent quoted bid and ask prices. Securities that trade in multiple markets or on multiple exchanges are valued according to the broadest and most representative market. Certain equity securities are valued based upon fundamental characteristics or relationships to similar securities. Investments in open-end mutual funds are valued at the closing net asset value.
Debt securities generally trade in the over-the-counter market rather than on a securities exchange. The Fund’s pricing services use multiple valuation techniques to determine fair value. In instances where sufficient market activity exists, the pricing services may utilize a market-based approach through which quotes from market makers are used to determine fair value. In instances where sufficient market activity may not exist or is limited, the pricing services also utilize proprietary valuation models which may consider market characteristics such as benchmark yield curves, option-adjusted spreads, credit spreads, estimated default rates, coupon rates, anticipated timing of principal repayments, underlying collateral, and other unique security features in order to estimate the relevant cash flows, which are then discounted to calculate the fair value. Securities denominated in a foreign currency are converted into their U.S. dollar equivalent at the foreign exchange rate in effect at the close of the NYSE on the date that the values of the foreign debt securities are determined.
Semiannual Report | 21
Franklin Global Trust
Notes to Financial Statements (unaudited) (continued)
Franklin Templeton Emerging Market Debt Opportunities Fund
| 1. | ORGANIZATION AND SIGNIFICANT ACCOUNTING POLICIES (continued) |
| a. | Financial Instrument Valuation (continued) |
Certain derivative financial instruments (derivatives) trade in the over-the-counter market. The Fund’s pricing services use various techniques including industry standard option pricing models and proprietary discounted cash flow models to determine the fair value of those instruments. The Fund’s net benefit or obligation under the derivative contract, as measured by the fair market value of the contract, is included in net assets.
The Fund has procedures to determine the fair value of securities and other financial instruments for which market prices are not readily available or which may not be reliably priced. Under these procedures, the Fund primarily employs a market-based approach which may use related or comparable assets or liabilities, recent transactions, market multiples, book values, and other relevant information for the investment to determine the fair value of the investment. The Fund may also use an income-based valuation approach in which the anticipated future cash flows of the investment are discounted to calculate fair value. Discounts may also be applied due to the nature or duration of any restrictions on the disposition of the investments. Due to the inherent uncertainty of valuations of such investments, the fair values may differ significantly from the values that would have been used had an active market existed.
Trading in securities on foreign securities stock exchanges and over-the-counter markets may be completed before the daily close of business on the NYSE. Occasionally, events occur between the time at which trading in a foreign security is completed and the close of the NYSE that might call into question the reliability of the value of a portfolio security held by the Fund. As a result, differences may arise between the value of the Fund’s portfolio securities as determined at the foreign market close and the latest indications of value at the close of the NYSE. In order to minimize the potential for these differences, the investment manager monitors price movements following the close of trading in foreign stock markets through a series of country specific market proxies (such as baskets of American Depositary Receipts, futures contracts and exchange traded funds). These price movements are measured against established trigger thresholds for each specific market proxy to assist in determining if an event has occurred that may call into question the reliability of the values of the foreign securities held by the Fund. If such an event occurs, the securities may be valued using fair value procedures, which may include the use of independent pricing services.
b. Foreign Currency Translation
Portfolio securities and other assets and liabilities denominated in foreign currencies are translated into U.S. dollars based on the exchange rate of such currencies against U.S. dollars on the date of valuation. The Fund may enter into foreign currency exchange contracts to facilitate transactions denominated in a foreign currency. Purchases and sales of securities, income and expense items denominated in foreign currencies are translated into U.S. dollars at the exchange
22 | Semiannual Report
Franklin Global Trust
Notes to Financial Statements (unaudited) (continued)
Franklin Templeton Emerging Market Debt Opportunities Fund
| 1. | ORGANIZATION AND SIGNIFICANT ACCOUNTING POLICIES (continued) |
| b. | Foreign Currency Translation (continued) |
rate in effect on the transaction date. Portfolio securities and assets and liabilities denominated in foreign currencies contain risks that those currencies will decline in value relative to the U.S. dollar. Occasionally, events may impact the availability or reliability of foreign exchange rates used to convert the U.S. dollar equivalent value. If such an event occurs, the foreign exchange rate will be valued at fair value using procedures established and approved by the Trust’s Board of Trustees.
The Fund does not separately report the effect of changes in foreign exchange rates from changes in market prices on securities held. Such changes are included in net realized and unrealized gain or loss from investments on the Statement of Operations.
Realized foreign exchange gains or losses arise from sales of foreign currencies, currency gains or losses realized between the trade and settlement dates on securities transactions and the difference between the recorded amounts of dividends, interest, and foreign withholding taxes and the U.S. dollar equivalent of the amounts actually received or paid. Net unrealized foreign exchange gains and losses arise from changes in foreign exchange rates on foreign denominated assets and liabilities other than investments in securities held at the end of the reporting period.
c. Securities Purchased on a When-Issued Basis
The Fund purchases securities on a when-issued basis, with payment and delivery scheduled for a future date. These transactions are subject to market fluctuations and are subject to the risk that the value at delivery may be more or less than the trade date purchase price. Although the Fund will generally purchase these securities with the intention of holding the securities, it may sell the securities before the settlement date. Sufficient assets have been segregated for these securities.
d. Derivative Financial Instruments
The Fund invested in derivatives in order to manage risk or gain exposure to various other investments or markets. Derivatives are financial contracts based on an underlying or notional amount, require no initial investment or an initial net investment that is smaller than would normally be required to have a similar response to changes in market factors, and require or permit net settlement. Derivatives contain various risks including the potential inability of the counterparty to fulfill their obligations under the terms of the contract, the potential for an illiquid secondary market, and/or the potential for market movements which expose the Fund to gains or losses in excess of the amounts shown on the Statement of Assets and Liabilities. Realized gain and loss and unrealized appreciation and depreciation on these contracts for the period are included in the Statement of Operations.
Semiannual Report | 23
Franklin Global Trust
Notes to Financial Statements (unaudited) (continued)
Franklin Templeton Emerging Market Debt Opportunities Fund
| 1. | ORGANIZATION AND SIGNIFICANT ACCOUNTING POLICIES (continued) |
| d. | Derivative Financial Instruments (continued) |
The Fund entered into forward exchange contracts primarily to manage and/or gain exposure to certain foreign currencies. A forward exchange contract is an agreement between the Fund and a counterparty to buy or sell a foreign currency for a specific exchange rate on a future date. Pursuant to the terms of the forward exchange contracts, cash or securities may be required to be deposited as collateral. Unrestricted cash may be invested according to the Fund’s investment objectives.
At January 31, 2012, the Fund holds $730,262 in U.S. Treasury bills and notes as collateral for derivatives.
See Note 10 regarding other derivative information.
e. Credit-Linked Notes
The Fund purchases credit-linked notes. Credit-linked notes are intended to replicate the economic effects that would apply had the Fund directly purchased the underlying reference asset. The risks of credit-linked notes include the potential default of the underlying reference asset, the movement in the value of the currency of the underlying reference asset relative to the credit-linked note, the potential inability of the Fund to dispose of the credit-linked note in the normal course of business, and the possible inability of the counterparties to fulfill their obligations under the contracts.
f. Investment in Alternative Strategies Ltd.
The Fund invests in certain securities, warrants or commodities through its investment in Alternative Strategies (FT) Ltd, a Cayman Islands exempted limited liability company and a wholly-owned subsidiary (Subsidiary) of the Fund. The Subsidiary has the ability to invest in commodities and securities, consistent with the investment objective of the Fund. At January 31, 2012, all Subsidiary investments as well as any payables or receivables are reflected in the Fund’s Statement of Investments and Statement of Assets and Liabilities. All income and expenses of the Subsidiary during the period ended January 31, 2012, have been included in the Fund’s Statement of Operations.
g. Restricted Cash
At January 31, 2012, the Fund held restricted cash in connection with investments in certain derivative securities. Restricted cash is held in a segregated account with the Fund’s custodian/ counterparty broker and is reflected in the Statement of Assets and Liabilities.
24 | Semiannual Report
Franklin Global Trust
Notes to Financial Statements (unaudited) (continued)
Franklin Templeton Emerging Market Debt Opportunities Fund
| 1. | ORGANIZATION AND SIGNIFICANT ACCOUNTING POLICIES (continued) |
| h. | Income Taxes |
It is the Fund’s policy to qualify as a regulated investment company under the Internal Revenue Code. The Fund intends to distribute to shareholders substantially all of its taxable income and net realized gains to relieve it from federal income and excise taxes. No further provision for U.S. federal income taxes is required.
The Fund may be subject to foreign taxation related to income received, capital gains on the sale of securities and certain foreign currency transactions in the foreign jurisdictions in which it invests. Foreign taxes, if any, are recorded based on the tax regulations and rates that exist in the foreign markets in which the Fund invests. When a capital gain tax is determined to apply the Fund records an estimated deferred tax liability in an amount that would be payable if the securities were disposed of on the valuation date.
The Fund recognizes the tax benefits of uncertain tax positions only when the position is “more likely than not” to be sustained upon examination by the tax authorities based on the technical merits of the tax position. As of January 31, 2012, and for all open tax years, the Fund has determined that no liability for unrecognized tax benefits is required in the Fund’s financial statements related to uncertain tax positions taken on a tax return (or expected to be taken on future tax returns). Open tax years are those that remain subject to examination and are based on each tax jurisdiction statute of limitation.
i. Security Transactions, Investment Income, Expenses and Distributions
Security transactions are accounted for on trade date. Realized gains and losses on security transactions are determined on a specific identification basis. Interest income and estimated expenses are accrued daily. Amortization of premium and accretion of discount on debt securities are included in interest income. Dividend income is recorded on the ex-dividend date except that certain dividends from foreign securities are recognized as soon as the Fund is notified of the ex-dividend date. Distributions to shareholders are recorded on the ex-dividend date and are determined according to income tax regulations (tax basis). Distributable earnings determined on a tax basis may differ from earnings recorded in accordance with accounting principles generally accepted in the United States of America. These differences may be permanent or temporary. Permanent differences are reclassified among capital accounts to reflect their tax character. These reclassifications have no impact on net assets or the results of operations. Temporary differences are not reclassified, as they may reverse in subsequent periods.
Semiannual Report | 25
Franklin Global Trust
Notes to Financial Statements (unaudited) (continued)
Franklin Templeton Emerging Market Debt Opportunities Fund
| 1. | ORGANIZATION AND SIGNIFICANT ACCOUNTING POLICIES (continued) |
| i. | Security Transactions, Investment Income, Expenses and Distributions (continued) |
Common expenses incurred by the Trust are allocated among the funds based on the ratio of net assets of each fund to the combined net assets of the Trust. Fund specific expenses are charged directly to the fund that incurred the expense.
Inflation-indexed bonds are adjusted for inflation through periodic increases or decreases in the security’s interest accruals, face amount, or principal redemption value, by amounts corresponding to the rate of inflation as measured by an index. Any increase or decrease in the face amount or principal redemption value will be included as interest income on the Statement of Operations.
j. Accounting Estimates
The preparation of financial statements in accordance with accounting principles generally accepted in the United States of America requires management to make estimates and assumptions that affect the reported amounts of assets and liabilities at the date of the financial statements and the amounts of income and expenses during the reporting period. Actual results could differ from those estimates.
k. Guarantees and Indemnifications
Under the Trust’s organizational documents, its officers and trustees are indemnified by the Trust against certain liabilities arising out of the performance of their duties to the Trust. Additionally, in the normal course of business, the Trust, on behalf of the Fund, enters into contracts with service providers that contain general indemnification clauses. The Trust’s maximum exposure under these arrangements is unknown as this would involve future claims that may be made against the Trust that have not yet occurred. Currently, the Trust expects the risk of loss to be remote.
2. SHARES OF BENEFICIAL INTEREST
At January 31, 2012, there were an unlimited number of shares authorized (without par value).
Transactions in the Fund’s shares were as follows:
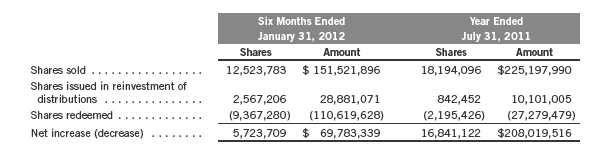
26 | Semiannual Report
Franklin Global Trust
Notes to Financial Statements (unaudited) (continued)
Franklin Templeton Emerging Market Debt Opportunities Fund
3. TRANSACTIONS WITH AFFILIATES
Franklin Resources, Inc. is the holding company for various subsidiaries that together are referred to as Franklin Templeton Investments. Certain officers and trustees of the Trust are also officers and/or directors of the following subsidiaries:
| |
| Subsidiary | Affiliation |
| Franklin Templeton Investment Management Limited (Investment Management) | Investment manager |
| Franklin Templeton Institutional, LLC (FT Institutional) | Investment manager |
| Franklin Templeton Services, LLC (FT Services) | Administrative manager |
| Franklin Templeton Investor Services, LLC (Investor Services) | Transfer agent |
a. Management Fees
The Fund pays an investment management fee to Investment Management based on the average daily net assets of the Fund as follows:
| | |
| Annualized Fee Rate | | Net Assets |
| 0.800 | % | Up to and including $500 million |
| 0.700 | % | Over $500 million, up to and including $1 billion |
| 0.650 | % | In excess of $1 billion |
Under a subadvisory agreement, FT Institutional, an affiliate of Investment Management, provides subadvisory services to the Fund and receives from Investment Management fees based on the average daily net assets of the Fund.
b. Administrative Fees
The Fund pays an administrative fee to FT Services of 0.20% per year of the average daily net assets of the Fund.
c. Transfer Agent Fees
For the period ended January 31, 2012, the Fund paid transfer agent fees of $14,947, of which $13,049 was retained by Investor Services.
d. Waiver and Expense Reimbursements
FT Services has contractually agreed in advance to waive or limit its fees and to assume as its own expense certain expenses otherwise payable by the fund so that the common expenses (i.e. a combination of management fees, administrative fees, and other expenses, but excluding acquired fund fees and expenses) do not exceed 1.00% (other than certain non-routine expenses or costs, including those relating to litigation, indemnification, reorganizations, and liquidations) until November 30, 2012.
Semiannual Report | 27
Franklin Global Trust
Notes to Financial Statements (unaudited) (continued)
Franklin Templeton Emerging Market Debt Opportunities Fund
4. EXPENSE OFFSET ARRANGEMENT
The Fund has entered into an arrangement with its custodian whereby credits realized as a result of uninvested cash balances are used to reduce a portion of the Fund’s custodian expenses. During the period ended January 31, 2012, there were no credits earned.
5. INCOME TAXES
At January 31, 2012, the cost of investments and net unrealized appreciation (depreciation) for income tax purposes were as follows:
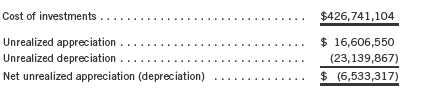
Differences between income and/or capital gains as determined on a book basis and a tax basis are primarily due to differing treatments of foreign currency transactions, bond discounts and premiums, tax straddles, and commodity-based derivatives.
6. INVESTMENT TRANSACTIONS
Purchases and sales of investments (excluding short term securities) for the period ended January 31, 2012, aggregated $161,353,282 and $76,542,324, respectively.
7. INVESTMENTS IN INSTITUTIONAL FIDUCIARY TRUST MONEY MARKET PORTFOLIO
The Fund invests in the Institutional Fiduciary Trust Money Market Portfolio (Sweep Money Fund), an open-end investment company managed by Franklin Advisers, Inc. (an affiliate of the investment manager). Management fees paid by the Fund are reduced on assets invested in the Sweep Money Fund, in an amount not to exceed the management and administrative fees paid by the Sweep Money Fund.
8. CREDIT RISK AND DEFAULTED SECURITIES
At January 31, 2012, the Fund had 74.72% of its portfolio invested in high yield or other securities rated below investment grade. These securities may be more sensitive to economic conditions causing greater price volatility and are potentially subject to a greater risk of loss due to default than higher rated securities.
28 | Semiannual Report
Franklin Global Trust
Notes to Financial Statements (unaudited) (continued)
Franklin Templeton Emerging Market Debt Opportunities Fund
8. CREDIT RISK AND DEFAULTED SECURITIES (continued)
The Fund held defaulted securities and/or other securities for which the income has been deemed uncollectible. At January 31, 2012, the aggregate value of these securities was $8,522,710, representing 1.97% of the Fund’s net assets. The Fund discontinues accruing income on securities for which income has been deemed uncollectible and provides an estimate for losses on interest receivable. The securities have been identified on the accompanying Statement of Investments.
9. CONCENTRATION OF RISK
Investing in foreign securities may include certain risks and considerations not typically associated with investing in U.S. securities, such as fluctuating currency values and changing local and regional economic, political and social conditions, which may result in greater market volatility. In addition, certain foreign securities may not be as liquid as U.S. securities.
10. OTHER DERIVATIVE INFORMATION
At January 31, 2012, the Fund has invested in derivative contracts which are reflected on the Statement of Assets and Liabilities as follows:
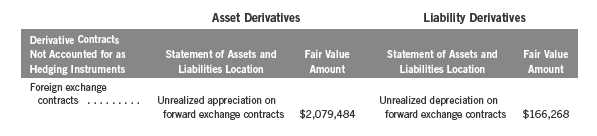
For the period ended January 31, 2012, the effect of derivative contracts on the Fund’s Statement of Operations was as follows:
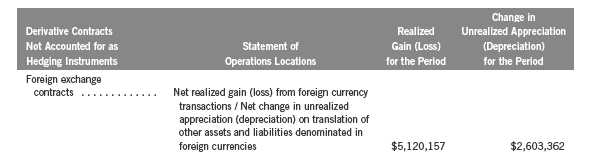
For the period ended January 31, 2012, the average month end market value of derivatives represented 0.59% of average month end net assets. The average month end number of open derivative contracts for the period was 8.
See Note 1(d) regarding derivative financial instruments.
Semiannual Report | 29
Franklin Global Trust
Notes to Financial Statements (unaudited) (continued)
Franklin Templeton Emerging Market Debt Opportunities Fund
11. SPECIAL SERVICING AGREEMENT
The Fund, which is an eligible underlying investment of one or more of the Franklin Templeton Fund Allocator Series Funds (Allocator Funds), participates in a Special Servicing Agreement (SSA) with the Allocator Funds and certain service providers of the Fund and the Allocator Funds. Under the SSA, the Fund may pay a portion of the Allocator Funds’ expenses (other than any asset allocation, administrative, and distribution fees) to the extent such payments are less than the amount of the benefits realized or expected to be realized by the Fund (e.g., due to reduced costs associated with servicing accounts) from the investment in the Fund by the Allocator Funds. The Allocator Funds are either managed by Franklin Advisers, Inc. or administered by FT Services, affiliates of Investment Management. For the period ended January 31, 2012, the Fund was held by one or more of the Allocator Funds and the amount of expenses borne by the Fund is noted in the Statement of Operations. At January 31, 2012, 19.25% of the Fund’s outstanding shares was held by one or more of the Allocator Funds.
12. CREDIT FACILITY
The Fund, together with other U.S. registered and foreign investment funds (collectively, Borrowers), managed by Franklin Templeton Investments, are borrowers in a joint syndicated senior unsecured credit facility totaling $1.5 billion (Global Credit Facility) which matures on January 18, 2013. This Global Credit Facility provides a source of funds to the Borrowers for temporary and emergency purposes, including the ability to meet future unanticipated or unusually large redemption requests.
Under the terms of the Global Credit Facility, the Fund shall, in addition to interest charged on any borrowings made by the Fund and other costs incurred by the Fund, pay its share of fees and expenses incurred in connection with the implementation and maintenance of the Global Credit Facility, based upon its relative share of the aggregate net assets of all of the Borrowers, including an annual commitment fee of 0.08% based upon the unused portion of the Global Credit Facility, which is reflected in other expenses on the Statement of Operations. During the period ended January 31, 2012, the Fund did not use the Global Credit Facility.
30 | Semiannual Report
Franklin Global Trust
Notes to Financial Statements (unaudited) (continued)
Franklin Templeton Emerging Market Debt Opportunities Fund
13. FAIR VALUE MEASUREMENTS
The Fund follows a fair value hierarchy that distinguishes between market data obtained from independent sources (observable inputs) and the Fund’s own market assumptions (unobservable inputs). These inputs are used in determining the value of the Fund’s investments and are summarized in the following fair value hierarchy:
- Level 1 – quoted prices in active markets for identical securities
- Level 2 – other significant observable inputs (including quoted prices for similar securities, interest rates, prepayment speed, credit risk, etc.)
- Level 3 – significant unobservable inputs (including the Fund’s own assumptions in determining the fair value of investments)
The inputs or methodology used for valuing securities are not an indication of the risk associated with investing in those securities.
For movements between the levels within the fair value hierarchy, the Fund has adopted a policy of recognizing the transfers as of the date of the underlying event which caused the movement.
The following is a summary of the inputs used as of January 31, 2012, in valuing the Fund’s assets and liabilities carried at fair value:

Semiannual Report | 31
Franklin Global Trust
Notes to Financial Statements (unaudited) (continued)
Franklin Templeton Emerging Market Debt Opportunities Fund
13. FAIR VALUE MEASUREMENTS (continued)
At January 31, 2012, the reconciliation of assets in which significant unobservable inputs (Level 3) were used in determining fair value, is as follows:
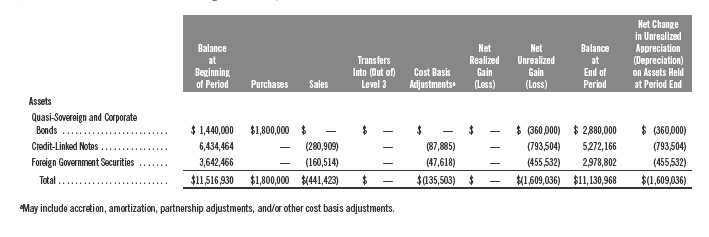
14. REVISION OF PREVIOUSLY ISSUED FINANCIAL STATEMENTS
After the Fund issued its July 31, 2011 financial statements, the Fund determined that two foreign securities were not properly accruing income in accordance with the effective interest rate method resulting in an understatement of investment income. The offsetting impact of this error is to unrealized appreciation (depreciation). Accordingly there is no impact on net increase (decrease) in net assets resulting from operations, beginning and ending net assets or total return. These adjustments were not considered to be material individually or in aggregate to previously issued financial statements. However, because of the significance of these adjustments, the Fund has determined to revise the applicable impacted financial statements and financial highlights the next time such financial statements and financial highlights are filed. Accordingly, the Fund will revise the financial statements for the year ended July 31, 2011, and certain Financial Highlight information for the years ended July 31, 2011 and 2010 to give effect to this change. The following sets forth the line items affected by the revisions discussed above.

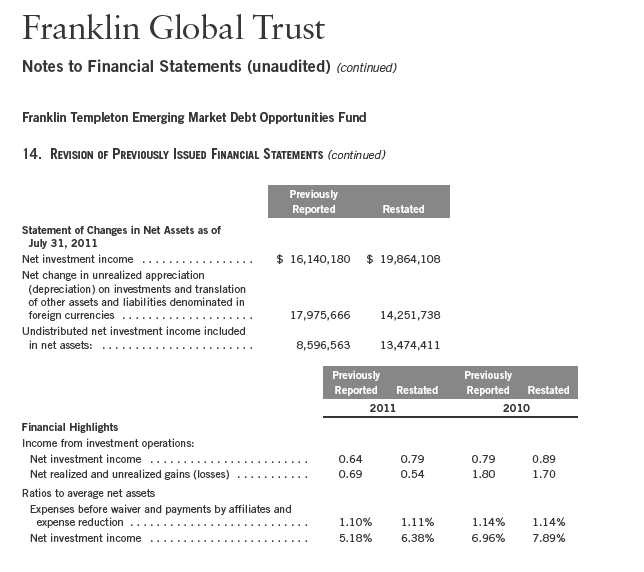
15. NEW ACCOUNTING PRONOUNCEMENTS
In May 2011, the Financial Accounting Standards Board (FASB) issued Accounting Standards Update (ASU) No. 2011-04, Fair Value Measurement (Topic 820): Amendments to Achieve Common Fair Value Measurement and Disclosure Requirements in U.S. GAAP and IFRSs. The amendments in the ASU will improve the comparability of fair value measurements presented and disclosed in financial statements prepared in accordance with U.S. GAAP (Generally Accepted Accounting Principles) and IFRS (International Financial Reporting Standards) and include new guidance for certain fair value measurement principles and disclosure requirements. The ASU is effective for interim and annual periods beginning after December 15, 2011. The Fund believes the adoption of this ASU will not have a material impact on its financial statements.
16. SUBSEQUENT EVENTS
The Fund has evaluated subsequent events through the issuance of the financial statements and determined that no events have occurred that require disclosure.
Semiannual Report | 33
Franklin Global Trust
Notes to Financial Statements (unaudited) (continued)
Franklin Templeton Emerging Market Debt Opportunities Fund
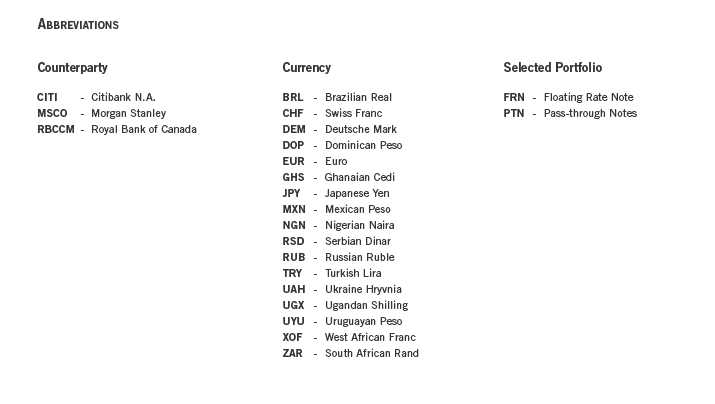
34 | Semiannual Report
Franklin Global Trust
Shareholder Information
Franklin Templeton Emerging Market Debt Opportunities Fund
Proxy Voting Policies and Procedures
The Trust’s investment manager has established Proxy Voting Policies and Procedures (Policies) that the Trust uses to determine how to vote proxies relating to portfolio securities. Shareholders may view the Trust’s complete Policies online at franklintempleton.com. Alternatively, shareholders may request copies of the Policies free of charge by calling the Proxy Group collect at (954) 527-7678 or by sending a written request to: Franklin Templeton Companies, LLC, 300 S.E. 2nd Street, Fort Lauderdale, FL 33301, Attention: Proxy Group. Copies of the Trust’s proxy voting records are also made available online at franklintempleton.com and posted on the U.S. Securities and Exchange Commission’s website at sec.gov and reflect the most recent 12-month period ended June 30.
Quarterly Statement of Investments
The Trust files a complete statement of investments with the U.S. Securities and Exchange Commission for the first and third quarters for each fiscal year on Form N-Q. Shareholders may view the filed Form N-Q by visiting the Commission’s website at sec.gov. The filed form may also be viewed and copied at the Commission’s Public Reference Room in Washington, DC. Information regarding the operations of the Public Reference Room may be obtained by calling (800) SEC-0330.
Semiannual Report | 35
This page intentionally left blank.
This page intentionally left blank.

(a) Evaluation of Disclosure Controls and Procedures. The Registrant maintains disclosure controls and procedures that are designed to ensure that information required to be disclosed in the Registrant’s filings under the Securities Exchange Act of 1934 and the Investment Company Act of 1940 is recorded, processed, summarized and reported within the periods specified in the rules and forms of the Securities and Exchange Commission. Such information is accumulated and communicated to the Registrant’s management, including its principal executive officer and principal financial officer, as appropriate, to allow timely decisions regarding required disclosure. The Registrant’s management, including the principal executive officer and the principal financial officer, recognizes that any set of controls and procedures, no matter how well designed and operated, can provide only reasonable assurance of achieving the desired control objectives.
Within 90 days prior to the filing date of this Shareholder Report on Form N-CSR, the Registrant had carried out an evaluation, under the supervision and with the participation of the Registrant’s management, including the Registrant’s principal executive officer and the Registrant’s principal financial officer, of the effectiveness of the design and operation of the Registrant’s disclosure controls and procedures. Based on such evaluation, the Registrant’s principal executive officer and principal financial officer concluded that the Registrant’s disclosure controls and procedures are effective.
(b) Changes in Internal Controls. There have been no significant changes in the Registrant’s internal controls or in other factors that could significantly affect the internal controls subsequent to the date of their evaluation in connection with the preparation of this Shareholder Report on Form N-CSR.
Item 12. Exhibits.
(a)(1) Code of Ethics
(a)(2) Certifications pursuant to Section 302 of the Sarbanes-Oxley Act of 2002 of Laura F. Fergerson, Chief Executive Officer - Finance and Administration, and Gaston Gardey, Chief Financial Officer, Chief Accounting Officer and Treasurer
(b) Certifications pursuant to Section 906 of the Sarbanes-Oxley Act of 2002 of Laura F. Fergerson, Chief Executive Officer - Finance and Administration, and Gaston Gardey, Chief Financial Officer, Chief Accounting Officer and Treasurer
SIGNATURES
Pursuant to the requirements of the Securities Exchange Act of 1934 and the Investment Company Act of 1940, the registrant has duly caused this report to be signed on its behalf by the undersigned, thereunto duly authorized.
FRANKLIN GLOBAL TRUST
By /s/LAURA F. FERGERSON
Laura F. Fergerson
FGT N-CSRS PE 1/31/12
Chief Executive Officer –
Finance and Administration
Date March 28, 2012
Pursuant to the requirements of the Securities Exchange Act of 1934 and the Investment Company Act of 1940, this report has been signed below by the following persons on behalf of the registrant and in the capacities and on the dates indicated.
By /s/LAURA F. FERGERSON
Laura F. Fergerson
Chief Executive Officer –
Finance and Administration
Date March 28, 2012
By /s/GASTON GARDEY
Gaston Gardey
Chief Financial Officer and
Chief Accounting Officer
Date March 28, 2012
FGT N-CSRS PE 1/31/12