UNITED STATES
SECURITIES AND EXCHANGE COMMISSION
Washington, D.C. 20549
FORM N-CSRS
CERTIFIED SHAREHOLDER REPORT OF REGISTERED MANAGEMENT INVESTMENT
COMPANIES
Investment Company Act file number 811-10157
Franklin Global Trust
(Exact name of registrant as specified in charter)
One Franklin Parkway, San Mateo, CA 94403-1906
(Address of principal executive offices) (Zip code)
Craig S. Tyle, One Franklin Parkway, San Mateo, CA 94403-1906
(Name and address of agent for service)
Registrant's telephone number, including area code: 650 312-2000
Date of fiscal year end: 7/31
Date of reporting period: 1/31/15
Item 1. Reports to Stockholders.

Franklin Templeton Investments
Gain From Our Perspective®
At Franklin Templeton Investments, we’re dedicated to one goal: delivering exceptional asset management for our clients. By bringing together multiple, world-class investment teams in a single firm, we’re able to offer specialized expertise across styles and asset classes, all supported by the strength and resources of one of the world’s largest asset managers. This has helped us to become a trusted partner to individual and institutional investors across the globe.
Focus on Investment Excellence
At the core of our firm, you’ll find multiple independent investment teams—each with a focused area of expertise—from traditional to alternative strategies and multi-asset solutions. And because our portfolio groups operate autonomously, their strategies can be combined to deliver true style and asset class diversification.
All of our investment teams share a common commitment to excellence grounded in rigorous, fundamental research and robust, disciplined risk management. Decade after decade, our consistent, research-driven processes have helped Franklin Templeton earn an impressive record of strong, long-term results.
Global Perspective Shaped by Local Expertise
In today’s complex and interconnected world, smart investing demands a global perspective. Franklin Templeton pioneered international investing over 60 years ago, and our expertise in emerging markets spans more than a quarter of a century. Today, our investment professionals are on the ground across the globe, spotting investment ideas and potential risks firsthand. These locally based teams bring in-depth understanding of local companies, economies and cultural nuances, and share their best thinking across our global research network.
Strength and Experience
Franklin Templeton is a global leader in asset management serving clients in over 150 countries.1 We run our business with the same prudence we apply to asset management, staying focused on delivering relevant investment solutions, strong long-term results and reliable, personal service. This approach, focused on putting clients first, has helped us to become one of the most trusted names in financial services.
1. As of 12/31/14. Clients are represented by the total number of shareholder accounts.
Not FDIC Insured | May Lose Value | No Bank Guarantee
| |
| Contents | |
| |
| Shareholder Letter | 1 |
| Semiannual Report | |
| Franklin Global Real Estate Fund | 3 |
| Performance Summary | 7 |
| Your Fund’s Expenses | 10 |
| Financial Highlights and | |
| Statement of Investments | 12 |
| Financial Statements | 20 |
| Notes to Financial Statements | 24 |
| Shareholder Information | 32 |
franklintempleton.com
1
Semiannual Report
Franklin Global Real Estate Fund
We are pleased to bring you Franklin Global Real Estate Fund’s semiannual report for the period ended January 31, 2015.
Your Fund’s Goal and Main Investments
The Fund seeks high total return. Under normal market conditions, the Fund invests at least 80% of its net assets in securities of companies located anywhere in the world that operate in the real estate sector, including real estate investment trusts (REITs) and REIT-like entities.1
Performance Overview
For the six months ended January 31, 2015, the Fund’s Class A shares delivered a cumulative total return of +8.14%. In comparison, the FTSE® EPRA®/NAREIT® Developed Index, which measures performance of global real estate markets in North America, Europe and Asia, generated a total return of +8.03%.2 You can find more of the Fund’s performance data in the Performance Summary beginning on page 7.
Performance data represent past performance, which does not guarantee future results. Investment return and principal value will fluctuate, and you may have a gain or loss when you sell your shares. Current performance may differ from figures shown. Please visit franklintempleton.com or call (800) 342-5236 for most recent month-end performance.

Economic and Market Overview
U.S. economic growth trends were generally encouraging during the six months under review, although economic expansion moderated in 2014’s fourth quarter. A wider trade deficit and lower federal government spending partially offset the positive effect from greater spending by consumers, businesses, and state and local governments. Manufacturing and non-manufacturing activities increased, and the unemployment rate declined to 5.7% in January 2015 from 6.2% in July 2014.3 The housing market improved as home prices rose in most metropolitan areas and mortgage rates declined for the six-month period. Retail sales rose for most of the period but softened near period-end.
1. REITs are real estate investment trust companies, usually with publicly traded stock, that manage a portfolio of income-producing real estate properties such as
apartments, hotels, industrial properties, office buildings or shopping centers. The Fund predominantly invests in “equity” REITs, which also take ownership positions in
real estate. Shareholders of equity REITs generally receive income from rents received and receive capital gains when properties are sold at a profit. REITs are generally
operated by experienced property management teams and typically concentrate on a specific geographic region or property type.
2. Source: Morningstar.
The index is unmanaged and includes reinvested dividends. One cannot invest directly in an index, and an index is not representative of the Fund’s portfolio.
3. Source: Bureau of Labor Statistics.
The dollar value, number of shares or principal amount, and names of all portfolio holdings are listed in the Fund’s Statement of Investments (SOI).
The SOI begins on page 16.
franklintempleton.com Semiannual Report | 3
FRANKLIN GLOBAL REAL ESTATE FUND
The U.S. Federal Reserve Board (Fed) ended its bond buying program in October 2014, based on its view that underlying economic strength could support ongoing progress in labor market conditions. The Fed stated that it could be patient with regard to raising interest rates and that it would consider inflationary pressures, labor market conditions, and financial and international developments in determining its next course of action.
The global economy overall expanded moderately during the period even though economic activity in some countries slowed. Major developed market central banks generally reaffirmed their accommodative monetary policies to support economic recovery. Several emerging market central banks cut interest rates to boost economic growth, while others raised rates to control inflation and currency depreciation.
The U.K. economy grew relatively well, supported by the services and manufacturing sectors. In the eurozone, the economy showed signs of improvement as the gross domestic product growth rate picked up in the third and fourth quarters of 2014, led by Germany, the region’s largest economy. In addition to maintaining a low benchmark interest rate and a negative bank deposit rate, the European Central Bank (ECB) implemented a major asset purchase program to boost inflation and stimulate the economy. Although the region benefited from lower oil prices, a weaker euro that supported exports and the ECB’s accommodative policy, it continued to face headwinds such as deflationary pressures and the crisis in Ukraine. Near period-end, concerns arose about Greece’s election of a new prime minister whose platform included restructuring the terms of the country’s debt and loosening austerity mandates.
Japan slid into recession in the third quarter, prompting the Bank of Japan (BOJ) to broaden its stimulus measures amid weak domestic demand and lower inflation resulting from falling crude oil prices. In December, Japan’s ruling coalition was reelected and announced a new stimulus package to revive economic growth. The country exited recession in the fourth quarter, supported largely by exports, while growth in domestic consumption and capital spending remained relatively soft.
Global developed market stocks, as measured by the MSCI World Index, declined slightly for the six-month period as investor concerns about global economic growth, particularly in the eurozone, Japan and China, and the future course of U.S. monetary policy overshadowed continued corporate profit strength. During the period, oil prices plummeted mainly because of strong supply. Despite benign global inflation and a
strong U.S. dollar, gold prices ended the period slightly higher after prices surged in January as oil prices weakened, the Swiss National Bank removed the franc’s peg to the euro and the ECB increased monetary stimulus.
Global Real Estate Market Overview
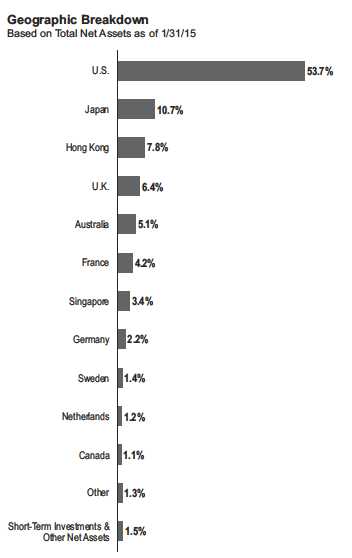
Global real estate markets overall made solid gains during the reporting period, as real estate securities in many countries benefited from generally improved global economic fundamentals. According to the FTSE EPRA/NAREIT Developed Index, in U.S. dollar terms, many countries posted positive results. The U.S., Germany and Switzerland led returns of country real estate markets. Hong Kong, Israel and the U.K. also performed well. However, most country real estate markets lost value, led by Greece, Japan and Finland.
4 | Semiannual Report franklintempleton.com
FRANKLIN GLOBAL REAL ESTATE FUND
Investment Strategy
We are research-driven, fundamental investors. We seek to limit price volatility by investing across markets and property types. We also seek to provide a consistently high level of income. We center our active investment strategy on the belief that unsynchronized regional economic activity within the global economy can provide consistent, attractive return opportunities in the global real estate markets. We use a bottom-up, value-oriented stock selection process that incorporates macro-level views in the evaluation process. We use top-down macro overlays to provide country/regional, property type and company size perspectives in identifying international/local cyclical and thematic trends that highlight investment opportunities. We may use currency forward contracts from time to time to help manage currency risk and the Fund’s exposure to various currencies.
What is a currency forward contract?
A currency forward contract is an agreement between the Fund and a counterparty to buy or sell a foreign currency at a specific exchange rate on a future date.
| | |
| Top 10 Holdings | | |
| 1/31/15 | | |
| Company | % of Total | |
| Sector/Industry, Country | Net Assets | |
| Simon Property Group Inc. | 5.2 | % |
| Retail REITs, U.S. | | |
| Mitsui Fudosan Co. Ltd. | 3.3 | % |
| Diversified Real Estate Activities, Japan | | |
| Unibail-Rodamco SE | 3.1 | % |
| Retail REITs, France | | |
| Equity Residential | 2.4 | % |
| Residential REITs, U.S. | | |
| Health Care REIT Inc. | 2.2 | % |
| Health Care REITs, U.S. | | |
| Mitsubishi Estate Co. Ltd. | 2.2 | % |
| Diversified Real Estate Activities, Japan | | |
| Prologis Inc. | 2.1 | % |
| Industrial REITs, U.S. | | |
| Boston Properties Inc. | 2.1 | % |
| Office REITs, U.S. | | |
| Vornado Realty Trust | 2.0 | % |
| Office REITs, U.S. | | |
| Host Hotels & Resorts Inc. | 1.9 | % |
| Hotel & Resort REITs, U.S. | | |
4. Self-storage REIT holdings are in specialized REITs in the SOI.
5. Global Logistics Properties is in real estate operating companies in the SOI.
See www.franklintempletondatasources.com for additional data provider information.
Manager’s Discussion
During the six months under review, key contributors to the Fund’s performance relative to the FTSE EPRA/NAREIT Developed Index included stock selection in the office space sector, particularly U.S.-based, mid-capitalization office REIT Kilroy Realty. Shares of the west coast-focused office landlord outperformed the index, largely reflecting strong office fundamentals, especially in the company’s core west coast markets of San Diego, West Los Angeles, San Francisco and Seattle. Since 2010, Kilroy has expanded successfully to new markets, including San Francisco and Seattle, where office fundamentals remained strong with healthy tenant demand and limited supply. In our view, Kilroy’s sizable near-term and long-term development pipelines could generate a bigger portion of its earnings as these developments begin operations.
The Fund’s investment in Extra Space Storage also enhanced relative performance, as the U.S.-based self-storage REIT outperformed the index and its peers.4 Self-storage fundamentals have remained solid, in our view, with strong demand and very limited supply proving especially beneficial. Extra Space Storage also started to receive increased revenue contributions from its recently completed acquisitions as they generated higher-than-expected occupancy levels.
The Fund’s position in U.S. regional mall operator General Growth Properties also boosted relative performance. Its shares rallied after Simon Property Group’s announcement of a stake in rival The Macerich Co. (both are Fund holdings) led many investors to believe there might be a potentially positive ripple effect for owners of high-quality malls, such as General Growth Properties. In addition, the company continued to deliver superior same-store, net-operating income growth relative to its peers, driven by strong rate spreads between expiring leases and new leases. The company’s growth outlook was further enhanced by several development projects in progress, the largest of which was the expansion of Honolulu’s Ala Moana Center, projected to deliver an initial yield of 9% to 10%.
In contrast, key detractors from the Fund’s relative performance included stock selection in the industrial property sector, notably Singapore-based Global Logistic Properties, whose shares lagged the benchmark index for the six-month period.5 The distribution facilities and services company announced the sale of a 34% stake in its China business in February 2014 and its foray into the U.S. market in December 2014. As a result,
franklintempleton.com
Semiannual Report | 5
FRANKLIN GLOBAL REAL ESTATE FUND
investors grew concerned about the company’s strategic initiatives and growth profile. Additionally, investors were worried about the potential impact of foreign currency exchange rates on the company’s U.S.-dollar denominated earnings and net asset value.
An underweighting in the health care property sector also hampered performance, particularly an underweighted position in U.S. large-capitalization, health care REIT Ventas, which outperformed the benchmark index during the reporting period. Despite the company’s positive core results, strong balance sheet and high-quality management, we became concerned about the company’s recent external growth initiatives, including its acquisition of American Realty Capital Healthcare Trust. Additionally, we believed that long-term interest rates would rise, thus hurting more rate-sensitive health care REITs with above-average dividend yields.
Other detractors included Japanese diversified real estate firm Mitsui Fudosan, whose shares underperformed those of its peers. Despite improving market fundamentals and the BOJ’s additional monetary easing, Mitsui Fudosan, along with other major Japanese developers, was hurt by concerns about economic weakness, the timing of another consumption tax hike and declining inflationary expectations against a backdrop of lower oil prices. Investors were also disappointed the company did not announce any new, specific investments in Japan after a significant stock sale in May 2014. Nevertheless, Mitsui Fudosan continued to make steady progress in various segments, such as office, retail and residential, and we believed the company was positioned to potentially generate robust earnings growth in the short term.
It is important to recognize the effect of currency movements on the Fund’s performance. In general, if the value of the U.S. dollar goes up compared with a foreign currency, an investment traded in that foreign currency will go down in value because it will be worth fewer U.S. dollars. This can have a negative effect on Fund performance. Conversely, when the U.S. dollar weakens in relation to a foreign currency, an investment traded in that foreign currency will increase in value, which can contribute to Fund performance. For the six months ended January 31, 2015, the U.S. dollar rose in value relative to most currencies. As a result, the Fund’s performance was negatively affected by the portfolio’s substantial investment in securities with non-U.S. currency exposure.
Thank you for your continued participation in Franklin Global Real Estate Fund. We look forward to serving your future investment needs.

The foregoing information reflects our analysis, opinions and portfolio holdings as of January 31, 2015, the end of the reporting period. The way we implement our main investment strategies and the resulting portfolio holdings may change depending on factors such as market and economic conditions. These opinions may not be relied upon as investment advice or an offer for a particular security. The information is not a complete analysis of every aspect of any market, country, industry, security or the Fund. Statements of fact are from sources considered reliable, but the investment manager makes no representation or warranty as to their completeness or accuracy. Although historical performance is no guarantee of future results, these insights may help you understand our investment management philosophy.
6 | Semiannual Report franklintempleton.com
FRANKLIN GLOBAL REAL ESTATE FUND
Performance Summary as of January 31, 2015
Your dividend income will vary depending on dividends or interest paid by securities in the Fund’s portfolio, adjusted for operating expenses of each class. Capital gain distributions are net profits realized from the sale of portfolio securities. The performance table does not reflect any taxes that a shareholder would pay on Fund dividends, capital gain distributions, if any, or any realized gains on the sale of Fund shares. Total return reflects reinvestment of the Fund’s dividends and capital gain distributions, if any, and any unrealized gains or losses.
| | | | | | |
| Net Asset Value | | | | | | |
| Share Class (Symbol) | | 1/31/15 | | 7/31/14 | | Change |
| A (FGRRX) | $ | 9.26 | $ | 8.69 | +$ | 0.57 |
| C (FCGRX) | $ | 9.17 | $ | 8.58 | +$ | 0.59 |
| R6 (n/a) | $ | 9.29 | $ | 8.74 | +$ | 0.55 |
| Advisor (FVGRX) | $ | 9.29 | $ | 8.73 | +$ | 0.56 |
| |
| |
| Distributions (8/1/14–1/31/15) | | | | | | |
| Dividend |
| Share Class | | Income | | | | |
| A | $ | 0.1267 | | | | |
| C | $ | 0.0768 | | | | |
| R6 | $ | 0.1652 | | | | |
| Advisor | $ | 0.1517 | | | | |
franklintempleton.com
Semiannual Report | 7
FRANKLIN GLOBAL REAL ESTATE FUND
PERFORMANCE SUMMARY
Performance as of 1/31/151
Cumulative total return excludes sales charges. Average annual total returns and value of $10,000 investment include maximum sales charges. Class A: 5.75% maximum initial sales charge; Class C: 1% contingent deferred sales charge in first year only;
Class R6/Advisor Class: no sales charges.
| | | | | | | | | | | | | | | |
| | | | | | | | | Value of | | Average Annual | | Total Annual | |
| | | Cumulative | | | Average Annual | | $ | 10,000 | | Total Return | | Operating Expenses6 | |
| Share Class | | Total Return2 | | | Total Return3 | | | Investment4 | | (12/31/14)5 | | (with waiver) | | (without waiver) | |
| A | | | | | | | | | | | | 1.45 | % | 1.61 | % |
| 6-Month | + | 8.14 | % | + | 1.92 | % | $ | 10,192 | | | | | | | |
| 1-Year | + | 21.88 | % | + | 14.88 | % | $ | 11,488 | + | 8.23 | % | | | | |
| 5-Year | + | 85.11 | % | + | 11.77 | % | $ | 17,443 | + | 9.66 | % | | | | |
| Since Inception (6/16/06) | + | 27.97 | % | + | 2.20 | % | $ | 12,061 | + | 1.64 | % | | | | |
| C | | | | | | | | | | | | 2.15 | % | 2.31 | % |
| 6-Month | + | 7.84 | % | + | 6.84 | % | $ | 10,684 | | | | | | | |
| 1-Year | + | 21.11 | % | + | 20.11 | % | $ | 12,011 | + | 13.09 | % | | | | |
| 5-Year | + | 78.58 | % | + | 12.30 | % | $ | 17,858 | + | 10.24 | % | | | | |
| Since Inception (6/16/06) | + | 20.63 | % | + | 2.20 | % | $ | 12,063 | + | 1.65 | % | | | | |
| R6 | | | | | | | | | | | | 0.99 | % | 1.15 | % |
| 6-Month | + | 8.35 | % | + | 8.35 | % | $ | 10,835 | | | | | | | |
| 1-Year | + | 22.50 | % | + | 22.50 | % | $ | 12,250 | + | 15.36 | % | | | | |
| Since Inception (5/1/13) | + | 10.97 | % | + | 6.12 | % | $ | 11,097 | + | 3.39 | % | | | | |
| Advisor | | | | | | | | | | | | 1.15 | % | 1.31 | % |
| 6-Month | + | 8.30 | % | + | 8.30 | % | $ | 10,830 | | | | | | | |
| 1-Year | + | 22.31 | % | + | 22.31 | % | $ | 12,231 | + | 15.18 | % | | | | |
| 5-Year | + | 87.60 | % | + | 13.41 | % | $ | 18,760 | + | 11.32 | % | | | | |
| Since Inception (6/16/06) | + | 31.43 | % | + | 3.22 | % | $ | 13,143 | + | 2.67 | % | | | | |
Performance data represent past performance, which does not guarantee future results. Investment return and principal value will fluctuate, and you may have a gain or loss when you sell your shares. Current performance may differ from figures shown. For most recent month-end performance, go to franklintempleton.com or call (800) 342-5236.
8 | Semiannual Report
franklintempleton.com
FRANKLIN GLOBAL REAL ESTATE FUND
PERFORMANCE SUMMARY
All investments involve risks, including possible loss of principal. The Fund concentrates in real estate securities, which involve special risks, such as declines in the value of real estate and increased susceptibility to adverse economic or regulatory developments affecting the sector. The Fund’s investments in REITs involve additional risks; since REITs typically are invested in a limited number of projects or in a particular market segment, they are more susceptible to adverse developments affecting a single project or market segment than more broadly diversified investments. Foreign investing, especially in emerging markets, involves additional risks such as currency and market volatility, as well as political and social instability. The Fund is actively managed but there is no guarantee that the manager’s investment decisions will produce the desired results. The Fund’s prospectus also includes a description of the main investment risks.
| |
| Class C: | These shares have higher annual fees and expenses than Class A shares. |
| Class R6: | Shares are available to certain eligible investors as described in the prospectus. |
| Advisor Class: | Shares are available to certain eligible investors as described in the prospectus. |
1. The Fund has an expense reduction contractually guaranteed through at least 11/30/16. Fund investment results reflect the expense reduction, to the extent applicable;
without this reduction, the results would have been lower.
2. Cumulative total return represents the change in value of an investment over the periods indicated.
3. Average annual total return represents the average annual change in value of an investment over the periods indicated. Six-month return has not been annualized.
4. These figures represent the value of a hypothetical $10,000 investment in the Fund over the periods indicated.
5. In accordance with SEC rules, we provide standardized average annual total return information through the latest calendar quarter.
6. Figures are as stated in the Fund’s current prospectus. In periods of market volatility, assets may decline significantly, causing total annual Fund operating expenses to
become higher than the figures shown.
franklintempleton.com
Semiannual Report | 9
FRANKLIN GLOBAL REAL ESTATE FUND
Your Fund’s Expenses
As a Fund shareholder, you can incur two types of costs:
- Transaction costs, including sales charges (loads) on Fund purchases; and
- Ongoing Fund costs, including management fees, distribu- tion and service (12b-1) fees, and other Fund expenses. All mutual funds have ongoing costs, sometimes referred to as operating expenses.
The following table shows ongoing costs of investing in the Fund and can help you understand these costs and compare them with those of other mutual funds. The table assumes a $1,000 investment held for the six months indicated.
Actual Fund Expenses
The first line (Actual) for each share class listed in the table provides actual account values and expenses. The “Ending Account Value” is derived from the Fund’s actual return, which includes the effect of Fund expenses.
You can estimate the expenses you paid during the period by following these steps. Of course, your account value and expenses will differ from those in this illustration:
| 1. | Divide your account value by $1,000. |
| | If an account had an $8,600 value, then $8,600 ÷ $1,000 = 8.6. |
| 2. | Multiply the result by the number under the heading “Expenses Paid During Period.” |
| | If Expenses Paid During Period were $7.50, then 8.6 x $7.50 = $64.50. |
In this illustration, the estimated expenses paid this period are $64.50.
Hypothetical Example for Comparison with Other Funds
Information in the second line (Hypothetical) for each class in the table can help you compare ongoing costs of investing in the Fund with those of other mutual funds. This information may not be used to estimate the actual ending account balance or expenses you paid during the period. The hypothetical “Ending Account Value” is based on the actual expense ratio for each class and an assumed 5% annual rate of return before expenses, which does not represent the Fund’s actual return. The figure under the heading “Expenses Paid During Period” shows the hypothetical expenses your account would have incurred under this scenario. You can compare this figure with the 5% hypothetical examples that appear in shareholder reports of other funds.
Please note that expenses shown in the table are meant to highlight ongoing costs and do not reflect any transaction costs, such as sales charges. Therefore, the second line for each class is useful in comparing ongoing costs only, and will not help you compare total costs of owning different funds. In addition, if transaction costs were included, your total costs would have been higher. Please refer to the Fund prospectus for additional information on operating expenses.
10 | Semiannual Report
franklintempleton.com
FRANKLIN GLOBAL REAL ESTATE FUND
YOUR FUND’S EXPENSES
| | | | | | |
| | | Beginning Account | | Ending Account | | Expenses Paid During |
| Share Class | | Value 8/1/14 | | Value 1/31/15 | | Period* 8/1/14–1/31/15 |
| A | | | | | | |
| Actual | $ | 1,000 | $ | 1,081.40 | $ | 7.61 |
| Hypothetical (5% return before expenses) | $ | 1,000 | $ | 1,017.90 | $ | 7.37 |
| C | | | | | | |
| Actual | $ | 1,000 | $ | 1,078.40 | $ | 11.26 |
| Hypothetical (5% return before expenses) | $ | 1,000 | $ | 1,014.37 | $ | 10.92 |
| R6 | | | | | | |
| Actual | $ | 1,000 | $ | 1,083.50 | $ | 5.20 |
| Hypothetical (5% return before expenses) | $ | 1,000 | $ | 1,020.21 | $ | 5.04 |
| Advisor | | | | | | |
| Actual | $ | 1,000 | $ | 1,083.00 | $ | 6.04 |
| Hypothetical (5% return before expenses) | $ | 1,000 | $ | 1,019.41 | $ | 5.85 |
*Expenses are calculated using the most recent six-month expense ratio, net of expense waivers, annualized for each class (A: 1.45%;
C: 2.15%; R6: 0.99%; and Advisor: 1.15%), multiplied by the average account value over the period, multiplied by 184/365 to reflect the
one-half year period.
franklintempleton.com
Semiannual Report | 11
| | | | | | | | | | | | | | | | | | |
| FRANKLIN GLOBAL TRUST | | | | | | | | | | | | | | | | | | |
| |
| |
| Financial Highlights | | | | | | | | | | | | | | | | | | |
| Franklin Global Real Estate Fund | | | | | | | | | | | | | | | | | | |
| | | Six Months Ended | | | | | | | | | | | | | | | | |
| | | January 31, 2015 | | | | | | | | | Year Ended July 31, | | | | |
| | | (unaudited) | | | 2014 | | | 2013 | | | 2012 | | | 2011 | | | 2010 | |
| Class A | | | | | | | | | | | | | | | | | | |
| Per share operating performance | | | | | | | | | | | | | | | | | | |
| (for a share outstanding throughout the period) | | | | | | | | | | | | | | | | | | |
| Net asset value, beginning of period | $ | 8.69 | | $ | 7.88 | | $ | 7.42 | | $ | 7.21 | | $ | 6.40 | | $ | 5.07 | |
| Income from investment operationsa: | | | | | | | | | | | | | | | | | | |
| Net investment incomeb | | 0.02 | | | 0.11 | | | 0.11 | | | 0.12 | | | 0.13 | | | 0.14 | |
| Net realized and unrealized gains | | | | | | | | | | | | | | | | | | |
| (losses) | | 0.68 | | | 0.82 | | | 0.59 | | | 0.17 | | | 1.05 | | | 1.43 | |
| Total from investment operations | | 0.70 | | | 0.93 | | | 0.70 | | | 0.29 | | | 1.18 | | | 1.57 | |
| Less distributions from net investment | | | | | | | | | | | | | | | | | | |
| income | | (0.13 | ) | | (0.12 | ) | | (0.24 | ) | | (0.08 | ) | | (0.37 | ) | | (0.24 | ) |
| Net asset value, end of period | $ | 9.26 | | $ | 8.69 | | $ | 7.88 | | $ | 7.42 | | $ | 7.21 | | $ | 6.40 | |
| |
| Total returnc | | 8.14 | % | | 12.13 | % | | 9.44 | % | | 4.12 | % | | 18.98 | % | | 31.43 | % |
| |
| Ratios to average net assetsd | | | | | | | | | | | | | | | | | | |
| Expenses before waiver and payments by | | | | | | | | | | | | | | | | | | |
| affiliates and expense reduction | | 1.59 | % | | 1.61 | % | | 1.62 | % | | 1.68 | % | | 1.73 | % | | 1.85 | % |
| Expenses net of waiver and payments by | | | | | | | | | | | | | | | | | | |
| affiliates and expense reduction | | 1.45 | %e | | 1.45 | %e | | 1.44 | %e | | 1.37 | % | | 1.35 | %e | | 1.35 | %e |
| Net investment income | | 0.50 | % | | 1.31 | % | | 1.37 | % | | 1.72 | % | | 2.02 | % | | 2.55 | % |
| |
| Supplemental data | | | | | | | | | | | | | | | | | | |
| Net assets, end of period (000’s) | $ | 100,194 | | $ | 90,653 | | $ | 86,575 | | $ | 53,727 | | $ | 57,141 | | $ | 29,918 | |
| Portfolio turnover rate | | 8.41 | % | | 22.37 | % | | 19.43 | % | | 25.74 | % | | 53.12 | % | | 106.64 | % |
aThe amount shown for a share outstanding throughout the period may not correlate with the Statement of Operations for the period due to the timing of sales and
repurchases of the Fund shares in relation to income earned and/or fluctuating fair value of the investments of the Fund.
bBased on average daily shares outstanding.
cTotal return does not reflect sales commissions or contingent deferred sales charges, if applicable, and is not annualized for periods less than one year.
dRatios are annualized for periods less than one year.
eBenefit of expense reduction rounds to less than 0.01%.
12 | Semiannual Report | The accompanying notes are an integral part of these financial statements. franklintempleton.com
FRANKLIN GLOBAL TRUST
FINANCIAL HIGHLIGHTS
| | | | | | | | | | | | | | | | | | |
| Franklin Global Real Estate Fund (continued) | | | | | | | | | | | | | | | | |
| | | Six Months Ended | | | | | | | | | | | | | | | | |
| | | January 31, 2015 | | | | | | | | | Year Ended July 31, | | | | |
| | | (unaudited) | | | 2014 | | | 2013 | | | 2012 | | | 2011 | | | 2010 | |
| Class C | | | | | | | | | | | | | | | | | | |
| Per share operating performance | | | | | | | | | | | | | | | | | | |
| (for a share outstanding throughout the period) | | | | | | | | | | | | | | | | | | |
| Net asset value, beginning of period | $ | 8.58 | | $ | 7.80 | | $ | 7.34 | | $ | 7.17 | | $ | 6.35 | | $ | 5.03 | |
| Income from investment operationsa: | | | | | | | | | | | | | | | | | | |
| Net investment income (loss)b | | (0.01 | ) | | 0.05 | | | 0.05 | | | 0.07 | | | 0.09 | | | 0.10 | |
| Net realized and unrealized gains | | | | | | | | | | | | | | | | | | |
| (losses) | | 0.68 | | | 0.81 | | | 0.59 | | | 0.16 | | | 1.04 | | | 1.42 | |
| Total from investment operations | | 0.67 | | | 0.86 | | | 0.64 | | | 0.23 | | | 1.13 | | | 1.52 | |
| Less distributions from net investment | | | | | | | | | | | | | | | | | | |
| income | | (0.08 | ) | | (0.08 | ) | | (0.18 | ) | | (0.06 | ) | | (0.31 | ) | | (0.20 | ) |
| Net asset value, end of period | $ | 9.17 | | $ | 8.58 | | $ | 7.80 | | $ | 7.34 | | $ | 7.17 | | $ | 6.35 | |
| |
| Total returnc | | 7.84 | % | | 11.28 | % | | 8.64 | % | | 3.39 | % | | 18.30 | % | | 30.62 | % |
| |
| Ratios to average net assetsd | | | | | | | | | | | | | | | | | | |
| Expenses before waiver and payments by | | | | | | | | | | | | | | | | | | |
| affiliates and expense reduction | | 2.29 | % | | 2.31 | % | | 2.32 | % | | 2.38 | % | | 2.43 | % | | 2.55 | % |
| Expenses net of waiver and payments by | | | | | | | | | | | | | | | | | | |
| affiliates and expense reduction | | 2.15 | %e | | 2.15 | %e | | 2.14 | %e | | 2.07 | % | | 2.05 | %e | | 2.05 | %e |
| Net investment income (loss) | | (0.20 | )% | | 0.61 | % | | 0.67 | % | | 1.02 | % | | 1.32 | % | | 1.85 | % |
| |
| Supplemental data | | | | | | | | | | | | | | | | | | |
| Net assets, end of period (000’s) | $ | 23,171 | | $ | 20,896 | | $ | 21,350 | | $ | 12,043 | | $ | 11,835 | | $ | 7,589 | |
| Portfolio turnover rate | | 8.41 | % | | 22.37 | % | | 19.43 | % | | 25.74 | % | | 53.12 | % | | 106.64 | % |
aThe amount shown for a share outstanding throughout the period may not correlate with the Statement of Operations for the period due to the timing of sales and
repurchases of the Fund shares in relation to income earned and/or fluctuating fair value of the investments of the Fund.
bBased on average daily shares outstanding.
cTotal return does not reflect sales commissions or contingent deferred sales charges, if applicable, and is not annualized for periods less than one year.
dRatios are annualized for periods less than one year.
eBenefit of expense reduction rounds to less than 0.01%.
franklintempleton.com The accompanying notes are an integral part of these financial statements. | Semiannual Report | 13
FRANKLIN GLOBAL TRUST
FINANCIAL HIGHLIGHTS
| | | | | | | | | |
| Franklin Global Real Estate Fund (continued) | | | | | | | | | |
| | | Six Months Ended | | | Year Ended | |
| | | January 31, 2015 | | | July 31, | |
| | | (unaudited) | | | 2014 | | | 2013 | a |
| Class R6 | | | | | | | | | |
| Per share operating performance | | | | | | | | | |
| (for a share outstanding throughout the period) | | | | | | | | | |
| Net asset value, beginning of period | $ | 8.74 | | $ | 7.92 | | $ | 8.70 | |
| Income from investment operationsb: | | | | | | | | | |
| Net investment incomec | | 0.05 | | | 0.15 | | | 0.04 | |
| Net realized and unrealized gains (losses) | | 0.67 | | | 0.82 | | | (0.82 | ) |
| Total from investment operations | | 0.72 | | | 0.97 | | | (0.78 | ) |
| Less distributions from net investment income | | (0.17 | ) | | (0.15 | ) | | — | |
| Net asset value, end of period | $ | 9.29 | | $ | 8.74 | | $ | 7.92 | |
| |
| Total returnd | | 8.35 | % | | 12.51 | % | | (8.97 | )% |
| |
| Ratios to average net assetse | | | | | | | | | |
| Expenses before waiver and payments by affiliates and expense reduction | | 1.14 | % | | 1.15 | % | | 1.15 | % |
| Expenses net of waiver and payments by affiliates and expense reductionf | | 0.99 | % | | 0.99 | % | | 0.99 | % |
| Net investment income | | 0.96 | % | | 1.77 | % | | 1.82 | % |
| |
| Supplemental data | | | | | | | | | |
| Net assets, end of period (000’s) | $ | 515 | | $ | 768 | | $ | 379 | |
| Portfolio turnover rate | | 8.41 | % | | 22.37 | % | | 19.43 | % |
aFor the period May 1, 2013 (effective date) to July 31, 2013.
bThe amount shown for a share outstanding throughout the period may not correlate with the Statement of Operations for the period due to the timing of sales and
repurchases of the Fund shares in relation to income earned and/or fluctuating fair value of the investments of the Fund.
cBased on average daily shares outstanding.
dTotal return is not annualized for periods less than one year.
eRatios are annualized for periods less than one year.
fBenefit of expense reduction rounds to less than 0.01%.
14 | Semiannual Report | The accompanying notes are an integral part of these financial statements. franklintempleton.com
FRANKLIN GLOBAL TRUST
FINANCIAL HIGHLIGHTS
| | | | | | | | | | | | | | | | | | |
| Franklin Global Real Estate Fund (continued) | | | | | | | | | | | | | | | | |
| | | Six Months Ended | | | | | | | | | | | | | | | | |
| | | January 31, 2015 | | | | | | | | | Year Ended July 31, | | | | |
| | | (unaudited) | | | 2014 | | | 2013 | | | 2012 | | | 2011 | | | 2010 | |
| Advisor Class | | | | | | | | | | | | | | | | | | |
| Per share operating performance | | | | | | | | | | | | | | | | | | |
| (for a share outstanding throughout the period) | | | | | | | | | | | | | | | | | | |
| Net asset value, beginning of period | $ | 8.73 | | $ | 7.91 | | $ | 7.46 | | $ | 7.23 | | $ | 6.42 | | $ | 5.08 | |
| Income from investment operationsa: | | | | | | | | | | | | | | | | | | |
| Net investment incomeb | | 0.04 | | | 0.13 | | | 0.13 | | | 0.13 | | | 0.17 | | | 0.18 | |
| Net realized and unrealized gains | | | | | | | | | | | | | | | | | | |
| (losses) | | 0.67 | | | 0.83 | | | 0.59 | | | 0.18 | | | 1.03 | | | 1.41 | |
| Total from investment operations | | 0.71 | | | 0.96 | | | 0.72 | | | 0.31 | | | 1.20 | | | 1.59 | |
| Less distributions from net investment | | | | | | | | | | | | | | | | | | |
| income | | (0.15 | ) | | (0.14 | ) | | (0.27 | ) | | (0.08 | ) | | (0.39 | ) | | (0.25 | ) |
| Net asset value, end of period | $ | 9.29 | | $ | 8.73 | | $ | 7.91 | | $ | 7.46 | | $ | 7.23 | | $ | 6.42 | |
| |
| Total returnc | | 8.30 | % | | 12.39 | % | | 9.78 | % | | 4.48 | % | | 19.33 | % | | 31.92 | % |
| |
| Ratios to average net assetsd | | | | | | | | | | | | | | | | | | |
| Expenses before waiver and payments by | | | | | | | | | | | | | | | | | | |
| affiliates and expense reduction | | 1.29 | % | | 1.31 | % | | 1.32 | % | | 1.38 | % | | 1.43 | % | | 1.55 | % |
| Expenses net of waiver and payments by | | | | | | | | | | | | | | | | | | |
| affiliates and expense reduction | | 1.15 | %e | | 1.15 | %e | | 1.14 | %e | | 1.07 | % | | 1.05 | %e | | 1.05 | %e |
| Net investment income | | 0.80 | % | | 1.61 | % | | 1.67 | % | | 2.02 | % | | 2.32 | % | | 2.85 | % |
| |
| Supplemental data | | | | | | | | | | | | | | | | | | |
| Net assets, end of period (000’s) | $ | 54,305 | | $ | 52,423 | | $ | 48,116 | | $ | 39,255 | | $ | 27,074 | | $ | 21,354 | |
| Portfolio turnover rate | | 8.41 | % | | 22.37 | % | | 19.43 | % | | 25.74 | % | | 53.12 | % | | 106.64 | % |
aThe amount shown for a share outstanding throughout the period may not correlate with the Statement of Operations for the period due to the timing of sales and
repurchases of the Fund shares in relation to income earned and/or fluctuating fair value of the investments of the Fund.
bBased on average daily shares outstanding.
cTotal return is not annualized for periods less than one year.
dRatios are annualized for periods less than one year.
eBenefit of expense reduction rounds to less than 0.01%.
franklintempleton.com The accompanying notes are an integral part of these financial statements. | Semiannual Report | 15
| | | | |
| FRANKLIN GLOBAL TRUST | | | | |
| |
| |
| |
| |
| Statement of Investments, January 31, 2015 (unaudited) | | | | |
| |
| Franklin Global Real Estate Fund | | | | |
| | | Shares/Units/ | | |
| | Country | Warrants | | Value |
| Common Stocks and Other Equity Interests 98.5% | | | | |
| Diversified Real Estate Activities 10.4% | | | | |
| CapitaLand Ltd. | Singapore | 559,924 | $ | 1,439,840 |
| Hang Lung Properties Ltd. | Hong Kong | 225,621 | | 662,110 |
| Mitsubishi Estate Co. Ltd. | Japan | 193,854 | | 3,933,521 |
| Mitsui Fudosan Co. Ltd. | Japan | 230,595 | | 5,890,268 |
| Sun Hung Kai Properties Ltd. | Hong Kong | 163,727 | | 2,669,542 |
| Sun Hung Kai Properties Ltd., wts., 4/22/16 | Hong Kong | 13,577 | | 49,038 |
| Tokyo Tatemono Co. Ltd. | Japan | 236,781 | | 1,612,606 |
| The Wharf Holdings Ltd. | Hong Kong | 278,694 | | 2,273,828 |
| | | | | 18,530,753 |
| Diversified REITs 11.1% | | | | |
| aActivia Properties Inc., 144A | Japan | 119 | | 1,066,760 |
| American Assets Trust Inc. | United States | 30,143 | | 1,337,746 |
| British Land Co. PLC | United Kingdom | 178,571 | | 2,231,202 |
| Canadian REIT | Canada | 24,050 | | 912,855 |
| Hulic REIT Inc. | Japan | 257 | | 385,943 |
| aHulic REIT Inc., 144A | Japan | 509 | | 764,378 |
| Kenedix Office Investment Corp. | Japan | 256 | | 1,523,381 |
| Land Securities Group PLC | United Kingdom | 152,805 | | 2,932,368 |
| Liberty Property Trust | United States | 12,466 | | 502,380 |
| Mirvac Group | Australia | 730,640 | | 1,097,508 |
| Spirit Realty Capital Inc. | United States | 68,100 | | 875,766 |
| Stockland | Australia | 542,221 | | 1,848,406 |
| Suntec REIT | Singapore | 625,794 | | 869,351 |
| TF Administradora Industrial S de RL de CV | Mexico | 184,500 | | 394,340 |
| aTF Administradora Industrial S de RL de CV, 144A | Mexico | 167,800 | | 358,646 |
| Wereldhave N.V. | Netherlands | 18,736 | | 1,350,123 |
| WP Carey Inc. | United States | 17,018 | | 1,222,063 |
| | | | | 19,673,216 |
| Health Care REITs 6.5% | | | | |
| HCP Inc. | United States | 69,454 | | 3,284,480 |
| Health Care REIT Inc. | United States | 48,658 | | 3,987,523 |
| Sabra Health Care REIT Inc. | United States | 26,660 | | 871,782 |
| Senior Housing Properties Trust | United States | 36,471 | | 849,410 |
| Ventas Inc. | United States | 32,109 | | 2,562,619 |
| | | | | 11,555,814 |
| Hotel & Resort REITs 4.1% | | | | |
| Hoshino Resorts REIT Inc. | Japan | 41 | | 466,318 |
| Host Hotels & Resorts Inc. | United States | 146,620 | | 3,356,132 |
| Pebblebrook Hotel Trust | United States | 46,760 | | 2,171,534 |
| Sunstone Hotel Investors Inc. | United States | 76,168 | | 1,298,664 |
| | | | | 7,292,648 |
| Hotels, Resorts & Cruise Lines 0.2% | | | | |
| Melia Hotels International SA | Spain | 33,672 | | 387,413 |
| Industrial REITs 5.8% | | | | |
| Ascendas REIT | Singapore | 133,003 | | 241,770 |
| aAscendas REIT, 144A | Singapore | 59,000 | | 107,249 |
| First Industrial Realty Trust Inc. | United States | 32,800 | | 712,744 |
| |
| |
| |
| 16 | Semiannual Report | | franklintempleton.com |
| | | | |
| | | FRANKLIN GLOBAL TRUST |
| | STATEMENT OF INVESTMENTS (UNAUDITED) |
| |
| |
| |
| |
| Franklin Global Real Estate Fund (continued) | | | | |
| | | Shares/Units/ | | |
| | Country | Warrants | | Value |
| Common Stocks and Other Equity Interests (continued) | | | | |
| Industrial REITs (continued) | | | | |
| aGLP J-REIT, 144A | Japan | 400 | $ | 455,625 |
| Goodman Group | Australia | 422,482 | | 2,015,653 |
| Mapletree Logistics Trust | Singapore | 696,737 | | 617,811 |
| Nippon Prologis REIT Inc. | Japan | 319 | | 753,336 |
| aNippon Prologis REIT Inc., 144A | Japan | 228 | | 538,434 |
| Prologis Inc. | United States | 84,720 | | 3,824,261 |
| STAG Industrial Inc. | United States | 42,033 | | 1,101,265 |
| | | | | 10,368,148 |
| Office REITs 13.9% | | | | |
| Alexandria Real Estate Equities Inc. | United States | 20,984 | | 2,046,360 |
| Boston Properties Inc. | United States | 27,332 | | 3,793,682 |
| Brandywine Realty Trust | United States | 56,997 | | 946,720 |
| Coresite Realty Corp. | United States | 8,031 | | 351,838 |
| Derwent London PLC | United Kingdom | 35,668 | | 1,748,804 |
| Digital Realty Trust Inc. | United States | 24,427 | | 1,781,705 |
| Douglas Emmett Inc. | United States | 28,740 | | 818,515 |
| Great Portland Estates PLC | United Kingdom | 147,873 | | 1,749,631 |
| Highwoods Properties Inc. | United States | 26,866 | | 1,262,702 |
| Japan Real Estate Investment Corp. | Japan | 226 | | 1,102,439 |
| Kilroy Realty Corp. | United States | 34,530 | | 2,560,400 |
| bParamount Group Inc. | United States | 25,960 | | 502,326 |
| SL Green Realty Corp. | United States | 20,059 | | 2,527,434 |
| Vornado Realty Trust | United States | 32,925 | | 3,636,237 |
| | | | | 24,828,793 |
| Real Estate Development 1.9% | | | | |
| China Overseas Land & Investment Ltd. | China | 240,158 | | 700,124 |
| Keppel Land Ltd. | Singapore | 355,646 | | 1,193,108 |
| KWG Property Holdings Ltd. | China | 740,500 | | 479,511 |
| Sino Land Co. Ltd. | Hong Kong | 642,645 | | 1,080,981 |
| | | | | 3,453,724 |
| Real Estate Operating Companies 7.5% | | | | |
| Brookfield Property Partners LP | United States | 29,700 | | 716,082 |
| Castellum AB | Sweden | 45,150 | | 710,431 |
| Deutsche Euroshop AG | Germany | 17,217 | | 798,681 |
| aDeutsche Euroshop AG, 144A | Germany | 2,920 | | 135,456 |
| bGAGFAH SA | Germany | 58,040 | | 1,292,940 |
| a,bGAGFAH SA, 144A | Germany | 8,190 | | 182,446 |
| Global Logistic Properties Ltd. | Singapore | 666,310 | | 1,245,669 |
| bHemfosa Fastigheter AB | Sweden | 17,840 | | 383,767 |
| a,bHemfosa Fastigheter AB, 144A | Sweden | 17,755 | | 381,939 |
| a,bHispania Activos Inmobiliarios SAU, 144A | Spain | 15,956 | | 213,953 |
| Hong Kong Land Holdings Ltd. | Hong Kong | 398,459 | | 2,952,581 |
| Hufvudstaden AB, A | Sweden | 76,426 | | 1,002,130 |
| Hysan Development Co. Ltd. | Hong Kong | 240,624 | | 1,168,620 |
| LEG Immobilien AG | Germany | 3,320 | | 254,767 |
| aLEG Immobilien AG, 144A | Germany | 15,474 | | 1,187,430 |
| Unite Group PLC | United Kingdom | 80,603 | | 594,799 |
| aUnite Group PLC, 144A | United Kingdom | 4,373 | | 32,270 |
| | | | | 13,253,961 |
| |
| franklintempleton.com | | Semiannual Report | 17 |
FRANKLIN GLOBAL TRUST
STATEMENT OF INVESTMENTS (UNAUDITED)
| | | | |
| Franklin Global Real Estate Fund (continued) | | | | |
| | | Shares/Units/ | | |
| | Country | Warrants | | Value |
| Common Stocks and Other Equity Interests (continued) | | | | |
| Residential REITs 9.3% | | | | |
| Apartment Investment & Management Co., A | United States | 45,997 | $ | 1,833,440 |
| AvalonBay Communities Inc. | United States | 14,048 | | 2,430,164 |
| Camden Property Trust | United States | 7,836 | | 603,764 |
| Education Realty Trust Inc. | United States | 6,533 | | 226,042 |
| Equity Lifestyle Properties Inc. | United States | 26,902 | | 1,472,346 |
| Equity Residential | United States | 54,023 | | 4,192,725 |
| Essex Property Trust Inc. | United States | 12,300 | | 2,780,415 |
| Invincible Investment Corp. | Japan | 992 | | 444,211 |
| Post Properties Inc. | United States | 12,096 | | 734,832 |
| UDR Inc. | United States | 54,797 | | 1,822,548 |
| | | | | 16,540,487 |
| Retail REITs 24.1% | | | | |
| CapitaMall Trust | Singapore | 161,794 | | 249,870 |
| DDR Corp. | United States | 69,190 | | 1,356,124 |
| Eurocommercial Properties NV, IDR | Netherlands | 16,854 | | 752,045 |
| Federal Realty Investment Trust | United States | 11,940 | | 1,716,614 |
| Federation Centres | Australia | 359,654 | | 848,154 |
| General Growth Properties Inc. | United States | 109,316 | | 3,299,157 |
| Hammerson PLC | United Kingdom | 197,743 | | 2,050,768 |
| Kimco Realty Corp. | United States | 37,251 | | 1,029,990 |
| Klepierre | France | 40,418 | | 1,908,969 |
| The Link REIT | Hong Kong | 418,966 | | 2,853,528 |
| The Macerich Co. | United States | 21,393 | | 1,840,012 |
| Realty Income Corp. | United States | 17,124 | | 930,004 |
| Regency Centers Corp. | United States | 23,981 | | 1,644,137 |
| RioCan REIT | Canada | 44,533 | | 1,031,999 |
| bScentre Group | Australia | 626,549 | | 1,853,044 |
| Simon Property Group Inc. | United States | 46,810 | | 9,299,275 |
| Taubman Centers Inc. | United States | 16,771 | | 1,374,384 |
| Unibail-Rodamco SE | France | 19,716 | | 5,570,272 |
| bUrban Edge Properties | United States | 16,462 | | 390,808 |
| Weingarten Realty Investors | United States | 35,060 | | 1,314,049 |
| Westfield Corp. | Australia | 216,196 | | 1,659,096 |
| | | | | 42,972,299 |
| Specialized REITs 3.7% | | | | |
| CubeSmart | United States | 54,247 | | 1,336,646 |
| Extra Space Storage Inc. | United States | 29,971 | | 1,978,086 |
| Public Storage | United States | 16,388 | | 3,291,366 |
| | | | | 6,606,098 |
| Total Common Stocks and Other Equity Interests | | | | |
| (Cost $120,464,674) | | | | 175,463,354 |
18 | Semiannual Report franklintempleton.com
| | | | | |
| | | FRANKLIN GLOBAL TRUST | |
| | STATEMENT OF INVESTMENTS (UNAUDITED) | |
| |
| |
| |
| |
| Franklin Global Real Estate Fund (continued) | | | | | |
| | | Principal | | | |
| | Country | Amount* | | Value | |
| Short Term Investments (Cost $3,000,000) 1.7% | | | | | |
| Time Deposits 1.7% | | | | | |
| Royal Bank of Canada, 0.05%, 2/02/15 | Canada | 3,000,000 | $ | 3,000,000 | |
| Total Investments (Cost $123,464,674) 100.2% | | | | 178,463,354 | |
| Other Assets, less Liabilities (0.2)% | | | | (277,950 | ) |
| Net Assets 100.0% | | | $ | 178,185,404 | |
See Abbreviations on page 31.
*The principal amount is stated in U.S. dollars unless otherwise indicated.
aSecurity was purchased pursuant to Rule 144A under the Securities Act of 1933 and may be sold in transactions exempt from registration only to qualified institutional buyers
or in a public offering registered under the Securities Act of 1933. These securities have been deemed liquid under guidelines approved by the Trust’s Board of Trustees. At
January 31, 2015, the aggregate value of these securities was $5,424,586, representing 3.04% of net assets.
bNon-income producing.
franklintempleton.com The accompanying notes are an integral part of these financial statements. | Semiannual Report | 19
| | | |
| FRANKLIN GLOBAL TRUST | | | |
| |
| |
| |
| |
| Financial Statements | | | |
| |
| Statement of Assets and Liabilities | | | |
| January 31, 2015 (unaudited) | | | |
| |
| Franklin Global Real Estate Fund | | | |
| |
| Assets: | | | |
| Investments in securities: | | | |
| Cost | $ | 123,464,674 | |
| Value | $ | 178,463,354 | |
| Cash | | 107,269 | |
| Foreign currency, at value (cost $28,383) | | 28,171 | |
| Receivables: | | | |
| Investment securities sold | | 139,648 | |
| Capital shares sold | | 249,745 | |
| Dividends | | 280,261 | |
| Other assets | | 155 | |
| Total assets | | 179,268,603 | |
| Liabilities: | | | |
| Payables: | | | |
| Investment securities purchased | | 729,340 | |
| Capital shares redeemed | | 71,880 | |
| Management fees | | 129,204 | |
| Distribution fees | | 44,409 | |
| Transfer agent fees | | 52,460 | |
| Accrued expenses and other liabilities | | 55,906 | |
| Total liabilities | | 1,083,199 | |
| Net assets, at value | $ | 178,185,404 | |
| Net assets consist of: | | | |
| Paid-in capital | $ | 191,936,422 | |
| Distributions in excess of net investment income | | (3,286,731 | ) |
| Net unrealized appreciation (depreciation) | | 54,992,239 | |
| Accumulated net realized gain (loss) | | (65,456,526 | ) |
| Net assets, at value | $ | 178,185,404 | |
20 | Semiannual Report | The accompanying notes are an integral part of these financial statements. franklintempleton.com
FRANKLIN GLOBAL TRUST
FINANCIAL STATEMENTS
| | |
| Statement of Assets and Liabilities (continued) | | |
| January 31, 2015 (unaudited) | | |
| |
| Franklin Global Real Estate Fund | | |
| |
| Class A: | | |
| Net assets, at value | $ | 100,194,390 |
| Shares outstanding | | 10,820,172 |
| Net asset value per sharea | $ | 9.26 |
| Maximum offering price per share (net asset value per share ÷ 94.25%) | $ | 9.82 |
| Class C: | | |
| Net assets, at value | $ | 23,171,443 |
| Shares outstanding | | 2,527,589 |
| Net asset value and maximum offering price per sharea | $ | 9.17 |
| Class R6: | | |
| Net assets, at value | $ | 514,796 |
| Shares outstanding | | 55,412 |
| Net asset value and maximum offering price per share | $ | 9.29 |
| Advisor Class: | | |
| Net assets, at value | $ | 54,304,775 |
| Shares outstanding | | 5,842,852 |
| Net asset value and maximum offering price per share | $ | 9.29 |
aRedemption price is equal to net asset value less contingent deferred sales charges, if applicable.
franklintempleton.com The accompanying notes are an integral part of these financial statements. | Semiannual Report | 21
|
| FRANKLIN GLOBAL TRUST |
| FINANCIAL STATEMENTS |
| | | |
| Statement of Operations | | | |
| for the six months ended January 31, 2015 (unaudited) | | | |
| |
| Franklin Global Real Estate Fund | | | |
| |
| Investment income: | | | |
| Dividends | $ | 1,639,366 | |
| Interest | | 485 | |
| Income from securities loaned | | 1,371 | |
| Total investment income | | 1,641,222 | |
| Expenses: | | | |
| Management fees (Note 3a) | | 840,198 | |
| Distribution fees: (Note 3c) | | | |
| Class A | | 139,113 | |
| Class C | | 107,162 | |
| Transfer agent fees: (Note 3e) | | | |
| Class A | | 78,457 | |
| Class C | | 18,133 | |
| Class R6 | | 57 | |
| Advisor Class | | 45,019 | |
| Custodian fees (Note 4) | | 6,183 | |
| Reports to shareholders | | 19,899 | |
| Registration and filing fees | | 37,734 | |
| Professional fees | | 25,259 | |
| Trustees’ fees and expenses | | 3,114 | |
| Other | | 7,827 | |
| Total expenses | | 1,328,155 | |
| Expense reductions (Note 4) | | (60 | ) |
| Expenses waived/paid by affiliates (Note 3f) | | (116,669 | ) |
| Net expenses | | 1,211,426 | |
| Net investment income | | 429,796 | |
| Realized and unrealized gains (losses): | | | |
| Net realized gain (loss) from: | | | |
| Investments | | 1,499,793 | |
| Foreign currency transactions | | (24,357 | ) |
| Net realized gain (loss) | | 1,475,436 | |
| Net change in unrealized appreciation (depreciation) on: | | | |
| Investments | | 11,484,992 | |
| Translation of other assets and liabilities denominated in foreign currencies | | (4,238 | ) |
| Net change in unrealized appreciation (depreciation) | | 11,480,754 | |
| Net realized and unrealized gain (loss) | | 12,956,190 | |
| Net increase (decrease) in net assets resulting from operations | $ | 13,385,986 | |
22 | Semiannual Report | The accompanying notes are an integral part of these financial statements. franklintempleton.com
| | | | | | |
| | | FRANKLIN GLOBAL TRUST | |
| | | FINANCIAL STATEMENTS | |
| |
| |
| Statements of Changes in Net Assets | | | | | | |
| |
| |
| Franklin Global Real Estate Fund | | | | | | |
| |
| | | Six Months Ended | | | | |
| | | January 31, 2015 | | | Year Ended | |
| | | (unaudited) | | | July 31, 2014 | |
| Increase (decrease) in net assets: | | | | | | |
| Operations: | | | | | | |
| Net investment income | $ | 429,796 | | $ | 2,051,143 | |
| Net realized gain (loss) from investments, realized gain distributions from REITs and foreign | | | | | | |
| currency transactions | | 1,475,436 | | | 1,703,424 | |
| Net change in unrealized appreciation (depreciation) on investments and translation of other | | | | | | |
| assets and liabilities denominated in foreign currencies | | 11,480,754 | | | 13,842,447 | |
| Net increase (decrease) in net assets resulting from operations | | 13,385,986 | | | 17,597,014 | |
| Distributions to shareholders from: | | | | | | |
| Net investment income: | | | | | | |
| Class A | | (1,328,264 | ) | | (1,261,562 | ) |
| Class C | | (186,892 | ) | | (198,655 | ) |
| Class R6 | | (14,806 | ) | | (7,455 | ) |
| Advisor Class | | (908,486 | ) | | (852,479 | ) |
| Total distributions to shareholders | | (2,438,448 | ) | | (2,320,151 | ) |
| Capital share transactions: (Note 2) | | | | | | |
| Class A | | 3,460,907 | | | (4,302,184 | ) |
| Class C | | 802,549 | | | (2,351,203 | ) |
| Class R6 | | (314,317 | ) | | 326,013 | |
| Advisor Class | | (1,450,858 | ) | | (631,433 | ) |
| Total capital share transactions | | 2,498,281 | | | (6,958,807 | ) |
| Net increase (decrease) in net assets | | 13,445,819 | | | 8,318,056 | |
| Net assets: | | | | | | |
| Beginning of period | | 164,739,585 | | | 156,421,529 | |
| End of period | $ | 178,185,404 | | $ | 164,739,585 | |
| Distributions in excess of net investment income, end of period | $ | (3,286,731 | ) | $ | (1,278,079 | ) |
franklintempleton.com The accompanying notes are an integral part of these financial statements. | Semiannual Report | 23
FRANKLIN GLOBAL TRUST
Notes to Financial Statements (unaudited)
Franklin Global Real Estate Fund
1. Organization and Significant Accounting Policies
Franklin Global Trust (Trust) is registered under the Investment Company Act of 1940, as amended, (1940 Act) as an open-end management investment company, consisting of six separate funds and applies the specialized accounting and reporting guidance in U.S. Generally Accepted Accounting Principles (U.S. GAAP). Franklin Global Real Estate Fund (Fund) is included in this report. The financial statements of the remaining funds in the Trust are presented separately. The Fund offers four classes of shares: Class A, Class C, Class R6, and Advisor Class. Each class of shares differs by its initial sales load, contingent deferred sales charges, voting rights on matters affecting a single class, its exchange privilege and fees primarily due to differing arrangements for distribution and transfer agent fees.
The following summarizes the Fund’s significant accounting policies.
a. Financial Instrument Valuation
The Fund’s investments in financial instruments are carried at fair value daily. Fair value is the price that would be received to sell an asset or paid to transfer a liability in an orderly transaction between market participants on the measurement date. The Fund calculates the net asset value per share at the close of the New York Stock Exchange (NYSE), generally at 4 p.m. Eastern time (NYSE close) on each day the NYSE is open for trading. Under compliance policies and procedures approved by the Trust’s Board of Trustees (the Board), the Fund’s administrator has responsibility for oversight of valuation, including leading the cross-functional Valuation and Liquidity Oversight Committee (VLOC). The VLOC provides administration and oversight of the Fund’s valuation policies and procedures, which are approved annually by the Board. Among other things, these procedures allow the Fund to utilize independent pricing services, quotations from securities and financial instrument dealers, and other market sources to determine fair value.
Equity securities listed on an exchange or on the NASDAQ National Market System are valued at the last quoted sale price or the official closing price of the day, respectively. Foreign equity securities are valued as of the close of trading on the foreign stock exchange on which the security is primarily traded or as of the NYSE close, whichever is earlier. The value is then converted into its U.S. dollar equivalent at the foreign exchange rate in effect at the NYSE close on the day that the value of the security is determined. Over-the-counter (OTC) securities are valued within the range of the most recent quoted bid and ask prices. Securities that trade in multiple markets or on multiple exchanges are valued according to the broadest and most representative market. Certain equity securities are valued based upon fundamental characteristics or relationships to similar securities. Time deposits are valued at cost, which approximates fair value.
The Fund has procedures to determine the fair value of financial instruments for which market prices are not reliable or readily available. Under these procedures, the VLOC convenes on a regular basis to review such financial instruments and considers a number of factors, including significant unobservable valuation inputs, when arriving at fair value. The VLOC primarily employs a market-based approach which may use related or comparable assets or liabilities, recent transactions, market multiples, book values, and other relevant information for the investment to determine the fair value of the investment. An income-based valuation approach may also be used in which the anticipated future cash flows of the investment are discounted to calculate fair value. Discounts may also be applied due to the nature or duration of any restrictions on the disposition of the investments. Due to the inherent uncertainty of valuations of such investments, the fair values may differ significantly from the values that would have been used had an active market existed. The VLOC employs various methods for calibrating these valuation approaches including a regular review of key inputs and assumptions, transactional back-testing or disposition analysis, and reviews of any related market activity.
Trading in securities on foreign securities stock exchanges and OTC markets may be completed before the daily NYSE close. In addition, trading in certain foreign markets may not take place on every NYSE business day. Occasionally, events occur between the time at which trading in a foreign security is completed and the close of the NYSE that might call into question the reliability of the value of a portfolio security held by the Fund. As a result, differences may arise between the value of the Fund’s portfolio securities as determined at the foreign market close and the latest indications of value at the close of the NYSE. In order to minimize the potential for these differences, the VLOC monitors price movements following the close of trading in foreign stock markets through a series of country specific market proxies (such as baskets of American Depositary Receipts, futures contracts and exchange traded funds). These price movements are measured against established trigger thresholds for each specific market proxy to assist in determining if an event has occurred that may call into
24 | Semiannual Report
franklintempleton.com
FRANKLIN GLOBAL TRUST
NOTES TO FINANCIAL STATEMENTS (UNAUDITED)
Franklin Global Real Estate Fund (continued)
question the reliability of the values of the foreign securities held by the Fund. If such an event occurs, the securities may be valued using fair value procedures, which may include the use of independent pricing services.
When the last day of the reporting period is a non-business day, certain foreign markets may be open on those days that the NYSE is closed, which could result in differences between the value of the Fund’s portfolio securities on the last business day and the last calendar day of the reporting period. Any significant security valuation changes due to an open foreign market are adjusted and reflected by the Fund for financial reporting purposes.
b. Foreign Currency Translation
Portfolio securities and other assets and liabilities denominated in foreign currencies are translated into U.S. dollars based on the exchange rate of such currencies against U.S. dollars on the date of valuation. The Fund may enter into foreign currency exchange contracts to facilitate transactions denominated in a foreign currency. Purchases and sales of securities, income and expense items denominated in foreign currencies are translated into U.S. dollars at the exchange rate in effect on the transaction date. Portfolio securities and assets and liabilities denominated in foreign currencies contain risks that those currencies will decline in value relative to the U.S. dollar. Occasionally, events may impact the availability or reliability of foreign exchange rates used to convert the U.S. dollar equivalent value. If such an event occurs, the foreign exchange rate will be valued at fair value using procedures established and approved by the Board.
The Fund does not separately report the effect of changes in foreign exchange rates from changes in market prices on securities held. Such changes are included in net realized and unrealized gain or loss from investments in the Statement of Operations.
Realized foreign exchange gains or losses arise from sales of foreign currencies, currency gains or losses realized between the trade and settlement dates on securities transactions and the difference between the recorded amounts of dividends, interest, and foreign withholding taxes and the U.S. dollar equivalent of the amounts actually received or paid. Net unrealized foreign exchange gains and losses arise from changes in foreign exchange rates on foreign denominated assets and liabilities other than investments in securities held at the end of the reporting period.
c. Securities Lending
The Fund participates in an agency based securities lending program. The Fund receives cash collateral against the loaned securities in an amount equal to at least 102% of the fair value of the loaned securities. Collateral is maintained over the life of the loan in an amount not less than 100% of the fair value of loaned securities, as determined at the close of fund business each day; any additional collateral required due to changes in security values is delivered to the Fund on the next business day. The collateral is invested in a non-registered money fund. The Fund receives income from the investment of cash collateral, in addition to lending fees and rebates paid by the borrower. The Fund bears the market risk with respect to the collateral investment, securities loaned, and the risk that the agent may default on its obligations to the Fund. The securities lending agent has agreed to indemnify the Fund in the event of default by a third party borrower. At January 31, 2015, the Fund had no securities on loan.
d. Income and Deferred Taxes
It is the Fund’s policy to qualify as a regulated investment company under the Internal Revenue Code. The Fund intends to distribute to shareholders substantially all of its taxable income and net realized gains to relieve it from federal income and excise taxes. As a result, no provision for U.S. federal income taxes is required.
The Fund may be subject to foreign taxation related to income received, capital gains on the sale of securities and certain foreign currency transactions in the foreign jurisdictions in which it invests. Foreign taxes, if any, are recorded based on the tax regulations and rates that exist in the foreign markets in which the Fund invests. When a capital gain tax is determined to apply the Fund records an estimated deferred tax liability in an amount that would be payable if the securities were disposed of on the valuation date.
The Fund recognizes the tax benefits of uncertain tax positions only when the position is “more likely than not” to be sustained upon examination by the tax authorities based on the technical merits of the tax position. As of January 31, 2015, and for all open tax years, the Fund has determined that no liability for unrecognized tax benefits is required in the Fund’s financial statements related to uncertain tax positions taken on a tax return (or expected to be taken on future tax returns). Open tax years are those that remain subject to examination and are based on each tax jurisdiction statute of limitation.
franklintempleton.com
Semiannual Report | 25
FRANKLIN GLOBAL TRUST
NOTES TO FINANCIAL STATEMENTS (UNAUDITED)
Franklin Global Real Estate Fund (continued)
1. Organization and Significant Accounting
Policies (continued)
e. Security Transactions, Investment Income, Expenses and Distributions
Security transactions are accounted for on trade date. Realized gains and losses on security transactions are determined on a specific identification basis. Interest income and estimated expenses are accrued daily. Dividend income is recorded on the ex-dividend date except for certain dividends from foreign securities where the dividend rate is not available. In such cases, the dividend is recorded as soon as the information is received by the Fund. Distributions to shareholders are recorded on the ex-dividend date and are determined according to income tax regulations (tax basis). Distributable earnings determined on a tax basis may differ from earnings recorded in accordance with U.S. GAAP. These differences may be permanent or temporary. Permanent differences are reclassified among capital accounts to reflect their tax character. These reclassifications have no impact on net assets or the results of operations. Temporary differences are not reclassified, as they may reverse in subsequent periods.
Common expenses incurred by the Trust are allocated among the funds based on the ratio of net assets of each fund to the combined net assets of the Trust. Fund specific expenses are charged directly to the fund that incurred the expense.
Realized and unrealized gains and losses and net investment income, not including class specific expenses, are allocated daily to each class of shares based upon the relative proportion of net assets of each class. Differences in per share distributions, by class, are generally due to differences in class specific expenses.
Distributions received by the Fund from certain securities may be a return of capital (ROC). Such distributions reduce the cost basis of the securities, and any distributions in excess of the cost basis are recognized as capital gains. For Real Estate Investment Trust (REIT) securities, the Fund records ROC estimates, if any, on the ex-dividend date and are adjusted once the actual tax designations are known.
f. Accounting Estimates
The preparation of financial statements in accordance with U.S. GAAP requires management to make estimates and assumptions that affect the reported amounts of assets and liabilities at the date of the financial statements and the amounts of income and expenses during the reporting period. Actual results could differ from those estimates.
g. Guarantees and Indemnifications
Under the Trust’s organizational documents, its officers and trustees are indemnified by the Trust against certain liabilities arising out of the performance of their duties to the Trust. Additionally, in the normal course of business, the Trust, on behalf of the Fund, enters into contracts with service providers that contain general indemnification clauses. The Trust’s maximum exposure under these arrangements is unknown as this would involve future claims that may be made against the Trust that have not yet occurred. Currently, the Trust expects the risk of loss to be remote.
2. Shares of Beneficial Interest
At January 31, 2015, there were an unlimited number of shares authorized (without par value). Transactions in the Fund’s shares were as follows:
| | | | | | | | | | |
| | Six Months Ended | | Year Ended | |
| | January 31, 2015 | | July 31, 2014 | |
| | Shares | | | Amount | | Shares | | | Amount | |
| Class A Shares: | | | | | | | | | | |
| Shares sold | 1,218,578 | | $ | 10,751,777 | | 2,340,901 | | $ | 18,868,053 | |
| Shares issued in reinvestment of distributions | 145,161 | | | 1,244,371 | | 157,274 | | | 1,195,925 | |
| Shares redeemed | (979,686 | ) | | (8,535,241 | ) | (3,054,880 | ) | | (24,366,162 | ) |
| Net increase (decrease) | 384,053 | | $ | 3,460,907 | | (556,705 | ) | $ | (4,302,184 | ) |
| Class C Shares: | | | | | | | | | | |
| Shares sold | 333,176 | | $ | 2,882,549 | | 481,358 | | $ | 3,871,682 | |
| Shares issued in reinvestment of distributions | 19,202 | | | 163,598 | | 22,960 | | | 172,429 | |
| Shares redeemed | (259,897 | ) | | (2,243,598 | ) | (808,171 | ) | | (6,395,314 | ) |
| Net increase (decrease) | 92,481 | | $ | 802,549 | | (303,853 | ) | $ | (2,351,203 | ) |
| |
| 26 | Semiannual Report | | | | | | franklintempleton.com | |
| | | | | | | | | | | | |
| | | | | | | | FRANKLIN GLOBAL TRUST | |
| | NOTES TO FINANCIAL STATEMENTS (UNAUDITED) | |
| |
| |
| |
| Franklin Global Real Estate Fund (continued) | | | | | | | | | | | | |
| |
| | Six Months Ended | | Year Ended | | |
| | January 31, 2015 | | July 31, 2014 | |
| | Shares | | | Amount | | Shares | | | Amount | |
| Class R6 Shares: | | | | | | | | | | | | |
| Shares sold | 36,071 | | | $ | 300,877 | | 39,593 | | | $ | 322,970 | |
| Shares issued in reinvestment of distributions | 1,721 | | | | 14,806 | | 974 | | | | 7,455 | |
| Shares redeemed | (70,280 | ) | | | (630,000 | ) | (575 | ) | | | (4,412 | ) |
| Net increase (decrease) | (32,488 | ) | | $ | (314,317 | ) | 39,992 | | | $ | 326,013 | |
| Advisor Class Shares: | | | | | | | | | | | | |
| Shares sold | 301,123 | | $ | 2,646,648 | | 408,271 | | $ | 3,311,576 | |
| Shares issued in reinvestment of distributions | 43,192 | | | | 371,111 | | 45,010 | | | | 344,457 | |
| Shares redeemed | (506,480 | ) | | (4,468,617 | ) | (528,657 | ) | | (4,287,466 | ) |
| Net increase (decrease) | (162,165 | ) | $ | (1,450,858 | ) | (75,376 | ) | $ | (631,433 | ) |
3. Transactions with Affiliates
Franklin Resources, Inc. is the holding company for various subsidiaries that together are referred to as Franklin Templeton Investments. Certain officers and trustees of the Trust are also officers and/or directors of the following subsidiaries:
| |
| Subsidiary | Affiliation |
| Franklin Templeton Institutional, LLC (FT Institutional) | Investment manager |
| Franklin Templeton Services, LLC (FT Services) | Administrative manager |
| Franklin Templeton Distributors, Inc. (Distributors) | Principal underwriter |
| Franklin Templeton Investor Services, LLC (Investor Services) | Transfer agent |
a. Management Fees
The Fund pays an investment management fee to FT Institutional based on the average daily net assets of the Fund as follows:
| |
| Annualized | |
| Fee Rate | Net Assets |
| 1.000% | Up to and including $500 million |
| 0.900% | Over $500 million, up to and including $1 billion |
| 0.850% | Over $1 billion, up to and including $1.5 billion |
| 0.800% | Over $1.5 billion, up to and including $6.5 billion |
| 0.780% | Over $6.5 billion, up to and including $11.5 billion |
| 0.760% | Over $11.5 billion, up to and including $16.5 billion |
| 0.740% | Over $16.5 billion, up to and including $19 billion |
| 0.730% | Over $19 billion, up to and including $21.5 billion |
| 0.720% | In excess of $21.5 billion |
b. Administrative Fees
Under an agreement with FT Institutional, FT Services provides administrative services to the Fund. The fee is paid by FT
Institutional based on the Fund’s average daily net assets, and is not an additional expense of the Fund.
franklintempleton.com
Semiannual Report | 27
FRANKLIN GLOBAL TRUST
NOTES TO FINANCIAL STATEMENTS (UNAUDITED)
Franklin Global Real Estate Fund (continued)
3. Transactions with Affiliates (continued)
c. Distribution Fees
The Board has adopted distribution plans for each share class, with the exception of Class R6 and Advisor Class shares, pursuant to Rule 12b-1 under the 1940 Act. Distribution fees are not charged on shares held by affiliates. Under the Fund’s Class A reimbursement distribution plan, the Fund reimburses Distributors for costs incurred in connection with the servicing, sale and distribution of the Fund’s shares up to the maximum annual plan rate. Under the Class A reimbursement distribution plan, costs exceeding the maximum for the current plan year cannot be reimbursed in subsequent periods. In addition, under the Fund’s Class C compensation distribution plan, the Fund pays Distributors for costs incurred in connection with the servicing, sale and distribution of the Fund’s shares up to the maximum annual plan rate. The plan year, for purposes of monitoring compliance with the maximum annual plan rates, is February 1 through January 31.
The maximum annual plan rates, based on the average daily net assets, for each class, are as follows:
The Board has set the current rate at 0.30% per year for Class A shares until further notice and approval by the Board.
d. Sales Charges/Underwriting Agreements
Front-end sales charges and contingent deferred sales charges (CDSC) do not represent expenses of the Fund. These charges are deducted from the proceeds of sales of Fund shares prior to investment or from redemption proceeds prior to remittance, as applicable. Distributors has advised the Fund of the following commission transactions related to the sales and redemptions of the Fund’s shares for the period:
| | |
| Sales charges retained net of commissions paid to unaffiliated broker/dealers | $ | 26,170 |
| CDSC retained | $ | 977 |
e. Transfer Agent Fees
Each class of shares, except for Class R6, pays transfer agent fees to Investor Services for its performance of shareholder servicing obligations and reimburses Investor Services for out of pocket expenses incurred, including shareholding servicing fees paid to third parties. These fees are allocated daily based upon their relative proportion of such classes’ aggregate net assets. Class R6 pays Investor Services transfer agent fees specific to that class.
For the period ended January 31, 2015, the Fund paid transfer agent fees of $141,666, of which $64,923 was retained by Investor Services.
f. Waiver and Expense Reimbursements
FT Institutional and Investor Services have contractually agreed in advance to waive or limit their respective fees and to assume as their own expense certain expenses otherwise payable by the Fund so that the expenses (excluding distribution fees and acquired fund fees and expenses) for Class A, Class C, and Advisor Class of the Fund do not exceed 1.15%, and Class R6 does not exceed 0.99% based on the average net assets of each class (other than certain non-routine expenses or costs, including those relating to litigation, indemnification, reorganizations, and liquidations) until November 30, 2016 and November 30, 2015, respectively.
28 | Semiannual Report
franklintempleton.com
FRANKLIN GLOBAL TRUST
NOTES TO FINANCIAL STATEMENTS (UNAUDITED)
Franklin Global Real Estate Fund (continued)
4. Expense Offset Arrangement
The Fund has entered into an arrangement with its custodian whereby credits realized as a result of uninvested cash balances are used to reduce a portion of the Fund’s custodian expenses. During the period ended January 31, 2015, the custodian fees were reduced as noted in the Statement of Operations.
5. Income Taxes
For tax purposes, capital losses may be carried over to offset future capital gains. Capital loss carryforwards with no expiration, if any, must be fully utilized before those losses with expiration dates.
| | |
| At July 31, 2014, capital loss carryforwards were as follows: | | |
| |
| Capital loss carryforwards expiring in: | | |
| 2016 | $ | 2,797,386 |
| 2017 | | 22,811,914 |
| 2018 | | 35,647,494 |
| 2019 | | 557,818 |
| Capital loss carryforwards not subject to expiration: | | |
| Short term | | 817,384 |
| Total capital loss carryforwards | $ | 62,631,996 |
At January 31, 2015, the cost of investments and net unrealized appreciation (depreciation) for income tax purposes were as follows:
| | | |
| Cost of investments | $ | 130,877,438 | |
| |
| Unrealized appreciation | $ | 49,601,816 | |
| Unrealized depreciation | | (2,015,900 | ) |
| Net unrealized appreciation (depreciation) | $ | 47,585,916 | |
Differences between income and/or capital gains as determined on a book basis and a tax basis are primarily due to differing treatments of passive foreign investment company shares and wash sales.
6. Investment Transactions
Purchases and sales of investments (excluding short term securities) for the period ended January 31, 2015, aggregated $15,510,251 and $13,911,596, respectively.
7. Concentration of Risk
Investing in foreign securities may include certain risks and considerations not typically associated with investing in U.S. securities, such as fluctuating currency values and changing local and regional economic, political and social conditions, which may result in greater market volatility. In addition, certain foreign securities may not be as liquid as U.S. securities.
The Fund invests a large percentage of its total assets in REIT securities. Such concentration may subject the Fund to special risks associated with real estate securities. These securities may be more sensitive to economic or regulatory developments due to a variety of factors such as local, regional, national and global economic conditions, interest rates and tax considerations.
franklintempleton.com
Semiannual Report | 29
FRANKLIN GLOBAL TRUST
NOTES TO FINANCIAL STATEMENTS (UNAUDITED)
Franklin Global Real Estate Fund (continued)
8. Credit Facility
The Fund, together with other U.S. registered and foreign investment funds (collectively, Borrowers), managed by Franklin Templeton Investments, are borrowers in a joint syndicated senior unsecured credit facility totaling $1.5 billion (Global Credit Facility) which matured on February 13, 2015. This Global Credit Facility provides a source of funds to the Borrowers for temporary and emergency purposes, including the ability to meet future unanticipated or unusually large redemption requests. Effective February 13, 2015, the Borrowers renewed the Global Credit Facility for a one year term, maturing February 12, 2016, for a total of $2 billion.
Under the terms of the Global Credit Facility, the Fund shall, in addition to interest charged on any borrowings made by the Fund and other costs incurred by the Fund, pay its share of fees and expenses incurred in connection with the implementation and maintenance of the Global Credit Facility, based upon its relative share of the aggregate net assets of all of the Borrowers, including an annual commitment fee of 0.07% based upon the unused portion of the Global Credit Facility. These fees are reflected in other expenses in the Statement of Operations. During the period ended January 31, 2015, the Fund did not use the Global Credit Facility.
9. Fair Value Measurements
The Fund follows a fair value hierarchy that distinguishes between market data obtained from independent sources (observable inputs) and the Fund’s own market assumptions (unobservable inputs). These inputs are used in determining the value of the Fund’s financial instruments and are summarized in the following fair value hierarchy:
- Level 1 – quoted prices in active markets for identical financial instruments
- Level 2 – other significant observable inputs (including quoted prices for similar financial instruments, interest rates, prepayment speed, credit risk, etc.)
- Level 3 – significant unobservable inputs (including the Fund’s own assumptions in determining the fair value of financial instruments)
The input levels are not necessarily an indication of the risk or liquidity associated with financial instruments at that level.
For movements between the levels within the fair value hierarchy, the Fund has adopted a policy of recognizing the transfers as of the date of the underlying event which caused the movement.
A summary of inputs used as of January 31, 2015, in valuing the Fund’s assets carried at fair value, is as follows:
| | | | | | | | |
| | | Level 1 | | Level 2 | | Level 3 | | Total |
| Assets: | | | | | | | | |
| Investments in Securities: | | | | | | | | |
| Equity Investmentsa,b | $ | 175,463,354 | $ | — | $ | — | $ | 175,463,354 |
| Short Term Investments. | | — | | 3,000,000 | | — | | 3,000,000 |
| Total Investments in Securities. | $ | 175,463,354 | $ | 3,000,000 | $ | — | $ | 178,463,354 |
aFor detailed categories, see the accompanying Statement of Investments.
bIncludes common stocks as well as other equity investments.
30 | Semiannual Report
franklintempleton.com
FRANKLIN GLOBAL TRUST
NOTES TO FINANCIAL STATEMENTS (UNAUDITED)
Franklin Global Real Estate Fund (continued)
10. New Accounting Pronouncements
In June 2014, the Financial Accounting Standards Board issued Accounting Standards Update (ASU) No. 2014-11, Transfers and Servicing (Topic 860), Repurchase-to-Maturity Transactions, Repurchase Financings, and Disclosures. The ASU changes the accounting for certain repurchase agreements and expands disclosure requirements related to repurchase agreements, securities lending, repurchase-to-maturity and similar transactions. The ASU is effective for interim and annual reporting periods beginning after December 15, 2014. Management has reviewed the requirements and believes the adoption of this ASU will not have a material impact on the financial statements.
11. Subsequent Events
The Fund has evaluated subsequent events through the issuance of the financial statements and determined that no events have occurred that require disclosure other than those already disclosed in the financial statements.
Abbreviations
Selected Portfolio
IDR International Depositary Receipt
REIT Real Estate Investment Trust
franklintempleton.com
Semiannual Report | 31
FRANKLIN GLOBAL TRUST
FRANKLIN GLOBAL REAL ESTATE FUND
Shareholder Information
Proxy Voting Policies and Procedures
The Trust’s investment manager has established Proxy Voting Policies and Procedures (Policies) that the Trust uses to determine how to vote proxies relating to portfolio securities. Shareholders may view the Trust’s complete Policies online at franklintempleton.com. Alternatively, shareholders may request copies of the Policies free of charge by calling the Proxy Group collect at (954) 527-7678 or by sending a written request to: Franklin Templeton Companies, LLC, 300 S.E. 2nd Street, Fort Lauderdale, FL 33301, Attention: Proxy Group. Copies of the Trust’s proxy voting records are also made available online at franklintempleton.com and posted on the U.S. Securities and Exchange Commission’s website at sec.gov and reflect the most recent 12-month period ended June 30.
Quarterly Statement of Investments
The Trust files a complete statement of investments with the U.S. Securities and Exchange Commission for the first and third quarters for each fiscal year on Form N-Q. Shareholders may view the filed Form N-Q by visiting the Commission’s website at sec.gov. The filed form may also be viewed and copied at the Commission’s Public Reference Room in Washington, DC. Information regarding the operations of the Public Reference Room may be obtained by calling (800) SEC-0330.
32 | Semiannual Report
franklintempleton.com

Franklin Templeton Investments
Gain From Our Perspective®
At Franklin Templeton Investments, we’re dedicated to one goal: delivering exceptional asset management for our clients. By bringing together multiple, world-class investment teams in a single firm, we’re able to offer specialized expertise across styles and asset classes, all supported by the strength and resources of one of the world’s largest asset managers. This has helped us to become a trusted partner to individual and institutional investors across the globe.
Focus on Investment Excellence
At the core of our firm, you’ll find multiple independent investment teams—each with a focused area of expertise—from traditional to alternative strategies and multi-asset solutions. And because our portfolio groups operate autonomously, their strategies can be combined to deliver true style and asset class diversification.
All of our investment teams share a common commitment to excellence grounded in rigorous, fundamental research and robust, disciplined risk management. Decade after decade, our consistent, research-driven processes have helped Franklin Templeton earn an impressive record of strong, long-term results.
Global Perspective Shaped by Local Expertise
In today’s complex and interconnected world, smart investing demands a global perspective. Franklin Templeton pioneered international investing over 60 years ago, and our expertise in emerging markets spans more than a quarter of a century. Today, our investment professionals are on the ground across the globe, spotting investment ideas and potential risks firsthand. These locally based teams bring in-depth understanding of local companies, economies and cultural nuances, and share their best thinking across our global research network.
Strength and Experience
Franklin Templeton is a global leader in asset management serving clients in over 150 countries.1 We run our business with the same prudence we apply to asset management, staying focused on delivering relevant investment solutions, strong long-term results and reliable, personal service. This approach, focused on putting clients first, has helped us to become one of the most trusted names in financial services.
1. As of 12/31/14. Clients are represented by the total number of shareholder accounts.
Not FDIC Insured | May Lose Value | No Bank Guarantee
| |
| Contents | |
| |
| Shareholder Letter | 1 |
| Semiannual Report | |
| Economic and Market Overview | 3 |
| Franklin International Growth Fund | 4 |
| Franklin International Small Cap | |
| Growth Fund | 12 |
| Financial Highlights and | |
| Statements of Investments | 20 |
| Financial Statements | 35 |
| Notes to Financial Statements | 39 |
| Shareholder Information | 48 |
1
Semiannual Report
Economic and Market Overview
U.S. economic growth trends were generally encouraging during the six months under review, although economic expansion moderated in 2014’s fourth quarter. A wider trade deficit and lower federal government spending partially offset the positive effect from greater spending by consumers, businesses, and state and local governments. Manufacturing and non-manufacturing activities increased, and the unemployment rate declined to 5.7% in January 2015 from 6.2% in July 2014.1 The housing market improved as home prices rose in most metropolitan areas and mortgage rates declined for the six-month period. Retail sales rose for most of the period but softened near period-end.
The U.S. Federal Reserve Board (Fed) ended its bond buying program in October 2014, based on its view that underlying economic strength could support ongoing progress in labor market conditions. The Fed stated that it could be patient with regard to raising interest rates and that it would consider inflationary pressures, labor market conditions, and financial and international developments in determining its next course of action.
The global economy overall expanded moderately during the period even though economic activity in some countries slowed. Major developed market central banks reaffirmed their accommodative monetary policies to support economic recovery. Several emerging market central banks cut interest rates to boost economic growth, while others raised rates to control inflation and currency depreciation.
The U.K. economy grew relatively well, supported by the services and manufacturing sectors. In the eurozone, the economy showed signs of improvement as the gross domestic product growth rate picked up in the third and fourth quarters of 2014, led by Germany, the region’s largest economy. In addition to maintaining a low benchmark interest rate and a negative bank deposit rate, the European Central Bank (ECB) implemented a major asset purchase program to boost inflation and stimulate the economy. Although the region benefited from lower oil prices, a weaker euro that supported exports and the ECB’s accommodative policy, it continued to face headwinds such as deflationary pressures and the crisis in Ukraine. Near period-end, concerns arose about Greece’s election of a new prime minister whose platform included restructuring the terms of the country’s debt and loosening austerity mandates.
Japan slid into recession in the third quarter, prompting the Bank of Japan to broaden its stimulus measures amid weak domestic demand and lower inflation resulting from falling crude oil prices. In December, Japan’s ruling coalition was reelected and announced a new stimulus package to revive economic growth. The country exited recession in the fourth quarter, supported largely by exports, while growth in domestic consumption and capital spending remained relatively soft.
Global developed market stocks, as measured by the MSCI World Index, declined slightly for the six-month period as investor concerns about global economic growth, particularly in the eurozone, Japan and China, and the future course of U.S. monetary policy overshadowed continued corporate profit strength. During the period, oil prices plummeted mainly because of strong supply. Despite benign global inflation and a strong U.S. dollar, gold prices ended the period slightly higher after prices surged in January as oil prices weakened, the Swiss National Bank removed the franc’s peg to the euro and the ECB increased monetary stimulus.
The foregoing information reflects our analysis and opinions as of January 31, 2015. The information is not a complete analysis of every aspect of any market, country, industry, security or fund. Statements of fact are from sources considered reliable.
1. Source: Bureau of Labor Statistics.
franklintempleton.com Semiannual Report | 3
Franklin International Growth Fund
This semiannual report for Franklin International Growth Fund covers the six months ended January 31, 2015.
Your Fund’s Goal and Main Investments
The Fund seeks long-term capital appreciation by investing predominantly in equity securities of mid- and large-capitalization companies, generally those with market capitalizations greater than $2 billion, located outside of the U.S., including developing or emerging market countries. The Fund considers international companies to be those organized under the laws of a country outside of the U.S. or having a principal office in a country outside of the U.S., or whose securities are listed or traded principally on a recognized stock exchange or over-the-counter market outside of the U.S.
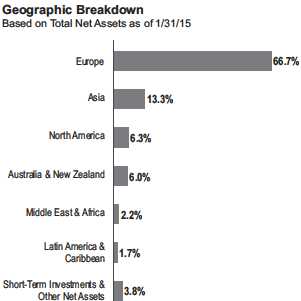
Performance Overview
For the six months ended January 31, 2015, the Fund’s Class A shares had a -5.11% cumulative total return. In comparison, the Fund’s benchmark, the MSCI Europe, Australasia, Far East (EAFE) Index, which measures global developed stock market performance excluding the U.S. and Canada, had a -6.88% total return.1 You can find more of the Fund’s performance data in the Performance Summary beginning on page 7.
Performance data represent past performance, which does not guarantee future results. Investment return and principal value will fluctuate, and you may have a gain or loss when you sell your shares. Current performance may differ from figures shown. Please visit franklintempleton.com or call (800) 342-5236 for most recent month-end performance.
Investment Strategy
In choosing individual equity investments, we employ a disciplined, bottom-up approach to identify attractive investment opportunities that have higher expected revenue and earnings growth than their peers. We use a growth investment style and in-depth, fundamental research to identify high-quality companies, across all industry groups, with sustainable business models that offer the most attractive combination of growth potential, quality and valuation.
Manager’s Discussion
The Fund’s stock selection in the materials, health care, information technology (IT) and financials sectors helped performance relative to the MSCI EAFE Index.2 From these sectors, positions in German flavor and fragrance maker Symrise, Ireland-headquartered biopharmaceutical company Alkermes,3 Australian hearing aid maker Cochlear, Argentine online marketplace MercadoLibre,3 Israeli IT security firm Check Point Software Technologies,3 U.K.-based enterprise software company The Sage Group and German exchange operator Deutsche Boerse boosted results. In consumer discretionary, Canadian discount retailer Dollarama3 and U.K.-based luxury fashion company Burberry Group aided relative results.4
1. Source: Morningstar.
The index is unmanaged and includes reinvested dividends. One cannot invest directly in an index, and an index is not representative of the Fund’s portfolio.
2. The materials sector comprises chemicals in the SOI. The health care sector comprises biotechnology, health care equipment and supplies and pharmaceuticals in
the SOI. The IT sector comprises electronic equipment, instruments and components; Internet software and services; semiconductors and semiconductor equipment
and software in the SOI. The financials sector comprises banks, capital markets and diversified financial services in the SOI.
3. Not part of the index.
4. The consumer discretionary sector comprises diversified consumer services; hotels, restaurants and leisure; Internet and catalog retail; media; multiline retail; and
textiles, apparel and luxury goods in the SOI.
The dollar value, number of shares or principal amount, and names of all portfolio holdings are listed in the Fund’s Statement of Investments (SOI).
The SOI begins on page 25.
4 | Semiannual Report franklintempleton.com
FRANKLIN INTERNATIONAL GROWTH FUND
| | |
| Top 10 Sectors/Industries | | |
| 1/31/15 | | |
| | % of Total | |
| | Net Assets | |
| Chemicals | 9.3 | % |
| Professional Services | 8.4 | % |
| Health Care Equipment & Supplies | 8.3 | % |
| Software | 7.4 | % |
| Capital Markets | 6.3 | % |
| Textiles, Apparel & Luxury Goods | 5.6 | % |
| Machinery | 5.5 | % |
| Biotechnology | 4.5 | % |
| Banks | 3.9 | % |
| Semiconductors & Semiconductor Equipment | 3.7 | % |
In contrast, key detractors from relative performance included stock selection in the energy and industrials sectors.5 In the energy sector, positions in energy equipment and services companies WorleyParsons (Australia) and Fugro6 (Netherlands) hurt relative results as falling oil prices led both to lose value. Within industrials, notable detractors included U.K.-based engineering company Weir Group, Hong Kong-based supply chain conglomerate Noble Group and Switzerland-based SGS, which provides inspection, verification, testing and certification services. In other sectors, major detractors included Japanese e-commerce company Start Today Co.,3 Canada-based Bank of Nova Scotia3 and Swiss chemical firm Sika.
| | |
| Top 10 Countries | | |
| 1/31/15 | | |
| | % of Total | |
| | Net Assets | |
| U.K. | 25.5 | % |
| Switzerland | 10.1 | % |
| Germany | 9.1 | % |
| Japan | 6.1 | % |
| Australia | 6.0 | % |
| Italy | 6.0 | % |
| Denmark | 5.7 | % |
| Canada | 3.9 | % |
| Belgium | 3.3 | % |
| Sweden | 3.2 | % |
Regionally, overweightings in North America and Israel and an underweighting in Australia helped relative performance. Stock selection in Europe, particularly Germany and the U.K, were also beneficial. An underweighting and stock selection in Asia, particularly Japan, hampered relative returns.
| | |
| Top 10 Holdings | | |
| 1/31/15 | | |
| Company | % of Total | |
| Sector/Industry, Country | Net Assets | |
| Umicore SA | 3.3 | % |
| Chemicals, Belgium | | |
| Azimut Holding SpA | 3.3 | % |
| Capital Markets, Italy | | |
| Elekta AB, B | 3.2 | % |
| Health Care Equipment & Supplies, Sweden | | |
| SGS SA | 3.1 | % |
| Professional Services, Switzerland | | |
| Experian PLC | 3.1 | % |
| Professional Services, U.K. | | |
| Syngenta AG | 3.1 | % |
| Chemicals, Switzerland | | |
| Aberdeen Asset Management PLC | 3.0 | % |
| Capital Markets, U.K. | | |
| GN Store Nord AS | 3.0 | % |
| Health Care Equipment & Supplies, Denmark | | |
| Burberry Group PLC | 2.9 | % |
| Textiles, Apparel & Luxury Goods, U.K. | | |
| Roche Holding AG | 2.8 | % |
| Pharmaceuticals, Switzerland | | |
It is important to recognize the effect of currency movements on the Fund’s performance. In general, if the value of the U.S. dollar goes up compared with a foreign currency, an investment traded in that foreign currency will go down in value because it will be worth fewer U.S. dollars. This can have a negative effect on Fund performance. Conversely, when the U.S. dollar weakens in relation to a foreign currency, an investment traded in that foreign currency will increase in value, which can contribute to Fund performance. For the six months ended January 31, 2015, the U.S. dollar rose in value relative to most currencies. As a result, the Fund’s performance was negatively affected by the portfolio’s investment predominantly in securities with non-U.S. currency exposure.
5. The energy sector comprises energy equipment and services in the SOI. The industrials sector comprises aerospace and defense, machinery, professional services, road
and rail, and trading companies and distributors in the SOI.
6. Sold by period-end.
See www.franklintempletondatasources.com for additional data provider information.
franklintempleton.com Semiannual Report | 5
FRANKLIN INTERNATIONAL GROWTH FUND
Thank you for your participation in Franklin International Growth Fund. We look forward to serving your future investment needs.

The foregoing information reflects our analysis, opinions and portfolio holdings as of January 31, 2015, the end of the reporting period. The way we implement our main investment strategies and the resulting portfolio holdings may change depending on factors such as market and economic conditions. These opinions may not be relied upon as investment advice or an offer for a particular security. The information is not a complete analysis of every aspect of any market, country, industry, security or the Fund. Statements of fact are from sources considered reliable, but the investment manager makes no representation or warranty as to their completeness or accuracy. Although historical performance is no guarantee of future results, these insights may help you understand our investment management philosophy.
CFA® is a trademark owned by CFA Institute.
6 | Semiannual Report franklintempleton.com
FRANKLIN INTERNATIONAL GROWTH FUND
Performance Summary as of January 31, 2015
Your dividend income will vary depending on dividends or interest paid by securities in the Fund’s portfolio, adjusted for operating expenses of each class. Capital gain distributions are net profits realized from the sale of portfolio securities. The performance table does not reflect any taxes that a shareholder would pay on Fund dividends, capital gain distributions, if any, or any realized gains on the sale of Fund shares. Total return reflects reinvestment of the Fund’s dividends and capital gain distributions, if any, and any unrealized gains or losses.
| | | | | | | | |
| Net Asset Value | | | | | | | | |
| Share Class (Symbol) | | 1/31/15 | | 7/31/14 | | Change | | |
| A (FNGAX) | $ | 10.71 | $ | 11.40 | -$ | 0.69 | | |
| C (n/a) | $ | 10.54 | $ | 11.22 | -$ | 0.68 | | |
| R (n/a) | $ | 10.71 | $ | 11.38 | -$ | 0.67 | | |
| R6 (FILRX) | $ | 10.77 | $ | 11.48 | -$ | 0.71 | | |
| Advisor (FNGZX) | $ | 10.76 | $ | 11.47 | -$ | 0.71 | | |
| |
| |
| Distributions (8/1/14–1/31/15) | | | | | | | | |
| | | Dividend | | Short-Term | | Long-Term | | |
| Share Class | | Income | | Capital Gain | | Capital Gain | | Total |
| A | $ | 0.0348 | $ | 0.0604 | $ | 0.0077 | $ | 0.1029 |
| C | | — | $ | 0.0604 | $ | 0.0077 | $ | 0.0681 |
| R | $ | 0.0061 | $ | 0.0604 | $ | 0.0077 | $ | 0.0742 |
| R6 | $ | 0.0783 | $ | 0.0604 | $ | 0.0077 | $ | 0.1464 |
| Advisor | $ | 0.0638 | $ | 0.0604 | $ | 0.0077 | $ | 0.1319 |
franklintempleton.com
Semiannual Report | 7
FRANKLIN INTERNATIONAL GROWTH FUND
PERFORMANCE SUMMARY
Performance as of 1/31/151
Cumulative total return excludes sales charges. Average annual total returns and value of $10,000 investment include maximum sales charges. Class A: 5.75% maximum initial sales charge; Class C: 1% contingent deferred sales charge in first year only;
Class R/R6/Advisor Class: no sales charges.
| | | | | | | | | | | | | | | |
| | | | | | | | | Value of | | Average Annual | | Total Annual | |
| | | Cumulative | | | Average Annual | | $ | 10,000 | | Total Return | | Operating Expenses6 | |
| Share Class | | Total Return2 | | | Total Return3 | | | Investment4 | | (12/31/14)5 | | (with waiver) | | (without waiver) | |
| A | | | | | | | | | | | | 1.49 | % | 1.70 | % |
| 6-Month | | -5.11 | % | | -10.60 | % | $ | 8,940 | | | | | | | |
| 1-Year | + | 1.57 | % | | -4.27 | % | $ | 9,573 | | -10.30 | % | | | | |
| 5-Year | + | 37.19 | % | + | 5.27 | % | $ | 12,926 | + | 4.07 | % | | | | |
| Since Inception (6/3/08) | + | 13.29 | % | + | 0.99 | % | $ | 10,678 | + | 0.90 | % | | | | |
| C | | | | | | | | | | | | 2.19 | % | 2.40 | % |
| 6-Month | | -5.43 | % | | -6.37 | % | $ | 9,363 | | | | | | | |
| 1-Year | + | 0.86 | % | | -0.14 | % | $ | 9,986 | | -6.40 | % | | | | |
| 5-Year | + | 32.50 | % | + | 5.79 | % | $ | 13,250 | + | 4.56 | % | | | | |
| Since Inception (6/3/08) | + | 7.98 | % | + | 1.16 | % | $ | 10,798 | + | 1.09 | % | | | | |
| R | | | | | | | | | | | | 1.69 | % | 1.90 | % |
| 6-Month | | -5.21 | % | | -5.21 | % | $ | 9,479 | | | | | | | |
| 1-Year | + | 1.38 | % | + | 1.38 | % | $ | 10,138 | | -4.99 | % | | | | |
| 5-Year | + | 35.73 | % | + | 6.30 | % | $ | 13,573 | + | 5.07 | % | | | | |
| Since Inception (6/3/08) | + | 11.53 | % | + | 1.65 | % | $ | 11,153 | + | 1.57 | % | | | | |
| R6 | | | | | | | | | | | | 1.02 | % | 1.02 | % |
| 6-Month | | -4.86 | % | | -4.86 | % | $ | 9,514 | | | | | | | |
| 1-Year | + | 2.08 | % | + | 2.08 | % | $ | 10,208 | | -4.31 | % | | | | |
| Since Inception (5/1/13) | + | 3.91 | % | + | 2.21 | % | $ | 10,391 | + | 1.93 | % | | | | |
| Advisor | | | | | | | | | | | | 1.19 | % | 1.40 | % |
| 6-Month | | -4.99 | % | | -4.99 | % | $ | 9,501 | | | | | | | |
| 1-Year | + | 1.84 | % | + | 1.84 | % | $ | 10,184 | | -4.44 | % | | | | |
| 5-Year | + | 39.15 | % | + | 6.83 | % | $ | 13,915 | + | 5.62 | % | | | | |
| Since Inception (6/3/08) | + | 15.42 | % | + | 2.18 | % | $ | 11,542 | + | 2.12 | % | | | | |
Performance data represent past performance, which does not guarantee future results. Investment return and principal value will fluctuate, and you may have a gain or loss when you sell your shares. Current performance may differ from figures shown. For most recent month-end performance, go to franklintempleton.com or call (800) 342-5236.
8 | Semiannual Report
franklintempleton.com
FRANKLIN INTERNATIONAL GROWTH FUND
PERFORMANCE SUMMARY
All investments involve risks, including possible loss of principal. Special risks are associated with foreign investing, including currency fluctuations, economic instability and political developments. Investments in emerging markets involve heightened risks related to the same factors, in addition to those associated with these markets’ smaller size and lesser liquidity. The Fund is actively managed but there is no guarantee that the manager’s investment decisions will produce the desired results. The Fund’s prospectus also includes a description of the main investment risks.
| |
| Class C: | These shares have higher annual fees and expenses than Class A shares. |
| Class R: | Shares are available to certain eligible investors as described in the prospectus. These shares have higher annual fees and expenses than Class A shares. |
| Class R6: | Shares are available to certain eligible investors as described in the prospectus. |
| Advisor Class: | Shares are available to certain eligible investors as described in the prospectus. |
1. The Fund has an expense reduction contractually guaranteed through at least 11/30/16 and a fee waiver associated with its investments in a Franklin Templeton money
fund, contractually guaranteed through at least its current fiscal year-end. Fund investment results reflect the expense reduction and fee waiver, to the extent applicable;
without these reductions, the results would have been lower.
2. Cumulative total return represents the change in value of an investment over the periods indicated.
3. Average annual total return represents the average annual change in value of an investment over the periods indicated. Six-month return has not been annualized.
4. These figures represent the value of a hypothetical $10,000 investment in the Fund over the periods indicated.
5. In accordance with SEC rules, we provide standardized average annual total return information through the latest calendar quarter.
6. Figures are as stated in the Fund’s current prospectus. In periods of market volatility, assets may decline significantly, causing total annual Fund operating expenses to
become higher than the figures shown.
franklintempleton.com Semiannual Report | 9
FRANKLIN INTERNATIONAL GROWTH FUND
Your Fund’s Expenses
As a Fund shareholder, you can incur two types of costs:
- Transaction costs, including sales charges (loads) on Fund purchases; and
- Ongoing Fund costs, including management fees, distribu- tion and service (12b-1) fees, and other Fund expenses. All mutual funds have ongoing costs, sometimes referred to as operating expenses.
The following table shows ongoing costs of investing in the Fund and can help you understand these costs and compare them with those of other mutual funds. The table assumes a $1,000 investment held for the six months indicated.
Actual Fund Expenses
The first line (Actual) for each share class listed in the table provides actual account values and expenses. The “Ending Account Value” is derived from the Fund’s actual return, which includes the effect of Fund expenses.
You can estimate the expenses you paid during the period by following these steps. Of course, your account value and expenses will differ from those in this illustration:
| 1. | Divide your account value by $1,000. |
| | If an account had an $8,600 value, then $8,600 ÷ $1,000 = 8.6. |
| 2. | Multiply the result by the number under the heading “Expenses Paid During Period.” |
| | If Expenses Paid During Period were $7.50, then 8.6 x $7.50 = $64.50. |
In this illustration, the estimated expenses paid this period are $64.50.
Hypothetical Example for Comparison with Other Funds
Information in the second line (Hypothetical) for each class in the table can help you compare ongoing costs of investing in the Fund with those of other mutual funds. This information may not be used to estimate the actual ending account balance or expenses you paid during the period. The hypothetical “Ending Account Value” is based on the actual expense ratio for each class and an assumed 5% annual rate of return before expenses, which does not represent the Fund’s actual return. The figure under the heading “Expenses Paid During Period” shows the hypothetical expenses your account would have incurred under this scenario. You can compare this figure with the 5% hypothetical examples that appear in shareholder reports of other funds.
Please note that expenses shown in the table are meant to highlight ongoing costs and do not reflect any transaction costs, such as sales charges. Therefore, the second line for each class is useful in comparing ongoing costs only, and will not help you compare total costs of owning different funds. In addition, if transaction costs were included, your total costs would have been higher. Please refer to the Fund prospectus for additional information on operating expenses.
10 | Semiannual Report
franklintempleton.com
FRANKLIN INTERNATIONAL GROWTH FUND
YOUR FUND’S EXPENSES
| | | | | | |
| | | Beginning Account | | Ending Account | | Expenses Paid During |
| Share Class | | Value 8/1/14 | | Value 1/31/15 | | Period* 8/1/14–1/31/15 |
| A | | | | | | |
| Actual | $ | 1,000 | $ | 948.90 | $ | 7.32 |
| Hypothetical (5% return before expenses) | $ | 1,000 | $ | 1,017.69 | $ | 7.58 |
| C | | | | | | |
| Actual | $ | 1,000 | $ | 945.70 | $ | 10.74 |
| Hypothetical (5% return before expenses) | $ | 1,000 | $ | 1,014.17 | $ | 11.12 |
| R | | | | | | |
| Actual | $ | 1,000 | $ | 947.90 | $ | 8.30 |
| Hypothetical (5% return before expenses) | $ | 1,000 | $ | 1,016.69 | $ | 8.59 |
| R6 | | | | | | |
| Actual | $ | 1,000 | $ | 951.40 | $ | 5.02 |
| Hypothetical (5% return before expenses) | $ | 1,000 | $ | 1,020.06 | $ | 5.19 |
| Advisor | | | | | | |
| Actual | $ | 1,000 | $ | 950.10 | $ | 5.85 |
| Hypothetical (5% return before expenses) | $ | 1,000 | $ | 1,019.21 | $ | 6.06 |
*Expenses are calculated using the most recent six-month expense ratio, net of expense waivers, annualized for each class (A: 1.49%;
C: 2.19%; R: 1.69%; R6: 1.02%; and Advisor: 1.19%), multiplied by the average account value over the period, multiplied by 184/365 to
reflect the one-half year period.
franklintempleton.com Semiannual Report | 11
Franklin International Small Cap Growth Fund
This semiannual report for Franklin International Small Cap Growth Fund covers the six months ended January 31, 2015.
Your Fund’s Goal and Main Investments
The Fund seeks long-term capital appreciation by investing at least 80% of its net assets in a diversified portfolio of marketable equity and equity-related securities of smaller international companies with market capitalizations not exceeding $5 billion (or the equivalent in local currencies), or the highest market capitalization of the MSCI Europe, Australasia, Far East (EAFE) Small Cap Index, whichever is greater, at the time of purchase. The Fund considers international companies to be those organized under the laws of a country outside of the U.S. or having a principal office in a country outside of the U.S., or whose securities are listed or traded principally on a recognized stock exchange or over-the-counter market outside of the U.S.
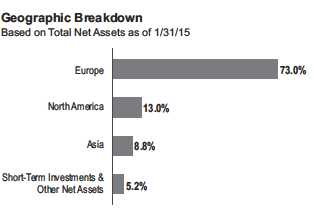
Performance Overview
For the six months ended January 31, 2015, the Fund’s Class A shares had a -9.94% cumulative total return. In comparison, the Fund’s benchmark, the MSCI EAFE Small Cap Index, which tracks small cap equity performance in global developed markets excluding the U.S. and Canada, had a -7.51% total return.1 You can find more of the Fund’s performance data in the Performance Summary beginning on page 15.
Performance data represent past performance, which does not guarantee future results. Investment return and principal value will fluctuate, and you may have a gain or loss when you sell your shares. Current performance may differ from figures shown. Please visit franklintempleton.com or call (800) 342-5236 for most recent month-end performance.
Investment Strategy
In choosing individual equity investments, we use a fundamental, bottom-up approach involving in-depth analysis of individual equity securities. We employ a quantitative and qualitative approach to identify smaller international companies that we believe have the potential to generate attractive returns with lower downside risk. Such companies tend to have proprietary products and services, which can sustain a longer term competitive advantage, and they tend to have a higher probability of maintaining a strong balance sheet and/or generating cash flow. After we identify a company, we conduct a thorough analysis to establish its earnings prospects and determine its value. Overall, we seek to invest in companies with attractive valuations.
We do not select investments for the Fund that are merely representative of the small cap asset class but instead aim to produce a portfolio of securities of exceptional companies operating in sectors that offer attractive growth potential.
Although we seek to outperform the MSCI EAFE Small Cap Index, the Fund may take positions that are not represented in the index.
Manager’s Discussion
During the six months under review, stock selection in the materials and industrials sectors was a leading contributor to the Fund’s performance relative to the MSCI EAFE Small Cap Index.2 A relatively small exposure to metals and mining companies during a period of falling commodity prices aided our materials sector performance. Within industrials, an overweighted position in Irish building materials distributor and trading company Grafton Group was beneficial. In August, Grafton reported double-digit year-over-year growth in revenue
1. Source: Morningstar.
The index is unmanaged and includes reinvested dividends. One cannot invest directly in an index, and an index is not representative of the Fund’s portfolio.
2. The materials sector comprises chemicals and metals and mining in the SOI. The industrials sector comprises air freight and logistics, building products, commercial
services and supplies, construction and engineering, electrical equipment, machinery, marine, professional services, and trading companies and distributors in the SOI.
The dollar value, number of shares or principal amount, and names of all portfolio holdings are listed in the Fund’s Statement of Investments (SOI).
The SOI begins on page 32.
12 | Semiannual Report franklintempleton.com
FRANKLIN INTERNATIONAL SMALL CAP GROWTH FUND
and profit and an increase in its operating margin. It also announced a 25% dividend increase. An overweighted allocation to the financials sector, which declined less than the index, also aided relative performance.3 Key individual contributors in the sector included positions in insurers Fairfax Financial Holdings,4 headquartered in Canada, and Bermuda-based Arch Capital Group.4 An overweighted position in Finnish firm Valmet, which supplies services and technologies to the pulp, paper and energy industries, was another key contributor.
| | |
| Top 10 Sectors/Industries | | |
| 1/31/15 | | |
| | % of Total | |
| | Net Assets | |
| Insurance | 14.4 | % |
| Machinery | 8.4 | % |
| Real Estate Investment Trusts | 7.2 | % |
| Capital Markets | 5.5 | % |
| Professional Services | 5.0 | % |
| Trading Companies & Distributors | 4.8 | % |
| Diversified Financial Services | 4.3 | % |
| Air Freight & Logistics | 4.1 | % |
| Food & Staples Retailing | 4.0 | % |
| Leisure Products | 3.4 | % |
In contrast, stock selection in the information technology (IT), consumer staples and consumer discretionary sectors detracted from the Fund’s relative performance.5 Within IT, an overweighted position in U.K.-based Optimal Payments hurt results as the payment processor’s share price fell sharply during the period. Among consumer staples, an overweighted position in Ireland-based alcoholic beverage manufacturer C&C Group hurt performance. C&C shares lost value as lower sales volumes in the company’s key markets led management to revise its fiscal year 2015 operating profit guidance downward. Also in consumer staples, the share price fell for Japanese wigmaker and hair restoration services provider Aderans Co. as the company reported an operating profit decline year-over-year for the first three quarters of fiscal year 2014 and its largest shareholder substantially reduced its stake. French boat manufacturer Beneteau and Dalata Hotel Group,4 Ireland’s largest hotel operator, were key consumer discretionary sector detractors. Other major detractors included U.K.-based outsourcing company Serco Group and a position in Spanish elevator and escalator manufacturer Zardoya Otis.4 Serco shares plunged in November as the company announced it would take substantial impairment charges (write down the book value of its assets), lowered its operating profit guidance for fiscal years 2014 and 2015, and planned a rights issue to raise additional capital. Zardoya Otis continued to be negatively affected by a prolonged slowdown in Spain’s housing market.
| | |
| Top 10 Countries | | |
| 1/31/15 | | |
| | % of Total | |
| | Net Assets | |
| U.K. | 26.6 | % |
| Ireland | 16.5 | % |
| Netherlands | 7.7 | % |
| U.S. | 7.2 | % |
| Finland | 6.3 | % |
| Canada | 5.8 | % |
| Japan | 5.3 | % |
| France | 5.1 | % |
| Singapore | 3.5 | % |
| Spain | 3.3 | % |
From a regional perspective, positions in North America,4 which outperformed the index as a whole, helped relative performance. In Europe, the benefit of stock selection in Finland, the Netherlands, Belgium, Denmark and Austria was not enough to outweigh the negative effects of stock selection in the U.K., France, Spain and Ireland. Stock selection in Japan also detracted from relative performance.
It is important to recognize the effect of currency movements on the Fund’s performance. In general, if the value of the U.S. dollar goes up compared with a foreign currency, an investment traded in that foreign currency will go down in value because it will be worth fewer U.S. dollars. This can have a negative effect on Fund performance. Conversely, when the U.S. dollar weakens in relation to a foreign currency, an investment traded in that foreign currency will increase in value, which can contribute to Fund performance. For the six months ended January 31, 2015, the U.S. dollar rose in value relative to most currencies. As a result, the Fund’s performance was negatively affected by the portfolio’s investment predominantly in securities with non-U.S. currency exposure.
3. The financials sector comprises capital markets, diversified financial services, insurance and real estate investment trusts in the SOI.
4. Not part of the index.
5. The IT sector comprises IT services in the SOI. The consumer staples sector comprises beverages, food and staples retailing, household products and personal products
in the SOI. The consumer discretionary sector comprises distributors; hotels, restaurants and leisure; leisure products; media and specialty retail in the SOI.
See www.franklintempletondatasources.com for additional data provider information.
franklintempleton.com Semiannual Report | 13
FRANKLIN INTERNATIONAL SMALL CAP GROWTH FUND
| | |
| Top 10 Holdings | | |
| 1/31/15 | | |
| Company | % of Total | |
| Sector/Industry, Country | Net Assets | |
| Grafton Group PLC | 4.8 | % |
| Trading Companies & Distributors, Ireland | | |
| Kennedy Wilson Europe Real Estate PLC | 4.3 | % |
| Diversified Financial Services, U.K. | | |
| Fairfax Financial Holdings Ltd. | 4.3 | % |
| Insurance, Canada | | |
| Sligro Food Group NV | 4.0 | % |
| Food & Staples Retailing, Netherlands | | |
| RenaissanceRe Holdings Ltd. | 3.9 | % |
| Insurance, U.S. | | |
| Michael Page International PLC | 3.8 | % |
| Professional Services, U.K. | | |
| TNT Express NV | 3.7 | % |
| Air Freight & Logistics, Netherlands | | |
| Green REIT PLC | 3.5 | % |
| Real Estate Investment Trusts, Ireland | | |
| Vesuvius PLC | 3.5 | % |
| Machinery, U.K. | | |
| Alent PLC | 3.3 | % |
| Chemicals, U.K. | | |
Thank you for your continued participation in Franklin International Small Cap Growth Fund. We look forward to serving your future investment needs.

The foregoing information reflects our analysis, opinions and portfolio holdings as of January 31, 2015, the end of the reporting period. The way we implement our main investment strategies and the resulting portfolio holdings may change depending on factors such as market and economic conditions. These opinions may not be relied upon as investment advice or an offer for a particular security. The information is not a complete analysis of every aspect of any market, country, industry, security or the Fund. Statements of fact are from sources considered reliable, but the investment manager makes no representation or warranty as to their completeness or accuracy. Although historical performance is no guarantee of future results, these insights may help you understand our investment management philosophy.
14 | Semiannual Report franklintempleton.com
FRANKLIN INTERNATIONAL SMALL CAP GROWTH FUND
Performance Summary as of January 31, 2015
Your dividend income will vary depending on dividends or interest paid by securities in the Fund’s portfolio, adjusted for operating expenses of each class. Capital gain distributions are net profits realized from the sale of portfolio securities. The performance table does not reflect any taxes that a shareholder would pay on Fund dividends, capital gain distributions, if any, or any realized gains on the sale of Fund shares. Total return reflects reinvestment of the Fund’s dividends and capital gain distributions, if any, and any unrealized gains or losses.
| | | | | | | | |
| Net Asset Value | | | | | | | | |
| Share Class (Symbol) | | 1/31/15 | | 7/31/14 | | Change | | |
| A (FINAX) | $ | 17.97 | $ | 22.23 | -$ | 4.26 | | |
| C (FCSMX) | $ | 17.74 | $ | 21.94 | -$ | 4.20 | | |
| R (FISDX) | $ | 17.95 | $ | 22.19 | -$ | 4.24 | | |
| R6 (FCAPX) | $ | 18.03 | $ | 22.32 | -$ | 4.29 | | |
| Advisor (FKSCX) | $ | 18.02 | $ | 22.30 | -$ | 4.28 | | |
| |
| |
| Distributions (8/1/14–1/31/15) | | | | | | | | |
| | | Dividend | | Short-Term | | Long-Term | | |
| Share Class | | Income | | Capital Gain | | Capital Gain | | Total |
| A | $ | 0.2922 | $ | 0.2259 | $ | 1.5014 | $ | 2.0195 |
| C | $ | 0.1917 | $ | 0.2259 | $ | 1.5014 | $ | 1.9190 |
| R | $ | 0.2482 | $ | 0.2259 | $ | 1.5014 | $ | 1.9755 |
| R6 | $ | 0.3467 | $ | 0.2259 | $ | 1.5014 | $ | 2.0740 |
| Advisor | $ | 0.3317 | $ | 0.2259 | $ | 1.5014 | $ | 2.0590 |
franklintempleton.com
Semiannual Report | 15
FRANKLIN INTERNATIONAL SMALL CAP GROWTH FUND
PERFORMANCE SUMMARY
Performance as of 1/31/15
Cumulative total return excludes sales charges. Average annual total returns and value of $10,000 investment include maximum sales charges. Class A: 5.75% maximum initial sales charge; Class C: 1% contingent deferred sales charge in first year only;
Class R/R6/Advisor Class: no sales charges.
| | | | | | | | | | | | | |
| | | Cumulative | | | Average Annual | | | Value of | | Average Annual | | Total Annual | |
| Share Class | | Total Return1 | | | Total Return2 | | $ | 10,000 Investment3 | | Total Return (12/31/14)4 | | Operating Expenses5 | |
| A | | | | | | | | | | | | 1.42 | % |
| 6-Month | | -9.94 | % | | -15.12 | % | $ | 8,488 | | | | | |
| 1-Year | | -7.40 | % | | -12.72 | % | $ | 8,728 | | -16.02 | % | | |
| 5-Year | + | 61.21 | % | + | 8.73 | % | $ | 15,195 | + | 8.45 | % | | |
| Since Inception (5/15/08) | + | 55.77 | % | + | 5.88 | % | $ | 14,681 | + | 6.01 | % | | |
| C | | | | | | | | | | | | 2.12 | % |
| 6-Month | | -10.27 | % | | -11.08 | % | $ | 8,892 | | | | | |
| 1-Year | | -8.09 | % | | -8.92 | % | $ | 9,108 | | -12.34 | % | | |
| 5-Year | + | 55.61 | % | + | 9.25 | % | $ | 15,561 | + | 8.97 | % | | |
| Since Inception (5/15/08) | + | 48.86 | % | + | 6.10 | % | $ | 14,886 | + | 6.24 | % | | |
| R | | | | | | | | | | | | 1.62 | % |
| 6-Month | | -10.07 | % | | -10.07 | % | $ | 8,993 | | | | | |
| 1-Year | | -7.66 | % | | -7.66 | % | $ | 9,234 | | -11.18 | % | | |
| 5-Year | + | 59.37 | % | + | 9.77 | % | $ | 15,937 | + | 9.49 | % | | |
| Since Inception (5/15/08) | + | 53.29 | % | + | 6.57 | % | $ | 15,329 | + | 6.70 | % | | |
| R66 | | | | | | | | | | | | 1.00 | % |
| 6-Month | | -9.79 | % | | -9.79 | % | $ | 9,021 | | | | | |
| 1-Year | | -7.08 | % | | -7.08 | % | $ | 9,292 | | -10.63 | % | | |
| Since Inception (5/1/13) | + | 10.88 | % | + | 6.06 | % | $ | 11,088 | + | 6.52 | % | | |
| Advisor | | | | | | | | | | | | 1.12 | % |
| 6-Month | | -9.82 | % | | -9.82 | % | $ | 9,018 | | | | | |
| 1-Year | | -7.20 | % | | -7.20 | % | $ | 9,280 | | -10.74 | % | | |
| 5-Year | + | 63.45 | % | + | 10.33 | % | $ | 16,345 | + | 10.03 | % | | |
| 10-Year | + | 199.12 | % | + | 11.58 | % | $ | 29,912 | + | 11.87 | % | | |
Performance data represent past performance, which does not guarantee future results. Investment return and principal value will fluctuate, and you may have a gain or loss when you sell your shares. Current performance may differ from figures shown. For most recent month-end performance, go to franklintempleton.com or call (800) 342-5236.
16 | Semiannual Report
franklintempleton.com
FRANKLIN INTERNATIONAL SMALL CAP GROWTH FUND
PERFORMANCE SUMMARY
All investments involve risks, including possible loss of principal. The Fund is intended for long-term investors who are comfortable with fluctuation in the value of their investment, especially over the short term. Smaller, relatively new and/or unseasoned companies can be particularly sensitive to changing economic conditions, and their prospects for growth are less certain than those of larger, more established companies. Foreign investing involves additional risks such as currency and market volatility, as well as political and social instability. Investments in emerging markets involve heightened risks relating to the same factors. The Fund is actively managed but there is no guarantee that the manager’s investment decisions will produce the desired results. The Fund’s prospectus also includes a description of the main investment risks.
| |
| Class C: | These shares have higher annual fees and expenses than Class A shares. |
| Class R: | Shares are available to certain eligible investors as described in the prospectus. These shares have higher annual fees and expenses than Class A shares. |
| Class R6: | Shares are available to certain eligible investors as described in the prospectus. |
| Advisor Class: | Shares are available to certain eligible investors as described in the prospectus. |
1. Cumulative total return represents the change in value of an investment over the periods indicated.
2. Average annual total return represents the average annual change in value of an investment over the periods indicated. Six-month return has not been annualized.
3. These figures represent the value of a hypothetical $10,000 investment in the Fund over the periods indicated.
4. In accordance with SEC rules, we provide standardized average annual total return information through the latest calendar quarter.
5. Figures are as stated in the Fund’s current prospectus. In periods of market volatility, assets may decline significantly, causing total annual Fund operating expenses to
become higher than the figures shown.
6. Class R6 shares have a fee waiver guaranteed through at least 11/30/15. Investment results reflect the fee waiver, to the extent applicable; without this reduction, the
results would have been lower.
franklintempleton.com
Semiannual Report | 17
FRANKLIN INTERNATIONAL SMALL CAP GROWTH FUND
Your Fund’s Expenses
As a Fund shareholder, you can incur two types of costs:
- Transaction costs, including sales charges (loads) on Fund purchases; and
- Ongoing Fund costs, including management fees, distribu- tion and service (12b-1) fees, and other Fund expenses. All mutual funds have ongoing costs, sometimes referred to as operating expenses.
The following table shows ongoing costs of investing in the Fund and can help you understand these costs and compare them with those of other mutual funds. The table assumes a $1,000 investment held for the six months indicated.
Actual Fund Expenses
The first line (Actual) for each share class listed in the table provides actual account values and expenses. The “Ending Account Value” is derived from the Fund’s actual return, which includes the effect of Fund expenses.
You can estimate the expenses you paid during the period by following these steps. Of course, your account value and expenses will differ from those in this illustration:
| 1. | Divide your account value by $1,000. |
| | If an account had an $8,600 value, then $8,600 ÷ $1,000 = 8.6. |
| 2. | Multiply the result by the number under the heading “Expenses Paid During Period.” |
| | If Expenses Paid During Period were $7.50, then 8.6 x $7.50 = $64.50. |
In this illustration, the estimated expenses paid this period are $64.50.
Hypothetical Example for Comparison with Other Funds
Information in the second line (Hypothetical) for each class in the table can help you compare ongoing costs of investing in the Fund with those of other mutual funds. This information may not be used to estimate the actual ending account balance or expenses you paid during the period. The hypothetical “Ending Account Value” is based on the actual expense ratio for each class and an assumed 5% annual rate of return before expenses, which does not represent the Fund’s actual return. The figure under the heading “Expenses Paid During Period” shows the hypothetical expenses your account would have incurred under this scenario. You can compare this figure with the 5% hypothetical examples that appear in shareholder reports of other funds.
Please note that expenses shown in the table are meant to highlight ongoing costs and do not reflect any transaction costs, such as sales charges. Therefore, the second line for each class is useful in comparing ongoing costs only, and will not help you compare total costs of owning different funds. In addition, if transaction costs were included, your total costs would have been higher. Please refer to the Fund prospectus for additional information on operating expenses.
18 | Semiannual Report
franklintempleton.com
FRANKLIN INTERNATIONAL SMALL CAP GROWTH FUND
YOUR FUND’S EXPENSES
| | | | | | |
| | | Beginning Account | | Ending Account | | Expenses Paid During |
| Share Class | | Value 8/1/14 | | Value 1/31/15 | | Period* 8/1/14–1/31/15 |
| A | | | | | | |
| Actual | $ | 1,000 | $ | 900.60 | $ | 6.47 |
| Hypothetical (5% return before expenses) | $ | 1,000 | $ | 1,018.40 | $ | 6.87 |
| C | | | | | | |
| Actual | $ | 1,000 | $ | 897.30 | $ | 9.76 |
| Hypothetical (5% return before expenses) | $ | 1,000 | $ | 1,014.92 | $ | 10.36 |
| R | | | | | | |
| Actual | $ | 1,000 | $ | 899.30 | $ | 7.71 |
| Hypothetical (5% return before expenses) | $ | 1,000 | $ | 1,017.09 | $ | 8.19 |
| R6 | | | | | | |
| Actual | $ | 1,000 | $ | 902.10 | $ | 4.75 |
| Hypothetical (5% return before expenses) | $ | 1,000 | $ | 1,020.21 | $ | 5.04 |
| Advisor | | | | | | |
| Actual | $ | 1,000 | $ | 901.80 | $ | 5.32 |
| Hypothetical (5% return before expenses) | $ | 1,000 | $ | 1,019.61 | $ | 5.65 |
*Expenses are calculated using the most recent six-month expense ratio, annualized for each class (A: 1.35%; C: 2.04%; R: 1.61%; R6: 0.99%;
and Advisor: 1.11%), multiplied by the average account value over the period, multiplied by 184/365 to reflect the one-half year period.
franklintempleton.com Semiannual Report | 19
| | | | | | | | | | | | | | | | | | |
| FRANKLIN GLOBAL TRUST | | | | | | | | | | | | | | | | | | |
| |
| |
| Financial Highlights | | | | | | | | | | | | | | | | | | |
| Franklin International Growth Fund | | | | | | | | | | | | | | | | | | |
| | | Six Months Ended | | | | | | | | | | | | | | | | |
| | | January 31, 2015 | | | | | | | | | Year Ended July 31, | | | | |
| | | (unaudited) | | | 2014 | | | 2013 | | | 2012 | | | 2011 | | | 2010 | |
| Class A | | | | | | | | | | | | | | | | | | |
| Per share operating performance | | | | | | | | | | | | | | | | | | |
| (for a share outstanding throughout the period) | | | | | | | | | | | | | | | | | | |
| Net asset value, beginning of period | $ | 11.40 | | $ | 10.45 | | $ | 9.11 | | $ | 9.86 | | $ | 8.47 | | $ | 7.47 | |
| Income from investment operationsa: | | | | | | | | | | | | | | | | | | |
| Net investment income (loss)b | | (0.02 | ) | | 0.05 | | | 0.10 | | | 0.12 | | | 0.11 | | | 0.11 | |
| Net realized and unrealized gains | | | | | | | | | | | | | | | | | | |
| (losses) | | (0.57 | ) | | 0.95 | | | 1.33 | | | (0.77 | ) | | 1.36 | | | 0.97 | |
| Total from investment operations | | (0.59 | ) | | 1.00 | | | 1.43 | | | (0.65 | ) | | 1.47 | | | 1.08 | |
| Less distributions from: | | | | | | | | | | | | | | | | | | |
| Net investment income | | (0.03 | ) | | (0.05 | ) | | (0.09 | ) | | (0.10 | ) | | (0.08 | ) | | (0.08 | ) |
| Net realized gains | | (0.07 | ) | | — | | | — | | | — | | | — | | | — | |
| Total distributions | | (0.10 | ) | | (0.05 | ) | | (0.09 | ) | | (0.10 | ) | | (0.08 | ) | | (0.08 | ) |
| Net asset value, end of period | $ | 10.71 | | $ | 11.40 | | $ | 10.45 | | $ | 9.11 | | $ | 9.86 | | $ | 8.47 | |
| |
| Total returnc | | (5.11 | )% | | 9.56 | % | | 15.69 | % | | (6.46 | )% | | 17.34 | % | | 14.56 | % |
| |
| Ratios to average net assetsd | | | | | | | | | | | | | | | | | | |
| Expenses before waiver and payments by | | | | | | | | | | | | | | | | | | |
| affiliates | | 1.74 | % | | 1.70 | % | | 1.52 | % | | 1.69 | % | | 1.64 | % | | 1.96 | % |
| Expenses net of waiver and payments by | | | | | | | | | | | | | | | | | | |
| affiliates | | 1.49 | % | | 1.49 | %e | | 1.49 | % | | 1.52 | % | | 1.37 | % | | 1.32 | % |
| Net investment income (loss) | | (0.31 | )% | | 0.48 | % | | 1.07 | % | | 1.46 | % | | 1.15 | % | | 1.40 | % |
| |
| Supplemental data | | | | | | | | | | | | | | | | | | |
| Net assets, end of period (000’s) | $ | 173,241 | | $ | 179,862 | | $ | 34,466 | | $ | 17,966 | | $ | 13,640 | | $ | 8,920 | |
| Portfolio turnover rate | | 30.55 | % | | 29.63 | % | | 26.06 | % | | 28.80 | % | | 13.21 | % | | 17.07 | % |
aThe amount shown for a share outstanding throughout the period may not correlate with the Statement of Operations for the period due to the timing of sales and
repurchases of the Fund shares in relation to income earned and/or fluctuating fair value of the investments of the Fund.
bBased on average daily shares outstanding.
cTotal return does not reflect sales commissions or contingent deferred sales charges, if applicable, and is not annualized for periods less than one year.
dRatios are annualized for periods less than one year.
eBenefit of expense reduction rounds to less than 0.01%.
20 | Semiannual Report | The accompanying notes are an integral part of these financial statements. franklintempleton.com
FRANKLIN GLOBAL TRUST
FINANCIAL HIGHLIGHTS
| | | | | | | | | | | | | | | | | | |
| Franklin International Growth Fund (continued) | | | | | | | | | | | | | | | | |
| | | Six Months Ended | | | | | | | | | | | | | | | | |
| | | January 31, 2015 | | | | | | | | | Year Ended July 31, | | | | |
| | | (unaudited) | | | 2014 | | | 2013 | | | 2012 | | | 2011 | | | 2010 | |
| Class C | | | | | | | | | | | | | | | | | | |
| Per share operating performance | | | | | | | | | | | | | | | | | | |
| (for a share outstanding throughout the period) | | | | | | | | | | | | | | | | | | |
| Net asset value, beginning of period | $ | 11.22 | | $ | 10.31 | | $ | 9.00 | | $ | 9.73 | | $ | 8.38 | | $ | 7.42 | |
| Income from investment operationsa: | | | | | | | | | | | | | | | | | | |
| Net investment income (loss)b | | (0.05 | ) | | (0.02 | ) | | 0.02 | | | 0.05 | | | 0.04 | | | 0.04 | |
| Net realized and unrealized gains | | | | | | | | | | | | | | | | | | |
| (losses) | | (0.56 | ) | | 0.93 | | | 1.32 | | | (0.74 | ) | | 1.34 | | | 0.96 | |
| Total from investment operations | | (0.61 | ) | | 0.91 | | | 1.34 | | | (0.69 | ) | | 1.38 | | | 1.00 | |
| Less distributions from: | | | | | | | | | | | | | | | | | | |
| Net investment income | | — | | | — | | | (0.03 | ) | | (0.04 | ) | | (0.03 | ) | | (0.04 | ) |
| Net realized gains | | (0.07 | ) | | — | | | — | | | — | | | — | | | — | |
| Total distributions | | (0.07 | ) | | — | | | (0.03 | ) | | (0.04 | ) | | (0.03 | ) | | (0.04 | ) |
| Net asset value, end of period | $ | 10.54 | | $ | 11.22 | | $ | 10.31 | | $ | 9.00 | | $ | 9.73 | | $ | 8.38 | |
| |
| Total returnc | | (5.43 | )% | | 8.83 | % | | 14.88 | % | | (7.08 | )% | | 16.43 | % | | 13.47 | % |
| |
| Ratios to average net assetsd | | | | | | | | | | | | | | | | | | |
| Expenses before waiver and payments by | | | | | | | | | | | | | | | | | | |
| affiliates | | 2.44 | % | | 2.40 | % | | 2.22 | % | | 2.35 | % | | 2.42 | % | | 2.79 | % |
| Expenses net of waiver and payments by | | | | | | | | | | | | | | | | | | |
| affiliates | | 2.19 | % | | 2.19 | %e | | 2.19 | % | | 2.18 | % | | 2.15 | % | | 2.15 | % |
| Net investment income (loss) | | (1.01 | )% | | (0.22 | )% | | 0.37 | % | | 0.80 | % | | 0.37 | % | | 0.57 | % |
| |
| Supplemental data | | | | | | | | | | | | | | | | | | |
| Net assets, end of period (000’s) | $ | 5,673 | | $ | 5,977 | | $ | 4,032 | | $ | 2,545 | | $ | 2,946 | | $ | 1,126 | |
| Portfolio turnover rate | | 30.55 | % | | 29.63 | % | | 26.06 | % | | 28.80 | % | | 13.21 | % | | 17.07 | % |
aThe amount shown for a share outstanding throughout the period may not correlate with the Statement of Operations for the period due to the timing of sales and
repurchases of the Fund shares in relation to income earned and/or fluctuating fair value of the investments of the Fund.
bBased on average daily shares outstanding.
cTotal return does not reflect sales commissions or contingent deferred sales charges, if applicable, and is not annualized for periods less than one year.
dRatios are annualized for periods less than one year.
eBenefit of expense reduction rounds to less than 0.01%.
franklintempleton.com The accompanying notes are an integral part of these financial statements. | Semiannual Report | 21
FRANKLIN GLOBAL TRUST
FINANCIAL HIGHLIGHTS
| | | | | | | | | | | | | | | | | | |
| Franklin International Growth Fund (continued) | | | | | | | | | | | | | | | | |
| | | Six Months Ended | | | | | | | | | | | | | | | | |
| | | January 31, 2015 | | | | | | | | | Year Ended July 31, | | | | |
| | | (unaudited) | | | 2014 | | | 2013 | | | 2012 | | | 2011 | | | 2010 | |
| Class R | | | | | | | | | | | | | | | | | | |
| Per share operating performance | | | | | | | | | | | | | | | | | | |
| (for a share outstanding throughout the period) | | | | | | | | | | | | | | | | | | |
| Net asset value, beginning of period | $ | 11.38 | | $ | 10.41 | | $ | 9.08 | | $ | 9.83 | | $ | 8.45 | | $ | 7.46 | |
| Income from investment operationsa: | | | | | | | | | | | | | | | | | | |
| Net investment income (loss)b | | (0.03 | ) | | 0.03 | | | 0.07 | | | 0.14 | | | 0.08 | | | 0.08 | |
| Net realized and unrealized gains | | | | | | | | | | | | | | | | | | |
| (losses) | | (0.56 | ) | | 0.95 | | | 1.33 | | | (0.81 | ) | | 1.35 | | | 0.97 | |
| Total from investment operations | | (0.59 | ) | | 0.98 | | | 1.40 | | | (0.67 | ) | | 1.43 | | | 1.05 | |
| Less distributions from: | | | | | | | | | | | | | | | | | | |
| Net investment income | | (0.01 | ) | | (0.01 | ) | | (0.07 | ) | | (0.08 | ) | | (0.05 | ) | | (0.06 | ) |
| Net realized gains | | (0.07 | ) | | — | | | — | | | — | | | — | | | — | |
| Total distributions | | (0.08 | ) | | (0.01 | ) | | (0.07 | ) | | (0.08 | ) | | (0.05 | ) | | (0.06 | ) |
| Net asset value, end of period | $ | 10.71 | | $ | 11.38 | | $ | 10.41 | | $ | 9.08 | | $ | 9.83 | | $ | 8.45 | |
| |
| Total returnc | | (5.21 | )% | | 9.44 | % | | 15.47 | % | | (6.79 | )% | | 17.10 | % | | 14.05 | % |
| |
| Ratios to average net assetsd | | | | | | | | | | | | | | | | | | |
| Expenses before waiver and payments by | | | | | | | | | | | | | | | | | | |
| affiliates | | 1.94 | % | | 1.90 | % | | 1.72 | % | | 1.85 | % | | 1.92 | % | | 2.29 | % |
| Expenses net of waiver and payments by | | | | | | | | | | | | | | | | | | |
| affiliates | | 1.69 | % | | 1.69 | %e | | 1.69 | % | | 1.68 | % | | 1.65 | % | | 1.65 | % |
| Net investment income (loss) | | (0.51 | )% | | 0.28 | % | | 0.87 | % | | 1.30 | % | | 0.87 | % | | 1.07 | % |
| |
| Supplemental data | | | | | | | | | | | | | | | | | | |
| Net assets, end of period (000’s) | $ | 222 | | $ | 222 | | $ | 274 | | $ | 150 | | $ | 47 | | $ | 41 | |
| Portfolio turnover rate | | 30.55 | % | | 29.63 | % | | 26.06 | % | | 28.80 | % | | 13.21 | % | | 17.07 | % |
aThe amount shown for a share outstanding throughout the period may not correlate with the Statement of Operations for the period due to the timing of sales and
repurchases of the Fund shares in relation to income earned and/or fluctuating fair value of the investments of the Fund.
bBased on average daily shares outstanding.
cTotal return is not annualized for periods less than one year.
dRatios are annualized for periods less than one year.
eBenefit of expense reduction rounds to less than 0.01%.
22 | Semiannual Report | The accompanying notes are an integral part of these financial statements. franklintempleton.com
FRANKLIN GLOBAL TRUST
FINANCIAL HIGHLIGHTS
| | | | | | | | | |
| Franklin International Growth Fund (continued) | | | | | | | | | |
| | | Six Months Ended | | | Year Ended | |
| | | January 31, 2015 | | | July 31, | |
| | | (unaudited) | | | 2014 | | | 2013 | a |
| Class R6 | | | | | | | | | |
| Per share operating performance | | | | | | | | | |
| (for a share outstanding throughout the period) | | | | | | | | | |
| Net asset value, beginning of period | $ | 11.48 | | $ | 10.48 | | $ | 10.56 | |
| Income from investment operationsb: | | | | | | | | | |
| Net investment income (loss)c | | (0.01 | ) | | 0.11 | | | 0.07 | |
| Net realized and unrealized gains (losses) | | (0.55 | ) | | 0.94 | | | (0.15 | ) |
| Total from investment operations | | (0.56 | ) | | 1.05 | | | (0.08 | ) |
| Less distributions from: | | | | | | | | | |
| Net investment income | | (0.08 | ) | | (0.05 | ) | | — | |
| Net realized gains | | (0.07 | ) | | — | | | — | |
| Total distributions | | (0.15 | ) | | (0.05 | ) | | — | |
| Net asset value, end of period | $ | 10.77 | | $ | 11.48 | | $ | 10.48 | |
| |
| Total returnd | | (4.86 | )% | | 10.05 | % | | (0.76 | )% |
| |
| Ratios to average net assetse | | | | | | | | | |
| Expenses before waiver and payments by affiliates | | 1.02 | % | | 1.02 | % | | 1.13 | % |
| Expenses net of waiver and payments by affiliates | | 1.02 | %f | | 1.02 | %f,g | | 1.10 | % |
| Net investment income | | 0.16 | % | | 0.95 | % | | 1.45 | % |
| |
| Supplemental data | | | | | | | | | |
| Net assets, end of period (000’s) | $ | 30,465 | | $ | 29,132 | | $ | 22,296 | |
| Portfolio turnover rate | | 30.55 | % | | 29.63 | % | | 26.06 | % |
aFor the period May 1, 2013 (effective date) to July 31, 2013.
bThe amount shown for a share outstanding throughout the period may not correlate with the Statement of Operations for the period due to the timing of sales and
repurchases of the Fund shares in relation to income earned and/or fluctuating fair value of the investments of the Fund.
cBased on average daily shares outstanding.
dTotal return is not annualized for periods less than one year.
eRatios are annualized for periods less than one year.
fBenefit of waiver and payments by affiliates rounds to less than 0.01%.
gBenefit of expense reduction rounds to less than 0.01%.
franklintempleton.com The accompanying notes are an integral part of these financial statements. | Semiannual Report | 23
FRANKLIN GLOBAL TRUST
FINANCIAL HIGHLIGHTS
| | | | | | | | | | | | | | | | | | |
| Franklin International Growth Fund (continued) | | | | | | | | | | | | | | | | |
| | | Six Months Ended | | | | | | | | | | | | | | | | |
| | | January 31, 2015 | | | | | | | | | Year Ended July 31, | | | | |
| | | (unaudited) | | | 2014 | | | 2013 | | | 2012 | | | 2011 | | | 2010 | |
| Advisor Class | | | | | | | | | | | | | | | | | | |
| Per share operating performance | | | | | | | | | | | | | | | | | | |
| (for a share outstanding throughout the period) | | | | | | | | | | | | | | | | | | |
| Net asset value, beginning of period | $ | 11.47 | | $ | 10.48 | | $ | 9.13 | | $ | 9.89 | | $ | 8.49 | | $ | 7.48 | |
| Income from investment operationsa: | | | | | | | | | | | | | | | | | | |
| Net investment incomeb | | —c | | | 0.09 | | | 0.13 | | | 0.17 | | | 0.13 | | | 0.15 | |
| Net realized and unrealized gains | | | | | | | | | | | | | | | | | | |
| (losses) | | (0.58 | ) | | 0.95 | | | 1.33 | | | (0.80 | ) | | 1.36 | | | 0.95 | |
| Total from investment operations | | (0.58 | ) | | 1.04 | | | 1.46 | | | (0.63 | ) | | 1.49 | | | 1.10 | |
| Less distributions from: | | | | | | | | | | | | | | | | | | |
| Net investment income | | (0.06 | ) | | (0.05 | ) | | (0.11 | ) | | (0.13 | ) | | (0.09 | ) | | (0.09 | ) |
| Net realized gains | | (0.07 | ) | | — | | | — | | | — | | | — | | | — | |
| Total distributions | | (0.13 | ) | | (0.05 | ) | | (0.11 | ) | | (0.13 | ) | | (0.09 | ) | | (0.09 | ) |
| Net asset value, end of period | $ | 10.76 | | $ | 11.47 | | $ | 10.48 | | $ | 9.13 | | $ | 9.89 | | $ | 8.49 | |
| |
| Total returnd | | (4.99 | )% | | 9.91 | % | | 16.04 | % | | (6.19 | )% | | 17.65 | % | | 14.66 | % |
| |
| Ratios to average net assetse | | | | | | | | | | | | | | | | | | |
| Expenses before waiver and payments by | | | | | | | | | | | | | | | | | | |
| affiliates | | 1.44 | % | | 1.40 | % | | 1.22 | % | | 1.35 | % | | 1.42 | % | | 1.79 | % |
| Expenses net of waiver and payments by | | | | | | | | | | | | | | | | | | |
| affiliates | | 1.19 | % | | 1.19 | %f | | 1.19 | % | | 1.18 | % | | 1.15 | % | | 1.15 | % |
| Net investment income (loss) | | (0.01 | )% | | 0.78 | % | | 1.37 | % | | 1.80 | % | | 1.37 | % | | 1.57 | % |
| |
| Supplemental data | | | | | | | | | | | | | | | | | | |
| Net assets, end of period (000’s) | $ | 93,764 | | $ | 97,134 | | $ | 74,240 | | $ | 48,549 | | $ | 21,873 | | $ | 11,512 | |
| Portfolio turnover rate | | 30.55 | % | | 29.63 | % | | 26.06 | % | | 28.80 | % | | 13.21 | % | | 17.07 | % |
aThe amount shown for a share outstanding throughout the period may not correlate with the Statement of Operations for the period due to the timing of sales and
repurchases of the Fund shares in relation to income earned and/or fluctuating fair value of the investments of the Fund.
bBased on average daily shares outstanding.
cAmount rounds to less than $0.01 per share.
dTotal return is not annualized for periods less than one year.
eRatios are annualized for periods less than one year.
fBenefit of expense reduction rounds to less than 0.01%.
24 | Semiannual Report | The accompanying notes are an integral part of these financial statements. franklintempleton.com
| | | | |
| | | FRANKLIN GLOBAL TRUST |
| |
| |
| |
| |
| Statement of Investments, January 31, 2015 (unaudited) | | | | |
| |
| Franklin International Growth Fund | | | | |
| | Country | Shares | | Value |
| Common Stocks 96.2% | | | | |
| Aerospace & Defense 2.1% | | | | |
| MTU Aero Engines AG | Germany | 70,000 | $ | 6,415,395 |
| Banks 3.9% | | | | |
| Bank of Nova Scotia | Canada | 125,000 | | 6,007,950 |
| a,bIrish Bank Resolution Corp. Ltd. | Ireland | 11,500 | | — |
| United Overseas Bank Ltd. | Singapore | 340,000 | | 5,823,690 |
| | | | | 11,831,640 |
| Biotechnology 4.5% | | | | |
| aAlkermes PLC | United States | 100,000 | | 7,225,000 |
| CSL Ltd. | Australia | 92,000 | | 6,297,537 |
| | | | | 13,522,537 |
| Capital Markets 6.3% | | | | |
| Aberdeen Asset Management PLC | United Kingdom | 1,395,000 | | 9,197,340 |
| Azimut Holding SpA | Italy | 425,000 | | 9,933,295 |
| | | | | 19,130,635 |
| Chemicals 9.3% | | | | |
| Sika AG | Switzerland | 900 | | 3,086,834 |
| Symrise AG | Germany | 90,000 | | 5,908,973 |
| Syngenta AG | Switzerland | 28,500 | | 9,278,781 |
| Umicore SA | Belgium | 240,000 | | 10,054,337 |
| | | | | 28,328,925 |
| Diversified Consumer Services 2.7% | | | | |
| aTAL Education Group, ADR | China | 265,000 | | 8,217,650 |
| Diversified Financial Services 2.4% | | | | |
| Deutsche Boerse AG | Germany | 94,000 | | 7,223,909 |
| Electronic Equipment, Instruments & Components 1.8% | | | | |
| YASKAWA Electric Corp. | Japan | 425,000 | | 5,503,129 |
| Energy Equipment & Services 3.3% | | | | |
| Amec Foster Wheeler PLC | United Kingdom | 370,000 | | 4,444,714 |
| WorleyParsons Ltd. | Australia | 730,000 | | 5,465,690 |
| | | | | 9,910,404 |
| Health Care Equipment & Supplies 8.3% | | | | |
| Cochlear Ltd. | Australia | 100,000 | | 6,459,890 |
| Elekta AB, B | Sweden | 910,000 | | 9,765,789 |
| GN Store Nord AS | Denmark | 400,000 | | 8,990,266 |
| | | | | 25,215,945 |
| Hotels, Restaurants & Leisure 2.5% | | | | |
| Whitbread PLC | United Kingdom | 100,000 | | 7,539,031 |
| Household Products 2.5% | | | | |
| Reckitt Benckiser Group PLC | United Kingdom | 90,000 | | 7,632,422 |
| Internet & Catalog Retail 2.1% | | | | |
| Start Today Co. Ltd. | Japan | 315,000 | | 6,427,915 |
| Internet Software & Services 1.7% | | | | |
| MercadoLibre Inc. | Argentina | 41,000 | | 5,081,540 |
franklintempleton.com Semiannual Report | 25
FRANKLIN GLOBAL TRUST
STATEMENT OF INVESTMENTS (UNAUDITED)
| | | | | |
| Franklin International Growth Fund (continued) | | | | | |
| | Country | Shares | | Value | |
| Common Stocks (continued) | | | | | |
| Machinery 5.5% | | | | | |
| GEA Group AG | Germany | 177,000 | $ | 8,046,910 | |
| Weir Group PLC | United Kingdom | 340,000 | | 8,603,985 | |
| | | | | 16,650,895 | |
| Media 2.1% | | | | | |
| ITV PLC | United Kingdom | 1,900,000 | | 6,296,334 | |
| Multiline Retail 2.0% | | | | | |
| Dollarama Inc. | Canada | 125,000 | | 5,938,090 | |
| Pharmaceuticals 2.8% | | | | | |
| Roche Holding AG | Switzerland | 32,000 | | 8,656,366 | |
| Professional Services 8.4% | | | | | |
| Experian PLC | United Kingdom | 530,000 | | 9,364,516 | |
| Recruit Holdings Co. Ltd. | Japan | 225,000 | | 6,589,197 | |
| SGS SA | Switzerland | 5,000 | | 9,521,219 | |
| | | | | 25,474,932 | |
| Road & Rail 2.7% | | | | | |
| DSV AS, B | Denmark | 260,000 | | 8,204,832 | |
| Semiconductors & Semiconductor Equipment 3.7% | | | | | |
| ARM Holdings PLC | United Kingdom | 470,000 | | 7,369,874 | |
| ASML Holding NV | Netherlands | 38,000 | | 4,004,202 | |
| | | | | 11,374,076 | |
| Software 7.4% | | | | | |
| aCheck Point Software Technologies Ltd. | Israel | 86,000 | | 6,636,620 | |
| Dassault Systemes SA | France | 125,000 | | 7,755,048 | |
| The Sage Group PLC | United Kingdom | 1,130,000 | | 8,173,575 | |
| | | | | 22,565,243 | |
| Textiles, Apparel & Luxury Goods 5.6% | | | | | |
| Burberry Group PLC | United Kingdom | 335,000 | | 8,724,715 | |
| Luxottica Group SpA | Italy | 139,000 | | 8,282,877 | |
| | | | | 17,007,592 | |
| Trading Companies & Distributors 2.6% | | | | | |
| Noble Group Ltd. | Hong Kong | 9,850,000 | | 7,751,607 | |
| Total Common Stocks (Cost $271,279,212) | | | | 291,901,044 | |
| Short Term Investments (Cost $11,597,917) 3.8% | | | | | |
| Money Market Funds 3.8% | | | | | |
| a,cInstitutional Fiduciary Trust Money Market Portfolio | United States | 11,597,917 | | 11,597,917 | |
| Total Investments (Cost $282,877,129) 100.0% | | | | 303,498,961 | |
| Other Assets, less Liabilities (0.0)%† | | | | (134,863 | ) |
| Net Assets 100.0% | | | $ | 303,364,098 | |
See Abbreviations on page 47.
†Rounds to less than 0.1% of net assets.
aNon-income producing.
bSecurity has been deemed illiquid because it may not be able to be sold within seven days.
cSee Note 3(f) regarding investments in Institutional Fiduciary Trust Money Market Portfolio.
26 | Semiannual Report | The accompanying notes are an integral part of these financial statements. franklintempleton.com
| | | | | | | | | | | | | | | | | | |
| | | | | | | | | | | | FRANKLIN GLOBAL TRUST | |
| |
| |
| Financial Highlights | | | | | | | | | | | | | | | | | | |
| Franklin International Small Cap Growth Fund | | | | | | | | | | | | | | | | |
| | | Six Months Ended | | | | | | | | | | | | | | | | |
| | | January 31, 2015 | | | | | | | | | Year Ended July 31, | | | | |
| | | (unaudited) | | | 2014 | | | 2013 | | | 2012 | | | 2011 | | | 2010 | |
| Class A | | | | | | | | | | | | | | | | | | |
| Per share operating performance | | | | | | | | | | | | | | | | | | |
| (for a share outstanding throughout the period) | | | | | | | | | | | | | | | | | | |
| Net asset value, beginning of period | $ | 22.23 | | $ | 19.70 | | $ | 14.38 | | $ | 16.31 | | $ | 14.99 | | $ | 12.33 | |
| Income from investment operationsa: | | | | | | | | | | | | | | | | | | |
| Net investment incomeb | | 0.05 | | | 0.19 | | | 0.18 | | | 0.25 | | | 0.28 | | | 0.19 | |
| Net realized and unrealized gains | | | | | | | | | | | | | | | | | | |
| (losses) | | (2.29 | ) | | 2.65 | | | 5.94 | | | (1.48 | ) | | 1.29 | | | 2.49 | |
| Total from investment operations | | (2.24 | ) | | 2.84 | | | 6.12 | | | (1.23 | ) | | 1.57 | | | 2.68 | |
| Less distributions from: | | | | | | | | | | | | | | | | | | |
| Net investment income | | (0.29 | ) | | (0.11 | ) | | (0.19 | ) | | (0.20 | ) | | (0.25 | ) | | (0.02 | ) |
| Net realized gains | | (1.73 | ) | | (0.20 | ) | | (0.61 | ) | | (0.50 | ) | | — | | | — | |
| Total distributions | | (2.02 | ) | | (0.31 | ) | | (0.80 | ) | | (0.70 | ) | | (0.25 | ) | | (0.02 | ) |
| Net asset value, end of period | $ | 17.97 | | $ | 22.23 | | $ | 19.70 | | $ | 14.38 | | $ | 16.31 | | $ | 14.99 | |
| |
| Total returnc | | (9.94 | )% | | 14.48 | % | | 43.69 | % | | (7.14 | )% | | 10.47 | % | | 21.74 | % |
| |
| Ratios to average net assetsd | | | | | | | | | | | | | | | | | | |
| Expenses before waiver and payments by | | | | | | | | | | | | | | | | | | |
| affiliates | | 1.35 | % | | 1.36 | % | | 1.46 | % | | 1.49 | % | | 1.47 | % | | 1.52 | % |
| Expenses net of waiver and payments by | | | | | | | | | | | | | | | | | | |
| affiliates | | 1.35 | %e | | 1.36 | %e | | 1.40 | %e | | 1.24 | % | | 1.25 | % | | 1.24 | %e |
| Net investment income | | 0.51 | % | | 0.89 | % | | 1.03 | % | | 1.72 | % | | 1.75 | % | | 1.32 | % |
| |
| Supplemental data | | | | | | | | | | | | | | | | | | |
| Net assets, end of period (000’s) | $ | 198,092 | | $ | 257,568 | | $ | 232,712 | | $ | 166,577 | | $ | 150,989 | | $ | 69,739 | |
| Portfolio turnover rate | | 12.36 | % | | 16.08 | % | | 22.81 | % | | 17.07 | % | | 17.52 | % | | 30.27 | % |
aThe amount shown for a share outstanding throughout the period may not correlate with the Statement of Operations for the period due to the timing of sales and
repurchases of the Fund shares in relation to income earned and/or fluctuating fair value of the investments of the Fund.
bBased on average daily shares outstanding.
cTotal return does not reflect sales commissions or contingent deferred sales charges, if applicable, and is not annualized for periods less than one year.
dRatios are annualized for periods less than one year.
eBenefit of expense reduction rounds to less than 0.01%.
franklintempleton.com The accompanying notes are an integral part of these financial statements. | Semiannual Report | 27
FRANKLIN GLOBAL TRUST
FINANCIAL HIGHLIGHTS
| | | | | | | | | | | | | | | | | | |
| Franklin International Small Cap Growth Fund (continued) | | | | | | | | | | | | | | | | |
| | | Six Months Ended | | | | | | | | | | | | | | | | |
| | | January 31, 2015 | | | | | | | | | Year Ended July 31, | | | | |
| | | (unaudited) | | | 2014 | | | 2013 | | | 2012 | | | 2011 | | | 2010 | |
| Class C | | | | | | | | | | | | | | | | | | |
| Per share operating performance | | | | | | | | | | | | | | | | | | |
| (for a share outstanding throughout the period) | | | | | | | | | | | | | | | | | | |
| Net asset value, beginning of period | $ | 21.94 | | $ | 19.51 | | $ | 14.25 | | $ | 16.13 | | $ | 14.85 | | $ | 12.29 | |
| Income from investment operationsa: | | | | | | | | | | | | | | | | | | |
| Net investment income (loss)b | | (0.02 | ) | | 0.02 | | | 0.05 | | | 0.14 | | | 0.17 | | | 0.09 | |
| Net realized and unrealized gains | | | | | | | | | | | | | | | | | | |
| (losses) | | (2.26 | ) | | 2.63 | | | 5.90 | | | (1.45 | ) | | 1.27 | | | 2.48 | |
| Total from investment operations | | (2.28 | ) | | 2.65 | | | 5.95 | | | (1.31 | ) | | 1.44 | | | 2.57 | |
| Less distributions from: | | | | | | | | | | | | | | | | | | |
| Net investment income | | (0.19 | ) | | (0.02 | ) | | (0.08 | ) | | (0.07 | ) | | (0.16 | ) | | (0.01 | ) |
| Net realized gains | | (1.73 | ) | | (0.20 | ) | | (0.61 | ) | | (0.50 | ) | | — | | | — | |
| Total distributions | | (1.92 | ) | | (0.22 | ) | | (0.69 | ) | | (0.57 | ) | | (0.16 | ) | | (0.01 | ) |
| Net asset value, end of period | $ | 17.74 | | $ | 21.94 | | $ | 19.51 | | $ | 14.25 | | $ | 16.13 | | $ | 14.85 | |
| |
| Total returnc | | (10.27 | )% | | 13.59 | % | | 42.74 | % | | (7.81 | )% | | 9.69 | % | | 20.93 | % |
| |
| Ratios to average net assetsd | | | | | | | | | | | | | | | | | | |
| Expenses before waiver and payments by | | | | | | | | | | | | | | | | | | |
| affiliates | | 2.04 | % | | 2.11 | % | | 2.16 | % | | 2.20 | % | | 2.17 | % | | 2.22 | % |
| Expenses net of waiver and payments by | | | | | | | | | | | | | | | | | | |
| affiliates | | 2.04 | %e | | 2.11 | %e | | 2.10 | %e | | 1.95 | % | | 1.95 | % | | 1.95 | %e |
| Net investment income (loss) | | (0.18 | )% | | 0.14 | % | | 0.33 | % | | 1.01 | % | | 1.05 | % | | 0.62 | % |
| |
| Supplemental data | | | | | | | | | | | | | | | | | | |
| Net assets, end of period (000’s) | $ | 28,654 | | $ | 35,484 | | $ | 29,786 | | $ | 14,278 | | $ | 19,127 | | $ | 10,378 | |
| Portfolio turnover rate | | 12.36 | % | | 16.08 | % | | 22.81 | % | | 17.07 | % | | 17.52 | % | | 30.27 | % |
aThe amount shown for a share outstanding throughout the period may not correlate with the Statement of Operations for the period due to the timing of sales and
repurchases of the Fund shares in relation to income earned and/or fluctuating fair value of the investments of the Fund.
bBased on average daily shares outstanding.
cTotal return does not reflect sales commissions or contingent deferred sales charges, if applicable, and is not annualized for periods less than one year.
dRatios are annualized for periods less than one year.
eBenefit of expense reduction rounds to less than 0.01%.
28 | Semiannual Report | The accompanying notes are an integral part of these financial statements. franklintempleton.com
FRANKLIN GLOBAL TRUST
FINANCIAL HIGHLIGHTS
| | | | | | | | | | | | | | | | | | |
| Franklin International Small Cap Growth Fund (continued) | | | | | | | | | | | | | | | | |
| | | Six Months Ended | | | | | | | | | | | | | | | | |
| | | January 31, 2015 | | | | | | | | | Year Ended July 31, | | | | |
| | | (unaudited) | | | 2014 | | | 2013 | | | 2012 | | | 2011 | | | 2010 | |
| Class R | | | | | | | | | | | | | | | | | | |
| Per share operating performance | | | | | | | | | | | | | | | | | | |
| (for a share outstanding throughout the period) | | | | | | | | | | | | | | | | | | |
| Net asset value, beginning of period | $ | 22.19 | | $ | 19.65 | | $ | 14.35 | | $ | 16.29 | | $ | 14.96 | | $ | 12.33 | |
| Income from investment operationsa: | | | | | | | | | | | | | | | | | | |
| Net investment incomeb | | 0.03 | | | 0.12 | | | 0.13 | | | 0.22 | | | 0.25 | | | 0.17 | |
| Net realized and unrealized gains | | | | | | | | | | | | | | | | | | |
| (losses) | | (2.29 | ) | | 2.66 | | | 5.94 | | | (1.48 | ) | | 1.29 | | | 2.48 | |
| Total from investment operations | | (2.26 | ) | | 2.78 | | | 6.07 | | | (1.26 | ) | | 1.54 | | | 2.65 | |
| Less distributions from: | | | | | | | | | | | | | | | | | | |
| Net investment income | | (0.25 | ) | | (0.04 | ) | | (0.16 | ) | | (0.18 | ) | | (0.21 | ) | | (0.02 | ) |
| Net realized gains | | (1.73 | ) | | (0.20 | ) | | (0.61 | ) | | (0.50 | ) | | — | | | — | |
| Total distributions | | (1.98 | ) | | (0.24 | ) | | (0.77 | ) | | (0.68 | ) | | (0.21 | ) | | (0.02 | ) |
| Net asset value, end of period | $ | 17.95 | | $ | 22.19 | | $ | 19.65 | | $ | 14.35 | | $ | 16.29 | | $ | 14.96 | |
| |
| Total returnc | | (10.07 | )% | | 14.17 | % | | 43.40 | % | | (7.37 | )% | | 10.30 | % | | 21.50 | % |
| |
| Ratios to average net assetsd | | | | | | | | | | | | | | | | | | |
| Expenses before waiver and payments by | | | | | | | | | | | | | | | | | | |
| affiliates | | 1.61 | % | | 1.62 | % | | 1.66 | % | | 1.70 | % | | 1.67 | % | | 1.72 | % |
| Expenses net of waiver and payments by | | | | | | | | | | | | | | | | | | |
| affiliates | | 1.61 | %e | | 1.62 | %e | | 1.60 | %e | | 1.45 | % | | 1.45 | % | | 1.45 | %e |
| Net investment income | | 0.25 | % | | 0.63 | % | | 0.83 | % | | 1.51 | % | | 1.55 | % | | 1.12 | % |
| |
| Supplemental data | | | | | | | | | | | | | | | | | | |
| Net assets, end of period (000’s) | $ | 6,796 | | $ | 9,320 | | $ | 12,087 | | $ | 9,755 | | $ | 7,718 | | $ | 2,718 | |
| Portfolio turnover rate | | 12.36 | % | | 16.08 | % | | 22.81 | % | | 17.07 | % | | 17.52 | % | | 30.27 | % |
aThe amount shown for a share outstanding throughout the period may not correlate with the Statement of Operations for the period due to the timing of sales and
repurchases of the Fund shares in relation to income earned and/or fluctuating fair value of the investments of the Fund.
bBased on average daily shares outstanding.
cTotal return is not annualized for periods less than one year.
dRatios are annualized for periods less than one year.
eBenefit of expense reduction rounds to less than 0.01%.
franklintempleton.com The accompanying notes are an integral part of these financial statements. | Semiannual Report | 29
FRANKLIN GLOBAL TRUST
FINANCIAL HIGHLIGHTS
| | | | | | | | | |
| Franklin International Small Cap Growth Fund (continued) | | | | | | | | | |
| | | Six Months Ended | | | Year Ended | |
| | | January 31, 2015 | | | July 31, | |
| | | (unaudited) | | | 2014 | | | 2013 | a |
| Class R6 | | | | | | | | | |
| Per share operating performance | | | | | | | | | |
| (for a share outstanding throughout the period) | | | | | | | | | |
| Net asset value, beginning of period | $ | 22.32 | | $ | 19.78 | | $ | 18.49 | |
| Income from investment operationsb: | | | | | | | | | |
| Net investment incomec | | 0.09 | | | 0.28 | | | 0.09 | |
| Net realized and unrealized gains (losses) | | (2.30 | ) | | 2.65 | | | 1.20 | |
| Total from investment operations | | (2.21 | ) | | 2.93 | | | 1.29 | |
| Less distributions from: | | | | | | | | | |
| Net investment income | | (0.35 | ) | | (0.19 | ) | | — | |
| Net realized gains | | (1.73 | ) | | (0.20 | ) | | — | |
| Total distributions | | (2.08 | ) | | (0.39 | ) | | — | |
| Net asset value, end of period | $ | 18.03 | | $ | 22.32 | | $ | 19.78 | |
| |
| Total returnd | | (9.79 | )% | | 14.89 | % | | 6.98 | % |
| |
| Ratios to average net assetse | | | | | | | | | |
| Expensesf | | 0.99 | % | | 1.00 | % | | 1.01 | % |
| Net investment income | | 0.87 | % | | 1.25 | % | | 1.42 | % |
| |
| Supplemental data | | | | | | | | | |
| Net assets, end of period (000’s) | $ | 336,144 | | $ | 359,449 | | $ | 220,507 | |
| Portfolio turnover rate | | 12.36 | % | | 16.08 | % | | 22.81 | % |
aFor the period May 1, 2013 (effective date) to July 31, 2013.
bThe amount shown for a share outstanding throughout the period may not correlate with the Statement of Operations for the period due to the timing of sales and
repurchases of the Fund shares in relation to income earned and/or fluctuating fair value of the investments of the Fund.
cBased on average daily shares outstanding.
dTotal return is not annualized for periods less than one year.
eRatios are annualized for periods less than one year.
fBenefit of expense reduction rounds to less than 0.01%.
30 | Semiannual Report | The accompanying notes are an integral part of these financial statements. franklintempleton.com
FRANKLIN GLOBAL TRUST
FINANCIAL HIGHLIGHTS
| | | | | | | | | | | | | | | | | | |
| Franklin International Small Cap Growth Fund (continued) | | | | | | | | | | | | | |
| | | Six Months Ended | | | | | | | | | | | | | | | | |
| | | January 31, 2015 | | | | | | | | | Year Ended July 31, | | | | |
| | | (unaudited) | | | 2014 | | | 2013 | | | 2012 | | | 2011 | | | 2010 | |
| Advisor Class | | | | | | | | | | | | | | | | | | |
| Per share operating performance | | | | | | | | | | | | | | | | | | |
| (for a share outstanding throughout the period) | | | | | | | | | | | | | | | | | | |
| Net asset value, beginning of period | $ | 22.30 | | $ | 19.77 | | $ | 14.43 | | $ | 16.36 | | $ | 15.02 | | $ | 12.32 | |
| Income from investment operationsa: | | | | | | | | | | | | | | | | | | |
| Net investment incomeb | | 0.08 | | | 0.25 | | | 0.23 | | | 0.29 | | | 0.34 | | | 0.23 | |
| Net realized and unrealized gains | | | | | | | | | | | | | | | | | | |
| (losses) | | (2.30 | ) | | 2.65 | | | 5.95 | | | (1.48 | ) | | 1.29 | | | 2.49 | |
| Total from investment operations | | (2.22 | ) | | 2.90 | | | 6.18 | | | (1.19 | ) | | 1.63 | | | 2.72 | |
| Less distributions from: | | | | | | | | | | | | | | | | | | |
| Net investment income | | (0.33 | ) | | (0.17 | ) | | (0.23 | ) | | (0.24 | ) | | (0.29 | ) | | (0.02 | ) |
| Net realized gains | | (1.73 | ) | | (0.20 | ) | | (0.61 | ) | | (0.50 | ) | | — | | | — | |
| Total distributions | | (2.06 | ) | | (0.37 | ) | | (0.84 | ) | | (0.74 | ) | | (0.29 | ) | | (0.02 | ) |
| Net asset value, end of period | $ | 18.02 | | $ | 22.30 | | $ | 19.77 | | $ | 14.43 | | $ | 16.36 | | $ | 15.02 | |
| |
| Total returnc | | (9.82 | )% | | 14.74 | % | | 44.06 | % | | (6.87 | )% | | 10.83 | % | | 22.11 | % |
| |
| Ratios to average net assetsd | | | | | | | | | | | | | | | | | | |
| Expenses before waiver and payments by | | | | | | | | | | | | | | | | | | |
| affiliates | | 1.11 | % | | 1.12 | % | | 1.16 | % | | 1.20 | % | | 1.17 | % | | 1.22 | % |
| Expenses net of waiver and payments by | | | | | | | | | | | | | | | | | | |
| affiliates | | 1.11 | %e | | 1.12 | %e | | 1.10 | %e | | 0.95 | % | | 0.95 | % | | 0.95 | %e |
| Net investment income | | 0.75 | % | | 1.13 | % | | 1.33 | % | | 2.01 | % | | 2.05 | % | | 1.62 | % |
| |
| Supplemental data | | | | | | | | | | | | | | | | | | |
| Net assets, end of period (000’s) | $ | 1,080,039 | | $ | 1,223,532 | | $ | 826,218 | | $ | 376,590 | | $ | 380,337 | | $ | 224,101 | |
| Portfolio turnover rate | | 12.36 | % | | 16.08 | % | | 22.81 | % | | 17.07 | % | | 17.52 | % | | 30.27 | % |
aThe amount shown for a share outstanding throughout the period may not correlate with the Statement of Operations for the period due to the timing of sales and
repurchases of the Fund shares in relation to income earned and/or fluctuating fair value of the investments of the Fund.
bBased on average daily shares outstanding.
cTotal return is not annualized for periods less than one year.
dRatios are annualized for periods less than one year.
eBenefit of expense reduction rounds to less than 0.01%.
franklintempleton.com The accompanying notes are an integral part of these financial statements. | Semiannual Report | 31
| | | | |
| FRANKLIN GLOBAL TRUST | | | | |
| |
| |
| |
| Statement of Investments, January 31, 2015 (unaudited) | | | | |
| |
| Franklin International Small Cap Growth Fund | | | | |
| | Country | Shares | | Value |
| Common Stocks 94.8% | | | | |
| Air Freight & Logistics 4.1% | | | | |
| Panalpina Welttransport Holding AG | Switzerland | 55,019 | $ | 6,735,188 |
| TNT Express NV | Netherlands | 5,745,000 | | 37,796,825 |
| aTNT Express NV, 144A | Netherlands | 3,442,900 | | 22,651,121 |
| | | | | 67,183,134 |
| Beverages 2.8% | | | | |
| C&C Group PLC | Ireland | 11,927,630 | | 46,754,946 |
| Building Products 3.2% | | | | |
| Uponor OYJ | Finland | 3,500,448 | | 53,382,797 |
| Capital Markets 5.5% | | | | |
| ARA Asset Management Ltd. | Singapore | 25,136,812 | | 31,576,576 |
| a,bFairfax India Holdings Corp., 144A | Canada | 2,457,300 | | 24,081,540 |
| bRHJ International | Belgium | 6,611,971 | | 34,731,842 |
| | | | | 90,389,958 |
| Chemicals 3.3% | | | | |
| Alent PLC | United Kingdom | 10,012,474 | | 55,123,939 |
| Commercial Services & Supplies 3.0% | | | | |
| bISS A/S | Denmark | 997,200 | | 29,500,002 |
| Serco Group PLC | United Kingdom | 8,305,128 | | 19,315,461 |
| | | | | 48,815,463 |
| Construction & Engineering 2.3% | | | | |
| Keller Group PLC | United Kingdom | 1,475,668 | | 19,849,592 |
| Morgan Sindall PLC | United Kingdom | 1,839,400 | | 18,563,610 |
| | | | | 38,413,202 |
| Distributors 1.9% | | | | |
| cHeadlam Group PLC | United Kingdom | 4,606,688 | | 31,225,743 |
| Diversified Financial Services 4.3% | | | | |
| Kennedy Wilson Europe Real Estate PLC | United Kingdom | 1,375,800 | | 21,552,622 |
| aKennedy Wilson Europe Real Estate PLC, 144A | United Kingdom | 3,118,600 | | 48,854,489 |
| | | | | 70,407,111 |
| Electrical Equipment 3.2% | | | | |
| Prysmian SpA | Italy | 2,864,029 | | 53,059,748 |
| Food & Staples Retailing 4.0% | | | | |
| Sligro Food Group NV | Netherlands | 1,714,255 | | 65,434,614 |
| Hotels, Restaurants & Leisure 1.3% | | | | |
| bDalata Hotel Group PLC | Ireland | 5,302,141 | | 17,489,526 |
| a,bDalata Hotel Group PLC, 144A | Ireland | 1,132,759 | | 3,736,494 |
| | | | | 21,226,020 |
| Household Products 0.3% | | | | |
| McBride PLC | United Kingdom | 4,753,920 | | 5,782,370 |
32 | Semiannual Report
franklintempleton.com
FRANKLIN GLOBAL TRUST
STATEMENT OF INVESTMENTS (UNAUDITED)
| | | | |
| Franklin International Small Cap Growth Fund (continued) | | | | |
| | Country | Shares | | Value |
| Common Stocks (continued) | | | | |
| Insurance 14.4% | | | | |
| bArch Capital Group Ltd. | United States | 931,117 | $ | 53,976,853 |
| Euler Hermes Group | France | 491,241 | | 48,256,749 |
| Fairfax Financial Holdings Ltd. | Canada | 132,300 | | 70,294,789 |
| RenaissanceRe Holdings Ltd. | United States | 679,300 | | 64,961,459 |
| | | | | 237,489,850 |
| IT Services 2.2% | | | | |
| bOptimal Payments PLC | United Kingdom | 7,066,225 | | 36,668,078 |
| Leisure Products 3.4% | | | | |
| Beneteau | France | 2,454,200 | | 35,902,414 |
| Sankyo Co. Ltd. | Japan | 550,200 | | 19,883,361 |
| | | | | 55,785,775 |
| Machinery 8.4% | | | | |
| Valmet Corp. | Finland | 3,932,780 | | 50,646,382 |
| Vesuvius PLC | United Kingdom | 8,624,167 | | 57,158,562 |
| Zardoya Otis SA | Spain | 2,688,496 | | 30,643,932 |
| | | | | 138,448,876 |
| Marine 1.9% | | | | |
| Irish Continental Group PLC | Ireland | 8,593,000 | | 32,033,373 |
| Media 2.3% | | | | |
| ASATSU-DK Inc. | Japan | 1,490,700 | | 37,589,524 |
| Metals & Mining 1.6% | | | | |
| Straits Trading Co. Ltd. | Singapore | 11,510,000 | | 25,685,509 |
| Personal Products 1.8% | | | | |
| cAderans Co. Ltd. | Japan | 3,418,500 | | 30,499,196 |
| Professional Services 5.0% | | | | |
| Michael Page International PLC | United Kingdom | 8,831,770 | | 61,993,353 |
| Sthree PLC | United Kingdom | 3,923,260 | | 19,974,470 |
| | | | | 81,967,823 |
| Real Estate Investment Trusts (REITs) 7.2% | | | | |
| b,cGreen REIT PLC | Ireland | 38,429,481 | | 57,737,781 |
| cIrish Residential Properties REIT PLC | Ireland | 11,125,000 | | 12,693,030 |
| a,cIrish Residential Properties REIT PLC, 144A | Ireland | 20,000,000 | | 22,818,931 |
| cLar Espana Real Estate Socimi SA | Spain | 2,504,000 | | 25,288,075 |
| | | | | 118,537,817 |
| Specialty Retail 2.6% | | | | |
| b,cCarpetright PLC | United Kingdom | 5,764,925 | | 42,702,125 |
| Trading Companies & Distributors 4.8% | | | | |
| Grafton Group PLC | Ireland | 7,821,732 | | 78,879,650 |
| Total Common Stocks (Cost $1,492,334,476) | | | | 1,563,486,641 |
franklintempleton.com Semiannual Report | 33
FRANKLIN GLOBAL TRUST
STATEMENT OF INVESTMENTS (UNAUDITED)
| | | | |
| Franklin International Small Cap Growth Fund (continued) | | | | |
| | | Principal | | |
| | Country | Amount* | | Value |
| Short Term Investments 5.1% | | | | |
| Time Deposits 5.1% | | | | |
| Bank of Montreal, 0.05%, 2/02/15 | Canada | 11,000,000 | $ | 11,000,000 |
| National Bank of Canada, 0.02%, 2/02/15 | Canada | 15,000,000 | | 15,000,000 |
| Royal Bank of Canada, 0.05%, 2/02/15 | Canada | 8,000,000 | | 8,000,000 |
| Scotia Capital Markets, 0.04%, 2/02/15 | United States | 51,000,000 | | 51,000,000 |
| Total Time Deposits (Cost $85,000,000) | | | | 85,000,000 |
| Total Investments (Cost $1,577,334,476) 99.9% | | | | 1,648,486,641 |
| Other Assets, less Liabilities 0.1% | | | | 1,237,873 |
| Net Assets 100.0% | | | $ | 1,649,724,514 |
See Abbreviations on page 47.
*The principal amount is stated in U.S. dollars unless otherwise indicated.
aSecurity was purchased pursuant to Rule 144A under the Securities Act of 1933 and may be sold in transactions exempt from registration only to qualified institutional buy-
ers or in a public offering registered under the Securities Act of 1933. These securities have been deemed liquid under guidelines approved by the Trust’s Board of
Trustees. At January 31, 2015, the aggregate value of these securities was $122,142,575, representing 7.40% of net assets.
bNon-income producing.
cSee Note 8 regarding holdings of 5% voting securities.
34 | Semiannual Report | The accompanying notes are an integral part of these financial statements. franklintempleton.com
| | | | | | |
| | | FRANKLIN GLOBAL TRUST | |
| |
| |
| |
| |
| Financial Statements | | | | | | |
| |
| Statements of Assets and Liabilities | | | | | | |
| January 31, 2015 (unaudited) | | | | | | |
| |
| | | | | | Franklin | |
| | | Franklin | | | International | |
| | | International | | | Small Cap | |
| | | Growth Fund | | | Growth Fund | |
| Assets: | | | | | | |
| Investments in securities: | | | | | | |
| Cost - Unaffiliated issuers | $ | 271,279,212 | | $ | 1,315,238,555 | |
| Cost - Non-controlled affiliated issuers (Note 8) | | — | | | 262,095,921 | |
| Cost - Sweep Money Fund (Note 3f) | | 11,597,917 | | | — | |
| Total cost of investments | $ | 282,877,129 | | $ | 1,577,334,476 | |
| Value - Unaffiliated issuers | $ | 291,901,044 | | $ | 1,425,521,760 | |
| Value - Non-controlled affiliated issuers (Note 8) | | — | | | 222,964,881 | |
| Value - Sweep Money Fund (Note 3f) | | 11,597,917 | | | — | |
| Total value of investments | | 303,498,961 | | | 1,648,486,641 | |
| Cash | | — | | | 2,286,533 | |
| Receivables: | | | | | | |
| Investment securities sold | | — | | | 63,615 | |
| Capital shares sold | | 218,311 | | | 6,063,924 | |
| Dividends | | 563,617 | | | 156,014 | |
| Other assets | | 6 | | | 42 | |
| Total assets | | 304,280,895 | | | 1,657,056,769 | |
| Liabilities: | | | | | | |
| Payables: | | | | | | |
| Investment securities purchased | | 241,634 | | | 3,518,960 | |
| Capital shares redeemed | | 240,463 | | | 2,046,172 | |
| Management fees | | 240,370 | | | 1,301,447 | |
| Distribution fees | | 48,323 | | | 68,197 | |
| Transfer agent fees | | 122,160 | | | 260,710 | |
| Trustees’ fees and expenses | | 898 | | | 1,051 | |
| Accrued expenses and other liabilities | | 22,949 | | | 135,718 | |
| Total liabilities | | 916,797 | | | 7,332,255 | |
| Net assets, at value | $ | 303,364,098 | | $ | 1,649,724,514 | |
| Net assets consist of: | | | | | | |
| Paid-in capital | $ | 291,476,258 | | $ | 1,596,356,988 | |
| Distributions in excess of net investment income | | (293,453 | ) | | (5,531,646 | ) |
| Net unrealized appreciation (depreciation) | | 20,584,294 | | | 71,125,949 | |
| Accumulated net realized gain (loss) | | (8,403,001 | ) | | (12,226,777 | ) |
| Net assets, at value | $ | 303,364,098 | | $ | 1,649,724,514 | |
franklintempleton.com The accompanying notes are an integral part of these financial statements. | Semiannual Report | 35
| | | | | |
| FRANKLIN GLOBAL TRUST | | | | | |
| FINANCIAL STATEMENTS | | | | | |
| |
| |
| Statements of Assets and Liabilities (continued) | | | | | |
| January 31, 2015 (unaudited) | | | | | |
| |
| | | | | | Franklin |
| | | | Franklin | | International |
| | | | International | | Small Cap |
| | | | Growth Fund | | Growth Fund |
| Class A: | | | | | |
| Net assets, at value | $ | | 173,241,113 | $ | 198,092,153 |
| Shares outstanding | | | 16,177,769 | | 11,022,498 |
| Net asset value per sharea | | $ | 10.71 | $ | 17.97 |
| Maximum offering price per share (net asset value per share ÷ 94.25%) | | $ | 11.36 | $ | 19.07 |
| Class C: | | | | | |
| Net assets, at value | $ | | 5,672,807 | $ | 28,654,368 |
| Shares outstanding | | | 538,382 | | 1,615,052 |
| Net asset value and maximum offering price per sharea | | $ | 10.54 | $ | 17.74 |
| Class R: | | | | | |
| Net assets, at value | $ | | 221,772 | $ | 6,795,553 |
| Shares outstanding | | | 20,711 | | 378,477 |
| Net asset value and maximum offering price per share | | $ | 10.71 | $ | 17.95 |
| Class R6: | | | | | |
| Net assets, at value | $ | | 30,464,831 | $ | 336,143,560 |
| Shares outstanding | | | 2,828,903 | | 18,640,192 |
| Net asset value and maximum offering price per share | | $ | 10.77 | $ | 18.03 |
| Advisor Class: | | | | | |
| Net assets, at value | $ | | 93,763,575 | $ | 1,080,038,880 |
| Shares outstanding | | | 8,710,198 | | 59,929,205 |
| Net asset value and maximum offering price per share | | $ | 10.76 | $ | 18.02 |
| |
| aRedemption price is equal to net asset value less contingent deferred sales charges, if applicable. | |
| 36 | Semiannual Report | The accompanying notes are an integral part of these financial statements. | franklintempleton.com |
|
| FRANKLIN GLOBAL TRUST |
| FINANCIAL STATEMENTS |
| | | | | | |
| Statements of Operations | | | | | | |
| for the six months ended January 31, 2015 (unaudited) | | | | | | |
| |
| | | | | | Franklin | |
| | | Franklin | | | International | |
| | | International | | | Small Cap | |
| | | Growth Fund | | | Growth Fund | |
| Investment income: | | | | | | |
| Dividends: (net of foreign taxes)a | | | | | | |
| Unaffiliated issuers | $ | 1,718,732 | | $ | 15,859,030 | |
| Non-controlled affiliated issuers (Note 8) | | — | | | 375,731 | |
| Interest | | — | | | 8,738 | |
| Total investment income | | 1,718,732 | | | 16,243,499 | |
| Expenses: | | | | | | |
| Management fees (Note 3a) | | 1,378,963 | | | 8,285,712 | |
| Distribution fees: (Note 3c) | | | | | | |
| Class A | | 263,483 | | | 276,806 | |
| Class C | | 28,611 | | | 148,231 | |
| Class R | | 557 | | | 19,270 | |
| Transfer agent fees: (Note 3e) | | | | | | |
| Class A | | 366,178 | | | 136,762 | |
| Class C | | 11,930 | | | 19,116 | |
| Class R | | 465 | | | 4,634 | |
| Class R6 | | 73 | | | 294 | |
| Advisor Class | | 204,866 | | | 676,071 | |
| Custodian fees (Note 4) | | 16,889 | | | 132,840 | |
| Reports to shareholders | | 8,054 | | | 45,982 | |
| Registration and filing fees | | 43,930 | | | 108,358 | |
| Professional fees | | 24,005 | | | 34,340 | |
| Trustees’ fees and expenses | | 4,971 | | | 33,972 | |
| Other | | 11,368 | | | 17,047 | |
| Total expenses | | 2,364,343 | | | 9,939,435 | |
| Expense reductions (Note 4) | | — | | | (572 | ) |
| Expenses waived/paid by affiliates (Note 3f and 3g) | | (353,825 | ) | | — | |
| Net expenses | | 2,010,518 | | | 9,938,863 | |
| Net investment income (loss) | | (291,786 | ) | | 6,304,636 | |
| Realized and unrealized gains (losses): | | | | | | |
| Net realized gain (loss) from: | | | | | | |
| Investments: | | | | | | |
| Unaffiliated issuers | | (8,270,950 | ) | | 24,382,655 | |
| Non-controlled affiliated issuers (Note 8) | | — | | | 27,010,731 | |
| Foreign currency transactions | | 12,094 | | | (866,521 | ) |
| Net realized gain (loss) | | (8,258,856 | ) | | 50,526,865 | |
| Net change in unrealized appreciation (depreciation) on: | | | | | | |
| Investments | | (6,817,355 | ) | | (242,051,039 | ) |
| Translation of other assets and liabilities denominated in foreign currencies | | (32,407 | ) | | (9,930 | ) |
| Net change in unrealized appreciation (depreciation) | | (6,849,762 | ) | | (242,060,969 | ) |
| Net realized and unrealized gain (loss) | | (15,108,618 | ) | | (191,534,104 | ) |
| Net increase (decrease) in net assets resulting from operations | $ | (15,400,404 | ) | $ | (185,229,468 | ) |
| |
| |
| |
| aForeign taxes withheld on dividends | $ | 98,022 | | $ | 469,970 | |
franklintempleton.com The accompanying notes are an integral part of these financial statements. | Semiannual Report | 37
| | | | | | | | | | | | |
| FRANKLIN GLOBAL TRUST | | | | | | | | | | | | |
| FINANCIAL STATEMENTS | | | | | | | | | | | | |
| |
| |
| Statements of Changes in Net Assets | | | | | | | | | | | | |
| |
| |
| | | Franklin International | | | Franklin International | |
| | | Growth Fund | | | Small Cap Growth Fund | |
| | | Six Months Ended | | | | | | Six Months Ended | | | | |
| | | January 31, 2015 | | | Year Ended | | | January 31, 2015 | | | Year Ended | |
| | | (unaudited) | | | July 31, 2014 | | | (unaudited) | | | July 31, 2014 | |
| Increase (decrease) in net assets: | | | | | | | | | | | | |
| Operations: | | | | | | | | | | | | |
| Net investment income (loss) | $ | (291,786 | ) | $ | 1,617,629 | | $ | 6,304,636 | | $ | 18,732,977 | |
| Net realized gain (loss) from investments and | | | | | | | | | | | | |
| foreign currency transactions | | (8,258,856 | ) | | 7,735,918 | | | 50,526,865 | | | 87,092,599 | |
| Net change in unrealized appreciation | | | | | | | | | | | | |
| (depreciation) on investments and translation | | | | | | | | | | | | |
| of other assets and liabilities denominated in | | | | | | | | | | | | |
| foreign currencies | | (6,849,762 | ) | | 10,310,067 | | | (242,060,969 | ) | | 92,835,745 | |
| Net increase (decrease) in net assets | | | | | | | | | | | | |
| resulting from operations | | (15,400,404 | ) | | 19,663,614 | | | (185,229,468 | ) | | 198,661,321 | |
| Distributions to shareholders from: | | | | | | | | | | | | |
| Net investment income: | | | | | | | | | | | | |
| Class A | | (559,483 | ) | | (689,760 | ) | | (3,102,758 | ) | | (1,394,806 | ) |
| Class C | | — | | | — | | | (290,660 | ) | | (27,536 | ) |
| Class R | | (127 | ) | | (211 | ) | | (85,742 | ) | | (17,768 | ) |
| Class R6 | | (33,485 | ) | | (106,815 | ) | | (5,783,528 | ) | | (2,506,396 | ) |
| Advisor Class | | (706,052 | ) | | (349,373 | ) | | (17,433,305 | ) | | (8,435,517 | ) |
| Net realized gains: | | | | | | | | | | | | |
| Class A | | (1,094,825 | ) | | — | | | (18,341,716 | ) | | (2,464,465 | ) |
| Class C | | (36,330 | ) | | — | | | (2,618,975 | ) | | (323,174 | ) |
| Class R | | (1,413 | ) | | — | | | (596,708 | ) | | (98,666 | ) |
| Class R6 | | (29,123 | ) | | — | | | (28,814,214 | ) | | (2,598,794 | ) |
| Advisor Class | | (753,638 | ) | | — | | | (90,782,478 | ) | | (9,695,233 | ) |
| Total distributions to shareholders | | (3,214,476 | ) | | (1,146,159 | ) | | (167,850,084 | ) | | (27,562,355 | ) |
| Capital share transactions: (Note 2) | | | | | | | | | | | | |
| Class A | | 4,220,854 | | | 136,913,226 | | | (13,172,687 | ) | | (6,104,899 | ) |
| Class C | | 54,901 | | | 1,560,584 | | | (358,534 | ) | | 1,918,063 | |
| Class R | | 12,781 | | | (73,119 | ) | | (984,148 | ) | | (4,084,402 | ) |
| Class R6 | | 2,010,552 | | | 4,588,601 | | | 48,657,581 | | | 110,937,964 | |
| Advisor Class | | 3,352,067 | | | 15,512,003 | | | 83,309,346 | | | 290,277,555 | |
| Total capital share transactions | | 9,651,155 | | | 158,501,295 | | | 117,451,558 | | | 392,944,281 | |
| Net increase (decrease) in net assets | | (8,963,725 | ) | | 177,018,750 | | | (235,627,994 | ) | | 564,043,247 | |
| Net assets: | | | | | | | | | | | | |
| Beginning of period | | 312,327,823 | | | 135,309,073 | | | 1,885,352,508 | | | 1,321,309,261 | |
| End of period | $ | 303,364,098 | | $ | 312,327,823 | | $ | 1,649,724,514 | | $ | 1,885,352,508 | |
| Undistributed net investment income (distributions | | | | | | | | | | | | |
| in excess of net investment income) included in | | | | | | | | | | | | |
| net assets: | | | | | | | | | | | | |
| End of period | $ | (293,453 | ) | $ | 1,297,480 | | $ | (5,531,646 | ) | $ | 14,859,711 | |
38 | Semiannual Report | The accompanying notes are an integral part of these financial statements. franklintempleton.com
FRANKLIN GLOBAL TRUST
Notes to Financial Statements (unaudited)
1. Organization and Significant Accounting Policies
Franklin Global Trust (Trust) is registered under the Investment Company Act of 1940, as amended, (1940 Act) as an open-end management investment company, consisting of six separate funds, two of which are included in this report (Funds) and applies the specialized accounting and reporting guidance in U.S. Generally Accepted Accounting Principles (U.S. GAAP). The financial statements of the remaining funds in the Trust are presented separately. The Funds offer five classes of shares: Class A, Class C, Class R, Class R6, and Advisor Class. Each class of shares differs by its initial sales load, contingent deferred sales charges, voting rights on matters affecting a single class, its exchange privilege and fees primarily due to differing arrangements for distribution and transfer agent fees. Franklin International Small Cap Growth Fund was closed to new investors effective June 3, 2013.
The following summarizes the Funds’ significant accounting policies.
a. Financial Instrument Valuation
The Funds’ investments in financial instruments are carried at fair value daily. Fair value is the price that would be received to sell an asset or paid to transfer a liability in an orderly transaction between market participants on the measurement date. The Funds calculate the net asset value (NAV) per share at the close of the New York Stock Exchange (NYSE), generally at 4 p.m. Eastern time (NYSE close) on each day the NYSE is open for trading. Under compliance policies and procedures approved by the Trust’s Board of Trustees (the Board), the Funds’ administrator has responsibility for oversight of valuation, including leading the cross-functional Valuation and Liquidity Oversight Committee (VLOC). The VLOC provides administration and oversight of the Funds’ valuation policies and procedures, which are approved annually by the Board. Among other things, these procedures allow the Funds to utilize independent pricing services, quotations from securities and financial instrument dealers, and other market sources to determine fair value.
Equity securities listed on an exchange or on the NASDAQ National Market System are valued at the last quoted sale price or the official closing price of the day, respectively. Foreign equity securities are valued as of the close of trading on the foreign stock exchange on which the security is primarily traded or as of the NYSE close, whichever is earlier. The value is then converted into its U.S. dollar equivalent at the foreign exchange rate in effect at the NYSE close on the day that the value of the security is determined. Over-the-counter (OTC) securities are valued within the range of the most recent quoted bid and ask prices. Securities that trade in multiple markets or on multiple exchanges are valued according to the broadest and most representative market. Certain equity securities are valued based upon fundamental characteristics or relationships to similar securities. Investments in open-end mutual funds are valued at the closing NAV. Time deposits are valued at cost, which approximates fair value.
The Funds have procedures to determine the fair value of financial instruments for which market prices are not reliable or readily available. Under these procedures, the VLOC convenes on a regular basis to review such financial instruments and considers a number of factors, including significant unobservable valuation inputs, when arriving at fair value. The VLOC primarily employs a market-based approach which may use related or comparable assets or liabilities, recent transactions, market multiples, book values, and other relevant information for the investment to determine the fair value of the investment. An income-based valuation approach may also be used in which the anticipated future cash flows of the investment are discounted to calculate fair value. Discounts may also be applied due to the nature or duration of any restrictions on the disposition of the investments. Due to the inherent uncertainty of valuations of such investments, the fair values may differ significantly from the values that would have been used had an active market existed. The VLOC employs various methods for calibrating these valuation approaches including a regular review of key inputs and assumptions, transactional back-testing or disposition analysis, and reviews of any related market activity.
Trading in securities on foreign securities stock exchanges and OTC markets may be completed before the daily NYSE close. In addition, trading in certain foreign markets may not take place on every NYSE business day. Occasionally, events occur between the time at which trading in a foreign security is completed and the close of the NYSE that might call into question the reliability of the value of a portfolio security held by the fund. As a result, differences may arise between the value of the Funds’ portfolio securities as determined at the foreign market close and the latest indications of value at the close of the NYSE. In order to minimize the potential for these differences, the VLOC monitors price movements following the close of trading in foreign stock markets through a series of country
franklintempleton.com
Semiannual Report | 39
FRANKLIN GLOBAL TRUST
NOTES TO FINANCIAL STATEMENTS (UNAUDITED)
1. Organization and Significant Accounting
Policies (continued)
a. Financial Instrument Valuation (continued)
specific market proxies (such as baskets of American Depositary Receipts, futures contracts and exchange traded funds). These price movements are measured against established trigger thresholds for each specific market proxy to assist in determining if an event has occurred that may call into question the reliability of the values of the foreign securities held by the Funds. If such an event occurs, the securities may be valued using fair value procedures, which may include the use of independent pricing services.
When the last day of the reporting period is a non-business day, certain foreign markets may be open on those days that the NYSE is closed, which could result in differences between the value of the Funds’ portfolio securities on the last business day and the last calendar day of the reporting period. Any significant security valuation changes due to an open foreign market are adjusted and reflected by the Funds for financial reporting purposes.
b. Foreign Currency Translation
Portfolio securities and other assets and liabilities denominated in foreign currencies are translated into U.S. dollars based on the exchange rate of such currencies against U.S. dollars on the date of valuation. The Funds may enter into foreign currency exchange contracts to facilitate transactions denominated in a foreign currency. Purchases and sales of securities, income and expense items denominated in foreign currencies are translated into U.S. dollars at the exchange rate in effect on the transaction date. Portfolio securities and assets and liabilities denominated in foreign currencies contain risks that those currencies will decline in value relative to the U.S. dollar. Occasionally, events may impact the availability or reliability of foreign exchange rates used to convert the U.S. dollar equivalent value. If such an event occurs, the foreign exchange rate will be valued at fair value using procedures established and approved by the Board.
The Funds do not separately report the effect of changes in foreign exchange rates from changes in market prices on securities held. Such changes are included in net realized and unrealized gain or loss from investments in the Statements of Operations.
Realized foreign exchange gains or losses arise from sales of foreign currencies, currency gains or losses realized between the trade and settlement dates on securities transactions and the difference between the recorded amounts of dividends, interest, and foreign withholding taxes and the U.S. dollar equivalent of the amounts actually received or paid. Net unrealized foreign exchange gains and losses arise from changes in foreign exchange rates on foreign denominated assets and liabilities other than investments in securities held at the end of the reporting period.
c. Income and Deferred Taxes
It is each fund’s policy to qualify as a regulated investment company under the Internal Revenue Code. Each fund intends to distribute to shareholders substantially all of its taxable income and net realized gains to relieve it from federal income and excise taxes. As a result, no provision for U.S. federal income taxes is required.
The Funds may be subject to foreign taxation related to income received, capital gains on the sale of securities and certain foreign currency transactions in the foreign jurisdictions in which the Funds invest. Foreign taxes, if any, are recorded based on the tax regulations and rates that exist in the foreign markets in which the Funds invest. When a capital gain tax is determined to apply the Funds record an estimated deferred tax liability in an amount that would be payable if the securities were disposed of on the valuation date. As a result of several court cases, in certain countries across the European Union, Franklin International Small Cap Growth Fund has filed additional tax reclaims for previously withheld taxes on dividends earned in those countries. These additional filings are subject to various administrative proceedings by the local jurisdictions’ tax authorities within the European Union, as well as a number of related judicial proceedings. At this time, uncertainty exists as to the ultimate resolution of these proceedings, the likelihood of receipt of these reclaims, and the potential timing of payment, and accordingly, no amounts are reflected in the financial statements.
Each fund recognizes the tax benefits of uncertain tax positions only when the position is “more likely than not” to be sustained upon examination by the tax authorities based on the technical merits of the tax position. As of January 31, 2015, and for all open tax years, each fund has determined that no liability for unrecognized tax benefits is required in each fund’s financial statements related to uncertain tax positions taken on a tax return (or expected to be taken on future tax returns). Open tax years are those that remain subject to examination and are based on each tax jurisdiction statute of limitation.
40 | Semiannual Report
franklintempleton.com
FRANKLIN GLOBAL TRUST
NOTES TO FINANCIAL STATEMENTS (UNAUDITED)
d. Security Transactions, Investment Income, Expenses and Distributions
Security transactions are accounted for on trade date. Realized gains and losses on security transactions are determined on a specific identification basis. Interest income and estimated expenses are accrued daily. Dividend income is recorded on the ex-dividend date except for certain dividends from foreign securities where the dividend rate is not available. In such cases, the dividend is recorded as soon as the information is received by the Funds. Distributions to shareholders are recorded on the ex-dividend date and are determined according to income tax regulations (tax basis). Distributable earnings determined on a tax basis may differ from earnings recorded in accordance with U.S. GAAP. These differences may be permanent or temporary. Permanent differences are reclassified among capital accounts to reflect their tax character. These reclassifications have no impact on net assets or the results of operations. Temporary differences are not reclassified, as they may reverse in subsequent periods.
Common expenses incurred by the Trust are allocated among the funds based on the ratio of net assets of each fund to the combined net assets of the Trust. Fund specific expenses are charged directly to the fund that incurred the expense.
Realized and unrealized gains and losses and net investment income, not including class specific expenses, are allocated daily to each class of shares based upon the relative proportion of net assets of each class. Differences in per share distributions, by class, are generally due to differences in class specific expenses.
e. Accounting Estimates
The preparation of financial statements in accordance with U.S. GAAP requires management to make estimates and assumptions that affect the reported amounts of assets and liabilities at the date of the financial statements and the amounts of income and expenses during the reporting period. Actual results could differ from those estimates.
f. Guarantees and Indemnifications
Under the Trust’s organizational documents, its officers and trustees are indemnified by the Trust against certain liabilities arising out of the performance of their duties to the Trust. Additionally, in the normal course of business, the Trust, on behalf of the Funds, enters into contracts with service providers that contain general indemnification clauses. The Trust’s maximum exposure under these arrangements is unknown as this would involve future claims that may be made against the Trust that have not yet occurred. Currently, the Trust expects the risk of loss to be remote.
2. Shares of Beneficial Interest
At January 31, 2015, there were an unlimited number of shares authorized (without par value). Transactions in the Funds’ shares were as follows:
| | | | | | | | | | |
| | Franklin International | | Franklin International | |
| | Growth Fund | | Small Cap Growth Fund | |
| | Shares | | | Amount | | Shares | | | Amount | |
| |
| Class A Shares: | | | | | | | | | | |
| Six Months ended January 31, 2015 | | | | | | | | | | |
| Shares sold | 1,777,103 | | $ | 19,237,356 | | 508,717 | | $ | 10,084,345 | |
| Shares issued in reinvestment of distributions | 41,861 | | | 430,752 | | 1,186,622 | | | 21,003,214 | |
| Shares redeemed | (1,424,485 | ) | | (15,447,254 | ) | (2,258,952 | ) | | (44,260,246 | ) |
| Net increase (decrease) | 394,479 | | $ | 4,220,854 | | (563,613 | ) | $ | (13,172,687 | ) |
| Year ended July 31, 2014 | | | | | | | | | | |
| Shares sold | 16,183,683 | | $ | 179,267,608 | | 2,462,039 | | $ | 54,122,330 | |
| Shares issued in reinvestment of distributions | 16,275 | | | 174,308 | | 172,955 | | | 3,770,301 | |
| Shares redeemed | (3,715,841 | ) | | (42,528,690 | ) | (2,859,815 | ) | | (63,997,530 | ) |
| Net increase (decrease) | 12,484,117 | | $ | 136,913,226 | | (224,821 | ) | $ | (6,104,899 | ) |
franklintempleton.com Semiannual Report | 41
FRANKLIN GLOBAL TRUST
NOTES TO FINANCIAL STATEMENTS (UNAUDITED)
| | | | | | | | | | | |
| 2. Shares of Beneficial Interest (continued) | | | | | | | | | | | |
| | Franklin International | | Franklin International | |
| | Growth Fund | | | Small Cap Growth Fund | |
| | Shares | | | Amount | | Shares | | | Amount | |
| |
| Class C Shares: | | | | | | | | | | | |
| Six Months ended January 31, 2015 | | | | | | | | | | | |
| Shares sold | 73,754 | | $ | 784,359 | | 53,934 | | $ | 1,062,216 | |
| Shares issued in reinvestment of distributions | 3,580 | | | | 36,263 | | 157,106 | | | 2,747,790 | |
| Shares redeemed | (71,870 | ) | | (765,721 | ) | (213,499 | ) | | (4,168,540 | ) |
| Net increase (decrease) | 5,464 | | | $ | 54,901 | | (2,459 | ) | $ | (358,534 | ) |
| Year ended July 31, 2014 | | | | | | | | | | | |
| Shares sold | 239,119 | | $ | 2,631,531 | | 277,372 | | $ | 6,027,445 | |
| Shares issued in reinvestment of distributions | — | | | | — | | 15,283 | | | 330,512 | |
| Shares redeemed | (97,230 | ) | | (1,070,947 | ) | (202,169 | ) | | (4,439,894 | ) |
| Net increase (decrease) | 141,889 | | $ | 1,560,584 | | 90,486 | | $ | 1,918,063 | |
| Class R Shares: | | | | | | | | | | | |
| Six Months ended January 31, 2015 | | | | | | | | | | | |
| Shares sold | 1,933 | | | $ | 20,980 | | 32,271 | | $ | 646,743 | |
| Shares issued in reinvestment of distributions | 150 | | | | 1,539 | | 38,578 | | | 682,450 | |
| Shares redeemed | (910 | ) | | | (9,738 | ) | (112,340 | ) | | (2,313,341 | ) |
| Net increase (decrease) | 1,173 | | | $ | 12,781 | | (41,491 | ) | $ | (984,148 | ) |
| Year ended July 31, 2014 | | | | | | | | | | | |
| Shares sold | 13,012 | | $ | 145,050 | | 173,177 | | $ | 3,715,748 | |
| Shares issued in reinvestment of distributions | 20 | | | | 211 | | 5,339 | | | 116,434 | |
| Shares redeemed | (19,851 | ) | | (218,380 | ) | (373,591 | ) | | (7,916,584 | ) |
| Net increase (decrease) | (6,819 | ) | | $ | (73,119 | ) | (195,075 | ) | $ | (4,084,402 | ) |
| Class R6 Shares: | | | | | | | | | | | |
| Six Months ended January 31, 2015 | | | | | | | | | | | |
| Shares sold | 2,496,825 | | $ | 26,885,280 | | 1,424,623 | | $ | 31,035,824 | |
| Shares issued on reinvestment of distributions | 2 | | | | 16 | | 1,948,071 | | | 34,597,741 | |
| Shares redeemed | (2,204,499 | ) | | (24,874,744 | ) | (837,382 | ) | | (16,975,984 | ) |
| Net increase (decrease) | 292,328 | | $ | 2,010,552 | | 2,535,312 | | $ | 48,657,581 | |
| Year ended July 31, 2014 | | | | | | | | | | | |
| Shares sold | 541,488 | | $ | 6,064,468 | | 5,518,168 | | $ | 123,236,803 | |
| Shares issued in reinvestment of distributions | 9,927 | | | 106,815 | | 233,843 | | | 5,105,190 | |
| Shares redeemed | (142,005 | ) | | (1,582,682 | ) | (794,059 | ) | | (17,404,029 | ) |
| Net increase (decrease) | 409,410 | | $ | 4,588,601 | | 4,957,952 | | $ | 110,937,964 | |
| Advisor Class Shares: | | | | | | | | | | | |
| Six Months ended January 31, 2015 | | | | | | | | | | | |
| Shares sold | 3,670,489 | | $ | 40,160,884 | | 14,794,664 | | $ | 283,612,597 | |
| Shares issued in reinvestment of distributions | 88,125 | | | 911,216 | | 5,783,456 | | | 102,656,340 | |
| Shares redeemed | (3,517,609 | ) | | (37,720,033 | ) | (15,507,635 | ) | | (302,959,591 | ) |
| Net increase (decrease) | 241,005 | | $ | 3,352,067 | | 5,070,485 | | $ | 83,309,346 | |
| Year ended July 31, 2014 | | | | | | | | | | | |
| Shares sold | 2,614,338 | | $ | 29,212,716 | | 23,297,295 | | $ | 517,428,835 | |
| Shares issued in reinvestment of distributions | 4,733 | | | | 50,927 | | 754,517 | | | 16,473,023 | |
| Shares redeemed | (1,234,555 | ) | | (13,751,640 | ) | (10,976,519 | ) | | (243,624,303 | ) |
| Net increase (decrease) | 1,384,516 | | $ | 15,512,003 | | 13,075,293 | | $ | 290,277,555 | |
42 | Semiannual Report
franklintempleton.com
FRANKLIN GLOBAL TRUST
NOTES TO FINANCIAL STATEMENTS (UNAUDITED)
3. Transactions with Affiliates
Franklin Resources, Inc. is the holding company for various subsidiaries that together are referred to as Franklin Templeton Investments. Certain officers and trustees of the Trust are also officers and/or directors of the following subsidiaries:
| |
| Subsidiary | Affiliation |
| Franklin Advisers, Inc. (Advisers) | Investment manager |
| Franklin Templeton Institutional, LLC (FT Institutional) | Investment manager |
| Franklin Templeton Services, LLC (FT Services) | Administrative manager |
| Franklin Templeton Distributors, Inc. (Distributors) | Principal underwriter |
| Franklin Templeton Investor Services, LLC (Investor Services) | Transfer agent |
a. Management Fees
Franklin International Growth Fund pays an investment management fee to FT Institutional based on the average daily net assets of the fund as follows:
| | |
| Annualized Fee Rate | | Net Assets |
| 0.950 | % | Up to and including $500 million |
| 0.850 | % | Over $500 million, up to and including $1 billion |
| 0.800 | % | Over $1 billion, up to and including $1.5 billion |
| 0.750 | % | Over $1.5 billion, up to and including $6.5 billion |
| 0.725 | % | Over $6.5 billion, up to and including $11.5 billion |
| 0.700 | % | Over $11.5 billion, up to and including $16.5 billion |
| 0.690 | % | Over $16.5 billion, up to and including $19 billion |
| 0.680 | % | Over $19 billion, up to and including $21.5 billion |
| 0.670 | % | In excess of $21.5 billion |
Franklin International Small Cap Growth Fund pays an investment management fee to Advisers of 0.95% per year of the average daily net assets of the fund.
Under a subadvisory agreement, FT Institutional, an affiliate of Advisers, provides subadvisory services to Franklin International Small Cap Growth Fund. The subadvisory fee is paid by Advisers based on the fund’s average daily net assets, and is not an additional expense of the fund.
b. Administrative Fees
Under an agreement with FT Institutional and Advisers, FT Services provides administrative services to the Funds. The fee is paid by FT Institutional and Advisers based on the Funds’ average daily net assets, and is not an additional expense of the Funds.
c. Distribution Fees
The Board has adopted distribution plans for each share class, with the exception of Class R6 and Advisor Class shares, pursuant to Rule 12b-1 under the 1940 Act. Distribution fees are not charged on shares held by affiliates. Under the Funds’ Class A reimbursement distribution plans, the Funds reimburse Distributors for costs incurred in connection with the servicing, sale and distribution of Funds’ shares up to the maximum annual plan rate for each class. Under the Class A reimbursement distribution plans, costs exceeding the maximum for the current plan year cannot be reimbursed in subsequent periods. In addition, under the Funds’ Class C and R compensation distribution plans, the Funds pay Distributors for costs incurred in connection with the servicing, sale and distribution of each fund’s shares up to the maximum annual plan rate for each class. The plan year, for purposes of monitoring compliance with the maximum annual plan rates, is February 1 through January 31 for each fund.
franklintempleton.com Semiannual Report | 43
FRANKLIN GLOBAL TRUST
NOTES TO FINANCIAL STATEMENTS (UNAUDITED)
3. Transactions with Affiliates (continued)
c. Distribution Fees (continued)
The maximum annual plan rates, based on the average daily net assets, for each class, are as follows:
| | | | |
| | | | Franklin | |
| | Franklin | | International | |
| | International | | Small Cap | |
| | Growth Fund | | Growth Fund | |
| Reimbursement Plans: | | | | |
| Class A | 0.35 | % | 0.35 | % |
| Compensation Plans: | | | | |
| Class C | 1.00 | % | 1.00 | % |
| Class R | 0.50 | % | 0.50 | % |
The Board has set the current rate at 0.30% per year for Class A shares until further notice and approval by the Board.
d. Sales Charges/Underwriting Agreements
Front-end sales charges and contingent deferred sales charges (CDSC) do not represent expenses of the Funds. These charges are deducted from the proceeds of sales of fund shares prior to investment or from redemption proceeds prior to remittance, as applicable. Distributors has advised the Funds of the following commission transactions related to the sales and redemptions of the Funds’ shares for the period:
| | | | |
| | | | | Franklin |
| | | Franklin | | International |
| | | International | | Small Cap |
| | | Growth Fund | | Growth Fund |
| |
| Sales charges retained net of commissions paid | | | | |
| to unaffiliated broker/dealers | $ | 17,563 | $ | 13,433 |
| CDSC retained | $ | 1,054 | $ | 5,581 |
e. Transfer Agent Fees
Each class of shares, except for Class R6, pays transfer agent fees to Investor Services for its performance of shareholder servicing obligations and reimburses Investor Services for out of pocket expenses incurred, including shareholding servicing fees paid to third parties. These fees are allocated daily based upon their relative proportion of such classes’ aggregate net assets. Class R6 pays Investor Services transfer agent fees specific to that class.
For the period ended January 31, 2015, the Funds paid transfer agent fees as noted in the Statements of Operations of which the following amounts were retained by Investor Services:
| | | | |
| | | | | Franklin |
| | | Franklin | | International |
| | | International | | Small Cap |
| | | Growth Fund | | Growth Fund |
| |
| Transfer agent fees | $ | 349,366 | $ | 425,680 |
44 | Semiannual Report franklintempleton.com
FRANKLIN GLOBAL TRUST
NOTES TO FINANCIAL STATEMENTS (UNAUDITED)
f. Investments in Institutional Fiduciary Trust Money Market Portfolio
Franklin International Growth Fund invests in Institutional Fiduciary Trust Money Market Portfolio (Sweep Money Fund), an affiliated open-end management investment company. Management fees paid by the fund are waived on assets invested in the Sweep Money Fund, as noted in the Statements of Operations, in an amount not to exceed the management and administrative fees paid directly or indirectly by the Sweep Money Fund. Prior to August 1, 2013, the waiver was accounted for as a reduction to management fees.
g. Waiver and Expense Reimbursements
FT Institutional and Investor Services have contractually agreed in advance to waive or limit their respective fees and to assume as their own expense certain expenses otherwise payable by Franklin International Growth Fund so that the expenses (excluding distribution fees and acquired fund fees and expenses) for Class A, Class C, Class R and Advisor Class of the fund do not exceed 1.19%, and Class R6 does not exceed 1.02% based on the average net assets of each class (other than certain non-routine expenses or costs, including those relating to litigation, indemnification, reorganizations, and liquidations) until November 30, 2016 and November 30, 2015, respectively.
Additionally, Investor Services has contractually agreed in advance to waive or limit its fees so that the Class R6 transfer agent fees for Franklin International Small Cap Growth Fund do not exceed 0.01% until November 30, 2015. For Franklin International Small Cap Growth Fund, there were no Class R6 transfer agent fees waived during the period ended January 31, 2015.
h. Other Affiliated Transactions
At January 31, 2015, one or more of the funds in Franklin Fund Allocator Series owned 13.49% of Franklin International Small Cap Growth Fund’s outstanding shares.
4. Expense Offset Arrangement
The Funds have entered into an arrangement with their custodian whereby credits realized as a result of uninvested cash balances are used to reduce a portion of the Funds’ custodian expenses. During the period ended January 31, 2015, the custodian fees were reduced as noted in the Statements of Operations.
5. Income Taxes
At January 31, 2015, the cost of investments and net unrealized appreciation (depreciation) for income tax purposes were as follows:
| | | | | | |
| | | | | | Franklin | |
| | | Franklin | | | International | |
| | | International | | | Small Cap | |
| | | Growth Fund | | | Growth Fund | |
| Cost of investments | $ | 287,233,498 | | $ | 1,590,057,049 | |
| |
| Unrealized appreciation | $ | 36,283,354 | | $ | 202,169,813 | |
| Unrealized depreciation | | (20,017,891 | ) | | (143,740,221 | ) |
| Net unrealized appreciation (depreciation) | $ | 16,265,463 | | $ | 58,429,592 | |
Differences between income and/or capital gains as determined on a book basis and a tax basis are primarily due to differing treatment of passive foreign investment company shares.
franklintempleton.com
Semiannual Report | 45
FRANKLIN GLOBAL TRUST
NOTES TO FINANCIAL STATEMENTS (UNAUDITED)
6. Investment Transactions
Purchases and sales of investments (excluding short term securities) for the period ended January 31, 2015, were as follows:
| | | | |
| | | | | Franklin |
| | | Franklin | | International |
| | | International | | Small Cap |
| | | Growth Fund | | Growth Fund |
| |
| Purchases | $ | 89,495,027 | $ | 209,985,618 |
| Sales | $ | 86,858,366 | $ | 314,718,425 |
7. Concentration of Risk
Investing in foreign securities may include certain risks and considerations not typically associated with investing in U.S. securities, such as fluctuating currency values and changing local and regional economic, political and social conditions, which may result in greater market volatility. In addition, certain foreign securities may not be as liquid as U.S. securities.
8. Holdings of 5% Voting Securities of Portfolio Companies
The 1940 Act defines “affiliated companies” to include investments in portfolio companies in which a fund owns 5% or more of the outstanding voting securities. Investments in “affiliated companies” for Franklin International Small Cap Growth Fund for the period ended January 31, 2015, were as shown below.
| | | | | | | | | | | | |
| | Number of | | | | Number of | | | | | | | |
| | Shares Held | | | | Shares Held | | Value | | | | Realized | |
| | at Beginning | Gross | Gross | | at End | | at End | | Investment | | Capital | |
| Name of Issuer | of Period | Additions | Reductions | | of Period | | of Period | | Income | | Gain (Loss) | |
| Non-Controlled Affiliates | | | | | | | | | | | | |
| Aderans Co. Ltd. | 3,418,500 | — | — | | 3,418,500 | $ | 30,499,196 | $ | — | $ | — | |
| Carpetright PLC | 3,387,259 | 2,377,666 | — | | 5,764,925 | | 42,702,125 | | — | | — | |
| Green REIT PLC | 42,701,981 | — | (4,272,500 | ) | 38,429,481 | | 57,737,781 | | — | | (1,374,031 | ) |
| Headlam Group PLC | 4,082,047 | 524,641 | — | | 4,606,688 | | 31,225,743 | | 375,731 | | — | |
| Irish Residential Properties | | | | | | | | | | | | |
| REIT PLC | 11,125,000 | — | — | | 11,125,000 | | 12,693,030 | | — | | — | |
| Irish Residential Properties | | | | | | | | | | | | |
| REIT PLC, 144A | 20,000,000 | — | — | | 20,000,000 | | 22,818,931 | | — | | — | |
| Lar Espana Real Estate | | | | | | | | | | | | |
| Socimi SA | 878,741 | 1,625,259 | — | | 2,504,000 | | 25,288,075 | | — | | — | |
| Optimal Payments PLC | 11,168,906 | — | (4,102,681 | ) | 7,066,225 | | —a | | — | | 28,384,762 | |
| Total Affiliated Securities (Value is 13.52% of Net Assets) | | | | $ | 222,964,881 | $ | 375,731 | $ | 27,010,731 | |
| aAs of January 31, 2015, no longer an affiliate. | | | | | | | | | | | |
9. Credit Facility
The Funds, together with other U.S. registered and foreign investment funds (collectively, Borrowers), managed by Franklin Templeton Investments, are borrowers in a joint syndicated senior unsecured credit facility totaling $1.5 billion (Global Credit Facility) which matured on February 13, 2015. This Global Credit Facility provides a source of funds to the Borrowers for temporary and emergency purposes, including the ability to meet future unanticipated or unusually large redemption requests. Effective February 13, 2015, the Borrowers renewed the Global Credit Facility for a one year term, maturing February 12, 2016, for a total of $2 billion.
Under the terms of the Global Credit Facility, the Funds shall, in addition to interest charged on any borrowings made by the Funds and other costs incurred by the Funds, pay their share of fees and expenses incurred in connection with the implementation
46 | Semiannual Report
franklintempleton.com
FRANKLIN GLOBAL TRUST
NOTES TO FINANCIAL STATEMENTS (UNAUDITED)
and maintenance of the Global Credit Facility, based upon their relative share of the aggregate net assets of all of the Borrowers, including an annual commitment fee of 0.07% based upon the unused portion of the Global Credit Facility. These fees are reflected in other expenses in the Statements of Operations. During the period ended January 31, 2015, the Funds did not use the Global Credit Facility.
10. Fair Value Measurements
The Funds follow a fair value hierarchy that distinguishes between market data obtained from independent sources (observable inputs) and the Funds’ own market assumptions (unobservable inputs). These inputs are used in determining the value of the Funds’ financial instruments and are summarized in the following fair value hierarchy:
- Level 1 – quoted prices in active markets for identical financial instruments
- Level 2 – other significant observable inputs (including quoted prices for similar financial instruments, interest rates, prepayment speed, credit risk, etc.)
- Level 3 – significant unobservable inputs (including the Funds’ own assumptions in determining the fair value of financial instruments)
The input levels are not necessarily an indication of the risk or liquidity associated with financial instruments at that level.
For movements between the levels within the fair value hierarchy, the Funds have adopted a policy of recognizing the transfers as of the date of the underlying event which caused the movement.
A summary of inputs used as of January 31, 2015, in valuing the Funds’ assets carried at fair value, is as follows:
| | | | | | | | |
| | | Level 1 | | Level 2 | | Level 3 | | Total |
| Franklin International Growth Fund | | | | | | | | |
| Assets: | | | | | | | | |
| Investments in Securities: | | | | | | | | |
| Equity Investmentsa | $ | 291,901,044 | $ | — | $ | —b | $ | 291,901,044 |
| Short Term Investments | | 11,597,917 | | — | | — | | 11,597,917 |
| Total Investments in Securities | $ | 303,498,961 | $ | — | $ | —b | $ | 303,498,961 |
| |
| Franklin International Small Cap Growth Fund | | | | | | | | |
| Assets: | | | | | | | | |
| Investments in Securities: | | | | | | | | |
| Equity Investmentsa | $ | 1,563,486,641 | $ | — | $ | — | $ | 1,563,486,641 |
| Short Term Investments | | — | | 85,000,000 | | — | | 85,000,000 |
| Total Investments in Securities | $ | 1,563,486,641 | $ | 85,000,000 | $ | — | $ | 1,648,486,641 |
aFor detailed categories, see the accompanying Statements of Investments.
bIncludes security determined to have no value at January 31, 2015.
11. Subsequent Events
The Funds have evaluated subsequent events through the issuance of the financial statements and determined that no events have occurred that require disclosure other than those already disclosed in the financial statements.
|
| Abbreviations |
| Selected Portfolio |
| ADR American Depositary Receipt |
franklintempleton.com Semiannual Report | 47
FRANKLIN GLOBAL TRUST
Shareholder Information
Proxy Voting Policies and Procedures
The Trust’s investment manager has established Proxy Voting Policies and Procedures (Policies) that the Trust uses to determine how to vote proxies relating to portfolio securities. Shareholders may view the Trust’s complete Policies online at franklintempleton.com. Alternatively, shareholders may request copies of the Policies free of charge by calling the Proxy Group collect at (954) 527-7678 or by sending a written request to: Franklin Templeton Companies, LLC, 300 S.E. 2nd Street, Fort Lauderdale, FL 33301, Attention: Proxy Group. Copies of the Trust’s proxy voting records are also made available online at franklintempleton.com and posted on the U.S. Securities and Exchange Commission’s website at sec.gov and reflect the most recent 12-month period ended June 30.
Quarterly Statement of Investments
The Trust files a complete statement of investments with the U.S. Securities and Exchange Commission for the first and third quarters for each fiscal year on Form N-Q. Shareholders may view the filed Form N-Q by visiting the Commission’s website at sec.gov. The filed form may also be viewed and copied at the Commission’s Public Reference Room in Washington, DC. Information regarding the operations of the Public Reference Room may be obtained by calling (800) SEC-0330.
48 | Semiannual Report
franklintempleton.com
Franklin Templeton Investments
Gain From Our Perspective®
At Franklin Templeton Investments, we’re dedicated to one goal: delivering exceptional asset management for our clients. By bringing together multiple, world-class investment teams in a single firm, we’re able to offer specialized expertise across styles and asset classes, all supported by the strength and resources of one of the world’s largest asset managers. This has helped us to become a trusted partner to individual and institutional investors across the globe.
Focus on Investment Excellence
At the core of our firm, you’ll find multiple independent investment teams—each with a focused area of expertise—from traditional to alternative strategies and multi-asset solutions. And because our portfolio groups operate autonomously, their strategies can be combined to deliver true style and asset class diversification.
All of our investment teams share a common commitment to excellence grounded in rigorous, fundamental research and robust, disciplined risk management. Decade after decade, our consistent, research-driven processes have helped Franklin Templeton earn an impressive record of strong, long-term results.
Global Perspective Shaped by Local Expertise
In today’s complex and interconnected world, smart investing demands a global perspective. Franklin Templeton pioneered international investing over 60 years ago, and our expertise in emerging markets spans more than a quarter of a century. Today, our investment professionals are on the ground across the globe, spotting investment ideas and potential risks firsthand. These locally based teams bring in-depth understanding of local companies, economies and cultural nuances, and share their best thinking across our global research network.
Strength and Experience
Franklin Templeton is a global leader in asset management serving clients in over 150 countries.1 We run our business with the same prudence we apply to asset management, staying focused on delivering relevant investment solutions, strong long-term results and reliable, personal service. This approach, focused on putting clients first, has helped us to become one of the most trusted names in financial services.
1. As of 12/31/14. Clients are represented by the total number of shareholder accounts.
Not FDIC Insured | May Lose Value | No Bank Guarantee
| |
| Contents | |
| |
| Shareholder Letter | 1 |
| Semiannual Report | |
| Franklin Large Cap Equity Fund | 3 |
| Performance Summary | 6 |
| Your Fund’s Expenses | 9 |
| Financial Highlights and | |
| Statement of Investments | 11 |
| Financial Statements | 18 |
| Notes to Financial Statements | 22 |
| Shareholder Information | 28 |
franklintempleton.com
| 1
Semiannual Report
Franklin Large Cap Equity Fund
This semiannual report for Franklin Large Cap Equity Fund covers the period ended January 31, 2015.
Your Fund’s Goal and Main Investments
The Fund seeks long-term growth of principal and income through investing at least 80% of its net assets in equity securities of large capitalization companies with market capital izations within the top 50% of companies in the Russell 1000® Index, or of more than $5 billion, at the time of purchase.1 The Fund attempts to minimize capital gains distributions.
Performance Overview
The Fund’s Class A shares posted a +1.59% cumulative total return for the six months under review. In comparison, the Fund’s benchmark, the Standard & Poor’s 500 Index (S&P 500®), which is a broad measure of U.S. stock performance, generated a +4.37% total return.2 You can find the Fund’s long-term performance data in the Performance Summary beginning on page 6.
Performance data represent past performance, which does not guarantee future results. Investment return and principal value will fluctuate, and you may have a gain or loss when you sell your shares. Current performance may differ from figures shown. Please visit franklintempleton.com or call (800) 342-5236 for most recent month-end performance.
| | |
| Geographic Breakdown | | |
| 1/31/15 | | |
| | % of Total | |
| | Net Assets | |
| U.S. | 91.9 | % |
| U.K. | 1.8 | % |
| Switzerland | 1.4 | % |
| Denmark | 1.0 | % |
| Short-Term Investments & Other Net Assets | 3.9 | % |
Economic and Market Overview
U.S. economic growth trends were generally encouraging during the six months under review, although economic expansion moderated in 2014’s fourth quarter. A wider trade deficit and lower federal government spending partially offset the positive effect from greater spending by consumers, businesses, and state and local governments. Manufacturing and non-manufacturing activities increased, and the unemployment rate declined to 5.7% in January 2015 from 6.2% in July 2014.3 The housing market improved as home prices rose in most metropolitan areas and mortgage rates declined for the six-month period. Retail sales rose for most of the period but softened near period-end.
The U.S. Federal Reserve Board (Fed) ended its bond buying program in October 2014, based on its view that underlying economic strength could support ongoing progress in labor market conditions. The Fed stated that it could be patient with regard to raising interest rates and that it would consider inflationary pressures, labor market conditions, and financial and international developments in determining its next course of action.
The global economy overall expanded moderately during the period even though economic activity in some countries slowed. Major developed market central banks generally reaffirmed their accommodative monetary policies to support economic recovery. Several emerging market central banks cut interest rates to boost economic growth, while others raised rates to control inflation and currency depreciation.
The U.K. economy grew relatively well, supported by the services and manufacturing sectors. In the eurozone, the economy showed signs of improvement as the gross domestic product growth rate picked up in the third and fourth quarters of 2014, led by Germany, the region’s largest economy. In addition to maintaining a low benchmark interest rate and a negative bank
1. The Russell 1000 Index is market capitalization weighted and measures performance of the largest companies in the Russell 3000 Index, which represent the majority
of the U.S. market’s total capitalization. Russell Investment Group is the source and owner of the trademarks, service marks and copyrights related to the Russell Indexes.
Russell® is a trademark of Russell Investment Group.
2. Source: Morningstar.
The indexes are unmanaged and include reinvested dividends. One cannot invest directly in an index, and an index is not representative of the Fund’s portfolio.
3. Source: Bureau of Labor Statistics.
The dollar value, number of shares or principal amount, and names of all portfolio holdings are listed in the Fund’s Statement of Investments (SOI).
The SOI begins on page 15.
franklintempleton.com Semiannual Report | 3
FRANKLIN LARGE CAP EQUITY FUND
deposit rate, the European Central Bank (ECB) implemented a major asset purchase program to boost inflation and stimulate the economy. Although the region benefited from lower oil prices, a weaker euro that supported exports and the ECB’s accommodative policy, it continued to face headwinds such as deflationary pressures and the crisis in Ukraine. Near period-end, concerns arose about Greece’s election of a new prime minister whose platform included restructuring the terms of the country’s debt and loosening austerity mandates.
| | |
| Top 10 Sectors/Industries | | |
| 1/31/15 | | |
| | % of Total | |
| | Net Assets | |
| Oil, Gas & Consumable Fuels | 7.2 | % |
| Biotechnology | 6.1 | % |
| Chemicals | 5.0 | % |
| Technology Hardware, Storage & Peripherals | 4.7 | % |
| Aerospace & Defense | 4.6 | % |
| Software | 4.3 | % |
| Banks | 4.3 | % |
| Internet Software & Services | 4.3 | % |
| Capital Markets | 4.0 | % |
| Media | 3.7 | % |
Japan slid into recession in the third quarter, prompting the Bank of Japan to broaden its stimulus measures amid weak domestic demand and lower inflation resulting from falling crude oil prices. In December, Japan’s ruling coalition was reelected and announced a new stimulus package to revive economic growth. The country exited recession in the fourth quarter, supported largely by exports, while growth in domestic consumption and capital spending remained relatively soft.
Global developed market stocks, as measured by the MSCI World Index, declined slightly for the six-month period as investor concerns about global economic growth, particularly in the eurozone, Japan and China, and the future course of U.S. monetary policy overshadowed continued corporate profit strength. During the period, oil prices plummeted mainly because of strong supply. Despite benign global inflation and a strong U.S. dollar, gold prices ended the period slightly higher after prices surged in January as oil prices weakened, the Swiss National Bank removed the franc’s peg to the euro and the ECB increased monetary stimulus.
Investment Strategy
We are research-driven, fundamental investors, pursuing a blend of growth and value strategies. We use a top-down analysis of macroeconomic trends, including sectors (with some attention to the sector weightings in the Fund’s comparative index) and industries combined with a bottom-up analysis of individual securities. In selecting investments for the Fund, we look for companies we believe are positioned for growth in revenues, earnings or assets, and are selling at reasonable prices. We also consider the dividend growth history. We employ a thematic approach to identify sectors that may benefit from longer term dynamic growth. Within these sectors, we consider the basic financial and operating strength and quality of a company and company management. The Fund, from time to time, may have significant positions in particular sectors. We also seek to identify companies that we believe are temporarily out of favor with investors but have a good intermediate- or long-term outlook.
| | |
| Top 10 Holdings | | |
| 1/31/15 | | |
| Company | % of Total | |
| Sector/Industry | Net Assets | |
| Apple Inc. | 3.7 | % |
| Technology Hardware, Storage & Peripherals | | |
| Google Inc., A & C | 2.7 | % |
| Internet Software & Services | | |
| United Technologies Corp. | 2.6 | % |
| Aerospace & Defense | | |
| Chevron Corp. | 2.4 | % |
| Oil, Gas & Consumable Fuels | | |
| Amazon.com Inc. | 2.3 | % |
| Internet & Catalog Retail | | |
| Gilead Sciences Inc. | 2.3 | % |
| Biotechnology | | |
| Abbott Laboratories | 2.2 | % |
| Health Care Equipment & Supplies | | |
| Celgene Corp. | 2.2 | % |
| Biotechnology | | |
| Starbucks Corp. | 2.2 | % |
| Hotels, Restaurants & Leisure | | |
| NIKE Inc., B | 2.1 | % |
| Textiles, Apparel & Luxury Goods | | |
Manager’s Discussion
During the six-month period, stock selection in the consumer discretionary and health care sectors contributed to the Fund’s performance compared to the benchmark S&P 500.4 Key contributors from the consumer discretionary sector included home
4. The consumer discretionary sector comprises auto components; hotels, restaurants and leisure; Internet and catalog retail; leisure products; media; specialty retail; and
textiles, apparel and luxury goods in the SOI. The health care sector comprises biotechnology, health care equipment and supplies, health care providers and services,
health care technology, life sciences tools and services, and pharmaceuticals in the SOI.
4 | Semiannual Report franklintempleton.com
FRANKLIN LARGE CAP EQUITY FUND
improvement retailer Lowe’s Companies, sporting goods and apparel maker NIKE, online retailer Amazon.com and coffee and tea retailer Starbucks. Lowe’s benefited from increased sales helped by rebounding home remodeling, profits for NIKE rose as a result of increased demand including higher margin products, and Starbucks had improved results driven by increased store traffic and gift card purchases. In health care, biopharmaceutical companies Celgene, Regeneron Pharmaceuticals and Gilead Sciences experienced increased product sales, and health care technology firm Cerner also helped relative results. Relative to its benchmark, the Fund had modest overweightings in the consumer discretionary and health care sectors. In other sectors, network security provider Fortinet5 and investment manager BlackRock were notable contributors.
In contrast, stock selection and an underweighting in the consumer staples sector and stock selection in the financials, energy and information technology (IT) sectors weighed on relative results.6 Broadly, cyclical stocks were negatively impacted by a slowdown in the global economy during this time period. Key detractors included oil and gas companies Anadarko Petroleum, Marathon Oil, Southwestern Energy,7 Chevron and Cabot Oil & Gas, and oilfield services firm Schlumberger, all of which were impaired by falling oil prices during the period. On a relative basis, the Fund had a slight underweighting in the energy sector during the period. In IT, positioning technology provider Trimble Navigation was also negatively impacted by lower oil prices as well as effects from new acquisitions and a stronger dollar.5,7 Digital communications products manufacturer QUALCOMM, which lowered the earnings guidance for its semiconductor business, also hindered performance. In other sectors, aerospace metal products maker Precision Castparts and auto components manufacturer BorgWarner also hurt relative results.
Thank you for your continued participation in Franklin Large Cap Equity Fund. We look forward to serving your future investment needs.

The foregoing information reflects our analysis, opinions and portfolio holdings as of January 31, 2015, the end of the reporting period. The way we implement our main investment strategies and the resulting portfolio holdings may change depending on factors such as market and economic conditions. These opinions may not be relied upon as investment advice or an offer for a particular security. The information is not a complete analysis of every aspect of any market, country, industry, security or the Fund. Statements of fact are from sources considered reliable, but the investment manager makes no representation or warranty as to their completeness or accuracy. Although historical performance is no guarantee of future results, these insights may help you understand our investment management philosophy.
CFA® is a trademark owned by CFA Institute.
5. Not part of the index.
6. The consumer staples sector comprises beverages, food and staples retailing, and food products in the SOI. The financials sector comprises banks, capital markets,
consumer finance, insurance and real estate investment trusts in the SOI. The energy sector comprises energy equipment and services; and oil, gas and consumable fuels
in the SOI. The IT sector comprises communications equipment; Internet software and services; IT services; semiconductors and semiconductor equipment; software; and
technology hardware, storage and peripherals in the SOI.
7. Sold by period-end.
See www.franklintempletondatasources.com for additional data provider information.
franklintempleton.com Semiannual Report | 5
FRANKLIN LARGE CAP EQUITY FUND
Performance Summary as of January 31, 2015
Your dividend income will vary depending on dividends or interest paid by securities in the Fund’s portfolio, adjusted for operating expenses of each class. Capital gain distributions are net profits realized from the sale of portfolio securities. The performance table does not reflect any taxes that a shareholder would pay on Fund dividends, capital gain distributions, if any, or any realized gains on the sale of Fund shares. Total return reflects reinvestment of the Fund’s dividends and capital gain distributions, if any, and any unrealized gains or losses.
| | | | | | |
| Net Asset Value | | | | | | |
| Share Class (Symbol) | | 1/31/15 | | 7/31/14 | | Change |
| A (FLCAX) | $ | 7.73 | $ | 8.25 | -$ | 0.52 |
| C (n/a) | $ | 7.51 | $ | 8.07 | -$ | 0.56 |
| R (n/a) | $ | 7.72 | $ | 8.25 | -$ | 0.53 |
| Advisor (FLCIX) | $ | 7.79 | $ | 8.31 | -$ | 0.52 |
| | | | | | | | |
| Distributions (8/1/14–1/31/15) | | | | | | | | |
| | | Dividend | | Short-Term | | Long-Term | | |
| Share Class | | Income | | Capital Gain | | Capital Gain | | Total |
| A | | — | $ | 0.1122 | $ | 0.5368 | $ | 0.6490 |
| C | | — | $ | 0.1122 | $ | 0.5368 | $ | 0.6490 |
| R | | — | $ | 0.1122 | $ | 0.5368 | $ | 0.6490 |
| Advisor | $ | 0.0052 | $ | 0.1122 | $ | 0.5368 | $ | 0.6542 |
6 | Semiannual Report franklintempleton.com
FRANKLIN LARGE CAP EQUITY FUND
PERFORMANCE SUMMARY
Performance as of 1/31/151
Cumulative total return excludes sales charges. Average annual total returns and value of $10,000 investment include maximum sales charges. Class A: 5.75% maximum initial sales charge; Class C: contingent deferred sales charge in first year only;
Class R/Advisor Class: no sales charges.
| | | | | | | | | | | | | | | |
| | | | | | | | | Value of | | Average Annual | | Total Annual | |
| | | Cumulative | | | Average Annual | | $ | 10,000 | | Total Return | | Operating Expenses6 | |
| Share Class | | Total Return2 | | | Total Return3 | | | Investment4 | | (12/31/14)5 | | (with waiver) | | (without waiver) | |
| A | | | | | | | | | | | | 1.25 | % | 1.36 | % |
| 6-Month | + | 1.59 | % | | -4.25 | % | $ | 9,575 | | | | | | | |
| 1-Year | + | 8.17 | % | + | 1.95 | % | $ | 10,195 | + | 0.70 | % | | | | |
| 5-Year | + | 74.34 | % | + | 10.44 | % | $ | 16,431 | + | 10.30 | % | | | | |
| Since Inception (9/30/08) | + | 69.46 | % | + | 7.67 | % | $ | 15,972 | + | 8.31 | % | | | | |
| C | | | | | | | | | | | | 1.95 | % | 2.06 | % |
| 6-Month | + | 1.12 | % | + | 0.19 | % | $ | 10,019 | | | | | | | |
| 1-Year | + | 7.24 | % | + | 6.25 | % | $ | 10,625 | + | 5.09 | % | | | | |
| 5-Year | + | 69.29 | % | + | 11.10 | % | $ | 16,929 | + | 10.96 | % | | | | |
| Since Inception (9/30/08) | + | 62.96 | % | + | 8.01 | % | $ | 16,296 | + | 8.69 | % | | | | |
| R | | | | | | | | | | | | 1.45 | % | 1.56 | % |
| 6-Month | + | 1.47 | % | + | 1.47 | % | $ | 10,147 | | | | | | | |
| 1-Year | + | 7.88 | % | + | 7.88 | % | $ | 10,788 | + | 6.57 | % | | | | |
| 5-Year | + | 73.28 | % | + | 11.62 | % | $ | 17,328 | + | 11.48 | % | | | | |
| Since Inception (9/30/08) | + | 68.02 | % | + | 8.53 | % | $ | 16,802 | + | 9.19 | % | | | | |
| Advisor | | | | | | | | | | | | 0.95 | % | 1.06 | % |
| 6-Month | + | 1.65 | % | + | 1.65 | % | $ | 10,165 | | | | | | | |
| 1-Year | + | 8.55 | % | + | 8.55 | % | $ | 10,855 | + | 7.08 | % | | | | |
| 5-Year | + | 77.87 | % | + | 12.21 | % | $ | 17,787 | + | 12.05 | % | | | | |
| 10-Year | + | 80.97 | % | + | 6.11 | % | $ | 18,097 | + | 6.13 | % | | | | |
Performance data represent past performance, which does not guarantee future results. Investment return and principal value will fluctuate, and you may have a gain or loss when you sell your shares. Current performance may differ from figures shown. For most recent month-end performance, go to franklintempleton.com or call (800) 342-5236.
franklintempleton.com Semiannual Report | 7
FRANKLIN LARGE CAP EQUITY FUND
PERFORMANCE SUMMARY
All investments involve risks, including possible loss of principal. Stock prices fluctuate, sometimes rapidly and dramatically, due to factors affecting individual
companies, particular industries or sectors, or general market conditions. The Fund’s investments in foreign company stocks involve special risks including cur-
rency fluctuations and political uncertainty. There are special risks involved with significant exposure to a particular sector, including increased susceptibility
related to economic, business or other developments affecting that sector, which may result in increased volatility. The Fund is actively managed but there is
no guarantee that the manager’s investment decisions will produce the desired results. The Fund’s prospectus also includes a description of the main invest-
ment risks.
Class C: These shares have higher annual fees and expenses than Class A shares.
Class R: Shares are available to certain eligible investors as described in the prospectus. These shares have higher annual fees and expenses than Class A shares.
Advisor Class: Shares are available to certain eligible investors as described in the prospectus.
1. The Fund has an expense reduction contractually guaranteed through at least 11/30/16 and a fee waiver associated with its investments in a Franklin Templeton money
fund, contractually guaranteed through at least its current fiscal year-end. Fund investment results reflect the expense reduction and fee waiver, to the extent applicable;
without these reductions, the results would have been lower.
2. Cumulative total return represents the change in value of an investment over the periods indicated.
3. Average annual total return represents the average annual change in value of an investment over the periods indicated. Six-month return has not been annualized.
4. These figures represent the value of a hypothetical $10,000 investment in the Fund over the periods indicated.
5. In accordance with SEC rules, we provide standardized average annual total return information through the latest calendar quarter.
6. Figures are as stated in the Fund’s current prospectus. In periods of market volatility, assets may decline significantly, causing total annual Fund operating expenses to
become higher than the figures shown.
8 | Semiannual Report franklintempleton.com
FRANKLIN LARGE CAP EQUITY FUND
Your Fund’s Expenses
As a Fund shareholder, you can incur two types of costs:
- Transaction costs, including sales charges (loads) on Fund purchases; and
- Ongoing Fund costs, including management fees, distribu- tion and service (12b-1) fees, and other Fund expenses. All mutual funds have ongoing costs, sometimes referred to as operating expenses.
The following table shows ongoing costs of investing in the Fund and can help you understand these costs and compare them with those of other mutual funds. The table assumes a $1,000 investment held for the six months indicated.
Actual Fund Expenses
The first line (Actual) for each share class listed in the table provides actual account values and expenses. The “Ending Account Value” is derived from the Fund’s actual return, which includes the effect of Fund expenses.
You can estimate the expenses you paid during the period by following these steps. Of course, your account value and expenses will differ from those in this illustration:
| 1. | Divide your account value by $1,000. |
| | If an account had an $8,600 value, then $8,600 ÷ $1,000 = 8.6. |
| 2. | Multiply the result by the number under the heading “Expenses Paid During Period.” |
| | If Expenses Paid During Period were $7.50, then 8.6 x $7.50 = $64.50. |
In this illustration, the estimated expenses paid this period are $64.50.
Hypothetical Example for Comparison with Other Funds
Information in the second line (Hypothetical) for each class in the table can help you compare ongoing costs of investing in the Fund with those of other mutual funds. This information may not be used to estimate the actual ending account balance or expenses you paid during the period. The hypothetical “Ending Account Value” is based on the actual expense ratio for each class and an assumed 5% annual rate of return before expenses, which does not represent the Fund’s actual return. The figure under the heading “Expenses Paid During Period” shows the hypothetical expenses your account would have incurred under this scenario. You can compare this figure with the 5% hypothetical examples that appear in shareholder reports of other funds.
Please note that expenses shown in the table are meant to highlight ongoing costs and do not reflect any transaction costs, such as sales charges. Therefore, the second line for each class is useful in comparing ongoing costs only, and will not help you compare total costs of owning different funds. In addition, if transaction costs were included, your total costs would have been higher. Please refer to the Fund prospectus for additional information on operating expenses.
franklintempleton.com Semiannual Report | 9
| | | | | | |
| FRANKLIN LARGE CAP EQUITY FUND | | | | |
| YOUR FUND’S EXPENSES | | | | | | |
| |
| |
| |
| | | Beginning Account | | Ending Account | | Expenses Paid During |
| Share Class | | Value 8/1/14 | | Value 1/31/15 | | Period* 8/1/14–1/31/15 |
| A | | | | | | |
| Actual | $ | 1,000 | $ | 1,015.90 | $ | 6.35 |
| Hypothetical (5% return before expenses) | $ | 1,000 | $ | 1,018.90 | $ | 6.36 |
| C | | | | | | |
| Actual | $ | 1,000 | $ | 1,011.20 | $ | 9.89 |
| Hypothetical (5% return before expenses) | $ | 1,000 | $ | 1,015.38 | $ | 9.91 |
| R | | | | | | |
| Actual | $ | 1,000 | $ | 1,014.70 | $ | 7.36 |
| Hypothetical (5% return before expenses) | $ | 1,000 | $ | 1,017.90 | $ | 7.37 |
| Advisor | | | | | | |
| Actual | $ | 1,000 | $ | 1,016.50 | $ | 4.83 |
| Hypothetical (5% return before expenses) | $ | 1,000 | $ | 1,020.42 | $ | 4.84 |
*Expenses are calculated using the most recent six-month expense ratio, net of expense waivers, annualized for each class (A: 1.25%;
C: 1.95%; R: 1.45%; and Advisor: 0.95%), multiplied by the average account value over the period, multiplied by 184/365 to reflect the
one-half year period.
10 | Semiannual Report franklintempleton.com
| | | | | | | | | | | | | | | | | | |
| | | | | | | | | | | | FRANKLIN GLOBAL TRUST | |
| |
| |
| Financial Highlights | | | | | | | | | | | | | | | | | | |
| Franklin Large Cap Equity Fund | | | | | | | | | | | | | | | | | | |
| | | Six Months Ended | | | | | | | | | | | | | | | | |
| | | January 31, 2015 | | | | | | | | | Year Ended July 31, | | | | |
| | | (unaudited) | | | 2014 | | | 2013 | | | 2012 | | | 2011 | | | 2010 | |
| Class A | | | | | | | | | | | | | | | | | | |
| Per share operating performance | | | | | | | | | | | | | | | | | | |
| (for a share outstanding throughout the period) | | | | | | | | | | | | | | | | | | |
| Net asset value, beginning of period | $ | 8.25 | | $ | 7.43 | | $ | 6.09 | | $ | 6.21 | | $ | 5.00 | | $ | 4.67 | |
| Income from investment operationsa: | | | | | | | | | | | | | | | | | | |
| Net investment income (loss)b | | (—)c | | | —c | | | 0.01 | | | 0.02 | | | 0.01 | | | 0.01 | |
| Net realized and unrealized gains | | | | | | | | | | | | | | | | | | |
| (losses) | | 0.13 | | | 1.11 | | | 1.35 | | | (0.13 | ) | | 1.21 | | | 0.34 | |
| Total from investment operations | | 0.13 | | | 1.11 | | | 1.36 | | | (0.11 | ) | | 1.22 | | | 0.35 | |
| Less distributions from: | | | | | | | | | | | | | | | | | | |
| Net investment income | | — | | | (0.01 | ) | | (0.02 | ) | | (0.01 | ) | | (0.01 | ) | | (0.02 | ) |
| Net realized gains | | (0.65 | ) | | (0.28 | ) | | — | | | — | | | — | | | — | |
| Total distributions | | (0.65 | ) | | (0.29 | ) | | (0.02 | ) | | (0.01 | ) | | (0.01 | ) | | (0.02 | ) |
| Net asset value, end of period | $ | 7.73 | | $ | 8.25 | | $ | 7.43 | | $ | 6.09 | | $ | 6.21 | | $ | 5.00 | |
| |
| Total returnd | | 1.59 | % | | 15.23 | % | | 22.14 | % | | (1.71 | )% | | 24.35 | % | | 7.47 | % |
| |
| Ratios to average net assetse | | | | | | | | | | | | | | | | | | |
| Expenses before waiver and payments by | | | | | | | | | | | | | | | | | | |
| affiliates | | 1.34 | % | | 1.36 | % | | 1.39 | % | | 1.41 | % | | 1.41 | % | | 1.45 | % |
| Expenses net of waiver and payments by | | | | | | | | | | | | | | | | | | |
| affiliates | | 1.25 | % | | 1.25 | % | | 1.25 | % | | 1.25 | % | | 1.25 | % | | 1.25 | % |
| Net investment income (loss) | | (0.08 | )% | | 0.06 | % | | 0.21 | % | | 0.26 | % | | 0.15 | % | | 0.28 | % |
| |
| Supplemental data | | | | | | | | | | | | | | | | | | |
| Net assets, end of period (000’s) | $ | 16,074 | | $ | 12,796 | | $ | 8,911 | | $ | 6,842 | | $ | 6,205 | | $ | 3,230 | |
| Portfolio turnover rate | | 15.73 | % | | 50.39 | % | | 33.77 | % | | 21.88 | % | | 24.73 | % | | 35.55 | % |
aThe amount shown for a share outstanding throughout the period may not correlate with the Statement of Operations for the period due to the timing of sales and
repurchases of the Fund shares in relation to income earned and/or fluctuating fair value of the investments of the Fund.
bBased on average daily shares outstanding.
cAmount rounds to less than $0.01 per share.
dTotal return does not reflect sales commissions or contingent deferred sales charges, if applicable, and is not annualized for periods less than one year.
eRatios are annualized for periods less than one year.
franklintempleton.com The accompanying notes are an integral part of these financial statements. | Semiannual Report | 11
FRANKLIN GLOBAL TRUST
FINANCIAL HIGHLIGHTS
| | | | | | | | | | | | | | | | | | |
| Franklin Large Cap Equity Fund (continued) | | | | | | | | | | | | | | | | |
| | | Six Months Ended | | | | | | | | | | | | | | | | |
| | | January 31, 2015 | | | | | | | | | Year Ended July 31, | | | | |
| | | (unaudited) | | | 2014 | | | 2013 | | | 2012 | | | 2011 | | | 2010 | |
| Class C | | | | | | | | | | | | | | | | | | |
| Per share operating performance | | | | | | | | | | | | | | | | | | |
| (for a share outstanding throughout the period) | | | | | | | | | | | | | | | | | | |
| Net asset value, beginning of period | $ | 8.07 | | $ | 7.31 | | $ | 6.02 | | $ | 6.14 | | $ | 4.97 | | $ | 4.66 | |
| Income from investment operationsa: | | | | | | | | | | | | | | | | | | |
| Net investment income (loss)b | | (0.03 | ) | | (0.05 | ) | | (0.03 | ) | | (0.02 | ) | | (0.03 | ) | | (0.03 | ) |
| Net realized and unrealized gains | | | | | | | | | | | | | | | | | | |
| (losses) | | 0.12 | | | 1.09 | | | 1.32 | | | (0.10 | ) | | 1.20 | | | 0.35 | |
| Total from investment operations | | 0.09 | | | 1.04 | | | 1.29 | | | (0.12 | ) | | 1.17 | | | 0.32 | |
| Less distributions from: | | | | | | | | | | | | | | | | | | |
| Net investment income | | — | | | — | | | — | | | — | | | — | | | (0.01 | ) |
| Net realized gains | | (0.65 | ) | | (0.28 | ) | | — | | | — | | | — | | | — | |
| Total distributions | | (0.65 | ) | | (0.28 | ) | | — | | | — | | | — | | | (0.01 | ) |
| Net asset value, end of period | $ | 7.51 | | $ | 8.07 | | $ | 7.31 | | $ | 6.02 | | $ | 6.14 | | $ | 4.97 | |
| |
| Total returnc | | 1.12 | % | | 14.37 | % | | 21.43 | % | | (1.95 | )% | | 23.54 | % | | 6.78 | % |
| |
| Ratios to average net assetsd | | | | | | | | | | | | | | | | | | |
| Expenses before waiver and payments by | | | | | | | | | | | | | | | | | | |
| affiliates | | 2.04 | % | | 2.05 | % | | 2.07 | % | | 2.07 | % | | 2.08 | % | | 2.15 | % |
| Expenses net of waiver and payments by | | | | | | | | | | | | | | | | | | |
| affiliates | | 1.95 | % | | 1.94 | % | | 1.93 | % | | 1.91 | % | | 1.92 | % | | 1.95 | % |
| Net investment income (loss) | | (0.78 | )% | | (0.63 | )% | | (0.47 | )% | | (0.40 | )% | | (0.52 | )% | | (0.42 | )% |
| |
| Supplemental data | | | | | | | | | | | | | | | | | | |
| Net assets, end of period (000’s) | $ | 3,813 | | $ | 3,330 | | $ | 2,214 | | $ | 1,116 | | $ | 1,221 | | $ | 408 | |
| Portfolio turnover rate | | 15.73 | % | | 50.39 | % | | 33.77 | % | | 21.88 | % | | 24.73 | % | | 35.55 | % |
aThe amount shown for a share outstanding throughout the period may not correlate with the Statement of Operations for the period due to the timing of sales and
repurchases of the Fund shares in relation to income earned and/or fluctuating fair value of the investments of the Fund.
bBased on average daily shares outstanding.
cTotal return does not reflect sales commissions or contingent deferred sales charges, if applicable, and is not annualized for periods less than one year.
dRatios are annualized for periods less than one year.
12 | Semiannual Report | The accompanying notes are an integral part of these financial statements. franklintempleton.com
FRANKLIN GLOBAL TRUST
FINANCIAL HIGHLIGHTS
| | | | | | | | | | | | | | | | | | |
| Franklin Large Cap Equity Fund (continued) | | | | | | | | | | | | | | | | |
| | | Six Months Ended | | | | | | | | | | | | | | | | |
| | | January 31, 2015 | | | | | | | | | Year Ended July 31, | | | | |
| | | (unaudited) | | | 2014 | | | 2013 | | | 2012 | | | 2011 | | | 2010 | |
| Class R | | | | | | | | | | | | | | | | | | |
| Per share operating performance | | | | | | | | | | | | | | | | | | |
| (for a share outstanding throughout the period) | | | | | | | | | | | | | | | | | | |
| Net asset value, beginning of period | $ | 8.25 | | $ | 7.44 | | $ | 6.10 | | $ | 6.20 | | $ | 5.00 | | $ | 4.67 | |
| Income from investment operationsa: | | | | | | | | | | | | | | | | | | |
| Net investment income (loss)b | | (0.01 | ) | | (0.01 | ) | | —c | | | —c | | | (—)c | | | —c | |
| Net realized and unrealized gains | | | | | | | | | | | | | | | | | | |
| (losses) | | 0.13 | | | 1.10 | | | 1.35 | | | (0.09 | ) | | 1.20 | | | 0.34 | |
| Total from investment operations | | 0.12 | | | 1.09 | | | 1.35 | | | (0.09 | ) | | 1.20 | | | 0.34 | |
| Less distributions from: | | | | | | | | | | | | | | | | | | |
| Net investment income | | — | | | (—)c | | | (0.01 | ) | | (0.01 | ) | | — | | | (0.01 | ) |
| Net realized gains | | (0.65 | ) | | (0.28 | ) | | — | | | — | | | — | | | — | |
| Total distributions | | (0.65 | ) | | (0.28 | ) | | (0.01 | ) | | (0.01 | ) | | — | | | (0.01 | ) |
| Net asset value, end of period | $ | 7.72 | | $ | 8.25 | | $ | 7.44 | | $ | 6.10 | | $ | 6.20 | | $ | 5.00 | |
| |
| Total returnd | | 1.47 | % | | 14.99 | % | | 21.91 | % | | (1.48 | )% | | 24.00 | % | | 7.32 | % |
| |
| Ratios to average net assetse | | | | | | | | | | | | | | | | | | |
| Expenses before waiver and payments by | | | | | | | | | | | | | | | | | | |
| affiliates | | 1.54 | % | | 1.56 | % | | 1.59 | % | | 1.61 | % | | 1.61 | % | | 1.65 | % |
| Expenses net of waiver and payments by | | | | | | | | | | | | | | | | | | |
| affiliates | | 1.45 | % | | 1.45 | % | | 1.45 | % | | 1.45 | % | | 1.45 | % | | 1.45 | % |
| Net investment income (loss) | | (0.28 | )% | | (0.14 | )% | | 0.01 | % | | 0.06 | % | | (0.05 | )% | | 0.08 | % |
| |
| Supplemental data | | | | | | | | | | | | | | | | | | |
| Net assets, end of period (000’s) | $ | 14 | | $ | 14 | | $ | 24 | | $ | 15 | | $ | 12 | | $ | 8 | |
| Portfolio turnover rate | | 15.73 | % | | 50.39 | % | | 33.77 | % | | 21.88 | % | | 24.73 | % | | 35.55 | % |
aThe amount shown for a share outstanding throughout the period may not correlate with the Statement of Operations for the period due to the timing of sales and
repurchases of the Fund shares in relation to income earned and/or fluctuating fair value of the investments of the Fund.
bBased on average daily shares outstanding.
cAmount rounds to less than $0.01 per share.
dTotal return is not annualized for periods less than one year.
eRatios are annualized for periods less than one year.
franklintempleton.com The accompanying notes are an integral part of these financial statements. | Semiannual Report | 13
FRANKLIN GLOBAL TRUST
FINANCIAL HIGHLIGHTS
| | | | | | | | | | | | | | | | | | |
| Franklin Large Cap Equity Fund (continued) | | | | | | | | | | | | | | | | |
| | | Six Months Ended | | | | | | | | | | | | | | | | |
| | | January 31, 2015 | | | | | | | | | Year Ended July 31, | | | | |
| | | (unaudited) | | | 2014 | | | 2013 | | | 2012 | | | 2011 | | | 2010 | |
| Advisor Class | | | | | | | | | | | | | | | | | | |
| Per share operating performance | | | | | | | | | | | | | | | | | | |
| (for a share outstanding throughout the period) | | | | | | | | | | | | | | | | | | |
| Net asset value, beginning of period | $ | 8.31 | | $ | 7.47 | | $ | 6.12 | | $ | 6.22 | | $ | 5.01 | | $ | 4.67 | |
| Income from investment operationsa: | | | | | | | | | | | | | | | | | | |
| Net investment incomeb | | 0.01 | | | 0.03 | | | 0.03 | | | 0.03 | | | 0.03 | | | 0.03 | |
| Net realized and unrealized gains | | | | | | | | | | | | | | | | | | |
| (losses) | | 0.13 | | | 1.12 | | | 1.36 | | | (0.10 | ) | | 1.20 | | | 0.34 | |
| Total from investment operations | | 0.14 | | | 1.15 | | | 1.39 | | | (0.07 | ) | | 1.23 | | | 0.37 | |
| Less distributions from: | | | | | | | | | | | | | | | | | | |
| Net investment income | | (0.01 | ) | | (0.03 | ) | | (0.04 | ) | | (0.03 | ) | | (0.02 | ) | | (0.03 | ) |
| Net realized gains | | (0.65 | ) | | (0.28 | ) | | — | | | — | | | — | | | — | |
| Total distributions | | (0.66 | ) | | (0.31 | ) | | (0.04 | ) | | (0.03 | ) | | (0.02 | ) | | (0.03 | ) |
| Net asset value, end of period | $ | 7.79 | | $ | 8.31 | | $ | 7.47 | | $ | 6.12 | | $ | 6.22 | | $ | 5.01 | |
| |
| Total returnc | | 1.65 | % | | 15.59 | % | | 22.71 | % | | (1.07 | )% | | 24.63 | % | | 7.92 | % |
| |
| Ratios to average net assetsd | | | | | | | | | | | | | | | | | | |
| Expenses before waiver and payments by | | | | | | | | | | | | | | | | | | |
| affiliates | | 1.04 | % | | 1.06 | % | | 1.09 | % | | 1.11 | % | | 1.11 | % | | 1.15 | % |
| Expenses net of waiver and payments by | | | | | | | | | | | | | | | | | | |
| affiliates | | 0.95 | % | | 0.95 | % | | 0.95 | % | | 0.95 | % | | 0.95 | % | | 0.95 | % |
| Net investment income | | 0.22 | % | | 0.36 | % | | 0.51 | % | | 0.56 | % | | 0.45 | % | | 0.58 | % |
| |
| Supplemental data | | | | | | | | | | | | | | | | | | |
| Net assets, end of period (000’s) | $ | 177,469 | | $ | 147,173 | | $ | 105,558 | | $ | 86,143 | | $ | 84,930 | | $ | 61,560 | |
| Portfolio turnover rate | | 15.73 | % | | 50.39 | % | | 33.77 | % | | 21.88 | % | | 24.73 | % | | 35.55 | % |
aThe amount shown for a share outstanding throughout the period may not correlate with the Statement of Operations for the period due to the timing of sales and
repurchases of the Fund shares in relation to income earned and/or fluctuating fair value of the investments of the Fund.
bBased on average daily shares outstanding.
cTotal return is not annualized for periods less than one year.
dRatios are annualized for periods less than one year.
14 | Semiannual Report | The accompanying notes are an integral part of these financial statements. franklintempleton.com
| | | |
| | FRANKLIN GLOBAL TRUST |
| |
| |
| |
| Statement of Investments, January 31, 2015 (unaudited) | | | |
| |
| Franklin Large Cap Equity Fund | | | |
| | Shares | | Value |
| Common Stocks 96.1% | | | |
| Aerospace & Defense 4.6% | | | |
| Precision Castparts Corp. | 20,000 | $ | 4,002,000 |
| United Technologies Corp. | 45,000 | | 5,165,100 |
| | | | 9,167,100 |
| Auto Components 2.0% | | | |
| BorgWarner Inc. | 73,000 | | 3,942,730 |
| Banks 4.3% | | | |
| Bank of America Corp. | 200,000 | | 3,030,000 |
| JPMorgan Chase & Co. | 65,000 | | 3,534,700 |
| aSignature Bank | 16,000 | | 1,874,080 |
| | | | 8,438,780 |
| Beverages 2.0% | | | |
| Diageo PLC, ADR (United Kingdom) | 14,000 | | 1,653,820 |
| PepsiCo Inc. | 23,800 | | 2,231,964 |
| | | | 3,885,784 |
| Biotechnology 6.1% | | | |
| aCelgene Corp. | 37,000 | | 4,408,920 |
| aGilead Sciences Inc. | 43,000 | | 4,507,690 |
| aRegeneron Pharmaceuticals Inc. | 7,500 | | 3,124,950 |
| | | | 12,041,560 |
| Capital Markets 4.0% | | | |
| BlackRock Inc. | 12,000 | | 4,086,120 |
| Morgan Stanley | 110,000 | | 3,719,100 |
| | | | 7,805,220 |
| Chemicals 5.0% | | | |
| Cytec Industries Inc. | 62,000 | | 2,975,380 |
| The Dow Chemical Co. | 90,000 | | 4,064,400 |
| Praxair Inc. | 24,000 | | 2,894,160 |
| | | | 9,933,940 |
| Communications Equipment 1.9% | | | |
| QUALCOMM Inc. | 60,000 | | 3,747,600 |
| Consumer Finance 2.0% | | | |
| American Express Co. | 50,000 | | 4,034,500 |
| Electrical Equipment 2.8% | | | |
| AMETEK Inc. | 56,000 | | 2,682,400 |
| Rockwell Automation Inc. | 25,500 | | 2,777,460 |
| | | | 5,459,860 |
| Energy Equipment & Services 1.4% | | | |
| Schlumberger Ltd. | 33,000 | | 2,718,870 |
| Food & Staples Retailing 1.5% | | | |
| Costco Wholesale Corp. | 21,000 | | 3,002,790 |
| Food Products 1.4% | | | |
| Mondelez International Inc., A | 75,500 | | 2,660,620 |
| Health Care Equipment & Supplies 2.2% | | | |
| Abbott Laboratories | 99,000 | | 4,431,240 |
| |
| |
| franklintempleton.com | Semiannual Report | 15 |
FRANKLIN GLOBAL TRUST
STATEMENT OF INVESTMENTS (UNAUDITED)
| | | |
| Franklin Large Cap Equity Fund (continued) | | | |
| | Shares | | Value |
| Common Stocks (continued) | | | |
| Health Care Providers & Services 1.1% | | | |
| McKesson Corp. | 10,000 | $ | 2,126,500 |
| Health Care Technology 1.7% | | | |
| aCerner Corp. | 50,000 | | 3,317,500 |
| Hotels, Restaurants & Leisure 2.2% | | | |
| Starbucks Corp. | 50,000 | | 4,376,500 |
| Industrial Conglomerates 1.7% | | | |
| Danaher Corp. | 41,000 | | 3,377,580 |
| Insurance 3.1% | | | |
| ACE Ltd. | 30,000 | | 3,238,800 |
| MetLife Inc. | 60,000 | | 2,790,000 |
| | | | 6,028,800 |
| Internet & Catalog Retail 2.3% | | | |
| aAmazon.com Inc. | 13,000 | | 4,608,890 |
| Internet Software & Services 4.3% | | | |
| aFacebook Inc., A | 40,000 | | 3,036,400 |
| aGoogle Inc., A | 2,000 | | 1,075,100 |
| aGoogle Inc., C | 8,000 | | 4,276,160 |
| | | | 8,387,660 |
| IT Services 2.0% | | | |
| MasterCard Inc., A | 47,000 | | 3,855,410 |
| Leisure Products 1.6% | | | |
| Polaris Industries Inc. | 22,000 | | 3,180,980 |
| Life Sciences Tools & Services 1.2% | | | |
| aQuintiles Transnational Holdings Inc. | 40,000 | | 2,420,000 |
| Machinery 1.6% | | | |
| Cummins Inc. | 22,900 | | 3,193,634 |
| Media 3.7% | | | |
| Comcast Corp., A | 70,000 | | 3,720,150 |
| The Walt Disney Co. | 40,000 | | 3,638,400 |
| | | | 7,358,550 |
| Oil, Gas & Consumable Fuels 7.2% | | | |
| Anadarko Petroleum Corp. | 43,000 | | 3,515,250 |
| Cabot Oil & Gas Corp., A | 85,000 | | 2,252,500 |
| Chevron Corp. | 47,000 | | 4,818,910 |
| Marathon Oil Corp. | 69,900 | | 1,859,340 |
| Royal Dutch Shell PLC, A, ADR (United Kingdom) | 30,000 | | 1,843,500 |
| | | | 14,289,500 |
| Pharmaceuticals 2.4% | | | |
| Novo Nordisk AS, ADR (Denmark) | 45,000 | | 2,005,200 |
| Roche Holding AG, ADR (Switzerland) | 80,000 | | 2,700,800 |
| | | | 4,706,000 |
| Real Estate Investment Trusts (REITs) 1.2% | | | |
| American Tower Corp. | 25,000 | | 2,423,750 |
16 | Semiannual Report franklintempleton.com
FRANKLIN GLOBAL TRUST
STATEMENT OF INVESTMENTS (UNAUDITED)
| | | |
| Franklin Large Cap Equity Fund (continued) | | | |
| | Shares | | Value |
| Common Stocks (continued) | | | |
| Road & Rail 1.0% | | | |
| Union Pacific Corp. | 17,000 | $ | 1,992,570 |
| Semiconductors & Semiconductor Equipment 2.8% | | | |
| Lam Research Corp. | 30,000 | | 2,293,200 |
| Microchip Technology Inc. | 70,000 | | 3,157,000 |
| | | | 5,450,200 |
| Software 4.3% | | | |
| aFortinet Inc. | 67,000 | | 2,002,965 |
| aRed Hat Inc. | 40,000 | | 2,551,600 |
| aSalesforce.com Inc. | 70,000 | | 3,951,500 |
| | | | 8,506,065 |
| Specialty Retail 2.7% | | | |
| Lowe’s Cos. Inc. | 60,000 | | 4,065,600 |
| The TJX Cos. Inc. | 20,000 | | 1,318,800 |
| | | | 5,384,400 |
| Technology Hardware, Storage & Peripherals 4.7% | | | |
| Apple Inc. | 62,500 | | 7,322,500 |
| aStratasys Ltd. | 25,000 | | 1,987,250 |
| | | | 9,309,750 |
| Textiles, Apparel & Luxury Goods 2.1% | | | |
| NIKE Inc., B | 44,700 | | 4,123,575 |
| Total Common Stocks (Cost $153,937,136) | | | 189,688,408 |
| Short Term Investments (Cost $7,632,026) 3.9% | | | |
| Money Market Funds 3.9% | | | |
| a,bInstitutional Fiduciary Trust Money Market Portfolio | 7,632,026 | | 7,632,026 |
| Total Investments (Cost $161,569,162) 100.0% | | | 197,320,434 |
| Other Assets, less Liabilities 0.0%† | | | 48,776 |
| Net Assets 100.0% | | $ | 197,369,210 |
See Abbreviations on page 27.
†Rounds to less than 0.1% of net assets.
aNon-income producing.
bSee Note 3(f) regarding investments in Institutional Fiduciary Trust Money Market Portfolio.
franklintempleton.com The accompanying notes are an integral part of these financial statements. | Semiannual Report | 17
| | |
| FRANKLIN GLOBAL TRUST | | |
| |
| |
| |
| |
| Financial Statements | | |
| |
| Statement of Assets and Liabilities | | |
| January 31, 2015 (unaudited) | | |
| |
| Franklin Large Cap Equity Fund | | |
| |
| Assets: | | |
| Investments in securities: | | |
| Cost - Unaffiliated issuers | $ | 153,937,136 |
| Cost - Sweep Money Fund (Note 3f) | | 7,632,026 |
| Total cost of investments | $ | 161,569,162 |
| Value - Unaffiliated issuers | $ | 189,688,408 |
| Value - Sweep Money Fund (Note 3f) | | 7,632,026 |
| Total value of investments | | 197,320,434 |
| Receivables: | | |
| Capital shares sold | | 85,694 |
| Dividends | | 130,449 |
| Other assets | | 19,068 |
| Total assets | | 197,555,645 |
| Liabilities: | | |
| Payables: | | |
| Capital shares redeemed | | 5,490 |
| Management fees | | 145,340 |
| Distribution fees | | 7,253 |
| Transfer agent fees | | 4,716 |
| Professional fees | | 14,870 |
| Accrued expenses and other liabilities | | 8,766 |
| Total liabilities | | 186,435 |
| Net assets, at value | $ | 197,369,210 |
| Net assets consist of: | | |
| Paid-in capital | $ | 161,115,641 |
| Undistributed net investment income | | 71,130 |
| Net unrealized appreciation (depreciation) | | 35,750,675 |
| Accumulated net realized gain (loss) | | 431,764 |
| Net assets, at value | $ | 197,369,210 |
18 | Semiannual Report | The accompanying notes are an integral part of these financial statements. franklintempleton.com
FRANKLIN GLOBAL TRUST
FINANCIAL STATEMENTS
| | |
| Statement of Assets and Liabilities (continued) | | |
| January 31, 2015 (unaudited) | | |
| |
| Franklin Large Cap Equity Fund | | |
| |
| Class A: | | |
| Net assets, at value | $ | 16,073,830 |
| Shares outstanding | | 2,080,337 |
| Net asset value per sharea | $ | 7.73 |
| Maximum offering price per share (net asset value per share ÷ 94.25%) | $ | 8.20 |
| Class C: | | |
| Net assets, at value | $ | 3,813,140 |
| Shares outstanding | | 507,415 |
| Net asset value and maximum offering price per sharea | $ | 7.51 |
| Class R: | | |
| Net assets, at value | $ | 13,740 |
| Shares outstanding | | 1,781 |
| Net asset value and maximum offering price per shareb | $ | 7.72 |
| Advisor Class: | | |
| Net assets, at value | $ | 177,468,500 |
| Shares outstanding | | 22,791,965 |
| Net asset value and maximum offering price per share | $ | 7.79 |
aRedemption price is equal to net asset value less contingent deferred sales charges, if applicable.
bNet asset value and maximum offering price may not recalculate due to rounding of net assets and/or shares outstanding.
franklintempleton.com The accompanying notes are an integral part of these financial statements. | Semiannual Report | 19
FRANKLIN GLOBAL TRUST
FINANCIAL STATEMENTS
| | | |
| Statement of Operations | | | |
| for the six months ended January 31, 2015 (unaudited) | | | |
| |
| Franklin Large Cap Equity Fund | | | |
| |
| Investment income: | | | |
| Dividends | $ | 1,091,648 | |
| Expenses: | | | |
| Management fees (Note 3a) | | 885,631 | |
| Distribution fees: (Note 3c) | | | |
| Class A | | 21,694 | |
| Class C | | 18,288 | |
| Class R | | 36 | |
| Transfer agent fees: (Note 3e) | | | |
| Class A | | 1,584 | |
| Class C | | 395 | |
| Class R | | 2 | |
| Advisor Class | | 18,169 | |
| Custodian fees (Note 4) | | 733 | |
| Reports to shareholders | | 10,784 | |
| Registration and filing fees | | 28,555 | |
| Professional fees | | 18,626 | |
| Trustees’ fees and expenses | | 2,715 | |
| Other | | 4,518 | |
| Total expenses | | 1,011,730 | |
| Expenses waived/paid by affiliates (Note 3f and 3g) | | (85,658 | ) |
| Net expenses | | 926,072 | |
| Net investment income | | 165,576 | |
| Realized and unrealized gains (losses): | | | |
| Net realized gain (loss) from: | | | |
| Investments | | 434,923 | |
| Foreign currency transactions | | (1,302 | ) |
| Net realized gain (loss) | | 433,621 | |
| Net change in unrealized appreciation (depreciation) on: | | | |
| Investments | | 1,540,148 | |
| Translation of other assets and liabilities denominated in foreign currencies | | (834 | ) |
| Net change in unrealized appreciation (depreciation) | | 1,539,314 | |
| Net realized and unrealized gain (loss) | | 1,972,935 | |
| Net increase (decrease) in net assets resulting from operations | $ | 2,138,511 | |
20 | Semiannual Report | The accompanying notes are an integral part of these financial statements. franklintempleton.com
| | | | | | |
| | | FRANKLIN GLOBAL TRUST | |
| | | FINANCIAL STATEMENTS | |
| |
| |
| Statements of Changes in Net Assets | | | | | | |
| |
| |
| Franklin Large Cap Equity Fund | | | | | | |
| |
| | | Six Months Ended | | | | |
| | | January 31, 2015 | | | Year Ended | |
| | | (unaudited) | | | July 31, 2014 | |
| Increase (decrease) in net assets: | | | | | | |
| Operations: | | | | | | |
| Net investment income | $ | 165,576 | | $ | 438,701 | |
| Net realized gain (loss) from investments and foreign currency transactions | | 433,621 | | | 17,131,009 | |
| Net change in unrealized appreciation (depreciation) on investments and translation of other | | | | | | |
| assets and liabilities denominated in foreign currencies | | 1,539,314 | | | 1,266,324 | |
| Net increase (decrease) in net assets resulting from operations | | 2,138,511 | | | 18,836,034 | |
| Distributions to shareholders from: | | | | | | |
| Net investment income: | | | | | | |
| Class A | | — | | | (10,101 | ) |
| Class R | | — | | | (7 | ) |
| Advisor Class | | (94,446 | ) | | (473,652 | ) |
| Net realized gains: | | | | | | |
| Class A | | (1,173,870 | ) | | (338,811 | ) |
| Class C | | (287,867 | ) | | (97,094 | ) |
| Class R | | (1,112 | ) | | (464 | ) |
| Advisor Class | | (13,297,929 | ) | | (4,023,670 | ) |
| Total distributions to shareholders | | (14,855,224 | ) | | (4,943,799 | ) |
| Capital share transactions: (Note 2) | | | | | | |
| Class A | | 4,319,823 | | | 2,847,370 | |
| Class C | | 739,959 | | | 856,045 | |
| Class R | | 513 | | | (11,542 | ) |
| Advisor Class | | 41,712,820 | | | 29,022,103 | |
| Total capital share transactions | | 46,773,115 | | | 32,713,976 | |
| Net increase (decrease) in net assets | | 34,056,402 | | | 46,606,211 | |
| Net assets: | | | | | | |
| Beginning of period | | 163,312,808 | | | 116,706,597 | |
| End of period | $ | 197,369,210 | | $ | 163,312,808 | |
| Undistributed net investment income included in net assets: | | | | | | |
| End of period | $ | 71,130 | | $ | — | |
franklintempleton.com The accompanying notes are an integral part of these financial statements. | Semiannual Report | 21
FRANKLIN GLOBAL TRUST
Notes to Financial Statements (unaudited)
Franklin Large Cap Equity Fund
1. Organization and Significant Accounting Policies
Franklin Global Trust (Trust) is registered under the Investment Company Act of 1940, as amended, (1940 Act) as an open-end management investment company, consisting of six separate funds and applies the specialized accounting and reporting guidance in U.S. Generally Accepted Accounting Principles (U.S. GAAP). The Franklin Large Cap Equity Fund (Fund) is included in this report. The financial statements of the remaining funds in the Trust are presented separately. The Fund offers four classes of shares: Class A, Class C, Class R, and Advisor Class. Each class of shares differs by its initial sales load, contingent deferred sales charges, voting rights on matters affecting a single class, its exchange privilege and fees primarily due to differing arrangements for distribution and transfer agent fees.
The following summarizes the Fund’s significant accounting policies.
a. Financial Instrument Valuation
The Fund’s investments in financial instruments are carried at fair value daily. Fair value is the price that would be received to sell an asset or paid to transfer a liability in an orderly transaction between market participants on the measurement date. The Fund calculates the net asset value (NAV) per share at the close of the New York Stock Exchange (NYSE), generally at 4 p.m. Eastern time (NYSE close) on each day the NYSE is open for trading. Under compliance policies and procedures approved by the Trust’s Board of Trustees (the Board), the Fund’s administrator has responsibility for oversight of valuation, including leading the cross-functional Valuation and Liquidity Oversight Committee (VLOC). The VLOC provides administration and oversight of the Fund’s valuation policies and procedures, which are approved annually by the Board. Among other things, these procedures allow the Fund to utilize independent pricing services, quotations from securities and financial instrument dealers, and other market sources to determine fair value.
Equity securities listed on an exchange or on the NASDAQ National Market System are valued at the last quoted sale price or the official closing price of the day, respectively. Foreign equity securities are valued as of the close of trading on the foreign stock exchange on which the security is primarily traded or as of the NYSE close, whichever is earlier. The value is then converted into its U.S. dollar equivalent at the foreign exchange rate in effect at the NYSE close on the day that the value of the security is determined. Over-the-counter (OTC) securities are valued within the range of the most recent quoted bid and ask prices. Securities that trade in multiple markets or on multiple exchanges are valued according to the broadest and most representative market. Certain equity securities are valued based upon fundamental characteristics or relationships to similar securities. Investments in open-end mutual funds are valued at the closing NAV.
The Fund has procedures to determine the fair value of financial instruments for which market prices are not reliable or readily available. Under these procedures, the VLOC convenes on a regular basis to review such financial instruments and considers a number of factors, including significant unobservable valuation inputs, when arriving at fair value. The VLOC primarily employs a market-based approach which may use related or comparable assets or liabilities, recent transactions, market multiples, book values, and other relevant information for the investment to determine the fair value of the investment. An income-based valuation approach may also be used in which the anticipated future cash flows of the investment are discounted to calculate fair value. Discounts may also be applied due to the nature or duration of any restrictions on the disposition of the investments. Due to the inherent uncertainty of valuations of such investments, the fair values may differ significantly from the values that would have been used had an active market existed. The VLOC employs various methods for calibrating these valuation approaches including a regular review of key inputs and assumptions, transactional back-testing or disposition analysis, and reviews of any related market activity.
Trading in securities on foreign securities stock exchanges and OTC markets may be completed before the daily NYSE close. In addition, trading in certain foreign markets may not take place on every NYSE business day. Occasionally, events occur between the time at which trading in a foreign security is completed and the close of the NYSE that might call into question the reliability of the value of a portfolio security held by the Fund. As a result, differences may arise between the value of the Fund’s portfolio securities as determined at the foreign market close and the latest indications of value at the close of the NYSE. In order to minimize the potential for these differences, the VLOC monitors price movements following the close of trading in foreign stock markets through a series of country specific market proxies (such as baskets of American Depositary Receipts, futures contracts and exchange traded
22 | Semiannual Report
franklintempleton.com
FRANKLIN GLOBAL TRUST
NOTES TO FINANCIAL STATEMENTS (UNAUDITED)
Franklin Large Cap Equity Fund (continued)
funds). These price movements are measured against established trigger thresholds for each specific market proxy to assist in determining if an event has occurred that may call into question the reliability of the values of the foreign securities held by the Fund. If such an event occurs, the securities may be valued using fair value procedures, which may include the use of independent pricing services.
When the last day of the reporting period is a non-business day, certain foreign markets may be open on those days that the NYSE is closed, which could result in differences between the value of the Fund’s portfolio securities on the last business day and the last calendar day of the reporting period. Any significant security valuation changes due to an open foreign market are adjusted and reflected by the Fund for financial reporting purposes.
b. Foreign Currency Translation
Portfolio securities and other assets and liabilities denominated in foreign currencies are translated into U.S. dollars based on the exchange rate of such currencies against U.S. dollars on the date of valuation. The Fund may enter into foreign currency exchange contracts to facilitate transactions denominated in a foreign currency. Purchases and sales of securities, income and expense items denominated in foreign currencies are translated into U.S. dollars at the exchange rate in effect on the transaction date. Portfolio securities and assets and liabilities denominated in foreign currencies contain risks that those currencies will decline in value relative to the U.S. dollar. Occasionally, events may impact the availability or reliability of foreign exchange rates used to convert the U.S. dollar equivalent value. If such an event occurs, the foreign exchange rate will be valued at fair value using procedures established and approved by the Board.
The Fund does not separately report the effect of changes in foreign exchange rates from changes in market prices on securities held. Such changes are included in net realized and unrealized gain or loss from investments in the Statement of Operations.
Realized foreign exchange gains or losses arise from sales of foreign currencies, currency gains or losses realized between the trade and settlement dates on securities transactions and the difference between the recorded amounts of dividends, interest, and foreign withholding taxes and the U.S. dollar equivalent of the amounts actually received or paid. Net unrealized foreign exchange gains and losses arise from changes in foreign exchange rates on foreign denominated assets and liabilities other than investments in securities held at the end of the reporting period.
c. Income and Deferred Taxes
It is the Fund’s policy to qualify as a regulated investment company under the Internal Revenue Code. The Fund intends to distribute to shareholders substantially all of its taxable income and net realized gains to relieve it from federal income and excise taxes. As a result, no provision for U.S. federal income taxes is required.
The Fund may be subject to foreign taxation related to income received, capital gains on the sale of securities and certain foreign currency transactions in the foreign jurisdictions in which it invests. Foreign taxes, if any, are recorded based on the tax regulations and rates that exist in the foreign markets in which the Fund invests. When a capital gain tax is determined to apply the Fund records an estimated deferred tax liability in an amount that would be payable if the securities were disposed of on the valuation date.
The Fund recognizes the tax benefits of uncertain tax positions only when the position is “more likely than not” to be sustained upon examination by the tax authorities based on the technical merits of the tax position. As of January 31, 2015, and for all open tax years, the Fund has determined that no liability for unrecognized tax benefits is required in the Fund’s financial statements related to uncertain tax positions taken on a tax return (or expected to be taken on future tax returns). Open tax years are those that remain subject to examination and are based on each tax jurisdiction statute of limitation.
d. Security Transactions, Investment Income, Expenses and Distributions
Security transactions are accounted for on trade date. Realized gains and losses on security transactions are determined on a specific identification basis. Estimated expenses are accrued daily. Dividend income is recorded on the ex-dividend date except for certain dividends from foreign securities where the dividend rate is not available. In such cases, the dividend is recorded as soon as the information is received by the Fund. Distributions to shareholders are recorded on the ex-dividend date and are determined according to income tax regulations (tax basis). Distributable earnings determined on a tax basis may differ from earnings recorded in accordance with U.S. GAAP. These differences may be permanent or temporary.
franklintempleton.com Semiannual Report | 23
FRANKLIN GLOBAL TRUST
NOTES TO FINANCIAL STATEMENTS (UNAUDITED)
Franklin Large Cap Equity Fund (continued)
1. Organization and Significant Accounting
Policies (continued)
d. Security Transactions, Investment Income, Expenses and Distributions (continued)
Permanent differences are reclassified among capital accounts to reflect their tax character. These reclassifications have no impact on net assets or the results of operations. Temporary differences are not reclassified, as they may reverse in subsequent periods.
Common expenses incurred by the Trust are allocated among the funds based on the ratio of net assets of each fund to the combined net assets of the Trust. Fund specific expenses are charged directly to the fund that incurred the expense.
Realized and unrealized gains and losses and net investment income, not including class specific expenses, are allocated daily to each class of shares based upon the relative proportion of net assets of each class. Differences in per share distributions, by class, are generally due to differences in class specific expenses.
e. Accounting Estimates
The preparation of financial statements in accordance with U.S. GAAP requires management to make estimates and assumptions that affect the reported amounts of assets and liabilities at the date of the financial statements and the amounts of income and expenses during the reporting period. Actual results could differ from those estimates.
f. Guarantees and Indemnifications
Under the Trust’s organizational documents, its officers and trustees are indemnified by the Trust against certain liabilities arising out of the performance of their duties to the Trust. Additionally, in the normal course of business, the Trust, on behalf of the Fund, enters into contracts with service providers that contain general indemnification clauses. The Trust’s maximum exposure under these arrangements is unknown as this would involve future claims that may be made against the Trust that have not yet occurred. Currently, the Trust expects the risk of loss to be remote.
2. Shares of Beneficial Interest
At January 31, 2015, there were an unlimited number of shares authorized (without par value). Transactions in the Fund’s shares were as follows:
| | | | | | | | | | | | |
| | Six Months Ended | | Year Ended | | |
| | January 31, 2015 | | July 31, 2014 | |
| | Shares | | | Amount | | Shares | | | Amount | |
| |
| Class A Shares: | | | | | | | | | | | | |
| Shares sold | 690,009 | | $ | 5,697,211 | | 678,515 | | $ | 5,462,595 | |
| Shares issued in reinvestment of distributions | 142,769 | | | | 1,099,321 | | 44,599 | | | | 346,978 | |
| Shares redeemed | (302,524 | ) | | (2,476,709 | ) | (373,139 | ) | | (2,962,203 | ) |
| Net increase (decrease) | 530,254 | | $ | 4,319,823 | | 349,975 | | $ | 2,847,370 | |
| |
| Class C Shares: | | | | | | | | | | | | |
| Shares sold | 117,598 | | | $ | 944,421 | | 214,660 | | $ | 1,678,766 | |
| Shares issued in reinvestment of distributions | 37,910 | | | | 283,944 | | 12,374 | | | | 94,540 | |
| Shares redeemed | (60,462 | ) | | | (488,406 | ) | (117,441 | ) | | (917,261 | ) |
| Net increase (decrease) | 95,046 | | | $ | 739,959 | | 109,593 | | | $ | 856,045 | |
| |
| Class R Shares: | | | | | | | | | | | | |
| Shares issued in reinvestment of distributions | 67 | | | $ | 513 | | 28 | | | $ | 215 | |
| Shares redeemed | — | | | | — | | (1,539 | ) | | | (11,757 | ) |
| Net increase (decrease) | 67 | | | $ | 513 | | (1,511 | ) | | $ | (11,542 | ) |
| |
| Advisor Class Shares: | | | | | | | | | | | | |
| Shares sold | 4,124,455 | | $ | 34,740,196 | | 4,211,343 | | $ | 34,142,365 | |
| Shares issued in reinvestment of distributions | 1,648,718 | | | 12,777,930 | | 492,902 | | | 3,859,949 | |
| Shares redeemed | (695,861 | ) | | (5,805,306 | ) | (1,120,683 | ) | | (8,980,211 | ) |
| Net increase (decrease) | 5,077,312 | | $ | 41,712,820 | | 3,583,562 | | $ | 29,022,103 | |
| |
| 24 | Semiannual Report | | | | | | | franklintempleton.com | |
FRANKLIN GLOBAL TRUST
NOTES TO FINANCIAL STATEMENTS (UNAUDITED)
Franklin Large Cap Equity Fund (continued)
3. Transactions with Affiliates
Franklin Resources, Inc. is the holding company for various subsidiaries that together are referred to as Franklin Templeton Investments. Certain officers and trustees of the Trust are also officers and/or directors of the following subsidiaries:
| |
| Subsidiary | Affiliation |
| Fiduciary International, Inc. (Fiduciary) | Investment manager |
| Franklin Templeton Services, LLC (FT Services) | Administrative manager |
| Franklin Templeton Distributors, Inc. (Distributors) | Principal underwriter |
| Franklin Templeton Investor Services, LLC (Investor Services) | Transfer agent |
a. Management Fees
The Fund pays an investment management fee to Fiduciary based on the average daily net assets of the Fund as follows:
| |
| Annualized Fee Rate | Net Assets |
| 0.950% | Up to and including $500 million |
| 0.850% | Over $500 million, up to and including $1 billion |
| 0.800% | Over $1 billion, up to and including $1.5 billion |
| 0.750% | Over $1.5 billion, up to and including $6.5 billion |
| 0.730% | Over $6.5 billion, up to and including $11.5 billion |
| 0.700% | In excess of $11.5 billion |
b. Administrative Fees
Under an agreement with Fiduciary, FT Services provides administrative services to the Fund. The fee is paid by Fiduciary based on the Fund’s average daily net assets, and is not an additional expense of the Fund.
c. Distribution Fees
The Board has adopted distribution plans for each share class, with the exception of Advisor Class shares, pursuant to Rule 12b-1 under the 1940 Act. Distribution fees are not charged on shares held by affiliates. Under the Fund’s Class A reimbursement distribution plan, the Fund reimburses Distributors for costs incurred in connection with the servicing, sale and distribution of the Fund’s shares up to the maximum annual plan rate. Under the Class A reimbursement distribution plan, costs exceeding the maximum for the current plan year cannot be reimbursed in subsequent periods. In addition, under the Fund’s Class C and R compensation distribution plans, the Fund pays Distributors for costs incurred in connection with the servicing, sale and distribution of the Fund’s shares up to the maximum annual plan rate for each class. The plan year, for purposes of monitoring compliance with the maximum annual plan rates, is February 1 through January 31.
The maximum annual plan rates, based on the average daily net assets, for each class, are as follows:
| | |
| Reimbursement Plan: | | |
| Class A | 0.35 | % |
| Compensation Plans: | | |
| Class C | 1.00 | % |
| Class R | 0.50 | % |
The Board has set the current rate at 0.30% per year for Class A shares until further notice and approval by the Board.
franklintempleton.com
Semiannual Report | 25
FRANKLIN GLOBAL TRUST
NOTES TO FINANCIAL STATEMENTS (UNAUDITED)
Franklin Large Cap Equity Fund (continued)
3. Transactions with Affiliates (continued)
d. Sales Charges/Underwriting Agreements
Front-end sales charges and contingent deferred sales charges (CDSC) do not represent expenses of the Fund. These charges are deducted from the proceeds of sales of Fund shares prior to investment or from redemption proceeds prior to remittance, as applicable. Distributors has advised the Fund of the following commission transactions related to the sales and redemptions of the Fund’s shares for the period:
| | |
| Sales charges retained net of commissions paid to unaffiliated broker/dealers | $ | 12,346 |
| CDSC retained | $ | 277 |
e. Transfer Agent Fees
Each class of shares pays transfer agent fees to Investor Services for its performance of shareholder servicing obligations and reimburses Investor Services for out of pocket expenses incurred, including shareholding servicing fees paid to third parties. These fees are allocated daily based upon their relative proportion of such classes’ aggregate net assets.
For the period ended January 31, 2015, the Fund paid transfer agent fees of $20,150, of which $13,130 was retained by Investor Services.
f. Investments in Institutional Fiduciary Trust Money Market Portfolio
The Fund invests in Institutional Fiduciary Trust Money Market Portfolio (Sweep Money Fund), an affiliated open-end management investment company. Management fees paid by the Fund are waived on assets invested in the Sweep Money Fund, as noted in the Statement of Operations, in an amount not to exceed the management and administrative fees paid directly or indirectly by the Sweep Money Fund. Prior to August 1, 2013, the waiver was accounted for as a reduction to management fees.
g. Waiver and Expense Reimbursements
Fiduciary has contractually agreed in advance to waive or limit its fees and to assume as its own expense certain expenses otherwise payable by the Fund so that the expenses (excluding distribution fees and acquired fund fees and expenses) for each class of the Fund do not exceed 0.95% (other than certain non-routine expenses or costs, including those relating to litigation, indemnification, reorganizations, and liquidations) until November 30, 2016.
4. Expense Offset Arrangement
The Fund has entered into an arrangement with its custodian whereby credits realized as a result of uninvested cash balances are used to reduce a portion of the Fund’s custodian expenses. During the period ended January 31, 2015, there were no credits earned.
5. Income Taxes
At January 31, 2015, the cost of investments and net unrealized appreciation (depreciation) for income tax purposes were as follows:
| | | |
| Cost of investments | $ | 161,591,359 | |
| |
| Unrealized appreciation | $ | 39,642,558 | |
| Unrealized depreciation | | (3,913,483 | ) |
| Net unrealized appreciation (depreciation) | $ | 35,729,075 | |
Differences between income and/or capital gains as determined on a book basis and a tax basis are primarily due to differing treatments of foreign currency transactions.
26 | Semiannual Report
franklintempleton.com
FRANKLIN GLOBAL TRUST
NOTES TO FINANCIAL STATEMENTS (UNAUDITED)
Franklin Large Cap Equity Fund (continued)
6. Investment Transactions
Purchases and sales of investments (excluding short term securities) for the period ended January 31, 2015, aggregated $58,204,570 and $27,870,633 respectively.
7. Credit Facility
The Fund, together with other U.S. registered and foreign investment funds (collectively, Borrowers), managed by Franklin Templeton Investments, are borrowers in a joint syndicated senior unsecured credit facility totaling $1.5 billion (Global Credit Facility) which matured on February 13, 2015. This Global Credit Facility provides a source of funds to the Borrowers for temporary and emergency purposes, including the ability to meet future unanticipated or unusually large redemption requests. Effective February 13, 2015, the Borrowers renewed the Global Credit Facility for a one year term, maturing February 12, 2016, for a total of $2 billion.
Under the terms of the Global Credit Facility, the Fund shall, in addition to interest charged on any borrowings made by the Fund and other costs incurred by the Fund, pay its share of fees and expenses incurred in connection with the implementation and maintenance of the Global Credit Facility, based upon its relative share of the aggregate net assets of all of the Borrowers, including an annual commitment fee of 0.07% based upon the unused portion of the Global Credit Facility. These fees are reflected in other expenses in the Statement of Operations. During the period ended January 31, 2015, the Fund did not use the Global Credit Facility.
8. Fair Value Measurements
The Fund follows a fair value hierarchy that distinguishes between market data obtained from independent sources (observable inputs) and the Fund’s own market assumptions (unobservable inputs). These inputs are used in determining the value of the Fund’s financial instruments and are summarized in the following fair value hierarchy:
- Level 1 – quoted prices in active markets for identical financial instruments
- Level 2 – other significant observable inputs (including quoted prices for similar financial instruments, interest rates, prepayment speed, credit risk, etc.)
- Level 3 – significant unobservable inputs (including the Fund’s own assumptions in determining the fair value of financial instruments)
The input levels are not necessarily an indication of the risk or liquidity associated with financial instruments at that level.
For movements between the levels within the fair value hierarchy, the Fund has adopted a policy of recognizing the transfers as of the date of the underlying event which caused the movement.
At January 31, 2015, all of the Fund’s investments in financial instruments carried at fair value were valued using Level 1 inputs.
For detailed categories, see the accompanying Statement of Investments.
9. Subsequent Events
The Fund has evaluated subsequent events through the issuance of the financial statements and determined that no events have occurred that require disclosure other than those already disclosed in the financial statements.
| |
| Abbreviations |
| Selected Portfolio |
| ADR | American Depositary Receipt |
| REIT | Real Estate Investment Trust |
franklintempleton.com Semiannual Report | 27
FRANKLIN GLOBAL TRUST
FRANKLIN LARGE CAP EQUITY FUND
Shareholder Information
Proxy Voting Policies and Procedures
The Trust’s investment manager has established Proxy Voting Policies and Procedures (Policies) that the Trust uses to determine how to vote proxies relating to portfolio securities. Shareholders may view the Trust’s complete Policies online at franklintempleton.com. Alternatively, shareholders may request copies of the Policies free of charge by calling the Proxy Group collect at (954) 527-7678 or by sending a written request to: Franklin Templeton Companies, LLC, 300 S.E. 2nd Street, Fort Lauderdale, FL 33301, Attention: Proxy Group. Copies of the Trust’s proxy voting records are also made available online at franklintempleton.com and posted on the U.S. Securities and Exchange Commission’s website at sec.gov and reflect the most recent 12-month period ended June 30.
Quarterly Statement of Investments
The Trust files a complete statement of investments with the U.S. Securities and Exchange Commission for the first and third quarters for each fiscal year on Form N-Q. Shareholders may view the filed Form N-Q by visiting the Commission’s website at sec.gov. The filed form may also be viewed and copied at the Commission’s Public Reference Room in Washington, DC. Information regarding the operations of the Public Reference Room may be obtained by calling (800) SEC-0330.
28 | Semiannual Report franklintempleton.com
| |
| Contents | |
| |
| Semiannual Report | |
| Franklin Emerging Market | |
| Debt Opportunities Fund | 1 |
| Performance Summary | 5 |
| Your Fund’s Expenses | 7 |
| Consolidated Financial Highlights | |
| and Consolidated Statement of | |
| Investments | 8 |
| Consolidated Financial Statements | 15 |
| Notes to Consolidated | |
| Financial Statements | 18 |
| Shareholder Information | 29 |
Semiannual Report
Franklin Emerging Market
Debt Opportunities Fund
(formerly, Franklin Templeton Emerging Market Debt Opportunities Fund)
This semiannual report for Franklin Emerging Market Debt Opportunities Fund covers the period ended January 31, 2015.
Your Fund’s Goal and Main Investments
The Fund seeks high total return through investing in debt securities of emerging market countries, mainly securities issued by sovereign and subsovereign government entities, but also including securities issued by corporate entities.
Performance Overview
The Fund had a -7.11% cumulative total return for the six months under review. In comparison, the J.P. Morgan (JPM) Emerging Markets Bond Index (EMBI) Global Diversified Index, which tracks total returns for U.S. dollar-denominated debt instruments issued by emerging market sovereign and quasi-sovereign entities, had a -0.61% total return,1 and the Fund’s second benchmark, the JPM Government Bond Index-Emerging Markets (GBI-EM) Broad Diversified Index (US$ Unhedged), which tracks local currency bonds issued in emerging markets, had a -6.49% total return.2 Also for comparison, the Fund’s third benchmark, the Bank of America Merrill Lynch (BofAML) Emerging Markets Corporate Plus (EMCB) Index (100% US$ Hedged), which tracks the performance of U.S. dollar-denominated and euro-denominated emerging market non-sovereign debt publicly issued within the major domestic and Eurobond markets, had a -2.06% return.1 You can find more performance data in the Performance Summary beginning on page 5.
Performance data represent past performance, which does not guarantee future results. Investment return and principal value will fluctuate, and you may have a gain or loss when you sell your shares. Current performance may differ from figures shown. For most recent month-end performance, go to ftinstitutional.com or call a Franklin Templeton Institutional Services representative at (800) 321-8563.
Economic and Market Overview
The performance of the various categories of emerging market (EM) debt varied widely during the six-month reporting period. U.S. dollar-denominated EM sovereign bonds delivered slightly negative total returns, as rising risk aversion was largely offset by a significant decline in U.S. Treasury yields. U.S. dollar- and euro-denominated
1. Source: Morningstar.
2. Source: J.P. Morgan.
The indexes are unmanaged and include reinvested interest. One cannot invest directly in an index and an index
is not representative of the Fund’s portfolio.
The dollar value, number of shares or principal amount, and names of all portfolio holdings are listed in
the Fund’s Consolidated Statement of Investments (SOI). The Consolidated SOI begins on page 9.
Not FDIC Insured | May Lose Value | No Bank Guarantee
ftinstitutional.com Semiannual Report | 1
FRANKLIN EMERGING MARKET DEBT OPPORTUNITIES FUND
| | | | | | |
| Portfolio Breakdown* | | | | | |
| Based on Total Net Assets as of 1/31/15 | | | | | |
| Foreign Government & | | | | | 42.4 | % |
| Agency Securities | | | | | | |
| Quasi-Sovereign & | | | 27.3 | % | | |
| Corporate Bonds | | | | | | |
| Loan Participations & | 14.7 | % | | | | |
| Assignments | | | | | | |
| Warrants | 2.4 | % | | | | |
| Private Limited | 0.1 | % | | | | |
| Partnership Fund | | | | | | |
| Credit-Linked Notes | 0.0 | %** | | | | |
| Common Stocks*** | 0.0 | % | | | | |
| Short-Term Investments & | | | | | | |
| Other Net Assets | 13.1 | % | | | | |
*Figures reflect certain derivatives held in the portfolio (or their underlying reference
assets) and may not total 100% or may be negative due to rounding, use of
derivatives, unsettled trades or other factors.
**Rounds to less than 0.1%.
***Includes securities determined to have no value at 1/31/15.
EM corporate bonds, however, fared worse than their sovereign counterparts, undermined by the relatively poor performance of Brazilian and Russian companies during the period, which accounted for a sizable weighting in the Fund’s EM corporate debt benchmark. Furthermore, the positive impact of lower yields on local currency EM bonds was offset by the weakness of EM currencies compared with the U.S. dollar, which strengthened as speculation increased about the timing of a rise in U.S. interest rates. Toward the end of 2014, concerns about the impact of falling oil prices on oil-exporting countries led to a wide sell-off that affected all EM asset classes.
U.S. Treasury yields, the pricing benchmark for U.S. dollar-denominated EM issues, fell sharply during the period, mainly because of fears about faltering global growth. In this environment, the 10-year U.S. Treasury yield lost more than 90 basis points (bps; 100 bps equal one percentage point). In contrast, the yield spread of U.S. dollar-denominated EM debt over U.S. Treasuries widened more than 130 bps over the period. The yield to maturity on the JPM EMBI Global Diversified Index rose significantly during the six months, finishing at 5.59%.
U.S. dollar-denominated EM debt, as measured by the JPM EMBI Global Diversified Index, had a slightly negative total return of -0.61% over the period,1 while local currency EM sovereign bonds, as measured by the JPM GBI-EM Broad Diversified Index, were significantly weaker, with a total return of -6.49%.2 EM corporate bonds, as measured by the BofAML EMCB Index, had a -2.06% total return.1
| | |
| Geographic Breakdown* | | |
| 1/31/15 | | |
| | % of Total | |
| Country | Net Assets | |
| Brazil | 7.3 | % |
| Ukraine | 4.9 | % |
| Russia | 4.6 | % |
| South Africa | 4.3 | % |
| Mexico | 4.0 | % |
| Angola | 4.0 | % |
| Nigeria | 3.7 | % |
| Argentina | 3.4 | % |
| Iraq | 3.1 | % |
| El Salvador | 3.0 | % |
| Uruguay | 2.7 | % |
| Ghana | 2.7 | % |
| Tunisia | 2.4 | % |
| Colombia | 2.2 | % |
| Supranational | 2.0 | % |
| China | 2.0 | % |
| Georgia | 2.0 | % |
| Azerbaijan | 2.0 | % |
| Venezuela | 1.9 | % |
| Mozambique | 1.8 | % |
| Republic of Seychelles | 1.8 | % |
| Bosnia & Herzegovina | 1.7 | % |
| Turkey | 1.7 | % |
| Mongolia | 1.5 | % |
| Other | 17.8 | % |
| Short-Term Investments & Other Net Assets | 11.5 | % |
*Figures reflect certain derivatives held in the portfolio (or their underlying reference
assets) and may not total 100% or may be negative due to rounding, use of
derivatives, unsettled trades or other factors. May differ from the Consolidated SOI
because percentages reflect the issuing country of the Fund’s long-term securities
and include the effect of interest receivable balances.
2 | Semiannual Report ftinstitutional.com
FRANKLIN EMERGING MARKET DEBT OPPORTUNITIES FUND
Investment Strategy
Our portfolio construction process can be summarized in three integral steps — country allocation, currency allocation and issue selection. The first stage of our emerging market debt investment process is identifying the countries for which we have a favorable outlook, which we manage with a bottom-up, research-driven perspective. Since the portfolio is constructed through bottom-up, fundamental research and not relative to a benchmark index, there is no requirement to hold issues in any one country. The next decision is whether to take exposure in the form of “hard currency” or local currency instruments. Hard currencies are typically currencies of economically and politically stable industrialized nations, such as the G-7.3 The last decision concerns security selection. This depends on the shape of the sovereign spread curve and the type of the issue’s coupon (fixed or floating). We may seek to manage the Fund’s exposure to various currencies, and may from time to time seek to hedge (protect) against currency risk through the use of derivative currency transactions, including currency forward contracts or options.
What is a currency forward contract?
A currency forward contract, or a currency forward, is an agreement between the Fund and a counterparty to buy or sell a foreign currency at a specific exchange rate on a future date.
What is a currency option?
A currency option is a derivative financial instrument that gives the owner the right but not the obligation to exchange money denominated in one currency at a preagreed exchange rate on a specified date.
Manager’s Discussion
During the six month period, U.S. dollar strength led the Fund’s exposure to local currencies to detract from performance. The Russian ruble was a major currency detractor largely because of prolonged depreciation caused by a persistent slide in oil prices and ongoing sanctions related to the Ukrainian conflict that turned into a full-blown currency crisis at the end of 2014. The currencies of other leading oil producers, namely the Brazilian real, the Mexican peso and the Nigerian naira, also hindered results.
At the security level, the Fund’s allocation to Venezuelan issues had a negative impact on results, as the collapse in oil prices cast doubt on how long Venezuela would continue to service its external bonds. Exposure to Ukrainian quasi-sovereign and corporate bonds also hurt performance, as investors placed an increasing likelihood on a restructuring of the country’s sovereign debt, possibly in 2015. The Fund had no significant security contributors to performance during the period.
| | |
| Currency Breakdown* | | |
| 1/31/15 | | |
| | % of Total | |
| Currency | Net Assets | |
| U.S. Dollar | 70.1 | % |
| Brazilian Real | 5.5 | % |
| Mexican Peso | 4.1 | % |
| Uruguayan Peso | 2.8 | % |
| South African Rand | 2.8 | % |
| Indian Rupee | 2.0 | % |
| Nigerian Naira | 1.9 | % |
| Colombian Peso | 1.7 | % |
| Kenyan Shilling | 1.4 | % |
| Ugandan Shilling | 1.2 | % |
| Ghanaian Cedi | 1.2 | % |
| Zambian Kwacha | 1.1 | % |
| Serbian Dinar | 1.0 | % |
| Russian Ruble | 1.0 | % |
| Costa Rican Colon | 0.9 | % |
| Turkish Lira | 0.8 | % |
| Dominican Peso | 0.6 | % |
| Ukraine Hryvnia | 0.1 | % |
| Japanese Yen | 0.0 | %** |
| Swiss Franc | 0.0 | %** |
| Euro | -0.2 | % |
*Figures reflect certain derivatives held in the portfolio (or their underlying reference
assets) and may not total 100% or may be negative due to rounding, use of
derivatives, unsettled trades or other factors. Percentages may differ from the
Consolidated SOI due to the underlying currency exposure on credit-linked notes,
pass-through notes, currency forward contracts and currency options and include
the effect of interest receivable balances.
**Rounds to less than 0.1%.
3. The G-7, or Group of Seven, is an informal forum of finance ministers from seven industrialized nations who meet periodically to discuss economic policies.
The G-7 includes Canada, France, Germany, Italy, Japan, the U.K. and the U.S.
See www.franklintempletondatasources.com for additional data provider information.
ftinstitutional.com Semiannual Report | 3
FRANKLIN EMERGING MARKET DEBT OPPORTUNITIES FUND
On January 31, 2015, the Fund had exposure to 46 emerging market countries. The largest single country exposure was Brazil (7.3% of total net assets), followed by Ukraine (4.9%) and Russia (4.6%). Securities denominated in G-7 currencies constituted 68.9% of total net assets, with 60.6% denominated in the U.S. dollar, 5.8% in the euro and 2.5% in the Japanese yen. The Fund’s exposures to the euro and Japanese yen were fully hedged back into the U.S. dollar. In addition, 29.1% of total net assets were denominated in 17 local currencies, of which the largest was the Brazilian real at 5.5% of total net assets. These figures may differ from the currency breakdown table because they do not include the Fund’s holdings in currency forward contracts and other hedging instruments.
| | |
| Top 10 Holdings* | | |
| 1/31/15 | | |
| Issue | % of Total | |
| Sector, Country | Net Assets | |
| Nota Do Tesouro Nacional | 4.6 | % |
| Foreign Government & Agency Securities, Brazil | | |
| Development Bank of South Africa Ltd. | | |
| (Government of Angola) | 4.0 | % |
| Loan Participations & Assignments, Angola | | |
| Government of Iraq** | 3.1 | % |
| Foreign Government & Agency Securities, Iraq | | |
| Mexican Udibonos | 3.1 | % |
| Foreign Government & Agency Securities, Mexico | | |
| Government of El Salvador | 3.0 | % |
| Foreign Government & Agency Securities, El Salvador | | |
| Government of Uruguay | 2.8 | % |
| Foreign Government & Agency Securities, Uruguay | | |
| Government of South Africa | 2.8 | % |
| Foreign Government & Agency Securities, South Africa | | |
| Banque Centrale de Tunisie | 2.4 | % |
| Foreign Government & Agency Securities, Tunisia | | |
| Ferrexpo Finance PLC | 2.1 | % |
| Quasi-Sovereign & Corporate Bonds, Ukraine | | |
| International Finance Corp. | 2.0 | % |
| Foreign Government & Agency Securities, Supranational | | |
*May differ from the Consolidated SOI because percentages include the effect of
interest receivable balances.
**Includes loan participations and assignments.
During the reporting period, the Fund added positions in bonds issued by Capital District of Bogota (Bogota Distrito Capital), Ethiopian Railway, International Bank of Azerbaijan, MTN
Mauritius Investments and Yasar Holdings. The Fund liquidated its positions in corporate bonds issued by Agrokor and Bharti Airtel, euro-denominated Hungarian sovereign bonds and local currency Peruvian sovereign bonds.
We thank you for your confidence in Franklin Emerging Market Debt Opportunities Fund and hope to serve your investment needs at the highest level of expectations.

The foregoing information reflects our analysis, opinions and portfolio holdings as of January 31, 2015, the end of the reporting period. The way we implement our main investment strategies and the resulting portfolio holdings may change depending on factors such as market and economic conditions. These opinions may not be relied upon as investment advice or an offer for a particular security. The information is not a complete analysis of every aspect of any market, country, industry, security or the Fund. Statements of fact are from sources considered reliable, but the investment manager makes no representation or warranty as to their completeness or accuracy. Although historical performance is no guarantee of future results, these insights may help you understand our investment management philosophy.
CFA® is a trademark owned by CFA Institute.
4 | Semiannual Report ftinstitutional.com
FRANKLIN EMERGING MARKET DEBT OPPORTUNITIES FUND
Performance Summary as of January 31, 2015
Your dividend income will vary depending on dividends or interest paid by securities in the Fund’s portfolio, adjusted for operating expenses. Capital gain distributions are net profits realized from the sale of portfolio securities. The performance table does not reflect any taxes that a shareholder would pay on Fund dividends, capital gain distributions, if any, or any realized gains on the sale of Fund shares. Total return reflects reinvestment of the Fund’s dividends and capital gain distributions, if any, and any unrealized gains or losses.
| | | | | | |
| Share Price | | | | | | |
| Symbol: FEMDX | | 1/31/15 | | 7/31/14 | | Change |
| Net Asset Value | $ | 10.50 | $ | 12.35 | -$ | 1.85 |
| |
| |
| Distributions (8/1/14–1/31/15) | | | | | | |
| Dividend | | Short-Term | | Long-Term | | |
| Income | | Capital Gain | | Capital Gain | | Total |
| $0.9104 | $ | 0.0357 | $ | 0.0263 | $ | 0.9724 |
| | | | | | | | | | | | | | | |
| Performance1 | | | | | | | | | | | | | | | |
| | | | | | | | | Value of | | Average Annual | | | | | |
| | | Cumulative | | | Average Annual | | $ | 50,000 | | Total Return | | Total Annual Operating Expenses6 | |
| | | Total Return2 | | | Total Return3 | | | Investment4 | | (12/31/14)5 | | (with waiver) | | (without waiver) | |
| | | | | | | | | | | | | 1.00 | % | 1.14 | % |
| 6-Month | | -7.11 | % | | -7.11 | % | $ | 46,447 | | | | | | | |
| 1-Year | + | 0.37 | % | + | 0.37 | % | $ | 50,185 | | -0.83 | % | | | | |
| 5-Year | + | 30.13 | % | + | 5.41 | % | $ | 65,065 | + | 6.29 | % | | | | |
| Since Inception (5/24/06) | + | 83.92 | % | + | 7.26 | % | $ | 91,966 | + | 7.47 | % | | | | |
Performance data represent past performance, which does not guarantee future results. Investment return and principal value will fluctuate, and you may have a gain or loss when you sell your shares. Current performance may differ from figures shown. For most recent month-end performance, go to ftinstitutional.com or call a Franklin Templeton Institutional Services representative at (800) 321-8563.
ftinstitutional.com
Semiannual Report | 5
FRANKLIN EMERGING MARKET DEBT OPPORTUNITIES FUND
PERFORMANCE SUMMARY
All investments involve risks, including possible loss of principal. Special risks are associated with foreign investing including currency volatility, economic instability, and social and political developments of countries where the Fund invests. Investments in emerging markets, of which frontier markets are a subset, involve heightened risks related to the same factors, in addition to those associated with these markets’ smaller size, lesser liquidity and lack of established legal, political, business and social frameworks to support securities markets. Because these frameworks are typically even less developed in frontier markets, as well as various factors including the increased potential for extreme price volatility, illiquidity, trade barriers and exchange controls, the risks associated with emerging markets are magnified in frontier markets. The risks associated with higher yielding, lower rated securities include higher risk of default and loss of principal. In addition, interest rate movements will affect the Fund’s share price and yield. Prices of debt securities generally move in the opposite direction of interest rates. Thus, as prices of debt securities in the Fund adjust to a rise in interest rates, the Fund’s share price may decline. The Fund is actively managed but there is no guarantee that the manager’s investment decisions will produce the desired results. The Fund’s prospectus also includes a description of the main investment risks.
1. The Fund has an expense reduction contractually guaranteed through at least 11/30/15, a waiver related to the management fee paid by a Fund subsidiary, and a fee
waiver associated with its investments in a Franklin Templeton money fund, contractually guaranteed through at least its current fiscal year-end. Fund investment results
reflect the expense reduction and fee waivers, to the extent applicable; without these reductions, the results would have been lower.
2. Cumulative total return represents the change in value of an investment over the periods indicated.
3. Average annual total return represents the average annual change in value of an investment over the periods indicated. Six-month return has not been annualized.
4. These figures represent the value of a hypothetical $50,000 investment in the Fund over the periods indicated.
5. In accordance with SEC rules, we provide standardized average annual total return information through the latest calendar quarter.
6. Figures are as stated in the Fund’s current prospectus. In periods of market volatility, assets may decline significantly, causing total annual Fund operating expenses to
become higher than the figures shown.
6 | Semiannual Report
ftinstitutional.com
FRANKLIN EMERGING MARKET DEBT OPPORTUNITIES FUND
Your Fund’s Expenses
As a Fund shareholder, you can incur two types of costs:
- Transaction costs, including sales charges (loads) on Fund purchases, if applicable; and
- Ongoing Fund costs, including management fees, distribu- tion and service (12b-1) fees, if applicable, and other Fund expenses. All mutual funds have ongoing costs, sometimes referred to as operating expenses.
The following table shows ongoing costs of investing in the Fund and can help you understand these costs and compare them with those of other mutual funds. The table assumes a $1,000 investment held for the six months indicated.
Actual Fund Expenses
The first line (Actual) of the table provides actual account values and expenses. The “Ending Account Value” is derived from the Fund’s actual return, which includes the effect of Fund expenses.
You can estimate the expenses you paid during the period by following these steps. Of course, your account value and expenses will differ from those in this illustration:
| 1. | Divide your account value by $1,000. |
| | If an account had an $8,600 value, then $8,600 ÷ $1,000 = 8.6. |
| 2. | Multiply the result by the number under the heading “Expenses Paid During Period.” |
| | If Expenses Paid During Period were $7.50, then 8.6 x $7.50 = $64.50. |
In this illustration, the estimated expenses paid this period are $64.50.
| | | | | | |
| | | Beginning Account | | Ending Account | | Expenses Paid During |
| | | Value 8/1/14 | | Value 1/31/15 | | Period* 8/1/14–1/31/15 |
| Actual | $ | 1,000 | $ | 928.90 | $ | 4.86 |
| Hypothetical (5% return before expenses) | $ | 1,000 | $ | 1,020.16 | $ | 5.09 |
*Expenses are calculated using the most recent six-month annualized expense ratio, net of expense waivers, of 1.00%, multiplied by the
average account value over the period, multiplied by 184/365 to reflect the one-half year period.
Hypothetical Example for Comparison with Other Funds
Information in the second line (Hypothetical) of the table can help you compare ongoing costs of investing in the Fund with those of other mutual funds. This information may not be used to estimate the actual ending account balance or expenses you paid during the period. The hypothetical “Ending Account Value” is based on the Fund’s actual expense ratio and an assumed 5% annual rate of return before expenses, which does not represent the Fund’s actual return. The figure under the heading “Expenses Paid During Period” shows the hypothetical expenses your account would have incurred under this scenario. You can compare this figure with the 5% hypothetical examples that appear in shareholder reports of other funds.
Please note that expenses shown in the table are meant to highlight ongoing costs and do not reflect any transaction costs, such as sales charges. Therefore, the second line of the table is useful in comparing ongoing costs only, and will not help you compare total costs of owning different funds. In addition, if transaction costs were included, your total costs would have been higher. Please refer to the Fund prospectus for additional information on operating expenses.
ftinstitutional.com Semiannual Report | 7
| | | | | | | | | | | | | | | | | | |
| FRANKLIN GLOBAL TRUST | | | | | | | | | | | | | | | | | | |
| |
| |
| Consolidated Financial Highlights | | | | | | | | | | | | | | | | | | |
| Franklin Emerging Market Debt Opportunities Fund | | | | | | | | | | | | | | | | |
| | | Six Months Ended | | | | | | | | | | | | | | | | |
| | | January 31, 2015 | | | | | | | | | Year Ended July 31, | | | | |
| | | (unaudited) | | | 2014 | | | 2013 | | | 2012 | | | 2011 | | | 2010 | |
| Per share operating performance | | | | | | | | | | | | | | | | | | |
| (for a share outstanding throughout the period) | | | | | | | | | | | | | | | | | | |
| Net asset value, beginning of period | $ | 12.35 | | $ | 12.06 | | $ | 12.33 | | $ | 12.80 | | $ | 11.94 | | $ | 9.78 | |
| Income from investment operationsa: | | | | | | | | | | | | | | | | | | |
| Net investment incomeb | | 0.45 | | | 0.87 | | | 0.83 | | | 0.90 | | | 0.79 | | | 0.89 | |
| Net realized and unrealized gains | | | | | | | | | | | | | | | | | | |
| (losses) | | (1.33 | ) | | 0.04 | | | (0.04 | ) | | (0.51 | ) | | 0.54 | | | 1.70 | |
| Total from investment operations | | (0.88 | ) | | 0.91 | | | 0.79 | | | 0.39 | | | 1.33 | | | 2.59 | |
| Less distributions from: | | | | | | | | | | | | | | | | | | |
| Net investment income | | (0.91 | ) | | (0.58 | ) | | (0.89 | ) | | (0.70 | ) | | (0.36 | ) | | (0.43 | ) |
| Net realized gains | | (0.06 | ) | | (0.04 | ) | | (0.17 | ) | | (0.16 | ) | | (0.11 | ) | | — | |
| Total distributions | | (0.97 | ) | | (0.62 | ) | | (1.06 | ) | | (0.86 | ) | | (0.47 | ) | | (0.43 | ) |
| Net asset value, end of period | $ | 10.50 | | $ | 12.35 | | $ | 12.06 | | $ | 12.33 | | $ | 12.80 | | $ | 11.94 | |
| |
| Total returnc | | (7.11 | )% | | 7.82 | % | | 6.40 | % | | 3.73 | % | | 11.40 | % | | 26.94 | % |
| |
| Ratios to average net assetsd | | | | | | | | | | | | | | | | | | |
| Expenses before waiver and payments by | | | | | | | | | | | | | | | | | | |
| affiliates | | 1.06 | % | | 1.10 | % | | 1.07 | % | | 1.09 | % | | 1.11 | % | | 1.14 | % |
| Expenses net of waiver and payments by | | | | | | | | | | | | | | | | | | |
| affiliates | | 1.00 | %e | | 1.00 | %e | | 1.00 | %e | | 1.00 | % | | 1.00 | % | | 1.00 | %e |
| Net investment income | | 7.54 | % | | 7.29 | % | | 6.63 | % | | 7.52 | % | | 6.38 | % | | 7.89 | % |
| |
| Supplemental data | | | | | | | | | | | | | | | | | | |
| Net assets, end of period (000’s) | $ | 588,563 | | $ | 630,597 | | $ | 568,794 | | $ | 464,714 | | $ | 400,887 | | $ | 172,858 | |
| Portfolio turnover rate | | 10.67 | % | | 29.70 | % | | 30.95 | % | | 33.17 | % | | 29.09 | % | | 36.13 | % |
aThe amount shown for a share outstanding throughout the period may not correlate with the Consolidated Statement of Operations for the period due to the timing of sales
and repurchases of the Fund shares in relation to income earned and/or fluctuating fair value of the investments of the Fund.
bBased on average daily shares outstanding.
cTotal return is not annualized for periods less than one year.
dRatios are annualized for periods less than one year.
eBenefit of expense reduction rounds to less than 0.01%.
8 | Semiannual Report | The accompanying notes are an integral part of these consolidated financial statements. ftinstitutional.com
FRANKLIN GLOBAL TRUST
| | | | | | |
| | Consolidated Statement of Investments, January 31, 2015 (unaudited) | | | | |
| |
| | Franklin Emerging Market Debt Opportunities Fund | | | | | |
| | | Country/ | | | | |
| | | Organization | Warrants | | | Value |
| | Warrants 2.4% | | | | | |
| | aCentral Bank of Nigeria, wts., 11/15/20 | Nigeria | 64,000 | | $ | 9,152,000 |
| | aGovernment of Venezuela, Oil Value Recovery wts., 4/15/20 | Venezuela | 450,000 | | | 4,725,000 |
| | Total Warrants (Cost $24,363,218) | | | | | 13,877,000 |
| |
| | | | Principal | | | |
| | | | Amount* | | | |
| |
| Quasi-Sovereign and Corporate Bonds 27.3% | | | | | |
| | Banks 4.6% | | | | | |
| | bFidelity Bank PLC, senior note, 144A, 6.875%, 5/09/18 | Nigeria | 10,000,000 | | | 8,402,000 |
| cHSBK(Europe) BV, senior note, Reg S, 7.25%, 5/03/17 | Kazakhstan | 5,000,000 | | | 4,982,775 |
| | cInternational Bank of Azerbaijan OJSC, senior note, Reg S, 5.625%, | | | | | |
| | 6/11/19 | Azerbaijan | 6,300,000 | | | 5,713,312 |
| | bNational Savings Bank, senior note, 144A, 8.875%, 9/18/18 | Sri Lanka | 7,000,000 | | | 7,743,750 |
| | | | | | | 26,841,837 |
| | Chemicals 0.7% | | | | | |
| | bBraskem Finance Ltd., senior note, 144A, 5.375%, 5/02/22 | Brazil | 4,450,000 | | | 4,360,755 |
| | Commercial Services & Supplies 1.0% | | | | | |
| | cRed de Carreteras de Occidente Sapib de CV, secured bond, Reg S, | | | | | |
| | 9.00%, 6/10/28 | Mexico | 86,000,000 | MXN | | 5,623,039 |
| | Diversified Financial Services 2.4% | | | | | |
| | d,e,fSphynx Capital Markets (National Investment Bank of Ghana), PTN, | | | | | |
| | zero cpn., 2/05/09 | Ghana | 8,000,000 | | | 8,684,136 |
| | bYasar Holdings SA, senior note, 144A, 8.875%, 5/06/20 | Turkey | 5,150,000 | | | 5,336,687 |
| | | | | | | 14,020,823 |
| | Diversified Telecommunication Services 2.3% | | | | | |
| | cEmpresa de Telecommunicaciones de Bogota SA, senior note, | | | | | |
| | Reg S, 7.00%, 1/17/23 | Colombia | 16,100,000,000 | COP | | 6,252,244 |
| bMTN(Mauritius) Investments Ltd., 144A, 4.755%, 11/11/24 | South Africa | 2,250,000 | | | 2,274,874 |
| | cOi SA, senior note, Reg S, 9.75%, 9/15/16 | Brazil | 14,400,000 | BRL | | 4,880,104 |
| | | | | | | 13,407,222 |
| | Food & Staples Retailing 1.7% | | | | | |
| | cCencosud SA, senior note, Reg S, 4.875%, 1/20/23 | Chile | 4,409,000 | | | 4,405,318 |
| | bJBS Investments GmbH, senior note, 144A, 7.25%, 4/03/24 | Brazil | 5,900,000 | | | 5,863,125 |
| | | | | | | 10,268,443 |
| | Metals & Mining 2.8% | | | | | |
| | cFerrexpo Finance PLC, senior bond, Reg S, 7.875%, 4/07/16 | Ukraine | 15,200,000 | | | 11,837,000 |
| | cVedanta Resources PLC, senior note, Reg S, 9.50%, 7/18/18 | India | 4,900,000 | | | 4,823,927 |
| | | | | | | 16,660,927 |
| | Municipal Bonds 3.9% | | | | | |
| | cBogota Distrito Capital, senior note, Reg S, 9.75%, 7/26/28 | Colombia | 7,928,000,000 | COP | | 3,898,265 |
| | Province Del Neuquen, secured note, | | | | | |
| | b144A, 7.875%, 4/26/21 | Argentina | 4,180,000 | | | 4,157,616 |
| | cReg S, 7.875%, 4/26/21 | Argentina | 5,270,600 | | | 5,242,376 |
| | Province of Salta Argentina, senior secured note, | | | | | |
| | b144A, 9.50%, 3/16/22 | Argentina | 3,838,500 | | | 3,790,519 |
| | cReg S, 9.50%, 3/16/22 | Argentina | 5,385,842 | | | 5,318,519 |
| | | | | | | 22,407,295 |
ftinstitutional.com Semiannual Report | 9
FRANKLIN GLOBAL TRUST
CONSOLIDATED STATEMENT OF INVESTMENTS (UNAUDITED)
| | | | | |
| Franklin Emerging Market Debt Opportunities Fund (continued) | | | | |
| | Country/ | Principal | | | |
| | Organization | Amount* | | | Value |
| Quasi-Sovereign and Corporate Bonds (continued) | | | | | |
| Oil, Gas & Consumable Fuels 2.2% | | | | | |
| bGeorgian Oil & Gas Corp., 144A, 6.875%, 5/16/17 | Georgia | 5,000,000 | | $ | 5,050,000 |
| Petro Co. of Trinidad and Tobago Ltd., senior note, | | | | | |
| b144A, 6.00%, 5/08/22 | Trinidad and Tobago | 750,000 | | | 757,500 |
| cReg S, 6.00%, 5/08/22 | Trinidad and Tobago | 1,625,000 | | | 1,642,347 |
| cState Oil Co., Government of Azerbaijan, senior note, Reg S, 4.75%, | | | | | |
| 3/13/23 | Azerbaijan | 6,200,000 | | | 5,636,420 |
| | | | | | 13,086,267 |
| Paper & Forest Products 0.7% | | | | | |
| bMasisa SA, senior note, 144A, 9.50%, 5/05/19 | Chile | 4,300,000 | | | 4,133,375 |
| Real Estate Management & Development 2.0% | | | | | |
| cFranshion Development Ltd., senior note, Reg S, 6.75%, 4/15/21 | China | 4,800,000 | | | 5,222,976 |
| cLongfor Properties Co. Ltd., senior note, Reg S, 6.75%, 1/29/23 | China | 500,000 | | | 476,875 |
| cYuexiu Property Co. Ltd., senior note, Reg S, 4.50%, 1/24/23 | China | 6,200,000 | | | 5,873,756 |
| | | | | | 11,573,607 |
| Road & Rail 0.5% | | | | | |
| bGeorgian Railway LLC, senior bond, 144A, 7.75%, 7/11/22 | Georgia | 2,900,000 | | | 3,076,233 |
| Specialty Retail 1.1% | | | | | |
| bEdcon Pty. Ltd., secured note, 144A, 9.50%, 3/01/18 | South Africa | 6,800,000 | EUR | | 6,174,102 |
| Textiles, Apparel & Luxury Goods 1.0% | | | | | |
| bGolden Legacy Pte. Ltd., senior note, 144A, 9.00%, 4/24/19 | Indonesia | 6,200,000 | | | 6,025,625 |
| Thrifts & Mortgage Finance 0.0%† | | | | | |
| fAstana Finance BV, 7.875%, 6/08/10 | Kazakhstan | 2,300,000 | EUR | | 259,820 |
| Wireless Telecommunication Services 0.4% | | | | | |
| bMillicom International Cellular SA, senior note, 144A, 6.625%, | | | | | |
| 10/15/21 | Luxembourg | 2,500,000 | | | 2,573,438 |
| Total Quasi-Sovereign and Corporate Bonds | | | | | |
| (Cost $162,842,623) | | | | | 160,492,808 |
| gLoan Participations and Assignments 14.7% | | | | | |
| bAlfa Bond Issuance PLC (Alfa Bank OJSC), 144A, 7.50%, | | | | | |
| 9/26/19 | Russia | 11,200,000 | | | 9,627,912 |
| cCredit Suisse First Boston International (City of Kyiv), secured bond, | | | | | |
| Reg S, 8.00%, 11/06/15 | Ukraine | 9,600,000 | | | 4,896,000 |
| hDevelopment Bank of South Africa Ltd. (Government of Angola), | | | | | |
| Tranche 2, senior note, FRN, 6.594%, 12/20/23 | Angola | 11,900,000 | | | 11,900,000 |
| Tranche 3B, senior note, FRN, 6.57%, 12/20/23 | Angola | 11,200,000 | | | 11,200,000 |
| hEthiopian Railway Corp. (Republic of Ethiopia), FRN, | | | | | |
| 3.917%, 8/07/21 | Ethiopia | 125,825 | | | 117,646 |
| 3.934%, 8/07/21 | Ethiopia | 550,719 | | | 514,922 |
| 4.075%, 8/07/21 | Ethiopia | 5,972,315 | | | 5,584,114 |
| cFederal Grid Co. OJSC (Federal Finance Ltd.), Reg S, 8.446%, | | | | | |
| 3/13/19 | Russia | 200,000,000 | RUB | | 2,134,075 |
| e,hGovernment of Iraq, Tranche A3, Sumitomo Corp. Loan, FRN, | | | | | |
| 0.688%, 1/01/28 | Iraq | 322,120,730 | JPY | | 1,724,345 |
| e,hMerrill Lynch & Co. Inc. (Government of Iraq), FRN, 0.688%, | | | | | |
| 1/01/28 | Iraq | 563,730,790 | JPY | | 3,017,708 |
| cMozambique EMATUM Finance 2020 BV (Republic of Mozambique), | | | | | |
| senior note, Reg S, 6.305%, 9/11/20 | Mozambique | 11,100,000 | | | 10,328,106 |
| |
| |
| 10 | Semiannual Report | | | | | ftinstitutional.com |
FRANKLIN GLOBAL TRUST
CONSOLIDATED STATEMENT OF INVESTMENTS (UNAUDITED)
| | | | | |
| Franklin Emerging Market Debt Opportunities Fund (continued) | | | | |
| | Country/ | Principal | | | |
| | Organization | Amount* | | | Value |
| gLoan Participations and Assignments (continued) | | | | | |
| f,iNK Debt Corp., | | | | | |
| 144A, zero cpn., 3/12/20 | North Korea | 4,250,000 | DEM | $ | 58,913 |
| Reg S, zero cpn., 3/12/20 | North Korea | 2,000,000 | CHF | | 52,231 |
| Reg S, zero cpn., 3/12/20 | North Korea | 18,000,000 | DEM | | 249,515 |
| RSHB Capital SA (Russian Agricultural Bank OJSC), senior sub. note, | | | | | |
| b144A, 6.00% to 6/03/16, FRN thereafter, 6/03/21 | Russia | 7,000,000 | | | 4,738,125 |
| cReg S, 6.00%, 6/03/21 | Russia | 1,200,000 | | | 812,250 |
| cRZD Capital PLC (Russian Railways), | | | | | |
| senior bond, Reg S, 5.70%, 4/05/22 | Russia | 7,400,000 | | | 5,889,142 |
| senior note, Reg S, 8.30%, 4/02/19 | Russia | 300,000,000 | RUB | | 3,241,649 |
| cSSB #1 PLC (OJSC State Savings Bank of Ukraine), senior note, | | | | | |
| Reg S, | | | | | |
| 8.25%, 3/10/16 | Ukraine | 15,000,000 | | | 7,331,250 |
| 8.875%, 3/20/18 | Ukraine | 6,300,000 | | | 2,980,688 |
| Total Loan Participations and Assignments | | | | | |
| (Cost $116,150,503) | | | | | 86,398,591 |
| jCredit-Linked Notes (Cost $573,442) 0.0%† | | | | | |
| bING Bank NV (Government of Ukraine), 144A, 5.50%, 8/25/15 | Ukraine | 4,400,000 | UAH | | 259,006 |
| Foreign Government and Agency Securities 42.4% | | | | | |
| Banque Centrale de Tunisie, | | | | | |
| cReg S, 4.50%, 6/22/20 | Tunisia | 3,961,000 | EUR | | 4,641,377 |
| senior bond, 4.30%, 8/02/30 | Tunisia | 610,000,000 | JPY | | 4,430,309 |
| senior bond, 4.20%, 3/17/31 | Tunisia | 680,000,000 | JPY | | 4,953,989 |
| The Development and Investment Projects Fund of the Jordan | | | | | |
| Armed Forces and Security Corps., senior note, 6.14%, | | | | | |
| 12/16/19 | Jordan | 2,200,000 | | | 2,139,500 |
| fGovernment of Argentina, 11.75%, 5/20/11 | Argentina | 3,000,000 | DEM | | 1,559,468 |
| hGovernment of Bosnia & Herzegovina, | | | | | |
| FRN, 0.938%, 12/11/17 | Bosnia & Herzegovina | 1,900,000 | DEM | | 998,637 |
| csenior bond, B, Reg S, FRN, 0.938%, 12/11/21 | Bosnia & Herzegovina | 18,754,167 | DEM | | 9,071,841 |
| bGovernment of Costa Rica, 144A, 10.58%, 9/23/15 | Costa Rica | 2,775,000,000 | CRC | | 5,296,089 |
| bGovernment of the Dominican Republic, 144A, 12.50%, 2/09/18 | Dominican Republic | 149,000,000 | DOP | | 3,522,545 |
| hGovernment of Ecuador, FRN, 1.188%, 2/27/15 | Ecuador | 96,676 | | | 92,084 |
| cGovernment of El Salvador, senior bond, Reg S, 7.65%, 6/15/35 | El Salvador | 16,400,000 | | | 17,788,834 |
| Government of Georgia, | | | | | |
| b144A, 6.875%, 4/12/21 | Georgia | 2,900,000 | | | 3,163,306 |
| cReg S, 6.875%, 4/12/21 | Georgia | 200,000 | | | 218,159 |
| Government of Ghana, | | | | | |
| 25.40%, 7/31/17 | Ghana | 11,000,000 | GHS | | 3,575,826 |
| 23.00%, 8/21/17 | Ghana | 8,790,000 | GHS | | 2,743,768 |
| c,fGovernment of Grenada, Reg S, 6.00% to 9/15/15, 8.00% to | | | | | |
| 9/15/17, 8.50% to 9/15/18, 9.00% thereafter, 9/15/25 | Grenada | 9,800,000 | | | 3,289,125 |
| Government of Honduras, | | | | | |
| b144A, 7.50%, 3/15/24 | Honduras | 3,200,000 | | | 3,368,288 |
| cReg S, 7.50%, 3/15/24 | Honduras | 400,000 | | | 421,036 |
| bsenior note, 144A, 8.75%, 12/16/20 | Honduras | 1,200,000 | | | 1,343,886 |
| cGovernment of Iraq, Reg S, 5.80%, 1/15/28 | Iraq | 17,000,000 | | | 13,673,355 |
| Government of Macedonia, senior bond, 4.625%, 12/08/15 | Macedonia | 4,242,000 | EUR | | 4,908,564 |
| cGovernment of Mongolia, Reg S, 5.125%, 12/05/22 | Mongolia | 10,500,000 | | | 8,830,500 |
| Government of Montenegro, 7.875%, 9/14/15 | Republic of | | | | |
| | Montenegro | 4,900,000 | EUR | | 5,748,144 |
| |
| ftinstitutional.com | | Semiannual Report | 11 |
| | | | | |
| FRANKLIN GLOBAL TRUST | | | | | |
| CONSOLIDATED STATEMENT OF INVESTMENTS (UNAUDITED) | | | | |
| |
| |
| |
| |
| Franklin Emerging Market Debt Opportunities Fund (continued) | | | | |
| | Country/ | Principal | | | |
| | Organization | Amount* | | | Value |
| Foreign Government and Agency Securities (continued) | | | | | |
| Government of Nigeria, 16.39%, 1/27/22 | Nigeria | 683,700,000 | NGN | $ | 3,830,178 |
| bGovernment of Paraguay, 144A, 4.625%, 1/25/23 | Paraguay | 5,950,000 | | | 6,210,342 |
| cGovernment of Rwanda, Reg S, 6.625%, 5/02/23 | Rwanda | 5,000,000 | | | 5,035,875 |
| cGovernment of Seychelles, Reg S, 7.00% to 1/01/18, 8.00% | | | | | |
| thereafter, 1/01/26 | Republic of Seychelles | 10,500,000 | | | 10,318,350 |
| Government of South Africa, 8.00%, 12/21/18 | South Africa | 180,000,000 | ZAR | | 16,279,515 |
| Government of Turkey, | | | | | |
| hFRN, 8.52%, 1/04/17 | Turkey | 1,940,000 | TRY | | 782,281 |
| kIndex Linked, 4.00%, 4/29/15 | Turkey | 9,311,468 | TRY | | 3,783,355 |
| Government of Uganda, | | | | | |
| 10.00%, 5/21/15 | Uganda | 1,450,000,000 | UGX | | 504,844 |
| 10.25%, 4/21/16 | Uganda | 3,000,000,000 | UGX | | 1,004,674 |
| 10.75%, 2/22/18 | Uganda | 2,200,000,000 | UGX | | 671,963 |
| kGovernment of Uruguay, senior bond, Index Linked, 3.70%, | | | | | |
| 6/26/37 | Uruguay | 437,893,268 | UYU | | 16,509,658 |
| Government of Venezuela, | | | | | |
| cReg S, 6.00%, 12/09/20 | Venezuela | 11,000,000 | | | 3,547,115 |
| senior bond, 7.65%, 4/21/25 | Venezuela | 9,000,000 | | | 2,910,690 |
| International Finance Corp., senior note, 7.75%, 12/03/16 | Supranationall | 705,000,000 | INR | | 11,800,603 |
| cJamaica Government International Bond, senior bond, Reg S, | | | | | |
| 7.625%, 7/09/25 | Jamaica | 1,700,000 | | | 1,855,984 |
| Kenya Infrastructure Bond, 11.00%, 9/15/25 | Kenya | 578,300,000 | KES | | 6,321,800 |
| kMexican Udibonos, Index Linked, 4.00%, 11/15/40 | Mexico | 2,278,227 | mMXN | | 17,902,356 |
| nNota Do Tesouro Nacional, Index Linked, 6.00%, | | | | | |
| 8/15/20 | Brazil | 7,890 | o BRL | | 7,543,032 |
| 8/15/24 | Brazil | 8,000 | o BRL | | 7,641,899 |
| 8/15/30 | Brazil | 12,000 | o BRL | | 11,402,824 |
| Serbia Treasury Note, 10.00%, | | | | | |
| 2/21/16 | Serbia | 500,000,000 | RSD | | 4,647,013 |
| 5/22/16 | Serbia | 50,000,000 | RSD | | 464,644 |
| c,hTanzania Government International Bond, Reg S, FRN, 6.329%, | | | | | |
| 3/09/20 | United Republic of | | | | |
| | Tanzania | 2,800,000 | | | 2,861,866 |
| Total Foreign Government and Agency Securities | | | | | |
| (Cost $286,402,488) | | | | | 249,609,491 |
| |
| | | Shares/Units | | | |
| |
| Common Stocks (Cost $—) 0.0% | | | | | |
| e,pAstana Finance JSC, ADR, 144A | Kazakhstan | 26,243 | | | — |
| Private Limited Partnership Fund | | | | | |
| (Cost $4,205,212) 0.1% | | | | | |
| Diversified Financial Services 0.1% | | | | | |
| a,i,p,qGlobal Distressed Alpha Fund III LP | Bermuda | 4,030,073 | | | 553,934 |
| |
| Total Investments before Short Term Investments | | | | | |
| (Cost $594,537,486) | | | | | 511,190,830 |
12 | Semiannual Report
ftinstitutional.com
FRANKLIN GLOBAL TRUST
CONSOLIDATED STATEMENT OF INVESTMENTS (UNAUDITED)
| | | | | |
| Franklin Emerging Market Debt Opportunities Fund (continued) | | | | | |
| | Country/ | Principal | | | |
| | Organization | Amount* | | | Value |
| Short Term Investments 9.5% | | | | | |
| Foreign Government and Agency Securities 2.5% | | | | | |
| rKenya Treasury Bill, 5/04/15 | Kenya | 155,750,000 | KES | $ | 1,658,427 |
| rNigeria Treasury Bills, 3/05/15 - 9/03/15 | Nigeria | 1,319,000,000 | NGN | | 6,775,471 |
| rZambia Treasury Bills, 7/13/15 - 10/19/15 | Zambia | 45,425,000 | ZMW | | 6,387,895 |
| Total Foreign Government and Agency Securities | | | | | |
| (Cost $16,267,905) | | | | | 14,821,793 |
| U.S. Government and Agency Securities | | | | | |
| (Cost $949,980) 0.2% | | | | | |
| rU.S. Treasury Bills, 2/12/15 - 4/09/15 | United States | 950,000 | | | 949,996 |
| Total Investments before Money Market Funds | | | | | |
| (Cost $611,755,371) | | | | | 526,962,619 |
| |
| | | Shares | | | |
| Money Market Funds (Cost $40,203,315) 6.8% | | | | | |
| p,sInstitutional Fiduciary Trust Money Market Portfolio | United States | 40,203,315 | | | 40,203,315 |
| Total Investments (Cost $651,958,686) 96.4% | | | | | 567,165,934 |
| Other Assets, less Liabilities 3.6% | | | | | 21,397,007 |
| Net Assets 100.0% | | | | $ | 588,562,941 |
*The principal amount is stated in U.S. dollars unless otherwise indicated.
†Rounds to less than 0.1% of net assets.
aThe security is owned by Alternative Strategies (FT) Ltd., a wholly-owned subsidiary of the Fund. See Note 1(g).
bSecurity was purchased pursuant to Rule 144A under the Securities Act of 1933 and may be sold in transactions exempt from registration only to qualified institutional buyers
or in a public offering registered under the Securities Act of 1933. These securities have been deemed liquid under guidelines approved by the Trust’s Board of Trustees. At
January 31, 2015, the aggregate value of these securities was $107,249,098, representing 18.22% of net assets.
cSecurity was purchased pursuant to Regulation S under the Securities Act of 1933, which exempts from registration securities offered and sold outside of the United States.
Such a security cannot be sold in the United States without either an effective registration statement filed pursuant to the Securities Act of 1933, or pursuant to an exemption
from registration. These securities have been deemed liquid under guidelines approved by the Trust’s Board of Trustees. At January 31, 2015, the aggregate value of these
securities was $200,995,830, representing 34.15% of net assets.
dRepresents claims that have been filed with a Ghanaian court against National Investment Bank of Ghana.
eSecurity has been deemed illiquid because it may not be able to be sold within seven days. At January 31, 2015, the aggregate value of these securities was $13,426,189,
representing 2.28% of net assets.
fSee Note 7 regarding defaulted securities.
gSee Note 1(e) regarding loan participations and assignments.
hThe coupon rate shown represents the rate at period end.
iSee Note 9 regarding restricted securities.
jSee Note 1(f) regarding credit-linked notes.
kPrincipal amount of security is adjusted for inflation. See Note 1(i).
lA supranational organization is an entity formed by two or more central governments through international treaties.
mPrincipal amount is stated in Unidad de Inversion Units.
nRedemption price at maturity is adjusted for inflation. See Note 1(i).
oPrincipal amount is stated in 1,000 Brazilian Real Units.
pNon-income producing.
qThe Global Distressed Alpha Fund III LP is a fund focused on the purchase of and the recovery on private distressed commercial, sovereign and sovereign-related debt
claims around the world, principally in Africa and Asia.
rThe security is traded on a discount basis with no stated coupon rate.
sSee Note 3(d) regarding investments in Institutional Fiduciary Trust Money Market Portfolio.
ftinstitutional.com Semiannual Report | 13
FRANKLIN GLOBAL TRUST
CONSOLIDATED STATEMENT OF INVESTMENTS (UNAUDITED)
Franklin Emerging Market Debt Opportunities Fund (continued)
At January 31, 2015, the Fund had the following forward exchange contracts outstanding. See Note 1(c).
| | | | | | | | | | | |
| Forward Exchange Contracts | | | | | | | | | | | |
| | | | | | Contract | Settlement | | Unrealized | | Unrealized | |
| Currency | Counterpartya Type | Quantity | | Amount | Date | | Appreciation | | Depreciation | |
| Euro | CITI | Sell | 12,300,000 | $ | 15,284,546 | 3/23/15 | $ | 1,383,356 | $ | — | |
| Euro | MSCO | Buy | 6,000,000 | | 7,307,160 | 3/23/15 | | — | | (526,092 | ) |
| Euro | MSCO | Sell | 13,000,000 | | 16,156,556 | 3/23/15 | | 1,464,242 | | — | |
| Euro | RBCCM | Sell | 12,000,000 | | 14,920,188 | 3/23/15 | | 1,358,052 | | — | |
| Japanese Yen | CITI | Sell | 600,000,000 | | 5,067,080 | 3/23/15 | | — | | (43,922 | ) |
| Japanese Yen | MSCO | Sell | 600,000,000 | | 5,065,027 | 3/23/15 | | — | | (45,975 | ) |
| Japanese Yen | RBCCM | Sell | 500,000,000 | | 4,222,795 | 3/23/15 | | — | | (36,373 | ) |
| Unrealized appreciation (depreciation) | | | | | | | 4,205,650 | | (652,362 | ) |
| Net unrealized appreciation (depreciation) | | | | | | $ | 3,553,288 | | | |
| aMay be comprised of multiple contracts with the same counterparty, currency and settlement date. | | | | | | |
| |
| See Abbreviations on page 28. | | | | | | | | | | | |
14 | Semiannual Report | The accompanying notes are an integral part of these consolidated financial statements. ftinstitutional.com
FRANKLIN GLOBAL TRUST
Consolidated Financial Statements
Consolidated Statement of Assets and Liabilities
January 31, 2015 (unaudited)
| | | |
| Franklin Emerging Market Debt Opportunities Fund | | | |
| |
| Assets: | | | |
| Investments in securities: | | | |
| Cost - Unaffiliated issuers | $ | 611,755,371 | |
| Cost - Sweep Money Fund (Note 3d) | | 40,203,315 | |
| Total cost of investments | $ | 651,958,686 | |
| Value - Unaffiliated issuers | $ | 526,962,619 | |
| Value - Sweep Money Fund (Note 3d) | | 40,203,315 | |
| Total value of investments | | 567,165,934 | |
| Cash | | 2,740,840 | |
| Restricted cash (Note 1d) | | 819,000 | |
| Foreign currency, at value (cost $5,820,543) | | 5,825,162 | |
| Receivables: | | | |
| Investment securities sold | | 4,864,430 | |
| Capital shares sold | | 156,194 | |
| Interest | | 9,528,354 | |
| Unrealized appreciation on forward exchange contracts | | 4,205,650 | |
| Unrealized appreciation on unfunded loan commitments (Note 10) | | 66,279 | |
| Other assets | | 16 | |
| Total assets | | 595,371,859 | |
| Liabilities: | | | |
| Payables: | | | |
| Investment securities purchased | | 4,118,914 | |
| Capital shares redeemed | | 275,453 | |
| Management fees | | 464,941 | |
| Transfer agent fees | | 5,610 | |
| Unrealized depreciation on forward exchange contracts | | 652,362 | |
| Unrealized depreciation on unfunded loan commitments (Note 10) | | 340,524 | |
| Due to brokers | | 819,000 | |
| Deferred tax | | 4,453 | |
| Accrued expenses and other liabilities | | 127,661 | |
| Total liabilities | | 6,808,918 | |
| Net assets, at value | $ | 588,562,941 | |
| Net assets consist of: | | | |
| Paid-in capital | $ | 674,342,586 | |
| Distributions in excess of net investment income | | (9,361,378 | ) |
| Net unrealized appreciation (depreciation) | | (81,801,493 | ) |
| Accumulated net realized gain (loss) | | 5,383,226 | |
| Net assets, at value | $ | 588,562,941 | |
| Shares outstanding | | 56,067,049 | |
| Net asset value and maximum offering price per share | $ | 10.50 | |
ftinstitutional.com The accompanying notes are an integral part of these consolidated financial statements. | Semiannual Report | 15
| | | |
| FRANKLIN GLOBAL TRUST | | | |
| CONSOLIDATED FINANCIAL STATEMENTS | | | |
| |
| |
| Consolidated Statement of Operations | | | |
| for the six months ended January 31, 2015 (unaudited) | | | |
| |
| Franklin Emerging Market Debt Opportunities Fund | | | |
| |
| Investment income: | | | |
| Dividends | $ | 2,310,000 | |
| Interest | | 22,712,467 | |
| Inflation principal adjustments | | 1,943,174 | |
| Total investment income | | 26,965,641 | |
| Expenses: | | | |
| Management fees (Note 3a) | | 3,082,212 | |
| Transfer agent fees (Note 3c) | | 28,629 | |
| Custodian fees (Note 4) | | 109,397 | |
| Reports to shareholders | | 13,861 | |
| Registration and filing fees | | 27,683 | |
| Professional fees | | 52,629 | |
| Trustees’ fees and expenses | | 11,775 | |
| Other | | 8,178 | |
| Total expenses | | 3,334,364 | |
| Expense reductions (Note 4) | | (250 | ) |
| Expenses waived/paid by affiliates (Notes 3d and 3e) | | (175,092 | ) |
| Net expenses | | 3,159,022 | |
| Net investment income | | 23,806,619 | |
| Realized and unrealized gains (losses): | | | |
| Net realized gain (loss) from: | | | |
| Investments | | (97,124 | ) |
| Foreign currency transactions | | 5,690,389 | |
| Net realized gain (loss) | | 5,593,265 | |
| Net change in unrealized appreciation (depreciation) on: | | | |
| Investments | | (78,563,922 | ) |
| Translation of other assets and liabilities denominated in foreign currencies | | 2,602,904 | |
| Change in deferred taxes on unrealized appreciation | | 7,385 | |
| Net change in unrealized appreciation (depreciation) | | (75,953,633 | ) |
| Net realized and unrealized gain (loss) | | (70,360,368 | ) |
| Net increase (decrease) in net assets resulting from operations | $ | (46,553,749 | ) |
16 | Semiannual Report | The accompanying notes are an integral part of these consolidated financial statements. ftinstitutional.com
FRANKLIN GLOBAL TRUST
CONSOLIDATED FINANCIAL STATEMENTS
| | | | | | |
| Consolidated Statements of Changes in Net Assets | | | | | | |
| |
| |
| Franklin Emerging Market Debt Opportunities Fund | | | | | | |
| |
| | | Six Months Ended | | | | |
| | | January 31, 2015 | | | Year Ended | |
| | | (unaudited) | | | July 31, 2014 | |
| Increase (decrease) in net assets: | | | | | | |
| Operations: | | | | | | |
| Net investment income | $ | 23,806,619 | | $ | 43,321,521 | |
| Net realized gain (loss) from investments and foreign currency transactions | | 5,593,265 | | | (4,241,115 | ) |
| Net change in unrealized appreciation (depreciation) on investments, translation of other assets | | | | | | |
| and liabilities denominated in foreign currencies, and deferred taxes | | (75,953,633 | ) | | 6,433,724 | |
| Net increase (decrease) in net assets resulting from operations | | (46,553,749 | ) | | 45,514,130 | |
| Distributions to shareholders from: | | | | | | |
| Net investment income | | (47,966,524 | ) | | (27,827,405 | ) |
| Net realized gains | | (3,266,613 | ) | | (1,989,027 | ) |
| Total distributions to shareholders | | (51,233,137 | ) | | (29,816,432 | ) |
| Capital share transactions (Note 2) | | 55,752,757 | | | 46,105,272 | |
| Net increase (decrease) in net assets | | (42,034,129 | ) | | 61,802,970 | |
| Net assets: | | | | | | |
| Beginning of period | | 630,597,070 | | | 568,794,100 | |
| End of period | $ | 588,562,941 | | $ | 630,597,070 | |
| Undistributed net investment income (distributions in excess of net investment income) included in | | | | | | |
| net assets: | | | | | | |
| End of period | $ | (9,361,378 | ) | $ | 14,798,527 | |
ftinstitutional.com The accompanying notes are an integral part of these consolidated financial statements. | Semiannual Report | 17
FRANKLIN GLOBAL TRUST
Notes to Consolidated Financial Statements (unaudited)
Franklin Emerging Market Debt Opportunities Fund
1. Organization and Significant Accounting Policies
Franklin Global Trust (Trust) is registered under the Investment Company Act of 1940, as amended, (1940 Act) as an open-end management investment company, consisting of six separate funds and applies the specialized accounting and reporting guidance in U.S. Generally Accepted Accounting Principles (U.S. GAAP). Franklin Emerging Market Debt Opportunities Fund (Fund) is included in this report. The financial statements of the remaining funds in the Trust are presented separately.
The following summarizes the Fund’s significant accounting policies.
a. Financial Instrument Valuation
The Fund’s investments in financial instruments are carried at fair value daily. Fair value is the price that would be received to sell an asset or paid to transfer a liability in an orderly transaction between market participants on the measurement date. The Fund calculates the net asset value (NAV) per share at the close of the New York Stock Exchange (NYSE), generally at 4 p.m. Eastern time (NYSE close) on each day the NYSE is open for trading. Under compliance policies and procedures approved by the Trust’s Board of Trustees (the Board), the Fund’s administrator has responsibility for oversight of valuation, including leading the cross-functional Valuation and Liquidity Oversight Committee (VLOC). The VLOC provides administration and oversight of the Fund’s valuation policies and procedures, which are approved annually by the Board. Among other things, these procedures allow the Fund to utilize independent pricing services, quotations from securities and financial instrument dealers, and other market sources to determine fair value.
Equity securities listed on an exchange or on the NASDAQ National Market System are valued at the last quoted sale price or the official closing price of the day, respectively. Foreign equity securities are valued as of the close of trading on the foreign stock exchange on which the security is primarily traded or as of the NYSE close, whichever is earlier. The value is then converted into its U.S. dollar equivalent at the foreign exchange rate in effect at the NYSE close on the day that the value of the security is determined. Over-the-counter (OTC) securities are valued within the range of the most recent quoted bid and ask prices. Securities that trade in multiple markets or on multiple exchanges are valued according to the broadest and most representative market. Certain equity securities are valued based upon fundamental characteristics or relationships to similar securities. Investments in open-end mutual funds are valued at the closing NAV.
Debt securities generally trade in the OTC market rather than on a securities exchange. The Fund’s pricing services use multiple valuation techniques to determine fair value. In instances where sufficient market activity exists, the pricing services may utilize a market-based approach through which quotes from market makers are used to determine fair value. In instances where sufficient market activity may not exist or is limited, the pricing services also utilize proprietary valuation models which may consider market characteristics such as benchmark yield curves, credit spreads, estimated default rates, anticipated market interest rate volatility, coupon rates, anticipated timing of principal repayments, underlying collateral, and other unique security features in order to estimate the relevant cash flows, which are then discounted to calculate the fair value. Securities denominated in a foreign currency are converted into their U.S. dollar equivalent at the foreign exchange rate in effect at the NYSE close on the date that the values of the foreign debt securities are determined.
Certain derivative financial instruments (derivatives) trade in the OTC market. The Fund’s pricing services use various techniques including industry standard option pricing models and proprietary discounted cash flow models to determine the fair value of those instruments. The Fund’s net benefit or obligation under the derivative contract, as measured by the fair value of the contract, is included in net assets.
The Fund has procedures to determine the fair value of financial instruments for which market prices are not reliable or readily available. Under these procedures, the VLOC convenes on a regular basis to review such financial instruments and considers a number of factors, including significant unobservable valuation inputs, when arriving at fair value. The VLOC primarily employs a market-based approach which may use related or comparable assets or liabilities, recent transactions, market multiples, book values, and other relevant information for the investment to determine the fair value of the investment. An income-based valuation approach may also be used in which the anticipated future cash flows of the investment are discounted to calculate fair value. Discounts may also be applied due to the nature or duration of any restrictions on the disposition of the investments. Due to the inherent uncertainty of valuations of such investments, the fair values may differ
18 | Semiannual Report
ftinstitutional.com
FRANKLIN GLOBAL TRUST
NOTES TO CONSOLIDATED FINANCIAL STATEMENTS (UNAUDITED)
Franklin Emerging Market Debt Opportunities Fund (continued)
significantly from the values that would have been used had an active market existed. The VLOC employs various methods for calibrating these valuation approaches including a regular review of key inputs and assumptions, transactional back-testing or disposition analysis, and reviews of any related market activity.
Trading in securities on foreign securities stock exchanges and OTC markets may be completed before the daily NYSE close. In addition, trading in certain foreign markets may not take place on every NYSE business day. Occasionally, events occur between the time at which trading in a foreign security is completed and the close of the NYSE that might call into question the reliability of the value of a portfolio security held by the Fund. As a result, differences may arise between the value of the Fund’s portfolio securities as determined at the foreign market close and the latest indications of value at the close of the NYSE. In order to minimize the potential for these differences, the VLOC monitors price movements following the close of trading in foreign stock markets through a series of country specific market proxies (such as baskets of American Depositary Receipts, futures contracts and exchange traded funds). These price movements are measured against established trigger thresholds for each specific market proxy to assist in determining if an event has occurred that may call into question the reliability of the values of the foreign securities held by the Fund. If such an event occurs, the securities may be valued using fair value procedures, which may include the use of independent pricing services.
When the last day of the reporting period is a non-business day, certain foreign markets may be open on those days that the NYSE is closed, which could result in differences between the value of the Fund’s portfolio securities on the last business day and the last calendar day of the reporting period. Any significant security valuation changes due to an open foreign market are adjusted and reflected by the Fund for financial reporting purposes.
b. Foreign Currency Translation
Portfolio securities and other assets and liabilities denominated in foreign currencies are translated into U.S. dollars based on the exchange rate of such currencies against U.S. dollars on the date of valuation. The Fund may enter into foreign currency exchange contracts to facilitate transactions denominated in a foreign currency. Purchases and sales of securities, income and expense items denominated in foreign currencies are translated into U.S. dollars at the exchange rate in effect on the transaction date. Portfolio securities and assets and liabilities denominated in foreign currencies contain risks that those currencies will decline in value relative to the U.S. dollar. Occasionally, events may impact the availability or reliability of foreign exchange rates used to convert the U.S. dollar equivalent value. If such an event occurs, the foreign exchange rate will be valued at fair value using procedures established and approved by the Board.
The Fund does not separately report the effect of changes in foreign exchange rates from changes in market prices on securities held. Such changes are included in net realized and unrealized gain or loss from investments in the Consolidated Statement of Operations.
Realized foreign exchange gains or losses arise from sales of foreign currencies, currency gains or losses realized between the trade and settlement dates on securities transactions and the difference between the recorded amounts of dividends, interest, and foreign withholding taxes and the U.S. dollar equivalent of the amounts actually received or paid. Net unrealized foreign exchange gains and losses arise from changes in foreign exchange rates on foreign denominated assets and liabilities other than investments in securities held at the end of the reporting period.
c. Derivative Financial Instruments
The Fund invested in derivatives in order to manage risk or gain exposure to various other investments or markets. Derivatives are financial contracts based on an underlying or notional amount, require no initial investment or an initial net investment that is smaller than would normally be required to have a similar response to changes in market factors, and require or permit net settlement. Derivatives contain various risks including the potential inability of the counterparty to fulfill their obligations under the terms of the contract, the potential for an illiquid secondary market, and/or the potential for market movements which expose the Fund to gains or losses in excess of the amounts shown in the Consolidated Statement of Assets and Liabilities. Realized gain and loss and unrealized appreciation and depreciation on these contracts for the period are included in the Consolidated Statement of Operations.
Derivative counterparty credit risk is managed through a formal evaluation of the creditworthiness of all potential counterparties. The Fund attempts to reduce its exposure to
ftinstitutional.com
Semiannual Report | 19
FRANKLIN GLOBAL TRUST
NOTES TO CONSOLIDATED FINANCIAL STATEMENTS (UNAUDITED)
Franklin Emerging Market Debt Opportunities Fund (continued)
1. Organization and Significant Accounting
Policies (continued)
c. Derivative Financial Instruments (continued)
counterparty credit risk on OTC derivatives, whenever possible, by entering into International Swaps and Derivatives Association (ISDA) master agreements with certain counter-parties. These agreements contain various provisions, including but not limited to collateral requirements, events of default, or early termination. Termination events applicable to the counter-party include certain deteriorations in the credit quality of the counterparty. Termination events applicable to the Fund include failure of the Fund to maintain certain net asset levels and/or limit the decline in net assets over various periods of time. In the event of default or early termination, the ISDA master agreement gives the non-defaulting party the right to net and close-out all transactions traded, whether or not arising under the ISDA agreement, to one net amount payable by one coun-terparty to the other. However, absent an event of default or early termination, OTC derivative assets and liabilities are presented gross and not offset in the Consolidated Statement of Assets and Liabilities. Early termination by the counterparty may result in an immediate payment by the Fund of any net liability owed to that counterparty under the ISDA agreement. At January 31, 2015, the Fund had no OTC derivatives in a net liability position for such contracts.
Collateral requirements differ by type of derivative. Collateral terms are contract specific for OTC derivatives. For OTC derivatives traded under an ISDA master agreement, posting of collateral is required by either the fund or the applicable counterparty if the total net exposure of all OTC derivatives with the applicable counterparty exceeds the minimum transfer amount, which typically ranges from $100,000 to $250,000, and can vary depending on the counterparty and the type of the agreement. Generally, collateral is determined at the close of fund business each day and any additional collateral required due to changes in derivative values may be delivered by the fund or the counterparty within a few business days. Collateral pledged and/or received by the fund, if any, is held in segregated accounts with the fund’s custodian/counterparty broker and can be in the form of cash and/or securities. Unrestricted cash may be invested according to the Fund’s investment objectives.
At January 31, 2015, the Fund received $1,238,614 in U.S. Treasury Bonds and Notes as collateral for derivatives.
The Fund entered into OTC forward exchange contracts primarily to manage and/or gain exposure to certain foreign currencies. A forward exchange contract is an agreement between the Fund and a counterparty to buy or sell a foreign currency at a specific exchange rate on a future date.
See Note 11 regarding other derivative information.
d. Restricted Cash
At January 31, 2015, the Fund held restricted cash in connection with investments in certain derivative securities. Restricted cash is held in a segregated account with the Fund’s custodian and is reflected in the Consolidated Statement of Assets and Liabilities.
e. Loan Participations and Assignments
The Fund may invest in debt instruments which are interests in amounts owed to lenders or lending syndicates by corporate, governmental, or other borrowers. The Fund’s investments in loans may be in the form of participations in loans or assignments of all or portion of loans from third parties. A loan is often administered by a bank or other financial institution (the lender”) that acts as agent for all holders. The agent administers the terms of the loan, as specified in the loan agreement. The Fund may invest in multiple series or tranches of a loan, which may have varying terms and carry different associated risks. When investing in a loan participation, a Fund has the right to receive payments of principal, interest and any fees only from the lender selling the loan and only upon receipt of payments from the borrower. The Fund generally has no right to enforce compliance with the terms of the loan agreement with the borrower. As a result, the Fund may be subject to credit risk of both the borrower and the lender that is selling the loan. When the Fund purchases assignments from lenders it acquires direct rights against the borrower of the loan.
f. Credit-Linked Notes
The Fund purchases credit-linked notes. Credit-linked notes are intended to replicate the economic effects that would apply had the Fund directly purchased the underlying reference asset. The risks of credit-linked notes include the potential default of the underlying reference asset, the movement in the value of the currency of the underlying reference asset relative to the credit-linked note, the potential inability of the Fund to dispose of the credit-linked note in the normal course of business, and the possible inability of the counterparties to fulfill their obligations under the contracts.
20 | Semiannual Report
ftinstitutional.com
FRANKLIN GLOBAL TRUST
NOTES TO CONSOLIDATED FINANCIAL STATEMENTS (UNAUDITED)
Franklin Emerging Market Debt Opportunities Fund (continued)
g. Investment in Alternative Strategies (FT) Ltd. (FT Subsidiary)
The Fund invests in certain financial instruments, warrants or commodities through its investment in the FT Subsidiary. The FT Subsidiary is a Cayman Islands exempted company with limited liability, is a wholly-owned subsidiary of the Fund, and is able to invest in certain financial instruments consistent with the investment objective of the Fund. At January 31, 2015, the FT Subsidiary’s investments as well as any other assets and liabilities of the FT Subsidiary are reflected in the Fund’s Consolidated Statement of Investments and Consolidated Statement of Assets and Liabilities. The financial statements have been consolidated and include the accounts of the Fund and the FT Subsidiary. All intercompany transactions and balances have been eliminated. At January 31, 2015, the net assets of the FT Subsidiary were $17,556,675, representing 2.98% of the Fund’s consolidated net assets. The Fund’s investment in the FT Subsidiary is limited to 25% of consolidated assets.
h. Income and Deferred Taxes
It is the Fund’s policy to qualify as a regulated investment company under the Internal Revenue Code. The Fund intends to distribute to shareholders substantially all of its taxable income and net realized gains to relieve it from federal income and excise taxes. As a result, no provision for U.S. federal income taxes is required.
The Fund may be subject to foreign taxation related to income received, capital gains on the sale of securities and certain foreign currency transactions in the foreign jurisdictions in which it invests. Foreign taxes, if any, are recorded based on the tax regulations and rates that exist in the foreign markets in which the Fund invests. When a capital gain tax is determined to apply the Fund records an estimated deferred tax liability in an amount that would be payable if the securities were disposed of on the valuation date.
The Fund recognizes the tax benefits of uncertain tax positions only when the position is “more likely than not” to be sustained upon examination by the tax authorities based on the technical merits of the tax position. As of January 31, 2015, and for all open tax years, the Fund has determined that no liability for unrecognized tax benefits is required in the Fund’s financial statements related to uncertain tax positions taken on a tax return (or expected to be taken on future tax returns). Open tax years are those that remain subject to examination and are based on each tax jurisdiction statute of limitation.
i. Security Transactions, Investment Income, Expenses and Distributions
Security transactions are accounted for on trade date. Realized gains and losses on security transactions are determined on a specific identification basis. Interest income and estimated expenses are accrued daily. Amortization of premium and accretion of discount on debt securities are included in interest income. Dividend income is recorded on the ex-dividend date except for certain dividends from foreign securities where the dividend rate is not available. In such cases, the dividend rate is recorded as soon as the information is received by the Fund. Distributions to shareholders are recorded on the ex-dividend date and are determined according to income tax regulations (tax basis). Distributable earnings determined on a tax basis may differ from earnings recorded in accordance with U.S. GAAP. These differences may be permanent or temporary. Permanent differences are reclassified among capital accounts to reflect their tax character. These reclassifications have no impact on net assets or the results of operations. Temporary differences are not reclassified, as they may reverse in subsequent periods.
Common expenses incurred by the Trust are allocated among the funds based on the ratio of net assets of each fund to the combined net assets of the Trust. Fund specific expenses are charged directly to the fund that incurred the expense.
Inflation-indexed bonds are adjusted for inflation through periodic increases or decreases in the security’s interest accruals, face amount, or principal redemption value, by amounts corresponding to the rate of inflation as measured by an index. Any increase or decrease in the face amount or principal redemption value will be included as inflation principal adjustments in the Consolidated Statement of Operations.
j. Accounting Estimates
The preparation of financial statements in accordance with U.S. GAAP requires management to make estimates and assumptions that affect the reported amounts of assets and liabilities at the date of the financial statements and the amounts of income and expenses during the reporting period. Actual results could differ from those estimates.
ftinstitutional.com
Semiannual Report | 21
FRANKLIN GLOBAL TRUST
NOTES TO CONSOLIDATED FINANCIAL STATEMENTS (UNAUDITED)
Franklin Emerging Market Debt Opportunities Fund (continued)
1. Organization and Significant Accounting
Policies (continued)
k. Guarantees and Indemnifications
Under the Trust’s organizational documents, its officers and trustees are indemnified by the Trust against certain liabilities arising out of the performance of their duties to the Trust.
Additionally, in the normal course of business, the Trust, on behalf of the Fund, enters into contracts with service providers that contain general indemnification clauses. The Trust’s maximum exposure under these arrangements is unknown as this would involve future claims that may be made against the Trust that have not yet occurred. Currently, the Trust expects the risk of loss to be remote.
2. Shares of Beneficial Interest
At January 31, 2015, there were an unlimited number of shares authorized (without par value). Transactions in the Fund’s shares were as follows:
| | | | | | | | | | |
| | Six Months Ended | | Year Ended | |
| | January 31, 2015 | | July 31, 2014 | |
| | Shares | | | Amount | | Shares | | | Amount | |
| Shares sold | 6,322,964 | | $ | 75,335,957 | | 10,773,400 | | $ | 129,807,757 | |
| Shares issued in reinvestment of distributions | 4,440,488 | | | 46,625,128 | | 2,273,662 | | | 26,465,438 | |
| Shares redeemed | (5,745,728 | ) | | (66,208,328 | ) | (9,177,157 | ) | | (110,167,923 | ) |
| Net increase (decrease) | 5,017,724 | | $ | 55,752,757 | | 3,869,905 | | $ | 46,105,272 | |
3. Transactions with Affiliates
Franklin Resources, Inc. is the holding company for various subsidiaries that together are referred to as Franklin Templeton Investments. Certain officers and trustees of the Trust are also officers and/or directors of the following subsidiaries:
| |
| Subsidiary | Affiliation |
| Franklin Templeton Investment Management Limited (FTIML) | Investment manager |
| Franklin Templeton Services, LLC (FT Services) | Administrative manager |
| Franklin Templeton Investor Services, LLC (Investor Services) | Transfer agent |
a. Management Fees
The Fund and FT Subsidiary pay an investment management fee to FTIML based on the average daily net assets of each of the Fund and FT Subsidiary as follows:
| | |
| Annualized Fee Rate | | Net Assets |
| 1.000 | % | Up to and including $500 million |
| 0.900 | % | Over $500 million, up to and including $1 billion |
| 0.850 | % | In excess of $1 billion |
Management fees paid by the Fund are reduced on assets invested in the FT Subsidiary, in an amount not to exceed the management fees paid by the FT Subsidiary.
b. Administrative Fees
Under an agreement with FTIML, FT Services provides administrative services to the Fund and FT Subsidiary. The fee is paid by FTIML based on each of the Fund’s and FT Subsidiary’s average daily net assets, and is not an additional expense of the Fund or FT Subsidiary.
22 | Semiannual Report
ftinstitutional.com
FRANKLIN GLOBAL TRUST
NOTES TO CONSOLIDATED FINANCIAL STATEMENTS (UNAUDITED)
Franklin Emerging Market Debt Opportunities Fund (continued)
c. Transfer Agent Fees
The Fund pays transfer agent fees to Investor Services for its performance of shareholder servicing obligations and reimburses Investor Services for out of pocket expenses incurred, including shareholding servicing fees paid to third parties.
For the period ended January 31, 2015, the Fund paid transfer agent fees of $28,629 of which $27,140 was retained by Investor Services.
d. Investment in Institutional Fiduciary Trust Money Market Portfolio
The Fund invests in Institutional Fiduciary Trust Money Market Portfolio (Sweep Money Fund), an affiliated open-end management investment company. Management fees paid by the Fund are waived on assets invested in the Sweep Money Fund, as noted in the Consolidated Statement of Operations, in an amount not to exceed the management and administrative fees paid directly or indirectly by the Sweep Money Fund. Prior to August 1, 2013, the waiver was accounted for as a reduction to management fees.
e. Waiver and Expense Reimbursements
FTIML has contractually agreed in advance to waive or limit its fees and to assume as its own expense certain expenses otherwise payable by the Fund so that the expenses (excluding acquired fund fees and expenses) do not exceed 1.00% (other than certain non-routine expenses or costs, including those relating to litigation, indemnification, reorganizations, and liquidations) until November 30, 2015.
f. Other Affiliated Transactions
At January 31, 2015, one or more of the funds in Franklin Fund Allocator Series owned 20.68% of the Fund’s outstanding shares.
4. Expense Offset Arrangement
The Fund has entered into an arrangement with its custodian whereby credits realized as a result of uninvested cash balances are used to reduce a portion of the Fund’s custodian expenses. During the period ended January 31, 2015, the custodian fees were reduced as noted in the Consolidated Statement of Operations.
5. Income Taxes
At January 31, 2015, the cost of investments and net unrealized appreciation (depreciation) for income tax purposes were as follows:
| | | |
| Cost of investments | $ | 645,847,250 | |
| |
| Unrealized appreciation | $ | 20,568,635 | |
| Unrealized depreciation | | (99,249,951 | ) |
| Net unrealized appreciation (depreciation) | $ | (78,681,316 | ) |
Differences between income and/or capital gains as determined on a book basis and a tax basis are primarily due to differing treatments of bond discounts and premiums, and tax straddles.
6. Investment Transactions
Purchases and sales of investments (excluding short term securities) for the period ended January 31, 2015, aggregated $69,806,382 and $59,918,269, respectively.
ftinstitutional.com
Semiannual Report | 23
FRANKLIN GLOBAL TRUST
NOTES TO CONSOLIDATED FINANCIAL STATEMENTS (UNAUDITED)
Franklin Emerging Market Debt Opportunities Fund (continued)
7. Credit Risk and Defaulted Securities
At January 31, 2015, the Fund had 65.95% of its portfolio invested in high yield or other securities rated below investment grade. These securities may be more sensitive to economic conditions causing greater price volatility and are potentially subject to a greater risk of loss due to default than higher rated securities.
The Fund held defaulted securities and/or other securities for which the income has been deemed uncollectible. At January 31, 2015, the aggregate value of these securities was $14,153,208, representing 2.40% of the Fund’s net assets. The Fund discontinues accruing income on securities for which income has been deemed uncollectible and provides an estimate for losses on interest receivable. The securities have been identified in the accompanying Consolidated Statement of Investments.
8. Concentration of Risk
Investing in foreign securities may include certain risks and considerations not typically associated with investing in U.S. securities, such as fluctuating currency values and changing local and regional economic, political and social conditions, which may result in greater market volatility. In addition, certain foreign securities may not be as liquid as U.S. securities.
9. Restricted Securities
The Fund invests in securities that are restricted under the Securities Act of 1933 (1933 Act) or which are subject to legal, contractual, or other agreed upon restrictions on resale. Restricted securities are often purchased in private placement transactions, and cannot be sold without prior registration unless the sale is pursuant to an exemption under the 1933 Act. Disposal of these securities may require greater effort and expense, and prompt sale at an acceptable price may be difficult. The Fund may have registration rights for restricted securities. The issuer generally incurs all registration costs.
At January 31, 2015, the Fund held investments in restricted securities, excluding certain securities exempt from registration under the 1933 Act deemed to be liquid, as follows:
| | | | | | | |
| Principal | | | | | | | |
| Amount/ | | | Acquisition | | | | |
| Units | | Issuer | Dates | | Cost | | Value |
| 4,030,073 | | Global Distressed Alpha Fund III LP | 10/11/12 - 10/06/14 | $ | 4,205,212 | $ | 553,934 |
| 4,250,000 | DEM | NK Debt Corp., 144A, zero cpn., 3/12/20 | 6/19/07 - 10/14/08 | | 723,263 | | 58,913 |
| 18,000,000 | DEM | NK Debt Corp., Reg S, zero cpn., 3/12/20 | 1/25/11 - 6/06/11 | | 2,023,663 | | 249,515 |
| 2,000,000 | CHF | NK Debt Corp., Reg S, zero cpn., 3/12/20 | 6/17/11 | | 388,830 | | 52,231 |
| | | Total Restricted Securities (Value is 0.16% of Net Assets) | | $ | 7,340,968 | $ | 914,593 |
10. Unfunded Loan Commitments
The Fund enters into certain credit agreements, all or a portion of which may be unfunded. The Fund is obligated to fund these loan commitments at the borrowers’ discretion. Funded portions of credit agreements are presented in the Consolidated Statement of Investments.
| | |
| At January 31, 2015, unfunded commitments were as follows: |
| | | Unfunded |
| | | Commitment |
| Borrower | | |
| Ethiopian Railway Corp. (Republic of Ethiopia) | $ | 2,651,141 |
| Global Distressed Alpha Fund III LP | | 394,788 |
| Total | $ | 3,045,929 |
24 | Semiannual Report ftinstitutional.com
FRANKLIN GLOBAL TRUST
NOTES TO CONSOLIDATED FINANCIAL STATEMENTS (UNAUDITED)
Franklin Emerging Market Debt Opportunities Fund (continued)
Unfunded loan commitments and funded portions of credit agreements are marked to market daily and any unrealized appreciation or depreciation is included in the Consolidated Statement of Assets and Liabilities and the Consolidated Statement of Operations.
11. Other Derivative Information
At January 31, 2015, the Fund’s investments in derivative contracts are reflected in the Consolidated Statement of Assets and Liabilities as follows:
| | | | | | |
| | Asset Derivatives | | | Liability Derivatives | | |
| Derivative Contracts | Consolidated | | | Consolidated | | |
| Not Accounted for as | Statement of Assets and | | | Statement of Assets and | | |
| Hedging Instruments | Liabilities Location | | Fair Value | Liabilities Location | | Fair Value |
| Foreign exchange contracts | Unrealized appreciation on | | | Unrealized depreciation on | | |
| | forward exchange contracts | $ | 4,205,650 | forward exchange contracts | $ | 652,362 |
For the period ended January 31, 2015, the effect of derivative contracts in the Fund’s Consolidated Statement of Operations
| | | | | |
| was as follows: | | | | | |
| | | | | | Change in |
| | | | | | Unrealized |
| Derivative Contracts | | | Realized | | Appreciation |
| Not Accounted for as | | | Gain (Loss) | | (Depreciation) |
| Hedging Instruments | Consolidated Statement of Operations Locations | | for the Period | | for the Period |
| Foreign exchange contracts | Net realized gain (loss) from investments and foreign | | | | |
| | currency transactions / Net change in unrealized | | | | |
| | appreciation (depreciation) on translation of other | | | | |
| | assets and liabilities denominated in foreign currencies | $ | 6,860,379 | $ | 2,802,621 |
For the period ended January 31, 2015, the average month end fair value of derivatives represented 0.43% of average month end net assets. The average month end number of open derivative contracts for the period was 7.
See Note 1(c) regarding derivative financial instruments.
12. Credit Facility
The Fund, together with other U.S. registered and foreign investment funds (collectively, Borrowers), managed by Franklin Templeton Investments, are borrowers in a joint syndicated senior unsecured credit facility totaling $1.5 billion (Global Credit Facility) which matured on February 13, 2015. This Global Credit Facility provides a source of funds to the Borrowers for temporary and emergency purposes, including the ability to meet future unanticipated or unusually large redemption requests. Effective February 13, 2015, the Borrowers renewed the Global Credit Facility for a one year term, maturing February 12, 2016, for a total of $2 billion.
Under the terms of the Global Credit Facility, the Fund shall, in addition to interest charged on any borrowings made by the Fund and other costs incurred by the Fund, pay its share of fees and expenses incurred in connection with the implementation and maintenance of the Global Credit Facility, based upon its relative share of the aggregate net assets of all of the Borrowers, including an annual commitment fee of 0.07% based upon the unused portion of the Global Credit Facility. These fees are reflected in other expenses in the Consolidated Statement of Operations. During the period ended January 31, 2015, the Fund did not use the Global Credit Facility.
ftinstitutional.com
Semiannual Report | 25
FRANKLIN GLOBAL TRUST
NOTES TO CONSOLIDATED FINANCIAL STATEMENTS (UNAUDITED)
Franklin Emerging Market Debt Opportunities Fund (continued)
13. Fair Value Measurements
The Fund follows a fair value hierarchy that distinguishes between market data obtained from independent sources (observable inputs) and the Fund’s own market assumptions (unobservable inputs). These inputs are used in determining the value of the Fund’s financial instruments and are summarized in the following fair value hierarchy:
- Level 1 – quoted prices in active markets for identical financial instruments
- Level 2 – other significant observable inputs (including quoted prices for similar financial instruments, interest rates, prepayment speed, credit risk, etc.)
- Level 3 – significant unobservable inputs (including the Fund’s own assumptions in determining the fair value of financial instruments)
The input levels are not necessarily an indication of the risk or liquidity associated with financial instruments at that level.
For movements between the levels within the fair value hierarchy, the Fund has adopted a policy of recognizing the transfers as of the date of the underlying event which caused the movement.
A summary of inputs used as of January 31, 2015, in valuing the Fund’s assets and liabilities carried at fair value, is as follows:
| | | | | | | | |
| | | Level 1 | | Level 2 | | Level 3 | | Total |
| Assets: | | | | | | | | |
| Investments in Securities: | | | | | | | | |
| Warrants | $ | — | $ | 4,725,000 | $ | 9,152,000 | $ | 13,877,000 |
| Quasi-Sovereign and Corporate Bonds | | — | | 151,808,672 | | 8,684,136 | | 160,492,808 |
| Loan Participations and Assignments | | — | | 51,979,197 | | 34,419,394 | | 86,398,591 |
| Credit-Linked Notes | | — | | 259,006 | | — | | 259,006 |
| Foreign Government and Agency Securities | | — | | 249,609,491 | | — | | 249,609,491 |
| Common Stocks | | — | | — | | —a | | — |
| Private Limited Partnership Fund | | — | | — | | 553,934 | | 553,934 |
| Short Term Investments | | 41,153,311 | | 14,821,793 | | — | | 55,975,104 |
| Total Investments in Securities | $ | 41,153,311 | $ | 473,203,159 | $ | 52,809,464 | $ | 567,165,934 |
| Other Financial Instruments: | | | | | | | | |
| Forward Exchange Contracts | $ | — | $ | 4,205,650 | $ | — | $ | 4,205,650 |
| Loan Participations and Assignments – Unfunded Commitment | | — | | — | | 66,279 | | 66,279 |
| Total Other Financial Instruments | $ | — | $ | 4,205,650 | $ | 66,279 | $ | 4,271,929 |
| Liabilities: | | | | | | | | |
| Other Financial Instruments: | | | | | | | | |
| Forward Exchange Contracts | $ | — | $ | 652,362 | $ | — | $ | 652,362 |
| Private Limited Partnership Fund – Unfunded Commitment | | — | | — | | 340,524 | | 340,524 |
| Total Other Financial Instruments | $ | — | $ | 652,362 | $ | 340,524 | $ | 992,886 |
| aIncludes securities determined to have no value at January 31, 2015. | | | | | | | | |
26 | Semiannual Report
ftinstitutional.com
FRANKLIN GLOBAL TRUST
NOTES TO CONSOLIDATED FINANCIAL STATEMENTS (UNAUDITED)
Franklin Emerging Market Debt Opportunities Fund (continued)
A reconciliation of assets and liabilities in which Level 3 inputs are used in determining fair value is presented when there are significant Level 3 financial instruments at the end of the period. At January 31, 2015, the reconciliation of assets and liabilities, is as follows:
| | | | | | | | | | | | | | | | | | | | | |
| | | | | | | | | | | | | | | | | | | | | Net Change | |
| | | | | | | | | | | | | | | | | | | | | in Unrealized | |
| | | | | | | | | | | | | | Net | | Net | | | | | Appreciation | |
| | | Balance at | | | | | | Transfers | | | | | Realized | | Unrealized | | | Balance | | (Depreciation) | |
| | | Beginning | | | | | | Into (Out of) | | Cost Basis | | | Gain | | Appreciation | | | at End | | on Assets Held | |
| | | of Period | | Purchases | | Sales | | Level 3 | | Adjustmentsa | | | (Loss) | | (Depreciation) | | | of Period | | at Period End | |
| Assets | | | | | | | | | | | | | | | | | | | | | |
| Investments in Securities: | | | | | | | | | | | | | | | | | | | | | |
| Warrants | $ | 9,920,000 | $ | — | $ | — | $ | — | $ | — | | $ | — | $ | (768,000 | ) | $ | 9,152,000 | $ | (768,000 | ) |
| Quasi-Sovereign and Corporate | | | | | | | | | | | | | | | | | | | | | |
| Bonds | | 8,406,320 | | — | | — | | — | | — | | | — | | 277,816 | | | 8,684,136 | | 277,816 | |
| Loan Participations and | | | | | | | | | | | | | | | | | | | | | |
| Assignments | | 29,693,263 | | 6,012,163 | | — | | — | | (151,825 | ) | | — | | (1,134,207 | ) | | 34,419,394 | | (1,134,207 | ) |
| Private Limited Partnership | | | | | | | | | | | | | | | | | | | | | |
| Fund | | 110,995 | | 330,240 | | — | | — | | — | | | — | | 112,699 | | | 553,934 | | 112,699 | |
| Total Investments in Securities | $ | 48,130,578 | $ | 6,342,403 | $ | — | $ | — | $ | (151,825 | ) | $ | — | $ | (1,511,692 | ) | $ | 52,809,464 | $ | (1,511,692 | ) |
| Other Financial Instruments | | | | | | | | | | | | | | | | | | | | | |
| Loan Participations and Assignments – | | | | | | | | | | | | | | | | | | | | | |
| Unfunded Commitment | $ | — | $ | — | $ | — | $ | — | $ | — | | $ | — | $ | 66,279 | | $ | 66,279 | $ | 66,279 | |
| Liabilities | | | | | | | | | | | | | | | | | | | | | |
| Other Financial Instruments | | | | | | | | | | | | | | | | | | | | | |
| Private Limited Partnership Fund – | | | | | | | | | | | | | | | | | | | | | |
| Unfunded Commitment | $ | — | $ | — | $ | — | $ | — | $ | — | | $ | — | $ | 340,524 | | $ | 340,524 | $ | 340,524 | |
aMay include accretion, amortization, partnership adjustments, and/or other cost basis adjustments.
Significant unobservable valuation inputs developed by the VLOC for material Level 3 financial instruments and impact to fair value as a result of changes in unobservable valuation inputs as of January 31, 2015, are as follows:
| | | | | | | | | |
| | | | | | | | | | Impact to Fair |
| | | Fair Value at | | | Unobservable | | Amount/ | | Value if Input |
| Description | | End of Period | | Valuation Technique | Inputs | | Range | | Increasesa |
| Assets: | | | | | | | | | |
| Investments in Securities: | | | | | | | | | |
| Quasi-Sovereign and Corporate | | | | | | | | | |
| Bonds | $ | 8,684,136 | | Probability Weighted | | | | | |
| | | | | Discounted Cash Flow | | | | | |
| | | | | Model | Free Cash Flowb | | $0.0 - $13.3 (mil) | | Increasec |
| | | | | Market Comparables | Discount for lack | | | | |
| | | | | | of marketability | | 20 | % | Decreased |
| Loan Participations and | | | | | | | | | |
| Assignments | | 4,742,053 | | Consensus Pricing | Weighted average | | | | |
| | | | | | of offered quotes | $ | 62.00 - $69.53 | | Increased |
| All Other Investmentse | | 39,449,554 | f | | | | | | |
| Total | $ | 52,875,743 | | | | | | | |
ftinstitutional.com Semiannual Report | 27
FRANKLIN GLOBAL TRUST
NOTES TO CONSOLIDATED FINANCIAL STATEMENTS (UNAUDITED)
Franklin Emerging Market Debt Opportunities Fund (continued)
13. Fair Value Measurements (continued)
| | |
| | | Fair Value at |
| Description | | End of Period |
| Liabilities: | | |
| Other Financial Instruments: | | |
| Private Limited Partnership Fund – | | |
| Unfunded Commitmente | $ | 340,524 |
aRepresents the directional change in the fair value of the Level 3 financial instruments that would result from a significant and reasonable increase in the corresponding
input. A significant and reasonable decrease in the input would have the opposite effect. Significant impacts, if any, to fair value and/or net assets have been indicated.
bIncludes probability assumptions for various outcomes from ongoing legal proceedings.
cRepresents a significant impact to fair value and net assets.
dRepresents a significant impact to fair value but not net assets.
eIncludes financial instruments with values derived using prior transaction prices or third party pricing information without adjustment for which such inputs are unobservable.
May also include fair value of immaterial financial instruments developed using various valuation techniques and unobservable inputs.
fIncludes securities determined to have no value at January 31, 2015.
14. Subsequent Events
The Fund has evaluated subsequent events through the issuance of the consolidated financial statements and determined that no events have occurred that require disclosure other than those already disclosed in the consolidated financial statements.
| | | | | |
| Abbreviations | | | | |
| Counterparty | Currency | Selected Portfolio |
| CITI | Citibank N.A. | BRL | Brazilian Real | ADR | American Depositary Receipt |
| MSCO | Morgan Stanley | CHF | Swiss Franc | FRN | Floating Rate Note |
| RBCCM | Royal Bank of Canada | COP | Colombian Peso | PTN | Pass-through Note |
| | | CRC | Costa Rican Colon | | |
| | | DEM | Deutsche Mark | | |
| | | DOP | Dominican Peso | | |
| | | EUR | Euro | | |
| | | GHS | Ghanaian Cedi | | |
| | | INR | Indian Rupee | | |
| | | JPY | Japanese Yen | | |
| | | KES | Kenyan Shilling | | |
| | | MXN | Mexican Peso | | |
| | | NGN | Nigerian Naira | | |
| | | RSD | Serbian Dinar | | |
| | | RUB | Russian Ruble | | |
| | | TRY | Turkish Lira | | |
| | | UAH | Ukraine Hryvnia | | |
| | | UGX | Ugandan Shilling | | |
| | | UYU | Uruguayan Peso | | |
| | | ZAR | South African Rand | | |
| | | ZMW Zambian Kwacha | | |
28 | Semiannual Report ftinstitutional.com
FRANKLIN GLOBAL TRUST
FRANKLIN EMERGING MARKET DEBT OPPORTUNITIES FUND
Shareholder Information
Proxy Voting Policies and Procedures
The Trust’s investment manager has established Proxy Voting Policies and Procedures (Policies) that the Trust uses to determine how to vote proxies relating to portfolio securities. Shareholders may view the Trust’s complete Policies online at franklintempleton.com. Alternatively, shareholders may request copies of the Policies free of charge by calling the Proxy Group collect at (954) 527-7678 or by sending a written request to: Franklin Templeton Companies, LLC, 300 S.E. 2nd Street, Fort Lauderdale, FL 33301, Attention: Proxy Group. Copies of the Trust’s proxy voting records are also made available online at franklintempleton.com and posted on the U.S. Securities and Exchange Commission’s website at sec.gov and reflect the most recent 12-month period ended June 30.
Quarterly Statement of Investments
The Trust files a complete statement of investments with the U.S. Securities and Exchange Commission for the first and third quarters for each fiscal year on Form N-Q. Shareholders may view the filed Form N-Q by visiting the Commission’s website at sec.gov. The filed form may also be viewed and copied at the Commission’s Public Reference Room in Washington, DC. Information regarding the operations of the Public Reference Room may be obtained by calling (800) SEC-0330.
ftinstitutional.com
Semiannual Report | 29
This page intentionally left blank.
This page intentionally left blank.
This page intentionally left blank.

Franklin Templeton Investments
Gain From Our Perspective®
At Franklin Templeton Investments, we’re dedicated to one goal: delivering exceptional asset management for our clients. By bringing together multiple, world-class investment teams in a single firm, we’re able to offer specialized expertise across styles and asset classes, all supported by the strength and resources of one of the world’s largest asset managers. This has helped us to become a trusted partner to individual and institutional investors across the globe.
Focus on Investment Excellence
At the core of our firm, you’ll find multiple independent investment teams—each with a focused area of expertise—from traditional to alternative strategies and multi-asset solutions. And because our portfolio groups operate autonomously, their strategies can be combined to deliver true style and asset class diversification.
All of our investment teams share a common commitment to excellence grounded in rigorous, fundamental research and robust, disciplined risk management. Decade after decade, our consistent, research-driven processes have helped Franklin Templeton earn an impressive record of strong, long-term results.
Global Perspective Shaped by Local Expertise
In today’s complex and interconnected world, smart investing demands a global perspective. Franklin Templeton pioneered international investing over 60 years ago, and our expertise in emerging markets spans more than a quarter of a century. Today, our investment professionals are on the ground across the globe, spotting investment ideas and potential risks firsthand. These locally based teams bring in-depth understanding of local companies, economies and cultural nuances, and share their best thinking across our global research network.
Strength and Experience
Franklin Templeton is a global leader in asset management serving clients in over 150 countries.1 We run our business with the same prudence we apply to asset management, staying focused on delivering relevant investment solutions, strong long-term results and reliable, personal service. This approach, focused on putting clients first, has helped us to become one of the most trusted names in financial services.
1. As of 12/31/14. Clients are represented by the total number of shareholder accounts.
Not FDIC Insured | May Lose Value | No Bank Guarantee
| |
| Contents | |
| |
| Shareholder Letter | 1 |
| Semiannual Report | |
| Franklin Global | |
| Listed Infrastructure Fund | 3 |
| Performance Summary | 7 |
| Your Fund’s Expenses | 10 |
| Financial Highlights and | |
| Statement of Investments | 12 |
| Financial Statements | 20 |
| Notes to Financial Statements | 24 |
| Shareholder Information | 31 |
1
Semiannual Report
Franklin Global Listed Infrastructure Fund
We are pleased to bring you Franklin Global Listed Infrastructure Fund’s semiannual report for the period ended January 31, 2015.
Your Fund’s Goal and Main Investments
The Fund seeks total investment return consisting of income and capital appreciation by investing, under normal market conditions, at least 80% of its net assets in securities listed on a domestic or foreign exchange of companies that are located around the world (including emerging markets) and whose principal business is the ownership, management, construction, operation, use or financing of infrastructure assets.
Performance Overview
For the period under review, the Fund’s Class A shares delivered a +0.38% cumulative total return. In comparison, the Standard & Poor’s® (S&P®) Global Infrastructure Index, which tracks performance of stocks of large infrastructure companies around the world, had a -0.48% cumulative total return.1 You can find more of the Fund’s performance data in the Performance Summary beginning on page 7.
Performance data represent past performance, which does not guarantee future results. Investment return and principal value will fluctuate, and you may have a gain or loss when you sell your shares. Current performance may differ from figures shown. Please visit franklintempleton.com or call (800) 342-5236 for most recent month-end performance.
Economic and Market Overview
U.S. economic growth trends were generally encouraging during the six months under review, although economic expansion moderated in 2014’s fourth quarter. A wider trade deficit and lower federal government spending partially offset the positive effect from greater spending by consumers, businesses, and state and local governments. Manufacturing and non-manufacturing activities increased, and the unemployment rate declined to 5.7% in January 2015 from 6.2% in July 2014.2 The housing market improved as home prices rose
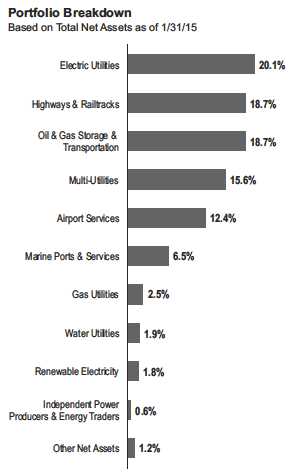
in most metropolitan areas and mortgage rates declined for the six-month period. Retail sales rose for most of the period but softened near period-end.
The U.S. Federal Reserve Board (Fed) ended its bond buying program in October 2014, based on its view that underlying economic strength could support ongoing progress in labor market conditions. The Fed stated that it could be patient with regard to raising interest rates and that it would consider inflationary pressures, labor market conditions, and financial and international developments in determining its next course of action.
1. Source: Morningstar.
The index is unmanaged and includes reinvested dividends. One cannot invest directly in an index, and an index is not representative of the Fund’s portfolio.
2. Source: Bureau of Labor Statistics.
The dollar value, number of shares or principal amount, and names of all portfolio holdings are listed in the Fund’s Statement of Investments (SOI).
The SOI begins on page 17.
franklintempleton.com Semiannual Report | 3
FRANKLIN GLOBAL LISTED INFRASTRUCTURE FUND
The global economy overall expanded moderately during the period even though economic activity in some countries slowed. Major developed market central banks generally reaffirmed their accommodative monetary policies to support economic recovery. Several emerging market central banks cut interest rates to boost economic growth, while others raised rates to control inflation and currency depreciation.
The U.K. economy grew relatively well, supported by the services and manufacturing sectors. In the eurozone, the economy showed signs of improvement as the gross domestic product growth rate picked up in the third and fourth quarters of 2014, led by Germany, the region’s largest economy. In addition to maintaining a low benchmark interest rate and a negative bank deposit rate, the European Central Bank (ECB) implemented a major asset purchase program to boost inflation and stimulate the economy. Although the region benefited from lower oil prices, a weaker euro that supported exports and the ECB’s accommodative policy, it continued to face headwinds such as deflationary pressures and the crisis in Ukraine. Near period-end, concerns arose about Greece’s election of a new prime minister whose platform included restructuring the terms of the country’s debt and loosening austerity mandates.
Japan slid into recession in the third quarter, prompting the Bank of Japan to broaden its stimulus measures amid weak domestic demand and lower inflation resulting from falling crude oil prices. In December, Japan’s ruling coalition was reelected and announced a new stimulus package to revive economic growth. The country exited recession in the fourth quarter, supported largely by exports, while growth in domestic consumption and capital spending remained relatively soft.
Global developed market stocks, as measured by the MSCI World Index, declined slightly for the six-month period as investor concerns about global economic growth, particularly in the eurozone, Japan and China, and the future course of U.S. monetary policy overshadowed continued corporate profit strength. During the period, oil prices plummeted mainly because of strong supply. Despite benign global inflation and a strong U.S. dollar, gold prices ended the period slightly higher after prices surged in January as oil prices weakened, the Swiss National Bank removed the franc’s peg to the euro and the ECB increased monetary stimulus.
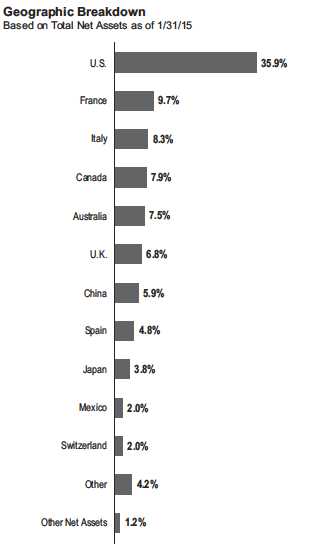
Investment Strategy
When selecting investments for the Fund’s portfolio, we use a bottom-up stock selection process that incorporates macro-level views in the evaluation process. Our portfolio construction process combines bottom-up analysis of individual stock and infrastructure market fundamentals with top-down macro overlays to provide country/regional, infrastructure sector and company size perspectives in identifying international/local cyclical and thematic trends that highlight investment opportunities. We may invest up to 20% of net assets in emerging markets and may invest in infrastructure-related companies of any market capitalization size. We may use currency forward or futures contracts from time to time to help manage currency risks and manage local currency exposure.
4 | Semiannual Report franklintempleton.com
FRANKLIN GLOBAL LISTED INFRASTRUCTURE FUND
What is a currency forward contract?
A currency forward contract is an agreement between the Fund and a counterparty to buy or sell a foreign currency at a specific exchange rate on a future date.
What is a futures contract?
A futures contract is an agreement between the Fund and a counterparty made through a U.S. or foreign futures exchange to buy or sell an asset at a specific price on a future date.
Manager’s Discussion
During the period under review, key contributors to the Fund’s performance relative to the S&P Global Infrastructure Index included an overweighted position in transportation infrastructure firm Japan Airport Terminal. Its share price benefited primarily from the internationalization of Haneda Airport, one of two primary airports that serve the Tokyo metropolitan area. Following the completion of the new international terminal in 2010 and subsequent expansion in the spring of 2014, Haneda Airport expected to experience significant international passenger traffic growth by the end of the decade. This passenger growth trend has driven continued improvement in retail sales and was projected to lead to robust operating income growth in the upcoming fiscal year. In recent months, Japanese airline operators reported strong international traffic growth trends at Haneda Airport, thus confirming our investment thesis.
An investment in New Jersey Resources also enhanced performance.3 The U.S. company provides regulated natural gas distribution service in several of New Jersey’s largest counties and, in our view, potentially offered earnings growth above the sector average resulting from a favorable regulatory regime and exposure to attractive customer growth dynamics. Its analyst day was a positive catalyst as the company highlighted that roughly 30% of its capital expenditures in the 2014–2017 fiscal period were projected to be invested in renewable energy and combined heat and power projects. New construction and oil-to-gas conversion projects were expected to drive New Jersey Resources’ gas distribution customer growth over the next few years. We believe additional growth should come from the company’s distribution system upgrades and storm-related projects. Moreover, New Jersey Resources is a smaller capitalization company with less analyst coverage than traditional U.S. electric utilities, and we believe investors should continue to find the story attractive, potentially driving further positive performance.
The Fund’s investment in Atmos Energy, one of the largest U.S. natural gas distributors, also supported performance.3 In November, the company reported positive earnings growth for its fiscal year 2014 and increased its next annual dividend 5.4%. The regulated pipeline segment and nonregulated midstream infrastructure segments generated strong profit growth. Additionally, the company’s operating cash flow growth increased significantly. Atmos Energy also enhanced its balance sheet by reducing its short-term debt and lowering its debt-to-capital ratio.
| | |
| Top 10 Holdings | | |
| 1/31/15 | | |
| Company | % of Total | |
| Sector/Industry, Country | Net Assets | |
| Atlantia SpA | 5.9 | % |
| Highways & Railtracks, Italy | | |
| Transurban Group | 5.3 | % |
| Highways & Railtracks, Australia | | |
| Groupe Eurotunnel SA | 4.0 | % |
| Highways & Railtracks, France | | |
| NextEra Energy Inc. | 3.4 | % |
| Electric Utilities, U.S. | | |
| National Grid PLC | 3.2 | % |
| Multi-Utilities, U.K. | | |
| Dominion Resources Inc. | 3.2 | % |
| Multi-Utilities, U.S. | | |
| China Merchants Holdings International Co. Ltd. | 2.9 | % |
| Marine Ports & Services, China | | |
| Japan Airport Terminal Co. Ltd. | 2.7 | % |
| Airport Services, Japan | | |
| Enbridge Inc. | 2.7 | % |
| Oil & Gas Storage & Transportation, Canada | | |
| Abertis Infraestructuras SA | 2.7 | % |
| Highways & Railtracks, Spain | | |
In contrast, the Fund’s investment in Spain-based global infrastructure asset operator and construction firm Obrascon Huarte Lain hampered relative performance.3 The company manages toll road, airport and social infrastructure concessions in seven European countries. We established the position in September 2014 after the market reacted negatively when the company revealed its net debt and working capital position during its first-half 2014 earnings call. Our analysis at the time suggested to us the stock was trading at a significant valuation discount to the value implied by its equity stakes in listed infrastructure companies Abertis Infraestructuras (a Fund holding) and OHL Mexico. However, the market continued to focus on the company’s perceived balance sheet weakness rather than a valuation we considered attractive, and there were no positive
3. Not part of the index.
See www.franklintempletondatasources.com for additional data provider information.
franklintempleton.com Semiannual Report | 5
FRANKLIN GLOBAL LISTED INFRASTRUCTURE FUND
catalysts to improve sentiment. Obrascon’s subsequent decision to sell a portion of its stake in OHL Mexico at a significant discount suggested to us that its leverage situation was poorer than we had initially assessed and we exited the position.
Also hindering relative results was an underweighted investment in The Southern Co., one of the largest listed, regulated U.S. utility companies, with operations focused in Alabama, Georgia, Florida and Mississippi. The company has been involved in the construction of several high-profile power plants and has experienced multiple cost overruns with a coal-to-gas plant. These cost overruns will be paid by shareholders rather than customers, and we expected similar risks with respect to the construction of its two nuclear units. Despite company-specific issues, however, the shares were buoyed during the period by outperformance of the U.S. utilities sector overall.
The Fund’s overweighted position in Veresen, a Canada-based midstream energy company, also detracted from performance. In September, the company announced a $1.43 billion investment in Ruby Pipeline, a natural gas pipeline in the U.S., by buying Global Infrastructure Partners’ 50% interest. Veresen raised capital through a stock sale to fund the acquisition and other investments, which initially led to an earnings per share dilution that drew negative market reaction. In addition, falling energy prices during the period led many investors to become less certain about the timing and implementation of the company’s ambitious Jordan Cove LNG Project, which was intended to facilitate export of liquefied natural gas.
It is important to recognize the effect of currency movements on the Fund’s performance. In general, if the value of the U.S. dollar goes up compared with a foreign currency, an investment traded in that foreign currency will go down in value because it will be worth fewer U.S. dollars. This can have a negative effect on Fund performance. Conversely, when the U.S. dollar weakens in relation to a foreign currency, an investment traded in that foreign currency will increase in value, which can contribute to Fund performance. For the six months ended January 31, 2015, the U.S. dollar rose in value relative to most currencies. As a result, the Fund’s performance was negatively affected by the portfolio’s substantial investment in securities with non-U.S. currency exposure.
Thank you for your continued participation in Franklin Global Listed Infrastructure Fund. We look forward to serving your future investment needs.

The foregoing information reflects our analysis, opinions and portfolio holdings as of January 31, 2015, the end of the reporting period. The way we implement our main investment strategies and the resulting portfolio holdings may change depending on factors such as market and economic conditions. These opinions may not be relied upon as investment advice or an offer for a particular security. The information is not a complete analysis of every aspect of any market, country, industry, security or the Fund. Statements of fact are from sources considered reliable, but the investment manager makes no representation or warranty as to their completeness or accuracy. Although historical performance is no guarantee of future results, these insights may help you understand our investment management philosophy.
CFA® is a trademark owned by CFA Institute.
6 | Semiannual Report franklintempleton.com
FRANKLIN GLOBAL LISTED INFRASTRUCTURE FUND
Performance Summary as of January 31, 2015
Your dividend income will vary depending on dividends or interest paid by securities in the Fund’s portfolio, adjusted for operating expenses of each class. Capital gain distributions are net profits realized from the sale of portfolio securities. The performance table does not reflect any taxes that a shareholder would pay on Fund dividends, capital gain distributions, if any, or any realized gains on the sale of Fund shares. Total return reflects reinvestment of the Fund’s dividends and capital gain distributions, if any, and any unrealized gains or losses.
| | | | | | |
| Net Asset Value | | | | | | |
| Share Class (Symbol) | | 1/31/15 | | 7/31/14 | | Change |
| A (FLGIX) | $ | 12.02 | $ | 12.35 | -$ | 0.33 |
| C (N/A) | $ | 11.95 | $ | 12.28 | -$ | 0.33 |
| R (N/A) | $ | 11.99 | $ | 12.32 | -$ | 0.33 |
| R6 (N/A) | $ | 12.03 | $ | 12.36 | -$ | 0.33 |
| Advisor (N/A) | $ | 12.03 | $ | 12.36 | -$ | 0.33 |
| | | | | | | | |
| Distributions (8/1/14–1/31/15) | | | | | | | | |
| | | Dividend | | Short-Term | | Long-Term | | |
| Share Class | | Income | | Capital Gain | | Capital Gain | | Total |
| A | $ | 0.1532 | $ | 0.1947 | $ | 0.0052 | $ | 0.3531 |
| C | $ | 0.1156 | $ | 0.1947 | $ | 0.0052 | $ | 0.3155 |
| R | $ | 0.1359 | $ | 0.1947 | $ | 0.0052 | $ | 0.3358 |
| R6 | $ | 0.1747 | $ | 0.1947 | $ | 0.0052 | $ | 0.3746 |
| Advisor | $ | 0.1716 | $ | 0.1947 | $ | 0.0052 | $ | 0.3715 |
franklintempleton.com Semiannual Report | 7
FRANKLIN GLOBAL LISTED INFRASTRUCTURE FUND
PERFORMANCE SUMMARY
Performance as of 1/31/151
Cumulative total return excludes sales charges. Average annual total returns and value of $10,000 investment include maximum sales charges. Class A: 5.75% maximum initial sales charge; Class C: 1% contingent deferred sales charge in first year only;
Class R/R6/Advisor Class: no sales charges.
| | | | | | | | | | | | | | | |
| | | | | | | | | Value of | | Average Annual | | | | | |
| | | Cumulative | | | Average Annual | | $ | 10,000 | | Total Return | | Total Annual Operating Expenses6 | |
| Share Class | | Total Return2 | | | Total Return3 | | | Investment4 | | (12/31/14)5 | | (with waiver) | | (without waiver) | |
| A | | | | | | | | | | | | 1.45 | % | 4.15 | % |
| 6-Month | + | 0.38 | % | | -5.37 | % | $ | 9,463 | | | | | | | |
| 1-Year | + | 16.15 | % | + | 9.50 | % | $ | 10,950 | + | 8.38 | % | | | | |
| Since Inception (9/6/13) | + | 25.28 | % | + | 12.58 | % | $ | 11,808 | + | 13.01 | % | | | | |
| C | | | | | | | | | | | | 2.15 | % | 4.85 | % |
| 6-Month | | -0.02 | % | | -0.99 | % | $ | 9,901 | | | | | | | |
| 1-Year | + | 15.24 | % | + | 14.24 | % | $ | 11,424 | + | 13.11 | % | | | | |
| Since Inception (9/6/13) | + | 23.92 | % | + | 16.52 | % | $ | 12,392 | + | 17.30 | % | | | | |
| R | | | | | | | | | | | | 1.65 | % | 4.35 | % |
| 6-Month | + | 0.15 | % | + | 0.15 | % | $ | 10,015 | | | | | | | |
| 1-Year | + | 15.71 | % | + | 15.71 | % | $ | 11,571 | + | 14.69 | % | | | | |
| Since Inception (9/6/13) | + | 24.67 | % | + | 17.02 | % | $ | 12,467 | + | 17.84 | % | | | | |
| R6 | | | | | | | | | | | | 1.08 | % | 5.21 | % |
| 6-Month | + | 0.48 | % | + | 0.48 | % | $ | 10,048 | | | | | | | |
| 1-Year | + | 16.45 | % | + | 16.45 | % | $ | 11,645 | + | 15.34 | % | | | | |
| Since Inception (9/6/13) | + | 25.80 | % | + | 17.78 | % | $ | 12,580 | + | 18.58 | % | | | | |
| Advisor | | | | | | | | | | | | 1.15 | % | 3.85 | % |
| 6-Month | + | 0.45 | % | + | 0.45 | % | $ | 10,045 | | | | | | | |
| 1-Year | + | 16.36 | % | + | 16.36 | % | $ | 11,636 | + | 15.24 | % | | | | |
| Since Inception (9/6/13) | + | 25.69 | % | + | 17.71 | % | $ | 12,569 | + | 18.50 | % | | | | |
Performance data represent past performance, which does not guarantee future results. Investment return and principal value will fluctuate, and you may have a gain or loss when you sell your shares. Current performance may differ from figures shown. For most recent month-end performance, go to franklintempleton.com or call (800) 342-5236.
8 | Semiannual Report
franklintempleton.com
FRANKLIN GLOBAL LISTED INFRASTRUCTURE FUND
PERFORMANCE SUMMARY
All investments involve risks, including possible loss of principal. Investments in infrastructure-related securities involve special risks, including but not limited to high interest costs, high leverage and increased susceptibility to adverse economic or regulatory developments affecting the sector. Investments in utility company securities, if purchased for dividend yield, involve additional interest rate risks. When interest rates have risen, the stock prices of these companies have tended to fall. Thus, as prices of utility company stocks in the Fund adjust to a rise in interest rates, the Fund’s share price may decline. By focusing on an industry or group of industries, the Fund carries much greater risk of adverse developments and price movements in such industries than a fund that invests in a wider variety of industries. Special risks are associated with foreign investing, including currency rate fluctuations, economic instability and political developments. The risks of foreign investing may be greater in developing or emerging markets. Investors should be comfortable with fluctuations in the value of their investment, as small- and midsized-company stocks can be volatile, especially over the short term. Smaller or relatively new or unseasoned companies can be particularly sensitive to changing economic conditions, and their prospects for growth are less certain than those of larger, more established companies. The Fund’s use of derivatives and foreign currency techniques involve special risks as such techniques may not achieve the anticipated benefits and/or may result in losses to the Fund. The Fund is actively managed but there is no guarantee that the manager’s investment decisions will produce the desired results. The Fund’s prospectus also includes a description of the main investment risks.
| |
| Class C: | These shares have higher annual fees and expenses than Class A shares. |
| Class R: | Shares are available to certain eligible investors as described in the prospectus. These shares have higher annual fees and expenses than Class A shares. |
| Class R6: | Shares are available to certain eligible investors as described in the prospectus. |
| Advisor Class: | Shares are available to certain eligible investors as described in the prospectus. |
1. The Fund has an expense reduction contractually guaranteed through at least 11/30/16. Fund investment results reflect the expense reduction, to the extent applicable;
without this reduction, the results would have been lower.
2. Cumulative total return represents the change in value of an investment over the periods indicated.
3. Average annual total return represents the average annual change in value of an investment over the periods indicated. Six-month return has not been annualized.
4. These figures represent the value of a hypothetical $10,000 investment in the Fund over the periods indicated.
5. In accordance with SEC rules, we provide standardized total return information through the latest calendar quarter.
6. Figures are as stated in the Fund’s current prospectus. In periods of market volatility, assets may decline significantly, causing total annual Fund operating expenses
to become higher than the figures shown.
franklintempleton.com Semiannual Report | 9
FRANKLIN GLOBAL LISTED INFRASTRUCTURE FUND
Your Fund’s Expenses
As a Fund shareholder, you can incur two types of costs:
- Transaction costs, including sales charges (loads) on Fund purchases; and
- Ongoing Fund costs, including management fees, distribu- tion and service (12b-1) fees, and other Fund expenses. All mutual funds have ongoing costs, sometimes referred to as operating expenses.
The following table shows ongoing costs of investing in the Fund and can help you understand these costs and compare them with those of other mutual funds. The table assumes a $1,000 investment held for the six months indicated.
Actual Fund Expenses
The first line (Actual) for each share class listed in the table provides actual account values and expenses. The “Ending Account Value” is derived from the Fund’s actual return, which includes the effect of Fund expenses.
You can estimate the expenses you paid during the period by following these steps. Of course, your account value and expenses will differ from those in this illustration:
| 1. | Divide your account value by $1,000. |
| | If an account had an $8,600 value, then $8,600 ÷ $1,000 = 8.6. |
| 2. | Multiply the result by the number under the heading “Expenses Paid During Period.” |
| | If Expenses Paid During Period were $7.50, then 8.6 x $7.50 = $64.50. |
In this illustration, the estimated expenses paid this period are $64.50.
Hypothetical Example for Comparison with Other Funds
Information in the second line (Hypothetical) for each class in the table can help you compare ongoing costs of investing in the Fund with those of other mutual funds. This information may not be used to estimate the actual ending account balance or expenses you paid during the period. The hypothetical “Ending Account Value” is based on the actual expense ratio for each class and an assumed 5% annual rate of return before expenses, which does not represent the Fund’s actual return. The figure under the heading “Expenses Paid During Period” shows the hypothetical expenses your account would have incurred under this scenario. You can compare this figure with the 5% hypothetical examples that appear in shareholder reports of other funds.
Please note that expenses shown in the table are meant to highlight ongoing costs and do not reflect any transaction costs, such as sales charges. Therefore, the second line for each class is useful in comparing ongoing costs only, and will not help you compare total costs of owning different funds. In addition, if transaction costs were included, your total costs would have been higher. Please refer to the Fund prospectus for additional information on operating expenses.
10 | Semiannual Report
franklintempleton.com
FRANKLIN GLOBAL LISTED INFRASTRUCTURE FUND
YOUR FUND’S EXPENSES
| | | | | | |
| | | Beginning Account | | Ending Account | | Expenses Paid During |
| Share Class | | Value 8/1/14 | | Value 1/31/15 | | Period* 8/1/14–1/31/15 |
| A | | | | | | |
| Actual | $ | 1,000 | $ | 1,003.80 | $ | 7.22 |
| Hypothetical (5% return before expenses) | $ | 1,000 | $ | 1,018.00 | $ | 7.27 |
| C | | | | | | |
| Actual | $ | 1,000 | $ | 999.80 | $ | 10.74 |
| Hypothetical (5% return before expenses) | $ | 1,000 | $ | 1,014.47 | $ | 10.82 |
| R | | | | | | |
| Actual | $ | 1,000 | $ | 1,001.50 | $ | 8.22 |
| Hypothetical (5% return before expenses) | $ | 1,000 | $ | 1,016.99 | $ | 8.29 |
| R6 | | | | | | |
| Actual | $ | 1,000 | $ | 1,004.80 | $ | 5.31 |
| Hypothetical (5% return before expenses) | $ | 1,000 | $ | 1,019.91 | $ | 5.35 |
| Advisor | | | | | | |
| Actual | $ | 1,000 | $ | 1,004.50 | $ | 5.71 |
| Hypothetical (5% return before expenses) | $ | 1,000 | $ | 1,019.51 | $ | 5.75 |
*Expenses are calculated using the most recent six-month expense ratio, net of expense waivers, annualized for each class (A: 1.43%;
C: 2.13%; R: 1.63%; R6: 1.05%; and Advisor: 1.13%), multiplied by the average account value over the period, multiplied by 184/365 to
reflect the one-half year period.
franklintempleton.com Semiannual Report | 11
| | | | | | |
| FRANKLIN GLOBAL TRUST | | | | | | |
| |
| |
| Financial Highlights | | | | | | |
| Franklin Global Listed Infrastructure Fund | | | | | | |
| | | Six Months Ended | | | | |
| | | January 31, 2015 | | | Period Ended | |
| | | (unaudited) | | | July 31, 2014a | |
| Class A | | | | | | |
| Per share operating performance | | | | | | |
| (for a share outstanding throughout the period) | | | | | | |
| Net asset value, beginning of period | $ | 12.35 | | $ | 10.00 | |
| Income from investment operationsb: | | | | | | |
| Net investment incomec | | 0.06 | | | 0.27 | |
| Net realized and unrealized gains (losses) | | (0.04 | ) | | 2.20 | |
| Total from investment operations | | 0.02 | | | 2.47 | |
| Less distributions from: | | | | | | |
| Net investment income | | (0.15 | ) | | (0.11 | ) |
| Net realized gains | | (0.20 | ) | | (0.01 | ) |
| Total distributions | | (0.35 | ) | | (0.12 | ) |
| Net asset value, end of period | $ | 12.02 | | $ | 12.35 | |
| |
| Total returnd | | 0.38 | % | | 24.81 | % |
| |
| Ratios to average net assetse | | | | | | |
| Expenses before waiver and payments by affiliates | | 1.95 | %f | | 4.03 | % |
| Expenses net of waiver and payments by affiliatesg | | 1.43 | % | | 1.28 | % |
| Net investment income | | 1.02 | % | | 2.59 | % |
| |
| Supplemental data | | | | | | |
| Net assets, end of period (000’s) | $ | 26,458 | | $ | 14,934 | |
| Portfolio turnover rate | | 24.85 | % | | 35.24 | % |
aFor the period September 6, 2013 (commencement of operations) to July 31, 2014.
bThe amount shown for a share outstanding throughout the period may not correlate with the Statement of Operations for the period due to the timing of sales and
repurchases of the Fund shares in relation to income earned and/or fluctuating fair value of the investments of the Fund.
cBased on average daily shares outstanding.
dTotal return does not reflect sales commissions or contingent deferred sales charges, if applicable, and is not annualized for periods less than one year.
eRatios are annualized for periods less than one year.
fRatios are adjusted to exclude the effects of annualization for non-recurring expenses.
gBenefit of expense reduction rounds to less than 0.01%.
12 | Semiannual Report | The accompanying notes are an integral part of these financial statements. franklintempleton.com
|
| FRANKLIN GLOBAL TRUST |
| FINANCIAL HIGHLIGHTS |
| | | | | | |
| Franklin Global Listed Infrastructure Fund (continued) | | | | | | |
| | | Six Months Ended | | | | |
| | | January 31, 2015 | | | Period Ended | |
| | | (unaudited) | | | July 31, 2014a | |
| Class C | | | | | | |
| Per share operating performance | | | | | | |
| (for a share outstanding throughout the period) | | | | | | |
| Net asset value, beginning of period | $ | 12.28 | | $ | 10.00 | |
| Income from investment operationsb: | | | | | | |
| Net investment incomec | | 0.02 | | | 0.22 | |
| Net realized and unrealized gains (losses) | | (0.03 | ) | | 2.16 | |
| Total from investment operations | | (0.01 | ) | | 2.38 | |
| Less distributions from: | | | | | | |
| Net investment income | | (0.12 | ) | | (0.09 | ) |
| Net realized gains | | (0.20 | ) | | (0.01 | ) |
| Total distributions | | (0.32 | ) | | (0.10 | ) |
| Net asset value, end of period | $ | 11.95 | | $ | 12.28 | |
| |
| Total returnd | | (0.02 | )% | | 23.95 | % |
| |
| Ratios to average net assetse | | | | | | |
| Expenses before waiver and payments by affiliates | | 2.65 | %f | | 4.85 | % |
| Expenses net of waiver and payments by affiliatesg | | 2.13 | % | | 2.10 | % |
| Net investment income | | 0.32 | % | | 1.77 | % |
| |
| Supplemental data | | | | | | |
| Net assets, end of period (000’s) | $ | 4,898 | | $ | 2,988 | |
| Portfolio turnover rate | | 24.85 | % | | 35.24 | % |
aFor the period September 6, 2013 (commencement of operations) to July 31, 2014.
bThe amount shown for a share outstanding throughout the period may not correlate with the Statement of Operations for the period due to the timing of sales and
repurchases of the Fund shares in relation to income earned and/or fluctuating fair value of the investments of the Fund.
cBased on average daily shares outstanding.
dTotal return does not reflect sales commissions or contingent deferred sales charges, if applicable, and is not annualized for periods less than one year.
eRatios are annualized for periods less than one year.
fRatios are adjusted to exclude the effects of annualization for non-recurring expenses.
gBenefit of expense reduction rounds to less than 0.01%.
franklintempleton.com The accompanying notes are an integral part of these financial statements. | Semiannual Report | 13
FRANKLIN GLOBAL TRUST
FINANCIAL HIGHLIGHTS
| | | | | | |
| Franklin Global Listed Infrastructure Fund (continued) | | | | | | |
| | | Six Months Ended | | | | |
| | | January 31, 2015 | | | Period Ended | |
| | | (unaudited) | | | July 31, 2014a | |
| Class R | | | | | | |
| Per share operating performance | | | | | | |
| (for a share outstanding throughout the period) | | | | | | |
| Net asset value, beginning of period | $ | 12.32 | | $ | 10.00 | |
| Income from investment operationsb: | | | | | | |
| Net investment incomec | | 0.05 | | | 0.25 | |
| Net realized and unrealized gains (losses) | | (0.04 | ) | | 2.18 | |
| Total from investment operations | | 0.01 | | | 2.43 | |
| Less distributions from: | | | | | | |
| Net investment income | | (0.14 | ) | | (0.10 | ) |
| Net realized gains | | (0.20 | ) | | (0.01 | ) |
| Total distributions | | (0.34 | ) | | (0.11 | ) |
| Net asset value, end of period | $ | 11.99 | | $ | 12.32 | |
| |
| Total returnd | | 0.15 | % | | 24.48 | % |
| |
| Ratios to average net assetse | | | | | | |
| Expenses before waiver and payments by affiliates | | 2.15 | %f | | 4.35 | % |
| Expenses net of waiver and payments by affiliatesg | | 1.63 | % | | 1.60 | % |
| Net investment income | | 0.82 | % | | 2.27 | % |
| |
| Supplemental data | | | | | | |
| Net assets, end of period (000’s) | $ | 81 | | $ | 81 | |
| Portfolio turnover rate | | 24.85 | % | | 35.24 | % |
aFor the period September 6, 2013 (commencement of operations) to July 31, 2014.
bThe amount shown for a share outstanding throughout the period may not correlate with the Statement of Operations for the period due to the timing of sales and
repurchases of the Fund shares in relation to income earned and/or fluctuating fair value of the investments of the Fund.
cBased on average daily shares outstanding.
dTotal return is not annualized for periods less than one year.
eRatios are annualized for periods less than one year.
fRatios are adjusted to exclude the effects of annualization for non-recurring expenses.
gBenefit of expense reduction rounds to less than 0.01%.
14 | Semiannual Report | The accompanying notes are an integral part of these financial statements. franklintempleton.com
|
| FRANKLIN GLOBAL TRUST |
| FINANCIAL HIGHLIGHTS |
| | | | | | |
| Franklin Global Listed Infrastructure Fund (continued) | | | | | | |
| | | Six Months Ended | | | | |
| | | January 31, 2015 | | | Period Ended | |
| | | (unaudited) | | | July 31, 2014a | |
| Class R6 | | | | | | |
| Per share operating performance | | | | | | |
| (for a share outstanding throughout the period) | | | | | | |
| Net asset value, beginning of period | $ | 12.36 | | $ | 10.00 | |
| Income from investment operationsb: | | | | | | |
| Net investment incomec | | 0.08 | | | 0.26 | |
| Net realized and unrealized gains (losses) | | (0.04 | ) | | 2.24 | |
| Total from investment operations | | 0.04 | | | 2.50 | |
| Less distributions from: | | | | | | |
| Net investment income | | (0.17 | ) | | (0.13 | ) |
| Net realized gains | | (0.20 | ) | | (0.01 | ) |
| Total distributions | | (0.37 | ) | | (0.14 | ) |
| Net asset value, end of period | $ | 12.03 | | $ | 12.36 | |
| |
| Total returnd | | 0.48 | % | | 25.20 | % |
| |
| Ratios to average net assetse | | | | | | |
| Expenses before waiver and payments by affiliates | | 5.06 | %f | | 5.21 | % |
| Expenses net of waiver and payments by affiliatesg | | 1.05 | % | | 1.03 | % |
| Net investment income | | 1.40 | % | | 2.84 | % |
| |
| Supplemental data | | | | | | |
| Net assets, end of period (000’s) | $ | 12 | | $ | 12 | |
| Portfolio turnover rate | | 24.85 | % | | 35.24 | % |
aFor the period September 6, 2013 (commencement of operations) to July 31, 2014.
bThe amount shown for a share outstanding throughout the period may not correlate with the Statement of Operations for the period due to the timing of sales and
repurchases of the Fund shares in relation to income earned and/or fluctuating fair value of the investments of the Fund.
cBased on average daily shares outstanding.
dTotal return is not annualized for periods less than one year.
eRatios are annualized for periods less than one year.
fRatios are adjusted to exclude the effects of annualization for non-recurring expenses.
gBenefit of expense reduction rounds to less than 0.01%.
franklintempleton.com The accompanying notes are an integral part of these financial statements. | Semiannual Report | 15
FRANKLIN GLOBAL TRUST
FINANCIAL HIGHLIGHTS
| | | | | | |
| Franklin Global Listed Infrastructure Fund (continued) | | | | | | |
| | | Six Months Ended | | | | |
| | | January 31, 2015 | | | Period Ended | |
| | | (unaudited) | | | July 31, 2014a | |
| Advisor Class | | | | | | |
| Per share operating performance | | | | | | |
| (for a share outstanding throughout the period) | | | | | | |
| Net asset value, beginning of period | $ | 12.36 | | $ | 10.00 | |
| Income from investment operationsb: | | | | | | |
| Net investment incomec | | 0.08 | | | 0.29 | |
| Net realized and unrealized gains (losses) | | (0.04 | ) | | 2.20 | |
| Total from investment operations | | 0.04 | | | 2.49 | |
| Less distributions from: | | | | | | |
| Net investment income | | (0.17 | ) | | (0.12 | ) |
| Net realized gains | | (0.20 | ) | | (0.01 | ) |
| Total distributions | | (0.37 | ) | | (0.13 | ) |
| Net asset value, end of period | $ | 12.03 | | $ | 12.36 | |
| |
| Total returnd | | 0.45 | % | | 25.13 | % |
| |
| Ratios to average net assetse | | | | | | |
| Expenses before waiver and payments by affiliates | | 1.65 | %f | | 3.85 | % |
| Expenses net of waiver and payments by affiliatesg | | 1.13 | % | | 1.10 | % |
| Net investment income | | 1.32 | % | | 2.77 | % |
| |
| Supplemental data | | | | | | |
| Net assets, end of period (000’s) | $ | 1,612 | | $ | 357 | |
| Portfolio turnover rate | | 24.85 | % | | 35.24 | % |
aFor the period September 6, 2013 (commencement of operations) to July 31, 2014.
bThe amount shown for a share outstanding throughout the period may not correlate with the Statement of Operations for the period due to the timing of sales and
repurchases of the Fund shares in relation to income earned and/or fluctuating fair value of the investments of the Fund.
cBased on average daily shares outstanding.
dTotal return is not annualized for periods less than one year.
eRatios are annualized for periods less than one year.
fRatios are adjusted to exclude the effects of annualization for non-recurring expenses.
gBenefit of expense reduction rounds to less than 0.01%.
16 | Semiannual Report | The accompanying notes are an integral part of these financial statements. franklintempleton.com
| | | | |
| | FRANKLIN GLOBAL TRUST |
| |
| |
| |
| |
| Statement of Investments, January 31, 2015 (unaudited) | | | | |
| |
| Franklin Global Listed Infrastructure Fund | | | | |
| | | Shares/ | | |
| | Country | Units | | Value |
| Common Stocks and Other Equity Interests 98.6% | | | | |
| Airport Services 12.4% | | | | |
| Aeroports de Paris (ADP) | France | 6,610 | $ | 794,487 |
| Auckland International Airport Ltd. | New Zealand | 113,461 | | 367,290 |
| BBAAviation PLC | United Kingdom | 53,730 | | 274,769 |
| Flughafen Zuerich AG | Switzerland | 970 | | 660,740 |
| Grupo Aeroportuario del Pacifico SAB de CV, ADR | Mexico | 4,995 | | 331,718 |
| aGrupo Aeroportuario del Sureste SAB de CV, ADR | Mexico | 2,559 | | 334,999 |
| Japan Airport Terminal Co. Ltd. | Japan | 19,500 | | 888,137 |
| Sydney Airport | Australia | 112,478 | | 436,833 |
| | | | | 4,088,973 |
| Electric Utilities 19.9% | | | | |
| Duke Energy Corp. | United States | 4,830 | | 420,886 |
| Edison International | United States | 10,640 | | 725,116 |
| Enel SpA | Italy | 177,842 | | 804,802 |
| Enersis SA, ADR | Chile | 7,577 | | 115,549 |
| Exelon Corp. | United States | 7,070 | | 254,803 |
| Iberdrola SA | Spain | 102,635 | | 710,490 |
| ITC Holdings Corp. | United States | 17,750 | | 755,085 |
| NextEra Energy Inc. | United States | 10,380 | | 1,133,911 |
| Portland General Electric Co. | United States | 15,080 | | 598,676 |
| The Southern Co. | United States | 1,930 | | 97,890 |
| SSE PLC | United Kingdom | 28,120 | | 681,527 |
| UIL Holdings Corp. | United States | 6,280 | | 288,880 |
| | | | | 6,587,615 |
| Gas Utilities 2.5% | | | | |
| Atmos Energy Corp. | United States | 6,730 | | 383,004 |
| ENN Energy Holdings Ltd. | China | 14,300 | | 84,484 |
| New Jersey Resources Corp. | United States | 5,460 | | 348,785 |
| | | | | 816,273 |
| Highways & Railtracks 18.7% | | | | |
| Abertis Infraestructuras SA | Spain | 44,961 | | 882,226 |
| Atlantia SpA | Italy | 75,147 | | 1,938,034 |
| Groupe Eurotunnel SA | France | 97,920 | | 1,316,876 |
| Macquarie Atlas Roads Group | Australia | 53,362 | | 122,518 |
| Qube Logistics Holdings Ltd. | Australia | 96,175 | | 175,156 |
| Transurban Group | Australia | 244,300 | | 1,751,177 |
| | | | | 6,185,987 |
| Independent Power Producers & Energy Traders 0.6% | | | | |
| NRG Energy Inc. | United States | 7,730 | | 190,622 |
| Marine Ports & Services 6.5% | | | | |
| China Merchants Holdings International Co. Ltd. | China | 258,000 | | 946,829 |
| COSCO Pacific Ltd. | China | 412,000 | | 601,607 |
| Hutchison Port Holdings Trust | Singapore | 327,400 | | 234,091 |
| Kamigumi Co. Ltd. | Japan | 29,000 | | 292,061 |
| Mitsubishi Logistics Corp. | Japan | 6,000 | | 90,257 |
| | | | | 2,164,845 |
franklintempleton.com
Semiannual Report | 17
FRANKLIN GLOBAL TRUST
STATEMENT OF INVESTMENTS (UNAUDITED)
| | | | |
| Franklin Global Listed Infrastructure Fund (continued) | | | | |
| | | Shares/ | | |
| | Country | Units | | Value |
| Common Stocks and Other Equity Interests (continued) | | | | |
| Multi-Utilities 15.6% | | | | |
| Ameren Corp. | United States | 5,570 | $ | 252,210 |
| Centrica PLC | United Kingdom | 48,720 | | 215,611 |
| Dominion Resources Inc. | United States | 13,720 | | 1,054,931 |
| E.ON SE | Germany | 9,470 | | 146,827 |
| GDF Suez | France | 37,480 | | 835,142 |
| National Grid PLC | United Kingdom | 75,100 | | 1,058,267 |
| NorthWestern Corp. | United States | 3,180 | | 183,677 |
| Public Service Enterprise Group Inc. | United States | 9,330 | | 398,204 |
| RWE AG | Germany | 9,370 | | 260,493 |
| Sempra Energy | United States | 4,460 | | 499,163 |
| Suez Environnement Co. | France | 13,050 | | 240,367 |
| | | | | 5,144,892 |
| Oil & Gas Storage & Transportation 18.7% | | | | |
| Altagas Ltd. | Canada | 17,750 | | 599,957 |
| aCheniere Energy Inc. | United States | 9,980 | | 712,372 |
| Cheniere Energy Partners LP | United States | 5,537 | | 175,523 |
| Enbridge Inc. | Canada | 18,310 | | 887,107 |
| Energy Transfer Equity LP | United States | 11,813 | | 701,929 |
| Enlink Midstream LLC | United States | 4,060 | | 128,458 |
| Kinder Morgan Inc. | United States | 3,490 | | 143,265 |
| Magellan Midstream Partners LP | United States | 3,582 | | 277,677 |
| MarkWest Energy Partners LP | United States | 2,149 | | 126,641 |
| Pembina Pipeline Corp. | Canada | 13,600 | | 422,645 |
| SemGroup Corp., A | United States | 3,980 | | 267,973 |
| Spectra Energy Corp. | United States | 2,630 | | 87,947 |
| Ultrapar Participacoes SA, ADR | Brazil | 11,119 | | 217,710 |
| Veresen Inc. | Canada | 35,200 | | 448,035 |
| Western Gas Equity Partners LP | United States | 6,225 | | 360,863 |
| The Williams Cos. Inc. | United States | 14,020 | | 614,917 |
| | | | | 6,173,019 |
| Renewable Electricity 1.8% | | | | |
| Boralex Inc., A | Canada | 21,600 | | 231,404 |
| Pattern Energy Group Inc. | United States | 12,800 | | 374,016 |
| | | | | 605,420 |
| Water Utilities 1.9% | | | | |
| American Water Works Co. Inc. | United States | 5,550 | | 311,577 |
| aSound Global Ltd. | China | 313,000 | | 317,752 |
| | | | | 629,329 |
| Total Common Stocks and Other Equity Interests | | | | |
| (Cost $31,238,381) | | | | 32,586,975 |
18 | Semiannual Report franklintempleton.com
FRANKLIN GLOBAL TRUST
STATEMENT OF INVESTMENTS (UNAUDITED)
| | | | |
| Franklin Global Listed Infrastructure Fund (continued) | | | | |
| | | Shares/ | | |
| | Country | Units | | Value |
| Preferred Stocks (Cost $96,236) 0.2% | | | | |
| Electric Utilities 0.2% | | | | |
| Companhia Energetica de Minas Gerais, ADR, pfd. | Brazil | 13,842 | $ | 62,427 |
| Total Investments (Cost $31,334,617) 98.8% | | | | 32,649,402 |
| Other Assets, less Liabilities 1.2% | | | | 412,457 |
| Net Assets 100.0% | | | $ | 33,061,859 |
See Abbreviations on page 30.
aNon-income producing.
franklintempleton.com The accompanying notes are an integral part of these financial statements. | Semiannual Report | 19
| | | |
| FRANKLIN GLOBAL TRUST | | | |
| |
| |
| |
| |
| Financial Statements | | | |
| |
| Statement of Assets and Liabilities | | | |
| January 31, 2015 (unaudited) | | | |
| |
| Franklin Global Listed Infrastructure Fund | | | |
| |
| Assets: | | | |
| Investments in securities: | | | |
| Cost | $ | 31,334,617 | |
| Value | $ | 32,649,402 | |
| Cash | | 286,102 | |
| Receivables: | | | |
| Capital shares sold | | 125,726 | |
| Dividends | | 70,760 | |
| Affiliates | | 5,235 | |
| Other assets | | 36,702 | |
| Total assets | | 33,173,927 | |
| Liabilities: | | | |
| Payables: | | | |
| Capital shares redeemed | | 65,877 | |
| Management fees | | 17,914 | |
| Distribution fees | | 10,769 | |
| Professional fees | | 12,085 | |
| Accrued expenses and other liabilities | | 5,423 | |
| Total liabilities | | 112,068 | |
| Net assets, at value | $ | 33,061,859 | |
| Net assets consist of: | | | |
| Paid-in capital | $ | 31,983,493 | |
| Distributions in excess of net investment income | | (25,622 | ) |
| Net unrealized appreciation (depreciation) | | 1,312,535 | |
| Accumulated net realized gain (loss) | | (208,547 | ) |
| Net assets, at value | $ | 33,061,859 | |
20 | Semiannual Report | The accompanying notes are an integral part of these financial statements. franklintempleton.com
FRANKLIN GLOBAL TRUST
FINANCIAL STATEMENTS
| | |
| Statement of Assets and Liabilities (continued) | | |
| January 31, 2015 (unaudited) | | |
| |
| Franklin Global Listed Infrastructure Fund | | |
| |
| Class A: | | |
| Net assets, at value | $ | 26,458,154 |
| Shares outstanding | | 2,202,040 |
| Net asset value per sharea | $ | 12.02 |
| Maximum offering price per share (net asset value per share ÷ 94.25%) | $ | 12.75 |
| Class C: | | |
| Net assets, at value | $ | 4,898,283 |
| Shares outstanding | | 409,894 |
| Net asset value and maximum offering price per sharea | $ | 11.95 |
| Class R: | | |
| Net assets, at value | $ | 81,118 |
| Shares outstanding | | 6,763 |
| Net asset value and maximum offering price per share | $ | 11.99 |
| Class R6: | | |
| Net assets, at value | $ | 12,031 |
| Shares outstanding | | 1,000 |
| Net asset value and maximum offering price per share | $ | 12.03 |
| Advisor Class: | | |
| Net assets, at value | $ | 1,612,273 |
| Shares outstanding | | 133,999 |
| Net asset value and maximum offering price per share | $ | 12.03 |
aRedemption price is equal to net asset value less contingent deferred sales charges, if applicable.
franklintempleton.com The accompanying notes are an integral part of these financial statements. | Semiannual Report | 21
|
| FRANKLIN GLOBAL TRUST |
| FINANCIAL STATEMENTS |
| | | |
| Statement of Operations | | | |
| for the six months ended January 31, 2015 (unaudited) | | | |
| |
| Franklin Global Listed Infrastructure Fund | | | |
| |
| Investment income: | | | |
| Dividends (net of foreign taxes of $21,260) | $ | 325,791 | |
| Expenses: | | | |
| Management fees (Note 3a) | | 132,640 | |
| Distribution fees: (Note 3c) | | | |
| Class A | | 37,415 | |
| Class C | | 21,062 | |
| Class R | | 204 | |
| Transfer agent fees: (Note 3e) | | | |
| Class A | | 11,586 | |
| Class C | | 2,283 | |
| Class R | | 44 | |
| Class R6 | | 216 | |
| Advisor Class | | 624 | |
| Custodian fees (Note 4) | | 1,481 | |
| Reports to shareholders | | 8,021 | |
| Registration and filing fees | | 24,349 | |
| Professional fees | | 24,307 | |
| Amortization of offering costs | | 16,745 | |
| Other | | 5,709 | |
| Total expenses | | 286,686 | |
| Expense reductions (Note 4) | | (60 | ) |
| Expenses waived/paid by affiliates (Note 3f) | | (77,658 | ) |
| Net expenses | | 208,968 | |
| Net investment income | | 116,823 | |
| Realized and unrealized gains (losses): | | | |
| Net realized gain (loss) from: | | | |
| Investments | | 123,298 | |
| Foreign currency transactions | | 1,678 | |
| Net realized gain (loss) | | 124,976 | |
| Net change in unrealized appreciation (depreciation) on: | | | |
| Investments | | (96,150 | ) |
| Translation of other assets and liabilities denominated in foreign currencies | | (2,561 | ) |
| Net change in unrealized appreciation (depreciation) | | (98,711 | ) |
| Net realized and unrealized gain (loss) | | 26,265 | |
| Net increase (decrease) in net assets resulting from operations | $ | 143,088 | |
22 | Semiannual Report | The accompanying notes are an integral part of these financial statements. franklintempleton.com
| | | | | | |
| | | FRANKLIN GLOBAL TRUST | |
| | | FINANCIAL STATEMENTS | |
| |
| |
| Statement of Changes in Net Assets | | | | | | |
| |
| |
| Franklin Global Listed Infrastructure Fund | | | | | | |
| |
| | | Six Months Ended | | | | |
| | | January 31, 2015 | | | Period Ended | |
| | | (unaudited) | | | July 31, 2014a | |
| Increase (decrease) in net assets: | | | | | | |
| Operations: | | | | | | |
| Net investment income | $ | 116,823 | | $ | 207,096 | |
| Net realized gain (loss) from investments and foreign currency transactions | | 124,976 | | | 159,946 | |
| Net change in unrealized appreciation (depreciation) on investments and translation of other | | | | | | |
| assets and liabilities denominated in foreign currencies | | (98,711 | ) | | 1,411,246 | |
| Net increase (decrease) in net assets resulting from operations | | 143,088 | | | 1,778,288 | |
| Distributions to shareholders from: | | | | | | |
| Net investment income: | | | | | | |
| Class A | | (255,768 | ) | | (82,128 | ) |
| Class C | | (38,355 | ) | | (4,949 | ) |
| Class R | | (899 | ) | | (152 | ) |
| Class R6 | | (175 | ) | | (130 | ) |
| Advisor Class | | (11,954 | ) | | (995 | ) |
| Net realized gains: | | | | | | |
| Class A | | (398,036 | ) | | (7,079 | ) |
| Class C | | (75,949 | ) | | (318 | ) |
| Class R | | (1,327 | ) | | (13 | ) |
| Class R6 | | (200 | ) | | (13 | ) |
| Advisor Class | | (24,403 | ) | | (30 | ) |
| Total distributions to shareholders | | (807,066 | ) | | (95,807 | ) |
| Capital share transactions: (Note 2) | | | | | | |
| Class A | | 12,058,101 | | | 13,354,722 | |
| Class C | | 2,017,793 | | | 2,900,515 | |
| Class R | | 1,890 | | | 77,852 | |
| Class R6 | | — | | | 10,000 | |
| Advisor Class | | 1,274,782 | | | 347,701 | |
| Total capital share transactions | | 15,352,566 | | | 16,690,790 | |
| Net increase (decrease) in net assets | | 14,688,588 | | | 18,373,271 | |
| Net assets: | | | | | | |
| Beginning of period | | 18,373,271 | | | — | |
| End of period | $ | 33,061,859 | | $ | 18,373,271 | |
| Undistributed net investment income (distributions in excess of net investment income) included in | | | | | | |
| net assets: | | | | | | |
| End of period | $ | (25,622 | ) | $ | 164,706 | |
aFor the period September 6, 2013 (commencement of operations) to July 31, 2014.
franklintempleton.com The accompanying notes are an integral part of these financial statements. | Semiannual Report | 23
FRANKLIN GLOBAL TRUST
Notes to Financial Statements (unaudited)
Franklin Global Listed Infrastructure Fund
1. Organization and Significant Accounting Policies
Franklin Global Trust (Trust) is registered under the Investment Company Act of 1940, as amended, (1940 Act) as an open-end management investment company, consisting of six separate funds and applies the specialized accounting and reporting guidance in U.S. Generally Accepted Accounting Principles (U.S. GAAP). Franklin Global Listed Infrastructure Fund (Fund) is included in this report. The financial statements of the remaining funds in the Trust are presented separately. The Fund offers five classes of shares: Class A, Class C, Class R, Class R6, and Advisor Class. Each class of shares differs by its initial sales load, contingent deferred sales charges, voting rights on matters affecting a single class, its exchange privilege and fees primarily due to differing arrangements for distribution and transfer agent fees.
The following summarizes the Fund’s significant accounting policies.
a. Financial Instrument Valuation
The Fund’s investments in financial instruments are carried at fair value daily. Fair value is the price that would be received to sell an asset or paid to transfer a liability in an orderly transaction between market participants on the measurement date. The Fund calculates the net asset value per share at the close of the New York Stock Exchange (NYSE), generally at 4 p.m. Eastern time (NYSE close) on each day the NYSE is open for trading. Under compliance policies and procedures approved by the Trust’s Board of Trustees (the Board), the Fund’s administrator has responsibility for oversight of valuation, including leading the cross-functional Valuation and Liquidity Oversight Committee (VLOC). The VLOC provides administration and oversight of the Fund’s valuation policies and procedures, which are approved annually by the Board. Among other things, these procedures allow the Fund to utilize independent pricing services, quotations from securities and financial instrument dealers, and other market sources to determine fair value.
Equity securities listed on an exchange or on the NASDAQ National Market System are valued at the last quoted sale price or the official closing price of the day, respectively. Foreign equity securities are valued as of the close of trading on the foreign stock exchange on which the security is primarily traded or as of the NYSE close, whichever is earlier. The value is then converted into its U.S. dollar equivalent at the foreign exchange rate in effect at the NYSE close on the day that the value of the security is determined. Over-the-counter (OTC) securities are valued within the range of the most recent quoted bid and ask prices. Securities that trade in multiple markets or on multiple exchanges are valued according to the broadest and most representative market. Certain equity securities are valued based upon fundamental characteristics or relationships to similar securities.
The Fund has procedures to determine the fair value of financial instruments for which market prices are not reliable or readily available. Under these procedures, the VLOC convenes on a regular basis to review such financial instruments and considers a number of factors, including significant unobservable valuation inputs, when arriving at fair value. The VLOC primarily employs a market-based approach which may use related or comparable assets or liabilities, recent transactions, market multiples, book values, and other relevant information for the investment to determine the fair value of the investment. An income-based valuation approach may also be used in which the anticipated future cash flows of the investment are discounted to calculate fair value. Discounts may also be applied due to the nature or duration of any restrictions on the disposition of the investments. Due to the inherent uncertainty of valuations of such investments, the fair values may differ significantly from the values that would have been used had an active market existed. The VLOC employs various methods for calibrating these valuation approaches including a regular review of key inputs and assumptions, transactional back-testing or disposition analysis, and reviews of any related market activity.
Trading in securities on foreign securities stock exchanges and OTC markets may be completed before the daily NYSE close. In addition, trading in certain foreign markets may not take place on every NYSE business day. Occasionally, events occur between the time at which trading in a foreign security is completed and the close of the NYSE that might call into question the reliability of the value of a portfolio security held by the Fund. As a result, differences may arise between the value of the Fund’s portfolio securities as determined at the foreign market close and the latest indications of value at the close of the NYSE. In order to minimize the potential for these differences, the VLOC monitors price movements following the close of trading in foreign stock markets through a series of country specific market proxies (such as baskets of American Depositary Receipts, futures contracts and exchange traded funds). These price movements are measured against established trigger thresholds for each specific market proxy to assist in determining if an event has occurred that may call into
24 | Semiannual Report
franklintempleton.com
FRANKLIN GLOBAL TRUST
NOTES TO FINANCIAL STATEMENTS (UNAUDITED)
Franklin Global Listed Infrastructure Fund (continued)
question the reliability of the values of the foreign securities held by the Fund. If such an event occurs, the securities may be valued using fair value procedures, which may include the use of independent pricing services.
When the last day of the reporting period is a non-business day, certain foreign markets may be open on those days that the NYSE is closed, which could result in differences between the value of the Fund’s portfolio securities on the last business day and the last calendar day of the reporting period. Any significant security valuation changes due to an open foreign market are adjusted and reflected by the Fund for financial reporting purposes.
b. Foreign Currency Translation
Portfolio securities and other assets and liabilities denominated in foreign currencies are translated into U.S. dollars based on the exchange rate of such currencies against U.S. dollars on the date of valuation. The Fund may enter into foreign currency exchange contracts to facilitate transactions denominated in a foreign currency. Purchases and sales of securities, income and expense items denominated in foreign currencies are translated into U.S. dollars at the exchange rate in effect on the transaction date. Portfolio securities and assets and liabilities denominated in foreign currencies contain risks that those currencies will decline in value relative to the U.S. dollar. Occasionally, events may impact the availability or reliability of foreign exchange rates used to convert the U.S. dollar equivalent value. If such an event occurs, the foreign exchange rate will be valued at fair value using procedures established and approved by the Board.
The Fund does not separately report the effect of changes in foreign exchange rates from changes in market prices on securities held. Such changes are included in net realized and unrealized gain or loss from investments in the Statement of Operations.
Realized foreign exchange gains or losses arise from sales of foreign currencies, currency gains or losses realized between the trade and settlement dates on securities transactions and the difference between the recorded amounts of dividends, interest, and foreign withholding taxes and the U.S. dollar equivalent of the amounts actually received or paid. Net unrealized foreign exchange gains and losses arise from changes in foreign exchange rates on foreign denominated assets and liabilities other than investments in securities held at the end of the reporting period.
c. Income and Deferred Taxes
It is the Fund’s policy to qualify as a regulated investment company under the Internal Revenue Code. The Fund intends to distribute to shareholders substantially all of its taxable income and net realized gains to relieve it from federal income and excise taxes. As a result, no provision for U.S. federal income taxes is required.
The Fund may be subject to foreign taxation related to income received, capital gains on the sale of securities and certain foreign currency transactions in the foreign jurisdictions in which it invests. Foreign taxes, if any, are recorded based on the tax regulations and rates that exist in the foreign markets in which the Fund invests. When a capital gain tax is determined to apply the Fund records an estimated deferred tax liability in an amount that would be payable if the securities were disposed of on the valuation date.
The Fund recognizes the tax benefits of uncertain tax positions only when the position is “more likely than not” to be sustained upon examination by the tax authorities based on the technical merits of the tax position. As of January 31, 2015, and for all open tax years, the Fund has determined that no liability for unrecognized tax benefits is required in the Fund’s financial statements related to uncertain tax positions taken on a tax return (or expected to be taken on future tax returns). Open tax years are those that remain subject to examination and are based on each tax jurisdiction statute of limitation.
d. Security Transactions, Investment Income, Expenses and Distributions
Security transactions are accounted for on trade date. Realized gains and losses on security transactions are determined on a specific identification basis. Estimated expenses are accrued daily. Dividend income is recorded on the ex-dividend date except for certain dividends from foreign securities where the dividend rate is not available. In such cases, the dividend is recorded as soon as the information is received by the Fund. Distributions to shareholders are recorded on the ex-dividend date and are determined according to income tax regulations (tax basis). Distributable earnings determined on a tax basis may differ from earnings recorded in accordance with U.S. GAAP. These differences may be permanent or temporary. Permanent differences are reclassified among capital accounts to reflect their tax character. These reclassifications have no impact on net assets or the results of operations. Temporary differences are not reclassified, as they may reverse in subsequent periods.
franklintempleton.com
Semiannual Report | 25
FRANKLIN GLOBAL TRUST
NOTES TO FINANCIAL STATEMENTS (UNAUDITED)
Franklin Global Listed Infrastructure Fund (continued)
1. Organization and Significant Accounting
Policies (continued)
d. Security Transactions, Investment Income, Expenses and Distributions (continued)
Common expenses incurred by the Trust are allocated among the funds based on the ratio of net assets of each fund to the combined net assets of the Trust. Fund specific expenses are charged directly to the fund that incurred the expense.
Realized and unrealized gains and losses and net investment income, not including class specific expenses, are allocated daily to each class of shares based upon the relative proportion of net assets of each class. Differences in per share distributions, by class, are generally due to differences in class specific expenses.
e. Offering Costs
Offering costs are amortized on a straight line basis over twelve months.
f. Accounting Estimates
The preparation of financial statements in accordance with U.S. GAAP requires management to make estimates and assumptions that affect the reported amounts of assets and liabilities at the date of the financial statements and the amounts of income and expenses during the reporting period. Actual results could differ from those estimates.
g. Guarantees and Indemnifications
Under the Trust’s organizational documents, its officers and trustees are indemnified by the Trust against certain liabilities arising out of the performance of their duties to the Trust. Additionally, in the normal course of business, the Trust, on behalf of the Fund, enters into contracts with service providers that contain general indemnification clauses. The Trust’s maximum exposure under these arrangements is unknown as this would involve future claims that may be made against the Trust that have not yet occurred. Currently, the Trust expects the risk of loss to be remote.
2. Shares of Beneficial Interest
At January 31, 2015, there were an unlimited number of shares authorized (without par value). Transactions in the Fund’s shares were as follows:
| | | | | | | | | | | |
| | Six Months Ended | | Period Ended | |
| | January 31, 2015a | | July 31, 2014b | |
| | Shares | | | Amount | | Shares | | | Amount | |
| |
| Class A Shares: | | | | | | | | | | | |
| Shares sold | 1,212,552 | | $ | 14,726,791 | | 1,285,776 | | $ | 14,305,910 | |
| Shares issued in reinvestment of distributions | 41,106 | | | 475,156 | | 2,260 | | | | 26,877 | |
| Shares redeemed | (261,101 | ) | | (3,143,846 | ) | (78,553 | ) | | (978,065 | ) |
| Net increase (decrease) | 992,557 | | $ | 12,058,101 | | 1,209,483 | | $ | 13,354,722 | |
| |
| Class C Shares: | | | | | | | | | | | |
| Shares sold | 222,937 | | $ | 2,697,708 | | 248,077 | | $ | 2,954,795 | |
| Shares issued in reinvestment of distributions | 9,845 | | | 113,615 | | 446 | | | | 5,166 | |
| Shares redeemed | (66,137 | ) | | (793,530 | ) | (5,274 | ) | | (59,446 | ) |
| Net increase (decrease) | 166,645 | | $ | 2,017,793 | | 243,249 | | $ | 2,900,515 | |
| |
| Class R Shares: | | | | | | | | | | | |
| Shares sold | — | | $ | — | | 6,597 | | | $ | 77,811 | |
| Shares issued in reinvestment of distributions | 163 | | | 1,890 | | 4 | | | | 51 | |
| Shares redeemed | — | | | — | | (1 | ) | | | (10 | ) |
| Net increase (decrease) | 163 | | $ | 1,890 | | 6,600 | | | $ | 77,852 | |
26 | Semiannual Report
franklintempleton.com
| | | | | | | | | | | |
| | | | | | | FRANKLIN GLOBAL TRUST | |
| | NOTES TO FINANCIAL STATEMENTS (UNAUDITED) | |
| |
| |
| |
| Franklin Global Listed Infrastructure Fund (continued) | | | | | | | | | | | |
| |
| | Six Months Ended | | Period Ended | |
| | January 31, 2015a | | July 31, 2014b | |
| | Shares | | | Amount | | Shares | | | Amount | |
| |
| Class R6 Shares: | | | | | | | | | | | |
| Shares sold | | | | | | 1,001 | | | $ | 10,010 | |
| Shares redeemed | | | | | | (1 | ) | | | (10 | ) |
| Net increase (decrease) | | | | | | 1,000 | | | $ | 10,000 | |
| Advisor Class Shares: | | | | | | | | | | | |
| Shares sold | 115,832 | | $ | 1,406,678 | | 44,335 | | $ | 513,363 | |
| Shares issued in reinvestment of distributions | 3,104 | | | 35,599 | | 64 | | | | 763 | |
| Shares redeemed | (13,859 | ) | | (167,495 | ) | (15,477 | ) | | (166,425 | ) |
| Net increase (decrease) | 105,077 | | $ | 1,274,782 | | 28,922 | | $ | 347,701 | |
| aDuring the period, Class R6 did not report any share transactions. | | | | | | | | | | | |
| bFor the period September 6, 2013 (commencement of operations) to July 31, 2014. | | | | | | | | | | | |
3. Transactions with Affiliates
Franklin Resources, Inc. is the holding company for various subsidiaries that together are referred to as Franklin Templeton Investments. Certain officers and trustees of the Trust are also officers and/or directors of the following subsidiaries:
| |
| Subsidiary | Affiliation |
| Franklin Templeton Institutional, LLC (FT Institutional) | Investment manager |
| Franklin Templeton Services, LLC (FT Services) | Administrative manager |
| Franklin Templeton Distributors, Inc. (Distributors) | Principal underwriter |
| Franklin Templeton Investor Services, LLC (Investor Services) | Transfer agent |
a. Management Fees
The Fund pays an investment management fee to FT Institutional based on the average daily net assets of the Fund as follows:
| | |
| Annualized Fee Rate | | Net Assets |
| 1.000 | % | Up to and including $500 million |
| 0.900 | % | Over $500 million, up to and including $1 billion |
| 0.850 | % | Over $1 billion, up to and including $1.5 billion |
| 0.800 | % | Over $1.5 billion, up to and including $6.5 billion |
| 0.780 | % | Over $6.5 billion, up to and including $11.5 billion |
| 0.760 | % | Over $11.5 billion, up to and including $16.5 billion |
| 0.740 | % | Over $16.5 billion, up to and including $19 billion |
| 0.730 | % | Over $19 billion, up to and including $21.5 billion |
| 0.720 | % | In excess of $21.5 billion |
b. Administrative Fees
Under an agreement with FT Institutional, FT Services provides administrative services to the Fund. The fee is paid by FT
Institutional based on the Fund’s average daily net assets, and is not an additional expense of the Fund.
franklintempleton.com
Semiannual Report | 27
FRANKLIN GLOBAL TRUST
NOTES TO FINANCIAL STATEMENTS (UNAUDITED)
Franklin Global Listed Infrastructure Fund (continued)
3. Transactions with Affiliates (continued)
c. Distribution Fees
The Board has adopted distribution plans for each share class, with the exception of Class R6 and Advisor Class shares, pursuant to Rule 12b-1 under the 1940 Act. Distribution fees are not charged on shares held by affiliates. Under the Fund’s Class A reimbursement distribution plan, the Fund reimburses Distributors for costs incurred in connection with the servicing, sale and distribution of the Fund’s shares up to the maximum annual plan rate. Under the Class A reimbursement distribution plan, costs exceeding the maximum for the current plan year cannot be reimbursed in subsequent periods. In addition, under the Fund’s Class C and R compensation distribution plans, the Fund pays Distributors for costs incurred in connection with the servicing, sale and distribution of the Fund’s shares up to the maximum annual plan rate for each class. The plan year, for purposes of monitoring compliance with the maximum annual plan rates, is February 1 through January 31.
The maximum annual plan rates, based on the average daily net assets, for each class, are as follows:
| | |
| Class A | 0.35 | % |
| Class C | 1.00 | % |
| Class R | 0.50 | % |
The Board has set the current rate at 0.30% per year for Class A shares until further notice and approval by the Board.
d. Sales Charges/Underwriting Agreements
Front-end sales charges and contingent deferred sales charges (CDSC) do not represent expenses of the Fund. These charges are deducted from the proceeds of sales of Fund shares prior to investment or from redemption proceeds prior to remittance, as applicable. Distributors has advised the Fund of the following commission transactions related to the sales and redemptions of the Fund’s shares for the period:
| | |
| Sales charges retained net of commissions paid to unaffiliated broker/dealers | $ | 32,729 |
| CDSC retained | $ | 752 |
e. Transfer Agent Fees
Each class of shares, except for Class R6, pays transfer agent fees to Investor Services for its performance of shareholder servicing obligations and reimburses Investor Services for out of pocket expenses incurred, including shareholding servicing fees paid to third parties. These fees are allocated daily based upon their relative proportion of such classes’ aggregate net assets. Class R6 pays Investor Services transfer agent fees specific to that class.
For the period ended January 31, 2015, the Fund paid transfer agent fees of $14,753, of which $13,368 was retained by Investor Services.
f. Waiver and Expense Reimbursements
FT Institutional and Investor Services have contractually agreed in advance to waive or limit their respective fees and to assume as their own expense certain expenses otherwise payable by the Fund so that the expenses (excluding distribution fees and acquired fund fees and expenses) for Class A, Class C, Class R and Advisor Class of the Fund do not exceed 1.15%, and Class R6 does not exceed 1.08% based on the average net assets of each class (other than certain non-routine expenses or costs, including those relating to litigation, indemnification, reorganizations, and liquidations) until November 30, 2016 and November 30, 2015, respectively.
28 | Semiannual Report
franklintempleton.com
FRANKLIN GLOBAL TRUST
NOTES TO FINANCIAL STATEMENTS (UNAUDITED)
Franklin Global Listed Infrastructure Fund (continued)
g. Other Affiliated Transactions
At January 31, 2015, Franklin Advisers, Inc., an affiliate of FT Institutional, owned 18.16% of the Fund’s outstanding shares.
4. Expense Offset Arrangement
The Fund has entered into an arrangement with its custodian whereby credits realized as a result of uninvested cash balances are used to reduce a portion of the Fund’s custodian expenses. During the period ended January 31, 2015, the custodian fees were reduced as noted in the Statement of Operations.
5. Income Taxes
At January 31, 2015, the cost of investments and net unrealized appreciation (depreciation) for income tax purposes were as follows:
| | | |
| Cost of investments | $ | 31,466,405 | |
| |
| Unrealized appreciation | $ | 2,231,397 | |
| Unrealized depreciation | | (1,048,400 | ) |
| Net unrealized appreciation (depreciation) | $ | 1,182,997 | |
Differences between income and/or capital gains as determined on a book basis and a tax basis are primarily due to differing treatments of pass-through entity income, offering costs and wash sales.
6. Investment Transactions
Purchases and sales of investments (excluding short term securities) for the period ended January 31, 2015, aggregated $21,098,509 and $6,463,283, respectively.
7. Concentration of Risk
Investing in foreign securities may include certain risks and considerations not typically associated with investing in U.S. securities, such as fluctuating currency values and changing local and regional economic, political and social conditions, which may result in greater market volatility. In addition, certain foreign securities may not be as liquid as U.S. securities.
8. Credit Facility
The Fund, together with other U.S. registered and foreign investment funds (collectively, Borrowers), managed by Franklin Templeton Investments, are borrowers in a joint syndicated senior unsecured credit facility totaling $1.5 billion (Global Credit Facility) which matured on February 13, 2015. This Global Credit Facility provides a source of funds to the Borrowers for temporary and emergency purposes, including the ability to meet future unanticipated or unusually large redemption requests. Effective February 13, 2015, the Borrowers renewed the Global Credit Facility for a one year term, maturing February 12, 2016, for a total of $2 billion.
Under the terms of the Global Credit Facility, the Fund shall, in addition to interest charged on any borrowings made by the Fund and other costs incurred by the Fund, pay its share of fees and expenses incurred in connection with the implementation and maintenance of the Global Credit Facility, based upon its relative share of the aggregate net assets of all of the Borrowers, including an annual commitment fee of 0.07% based upon the unused portion of the Global Credit Facility. These fees are reflected in other expenses in the Statement of Operations. During the period ended January 31, 2015, the Fund did not use the Global Credit Facility.
franklintempleton.com
Semiannual Report | 29
FRANKLIN GLOBAL TRUST
NOTES TO FINANCIAL STATEMENTS (UNAUDITED)
Franklin Global Listed Infrastructure Fund (continued)
9. Fair Value Measurements
The Fund follows a fair value hierarchy that distinguishes between market data obtained from independent sources (observable inputs) and the Fund’s own market assumptions (unobservable inputs). These inputs are used in determining the value of the Fund’s financial instruments and are summarized in the following fair value hierarchy:
- Level 1 – quoted prices in active markets for identical financial instruments
- Level 2 – other significant observable inputs (including quoted prices for similar financial instruments, interest rates, prepayment speed, credit risk, etc.)
- Level 3 – significant unobservable inputs (including the Fund’s own assumptions in determining the fair value of financial instruments)
The input levels are not necessarily an indication of the risk or liquidity associated with financial instruments at that level.
For movements between the levels within the fair value hierarchy, the Fund has adopted a policy of recognizing the transfers as of the date of the underlying event which caused the movement.
At January 31, 2015, all of the Fund’s investments in financial instruments carried at fair value were valued using Level 1 inputs.
For detailed categories, see the accompanying Statement of Investments.
10. Subsequent Events
The Fund has evaluated subsequent events through the issuance of the financial statements and determined that no events have occurred that require disclosure other than those already disclosed in the financial statements.
|
| Abbreviations |
| Selected Portfolio |
| ADR American Depositary Receipt |
30 | Semiannual Report franklintempleton.com
FRANKLIN GLOBAL TRUST
FRANKLIN GLOBAL LISTED INFRASTRUCTURE FUND
Shareholder Information
Proxy Voting Policies and Procedures
The Trust’s investment manager has established Proxy Voting Policies and Procedures (Policies) that the Trust uses to determine how to vote proxies relating to portfolio securities. Shareholders may view the Trust’s complete Policies online at franklintempleton.com. Alternatively, shareholders may request copies of the Policies free of charge by calling the Proxy Group collect at (954) 527-7678 or by sending a written request to: Franklin Templeton Companies, LLC, 300 S.E. 2nd Street, Fort Lauderdale, FL 33301, Attention: Proxy Group. Copies of the Trust’s proxy voting records are also made available online at franklintempleton.com and posted on the U.S. Securities and Exchange Commission’s website at sec.gov and reflect the most recent 12-month period ended June 30.
Quarterly Statement of Investments
The Trust files a complete statement of investments with the U.S. Securities and Exchange Commission for the first and third quarters for each fiscal year on Form N-Q. Shareholders may view the filed Form N-Q by visiting the Commission’s website at sec.gov. The filed form may also be viewed and copied at the Commission’s Public Reference Room in Washington, DC. Information regarding the operations of the Public Reference Room may be obtained by calling (800) SEC-0330.
franklintempleton.com
Semiannual Report | 31
This page intentionally left blank.
Item 2. Code OF Ethics.
(a) The Registrant has adopted a code of ethics that applies to its principal executive officers and principal financial and accounting officer.
(c) N/A
(d) N/A
(f) Pursuant to Item 12(a)(1), the Registrant is attaching as an exhibit a copy of its code of ethics that applies to its principal executive officers and
principal financial and accounting officer.
Item 3. Audit Committee Financial Expert.
(a)(1) The Registrant has an audit committee financial expert serving on its audit committee.
(2) The audit committee financial expert is John B. Wilson and he is
"independent" as defined under the relevant Securities and Exchange Commission Rules and Releases.
Item 4. Principal Accountant Fees and Services. N/A
Item 5. Audit Committee of Listed Registrants. N/A
Item 6. Schedule of Investments. N/A
Item 7. Disclosure of Proxy Voting Policies and Procedures for Closed-End Management Investment Companies. N/A
Item 8. Portfolio Managers of Closed-End Management Investment Companies. N/A
Item 9. Purchases of Equity Securities by Closed-End Management Investment Company and Affiliated Purchasers. N/A
Item 10. Submission of Matters to a Vote of Security Holders.
There have been no changes to the procedures by which shareholders may recommend nominees to the Registrant's Board of Trustees that would require disclosure herein.
Item 11. Controls and Procedures.
(a) Evaluation of Disclosure Controls And Procedures. The Registrant maintains disclosure controls and procedures that are designed to ensure that information required to be disclosed in the Registrant's filings under the Securities Exchange Act of 1934 and the Investment Company Act of 1940 is recorded, processed, summarized and reported within the periods specified in the rules and forms of the Securities and Exchange Commission. Such information is accumulated and communicated to the Registrant's management, including its principal executive officer and principal financial officer, as appropriate, to allow timely decisions regarding required disclosure. The Registrant's management, including the principal executive officer and the principal financial officer, recognizes that any set of controls and procedures, no matter how well designed and operated, can provide only reasonable assurance of achieving the desired control objectives.
Within 90 days prior to the filing date of this Shareholder Report on Form N-CSR, the Registrant had carried out an evaluation, under the supervision and with the participation of the Registrant's management, including the Registrant's principal executive officer and the Registrant's principal financial officer, of the effectiveness of the design and operation of the Registrant's disclosure controls and procedures. Based on such evaluation, the Registrant's principal executive officer and principal financial officer concluded that the Registrant's disclosure controls and procedures are effective.
(b) Changes in Internal Controls. There have been no changes in the Registrant's internal controls or in other factors that could materially affect the internal controls over financial reporting subsequent to the date of their evaluation in connection with the preparation of this Shareholder Report on Form N-CSR.
Item 12. Exhibits.
(a) (1) Code of Ethics
(a) (2) Certifications pursuant to Section 302 of the Sarbanes-Oxley Act of 2002 of Laura F. Fergerson, Chief Executive Officer - Finance and Administration, and Gaston Gardey, Chief Financial Officer and Chief Accounting Officer
(b) Certifications pursuant to Section 906 of the Sarbanes-Oxley Act of 2002 of Laura F. Fergerson, Chief Executive Officer - Finance and Administration, and Gaston Gardey, Chief Financial Officer and Chief Accounting Officer
SIGNATURES
Pursuant to the requirements of the Securities Exchange Act of 1934 and the Investment Company Act of 1940, the registrant has duly caused this report to be signed on its behalf by the undersigned, thereunto duly authorized.
FRANKLIN GLOBAL TRUST
By /s/Laura F. Fergerson
Laura F. Fergerson
Chief Executive Officer - Finance and Administration
Date March 27, 2015
Pursuant to the requirements of the Securities Exchange Act of 1934 and the Investment Company Act of 1940, this report has been signed below by the following persons on behalf of the registrant and in the capacities and on the dates indicated.
By /s/Laura F. Fergerson
Laura F. Fergerson
Chief Executive Officer - Finance and Administration
Date March 27, 2015
By /s/Gaston Gardey
Gaston Gardey
Chief Financial Officer and Chief Accounting Officer
Date March 27, 2015