UNITED STATES
SECURITIES AND EXCHANGE COMMISSION
Washington, D.C. 20549
FORM N-CSRS
CERTIFIED SHAREHOLDER REPORT OF REGISTERED
MANAGEMENT INVESTMENT COMPANIES
Investment Company Act file number 811-10157
Franklin Global Trust
(Exact name of registrant as specified in charter)
One Franklin Parkway, San Mateo, CA 94403-1906
(Address of principal executive offices) (Zip code)
Craig S. Tyle, One Franklin Parkway, San Mateo, CA 94403-1906
(Name and address of agent for service)
Registrant’s telephone number, including area code: 650 312-2000
Date of fiscal year end: 7/31
Date of reporting period: 1/31/18
| Item 1. | Reports to Stockholders. |
[INSERT SEMIANNUAL REPORTS]
| | |

| | Semiannual Report and Shareholder Letter January 31, 2018 |
Franklin Global Real Estate Fund
A SERIES OF FRANKLIN GLOBAL TRUST

Sign up for electronic delivery at franklintempleton.com/edelivery
Franklin Templeton Investments
Why choose Franklin Templeton Investments?
Successful investing begins with ambition. And achievement only comes when you reach for it. That’s why we continually strive to deliver better outcomes for investors. No matter what your goals are, our deep, global investment expertise allows us to offer solutions that can help.
During our more than 70 years of experience, we’ve managed through all kinds of markets—up, down and those in between. We’re always preparing for what may come next. It’s because of this, combined with our strength as one of the world’s largest asset managers that we’ve earned the trust of millions of investors around the world.
Dear Shareholder:
During the six months ended January 31, 2018, mostly upbeat global economic data, improved corporate earnings and supportive monetary policies benefited global securities markets. The European Central Bank (ECB) and the Bank of Japan (BOJ) kept their benchmark interest rates unchanged, while the US Federal Reserve (Fed) raised the target range for the federal funds rate 0.25% to 1.25%–1.50% at its December 2017 meeting amid signs of a growing US economy. The BOJ maintained its quantitative easing measures during the period, while the ECB began to reduce its bond purchases in January 2018. The Fed also began a gradual reduction in its balance sheet during the period as part of its ongoing plan to normalize US monetary policy. In this environment, US stocks, as measured by the Standard & Poor’s® 500 Index, and global developed market stocks, as measured by the MSCI World Index, generated strong returns for the six-month period.
We are committed to our long-term perspective and disciplined investment approach as we conduct a rigorous, fundamental analysis of securities with a regular emphasis on investment risk management.
We believe active, professional investment management serves investors well. We also recognize the important role of financial advisors in today’s markets and encourage investors to continue to seek their advice. Amid changing markets and economic conditions, we are confident investors with a well-diversified portfolio and a patient, long-term outlook should be well positioned for the years ahead.
Franklin Global Real Estate Fund’s semiannual report includes more detail about prevailing conditions and a discussion about
investment decisions during the period. Please remember all securities markets fluctuate, as do mutual fund share prices.
As previously communicated, the Fund will reorganize with and into Franklin Real Estate Securities Fund on or about April 27, 2018, pending shareholder approval. Effective at the close of market on December 21, 2017, the Fund closed to all new investors with limited exceptions. The Fund will not accept any additional purchases or exchanges after the close of market on or about April 20, 2018. The Fund reserves the right to change this policy at any time.
We thank you for investing with Franklin Templeton, welcome your questions and comments, and look forward to serving your future investment needs.
Sincerely,

Edward B. Jamieson
President and Chief Executive Officer –
Investment Management
Franklin Global Trust
This letter reflects our analysis and opinions as of January 31, 2018, unless otherwise indicated. The information is not a complete analysis of every aspect of any market, country, industry, security or fund. Statements of fact are from sources considered reliable.
| | | | | | | | |
| Not FDIC Insured | | | | | May Lose Value | | | | | No Bank Guarantee |
| | | | | | |
| franklintempleton.com | | Not part of the semiannual report | | | 1 | |
Contents
Semiannual Report
Visit franklintempleton.com for fund updates, to access your account, or to find helpful financial planning tools.
| | | | | | |
| | 2 | | | Semiannual Report | | franklintempleton.com |
Semiannual Report
Franklin Global Real Estate Fund
This semiannual report for Franklin Global Real Estate Fund covers the period ended January 31, 2018. As previously communicated, the Fund will reorganize with and into Franklin Real Estate Securities Fund on or about April 27, 2018, pending shareholder approval. Effective at the close of market on December 21, 2017, the Fund closed to all new investors with limited exceptions. The Fund will not accept any additional purchases or exchanges after the close of market on or about April 20, 2018. The Fund reserves the right to change this policy at any time.
Your Fund’s Goal and Main Investments
The Fund seeks high total return. Under normal market conditions, the Fund invests at least 80% of its net assets in securities of companies located anywhere in the world that operate in the real estate sector, including real estate investment trusts (REITs) and similar REIT-like entities domiciled outside the US.1
Performance Overview
For the six months ended January 31, 2018, the Fund’s Class A shares posted a +3.48% cumulative total return. In comparison, the FTSE® EPRA®/NAREIT® Developed Index, which measures global real estate markets in North America, Europe and Asia, delivered a +3.83% total return.2 You can find the Fund’s long-term performance data in the Performance Summary beginning on page 8.
Performance data represent past performance, which does not guarantee future results. Investment return and principal value will fluctuate, and you may have a gain or loss when you sell your shares. Current performance may differ from figures shown. For most recent month-end performance, go to franklintempleton.com or call (800) 342-5236.
Economic and Market Overview
The US economy continued to grow during the six months under review. The economy expanded in 2017’s fourth quarter, though at a slower pace compared to the third quarter, as lower inventory investment and higher imports partially offset the positive contributions of growth in consumer spending, business and housing investment, exports, and government spending. The manufacturing and services sectors expanded during the period. The unemployment rate decreased from 4.3% in July 2017 to 4.1% at period-end.3 Annual inflation, as measured by the Consumer Price Index, increased from 1.7% in July 2017 to 2.1% at period-end.3
The US Federal Reserve (Fed) kept its target range for the federal funds rate unchanged at its meetings in the August-November period and began reducing its balance sheet in October. At its December meeting, the Fed raised its target range for the federal funds rate 0.25% to 1.25%–1.50%, as widely anticipated by the market. The Fed also confirmed that the monthly balance sheet reduction would increase from $10 billion to $20 billion beginning in January 2018. At its January 2018 meeting, the Fed left its target rate for the federal funds rate unchanged, but expressed that it anticipated inflation to rise in 2018 and stabilize around the 2% target over the medium term. The broad US stock market, as measured by the Standard & Poor’s 500 Index, advanced for the six-month period ended January 31, 2018.
The global economy generally expanded during the six-month period under review. In this environment, global developed and emerging market stocks generated a +14.52% total return, as measured by the MSCI All Country World Index.2 Global markets were aided by price gains in oil and other commodities, generally upbeat economic data across regions, the European Central Bank’s (ECB’s) extension of its monetary
1. REITs are real estate investment trust companies, usually with publicly traded stock, that manage a portfolio of income-producing real estate properties such as apartments, hotels, industrial properties, office buildings or shopping centers. The Fund predominantly invests in “equity” REITs, which also take ownership positions in real estate. Shareholders of equity REITs generally receive income from rents received and receive capital gains when properties are sold at a profit. REITs are generally operated by experienced property management teams and typically concentrate on a specific geographic region or property type.
2. Source: Morningstar.
The index is unmanaged and includes reinvestment of any income or distributions. One cannot invest directly in an index, and an index is not representative of the Fund’s portfolio.
3. Bureau of Labor Statistics.
The dollar value, number of shares or principal amount, and names of all portfolio holdings are listed in the Fund’s Statement of Investments (SOI).
The SOI begins on page 15.
| | | | | | |
| franklintempleton.com | | Semiannual Report | | | 3 | |
FRANKLIN GLOBAL REAL ESTATE FUND
easing program, and encouraging corporate earnings reports. The passage of the US tax reform bill also supported global stocks.
However, global markets reflected investor concerns about geopolitical tensions in the Korean peninsula and other regions, expectations that key central bankers around the world may potentially raise interest rates amid an improving economic outlook and political uncertainties in the US and the European Union.
In Europe, the UK’s economic growth moderated in 2017’s fourth quarter over the previous quarter, due to slower growth in production output, household spending and business investment. In November, the Bank of England raised its key policy rate 0.25%, its first increase in a decade. The eurozone’s growth moderated in 2017’s fourth quarter over the previous quarter. The bloc’s annual inflation rate remained low and ended at the same level as in July 2017. The ECB kept its benchmark interest rate unchanged during the period. However, at its October meeting, the ECB extended the time frame for its massive bond-buying program from December 2017 to at least September 2018, while reducing the amount of monthly bond purchases in half beginning in January 2018.
In Asia, Japan’s quarterly gross domestic product (GDP) growth slowed in 2017’s fourth quarter compared to the third quarter, as a slowdown in business spending and contractions in private residential investment and government spending offset a recovery in private consumption. The Bank of Japan left its benchmark interest rate unchanged during the period and continued its monetary stimulus measures. China’s annual GDP grew at a stable rate in 2017’s fourth quarter compared to the prior-year period. The People’s Bank of China also left its benchmark interest rate unchanged during the period.
Global Real Estate Market Overview
According to the FTSE EPRA/NAREIT Developed Index, in US dollar terms, Austria and Germany performed well. Italy, Singapore and Norway also posted solid results. In contrast, some of the markets represented in the index that lost value, included France, Japan and Australia. At period-end, the US was the index’s largest country weighting.
Investment Strategy
We are research-driven, fundamental investors. We seek to limit price volatility by investing across markets and property types. We also seek to provide a consistently high level of income. We center our active investment strategy on the belief that unsynchronized regional economic activity within the
Geographic Composition
Based on Total Net Assets as of 1/31/18
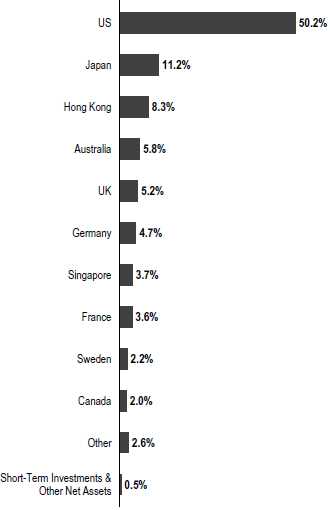
global economy can provide consistent, attractive return opportunities in the global real estate markets. We use a bottom-up stock selection process that incorporates macro-level views in the evaluation process. We use top-down macro overlays to provide country/regional, property type and company size perspectives in identifying international/local cyclical and thematic trends that highlight investment opportunities. We may use derivative instruments, such as currency forward contracts, from time to time to help manage currency risk and the Fund’s exposure to various currencies.
|
What is a currency forward contract? A currency forward contract is an agreement between the Fund and a counterparty to buy or sell a foreign currency in exchange for another currency at a specific exchange rate on a future date. Currency forward contracts are privately traded in the interbank market, not on a centralized exchange. |
| | | | |
| 4 | | Semiannual Report | | franklintempleton.com |
FRANKLIN GLOBAL REAL ESTATE FUND
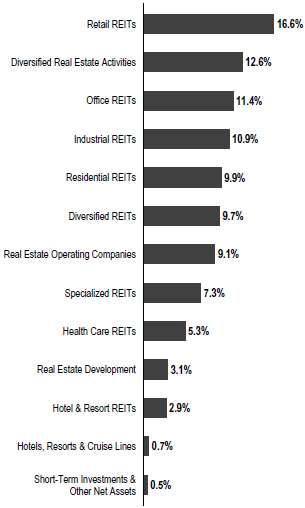
Portfolio Composition
Based on Total Net Assets as of 1/31/18
Manager’s Discussion
During the six months under review, key contributors to the Fund’s performance relative to the FTSE EPRA/NAREIT Developed Index included stock selection in the residential industry.4 Shares of German-based residential REIT ADO Properties, surged over the reporting period, as the German residential sector outperformed the overall index. ADO Properties outperformed its peer group with stronger-than-average rental growth in the third quarter of 2017. Fundamentally, the Berlin residential market has remained attractive as supply and demand continued to put upward pressure on rents, while vacancies have decreased sharply. We
4. Residential holdings are in real estate operating companies in the SOI.
5. Industrial property holdings are in industrial REITs in the SOI.
Top 10 Holdings
1/31/18
| | |
Company Sector/Industry, Country | | % of Total
Net Assets |
Simon Property Group Inc. Retail REITs, US | | 3.7% |
Prologis Inc. Industrial REITs, US | | 3.3% |
Mitsui Fudosan Co. Ltd. Diversified Real Estate Activities, Japan | | 2.8% |
CK Asset Holdings Ltd. Real Estate Development, Hong Kong | | 2.6% |
Unibail-Rodamco SE Retail REITs, France | | 2.3% |
Deutsche Wohnen SE Real Estate Operating Companies, Germany | | 2.3% |
Equity Residential Residential REITs, US | | 2.2% |
Mitsubishi Estate Co. Ltd. Diversified Real Estate Activities, Japan | | 2.1% |
Sun Hung Kai Properties Ltd. Diversified Real Estate Activities, Hong Kong | | 2.1% |
AvalonBay Communities Inc. Residential REITs, US | | 2.0% |
believe ADO Properties, is well positioned to benefit from further rent increases within the Berlin residential market.
Security selection and an overweighting in the industrial property industry also boosted results.5 Shares of Segro, a UK industrial property company, outperformed over the period, as the company benefited from strong growth in ecommerce. Despite the lack of quality industrial space, limited new supply and scarcity of industrial zoned land, the company has continued to report robust and improved rental growth, while maintaining a solid development pipeline.
Other individual contributors to relative performance included City Developments, one of the largest property developers in Singapore. Shares outperformed the local and global indexes over the period. The residential market in Singapore declined in 2017 but began to show price recovery due to limited supply, an improving economic outlook and stable affordability. We believe City Developments remains well positioned in the Singapore residential market, as the company has the largest residential holdings for future development among listed players. In addition, it has executed well over the past couple years in monetizing its assets.
| | | | | | |
| franklintempleton.com | | Semiannual Report | | | 5 | |
FRANKLIN GLOBAL REAL ESTATE FUND
Conversely, stock selection and an underweighting in the triple net leasing industry detracted from relative performance.6 Shares of Gramercy Property Trust, an owner and asset manager of single-tenant, net-lease industrial and office properties in the US, underperformed over the reporting period. Although Gramercy has been successful in increasing its industrial weighting through acquisitions, its operating metrics have fallen below expectations, namely declining occupancy and weaker same store net-operating income. Additionally, some mixed messaging on external growth initiatives has also raised investor concerns regarding the company’s overall strategy. Relative returns were pressured further by security selection in the diversified industry.7 Shares of Washington REIT, a diversified REIT with a portfolio of office, retail and multifamily assets in the greater Washington, D.C., metropolitan area, underperformed during the reporting period. Despite reporting above-average operating results for the past few quarters, the stock’s recent underperformance largely reflected increased uncertainty about net earnings impact based on its recent portfolio transactions. However, we continue to believe the company remains well positioned to benefit from recovering fundamentals in the Washington, D.C., metro area given its unique strategy of focusing on Class B multifamily assets and redeveloped/renovated office investments with mostly small to mid-sized tenants and minimum government exposure.
Other notable detractors over the reporting period included HCP, one of the three largest US-based healthcare REITs. The company, which is currently going through a transition led by a new management team, focuses on life-science, senior housing and medical office segments within health care. As part of its new simplification business strategy to focus on private pay versus insurance, HCP exited its skilled nursing segment through a spin-off. The spin-off enabled the majority of its portfolio to be private pay across its three core segments. We believe the stock’s recent underperformance reflected overall negative investor sentiment for health care REITs, as well as the company’s mixed quarterly operating results. HCP’s senior housing portfolio has continued to face increased operational challenges, as well as supply pressures, as rent coverage for one of HCP’s largest senior housing operators, Brookdale, deteriorated. HCP’s results were also negatively impacted by recent asset sales. We reduced our position in HCP as we became more cautious about the stock’s near-term outlook. We
6. Triple net leasing holdings are in diversified REITs in the SOI.
7. Diversified holdings are in diversified REITs in the SOI.
See www.franklintempletondatasources.com for additional data provider information.
believe the stock will likely remain under pressure until HCP successfully executes on its simplification plan.
It is important to recognize the effect of currency movements on the Fund’s performance. In general, if the value of the US dollar goes up compared with a foreign currency, an investment traded in that foreign currency will go down in value because it will be worth fewer US dollars. This can have a negative effect on Fund performance. Conversely, when the US dollar weakens in relation to a foreign currency, an investment traded in that foreign currency will increase in value, which can contribute to Fund performance. For the six months ended January 31, 2018, the US dollar declined in value relative to most currencies. As a result, the Fund’s performance was positively affected by the portfolio’s significant investment in securities with non-US currency exposure. However, one cannot expect the same result in future periods.
Thank you for your continued participation in Franklin Global Real Estate Fund. We look forward to serving your future investment needs.
| | |
 | | 
Wilson Magee |
| |
 | | 
Daniel Pettersson |
| |
| | Portfolio Management Team |
| | | | |
| 6 | | Semiannual Report | | franklintempleton.com |
FRANKLIN GLOBAL REAL ESTATE FUND
The foregoing information reflects our analysis, opinions and portfolio holdings as of January 31, 2018, the end of the reporting period. The way we implement our main investment strategies and the resulting portfolio holdings may change depending on factors such as market and economic conditions. These opinions may not be relied upon as investment advice or an offer for a particular security. The information is not a complete analysis of every aspect of any market, country, industry, security or the Fund. Statements of fact are from sources considered reliable, but the investment manager makes no representation or warranty as to their completeness or accuracy. Although historical performance is no guarantee of future results, these insights may help you understand our investment management philosophy.
| | | | | | |
| franklintempleton.com | | Semiannual Report | | | 7 | |
FRANKLIN GLOBAL REAL ESTATE FUND
Performance Summary as of January 31, 2018
The performance table does not reflect any taxes that a shareholder would pay on Fund dividends, capital gain distributions, if any, or any realized gains on the sale of Fund shares. Total return reflects reinvestment of the Fund’s dividends and capital gain distributions, if any, and any unrealized gains or losses. Your dividend income will vary depending on dividends or interest paid by securities in the Fund’s portfolio, adjusted for operating expenses of each class. Capital gain distributions are net profits realized from the sale of portfolio securities.
Performance as of 1/31/181
Cumulative total return excludes sales charges. Average annual total return includes maximum sales charges. Sales charges will vary depending on the size of the investment and the class of share purchased. The maximum is 5.75% and the minimum is 0%. Class A: 5.75% maximum initial sales charge; Advisor Class: no sales charges. For other share classes, visit franklintempleton.com.
| | | | | | | | |
| Share Class | | Cumulative Total Return2 | | | Average Annual Total Return3 | |
A | | | | | | | | |
6-Month | | | +3.48% | | | | -2.45% | |
1-Year | | | +10.19% | | | | +3.84% | |
5-Year | | | +28.51% | | | | +3.91% | |
10-Year | | | +36.38% | | | | +2.55% | |
Advisor | | | | | | | | |
6-Month | | | +3.52% | | | | +3.52% | |
1-Year | | | +10.45% | | | | +10.45% | |
5-Year | | | +30.22% | | | | +5.42% | |
10-Year | | | +40.46% | | | | +3.46% | |
Performance data represent past performance, which does not guarantee future results. Investment return and principal value will fluctuate, and you may have a gain or loss when you sell your shares. Current performance may differ from figures shown. For most recent month-end performance, go to franklintempleton.com or call (800) 342-5236.
See page 9 for Performance Summary footnotes.
| | | | |
| 8 | | Semiannual Report | | franklintempleton.com |
FRANKLIN GLOBAL REAL ESTATE FUND
PERFORMANCE SUMMARY
Distributions (8/1/17–1/31/18)
| | | | |
| Share Class | | Net Investment
Income | |
A | | | $0.0249 | |
R6 | | | $0.0640 | |
Advisor | | | $0.0503 | |
Total Annual Operating Expenses4
| | | | | | | | |
| Share Class | | With
Waiver | | | Without
Waiver | |
A | | | 1.40% | | | | 1.55% | |
Advisor | | | 1.15% | | | | 1.30% | |
Each class of shares is available to certain eligible investors and has different annual fees and expenses, as described in the prospectus.
All investments involve risks, including possible loss of principal. The Fund concentrates in real estate securities, which involve special risks, such as declines in the value of real estate and increased susceptibility to adverse economic or regulatory developments affecting the sector. The Fund’s investments in REITs involve additional risks; since REITs typically are invested in a limited number of projects or in a particular market segment, they are more susceptible to adverse developments affecting a single project or market segment than more broadly diversified investments. Foreign investing, especially in emerging markets, involves additional risks such as currency and market volatility, as well as political and social instability. Investments in derivatives involve costs and create economic leverage, which may result in significant volatility and cause the Fund to participate in losses (as well as gains) that significantly exceed the Fund’s initial investment. The Fund is actively managed but there is no guarantee that the manager’s investment decisions will produce the desired results. The Fund’s prospectus also includes a description of the main investment risks.
1. The Fund has an expense reduction contractually guaranteed through 11/30/18. Fund investment results reflect the expense reduction; without this reduction, the results would have been lower.
2. Cumulative total return represents the change in value of an investment over the periods indicated.
3. Average annual total return represents the average annual change in value of an investment over the periods indicated. Return for less than one year, if any, has not been annualized.
4. Figures are as stated in the Fund’s current prospectus and may differ from the expense ratios disclosed in the Your Fund’s Expenses and Financial Highlights in this report. In periods of market volatility, assets may decline significantly, causing total annual Fund operating expenses to become higher than the figures shown.
| | | | | | |
| franklintempleton.com | | Semiannual Report | | | 9 | |
FRANKLIN GLOBAL REAL ESTATE FUND
Your Fund’s Expenses
As a Fund shareholder, you can incur two types of costs: (1) transaction costs, including sales charges (loads) on Fund purchases and redemptions; and (2) ongoing Fund costs, including management fees, distribution and service (12b-1) fees, and other Fund expenses. All mutual funds have ongoing costs, sometimes referred to as operating expenses. The table below shows ongoing costs of investing in the Fund and can help you understand these costs and compare them with those of other mutual funds. The table assumes a $1,000 investment held for the six months indicated.
Actual Fund Expenses
The table below provides information about actual account values and actual expenses in the columns under the heading “Actual.” In these columns the Fund’s actual return, which includes the effect of Fund expenses, is used to calculate the “Ending Account Value” for each class of shares. You can estimate the expenses you paid during the period by following these steps (of course, your account value and expenses will differ from those in this illustration): Divide your account value by $1,000 (if your account had an $8,600 value, then $8,600 ÷ $1,000 = 8.6). Then multiply the result by the number in the row for your class of shares under the headings “Actual” and “Expenses Paid During Period” (if Actual Expenses Paid During Period were $7.50, then 8.6 x $7.50 = $64.50). In this illustration, the actual expenses paid this period are $64.50.
Hypothetical Example for Comparison with Other Funds
Under the heading “Hypothetical” in the table, information is provided about hypothetical account values and hypothetical expenses based on the Fund’s actual expense ratio and an assumed rate of return of 5% per year before expenses, which is not the Fund’s actual return. This information may not be used to estimate the actual ending account balance or expenses you paid for the period, but it can help you compare ongoing costs of investing in the Fund with those of other funds. To do so, compare this 5% hypothetical example for the class of shares you hold with the 5% hypothetical examples that appear in the shareholder reports of other funds.
Please note that expenses shown in the table are meant to highlight ongoing costs and do not reflect any transactional costs. Therefore, information under the heading “Hypothetical” is useful in comparing ongoing costs only, and will not help you compare total costs of owning different funds. In addition, if transactional costs were included, your total costs would have been higher.
| | | | | | | | | | | | | | | | | | |
| | | | | | | Actual | | | | Hypothetical | | | | |
| | | | | | | (actual return after expenses) | | | | (5% annual return before expenses) | | | | |
| | | | | | | | | Expenses | | | | | | Expenses | | | | Net |
| | | Beginning | | | | Ending | | Paid During | | | | Ending | | Paid During | | | | Annualized |
| Share | | Account | | | | Account | | Period | | | | Account | | Period | | | | Expense |
| Class | | Value 8/1/17 | | | | Value 1/31/18 | | 8/1/17–1/31/181,2 | | | | Value 1/31/18 | | 8/1/17–1/31/181,2 | | | | Ratio2 |
A | | $1,000 | | | | $1,034.80 | | $ 7.18 | | | | $1,018.15 | | $ 7.12 | | | | 1.40% |
C | | $1,000 | | | | $1,030.30 | | $10.95 | | | | $1,014.42 | | $10.87 | | | | 2.14% |
R6 | | $1,000 | | | | $1,035.70 | | $ 5.08 | | | | $1,020.21 | | $ 5.04 | | | | 0.99% |
Advisor | | $1,000 | | | | $1,035.20 | | $ 5.90 | | | | $1,019.41 | | $ 5.85 | | | | 1.15% |
1. Expenses are equal to the annualized expense ratio for the six-month period as indicated above—in the far right column—multiplied by the simple average account value over the period indicated, and then multiplied by 184/365 to reflect the one-half year period.
2. Reflects expenses after fee waivers and expense reimbursements.
| | | | |
| 10 | | Semiannual Report | | franklintempleton.com |
FRANKLIN GLOBAL TRUST
Financial Highlights
Franklin Global Real Estate Fund
| | | | | | | | | | | | | | | | | | | | | | | | |
| | | Six Months Ended
January 31, 2018 | | Year Ended July 31, | |
| | | (unaudited) | | 2017 | | | 2016 | | | 2015 | | | 2014 | | | 2013 | |
| |
| | | | | | |
| Class A | | | | | | | | | | | | | | | | | | | | | | | | |
| | | | | | |
Per share operating performance
(for a share outstanding throughout the period) | | | | | | | | | | | | | | | | | | | | | | | | |
| | | | | | |
| Net asset value, beginning of period | | | $9.05 | | | | $9.73 | | | | $8.83 | | | | $8.69 | | | | $7.88 | | | | $7.42 | |
| | | | |
| | | | | | |
| Income from investment operationsa: | | | | | | | | | | | | | | | | | | | | | | | | |
| | | | | | |
Net investment incomeb | | | 0.05 | | | | 0.10 | | | | 0.15 | | | | 0.10 | | | | 0.11 | | | | 0.11 | |
| | | | | | |
Net realized and unrealized gains (losses) | | | 0.26 | | | | (0.48 | ) | | | 0.89 | | | | 0.18 | | | | 0.82 | | | | 0.59 | |
| | | | |
| | | | | | |
Total from investment operations | | | 0.31 | | | | (0.38 | ) | | | 1.04 | | | | 0.28 | | | | 0.93 | | | | 0.70 | |
| | | | |
| | | | | | |
| Less distributions from net investment income | | | (0.02 | ) | | | (0.30 | ) | | | (0.14 | ) | | | (0.14 | ) | | | (0.12 | ) | | | (0.24 | ) |
| | | | |
| | | | | | |
Net asset value, end of period | | | $9.34 | | | | $9.05 | | | | $9.73 | | | | $8.83 | | | | $8.69 | | | | $7.88 | |
| | | | |
| | | | | | |
Total returnc | | | 3.48% | | | | (3.68)% | | | | 12.05% | | | | 3.27% | | | | 12.13% | | | | 9.44% | |
| | | | | | |
| Ratios to average net assetsd | | | | | | | | | | | | | | | | | | | | | | | | |
| | | | | | |
Expenses before waiver and payments by affiliates and expense reduction | | | 1.61% | | | | 1.55% | | | | 1.54% | | | | 1.58% | | | | 1.61% | | | | 1.62% | |
| | | | | | |
Expenses net of waiver and payments by affiliates and expense reductione | | | 1.40% | | | | 1.39% | | | | 1.40% | | | | 1.45% | | | | 1.45% | | | | 1.44% | |
| | | | | | |
Net investment income | | | 1.23% | | | | 1.16% | | | | 1.69% | | | | 1.06% | | | | 1.31% | | | | 1.37% | |
| | | | | | |
| Supplemental data | | | | | | | | | | | | | | | | | | | | | | | | |
| | | | | | |
Net assets, end of period (000’s) | | | $76,171 | | | | $80,700 | | | | $102,958 | | | | $102,228 | | | | $90,653 | | | | $86,575 | |
| | | | | | |
Portfolio turnover rate | | | 8.49% | | | | 27.67% | | | | 28.00% | | | | 26.05% | | | | 22.37% | | | | 19.43% | |
a The amount shown for a share outstanding throughout the period may not correlate with the Statement of Operations for the period due to the timing of sales and repurchases of the Fund’s shares in relation to income earned and/or fluctuating fair value of the investments of the Fund.
b Based on average daily shares outstanding.
c Total return does not reflect sales commissions or contingent deferred sales charges, if applicable, and is not annualized for periods less than one year.
d Ratios are annualized for periods less than one year, except for non-recurring expenses, if any.
e Benefit of expense reduction rounds to less than 0.01%.
| | | | | | |
| franklintempleton.com | | The accompanying notes are an integral part of these financial statements. | Semiannual Report | | | 11 | |
FRANKLIN GLOBAL TRUST
FINANCIAL HIGHLIGHTS
Franklin Global Real Estate Fund (continued)
| | | | | | | | | | | | | | | | | | | | | | | | |
| | | Six Months Ended
January 31, 2018 | | Year Ended July 31, | |
| | | (unaudited) | | 2017 | | | 2016 | | | 2015 | | | 2014 | | | 2013 | |
| |
| | | | | | |
| Class C | | | | | | | | | | | | | | | | | | | | | | | | |
| | | | | | |
| Per share operating performance | | | | | | | | | | | | | | | | | | | | | | | | |
(for a share outstanding throughout the period) | | | | | | | | | | | | | | | | | | | | | | | | |
| | | | | | |
Net asset value, beginning of period | | | $8.92 | | | | $9.58 | | | | $8.72 | | | | $8.58 | | | | $7.80 | | | | $7.34 | |
| | | | |
| | | | | | |
Income from investment operationsa: | | | | | | | | | | | | | | | | | | | | | | | | |
| | | | | | |
Net investment incomeb | | | 0.02 | | | | 0.04 | | | | 0.08 | | | | 0.03 | | | | 0.05 | | | | 0.05 | |
| | | | | | |
Net realized and unrealized gains (losses) | | | 0.25 | | | | (0.47 | ) | | | 0.88 | | | | 0.20 | | | | 0.81 | | | | 0.59 | |
| | | | |
| | | | | | |
Total from investment operations | | | 0.27 | | | | (0.43 | ) | | | 0.96 | | | | 0.23 | | | | 0.86 | | | | 0.64 | |
| | | | |
| | | | | | |
Less distributions from net investment income | | | — | | | | (0.23 | ) | | | (0.10 | ) | | | (0.09 | ) | | | (0.08 | ) | | | (0.18 | ) |
| | | | |
| | | | | | |
Net asset value, end of period | | | $9.19 | | | | $8.92 | | | | $9.58 | | | | $8.72 | | | | $8.58 | | | | $7.80 | |
| | | | |
| | | | | | |
Total returnc | | | 3.03% | | | | (4.30)% | | | | 11.11% | | | | 2.70% | | | | 11.28% | | | | 8.64% | |
| | | | | | |
| Ratios to average net assetsd | | | | | | | | | | | | | | | | | | | | | | | | |
| | | | | | |
Expenses before waiver and payments by affiliates and expense reduction | | | 2.35% | | | | 2.30% | | | | 2.29% | | | | 2.28% | | | | 2.31% | | | | 2.32% | |
| | | | | | |
Expenses net of waiver and payments by affiliates and expense reductione | | | 2.14% | | | | 2.14% | | | | 2.15% | | | | 2.15% | | | | 2.15% | | | | 2.14% | |
| | | | | | |
Net investment income | | | 0.49% | | | | 0.41% | | | | 0.94% | | | | 0.36% | | | | 0.61% | | | | 0.67% | |
| | | | | | |
| Supplemental data | | | | | | | | | | | | | | | | | | | | | | | | |
| | | | | | |
Net assets, end of period (000’s) | | | $13,295 | | | | $15,529 | | | | $20,906 | | | | $23,124 | | | | $20,896 | | | | $21,350 | |
| | | | | | |
Portfolio turnover rate | | | 8.49% | | | | 27.67% | | | | 28.00% | | | | 26.05% | | | | 22.37% | | | | 19.43% | |
a The amount shown for a share outstanding throughout the period may not correlate with the Statement of Operations for the period due to the timing of sales and repurchases of the Fund’s shares in relation to income earned and/or fluctuating fair value of the investments of the Fund.
b Based on average daily shares outstanding.
c Total return does not reflect sales commissions or contingent deferred sales charges, if applicable, and is not annualized for periods less than one year.
d Ratios are annualized for periods less than one year, except for non-recurring expenses, if any.
e Benefit of expense reduction rounds to less than 0.01%.
| | | | |
| 12 | | Semiannual Report | The accompanying notes are an integral part of these financial statements. | | franklintempleton.com |
FRANKLIN GLOBAL TRUST
FINANCIAL HIGHLIGHTS
Franklin Global Real Estate Fund (continued)
| | | | | | | | | | | | | | | | | | | | | | | | |
| | | Six Months Ended
January 31, 2018 | | Year Ended July 31, | |
| | | (unaudited) | | 2017 | | | 2016 | | | 2015 | | | 2014 | | | 2013a | |
| |
| | | | | | |
| Class R6 | | | | | | | | | | | | | | | | | | | | | | | | |
| | | | | | |
| Per share operating performance | | | | | | | | | | | | | | | | | | | | | | | | |
(for a share outstanding throughout the period) | | | | | | | | | | | | | | | | | | | | | | | | |
| | | | | | |
Net asset value, beginning of period | | | $9.09 | | | | $9.78 | | | | $8.88 | | | | $8.74 | | | | $7.92 | | | | $8.70 | |
| | | | |
| | | | | | |
Income from investment operationsb: | | | | | | | | | | | | | | | | | | | | | | | | |
| | | | | | |
Net investment incomec | | | 0.06 | | | | 0.14 | | | | 0.18 | | | | 0.14 | | | | 0.15 | | | | 0.04 | |
| | | | | | |
Net realized and unrealized gains (losses) | | | 0.27 | | | | (0.49 | ) | | | 0.90 | | | | 0.18 | | | | 0.82 | | | | (0.82 | ) |
| | | | |
| | | | | | |
Total from investment operations | | | 0.33 | | | | (0.35 | ) | | | 1.08 | | | | 0.32 | | | | 0.97 | | | | (0.78 | ) |
| | | | |
| | | | | | |
Less distributions from net investment income | | | (0.06 | ) | | | (0.34 | ) | | | (0.18 | ) | | | (0.18 | ) | | | (0.15 | ) | | | — | |
| | | | |
| | | | | | |
Net asset value, end of period | | | $9.36 | | | | $9.09 | | | | $9.78 | | | | $8.88 | | | | $8.74 | | | | $7.92 | |
| | | | |
| | | | | | |
Total returnd | | | 3.57% | | | | (3.24)% | | | | 12.49% | | | | 3.71% | | | | 12.51% | | | | (8.97)% | |
| | | | | | |
| Ratios to average net assetse | | | | | | | | | | | | | | | | | | | | | | | | |
| | | | | | |
Expenses before waiver and payments by affiliates and expense reduction | | | 2.00% | | | | 2.03% | | | | 1.23% | | | | 1.13% | | | | 1.15% | | | | 1.15% | |
| | | | | | |
Expenses net of waiver and payments by affiliates and expense reductionf | | | 0.99% | | | | 0.98% | | | | 0.99% | | | | 0.99% | | | | 0.99% | | | | 0.99% | |
| | | | | | |
Net investment income | | | 2.98% | | | | 1.58% | | | | 2.10% | | | | 1.52% | | | | 1.77% | | | | 1.82% | |
| | | | | | |
| Supplemental data | | | | | | | | | | | | | | | | | | | | | | | | |
| | | | | | |
Net assets, end of period (000’s) | | | $25 | | | | $18 | | | | $16 | | | | $246 | | | | $768 | | | | $379 | |
| | | | | | |
Portfolio turnover rate | | | 8.49% | | | | 27.67% | | | | 28.00% | | | | 26.05% | | | | 22.37% | | | | 19.43% | |
a For the period May 1, 2013 (effective date) to July 31, 2013.
b The amount shown for a share outstanding throughout the period may not correlate with the Statement of Operations for the period due to the timing of sales and repurchases of the Fund’s shares in relation to income earned and/or fluctuating fair value of the investments of the Fund.
c Based on average daily shares outstanding.
d Total return is not annualized for periods less than one year.
e Ratios are annualized for periods less than one year, except for non-recurring expenses, if any.
f Benefit of expense reduction rounds to less than 0.01%.
| | | | | | |
| franklintempleton.com | | The accompanying notes are an integral part of these financial statements. | Semiannual Report | | | 13 | |
FRANKLIN GLOBAL TRUST
FINANCIAL HIGHLIGHTS
Franklin Global Real Estate Fund (continued)
| | | | | | | | | | | | | | | | | | | | | | | | |
| | | Six Months Ended
January 31, 2018 | | Year Ended July 31, | |
| | | (unaudited) | | 2017 | | | 2016 | | | 2015 | | | 2014 | | | 2013 | |
| |
| | | | | | |
| Advisor Class | | | | | | | | | | | | | | | | | | | | | | | | |
| | | | | | |
| Per share operating performance | | | | | | | | | | | | | | | | | | | | | | | | |
(for a share outstanding throughout the period) | | | | | | | | | | | | | | | | | | | | | | | | |
| | | | | | |
Net asset value, beginning of period | | | $9.10 | | | | $9.78 | | | | $8.88 | | | | $8.73 | | | | $7.91 | | | | $7.46 | |
| | | | |
| | | | | | |
Income from investment operationsa: | | | | | | | | | | | | | | | | | | | | | | | | |
| | | | | | |
Net investment incomeb | | | 0.06 | | | | 0.12 | | | | 0.17 | | | | 0.12 | | | | 0.13 | | | | 0.13 | |
| | | | | | |
Net realized and unrealized gains (losses) | | | 0.26 | | | | (0.47 | ) | | | 0.90 | | | | 0.19 | | | | 0.83 | | | | 0.59 | |
| | | | |
| | | | | | |
Total from investment operations | | | 0.32 | | | | (0.35 | ) | | | 1.07 | | | | 0.31 | | | | 0.96 | | | | 0.72 | |
| | | | |
| | | | | | |
Less distributions from net investment income | | | (0.05 | ) | | | (0.33 | ) | | | (0.17 | ) | | | (0.16 | ) | | | (0.14 | ) | | | (0.27 | ) |
| | | | |
| | | | | | |
Net asset value, end of period | | | $9.37 | | | | $9.10 | | | | $9.78 | | | | $8.88 | | | | $8.73 | | | | $7.91 | |
| | | | |
| | | | | | |
Total returnc | | | 3.52% | | | | (3.39)% | | | | 12.31% | | | | 3.67% | | | | 12.39% | | | | 9.78% | |
| | | | | | |
| Ratios to average net assetsd | | | | | | | | | | | | | | | | | | | | | | | | |
| | | | | | |
Expenses before waiver and payments by affiliates and expense reduction | | | 1.36% | | | | 1.30% | | | | 1.29% | | | | 1.28% | | | | 1.31% | | | | 1.32% | |
| | | | | | |
Expenses net of waiver and payments by affiliates and expense reductione | | | 1.15% | | | | 1.14% | | | | 1.15% | | | | 1.15% | | | | 1.15% | | | | 1.14% | |
| | | | | | |
Net investment income | | | 1.48% | | | | 1.41% | | | | 1.94% | | | | 1.36% | | | | 1.61% | | | | 1.67% | |
| | | | | | |
| Supplemental data | | | | | | | | | | | | | | | | | | | | | | | | |
| | | | | | |
Net assets, end of period (000’s) | | | $57,274 | | | | $51,915 | | | | $51,617 | | | | $45,451 | | | | $52,423 | | | | $48,116 | |
| | | | | | |
Portfolio turnover rate | | | 8.49% | | | | 27.67% | | | | 28.00% | | | | 26.05% | | | | 22.37% | | | | 19.43% | |
a The amount shown for a share outstanding throughout the period may not correlate with the Statement of Operations for the period due to the timing of sales and repurchases of the Fund’s shares in relation to income earned and/or fluctuating fair value of the investments of the Fund.
b Based on average daily shares outstanding.
c Total return is not annualized for periods less than one year.
d Ratios are annualized for periods less than one year, except for non-recurring expenses, if any.
e Benefit of expense reduction rounds to less than 0.01%.
| | | | |
| 14 | | Semiannual Report | The accompanying notes are an integral part of these financial statements. | | franklintempleton.com |
FRANKLIN GLOBAL TRUST
Statement of Investments, January 31, 2018 (unaudited)
Franklin Global Real Estate Fund
| | | | | | | | | | | | | | |
| | | | | Country | | | Shares | | | Value | |
| | | Common Stocks 99.5% | | | | | | | | | |
| | Diversified Real Estate Activities 12.6% | | | | | | | | | | | | |
| | CapitaLand Ltd. | | | Singapore | | | | 586,124 | | | $ | 1,715,943 | |
| | City Developments Ltd. | | | Singapore | | | | 176,700 | | | | 1,786,332 | |
| | Mitsubishi Estate Co. Ltd. | | | Japan | | | | 164,454 | | | | 3,145,690 | |
| | Mitsui Fudosan Co. Ltd. | | | Japan | | | | 157,895 | | | | 4,132,298 | |
| | New World Development Co. Ltd. | | | Hong Kong | | | | 1,282,000 | | | | 2,074,746 | |
| | Nomura Real Estate Holdings Inc. | | | Japan | | | | 41,100 | | | | 983,223 | |
| | Sun Hung Kai Properties Ltd. | | | Hong Kong | | | | 176,727 | | | | 3,070,193 | |
| | Tokyo Tatemono Co. Ltd. | | | Japan | | | | 99,190 | | | | 1,590,710 | |
| | | | | | | | | | | | | | |
| | | | | | | | | | | | | 18,499,135 | |
| | | | | | | | | | | | | | |
| | Diversified REITs 9.7% | | | | | | | | | | | | |
| | Activia Properties Inc. | | | Japan | | | | 274 | | | | 1,218,363 | |
| | Gecina SA | | | France | | | | 9,458 | | | | 1,845,785 | |
| | GPT Group | | | Australia | | | | 327,802 | | | | 1,328,556 | |
| | Gramercy Property Trust | | | United States | | | | 26,300 | | | | 663,812 | |
| | Hispania Activos Inmobiliarios SOCIMI SA | | | Spain | | | | 83,504 | | | | 1,746,773 | |
| | Hulic REIT Inc. | | | Japan | | | | 628 | | | | 984,692 | |
| | Kenedix Office Investment Corp. | | | Japan | | | | 224 | | | | 1,413,527 | |
| | Land Securities Group PLC | | | United Kingdom | | | | 125,682 | | | | 1,786,701 | |
| | Stockland | | | Australia | | | | 406,743 | | | | 1,383,034 | |
| | VEREIT Inc. | | | United States | | | | 140,300 | | | | 1,010,160 | |
| | Washington REIT | | | United States | | | | 31,400 | | | | 899,924 | |
| | | | | | | | | | | | | | |
| | | | | | | | | | | | | 14,281,327 | |
| | | | | | | | | | | | | | |
| | Health Care REITs 5.3% | | | | | | | | | | | | |
| | CareTrust REIT Inc. | | | United States | | | | 48,800 | | | | 775,432 | |
| | HCP Inc. | | | United States | | | | 62,754 | | | | 1,511,116 | |
| | Physicians Realty Trust | | | United States | | | | 41,700 | | | | 679,710 | |
| | Ventas Inc. | | | United States | | | | 37,109 | | | | 2,076,991 | |
| | Welltower Inc. | | | United States | | | | 44,758 | | | | 2,684,137 | |
| | | | | | | | | | | | | | |
| | | | | | | | | | | | | 7,727,386 | |
| | | | | | | | | | | | | | |
| | Hotel & Resort REITs 2.9% | | | | | | | | | | | | |
| | Hoshino Resorts REIT Inc. | | | Japan | | | | 109 | | | | 572,029 | |
| | Host Hotels & Resorts Inc. | | | United States | | | | 103,020 | | | | 2,138,696 | |
| | MGM Growth Properties LLC, A | | | United States | | | | 19,600 | | | | 549,976 | |
| | Sunstone Hotel Investors Inc. | | | United States | | | | 59,899 | | | | 1,009,298 | |
| | | | | | | | | | | | | | |
| | | | | | | | | | | | | 4,269,999 | |
| | | | | | | | | | | | | | |
| | Hotels, Resorts & Cruise Lines 0.7% | | | | | | | | | | | | |
| | Hilton Worldwide Holdings Inc. | | | United States | | | | 11,703 | | | | 1,002,362 | |
| | | | | | | | | | | | | | |
| | Industrial REITs 10.9% | | | | | | | | | | | | |
| | First Industrial Realty Trust Inc. | | | United States | | | | 51,900 | | | | 1,601,634 | |
| | Frasers Logistics & Industrial Trust | | | Singapore | | | | 774,500 | | | | 673,145 | |
| | Goodman Group | | | Australia | | | | 311,141 | | | | 2,028,178 | |
| | Mapletree Logistics Trust | | | Singapore | | | | 885,040 | | | | 924,412 | |
| | Nippon Prologis REIT Inc. | | | Japan | | | | 493 | | | | 1,131,076 | |
| | PLA Administradora Industrial S de RL de CV | | | Mexico | | | | 433,200 | | | | 660,281 | |
| | Prologis Inc. | | | United States | | | | 74,020 | | | | 4,819,442 | |
| | Rexford Industrial Realty Inc. | | | United States | | | | 50,200 | | | | 1,490,438 | |
| | Segro PLC | | | United Kingdom | | | | 324,219 | | | | 2,674,922 | |
| | | | | | | | | | | | | | |
| | | | | | | | | | | | | 16,003,528 | |
| | | | | | | | | | | | | | |
| | | | | | |
| franklintempleton.com | | Semiannual Report | | | 15 | |
FRANKLIN GLOBAL TRUST
STATEMENT OF INVESTMENTS (UNAUDITED)
Franklin Global Real Estate Fund (continued)
| | | | | | | | | | | | | | |
| | | | | Country | | | Shares | | | Value | |
| | | Common Stocks (continued) | | | | | | | | | |
| | Office REITs 11.4% | | | | | | | | | | | | |
| | Alexandria Real Estate Equities Inc. | | | United States | | | | 19,384 | | | $ | 2,514,105 | |
| | Boston Properties Inc. | | | United States | | | | 18,932 | | | | 2,342,078 | |
| | Brandywine Realty Trust | | | United States | | | | 68,900 | | | | 1,236,066 | |
| | Cousins Properties Inc. | | | United States | | | | 81,200 | | | | 730,800 | |
| | Derwent London PLC | | | United Kingdom | | | | 37,321 | | | | 1,549,620 | |
| | Dexus | | | Australia | | | | 228,065 | | | | 1,751,265 | |
| | Highwoods Properties Inc. | | | United States | | | | 21,366 | | | | 1,023,004 | |
| | Japan Real Estate Investment Corp. | | | Japan | | | | 260 | | | | 1,335,898 | |
| | Kilroy Realty Corp. | | | United States | | | | 24,230 | | | | 1,728,083 | |
| | SL Green Realty Corp. | | | United States | | | | 15,859 | | | | 1,594,147 | |
| | Vornado Realty Trust | | | United States | | | | 12,325 | | | | 883,456 | |
| | | | | | | | | | | | | | |
| | | | | | | | | | | | | 16,688,522 | |
| | | | | | | | | | | | | | |
| | Real Estate Development 3.1% | | | | | | | | | | | | |
| | CK Asset Holdings Ltd. | | | Hong Kong | | | | 393,500 | | | | 3,755,068 | |
| a | | Howard Hughes Corp. | | | United States | | | | 6,210 | | | | 782,212 | |
| | | | | | | | | | | | | | |
| | | | | | | | | | | | | 4,537,280 | |
| | | | | | | | | | | | | | |
| | Real Estate Operating Companies 9.1% | | | | | | | | | | | | |
| | ADO Properties SA | | | Germany | | | | 10,294 | | | | 554,630 | |
| b | | ADO Properties SA, 144A | | | Germany | | | | 25,259 | | | | 1,360,928 | |
| | BUWOG AG | | | Austria | | | | 40,471 | | | | 1,452,015 | |
| | Deutsche Wohnen SE | | | Germany | | | | 74,008 | | | | 3,344,331 | |
| | Fabege AB | | | Sweden | | | | 56,030 | | | | 1,224,859 | |
| | First Capital Realty Inc. | | | Canada | | | | 43,000 | | | | 719,084 | |
| | Hemfosa Fastigheter AB | | | Sweden | | | | 74,804 | | | | 1,026,909 | |
| | Hufvudstaden AB, A | | | Sweden | | | | 60,273 | | | | 969,666 | |
| | Hysan Development Co. Ltd. | | | Hong Kong | | | | 206,624 | | | | 1,154,265 | |
| | Vonovia SE | | | Germany | | | | 32,126 | | | | 1,583,747 | |
| | | | | | | | | | | | | | |
| | | | | | | | | | | | | 13,390,434 | |
| | | | | | | | | | | | | | |
| | Residential REITs 9.9% | | | | | | | | | | | | |
| | AvalonBay Communities Inc. | | | United States | | | | 17,548 | | | | 2,990,179 | |
| | Camden Property Trust | | | United States | | | | 19,400 | | | | 1,679,264 | |
| | Canadian Apartment Properties REIT | | | Canada | | | | 50,000 | | | | 1,469,859 | |
| | Equity Lifestyle Properties Inc. | | | United States | | | | 21,402 | | | | 1,847,421 | |
| | Equity Residential | | | United States | | | | 51,723 | | | | 3,186,654 | |
| | Essex Property Trust Inc. | | | United States | | | | 4,100 | | | | 955,218 | |
| | Mid-America Apartment Communities Inc. | | | United States | | | | 7,000 | | | | 667,590 | |
| | Unite Group PLC | | | United Kingdom | | | | 148,542 | | | | 1,679,985 | |
| | | | | | | | | | | | | | |
| | | | | | | | | | | | | 14,476,170 | |
| | | | | | | | | | | | | | |
| | Retail REITs 16.6% | | | | | | | | | | | | |
| | Agree Realty Corp. | | | United States | | | | 16,300 | | | | 784,682 | |
| | CapitaLand Mall Trust | | | Singapore | | | | 172,800 | | | | 276,659 | |
| | GGP Inc. | | | United States | | | | 74,016 | | | | 1,704,588 | |
| | Kimco Realty Corp. | | | United States | | | | 25,651 | | | | 408,107 | |
| | Link REIT | | | Hong Kong | | | | 235,266 | | | | 2,081,175 | |
| | The Macerich Co. | | | United States | | | | 13,800 | | | | 891,066 | |
| | Realty Income Corp. | | | United States | | | | 34,924 | | | | 1,857,608 | |
| | Regency Centers Corp. | | | United States | | | | 29,781 | | | | 1,873,523 | |
| | Retail Properties of America Inc., A | | | United States | | | | 93,400 | | | | 1,125,470 | |
| | Scentre Group | | | Australia | | | | 374,898 | | | | 1,253,607 | |
| | Simon Property Group Inc. | | | United States | | | | 33,410 | | | | 5,458,192 | |
| | | | |
| 16 | | Semiannual Report | | franklintempleton.com |
FRANKLIN GLOBAL TRUST
STATEMENT OF INVESTMENTS (UNAUDITED)
| | | | | | | | | | | | | | |
| | Franklin Global Real Estate Fund (continued) | | | | | | | | | | | | |
| | | | | Country | | | Shares | | | Value | |
| | | Common Stocks (continued) | | | | | | | | | |
| | Retail REITs (continued) | | | | | | | | | | | | |
| | SmartCentres REIT | | | Canada | | | | 30,700 | | | $ | 754,990 | |
| | Taubman Centers Inc. | | | United States | | | | 8,300 | | | | 511,695 | |
| | Unibail-Rodamco SE | | | France | | | | 13,173 | | | | 3,378,658 | |
| | Weingarten Realty Investors | | | United States | | | | 41,760 | | | | 1,234,008 | |
| | Westfield Corp. | | | Australia | | | | 111,733 | | | | 822,864 | |
| | | | | | | | | | | | | | |
| | | | | | | | | | | | | 24,416,892 | |
| | | | | | | | | | | | | | |
| | Specialized REITs 7.3% | | | | | | | | | | | | |
| | American Tower Corp. | | | United States | | | | 8,700 | | | | 1,284,990 | |
| | Coresite Realty Corp. | | | United States | | | | 12,631 | | | | 1,368,190 | |
| | CubeSmart | | | United States | | | | 40,647 | | | | 1,119,012 | |
| | CyrusOne Inc. | | | United States | | | | 16,100 | | | | 928,809 | |
| | Digital Realty Trust Inc. | | | United States | | | | 20,927 | | | | 2,342,777 | |
| | Iron Mountain Inc. | | | United States | | | | 19,400 | | | | 679,582 | |
| | Public Storage | | | United States | | | | 10,988 | | | | 2,151,011 | |
| | Weyerhaeuser Co. | | | United States | | | | 20,700 | | | | 777,078 | |
| | | | | | | | | | | | | | |
| | | | | | | | | | | | | 10,651,449 | |
| | | | | | | | | | | | | | |
| | Total Common Stocks (Cost $103,757,261) | | | | | | | | | | | 145,944,484 | |
| | | | | | | | | | | | | | |
| | | | |
| | | | | | | | Principal
Amount | | | | |
| | Short Term Investments (Cost $500,000) 0.3% | | | | | | | | | | | | |
| | Time Deposits 0.3% | | | | | | | | | | | | |
| | Royal Bank of Canada, 1.28%, 2/01/18 | | | United States | | | $ | 500,000 | | | | 500,000 | |
| | | | | | | | | | | | | | |
| | Total Investments (Cost $104,257,261) 99.8% | | | | | | | | | | | 146,444,484 | |
| | Other Assets, less Liabilities 0.2% | | | | | | | | | | | 320,856 | |
| | | | | | | | | | | | | | |
| | Net Assets 100.0% | | | | | | | | | | $ | 146,765,340 | |
| | | | | | | | | | | | | | |
See Abbreviations on page 29.
aNon-income producing.
bSecurity was purchased pursuant to Rule 144A under the Securities Act of 1933 and may be sold in transactions exempt from registration only to qualified institutional buyers or in a public offering registered under the Securities Act of 1933. This security has been deemed liquid under guidelines approved by the Trust’s Board of Trustees. At January 31, 2018, the value of this security was $1,360,928, representing 0.9% of net assets.
| | | | | | |
| franklintempleton.com | | The accompanying notes are an integral part of these financial statements. | Semiannual Report | | | 17 | |
FRANKLIN GLOBAL TRUST
Financial Statements
Statement of Assets and Liabilities
January 31, 2018 (unaudited)
Franklin Global Real Estate Fund
| | | | |
Assets: | | | | |
Investments in securities: | | | | |
Cost - Unaffiliated issuers | | | $104,257,261 | |
| | | | |
Value - Unaffiliated issuers | | | $146,444,484 | |
Cash | | | 105,319 | |
Receivables: | | | | |
Investment securities sold | | | 554,445 | |
Capital shares sold | | | 1,507,020 | |
Dividends | | | 234,904 | |
European Union tax reclaims | | | 49,401 | |
| | | | |
Total assets | | | 148,895,573 | |
| | | | |
Liabilities: | | | | |
Payables: | | | | |
Investment securities purchased | | | 414,145 | |
Capital shares redeemed | | | 1,487,128 | |
Management fees | | | 96,615 | |
Distribution fees | | | 28,261 | |
Transfer agent fees | | | 25,469 | |
Trustees’ fees and expenses | | | 586 | |
Accrued expenses and other liabilities | | | 78,029 | |
| | | | |
Total liabilities | | | 2,130,233 | |
| | | | |
Net assets, at value | | | $146,765,340 | |
| | | | |
Net assets consist of: | | | | |
Paid-in capital | | | $146,556,794 | |
Distributions in excess of net investment income | | | (3,092,334 | ) |
Net unrealized appreciation (depreciation) | | | 42,197,370 | |
Accumulated net realized gain (loss) | | | (38,896,490 | ) |
| | | | |
Net assets, at value | | | $146,765,340 | |
| | | | |
| | | | |
| 18 | | Semiannual Report | The accompanying notes are an integral part of these financial statements. | | franklintempleton.com |
FRANKLIN GLOBAL TRUST
FINANCIAL STATEMENTS
Statement of Assets and Liabilities (continued)
January 31, 2018 (unaudited)
Franklin Global Real Estate Fund
| | | | |
| |
| Class A: | | | | |
Net assets, at value | | $ | 76,171,107 | |
| | | | |
Shares outstanding | | | 8,158,855 | |
| | | | |
Net asset value per sharea | | $ | 9.34 | |
| | | | |
Maximum offering price per share (net asset value per share ÷ 94.25%) | | $ | 9.91 | |
| | | | |
| Class C: | | | | |
Net assets, at value | | $ | 13,295,024 | |
| | | | |
Shares outstanding | | | 1,447,298 | |
| | | | |
Net asset value and maximum offering price per sharea | | $ | 9.19 | |
| | | | |
| Class R6: | | | | |
Net assets, at value | | $ | 24,768 | |
| | | | |
Shares outstanding | | | 2,646 | |
| | | | |
Net asset value and maximum offering price per share | | $ | 9.36 | |
| | | | |
| Advisor Class: | | | | |
Net assets, at value | | $ | 57,274,441 | |
| | | | |
Shares outstanding | | | 6,114,042 | |
| | | | |
Net asset value and maximum offering price per share | | $ | 9.37 | |
| | | | |
aRedemption price is equal to net asset value less contingent deferred sales charges, if applicable.
| | | | | | |
| franklintempleton.com | | The accompanying notes are an integral part of these financial statements. | Semiannual Report | | | 19 | |
FRANKLIN GLOBAL TRUST
FINANCIAL STATEMENTS
Statement of Operations
for the six months ended January 31, 2018 (unaudited)
Franklin Global Real Estate Fund
| | | | |
Investment income: | | | | |
Dividends: (net of foreign taxes)* | | | | |
Unaffiliated issuers | | $ | 1,867,772 | |
Interest: | | | | |
Unaffiliated issuers | | | 5,749 | |
Other income (Note 1c) | | | 16,052 | |
| | | | |
Total investment income | | | 1,889,573 | |
| | | | |
Expenses: | | | | |
Management fees (Note 3a) | | | 743,806 | |
Distribution fees: (Note 3c) | | | | |
Class A | | | 99,464 | |
Class C | | | 73,043 | |
Transfer agent fees: (Note 3e) | | | | |
Class A | | | 99,556 | |
Class C | | | 18,445 | |
Class R6 | | | 151 | |
Advisor Class | | | 68,086 | |
Custodian fees (Note 4) | | | 5,045 | |
Reports to shareholders | | | 21,175 | |
Registration and filing fees | | | 32,963 | |
Professional fees | | | 26,220 | |
Trustees’ fees and expenses | | | 2,997 | |
Other | | | 36,635 | |
| | | | |
Total expenses | | | 1,227,586 | |
Expense reductions (Note 4) | | | (703 | ) |
Expenses waived/paid by affiliates (Note 3f) | | | (200,093 | ) |
| | | | |
Net expenses | | | 1,026,790 | |
| | | | |
Net investment income | | | 862,783 | |
| | | | |
Realized and unrealized gains (losses): | | | | |
Net realized gain (loss) from: | | | | |
Investments: | | | | |
Unaffiliated issuers | | | 1,685,118 | |
Capital gain distributions from REITs | | | 422,337 | |
Foreign currency transactions | | | 3,886 | |
| | | | |
Net realized gain (loss) | | | 2,111,341 | |
| | | | |
Net change in unrealized appreciation (depreciation) on: | | | | |
Investments: | | | | |
Unaffiliated issuers | | | 1,950,864 | |
Translation of other assets and liabilities denominated in foreign currencies | | | 1,284 | |
| | | | |
Net change in unrealized appreciation (depreciation) | | | 1,952,148 | |
| | | | |
Net realized and unrealized gain (loss) | | | 4,063,489 | |
| | | | |
Net increase (decrease) in net assets resulting from operations | | $ | 4,926,272 | |
| | | | |
| |
*Foreign taxes withheld on dividends | | $ | 64,917 | |
| | | | |
| 20 | | Semiannual Report | The accompanying notes are an integral part of these financial statements. | | franklintempleton.com |
FRANKLIN GLOBAL TRUST
FINANCIAL STATEMENTS
Statements of Changes in Net Assets
Franklin Global Real Estate Fund
| | | | | | | | |
| | | Six Months Ended
January 31, 2018
(unaudited) | | | Year Ended
July 31, 2017 | |
Increase (decrease) in net assets: | | | | | | | | |
Operations: | | | | | | | | |
Net investment income | | $ | 862,783 | | | $ | 1,757,869 | |
Net realized gain (loss) | | | 2,111,341 | | | | 6,342,450 | |
Net change in unrealized appreciation (depreciation) | | | 1,952,148 | | | | (15,780,071 | ) |
| | | | |
Net increase (decrease) in net assets resulting from operations | | | 4,926,272 | | | | (7,679,752 | ) |
| | | | |
Distributions to shareholders from: | | | | | | | | |
Net investment income: | | | | | | | | |
Class A | | | (210,976 | ) | | | (3,089,261 | ) |
Class C | | | — | | | | (481,142 | ) |
Class R6 | | | (151 | ) | | | (589 | ) |
Advisor Class | | | (298,368 | ) | | | (1,792,637 | ) |
| | | | |
Total distributions to shareholders | | | (509,495 | ) | | | (5,363,629 | ) |
| | | | |
Capital share transactions: (Note 2) | | | | | | | | |
Class A | | | (6,909,683 | ) | | | (14,476,653 | ) |
Class C | | | (2,654,297 | ) | | | (3,802,833 | ) |
Class R6 | | | 5,708 | | | | 3,286 | |
Advisor Class | | | 3,744,086 | | | | 3,985,219 | |
| | | | |
Total capital share transactions | | | (5,814,186 | ) | | | (14,290,981 | ) |
| | | | |
Net increase (decrease) in net assets | | | (1,397,409 | ) | | | (27,334,362 | ) |
Net assets: | | | | | | | | |
Beginning of period | | | 148,162,749 | | | | 175,497,111 | |
| | | | |
End of period | | $ | 146,765,340 | | | $ | 148,162,749 | |
| | | | |
Distributions in excess of net investment income included in net assets: | | | | | | | | |
End of period | | $ | (3,092,334 | ) | | $ | (3,445,622 | ) |
| | | | |
| | | | | | |
| franklintempleton.com | | The accompanying notes are an integral part of these financial statements. | Semiannual Report | | | 21 | |
FRANKLIN GLOBAL TRUST
Notes to Financial Statements (unaudited)
Franklin Global Real Estate Fund
1. Organization and Significant Accounting Policies
Franklin Global Trust (Trust) is registered under the Investment Company Act of 1940 (1940 Act) as an open-end management investment company, consisting of five separate funds and applies the specialized accounting and reporting guidance in U.S. Generally Accepted Accounting Principles (U.S. GAAP). Franklin Global Real Estate Fund (Fund) is included in this report. The Fund offers four classes of shares: Class A, Class C, Class R6 and Advisor Class. Each class of shares may differ by its initial sales load, contingent deferred sales charges, voting rights on matters affecting a single class, its exchange privilege and fees due to differing arrangements for distribution and transfer agent fees.
The following summarizes the Fund’s significant accounting policies.
a. Financial Instrument Valuation
The Fund’s investments in financial instruments are carried at fair value daily. Fair value is the price that would be received to sell an asset or paid to transfer a liability in an orderly transaction between market participants on the measurement date. The Fund calculates the net asset value (NAV) per share as of 4 p.m. Eastern time each day the New York Stock Exchange (NYSE) is open for trading. Under compliance policies and procedures approved by the Trust’s Board of Trustees (the Board), the Fund’s administrator has responsibility for oversight of valuation, including leading the cross-functional Valuation Committee (VC). The VC provides administration and oversight of the Fund’s valuation policies and procedures, which are approved annually by the Board. Among other things, these procedures allow the Fund to utilize independent pricing services, quotations from securities and financial instrument dealers, and other market sources to determine fair value.
Equity securities listed on an exchange or on the NASDAQ National Market System are valued at the last quoted sale price or the official closing price of the day, respectively. Foreign equity securities are valued as of the close of trading on the foreign stock exchange on which the security is primarily traded, or as of 4 p.m. Eastern time. The value is then converted into its U.S. dollar equivalent at the foreign exchange rate in effect at 4 p.m. Eastern time on the day that the value of the security is determined. Over-the-counter (OTC) securities are valued within the range of the most recent quoted bid and ask
prices. Securities that trade in multiple markets or on multiple exchanges are valued according to the broadest and most representative market. Certain equity securities are valued based upon fundamental characteristics or relationships to similar securities.
Investments in time deposits are valued at cost, which approximates fair value.
The Fund has procedures to determine the fair value of financial instruments for which market prices are not reliable or readily available. Under these procedures, the VC convenes on a regular basis to review such financial instruments and considers a number of factors, including significant unobservable valuation inputs, when arriving at fair value. The VC primarily employs a market-based approach which may use related or comparable assets or liabilities, recent transactions, market multiples, book values, and other relevant information for the investment to determine the fair value of the investment. An income-based valuation approach may also be used in which the anticipated future cash flows of the investment are discounted to calculate fair value. Discounts may also be applied due to the nature or duration of any restrictions on the disposition of the investments. Due to the inherent uncertainty of valuations of such investments, the fair values may differ significantly from the values that would have been used had an active market existed. The VC employs various methods for calibrating these valuation approaches including a regular review of key inputs and assumptions, transactional back-testing or disposition analysis, and reviews of any related market activity.
Trading in securities on foreign securities stock exchanges and OTC markets may be completed before 4 p.m. Eastern time. In addition, trading in certain foreign markets may not take place on every Fund’s business day. Occasionally, events occur between the time at which trading in a foreign security is completed and 4 p.m. Eastern time that might call into question the reliability of the value of a portfolio security held by the Fund. As a result, differences may arise between the value of the Fund’s portfolio securities as determined at the foreign market close and the latest indications of value at 4 p.m. Eastern time. In order to minimize the potential for these differences, the VC monitors price movements following the close of trading in foreign stock markets through a series of country specific market proxies (such as baskets of American Depositary Receipts, futures contracts and exchange traded funds). These price movements are measured against established trigger thresholds for each specific market proxy to
| | | | |
| 22 | | Semiannual Report | | franklintempleton.com |
FRANKLIN GLOBAL TRUST
NOTES TO FINANCIAL STATEMENTS (UNAUDITED)
Franklin Global Real Estate Fund (continued)
assist in determining if an event has occurred that may call into question the reliability of the values of the foreign securities held by the Fund. If such an event occurs, the securities may be valued using fair value procedures, which may include the use of independent pricing services.
When the last day of the reporting period is a non-business day, certain foreign markets may be open on those days that the Fund’s NAV is not calculated, which could result in differences between the value of the Fund’s portfolio securities on the last business day and the last calendar day of the reporting period. Any significant security valuation changes due to an open foreign market are adjusted and reflected by the Fund for financial reporting purposes.
b. Foreign Currency Translation
Portfolio securities and other assets and liabilities denominated in foreign currencies are translated into U.S. dollars based on the exchange rate of such currencies against U.S. dollars on the date of valuation. The Fund may enter into foreign currency exchange contracts to facilitate transactions denominated in a foreign currency. Purchases and sales of securities, income and expense items denominated in foreign currencies are translated into U.S. dollars at the exchange rate in effect on the transaction date. Portfolio securities and assets and liabilities denominated in foreign currencies contain risks that those currencies will decline in value relative to the U.S. dollar. Occasionally, events may impact the availability or reliability of foreign exchange rates used to convert the U.S. dollar equivalent value. If such an event occurs, the foreign exchange rate will be valued at fair value using procedures established and approved by the Board.
The Fund does not separately report the effect of changes in foreign exchange rates from changes in market prices on securities held. Such changes are included in net realized and unrealized gain or loss from investments in the Statement of Operations.
Realized foreign exchange gains or losses arise from sales of foreign currencies, currency gains or losses realized between the trade and settlement dates on securities transactions and the difference between the recorded amounts of dividends, interest, and foreign withholding taxes and the U.S. dollar equivalent of the amounts actually received or paid. Net unrealized foreign exchange gains and losses arise from changes in foreign
exchange rates on foreign denominated assets and liabilities other than investments in securities held at the end of the reporting period.
c. Income and Deferred Taxes
It is the Fund’s policy to qualify as a regulated investment company under the Internal Revenue Code. The Fund intends to distribute to shareholders substantially all of its taxable income and net realized gains to relieve it from federal income and excise taxes. As a result, no provision for U.S. federal income taxes is required.
The Fund may be subject to foreign taxation related to income received, capital gains on the sale of securities and certain foreign currency transactions in the foreign jurisdictions in which it invests. Foreign taxes, if any, are recorded based on the tax regulations and rates that exist in the foreign markets in which the Fund invests. When a capital gain tax is determined to apply, the Fund records an estimated deferred tax liability in an amount that would be payable if the securities were disposed of on the valuation date.
As a result of several court cases, in certain countries across the European Union, the Fund filed additional tax reclaims for previously withheld taxes on dividends earned in those countries (EU reclaims). These additional filings are subject to various administrative proceedings by the local jurisdictions’ tax authorities within the European Union, as well as a number of related judicial proceedings. Income recognized, if any, for EU reclaims is reflected as other income in the Statement of Operations and any related receivable, if any, is reflected as European Union tax reclaims in the Statement of Assets and Liabilities. When uncertainty exists as to the ultimate resolution of these proceedings, the likelihood of receipt of these EU reclaims, and the potential timing of payment, no amounts are reflected in the financial statements. For U.S. income tax purposes, EU reclaims received by the Fund, if any, reduce the amounts of foreign taxes Fund shareholders can use as tax credits in their individual income tax returns.
The Fund may recognize an income tax liability related to its uncertain tax positions under U.S. GAAP when the uncertain tax position has a less than 50% probability that it will be sustained upon examination by the tax authorities based on its technical merits. As of January 31, 2018, the Fund has determined that no tax liability is required in its financial statements related to uncertain tax positions for any open tax
| | | | | | |
| franklintempleton.com | | Semiannual Report | | | 23 | |
FRANKLIN GLOBAL TRUST
NOTES TO FINANCIAL STATEMENTS (UNAUDITED)
Franklin Global Real Estate Fund (continued)
1. Organization and Significant Accounting Policies (continued)
c. Income and Deferred Taxes (continued)
years (or expected to be taken in future tax years). Open tax years are those that remain subject to examination and are based on the statute of limitations in each jurisdiction in which the Fund invests.
d. Security Transactions, Investment Income, Expenses and Distributions
Security transactions are accounted for on trade date. Realized gains and losses on security transactions are determined on a specific identification basis. Interest income and estimated expenses are accrued daily. Dividend income is recorded on the ex-dividend date except for certain dividends from securities where the dividend rate is not available. In such cases, the dividend is recorded as soon as the information is received by the Fund. Distributions to shareholders are recorded on the ex-dividend date. Distributable earnings are determined according to income tax regulations (tax basis) and may differ from earnings recorded in accordance with U.S. GAAP. These differences may be permanent or temporary. Permanent differences are reclassified among capital accounts to reflect their tax character. These reclassifications have no impact on net assets or the results of operations. Temporary differences are not reclassified, as they may reverse in subsequent periods.
Common expenses incurred by the Trust are allocated among the Funds based on the ratio of net assets of each Fund to the combined net assets of the Trust. Fund specific expenses are charged directly to the Fund that incurred the expense.
Realized and unrealized gains and losses and net investment income, excluding class specific expenses, are allocated daily to each class of shares based upon the relative proportion of net assets of each class. Differences in per share distributions by class are generally due to differences in class specific expenses.
Distributions received by the Fund from certain securities may be a return of capital (ROC). Such distributions reduce the cost basis of the securities, and any distributions in excess of the cost basis are recognized as capital gains. For Real Estate Investment Trust (REIT) securities, the Fund records ROC estimates, if any, on the ex-dividend date and are adjusted once actual tax designations are known.
e. Accounting Estimates
The preparation of financial statements in accordance with U.S. GAAP requires management to make estimates and assumptions that affect the reported amounts of assets and liabilities at the date of the financial statements and the amounts of income and expenses during the reporting period. Actual results could differ from those estimates.
f. Guarantees and Indemnifications
Under the Trust’s organizational documents, its officers and trustees are indemnified by the Trust against certain liabilities arising out of the performance of their duties to the Trust. Additionally, in the normal course of business, the Trust, on behalf of the Fund, enters into contracts with service providers that contain general indemnification clauses. The Trust’s maximum exposure under these arrangements is unknown as this would involve future claims that may be made against the Trust that have not yet occurred. Currently, the Trust expects the risk of loss to be remote.
| | | | |
| 24 | | Semiannual Report | | franklintempleton.com |
FRANKLIN GLOBAL TRUST
NOTES TO FINANCIAL STATEMENTS (UNAUDITED)
Franklin Global Real Estate Fund (continued)
2. Shares of Beneficial Interest
At January 31, 2018, there were an unlimited number of shares authorized (without par value). Transactions in the Fund’s shares were as follows:
| | | | | | | | | | | | | | | | |
| | | Six Months Ended
January 31, 2018 | | | Year Ended
July 31, 2017 | |
| | | Shares | | | Amount | | | Shares | | | Amount | |
| Class A Shares: | | | | | | | | | | | | | | | | |
Shares sold | | | 346,013 | | | $ | 3,162,133 | | | | 1,144,042 | | | $ | 10,099,188 | |
Shares issued in reinvestment of distributions | | | 22,114 | | | | 204,993 | | | | 343,522 | | | | 2,948,908 | |
Shares redeemed | | | (1,122,330 | ) | | | (10,276,809 | ) | | | (3,154,730 | ) | | | (27,524,749 | ) |
| | | | |
| | | | |
Net increase (decrease) | | | (754,203 | ) | | $ | (6,909,683 | ) | | | (1,667,166 | ) | | $ | (14,476,653 | ) |
| | | | |
| Class C Shares: | | | | | | | | | | | | | | | | |
Shares sold | | | 36,898 | | | $ | 332,907 | | | | 264,357 | | | $ | 2,316,608 | |
Shares issued in reinvestment of distributions | | | — | | | | — | | | | 53,268 | | | | 450,927 | |
Shares redeemed | | | (330,952 | ) | | | (2,987,204 | ) | | | (757,821 | ) | | | (6,570,368 | ) |
| | | | |
| | | | |
Net increase (decrease) | | | (294,054 | ) | | $ | (2,654,297 | ) | | | (440,196 | ) | | $ | (3,802,833 | ) |
| | | | |
| Class R6 Shares: | | | | | | | | | | | | | | | | |
Shares sold | | | 600 | | | $ | 5,557 | | | | 309 | | | $ | 2,697 | |
Shares issued in reinvestment of distributions | | | 16 | | | | 151 | | | | 69 | | | | 589 | |
| | | | |
| | | | |
Net increase (decrease) | | | 616 | | | $ | 5,708 | | | | 378 | | | $ | 3,286 | |
| | | | |
| Advisor Class Shares: | | | | | | | | | | | | | | | | |
Shares sold | | | 752,562 | | | $ | 6,916,934 | | | | 1,226,464 | | | $ | 10,987,526 | |
Shares issued in reinvestment of distributions | | | 14,005 | | | | 130,246 | | | | 85,507 | | | | 737,427 | |
Shares redeemed | | | (358,721 | ) | | | (3,303,094 | ) | | | (884,047 | ) | | | (7,739,734 | ) |
| | | | |
| | | | |
Net increase (decrease) | | | 407,846 | | | $ | 3,744,086 | | | | 427,924 | | | $ | 3,985,219 | |
| | | | |
3. Transactions with Affiliates
Franklin Resources, Inc. is the holding company for various subsidiaries that together are referred to as Franklin Templeton Investments. Certain officers and trustees of the Trust are also officers and/or directors of the following subsidiaries:
| | |
| Subsidiary | | Affiliation |
Franklin Templeton Institutional, LLC (FT Institutional) | | Investment manager |
Franklin Templeton Services, LLC (FT Services) | | Administrative manager |
Franklin Templeton Distributors, Inc. (Distributors) | | Principal underwriter |
Franklin Templeton Investor Services, LLC (Investor Services) | | Transfer agent |
| | | | | | |
| franklintempleton.com | | Semiannual Report | | | 25 | |
FRANKLIN GLOBAL TRUST
NOTES TO FINANCIAL STATEMENTS (UNAUDITED)
Franklin Global Real Estate Fund (continued)
3. Transactions with Affiliates (continued)
a. Management Fees
The Fund pays an investment management fee to FT Institutional based on the average daily net assets of each of the Fund as follows:
| | |
| Annualized Fee Rate | | Net Assets |
1.000% | | Up to and including $500 million |
0.900% | | Over $500 million, up to and including $1 billion |
0.850% | | Over $1 billion, up to and including $1.5 billion |
0.800% | | Over $1.5 billion, up to and including $6.5 billion |
0.780% | | Over $6.5 billion, up to and including $11.5 billion |
0.760% | | Over $11.5 billion, up to and including $16.5 billion |
0.740% | | Over $16.5 billion, up to and including $19 billion |
0.730% | | Over $19 billion, up to and including $21.5 billion |
0.720% | | In excess of $21.5 billion |
For the period ended January 31, 2018, the annualized gross effective investment management fee rate was 1.000% of the Fund’s average daily net assets.
b. Administrative Fees
Under an agreement with FT Institutional, FT Services provides administrative services to the Fund. The fee is paid by FT Institutional based on the Fund’s average daily net assets, and is not an additional expense of the Fund.
c. Distribution Fees
The Board has adopted distribution plans for each share class, with the exception of Class R6 and Advisor Class shares, pursuant to Rule 12b-1 under the 1940 Act. Under the Fund’s Class A reimbursement distribution plan, the Fund reimburses Distributors for costs incurred in connection with the servicing, sale and distribution of the Fund’s shares up to the maximum annual plan rate. Under the Class A reimbursement distribution plan, costs exceeding the maximum for the current plan year cannot be reimbursed in subsequent periods. In addition, under the Fund’s Class C compensation distribution plan, the Fund pays Distributors for costs incurred in connection with the servicing, sale and distribution of the Fund’s shares up to the maximum annual plan rate. The plan year, for purposes of monitoring compliance with the maximum annual plan rates, is February 1 through January 31.
The maximum annual plan rates, based on the average daily net assets, for each class, are as follows:
| | |
| Class A | | 0.35% |
| Class C | | 1.00% |
The Board has set the current rate at 0.25% per year for Class A shares until further notice and approval by the Board.
| | | | |
| 26 | | Semiannual Report | | franklintempleton.com |
FRANKLIN GLOBAL TRUST
NOTES TO FINANCIAL STATEMENTS (UNAUDITED)
Franklin Global Real Estate Fund (continued)
d. Sales Charges/Underwriting Agreements
Front-end sales charges and contingent deferred sales charges (CDSC) do not represent expenses of the Fund. These charges are deducted from the proceeds of sales of Fund shares prior to investment or from redemption proceeds prior to remittance, as applicable. Distributors has advised the Fund of the following commission transactions related to the sales and redemptions of the Fund’s shares for the period:
| | |
| Sales charges retained net of commissions paid to unaffiliated brokers/dealers | | $6,011 |
| CDSC retained | | $ 679 |
e. Transfer Agent Fees
Each class of shares pays transfer agent fees to Investor Services for its performance of shareholder servicing obligations. Effective November 1, 2017, the fees are based on an annualized asset based fee of 0.02% plus a transaction based fee. Prior to November 1, 2017, the fees were account based fees that varied based on fund or account type. In addition, each class reimburses Investor Services for out of pocket expenses incurred and, except for Class R6, reimburses shareholder servicing fees paid to third parties. These fees are allocated daily based upon their relative proportion of such classes’ aggregate net assets. Class R6 pays Investor Services transfer agent fees specific to that class.
For the period ended January 31, 2018, the Fund paid transfer agent fees of $186,238, of which $36,099 was retained by Investor Services.
f. Waiver and Expense Reimbursements
FT Institutional and Investor Services have contractually agreed in advance to waive or limit their fees and to assume as their own expense certain expenses otherwise payable by the Fund so that the expenses (excluding distribution fees, and acquired fund fees and expenses) for Class A, Class C and Advisor Class of the Fund do not exceed 1.15%, and Class R6 does not exceed 1.01% based on the average net assets of each class (other than certain non-routine expenses or costs, including those relating to litigation, indemnification, reorganizations, and liquidations) until November 30, 2018. Total expenses waived or paid are not subject to recapture subsequent to the Fund’s fiscal year end. Prior to December 1, 2017, expenses for Class R6 were limited to 0.98%.
4. Expense Offset Arrangement
The Fund has entered into an arrangement with its custodian whereby credits realized as a result of uninvested cash balances are used to reduce a portion of the Fund’s custodian expenses. During the period ended January 31, 2018, the custodian fees were reduced as noted in the Statement of Operations.
5. Income Taxes
For tax purposes, capital losses may be carried over to offset future capital gains. Capital loss carryforwards with no expiration, if any, must be fully utilized before those losses with expiration dates.
At July 31, 2017, capital loss carryforwards were as follows:
| | | | |
| Capital loss carryforwards expiring in: | | | | |
2018 | | | $35,647,494 | |
2019 | | | 557,818 | |
| | | | |
Total capital loss carryforwards | | | $36,205,312 | |
| | | | |
For tax purposes, the Fund may elect to defer any portion of a post-October capital loss to the first day of the following fiscal year. At July 31, 2017, the Fund deferred post-October capital losses of $810,621.
| | | | | | |
| franklintempleton.com | | Semiannual Report | | | 27 | |
FRANKLIN GLOBAL TRUST
NOTES TO FINANCIAL STATEMENTS (UNAUDITED)
Franklin Global Real Estate Fund (continued)
5. Income Taxes (continued)
At January 31, 2018, the cost of investments and net unrealized appreciation (depreciation) for income tax purposes were as follows:
| | | | |
Cost of investments | | | $111,725,079 | |
| | | | |
Unrealized appreciation | | | $ 43,824,908 | |
Unrealized depreciation | | | (9,105,503 | ) |
| | | | |
Net unrealized appreciation (depreciation) | | | $ 34,719,405 | |
| | | | |
Differences between income and/or capital gains as determined on a book basis and a tax basis are primarily due to differing treatment of passive foreign investment company shares.
6. Investment Transactions
Purchases and sales of investments (excluding short term securities) for the period ended January 31, 2018, aggregated $12,397,006 and $17,317,257, respectively.
7. Concentration of Risk
Investing in foreign securities may include certain risks and considerations not typically associated with investing in U.S. securities, such as fluctuating currency values and changing local and regional economic, political and social conditions, which may result in greater market volatility. In addition, certain foreign securities may not be as liquid as U.S. securities.
The Fund invests a large percentage of its total assets in REIT securities. Such concentration may subject the Fund to special risks associated with real estate securities. These securities may be more sensitive to economic or regulatory developments due to a variety of factors such as local, regional, national and global economic conditions, interest rates and tax considerations.
8. Upcoming Reorganization
On October 24, 2017, the Board for the Fund approved a proposal to reorganize the Fund with and into Franklin Real Estate Securities Fund, a series of Franklin Real Estate Securities Trust, subject to approval by the shareholders of the Fund.
9. Credit Facility
The Fund, together with other U.S. registered and foreign investment funds (collectively, Borrowers), managed by Franklin Templeton Investments, are borrowers in a joint syndicated senior unsecured credit facility totaling $2 billion (Global Credit Facility) which matured on February 9, 2018. This Global Credit Facility provides a source of funds to the Borrowers for temporary and emergency purposes, including the ability to meet future unanticipated or unusually large redemption requests. Effective February 9, 2018, the Borrowers renewed the Global Credit Facility for a one year term, maturing February 8, 2019, for a total of $2 billion.
Under the terms of the Global Credit Facility, the Fund shall, in addition to interest charged on any borrowings made by the Fund and other costs incurred by the Fund, pay its share of fees and expenses incurred in connection with the implementation and maintenance of the Global Credit Facility, based upon its relative share of the aggregate net assets of all of the Borrowers, including an annual commitment fee of 0.15% based upon the unused portion of the Global Credit Facility. These fees are reflected in other expenses in the Statement of Operations. During the period ended January 31, 2018, the Fund did not use the Global Credit Facility.
| | | | |
| 28 | | Semiannual Report | | franklintempleton.com |
FRANKLIN GLOBAL TRUST
NOTES TO FINANCIAL STATEMENTS (UNAUDITED)
Franklin Global Real Estate Fund (continued)
10. Fair Value Measurements
The Fund follows a fair value hierarchy that distinguishes between market data obtained from independent sources (observable inputs) and the Fund’s own market assumptions (unobservable inputs). These inputs are used in determining the value of the Fund’s financial instruments and are summarized in the following fair value hierarchy:
| | • | | Level 1 – quoted prices in active markets for identical financial instruments |
| | • | | Level 2 – other significant observable inputs (including quoted prices for similar financial instruments, interest rates, prepayment speed, credit risk, etc.) |
| | • | | Level 3 – significant unobservable inputs (including the Fund’s own assumptions in determining the fair value of financial instruments) |
The input levels are not necessarily an indication of the risk or liquidity associated with financial instruments at that level.
For movements between the levels within the fair value hierarchy, the Fund has adopted a policy of recognizing the transfers as of the date of the underlying event which caused the movement.
A summary of inputs used as of January 31, 2018, in valuing the Fund’s assets carried at fair value, is as follows:
| | | | | | | | | | | | | | | | |
| | | Level 1 | | | Level 2 | | | Level 3 | | | Total | |
| Assets: | | | | | | | | | | | | | | | | |
Investments in Securities:a | | | | | | | | | | | | | | | | |
Equity Investments | | $ | 145,944,484 | | | $ | — | | | $ | — | | | $ | 145,944,484 | |
Short Term Investments | | | — | | | | 500,000 | | | | — | | | | 500,000 | |
| | | | |
Total Investments in Securities | | $ | 145,944,484 | | | $ | 500,000 | | | $ | — | | | $ | 146,444,484 | |
| | | | |
aFor detailed categories, see the accompanying Statement of Investments.
11. Subsequent Events
The Fund has evaluated subsequent events through the issuance of the financial statements and determined that no events have occurred that require disclosure other than those already disclosed in the financial statements.
Abbreviations
|
Selected Portfolio |
| REIT Real Estate Investment Trust |
| | | | | | |
| franklintempleton.com | | Semiannual Report | | | 29 | |
FRANKLIN GLOBAL TRUST
FRANKLIN GLOBAL REAL ESTATE FUND
Special Meeting of Shareholders
MEETING OF SHAREHOLDERS: OCTOBER 30, 2017 AND RECONVENED ON DECEMBER 15, 2017 AND DECEMBER 29, 2017
(UNAUDITED)
A Special Meeting of Shareholders of Franklin Global Trust was held at the offices of Franklin Templeton Investments, One Franklin Parkway, San Mateo, California on October 30, 2017 and reconvened on December 15, 2017 and December 29, 2017. The purpose of the meeting was to elect Trustees of Franklin Global Trust and to vote on the following proposals: to approve the use of a “manager of managers” structure whereby the Fund’s investment manager would be able to hire and replace subadvisers without shareholder approval and to approve an amended fundamental investment restriction regarding investments in commodities for the Fund. At the meeting, (i) the following persons were elected by the shareholders to serve as Trustees of Franklin Global Trust: Harris J. Ashton, Terrence J. Checki, Mary C. Choksi, Edith E. Holiday, Gregory E. Johnson, Rupert H. Johnson, Jr., J. Michael Luttig, Larry D. Thompson, and John B. Wilson and (ii) the proposals to use a “manager of managers” structure and to approve the amended fundamental investment restriction regarding investments in commodities were approved by shareholders. No other business was transacted at the meeting.
In connection with the meeting, management is aware that some shareholders received from the proxy solicitor numerous calls and mailings that may have been distracting. Management is taking steps to ensure that, in the future, for any new shareholder meeting solicitations that occur, such activity is not repeated. Management apologizes for any inconvenience that may have been caused as a result of such calls and mailings.
The results of the voting at the meeting are as follows:
Proposal 1. To elect a Board of Trustees:
| | | | |
| Name | | For | | Withheld |
Harris J. Ashton | | 123,597,479 | | 3,571,398 |
Terrence J. Checki | | 123,690,572 | | 3,478,306 |
Mary C. Choksi | | 123,243,714 | | 3,925,163 |
Edith E. Holiday | | 121,178,523 | | 5,990,354 |
Gregory E. Johnson | | 123,694,217 | | 3,474,660 |
Rupert H. Johnson, Jr. | | 123,621,068 | | 3,547,808 |
J. Michael Luttig | | 123,705,401 | | 3,463,476 |
Larry D. Thompson | | 123,162,505 | | 4,006,372 |
John B. Wilson | | 123,573,690 | | 3,595,187 |
Total Trust Shares Outstanding*: 162,995,191
* As of the record date.
| | | | |
| 30 | | Semiannual Report | | franklintempleton.com |
FRANKLIN GLOBAL TRUST
FRANKLIN GLOBAL REAL ESTATE FUND
SPECIAL MEETING OF SHAREHOLDERS
| Proposal 2. | To approve the use of a “manager of managers” structure whereby the Fund’s investment manager would be able to hire and replace subadvisers without shareholder approval: |
| | | | |
| | | Shares | |
For | | | 8,186,921 | |
Against | | | 326,238 | |
Abstain | | | 229,748 | |
Broker Non-Votes | | | 2,902,805 | |
Total Fund Shares Voted | | | 11,645,708 | |
Total Fund Shares Outstanding* | | | 16,304,147 | |
| Proposal 3. | To approve an amended fundamental investment restriction regarding investments in commodities: |
| | | | |
| | | Shares | |
For | | | 8,213,293 | |
Against | | | 266,277 | |
Abstain | | | 263,333 | |
Broker Non-Votes | | | 2,902,805 | |
Total Fund Shares Voted | | | 11,645,708 | |
Total Fund Shares Outstanding* | | | 16,304,147 | |
| | | | | | |
| franklintempleton.com | | Semiannual Report | | | 31 | |
FRANKLIN GLOBAL TRUST
FRANKLIN GLOBAL REAL ESTATE FUND
Shareholder Information
Proxy Voting Policies and Procedures
The Fund’s investment manager has established Proxy Voting Policies and Procedures (Policies) that the Fund uses to determine how to vote proxies relating to portfolio securities. Shareholders may view the Fund’s complete Policies online at franklintempleton.com. Alternatively, shareholders may request copies of the Policies free of charge by calling the Proxy Group collect at (954) 527-7678 or by sending a written request to: Franklin Templeton Companies, LLC, 300 S.E. 2nd Street, Fort Lauderdale, FL 33301, Attention: Proxy Group. Copies of the Fund’s proxy voting records are also made available online at franklintempleton.com and posted on the US Securities and Exchange Commission’s website at sec.gov and reflect the most recent 12-month period ended June 30.
Quarterly Statement of Investments
The Trust, on behalf of the Fund, files a complete statement of investments with the U.S. Securities and Exchange Commission for the first and third quarters for each fiscal year on Form N-Q. Shareholders may view the filed Form N-Q by visiting the Commission’s website at sec.gov. The filed form may also be viewed and copied at the Commission’s Public Reference Room in Washington, DC. Information regarding the operations of the Public Reference Room may be obtained by calling (800) SEC-0330.
| | | | |
| 32 | | Semiannual Report | | franklintempleton.com |
| | |
 | | Semiannual Report and Shareholder Letter Franklin Global Real Estate Fund |
| | Investment Manager Franklin Templeton Institutional, LLC |
| | Distributor Franklin Templeton Distributors, Inc. (800) DIAL BEN® / 342-5236 franklintempleton.com |
| | Shareholder Services (800) 632-2301 |
Authorized for distribution only when accompanied or preceded by a summary prospectus and/or prospectus. Investors should carefully consider a fund’s investment goals, risks, charges and expenses before investing. A prospectus contains this and other information; please read it carefully before investing.
To help ensure we provide you with quality service, all calls to and from our service areas are monitored and/or recorded.
| | |
| © 2018 Franklin Templeton Investments. All rights reserved. | | 495 S 03/18 |
| | |

| | Semiannual Report and Shareholder Letter January 31, 2018 |
Franklin International Growth Fund
Franklin International Small Cap Growth Fund
Sign up for electronic delivery at franklintempleton.com/edelivery
Franklin Templeton Investments
Why choose Franklin Templeton Investments?
Successful investing begins with ambition. And achievement only comes when you reach for it. That’s why we continually strive to deliver better outcomes for investors. No matter what your goals are, our deep, global investment expertise allows us to offer solutions that can help.
During our more than 70 years of experience, we’ve managed through all kinds of markets—up, down and those in between. We’re always preparing for what may come next. It’s because of this, combined with our strength as one of the world’s largest asset managers that we’ve earned the trust of millions of investors around the world.
Dear Shareholder:
During the six months ended January 31, 2018, mostly upbeat global economic data, improved corporate earnings and supportive monetary policies benefited global securities markets. The European Central Bank (ECB) and the Bank of Japan (BOJ) kept their benchmark interest rates unchanged, while the US Federal Reserve (Fed) raised the target range for the federal funds rate 0.25% to 1.25%–1.50% at its December 2017 meeting amid signs of a growing US economy. The BOJ maintained its quantitative easing measures during the period, while the ECB began to reduce its bond purchases in January 2018. The Fed also began a gradual reduction in its balance sheet during the period as part of its ongoing plan to normalize US monetary policy. In this environment, stocks in global developed markets excluding the US and Canada generated strong returns for the six-month period, as measured by the MSCI Europe, Australasia and Far East Index.
We are committed to our long-term perspective and disciplined investment approach as we conduct a rigorous, fundamental analysis of securities with a regular emphasis on investment risk management.
We believe active, professional investment management serves investors well. We also recognize the important role of financial advisors in today’s markets and encourage investors to continue to seek their advice. Amid changing markets and economic conditions, we are confident investors with a well-diversified portfolio and a patient, long-term outlook should be well positioned for the years ahead.
Franklin Global Trust’s semiannual report includes more detail about prevailing conditions and discussions about investment decisions during the period. Please remember all securities markets fluctuate, as do mutual fund share prices.
We thank you for investing with Franklin Templeton, welcome your questions and comments, and look forward to serving your future investment needs.
Sincerely,

Edward B. Jamieson
President and Chief Executive Officer –
Investment Management
Franklin Global Trust
This letter reflects our analysis and opinions as of January 31, 2018, unless otherwise indicated. The information is not a complete analysis of every aspect of any market, country, industry, security or fund. Statements of fact are from sources considered reliable.
| | | | |
Not FDIC Insured | | | May Lose Value | | | No Bank Guarantee |
| | | | | | |
| franklintempleton.com | | Not part of the semiannual report | | | 1 | |
Contents
Semiannual Report
Visit franklintempleton.com for fund updates, to access your account, or to find helpful financial planning tools.
| | | | | | |
| | 2 | | | Semiannual Report | | franklintempleton.com |
Semiannual Report
Economic and Market Overview
The US economy continued to grow during the six months under review. The economy expanded in 2017’s fourth quarter, though at a slower pace compared to the third quarter, as lower inventory investment and higher imports partially offset the positive contributions of growth in consumer spending, business and housing investment, exports, and government spending. The manufacturing and services sectors expanded during the period. The unemployment rate decreased from 4.3% in July 2017 to 4.1% at period-end.1 Annual inflation, as measured by the Consumer Price Index, increased from 1.7% in July 2017 to 2.1% at period-end.1
The US Federal Reserve (Fed) kept its target range for the federal funds rate unchanged at its meetings in the August-November period and began reducing its balance sheet in October. At its December meeting, the Fed raised its target range for the federal funds rate 0.25% to 1.25%–1.50%, as widely anticipated by the market. The Fed also confirmed that the monthly balance sheet reduction would increase from $10 billion to $20 billion beginning in January 2018. At its January 2018 meeting, the Fed left its target rate for the federal funds rate unchanged, but expressed that it anticipated inflation to rise in 2018 and stabilize around the 2% target over the medium term. The broad US stock market, as measured by the Standard & Poor’s® 500 Index, advanced for the six-month period ended January 31, 2018.
The global economy generally expanded during the six-month period under review. In this environment, global developed and emerging market stocks generated a +14.52% total return, as measured by the MSCI All Country World Index.2 Global markets were aided by price gains in oil and other commodities, generally upbeat economic data across regions, the European Central Bank’s (ECB’s) extension of its monetary easing program, and encouraging corporate earnings reports. The passage of the US tax reform bill also supported global stocks.
However, global markets reflected investor concerns about geopolitical tensions in the Korean peninsula and other regions, expectations that key central bankers around the world may potentially raise interest rates amid an improving economic outlook and political uncertainties in the US and the European Union.
In Europe, the UK’s economic growth moderated in 2017’s fourth quarter over the previous quarter, due to slower growth in production output, household spending and business investment. In November, the Bank of England raised its key policy rate 0.25%, its first increase in a decade. The eurozone’s growth moderated in 2017’s fourth quarter over the previous quarter. The bloc’s annual inflation rate remained low and ended at the same level as in July 2017. The ECB kept its benchmark interest rate unchanged during the period. However, at its October meeting, the ECB extended the time frame for its massive bond-buying program from December 2017 to at least September 2018, while reducing the amount of monthly bond purchases in half beginning in January 2018.
In Asia, Japan’s quarterly gross domestic product (GDP) growth slowed in 2017’s fourth quarter compared to the third quarter, as a slowdown in business spending and contractions in private residential investment and government spending offset a recovery in private consumption. The Bank of Japan left its benchmark interest rate unchanged during the period and continued its monetary stimulus measures. China’s annual GDP grew at a stable rate in 2017’s fourth quarter compared to the prior-year period. The People’s Bank of China also left its benchmark interest rate unchanged during the period.
The foregoing information reflects our analysis and opinions as of January 31, 2018. The information is not a complete analysis of every aspect of any market, country, industry, security or fund. Statements of fact are from sources considered reliable.
1. Source: US Bureau of Labor Statistics.
2. Source: Morningstar.
See www.franklintempletondatasources.com for additional data provider information.
| | | | | | |
| franklintempleton.com | | Semiannual Report | | | 3 | |
Franklin International Growth Fund
We are pleased to bring you Franklin International Growth Fund’s semiannual report for the period ended January 31, 2018.
Your Fund’s Goal and Main Investments
The Fund seeks long-term capital appreciation by investing predominantly in equity securities of mid- and large-capitalization companies, generally those with market capitalizations greater than $2 billion, located outside of the US, including developing or emerging market countries. The Fund considers international companies to be those organized under the laws of a country outside of the US or having a principal office in a country outside of the US, or whose securities are listed or traded principally on a recognized stock exchange or over-the-counter market outside of the US.
Performance Overview
For the six months ended January 31, 2018, the Fund’s Class A shares delivered a +18.57% cumulative total return. In comparison, the Fund’s benchmark, the MSCI Europe, Australasia and Far East (EAFE) (Net Dividends) Index, returned +12.14%.1 The MSCI EAFE (Net Dividends) Index measures global developed stock market performance excluding the US and Canada, taking into account the impact of foreign withholding taxes. You can find the Fund’s long-term performance data in the Performance Summary beginning on page 8.
Performance data represent past performance, which does not guarantee future results. Investment return and principal value will fluctuate, and you may have a gain or loss when you sell your shares. Current performance may differ from figures shown. For most recent month-end performance, go to franklintempleton.com or call (800) 342-5236.
Investment Strategy
In choosing individual equity investments, we employ a disciplined, bottom-up approach to identify attractive investment opportunities that have higher expected revenue and earnings growth than their peers. We use a growth investment style and in-depth, fundamental research to identify high-quality companies, across all industry groups, with
Geographic Composition
Based on Total Net Assets as of 1/31/18
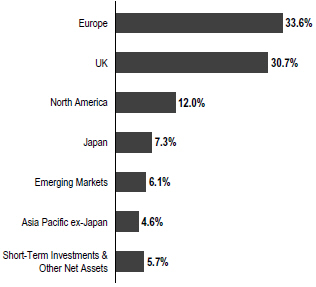
sustainable business models that offer the most attractive combination of growth potential, quality and valuation.
Manager’s Discussion
Stock selection and an overweighting in the information technology (IT) sector, as well as stock selection in industrials and materials, contributed to relative performance.2
IT contributors included UK-based Sophos Group, a cybersecurity services firm, and UK-based Just Eat, an online food ordering services provider. Sophos benefited from strong demand for security products driven by the rising threat from cyberattacks, while Just Eat contributed amid robust growth in its platform and recent regulatory approval for an acquisition. Argentina-based MercadoLibre, a pan-Latin American online marketplace operator, also contributed due to what we considered the company’s strong underlying fundamentals. We believe MercadoLibre remains well positioned in Latin America and has been making investments in building out its platform to include payments and shipping.
In industrials, Denmark-based logistics provider DSV supported relative returns. The company saw strong
1. Source: Morningstar.
The index is unmanaged and includes reinvestment of any income or distributions. It does not reflect any fees, expenses or sales charges. One cannot invest directly in an index, and an index is not representative of the Fund’s portfolio.
2. The information technology sector comprises internet software and services; IT services; semiconductors and semiconductor equipment; and software in the SOI. The industrials sector comprises aerospace and defense, machinery, professional services, road and rail, and trading companies and distributors in the SOI. The materials sector comprises chemicals in the SOI.
The dollar value, number of shares or principal amount, and names of all portfolio holdings are listed in the Fund’s Statement of Investments (SOI).
The SOI begins on page 22.
| | | | |
| 4 | | Semiannual Report | | franklintempleton.com |
FRANKLIN INTERNATIONAL GROWTH FUND
| | | | |
| Top 10 Sectors/Industries | | | |
| 1/31/18 | | | |
| | | % of Total
Net Assets | |
| Software | | | 12.0% | |
| Chemicals | | | 8.8% | |
| Capital Markets | | | 7.5% | |
| Internet Software & Services | | | 7.2% | |
| Pharmaceuticals | | | 6.3% | |
| Biotechnology | | | 5.5% | |
| Internet & Direct Marketing Retail | | | 5.3% | |
| Health Care Equipment & Supplies | | | 4.6% | |
| Diversified Consumer Services | | | 3.4% | |
| Banks | | | 3.1% | |
improvements in Europe and benefited from the integration of a recent acquisition. Weir Group, a UK-based engineering firm, also contributed due to a rebound in commodity prices that led to optimism about capital spending increases that resulted in greater demand for Weir’s mining and oil and gas equipment.
In materials, Koninklijke DSM, a Netherlands-based health and nutritional ingredients manufacturer, and Umicore, a Belgium-based clean technology materials company, also boosted relative returns. Koninklijke DSM has been seeing strong demand for its nutritional ingredients across most regions. Umicore has continued to benefit from strong demand for cathode materials used in electric vehicles. A rebound in metals prices and other commodities is, in our opinion, poised to help its metals recycling business over time.
Other key contributors included Dollarama, a Canada-based discount retailer, and TAL Education Group, a China-based tutoring services provider. Dollarama has been opening new stores and stocking higher ticket items, leading to faster growth. Meanwhile, we continued to believe TAL’s earnings momentum should likely remain strong, despite recent investments, given the Chinese education system’s heavy focus on testing and the company’s consistent approach to teaching.
Conversely, an overweighting in health care, as well as stock selection and an underweighting in energy detracted from relative performance.3
Health care holding Hikma Pharmaceuticals, a UK-listed generic drug and injectables manufacturer, hurt relative results amid concerns about its generic drug business and general
| | | | |
| Top 10 Holdings | | | |
| 1/31/18 | | | |
| |
Company Sector/Industry, Country | | % of Total
Net Assets | |
Sophos Group PLC Software, UK | | | 3.7% | |
TAL Education Group Diversified Consumer Services, China | | | 3.4% | |
Alkermes PLC Biotechnology, US | | | 3.3% | |
Azimut Holding SpA Capital Markets, Italy | | | 3.2% | |
KBC Groep NV Banks, Belgium | | | 3.1% | |
Ferguson PLC Trading Companies & Distributors, UK | | | 3.1% | |
Umicore SA Chemicals, Belgium | | | 3.1% | |
Symrise AG Chemicals, Germany | | | 3.0% | |
Weir Group PLC
Machinery, UK | | | 3.0% | |
DSV AS Road & Rail, Denmark | | | 3.0% | |
worries about the US pharmaceutical pricing environment. However, we believe the weakness has been exaggerated and see attractive opportunities in the company’s injectables business, which we believe is being overlooked. Other detractors in the sector included Alkermes, an Ireland-domiciled biopharmaceuticals manufacturer, and Roche Holding, a Switzerland-based drug maker.
Despite rebounding oil prices during the period, UK-based oilfield services firm John Wood Group hampered relative performance in the energy sector. The company completed its acquisition of UK rival Amec Foster Wheeler during the period and expects industry capital spending to remain challenging overall despite the rise in oil prices. Amec Foster Wheeler was a Fund contributor during the period.
Other key detractors included UK-based online fashion retailer boohoo.com, Italy-based wealth manager Azimut Holding and UK-based personal and household products company Reckitt Benckiser Group. Concerns about boohoo.com’s need to increase marketing spending to support a multi-brand strategy hurt the company’s share price. Despite Azimut Holdings share price weakness, the company has continued to attract new
3. The health care sector comprises biotechnology, health care equipment and supplies, and pharmaceuticals in the SOI. The energy sector comprises energy equipment and services in the SOI.
See www.franklintempletondatasources.com for additional data provider information.
| | | | | | |
| franklintempleton.com | | Semiannual Report | | | 5 | |
FRANKLIN INTERNATIONAL GROWTH FUND
assets as investors look for higher returns in a low interest-rate environment. Reckitt Benckiser has been experiencing softer growth in recent quarters due to slowing volumes and weaker pricing. However, we believe the company’s stable of strong brands could support growth over the longer term.
Regionally, stock selection in Europe and the UK, as well as an overweighting in emerging markets supported relative performance. Although stock selection in Japan contributed to relative results, this was more than offset by an underweighting in the country.
It is important to recognize the effect of currency movements on the Fund’s performance. In general, if the value of the US dollar goes up compared with a foreign currency, an investment traded in that foreign currency will go down in value because it will be worth fewer US dollars. This can have a negative effect on Fund performance. Conversely, when the US dollar weakens in relation to a foreign currency, an investment traded in that foreign currency will increase in value, which can contribute to Fund performance. For the six months ended January, 31, 2018, the US dollar declined in value relative to most currencies. As a result, the Fund’s performance was positively affected by the portfolio’s investment predominantly in securities with non-US currency exposure. However, one cannot expect the same result in future periods.
| | | | |
| Top 10 Countries | | | |
| 1/31/18 | | | |
| | | % of Total
Net Assets | |
| UK | | | 30.7% | |
| Germany | | | 12.9% | |
| Japan | | | 7.3% | |
| Canada | | | 6.4% | |
| Belgium | | | 6.2% | |
| US | | | 5.7% | |
| Denmark | | | 5.2% | |
| Australia | | | 4.6% | |
| Netherlands | | | 3.9% | |
| China | | | 3.4% | |
Thank you for your continued participation in Franklin International Growth Fund. We look forward to serving your future investment needs.
| | |

| | 
Donald G. Huber, CFA |
| |
 | | 
Coleen F. Barbeau, CFA |
| | M. Par Rostom, CFA Portfolio Management Team |
CFA® is a trademark owned by CFA Institute.
| | | | |
| 6 | | Semiannual Report | | franklintempleton.com |
FRANKLIN INTERNATIONAL GROWTH FUND
The foregoing information reflects our analysis, opinions and portfolio holdings as of January 31, 2018, the end of the reporting period. The way we implement our main investment strategies and the resulting portfolio holdings may change depending on factors such as market and economic conditions. These opinions may not be relied upon as investment advice or an offer for a particular security. The information is not a complete analysis of every aspect of any market, country, industry, security or the Fund. Statements of fact are from sources considered reliable, but the investment manager makes no representation or warranty as to their completeness or accuracy. Although historical performance is no guarantee of future results, these insights may help you understand our investment management philosophy.
| | | | | | |
| franklintempleton.com | | Semiannual Report | | | 7 | |
FRANKLIN INTERNATIONAL GROWTH FUND
Performance Summary as of January 31, 2018
The performance table does not reflect any taxes that a shareholder would pay on Fund dividends, capital gain distributions, if any, or any realized gains on the sale of Fund shares. Total return reflects reinvestment of the Fund’s dividends and capital gain distributions, if any, and any unrealized gains or losses. Your dividend income will vary depending on dividends or interest paid by securities in the Fund’s portfolio, adjusted for operating expenses of each class. Capital gain distributions are net profits realized from the sale of portfolio securities.
Performance as of 1/31/181
Cumulative total return excludes sales charges. Average annual total return includes maximum sales charges. Sales charges will vary depending on the size of the investment and the class of share purchased. The maximum is 5.75% and the minimum is 0%. Class A: 5.75% maximum initial sales charge; Advisor Class: no sales charges. For other share classes, visit franklintempleton.com.
| | | | | | | | |
| Share Class | | Cumulative
Total Return2 | | | Average Annual Total Return3 | |
| | |
| A | | | | | | | | |
6-Month | | | +18.57% | | | | +11.79% | |
1-Year | | | +40.67% | | | | +32.55% | |
5-Year | | | +53.85% | | | | +7.72% | |
Since Inception (6/3/08) | | | +66.22% | | | | +4.76% | |
| | |
| Advisor | | | | | | | | |
6-Month | | | +18.68% | | | | +18.68% | |
1-Year | | | +40.92% | | | | +40.92% | |
5-Year | | | +55.91% | | | | +9.29% | |
Since Inception (6/3/08) | | | +70.69% | | | | +5.69% | |
Performance data represent past performance, which does not guarantee future results. Investment return and principal value will fluctuate, and you may have a gain or loss when you sell your shares. Current performance may differ from figures shown. For most recent month-end performance, go to franklintempleton.com or call (800) 342-5236.
See page 9 for Performance Summary footnotes.
| | | | |
| 8 | | Semiannual Report | | franklintempleton.com |
FRANKLIN INTERNATIONAL GROWTH FUND
PERFORMANCE SUMMARY
Distributions (8/1/17–1/31/18)
| | | | | | | | | | | | |
| Share Class | | Net Investment
Income | | | Long-Term
Capital Gain | | | Total | |
A | | | $ — | | | | $0.1891 | | | | $0.1891 | |
C | | | $ — | | | | $0.1891 | | | | $0.1891 | |
R | | | $0.0233 | | | | $0.1891 | | | | $0.2124 | |
R6 | | | $0.0983 | | | | $0.1891 | | | | $0.2874 | |
Advisor | | | $0.0768 | | | | $0.1891 | | | | $0.2659 | |
Total Annual Operating Expenses4
| | | | | | | | |
| Share Class | | With Waiver | | | Without Waiver | |
A | | | 1.12% | | | | 1.48% | |
Advisor | | | 0.87% | | | | 1.23% | |
Each class of shares is available to certain eligible investors and has different annual fees and expenses, as described in the prospectus.
All investments involve risks, including possible loss of principal. Special risks are associated with foreign investing, including currency fluctuations, economic instability and political developments. Investments in emerging markets involve heightened risks related to the same factors, in addition to those associated with these markets’ smaller size and lesser liquidity. The Fund is actively managed but there is no guarantee that the manager’s investment decisions will produce the desired results. The Fund’s prospectus also includes a description of the main investment risks.
1. The Fund has an expense reduction and a fee waiver associated with any investments it makes in a Franklin Templeton money fund and/or other Franklin Templeton fund, contractually guaranteed through 11/30/19. Fund investment results reflect the expense reduction and fee waiver; without these reductions, the results would have been lower.
2. Cumulative total return represents the change in value of an investment over the periods indicated.
3. Average annual total return represents the average annual change in value of an investment over the periods indicated. Return for less than one year, if any, has not been annualized.
4. Figures are as stated in the Fund’s current prospectus and may differ from the expense ratios disclosed in the Your Fund’s Expenses and Financial Highlights sections in this report. In periods of market volatility, assets may decline significantly, causing total annual Fund operating expenses to become higher than the figures shown.
| | | | | | |
| franklintempleton.com | | Semiannual Report | | | 9 | |
FRANKLIN INTERNATIONAL GROWTH FUND
Your Fund’s Expenses
As a Fund shareholder, you can incur two types of costs: (1) transaction costs, including sales charges (loads) on Fund purchases and redemptions; and (2) ongoing Fund costs, including management fees, distribution and service (12b-1) fees, and other Fund expenses. All mutual funds have ongoing costs, sometimes referred to as operating expenses. The table below shows ongoing costs of investing in the Fund and can help you understand these costs and compare them with those of other mutual funds. The table assumes a $1,000 investment held for the six months indicated.
Actual Fund Expenses
The table below provides information about actual account values and actual expenses in the columns under the heading “Actual.” In these columns the Fund’s actual return, which includes the effect of Fund expenses, is used to calculate the “Ending Account Value” for each class of shares. You can estimate the expenses you paid during the period by following these steps (of course, your account value and expenses will differ from those in this illustration): Divide your account value by $1,000 (if your account had an $8,600 value, then $8,600 ÷ $1,000 = 8.6). Then multiply the result by the number in the row for your class of shares under the headings “Actual” and “Expenses Paid During Period” (if Actual Expenses Paid During Period were $7.50, then 8.6 x $7.50 = $64.50). In this illustration, the actual expenses paid this period are $64.50.
Hypothetical Example for Comparison with Other Funds
Under the heading “Hypothetical” in the table, information is provided about hypothetical account values and hypothetical expenses based on the Fund’s actual expense ratio and an assumed rate of return of 5% per year before expenses, which is not the Fund’s actual return. This information may not be used to estimate the actual ending account balance or expenses you paid for the period, but it can help you compare ongoing costs of investing in the Fund with those of other funds. To do so, compare this 5% hypothetical example for the class of shares you hold with the 5% hypothetical examples that appear in the shareholder reports of other funds.
Please note that expenses shown in the table are meant to highlight ongoing costs and do not reflect any transactional costs. Therefore, information under the heading “Hypothetical” is useful in comparing ongoing costs only, and will not help you compare total costs of owning different funds. In addition, if transactional costs were included, your total costs would have been higher.
| | | | | | | | | | | | | | | | | | |
| | | | | | | Actual | | | | Hypothetical | | | | |
| | | | | | | (actual return after expenses) | | | | (5% annual return before expenses) | | | | |
| | | | | | | | | Expenses | | | | | | Expenses | | | | Net |
| | | Beginning | | | | Ending | | Paid During | | | | Ending | | Paid During | | | | Annualized |
| Share | | Account | | | | Account | | Period | | | | Account | | Period | | | | Expense |
| Class | | Value 8/1/17 | | | | Value 1/31/18 | | 8/1/17–1/31/181,2 | | | | Value 1/31/18 | | 8/1/17–1/31/181,2 | | | | Ratio2 |
A | | $1,000 | | | | $1,185.70 | | $ 6.89 | | | | $1,018.90 | | $ 6.36 | | | | 1.25% |
C | | $1,000 | | | | $1,181.10 | | $11.00 | | | | $1,015.12 | | $10.16 | | | | 2.00% |
R | | $1,000 | | | | $1,183.40 | | $ 8.03 | | | | $1,017.85 | | $ 7.43 | | | | 1.46% |
R6 | | $1,000 | | | | $1,187.70 | | $ 4.41 | | | | $1,021.17 | | $ 4.08 | | | | 0.80% |
Advisor | | $1,000 | | | | $1,186.80 | | $ 5.51 | | | | $1,020.16 | | $ 5.09 | | | | 1.00% |
1. Expenses are equal to the annualized expense ratio for the six-month period as indicated above—in the far right column—multiplied by the simple average account value over the period indicated, and then multiplied by 184/365 to reflect the one-half year period.
2. Reflects expenses after fee waivers and expense reimbursements. Does not include acquired fund fees and expenses.
| | | | |
| 10 | | Semiannual Report | | franklintempleton.com |
Franklin International Small Cap Growth Fund
This semiannual report for Franklin International Small Cap Growth Fund covers the period ended January 31, 2018. Effective June 3, 2013, the Fund closed to new investors, with limited exceptions.
Your Fund’s Goal and Main Investments
The Fund seeks long-term capital appreciation by investing at least 80% of its net assets in a diversified portfolio of marketable equity and equity-related securities of smaller international companies with market capitalizations not exceeding $5 billion (or the equivalent in local currencies), or the highest market capitalization of the MSCI Europe, Australasia and Far East (EAFE) Small Cap Index, whichever is greater, at the time of purchase. The Fund considers international companies to be those organized under the laws of a country outside of the US or having a principal office in a country outside of the US, or whose securities are listed or traded principally on a recognized stock exchange or over-the-counter market outside of the US.
Performance Overview
For the six months ended January 31, 2018, the Fund’s Class A shares delivered a +12.75% cumulative total return. In comparison, the Fund’s benchmark, the MSCI Europe, Australasia and Far East (EAFE) Small Cap (Net Dividends) Index, returned +15.60%.1 The MSCI EAFE Small Cap (Net Dividends) Index tracks small cap equity performance in global developed markets excluding the US and Canada, taking into account the impact of foreign withholding taxes. You can find the Fund’s long-term performance data in the Performance Summary beginning on page 14.
Performance data represent past performance, which does not guarantee future results. Investment return and principal value will fluctuate, and you may have a gain or loss when you sell your shares. Current performance may differ from figures shown. For most recent month-end performance, go to franklintempleton.com or call (800) 342-5236.
Investment Strategy
In choosing individual equity investments, we use a fundamental, bottom-up approach involving in-depth analysis
Geographic Composition
Based on Total Net Assets as of 1/31/18
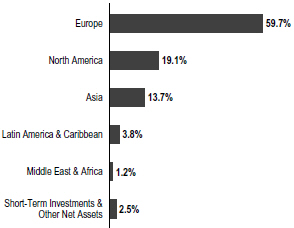
of individual equity securities. We employ a quantitative and qualitative approach to identify smaller international companies that we believe have the potential to generate attractive returns with lower downside risk. Such companies tend to have proprietary products and services, which can sustain a longer term competitive advantage, and they tend to have a higher probability of maintaining a strong balance sheet and/or generating cash flow. After we identify a company, we conduct a thorough analysis to establish its earnings prospects and determine its value. Overall, we seek to invest in companies with attractive valuations.
We do not select investments for the Fund that are merely representative of the small cap asset class but instead aim to produce a portfolio of securities of exceptional companies operating in sectors that offer attractive growth potential.
Although we seek to outperform the MSCI EAFE Small Cap (Net Dividends) Index, the Fund may take positions that are not represented in the index.
Manager’s Discussion
Stock selection in the information technology (IT) and consumer staples sectors contributed to relative performance.2
Within information technology, China-based IT company 58.com, an online classifieds company, boosted relative
1. Source: Morningstar.
The index is unmanaged and includes reinvestment of any income or distributions. It does not reflect any fees, expenses or sales charges. One cannot invest directly in an index, and an index is not representative of the Fund’s portfolio.
2. The information technology sector comprises internet software and services in the SOI. The consumer staples sector comprises food and staples retailing, food products and tobacco in the SOI.
The dollar value, number of shares or principal amount, and names of all portfolio holdings are listed in the Fund’s Statement of Investments (SOI).
The SOI begins on page 29.
| | | | | | |
| franklintempleton.com | | Semiannual Report | | | 11 | |
FRANKLIN INTERNATIONAL SMALL CAP GROWTH FUND
performance. The company saw strong growth in its jobs and real estate platforms. We believe that given its large user base and merchant network, along with its hard-to-replicate database of local information, 58.com could benefit from significant critical mass and substantial barriers to entry.
| | | | |
| Top 10 Sectors/Industries | | | |
| 1/31/18 | | | |
| | | % of Total
Net Assets | |
| Real Estate Management & Development | | | 11.6% | |
| Insurance | | | 8.2% | |
| Marine | | | 7.4% | |
| Commercial Services & Supplies | | | 6.3% | |
| Internet Software & Services | | | 6.1% | |
| Professional Services | | | 6.1% | |
| Capital Markets | | | 5.5% | |
| Energy Equipment & Services | | | 5.2% | |
| Trading Companies & Distributors | | | 5.2% | |
| Tobacco | | | 4.7% | |
In the consumer staples sector, Denmark-based cigar manufacturer Scandinavian Tobacco Group contributed to relative returns as it continued to bounce back from recent issues with its US distribution operations. We believe the company could continue to offset declining volumes with price increases, and it has continued to generate significant free cash flow.
Other key contributors included France-based Beneteau and UK-based Clarkson. Beneteau, a recreational boat and leisure home manufacturer, boosted relative performance following strong earnings results for its fiscal year as it is continuing to see strong interest in its boats and leisure homes. We believe Clarkson is well-positioned to benefit from an upturn in global shipping as the economic recovery continues.
Conversely, stock selection in the financials sector, as well as selection and an overweighting in the real estate sector detracted from relative performance.3
In the financials sector, Bermuda-domiciled reinsurers RenaissanceRe Holdings and Arch Capital Group curbed relative performance. In our view, a combination of concerns about the costs of an active hurricane season in North America,
| | | | |
| Top 10 Holdings | | | |
| 1/31/18 | | | |
| |
Company Sector/Industry, Country | | % of Total
Net Assets | |
58.com Inc. Internet Software & Services, China | | | 6.1% | |
Fairfax India Holdings Corp. Capital Markets, Canada | | | 5.5% | |
Clarkson PLC Marine, UK | | | 5.4% | |
Grafton Group PLC Trading Companies & Distributors, UK | | | 5.2% | |
Lar Espana Real Estate Socimi SA Real Estate Management & Development, Spain | | | 4.8% | |
PageGroup PLC Professional Services, UK | | | 4.7% | |
Scandinavian Tobacco Group AS Tobacco, Denmark | | | 4.7% | |
Green REIT PLC Equity Real Estate Investment Trusts (REITs), Ireland | | | 4.3% | |
John Wood Group PLC Energy Equipment & Services, UK | | | 4.0% | |
Liberty Latin America Ltd. Media, Chile | | | 3.8% | |
the impact of US tax reform and a potentially less dramatic rise in pricing pressured the stocks during the six-months under review.
Within real estate, Kennedy-Wilson Holdings, a US-based property investor with significant assets in Europe, curbed relative performance. Kennedy-Wilson could benefit from the ongoing real estate market recovery in Europe, in our analysis.
Other key detractors included UK-based floor covering retailer Carpetright and UK-domiciled cable company Liberty Latin America. Carpetright saw slowing sales as the housing market remained sluggish in the UK and increased competition had an adverse impact on sales trends. Liberty Latin America’s business, which is focused on Latin America and the Caribbean, was adversely impacted by the recent hurricanes in the Caribbean, with significant damage to its infrastructure in Puerto Rico.
Regionally, stock selection in Europe, as well as an overweighting in emerging markets supported relative performance. An off-benchmark exposure to North America hurt relative performance, as did stock selection in the UK.
3. The financials sector comprises capital markets and insurance in the SOI. The real estate sector comprises equity real estate investment trusts and real estate management and development in the SOI.
See www.franklintempletondatasources.com for additional data provider information.
| | | | |
| 12 | | Semiannual Report | | franklintempleton.com |
FRANKLIN INTERNATIONAL SMALL CAP GROWTH FUND
| | | | |
| Top 10 Countries | | | |
| 1/31/18 | | | |
| |
| | | % of Total
Net Assets | |
| UK | | | 25.2% | |
| US | | | 10.0% | |
| Canada | | | 9.1% | |
| Denmark | | | 8.3% | |
| Ireland | | | 7.3% | |
| Spain | | | 7.2% | |
| China | | | 6.1% | |
| Sweden | | | 4.4% | |
| Chile | | | 3.8% | |
| France | | | 3.8% | |
It is important to recognize the effect of currency movements on the Fund’s performance. In general, if the value of the US dollar goes up compared with a foreign currency, an investment traded in that foreign currency will go down in value because it will be worth fewer US dollars. This can have a negative effect on Fund performance. Conversely, when the US dollar weakens in relation to a foreign currency, an investment traded in that foreign currency will increase in value, which can contribute to Fund performance. For the six months ended January 31, 2018, the U.S. dollar declined in value relative to most currencies. As a result, the Fund’s performance was positively affected by the portfolio’s investment predominantly in securities with non-US currency exposure. However, one cannot expect the same result in future periods.
Thank you for your continued participation in Franklin International Small Cap Growth Fund. We look forward to serving your future investment needs.
| | |
 | | 
Edwin Lugo, CFA Portfolio Manager |
The foregoing information reflects our analysis, opinions and portfolio holdings as of January 31, 2018, the end of the reporting period. The way we implement our main investment strategies and the resulting portfolio holdings may change depending on factors such as market and economic conditions. These opinions may not be relied upon as investment advice or an offer for a particular security. The information is not a complete analysis of every aspect of any market, country, industry, security or the Fund. Statements of fact are from sources considered reliable, but the investment manager makes no representation or warranty as to their completeness or accuracy. Although historical performance is no guarantee of future results, these insights may help you understand our investment management philosophy.
| | | | | | |
| franklintempleton.com | | Semiannual Report | | | 13 | |
FRANKLIN INTERNATIONAL SMALL CAP GROWTH FUND
Performance Summary as of January 31, 2018
The performance table does not reflect any taxes that a shareholder would pay on Fund dividends, capital gain distributions, if any, or any realized gains on the sale of Fund shares. Total return reflects reinvestment of the Fund’s dividends and capital gain distributions, if any, and any unrealized gains or losses. Your dividend income will vary depending on dividends or interest paid by securities in the Fund’s portfolio, adjusted for operating expenses of each class. Capital gain distributions are net profits realized from the sale of portfolio securities.
Performance as of 1/31/18
Cumulative total return excludes sales charges. Average annual total return includes maximum sales charges. Sales charges will vary depending on the size of the investment and the class of share purchased. The maximum is 5.75% and the minimum is 0%. Class A: 5.75% maximum initial sales charge; Advisor Class: no sales charges. For other share classes, visit franklintempleton.com.
| | | | | | | | |
| Share Class | | Cumulative Total Return1 | | | Average Annual
Total Return2 | |
| | |
| A | | | | | | | | |
6-Month | | | +12.75% | | | | +6.27% | |
1-Year | | | +36.29% | | | | +28.45% | |
5-Year | | | +68.91% | | | | +9.75% | |
Since Inception (5/15/08) | | | +127.48% | | | | +8.17% | |
| | |
| Advisor | | | | | | | | |
6-Month | | | +12.83% | | | | +12.83% | |
1-Year | | | +36.54% | | | | +36.54% | |
5-Year | | | +70.94% | | | | +11.32% | |
10-Year | | | +149.30% | | | | +9.57% | |
Performance data represent past performance, which does not guarantee future results. Investment return and principal value will fluctuate, and you may have a gain or loss when you sell your shares. Current performance may differ from figures shown. For most recent month-end performance, go to franklintempleton.com or call (800) 342-5236.
See page 15 for Performance Summary footnotes.
| | | | |
| 14 | | Semiannual Report | | franklintempleton.com |
FRANKLIN INTERNATIONAL SMALL CAP GROWTH FUND
PERFORMANCE SUMMARY
Distributions (8/1/17–1/31/18)
| | | | | | | | | | | | | | | | |
| Share Class | | Net Investment
Income | | | Short-Term
Capital Gain | | | Long-Term
Capital Gain | | | Total | |
A | | | $1.2315 | | | | $0.1116 | | | | $0.4682 | | | | $1.8113 | |
C | | | $1.0709 | | | | $0.1116 | | | | $0.4682 | | | | $1.6507 | |
R | | | $1.1753 | | | | $0.1116 | | | | $0.4682 | | | | $1.7551 | |
R6 | | | $1.3071 | | | | $0.1116 | | | | $0.4682 | | | | $1.8869 | |
Advisor | | | $1.2814 | | | | $0.1116 | | | | $0.4682 | | | | $1.8612 | |
Total Annual Operating Expenses3
| | | | |
| Share Class | | | |
A | | | 1.38% | |
Advisor | | | 1.14% | |
Each class of shares is available to certain eligible investors and has different annual fees and expenses, as described in the prospectus.
All investments involve risks, including possible loss of principal. The Fund is intended for long-term investors who are comfortable with fluctuation in the value of their investment, especially over the short term. Smaller, relatively new and/or unseasoned companies can be particularly sensitive to changing economic conditions, and their prospects for growth are less certain than those of larger, more established companies. Foreign investing involves additional risks such as currency and market volatility, as well as political and social instability. Investments in emerging markets involve heightened risks relating to the same factors. The Fund is actively managed but there is no guarantee that the manager’s investment decisions will produce the desired results. The Fund’s prospectus also includes a description of the main investment risks.
1. Cumulative total return represents the change in value of an investment over the periods indicated.
2. Average annual total return represents the average annual change in value of an investment over the periods indicated. Return for less than one year, if any, has not been annualized.
3. Figures are as stated in the Fund’s current prospectus and may differ from the expense ratios disclosed in the Your Fund’s Expenses and Financial Highlights sections in this report. In periods of market volatility, assets may decline significantly, causing total annual Fund operating expenses to become higher than the figures shown.
| | | | | | |
| franklintempleton.com | | Semiannual Report | | | 15 | |
FRANKLIN INTERNATIONAL SMALL CAP GROWTH FUND
Your Fund’s Expenses
As a Fund shareholder, you can incur two types of costs: (1) transaction costs, including sales charges (loads) on Fund purchases and redemptions; and (2) ongoing Fund costs, including management fees, distribution and service (12b-1) fees, and other Fund expenses. All mutual funds have ongoing costs, sometimes referred to as operating expenses. The table below shows ongoing costs of investing in the Fund and can help you understand these costs and compare them with those of other mutual funds. The table assumes a $1,000 investment held for the six months indicated.
Actual Fund Expenses
The table below provides information about actual account values and actual expenses in the columns under the heading “Actual.” In these columns the Fund’s actual return, which includes the effect of Fund expenses, is used to calculate the “Ending Account Value” for each class of shares. You can estimate the expenses you paid during the period by following these steps (of course, your account value and expenses will differ from those in this illustration): Divide your account value by $1,000 (if your account had an $8,600 value, then $8,600 ÷ $1,000 = 8.6). Then multiply the result by the number in the row for your class of shares under the headings “Actual” and “Expenses Paid During Period” (if Actual Expenses Paid During Period were $7.50, then 8.6 x $7.50 = $64.50). In this illustration, the actual expenses paid this period are $64.50.
Hypothetical Example for Comparison with Other Funds
Under the heading “Hypothetical” in the table, information is provided about hypothetical account values and hypothetical expenses based on the Fund’s actual expense ratio and an assumed rate of return of 5% per year before expenses, which is not the Fund’s actual return. This information may not be used to estimate the actual ending account balance or expenses you paid for the period, but it can help you compare ongoing costs of investing in the Fund with those of other funds. To do so, compare this 5% hypothetical example for the class of shares you hold with the 5% hypothetical examples that appear in the shareholder reports of other funds.
Please note that expenses shown in the table are meant to highlight ongoing costs and do not reflect any transactional costs. Therefore, information under the heading “Hypothetical” is useful in comparing ongoing costs only, and will not help you compare total costs of owning different funds. In addition, if transactional costs were included, your total costs would have been higher.
| | | | | | | | | | | | |
| | | | | Actual
(actual return after expenses) | | Hypothetical
(5% annual return before expenses) | | |
Share Class | | Beginning Account Value 8/1/17 | | Ending Account Value 1/31/18 | | Expenses Paid During Period 8/1/17–1/31/181 | | Ending Account Value 1/31/18 | | Expenses Paid During Period 8/1/17–1/31/181 | | Annualized Expense Ratio |
| | | | | | |
| A | | $1,000 | | $1,127.50 | | $ 7.24 | | $1,018.40 | | $ 6.87 | | 1.35% |
| C | | $1,000 | | $1,122.40 | | $11.29 | | $1,014.57 | | $10.71 | | 2.11% |
| R | | $1,000 | | $1,125.10 | | $ 8.62 | | $1,017.09 | | $ 8.19 | | 1.61% |
| R6 | | $1,000 | | $1,129.20 | | $ 5.31 | | $1,020.21 | | $ 5.04 | | 0.99% |
| Advisor | | $1,000 | | $1,128.30 | | $ 5.95 | | $1,019.61 | | $ 5.65 | | 1.11% |
1. Expenses are equal to the annualized expense ratio for the six-month period as indicated above—in the far right column—multiplied by the simple average account value over the period indicated, and then multiplied by 184/365 to reflect the one-half year period.
| | | | |
| 16 | | Semiannual Report | | franklintempleton.com |
FRANKLIN GLOBAL TRUST
Financial Highlights
Franklin International Growth Fund
| | | | | | | | | | | | | | | | | | | | | | | | |
| | | Six Months Ended
January 31, 2018 | | | Year Ended July 31, | |
| | | (unaudited) | | | 2017 | | | 2016 | | | 2015 | | | 2014 | | | 2013 | |
| |
| | | | | | |
| Class A | | | | | | | | | | | | | | | | | | | | | | | | |
| | | | | | |
Per share operating performance
(for a share outstanding throughout the period) | | | | | | | | | | | | | | | | | | | | | | | | |
| | | | | | |
| Net asset value, beginning of period | | | $13.18 | | | | $11.07 | | | | $11.16 | | | | $11.40 | | | | $10.45 | | | | $9.11 | |
| | | | |
| | | | | | |
| Income from investment operationsa: | | | | | | | | | | | | | | | | | | | | | | | | |
| | | | | | |
Net investment income (loss)b | | | (0.02 | ) | | | 0.05 | | | | 0.03 | | | | 0.06 | | | | 0.05 | | | | 0.10 | |
| | | | | | |
Net realized and unrealized gains (losses) | | | 2.45 | | | | 2.12 | | | | (0.12 | ) | | | (0.20 | ) | | | 0.95 | | | | 1.33 | |
| | | | |
| | | | | | |
Total from investment operations | | | 2.43 | | | | 2.17 | | | | (0.09 | ) | | | (0.14 | ) | | | 1.00 | | | | 1.43 | |
| | | | |
| | | | | | |
| Less distributions from: | | | | | | | | | | | | | | | | | | | | | | | | |
| | | | | | |
Net investment income | | | — | | | | (0.06 | ) | | | (— | )c | | | (0.03 | ) | | | (0.05 | ) | | | (0.09 | ) |
| | | | | | |
Net realized gains | | | (0.19 | ) | | | — | | | | — | | | | (0.07 | ) | | | — | | | | — | |
| | | | |
| | | | | | |
Total distributions | | | (0.19 | ) | | | (0.06 | ) | | | (— | )c | | | (0.10 | ) | | | (0.05 | ) | | | (0.09 | ) |
| | | | |
| | | | | | |
Net asset value, end of period | | | $15.42 | | | | $13.18 | | | | $11.07 | | | | $11.16 | | | | $11.40 | | | | $10.45 | |
| | | | |
| | | | | | |
Total returnd | | | 18.57% | | | | 19.70% | | | | (0.80)% | | | | (1.13)% | | | | 9.56% | | | | 15.69% | |
| | | | | | |
| Ratios to average net assetse | | | | | | | | | | | | | | | | | | | | | | | | |
| | | | | | |
Expenses before waiver and payments by affiliates | | | 1.44% | | | | 1.54% | | | | 1.65% | | | | 1.72% | | | | 1.70% | | | | 1.52% | |
| | | | | | |
Expenses net of waiver and payments by affiliates | | | 1.25%f | | | | 1.31%f | | | | 1.44%f | | | | 1.49% | | | | 1.49%f | | | | 1.49% | |
| | | | | | |
Net investment income (loss) | | | (0.41)% | | | | 0.37% | | | | 0.25% | | | | 0.61% | | | | 0.48% | | | | 1.07% | |
| | | | | | |
| Supplemental data | | | | | | | | | | | | | | | | | | | | | | | | |
| | | | | | |
Net assets, end of period (000’s) | | | $102,357 | | | | $185,680 | | | | $169,994 | | | | $182,825 | | | | $179,862 | | | | $34,466 | |
| | | | | | |
Portfolio turnover rate | | | 25.19% | | | | 28.66% | | | | 27.27% | | | | 47.52% | | | | 29.63% | | | | 26.06% | |
aThe amount shown for a share outstanding throughout the period may not correlate with the Statement of Operations for the period due to the timing of sales and repurchases of the Fund’s shares in relation to income earned and/or fluctuating fair value of the investments of the Fund.
bBased on average daily shares outstanding.
cAmount rounds to less than $0.01 per share.
dTotal return does not reflect sales commissions or contingent deferred sales charges, if applicable, and is not annualized for periods less than one year.
eRatios are annualized for periods less than one year, except for non-recurring expenses, if any.
fBenefit of expense reduction rounds to less than 0.01%.
| | | | | | |
| franklintempleton.com | | The accompanying notes are an integral part of these financial statements. | Semiannual Report | | | 17 | |
FRANKLIN GLOBAL TRUST
FINANCIAL HIGHLIGHTS
Franklin International Growth Fund (continued)
| | | | | | | | | | | | | | | | | | | | | | | | |
| | | Six Months Ended
January 31, 2018 | | | Year Ended July 31, | |
| | | (unaudited) | | | 2017 | | | 2016 | | | 2015 | | | 2014 | | | 2013 | |
| |
| | | | | | |
| Class C | | | | | | | | | | | | | | | | | | | | | | | | |
| | | | | | |
Per share operating performance (for a share outstanding throughout the period) | | | | | | | | | | | | | | | | | | | | | | | | |
| | | | | | |
| Net asset value, beginning of period | | | $12.80 | | | | $10.77 | | | | $10.94 | | | | $11.22 | | | | $10.31 | | | | $9.00 | |
| | | | |
| | | | | | |
| Income from investment operationsa: | | | | | | | | | | | | | | | | | | | | | | | | |
| | | | | | |
Net investment income (loss)b | | | (0.09 | ) | | | (0.04 | ) | | | (0.05 | ) | | | (0.01 | ) | | | (0.02 | ) | | | 0.02 | |
| | | | | | |
Net realized and unrealized gains (losses) | | | 2.39 | | | | 2.07 | | | | (0.12 | ) | | | (0.20 | ) | | | 0.93 | | | | 1.32 | |
| | | | |
| | | | | | |
Total from investment operations | | | 2.30 | | | | 2.03 | | | | (0.17 | ) | | | (0.21 | ) | | | 0.91 | | | | 1.34 | |
| | | | |
| | | | | | |
| Less distributions from: | | | | | | | | | | | | | | | | | | | | | | | | |
| | | | | | |
Net investment income | | | — | | | | — | | | | — | | | | — | | | | — | | | | (0.03 | ) |
| | | | | | |
Net realized gains | | | (0.19 | ) | | | — | | | | — | | | | (0.07 | ) | | | — | | | | — | |
| | | | |
| | | | | | |
Total distributions | | | (0.19 | ) | | | — | | | | — | | | | (0.07 | ) | | | — | | | | (0.03 | ) |
| | | | |
| | | | | | |
Net asset value, end of period | | | $14.91 | | | | $12.80 | | | | $10.77 | | | | $10.94 | | | | $11.22 | | | | $10.31 | |
| | | | |
| | | | | | |
Total returnc | | | 18.11% | | | | 18.85% | | | | (1.55)% | | | | (1.84)% | | | | 8.83% | | | | 14.88% | |
| | | | | | |
| Ratios to average net assetsd | | | | | | | | | | | | | | | | | | | | | | | | |
| | | | | | |
Expenses before waiver and payments by affiliates | | | 2.19% | | | | 2.29% | | | | 2.40% | | | | 2.42% | | | | 2.40% | | | | 2.22% | |
| | | | | | |
Expenses net of waiver and payments by affiliates | | | 2.00%e | | | | 2.06%e | | | | 2.19%e | | | | 2.19% | | | | 2.19%e | | | | 2.19% | |
| | | | | | |
Net investment income (loss) | | | (1.16)% | | | | (0.38)% | | | | (0.50)% | | | | (0.09)% | | | | (0.22)% | | | | 0.37% | |
| | | | | | |
| Supplemental data | | | | | | | | | | | | | | | | | | | | | | | | |
| | | | | | |
Net assets, end of period (000’s) | | | $14,684 | | | | $8,702 | | | | $6,773 | | | | $7,179 | | | | $5,977 | | | | $4,032 | |
| | | | | | |
Portfolio turnover rate | | | 25.19% | | | | 28.66% | | | | 27.27% | | | | 47.52% | | | | 29.63% | | | | 26.06% | |
aThe amount shown for a share outstanding throughout the period may not correlate with the Statement of Operations for the period due to the timing of sales and repurchases of the Fund’s shares in relation to income earned and/or fluctuating fair value of the investments of the Fund.
bBased on average daily shares outstanding.
cTotal return does not reflect sales commissions or contingent deferred sales charges, if applicable, and is not annualized for periods less than one year.
dRatios are annualized for periods less than one year, except for non-recurring expenses, if any.
eBenefit of expense reduction rounds to less than 0.01%.
| | | | |
| 18 | | Semiannual Report | The accompanying notes are an integral part of these financial statements. | | franklintempleton.com |
FRANKLIN GLOBAL TRUST
FINANCIAL HIGHLIGHTS
Franklin International Growth Fund (continued)
| | | | | | | | | | | | | | | | | | | | | | | | |
| | | Six Months Ended
January 31, 2018 | | | Year Ended July 31, | |
| | | (unaudited) | | | 2017 | | | 2016 | | | 2015 | | | 2014 | | | 2013 | |
| |
| | | | | | |
| Class R | | | | | | | | | | | | | | | | | | | | | | | | |
| | | | | | |
Per share operating performance (for a share outstanding throughout the period) | | | | | | | | | | | | | | | | | | | | | | | | |
| | | | | | |
| Net asset value, beginning of period | | | $13.16 | | | | $11.02 | | | | $11.15 | | | | $11.38 | | | | $10.41 | | | | $9.08 | |
| | | | |
| | | | | | |
| Income from investment operationsa: | | | | | | | | | | | | | | | | | | | | | | | | |
| | | | | | |
Net investment income (loss)b | | | (0.05 | ) | | | 0.02 | | | | (— | )c | | | 0.04 | | | | 0.03 | | | | 0.07 | |
| | | | | | |
Net realized and unrealized gains (losses) | | | 2.44 | | | | 2.13 | | | | (0.12 | ) | | | (0.19 | ) | | | 0.95 | | | | 1.33 | |
| | | | |
| | | | | | |
Total from investment operations | | | 2.39 | | | | 2.15 | | | | (0.12 | ) | | | (0.15 | ) | | | 0.98 | | | | 1.40 | |
| | | | |
| | | | | | |
| Less distributions from: | | | | | | | | | | | | | | | | | | | | | | | | |
| | | | | | |
Net investment income | | | (0.02 | ) | | | (0.01 | ) | | | (0.01 | ) | | | (0.01 | ) | | | (0.01 | ) | | | (0.07 | ) |
| | | | | | |
Net realized gains | | | (0.19 | ) | | | — | | | | — | | | | (0.07 | ) | | | — | | | | — | |
| | | | |
| | | | | | |
Total distributions | | | (0.21 | ) | | | (0.01 | ) | | | (0.01 | ) | | | (0.08 | ) | | | (0.01 | ) | | | (0.07 | ) |
| | | | |
| | | | | | |
Net asset value, end of period | | | $15.34 | | | | $13.16 | | | | $11.02 | | | | $11.15 | | | | $11.38 | | | | $10.41 | |
| | | | |
| | | | | | |
Total returnd | | | 18.34% | | | | 19.54% | | | | (1.10)% | | | | (1.31)% | | | | 9.44% | | | | 15.47% | |
| | | | | | |
| Ratios to average net assetse | | | | | | | | | | | | | | | | | | | | | | | | |
| | | | | | |
Expenses before waiver and payments by affiliates | | | 1.65% | | | | 1.76% | | | | 1.90% | | | | 1.92% | | | | 1.90% | | | | 1.72% | |
| | | | | | |
Expenses net of waiver and payments by affiliates | | | 1.46%f | | | | 1.53%f | | | | 1.69%f | | | | 1.69% | | | | 1.69%f | | | | 1.69% | |
| | | | | | |
Net investment income (loss) | | | (0.62)% | | | | 0.15% | | | | (—)%g | | | | 0.41% | | | | 0.28% | | | | 0.87% | |
| | | | | | |
| Supplemental data | | | | | | | | | | | | | | | | | | | | | | | | |
| | | | | | |
Net assets, end of period (000’s) | | | $553 | | | | $371 | | | | $295 | | | | $363 | | | | $222 | | | | $274 | |
| | | | | | |
Portfolio turnover rate | | | 25.19% | | | | 28.66% | | | | 27.27% | | | | 47.52% | | | | 29.63% | | | | 26.06% | |
aThe amount shown for a share outstanding throughout the period may not correlate with the Statement of Operations for the period due to the timing of sales and repurchases of the Fund’s shares in relation to income earned and/or fluctuating fair value of the investments of the Fund.
bBased on average daily shares outstanding.
cAmount rounds to less than $0.01 per share.
dTotal return is not annualized for periods less than one year.
eRatios are annualized for periods less than one year, except for non-recurring expenses, if any.
f Benefit of expense reduction rounds to less than 0.01%.
g Rounds to less than 0.01%.
| | | | | | |
| franklintempleton.com | | The accompanying notes are an integral part of these financial statements. | Semiannual Report | | | 19 | |
FRANKLIN GLOBAL TRUST
FINANCIAL HIGHLIGHTS
Franklin International Growth Fund (continued)
| | | | | | | | | | | | | | | | | | | | | | | | |
| | | Six Months Ended
January 31, 2018 | | | Year Ended July 31, | |
| | | (unaudited) | | | 2017 | | | 2016 | | | 2015 | | | 2014 | | | 2013a | |
| |
| | | | | | |
| Class R6 | | | | | | | | | | | | | | | | | | | | | | | | |
| | | | | | |
Per share operating performance (for a share outstanding throughout the period) | | | | | | | | | | | | | | | | | | | | | | | | |
| | | | | | |
| Net asset value, beginning of period | | | $13.25 | | | | $11.15 | | | | $11.25 | | | | $11.48 | | | | $10.48 | | | | $10.56 | |
| | | | |
| | | | | | |
| Income from investment operationsb: | | | | | | | | | | | | | | | | | | | | | | | | |
| | | | | | |
Net investment income (loss)c | | | (— | )d | | | 0.08 | | | | 0.07 | | | | 0.15 | | | | 0.11 | | | | 0.07 | |
| | | | | | |
Net realized and unrealized gains (losses) | | | 2.47 | | | | 2.15 | | | | (0.12 | ) | | | (0.23 | ) | | | 0.94 | | | | (0.15 | ) |
| | | | |
| | | | | | |
Total from investment operations | | | 2.47 | | | | 2.23 | | | | (0.05 | ) | | | (0.08 | ) | | | 1.05 | | | | (0.08 | ) |
| | | | |
| | | | | | |
| Less distributions from: | | | | | | | | | | | | | | | | | | | | | | | | |
| | | | | | |
Net investment income | | | (0.10 | ) | | | (0.13 | ) | | | (0.05 | ) | | | (0.08 | ) | | | (0.05 | ) | | | — | |
| | | | | | |
Net realized gains | | | (0.19 | ) | | | — | | | | — | | | | (0.07 | ) | | | — | | | | — | |
| | | | |
| | | | | | |
Total distributions | | | (0.29 | ) | | | (0.13 | ) | | | (0.05 | ) | | | (0.15 | ) | | | (0.05 | ) | | | — | |
| | | | |
| | | | | | |
Net asset value, end of period | | | $15.43 | | | | $13.25 | | | | $11.15 | | | | $11.25 | | | | $11.48 | | | | $10.48 | |
| | | | |
| | | | | | |
Total returne | | | 18.77% | | | | 20.26% | | | | (0.39)% | | | | (0.62)% | | | | 10.05% | | | | (0.76)% | |
| | | | | | |
| Ratios to average net assetsf | | | | | | | | | | | | | | | | | | | | | | | | |
| | | | | | |
Expenses before waiver and payments by affiliates | | | 0.84% | | | | 0.90% | | | | 1.01% | | | | 1.02% | | | | 1.02% | | | | 1.13% | |
| | | | | | |
Expenses net of waiver and payments by affiliates | | | 0.80%g | | | | 0.88%g | | | | 1.00%g | | | | 1.02%h | | | | 1.02% | g,h | | | 1.10% | |
| | | | | | |
Net investment income | | | 0.04% | | | | 0.80% | | | | 0.69% | | | | 1.08% | | | | 0.95% | | | | 1.45% | |
| | | | | | |
| Supplemental data | | | | | | | | | | | | | | | | | | | | | | | | |
| | | | | | |
Net assets, end of period (000’s) | | | $65,646 | | | | $54,347 | | | | $122,862 | | | | $137,950 | | | | $29,132 | | | | $22,296 | |
| | | | | | |
Portfolio turnover rate | | | 25.19% | | | | 28.66% | | | | 27.27% | | | | 47.52% | | | | 29.63% | | | | 26.06% | |
aFor the period May 1, 2013 (effective date) to July 31, 2013.
bThe amount shown for a share outstanding throughout the period may not correlate with the Statement of Operations for the period due to the timing of sales and repurchases of the Fund’s shares in relation to income earned and/or fluctuating fair value of the investments of the Fund.
cBased on average daily shares outstanding.
dAmount rounds to less than $0.01 per share.
eTotal return is not annualized for periods less than one year.
fRatios are annualized for periods less than one year, except for non-recurring expenses, if any.
gBenefit of expense reduction rounds to less than 0.01%.
hBenefit of waiver and payments by affiliates rounds to less than 0.01%.
| | | | |
| 20 | | Semiannual Report | The accompanying notes are an integral part of these financial statements. | | franklintempleton.com |
FRANKLIN GLOBAL TRUST
FINANCIAL HIGHLIGHTS
Franklin International Growth Fund (continued)
| | | | | | | | | | | | | | | | | | | | | | | | |
| | | Six Months Ended
January 31, 2018 | | | Year Ended July 31, | |
| | | (unaudited) | | | 2017 | | | 2016 | | | 2015 | | | 2014 | | | 2013 | |
| |
| | | | | | |
| Advisor Class | | | | | | | | | | | | | | | | | | | | | | | | |
| | | | | | |
Per share operating performance (for a share outstanding throughout the period) | | | | | | | | | | | | | | | | | | | | | | | | |
| | | | | | |
| Net asset value, beginning of period | | | $13.24 | | | | $11.13 | | | | $11.24 | | | | $11.47 | | | | $10.48 | | | | $9.13 | |
| | | | |
| | | | | | |
| Income from investment operationsa: | | | | | | | | | | | | | | | | | | | | | | | | |
| | | | | | |
Net investment income (loss)b | | | (0.02 | ) | | | 0.08 | | | | 0.05 | | | | 0.10 | | | | 0.09 | | | | 0.13 | |
| | | | | | |
Net realized and unrealized gains (losses) | | | 2.47 | | | | 2.13 | | | | (0.12 | ) | | | (0.20 | ) | | | 0.95 | | | | 1.33 | |
| | | | |
| | | | | | |
Total from investment operations | | | 2.45 | | | | 2.21 | | | | (0.07 | ) | | | (0.10 | ) | | | 1.04 | | | | 1.46 | |
| | | | |
| | | | | | |
| Less distributions from: | | | | | | | | | | | | | | | | | | | | | | | | |
| | | | | | |
Net investment income | | | (0.08 | ) | | | (0.10 | ) | | | (0.04 | ) | | | (0.06 | ) | | | (0.05 | ) | | | (0.11 | ) |
| | | | | | |
Net realized gains | | | (0.19 | ) | | | — | | | | — | | | | (0.07 | ) | | | — | | | | — | |
| | | | |
| | | | | | |
Total distributions | | | (0.27 | ) | | | (0.10 | ) | | | (0.04 | ) | | | (0.13 | ) | | | (0.05 | ) | | | (0.11 | ) |
| | | | |
| | | | | | |
Net asset value, end of period | | | $15.42 | | | | $13.24 | | | | $11.13 | | | | $11.24 | | | | $11.47 | | | | $10.48 | |
| | | | |
| | | | | | |
Total returnc | | | 18.68% | | | | 20.04% | | | | (0.62)% | | | | (0.76)% | | | | 9.91% | | | | 16.04% | |
| | | | | | |
| Ratios to average net assetsd | | | | | | | | | | | | | | | | | | | | | | | | |
| | | | | | |
Expenses before waiver and payments by affiliates | | | 1.19% | | | | 1.29% | | | | 1.40% | | | | 1.42% | | | | 1.40% | | | | 1.22% | |
| | | | | | |
Expenses net of waiver and payments by affiliates | | | 1.00%e | | | | 1.06%e | | | | 1.19%e | | | | 1.19% | | | | 1.19%e | | | | 1.19% | |
| | | | | | |
Net investment income (loss) | | | (0.16)% | | | | 0.62% | | | | 0.50% | | | | 0.91% | | | | 0.78% | | | | 1.37% | |
| | | | | | |
| Supplemental data | | | | | | | | | | | | | | | | | | | | | | | | |
| | | | | | |
Net assets, end of period (000’s) | | | $186,918 | | | | $147,926 | | | | $110,441 | | | | $126,130 | | | | $97,134 | | | | $74,240 | |
| | | | | | |
Portfolio turnover rate | | | 25.19% | | | | 28.66% | | | | 27.27% | | | | 47.52% | | | | 29.63% | | | | 26.06% | |
aThe amount shown for a share outstanding throughout the period may not correlate with the Statement of Operations for the period due to the timing of sales and repurchases of the Fund’s shares in relation to income earned and/or fluctuating fair value of the investments of the Fund.
bBased on average daily shares outstanding.
cTotal return is not annualized for periods less than one year.
dRatios are annualized for periods less than one year, except for non-recurring expenses, if any.
eBenefit of expense reduction rounds to less than 0.01%.
| | | | | | |
| franklintempleton.com | | The accompanying notes are an integral part of these financial statements. | Semiannual Report | | | 21 | |
FRANKLIN GLOBAL TRUST
Statement of Investments, January 31, 2018 (unaudited)
Franklin International Growth Fund
| | | | | | | | | | | | | | |
| | | | | Country | | | Shares | | | Value | |
| | | | | | | | | | | | | | |
| | | Common Stocks 94.3% | | | | | | | | | |
| | Aerospace & Defense 2.7% | | | | | | | | | | | | |
| | MTU Aero Engines AG | | | Germany | | | | 56,300 | | | $ | 10,085,651 | |
| | | | | | | | | | | | | | |
| | Auto Components 2.4% | | | | | | | | | | | | |
| | Aptiv PLC | | | United States | | | | 92,000 | | | | 8,728,960 | |
| | | | | | | | | | | | | | |
| | Banks 3.1% | | | | | | | | | | | | |
| a,b | | Irish Bank Resolution Corp. Ltd. | | | Ireland | | | | 11,500 | | | | — | |
| | KBC Groep NV | | | Belgium | | | | 119,000 | | | | 11,434,499 | |
| | | | | | | | | | | | | | |
| | | | | | | | | | | | | 11,434,499 | |
| | | | | | | | | | | | | | |
| | Biotechnology 5.5% | | | | | | | | | | | | |
| a | | Alkermes PLC | | | United States | | | | 213,000 | | | | 12,177,210 | |
| | CSL Ltd. | | | Australia | | | | 68,000 | | | | 8,022,499 | |
| | | | | | | | | | | | | | |
| | | | | | | | | | | | | 20,199,709 | |
| | | | | | | | | | | | | | |
| | Capital Markets 7.5% | | | | | | | | | | | | |
| | Azimut Holding SpA | | | Italy | | | | 520,000 | | | | 11,839,460 | |
| | CI Financial Corp. | | | Canada | | | | 320,500 | | | | 7,715,138 | |
| | Deutsche Boerse AG | | | Germany | | | | 65,000 | | | | 8,339,750 | |
| | | | | | | | | | | | | | |
| | | | | | | | | | | | | 27,894,348 | |
| | | | | | | | | | | | | | |
| | Chemicals 8.8% | | | | | | | | | | | | |
| | Koninklijke DSM NV | | | Netherlands | | | | 98,000 | | | | 10,124,720 | |
| | Symrise AG | | | Germany | | | | 135,000 | | | | 11,289,249 | |
| | Umicore SA | | | Belgium | | | | 215,000 | | | | 11,306,382 | |
| | | | | | | | | | | | | | |
| | | | | | | | | | | | | 32,720,351 | |
| | | | | | | | | | | | | | |
| | Diversified Consumer Services 3.4% | | | | | | | | | | | | |
| | TAL Education Group, ADR | | | China | | | | 385,800 | | | | 12,565,506 | |
| | | | | | | | | | | | | | |
| | Energy Equipment & Services 3.0% | | | | | | | | | | | | |
| | John Wood Group PLC | | | United Kingdom | | | | 1,200,000 | | | | 11,031,127 | |
| | | | | | | | | | | | | | |
| | Health Care Equipment & Supplies 4.6% | | | | | | | | | | | | |
| | Cochlear Ltd. | | | Australia | | | | 63,400 | | | | 8,874,408 | |
| | GN Store Nord A/S | | | Denmark | | | | 240,900 | | | | 8,124,424 | |
| | | | | | | | | | | | | | |
| | | | | | | | | | | | | 16,998,832 | |
| | | | | | | | | | | | | | |
| | Household Products 1.6% | | | | | | | | | | | | |
| | Reckitt Benckiser Group PLC | | | United Kingdom | | | | 61,300 | | | | 5,917,778 | |
| | | | | | | | | | | | | | |
| | Internet & Direct Marketing Retail 5.3% | | | | | | | | | | | | |
| a | | boohoo.com PLC | | | United Kingdom | | | | 3,900,000 | | | | 10,257,816 | |
| | Start Today Co. Ltd. | | | Japan | | | | 320,000 | | | | 9,393,232 | |
| | | | | | | | | | | | | | |
| | | | | | | | | | | | | 19,651,048 | |
| | | | | | | | | | | | | | |
| | Internet Software & Services 7.2% | | | | | | | | | | | | |
| a | | Just Eat PLC | | | United Kingdom | | | | 930,000 | | | | 10,758,329 | |
| | MercadoLibre Inc. | | | Argentina | | | | 26,000 | | | | 10,064,600 | |
| a | | Shopify Inc., A | | | Canada | | | | 45,000 | | | | 5,756,400 | |
| | | | | | | | | | | | | | |
| | | | | | | | | | | | | 26,579,329 | |
| | | | | | | | | | | | | | |
| | IT Services 1.2% | | | | | | | | | | | | |
| a | | InterXion Holding NV | | | Netherlands | | | | 72,000 | | | | 4,518,000 | |
| | | | | | | | | | | | | | |
| | Machinery 3.0% | | | | | | | | | | | | |
| | Weir Group PLC | | | United Kingdom | | | | 360,000 | | | | 11,284,853 | |
| | | | | | | | | | | | | | |
| | Media 2.8% | | | | | | | | | | | | |
| | Ascential PLC | | | United Kingdom | | | | 2,000,000 | | | | 10,313,655 | |
| | | | | | | | | | | | | | |
| | | | |
| 22 | | Semiannual Report | | franklintempleton.com |
FRANKLIN GLOBAL TRUST
STATEMENT OF INVESTMENTS (UNAUDITED)
Franklin International Growth Fund (continued)
| | | | | | | | | | | | | | |
| | | | | Country | | | Shares | | | Value | |
| | | | | | | | | | | | | | |
| | | Common Stocks (continued) | | | | | | | | | |
| | Multiline Retail 2.7% | | | | | | | | | | | | |
| | Dollarama Inc. | | | Canada | | | | 72,600 | | | $ | 9,926,318 | |
| | | | | | | | | | | | | | |
| | Pharmaceuticals 6.3% | | | | | | | | | | | | |
| | Hikma Pharmaceuticals PLC | | | United Kingdom | | | | 600,000 | | | | 8,233,328 | |
| | Roche Holding AG | | | Switzerland | | | | 32,000 | | | | 7,886,573 | |
| | Santen Pharmaceutical Co. Ltd. | | | Japan | | | | 450,400 | | | | 7,346,819 | |
| | | | | | | | | | | | | | |
| | | | | | | | | | | | | 23,466,720 | |
| | | | | | | | | | | | | | |
| | Professional Services 2.7% | | | | | | | | | | | | |
| | Experian PLC | | | United Kingdom | | | | 435,000 | | | | 10,018,564 | |
| | | | | | | | | | | | | | |
| | Road & Rail 3.0% | | | | | | | | | | | | |
| | DSV AS | | | Denmark | | | | 135,000 | | | | 11,100,826 | |
| | | | | | | | | | | | | | |
| | Semiconductors & Semiconductor Equipment 2.4% | | | | | | | | | | | | |
| | Infineon Technologies AG | | | Germany | | | | 300,000 | | | | 8,718,703 | |
| | | | | | | | | | | | | | |
| | Software 12.0% | | | | | | | | | | | | |
| a | | Line Corp. | | | Japan | | | | 215,900 | | | | 10,223,043 | |
| | The Sage Group PLC | | | United Kingdom | | | | 1,010,600 | | | | 10,744,217 | |
| | SAP SE | | | Germany | | | | 86,000 | | | | 9,697,438 | |
| | Sophos Group PLC | | | United Kingdom | | | | 1,513,900 | | | | 13,749,119 | |
| | | | | | | | | | | | | | |
| | | | | | | | | | | | | 44,413,817 | |
| | | | | | | | | | | | | | |
| | Trading Companies & Distributors 3.1% | | | | | | | | | | | | |
| | Ferguson PLC | | | United Kingdom | | | | 147,800 | | | | 11,401,227 | |
| | | | | | | | | | | | | | |
| | Total Common Stocks (Cost $228,714,204) | | | | | | | | | | | 348,969,821 | |
| | | | | | | | | | | | | | |
| | | | |
| | Short Term Investments (Cost $23,202,027) 6.2% | | | | | | | | | | | | |
| | | Money Market Funds 6.2% | | | | | | | | | |
| c,d | | Institutional Fiduciary Trust Money Market Portfolio, 0.96% | | | United States | | | | 23,202,027 | | | | 23,202,027 | |
| | | | | | | | | | | | | | |
| | Total Investments (Cost $251,916,231) 100.5% | | | | | | | | | | | 372,171,848 | |
| | Other Assets, less Liabilities (0.5)% | | | | | | | | | | | (2,013,411 | ) |
| | | | | | | | | | | | | | |
| | Net Assets 100.0% | | | | | | | | | | $ | 370,158,437 | |
| | | | | | | | | | | | | | |
See Abbreviations on page 45.
aNon-income producing.
bFair valued using significant unobservable inputs. See Note 10 regarding fair value measurements.
cSee Note 3(f) regarding investments in affiliated management investment companies.
dThe rate shown is the annualized seven-day yield at period end.
| | | | | | |
| franklintempleton.com | | The accompanying notes are an integral part of these financial statements. | Semiannual Report | | | 23 | |
FRANKLIN GLOBAL TRUST
Financial Highlights
Franklin International Small Cap Growth Fund
| | | | | | | | | | | | | | | | | | | | | | | | |
| | | Six Months Ended | | | | | | | | | | | | | | | | | | | | | |
| | | January 31, 2018 | | | | | | Year Ended July 31, | | | | |
| | | | | | | | |
| | | (unaudited) | | | 2017 | | | 2016 | | | 2015 | | | 2014 | | | 2013 | |
| |
| | | | | | |
| Class A | | | | | | | | | | | | | | | | | | | | | | | | |
| | | | | | |
Per share operating performance
(for a share outstanding throughout the period) | | | | | | | | | | | | | | | | | | | | | | | | |
| | | | | | |
Net asset value, beginning of period | | | $20.61 | | | | $17.55 | | | | $19.92 | | | | $22.23 | | | | $19.70 | | | | $14.38 | |
| | | | |
| | | | | | |
Income from investment operationsa: | | | | | | | | | | | | | | | | | | | | | | | | |
| | | | | | |
Net investment incomeb | | | 0.25 | | | | 0.19 | | | | 0.22 | | | | 0.19 | | | | 0.19 | | | | 0.18 | |
| | | | | | |
Net realized and unrealized gains (losses) | | | 2.22 | | | | 4.37 | | | | (1.98) | | | | (0.48) | | | | 2.65 | | | | 5.94 | |
| | | | |
| | | | | | |
Total from investment operations | | | 2.47 | | | | 4.56 | | | | (1.76) | | | | (0.29) | | | | 2.84 | | | | 6.12 | |
| | | | |
| | | | | | |
Less distributions from: | | | | | | | | | | | | | | | | | | | | | | | | |
| | | | | | |
Net investment income | | | (1.23) | | | | (0.18) | | | | (0.24) | | | | (0.29) | | | | (0.11) | | | | (0.19) | |
| | | | | | |
Net realized gains | | | (0.58) | | | | (1.32) | | | | (0.37) | | | | (1.73) | | | | (0.20) | | | | (0.61) | |
| | | | | | |
Total distributions | | | (1.81) | | | | (1.50) | | | | (0.61) | | | | (2.02) | | | | (0.31) | | | | (0.80) | |
| | | | |
| | | | | | |
Net asset value, end of period | | | $21.27 | | | | $20.61 | | | | $17.55 | | | | $19.92 | | | | $22.23 | | | | $19.70 | |
| | | | |
| | | | | | |
Total returnc | | | 12.75% | | | | 28.31% | | | | (8.93)% | | | | (0.17)% | | | | 14.48% | | | | 43.69% | |
| | | | |
| | | | | | |
| Ratios to average net assetsd | | | | | | | | | | | | | | | | | | | | | | | | |
| | | | | | |
Expenses before waiver and payments by affiliates | | | 1.35% | | | | 1.38% | | | | 1.38% | | | | 1.36% | | | | 1.36% | | | | 1.46% | |
| | | | | | |
Expenses net of waiver and payments by affiliatese | | | 1.35% | | | | 1.38% | | | | 1.38% | | | | 1.36% | | | | 1.36% | | | | 1.40% | |
| | | | | | |
Net investment income | | | 2.41% | | | | 1.05% | | | | 1.14% | | | | 0.98% | | | | 0.89% | | | | 1.03% | |
| | | | | | |
| Supplemental data | | | | | | | | | | | | | | | | | | | | | | | | |
| | | | | | |
Net assets, end of period (000’s) | | | $175,908 | | | | $161,355 | | | | $169,943 | | | | $212,890 | | | | $257,568 | | | | $232,712 | |
| | | | | | |
Portfolio turnover rate | | | 13.06% | | | | 21.71% | | | | 21.93% | | | | 24.20% | | | | 16.08% | | | | 22.81% | |
aThe amount shown for a share outstanding throughout the period may not correlate with the Statement of Operations for the period due to the timing of sales and repurchases of the Fund’s shares in relation to income earned and/or fluctuating fair value of the investments of the Fund.
bBased on average daily shares outstanding.
cTotal return does not reflect sales commissions or contingent deferred sales charges, if applicable, and is not annualized for periods less than one year.
dRatios are annualized for periods less than one year, except for non-recurring expenses, if any.
eBenefit of expense reduction rounds to less than 0.01%.
| | | | |
| 24 | | Semiannual Report | The accompanying notes are an integral part of these financial statements. | | franklintempleton.com |
FRANKLIN GLOBAL TRUST
FINANCIAL HIGHLIGHTS
Franklin International Small Cap Growth Fund (continued)
| | | | | | | | | | | | | | | | | | | | | | | | |
| | | Six Months Ended | | | | | | | | | | |
| | | January 31, 2018 | | | Year Ended July 31, | |
| | | | | | | | |
| | | (unaudited) | | | 2017 | | | 2016 | | | 2015 | | | 2014 | | | 2013 | |
| |
| | | | | | |
| Class C | | | | | | | | | | | | | | | | | | | | | | | | |
| | | | | | |
Per share operating performance
(for a share outstanding throughout the period) | | | | | | | | | | | | | | | | | | | | | | | | |
| | | | | | |
| Net asset value, beginning of period | | | $20.36 | | | | $17.32 | | | | $19.60 | | | | $21.94 | | | | $19.51 | | | | $14.25 | |
| | | | |
| | | | | | |
| Income from investment operationsa: | | | | | | | | | | | | | | | | | | | | | | | | |
| | | | | | |
Net investment incomeb | | | 0.17 | | | | 0.05 | | | | 0.07 | | | | 0.05 | | | | 0.02 | | | | 0.05 | |
| | | | | | |
Net realized and unrealized gains (losses) | | | 2.18 | | | | 4.33 | | | | (1.95) | | | | (0.47) | | | | 2.63 | | | | 5.90 | |
| | | | |
| | | | | | |
| Total from investment operations | | | 2.35 | | | | 4.38 | | | | (1.88) | | | | (0.42) | | | | 2.65 | | | | 5.95 | |
| | | | |
| | | | | | |
| Less distributions from: | | | | | | | | | | | | | | | | | | | | | | | | |
| | | | | | |
Net investment income | | | (1.07) | | | | (0.02) | | | | (0.03) | | | | (0.19) | | | | (0.02) | | | | (0.08) | |
| | | | | | |
Net realized gains | | | (0.58) | | | | (1.32) | | | | (0.37) | | | | (1.73) | | | | (0.20) | | | | (0.61) | |
| | | | |
| | | | | | |
| Total distributions | | | (1.65) | | | | (1.34) | | | | (0.40) | | | | (1.92) | | | | (0.22) | | | | (0.69) | |
| | | | |
| | | | | | |
| Net asset value, end of period | | | $21.06 | | | | $20.36 | | | | $17.32 | | | | $19.60 | | | | $21.94 | | | | $19.51 | |
| | | | |
| | | | | | |
Total returnc | | | 12.24% | | | | 27.39% | | | | (9.66)% | | | | (0.86)% | | | | 13.59% | | | | 42.74% | |
| | | | | | |
| Ratios to average net assetsd | | | | | | | | | | | | | | | | | | | | | | | | |
| | | | | | |
| Expenses before waiver and payments by affiliates | | | 2.11% | | | | 2.13% | | | | 2.15% | | | | 2.08% | | | | 2.11% | | | | 2.16% | |
| | | | | | |
| Expenses net of waiver and payments by affiliatese | | | 2.11% | | | | 2.13% | | | | 2.15% | | | | 2.08% | | | | 2.11% | | | | 2.10% | |
| | | | | | |
| Net investment income | | | 1.65% | | | | 0.30% | | | | 0.37% | | | | 0.26% | | | | 0.14% | | | | 0.33% | |
| | | | | | |
| Supplemental data | | | | | | | | | | | | | | | | | | | | | | | | |
| | | | | | |
| Net assets, end of period (000’s) | | | $22,518 | | | | $22,191 | | | | $22,699 | | | | $30,067 | | | | $35,484 | | | | $29,786 | |
| | | | | | |
| Portfolio turnover rate | | | 13.06% | | | | 21.71% | | | | 21.93% | | | | 24.20% | | | | 16.08% | | | | 22.81% | |
aThe amount shown for a share outstanding throughout the period may not correlate with the Statement of Operations for the period due to the timing of sales and repurchases of the Fund’s shares in relation to income earned and/or fluctuating fair value of the investments of the Fund.
bBased on average daily shares outstanding.
cTotal return does not reflect sales commissions or contingent deferred sales charges, if applicable, and is not annualized for periods less than one year.
dRatios are annualized for periods less than one year, except for non-recurring expenses, if any.
eBenefit of expense reduction rounds to less than 0.01%.
| | | | | | |
| franklintempleton.com | | The accompanying notes are an integral part of these financial statements. | Semiannual Report | | | 25 | |
FRANKLIN GLOBAL TRUST
FINANCIAL HIGHLIGHTS
Franklin International Small Cap Growth Fund (continued)
| | | | | | | | | | | | | | | | | | | | | | | | |
| | | Six Months Ended | | | | | | | | | | |
| | | January 31, 2018 | | | Year Ended July 31, | |
| | | | | | | | |
| | | (unaudited) | | | 2017 | | | 2016 | | | 2015 | | | 2014 | | | 2013 | |
| |
| | | | | | |
| Class R | | | | | | | | | | | | | | | | | | | | | | | | |
| | | | | | |
Per share operating performance
(for a share outstanding throughout the period) | | | | | | | | | | | | | | | | | | | | | | | | |
| | | | | | |
Net asset value, beginning of period | | | $20.66 | | | | $17.56 | | | | $19.88 | | | | $22.19 | | | | $19.65 | | | | $14.35 | |
| | | | |
| | | | | | |
Income from investment operationsa: | | | | | | | | | | | | | | | | | | | | | | | | |
| | | | | | |
Net investment incomeb | | | 0.23 | | | | 0.13 | | | | 0.17 | | | | 0.15 | | | | 0.12 | | | | 0.13 | |
| | | | | | |
Net realized and unrealized gains (losses) | | | 2.21 | | | | 4.41 | | | | (1.98) | | | | (0.48) | | | | 2.66 | | | | 5.94 | |
| | | | |
| | | | | | |
Total from investment operations | | | 2.44 | | | | 4.54 | | | | (1.81) | | | | (0.33) | | | | 2.78 | | | | 6.07 | |
| | | | |
| | | | | | |
Less distributions from: | | | | | | | | | | | | | | | | | | | | | | | | |
| | | | | | |
Net investment income | | | (1.18) | | | | (0.12) | | | | (0.14) | | | | (0.25) | | | | (0.04) | | | | (0.16) | |
| | | | | | |
Net realized gains | | | (0.58) | | | | (1.32) | | | | (0.37) | | | | (1.73) | | | | (0.20) | | | | (0.61) | |
| | | | |
| | | | | | |
Total distributions | | | (1.76) | | | | (1.44) | | | | (0.51) | | | | (1.98) | | | | (0.24) | | | | (0.77) | |
| | | | |
| | | | | | |
Net asset value, end of period | | | $21.34 | | | | $20.66 | | | | $17.56 | | | | $19.88 | | | | $22.19 | | | | $19.65 | |
| | | | |
| | | | | | |
Total returnc | | | 12.51% | | | | 28.07% | | | | (9.20)% | | | | (0.41)% | | | | 14.17% | | | | 43.40% | |
| | | | | | |
| Ratios to average net assetsd | | | | | | | | | | | | | | | | | | | | | | | | |
| | | | | | |
Expenses before waiver and payments by affiliates | | | 1.61% | | | | 1.64% | | | | 1.64% | | | | 1.62% | | | | 1.62% | | | | 1.66% | |
| | | | | | |
Expenses net of waiver and payments by affiliatese | | | 1.61% | | | | 1.64% | | | | 1.64% | | | | 1.62% | | | | 1.62% | | | | 1.60% | |
| | | | | | |
Net investment income | | | 2.15% | | | | 0.79% | | | | 0.88% | | | | 0.72% | | | | 0.63% | | | | 0.83% | |
| | | | | | |
| Supplemental data | | | | | | | | | | | | | | | | | | | | | | | | |
| | | | | | |
Net assets, end of period (000’s) | | | $3,967 | | | | $3,592 | | | | $4,735 | | | | $6,193 | | | | $9,320 | | | | $120,877 | |
| | | | | | |
Portfolio turnover rate | | | 13.06% | | | | 21.71% | | | | 21.93% | | | | 24.20% | | | | 16.08% | | | | 22.81% | |
aThe amount shown for a share outstanding throughout the period may not correlate with the Statement of Operations for the period due to the timing of sales and repurchases of the Fund’s shares in relation to income earned and/or fluctuating fair value of the investments of the Fund.
bBased on average daily shares outstanding.
cTotal return is not annualized for periods less than one year.
dRatios are annualized for periods less than one year, except for non-recurring expenses, if any.
eBenefit of expense reduction rounds to less than 0.01%.
| | | | |
| 26 | | Semiannual Report | The accompanying notes are an integral part of these financial statements. | | franklintempleton.com |
FRANKLIN GLOBAL TRUST
FINANCIAL HIGHLIGHTS
Franklin International Small Cap Growth Fund (continued)
| | | | | | | | | | | | | | | | | | | | | | | | |
| | | Six Months Ended | | | | | | | | | | |
| | | January 31, 2018 | | | Year Ended July 31, | |
| | | | | | | | |
| | | (unaudited) | | | 2017 | | | 2016 | | | 2015 | | | 2014 | | | 2013a | |
| |
| | | | | | |
| Class R6 | | | | | | | | | | | | | | | | | | | | | | | | |
| | | | | | |
Per share operating performance
(for a share outstanding throughout the period) | | | | | | | | | | | | | | | | | | | | | | | | |
| | | | | | |
Net asset value, beginning of period | | | $20.67 | | | | $17.61 | | | | $20.03 | | | | $22.32 | | | | $19.78 | | | | $18.49 | |
| | | | |
| | | | | | |
Income from investment operationsb: | | | | | | | | | | | | | | | | | | | | | | | | |
| | | | | | |
Net investment incomec | | | 0.30 | | | | 0.27 | | | | 0.30 | | | | 0.27 | | | | 0.28 | | | | 0.09 | |
| | | | | | |
Net realized and unrealized gains (losses) | | | 2.21 | | | | 4.37 | | | | (2.00) | | | | (0.48) | | | | 2.65 | | | | 1.20 | |
| | | | |
| | | | | | |
Total from investment operations | | | 2.51 | | | | 4.64 | | | | (1.70) | | | | (0.21) | | | | 2.93 | | | | 1.29 | |
| | | | |
| | | | | | |
Less distributions from: | | | | | | | | | | | | | | | | | | | | | | | | |
| | | | | | |
Net investment income | | | (1.31) | | | | (0.26) | | | | (0.35) | | | | (0.35) | | | | (0.19) | | | | — | |
| | | | | | |
Net realized gains | | | (0.58) | | | | (1.32) | | | | (0.37) | | | | (1.73) | | | | (0.20) | | | | — | |
| | | | |
| | | | | | |
Total distributions | | | (1.89) | | | | (1.58) | | | | (0.72) | | | | (2.08) | | | | (0.39) | | | | — | |
| | | | |
| | | | | | |
Net asset value, end of period | | | $21.29 | | | | $20.67 | | | | $17.61 | | | | $20.03 | | | | $22.32 | | | | $19.78 | |
| | | | |
| | | | | | |
Total returnd | | | 12.92% | | | | 28.87% | | | | (8.61)% | | | | 0.22% | | | | 14.89% | | | | 6.98% | |
| | | | | | |
| Ratios to average net assetse | | | | | | | | | | | | | | | | | | | | | | | | |
| | | | | | |
Expensesf | | | 0.99% | | | | 0.99% | | | | 0.99% | | | | 0.99% | | | | 1.00% | | | | 1.01% | |
| | | | | | |
Net investment income | | | 2.77% | | | | 1.44% | | | | 1.53% | | | | 1.35% | | | | 1.25% | | | | 1.42% | |
| | | | | | |
| Supplemental data | | | | | | | | | | | | | | | | | | | | | | | | |
| | | | | | |
Net assets, end of period (000’s) | | | $488,173 | | | | $492,010 | | | | $383,411 | | | | $387,070 | | | | $359,449 | | | | $220,507 | |
| | | | | | |
Portfolio turnover rate | | | 13.06% | | | | 21.71% | | | | 21.93% | | | | 24.20% | | | | 16.08% | | | | 22.81% | |
aFor the period May 1, 2013 (effective date) to July 31, 2013.
bThe amount shown for a share outstanding throughout the period may not correlate with the Statement of Operations for the period due to the timing of sales and repurchases of the Fund’s shares in relation to income earned and/or fluctuating fair value of the investments of the Fund.
cBased on average daily shares outstanding.
dTotal return is not annualized for periods less than one year.
eRatios are annualized for periods less than one year, except for non-recurring expenses, if any.
fBenefit of expense reduction rounds to less than 0.01%.
| | | | | | |
| franklintempleton.com | | The accompanying notes are an integral part of these financial statements. | Semiannual Report | | | 27 | |
FRANKLIN GLOBAL TRUST
FINANCIAL HIGHLIGHTS
Franklin International Small Cap Growth Fund (continued)
| | | | | | | | | | | | | | | | | | | | | | | | |
| | | Six Months Ended | | | | | | | | | | |
| | | January 31, 2018 | | | Year Ended July 31, | |
| | | | | | | | |
| | | (unaudited) | | | 2017 | | | 2016 | | | 2015 | | | 2014 | | | 2013 | |
| |
| | | | | | |
| Advisor Class | | | | | | | | | | | | | | | | | | | | | | | | |
| | | | | | |
Per share operating performance
(for a share outstanding throughout the period) | | | | | | | | | | | | | | | | | | | | | | | | |
| | | | | | |
Net asset value, beginning of period | | | $20.67 | | | | $17.59 | | | | $20.00 | | | | $22.30 | | | | $19.77 | | | | $14.43 | |
| | | | |
| | | | | | |
Income from investment operationsa: | | | | | | | | | | | | | | | | | | | | | | | | |
| | | | | | |
Net investment incomeb | | | 0.28 | | | | 0.23 | | | | 0.25 | | | | 0.24 | | | | 0.25 | | | | 0.23 | |
| | | | | | |
Net realized and unrealized gains (losses) | | | 2.21 | | | | 4.39 | | | | (1.97) | | | | (0.48) | | | | 2.65 | | | | 5.95 | |
| | | | |
| | | | | | |
Total from investment operations | | | 2.49 | | | | 4.62 | | | | (1.72) | | | | (0.24) | | | | 2.90 | | | | 6.18 | |
| | | | |
| | | | | | |
Less distributions from: | | | | | | | | | | | | | | | | | | | | | | | | |
| | | | | | |
Net investment income | | | (1.28) | | | | (0.22) | | | | (0.32) | | | | (0.33) | | | | (0.17) | | | | (0.23) | |
| | | | | | |
Net realized gains | | | (0.58) | | | | (1.32) | | | | (0.37) | | | | (1.73) | | | | (0.20) | | | | (0.61) | |
| | | | |
| | | | | | |
Total distributions | | | (1.86) | | | | (1.54) | | | | (0.69) | | | | (2.06) | | | | (0.37) | | | | (0.84) | |
| | | | |
| | | | | | |
Net asset value, end of period | | | $21.30 | | | | $20.67 | | | | $17.59 | | | | $20.00 | | | | $22.30 | | | | $19.77 | |
| | | | |
| | | | | | |
Total returnc | | | 12.83% | | | | 28.68% | | | | (8.74)% | | | | 0.09% | | | | 14.74% | | | | 44.06% | |
| | | | | | |
| Ratios to average net assetsd | | | | | | | | | | | | | | | | | | | | | | | | |
| | | | | | |
Expenses before waiver and payments by affiliates | | | 1.11% | | | | 1.14% | | | | 1.14% | | | | 1.12% | | | | 1.12% | | | | 1.16% | |
| | | | | | |
Expenses net of waiver and payments by affiliatese | | | 1.11% | | | | 1.14% | | | | 1.14% | | | | 1.12% | | | | 1.12% | | | | 1.10% | |
| | | | | | |
Net investment income | | | 2.65% | | | | 1.29% | | | | 1.38% | | | | 1.22% | | | | 1.13% | | | | 1.33% | |
| | | | | | |
| Supplemental data | | | | | | | | | | | | | | | | | | | | | | | | |
| | | | | | |
Net assets, end of period (000’s) | | | $807,526 | | | | $749,573 | | | | $827,351 | | | | $1,300,759 | | | | $1,223,532 | | | | $826,218 | |
| | | | | | |
Portfolio turnover rate | | | 13.06% | | | | 21.71% | | | | 21.93% | | | | 24.20% | | | | 16.08% | | | | 22.81% | |
aThe amount shown for a share outstanding throughout the period may not correlate with the Statement of Operations for the period due to the timing of sales and repurchases of the Fund’s shares in relation to income earned and/or fluctuating fair value of the investments of the Fund.
bBased on average daily shares outstanding.
cTotal return is not annualized for periods less than one year.
dRatios are annualized for periods less than one year, except for non-recurring expenses, if any.
eBenefit of expense reduction rounds to less than 0.01%.
| | | | |
| 28 | | Semiannual Report | The accompanying notes are an integral part of these financial statements. | | franklintempleton.com |
FRANKLIN GLOBAL TRUST
Statement of Investments, January 31, 2018 (unaudited)
Franklin International Small Cap Growth Fund
| | | | | | | | | | | | | | |
| | | | | Country | | | Shares | | | Value | |
| | Common Stocks 97.5% | | | | | | | | | | | | |
| | Air Freight & Logistics 3.5% | | | | | | | | | | | | |
| | Panalpina Welttransport Holding AG | | | Switzerland | | | | 317,499 | | | $ | 52,552,735 | |
| | | | | | | | | | | | | | |
| | Capital Markets 5.5% | | | | | | | | | | | | |
| a | | Fairfax India Holdings Corp. | | | Canada | | | | 4,492,000 | | | | 82,922,320 | |
| | | | | | | | | | | | | | |
| | Commercial Services & Supplies 6.3% | | | | | | | | | | | | |
| | Elis SA | | | France | | | | 848,260 | | | | 23,694,128 | |
| | ISS AS | | | Denmark | | | | 1,385,100 | | | | 54,036,342 | |
| a | | Serco Group PLC | | | United Kingdom | | | | 13,028,010 | | | | 16,398,322 | |
| | | | | | | | | | | | | | |
| | | | | | | | | | | | | 94,128,792 | |
| | | | | | | | | | | | | | |
| | Distributors 2.9% | | | | | | | | | | | | |
| b | | Headlam Group PLC | | | United Kingdom | | | | 5,372,888 | | | | 43,840,281 | |
| | | | | | | | | | | | | | |
| | Energy Equipment & Services 5.2% | | | | | | | | | | | | |
| a | | Borr Drilling Ltd. | | | United Arab Emirates | | | | 4,017,800 | | | | 18,448,922 | |
| | John Wood Group PLC | | | United Kingdom | | | | 6,540,675 | | | | 60,125,848 | |
| | | | | | | | | | | | | | |
| | | | | | | | | | | | | 78,574,770 | |
| | | | | | | | | | | | | | |
| | Equity Real Estate Investment Trusts (REITs) 4.3% | | | | | | | | | | | | |
| | Green REIT PLC | | | Ireland | | | | 32,323,781 | | | | 63,884,345 | |
| | | | | | | | | | | | | | |
| | Food & Staples Retailing 3.0% | | | | | | | | | | | | |
| �� | Total Produce PLC | | | Ireland | | | | 15,245,100 | | | | 44,476,168 | |
| | | | | | | | | | | | | | |
| | Food Products 3.2% | | | | | | | | | | | | |
| | Cloetta AB, B | | | Sweden | | | | 11,664,600 | | | | 48,157,895 | |
| | | | | | | | | | | | | | |
| | Hotels, Restaurants & Leisure 0.6% | | | | | | | | | | | | |
| | Elior Group SA | | | France | | | | 369,600 | | | | 8,516,069 | |
| | | | | | | | | | | | | | |
| | Insurance 8.2% | | | | | | | | | | | | |
| a | | Arch Capital Group Ltd. | | | United States | | | | 446,907 | | | | 40,641,723 | |
| | Fairfax Financial Holdings Ltd. | | | Canada | | | | 102,300 | | | | 53,809,276 | |
| | RenaissanceRe Holdings Ltd. | | | United States | | | | 221,600 | | | | 28,174,224 | |
| | | | | | | | | | | | | | |
| | | | | | | | | | | | | 122,625,223 | |
| | | | | | | | | | | | | | |
| | Internet & Direct Marketing Retail 1.2% | | | | | | | | | | | | |
| | Dustin Group AB | | | Sweden | | | | 1,850,600 | | | | 18,243,732 | |
| | | | | | | | | | | | | | |
| | Internet Software & Services 6.1% | | | | | | | | | | | | |
| a | | 58.com Inc., ADR | | | China | | | | 1,151,400 | | | | 91,973,832 | |
| | | | | | | | | | | | | | |
| | Leisure Products 3.6% | | | | | | | | | | | | |
| | Bandai Namco Holdings Inc. | | | Japan | | | | 894,700 | | | | 29,171,883 | |
| | Beneteau SA | | | France | | | | 920,848 | | | | 24,464,196 | |
| | | | | | | | | | | | | | |
| | | | | | | | | | | | | 53,636,079 | |
| | | | | | | | | | | | | | |
| | Machinery 2.4% | | | | | | | | | | | | |
| | Zardoya Otis SA | | | Spain | | | | 3,149,108 | | | | 35,967,032 | |
| | | | | | | | | | | | | | |
| | Marine 7.4% | | | | | | | | | | | | |
| b | | Clarkson PLC | | | United Kingdom | | | | 1,798,229 | | | | 80,380,972 | |
| a,b | | Diana Shipping Inc. | | | United States | | | | 8,027,750 | | | | 30,505,450 | |
| | | | | | | | | | | | | | |
| | | | | | | | | | | | | 110,886,422 | |
| | | | | | | | | | | | | | |
| | Media 3.8% | | | | | | | | | | | | |
| a | | Liberty Latin America Ltd. | | | Chile | | | | 867,900 | | | | 19,675,293 | |
| a | | Liberty Latin America Ltd., A | | | Chile | | | | 1,690,100 | | | | 37,942,745 | |
| | | | | | | | | | | | | | |
| | | | | | | | | | | | | 57,618,038 | |
| | | | | | | | | | | | | | |
| | | | | | |
| franklintempleton.com | | Semiannual Report | | | 29 | |
FRANKLIN GLOBAL TRUST
STATEMENT OF INVESTMENTS (UNAUDITED)
Franklin International Small Cap Growth Fund (continued)
| | | | | | | | | | | | | | |
| | | | |
| | | | | Country | | | Shares | | | Value | |
| | Common Stocks (continued) | | | | | | | | | | | | |
| | Metals & Mining 2.2% | | | | | | | | | | | | |
| | Straits Trading Co. Ltd. | | | Singapore | | | | 18,223,100 | | | $ | 32,232,373 | |
| | | | | | | | | | | | | | |
| | Pharmaceuticals 0.0%† | | | | | | | | | | | | |
| | Haw Par Corp. Ltd. | | | Singapore | | | | 6,300 | | | | 57,973 | |
| | | | | | | | | | | | | | |
| | Professional Services 6.1% | | | | | | | | | | | | |
| | PageGroup PLC | | | United Kingdom | | | | 9,078,218 | | | | 70,080,502 | |
| | SThree PLC | | | United Kingdom | | | | 4,069,860 | | | | 20,502,439 | |
| | | | | | | | | | | | | | |
| | | | | | | | | | | | | 90,582,941 | |
| | | | | | | | | | | | | | |
| | Real Estate Management & Development 11.6% | | | | | | | | | | | | |
| | Hang Lung Group Ltd. | | | Hong Kong | | | | 13,398,600 | | | | 50,955,342 | |
| | Kennedy-Wilson Holdings Inc. | | | United States | | | | 2,881,136 | | | | 51,140,164 | |
| b | | Lar Espana Real Estate Socimi SA | | | Spain | | | | 6,357,210 | | | | 71,897,561 | |
| | | | | | | | | | | | | | |
| | | | | | | | | | | | | 173,993,067 | |
| | | | | | | | | | | | | | |
| | Specialty Retail 0.5% | | | | | | | | | | | | |
| a,b | | Carpetright PLC | | | United Kingdom | | | | 6,064,925 | | | | 7,229,403 | |
| | | | | | | | | | | | | | |
| | Tobacco 4.7% | | | | | | | | | | | | |
| | Scandinavian Tobacco Group AS | | | Denmark | | | | 3,446,373 | | | | 69,783,952 | |
| | | | | | | | | | | | | | |
| | Trading Companies & Distributors 5.2% | | | | | | | | | | | | |
| | Grafton Group PLC, units consisting of A shares and C shares | | | United Kingdom | | | | 6,970,732 | | | | 78,194,816 | |
| | | | | | | | | | | | | | |
| | Total Common Stocks (Cost $1,194,648,039) | | | | | | | | | | | 1,460,078,258 | |
| | | | | | | | | | | | | | |
| | | | |
| | | | | | | | Principal
Amount | | | | |
| | Short Term Investments 2.2% | | | | | | | | | | | | |
| | Time Deposits 2.2% | | | | | | | | | | | | |
| | National Australia Bank Ltd, 1.32%, 2/01/18 | | | United States | | | $ | 20,000,000 | | | | 20,000,000 | |
| | Royal Bank of Canada, 1.28%, 2/01/18 | | | United States | | | | 13,500,000 | | | | 13,500,000 | |
| | | | | | | | | | | | | | |
| | Total Time Deposits (Cost $33,500,000) | | | | | | | | | | | 33,500,000 | |
| | | | | | | | | | | | | | |
| | Total Investments (Cost $1,228,148,039) 99.7% | | | | | | | | | | | 1,493,578,258 | |
| | Other Assets, less Liabilities 0.3% | | | | | | | | | | | 4,514,010 | |
| | | | | | | | | | | | | | |
| | Net Assets 100.0% | | | | | | | | | | $ | 1,498,092,268 | |
| | | | | | | | | | | | | | |
See Abbreviations on page 45.
†Rounds to less than 0.1% of net assets.
aNon-income producing.
bSee Note 8 regarding holdings of 5% voting securities.
| | | | |
| 30 | | Semiannual Report | The accompanying notes are an integral part of these financial statements. | | franklintempleton.com |
FRANKLIN GLOBAL TRUST
Financial Statements
Statements of Assets and Liabilities
January 31, 2018 (unaudited)
| | | | | | | | |
| | | Franklin
International
Growth Fund | | | Franklin
International
Small Cap Growth Fund | |
Assets: | | | | | | | | |
Investments in securities: | | | | | | | | |
Cost - Unaffiliated issuers | | $ | 228,714,204 | | | $ | 984,809,260 | |
Cost - Non-controlled affiliates (Note 3f and 8) | | | 23,202,027 | | | | 243,338,779 | |
| | | | |
Value - Unaffiliated issuers | | $ | 348,969,821 | | | $ | 1,259,724,591 | |
Value - Non-controlled affiliates (Note 3f and 8) | | | 23,202,027 | | | | 233,853,667 | |
Cash | | | — | | | | 138,913 | |
Foreign currency, at value (cost $— and $162,156, respectively) | | | — | | | | 162,378 | |
Receivables: | | | | | | | | |
Investment securities sold | | | — | | | | 1,775,324 | |
Capital shares sold | | | 1,291,908 | | | | 4,001,955 | |
Dividends | | | 626,477 | | | | 2,533,903 | |
European Union tax reclaims | | | 52,855 | | | | 1,031,200 | |
Affiliates | | | 72,806 | | | | — | |
Other assets | | | 8 | | | | 32 | |
| | | | |
Total assets | | | 374,215,902 | | | | 1,503,221,963 | |
| | | | |
Liabilities: | | | | | | | | |
Payables: | | | | | | | | |
Investment securities purchased | | | 3,134,310 | | | | 1,127,816 | |
Capital shares redeemed | | | 631,013 | | | | 2,479,540 | |
Management fees | | | 208,849 | | | | 1,201,167 | |
Distribution fees | | | 31,165 | | | | 55,848 | |
Transfer agent fees | | | — | | | | 152,665 | |
Trustees’ fees and expenses | | | 969 | | | | 1,909 | |
Accrued expenses and other liabilities | | | 51,159 | | | | 110,750 | |
| | | | |
Total liabilities | | | 4,057,465 | | | | 5,129,695 | |
| | | | |
Net assets, at value | | $ | 370,158,437 | | | $ | 1,498,092,268 | |
| | | | |
Net assets consist of: | | | | | | | | |
Paid-in capital | | $ | 242,232,685 | | | $ | 1,242,658,499 | |
Distributions in excess of net investment income | | | (422,772 | ) | | | (63,946,095 | ) |
Net unrealized appreciation (depreciation) | | | 120,287,914 | | | | 265,638,856 | |
Accumulated net realized gain (loss) | | | 8,060,610 | | | | 53,741,008 | |
| | | | |
Net assets, at value | | $ | 370,158,437 | | | $ | 1,498,092,268 | |
| | | | |
| | | | | | |
| franklintempleton.com | | The accompanying notes are an integral part of these financial statements. | Semiannual Report | | | 31 | |
FRANKLIN GLOBAL TRUST
FINANCIAL STATEMENTS
Statements of Assets and Liabilities (continued)
January 31, 2018 (unaudited)
| | | | | | | | |
| | | Franklin
International
Growth Fund | | | Franklin
International
Small Cap
Growth Fund | |
| |
| | |
| Class A: | | | | | | | | |
Net assets, at value | | $ | 102,357,133 | | | $ | 175,908,412 | |
| | | | |
Shares outstanding | | | 6,637,050 | | | | 8,272,034 | |
| | | | |
Net asset value per sharea | | $ | 15.42 | | | $ | 21.27 | |
| | | | |
Maximum offering price per share (net asset value per share ÷ 94.25%) | | $ | 16.36 | | | $ | 22.57 | |
| | | | |
| | |
| Class C: | | | | | | | | |
Net assets, at value | | $ | 14,684,093 | | | $ | 22,518,448 | |
| | | | |
Shares outstanding | | | 985,046 | | | | 1,069,041 | |
| | | | |
Net asset value and maximum offering price per sharea | | $ | 14.91 | | | $ | 21.06 | |
| | | | |
| | |
| Class R: | | | | | | | | |
Net assets, at value | | $ | 553,143 | | | $ | 3,966,500 | |
| | | | |
Shares outstanding | | | 36,061 | | | | 185,846 | |
| | | | |
Net asset value and maximum offering price per share | | $ | 15.34 | | | $ | 21.34 | |
| | | | |
| | |
| Class R6: | | | | | | | | |
Net assets, at value | | $ | 65,646,099 | | | $ | 488,173,214 | |
| | | | |
Shares outstanding | | | 4,255,738 | | | | 22,932,964 | |
| | | | |
Net asset value and maximum offering price per share | | $ | 15.43 | | | $ | 21.29 | |
| | | | |
| | |
| Advisor Class: | | | | | | | | |
Net assets, at value | | $ | 186,917,969 | | | $ | 807,525,694 | |
| | | | |
Shares outstanding | | | 12,121,350 | | | | 37,911,808 | |
| | | | |
Net asset value and maximum offering price per share | | $ | 15.42 | | | $ | 21.30 | |
| | | | |
aRedemption price is equal to net asset value less contingent deferred sales charges, if applicable.
| | | | |
| 32 | | Semiannual Report | The accompanying notes are an integral part of these financial statements. | | franklintempleton.com |
FRANKLIN GLOBAL TRUST
FINANCIAL STATEMENTS
Statements of Operations
for the six months ended January 31, 2018 (unaudited)
| | | | | | | | |
| | | Franklin
International
Growth Fund | | | Franklin
International
Small Cap
Growth Fund | |
| |
Investment income: | | | | | | | | |
Dividends: (net of foreign taxes)* | | | | | | | | |
Unaffiliated issuers | | $ | 1,484,068 | | | $ | 25,220,684 | |
Non-controlled affiliates (Note 3f and 8) | | | 50,543 | | | | 1,910,884 | |
Interest: | | | | | | | | |
Unaffiliated issuers | | | — | | | | 128,001 | |
Other income (Note 1c) | | | — | | | | 508,033 | |
| | | | |
Total investment income | | | 1,534,611 | | | | 27,767,602 | |
| | | | |
Expenses: | | | | | | | | |
Management fees (Note 3a) | | | 1,396,802 | | | | 6,996,878 | |
Distribution fees: (Note 3c) | | | | | | | | |
Class A | | | 171,100 | | | | 198,201 | |
Class C | | | 53,065 | | | | 111,884 | |
Class R | | | 979 | | | | 9,259 | |
Transfer agent fees: (Note 3e) | | | | | | | | |
Class A | | | 261,409 | | | | 118,519 | |
Class C | | | 20,276 | | | | 15,944 | |
Class R | | | 811 | | | | 2,637 | |
Class R6 | | | 4,396 | | | | 29,047 | |
Advisor Class | | | 312,448 | | | | 556,832 | |
Custodian fees (Note 4) | | | 18,616 | | | | 77,653 | |
Reports to shareholders | | | 8,213 | | | | 31,453 | |
Registration and filing fees | | | 39,869 | | | | 57,911 | |
Professional fees | | | 31,393 | | | | 43,502 | |
Trustees’ fees and expenses | | | 7,280 | | | | 25,226 | |
Other | | | 8,807 | | | | 17,121 | |
| | | | |
Total expenses | | | 2,335,464 | | | | 8,292,067 | |
Expense reductions (Note 4) | | | (63 | ) | | | (891 | ) |
Expenses waived/paid by affiliates (Note 3f and 3g) | | | (331,515 | ) | | | — | |
| | | | |
Net expenses | | | 2,003,886 | | | | 8,291,176 | |
| | | | |
Net investment income (loss) | | | (469,275 | ) | | | 19,476,426 | |
| | | | |
Realized and unrealized gains (losses): | | | | | | | | |
Net realized gain (loss) from: | | | | | | | | |
Investments: | | | | | | | | |
Unaffiliated issuers. | | | 33,991,745 | | | | 47,567,566 | |
Non-controlled affiliates (Note 3f and 8) | | | — | | | | 10,232,321 | |
Foreign currency transactions | | | 99,496 | | | | (13,684 | ) |
| | | | |
Net realized gain (loss) | | | 34,091,241 | | | | 57,786,203 | |
| | | | |
Net change in unrealized appreciation (depreciation) on: | | | | | | | | |
Investments: | | | | | | | | |
Unaffiliated issuers | | | 25,887,560 | | | | 79,817,866 | |
Non-controlled affiliates (Note 3f and 8) | | | — | | | | 18,298,698 | |
Translation of other assets and liabilities denominated in foreign currencies | | | 8,958 | | | | 198,373 | |
| | | | |
Net change in unrealized appreciation (depreciation) | | | 25,896,518 | | | | 98,314,937 | |
| | | | |
Net realized and unrealized gain (loss) | | | 59,987,759 | | | | 156,101,140 | |
| | | | |
Net increase (decrease) in net assets resulting from operations | | $ | 59,518,484 | | | $ | 175,577,566 | |
| | | | |
| | |
*Foreign taxes withheld on dividends | | $ | 98,203 | | | $ | 1,049,620 | |
| | | | | | |
| franklintempleton.com | | The accompanying notes are an integral part of these financial statements. | Semiannual Report | | | 33 | |
FRANKLIN GLOBAL TRUST
FINANCIAL STATEMENTS
Statements of Changes in Net Assets
| | | | | | | | | | | | | | | | |
| | | Franklin International
Growth Fund | | | Franklin International
Small Cap Growth Fund | |
| | | Six Months Ended
January 31, 2018
(unaudited) | | | Year Ended
July 31, 2017 | | | Six Months Ended
January 31, 2018
(unaudited) | | | Year Ended
July 31, 2017 | |
Increase (decrease) in net assets: | | | | | | | | | | | | | | | | |
Operations: | | | | | | | | | | | | | | | | |
Net investment income (loss) | | $ | (469,275 | ) | | $ | 1,939,134 | | | $ | 19,476,426 | | | $ | 16,874,048 | |
Net realized gain (loss) | | | 34,091,241 | | | | (3,156,816 | ) | | | 57,786,203 | | | | 70,195,707 | |
Net change in unrealized appreciation (depreciation) | | | 25,896,518 | | | | 62,884,538 | | | | 98,314,937 | | | | 240,225,188 | |
| | | | |
Net increase (decrease) in net assets resulting from operations | | | 59,518,484 | | | | 61,666,856 | | | | 175,577,566 | | | | 327,294,943 | |
| | | | |
Distributions to shareholders from: | | | | | | | | | | | | | | | | |
Net investment income: | | | | | | | | | | | | | | | | |
Class A | | | — | | | | (841,402 | ) | | | (9,363,942 | ) | | | (1,425,763 | ) |
Class C | | | — | | | | — | | | | (1,102,389 | ) | | | (25,457 | ) |
Class R | | | (735 | ) | | | (295 | ) | | | (196,983 | ) | | | (24,719 | ) |
Class R6 | | | (390,120 | ) | | | (527,530 | ) | | | (30,175,573 | ) | | | (5,916,833 | ) |
Advisor Class | | | (887,066 | ) | | | (949,579 | ) | | | (45,382,451 | ) | | | (7,468,726 | ) |
Net realized gains: | | | | | | | | | | | | | | | | |
Class A | | | (1,015,228 | ) | | | — | | | | (4,408,619 | ) | | | (10,725,449 | ) |
Class C | | | (152,225 | ) | | | — | | | | (596,849 | ) | | | (1,533,621 | ) |
Class R | | | (5,964 | ) | | | — | | | | (97,175 | ) | | | (283,306 | ) |
Class R6 | | | (750,475 | ) | | | — | | | | (13,385,202 | ) | | | (29,674,221 | ) |
Advisor Class | | | (2,184,169 | ) | | | — | | | | (20,534,372 | ) | | | (45,321,273 | ) |
| | | | |
Total distributions to shareholders | | | (5,385,982 | ) | | | (2,318,806 | ) | | | (125,243,555 | ) | | | (102,399,368 | ) |
| | | | |
Capital share transactions: (Note 2) | | | | | | | | | | | | | | | | |
Class A | | | (101,636,262 | ) | | | (14,875,113 | ) | | | 8,415,748 | | | | (33,815,434 | ) |
Class C | | | 4,294,268 | | | | 687,333 | | | | (540,182 | ) | | | (4,027,645 | ) |
Class R | | | 112,849 | | | | 16,119 | | | | 231,951 | | | | (1,705,023 | ) |
Class R6 | | | 2,565,297 | | | | (75,081,157 | ) | | | (19,792,339 | ) | | | 29,575,056 | |
Advisor Class | | | 13,664,519 | | | | 16,565,815 | | | | 30,721,876 | | | | (194,340,783 | ) |
| | | | |
Total capital share transactions | | | (80,999,329 | ) | | | (72,687,003 | ) | | | 19,037,054 | | | | (204,313,829 | ) |
| | | | |
Net increase (decrease) in net assets | | | (26,866,827 | ) | | | (13,338,953 | ) | | | 69,371,065 | | | | 20,581,746 | |
Net assets: | | | | | | | | | | | | | | | | |
Beginning of period | | | 397,025,264 | | | | 410,364,217 | | | | 1,428,721,203 | | | | 1,408,139,457 | |
| | | | |
End of period | | $ | 370,158,437 | | | $ | 397,025,264 | | | $ | 1,498,092,268 | | | $ | 1,428,721,203 | |
| | | | |
Undistributed net investment income included in net assets: | | | | | | | | | | | | | | | | |
End of period | | $ | — | | | $ | 1,324,424 | | | $ | — | | | $ | 2,798,817 | |
| | | | |
Distributions in excess of net investment income included in net assets: | | | | | | | | | | | | | | | | |
End of period | | $ | (422,772 | ) | | $ | — | | | $ | (63,946,095 | ) | | $ | — | |
| | | | |
| | | | |
| 34 | | Semiannual Report | The accompanying notes are an integral part of these financial statements. | | franklintempleton.com |
FRANKLIN GLOBAL TRUST
Notes to Financial Statements (unaudited)
1. Organization and Significant Accounting Policies
Franklin Global Trust (Trust) is registered under the Investment Company Act of 1940 (1940 Act) as an open-end management investment company, consisting of five separate funds, two of which are included in this report (Funds) and applies the specialized accounting and reporting guidance in U.S. Generally Accepted Accounting Principles (U.S. GAAP). The Funds offer five classes of shares: Class A, Class C, Class R, Class R6 and Advisor Class. Each class of shares may differ by its initial sales load, contingent deferred sales charges, voting rights on matters affecting a single class, its exchange privilege and fees due to differing arrangements for distribution and transfer agent fees. Franklin International Small Cap Growth Fund was closed to new investors with limited exceptions effective June 3, 2013.
The following summarizes the Funds’ significant accounting policies.
a. Financial Instrument Valuation
The Funds’ investments in financial instruments are carried at fair value daily. Fair value is the price that would be received to sell an asset or paid to transfer a liability in an orderly transaction between market participants on the measurement date. The Funds calculate the net asset value (NAV) per share as of 4 p.m. Eastern time each day the New York Stock Exchange (NYSE) is open for trading. Under compliance policies and procedures approved by the Trust’s Board of Trustees (the Board), the Funds’ administrator has responsibility for oversight of valuation, including leading the cross-functional Valuation Committee (VC). The VC provides administration and oversight of the Funds’ valuation policies and procedures, which are approved annually by the Board. Among other things, these procedures allow the Funds to utilize independent pricing services, quotations from securities and financial instrument dealers, and other market sources to determine fair value.
Equity securities listed on an exchange or on the NASDAQ National Market System are valued at the last quoted sale price or the official closing price of the day, respectively. Foreign equity securities are valued as of the close of trading on the foreign stock exchange on which the security is primarily traded, or as of 4 p.m. Eastern time. The value is then converted into its U.S. dollar equivalent at the foreign exchange rate in effect at 4 p.m. Eastern time on the day that the value of the security is determined. Over-the-counter (OTC) securities are
valued within the range of the most recent quoted bid and ask prices. Securities that trade in multiple markets or on multiple exchanges are valued according to the broadest and most representative market. Certain equity securities are valued based upon fundamental characteristics or relationships to similar securities.
Investments in open-end mutual funds are valued at the closing NAV. Investments in time deposits are valued at cost, which approximates fair value.
The Funds have procedures to determine the fair value of financial instruments for which market prices are not reliable or readily available. Under these procedures, the VC convenes on a regular basis to review such financial instruments and considers a number of factors, including significant unobservable valuation inputs, when arriving at fair value. The VC primarily employs a market-based approach which may use related or comparable assets or liabilities, recent transactions, market multiples, book values, and other relevant information for the investment to determine the fair value of the investment. An income-based valuation approach may also be used in which the anticipated future cash flows of the investment are discounted to calculate fair value. Discounts may also be applied due to the nature or duration of any restrictions on the disposition of the investments. Due to the inherent uncertainty of valuations of such investments, the fair values may differ significantly from the values that would have been used had an active market existed. The VC employs various methods for calibrating these valuation approaches including a regular review of key inputs and assumptions, transactional back-testing or disposition analysis, and reviews of any related market activity.
Trading in securities on foreign securities stock exchanges and OTC markets may be completed before 4 p.m. Eastern time. In addition, trading in certain foreign markets may not take place on every Funds’ business day. Occasionally, events occur between the time at which trading in a foreign security is completed and 4 p.m. Eastern time that might call into question the reliability of the value of a portfolio security held by the Fund. As a result, differences may arise between the value of the Funds’ portfolio securities as determined at the foreign market close and the latest indications of value at 4 p.m. Eastern time. In order to minimize the potential for these differences, the VC monitors price movements following the close of trading in foreign stock markets through a series of country specific market proxies (such as baskets of American
| | | | | | |
| franklintempleton.com | | Semiannual Report | | | 35 | |
FRANKLIN GLOBAL TRUST
NOTES TO FINANCIAL STATEMENTS (UNAUDITED)
1. Organization and Significant Accounting Policies (continued)
a. Financial Instrument Valuation (continued)
Depositary Receipts, futures contracts and exchange traded funds). These price movements are measured against established trigger thresholds for each specific market proxy to assist in determining if an event has occurred that may call into question the reliability of the values of the foreign securities held by the Funds. If such an event occurs, the securities may be valued using fair value procedures, which may include the use of independent pricing services.
When the last day of the reporting period is a non-business day, certain foreign markets may be open on those days that the Funds’ NAV is not calculated, which could result in differences between the value of the Funds’ portfolio securities on the last business day and the last calendar day of the reporting period. Any significant security valuation changes due to an open foreign market are adjusted and reflected by the Funds for financial reporting purposes.
b. Foreign Currency Translation
Portfolio securities and other assets and liabilities denominated in foreign currencies are translated into U.S. dollars based on the exchange rate of such currencies against U.S. dollars on the date of valuation. The Funds may enter into foreign currency exchange contracts to facilitate transactions denominated in a foreign currency. Purchases and sales of securities, income and expense items denominated in foreign currencies are translated into U.S. dollars at the exchange rate in effect on the transaction date. Portfolio securities and assets and liabilities denominated in foreign currencies contain risks that those currencies will decline in value relative to the U.S. dollar. Occasionally, events may impact the availability or reliability of foreign exchange rates used to convert the U.S. dollar equivalent value. If such an event occurs, the foreign exchange rate will be valued at fair value using procedures established and approved by the Board.
The Funds do not separately report the effect of changes in foreign exchange rates from changes in market prices on securities held. Such changes are included in net realized and unrealized gain or loss from investments in the Statements of Operations.
Realized foreign exchange gains or losses arise from sales of foreign currencies, currency gains or losses realized between the trade and settlement dates on securities transactions and the
difference between the recorded amounts of dividends, interest, and foreign withholding taxes and the U.S. dollar equivalent of the amounts actually received or paid. Net unrealized foreign exchange gains and losses arise from changes in foreign exchange rates on foreign denominated assets and liabilities other than investments in securities held at the end of the reporting period.
c. Income and Deferred Taxes
It is each Fund’s policy to qualify as a regulated investment company under the Internal Revenue Code. Each Fund intends to distribute to shareholders substantially all of its taxable income and net realized gains to relieve it from federal income and excise taxes. As a result, no provision for U.S. federal income taxes is required.
The Funds may be subject to foreign taxation related to income received, capital gains on the sale of securities and certain foreign currency transactions in the foreign jurisdictions in which the Funds invest. Foreign taxes, if any, are recorded based on the tax regulations and rates that exist in the foreign markets in which the Funds invest. When a capital gain tax is determined to apply, certain or all Funds record an estimated deferred tax liability in an amount that would be payable if the securities were disposed of on the valuation date.
As a result of several court cases, in certain countries across the European Union, certain or all Funds filed additional tax reclaims for previously withheld taxes on dividends earned in those countries (EU reclaims). These additional filings are subject to various administrative proceedings by the local jurisdictions’ tax authorities within the European Union, as well as a number of related judicial proceedings. Income recognized, if any, for EU reclaims is reflected as other income in the Statements of Operations and any related receivable, if any, is reflected as European Union tax reclaims in the Statements of Assets and Liabilities. When uncertainty exists as to the ultimate resolution of these proceedings, the likelihood of receipt of these EU reclaims, and the potential timing of payment, no amounts are reflected in the financial statements. For U.S. income tax purposes, EU reclaims received by the Funds, if any, reduce the amounts of foreign taxes Fund shareholders can use as tax credits in their individual income tax returns.
| | | | |
| 36 | | Semiannual Report | | franklintempleton.com |
FRANKLIN GLOBAL TRUST
NOTES TO FINANCIAL STATEMENTS (UNAUDITED)
Each Fund may recognize an income tax liability related to its uncertain tax positions under U.S. GAAP when the uncertain tax position has a less than 50% probability that it will be sustained upon examination by the tax authorities based on its technical merits. As of January 31, 2018, the each Fund has determined that no tax liability is required in its financial statements related to uncertain tax positions for any open tax years (or expected to be taken in future tax years). Open tax years are those that remain subject to examination and are based on the statute of limitations in each jurisdiction in which the Fund invests.
d. Security Transactions, Investment Income, Expenses and Distributions
Security transactions are accounted for on trade date. Realized gains and losses on security transactions are determined on a specific identification basis. Interest income and estimated expenses are accrued daily. Dividend income is recorded on the ex-dividend date except for certain dividends from securities where the dividend rate is not available. In such cases, the dividend is recorded as soon as the information is received by the Funds. Distributions to shareholders are recorded on the ex-dividend date. Distributable earnings are determined according to income tax regulations (tax basis) and may differ from earnings recorded in accordance with U.S. GAAP. These differences may be permanent or temporary. Permanent differences are reclassified among capital accounts to reflect their tax character. These reclassifications have no impact on net assets or the results of operations. Temporary differences are not reclassified, as they may reverse in subsequent periods.
Common expenses incurred by the Trust are allocated among the Funds based on the ratio of net assets of each Fund to the combined net assets of the Trust. Fund specific expenses are charged directly to the Fund that incurred the expense.
Realized and unrealized gains and losses and net investment income, excluding class specific expenses, are allocated daily to each class of shares based upon the relative proportion of net assets of each class. Differences in per share distributions by class are generally due to differences in class specific expenses.
e. Accounting Estimates
The preparation of financial statements in accordance with U.S. GAAP requires management to make estimates and assumptions that affect the reported amounts of assets and liabilities at the date of the financial statements and the amounts of income and expenses during the reporting period. Actual results could differ from those estimates.
f. Guarantees and Indemnifications
Under the Trust’s organizational documents, its officers and trustees are indemnified by the Trust against certain liabilities arising out of the performance of their duties to the Trust. Additionally, in the normal course of business, the Trust, on behalf of the Funds, enters into contracts with service providers that contain general indemnification clauses. The Trust’s maximum exposure under these arrangements is unknown as this would involve future claims that may be made against the Trust that have not yet occurred. Currently, the Trust expects the risk of loss to be remote.
| | | | | | |
| franklintempleton.com | | Semiannual Report | | | 37 | |
FRANKLIN GLOBAL TRUST
NOTES TO FINANCIAL STATEMENTS (UNAUDITED)
2. Shares of Beneficial Interest
At January 31, 2018, there were an unlimited number of shares authorized (without par value). Transactions in the Funds’ shares were as follows:
| | | | | | | | | | | | | | | | |
| | | Franklin International Growth Fund | | | Franklin International Small Cap Growth Fund | |
| | | | |
| | | Shares | | | Amount | | | Shares | | | Amount | |
| |
| | | | |
| Class A Shares: | | | | | | | | | | | | | | | | |
| Six Months ended January 31, 2018 | | | | | | | | | | | | | | | | |
| Shares sold | | | 4,795,508 | | | $ | 67,915,889 | | | | 555,416 | | | $ | 11,759,211 | |
| Shares issued in reinvestment of distributions | | | 72,096 | | | | 1,010,070 | | | | 684,632 | | | | 13,405,092 | |
| Shares redeemed | | | (12,316,077 | ) | | | (170,562,221 | ) | | | (795,687 | ) | | | (16,748,555 | ) |
| | | | |
| | | | |
| Net increase (decrease) | | | (7,448,473 | ) | | $ | (101,636,262 | ) | | | 444,361 | | | $ | 8,415,748 | |
| | | | |
| Year ended July 31, 2017 | | | | | | | | | | | | | | | | |
| Shares sold | | | 5,449,763 | | | $ | 62,616,764 | | | | 796,265 | | | $ | 14,658,914 | |
| Shares issued in reinvestment of distributions | | | 21,796 | | | | 231,036 | | | | 734,034 | | | | 11,840,007 | |
| Shares redeemed | | | (6,744,103 | ) | | | (77,722,913 | ) | | | (3,387,572 | ) | | | (60,314,355 | ) |
| | | | |
| | | | |
| Net increase (decrease) | | | (1,272,544 | ) | | $ | (14,875,113 | ) | | | (1,857,273 | ) | | $ | (33,815,434 | ) |
| | | | |
| | | | |
| Class C Shares: | | | | | | | | | | | | | | | | |
| Six Months ended January 31, 2018 | | | | | | | | | | | | | | | | |
| Shares sold | | | 371,453 | | | $ | 5,211,392 | | | | 31,843 | | | $ | 659,711 | |
| Shares issued in reinvestment of distributions | | | 11,234 | | | | 152,225 | | | | 83,882 | | | | 1,628,141 | |
| Shares redeemed | | | (77,292 | ) | | | (1,069,349 | ) | | | (136,771 | ) | | | (2,828,034 | ) |
| | | | |
| | | | |
| Net increase (decrease) | | | 305,395 | | | $ | 4,294,268 | | | | (21,046 | ) | | $ | (540,182 | ) |
| | | | |
| Year ended July 31, 2017 | | | | | | | | | | | | | | | | |
| Shares sold | | | 204,694 | | | $ | 2,385,416 | | | | 57,747 | | | $ | 1,034,118 | |
| Shares issued in reinvestment of distributions | | | — | | | | — | | | | 91,654 | | | | 1,467,346 | |
| Shares redeemed | | | (153,658 | ) | | | (1,698,083 | ) | | | (370,069 | ) | | | (6,529,109 | ) |
| | | | |
| | | | |
| Net increase (decrease) | | | 51,036 | | | $ | 687,333 | | | | (220,668 | ) | | $ | (4,027,645 | ) |
| | | | |
| | | | |
| Class R Shares: | | | | | | | | | | | | | | | | |
| Six Months ended January 31, 2018 | | | | | | | | | | | | | | | | |
| Shares sold | | | 7,828 | | | $ | 112,139 | | | | 21,401 | | | $ | 456,074 | |
| Shares issued in reinvestment of distributions | | | 481 | | | | 6,699 | | | | 14,962 | | | | 294,158 | |
| Shares redeemed | | | (428 | ) | | | (5,989 | ) | | | (24,433 | ) | | | (518,281 | ) |
| | | | |
| | | | |
| Net increase (decrease) | | | 7,881 | | | $ | 112,849 | | | | 11,930 | | | $ | 231,951 | |
| | | | |
| Year ended July 31, 2017 | | | | | | | | | | | | | | | | |
| Shares sold | | | 3,773 | | | $ | 43,390 | | | | 29,482 | | | $ | 538,817 | |
| Shares issued in reinvestment of distributions | | | 28 | | | | 295 | | | | 19,026 | | | | 308,025 | |
| Shares redeemed | | | (2,356 | ) | | | (27,566 | ) | | | (144,248 | ) | | | (2,551,865 | ) |
| | | | |
| | | | |
| Net increase (decrease) | | | 1,445 | | | $ | 16,119 | | | | (95,740 | ) | | $ | (1,705,023 | ) |
| | | | |
| | | | |
| 38 | | Semiannual Report | | franklintempleton.com |
FRANKLIN GLOBAL TRUST
NOTES TO FINANCIAL STATEMENTS (UNAUDITED)
| | | | | | | | | | | | | | | | |
| | | Franklin International Growth Fund | | | Franklin International Small Cap Growth Fund | |
| | | | |
| | | Shares | | | Amount | | | Shares | | | Amount | |
| |
| | | | |
| Class R6 Shares: | | | | | | | | | | | | | | | | |
| Six Months ended January 31, 2018 | | | | | | | | | | | | | | | | |
| Shares sold | | | 479,332 | | | $ | 6,957,118 | | | | 754,700 | | | $ | 16,118,842 | |
| Shares issued in reinvestment of distributions | | | 69,963 | | | | 979,475 | | | | 2,208,458 | | | | 43,263,696 | |
| Shares redeemed | | | (394,005 | ) | | | (5,371,296 | ) | | | (3,835,047 | ) | | | (79,174,877 | ) |
| | | | |
| | | | |
| Net increase (decrease) | | | 155,290 | | | $ | 2,565,297 | | | | (871,889 | ) | | $ | (19,792,339 | ) |
| | | | |
| Year ended July 31, 2017 | | | | | | | | | | | | | | | | |
| Shares sold | | | 318,411 | | | $ | 3,760,600 | | | | 5,386,087 | | | $ | 94,671,471 | |
| Shares issued in reinvestment of distributions | | | 44,509 | | | | 473,134 | | | | 2,201,724 | | | | 35,535,834 | |
| Shares redeemed | | | (7,281,023 | ) | | | (79,314,891 | ) | | | (5,555,198 | ) | | | (100,632,249 | ) |
| | | | |
| | | | |
| Net increase (decrease) | | | (6,918,103 | ) | | $ | (75,081,157 | ) | | | 2,032,613 | | | $ | 29,575,056 | |
| | | | |
| Advisor Class Shares: | | | | | | | | | | | | | | | | |
| Six Months ended January 31, 2018 | | | | | | | | | | | | | | | | |
| Shares sold | | | 1,355,720 | | | $ | 19,345,163 | | | | 2,536,269 | | | $ | 53,661,198 | |
| Shares issued in reinvestment of distributions | | | 151,034 | | | | 2,114,473 | | | | 3,054,312 | | | | 59,895,053 | |
| Shares redeemed | | | (555,221 | ) | | | (7,795,117 | ) | | | (3,945,843 | ) | | | (82,834,375 | ) |
| | | | |
| | | | |
| Net increase (decrease) | | | 951,533 | | | $ | 13,664,519 | | | | 1,644,738 | | | $ | 30,721,876 | |
| | | | |
| Year ended July 31, 2017 | | | | | | | | | | | | | | | | |
| Shares sold | | | 2,984,830 | | | $ | 36,087,649 | | | | 7,102,289 | | | $ | 127,985,896 | |
| Shares issued in reinvestment of distributions | | | 6,201 | | | | 65,975 | | | | 3,058,640 | | | | 49,397,037 | |
| Shares redeemed | | | (1,741,768 | ) | | | (19,587,809 | ) | | | (20,925,836 | ) | | | (371,723,716 | ) |
| | | | |
| | | | |
| Net increase (decrease) | | | 1,249,263 | | | $ | 16,565,815 | | | | (10,764,907 | ) | | $ | (194,340,783 | ) |
| | | | |
3. Transactions with Affiliates
Franklin Resources, Inc. is the holding company for various subsidiaries that together are referred to as Franklin Templeton Investments. Certain officers and trustees of the Trust are also officers and/or directors of the following subsidiaries:
| | |
| Subsidiary | | Affiliation |
Franklin Advisers, Inc. (Advisers) | | Investment manager |
Franklin Templeton Institutional, LLC (FT Institutional) | | Investment manager |
Franklin Templeton Services, LLC (FT Services) | | Administrative manager |
Franklin Templeton Distributors, Inc. (Distributors) | | Principal underwriter |
Franklin Templeton Investor Services, LLC (Investor Services) | | Transfer agent |
| | | | | | |
| franklintempleton.com | | Semiannual Report | | | 39 | |
FRANKLIN GLOBAL TRUST
NOTES TO FINANCIAL STATEMENTS (UNAUDITED)
3. Transactions with Affiliates (continued)
a. Management Fees
Franklin International Growth Fund pays an investment management fee to FT Institutional based on the average daily net assets of the Fund as follows:
| | |
| Annualized Fee Rate | | Net Assets |
0.760% | | Up to and including $500 million |
0.740% | | Over $500 million, up to and including $1 billion |
0.720% | | Over $1 billion, up to and including $1.5 billion |
0.700% | | Over $1.5 billion, up to and including $6.5 billion |
0.675% | | Over $6.5 billion, up to and including $11.5 billion |
0.655% | | Over $11.5 billion, up to and including $16.5 billion |
0.635% | | Over $16.5 billion, up to and including $19 billion |
0.615% | | Over $19 billion, up to and including $21.5 billion |
0.600% | | In excess of $21.5 billion |
For the period ended January 31, 2018, the annualized gross effective investment management fee rate was 0.760% of the Fund’s average daily net assets.
Franklin International Small Cap Growth Fund pays an investment management fee to Advisers of 0.950% per year of the average daily net assets of the Fund.
Under a subadvisory agreement, FT Institutional, an affiliate of Advisers, provides subadvisory services to Franklin International Small Cap Growth Fund. The subadvisory fee is paid by Advisers based on the Fund’s average daily net assets, and is not an additional expense of the Fund.
b. Administrative Fees
Under an agreement with FT Institutional and Advisers, FT Services provides administrative services to the Funds. The fee is paid by FT Institutional and Advisers based on each of the Fund’s average daily net assets, and is not an additional expense of the Funds.
c. Distribution Fees
The Board has adopted distribution plans for each share class, with the exception of Class R6 and Advisor Class shares, pursuant to Rule 12b-1 under the 1940 Act. Under the Funds’ Class A reimbursement distribution plans, the Funds reimburse Distributors for costs incurred in connection with the servicing, sale and distribution of each Fund’s shares up to the maximum annual plan rate for each class. Under the Class A reimbursement distribution plans, costs exceeding the maximum for the current plan year cannot be reimbursed in subsequent periods. In addition, under the Funds’ Class C and R compensation distribution plans, the Funds pay Distributors for costs incurred in connection with the servicing, sale and distribution of each Fund’s shares up to the maximum annual plan rate for each class. The plan year, for purposes of monitoring compliance with the maximum annual plan rates, is February 1 through January 31 for each Fund.
| | | | |
| 40 | | Semiannual Report | | franklintempleton.com |
FRANKLIN GLOBAL TRUST
NOTES TO FINANCIAL STATEMENTS (UNAUDITED)
The maximum annual plan rates, based on the average daily net assets, for each class, are as follows:
| | | | | | |
| | | Franklin
International
Growth Fund | | | Franklin
International
Small Cap
Growth Fund |
| | |
| Reimbursement Plans: | | | | | | |
Class A | | | 0.35% | | | 0.35% |
| | |
| Compensation Plans: | | | | | | |
Class C | | | 1.00% | | | 1.00% |
Class R | | | 0.50% | | | 0.50% |
The Board has set the current rate at 0.25% per year for Class A shares, until further notice and approval by the Board.
d. Sales Charges/Underwriting Agreements
Front-end sales charges and contingent deferred sales charges (CDSC) do not represent expenses of the Funds. These charges are deducted from the proceeds of sales of fund shares prior to investment or from redemption proceeds prior to remittance, as applicable. Distributors has advised the Funds of the following commission transactions related to the sales and redemptions of the Funds’ shares for the period:
| | | | | | | | |
| | | Franklin
International
Growth Fund | | | Franklin
International
Small Cap
Growth Fund | |
| | |
Sales charges retained net of commissions paid to unaffiliated brokers/dealers | | | $53,524 | | | | $6,301 | |
CDSC retained | | | $ 1,214 | | | | $ 361 | |
e. Transfer Agent Fees
Each class of shares pays transfer agent fees to Investor Services for its performance of shareholder servicing obligations. Effective November 1, 2017, the fees are based on an annualized asset based fee of 0.02% plus a transaction based fee. Prior to November 1, 2017, the fees were account based fees that varied based on fund or account type. In addition, each class reimburses Investor Services for out of pocket expenses incurred and, except for Class R6, reimburses shareholder servicing fees paid to third parties. These fees are allocated daily based upon their relative proportion of such classes’ aggregate net assets. Class R6 pays Investor Services transfer agent fees specific to that class.
For the period ended January 31, 2018, the Funds paid transfer agent fees as noted in the Statements of Operations of which the following amounts were retained by Investor Services:
| | | | | | | | |
| | | Franklin
International
Growth Fund | | | Franklin
International
Small Cap
Growth Fund | |
Transfer agent fees | | | $211,011 | | | | $233,298 | |
| | | | | | |
| franklintempleton.com | | Semiannual Report | | | 41 | |
FRANKLIN GLOBAL TRUST
NOTES TO FINANCIAL STATEMENTS (UNAUDITED)
3. Transactions with Affiliates (continued)
f. Investments in Affiliated Management Investment Companies
Certain or all Funds invest in one or more affiliated management investment companies for purposes other than exercising a controlling influence over the management or policies. Management fees paid by the Funds are waived on assets invested in the affiliated management investment companies, as noted in the Statements of Operations, in an amount not to exceed the management and administrative fees paid directly or indirectly by each affiliate. Prior to August 1, 2013, the waiver was accounted for as a reduction to management fees. During the period ended January 31, 2018, investments in affiliated management investment companies were as follows:
| | | | | | | | | | | | | | | | | | | | | | | | | | | | | | | | |
| | | Number of
Shares Held
at Beginning
of Period | | | Gross
Additions | | | Gross
Reductions | | | Number of
Shares Held at End
of Period | | | Value at End of Period | | | Dividend
Income | | | Realized
Gain
(Loss) | | | Net Change in
Unrealized
Appreciation
(Depreciation) | |
| | | | | | | | |
| Franklin International Growth Fund | | | | | | | | | | | | | | | | | | | | | | | | | | | | | | | | |
| Non-Controlled Affiliates | | | | | | | | | | | | | | | | | | | | | | | | | | | | | | | | |
Institutional Fiduciary Trust Money Market Portfolio, 0.96% | | | 12,826,423 | | | | 68,961,143 | | | | (58,585,539 | ) | | | 23,202,027 | | | $ | 23,202,027 | | | | $50,543 | | | | $ — | | | | $ — | |
| | | | | | | | | | | | | | | | | | | | |
g. Waiver and Expense Reimbursements
FT Institutional and Investor Services have contractually agreed in advance to waive or limit their respective fees and to assume as their own expense certain expenses otherwise payable by Franklin International Growth Fund so that the expenses (excluding distribution fees, and acquired fund fees and expenses) for Class A, Class C, Class R and Advisor Class of the Fund do not exceed 1.00% and Class R6 does not exceed 0.77% based on the average net assets of each class (other than certain non-routine expenses or costs, including those relating to litigation, indemnification, reorganizations, and liquidations). Prior to December 1, 2017, expenses for Class R6 were limited to 0.82%. Effective February 1, 2018, the expenses (excluding distribution fees, and acquired fund fees and expenses) for each class of the Fund will be limited to 0.86% and Class R6 will be limited to 0.63% based on the average net assets of each class (other than certain non-routine expenses or costs, including those relating to litigation, indemnification, reorganizations, and liquidations) until November 30, 2019. Total expenses waived or paid are not subject to recapture subsequent to the Fund’s fiscal year end.
h. Other Affiliated Transactions
At January 31, 2018, one or more of the funds in Franklin Fund Allocator Series owned 19.1% of Franklin International Small Cap Growth Fund’s outstanding shares.
4. Expense Offset Arrangement
The Funds have entered into an arrangement with their custodian whereby credits realized as a result of uninvested cash balances are used to reduce a portion of the Funds’ custodian expenses. During the period ended January 31, 2018, the custodian fees were reduced as noted in the Statements of Operations.
| | | | |
| 42 | | Semiannual Report | | franklintempleton.com |
FRANKLIN GLOBAL TRUST
NOTES TO FINANCIAL STATEMENTS (UNAUDITED)
5. Income Taxes
For tax purposes, capital losses may be carried over to offset future capital gains, if any. At July 31, 2017, the capital loss carryforwards were as follows:
| | | | |
| | | Franklin
International
Growth Fund | |
| |
Capital loss carryforwards: | | | | |
Short term | | | $ 4,971,133 | |
Long term | | | 15,447,536 | |
| | | | |
Total capital loss carryforwards | | | $20,418,669 | |
| | | | |
At January 31, 2018, the cost of investments and net unrealized appreciation (depreciation) for income tax purposes were as follows:
| | | | | | | | | | | | |
| | | Franklin
International
Growth Fund | | | | | | Franklin
International
Small Cap Growth Fund | |
| |
Cost of investments | | | $253,420,132 | | | | | | | | $1,284,848,811 | |
| | | | |
| | | |
Unrealized appreciation | | | $125,397,993 | | | | | | | | $ 361,085,850 | |
Unrealized depreciation | | | (6,646,277 | ) | | | | | | | (152,356,403 | ) |
| | | | |
Net unrealized appreciation (depreciation) | | | $118,751,716 | | | | | | | | $ 208,729,447 | |
| | | | |
Differences between income and/or capital gains as determined on a book basis and a tax basis are primarily due to differing treatments of foreign currency transactions, passive foreign investment company shares and wash sales.
6. Investment Transactions
Purchases and sales of investments (excluding short term securities) for the period ended January 31, 2018, were as follows:
| | | | | | | | | | | | |
| | | Franklin
International
Growth Fund | | | | | | Franklin
International
Small Cap
Growth Fund | |
| |
Purchases | | | $ 87,129,872 | | | | | | | | $189,008,582 | |
Sales | | | $183,625,526 | | | | | | | | $361,396,959 | |
7. Concentration of Risk
Investing in foreign securities may include certain risks and considerations not typically associated with investing in U.S. securities, such as fluctuating currency values and changing local and regional economic, political and social conditions, which may result in greater market volatility. In addition, certain foreign securities may not be as liquid as U.S. securities.
| | | | | | |
| franklintempleton.com | | Semiannual Report | | | 43 | |
FRANKLIN GLOBAL TRUST
NOTES TO FINANCIAL STATEMENTS (UNAUDITED)
8. Holdings of 5% Voting Securities of Portfolio Companies
The 1940 Act defines “affiliated companies” to include investments in portfolio companies in which a fund owns 5% or more of the outstanding voting securities. During the period ended January 31, 2018, investments in “affiliated companies” were as follows:
| | | | | | | | | | | | | | | | | | | | | | | | | | | | | | | | |
| Name of Issuer | | Number of
Shares Held
at Beginning
of Period | | | Gross
Additions | | | Gross
Reductions | | | Number of
Shares Held
at End of Period | | | Value at End of Period | | | Dividend
Income | | | Realized
Gain (Loss) | | | Net Change in
Unrealized
Appreciation
(Depreciation) | |
| |
| Franklin International Small Cap Growth Fund | | | | | | | | | | | | | | | | | | | | | | | | | |
| Non-Controlled Affiliates | | | | | | | | | | | | | | | | | | | | | | | | | | | | | | | | |
Carpetright PLC | | | 6,064,925 | | | | — | | | | — | | | | 6,064,925 | | | | $ 7,229,403 | | | | $ — | | | | $ — | | | | $(8,374,617) | |
Clarkson PLC | | | 1,798,229 | | | | — | | | | — | | | | 1,798,229 | | | | 80,380,972 | | | | 539,283 | | | | — | | | | 16,985,548 | |
Diana Shipping Inc. | | | 7,909,500 | | | | 118,250 | | | | — | | | | 8,027,750 | | | | 30,505,450 | | | | — | | | | — | | | | (578,831 | ) |
Headlam Group PLC | | | 5,372,888 | | | | — | | | | — | | | | 5,372,888 | | | | 43,840,281 | | | | 544,082 | | | | — | | | | 2,157,031 | |
Irish Residential Properties REIT PLC | | | 28,014,700 | | | | — | | | | (28,014,700 | ) | | | — | | | | — | | | | 827,519 | | | | 10,232,321 | | | | — | |
Lar Espana Real Estate Socimi SA | | | 6,357,210 | | | | — | | | | — | | | | 6,357,210 | | | | 71,897,561 | | | | — | | | | — | | | | 8,109,567 | |
| | | | | | | | | | | | | | | | | | | | |
Total Affiliated Securities (Value is 15.6% of Net Assets) | | | | $233,853,667 | | | | $1,910,884 | | | | $10,232,321 | | | | $18,298,698 | |
| | | | | | | | | | | | | | | | | | | | |
9. Credit Facility
The Funds, together with other U.S. registered and foreign investment funds (collectively, Borrowers), managed by Franklin Templeton Investments, are borrowers in a joint syndicated senior unsecured credit facility totaling $2 billion (Global Credit Facility) which matured on February 9, 2018. This Global Credit Facility provides a source of funds to the Borrowers for temporary and emergency purposes, including the ability to meet future unanticipated or unusually large redemption requests. Effective February 9, 2018, the Borrowers renewed the Global Credit Facility for a one year term, maturing February 8, 2019, for a total of $2 billion.
Under the terms of the Global Credit Facility, the Funds shall, in addition to interest charged on any borrowings made by the Funds and other costs incurred by the Funds, pay their share of fees and expenses incurred in connection with the implementation and maintenance of the Global Credit Facility, based upon their relative share of the aggregate net assets of all of the Borrowers, including an annual commitment fee of 0.15% based upon the unused portion of the Global Credit Facility. These fees are reflected in other expenses in the Statements of Operations. During the period ended January 31, 2018, the Funds did not use the Global Credit Facility.
10. Fair Value Measurements
The Funds follow a fair value hierarchy that distinguishes between market data obtained from independent sources (observable inputs) and the Funds’ own market assumptions (unobservable inputs). These inputs are used in determining the value of the Funds’ financial instruments and are summarized in the following fair value hierarchy:
| | • | | Level 1 – quoted prices in active markets for identical financial instruments |
| | • | | Level 2 – other significant observable inputs (including quoted prices for similar financial instruments, interest rates, prepayment speed, credit risk, etc.) |
| | • | | Level 3 – significant unobservable inputs (including the Funds’ own assumptions in determining the fair value of financial instruments) |
The input levels are not necessarily an indication of the risk or liquidity associated with financial instruments at that level.
| | | | |
| 44 | | Semiannual Report | | franklintempleton.com |
FRANKLIN GLOBAL TRUST
NOTES TO FINANCIAL STATEMENTS (UNAUDITED)
For movements between the levels within the fair value hierarchy, the Funds have adopted a policy of recognizing the transfers as of the date of the underlying event which caused the movement.
A summary of inputs used as of January 31, 2018, in valuing the Funds’ assets carried at fair value, is as follows:
| | | | | | | | | | | | | | | | |
| | | Level 1 | | | Level 2 | | | Level 3 | | | Total | |
| |
| Franklin International Growth Fund | | | | | | | | | | | | | | | | |
Assets: | | | | | | | | | | | | | | | | |
Investments in Securities:a | | | | | | | | | | | | | | | | |
Equity Investments | | $ | 348,969,821 | | | $ | — | | | $ | —b | | | $ | 348,969,821 | |
Short Term Investments | | | 23,202,027 | | | | — | | | | — | | | | 23,202,027 | |
| | | | |
Total Investments in Securities | | $ | 372,171,848 | | | $ | — | | | $ | — | | | $ | 372,171,848 | |
| | | | |
| | | | |
| Franklin International Small Cap Growth Fund | | | | | | | | | | | | | | | | |
Assets: | | | | | | | | | | | | | | | | |
Investments in Securities:a | | | | | | | | | | | | | | | | |
Equity Investments | | $ | 1,460,078,258 | | | $ | — | | | $ | — | | | $ | 1,460,078,258 | |
Short Term Investments | | | — | | | | 33,500,000 | | | | — | | | | 33,500,000 | |
| | | | |
Total Investments in Securities | | $ | 1,460,078,258 | | | $ | 33,500,000 | | | $ | — | | | $ | 1,493,578,258 | |
| | | | |
| | | | | | | | |
aFor detailed categories, see the accompanying Statement of Investments. bIncludes securities determined to have no value at January 31, 2018. |
11. Subsequent Events
The Funds have evaluated subsequent events through the issuance of the financial statements and determined that no events have occurred that require disclosure other than those already disclosed in the financial statements.
Abbreviations
| | |
| Selected Portfolio |
| |
ADR | | American Depositary Receipt |
REIT | | Real Estate Investment Trust |
| | | | | | |
| franklintempleton.com | | Semiannual Report | | | 45 | |
FRANKLIN GLOBAL TRUST
Special Meeting of Shareholders
MEETING OF SHAREHOLDERS: OCTOBER 30, 2017 AND RECONVENED ON DECEMBER 15, 2017 AND DECEMBER 29, 2017
(UNAUDITED)
A Special Meeting of Shareholders of Franklin Global Trust was held at the offices of Franklin Templeton Investments, One Franklin Parkway, San Mateo, California on October 30, 2017 and reconvened on December 15, 2017 and December 29, 2017. The purpose of the meeting was to elect Trustees of Franklin Global Trust and to vote on the following proposals: for each Fund, to approve the use of a “manager of managers” structure whereby the Fund’s investment manager would be able to hire and replace subadvisers without shareholder approval and for each Fund, to approve an amended fundamental investment restriction regarding investments in commodities. At the meeting, (i) the following persons were elected by the shareholders to serve as Trustees of Franklin Global Trust: Harris J. Ashton, Terrence J. Checki, Mary C. Choksi, Edith E. Holiday, Gregory E. Johnson, Rupert H. Johnson, Jr., J. Michael Luttig, Larry D. Thompson, and John B. Wilson and (ii) the proposals to use a “manager of managers” structure and to approve the amended fundamental investment restriction regarding investments in commodities were approved by shareholders of each Fund. No other business was transacted at the meeting.
In connection with the meeting, management is aware that some shareholders received from the proxy solicitor numerous calls and mailings that may have been distracting. Management is taking steps to ensure that, in the future, for any new shareholder meeting solicitations that occur, such activity is not repeated. Management apologizes for any inconvenience that may have been caused as a result of such calls and mailings.
The results of the voting at the meeting are as follows:
Proposal 1. To elect a Board of Trustees:
| | | | | | | | |
| Name | | For | | | Withheld | |
| | |
Harris J. Ashton | | | 123,597,479.00 | | | | 3,571,398.00 | |
Terrence J. Checki | | | 123,690,572.00 | | | | 3,478,306.00 | |
Mary C. Choksi | | | 123,243,714.00 | | | | 3,925,163.00 | |
Edith E. Holiday | | | 121,178,523.00 | | | | 5,990,354.00 | |
Gregory E. Johnson | | | 123,694,217.00 | | | | 3,474,660.00 | |
Rupert H. Johnson, Jr. | | | 123,621,068.00 | | | | 3,547,808.00 | |
J. Michael Luttig | | | 123,705,401.00 | | | | 3,463,476.00 | |
Larry D. Thompson | | | 123,162,505.00 | | | | 4,006,372.00 | |
John B. Wilson | | | 123,573,690.00 | | | | 3,595,187.00 | |
|
Total Trust Shares Outstanding*: 162,995,191 | |
* As of the record date.
| | | | |
| 46 | | Semiannual Report | | franklintempleton.com |
FRANKLIN GLOBAL TRUST
SPECIAL MEETING OF SHAREHOLDERS
| Proposal 2. | To approve the use of a “manager of managers” structure whereby the Fund’s investment manager would be able to hire and replace subadvisers without shareholder approval: |
| | | | |
| Franklin International Growth Fund | | | | |
| |
| | | Shares | |
| |
For | | | 22,171,821 | |
Against | | | 124,536 | |
Abstain | | | 85,062 | |
Broker Non-Votes | | | 2,702,652 | |
Total Fund Shares Voted | | | 25,084,068 | |
Total Fund Shares Outstanding* | | | 29,790,993 | |
| |
| Franklin International Small Cap Growth Fund | | | | |
| |
| | | Shares | |
| |
For | | | 46,371,981 | |
Against | | | 2,229,613 | |
Abstain | | | 764,799 | |
Broker Non-Votes | | | 10,292,879 | |
Total Fund Shares Voted | | | 59,659,273 | |
Total Fund Shares Outstanding* | | | 68,785,113 | |
| Proposal 3. | To approve an amended fundamental investment restriction regarding investments in commodities: |
Franklin International Growth Fund
| | | | |
| | | Shares | |
| |
For | | | 22,194,974 | |
Against | | | 96,103 | |
Abstain | | | 90,339 | |
Broker Non-Votes | | | 2,702,652 | |
Total Fund Shares Voted | | | 25,084,068 | |
Total Fund Shares Outstanding* | | | 29,790,993 | |
| |
| Franklin International Small Cap Growth Fund | | | | |
| |
| | | Shares | |
| |
For | | | 46,262,794 | |
Against | | | 2,331,293 | |
Abstain | | | 772,307 | |
Broker Non-Votes | | | 10,292,879 | |
Total Fund Shares Voted | | | 59,659,273 | |
Total Fund Shares Outstanding* | | | 68,785,113 | |
| | | | | | |
| franklintempleton.com | | Semiannual Report | | | 47 | |
FRANKLIN GLOBAL TRUST
Shareholder Information
Proxy Voting Policies and Procedures
The Trust’s investment manager has established Proxy Voting Policies and Procedures (Policies) that the Trust uses to determine how to vote proxies relating to portfolio securities. Shareholders may view the Trust’s complete Policies online at franklintempleton.com. Alternatively, shareholders may request copies of the Policies free of charge by calling the Proxy Group collect at (954) 527-7678 or by sending a written request to: Franklin Templeton Companies, LLC, 300 S.E. 2nd Street, Fort Lauderdale, FL 33301, Attention: Proxy Group. Copies of the Trust’s proxy voting records are also made available online at franklintempleton.com and posted on the US Securities and Exchange Commission’s website at sec.gov and reflect the most recent 12-month period ended June 30.
Quarterly Statement of Investments
The Trust files a complete statement of investments with the US Securities and Exchange Commission for the first and third quarters for each fiscal year on Form N-Q. Shareholders may view the filed Form N-Q by visiting the Commission’s website at sec.gov. The filed form may also be viewed and copied at the Commission’s Public Reference Room in Washington, DC. Information regarding the operations of the Public Reference Room may be obtained by calling (800) SEC-0330.
| | | | |
| 48 | | Semiannual Report | | franklintempleton.com |
| | | | |
| | | | Semiannual Report and Shareholder Letter Franklin Global Trust Investment Managers Franklin Advisers, Inc. Franklin Templeton Institutional, LLC Subadvisor Franklin Templeton Institutional, LLC Distributor Franklin Templeton Distributors, Inc. (800) DIAL BEN® / 342-5236 franklintempleton.com Shareholder Services (800) 632-2301 |
Authorized for distribution only when accompanied or preceded by a summary prospectus and/or prospectus. Investors should carefully consider a fund’s investment goals, risks, charges and expenses before investing. A prospectus contains this and other information; please read it carefully before investing.
To help ensure we provide you with quality service, all calls to and from our service areas are monitored and/or recorded.
.
| | |
| © 2018 Franklin Templeton Investments. All rights reserved. | | FGT3 S 03/18 |
| | |
| | | Semiannual Report January 31, 2018 |
| | | | |
| | | | |
| | | | |
| | | Franklin Emerging Market Debt Opportunities Fund |
| | | | |
| | A SERIES OF FRANKLIN GLOBAL TRUST |
| | | | |
| | | | |
| | | | |
|
|
|
| | | | |

Franklin Templeton Investments
Why choose Franklin Templeton Investments?
Successful investing begins with ambition. And achievement only comes when you reach for it. That’s why we continually strive to deliver better outcomes for investors. No matter what your goals are, our deep, global investment expertise allows us to offer solutions that can help.
During our more than 70 years of experience, we’ve managed through all kinds of markets—up, down and those in between. We’re always preparing for what may come next. It’s because of this, combined with our strength as one of the world’s largest asset managers that we’ve earned the trust of millions of investors around the world.
Contents
Semiannual Report
Visit ftinstitutional.com for fund updates, to access your account, or to find investment insights.
| | | | | | | | |
| Not FDIC Insured | May Lose Value | No Bank Guarantee |
| | | | | | |
| ftinstitutional.com | | Not part of the semiannual report | | | 1 | |
Semiannual Report
Franklin Emerging Market Debt Opportunities Fund
We are pleased to bring you Franklin Emerging Market Debt Opportunities Fund’s semiannual report for the period ended January 31, 2018.
Your Fund’s Goal and Main Investments
The Fund seeks high total return through investing at least 80% of its net assets in debt securities of emerging market countries—mainly securities issued by sovereign and subsovereign government entities, but also including securities issued by corporate entities that are controlled by a sovereign entity, and corporate emerging markets debt.
Performance Overview
The Fund delivered a +6.18% cumulative total return for the six months under review. In comparison, the Fund’s first benchmark, the J.P. Morgan (JPM) Emerging Markets Bond Index (EMBI) Global Diversified Index, which tracks total returns for U.S. dollar-denominated debt instruments issued by emerging market sovereign and quasi-sovereign entities, generated a total return of +2.92%,1 and the Fund’s second benchmark, the JPM Government Bond Index-Emerging Markets (GBI-EM) Broad Diversified Index (US$ Unhedged), which tracks local currency bonds issued in emerging markets, produced a +5.98% total return.2 Also for comparison, the Fund’s third benchmark, the ICE Bank of America Merrill Lynch (BofAML) Emerging Markets Corporate Plus Index (EMCB) (100% US$ Hedged), which tracks the performance of U.S. dollar-denominated and euro-denominated emerging market non-sovereign debt publicly issued within the major domestic and Eurobond markets, posted a +1.77% total return.1 You can find more of the Fund’s performance data in the Performance Summary beginning on page 6.
Performance data represent past performance, which does not guarantee future results. Investment return and principal value will fluctuate, and you may have a gain or loss when you sell your shares. Current performance may differ from figures shown. For most recent month-end performance, go to
Portfolio Composition*
Based on Total Net Assets as of 1/31/18
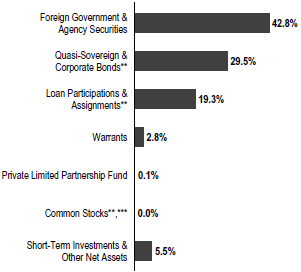
*Figures reflect certain derivatives held in the portfolio (or their underlying reference assets) and may not total 100% or may be negative due to rounding, use of derivatives, unsettled trades or other factors.
**Includes securities determined to have no value at 1/31/18.
***Rounds to less than 0.1%.
ftinstitutional.com or call a Franklin Templeton Institutional Services representative at (800) 321-8563.
Economic and Market Overview
Emerging market (EM) debt benefited from what we considered a benign economic backdrop for most of the six months under review. The world economy accelerated during the reporting period. US gross domestic product (GDP) expanded 2017, despite a slow fourth quarter. The US unemployment rate fell to 4.1%.3 This decline allowed the Federal Reserve to increase its target range for the federal funds rate 0.25% to 1.25%–1.50% in December, its third hike of 2017. Ten-year US Treasury yields remained stable for most of the review period, however, which made for a flatter US yield
1. Source: Morningstar.
2. Source: J.P. Morgan.
The indexes are unmanaged and include reinvested interest. They do not reflect any fees, expenses or sales charges. One cannot invest directly in an index and an index is not representative of the Fund’s portfolio.
3. Source: US Bureau of Labor Statistics.
See www.franklintempletondatasources.com for additional data provider information.
The dollar value, number of shares or principal amount, and names of all portfolio holdings are listed in the Fund’s Consolidated Statement of
Investments (SOI). The Consolidated SOI begins on page 10.
| | | | |
| 2 | | Semiannual Report | | ftinstitutional.com |
FRANKLIN EMERGING MARKET DEBT OPPORTUNITIES FUND
curve. Only after the beginning of 2018 did the 10-year US Treasury yield increase, to peak at 2.71% at the end of January 2018, its highest level since early 2014.
Commodity prices generally rose as a result of this healthy economic backdrop, which boosted many emerging markets. In November, a meeting of the Organization of the Petroleum Exporting Countries, extended the supply cuts it had enacted in 2016. Continued tension between Saudi Arabia and Iran, lower oil reserves and the possibility of lower supplies from Venezuela also helped to lift prices. But faster-than-expected production increases in the US kept prices from rising too quickly. Brent crude oil, for example, ended January 2018 at US$68.89 per barrel.
Emerging markets’ economies themselves also performed well during the six months under review. China reported moderate economic growth for 2017, while India and Indonesia enacted important economic reforms. In Latin America, lower interest rates helped restore economic confidence in Brazil, Chile and Argentina. Recovery in the European Union, which grew at its fastest rate in a decade, helped Central Europe’s emerging economies.
Political and geopolitical tension continued to affect some emerging markets, such as Venezuela and South Africa. But other emerging markets, such as Russia, Turkey and Angola, delivered economic performances that seemed to defy their political troubles.
EM debt delivered solid returns during the period, helped by generally lower benchmark yields and narrower spreads. US tax reform and looser fiscal policy led to a weaker US dollar toward the period-end, which boosted EM currencies and returns from EM local-currency debt.
Hard currency-denominated EM sovereign bonds returned +2.92% during the period, as measured by the JPM EMBI Global Diversified Index (EMBIGD).1 US 10-year Treasury yields rose 41 basis points (bps) during the six months under review, after a notable spike in January. However, over those same six months, the EMBIGD’s spread over US Treasuries also fell 40 bps, on a yield-to-worst basis. Local-currency sovereign EM bonds returned a +5.98% return, as measured by the JPM GBI-EM Broad Diversified Index (US$ Unhedged).2 Local-currency yields fell just three bps during the review period, but EM currencies strengthened significantly, relative to the weaker US dollar. US dollar- and euro-denominated EM corporate bonds returned +1.77%, as measured by the ICE BofAML EMCB Index (100% US$ Hedged).1
Geographic Composition*
1/31/18
| | | | |
| Country | | % of Total Net Assets | |
Ukraine | | | 7.9% | |
Iraq | | | 6.4% | |
South Africa | | | 5.4% | |
Colombia | | | 4.7% | |
Mexico | | | 4.0% | |
Turkey | | | 4.0% | |
Brazil | | | 3.7% | |
Nigeria | | | 3.7% | |
Uruguay | | | 3.7% | |
Argentina | | | 3.5% | |
Angola | | | 3.5% | |
Russia | | | 3.0% | |
Azerbaijan | | | 3.0% | |
Chad | | | 2.8% | |
El Salvador | | | 2.7% | |
Armenia | | | 2.6% | |
Georgia | | | 2.4% | |
Ghana | | | 2.3% | |
Tunisia | | | 2.1% | |
Cameroon | | | 1.8% | |
Venezuela | | | 1.8% | |
Ethiopia | | | 1.7% | |
Gabon | | | 1.7% | |
Kazakhstan | | | 1.6% | |
Kenya | | | 1.6% | |
Other | | | 14.3% | |
Short-Term Investments & Other Net Assets** | | | 4.1% | |
*Figures reflect certain derivatives held in the portfolio (or their underlying reference assets) and may not total 100% or may be negative due to rounding, use of any derivatives, unsettled trades or other factors. May differ from the Consolidated SOI because percentages reflect the issuing country of the Fund’s long-term securities and include the effect of interest receivable balances.
**Short-term securities denominated in US Dollar.
Investment Strategy
Our portfolio construction process can be summarized in three integral steps—country allocation, currency allocation and issue selection. The first stage of our emerging market debt investment process is identifying the countries for which we have a favorable outlook, which we manage with a bottom-up, research-driven perspective. Since the portfolio is constructed through bottom-up, fundamental research and not relative to a benchmark index, there is no requirement to hold issues from any one country. The next decision is whether to take exposure in the form of “hard currency” or local currency instruments. Hard currencies are typically currencies of economically and politically stable industrialized nations. The last decision
| | | | | | |
| ftinstitutional.com | | Semiannual Report | | | 3 | |
FRANKLIN EMERGING MARKET DEBT OPPORTUNITIES FUND
concerns security selection. This depends on a number of factors, including the type of the issue’s coupon (fixed or floating).
Manager’s Discussion
During the reporting period, the Fund’s position in Salvadoran government bonds, denominated in US dollars, was a major contributor to performance, as El Salvador’s political and economic situation continued to improve. We feel that unlike his predecessor, newly elected president Lenín Moreno has been adept at bridging divisions with the country’s right-wing political parties. At the same time, Ecuador’s economic growth continued to accelerate. At the end of November, the International Monetary Fund (IMF) suggested that it might have to raise its growth projections for the country.
Currency Composition*
1/31/18
| | | | |
| | | % of Total Net Assets | |
US Dollar | | | 72.1% | |
Colombian Peso | | | 3.7% | |
South African Rand | | | 3.7% | |
Uruguayan Peso | | | 3.7% | |
Mexican Peso | | | 3.4% | |
Turkish Lira | | | 3.0% | |
Russian Ruble | | | 2.3% | |
Ghanaian Cedi | | | 1.9% | |
Kenyan Shilling | | | 1.6% | |
Egyptian Pound | | | 1.1% | |
Peruvian Nuevo Sol | | | 1.1% | |
Georgian Lari | | | 1.1% | |
Ugandan Shilling | | | 1.1% | |
Azerbaijan Manat | | | 0.4% | |
Brazilian Real | | | 0.1% | |
Japanese Yen | | | -0.1% | |
Euro | | | -0.2% | |
*Figures reflect certain derivatives held in the portfolio (or their underlying reference assets) and may not total 100% or may be negative due to rounding, use of derivatives, unsettled trades or other factors. Percentages may differ from the Consolidated SOI due to the underlying currency exposure on pass-through notes and currency forward contracts and include the effect of interest receivable balances.
The Fund’s position in US dollar-denominated Venezuelan oil warrants also contributed to returns. Despite a delay in payments in late 2017 as a result of Venezuela’s economic and
political crisis, the full amounts due on these warrants were paid out to investors. The warrants also benefited from generally higher oil prices during the six months under review.
Top 10 Holdings*
1/31/18
| | | | |
| Issue | | % of Total | |
| Sector, Country | | Net Assets | |
Government of Iraq** Foreign Government and Agency Securities, Iraq | |
| 4.5%
|
|
Government of South Africa Foreign Government and Agency Securities, South Africa | |
| 3.7%
|
|
Government of Uruguay Foreign Government and Agency Securities, Uruguay | |
| 3.7%
|
|
Development Bank of South Africa (Government of Angola) Loan Participations and Assignments, Angola | | | 3.5% | |
Government of Turkey Foreign Government and Agency Securities, Turkey | |
| 3.0%
|
|
Societe des Hydrocarbures du Tchad Loan Participations and Assignments, Chad | |
| 2.8%
|
|
Government of El Salvador Foreign Government and Agency Securities, El Salvador | |
| 2.7%
|
|
Government of Mexico Foreign Government and Agency Securities, Mexico | |
| 2.5%
|
|
SSB No. 1 PLC (OJSC State Savings Bank of Ukraine) Loan Participations and Assignments, Ukraine | |
| 2.2%
|
|
Government of Russia Foreign Government and Agency Securities, Russia | |
| 2.2%
|
|
*May differ from the Consolidated SOI because percentages include the effect of interest receivable balances.
**Includes loan participations and assignments.
In contrast, the Fund’s position in US-dollar bonds issued by the government of Venezuela was a major detractor from returns. Despite Venezuela’s stated wish to restructure its external sovereign debt, the country’s Office of Public Credit claimed in November that it had started paying coupons on two bonds due in October. However, it made no such announcements on other bonds, and when a subsequent 30-day notice period expired without payment, an event of default occurred.
The Fund’s participation in a loan to Société des Hydrocarbures du Tchad (SHT) also detracted from performance. Talks to restructure more than US$1 billion that Chad owes to trading firm Glencore stalled in late 2017. This setback threatened to delay the release of loans to Chad that the IMF had earlier approved. In addition, SHT instructed oil company Exxon to pay royalties to Chad in cash, breaking its contract to deliver these to Glencore in kind, which led to a lower valuation of the Fund’s position as well.
| | | | |
| 4 | | Semiannual Report | | ftinstitutional.com |
FRANKLIN EMERGING MARKET DEBT OPPORTUNITIES FUND
As of period-end, the Fund had exposure to 39 emerging markets and one supranational. The largest single country exposure was to Ukraine (7.9% of total net assets), followed by Iraq (6.4%) and South Africa (5.4%). Securities denominated in G7 currencies constituted 70.1% of total net assets, with 64.5% denominated in the US dollar, 4.3% in the Japanese yen and 1.3% in the euro. At the end of the review period, the Fund’s exposures to the euro and the Japanese yen were fully hedged back into the US dollar. In addition, 28.5% of total net assets were denominated in 14 local currencies, of which the largest currency exposure was to the Colombian peso at 3.7% of total net assets.
We thank you for your confidence in Franklin Emerging Market Debt Opportunities Fund and hope to serve your investment needs at the highest level of expectations.
| | |

| | 
William Ledward Portfolio Manager and Research Analyst of Franklin Templeton Investment Management Limited (FTIML) |
| | |
 | | 
Nicholas Hardingham, CFA Portfolio Manager and Research Analyst of FTIML |
| |
| | Stephanie Ouwendijk, CFA Portfolio Manager and Research Analyst of FTIML Portfolio Management Team |
The foregoing information reflects our analysis, opinions and portfolio holdings as of January 31, 2018, the end of the reporting period. The way we implement our main investment strategies and the resulting portfolio holdings may change depending on factors such as market and economic conditions. These opinions may not be relied upon as investment advice or an offer for a particular security. The information is not a complete analysis of every aspect of any market, country, industry, security or the Fund. Statements of fact are from sources considered reliable, but the investment manager makes no representation or warranty as to their completeness or accuracy. Although historical performance is no guarantee of future results, these insights may help you understand our investment management philosophy.
CFA® is a trademark owned by CFA Institute.
| | | | | | |
| ftinstitutional.com | | Semiannual Report | | | 5 | |
FRANKLIN EMERGING MARKET DEBT OPPORTUNITIES FUND
Performance Summary as of January 31, 2018
The performance table does not reflect any taxes that a shareholder would pay on Fund dividends, capital gain distributions, if any, or any realized gains on the sale of Fund shares. Total return reflects reinvestment of the Fund’s dividends and capital gain distributions, if any, and any unrealized gains or losses. Your dividend income will vary depending on dividends or interest paid by securities in the Fund’s portfolio, adjusted for operating expenses. Capital gain distributions are net profits realized from the sale of portfolio securities.
Performance as of 1/31/181
| | | | | | | | |
| | | Cumulative | | | Average Annual | |
| | | | Total Return2 | | | | Total Return | 3 |
| | |
6-Month | | | +6.18% | | | | +6.18% | |
1-Year | | | +11.72% | | | | +11.72% | |
5-Year | | | +23.33% | | | | +4.28% | |
10-Year | | | +95.01% | | | | +6.91% | |
Performance data represent past performance, which does not guarantee future results. Investment return and principal value will fluctuate, and you may have a gain or loss when you sell your shares. Current performance may differ from figures shown. For most recent month-end performance, go to ftinstitutional.com or call a Franklin Templeton Institutional Services representative at (800) 321-8563.
See page 7 for Performance Summary footnotes.
| | | | |
| 6 | | Semiannual Report | | ftinstitutional.com |
FRANKLIN EMERGING MARKET DEBT OPPORTUNITIES FUND
PERFORMANCE SUMMARY
Distributions (8/1/17–1/31/18)
| | | | | | | | |
Net Investment Income | | Long-Term Capital Gain | | | Total | |
$0.4665 | | | $0.0340 | | | | $0.5005 | |
Total Annual Operating Expenses4
| | | | |
| | | With Waiver | | Without Waiver |
| | | 1.01% | | 1.10% |
All investments involve risks, including possible loss of principal. Special risks are associated with foreign investing including currency volatility, economic instability, and social and political developments of countries where the Fund invests. Investments in emerging markets involve heightened risks related to the same factors, in addition to those associated with these markets’ smaller size, lesser liquidity and lack of established legal, political, business and social frameworks to support securities markets. The risks associated with higher yielding, lower rated securities include higher risk of default and loss of principal. In addition, interest rate movements will affect the Fund’s share price and yield. Prices of debt securities generally move in the opposite direction of interest rates. Thus, as prices of debt securities in the Fund adjust to a rise in interest rates, the Fund’s share price may decline. The Fund is actively managed but there is no guarantee that the manager’s investment decisions will produce the desired results. The Fund’s prospectus also includes a description of the main investment risks.
1. The Fund has an expense reduction, a waiver related to the management fee paid by a Fund subsidiary and a fee waiver associated with any investments it makes in a Franklin Templeton money fund and/or other Franklin Templeton fund, contractually guaranteed through 11/30/18. Fund investment results reflect the expense reduction and fee waivers; without these reductions, the results would have been lower.
2. Cumulative total return represents the change in value of an investment over the periods indicated.
3. Average annual total return represents the average annual change in value of an investment over the periods indicated. Return for less than one year, if any, has not been annualized.
4. Figures are as stated in the Fund’s current prospectus and may differ from the expense ratios disclosed in the Your Fund’s Expenses and Consolidated Financial Highlights sections in this report. In periods of market volatility, assets may decline significantly, causing total annual Fund operating expenses to become higher than the figures shown.
| | | | | | |
| ftinstitutional.com | | Semiannual Report | | | 7 | |
FRANKLIN EMERGING MARKET DEBT OPPORTUNITIES FUND
Your Fund’s Expenses
As a Fund shareholder, you can incur two types of costs: (1) transaction costs, including sales charges (loads) on Fund purchases and redemptions, if applicable; and (2) ongoing Fund costs, including management fees, distribution and service (12b-1) fees, if applicable, and other Fund expenses. All mutual funds have ongoing costs, sometimes referred to as operating expenses. The table below shows ongoing costs of investing in the Fund and can help you understand these costs and compare them with those of other mutual funds. The table assumes a $1,000 investment held for the six months indicated.
Actual Fund Expenses
The table below provides information about actual account values and actual expenses in the columns under the heading “Actual.” In these columns the Fund’s actual return, which includes the effect of Fund expenses, is used to calculate the “Ending Account Value.” You can estimate the expenses you paid during the period by following these steps (of course, your account value and expenses will differ from those in this illustration): Divide your account value by $1,000 (if your account had an $8,600 value, then $8,600 ÷ $1,000 = 8.6). Then multiply the result by the number in the row for your class of shares under the headings “Actual” and “Expenses Paid During Period” (if Actual Expenses Paid During Period were $7.50, then 8.6 x $7.50 = $64.50). In this illustration, the actual expenses paid this period are $64.50.
Hypothetical Example for Comparison with Other Funds
Under the heading “Hypothetical” in the table, information is provided about hypothetical account values and hypothetical expenses based on the Fund’s actual expense ratio and an assumed rate of return of 5% per year before expenses, which is not the Fund’s actual return. This information may not be used to estimate the actual ending account balance or expenses you paid for the period, but it can help you compare ongoing costs of investing in the Fund with those of other funds. To do so, compare this 5% hypothetical example for the class of shares you hold with the 5% hypothetical examples that appear in the shareholder reports of other funds.
Please note that expenses shown in the table are meant to highlight ongoing costs and do not reflect any transactional costs. Therefore, information under the heading “Hypothetical” is useful in comparing ongoing costs only, and will not help you compare total costs of owning different funds. In addition, if transactional costs were included, your total costs would have been higher.
| | | | | | | | | | |
| | | Actual
(actual return after expenses) | | Hypothetical
(5% annual return before expenses) | | |
Beginning Account Value 8/1/17 | | Ending
Account
Value 1/31/18 | | Expenses
Paid During
Period
8/1/17–1/31/181,2 | | Ending
Account
Value 1/31/18 | | Expenses
Paid During
Period
8/1/17–1/31/181,2 | | Net
Annualized
Expense
Ratio2 |
| $1,000 | | $1,061.80 | | $5.20 | | $1,020.16 | | $5.09 | | 1.00% |
1. Expenses are equal to the annualized expense ratio for the six-month period as indicated above—in the far right column—multiplied by the simple average account value over the period indicated, and then multiplied by 184/365 to reflect the one-half year period.
2. Reflects expenses after fee waivers and expense reimbursements. Does not include acquired fund fees and expenses.
| | | | |
| 8 | | Semiannual Report | | ftinstitutional.com |
FRANKLIN GLOBAL TRUST
Consolidated Financial Highlights
Franklin Emerging Market Debt Opportunities Fund
| | | | | | | | | | | | | | | | | | | | | | | | |
| | | Six Months Ended
January 31, 2018 (unaudited) | | | Year Ended July 31, | |
| | | | 2017 | | | 2016 | | | 2015 | | | 2014 | | | 2013 | |
| |
| | | | | | |
Per share operating performance
(for a share outstanding throughout the period) | | | | | | | | | | | | | | | | | | | | | | | | |
| | | | | | |
Net asset value, beginning of period | | | $11.68 | | | | $10.76 | | | | $10.72 | | | | $12.35 | | | | $12.06 | | | | $12.33 | |
| | | | |
| | | | | | |
| Income from investment operationsa: | | | | | | | | | | | | | | | | | | | | | | | | |
| | | | | | |
Net investment income | | | 0.47 | | | | 0.83 | | | | 0.89 | | | | 0.87 | | | | 0.87 | | | | 0.83 | |
| | | | | | |
Net realized and unrealized gains (losses) | | | 0.25 | | | | 0.17 | | | | (0.26) | | | | (1.53) | | | | 0.04 | | | | (0.04) | |
| | | | |
| | | | | | |
Total from investment operations | | | 0.72 | | | | 1.00 | | | | 0.63 | | | | (0.66) | | | | 0.91 | | | | 0.79 | |
| | | | |
| | | | | | |
| Less distributions from: | | | | | | | | | | | | | | | | | | | | | | | | |
| | | | | | |
Net investment income | | | (0.47) | | | | — | | | | (0.59) | | | | (0.91) | | | | (0.58) | | | | (0.89) | |
| | | | | | |
Net realized gains | | | (0.03) | | | | (0.08) | | | | — | | | | (0.06) | | | | (0.04) | | | | (0.17) | |
| | | | |
| | | | | | |
Total distributions | | | (0.50) | | | | (0.08) | | | | (0.59) | | | | (0.97) | | | | (0.62) | | | | (1.06) | |
| | | | |
| | | | | | |
Net asset value, end of period | | | $11.90 | | | | $11.68 | | | | $10.76 | | | | $10.72 | | | | $12.35 | | | | $12.06 | |
| | | | |
| | | | | | |
Total returnb | | | 6.18% | | | | 9.40% | | | | 6.41% | | | | (5.16)% | | | | 7.82% | | | | 6.40% | |
| | | | | | |
| Ratios to average net assetsc | | | | | | | | | | | | | | | | | | | | | | | | |
| | | | | | |
Expenses before waiver and payments by affiliates | | | 1.08% | | | | 1.07% | | | | 1.06% | | | | 1.05% | | | | 1.10% | | | | 1.07% | |
| | | | | | |
Expenses net of waiver and payments by affiliatesd | | | 1.00% | | | | 1.00% | | | | 1.00% | | | | 1.00% | | | | 1.00% | | | | 1.00% | |
| | | | | | |
Net investment income | | | 7.79% | | | | 7.43% | | | | 8.70% | | | | 7.78% | | | | 7.29% | | | | 6.63% | |
| | | | | | |
| Supplemental data | | | | | | | | | | | | | | | | | | | | | | | | |
| | | | | | |
Net assets, end of period (000’s) | | | $478,539 | | | | $514,406 | | | | $552,835 | | | | $713,575 | | | | $630,597 | | | | $568,794 | |
| | | | | | |
Portfolio turnover rate | | | 6.72% | | | | 29.45% | | | | 21.61% | | | | 17.56% | | | | 29.70% | | | | 30.95% | |
aThe amount shown for a share outstanding throughout the period may not correlate with the Consolidated Statement of Operations for the period due to the timing of sales and repurchases of the Fund’s shares in relation to income earned and/or fluctuating fair value of the investments of the Fund.
bTotal return is not annualized for periods less than one year.
cRatios are annualized for periods less than one year.
dBenefit of expense reduction rounds to less than 0.01%.
| | | | | | |
| ftinstitutional.com | | The accompanying notes are an integral part of these consolidated financial statements. | Semiannual Report | | | 9 | |
FRANKLIN GLOBAL TRUST
Consolidated Statement of Investments, January 31, 2018 (unaudited)
Franklin Emerging Market Debt Opportunities Fund
| | | | | | | | | | | | | | | | | | |
| | | | | Country/
Organization | | | Warrants | | | | | | Value | |
| |
| | | | | |
| | | Warrants 2.8% | | | | | | | | | | | | |
| a,b | | Central Bank of Nigeria, Reg S, wts., 11/15/20 | | | Nigeria | | | | 64,000 | | | | | | | $ | 4,832,000 | |
| b,c,d | | Government of Ukraine, Reg S, VRI, GDP Linked Security, 5/31/40 | | | Ukraine | | | | 7,700,000 | | | | | | | | 5,257,444 | |
| a | | Government of Venezuela, Oil Value Recovery wts., 4/15/20 | | | Venezuela | | | | 925,920 | | | | | | | | 3,472,200 | |
| | | | | | | | | | | | | | | | | | |
| | Total Warrants (Cost $31,791,416) | | | | | | | | | | | | | | | 13,561,644 | |
| | | | | | | | | | | | | | | | | | |
| | | | | |
| | | | | | | |
| Principal
Amount |
* | | | | | | | | |
| | | | | | | | | | | | | | | | | | |
| | | Quasi-Sovereign and Corporate Bonds 29.5% | | | | | | | | | | | | |
| | Banks 4.8% | | | | | | | | | | | | | | | | |
| e,f | | Astana Finance JSC, secured note, 144A, zero cpn., 12/22/24 | | | Kazakhstan | | | | 136,566 | | | | | | | | 1,366 | |
| g | | Bank of Georgia JSC, senior note, 144A, 11.00%, 6/01/20 | | | Georgia | | | | 12,300,000 | | | | GEL | | | | 4,978,443 | |
| g | | Fidelity Bank, senior note, 144A, 10.50%, 10/16/22 | | | Nigeria | | | | 4,800,000 | | | | | | | | 5,048,808 | |
| b,h | | International Bank of Azerbaijan OJSC, senior note, Reg S, 5.625%, 6/11/19 | | | Azerbaijan | | | | 10,500,000 | | | | | | | | 8,602,650 | |
| g | | National Savings Bank, senior note, 144A, 8.875%, 9/18/18 | | | Sri Lanka | | | | 4,000,000 | | | | | | | | 4,123,000 | |
| e,f,h,i | | Sphynx Capital Markets PCC (National Investment Bank of Ghana), PTN, Reg S, zero cpn., 2/05/09 | | | Ghana | | | | 8,000,000 | | | | | | | | — | |
| | | | | | | | | | | | | | | | | | |
| | | | | | | | | | | | | | | | | 22,754,267 | |
| | | | | | | | | | | | | | | | | | |
| | Building Products 1.9% | | | | | | | | | | | | | | | | |
| g | | St. Marys Cement Inc., senior bond, 144A, 5.75%, 1/28/27 | | | Brazil | | | | 4,100,000 | | | | | | | | 4,320,867 | |
| g | | Tecnoglass Inc., senior note, 144A, 8.20%, 1/31/22 | | | Colombia | | | | 4,400,000 | | | | | | | | 4,708,000 | |
| | | | | | | | | | | | | | | | | | |
| | | | | | | | | | | | | | | | | 9,028,867 | |
| | | | | | | | | | | | | | | | | | |
| | Commercial Services & Supplies 1.0% | | | | | | | | | | | | | | | | |
| b | | Red de Carreteras de Occidente Sapib de CV, senior secured bond, Reg S, 9.00%, 6/10/28 | | | Mexico | | | | 90,000,000 | | | | MXN | | | | 4,648,790 | |
| | | | | | | | | | | | | | | | | | |
| | Construction & Engineering 0.5% | | | | | | | | | | | | | | | | |
| b | | Saderea DAC, senior secured bond, Reg S, 12.50%, 11/30/26 | | | Ghana | | | | 2,022,989 | | | | | | | | 2,288,507 | |
| | | | | | | | | | | | | | | | | | |
| | Diversified Financial Services 3.1% | | | | | | | | | | | | | | | | |
| g,j | | Fideicomiso PA Costera, senior secured bond, B, 144A, Index Linked, 6.25%, 1/15/34 | | | Colombia | | | | 10,411,470,916 | | | | COP | | | | 3,852,005 | |
| g | | O1 Properties Finance PLC, senior note, 144A, 8.25%, 9/27/21 | | | Russia | | | | 5,400,000 | | | | | | | | 4,050,000 | |
| g | | Rio Oil Finance Trust, senior secured bond, 144A, 9.25%, 7/06/24 | | | Brazil | | | | 6,271,184 | | | | | | | | 6,819,912 | |
| | | | | | | | | | | | | | | | | | |
| | | | | | | | | | | | | | | | | 14,721,917 | |
| | | | | | | | | | | | | | | | | | |
| | Diversified Telecommunication Services 3.1% | | | | | | | | | | | | | | | | |
| b | | Empresa de Telecommunicaciones de Bogota SA, senior note, Reg S, 7.00%, 1/17/23. | | | Colombia | | | | 27,200,000,000 | | | | COP | | | | 7,967,258 | |
| g | | MTN (Mauritius) Investments Ltd., senior bond, 144A, 4.755%, 11/11/24 | | | South Africa | | | | 4,000,000 | | | | | | | | 3,986,760 | |
| b,h | | Oi SA, senior note, Reg S, 9.75%, 9/15/16 | | | Brazil | | | | 26,100,000 | | | | BRL | | | | 3,031,264 | |
| | | | | | | | | | | | | | | | | | |
| | | | | | | | | | | | | | | | | 14,985,282 | |
| | | | | | | | | | | | | | | | | | |
| | Food & Staples Retailing 0.7% | | | | | | | | | | | | | | | | |
| g | | JBS Investments GmbH, senior note, 144A, 7.25%, 4/03/24 | | | Brazil | | | | 3,500,000 | | | | | | | | 3,514,857 | |
| | | | | | | | | | | | | | | | | | |
| | Gas Utilities 1.2% | | | | | | | | | | | | | | | | |
| g | | Southern Gas Corridor CJSC, senior note, 144A, 6.875%, 3/24/26 | | | Azerbaijan | | | | 4,900,000 | | | | | | | | 5,615,988 | |
| | | | | | | | | | | | | | | | | | |
| | | | |
| 10 | | Semiannual Report | | ftinstitutional.com |
FRANKLIN GLOBAL TRUST
CONSOLIDATED STATEMENT OF INVESTMENTS (UNAUDITED)
| | | | | | | | | | | | | | | | | | |
Franklin Emerging Market Debt Opportunities Fund (continued) | | | | | | | |
| | | | | Country/ | | | Principal | | | | | | | |
| | | | | Organization | | | | Amount | * | | | | | | | Value | |
| |
| | | | | |
| | | Quasi-Sovereign and Corporate Bonds (continued) | | | | | | | | | | | | |
| | Industrial Conglomerates 0.9% | | | | | | | | | | | | | | | | |
| g | | Yasar Holdings SA, senior note, 144A, 8.875%, 5/06/20 | | | Turkey | | | | 4,400,000 | | | | | | | $ | 4,498,296 | |
| | | | | | | | | | | | | | | | | | |
| | Metals & Mining 2.4% | | | | | | | | | | | | | | | | |
| g | | Ferrexpo Finance PLC, senior note, 144A, 10.375%, 4/07/19 | | | Ukraine | | | | 7,500,000 | | | | | | | | 7,808,887 | |
| g | | Petra Diamonds U.S. Treasury PLC, secured note, second lien, 144A, 7.25%, 5/01/22 | | | South Africa | | | | 3,400,000 | | | | | | | | 3,469,377 | |
| | | | | | | | | | | | | | | | | | |
| | | | | | | | | | | | | | | | | 11,278,264 | |
| | | | | | | | | | | | | | | | | | |
| | Multiline Retail 0.1% | | | | | | | | | | | | | | | | |
| f,k | | K2016470219 South Africa Ltd., senior secured note, 144A, PIK, 3.00%, 12/31/22 | | | South Africa | | | | 4,235,532 | | | | | | | | 126,728 | |
| f,k | | K2016470260 South Africa Ltd., senior secured note, 144A, PIK, 25.00%, 12/31/22 | | | South Africa | | | | 739,060 | | | | | | | | 560,320 | |
| | | | | | | | | | | | | | | | | | |
| | | | | | | | | | | | | | | | | 687,048 | |
| | | | | | | | | | | | | | | | | | |
| | Municipal Bonds 4.6% | | | | | | | | | | | | | | | | |
| b | | Bogota Distrito Capital, senior bond, Reg S, 9.75%, 7/26/28 | | | Colombia | | | | 14,600,000,000 | | | | COP | | | | 5,624,316 | |
| | Province of Salta Argentina, | | | Argentina | | | | 2,250,900 | | | | | | | | 2,391,581 | |
| | gsenior secured note, 144A, 9.50%, 3/16/22 | | | | | | | | | | | | | | | | |
| | bsenior secured note, Reg S, 9.50%, 3/16/22 | | | Argentina | | | | 1,657,663 | | | | | | | | 1,761,267 | |
| g | | Provincia de Neuquen Argentina, senior secured bond, 144A, 8.625%, 5/12/28 | | | Argentina | | | | 9,000,000 | | | | | | | | 9,936,180 | |
| g | | Provincia de Tierra Del Fuego Argentina, senior secured bond, 144A, 8.95%, 4/17/27 | | | Argentina | | | | 2,300,000 | | | | | | | | 2,468,935 | |
| | | | | | | | | | | | | | | | | | |
| | | | | | | | | | | | | | | | | 22,182,279 | |
| | | | | | | | | | | | | | | | | | |
| | Oil, Gas & Consumable Fuels 2.0% | | | | | | | | | | | | | | | | |
| g | | Georgian Oil and Gas Corp JSC, senior note, 144A, 6.75%, 4/26/21 | | | Georgia | | | | 6,000,000 | | | | | | | | 6,448,620 | |
| g | | Petroleum Co. of Trinidad and Tobago Ltd., senior bond, 144A, 6.00%, 5/08/22 | | | Trinidad and Tobago | | | | 3,037,500 | | | | | | | | 3,080,648 | |
| | | | | | | | | | | | | | | | | | |
| | | | | | | | | | | | | | | | | 9,529,268 | |
| | | | | | | | | | | | | | | | | | |
| | Road & Rail 1.6% | | | | | | | | | | | | | | | | |
| g | | Kazakhstan Temir Zholy Finance BV, senior bond, 144A, 6.95%, 7/10/42 | | | Kazakhstan | | | | 6,250,000 | | | | | | | | 7,452,844 | |
| | | | | | | | | | | | | | | | | | |
| | Textiles, Apparel & Luxury Goods 1.1% | | | | | | | | | | | | | | | | |
| g | | Golden Legacy PT Ltd., senior note, 144A, 8.25%, 6/07/21 | | | Indonesia | | | | 5,000,000 | | | | | | | | 5,347,600 | |
| | | | | | | | | | | | | | | | | | |
| | Transportation Infrastructure 0.5% | | | | | | | | | | | | | | | | |
| g | | Mexico City Airport Trust, secured bond, 144A, 5.50%, 7/31/47 | | | Mexico | | | | 2,700,000 | | | | | | | | 2,608,511 | |
| | | | | | | | | | | | | | | | | | |
| | Total Quasi-Sovereign and Corporate Bonds
(Cost $158,338,455) | | | | | | | | | | | | | | | 141,142,585 | |
| | | | | | | | | | | | | | | | | | |
| l | | Loan Participations and Assignments 19.3% | | | | | | | | | | | | | | | | |
| f,h | | Credit Suisse First Boston International, (City of Kyiv), secured bond, Reg S, 8.00%, 11/06/15 | | | Ukraine | | | | 11,975,000 | | | | | | | | 9,520,125 | |
| e,f | | Deutsche Bank AG (Government of Iraq), 2.571%, 1/01/28 | | | Iraq | | | | 831,895,178 | | | | JPY | | | | 5,788,852 | |
| e,f,m | | Development Bank of South Africa Ltd. (Government of Angola), | | | | | | | | | | | | | | | | |
| | Tranche 2, senior note, FRN, 8.032%, (6-month USD LIBOR + 6.25%), 12/20/23 | | | Angola | | | | 8,925,000 | | | | | | | | 8,524,850 | |
| | Tranche 3B, senior note, FRN, 8.032%, (6- month USD LIBOR + 6.25%), 12/20/23 | | | Angola | | | | 8,400,000 | | | | | | | | 8,023,388 | |
| | | | | | |
| ftinstitutional.com | | Semiannual Report | | | 11 | |
FRANKLIN GLOBAL TRUST
CONSOLIDATED STATEMENT OF INVESTMENTS (UNAUDITED)
| | | | | | | | | | | | | | | | | | |
| Franklin Emerging Market Debt Opportunities Fund (continued) | | | | | | | | | | |
| | | |
| Country/
Organization |
| |
| Principal
Amount |
* | | | | | | | Value | |
| |
| l | | Loan Participations and Assignments (continued) | | | | | | | | | | | | |
| g | | Dilijan Finance BV, (Ardshinbank CJSC), senior note, 144A, 12.00%, 7/29/20 | | | Armenia | | | | 6,620,000 | | | | | | | $ | 7,140,994 | |
| e,f,m | | Ethiopian Railway Corp. (Government of Ethiopia), FRN, 5.205%, (6-month USD LIBOR + 3.75%), 8/02/21 | | | Ethiopia | | | | 8,266,667 | | | | | | | | 8,036,592 | |
| b | | FBN Finance Co. BV, (First Bank of Nigeria Ltd.), sub. note, Reg S, 8.00% to 7/23/19, FRN thereafter, 7/23/21 | | | Nigeria | | | | 7,800,000 | | | | | | | | 7,673,250 | |
| a,e,f,k,n | | Global Distressed Alpha Fund III LP, PIK, 12.00%, Perpetual | | | United States | | | | 498,023 | | | | | | | | 498,023 | |
| e,f,m | | Government of Iraq, Tranche A3, Sumitomo Corp. Loan, FRN, 0.563%, (6-month JPY LIBOR + 0.50%), 1/01/28 | | | Iraq | | | | 247,785,175 | | | | JPY | | | | 1,755,190 | |
| e,f,m | | Merrill Lynch & Co. Inc. (Government of Iraq), FRN, 0.563%, (6-month JPY LIBOR + 0.50%), 1/01/28 | | | Iraq | | | | 433,639,066 | | | | JPY | | | | 3,071,689 | |
| e,f,h | | NK Debt Corp.,
144A, zero cpn., 3/12/20 | | | North Korea | | | | 4,250,000 | | | | DEM | | | | — | |
| | Reg S, zero cpn., 3/12/20 | | | North Korea | | | | 2,000,000 | | | | CHF | | | | — | |
| | Reg S, zero cpn., 3/12/20 | | | North Korea | | | | 18,000,000 | | | | DEM | | | | — | |
| g | | Oilflow SPV 1 DAC (Kurdistan Regional Government), secured note, 144A, 12.00%, 1/13/22 | | | Iraq | | | | 9,000,000 | | | | | | | | 9,303,975 | |
| e,f,m | | Societe des Hydrocarbures du Tchad, Tranche 4, FRN, 8.654%, (1-month USD LIBOR + 7.10%), 12/30/22 | | | Chad | | | | 16,478,377 | | | | | | | | 12,807,467 | |
| g | | SSB No. 1 PLC (OJSC State Savings Bank of Ukraine), senior note, 144A, 9.625%, 3/20/25 | | | Ukraine | | | | 9,000,000 | | | | | | | | 10,046,790 | |
| | | | | | | | | | | | | | | | | | |
| | Total Loan Participations and Assignments
(Cost $96,496,526) | | | | | | | | | | | | | | | 92,191,185 | |
| | | | | | | | | | | | | | | | | | |
| | Foreign Government and Agency Securities 42.8% | | | | | | | | | | | | | | | | |
| | Banque Centrale de Tunisie International Bond, senior bond, 4.30%, 8/02/30 | | | Tunisia | | | | 610,000,000 | | | | JPY | | | | 4,545,068 | |
| | senior bond, 4.20%, 3/17/31 | | | Tunisia | | | | 680,000,000 | | | | JPY | | | | 5,079,276 | |
| g | | Government of Armenia, senior note, 144A, 7.15%, 3/26/25 | | | Armenia | | | | 4,500,000 | | | | | | | | 5,173,313 | |
| g | | Government of Belarus International Bond, senior note, 144A, 6.875%, 2/28/23 | | | Belarus | | | | 4,300,000 | | | | | | | | 4,743,416 | |
| b,m | | Government of Bosnia & Herzegovina, senior bond, B, Reg S, FRN, 0.50%, (6-month EUR LIBOR + 0.813%), 12/20/21 | | | Bosnia and Herzegovina | | | | 11,714,000 | | | | DEM | | | | 6,436,506 | |
| g | | Government of Cameroon, senior note, 144A, 9.50%, 11/19/25 | | | Cameroon | | | | 7,300,000 | | | | | | | | 8,670,283 | |
| | Government of Egypt, | | | | | | | | | | | | | | | | |
| | 16.75%, 9/06/19 | | | Egypt | | | | 47,500,000 | | | | EGP | | | | 2,715,337 | |
| | 18.15%, 6/13/20 | | | Egypt | | | | 21,000,000 | | | | EGP | | | | 1,247,819 | |
| | 16.40%, 9/05/20 | | | Egypt | | | | 16,500,000 | | | | EGP | | | | 955,511 | |
| b | | Government of El Salvador, senior bond, Reg S, 7.65%, 6/15/35 | | | El Salvador | | | | 11,500,000 | | | | | | | | 12,686,225 | |
| g | | Government of Gabon, senior note, 144A, 6.95%, 6/16/25 | | | Gabon | | | | 7,800,000 | | | | | | | | 8,080,722 | |
| | Government of Ghana, | | | | | | | | | | | | | | | | |
| | 24.75%, 7/19/21 | | | Ghana | | | | 5,000,000 | | | | GHS | | | | 1,377,723 | |
| | senior note, 18.25%, 7/25/22 | | | Ghana | | | | 29,050,000 | | | | GHS | | | | 7,069,832 | |
| b | | Government of Iraq, Reg S, 5.80%, 1/15/28 | | | Iraq | | | | 11,100,000 | | | | | | | | 10,998,768 | |
| | Government of Jamaica, senior bond, 7.875%, 7/28/45 | | | Jamaica | | | | 4,000,000 | | | | | | | | 4,979,140 | |
| g | | Government of Jordan, senior bond, 144A, 6.125%, 1/29/26 | | | Jordan | | | | 2,300,000 | | | | | | | | 2,399,418 | |
| | Government of Mexico, senior note, M, 5.00%, 12/11/19 | | | Mexico | | | | 2,270,000 | ° | | | MXN | | | | 11,692,514 | |
| | Government of Russia, 7.50%, 3/15/18 | | | Russia | | | | 570,000,000 | | | | RUB | | | | 10,160,027 | |
| | Government of South Africa, senior bond, 7.00%, 2/28/31 | | | South Africa | | | | 240,000,000 | | | | ZAR | | | | 17,132,958 | |
| | Government of Suriname, | | | | | | | | | | | | | | | | |
| | e,f 9.00%, 6/28/19 | | | Suriname | | | | 2,500,000 | | | | | | | | 2,500,000 | |
| | g senior note, 144A, 9.25%, 10/26/26 | | | Suriname | | | | 2,200,000 | | | | | | | | 2,332,000 | |
| | | | |
| 12 | | Semiannual Report | | ftinstitutional.com |
FRANKLIN GLOBAL TRUST
CONSOLIDATED STATEMENT OF INVESTMENTS (UNAUDITED)
| | | | | | | | | | | | | | | | | | |
| Franklin Emerging Market Debt Opportunities Fund (continued) | | | | | | | | | | |
| | | |
| Country/
Organization |
| |
| Principal
Amount |
* | | | | | | | Value | |
| |
| | | Foreign Government and Agency Securities (continued) | | | | | | | | | | |
| | Government of Turkey, 8.70%, 7/11/18 | | | Turkey | | | | 55,000,000 | | | | TRY | | | $ | 14,397,403 | |
| | Government of Uganda, | | | | | | | | | | | | | | | | |
| | 10.75%, 2/22/18 | | | Uganda | | | | 2,200,000,000 | | | | UGX | | | | 608,124 | |
| | 16.125%, 3/22/18 | | | Uganda | | | | 4,420,000,000 | | | | UGX | | | | 1,232,708 | |
| | 13.75%, 6/13/19 | | | Uganda | | | | 10,750,000,000 | | | | UGX | | | | 3,068,868 | |
| g | | Government of Ukraine, senior bond, 144A, 7.375%, 9/25/32 | | | Ukraine | | | | 4,500,000 | | | | | | | | 4,568,490 | |
| j | | Government of Uruguay, senior bond, Index Linked, 3.70%, | | | | | | | | | | | | | | | | |
| | 6/26/37 | | | Uruguay | | | | 441,624,124 | | | | UYU | | | | 17,421,300 | |
| b,h | | Government of Venezuela, | | | | | | | | | | | | | | | | |
| | senior bond, Reg S, 6.00%, 12/09/20 | | | Venezuela | | | | 5,400,000 | | | | | | | | 1,420,875 | |
| | senior bond, Reg S, 7.65%, 4/21/25 | | | Venezuela | | | | 13,500,000 | | | | | | | | 3,645,000 | |
| g | | Grenada Government International Bond, senior bond, 144A, 7.00%, 5/12/30 | | | Grenada | | | | 7,047,882 | | | | | | | | 6,484,051 | |
| e | | International Finance Corp., senior note, 10.25%, 12/05/18 | | | Supranationalp | | | | 3,407,800 | | | | AZN | | | | 2,010,793 | |
| | Kenya Infrastructure Bond, 11.00%, 9/15/25 | | | Kenya | | | | 460,000,000 | | | | KES | | | | 4,363,580 | |
| | senior note, 12.50%, 5/12/25 | | | Kenya | | | | 278,000,000 | | | | KES | | | | 2,816,990 | |
| g,h | | Mozambique International Bond, senior note, 144A, 10.50%, 1/18/23 | | | Mozambique | | | | 7,900,000 | | | | | | | | 6,845,350 | |
| g | | Peruvian Government International Bond, senior bond, 144A, 6.35%, 8/12/28 | | | Peru | | | | 14,400,000 | | | | PEN | | | | 5,095,191 | |
| | | | | | | | | | | | | | | | | | |
| | Total Foreign Government and Agency Securities
(Cost $204,431,058) | | | | | | | | | | | | | | | 204,954,579 | |
| | | | | | | | | | | | | | | | | | |
| | | | | |
| | | | | | | | Shares | | | | | | | |
| | | | | | | | | | | | | | | | | | |
| | Common Stocks 0.0%† | | | | | | | | | | | | | | | | |
| c,e,f | | Astana Finance JSC, GDR, 144A | | | Kazakhstan | | | | 193,625 | | | | | | | | — | |
| c,e,f | | Holdco 2, A | | | South Africa | | | | 55,882,058 | | | | | | | | 47,192 | |
| c,e,f | | Holdco 2, B | | | South Africa | | | | 5,561,052 | | | | | | | | 4,696 | |
| | | | | | | | | | | | | | | | | | |
| | Total Common Stocks (Cost $433,379) | | | | | | | | | | | | | | | 51,888 | |
| | | | | | | | | | | | | | | | | | |
| | | | | |
| | | | | | | | Units | | | | | | | |
| | | | | | | | | | | | | | | | | | |
| | Private Limited Partnership Fund
(Cost $4,600,000) 0.1% | | | | | | | | | | | | | | | | |
| | Diversified Financial Services 0.1% | | | | | | | | | | | | | | | | |
| a,c,e,f,q | | Global Distressed Alpha Fund III LP | | | United States | | | | 4,424,861 | | | | | | | | 396,065 | |
| | | | | | | | | | | | | | | | | | |
| | Total Investments before Short Term Investments
(Cost $496,090,834) | | | | | | | | | | | | | | | 452,297,946 | |
| | | | | | | | | | | | | | | | | | |
| | | | | | |
| ftinstitutional.com | | Semiannual Report | | | 13 | |
FRANKLIN GLOBAL TRUST
CONSOLIDATED STATEMENT OF INVESTMENTS (UNAUDITED)
| | | | | | | | | | | | | | | | | | |
| Franklin Emerging Market Debt Opportunities Fund (continued) | | | | | | | | | | |
| | | |
| Country/
Organization |
| |
| Principal
Amount |
* | | | | | | | Value | |
| |
| | | Short Term Investments 2.8% | | | | | | | | | | | | |
| | | Foreign Government and Agency Securities
(Cost $310,867) 0.1% | | | | | | | | | | | | |
| r | | Egypt Treasury Bill, 2/27/18 | | | Egypt | | | | 5,575,000 | | | | EGP | | | $ | 311,174 | |
| | | | | | | | | | | | | | | | | | |
| | | Total Investments before Money Market Funds
(Cost $496,401,701) | | | | | | | | | | | 452,609,120 | |
| | | | | | | | | | | | | | | | | | |
| | | | | |
| | | | | | | | Shares | | | | | | | |
| | | | | | | | | | | | | | | | | | |
| | | Money Market Funds (Cost $13,019,263) 2.7% | | | | | | | | | | | | |
| s,t | | Institutional Fiduciary Trust Money Market Portfolio, 0.96% | | | United States | | | | 13,019,263 | | | | | | | | 13,019,263 | |
| | | | | | | | | | | | | | | | | | |
| | | Total Investments (Cost $509,420,964) 97.3% | | | | | | | | | | | 465,628,383 | |
| | | Other Assets, less Liabilities 2.7% | | | | | | | | | | | 12,910,970 | |
| | | | | | | | | | | | | | | | | | |
| | | Net Assets 100.0% | | | | | | | | | | | $478,539,353 | |
| | | | | | | | | | | | | | | | | | |
†Rounds to less than 0.1% of net assets.
*The principal amount is stated in U.S. dollars unless otherwise indicated.
aThe security is owned by Alternative Strategies (FT) Ltd., a wholly-owned subsidiary of the Fund. See Note 1(e).
bSecurity was purchased pursuant to Regulation S under the Securities Act of 1933, which exempts from registration securities offered and sold outside of the United States. Such a security cannot be sold in the United States without either an effective registration statement filed pursuant to the Securities Act of 1933, or pursuant to an exemption from registration. These securities have been deemed liquid under guidelines approved by the Trust’s Board of Trustees. At January 31, 2018, the aggregate value of these securities was $86,874,120, representing 18.2% of net assets.
cNon-income producing.
dThe principal represents the notional amount. See Note 1(c) regarding value recovery instruments.
eFair valued using significant unobservable inputs. See Note 12 regarding fair value measurements.
fSee Note 9 regarding restricted securities.
gSecurity was purchased pursuant to Rule 144A under the Securities Act of 1933 and may be sold in transactions exempt from registration only to qualified institutional buyers or in a public offering registered under the Securities Act of 1933. These securities have been deemed liquid under guidelines approved by the Trust’s Board of Trustees. At January 31, 2018, the aggregate value of these securities was $187,414,112, representing 39.2% of net assets.
hSee Note 7 regarding defaulted securities.
iRepresents claims that have been filed with a Ghanaian court against National Investment Bank of Ghana.
jPrincipal amount of security is adjusted for inflation. See Note 1(g).
kIncome may be received in additional securities and/or cash.
lSee Note 1(d) regarding loan participations and assignments.
mThe coupon rate shown represents the rate at period end.
nPerpetual security with no stated maturity date.
oPrincipal amount is stated in 100 Mexican Peso Units.
pA supranational organization is an entity formed by two or more central governments through international treaties.
qThe Global Distressed Alpha Fund III LP is a fund focused on the purchase of and the recovery on private distressed commercial, sovereign and sovereign-related debt claims around the world, principally in Africa and Asia.
rThe security was issued on a discount basis with no stated coupon rate.
sSee Note 3(d) regarding investments in affiliated management investment companies.
tThe rate shown is the annualized seven-day yield at period end.
| | | | |
| 14 | | Semiannual Report | | ftinstitutional.com |
FRANKLIN GLOBAL TRUST
CONSOLIDATED STATEMENT OF INVESTMENTS (UNAUDITED)
Franklin Emerging Market Debt Opportunities Fund (continued)
At January 31, 2018, the Fund had the following forward exchange contracts outstanding. See Note 1(c).
Forward Exchange Contracts
| | | | | | | | | | | | | | | | | | | | | | | | |
| Currency | | Counterpartya | | Type | | Quantity | | | Contract
Amount | | | Settlement
Date | | | Unrealized
Appreciation | | | Unrealized
Depreciation | |
| |
| OTC Forward Exchange Contracts | | | | | | | | | | | | | | | | | | | | |
Brazilian Real | | CITI | | Sell | | | 7,900,000 | | | $ | 2,374,868 | | | | 2/20/18 | | | | $ — | | | $ | (100,017 | ) |
Euro | | CITI | | Sell | | | 2,100,000 | | | | 2,490,384 | | | | 3/13/18 | | | | — | | | | (123,441 | ) |
Euro | | MSCO | | Sell | | | 2,000,000 | | | | 2,371,921 | | | | 3/13/18 | | | | — | | | | (117,437 | ) |
Euro | | RBCCM | | Sell | | | 2,000,000 | | | | 2,371,820 | | | | 3/13/18 | | | | — | | | | (117,537 | ) |
Japanese Yen | | CITI | | Sell | | | 800,000,000 | | | | 7,130,824 | | | | 3/13/18 | | | | — | | | | (212,647 | ) |
Japanese Yen | | MSCO | | Sell | | | 760,000,000 | | | | 6,777,147 | | | | 3/13/18 | | | | — | | | | (199,151 | ) |
Japanese Yen | | RBCCM | | Sell | | | 700,000,000 | | | | 6,242,142 | | | | 3/13/18 | | | | — | | | | (183,396 | ) |
| | | | | | | | | | | | | | | | | | | | |
Total Forward Exchange Contracts | | | | | | | | | | | | $ — | | | $ | (1,053,626 | ) |
| | | | | | | | | | | | | | | | | | | | |
Net unrealized appreciation (depreciation) | | | | | | | | | | | $ | (1,053,626 | ) |
| | | | | | | | | | | | | | | | | | | | | | | | |
aMay be comprised of multiple contracts with the same counterparty, currency and settlement date.
See Note 10 regarding other derivative information.
See Abbreviations on page 31.
| | | | | | |
| ftinstitutional.com | | The accompanying notes are an integral part of these consolidated financial statements. | Semiannual Report | | | 15 | |
FRANKLIN GLOBAL TRUST
Consolidated Financial Statements
Consolidated Statement of Assets and Liabilities
January 31, 2018 (unaudited)
Franklin Emerging Market Debt Opportunities Fund
| | | | |
Assets: | | | | |
Investments in securities: | | | | |
Cost - Unaffiliated issuers | | $ | 496,401,701 | |
Cost - Non-controlled affiliates (Note 3d) | | | 13,019,263 | |
| | | | |
Value - Unaffiliated issuers | | $ | 452,609,120 | |
Value - Non-controlled affiliates (Note 3d) | | | 13,019,263 | |
Cash | | | 6,351,412 | |
Foreign currency, at value (cost $1,050,470) | | | 1,051,300 | |
Receivables: | | | | |
Capital shares sold | | | 635,083 | |
Interest | | | 6,268,867 | |
Deposits with brokers for:
OTC derivative contracts | | | 570,000 | |
Other assets | | | 15 | |
| | | | |
Total assets | | | 480,505,060 | |
| | | | |
Liabilities: | | | | |
Payables: | | | | |
Investment securities purchased | | | 194,784 | |
Capital shares redeemed | | | 164,560 | |
Management fees | | | 415,419 | |
Transfer agent fees | | | 18,629 | |
Unrealized depreciation on OTC forward exchange contracts | | | 1,053,626 | |
Deferred tax | | | 49,116 | |
Accrued expenses and other liabilities | | | 69,573 | |
| | | | |
Total liabilities | | | 1,965,707 | |
| | | | |
Net assets, at value | | $ | 478,539,353 | |
| | | | |
Net assets consist of: | | | | |
Paid-in capital | | $ | 520,675,366 | |
Undistributed net investment income | | | 2,790,844 | |
Net unrealized appreciation (depreciation) | | | (44,806,461 | ) |
Accumulated net realized gain (loss) | | | (120,396 | ) |
| | | | |
Net assets, at value | | $ | 478,539,353 | |
| | | | |
Shares outstanding | | | 40,227,936 | |
| | | | |
Net asset value and maximum offering price per share | | | $11.90 | |
| | | | |
| | | | |
| 16 | | Semiannual Report | The accompanying notes are an integral part of these consolidated financial statements. | | ftinstitutional.com |
FRANKLIN GLOBAL TRUST
CONSOLIDATED FINANCIAL STATEMENTS
Consolidated Statement of Operations
for the six months ended January 31, 2018 (unaudited)
Franklin Emerging Market Debt Opportunities Fund
| | | | |
Investment income: | | | | |
Dividends: | | | | |
Unaffiliated issuers | | $ | 3,744,878 | |
Non-controlled affiliates (Note 3d) | | | 89,544 | |
Interest: (net of foreign taxes)~ | | | | |
Unaffiliated issuers | | | 19,383,003 | |
| | | | |
Total investment income | | | 23,217,425 | |
| | | | |
Expenses: | | | | |
Management fees (Note 3a) | | | 2,633,406 | |
Transfer agent fees (Note 3c) | | | 48,210 | |
Custodian fees (Note 4) | | | 58,789 | |
Reports to shareholders | | | 7,671 | |
Registration and filing fees | | | 17,750 | |
Professional fees | | | 53,843 | |
Trustees’ fees and expenses | | | 9,936 | |
Other | | | 11,058 | |
| | | | |
Total expenses | | | 2,840,663 | |
Expense reductions (Note 4) | | | (522 | ) |
Expenses waived/paid by affiliates (Note 3d and 3e) | | | (194,806 | ) |
| | | | |
Net expenses | | | 2,645,335 | |
| | | | |
Net investment income | | | 20,572,090 | |
| | | | |
Realized and unrealized gains (losses): | | | | |
Net realized gain (loss) from: | | | | |
Investments: | | | | |
Unaffiliated issuers | | | 1,174,568 | |
Foreign currency transactions | | | (41,827 | ) |
Forward exchange contracts | | | 407,616 | |
| | | | |
Net realized gain (loss) | | | 1,540,357 | |
| | | | |
Net change in unrealized appreciation (depreciation) on: | | | | |
Investments: | | | | |
Unaffiliated issuers | | | 10,472,120 | |
Translation of other assets and liabilities denominated in foreign currencies | | | 88,963 | |
Forward exchange contracts | | | (799,019 | ) |
Change in deferred taxes on unrealized appreciation | | | (4,506 | ) |
| | | | |
Net change in unrealized appreciation (depreciation) | | | 9,757,558 | |
| | | | |
Net realized and unrealized gain (loss) | | | 11,297,915 | |
| | | | |
Net increase (decrease) in net assets resulting from operations | | $ | 31,870,005 | |
| | | | |
| |
~Foreign taxes withheld on interest | | $ | 111,323 | |
| | | | | | |
| ftinstitutional.com | | The accompanying notes are an integral part of these consolidated financial statements. | Semiannual Report | | | 17 | |
FRANKLIN GLOBAL TRUST
CONSOLIDATED FINANCIAL STATEMENTS
Consolidated Statements of Changes in Net Assets
Franklin Emerging Market Debt Opportunities Fund
| | | | | | | | |
| | | Six Months Ended
January 31, 2018
(unaudited) | | | Year Ended
July 31, 2017 | |
Increase (decrease) in net assets: | | | | | | | | |
Operations: | | | | | | | | |
Net investment income | | | $ 20,572,090 | | | | $ 38,585,339 | |
Net realized gain (loss) | | | 1,540,357 | | | | (15,437,575 | ) |
Net change in unrealized appreciation (depreciation) | | | 9,757,558 | | | | 23,420,308 | |
| | | | |
Net increase (decrease) in net assets resulting from operations | | | 31,870,005 | | | | 46,568,072 | |
| | | | |
Distributions to shareholders from: | | | | | | | | |
Net investment income | | | (20,540,417 | ) | | | — | |
Net realized gains | | | (1,497,051 | ) | | | (3,393,271 | ) |
| | | | |
Total distributions to shareholders | | | (22,037,468 | ) | | | (3,393,271 | ) |
| | | | |
Capital share transactions (Note 2) | | | (45,699,216 | ) | | | (81,603,355 | ) |
| | | | |
Net increase (decrease) in net assets | | | (35,866,679 | ) | | | (38,428,554 | ) |
Net assets: | | | | | | | | |
Beginning of period | | | 514,406,032 | | | | 552,834,586 | |
| | | | |
End of period | | | $478,539,353 | | | | $514,406,032 | |
| | | | |
Undistributed net investment income included in net assets: | | | | | | | | |
End of period | | | $ 2,790,844 | | | | $ 2,759,171 | |
| | | | |
| | | | |
| 18 | | Semiannual Report | The accompanying notes are an integral part of these consolidated financial statements. | | ftinstitutional.com |
FRANKLIN GLOBAL TRUST
CONSOLIDATED FINANCIAL STATEMENTS
Consolidated Statement of Cash Flows
for the six months ended January 31, 2018 (unaudited)
Franklin Emerging Market Debt Opportunities Fund
| | | | |
Cash flow from operating activities: | | | | |
Dividends, interest and other income received | | $ | 21,595,673 | |
Operating expenses paid | | | (2,615,451 | ) |
Purchases of long-term investments | | | (35,761,328 | ) |
Cash on deposit with brokers | | | (570,000 | ) |
Realized gain on foreign currency transactions | | | 365,789 | |
Sales and maturities of long-term investments | | | 87,340,363 | |
Net purchases of short-term investments | | | (2,203,365 | ) |
| | | | |
Cash provided - operating activities | | | 68,151,681 | |
| | | | |
Cash flow from financing activities: | | | | |
Proceeds from shares sold | | | 24,127,219 | |
Payment of shares redeemed | | | (92,162,064 | ) |
Cash distributions to shareholders | | | (243,335 | ) |
| | | | |
Cash used - financing activities | | | (68,278,180 | ) |
| | | | |
Net increase (decrease) in cash | | | (126,499 | ) |
Cash and foreign currency at beginning of period | | | 7,526,240 | |
Effect of exchange rate changes on foreign currency | | | 2,971 | |
| | | | |
Cash and foreign currency at end of period | | $ | 7,402,712 | |
| | | | |
| |
Reconciliation of Net Increase (Decrease) in Net Assets resulting from Operating Activities to Net Cash Provided by Operating Activities for the six months ended January 31, 2018 (unaudited) | | | | |
| |
Net increase (decrease) in net assets resulting from operating activities | | $ | 31,870,005 | |
Adjustments to reconcile net increase (decrease) in net assets resulting from operating activities to net cash provided by operating activities: | | | | |
Net amortization income | | | (2,417,498 | ) |
Reinvested dividends from non-controlled affiliates | | | (89,544 | ) |
Interest received in the form of securities | | | (93,045 | ) |
Decrease in dividends and interest receivable and other assets | | | 1,071,379 | |
Increase in payables to affiliates, accrued expenses, and other liabilities | | | 29,884 | |
Decrease in payable for investments purchased | | | (3,287,163 | ) |
Decrease in cost of investments | | | 51,395,221 | |
Decrease in unrealized depreciation on investments | | | (9,757,558 | ) |
Increase in cash on deposit with broker | | | (570,000 | ) |
| | | | |
Net cash provided by operating activities | | $ | 68,151,681 | |
| | | | |
Non cash financing activities - reinvestment of dividends | | $ | 21,794,133 | |
| | | | |
| | | | | | |
| ftinstitutional.com | | The accompanying notes are an integral part of these consolidated financial statements. | Semiannual Report | | | 19 | |
FRANKLIN GLOBAL TRUST
Notes to Consolidated Financial Statements (unaudited)
Franklin Emerging Market Debt Opportunities Fund
1. Organization and Significant Accounting Policies
Franklin Global Trust (Trust) is registered under the Investment Company Act of 1940 (1940 Act) as an open-end management investment company, consisting of five separate funds and applies the specialized accounting and reporting guidance in U.S. Generally Accepted Accounting Principles (U.S. GAAP). Franklin Emerging Market Debt Opportunities Fund (Fund) is included in this report.
The following summarizes the Fund’s significant accounting policies.
a. Financial Instrument Valuation
The Fund’s investments in financial instruments are carried at fair value daily. Fair value is the price that would be received to sell an asset or paid to transfer a liability in an orderly transaction between market participants on the measurement date. The Fund calculates the net asset value (NAV) per share as of 4 p.m. Eastern time each day the New York Stock Exchange (NYSE) is open for trading. Under compliance policies and procedures approved by the Trust’s Board of Trustees (the Board), the Fund’s administrator has responsibility for oversight of valuation, including leading the cross-functional Valuation Committee (VC). The VC provides administration and oversight of the Fund’s valuation policies and procedures, which are approved annually by the Board. Among other things, these procedures allow the Fund to utilize independent pricing services, quotations from securities and financial instrument dealers, and other market sources to determine fair value.
Equity securities listed on an exchange or on the NASDAQ National Market System are valued at the last quoted sale price or the official closing price of the day, respectively. Foreign equity securities are valued as of the close of trading on the foreign stock exchange on which the security is primarily traded, or as of 4 p.m. Eastern time. The value is then converted into its U.S. dollar equivalent at the foreign exchange rate in effect at 4 p.m. Eastern time on the day that the value of the security is determined. Over-the-counter (OTC) securities are valued within the range of the most recent quoted bid and ask prices. Securities that trade in multiple markets or on multiple exchanges are valued according to the broadest and most representative market. Certain equity securities are valued based upon fundamental characteristics or relationships to similar securities.
Debt securities generally trade in the OTC market rather than on a securities exchange. The Fund’s pricing services use multiple valuation techniques to determine fair value. In instances where sufficient market activity exists, the pricing services may utilize a market-based approach through which quotes from market makers are used to determine fair value. In instances where sufficient market activity may not exist or is limited, the pricing services also utilize proprietary valuation models which may consider market characteristics such as benchmark yield curves, credit spreads, estimated default rates, anticipated market interest rate volatility, coupon rates, anticipated timing of principal repayments, underlying collateral, and other unique security features in order to estimate the relevant cash flows, which are then discounted to calculate the fair value. Securities denominated in a foreign currency are converted into their U.S. dollar equivalent at the foreign exchange rate in effect at 4 p.m. Eastern time on the date that the values of the foreign debt securities are determined.
Investments in open-end mutual funds are valued at the closing NAV.
Certain derivative financial instruments trade in the OTC market. The Fund’s pricing services use various techniques including industry standard option pricing models and proprietary discounted cash flow models to determine the fair value of those instruments. The Fund’s net benefit or obligation under the derivative contract, as measured by the fair value of the contract, is included in net assets.
The Fund has procedures to determine the fair value of financial instruments for which market prices are not reliable or readily available. Under these procedures, the VC convenes on a regular basis to review such financial instruments and considers a number of factors, including significant unobservable valuation inputs, when arriving at fair value. The VC primarily employs a market-based approach which may use related or comparable assets or liabilities, recent transactions, market multiples, book values, and other relevant information for the investment to determine the fair value of the investment. An income-based valuation approach may also be used in which the anticipated future cash flows of the investment are discounted to calculate fair value. Discounts may also be applied due to the nature or duration of any restrictions on the disposition of the investments. Due to the inherent uncertainty of valuations of such investments, the fair values may differ significantly from the values that would have been used had an active market existed. The VC employs various methods for calibrating these
| | | | |
| 20 | | Semiannual Report | | ftinstitutional.com |
FRANKLIN GLOBAL TRUST
NOTES TO CONSOLIDATED FINANCIAL STATEMENTS (UNAUDITED)
Franklin Emerging Market Debt Opportunities Fund (continued)
valuation approaches including a regular review of key inputs and assumptions, transactional back-testing or disposition analysis, and reviews of any related market activity.
Trading in securities on foreign securities stock exchanges and OTC markets may be completed before 4 p.m. Eastern time. In addition, trading in certain foreign markets may not take place on every Fund’s business day. Occasionally, events occur between the time at which trading in a foreign security is completed and 4 p.m. Eastern time that might call into question the reliability of the value of a portfolio security held by the Fund. As a result, differences may arise between the value of the Fund’s portfolio securities as determined at the foreign market close and the latest indications of value at 4 p.m. Eastern time. In order to minimize the potential for these differences, the VC monitors price movements following the close of trading in foreign stock markets through a series of country specific market proxies (such as baskets of American Depositary Receipts, futures contracts and exchange traded funds). These price movements are measured against established trigger thresholds for each specific market proxy to assist in determining if an event has occurred that may call into question the reliability of the values of the foreign securities held by the Fund. If such an event occurs, the securities may be valued using fair value procedures, which may include the use of independent pricing services.
When the last day of the reporting period is a non-business day, certain foreign markets may be open on those days that the Fund’s NAV is not calculated, which could result in differences between the value of the Fund’s portfolio securities on the last business day and the last calendar day of the reporting period. Any significant security valuation changes due to an open foreign market are adjusted and reflected by the Fund for financial reporting purposes.
b. Foreign Currency Translation
Portfolio securities and other assets and liabilities denominated in foreign currencies are translated into U.S. dollars based on the exchange rate of such currencies against U.S. dollars on the date of valuation. The Fund may enter into foreign currency exchange contracts to facilitate transactions denominated in a foreign currency. Purchases and sales of securities, income and expense items denominated in foreign currencies are translated into U.S. dollars at the exchange rate in effect on the transaction date. Portfolio securities and assets and liabilities denominated in foreign currencies contain risks that those currencies will
decline in value relative to the U.S. dollar. Occasionally, events may impact the availability or reliability of foreign exchange rates used to convert the U.S. dollar equivalent value. If such an event occurs, the foreign exchange rate will be valued at fair value using procedures established and approved by the Board.
The Fund does not separately report the effect of changes in foreign exchange rates from changes in market prices on securities held. Such changes are included in net realized and unrealized gain or loss from investments in the Consolidated Statement of Operations.
Realized foreign exchange gains or losses arise from sales of foreign currencies, currency gains or losses realized between the trade and settlement dates on securities transactions and the difference between the recorded amounts of dividends, interest, and foreign withholding taxes and the U.S. dollar equivalent of the amounts actually received or paid. Net unrealized foreign exchange gains and losses arise from changes in foreign exchange rates on foreign denominated assets and liabilities other than investments in securities held at the end of the reporting period.
c. Derivative Financial Instruments
The Fund invested in derivative financial instruments in order to manage risk or gain exposure to various other investments or markets. Derivatives are financial contracts based on an underlying or notional amount, require no initial investment or an initial net investment that is smaller than would normally be required to have a similar response to changes in market factors, and require or permit net settlement. Derivatives contain various risks including the potential inability of the counterparty to fulfill their obligations under the terms of the contract, the potential for an illiquid secondary market, and/or the potential for market movements which expose the Fund to gains or losses in excess of the amounts shown in the Consolidated Statement of Assets and Liabilities. Realized gain and loss and unrealized appreciation and depreciation on these contracts for the period are included in the Consolidated Statement of Operations.
Derivative counterparty credit risk is managed through a formal evaluation of the creditworthiness of all potential counterparties. The Fund attempts to reduce its exposure to counterparty credit risk on OTC derivatives, whenever possible, by entering into International Swaps and Derivatives Association (ISDA) master agreements with certain counterparties. These agreements contain various provisions,
| | | | | | |
| ftinstitutional.com | | Semiannual Report | | | 21 | |
FRANKLIN GLOBAL TRUST
NOTES TO CONSOLIDATED FINANCIAL STATEMENTS (UNAUDITED)
Franklin Emerging Market Debt Opportunities Fund (continued)
1. Organization and Significant Accounting Policies (continued)
c. Derivative Financial Instruments (continued)
including but not limited to collateral requirements, events of default, or early termination. Termination events applicable to the counterparty include certain deteriorations in the credit quality of the counterparty. Termination events applicable to the Fund include failure of the Fund to maintain certain net asset levels and/or limit the decline in net assets over various periods of time. In the event of default or early termination, the ISDA master agreement gives the non-defaulting party the right to net and close-out all transactions traded, whether or not arising under the ISDA agreement, to one net amount payable by one counterparty to the other. However, absent an event of default or early termination, OTC derivative assets and liabilities are presented gross and not offset in the Consolidated Statement of Assets and Liabilities. Early termination by the counterparty may result in an immediate payment by the Fund of any net liability owed to that counterparty under the ISDA agreement. At January 31, 2018, the Fund had OTC derivatives in a net liability position of $752,693.
Collateral requirements differ by type of derivative. Collateral terms are contract specific for OTC derivatives. For OTC derivatives traded under an ISDA master agreement, posting of collateral is required by either the fund or the applicable counterparty if the total net exposure of all OTC derivatives with the applicable counterparty exceeds the minimum transfer amount, which typically ranges from $100,000 to $250,000, and can vary depending on the counterparty and the type of the agreement. Generally, collateral is determined at the close of Fund business each day and any additional collateral required due to changes in derivative values may be delivered by the Fund or the counterparty the next business day, or within a few business days. Collateral pledged and/or received by the Fund, if any, is held in segregated accounts with the Fund’s custodian/counterparty broker and can be in the form of cash and/or securities. Unrestricted cash may be invested according to the Fund’s investment objectives. To the extent that the amounts due to the Fund from its counterparties are not subject to collateralization or are not fully collateralized, the Fund bears the risk of loss from counterparty non-performance.
The Fund entered into OTC forward exchange contracts primarily to manage and/or gain exposure to certain foreign currencies. A forward exchange contract is an agreement between the Fund and a counterparty to buy or sell a foreign currency at a specific exchange rate on a future date.
The Fund invests in value recovery instruments (VRI) primarily to gain exposure to economic growth. Periodic payments from VRI are dependent on established benchmarks for underlying variables. VRI has a notional amount, which is used to calculate amounts of payments to holders. Payments are recorded upon receipt as realized gains in the Consolidated Statement of Operations. The risks of investing in VRI include growth risk, liquidity, and the potential loss of investment.
See Note 10 regarding other derivative information.
d. Loan Participations and Assignments
The Fund may invest in debt instruments which are interests in amounts owed to lenders or lending syndicates by corporate, governmental, or other borrowers. The Fund’s investments in loans may be in the form of participations in loans or assignments of all or portion of loans from third parties. A loan is often administered by a bank or other financial institution (the lender”) that acts as agent for all holders. The agent administers the terms of the loan, as specified in the loan agreement. The Fund may invest in multiple series or tranches of a loan, which may have varying terms and carry different associated risks. When investing in a loan participation, a Fund has the right to receive payments of principal, interest and any fees only from the lender selling the loan and only upon receipt of payments from the borrower. The Fund generally has no right to enforce compliance with the terms of the loan agreement with the borrower. As a result, the Fund may be subject to credit risk of both the borrower and the lender that is selling the loan. When the Fund purchases assignments from lenders it acquires direct rights against the borrower of the loan.
e. Investments in Alternative Strategies (FT) Ltd. (FT Subsidiary)
The Fund invests in certain financial instruments, warrants or commodities through its investments in the FT Subsidiary. The FT Subsidiary is a Cayman Islands exempted company with limited liability, is a wholly-owned subsidiary of the Fund, and is able to invest in certain financial instruments consistent with the investment objective of the Fund. At January 31, 2018, the FT Subsidiary’s investments as well as any other assets and
| | | | |
| 22 | | Semiannual Report | | ftinstitutional.com |
FRANKLIN GLOBAL TRUST
NOTES TO CONSOLIDATED FINANCIAL STATEMENTS (UNAUDITED)
Franklin Emerging Market Debt Opportunities Fund (continued)
liabilities of the FT Subsidiary are reflected in the Fund’s Consolidated Statement of Investments and Consolidated Statement of Assets and Liabilities. The financial statements have been consolidated and include the accounts of the Fund and the FT Subsidiary. All intercompany transactions and balances have been eliminated. At January 31, 2018, the net assets of the FT Subsidiary were $15,539,076, representing 3.3% of the Fund’s consolidated net assets. The Fund’s investment in the FT Subsidiary is limited to 25% of consolidated assets.
f. Income and Deferred Taxes
It is the Fund’s policy to qualify as a regulated investment company under the Internal Revenue Code. The Fund intends to distribute to shareholders substantially all of its taxable income and net realized gains to relieve it from federal income and excise taxes. As a result, no provision for U.S. federal income taxes is required.
The Fund may be subject to foreign taxation related to income received, capital gains on the sale of securities and certain foreign currency transactions in the foreign jurisdictions in which it invests. Foreign taxes, if any, are recorded based on the tax regulations and rates that exist in the foreign markets in which the Fund invests. When a capital gain tax is determined to apply, the Fund records an estimated deferred tax liability in an amount that would be payable if the securities were disposed of on the valuation date.
The Fund may recognize an income tax liability related to its uncertain tax positions under U.S. GAAP when the uncertain tax position has a less than 50% probability that it will be sustained upon examination by the tax authorities based on its technical merits. As of January 31, 2018, the Fund has determined that no tax liability is required in its financial statements related to uncertain tax positions for any open tax years (or expected to be taken in future tax years). Open tax years are those that remain subject to examination and are based on the statute of limitations in each jurisdiction in which the Fund invests.
g. Security Transactions, Investment Income, Expenses and Distributions
Security transactions are accounted for on trade date. Realized gains and losses on security transactions are determined on a specific identification basis. Interest income and estimated expenses are accrued daily. Amortization of premium and
accretion of discount on debt securities are included in interest income. Dividend income is recorded on the ex-dividend date except for certain dividends from securities where the dividend rate is not available. In such cases, the dividend is recorded as soon as the information is received by the Fund. Distributions to shareholders are recorded on the ex-dividend date. Distributable earnings are determined according to income tax regulations (tax basis) and may differ from earnings recorded in accordance with U.S. GAAP. These differences may be permanent or temporary. Permanent differences are reclassified among capital accounts to reflect their tax character. These reclassifications have no impact on net assets or the results of operations. Temporary differences are not reclassified, as they may reverse in subsequent periods.
Common expenses incurred by the Trust are allocated among the Funds based on the ratio of net assets of each Fund to the combined net assets of the Trust. Fund specific expenses are charged directly to the Fund that incurred the expense.
Inflation-indexed bonds are adjusted for inflation through periodic increases or decreases in the security’s interest accruals, face amount, or principal redemption value, by amounts corresponding to the rate of inflation as measured by an index. Any increase or decrease in the face amount or principal redemption value will be included as interest income in the Consolidated Statement of Operations.
h. Accounting Estimates
The preparation of financial statements in accordance with U.S. GAAP requires management to make estimates and assumptions that affect the reported amounts of assets and liabilities at the date of the financial statements and the amounts of income and expenses during the reporting period. Actual results could differ from those estimates.
i. Guarantees and Indemnifications
Under the Trust’s organizational documents, its officers and trustees are indemnified by the Trust against certain liabilities arising out of the performance of their duties to the Trust. Additionally, in the normal course of business, the Trust, on behalf of the Fund, enters into contracts with service providers that contain general indemnification clauses. The Trust’s maximum exposure under these arrangements is unknown as this would involve future claims that may be made against the Trust that have not yet occurred. Currently, the Trust expects the risk of loss to be remote.
| | | | | | |
| ftinstitutional.com | | Semiannual Report | | | 23 | |
FRANKLIN GLOBAL TRUST
NOTES TO CONSOLIDATED FINANCIAL STATEMENTS (UNAUDITED)
Franklin Emerging Market Debt Opportunities Fund (continued)
2. Shares of Beneficial Interest
At January 31, 2018, there were an unlimited number of shares authorized (without par value). Transactions in the Fund’s shares were as follows:
| | | | | | | | | | | | | | | | | | | | |
| | | Six Months Ended January 31, 2018 | | | | | | Year Ended July 31, 2017 | |
| | | Shares | | | Amount | | | | | | Shares | | | Amount | |
Shares sold | | | 2,077,469 | | | $ | 24,717,690 | | | | | | | | 7,726,411 | | | $ | 86,256,255 | |
Shares issued in reinvestment of distributions | | | 1,875,571 | | | | 21,794,133 | | | | | | | | 299,660 | | | | 3,257,301 | |
Shares redeemed | | | (7,749,397 | ) | | | (92,211,039 | ) | | | | | | | (15,380,317 | ) | | | (171,116,911 | ) |
Net increase (decrease) | | | (3,796,357 | ) | | $ | (45,699,216 | ) | | | | | | | (7,354,246 | ) | | $ | (81,603,355 | ) |
3. Transactions with Affiliates
Franklin Resources, Inc. is the holding company for various subsidiaries that together are referred to as Franklin Templeton Investments. Certain officers and trustees of the Trust are also officers and/or directors of the following subsidiaries:
| | |
| Subsidiary | | Affiliation |
Franklin Templeton Investment Management Limited (FTIML) | | Investment manager |
Franklin Templeton Services, LLC (FT Services) | | Administrative manager |
Franklin Templeton Investor Services, LLC (Investor Services) | | Transfer agent |
a. Management Fees
The Fund and FT Subsidiary pay an investment management fee to FTIML based on the average daily net assets of each of the Fund and FT Subsidiary as follows:
| | |
| Annualized Fee Rate | | Net Assets |
1.000% | | Up to and including $500 million |
0.900% | | Over $500 million, up to and including $1 billion |
0.850% | | In excess of $1 billion |
For the period ended January 31, 2018, the annualized gross effective investment management fee rate was 0.995% of the Fund’s average daily net assets.
Management fees paid by the Fund are reduced on assets invested in FT Subsidiary, in an amount not to exceed the management fees paid by FT Subsidiary.
b. Administrative Fees
Under an agreement with FTIML, FT Services provides administrative services to the Fund and FT Subsidiary. The fee is paid by FTIML based on each of the Fund’s and FT Subsidiary’s average daily net assets, and is not an additional expense of the Fund or FT Subsidiary.
c. Transfer Agent Fees
The Fund pays transfer agent fees to Investor Services for its performance of shareholder servicing obligations. Effective November 1, 2017, the fees are based on an annualized asset based fee of 0.02% plus a transaction based fee. Prior to November 1, 2017, the fees were account based fees that varied based on fund or account type. In addition, the Fund reimburses Investor Services for out of pocket expenses incurred and shareholder servicing fees paid to third parties.
| | | | |
| 24 | | Semiannual Report | | ftinstitutional.com |
FRANKLIN GLOBAL TRUST
NOTES TO CONSOLIDATED FINANCIAL STATEMENTS (UNAUDITED)
Franklin Emerging Market Debt Opportunities Fund (continued)
For the period ended January 31, 2018, the Fund paid transfer agent fees of $48,210, of which $32,584 was retained by Investor Services.
d. Investments in Affiliated Management Investment Companies
The Fund invests in one or more affiliated management investment companies for purposes other than exercising a controlling influence over the management or policies. Management fees paid by the Fund are waived on assets invested in the affiliated management investment companies, as noted in the Consolidated Statement of Operations, in an amount not to exceed the management and administrative fees paid directly or indirectly by each affiliate. Prior to August 1, 2013, the waiver was accounted for as a reduction to management fees. During the period ended January 31, 2018, the Fund held investments in affiliated management investment companies as follows:
| | | | | | | | | | | | | | | | | | | | | | | | | | | | | | | | |
| | | Number of
Shares Held
at Beginning
of Period | | | Gross
Additions | | | Gross
Reductions | | | Number of
Shares
Held at End
of Period | | | Value
at End
of Period | | | Dividend
Income | | | Realized
Gain
(Loss) | | | Net Change in
Unrealized
Appreciation
(Depreciation) | |
| Non-Controlled Affiliates | | | | | | | | | | | | | | | | | | | | | | | | | |
Institutional Fiduciary Trust Money Market Portfolio, 0.96% | | | 11,026,616 | | | | 70,627,477 | | | | (68,634,830 | ) | | | 13,019,263 | | | $ | 13,019,263 | | | $ | 89,544 | | | $ | — | | | $ | — | |
| | | | | | | | | | | | | | | | | | | | |
e. Waiver and Expense Reimbursements
FTIML has contractually agreed in advance to waive or limit its fees and to assume as its own expense certain expenses otherwise payable by the Fund so that the expenses (excluding acquired fund fees and expenses) do not exceed 1.00% (other than certain non-routine expenses or costs, including those relating to litigation, indemnification, reorganizations, and liquidations) until November 30, 2018. Total expenses waived or paid are not subject to recapture subsequent to the Fund’s fiscal year end.
4. Expense Offset Arrangement
The Fund has entered into an arrangement with its custodian whereby credits realized as a result of uninvested cash balances are used to reduce a portion of the Fund’s custodian expenses. During the period ended January 31, 2018, the custodian fees were reduced as noted in the Consolidated Statement of Operations.
5. Income Taxes
For tax purposes, the Fund may elect to defer any portion of a post-October capital loss to the first day of the following fiscal year. At July 31, 2017, the Fund deferred post-October capital losses of $163,291.
At January 31, 2018, the cost of investments and net unrealized appreciation (depreciation) for income tax purposes were as follows:
| | | | |
Cost of investments | | $ | 485,990,410 | |
| | | | |
Unrealized appreciation | | $ | 54,674,087 | |
Unrealized depreciation | | | (76,089,740) | |
| | | | |
Net unrealized appreciation (depreciation) | | $ | (21,415,653) | |
| | | | |
Differences between income and/or capital gains as determined on a book basis and a tax basis are primarily due to differing treatments of defaulted securities, foreign currency transactions and inflation related adjustments on foreign securities.
| | | | | | |
| ftinstitutional.com | | Semiannual Report | | | 25 | |
FRANKLIN GLOBAL TRUST
NOTES TO CONSOLIDATED FINANCIAL STATEMENTS (UNAUDITED)
Franklin Emerging Market Debt Opportunities Fund (continued)
6. Investment Transactions
Purchases and sales of investments (excluding short term securities) for the period ended January 31, 2018, aggregated $32,474,165 and $87,412,752, respectively.
7. Credit Risk and Defaulted Securities
At January 31, 2018, the Fund had 85.8% of its portfolio invested in high yield or other securities rated below investment grade and unrated securities, if any. These securities may be more sensitive to economic conditions causing greater price volatility and are potentially subject to a greater risk of loss due to default than higher rated securities.
The Fund held defaulted securities and/or other securities for which the income has been deemed uncollectible. At January 31, 2018, the aggregate value of these securities was $33,065,264, representing 6.9% of the Fund’s net assets. The Fund discontinues accruing income on securities for which income has been deemed uncollectible and provides an estimate for losses on interest receivable. The securities have been identified in the accompanying Consolidated Statement of Investments.
8. Concentration of Risk
Investing in foreign securities may include certain risks and considerations not typically associated with investing in U.S. securities, such as fluctuating currency values and changing local and regional economic, political and social conditions, which may result in greater market volatility. In addition, certain foreign securities may not be as liquid as U.S. securities.
9. Restricted Securities
The Fund invests in securities that are restricted under the Securities Act of 1933 (1933 Act). Restricted securities are often purchased in private placement transactions, and cannot be sold without prior registration unless the sale is pursuant to an exemption under the 1933 Act. Disposal of these securities may require greater effort and expense, and prompt sale at an acceptable price may be difficult. The Fund may have registration rights for restricted securities. The issuer generally incurs all registration costs.
At January 31, 2018, investments in restricted securities, excluding securities exempt from registration under the 1933 Act deemed to be liquid, were as follows:
| | | | | | | | | | | | | | | | |
Principal Amount* /Units | | | Issuer | | Acquisition Date | | | Cost | | | Value | |
| | 193,625 | | | Astana Finance JSC, GDR, 144A. | | | 5/22/15 | | | $ | — | | | $ | — | |
| | 136,566 | | | Astana Finance JSC, secured note, 144A, zero cpn., 12/22/24 | | | 5/22/15 | | | | — | | | | 1,366 | |
| | 11,975,000 | | | Credit Suisse First Boston International, (City of Kyiv), secured bond, Reg S, 8.00%, 11/06/15 | | | 5/19/15 - 11/23/15 | | | | 11,651,303 | | | | 9,520,125 | |
| | 831,895,178 | JPY | | Deutsche Bank AG (Government of Iraq), 2.571%, 1/01/28 | | | 1/26/17 | | | | 4,858,442 | | | | 5,788,852 | |
| | 8,925,000 | | | Development Bank of South Africa Ltd. (Government of Angola), Tranche 2, senior note, FRN, 8.032%, (6-month USD LIBOR + 6.25%), 12/20/23 | | | 12/16/13 | | | | 8,925,000 | | | | 8,524,850 | |
| | 8,400,000 | | | Development Bank of South Africa Ltd. (Government of Angola), Tranche 3B, senior note, FRN, 8.032%, (6-month USD LIBOR + 6.25%), 12/20/23 | | | 6/06/14 | | | | 8,400,000 | | | | 8,023,388 | |
| | 8,266,667 | | | Ethiopian Railway Corp. (Government of Ethiopia), FRN, 5.205%, (6-month USD LIBOR + 3.75%), 8/02/21 | | | 8/04/14 - 1/15/16 | | | | 7,948,920 | | | | 8,036,592 | |
| | 4,424,861 | | | Global Distressed Alpha Fund III LP | | | 10/11/12 - 1/22/16 | | | | 4,600,000 | | | | 396,065 | |
| | 498,023 | | | Global Distressed Alpha Fund III LP, PIK, 12.00%, Perpetual | | | 12/28/16 - 12/30/17 | | | | 498,020 | | | | 498,023 | |
| | 247,785,175 | JPY | | Government of Iraq, Tranche A3, Sumitomo Corp. Loan, FRN, 0.563%, (6-month JPY LIBOR + 0.50%), 1/01/28 | | | 10/16/07 - 1/06/11 | | | | 1,467,112 | | | | 1,755,190 | |
| | | | |
| 26 | | Semiannual Report | | ftinstitutional.com |
FRANKLIN GLOBAL TRUST
NOTES TO CONSOLIDATED FINANCIAL STATEMENTS (UNAUDITED)
Franklin Emerging Market Debt Opportunities Fund (continued)
| | | | | | | | | | | | | | | | |
Principal Amount* /Units | | | Issuer | | Acquisition Date | | | Cost | | | Value | |
| | 2,500,000 | | | Government of Suriname, 9.00%, 6/28/19 | | | 12/28/17 | | | $ | 2,500,000 | | | $ | 2,500,000 | |
| | 55,882,058 | | | Holdco 2, A | | | 2/08/13 - 2/01/17 | | | | 429,250 | | | | 47,192 | |
| | 5,561,052 | | | Holdco 2, B | | | 2/01/17 | | | | 4,129 | | | | 4,696 | |
| | 4,235,532 | | | K2016470219 South Africa Ltd., senior secured note, 144A, PIK, 3.00%, 12/31/22 | | | 2/08/13 - 12/29/17 | | | | 7,449,870 | | | | 126,728 | |
| | 739,060 | | | K2016470260 South Africa Ltd., senior secured note, 144A, PIK, 25.00%, 12/31/22 | | | 2/01/17 - 12/29/17 | | | | 717,462 | | | | 560,320 | |
| | 433,639,066 | JPY | | Merrill Lynch & Co. Inc. (Government of Iraq), FRN, 0.563%, (6-month JPY LIBOR + 0.50%), 1/01/28 | | | 7/19/07 - 1/06/11 | | | | 2,549,788 | | | | 3,071,689 | |
| | 4,250,000 | DEM | | NK Debt Corp., 144A, zero cpn., 3/12/20 | | | 6/19/07 - 10/14/08 | | | | 723,263 | | | | — | |
| | 2,000,000 | CHF | | NK Debt Corp., Reg S, zero cpn., 3/12/20 | | | 6/17/11 | | | | 388,830 | | | | — | |
| | 18,000,000 | DEM | | NK Debt Corp., Reg S, zero cpn., 3/12/20 | | | 1/25/11 - 6/06/11 | | | | 2,023,663 | | | | — | |
| | 16,478,377 | | | Societe des Hydrocarbures du Tchad, Tranche 4, FRN, 8.654%, (1-month USD LIBOR + 7.10%), 12/30/22 | | | 10/03/16 | | | | 16,114,687 | | | | 12,807,467 | |
| | 8,000,000 | | | Sphynx Capital Markets PCC (National Investment Bank of Ghana), PTN, Reg S, zero cpn., 2/05/09 | | | 10/12/09 - 10/13/11 | | | | 3,100,000 | | | | — | |
| | | | | | | | | | | | |
| | | | Total Restricted Securities (Value is 12.9% of Net Assets) | | | | | | $ | 84,349,739 | | | $ | 61,662,543 | |
| | | | | | | | | | | | |
* In U.S. dollars unless otherwise indicated.
10. Other Derivative Information
At January 31, 2018, the Fund’s investments in derivative contracts are reflected in the Consolidated Statement of Assets and Liabilities as follows:
| | | | | | | | | | | | |
| | | Asset Derivatives | | | Liability Derivatives | |
Derivative Contracts Not Accounted for as Hedging Instruments | | Consolidated Statement of
Assets and Liabilities
Location | | Fair Value | | | Consolidated Statement of
Assets and Liabilities
Location | | Fair Value | |
Foreign exchange contracts | | Unrealized appreciation on OTC forward exchange contracts | | | $ — | | | Unrealized depreciation on OTC forward exchange contracts | | | $1,053,626 | |
Value recovery instruments | | Investments in securities, at value | | | 5,257,444 | a | | | | | | |
| | | | | | | | | | | | |
Totals | | | | | $5,257,444 | | | | | | $1,053,626 | |
| | | | | | | | | | | | |
aVRI are included in investments in securities, at value in the Consolidated Statement of Assets and Liabilities. For the period ended January 31, 2018, the effect of derivative contracts in the Fund’s Consolidated Statement of Operations was as follows: | |
Derivative Contracts
Not Accounted for as
Hedging Instruments | | Consolidated Statement of Operations Location | | Net Realized
Gain (Loss) for
the Period | | | Consolidated Statement of
Operations Location | | Net Change in Unrealized Appreciation
(Depreciation)
for the Period | |
| | Net realized gain (loss) from: | | | | | | Net change in unrealized appreciation (depreciation) on: | | | | |
Foreign exchange contracts | | Forward exchange contracts | | | $407,616 | | | Forward exchange contracts | | | $ (799,019) | |
Value recovery instruments | | Investments | | | — | | | Investments | | | 1,857,894a | |
| | | | | | | | | | | | |
Totals | | | | | $407,616 | | | | | | $1,058,875 | |
| | | | | | | | | | | | |
aVRI are included in net change in unrealized appreciation (depreciation) on investments in the Consolidated Statement of Operations.
For the period ended January 31, 2018, the average month end contract value for forward exchange contracts and average month end fair value of VRI was $29,384,340 and $4,338,062, respectively.
| | | | | | |
| ftinstitutional.com | | Semiannual Report | | | 27 | |
FRANKLIN GLOBAL TRUST
NOTES TO CONSOLIDATED FINANCIAL STATEMENTS (UNAUDITED)
Franklin Emerging Market Debt Opportunities Fund (continued)
10. Other Derivative Information (continued)
See Note 1(c) regarding derivative financial instruments.
11. Credit Facility
The Fund, together with other U.S. registered and foreign investment funds (collectively, Borrowers), managed by Franklin Templeton Investments, are borrowers in a joint syndicated senior unsecured credit facility totaling $2 billion (Global Credit Facility) which matured on February 9, 2018. This Global Credit Facility provides a source of funds to the Borrowers for temporary and emergency purposes, including the ability to meet future unanticipated or unusually large redemption requests. Effective February 9, 2018, the Borrowers renewed the Global Credit Facility for a one year term, maturing February 8, 2019, for a total of $2 billion.
Under the terms of the Global Credit Facility, the Fund shall, in addition to interest charged on any borrowings made by the Fund and other costs incurred by the Fund, pay its share of fees and expenses incurred in connection with the implementation and maintenance of the Global Credit Facility, based upon its relative share of the aggregate net assets of all of the Borrowers, including an annual commitment fee of 0.15% based upon the unused portion of the Global Credit Facility. These fees are reflected in other expenses in the Consolidated Statement of Operations. During the period ended January 31, 2018, the Fund did not use the Global Credit Facility.
12. Fair Value Measurements
The Fund follows a fair value hierarchy that distinguishes between market data obtained from independent sources (observable inputs) and the Fund’s own market assumptions (unobservable inputs). These inputs are used in determining the value of the Fund’s financial instruments and are summarized in the following fair value hierarchy:
| | • | | Level 1 – quoted prices in active markets for identical financial instruments |
| | • | | Level 2 – other significant observable inputs (including quoted prices for similar financial instruments, interest rates, prepayment speed, credit risk, etc.) |
| | • | | Level 3 – significant unobservable inputs (including the Fund’s own assumptions in determining the fair value of financial instruments) |
The input levels are not necessarily an indication of the risk or liquidity associated with financial instruments at that level.
For movements between the levels within the fair value hierarchy, the Fund has adopted a policy of recognizing the transfers as of the date of the underlying event which caused the movement.
| | | | |
| 28 | | Semiannual Report | | ftinstitutional.com |
FRANKLIN GLOBAL TRUST
NOTES TO CONSOLIDATED FINANCIAL STATEMENTS (UNAUDITED)
Franklin Emerging Market Debt Opportunities Fund (continued)
A summary of inputs used as of January 31, 2018, in valuing the Fund’s assets and liabilities carried at fair value, is as follows:
| | | | | | | | | | | | | | | | |
| | | Level 1 | | | Level 2 | | | Level 3 | | | Total | |
| |
| | | | |
| Assets: | | | | | | | | | | | | | | | | |
Investments in Securities: | | | | | | | | | | | | | | | | |
Warrants | | $ | — | | | $ | 13,561,644 | | | $ | — | | | $ | 13,561,644 | |
Quasi-Sovereign and Corporate Bonds | | | — | | | | 141,141,219 | | | | 1,366 | a | | | 141,142,585 | |
Loan Participations and Assignments | | | — | | | | 43,685,134 | | | | 48,506,051 | a | | | 92,191,185 | |
Foreign Government and Agency Securities | | | — | | | | 200,443,786 | | | | 4,510,793 | | | | 204,954,579 | |
Common Stocks | | | — | | | | — | | | | 51,888 | a | | | 51,888 | |
Private Limited Partnership Fund | | | — | | | | — | | | | 396,065 | | | | 396,065 | |
Short Term Investments | | | 13,019,263 | | | | 311,174 | | | | — | | | | 13,330,437 | |
| | | | |
Total Investments in Securities | | $ | 13,019,263 | | | $ | 399,142,957 | | | $ | 53,466,163 | | | $ | 465,628,383 | |
| | | | |
| | | | |
| Liabilities: | | | | | | | | | | | | | | | | |
Other Financial Instruments: | | | | | | | | | | | | | | | | |
Forward Exchange Contracts | | $ | — | | | $ | 1,053,626 | | | $ | — | | | $ | 1,053,626 | |
| | | | |
aIncludes securities determined to have no value at January 31, 2018.
A reconciliation of assets in which Level 3 inputs are used in determining fair value is presented when there are significant Level 3 financial instruments at the beginning and/or end of the period. At January 31, 2018, the reconciliation of assets, is as follows:
| | | | | | | | | | | | | | | | | | | | | | | | | | | | | | | | | | | | |
| | | Balance at
Beginning of
Period | | | Purchases | | | Sales | | | Transfer
Into (Out of) Level 3 | | | Cost Basis
Adjustmentsa | | | Net
Realized
Gain
(Loss) | | | Net
Unrealized
Appreciation
(Depreciation) | | | Balance
at End
of Period | | | Net Change in
Unrealized
Appreciation
(Depreciation)
on Assets
Held at Period End | |
| | | | | | | | | |
| Assets: | | | | | | | | | | | | | | | | | | | | | | | | | | | | | | | | | | | | |
Investments in Securities: | | | | | | | | | | | | | | | | | | | | | | | | | | | | | | | | | | | | |
Quasi-Sovereign and Corporate Bonds | | $ | 1,366 | b | | | $ — | | | | $ — | | | | $— | | | | $ — | | | | $ — | | | | $ — | | | | $ 1,366 | b | | | $ — | |
Loan Participations and Assignments | | | 52,189,889 | b | | | — | | | | (3,147,418 | ) | | | — | | | | 555,902 | | | | 13,595 | | | | (1,105,917 | ) | | | 48,506,051 | b | | | (967,944 | ) |
Foreign Government and Agency Securities | | | 1,991,020 | | | | 2,500,000 | | | | — | | | | — | | | | — | | | | — | | | | 19,773 | | | | 4,510,793 | | | | 19,773 | |
Common Stocks | | | 46,615 | b | | | — | | | | — | | | | — | | | | — | | | | — | | | | 5,273 | | | | 51,888 | b | | | 5,273 | |
Private Limited Partnership Fund | | | 313,302 | | | | — | | | | — | | | | — | | | | — | | | | — | | | | 82,763 | | | | 396,065 | | | | 82,763 | |
| | | | |
Total Investments in Securities | | $ | 54,542,192 | | | | $2,500,000 | | | | $(3,147,418 | ) | | | $— | | | | $555,902 | | | | $13,595 | | | | $(998,108 | ) | | | $53,466,163 | | | | $(860,135 | ) |
| | | | |
aMay include accretion, amortization, partnership adjustments, and/or other cost basis adjustments.
bIncludes securities determined to have no value.
| | | | | | |
| ftinstitutional.com | | Semiannual Report | | | 29 | |
FRANKLIN GLOBAL TRUST
NOTES TO CONSOLIDATED FINANCIAL STATEMENTS (UNAUDITED)
Franklin Emerging Market Debt Opportunities Fund (continued)
12. Fair Value Measurements (continued)
Significant unobservable valuation inputs for material Level 3 financial instruments and impact to fair value as a result of changes in unobservable valuation inputs as of January 31, 2018, are as follows:
| | | | | | | | | | | | | | | | |
| Description | | Fair Value at End of Period | | | Valuation Technique | | Unobservable Inputs | | Amount/Range | | | Impact to Fair
Value if Input
Increasesa | |
| | | | | |
| Assets: | | | | | | | | | | | | | | | | |
Investments in Securities: | | | | | | | | | | | | | | | | |
Loan Participations and Assignments | | $ | 42,219,176 | | | Consensus Pricing | | Weighted average of offered quotes | | | 71.2 - 79.8 JPY | | | | Increaseb | |
| | | | | | | |
| | | | | | Discounted Cash Flow Model | | Free Cash Flow | | $ | 53.6 (mil | ) | | | Increasec | |
| | | | | | | | | |
| | | | | | | | Discount rate | | | 6.5% - 17.6% | | | | Decreasec | |
| |
All Other Investmentsd | | | 11,246,987 | e | | | | | | | | | | | | |
| |
| | | | | |
| Total | | $ | 53,466,163 | | | | | | | | | | | | | |
| |
aRepresents the directional change in the fair value of the Level 3 financial instruments that would result from a significant and reasonable increase in the corresponding input. A significant and reasonable decrease in the input would have the opposite effect. Significant impacts, if any, to fair value and/or net assets have been indicated.
bRepresents a significant impact to fair value but not net assets.
cRepresents a significant impact to fair value and net assets.
dIncludes financial instruments with values derived using prior transaction prices or third party pricing information without adjustment for which such inputs are unobservable. May also include fair value of immaterial financial instruments developed using various valuation techniques and unobservable inputs.
eIncludes securities determined to have no value at January 31, 2018.
13. Subsequent Events
The Fund has evaluated subsequent events through the issuance of the consolidated financial statements and determined that no events have occurred that require disclosure other than those already disclosed in the consolidated financial statements.
| | | | |
| 30 | | Semiannual Report | | ftinstitutional.com |
FRANKLIN GLOBAL TRUST
NOTES TO CONSOLIDATED FINANCIAL STATEMENTS (UNAUDITED)
Franklin Emerging Market Debt Opportunities Fund (continued)
| | | | | | | | | | | | |
| Abbreviations | | | | | | | | | | |
| | | |
| Counterparty | | Currency | | Selected Portfolio | | |
| CITI | | Citibank N.A. | | AZN | | Azerbaijan Manat | | FRN | | Floating Rate Note | | |
| MSCO | | Morgan Stanley | | BRL | | Brazilian Real | | GDP | | Gross Domestic Product | | |
| RBCCM | | Royal Bank of Canada | | CHF | | Swiss Franc | | GDR | | Global Depositary Receipt | | |
| | | | COP | | Colombian Peso | | LIBOR | | London InterBank Offered Rate | | |
| | | | DEM | | Deutsche Mark | | PIK | | Payment-In-Kind | | |
| | | | EGP | | Egyptian Pound | | PTN | | Pass-through Note | | |
| | | | EUR | | Euro | | VRI | | Value Recovery Instrument | | |
| | | | GEL | | Georgian Lari | | | | | | |
| | | | GHS | | Ghanaian Cedi | | | | | | |
| | | | JPY | | Japanese Yen | | | | | | |
| | | | KES | | Kenyan Shilling | | | | | | |
| | | | MXN | | Mexican Peso | | | | | | |
| | | | PEN | | Peruvian Nuevo Sol | | | | | | |
| | | | RUB | | Russian Ruble | | | | | | |
| | | | TRY | | Turkish Lira | | | | | | |
| | | | UGX | | Ugandan Shilling | | | | | | |
| | | | USD | | United States Dollar | | | | | | |
| | | | UYU | | Uruguayan Peso | | | | | | |
| | | | ZAR | | South African Rand | | | | | | |
| | | | | | |
| ftinstitutional.com | | Semiannual Report | | | 31 | |
FRANKLIN GLOBAL TRUST
FRANKLIN EMERGING MARKET DEBT OPPORTUNITIES FUND
Special Meeting of Shareholders
MEETING OF SHAREHOLDERS: OCTOBER 30, 2017 AND RECONVENED ON DECEMBER 15, 2017 AND DECEMBER 29, 2017
(UNAUDITED)
A Special Meeting of Shareholders of Franklin Global Trust was held at the offices of Franklin Templeton Investments, One Franklin Parkway, San Mateo, California on October 30, 2017 and reconvened on December 15, 2017 and December 29, 2017. The purpose of the meeting was to elect Trustees of Franklin Global Trust and to vote on the following proposals: to approve the use of a “manager of managers” structure whereby the Fund’s investment manager would be able to hire and replace subadvisers without shareholder approval and to approve an amended fundamental investment restriction regarding investments in commodities for the Fund. At the meeting, (i) the following persons were elected by the shareholders to serve as Trustees of Franklin Global Trust: Harris J. Ashton, Terrence J. Checki, Mary C. Choksi, Edith E. Holiday, Gregory E. Johnson, Rupert H. Johnson, Jr., J. Michael Luttig, Larry D. Thompson, and John B. Wilson and (ii) the proposals to use a “manager of managers” structure and to approve the amended fundamental investment restriction regarding investments in commodities were approved by shareholders. No other business was transacted at the meeting.
In connection with the meeting, management is aware that some shareholders received from the proxy solicitor numerous calls and mailings that may have been distracting. Management is taking steps to ensure that, in the future, for any new shareholder meeting solicitations that occur, such activity is not repeated. Management apologizes for any inconvenience that may have been caused as a result of such calls and mailings.
The results of the voting at the meeting are as follows:
Proposal 1. To elect a Board of Trustees:
| | | | | | | | |
| Name | | For | | | Withheld | |
Harris J. Ashton | | | 123,597,479 | | | | 3,571,398 | |
Terrence J. Checki | | | 123,690,572 | | | | 3,478,306 | |
Mary C. Choksi | | | 123,243,714 | | | | 3,925,163 | |
Edith E. Holiday | | | 121,178,523 | | | | 5,990,354 | |
Gregory E. Johnson | | | 123,694,217 | | | | 3,474,660 | |
Rupert H. Johnson, Jr. | | | 123,621,068 | | | | 3,547,808 | |
J. Michael Luttig | | | 123,705,401 | | | | 3,463,476 | |
Larry D. Thompson | | | 123,162,505 | | | | 4,006,372 | |
John B. Wilson | | | 123,573,690 | | | | 3,595,187 | |
| | |
Total Trust Shares Outstanding*: 162,995,191 | | | | | | | | |
* As of the record date.
| | | | |
| 32 | | Semiannual Report | | ftinstitutional.com |
FRANKLIN GLOBAL TRUST
FRANKLIN EMERGING MARKET DEBT OPPORTUNITIES FUND
SPECIAL MEETING OF SHAREHOLDERS
| Proposal 2. | To approve the use of a “manager of managers” structure whereby the Fund’s investment manager would be able to hire and replace subadvisers without shareholder approval: |
| | |
| | | Shares |
| |
For | | 21,855,206 |
| |
Against | | 14,063 |
| |
Abstain | | 15,074 |
| |
Broker Non-Votes | | 6,000,110 |
| |
Total Fund Shares Voted | | 27,884,451 |
| |
Total Fund Shares Outstanding* | | 44,049,604 |
| Proposal 3. | To approve an amended fundamental investment restriction regarding investments in commodities: |
| | | | |
| | | Shares | |
| |
For | | | 21,791,199 | |
| |
Against | | | 16,569 | |
| |
Abstain | | | 76,573 | |
| |
Broker Non-Votes | | | 6,000,110 | |
| |
Total Fund Shares Voted | | | 27,884,451 | |
| |
Total Fund Shares Outstanding* | | | 44,049,604 | |
| | | | | | |
| ftinstitutional.com | | Semiannual Report | | | 33 | |
FRANKLIN GLOBAL TRUST
FRANKLIN EMERGING MARKET DEBT OPPORTUNITIES FUND
Shareholder Information
Proxy Voting Policies and Procedures
The Fund’s investment manager has established Proxy Voting Policies and Procedures (Policies) that the Fund uses to determine how to vote proxies relating to portfolio securities. Shareholders may view the Fund’s complete Policies online at franklintempleton.com. Alternatively, shareholders may request copies of the Policies free of charge by calling the Proxy Group collect at (954) 527-7678 or by sending a written request to: Franklin Templeton Companies, LLC, 300 S.E. 2nd Street, Fort Lauderdale, FL 33301, Attention: Proxy Group. Copies of the Fund’s proxy voting records are also made available online at franklintempleton.com and posted on the US Securities and Exchange Commission’s website at sec.gov and reflect the most recent 12-month period ended June 30.
Quarterly Consolidated Statement of Investments
The Trust, on behalf of the Fund, files a complete consolidated statement of investments with the US Securities and Exchange Commission for the first and third quarters for each fiscal year on Form N-Q. Shareholders may view the filed Form N-Q by visiting the Commission’s website at sec.gov. The filed form may also be viewed and copied at the Commission’s Public Reference Room in Washington, DC. Information regarding the operations of the Public Reference Room may be obtained by calling (800) SEC-0330.
| | | | |
| 34 | | Semiannual Report | | ftinstitutional.com |
This page intentionally left blank.
This page intentionally left blank.
| | |
| | Semiannual Report Franklin Emerging Market Debt Opportunities Fund |
| | Investment Manager Franklin Templeton Investment Management Limited |
| | Distributor Franklin Templeton Distributors, Inc. |
| | Franklin Templeton Institutional Services (800) 321-8563 ftinstitutional.com |
Authorized for distribution only when accompanied or preceded by a summary prospectus and/or prospectus. Investors should carefully consider a fund’s investment goals, risks, charges and expenses before investing. A prospectus contains this and other information; please read it carefully before investing.
To help ensure we provide you with quality service, all calls to and from our service areas are monitored and/or recorded.
| | |
| © 2018 Franklin Templeton Investments. All rights reserved. | | 699 S 03/18 |
| | | | | | |
| | | | | | | Semiannual Report and Shareholder Letter January 31, 2018 |
Franklin Global Listed Infrastructure Fund
A SERIES OF FRANKLIN GLOBAL TRUST
Sign up for electronic delivery at franklintempleton.com/edelivery
Franklin Templeton Investments
Why choose Franklin Templeton Investments?
Successful investing begins with ambition. And achievement only comes when you reach for it. That’s why we continually strive to deliver better outcomes for investors. No matter what your goals are, our deep, global investment expertise allows us to offer solutions that can help.
During our more than 70 years of experience, we’ve managed through all kinds of markets—up, down and those in between. We’re always preparing for what may come next. It’s because of this, combined with our strength as one of the world’s largest asset managers that we’ve earned the trust of millions of investors around the world.
Dear Shareholder:
During the six months ended January 31, 2018, mostly upbeat global economic data, improved corporate earnings and supportive monetary policies benefited global securities markets. The European Central Bank (ECB) and the Bank of Japan (BOJ) kept their benchmark interest rates unchanged, while the US Federal Reserve (Fed) raised the target range for the federal funds rate 0.25% to 1.25%–1.50% at its December 2017 meeting amid signs of a growing US economy. The BOJ maintained its quantitative easing measures during the period, while the ECB began to reduce its bond purchases in January 2018. The Fed also began a gradual reduction in its balance sheet during the period as part of its ongoing plan to normalize US monetary policy. In this environment, US stocks, as measured by the Standard & Poor’s® 500 Index, and global developed market stocks, as measured by the MSCI World Index, generated strong returns for the six-month period.
We are committed to our long-term perspective and disciplined investment approach as we conduct a rigorous, fundamental analysis of securities with a regular emphasis on investment risk management.
We believe active, professional investment management serves investors well. We also recognize the important role of financial advisors in today’s markets and encourage investors to continue to seek their advice. Amid changing markets and economic conditions, we are confident investors with a well-diversified portfolio and a patient, long-term outlook should be well positioned for the years ahead.
Franklin Global Listed Infrastructure Fund’s semiannual report includes more detail about prevailing conditions and discussions about investment decisions during the period. Please remember all securities markets fluctuate, as do mutual fund share prices.
We thank you for investing with Franklin Templeton, welcome your questions and comments, and look forward to serving your future investment needs.
Sincerely,
Edward B. Jamieson
President and Chief Executive Officer –
Investment Management
Franklin Global Trust
This letter reflects our analysis and opinions as of January 31, 2018, unless otherwise indicated. The information is not a complete analysis of every aspect of any market, country, industry, security or fund. Statements of fact are from sources considered reliable.
| | | | | | | | |
| Not FDIC Insured | | | | | May Lose Value | | | | | No Bank Guarantee |
| | | | | | |
| franklintempleton.com | | Not part of the semiannual report | | | 1 | |
Contents
Semiannual Report
Visit franklintempleton.com for fund updates, to access your account, or to find helpful financial planning tools.
| | | | | | |
| | 2 | | | Semiannual Report | | franklintempleton.com |
Semiannual Report
Franklin Global Listed Infrastructure Fund
We are pleased to bring you Franklin Global Listed Infrastructure Fund’s semiannual report for the period ended January 31, 2018.
Your Fund’s Goal and Main Investments
The Fund seeks total investment return consisting of income and capital appreciation by investing, under normal market conditions, at least 80% of its net assets in infrastructure-related companies globally, as defined in the Fund’s prospectus.
Performance Overview
For the period under review, the Fund’s Class A shares generated a +3.67% cumulative total return. In comparison, the Standard & Poor’s (S&P®) Global Infrastructure Index, which tracks performance of stocks of large infrastructure companies around the world, posted a +2.84% cumulative total return.1 You can find more of the Fund’s performance data in the Performance Summary beginning on page 8.
Performance data represent past performance, which does not guarantee future results. Investment return and principal value will fluctuate, and you may have a gain or loss when you sell your shares. Current performance may differ from figures shown. For most recent month-end performance, go to franklintempleton.com or call (800) 342-5236.
Economic and Market Overview
The US economy continued to grow during the six months under review. The economy expanded in 2017’s fourth quarter, though at a slower pace compared to the third quarter, as lower inventory investment and higher imports partially offset the positive contributions of growth in consumer spending, business and housing investment, exports, and government spending. The manufacturing and services sectors expanded during the period. The unemployment rate decreased from 4.3% in July 2017 to 4.1% at period-end.2 Annual inflation, as measured by the Consumer Price Index, increased from 1.7% in July 2017 to 2.1% at period-end.2
Portfolio Composition
Based on Total Net Assets as of 1/31/18
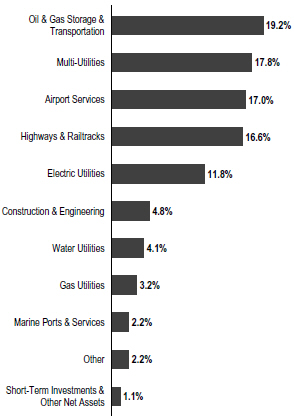
The US Federal Reserve (Fed) kept its target range for the federal funds unchanged at its meetings in the August-November period and began reducing its balance sheet in October. At its December meeting, the Fed raised its target range for the federal funds rate 0.25% to 1.25%–1.50%, as widely anticipated by the market. The Fed also confirmed that the monthly balance sheet reduction would increase from $10 billion to $20 billion beginning in January 2018. At its January 2018 meeting, the Fed left its benchmark interest rate unchanged, but expressed that it anticipated inflation to rise in 2018 and stabilize around the 2% target over the medium term.
1. Source: Morningstar.
The index is unmanaged and includes reinvestment of any income or distributions. It does not reflect any fees, expenses or sales charges. One cannot invest directly in an index, and an index is not representative of the Fund’s portfolio.
2. Source: US Bureau of Labor Statistics.
The dollar value, number of shares or principal amount, and names of all portfolio holdings are listed in the Fund’s Statement of Investments (SOI). The SOI begins on page 16.
| | | | | | |
| franklintempleton.com | | Semiannual Report | | | 3 | |
FRANKLIN GLOBAL LISTED INFRASTRUCTURE FUND
The broad US stock market, as measured by the S&P 500® Index, advanced for the six-month period ended January 31, 2018.
The global economy generally expanded during the six-month period under review. In this environment, global developed and emerging market stocks generated a +14.52% total return, as measured by the MSCI All Country World Index.1 Global markets were aided by price gains in oil and other commodities, generally upbeat economic data across regions, the European Central Bank’s (ECB’s) extension of its monetary easing program, and encouraging corporate earnings reports. The passage of the US tax reform bill also supported global stocks.
However, global markets reflected investor concerns about geopolitical tensions in the Korean peninsula and other regions, expectations that key central bankers around the world may potentially raise interest rates amid an improving economic outlook and political uncertainties in the US and the European Union.
In Europe, the UK’s economic growth accelerated in 2017’s fourth quarter over the previous quarter, largely due to growth in the services sector. In November, the Bank of England raised its key policy rate 0.25%, its first increase in a decade. The eurozone’s growth moderated in 2017’s fourth quarter over the previous quarter. The bloc’s annual inflation rate remained low and ended at the same level as in July 2017. The ECB kept its benchmark interest rate unchanged during the period. However, at its October meeting, the ECB extended the time frame for its massive bond-buying program from December 2017 to at least September 2018, while reducing the amount of monthly bond purchases in half beginning in January 2018.
In Asia, Japan’s quarterly gross domestic product (GDP) growth slowed in 2017’s fourth quarter compared to the third quarter, as a slowdown in business spending and contractions in private residential investment and government spending offset a recovery in private consumption. The Bank of Japan left its benchmark interest rate unchanged during the period and continued its monetary stimulus measures. China’s annual GDP grew at a stable rate in 2017’s fourth quarter compared to the prior-year period. The People’s Bank of China also left its benchmark interest rate unchanged during the period.
Investment Strategy
When selecting investments for the Fund’s portfolio, we use a bottom-up stock selection process that incorporates macro-level views in the evaluation process. Our portfolio construction process combines bottom-up analysis of individual stock and
Geographic Composition
Based on Total Net Assets as of 1/31/18
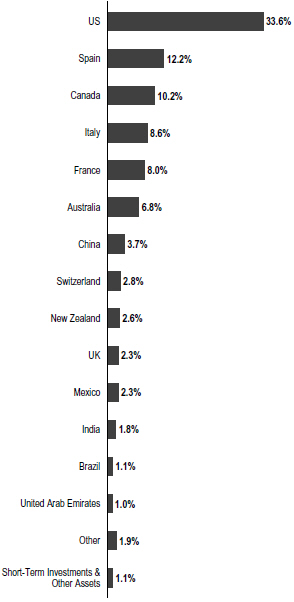
infrastructure market fundamentals with top-down macro overlays to provide country/regional, infrastructure sector and company size perspectives in identifying international/local cyclical and thematic trends that highlight investment opportunities. Under normal market conditions, the Fund invests at least 80% of its net assets in securities listed on a domestic or foreign exchange of companies that are located around the world (including emerging markets) and whose principal business is the ownership, management, construction, operation, use or financing of infrastructure assets. Under normal market conditions, the Fund expects to invest at least
| | | | |
| 4 | | Semiannual Report | | franklintempleton.com |
FRANKLIN GLOBAL LISTED INFRASTRUCTURE FUND
40% of its net assets in foreign securities. We may invest up to 20% of net assets in emerging markets and may invest in infrastructure-related companies of any market capitalization size. We may use derivative instruments, including currency forward and futures contracts, from time to time to help manage currency risks and manage local currency exposure.
|
What is a currency forward contract? A currency forward contract is an agreement between the Fund and a counterparty to buy or sell a foreign currency in exchange for another currency at a specific exchange rate on a future date. Currency forward contracts are privately traded in the interbank market, not on a centralized exchange. |
|
What is a futures contract? A futures contract is an agreement between the Fund and a counterparty made through a US or foreign futures exchange to buy or sell an underlying instrument or asset at a specific price on a future date. |
| | | | |
Top 10 Holdings | | | | |
1/31/18 | | | | |
| |
Company Sector/Industry, Country | | % of Total
Net Assets | |
Transurban Group | | | 6.2% | |
Highways & Railtracks, Australia | | | | |
Atlantia SpA | | | 4.5% | |
Highways & Railtracks, Italy | | | | |
Aena SME SA | | | 4.4% | |
Airport Services, Spain | | | | |
TransCanada Corp. | | | 4.3% | |
Oil & Gas Storage & Transportation, Canada | | | | |
Abertis Infraestructuras SA | | | 4.0% | |
Highways & Railtracks, Spain | | | | |
Sempra Energy | | | 4.0% | |
Multi-Utilities, US | | | | |
Pembina Pipeline Corp. | | | 3.8% | |
Oil & Gas Storage & Transportation, Canada | | | | |
Enel SpA | | | 3.8% | |
Electric Utilities, Italy | | | | |
DTE Energy Co. | | | 3.5% | |
Multi-Utilities, US | | | | |
Dominion Energy Inc. | | | 3.0% | |
Multi-Utilities, US | | | | |
Manager’s Discussion
During the six months under review, key contributors to the Fund’s performance relative to the S&P Global Infrastructure Index included stock selection in the utilities sector,3 with the Fund’s investment in Adani Transmission4 proving especially beneficial. Adani Transmission is an India-based company engaged in building and owning regulated transmission lines across India. Its shares rallied over the reporting period as investors welcomed the company’s aggressive expansion. The company recently completed its acquisition of transmission line assets from competitor Reliance Infrastructure (not a Fund holding) and signed a binding agreement toward period-end to buy Reliance’s Mumbai city electric distribution business. The market responded well to this deal, which drove the stock price to all-time highs.
Relative Fund performance was supported further by security selection in the energy sector,5 notably our investment in US-based pipeline operator Cheniere Energy Partners LP Holdings,6 which owns and operates the Sabine Pass liquid natural gas (LNG) terminal in Louisiana. This terminal has five LNG export trains, three of which started operations in 2017; one is expected to become operational in 2018 and the last one in 2019. All five trains are fully contracted for 20 years on a take-or-pay basis without any change in revenues. As the export trains started producing revenues, the market recognized the profit potential of these LNG export trains, bolstering shares of Cheniere Energy Partners.
Although the industrials sector7 overall detracted from relative performance, the Fund’s overweighted position in Eiffage,4 a French toll road operator and construction group, boosted results. During the period, traffic on its main toll road network, Autoroutes Paris-Rhin-Rhône, continued to exceed market expectations amid increased consumer confidence and strength in the French economy. Its third-quarter 2017 earnings report indicated solid construction growth, a business in which we anticipate potential cyclical upside. We believe the company’s debt refinancing efforts will support continued earnings momentum, and we expect dividends to grow due to stronger-than-expected cash flow generation. Generally, we continue to see more attractive relative valuation with companies that offer a combination of infrastructure
3. The utilities sector comprises electric utilities, gas utilities, independent power producers and energy traders, multi-utilities, renewable electricity and water utilities in the SOI.
4. No longer held by period-end.
5. The energy sector comprises oil and gas storage and transportation in the SOI.
6. Not part of the index.
7. The industrials sector comprises airport services, construction and engineering, highways and railtracks, and marine ports and services in the SOI.
See www.franklintempletondatasources.com for additional data provider information.
| | | | | | |
| franklintempleton.com | | Semiannual Report | | | 5 | |
FRANKLIN GLOBAL LISTED INFRASTRUCTURE FUND
construction and operation capabilities, compared to those that only manage portfolios of operational or brownfield toll roads.
In contrast, security selection and an underweighting in the industrials sector (specifically the transportation infrastructure industry) detracted from the Fund’s relative performance during the reporting period. For instance, the Fund’s underweighting in Getlink, the operator of the rail infrastructure in the Channel Tunnel that connects the UK with France, detracted from relative results. In prior periods, the stock underperformed other European transportation companies due to investor concerns about the potential effects that the UK’s exit from the European Union (Brexit) could have on traffic volumes through the tunnel. The stock has rebounded more recently as the market began to anticipate a less onerous Brexit and to recognize the French economy’s underlying strength. However, we continued to believe the company is not free from traffic volume risk. Additionally, the company recently made a significant investment in a transmission line designed to export French electricity to the UK, and we remained cautious of this project given management’s lack of expertise in electricity markets. We continued to prefer other transportation companies within our coverage, though we acknowledge that the transportation industry will likely outperform utilities more broadly as European economies continue to grow.
Although energy was an overall contributor at the sector level, the Fund’s investment in Canadian energy infrastructure company TransCanada dampened results. The company operates through three segments: natural gas pipelines, liquids pipelines and energy. TransCanada is in the process of reviving its once-abandoned Keystone XL crude oil pipeline project, which would deliver crude oil from Alberta to Texas. The project is estimated to cost between $8 billion and $10 billion, and investor concerns about the construction risk from such a large project negatively impacted stock performance.
Other key individual detractors from relative performance included PG&E, a northern and central California regulated utility engaged in the sale and delivery of electricity and natural gas to commercial and residential customers.4 We liked its business model as it is 100% regulated, and we believed it is one of the least-exposed among all utilities to tax changes from the Trump administration. Moreover, we considered its valuation attractive at the beginning of 2017 compared to other utilities, based on our bottom-up earnings projection model. However, in October 2017, Northern California was engulfed by major wildfires, and according to California law, the local utility (PG&E) could be liable for all damages related to the wildfires. As a result, the stock suffered a significant decline in
October 2017. Estimates for the loss from this fire ranged between $10 billion and $15 billion, and PG&E has insurance covering only $700 million. This marks the first time we have seen such massive wildfire liability for a utility in California, so we were not prepared for this type of unexpected natural disaster risk in the portfolio. On December 20, 2017, the company decided to suspend its quarterly dividend pending additional clarity on the wildfire liabilities, pressuring shares further.
It is important to recognize the effect of currency movements on the Fund’s performance. In general, if the value of the US dollar goes up compared with a foreign currency, an investment traded in that foreign currency will go down in value because it will be worth fewer US dollars. This can have a negative effect on Fund performance. Conversely, when the US dollar weakens in relation to a foreign currency, an investment traded in that foreign currency will increase in value, which can contribute to Fund performance. For the six months ended January 31, 2018, the US dollar declined in value relative to most currencies. As a result, the Fund’s performance was positively affected by the portfolio’s substantial investment in securities with non-US currency exposure. However, one cannot expect the same result in future periods.
| | | | |
| 6 | | Semiannual Report | | franklintempleton.com |
FRANKLIN GLOBAL LISTED INFRASTRUCTURE FUND
Thank you for your continued participation in Franklin Global Listed Infrastructure Fund. We look forward to serving your future investment needs.
| | |
| | |
| | Wilson Magee |
| |
 | |  |
| | Ketul Sakhpara, CFA |
| |
| | Emily Foshag, CFA |
| |
| | Portfolio Management Team |
The foregoing information reflects our analysis, opinions and portfolio holdings as of January 31, 2018, the end of the reporting period. The way we implement our main investment strategies and the resulting portfolio holdings may change depending on factors such as market and economic conditions. These opinions may not be relied upon as investment advice or an offer for a particular security. The information is not a complete analysis of every aspect of any market, country, industry, security or the Fund. Statements of fact are from sources considered reliable, but the investment manager makes no representation or warranty as to their completeness or accuracy. Although historical performance is no guarantee of future results, these insights may help you understand our investment management philosophy.
CFA® is a trademark owned by CFA Institute.
| | | | | | |
| franklintempleton.com | | Semiannual Report | | | 7 | |
FRANKLIN GLOBAL LISTED INFRASTRUCTURE FUND
Performance Summary as of January 31, 2018
The performance table does not reflect any taxes that a shareholder would pay on Fund dividends, capital gain distributions, if any, or any realized gains on the sale of Fund shares. Total return reflects reinvestment of the Fund’s dividends and capital gain distributions, if any, and any unrealized gains or losses. Your dividend income will vary depending on dividends or interest paid by securities in the Fund’s portfolio, adjusted for operating expenses of each class. Capital gain distributions are net profits realized from the sale of portfolio securities.
Performance as of 1/31/181
Cumulative total return excludes sales charges. Average annual total return includes maximum sales charges. Sales charges will vary depending on the size of the investment and the class of share purchased. The maximum is 5.75% and the minimum is 0%. Class A: 5.75% maximum initial sales charge; Advisor Class: no sales charges. For other share classes, visit franklintempleton.com.
| | | | | | | | |
| Share Class | | Cumulative
Total Return2 | | | Average Annual
Total Return3 | |
| | |
| A | | | | | | | | |
6-Month | | | +3.67% | | | | -2.27% | |
1-Year | | | +22.34% | | | | +15.30% | |
3-Year | | | +22.43% | | | | +4.90% | |
Since Inception (9/6/13) | | | +53.38% | | | | +8.73% | |
| | |
| Advisor | | | | | | | | |
6-Month | | | +3.72% | | | | +3.72% | |
1-Year | | | +22.57% | | | | +22.57% | |
3-Year | | | +23.43% | | | | +7.27% | |
Since Inception (9/6/13) | | | +55.14% | | | | +10.49% | |
Performance data represent past performance, which does not guarantee future results. Investment return and principal value will fluctuate, and you may have a gain or loss when you sell your shares. Current performance may differ from figures shown. For most recent month-end performance, go to franklintempleton.com or call (800) 342-5236. | |
See page 9 for Performance Summary footnotes.
| | | | |
| 8 | | Semiannual Report | | franklintempleton.com |
FRANKLIN GLOBAL LISTED INFRASTRUCTURE FUND
PERFORMANCE SUMMARY
| | |
Distributions (8/1/17–1/31/18) |
| |
| Share Class | | Net Investment
Income |
A | | $0.1586 |
C | | $0.1004 |
R | | $0.1262 |
R6 | | $0.1910 |
Advisor | | $0.1764 |
| | | | | | |
Total Annual Operating Expenses4 |
| | |
| Share Class | | With Waiver | | | Without Waiver |
A | | | 1.24% | | | 1.99% |
Advisor | | | 0.99% | | | 1.74% |
Each class of shares is available to certain eligible investors and has different annual fees and expenses, as described in the prospectus.
All investments involve risks, including possible loss of principal. Investments in infrastructure-related securities involve special risks, such as high interest costs, high leverage and increased susceptibility to adverse economic or regulatory developments affecting the sector. Special risks are associated with foreign investing, including currency-rate fluctuations, economic instability and political developments. Because the Fund may invest at least a significant portion of its assets in companies in a specific region, including Europe, the Fund is subject to greater risks of adverse developments in that region and/or the surrounding regions than a fund that is more broadly diversified geographically. Investments in utility company securities, if purchased for dividend yield, involve additional interest-rate risks. When interest rates have risen, the stock prices of these companies have tended to fall. Thus, as the prices of utility company stocks in the Fund adjust to a rise in interest rates, the Fund’s share price may decline. By focusing on an industry or group of industries, the Fund carries much greater risk of adverse developments and price movements in such industries than a fund that invests in a wider variety of industries. The Fund is actively managed but there is no guarantee that the manager’s investment decisions will produce the desired results. The Fund’s prospectus also includes a description of the main investment risks.
1. The Fund has an expense reduction contractually guaranteed through 11/30/19. Fund investment results reflect the expense reduction; without this reduction, the results would have been lower.
2. Cumulative total return represents the change in value of an investment over the periods indicated.
3. Average annual total return represents the average annual change in value of an investment over the periods indicated. Return for less than one year, if any, has not been annualized.
4. Figures are as stated in the Fund’s current prospectus and may differ from the expense ratios disclosed in the Your Fund’s Expenses and Financial Highlights sections in this report. In periods of market volatility, assets may decline significantly, causing total annual Fund operating expenses to become higher than the figures shown.
| | | | | | |
| franklintempleton.com | | Semiannual Report | | | 9 | |
FRANKLIN GLOBAL LISTED INFRASTRUCTURE FUND
Your Fund’s Expenses
As a Fund shareholder, you can incur two types of costs: (1) transaction costs, including sales charges (loads) on Fund purchases and redemptions; and (2) ongoing Fund costs, including management fees, distribution and service (12b-1) fees, and other Fund expenses. All mutual funds have ongoing costs, sometimes referred to as operating expenses. The table below shows ongoing costs of investing in the Fund and can help you understand these costs and compare them with those of other mutual funds. The table assumes a $1,000 investment held for the six months indicated.
Actual Fund Expenses
The table below provides information about actual account values and actual expenses in the columns under the heading “Actual.” In these columns the Fund’s actual return, which includes the effect of Fund expenses, is used to calculate the “Ending Account Value” for each class of shares. You can estimate the expenses you paid during the period by following these steps (of course, your account value and expenses will differ from those in this illustration): Divide your account value by $1,000 (if your account had an $8,600 value, then $8,600 ÷ $1,000 = 8.6). Then multiply the result by the number in the row for your class of shares under the headings “Actual” and “Expenses Paid During Period” (if Actual Expenses Paid During Period were $7.50, then 8.6 x $7.50 = $64.50). In this illustration, the actual expenses paid this period are $64.50.
Hypothetical Example for Comparison with Other Funds
Under the heading “Hypothetical” in the table, information is provided about hypothetical account values and hypothetical expenses based on the Fund’s actual expense ratio and an assumed rate of return of 5% per year before expenses, which is not the Fund’s actual return. This information may not be used to estimate the actual ending account balance or expenses you paid for the period, but it can help you compare ongoing costs of investing in the Fund with those of other funds. To do so, compare this 5% hypothetical example for the class of shares you hold with the 5% hypothetical examples that appear in the shareholder reports of other funds.
Please note that expenses shown in the table are meant to highlight ongoing costs and do not reflect any transactional costs. Therefore, information under the heading “Hypothetical” is useful in comparing ongoing costs only, and will not help you compare total costs of owning different funds. In addition, if transactional costs were included, your total costs would have been higher.
| | | | | | | | | | | | |
| | | | | Actual
(actual return after expenses) | | Hypothetical
(5% annual return before expenses) | | |
Share
Class | | Beginning
Account
Value 8/1/17 | | Ending
Account
Value 1/31/18 | | Expenses Paid During Period 8/1/17–1/31/181,2 | | Ending Account Value 1/31/18 | | Expenses Paid During
Period 8/1/17–1/31/181,2 | | Net
Annualized
Expense
Ratio2 |
| | | | | | |
A | | $1,000 | | $1,036.70 | | $7.14 | | $1,018.20 | | $7.07 | | 1.39% |
C | | $1,000 | | $1,032.60 | | $10.96 | | $1,014.42 | | $10.87 | | 2.14% |
R | | $1,000 | | $1,035.10 | | $8.67 | | $1,016.69 | | $8.59 | | 1.69% |
R6 | | $1,000 | | $1,038.30 | | $4.88 | | $1,020.42 | | $4.84 | | 0.95% |
Advisor | | $1,000 | | $1,037.20 | | $5.85 | | $1,019.46 | | $5.80 | | 1.14% |
1. Expenses are equal to the annualized expense ratio for the six-month period as indicated above—in the far right column—multiplied by the simple average account value over the period indicated, and then multiplied by 184/365 to reflect the one-half year period.
2. Reflects expenses after fee waivers and expense reimbursements. Does not include acquired fund fees and expenses.
| | | | |
| 10 | | Semiannual Report | | franklintempleton.com |
FRANKLIN GLOBAL TRUST
Financial Highlights
Franklin Global Listed Infrastructure Fund
| | | | | | | | | | | | | | | | | | | | |
| | | Six Months Ended January 31, 2018
(unaudited) | | | Year Ended July 31, | |
| | | | 2017 | | | 2016 | | | 2015 | | | 2014a | |
| |
| | | | | |
| Class A | | | | | | | | | | | | | | | | | | | | |
| | | | | |
Per share operating performance
(for a share outstanding throughout the period) | | | | | | | | | | | | | | | | | | | | |
| | | | | |
Net asset value, beginning of period | | | $13.66 | | | | $12.35 | | | | $11.81 | | | | $12.35 | | | | $10.00 | |
| | | | |
| | | | | |
Income from investment operationsb: | | | | | | | | | | | | | | | | | | | | |
| | | | | |
Net investment incomec | | | 0.10 | | | | 0.26 | | | | 0.22 | | | | 0.19 | | | | 0.27 | |
| | | | | |
Net realized and unrealized gains (losses) | | | 0.40 | | | | 1.27 | | | | 0.51 | | | | (0.34 | ) | | | 2.20 | |
| | | | |
| | | | | |
Total from investment operations. | | | 0.50 | | | | 1.53 | | | | 0.73 | | | | (0.15 | ) | | | 2.47 | |
| | | | |
| | | | | |
Less distributions from: | | | | | | | | | | | | | | | | | | | | |
| | | | | |
Net investment income | | | (0.16 | ) | | | (0.22 | ) | | | (0.18 | ) | | | (0.19 | ) | | | (0.11) | |
| | | | | |
Net realized gains | | | — | | | | — | | | | (0.01 | ) | | | (0.20 | ) | | | (0.01) | |
| | | | |
| | | | | |
Total distributions | | | (0.16 | ) | | | (0.22 | ) | | | (0.19 | ) | | | (0.39 | ) | | | (0.12) | |
| | | | |
| | | | | |
Net asset value, end of period | | | $14.00 | | | | $13.66 | | | | $12.35 | | | | $11.81 | | | | $12.35 | |
| | | | |
| | | | | |
Total returnd | | | 3.67% | | | | 12.68% | | | | 6.35% | | | | (1.08 | )% | | | 24.81% | |
| | | | | |
| Ratios to average net assetse | | | | | | | | | | | | | | | | | | | | |
| | | | | |
Expenses before waiver and payments by affiliates and expense reduction | | | 1.80% | | | | 1.99% | | | | 2.24% | | | | 2.21% | | | | 4.03% | |
| | | | | |
Expenses net of waiver and payments by affiliates and expense reductionf | | | 1.39% | | | | 1.38% | | | | 1.40% | | | | 1.45% | | | | 1.28% | |
| | | | | |
Net investment income | | | 1.43% | | | | 2.10% | | | | 1.93% | | | | 1.62% | | | | 2.59% | |
| | | | | |
| Supplemental data | | | | | | | | | | | | | | | | | | | | |
| | | | | |
Net assets, end of period (000’s) | | | $55,620 | | | | $39,991 | | | | $24,889 | | | | $28,568 | | | | $14,934 | |
| | | | | |
Portfolio turnover rate | | | 37.79% | | | | 71.81% | | | | 63.57% | | | | 50.75% | | | | 35.24% | |
aFor the period September 6, 2013 (commencement of operations) to July 31, 2014.
bThe amount shown for a share outstanding throughout the period may not correlate with the Statement of Operations for the period due to the timing of sales and repurchases of the Fund’s shares in relation to income earned and/or fluctuating fair value of the investments of the Fund.
cBased on average daily shares outstanding.
dTotal return does not reflect sales commissions or contingent deferred sales charges, if applicable, and is not annualized for periods less than one year.
eRatios are annualized for periods less than one year, except for non-recurring expenses, if any.
f Benefit of expense reduction rounds to less than 0.01%.
| | | | | | |
| franklintempleton.com | | The accompanying notes are an integral part of these financial statements. | Semiannual Report | | | 11 | |
FRANKLIN GLOBAL TRUST
FINANCIAL HIGHLIGHTS
Franklin Global Listed Infrastructure Fund (continued)
| | | | | | | | | | | | | | | | | | | | |
| | | Six Months Ended January 31, 2018 (unaudited) | | | Year Ended July 31, | |
| | | | 2017 | | | 2016 | | | 2015 | | | 2014a | |
| |
| | | | | |
| Class C | | | | | | | | | | | | | | | | | | | | |
| | | | | |
Per share operating performance
(for a share outstanding throughout the period) | | | | | | | | | | | | | | | | | | | | |
| | | | | |
Net asset value, beginning of period | | | $13.57 | | | | $12.28 | | | | $11.74 | | | | $12.28 | | | | $10.00 | |
| | | | |
| | | | | |
Income from investment operationsb: | | | | | | | | | | | | | | | | | | | | |
| | | | | |
Net investment incomec | | | 0.05 | | | | 0.17 | | | | 0.13 | | | | 0.11 | | | | 0.22 | |
| | | | | |
Net realized and unrealized gains (losses) | | | 0.39 | | | | 1.26 | | | | 0.51 | | | | (0.33 | ) | | | 2.16 | |
| | | | |
| | | | | |
Total from investment operations | | | 0.44 | | | | 1.43 | | | | 0.64 | | | | (0.22 | ) | | | 2.38 | |
| | | | |
| | | | | |
Less distributions from: | | | | | | | | | | | | | | | | | | | | |
| | | | | |
Net investment income | | | (0.10 | ) | | | (0.14 | ) | | | (0.09 | ) | | | (0.12 | ) | | | (0.09) | |
| | | | | |
Net realized gains | | | — | | | | — | | | | (0.01 | ) | | | (0.20 | ) | | | (0.01) | |
| | | | |
| | | | | |
Total distributions | | | (0.10 | ) | | | (0.14 | ) | | | (0.10 | ) | | | (0.32 | ) | | | (0.10) | |
| | | | |
| | | | | |
Net asset value, end of period | | | $13.91 | | | | $13.57 | | | | $12.28 | | | | $11.74 | | | | $12.28 | |
| | | | |
| | | | | |
Total returnd | | | 3.26% | | | | 11.86% | | | | 5.58% | | | | (1.78 | )% | | | 23.95% | |
| | | | | |
| Ratios to average net assetse | | | | | | | | | | | | | | | | | | | | |
| | | | | |
Expenses before waiver and payments by affiliates and expense reduction | | | 2.55% | | | | 2.74% | | | | 2.99% | | | | 2.91% | | | | 4.85% | |
| | | | | |
Expenses net of waiver and payments by affiliates and expense reductionf | | | 2.14% | | | | 2.13% | | | | 2.15% | | | | 2.15% | | | | 2.10% | |
| | | | | |
Net investment income | | | 0.68% | | | | 1.35% | | | | 1.18% | | | | 0.92% | | | | 1.77% | |
| | | | | |
| Supplemental data | | | | | | | | | | | | | | | | | | | | |
| | | | | |
Net assets, end of period (000’s) | | | $10,257 | | | | $8,299 | | | | $4,515 | | | | $4,855 | | | | $2,988 | |
| | | | | |
Portfolio turnover rate | | | 37.79% | | | | 71.81% | | | | 63.57% | | | | 50.75% | | | | 35.24% | |
aFor the period September 6, 2013 (commencement of operations) to July 31, 2014.
bThe amount shown for a share outstanding throughout the period may not correlate with the Statement of Operations for the period due to the timing of sales and repurchases of the Fund’s shares in relation to income earned and/or fluctuating fair value of the investments of the Fund.
cBased on average daily shares outstanding.
dTotal return does not reflect sales commissions or contingent deferred sales charges, if applicable, and is not annualized for periods less than one year.
eRatios are annualized for periods less than one year, except for non-recurring expenses, if any.
fBenefit of expense reduction rounds to less than 0.01%.
| | | | |
| 12 | | Semiannual Report | The accompanying notes are an integral part of these financial statements. | | franklintempleton.com |
FRANKLIN GLOBAL TRUST
FINANCIAL HIGHLIGHTS
Franklin Global Listed Infrastructure Fund (continued)
| | | | | | | | | | | | | | | | | | | | |
| | | Six Months Ended January 31, 2018
(unaudited) | | | Year Ended July 31, | |
| | | | 2017 | | | 2016 | | | 2015 | | | 2014a | |
| |
| | | | | |
| Class R | | | | | | | | | | | | | | | | | | | | |
| | | | | |
Per share operating performance
(for a share outstanding throughout the period) | | | | | | | | | | | | | | | | | | | | |
| | | | | |
Net asset value, beginning of period | | | $13.64 | | | | $12.34 | | | | $11.80 | | | | $12.32 | | | | $10.00 | |
| | | | |
| | | | | |
Income from investment operationsb: | | | | | | | | | | | | | | | | | | | | |
| | | | | |
Net investment incomec | | | 0.08 | | | | 0.24 | | | | 0.19 | | | | 0.16 | | | | 0.25 | |
| | | | | |
Net realized and unrealized gains (losses) | | | 0.40 | | | | 1.27 | | | | 0.51 | | | | (0.33 | ) | | | 2.18 | |
| | | | |
| | | | | |
Total from investment operations | | | 0.48 | | | | 1.51 | | | | 0.70 | | | | (0.17 | ) | | | 2.43 | |
| | | | |
| | | | | |
Less distributions from: | | | | | | | | | | | | | | | | | | | | |
| | | | | |
Net investment income | | | (0.13 | ) | | | (0.21 | ) | | | (0.15 | ) | | | (0.15 | ) | | | (0.10) | |
| | | | | |
Net realized gains | | | — | | | | — | | | | (0.01 | ) | | | (0.20 | ) | | | (0.01) | |
| | | | |
| | | | | |
Total distributions | | | (0.13 | ) | | | (0.21 | ) | | | (0.16 | ) | | | (0.35 | ) | | | (0.11) | |
| | | | |
| | | | | |
Net asset value, end of period | | | $13.99 | | | | $13.64 | | | | $12.34 | | | | $11.80 | | | | $12.32 | |
| | | | |
| | | | | |
Total returnd | | | 3.51% | | | | 12.48% | | | | 6.08% | | | | (1.29 | )% | | | 24.48% | |
| | | | | |
| Ratios to average net assetse | | | | | | | | | | | | | | | | | | | | |
| | | | | |
Expenses before waiver and payments by affiliates and expense reduction | | | 2.10% | | | | 2.19% | | | | 2.47% | | | | 2.41% | | | | 4.35% | |
| | | | | |
Expenses net of waiver and payments by affiliates and expense reductionf | | | 1.69% | | | | 1.58% | | | | 1.63% | | | | 1.65% | | | | 1.60% | |
| | | | | |
Net investment income | | | 1.13% | | | | 1.90% | | | | 1.70% | | | | 1.42% | | | | 2.27% | |
| | | | | |
| Supplemental data | | | | | | | | | | | | | | | | | | | | |
| | | | | |
Net assets, end of period (000’s) | | | $92 | | | | $96 | | | | $63 | | | | $62 | | | | $81 | |
| | | | | |
Portfolio turnover rate | | | 37.79% | | | | 71.81% | | | | 63.57% | | | | 50.75% | | | | 35.24% | |
aFor the period September 6, 2013 (commencement of operations) to July 31, 2014.
bThe amount shown for a share outstanding throughout the period may not correlate with the Statement of Operations for the period due to the timing of sales and repurchases of the Fund’s shares in relation to income earned and/or fluctuating fair value of the investments of the Fund.
cBased on average daily shares outstanding.
dTotal return is not annualized for periods less than one year.
eRatios are annualized for periods less than one year, except for non-recurring expenses, if any.
fBenefit of expense reduction rounds to less than 0.01%.
| | | | | | |
| franklintempleton.com | | The accompanying notes are an integral part of these financial statements. | Semiannual Report | | | 13 | |
FRANKLIN GLOBAL TRUST
FINANCIAL HIGHLIGHTS
Franklin Global Listed Infrastructure Fund (continued)
| | | | | | | | | | | | | | | | | | | | |
| | | Six Months Ended January 31, 2018
(unaudited) | | | Year Ended July 31, | |
| | | | 2017 | | | 2016 | | | 2015 | | | 2014a | |
| |
| | | | | |
| Class R6 | | | | | | | | | | | | | | | | | | | | |
| | | | | |
Per share operating performance
(for a share outstanding throughout the period) | | | | | | | | | | | | | | | | | | | | |
| | | | | |
Net asset value, beginning of period | | | $13.70 | | | | $12.37 | | | | $11.83 | | | | $12.36 | | | | $10.00 | |
| | | | |
| | | | | |
Income from investment operationsb: | | | | | | | | | | | | | | | | | | | | |
| | | | | |
Net investment incomec | | | 0.14 | | | | 0.30 | | | | 0.27 | | | | 0.23 | | | | 0.26 | |
| | | | | |
Net realized and unrealized gains (losses) | | | 0.38 | | | | 1.30 | | | | 0.50 | | | | (0.33 | ) | | | 2.24 | |
| | | | |
| | | | | |
Total from investment operations. | | | 0.52 | | | | 1.60 | | | | 0.77 | | | | (0.10 | ) | | | 2.50 | |
| | | | |
| | | | | |
Less distributions from: | | | | | | | | | | | | | | | | | | | | |
| | | | | |
Net investment income | | | (0.19 | ) | | | (0.27 | ) | | | (0.22 | ) | | | (0.23 | ) | | | (0.13) | |
| | | | | |
Net realized gains | | | — | | | | — | | | | (0.01 | ) | | | (0.20 | ) | | | (0.01) | |
| | | | |
| | | | | |
Total distributions | | | (0.19 | ) | | | (0.27 | ) | | | (0.23 | ) | | | (0.43 | ) | | | (0.14) | |
| | | | |
| | | | | |
Net asset value, end of period | | | $14.03 | | | | $13.70 | | | | $12.37 | | | | $11.83 | | | | $12.36 | |
| | | | |
| | | | | |
Total returnd | | | 3.83% | | | | 13.27% | | | | 6.78% | | | | (0.75 | )% | | | 25.20% | |
| | | | | |
| Ratios to average net assetse | | | | | | | | | | | | | | | | | | | | |
| | | | | |
Expenses before waiver and payments by affiliates and expense reduction | | | 1.39% | | | | 2.31% | | | | 2.26% | | | | 2.17% | | | | 5.21% | |
| | | | | |
Expenses net of waiver and payments by affiliates and expense reductionf | | | 0.95% | | | | 0.94% | | | | 1.00% | | | | 1.07% | | | | 1.03% | |
| | | | | |
Net investment income | | | 1.87% | | | | 2.54% | | | | 2.33% | | | | 2.00% | | | | 2.84% | |
| | | | | |
| Supplemental data | | | | | | | | | | | | | | | | | | | | |
| | | | | |
Net assets, end of period (000’s) | | | $2,017 | | | | $14 | | | | $12 | | | | $12 | | | | $12 | |
| | | | | |
Portfolio turnover rate | | | 37.79% | | | | 71.81% | | | | 63.57% | | | | 50.75% | | | | 35.24% | |
aFor the period September 6, 2013 (commencement of operations) to July 31, 2014.
bThe amount shown for a share outstanding throughout the period may not correlate with the Statement of Operations for the period due to the timing of sales and repurchases of the Fund’s shares in relation to income earned and/or fluctuating fair value of the investments of the Fund.
cBased on average daily shares outstanding.
dTotal return is not annualized for periods less than one year.
eRatios are annualized for periods less than one year, except for non-recurring expenses, if any.
fBenefit of expense reduction rounds to less than 0.01%.
| | | | |
| 14 | | Semiannual Report | The accompanying notes are an integral part of these financial statements. | | franklintempleton.com |
FRANKLIN GLOBAL TRUST
FINANCIAL HIGHLIGHTS
Franklin Global Listed Infrastructure Fund (continued)
| | | | | | | | | | | | | | | | | | | | |
| | | Six Months Ended January 31, 2018
(unaudited) | | | Year Ended July 31, | |
| | | | 2017 | | | 2016 | | | 2015 | | | 2014a | |
| |
| | | | | |
| Advisor Class | | | | | | | | | | | | | | | | | | | | |
| | | | | |
Per share operating performance
(for a share outstanding throughout the period) | | | | | | | | | | | | | | | | | | | | |
| | | | | |
Net asset value, beginning of period | | | $13.69 | | | | $12.37 | | | | $11.83 | | | | $12.36 | | | | $10.00 | |
| | | | |
| | | | | |
Income from investment operationsb: | | | | | | | | | | | | | | | | | | | | |
| | | | | |
Net investment incomec | | | 0.12 | | | | 0.32 | | | | 0.25 | | | | 0.20 | | | | 0.29 | |
| | | | | |
Net realized and unrealized gains (losses) | | | 0.39 | | | | 1.26 | | | | 0.51 | | | | (0.31 | ) | | | 2.20 | |
| | | | |
| | | | | |
Total from investment operations | | | 0.51 | | | | 1.58 | | | | 0.76 | | | | (0.11 | ) | | | 2.49 | |
| | | | |
| | | | | |
Less distributions from: | | | | | | | | | | | | | | | | | | | | |
| | | | | |
Net investment income | | | (0.18 | ) | | | (0.26 | ) | | | (0.21 | ) | | | (0.22 | ) | | | (0.12) | |
| | | | | |
Net realized gains | | | — | | | | — | | | | (0.01 | ) | | | (0.20 | ) | | | (0.01) | |
| | | | |
| | | | | |
Total distributions | | | (0.18 | ) | | | (0.26 | ) | | | (0.22 | ) | | | (0.42 | ) | | | (0.13) | |
| | | | |
| | | | | |
Net asset value, end of period | | | $14.02 | | | | $13.69 | | | | $12.37 | | | | $11.83 | | | | $12.36 | |
| | | | |
| | | | | |
Total returnd | | | 3.72% | | | | 13.05% | | | | 6.53% | | | | (0.74 | )% | | | 25.13% | |
| | | | | |
| Ratios to average net assetse | | | | | | | | | | | | | | | | | | | | |
| | | | | |
Expenses before waiver and payments by affiliates and expense reduction | | | 1.55% | | | | 1.74% | | | | 1.99% | | | | 1.91% | | | | 3.85% | |
| | | | | |
Expenses net of waiver and payments by affiliates and expense reductionf | | | 1.14% | | | | 1.13% | | | | 1.15% | | | | 1.15% | | | | 1.10% | |
| | | | | |
Net investment income | | | 1.68% | | | | 2.35% | | | | 2.18% | | | | 1.92% | | | | 2.77% | |
| | | | | |
| Supplemental data | | | | | | | | | | | | | | | | | | | | |
| | | | | |
Net assets, end of period (000’s) | | | $9,400 | | | | $5,220 | | | | $957 | | | | $556 | | | | $357 | |
| | | | | |
Portfolio turnover rate | | | 37.79% | | | | 71.81% | | | | 63.57% | | | | 50.75% | | | | 35.24% | |
aFor the period September 6, 2013 (commencement of operations) to July 31, 2014.
bThe amount shown for a share outstanding throughout the period may not correlate with the Statement of Operations for the period due to the timing of sales and repurchases of the Fund’s shares in relation to income earned and/or fluctuating fair value of the investments of the Fund.
cBased on average daily shares outstanding.
dTotal return is not annualized for periods less than one year.
eRatios are annualized for periods less than one year, except for non-recurring expenses, if any.
fBenefit of expense reduction rounds to less than 0.01%.
| | | | | | |
| franklintempleton.com | | The accompanying notes are an integral part of these financial statements. | Semiannual Report | | | 15 | |
FRANKLIN GLOBAL TRUST
Statement of Investments, January 31, 2018 (unaudited)
Franklin Global Listed Infrastructure Fund
| | | | | | | | | | | | | | |
| | | | | Country | | | Shares/
Units | | | Value | |
| | | | | | | | | | | | | | |
| | | Common Stocks and Other Equity Interests 98.9% | | | | | | | | | |
| | Airport Services 17.0% | | | | | | | | | | | | |
| | Aena SME SA | | | Spain | | | | 15,882 | | | $ | 3,459,297 | |
| | Aeroports de Paris SA | | | France | | | | 9,691 | | | | 2,012,768 | |
| | Auckland International Airport Ltd. | | | New Zealand | | | | 407,791 | | | | 2,011,992 | |
| | Beijing Capital International Airport Co. Ltd. | | | China | | | | 572,000 | | | | 867,210 | |
| | Enav SpA | | | Italy | | | | 51,170 | | | | 267,694 | |
| | Flughafen Zurich AG | | | Switzerland | | | | 8,511 | | | | 2,168,431 | |
| | Grupo Aeroportuario del Centro Norte SAB de CV, ADR | | | Mexico | | | | 9,000 | | | | 368,370 | |
| | Grupo Aeroportuario del Pacifico SAB de CV, ADR | | | Mexico | | | | 13,051 | | | | 1,368,397 | |
| | Japan Airport Terminal Co. Ltd. | | | Japan | | | | 16,200 | | | | 624,646 | |
| | | | | | | | | | | | | | |
| | | | | | | | | | | | | 13,148,805 | |
| | | | | | | | | | | | | | |
| | Construction & Engineering 4.8% | | | | | | | | | | | | |
| | Eiffage SA | | | France | | | | 11,056 | | | | 1,340,430 | |
| a | | Ferrovial SA | | | Spain | | | | 36,737 | | | | 842,592 | |
| | Sadbhav Engineering Ltd. | | | India | | | | 109,413 | | | | 701,476 | |
| | Vinci SA | | | France | | | | 7,867 | | | | 849,684 | |
| | | | | | | | | | | | | | |
| | | | | | | | | | | | | 3,734,182 | |
| | | | | | | | | | | | | | |
| | Electric Utilities 11.8% | | | | | | | | | | | | |
| | American Electric Power Co. Inc. | | | United States | | | | 17,570 | | | | 1,208,464 | |
| | Emera Inc. | | | Canada | | | | 3,700 | | | | 136,864 | |
| | Enel SpA | | | Italy | | | | 460,055 | | | | 2,918,501 | |
| | Exelon Corp. | | | United States | | | | 13,320 | | | | 512,953 | |
| | Iberdrola SA | | | Spain | | | | 117,111 | | | | 953,451 | |
| a | | Iberdrola SA, interim line | | | Spain | | | | 2,405 | | | | 19,580 | |
| | NextEra Energy Inc. | | | United States | | | | 11,540 | | | | 1,828,167 | |
| | SSE PLC | | | United Kingdom | | | | 38,042 | | | | 704,215 | |
| | Xcel Energy Inc. | | | United States | | | | 18,190 | | | | 830,192 | |
| | | | | | | | | | | | | | |
| | | | | | | | | | | | | 9,112,387 | |
| | | | | | | | | | | | | | |
| | Gas Utilities 3.2% | | | | | | | | | | | | |
| | Atmos Energy Corp | | | United States | | | | 2,600 | | | | 215,540 | |
| | ENN Energy Holdings Ltd. | | | China | | | | 105,000 | | | | 810,717 | |
| | Gujarat State Petronet Ltd. | | | India | | | | 209,903 | | | | 669,900 | |
| | Southwest Gas Holdings Inc. | | | United States | | | | 10,300 | | | | 757,874 | |
| | | | | | | | | | | | | | |
| | | | | | | | | | | | | 2,454,031 | |
| | | | | | | | | | | | | | |
| | Highways & Railtracks 16.6% | | | | | | | | | | | | |
| | Abertis Infraestructuras SA | | | Spain | | | | 128,723 | | | | 3,119,358 | |
| | Atlantia SpA | | | Italy | | | | 105,478 | | | | 3,493,630 | |
| | CCR SA | | | Brazil | | | | 85,600 | | | | 421,041 | |
| | Getlink SE | | | France | | | | 45,079 | | | | 632,386 | |
| | Macquarie Atlas Roads Group | | | Australia | | | | 94,957 | | | | 439,177 | |
| | Transurban Group | | | Australia | | | | 493,147 | | | | 4,776,185 | |
| | | | | | | | | | | | | | |
| | | | | | | | | | | | | 12,881,777 | |
| | | | | | | | | | | | | | |
| | Independent Power Producers & Energy Traders 0.4% | | | | | | | | | | | | |
| | Uniper SE | | | Germany | | | | 11,269 | | | | 336,177 | |
| | | | | | | | | | | | | | |
| | Integrated Telecommunication Services 1.4% | | | | | | | | | | | | |
| | Cellnex Telecom SAU | | | Spain | | | | 39,431 | | | | 1,064,698 | |
| | | | | | | | | | | | | | |
| | | | |
| 16 | | Semiannual Report | | franklintempleton.com |
FRANKLIN GLOBAL TRUST
STATEMENT OF INVESTMENTS (UNAUDITED)
Franklin Global Listed Infrastructure Fund (continued)
| | | | | | | | | | | | | | |
| | | | | Country | | | Shares/
Units | | | Value | |
| | | | | | | | | | | | | | |
| | | Common Stocks and Other Equity Interests (continued) | | | | | | | | | |
| | | Marine Ports & Services 2.2% | | | | | | | | | |
| | China Merchants Port Holdings Co. Ltd. | | | China | | | | 124,000 | | | $ | 328,122 | |
| | COSCO Shipping Ports Ltd. | | | China | | | | 406,000 | | �� | | 425,063 | |
| | DP World Ltd. | | | United Arab Emirates | | | | 28,878 | | | | 765,556 | |
| | Global Ports Holding Ltd. | | | Turkey | | | | 11,679 | | | | 71,264 | |
| b | | Global Ports Holding Ltd., 144A | | | Turkey | | | | 24,481 | | | | 149,381 | |
| | | | | | | | | | | | | | |
| | | | | | | | | | | | | 1,739,386 | |
| | | | | | | | | | | | | | |
| | | Multi-Utilities 17.8% | | | | | | | | | |
| | CMS Energy Corp. | | | United States | | | | 12,900 | | | | 577,275 | |
| | Dominion Energy Inc. | | | United States | | | | 30,200 | | | | 2,308,488 | |
| | DTE Energy Co. | | | United States | | | | 25,450 | | | | 2,688,538 | |
| | E.ON SE | | | Germany | | | | 28,390 | | | | 298,136 | |
| | Engie SA | | | France | | | | 80,908 | | | | 1,404,196 | |
| | NiSource Inc. | | | United States | | | | 78,400 | | | | 1,934,912 | |
| | Public Service Enterprise Group Inc. | | | United States | | | | 16,400 | | | | 850,668 | |
| | Sempra Energy | | | United States | | | | 28,760 | | | | 3,077,895 | |
| | Unitil Corp. | | | United States | | | | 14,500 | | | | 641,045 | |
| | | | | | | | | | | | | | |
| | | | | | | | | | | | | 13,781,153 | |
| | | | | | | | | | | | | | |
| | | Oil & Gas Storage & Transportation 19.2% | | | | | | | | | |
| a | | Cheniere Energy Inc. | | | United States | | | | 12,450 | | | | 704,172 | |
| | Cheniere Energy Partners LP Holdings LLC | | | United States | | | | 78,080 | | | | 2,222,938 | |
| | Enbridge Inc. | | | Canada | | | | 32,244 | | | | 1,180,397 | |
| | Energy Transfer Equity LP | | | United States | | | | 79,187 | | | | 1,449,122 | |
| | EQT GP Holdings LP | | | United States | | | | 24,563 | | | | 681,132 | |
| | ONEOK Inc. | | | United States | | | | 11,300 | | | | 665,118 | |
| | Pembina Pipeline Corp. | | | Canada | | | | 86,629 | | | | 2,953,013 | |
| | Targa Resources Corp. | | | United States | | | | 10,420 | | | | 500,160 | |
| | TransCanada Corp. | | | Canada | | | | 72,907 | | | | 3,356,549 | |
| | The Williams Cos. Inc. | | | United States | | | | 36,840 | | | | 1,156,408 | |
| | | | | | | | | | | | | | |
| | | | | | | | | | | | | 14,869,009 | |
| | | | | | | | | | | | | | |
| | | Renewable Electricity 0.4% | | | | | | | | | |
| | Boralex Inc., A | | | Canada | | | | 16,600 | | | | 319,031 | |
| | | | | | | | | | | | | | |
| | | Water Utilities 4.1% | | | | | | | | | |
| | American Water Works Co. Inc. | | | United States | | | | 12,820 | | | | 1,066,239 | |
| | Beijing Enterprises Water Group Ltd. | | | China | | | | 706,000 | | | | 508,108 | |
| | Cia de Saneamento do Parana, units consisting of common stock and preferred stock | | | Brazil | | | | 24,600 | | | | 448,712 | |
| | Pennon Group PLC | | | United Kingdom | | | | 109,935 | | | | 1,121,040 | |
| | | | | | | | | | | | | | |
| | | | | | | | | | | | | 3,144,099 | |
| | | | | | | | | | | | | | |
| | Total Common Stocks and Other Equity Interests
(Cost $66,445,803) | | | | | | | | | | | 76,584,735 | |
| | | | | | | | | | | | | | |
| | | | | | |
| franklintempleton.com | | Semiannual Report | | | 17 | |
FRANKLIN GLOBAL TRUST
STATEMENT OF INVESTMENTS (UNAUDITED)
Franklin Global Listed Infrastructure Fund (continued)
| | | | | | | | | | | | | | |
| | | | | Country | | | Shares | | | Value | |
| | | Short Term Investments (Cost $916,241) 1.2% | | | | | | | | | |
| | Money Market Funds 1.2% | | | | | | | | | | | | |
| c,d | | Institutional Fiduciary Trust Money Market Portfolio, 0.96% | | | United States | | | | 916,241 | | | $ | 916,241 | |
| | | | | | | | | | | | | | |
| | | Total Investments (Cost $67,362,044) 100.1% | | | | | | | | 77,500,976 | |
| | Other Assets, less Liabilities (0.1)% | | | | | | | | | | | (115,998 | ) |
| | | | | | | | | | | | | | |
| | | Net Assets 100.0% | | | | | | | | $77,384,978 | |
| | | | | | | | | | | | | | |
See Abbreviations on page 30.
aNon-income producing.
bSecurity was purchased pursuant to Rule 144A under the Securities Act of 1933 and may be sold in transactions exempt from registration only to qualified institutional buyers or in a public offering registered under the Securities Act of 1933. This security has been deemed liquid under guidelines approved by the Trust’s Board of Trustees. At January 31, 2018, the value of this security was $149,381, representing 0.2% of net assets.
cSee Note 3(f) regarding investments in affiliated management investment companies.
dThe rate shown is the annualized seven-day yield at period end.
| | | | |
| 18 | | Semiannual Report | The accompanying notes are an integral part of these financial statements. | | franklintempleton.com |
FRANKLIN GLOBAL TRUST
Financial Statements
Statement of Assets and Liabilities
January 31, 2018 (unaudited)
Franklin Global Listed Infrastructure Fund
| | | | |
Assets: | | | | |
Investments in securities: | | | | |
Cost - Unaffiliated issuers | | | $66,445,803 | |
Cost - Non-controlled affiliates (Note 3f) | | | 916,241 | |
| | | | |
| |
Value - Unaffiliated issuers | | | $76,584,735 | |
Value - Non-controlled affiliates (Note 3f) | | | 916,241 | |
Receivables: | | | | |
Investment securities sold | | | 187,091 | |
Capital shares sold | | | 505,799 | |
Dividends and interest | | | 172,467 | |
Other assets | | | 3 | |
| | | | |
| |
Total assets | | | 78,366,336 | |
| | | | |
Liabilities: | | | | |
Payables: | | | | |
Investment securities purchased | | | 795,708 | |
Capital shares redeemed | | | 66,213 | |
Management fees | | | 42,703 | |
Distribution fees | | | 19,821 | |
Transfer agent fees | | | 16,514 | |
Deferred tax | | | 18,337 | |
Accrued expenses and other liabilities | | | 22,062 | |
| | | | |
| |
Total liabilities | | | 981,358 | |
| | | | |
| |
Net assets, at value | | | $77,384,978 | |
| | | | |
Net assets consist of: | | | | |
Paid-in capital | | | $69,408,144 | |
Undistributed net investment income | | | 76,493 | |
Net unrealized appreciation (depreciation) | | | 10,125,636 | |
Accumulated net realized gain (loss) | | | (2,225,295 | ) |
| | | | |
| |
Net assets, at value | | | $77,384,978 | |
| | | | |
| | | | | | |
| franklintempleton.com | | The accompanying notes are an integral part of these financial statements. | Semiannual Report | | | 19 | |
FRANKLIN GLOBAL TRUST
FINANCIAL STATEMENTS
Statement of Assets and Liabilities (continued)
January 31, 2018 (unaudited)
Franklin Global Listed Infrastructure Fund
| | | | |
| |
| Class A: | | | | |
Net assets, at value | | $ | 55,620,213 | |
| | | | |
Shares outstanding | | | 3,973,544 | |
| | | | |
Net asset value per sharea | | | $14.00 | |
| | | | |
Maximum offering price per share (net asset value per share ÷ 94.25%) | | | $14.85 | |
| | | | |
| |
| Class C: | | | | |
Net assets, at value | | $ | 10,256,673 | |
| | | | |
Shares outstanding | | | 737,512 | |
| | | | |
Net asset value and maximum offering price per sharea | | | $13.91 | |
| | | | |
| |
| Class R: | | | | |
Net assets, at value | | $ | 91,562 | |
| | | | |
Shares outstanding | | | 6,546 | |
| | | | |
Net asset value and maximum offering price per share | | | $13.99 | |
| | | | |
| |
| Class R6: | | | | |
Net assets, at value | | $ | 2,016,745 | |
| | | | |
Shares outstanding | | | 143,703 | |
| | | | |
Net asset value and maximum offering price per share | | | $14.03 | |
| | | | |
| |
| Advisor Class: | | | | |
Net assets, at value | | $ | 9,399,785 | |
| | | | |
Shares outstanding | | | 670,223 | |
| | | | |
Net asset value and maximum offering price per share | | | $14.02 | |
| | | | |
aRedemption price is equal to net asset value less contingent deferred sales charges, if applicable.
| | | | |
| 20 | | Semiannual Report | The accompanying notes are an integral part of these financial statements. | | franklintempleton.com |
FRANKLIN GLOBAL TRUST
FINANCIAL STATEMENTS
Statement of Operations
for the six months ended January 31, 2018 (unaudited)
Franklin Global Listed Infrastructure Fund
| | | | |
Investment income: | | | | |
Dividends: (net of foreign taxes)* | | | | |
Unaffiliated issuers | | $ | 908,130 | |
Non-controlled affiliates (Note 3f) | | | 3,537 | |
| | | | |
| |
Total investment income | | | 911,667 | |
| | | | |
Expenses: | | | | |
Management fees (Note 3a) | | | 323,273 | |
Distribution fees: (Note 3c) | | | | |
Class A | | | 59,314 | |
Class C | | | 46,206 | |
Class R | | | 254 | |
Transfer agent fees: (Note 3e) | | | | |
Class A | | | 68,476 | |
Class C | | | 13,335 | |
Class R | | | 135 | |
Class R6 | | | 390 | |
Advisor Class | | | 10,303 | |
Custodian fees (Note 4) | | | 3,756 | |
Reports to shareholders | | | 8,625 | |
Registration and filing fees | | | 41,310 | |
Professional fees | | | 40,067 | |
Trustees’ fees and expenses | | | 2 | |
Other | | | 6,233 | |
| | | | |
| |
Total expenses | | | 621,679 | |
Expense reductions (Note 4) | | | (222 | ) |
Expenses waived/paid by affiliates (Note 3f and 3g) | | | (146,621 | ) |
| | | | |
| |
Net expenses | | | 474,836 | |
| | | | |
| |
Net investment income | | | 436,831 | |
| | | | |
Realized and unrealized gains (losses): | | | | |
Net realized gain (loss) from: | | | | |
Investments:# | | | | |
Unaffiliated issuers | | | 979,593 | |
Foreign currency transactions | | | (29,869 | ) |
| | | | |
| |
Net realized gain (loss) | | | 949,724 | |
| | | | |
Net change in unrealized appreciation (depreciation) on: | | | | |
Investments: | | | | |
Unaffiliated issuers | | | 881,987 | |
Translation of other assets and liabilities denominated in foreign currencies | | | 2,066 | |
Change in deferred taxes on unrealized appreciation | | | 45,612 | |
| | | | |
| |
Net change in unrealized appreciation (depreciation) | | | 929,665 | |
| | | | |
| |
Net realized and unrealized gain (loss) | | | 1,879,389 | |
| | | | |
| |
Net increase (decrease) in net assets resulting from operations | | $ | 2,316,220 | |
| | | | |
| |
*Foreign taxes withheld on dividends | | $ | 71,457 | |
#Net of foreign taxes | | $ | 68,890 | |
| | | | | | |
| franklintempleton.com | | The accompanying notes are an integral part of these financial statements. | Semiannual Report | | | 21 | |
FRANKLIN GLOBAL TRUST
FINANCIAL STATEMENTS
Statements of Changes in Net Assets
Franklin Global Listed Infrastructure Fund
| | | | | | | | |
| | | Six Months Ended
January 31, 2018
(unaudited) | | | Year Ended
July 31, 2017 | |
Increase (decrease) in net assets: | | | | | | | | |
Operations: | | | | | | | | |
Net investment income | | $ | 436,831 | | | $ | 747,100 | |
Net realized gain (loss) | | | 949,724 | | | | (73,447 | ) |
Net change in unrealized appreciation (depreciation) | | | 929,665 | | | | 5,154,198 | |
| | | | |
| | |
Net increase (decrease) in net assets resulting from operations | | | 2,316,220 | | | | 5,827,851 | |
| | | | |
Distributions to shareholders from: | | | | | | | | |
Net investment income: | | | | | | | | |
Class A | | | (531,578 | ) | | | (504,180 | ) |
Class C | | | (65,288 | ) | | | (61,544 | ) |
Class R | | | (860 | ) | | | (1,914 | ) |
Class R6 | | | (12,779 | ) | | | (272 | ) |
Advisor Class | | | (86,711 | ) | | | (43,103 | ) |
| | | | |
| | |
Total distributions to shareholders | | | (697,216 | ) | | | (611,013 | ) |
| | | | |
Capital share transactions: (Note 2) | | | | | | | | |
Class A | | | 14,445,519 | | | | 11,321,710 | |
Class C | | | 1,723,199 | | | | 2,885,515 | |
Class R | | | (6,126 | ) | | | 19,672 | |
Class R6 | | | 1,978,819 | | | | — | |
Advisor Class | | | 4,005,491 | | | | 3,738,902 | |
| | | | |
| | |
Total capital share transactions | | | 22,146,902 | | | | 17,965,799 | |
| | | | |
Net increase (decrease) in net assets | | | 23,765,906 | | | | 23,182,637 | |
Net assets: | | | | | | | | |
Beginning of period | | | 53,619,072 | | | | 30,436,435 | |
| | | | |
| | |
End of period | | $ | 77,384,978 | | | $ | 53,619,072 | |
| | | | |
Undistributed net investment income included in net assets: | | | | | | | | |
End of period | | $ | 76,493 | | | $ | 336,878 | |
| | | | |
| | | | | | |
| 22 | | Semiannual Report | | The accompanying notes are an integral part of these financial statements. | | franklintempleton.com |
FRANKLIN GLOBAL TRUST
Notes to Financial Statements (unaudited)
Franklin Global Listed Infrastructure Fund
1. Organization and Significant Accounting Policies
Franklin Global Trust (Trust) is registered under the Investment Company Act of 1940 (1940 Act) as an open-end management investment company, consisting of five separate funds and applies the specialized accounting and reporting guidance in U.S. Generally Accepted Accounting Principles (U.S. GAAP). Franklin Global Listed Infrastructure Fund (Fund) is included in this report. The Fund offers five classes of shares: Class A, Class C, Class R, Class R6 and Advisor Class. Each class of shares may differ by its initial sales load, contingent deferred sales charges, voting rights on matters affecting a single class, its exchange privilege and fees due to differing arrangements for distribution and transfer agent fees.
The following summarizes the Fund’s significant accounting policies.
a. Financial Instrument Valuation
The Fund’s investments in financial instruments are carried at fair value daily. Fair value is the price that would be received to sell an asset or paid to transfer a liability in an orderly transaction between market participants on the measurement date. The Fund calculates the net asset value (NAV) per share as of 4 p.m. Eastern time each day the New York Stock Exchange (NYSE) is open for trading. Under compliance policies and procedures approved by the Trust’s Board of Trustees (the Board), the Fund’s administrator has responsibility for oversight of valuation, including leading the cross-functional Valuation Committee (VC). The VC provides administration and oversight of the Fund’s valuation policies and procedures, which are approved annually by the Board. Among other things, these procedures allow the Fund to utilize independent pricing services, quotations from securities and financial instrument dealers, and other market sources to determine fair value.
Equity securities listed on an exchange or on the NASDAQ National Market System are valued at the last quoted sale price or the official closing price of the day, respectively. Foreign equity securities are valued as of the close of trading on the foreign stock exchange on which the security is primarily traded, or as of 4 p.m. Eastern time. The value is then converted into its U.S. dollar equivalent at the foreign exchange rate in effect at 4 p.m. Eastern time on the day that the value of the security is determined. Over-the-counter (OTC) securities are valued within the range of the most recent quoted bid and ask
prices. Securities that trade in multiple markets or on multiple exchanges are valued according to the broadest and most representative market. Certain equity securities are valued based upon fundamental characteristics or relationships to similar securities.
Investments in open-end mutual funds are valued at the closing NAV.
The Fund has procedures to determine the fair value of financial instruments for which market prices are not reliable or readily available. Under these procedures, the VC convenes on a regular basis to review such financial instruments and considers a number of factors, including significant unobservable valuation inputs, when arriving at fair value. The VC primarily employs a market-based approach which may use related or comparable assets or liabilities, recent transactions, market multiples, book values, and other relevant information for the investment to determine the fair value of the investment. An income-based valuation approach may also be used in which the anticipated future cash flows of the investment are discounted to calculate fair value. Discounts may also be applied due to the nature or duration of any restrictions on the disposition of the investments. Due to the inherent uncertainty of valuations of such investments, the fair values may differ significantly from the values that would have been used had an active market existed. The VC employs various methods for calibrating these valuation approaches including a regular review of key inputs and assumptions, transactional back-testing or disposition analysis, and reviews of any related market activity.
Trading in securities on foreign securities stock exchanges and OTC markets may be completed before 4 p.m. Eastern time. In addition, trading in certain foreign markets may not take place on every Fund’s business day. Occasionally, events occur between the time at which trading in a foreign security is completed and 4 p.m. Eastern time that might call into question the reliability of the value of a portfolio security held by the Fund. As a result, differences may arise between the value of the Fund’s portfolio securities as determined at the foreign market close and the latest indications of value at 4 p.m. Eastern time. In order to minimize the potential for these differences, the VC monitors price movements following the close of trading in foreign stock markets through a series of country specific market proxies (such as baskets of American Depositary Receipts, futures contracts and exchange traded funds). These price movements are measured against established trigger thresholds for each specific market proxy to
| | | | | | |
| franklintempleton.com | | Semiannual Report | | | 23 | |
FRANKLIN GLOBAL TRUST
NOTES TO FINANCIAL STATEMENTS (UNAUDITED)
Franklin Global Listed Infrastructure Fund (continued)
1. Organization and Significant Accounting Policies (continued)
a. Financial Instrument Valuation (continued)
assist in determining if an event has occurred that may call into question the reliability of the values of the foreign securities held by the Fund. If such an event occurs, the securities may be valued using fair value procedures, which may include the use of independent pricing services.
When the last day of the reporting period is a non-business day, certain foreign markets may be open on those days that the Fund’s NAV is not calculated, which could result in differences between the value of the Fund’s portfolio securities on the last business day and the last calendar day of the reporting period. Any significant security valuation changes due to an open foreign market are adjusted and reflected by the Fund for financial reporting purposes.
b. Foreign Currency Translation
Portfolio securities and other assets and liabilities denominated in foreign currencies are translated into U.S. dollars based on the exchange rate of such currencies against U.S. dollars on the date of valuation. The Fund may enter into foreign currency exchange contracts to facilitate transactions denominated in a foreign currency. Purchases and sales of securities, income and expense items denominated in foreign currencies are translated into U.S. dollars at the exchange rate in effect on the transaction date. Portfolio securities and assets and liabilities denominated in foreign currencies contain risks that those currencies will decline in value relative to the U.S. dollar. Occasionally, events may impact the availability or reliability of foreign exchange rates used to convert the U.S. dollar equivalent value. If such an event occurs, the foreign exchange rate will be valued at fair value using procedures established and approved by the Board.
The Fund does not separately report the effect of changes in foreign exchange rates from changes in market prices on securities held. Such changes are included in net realized and unrealized gain or loss from investments in the Statement of Operations.
Realized foreign exchange gains or losses arise from sales of foreign currencies, currency gains or losses realized between the trade and settlement dates on securities transactions and the difference between the recorded amounts of dividends, interest, and foreign withholding taxes and the U.S. dollar equivalent of the amounts actually received or paid. Net unrealized foreign
exchange gains and losses arise from changes in foreign exchange rates on foreign denominated assets and liabilities other than investments in securities held at the end of the reporting period.
c. Income and Deferred Taxes
It is the Fund’s policy to qualify as a regulated investment company under the Internal Revenue Code. The Fund intends to distribute to shareholders substantially all of its taxable income and net realized gains to relieve it from federal income and if applicable, excise taxes. As a result, no provision for U.S. federal income taxes is required.
The Fund may be subject to foreign taxation related to income received, capital gains on the sale of securities and certain foreign currency transactions in the foreign jurisdictions in which it invests. Foreign taxes, if any, are recorded based on the tax regulations and rates that exist in the foreign markets in which the Fund invests. When a capital gain tax is determined to apply, the Fund records an estimated deferred tax liability in an amount that would be payable if the securities were disposed of on the valuation date.
The Fund may recognize an income tax liability related to its uncertain tax positions under U.S. GAAP when the uncertain tax position has a less than 50% probability that it will be sustained upon examination by the tax authorities based on its technical merits. As of January 31, 2018, the Fund has determined that no tax liability is required in its financial statements related to uncertain tax positions for any open tax years (or expected to be taken in future tax years). Open tax years are those that remain subject to examination and are based on the statute of limitations in each jurisdiction in which the Fund invests.
d. Security Transactions, Investment Income, Expenses and Distributions
Security transactions are accounted for on trade date. Realized gains and losses on security transactions are determined on a specific identification basis. Estimated expenses are accrued daily. Dividend income is recorded on the ex-dividend date except for certain dividends from securities where the dividend rate is not available. In such cases, the dividend is recorded as soon as the information is received by the Fund. Distributions to shareholders are recorded on the ex-dividend date. Distributable earnings are determined according to income tax regulations (tax basis) and may differ from earnings recorded in accordance
| | | | |
| 24 | | Semiannual Report | | franklintempleton.com |
FRANKLIN GLOBAL TRUST
NOTES TO FINANCIAL STATEMENTS (UNAUDITED)
Franklin Global Listed Infrastructure Fund (continued)
with U.S. GAAP. These differences may be permanent or temporary. Permanent differences are reclassified among capital accounts to reflect their tax character. These reclassifications have no impact on net assets or the results of operations. Temporary differences are not reclassified, as they may reverse in subsequent periods.
Common expenses incurred by the Trust are allocated among the Funds based on the ratio of net assets of each Fund to the combined net assets of the Trust. Fund specific expenses are charged directly to the Fund that incurred the expense.
Realized and unrealized gains and losses and net investment income, excluding class specific expenses, are allocated daily to each class of shares based upon the relative proportion of net assets of each class. Differences in per share distributions by class are generally due to differences in class specific expenses.
e. Accounting Estimates
The preparation of financial statements in accordance with U.S. GAAP requires management to make estimates and assumptions that affect the reported amounts of assets and
liabilities at the date of the financial statements and the amounts of income and expenses during the reporting period. Actual results could differ from those estimates.
f. Guarantees and Indemnifications
Under the Trust’s organizational documents, its officers and trustees are indemnified by the Trust against certain liabilities arising out of the performance of their duties to the Trust. Additionally, in the normal course of business, the Trust, on behalf of the Fund, enters into contracts with service providers that contain general indemnification clauses. The Trust’s maximum exposure under these arrangements is unknown as this would involve future claims that may be made against the Trust that have not yet occurred. Currently, the Trust expects the risk of loss to be remote.
2. Shares of Beneficial Interest
At January 31, 2018, there were an unlimited number of shares authorized (without par value). Transactions in the Fund’s shares were as follows:
| | | | | | | | | | | | | | | | |
| | | Six Months Ended January 31, 2018 | | | Year Ended July 31, 2017a | |
| | | | |
| | | Shares | | | Amount | | | Shares | | | Amount | |
| |
| | | | |
| Class A Shares: | | | | | | | | | | | | | | | | |
Shares sold | | | 1,388,693 | | | $ | 19,179,423 | | | | 1,846,908 | | | $ | 22,519,248 | |
Shares issued in reinvestment of distributions | | | 38,222 | | | | 527,442 | | | | 37,190 | | | | 449,990 | |
Shares redeemed | | | (380,293 | ) | | | (5,261,346 | ) | | | (972,794 | ) | | | (11,647,528 | ) |
| | | | |
| | | | |
Net increase (decrease) | | | 1,046,622 | | | $ | 14,445,519 | | | | 911,304 | | | $ | 11,321,710 | |
| | | | |
| | | | |
| Class C Shares: | | | | | | | | | | | | | | | | |
Shares sold | | | 186,815 | | | $ | 2,556,512 | | | | 407,842 | | | $ | 4,869,479 | |
Shares issued in reinvestment of distributions | | | 4,748 | | | | 65,037 | | | | 5,185 | | | | 61,357 | |
Shares redeemed | | | (65,675 | ) | | | (898,350 | ) | | | (169,244 | ) | | | (2,045,321 | ) |
| | | | |
| | | | |
Net increase (decrease) | | | 125,888 | | | $ | 1,723,199 | | | | 243,783 | | | $ | 2,885,515 | |
| | | | |
| | | | |
| Class R Shares: | | | | | | | | | | | | | | | | |
Shares sold | | | 105 | | | $ | 1,457 | | | | 7,598 | | | $ | 91,810 | |
Shares issued in reinvestment of distributions | | | 62 | | | | 861 | | | | 145 | | | | 1,746 | |
Shares redeemed | | | (623 | ) | | | (8,444 | ) | | | (5,820 | ) | | | (73,884 | ) |
| | | | |
| | | | |
Net increase (decrease) | | | (456 | ) | | $ | (6,126 | ) | | | 1,923 | | | $ | 19,672 | |
| | | | |
| | | | | | |
| franklintempleton.com | | Semiannual Report | | | 25 | |
FRANKLIN GLOBAL TRUST
NOTES TO FINANCIAL STATEMENTS (UNAUDITED)
Franklin Global Listed Infrastructure Fund (continued)
2. Shares of Beneficial Interest (continued)
| | | | | | | | | | | | | | | | |
| | | Six Months Ended January 31, 2018 | | | Year Ended July 31, 2017a | |
| | | | |
| | | Shares | | | Amount | | | Shares | | | Amount | |
| |
| | | | |
| Class R6 Shares: | | | | | | | | | | | | | | | | |
Shares sold | | | 161,126 | | | $ | 2,238,345 | | | | — | | | $ | — | |
Shares issued in reinvestment of distributions | | | 909 | | | | 12,588 | | | | — | | | | — | |
Shares redeemed | | | (19,332 | ) | | | (272,114 | ) | | | — | | | | — | |
| | | | |
| | | | |
Net increase (decrease) | | | 142,703 | | | $ | 1,978,819 | | | | — | | | $ | — | |
| | | | |
| | | | |
| Advisor Class Shares: | | | | | | | | | | | | | | | | |
Shares sold | | | 535,750 | | | $ | 7,414,270 | | | | 394,717 | | | $ | 4,861,041 | |
Shares issued in reinvestment of distributions | | | 6,105 | | | | 84,360 | | | | 3,276 | | | | 40,539 | |
Shares redeemed | | | (252,896 | ) | | | (3,493,139 | ) | | | (94,027 | ) | | | (1,162,678 | ) |
| | | | |
| | | | |
Net increase (decrease) | | | 288,959 | | | $ | 4,005,491 | | | | 303,966 | | | $ | 3,738,902 | |
| | | | |
aDuring the period, Class R6 did not report any share transactions. | | | | | | | | | | | | | | | | |
3. Transactions with Affiliates
Franklin Resources, Inc. is the holding company for various subsidiaries that together are referred to as Franklin Templeton Investments. Certain officers and trustees of the Trust are also officers and/or directors of the following subsidiaries:
| | |
| Subsidiary | | Affiliation |
| Franklin Templeton Institutional, LLC (FT Institutional) | | Investment manager |
| Franklin Templeton Services, LLC (FT Services) | | Administrative manager |
| Franklin Templeton Distributors, Inc. (Distributors) | | Principal underwriter |
| Franklin Templeton Investor Services, LLC (Investor Services) | | Transfer agent |
a. Management Fees
The Fund pays an investment management fee to FT Institutional based on the average daily net assets of the Fund as follows:
| | |
| Annualized Fee Rate | | Net Assets |
1.000% | | Up to and including $500 million |
0.900% | | Over $500 million, up to and including $1 billion |
0.850% | | Over $1 billion, up to and including $1.5 billion |
0.800% | | Over $1.5 billion, up to and including $6.5 billion |
0.780% | | Over $6.5 billion, up to and including $11.5 billion |
0.760% | | Over $11.5 billion, up to and including $16.5 billion |
0.740% | | Over $16.5 billion, up to and including $19 billion |
0.730% | | Over $19 billion, up to and including $21.5 billion |
0.720% | | In excess of $21.5 billion |
For the period ended January 31, 2018, the annualized gross effective investment management fee rate was 1.000% of the Fund’s average daily net assets.
| | | | |
| 26 | | Semiannual Report | | franklintempleton.com |
FRANKLIN GLOBAL TRUST
NOTES TO FINANCIAL STATEMENTS (UNAUDITED)
Franklin Global Listed Infrastructure Fund (continued)
b. Administrative Fees
Under an agreement with FT Institutional, FT Services provides administrative services to the Fund. The fee is paid by FT Institutional based on the Fund’s average net assets, and is not an additional expense of the Fund.
c. Distribution Fees
The Board has adopted distribution plans for each share class, with the exception of Class R6 and Advisor Class shares, pursuant to Rule 12b-1 under the 1940 Act. Under the Fund’s Class A reimbursement distribution plan, the Fund reimburses Distributors for costs incurred in connection with the servicing, sale and distribution of the Fund’s shares up to the maximum annual plan rate. Under the Class A reimbursement distribution plan, costs exceeding the maximum for the current plan year cannot be reimbursed in subsequent periods. In addition, under the Fund’s Class C and R compensation distribution plans, the Fund pays Distributors for costs incurred in connection with the servicing, sale and distribution of the Fund’s shares up to the maximum annual plan rate for each class. The plan year, for purposes of monitoring compliance with the maximum annual plan rates, is February 1 through January 31.
The maximum annual plan rates, based on the average daily net assets, for each class, are as follows:
| | | | |
Class A | | | 0.35 | % |
Class C | | | 1.00 | % |
Class R | | | 0.50 | % |
The Board has set the current rate at 0.25% per year for Class A shares until further notice and approval by the Board.
d. Sales Charges/Underwriting Agreements
Front-end sales charges and contingent deferred sales charges (CDSC) do not represent expenses of the Fund. These charges are deducted from the proceeds of sales of Fund shares prior to investment or from redemption proceeds prior to remittance, as applicable. Distributors has advised the Fund of the following commission transactions related to the sales and redemptions of the Fund’s shares for the period:
| | | | |
Sales charges retained net of commissions paid to unaffiliated brokers/dealers | | $ | 59,408 | |
CDSC retained | | $ | 641 | |
e. Transfer Agent Fees
Each class of shares pays transfer agent fees to Investor Services for its performance of shareholder servicing obligations. Effective November 1, 2017, the fees are based on an annualized asset based fee of 0.02% plus a transaction based fee. Prior to November 1, 2017, the fees were account based fees that varied based on fund or account type. In addition, each class reimburses Investor Services for out of pocket expenses incurred and, except for Class R6, reimburses shareholder servicing fees paid to third parties. These fees are allocated daily based upon their relative proportion of such classes’ aggregate net assets. Class R6 pays Investor Services transfer agent fees specific to that class.
For the period ended January 31, 2018, the Fund paid transfer agent fees of $92,639, of which $18,095 was retained by Investor Services.
| | | | | | |
| franklintempleton.com | | Semiannual Report | | | 27 | |
FRANKLIN GLOBAL TRUST
NOTES TO FINANCIAL STATEMENTS (UNAUDITED)
Franklin Global Listed Infrastructure Fund (continued)
3. Transactions with Affiliates (continued)
f. Investments in Affiliated Management Investment Companies
The Fund invests in one or more affiliated management investment companies for purposes other than exercising a controlling influence over the management or policies. Management fees paid by the Fund are waived on assets invested in the affiliated management investment companies, as noted in the Statement of Operations, in an amount not to exceed the management and administrative fees paid directly or indirectly by each affiliate. During the period ended January 31, 2018, the Fund held investments in affiliated management investment companies as follows:
| | | | | | | | | | | | | | | | | | | | | | | | | | | | | | | | |
| | | Number of
Shares Held
at Beginning
of Period | | | Gross
Additions | | | Gross
Reductions | | | Number of
Shares
Held at End
of Period | | | Value
at End of Period | | | Dividend
Income | | | Realized
Gain
(Loss) | | | Net Change in
Unrealized
Appreciation
(Depreciation) | |
Non-Controlled Affiliates | | | | | | | | | | | | | | | | | | | | | | | | | | | | | | | | |
Institutional Fiduciary Trust Money Market Portfolio, 0.96% | | | 839,543 | | | | 14,210,391 | | | | (14,133,693 | ) | | | 916,241 | | | | $916,241 | | | | $3,537 | | | | $ — | | | | $ — | |
| | | | | | | | | | | | | | | | | | | | |
g. Waiver and Expense Reimbursements
FT Institutional and Investor Services have contractually agreed in advance to waive or limit their respective fees and to assume as their own expense certain expenses otherwise payable by the Fund so that the expenses (excluding distribution fees, and acquired fund fees and expenses) for Class A, Class C, Class R and Advisor Class of the Fund do not exceed 1.15%, and Class R6 does not exceed 0.98% based on the average net assets of each class (other than certain non-routine expenses or costs, including those relating to litigation, indemnification, reorganizations, and liquidations). Prior to December 1, 2017, the expenses for Class R6 were limited to 0.93%. Effective February 1, 2018, the expenses (excluding distribution fees, and aquired fund fees and expenses) for each class of the Fund will be limited to 0.99% and Class R6 will be limited to 0.82% based on the average net assets of each class (other than certain non-routine expenses or costs, including those relating to litigation, indemnification, reorganizations, and liquidations) until November 30, 2019. Total expenses waived or paid are not subject to recapture subsequent to the Fund’s fiscal year end.
4. Expense Offset Arrangement
The Fund has entered into an arrangement with its custodian whereby credits realized as a result of uninvested cash balances are used to reduce a portion of the Fund’s custodian expenses. During the period ended January 31, 2018, the custodian fees were reduced as noted in the Statement of Operations.
5. Income Taxes
For tax purposes, capital losses may be carried over to offset future capital gains, if any. At January 31, 2018, the capital loss carryforwards were as follows:
| | | | |
Capital loss carryforwards: | | | | |
Short term | | $ | 555,014 | |
Long term | | $ | 1,818,269 | |
| | | | |
Total capital loss carryforwards | | $ | 2,373,283 | |
| | | | |
| | | | |
| 28 | | Semiannual Report | | franklintempleton.com |
FRANKLIN GLOBAL TRUST
NOTES TO FINANCIAL STATEMENTS (UNAUDITED)
Franklin Global Listed Infrastructure Fund (continued)
At January 31, 2018, the cost of investments and net unrealized appreciation (depreciation) for income tax purposes were as follows:
| | | | |
Cost of investments | | $ | 68,190,410 | |
| | | | |
| |
Unrealized appreciation | | $ | 10,728,915 | |
Unrealized depreciation | | | (1,418,349) | |
| | | | |
Net unrealized appreciation (depreciation) | | $ | 9,310,566 | |
| | | | |
Differences between income and/or capital gains as determined on a book basis and a tax basis are primarily due to differing treatment of wash sales.
6. Investment Transactions
Purchases and sales of investments (excluding short term securities) for the period ended January 31, 2018, aggregated $45,656,877 and $23,998,473, respectively.
7. Concentration of Risk
Investing in foreign securities may include certain risks and considerations not typically associated with investing in U.S. securities, such as fluctuating currency values and changing local and regional economic, political and social conditions, which may result in greater market volatility. In addition, certain foreign securities may not be as liquid as U.S. securities.
8. Credit Facility
The Fund, together with other U.S. registered and foreign investment funds (collectively, Borrowers), managed by Franklin Templeton Investments, are borrowers in a joint syndicated senior unsecured credit facility totaling $2 billion (Global Credit Facility) which matured on February 9, 2018. This Global Credit Facility provides a source of funds to the Borrowers for temporary and emergency purposes, including the ability to meet future unanticipated or unusually large redemption requests. Effective February 9, 2018, the Borrowers renewed the Global Credit Facility for a one year term, maturing February 8, 2019, for a total of $2 billion.
Under the terms of the Global Credit Facility, the Fund shall, in addition to interest charged on any borrowings made by the Fund and other costs incurred by the Fund, pay its share of fees and expenses incurred in connection with the implementation and maintenance of the Global Credit Facility, based upon its relative share of the aggregate net assets of all of the Borrowers, including an annual commitment fee of 0.15% based upon the unused portion of the Global Credit Facility. These fees are reflected in other expenses in the Statement of Operations. During the period ended January 31, 2018, the Fund did not use the Global Credit Facility.
9. Fair Value Measurements
The Fund follows a fair value hierarchy that distinguishes between market data obtained from independent sources (observable inputs) and the Fund’s own market assumptions (unobservable inputs). These inputs are used in determining the value of the Fund’s financial instruments and are summarized in the following fair value hierarchy:
| | • | | Level 1 – quoted prices in active markets for identical financial instruments |
| | • | | Level 2 – other significant observable inputs (including quoted prices for similar financial instruments, interest rates, prepayment speed, credit risk, etc.) |
| | | | | | |
| franklintempleton.com | | Semiannual Report | | | 29 | |
FRANKLIN GLOBAL TRUST
NOTES TO FINANCIAL STATEMENTS (UNAUDITED)
Franklin Global Listed Infrastructure Fund (continued)
9. Fair Value Measurements (continued)
| | • | | Level 3 – significant unobservable inputs (including the Fund’s own assumptions in determining the fair value of financial instruments) |
The input levels are not necessarily an indication of the risk or liquidity associated with financial instruments at that level.
For movements between the levels within the fair value hierarchy, the Fund has adopted a policy of recognizing the transfers as of the date of the underlying event which caused the movement.
A summary of inputs used as of January 31, 2018, in valuing the Fund’s assets carried at fair value, is as follows:
| | | | | | | | | | | | | | | | |
| | | Level 1 | | | Level 2 | | | Level 3 | | | Total | |
| |
Assets: | | | | | | | | | | | | | | | | |
Investments in Securities:a | | | | | | | | | | | | | | | | |
Equity Investments | | $ | 76,565,155 | | | $ | 19,580 | | | $ | — | | | $ | 76,584,735 | |
Short Term Investments | | | 916,241 | | | | — | | | | — | | | | 916,241 | |
| | | | |
Total Investments in Securities | | $ | 77,481,396 | | | $ | 19,580 | | | $ | — | | | $ | 77,500,976 | |
| | | | |
aFor detailed categories, see the accompanying Statement of Investments.
10. Subsequent Events
The Fund has evaluated subsequent events through the issuance of the financial statements and determined that no events have occurred that require disclosure other than those already disclosed in the financial statements.
Abbreviations
| | |
| Selected Portfolio |
| |
ADR | | American Depositary Receipt |
| | | | |
| 30 | | Semiannual Report | | franklintempleton.com |
FRANKLIN GLOBAL TRUST
FRANKLIN GLOBAL LISTED INFRASTRUCTURE FUND
Special Meeting of Shareholders
MEETING OF SHAREHOLDERS: OCTOBER 30, 2017 AND RECONVENED ON DECEMBER 15, 2017 AND DECEMBER 29, 2017
(UNAUDITED)
A Special Meeting of Shareholders of Franklin Global Trust was held at the offices of Franklin Templeton Investments, One Franklin Parkway, San Mateo, California on October 30, 2017 and reconvened on December 15, 2017 and December 29, 2017. The purpose of the meeting was to elect Trustees of Franklin Global Trust and to approve an amended fundamental investment restriction regarding investments in commodities for the Fund. At the meeting, (i) the following persons were elected by the shareholders to serve as Trustees of Franklin Global Trust: Harris J. Ashton, Terrence J. Checki, Mary C. Choksi, Edith E. Holiday, Gregory E. Johnson, Rupert H. Johnson, Jr., J. Michael Luttig, Larry D. Thompson, and John B. Wilson and (ii) sufficient votes were not received to pass the proposal to approve the amended fundamental investment restriction regarding investments in commodities. No other business was transacted at the meeting.
In connection with the meeting, management is aware that some shareholders received from the proxy solicitor numerous calls and mailings that may have been distracting. Management is taking steps to ensure that, in the future, for any new shareholder meeting solicitations that occur, such activity is not repeated. Management apologizes for any inconvenience that may have been caused as a result of such calls and mailings.
The results of the voting at the meeting are as follows:
Proposal 1. To elect a Board of Trustees:
| | | | | | | | |
| Name | | For | | | Withheld | |
| | |
Harris J. Ashton | | | 123,597,479 | | | | 3,571,398 | |
Terrence J. Checki | | | 123,690,572 | | | | 3,478,306 | |
Mary C. Choksi | | | 123,243,714 | | | | 3,925,163 | |
Edith E. Holiday | | | 121,178,523 | | | | 5,990,354 | |
Gregory E. Johnson | | | 123,694,217 | | | | 3,474,660 | |
Rupert H. Johnson, Jr. | | | 123,621,068 | | | | 3,547,808 | |
J. Michael Luttig. | | | 123,705,401 | | | | 3,463,476 | |
Larry D. Thompson | | | 123,162,505 | | | | 4,006,372 | |
John B. Wilson | | | 123,573,690 | | | | 3,595,187 | |
| |
Total Trust Shares Outstanding*: 162,995,191 | | | | | |
* As of the record date.
| | | | | | |
| franklintempleton.com | | Semiannual Report | | | 31 | |
FRANKLIN GLOBAL TRUST
FRANKLIN GLOBAL LISTED INFRASTRUCTURE FUND
SPECIAL MEETING OF SHAREHOLDERS
| Proposal 2. | To approve an amended fundamental investment restriction regarding investments in commodities: |
| | | | |
| | | Shares | |
| |
For | | | 1,822,002 | |
Against | | | 44,966 | |
Abstain | | | 67,419 | |
Broker Non-Votes | | | 960,990 | |
Total Fund Shares Voted | | | 2,895,378 | |
Total Fund Shares Outstanding* | | | 4,065,333 | |
| | | | |
| 32 | | Semiannual Report | | franklintempleton.com |
FRANKLIN GLOBAL TRUST
FRANKLIN GLOBAL LISTED INFRASTRUCTURE FUND
Shareholder Information
Proxy Voting Policies and Procedures
The Fund’s investment manager has established Proxy Voting Policies and Procedures (Policies) that the Fund uses to determine how to vote proxies relating to portfolio securities. Shareholders may view the Fund’s complete Policies online at franklintempleton.com. Alternatively, shareholders may request copies of the Policies free of charge by calling the Proxy Group collect at (954) 527-7678 or by sending a written request to: Franklin Templeton Companies, LLC, 300 S.E. 2nd Street, Fort Lauderdale, FL 33301, Attention: Proxy Group. Copies of the Fund’s proxy voting records are also made available online at franklintempleton.com and posted on the US Securities and Exchange Commission’s website at sec.gov and reflect the most recent 12-month period ended June 30.
Quarterly Statement of Investments
The Trust, on behalf of the Fund, files a complete statement of investments with the US Securities and Exchange Commission for the first and third quarters for each fiscal year on Form N-Q. Shareholders may view the filed Form N-Q by visiting the Commission’s website at sec.gov. The filed form may also be viewed and copied at the Commission’s Public Reference Room in Washington, DC. Information regarding the operations of the Public Reference Room may be obtained by calling (800) SEC-0330.
| | | | | | |
| franklintempleton.com | | Semiannual Report | | | 33 | |
This page intentionally left blank.
This page intentionally left blank.
This page intentionally left blank.
| | | | |
| | | | Semiannual Report and Shareholder Letter Franklin Global Listed Infrastructure Fund Investment Manager Franklin Templeton Institutional, LLC Distributor Franklin Templeton Distributors, Inc. (800) DIAL BEN® / 342-5236 franklintempleton.com Shareholder Services (800) 632-2301 |
Authorized for distribution only when accompanied or preceded by a summary prospectus and/or prospectus. Investors should carefully consider a fund’s investment goals, risks, charges and expenses before investing. A prospectus contains this and other information; please read it carefully before investing.
To help ensure we provide you with quality service, all calls to and from our service areas are monitored and/or recorded.
| | | | |
| © 2018 Franklin Templeton Investments. All rights reserved. | | 997 S 03/18 |
(a) The Registrant has adopted a code of ethics that applies to its principal executive officers and principal financial and accounting officer.
(c) N/A
(d) N/A
(f) Pursuant to Item 12(a)(1), the Registrant is attaching as an exhibit a copy of its code of ethics that applies to its principal executive officers and principal financial and accounting officer.
| Item 3. | Audit Committee Financial Expert. |
(a)(1) The Registrant has an audit committee financial expert serving on its audit committee.
(2) The audit committee financial expert is John B. Wilson and he is “independent” as defined under the relevant Securities and Exchange Commission Rules and Releases.
| Item 4. | Principal Accountant Fees and Services. N/A |
| Item 5. | Audit Committee of Listed Registrants. N/A |
| Item 6. | Schedule of Investments. N/A |
| Item 7. | Disclosure of Proxy Voting Policies and Procedures for Closed-End Management Investment Companies. N/A |
| Item 8. | Portfolio Managers of Closed-End Management Investment Companies. N/A |
| Item 9. | Purchases of Equity Securities by Closed-End Management Investment Company and Affiliated Purchasers. N/A |
| Item 10. | Submission of Matters to a Vote of Security Holders. |
There have been no changes to the procedures by which shareholders may recommend nominees to the Registrant’s Board of Trustees that would require disclosure herein.
| Item 11. | Controls and Procedures. |
(a) Evaluation of Disclosure Controls And Procedures. The Registrant maintains disclosure controls and procedures that are designed to ensure that information required to be disclosed in the Registrant’s filings under the Securities Exchange Act of 1934 and the Investment Company Act of 1940 is recorded, processed, summarized and reported within the periods specified in the rules and forms of the Securities and Exchange Commission. Such information is accumulated and communicated to the Registrant’s management, including its principal executive officer and principal financial officer, as appropriate, to allow timely decisions regarding required disclosure. The Registrant’s management, including the principal executive officer and the principal financial officer, recognizes that any set of controls and procedures, no matter how well designed and operated, can provide only reasonable assurance of achieving the desired control objectives.
Within 90 days prior to the filing date of this Shareholder Report on Form N-CSR, the Registrant had carried out an evaluation, under the supervision and with the participation of the Registrant’s management, including the Registrant’s principal executive officer and the Registrant’s principal financial officer, of the effectiveness of the design and operation of the Registrant’s disclosure controls and procedures. Based on such evaluation, the Registrant’s principal executive officer and principal financial officer concluded that the Registrant’s disclosure controls and procedures are effective.
(b) Changes in Internal Controls. There have been no changes in the Registrant’s internal controls or in other factors that could materially affect the internal controls over financial reporting subsequent to the date of their evaluation in connection with the preparation of this Shareholder Report on Form N-CSR.
(a) (1) Code of Ethics
(a) (2) Certifications pursuant to Section 302 of the Sarbanes-Oxley Act of 2002 of Matthew T. Hinkle, Chief Executive Officer - Finance and Administration, and Gaston Gardey, Chief Financial Officer and Chief Accounting Officer
(b) Certifications pursuant to Section 906 of the Sarbanes-Oxley Act of 2002 of Matthew T. Hinkle, Chief Executive Officer - Finance and Administration, and Gaston Gardey, Chief Financial Officer and Chief Accounting Officer
SIGNATURES
Pursuant to the requirements of the Securities Exchange Act of 1934 and the Investment Company Act of 1940, the registrant has duly caused this report to be signed on its behalf by the undersigned, thereunto duly authorized.
FRANKLIN GLOBAL TRUST
| | |
| By | | /s/ Matthew T. Hinkle |
| | Matthew T. Hinkle |
| | Chief Executive Officer - Finance and Administration |
| Date | | March 28, 2018 |
Pursuant to the requirements of the Securities Exchange Act of 1934 and the Investment Company Act of 1940, this report has been signed below by the following persons on behalf of the registrant and in the capacities and on the dates indicated.
| | |
| By | | /s/ Matthew T. Hinkle |
| | Matthew T. Hinkle |
| | Chief Executive Officer - Finance and Administration |
| Date | | March 28, 2018 |
| | |
| By | | /s/ Gaston Gardey |
| | Gaston Gardey |
| | Chief Financial Officer and Chief Accounting Officer |
| Date | | March 28, 2018 |