UNITED STATES
SECURITIES AND EXCHANGE COMMISSION
Washington, D.C. 20549
FORM N-CSRS
CERTIFIED SHAREHOLDER REPORT OF REGISTERED MANAGEMENT INVESTMENT
COMPANIES
Investment Company Act file number 811-10157
Franklin Global Trust
(Exact name of registrant as specified in charter)
One Franklin Parkway, San Mateo, CA 94403-1906
(Address of principal executive offices) (Zip code)
Craig S. Tyle, One Franklin Parkway, San Mateo, CA 94403-1906
(Name and address of agent for service)
Registrant's telephone number, including area code: 650 312-2000
Date of fiscal year end: 7/31
Date of reporting period: 1/31/16
Item 1. Reports to Stockholders.

| |
| Contents | |
| |
| Semiannual Report | |
| Franklin Global Real Estate Fund | 3 |
| Performance Summary | 7 |
| Your Fund’s Expenses | 10 |
| Financial Highlights and Statement of Investments | 12 |
| FinancialStatements | 19 |
| Notes to Financial Statements | 23 |
| Shareholder Information | 31 |
Visit franklintempleton.com for fund updates, to access your account, or to find helpful financial planning tools.
2 Semiannual Report
franklintempleton.com
Semiannual Report
Franklin Global Real Estate Fund
This semiannual report for Franklin Global Real Estate Fund covers the period ended January 31, 2016.
Your Fund’s Goal and Main Investments
The Fund seeks high total return. Under normal market conditions, the Fund invests at least 80% of its net assets in securities of companies located anywhere in the world that operate in the real estate sector, including real estate investment trusts (REITs) and similar REIT-like entities domiciled outside the U.S.1
Performance Overview
For the six months ended January 31, 2016, the Fund’s Class A shares had a -4.53% cumulative total return. In comparison, the FTSE® EPRA®/NAREIT® Developed Index, which measures global real estate markets in North America, Europe and Asia, had a -4.77% total return.2 You can find the Fund’s long-term performance data in the Performance Summary beginning on page 7.
Performance data represent past performance, which does not guarantee future results. Investment return and principal value will fluctuate, and you may have a gain or loss when you sell your shares. Current performance may differ from figures shown. For most recent month-end performance, go to franklintempleton.com or call (800) 342-5236.
Economic and Market Overview
The U.S. economy grew moderately during the period ended January 31, 2016. The third and fourth quarters of 2015 experienced healthy consumer spending, slower export growth, and reduced state and local government spending. Non-manufacturing activities expanded, contributing to new jobs and helping drive down the unemployment rate to 4.9% at period-end, the lowest level in nearly eight years. At its
1. REITs are real estate investment trust companies, usually with publicly traded stock, that manage a portfolio of income-producing real estate properties such as apartments,
hotels, industrial properties, office buildings or shopping centers. The Fund predominantly invests in “equity” REITs, which also take ownership positions in real estate.
Shareholders of equity REITs generally receive income from rents received and receive capital gains when properties are sold at a profit. REITs are generally operated by
experienced property management teams and typically concentrate on a specific geographic region or property type.
2. Source: Morningstar
The index is unmanaged and includes reinvestment of any income or distributions. One cannot invest directly in an index, and an index is not representative of the Fund’s
portfolio.
The dollar value, number of shares or principal amount, and names of all portfolio holdings are listed in the Fund’s Statement of Investments (SOI).
The SOI begins on page 16.
franklintempleton.com
Semiannual Report 3
FRANKLIN GLOBAL REAL ESTATE FUND
December 2015 meeting, the Federal Reserve (Fed) raised its target range for the federal funds rate to 0.25%–0.50%, as policymakers cited the labor market’s considerable improvement and were reasonably confident that inflation would move back to the Fed’s 2% medium-term objective. The Fed kept its interest rate unchanged at its January meeting and indicated it would monitor global economic and financial developments and their implications on the labor market and inflation. The broad U.S. stock market, as measured by the Standard & Poor’s 500 Index, declined for the six months ended January 31, 2016.
The global economy expanded moderately during the six-month period. Global developed and emerging market stocks, as measured by the MSCI All Country World Index, fell during the six-month period mainly due to concerns about China’s slowing economy and tumbling stock market, declining commodity prices, geopolitical tensions in certain regions and ongoing uncertainty about the Fed’s timing for raising interest rates. In the period under review, oil prices declined sharply due to strong global supply that exceeded demand. Gold prices fell for most of the period but recovered in January. The U.S. dollar appreciated against most currencies, which reduced returns of many foreign assets in U.S. dollar terms.
In Europe, U.K. fourth-quarter economic growth gained momentum from the services sector. The eurozone grew slightly and generally benefited during the period from lower oil prices, a weaker euro that supported exports, the European Central Banks’s (ECB’s) accommodative policy and expectations of further ECB stimulus. Although the eurozone’s annual inflation rate declined early in the period, it rose during the rest of the period. The ECB maintained its benchmark interest rates although it reduced its bank deposit rate in December, seeking to boost the region’s slowing growth.
In Asia, preliminary estimates showed that Japan’s economy contracted in the fourth quarter after expanding in the third quarter, as private consumption and housing investment declined. The Bank of Japan (BOJ) took several actions during the period, including lowering its economic growth and inflation forecasts, and reorganizing its stimulus program to increase exposure to long-term government bonds and exchange-traded funds. In January, the BOJ introduced a negative interest rate on excess reserves kept by financial institutions with the central bank, in an effort to boost lending and support inflation. China’s economy expanded in the fourth quarter, but growth was less robust in 2015 than in 2014, as strength in services and consumption was offset by weakness in fixed-asset investment, imports and exports, and manufac-

turing. The People’s Bank of China (PBOC) cut its benchmark interest rate and reduced the banks’ cash reserve requirement. Toward period-end, the PBOC lowered short-term borrowing costs for smaller banks as part of its efforts to establish an interest rate corridor intended to help banks access funds in times of a liquidity crunch and to avoid heightened volatility in money market rates.
Global Real Estate Market Overview
Overall, global real estate markets declined for the six months under review. According to the FTSE EPRA/NAREIT Developed Index, in U.S. dollar terms, Asia and Europe led regional declines, and most countries represented in the index lost value, particularly Hong Kong, the U.K., Italy, Israel, Norway and Canada. In contrast, a few markets gained value, notably Sweden, Austria and Germany. At period-end, the U.S. was the index’s largest country weighting.
Investment Strategy
We are research-driven, fundamental investors. We seek to limit price volatility by investing across markets and property types. We also seek to provide a consistently high level of income. We center our active investment strategy on the belief that unsynchronized regional economic activity within the global economy can provide consistent, attractive return opportunities in the global real estate markets. We use a
4 Semiannual Report
franklintempleton.com
FRANKLIN GLOBAL REAL ESTATE FUND
| | |
| Top 10 Holdings | | |
| 1/31/16 | | |
| Company | % of Total | |
| Sector/Industry, Country | Net Assets | |
| Simon Property Group Inc. | 5.4 | % |
| Retail REITs, U.S. | | |
| Equity Residential | 3.2 | % |
| Residential REITs, U.S. | | |
| Mitsui Fudosan Co. Ltd. | 3.1 | % |
| Diversified Real Estate Activities, Japan | | |
| Unibail-Rodamco SE | 3.0 | % |
| Retail REITs, France | | |
| Public Storage | 2.7 | % |
| Specialized REITs, U.S. | | |
| Mitsubishi Estate Co. Ltd. | 2.4 | % |
| Diversified Real Estate Activities, Japan | | |
| Prologis Inc. | 2.2 | % |
| Industrial REITs, U.S. | | |
| Boston Properties Inc. | 2.1 | % |
| Office REITs, U.S. | | |
| Ventas Inc. | 1.8 | % |
| Health Care REITs, U.S. | | |
| Essex Property Trust Inc. | 1.8 | % |
| Residential REITs, U.S. | | |
bottom-up stock selection process that incorporates macro-level views in the evaluation process. We use top-down macro overlays to provide country/regional, property type and company size perspectives in identifying international/local cyclical and thematic trends that highlight investment opportunities. We may use derivative instruments, such as currency forward contracts, from time to time to help manage currency risk and the Fund’s exposure to various currencies.
What is a currency forward contract?
A currency forward contract is an agreement between the Fund and a counterparty to buy or sell a foreign currency at a specific exchange rate on a future date.
Manager’s Discussion
During the six months under review, key contributors to the Fund’s performance relative to the FTSE EPRA/NAREIT Developed Index included stock selection and an underweighting in the diversified sector, with holdings such as Japan-based REIT Invincible Investment.3 Its shares outperformed the broader benchmark index during the six-month period. The trust aggressively expanded into hotels and significantly increased its portfolio size over the past two years. In 2015, Invincible reported robust earnings growth driven by acquisitions of properties, as well as higher occupancy and average daily rate for its existing hotels, helped by Japan’s strong tourism industry. U.S. asset manager Fortress Group, Invincible’s sponsor, had an ample supply of hotel assets in Japan, which may provide further growth opportunities for Invincible.
Shares of U.S.-based data center CyrusOne surged over the period, reaching an all-time high in December as investors favored the company’s aggressive expansion amid increasing demand.4 An overweighting in the self-storage sector was also favorable, particularly the Fund’s investment in U.S.-based storage REIT Extra Space Storage.5 The company’s shares surged and outperformed the REIT index over the past six months as its operating results consistently were above its peer group average and exceeded company guidance and investor expectations. Storage fundamentals remained strong, with limited near-term supply and healthy tenant demand. Extra Space Storage also executed well in leasing its existing and recently acquired assets, reflected by the portfolio’s higher occupancy and rent levels. We believed the company remained well positioned to benefit from additional consolidation opportunities within the highly fragmented storage property sector. An overweighted allocation in the specialty sector also boosted results.6
In contrast, key detractors from the Fund’s relative performance included stock selection in the office space sector.7 Shares of U.K.-based office REIT Derwent London lagged the benchmark over the period as the U.K.’s pending vote about whether to leave the European Union created uncertainty for companies with London offices. Fundamentals in the West End and fringes of London City where Derwent operates offered healthy demand, low vacancy and strong rental growth. Derwent had a potential redevelopment pipeline of roughly half of its assets. Given that the company was trading at a sizable discount to its property assets, with a conservative loan-to-value ratio and with what we viewed as one of the best management teams in the Europe property space, we believed its share price was undervalued.
3. Diversified holdings are in diversified real estate activities, diversified REITs, real estate development, real estate operating companies and residential REITs in the SOI.
4. Not part of the index.
5. Self-storage holdings are in specializied REITs in the SOI.
6. Specialty holdings are in office REITs and specialized REITs in the SOI.
7. Office space holdings are in office REITs and real estate operating companies in the SOI.
franklintempleton.com
Semiannual Report 5
FRANKLIN GLOBAL REAL ESTATE FUND
Security selection in the industrial property sector also hindered results.8 Shares of Singapore-based Global Logistic Properties, the largest warehouse operator in China, declined over the reporting period amid ongoing concerns about China’s economic health and expectations for currency depreciation. Investors took a cautious view on the stock as China’s broad economic moderation continued to weigh on the demand outlook and tenants were more cautious with expansion plans. Given the uncertain economic outlook and challenging operating environment, management guidance became more conservative and the visibility of the company’s forward growth became clouded.
Other detractors included the Fund’s investment in U.S.-based hotelier Hilton Worldwide Holdings.4 Despite Hilton’s good fundamentals, above-average global unit growth, strong balance sheet and attractive valuations, the company’s stock was under pressure during the period largely due to persistently negative investor sentiment for hotel stocks. Investor concerns were largely attributable to deceleration in hotel revenue growth across major U.S. gateway cities, reflecting ongoing broad-based risks and declining in-bound international travel.
It is important to recognize the effect of currency movements on the Fund’s performance. In general, if the value of the U.S. dollar goes up compared with a foreign currency, an investment traded in that foreign currency will go down in value because it will be worth fewer U.S. dollars. This can have a negative effect on Fund performance. Conversely, when the U.S. dollar weakens in relation to a foreign currency, an investment traded in that foreign currency will increase in value, which can contribute to Fund performance. For the six months ended January 31, 2016, the U.S. dollar rose in value relative to most currencies. As a result, the Fund’s performance was negatively affected by the portfolio’s significant investment in securities with non-U.S. currency exposure.
Thank you for your continued participation in Franklin Global Real Estate Fund. We look forward to serving your future investment needs.

The foregoing information reflects our analysis, opinions and portfolio holdings as of January 31, 2016, the end of the reporting period. The way we implement our main investment strategies and the resulting portfolio holdings may change depending on factors such as market and economic conditions. These opinions may not be relied upon as investment advice or an offer for a particular security. The information is not a complete analysis of every aspect of any market, country, industry, security or the Fund. Statements of fact are from sources considered reliable, but the investment manager makes no representation or warranty as to their completeness or accuracy. Although historical performance is no guarantee of future results, these insights may help you understand our investment management philosophy.
8. Industrial holdings are in diversified REITs, industrial REITs and real estate operating companies in the SOI.
See www.franklintempletondatasources.com for additional data provider information.
6 Semiannual Report
franklintempleton.com
FRANKLIN GLOBAL REAL ESTATE FUND
Performance Summary as of January 31, 2016
Your dividend income will vary depending on dividends or interest paid by securities in the Fund’s portfolio, adjusted for operating expenses of each class. Capital gain distributions are net profits realized from the sale of portfolio securities. The performance table does not reflect any taxes that a shareholder would pay on Fund dividends, capital gain distributions, if any, or any realized gains on the sale of Fund shares. Total return reflects reinvestment of the Fund’s dividends and capital gain distributions, if any, and any unrealized gains or losses.
| | | | | | |
| Net Asset Value | | | | | | |
| Share Class (Symbol) | | 1/31/16 | | 7/31/15 | | Change |
| A (FGRRX) | $ | 8.29 | $ | 8.83 | -$ | 0.54 |
| C (FCGRX) | $ | 8.20 | $ | 8.72 | -$ | 0.52 |
| R6 (N/A) | $ | 8.32 | $ | 8.88 | -$ | 0.56 |
| Advisor (FVGRX) | $ | 8.33 | $ | 8.88 | -$ | 0.55 |
| |
| |
| Distributions1 (8/1/15–1/31/16) | | | | | | |
| | | Dividend | | | | |
| Share Class | | Income | | | | |
| A | $ | 0.1425 | | | | |
| C | $ | 0.0952 | | | | |
| R6 | $ | 0.1807 | | | | |
| Advisor | $ | 0.1667 | | | | |
See page 9 for Performance Summary footnotes.
franklintempleton.com
Semiannual Report 7
FRANKLIN GLOBAL REAL ESTATE FUND
PERFORMANCE SUMMARY
Performance as of 1/31/162
Cumulative total return excludes sales charges. Average annual total returns and value of $10,000 investment include maximum sales charges. Class A: 5.75 % maximum initial sales charge; Class C: 1% contingent deferred sales charge in first year only;
Class R6/Advisor Class: no sales charges.
| | | | | | | | | | | | |
| | | | | | | Value of | Average Annual | | | |
| | Cumulative | | Average Annual | | $ | 10,000 | Total Return | | Total Annual Operating Expenses7 | |
| Share Class | Total Return3 | | Total Return4 | | | Investment5 | (12/31/15 | )6 | (with waiver) | | (without waiver) | |
| A | | | | | | | | | 1.40 | % | 1.53 | % |
| 6-Month | -4.53 | % | -10.03 | % | $ | 8,997 | | | | | | |
| 1-Year | -8.83 | % | -14.03 | % | $ | 8,597 | -5.35 | % | | | | |
| 5-Year | +32.79 | % | +4.59 | % | $ | 12,518 | +5.81 | % | | | | |
| Since Inception (6/16/06) | +16.67 | % | +0.99 | % | $ | 10,996 | +1.51 | % | | | | |
| C | | | | | | | | | 2.15 | % | 2.28 | % |
| 6-Month | -4.90 | % | -5.84 | % | $ | 9,416 | | | | | | |
| 1-Year | -9.43 | % | -10.33 | % | $ | 8,967 | -1.21 | % | | | | |
| 5-Year | +28.18 | % | +5.09 | % | $ | 12,818 | +6.37 | % | | | | |
| Since Inception (6/16/06) | +9.25 | % | +0.92 | % | $ | 10,925 | +1.45 | % | | | | |
| R6 | | | | | | | | | 0.99 | % | 1.13 | % |
| 6-Month | -4.30 | % | -4.30 | % | $ | 9,570 | | | | | | |
| 1-Year | -8.39 | % | -8.39 | % | $ | 9,161 | +0.90 | % | | | | |
| Since Inception (5/1/13) | +1.66 | % | +0.60 | % | $ | 10,166 | +2.45 | % | | | | |
| Advisor | | | | | | | | | 1.15 | % | 1.28 | % |
| 6-Month | -4.34 | % | -4.34 | % | $ | 9,566 | | | | | | |
| 1-Year | -8.43 | % | -8.43 | % | $ | 9,157 | +0.73 | % | | | | |
| 5-Year | +34.90 | % | +6.17 | % | $ | 13,490 | +7.42 | % | | | | |
| Since Inception (6/16/06) | +20.35 | % | +1.94 | % | $ | 12,035 | +2.46 | % | | | | |
Performance data represent past performance, which does not guarantee future results. Investment return and principal value will fluctuate, and you may have a gain or loss when you sell your shares. Current performance may differ from figures shown. For most recent month-end performance, go to franklintempleton.com or call (800) 342-5236.
See page 9 for Performance Summary footnotes.
8 Semiannual Report
franklintempleton.com
FRANKLIN GLOBAL REAL ESTATE FUND
PERFORMANCE SUMMARY
All investments involve risks, including possible loss of principal. The Fund concentrates in real estate securities, which involve special risks, such as declines in the value of real estate and increased susceptibility to adverse economic or regulatory developments affecting the sector. The Fund’s investments in REITs involve additional risks; since REITs typically are invested in a limited number of projects or in a particular market segment, they are more susceptible to adverse developments affecting a single project or market segment than more broadly diversified investments. Foreign investing, especially in emerging markets, involves additional risks such as currency and market volatility, as well as political and social instability. Derivatives, including currency management strategies, involve costs and can create economic leverage in the portfolio, which may result in significant volatility and cause the Fund to participate in losses (as well asgains)in an amount that significantly exceeds the Fund’s initial investment. The Fund is actively managed but there is no guarantee that the manager’s investment decisions will produce the desired results. The Fund’s prospectus also includes a description of the main investment risks.
| |
| Class C: | These shares have higher annual fees and expenses than Class A shares. |
| Class R6: | Shares are available to certain eligible investors as described in the prospectus. |
| Advisor Class: | Shares are available to certain eligible investors as described in the prospectus. |
1. The distribution amount is the sum of the dividend payments to shareholders for the period shown and includes only estimated tax-basis net investment income.
2. The Fund has an expense reduction contractually guaranteed through at least 11/30/16. The transfer agent has contractually agreed to cap transfer agency fees for Class R6
shares so that transfer agency fees for that class do not exceed 0.01% until at least 11/30/16. Fund investment results reflect the expense reduction and fee cap, to the extent
applicable; without these reductions, the results would have been lower.
3. Cumulative total return represents the change in value of an investment over the periods indicated.
4. Average annual total return represents the average annual change in value of an investment over the periods indicated. Return for less than one year, if any, has not been
annualized.
5. These figures represent the value of a hypothetical $10,000 investment in the Fund over the periods indicated.
6. In accordance with SEC rules, we provide standardized average annual total return information through the latest calendar quarter.
7. Figures are as stated in the Fund’s current prospectus. In periods of market volatility, assets may decline significantly, causing total annual Fund operating expenses to
become higher than the figures shown.
franklintempleton.com
Semiannual Report 9
FRANKLIN GLOBAL REAL ESTATE FUND
Your Fund’s Expenses
As a Fund shareholder, you can incur two types of costs:
- Transaction costs, including sales charges (loads) on Fund purchases; and
- Ongoing Fund costs, including management fees, distribution and service (12b-1) fees, and other Fund expenses. All mutual funds have ongoing costs, sometimes referred to as operating expenses.
The following table shows ongoing costs of investing in the Fund and can help you understand these costs and compare them with those of other mutual funds. The table assumes a $1,000 investment held for the six months indicated.
Actual Fund Expenses
The first line (Actual) for each share class listed in the table provides actual account values and expenses. The “Ending Account Value” is derived from the Fund’s actual return, which includes the effect of Fund expenses.
You can estimate the expenses you paid during the period by following these steps. Of course, your account value and expenses will differ from those in this illustration:
| 1. | Divide your account value by $1,000. |
| | If an account had an $8,600 value, then $8,600 ÷ $1,000 = 8.6. |
| 2. | Multiply the result by the number under the heading “Expenses Paid During Period.” |
| | If Expenses Paid During Period were $7.50, then 8.6 x $7.50 = $64.50. |
In this illustration, the estimated expenses paid this period are $64.50.
Hypothetical Example for Comparison with Other Funds
Information in the second line (Hypothetical) for each class in the table can help you compare ongoing costs of investing in the Fund with those of other mutual funds. This information may not be used to estimate the actual ending account balance or expenses you paid during the period. The hypothetical “Ending Account Value” is based on the actual expense ratio for each class and an assumed 5% annual rate of return before expenses, which does not represent the Fund’s actual return. The figure under the heading “Expenses Paid During Period” shows the hypothetical expenses your account would have incurred under this scenario. You can compare this figure with the 5% hypothetical examples that appear in shareholder reports of other funds.
Please note that expenses shown in the table are meant to highlight ongoing costs and do not reflect any transaction costs, such as sales charges. Therefore, the second line for each class is useful in comparing ongoing costs only, and will not help you compare total costs of owning different funds. In addition, if transaction costs were included, your total costs would have been higher. Please refer to the Fund prospectus for additional information on operating expenses.
10 Semiannual Report
franklintempleton.com
| | | | | | |
| | | | | | | FRANKLIN GLOBAL REAL ESTATE FUND |
| | | | | | | YOUR FUND’S EXPENSES |
| |
| |
| |
| | | Beginning Account | | Ending Account | | Expenses Paid During |
| Share Class | | Value 8/1/15 | | Value 1/31/16 | | Period* 8/1/15–1/31/16 |
| A | | | | | | |
| Actual | $ | 1,000 | $ | 954.70 | $ | 6.88 |
| Hypothetical (5% return before expenses) | $ | 1,000 | $ | 1,018.10 | $ | 7.10 |
| C | | | | | | |
| Actual | $ | 1,000 | $ | 951.00 | $ | 10.54 |
| Hypothetical (5% return before expenses) | $ | 1,000 | $ | 1,014.33 | $ | 10.89 |
| R6 | | | | | | |
| Actual | $ | 1,000 | $ | 957.00 | $ | 4.87 |
| Hypothetical (5% return before expenses) | $ | 1,000 | $ | 1,020.16 | $ | 5.03 |
| Advisor | | | | | | |
| Actual | $ | 1,000 | $ | 956.60 | $ | 5.66 |
| Hypothetical (5% return before expenses) | $ | 1,000 | $ | 1,019.36 | $ | 5.84 |
*Expenses are calculated using the most recent six-month expense ratio, net of expense waivers, annualized for each class (A: 1.40%;
C: 2.15%; R6: 0.99%; and Advisor: 1.15%), multiplied by the average account value over the period, multiplied by 184/366 to reflect the
one-half year period.
franklintempleton.com
Semiannual Report 11
FRANKLIN GLOBAL TRUST
| | | | | | | | | | | | | | | | | | |
| Financial Highlights | | | | | | | | | | | | | | | | | | |
| Franklin Global Real Estate Fund | | | | | | | | | | | | | | | | | | |
| | | Six Months Ended | | | | | | | | | | | | | | | | |
| | | January 31, 2016 | | | | | | Year Ended July 31, | | | | | | | |
| | | (unaudited) | | | 2015 | | | 2014 | | | 2013 | | | 2012 | | | 2011 | |
| Class A | | | | | | | | | | | | | | | | | | |
| Per share operating performance | | | | | | | | | | | | | | | | | | |
| (for a share outstanding throughout the period) | | | | | | | | | | | | | | | | | | |
| Net asset value, beginning of period | $ | 8.83 | | $ | 8.69 | | $ | 7.88 | | $ | 7.42 | | $ | 7.21 | | $ | 6.40 | |
| Income from investment operationsa: | | | | | | | | | | | | | | | | | | |
| Net investment incomeb | | 0.04 | | | 0.10 | | | 0.11 | | | 0.11 | | | 0.12 | | | 0.13 | |
| Net realized and unrealized gains (losses) | | (0.44 | ) | | 0.18 | | | 0.82 | | | 0.59 | | | 0.17 | | | 1.05 | |
| Total from investment operations | | (0.40 | ) | | 0.28 | | | 0.93 | | | 0.70 | | | 0.29 | | | 1.18 | |
| Less distributions from net investment income . | | (0.14 | ) | | (0.14 | ) | | (0.12 | ) | | (0.24 | ) | | (0.08 | ) | | (0.37 | ) |
| Net asset value, end of period | $ | 8.29 | | $ | 8.83 | | $ | 8.69 | | $ | 7.88 | | $ | 7.42 | | $ | 7.21 | |
| |
| Total returnc | | (4.53 | )% | | 3.27 | % | | 12.13 | % | | 9.44 | % | | 4.12 | % | | 18.98 | % |
| |
| Ratios to average net assetsd | | | | | | | | | | | | | | | | | | |
| Expenses before waiver and payments by | | | | | | | | | | | | | | | | | | |
| affiliates and expense reduction | | 1.54 | % | | 1.58 | % | | 1.61 | % | | 1.62 | % | | 1.68 | % | | 1.73 | % |
| Expenses net of waiver and payments by | | | | | | | | | | | | | | | | | | |
| affiliates and expense reduction | | 1.40 | %e | | 1.45 | %e | | 1.45 | %e | | 1.44 | %e | | 1.37 | % | | 1.35 | %e |
| Net investment income | | 0.89 | % | | 1.06 | % | | 1.31 | % | | 1.37 | % | | 1.72 | % | | 2.02 | % |
| |
| Supplemental data | | | | | | | | | | | | | | | | | | |
| Net assets, end of period (000’s) | $ | 92,235 | | $ | 102,228 | | $ | 90,653 | | $ | 86,575 | | $ | 53,727 | | $ | 57,141 | |
| Portfolio turnover rate | | 10.73 | % | | 26.05 | % | | 22.37 | % | | 19.43 | % | | 25.74 | % | | 53.12 | % |
aThe amount shown for a share outstanding throughout the period may not correlate with the Statement of Operations for the period due to the timing of sales and
repurchases of the Fund’s shares in relation to income earned and/or fluctuating fair value of the investments of the Fund.
bBased on average daily shares outstanding.
cTotal return does not reflect sales commissions or contingent deferred sales charges, if applicable, and is not annualized for periods less than one year.
dRatios are annualized for periods less than one year.
eBenefit of expense reduction rounds to less than 0.01%.
12 Semiannual Report | The accompanying notes are an integral part of these financial statements. franklintempleton.com
| | | | | | | | | | | | | | | | | | |
| | | | | | | | | | | | FRANKLIN GLOBAL TRUST | |
| | | | | | | | | | | | FINANCIAL HIGHLIGHTS | |
| |
| |
| Franklin Global Real Estate Fund (continued) | | | | | | | | | | | | | | | | |
| | | Six Months Ended | | | | | | | | | | | | | | | | |
| | | January 31, 2016 | | | | | | Year Ended July 31, | | | | | | | |
| | | (unaudited) | | | 2015 | | | 2014 | | | 2013 | | | 2012 | | | 2011 | |
| Class C | | | | | | | | | | | | | | | | | | |
| Per share operating performance | | | | | | | | | | | | | | | | | | |
| (for a share outstanding throughout the period) | | | | | | | | | | | | | | | | | | |
| Net asset value, beginning of period | $ | 8.72 | | $ | 8.58 | | $ | 7.80 | | $ | 7.34 | | $ | 7.17 | | $ | 6.35 | |
| Income from investment operationsa: | | | | | | | | | | | | | | | | | | |
| Net investment incomeb | | 0.01 | | | 0.03 | | | 0.05 | | | 0.05 | | | 0.07 | | | 0.09 | |
| Net realized and unrealized gains (losses) | | (0.43 | ) | | 0.20 | | | 0.81 | | | 0.59 | | | 0.16 | | | 1.04 | |
| Total from investment operations | | (0.42 | ) | | 0.23 | | | 0.86 | | | 0.64 | | | 0.23 | | | 1.13 | |
| Less distributions from net investment income . | | (0.10 | ) | | (0.09 | ) | | (0.08 | ) | | (0.18 | ) | | (0.06 | ) | | (0.31 | ) |
| Net asset value, end of period | $ | 8.20 | | $ | 8.72 | | $ | 8.58 | | $ | 7.80 | | $ | 7.34 | | $ | 7.17 | |
| |
| Total returnc | | (4.90 | )% | | 2.70 | % | | 11.28 | % | | 8.64 | % | | 3.39 | % | | 18.30 | % |
| |
| Ratios to average net assetsd | | | | | | | | | | | | | | | | | | |
| Expenses before waiver and payments by | | | | | | | | | | | | | | | | | | |
| affiliates and expense reduction | | 2.29 | % | | 2.28 | % | | 2.31 | % | | 2.32 | % | | 2.38 | % | | 2.43 | % |
| Expenses net of waiver and payments by | | | | | | | | | | | | | | | | | | |
| affiliates and expense reduction | | 2.15 | %e | | 2.15 | %e | | 2.15 | %e | | 2.14 | %e | | 2.07 | % | | 2.05 | %e |
| Net investment income | | 0.14 | % | | 0.36 | % | | 0.61 | % | | 0.67 | % | | 1.02 | % | | 1.32 | % |
| |
| Supplemental data | | | | | | | | | | | | | | | | | | |
| Net assets, end of period (000’s) | $ | 18,980 | | $ | 23,124 | | $ | 20,896 | | $ | 21,350 | | $ | 12,043 | | $ | 11,835 | |
| Portfolio turnover rate | | 10.73 | % | | 26.05 | % | | 22.37 | % | | 19.43 | % | | 25.74 | % | | 53.12 | % |
aThe amount shown for a share outstanding throughout the period may not correlate with the Statement of Operations for the period due to the timing of sales and
repurchases of the Fund’s shares in relation to income earned and/or fluctuating fair value of the investments of the Fund.
bBased on average daily shares outstanding.
cTotal return does not reflect sales commissions or contingent deferred sales charges, if applicable, and is not annualized for periods less than one year.
dRatios are annualized for periods less than one year.
eBenefit of expense reduction rounds to less than 0.01%.
franklintempleton.com The accompanying notes are an integral part of these financial statements. | Semiannual Report 13
| | | | | | | | | | | | |
| FRANKLIN GLOBAL TRUST | | | | | | | | | | | | |
| FINANCIAL HIGHLIGHTS | | | | | | | | | | | | |
| |
| |
| Franklin Global Real Estate Fund (continued) | | | | | | | | | | | | |
| | | Six Months Ended | | | | | | | | | | |
| | | January 31, 2016 | | | Year Ended July 31, | | | | |
| | | (unaudited) | | | 2015 | | | 2014 | | | 2013 | a |
| Class R6 | | | | | | | | | | | | |
| Per share operating performance | | | | | | | | | | | | |
| (for a share outstanding throughout the period) | | | | | | | | | | | | |
| Net asset value, beginning of period | $ | 8.88 | | $ | 8.74 | | $ | 7.92 | | $ | 8.70 | |
| Income from investment operationsb: | | | | | | | | | | | | |
| Net investment incomec | | 0.06 | | | 0.14 | | | 0.15 | | | 0.04 | |
| Net realized and unrealized gains (losses) | | (0.44 | ) | | 0.18 | | | 0.82 | | | (0.82 | ) |
| Total from investment operations | | (0.38 | ) | | 0.32 | | | 0.97 | | | (0.78 | ) |
| Less distributions from net investment income. | | (0.18 | ) | | (0.18 | ) | | (0.15 | ) | | — | |
| Net asset value, end of period | $ | 8.32 | | $ | 8.88 | | $ | 8.74 | | $ | 7.92 | |
| |
| Total returnd | | (4.30 | )% | | 3.71 | % | | 12.51 | % | | (8.97 | )% |
| |
| Ratios to average net assetse | | | | | | | | | | | | |
| Expenses before waiver and payments by affiliates and expense reduction . | | 1.17 | % | | 1.13 | % | | 1.15 | % | | 1.15 | % |
| Expenses net of waiver and payments by affiliates and expense reductionf | | 0.99 | % | | 0.99 | % | | 0.99 | % | | 0.99 | % |
| Net investment income | | 1.30 | % | | 1.52 | % | | 1.77 | % | | 1.82 | % |
| |
| Supplemental data | | | | | | | | | | | | |
| Net assets, end of period (000’s) | $ | 114 | | $ | 246 | | $ | 768 | | $ | 379 | |
| Portfolio turnover rate. | | 10.73 | % | | 26.05 | % | | 22.37 | % | | 19.43 | % |
aFor the period May 1, 2013 (effective date) to July 31, 2013.
bThe amount shown for a share outstanding throughout the period may not correlate with the Statement of Operations for the period due to the timing of sales and
repurchases of the Fund’s shares in relation to income earned and/or fluctuating fair value of the investments of the Fund.
cBased on average daily shares outstanding.
dTotal return is not annualized for periods less than one year.
eRatios are annualized for periods less than one year.
fBenefit of expense reduction rounds to less than 0.01%.
14 Semiannual Report | The accompanying notes are an integral part of these financial statements. franklintempleton.com
| | | | | | | | | | | | | | | | | | |
| | | | | | | | | | | | FRANKLIN GLOBAL TRUST | |
| | | | | | | | | | | | FINANCIAL HIGHLIGHTS | |
| |
| |
| Franklin Global Real Estate Fund (continued) | | | | | | | | | | | | | | | | |
| | | Six Months Ended | | | | | | | | | | | | | | | | |
| | | January 31, 2016 | | | | | | Year Ended July 31, | | | | | | | |
| | | (unaudited) | | | 2015 | | | 2014 | | | 2013 | | | 2012 | | | 2011 | |
| Advisor Class | | | | | | | | | | | | | | | | | | |
| Per share operating performance | | | | | | | | | | | | | | | | | | |
| (for a share outstanding throughout the period) | | | | | | | | | | | | | | | | | | |
| Net asset value, beginning of period | $ | 8.88 | | $ | 8.73 | | $ | 7.91 | | $ | 7.46 | | $ | 7.23 | | $ | 6.42 | |
| Income from investment operationsa: | | | | | | | | | | | | | | | | | | |
| Net investment incomeb | | 0.05 | | | 0.12 | | | 0.13 | | | 0.13 | | | 0.13 | | | 0.17 | |
| Net realized and unrealized gains (losses) | | (0.43 | ) | | 0.19 | | | 0.83 | | | 0.59 | | | 0.18 | | | 1.03 | |
| Total from investment operations | | (0.38 | ) | | 0.31 | | | 0.96 | | | 0.72 | | | 0.31 | | | 1.20 | |
| Less distributions from net investment income . | | (0.17 | ) | | (0.16 | ) | | (0.14 | ) | | (0.27 | ) | | (0.08 | ) | | (0.39 | ) |
| Net asset value, end of period | $ | 8.33 | | $ | 8.88 | | $ | 8.73 | | $ | 7.91 | | $ | 7.46 | | $ | 7.23 | |
| |
| Total returnc | | (4.34 | )% | | 3.67 | % | | 12.39 | % | | 9.78 | % | | 4.48 | % | | 19.33 | % |
| |
| Ratios to average net assetsd | | | | | | | | | | | | | | | | | | |
| Expenses before waiver and payments by | | | | | | | | | | | | | | | | | | |
| affiliates and expense reduction | | 1.29 | % | | 1.28 | % | | 1.31 | % | | 1.32 | % | | 1.38 | % | | 1.43 | % |
| Expenses net of waiver and payments by | | | | | | | | | | | | | | | | | | |
| affiliates and expense reduction | | 1.15 | %e | | 1.15 | %e | | 1.15 | %e | | 1.14 | %e | | 1.07 | % | | 1.05 | %e |
| Net investment income | | 1.14 | % | | 1.36 | % | | 1.61 | % | | 1.67 | % | | 2.02 | % | | 2.32 | % |
| |
| Supplemental data | | | | | | | | | | | | | | | | | | |
| Net assets, end of period (000’s) | $ | 42,870 | | $ | 45,451 | | $ | 52,423 | | $ | 48,116 | | $ | 39,255 | | $ | 27,074 | |
| Portfolio turnover rate | | 10.73 | % | | 26.05 | % | | 22.37 | % | | 19.43 | % | | 25.74 | % | | 53.12 | % |
aThe amount shown for a share outstanding throughout the period may not correlate with the Statement of Operations for the period due to the timing of sales and
repurchases of the Fund’s shares in relation to income earned and/or fluctuating fair value of the investments of the Fund.
bBased on average daily shares outstanding.
cTotal return is not annualized for periods less than one year.
dRatios are annualized for periods less than one year.
eBenefit of expense reduction rounds to less than 0.01%.
franklintempleton.com The accompanying notes are an integral part of these financial statements. | Semiannual Report 15
| | | | |
| FRANKLIN GLOBAL TRUST | | | | |
| |
| |
| |
| |
| Statement of Investments, January 31, 2016 (unaudited) | | | | |
| Franklin Global Real Estate Fund | | | | |
| | | Shares/ | | |
| | Country | Units | | Value |
| |
| Common Stocks and Other Equity Interests 98.7% | | | | |
| Diversified Real Estate Activities 8.5% | | | | |
| CapitaLand Ltd | Singapore | 711,124 | $ | 1,532,842 |
| Mitsubishi Estate Co. Ltd | Japan | 189,854 | | 3,712,864 |
| Mitsui Fudosan Co. Ltd | Japan | 203,595 | | 4,714,000 |
| Sun Hung Kai Properties Ltd | Hong Kong | 159,727 | | 1,715,166 |
| Tokyo Tatemono Co. Ltd | Japan | 84,390 | | 893,672 |
| The Wharf Holdings Ltd | Hong Kong | 110,694 | | 510,029 |
| | | | | 13,078,573 |
| Diversified REITs 7.1% | | | | |
| Activia Properties Inc | Japan | 171 | | 762,762 |
| a Activia Properties Inc., 144A. | Japan | 47 | | 209,648 |
| American Assets Trust Inc | United States | 21,043 | | 786,798 |
| British Land Co. PLC | United Kingdom | 172,671 | | 1,820,752 |
| Duke Realty Corp | United States | 80,000 | | 1,610,400 |
| Hulic REIT Inc | Japan | 277 | | 400,650 |
| a Hulic REIT Inc., 144A | Japan | 206 | | 297,956 |
| Kenedix Office Investment Corp | Japan | 250 | | 1,257,641 |
| Land Securities Group PLC | United Kingdom | 148,505 | | 2,317,154 |
| Stockland | Australia | 527,659 | | 1,527,737 |
| | | | | 10,991,498 |
| Health Care REITs 5.4% | | | | |
| HCP Inc | United States | 48,554 | | 1,745,031 |
| OMEGA Healthcare Investors Inc | United States | 31,900 | | 1,011,549 |
| Physicians Realty Trust | United States | 13,400 | | 228,738 |
| Ventas Inc | United States | 51,409 | | 2,843,946 |
| Welltower Inc | United States | 40,158 | | 2,498,630 |
| | | | | 8,327,894 |
| Homebuilding 0.3% | | | | |
| D.R. Horton Inc | United States | 17,750 | | 488,303 |
| Hotel & Resort REITs 2.4% | | | | |
| Hoshino Resorts REIT Inc | Japan | 59 | | 583,372 |
| Host Hotels & Resorts Inc | United States | 106,520 | | 1,475,302 |
| Summit Hotel Properties Inc | United States | 76,500 | | 776,475 |
| Sunstone Hotel Investors Inc | United States | 65,168 | | 774,196 |
| | | | | 3,609,345 |
| Hotels, Resorts & Cruise Lines 0.6% | | | | |
| Hilton Worldwide Holdings Inc | United States | 17,620 | | 313,812 |
| Melia Hotels International SA | Spain | 52,741 | | 572,539 |
| | | | | 886,351 |
| Industrial REITs 5.1% | | | | |
| First Industrial Realty Trust Inc | United States | 53,200 | | 1,095,388 |
| Goodman Group | Australia | 294,710 | | 1,268,441 |
| Mapletree Logistics Trust | Singapore | 677,137 | | 446,908 |
| Nippon Prologis REIT Inc | Japan | 534 | | 943,080 |
| PLA Administradora Industrial S de RL de CV | Mexico | 279,100 | | 445,944 |
| a PLA Administradora Industrial S de RL de CV, 144A | Mexico | 152,200 | | 243,184 |
| Prologis Inc | United States | 86,320 | | 3,407,050 |
| | | | | 7,849,995 |
16 Semiannual Report
franklintempleton.com
FRANKLIN GLOBAL TRUST
STATEMENT OF INVESTMENTS (UNAUDITED)
| | | | |
| Franklin Global Real Estate Fund (continued) | | | | |
| | | Shares/ | | |
| | Country | Units | | Value |
| |
| Common Stocks and Other Equity Interests (continued) | | | | |
| Office REITs 12.1% | | | | |
| Alexandria Real Estate Equities Inc | United States | 23,284 | $ | 1,843,627 |
| Boston Properties Inc | United States | 27,532 | | 3,199,494 |
| Daiwa Office Investment Corp | Japan | 33 | | 187,543 |
| a Daiwa Office Investment Corp., 144A | Japan | 90 | | 511,482 |
| Derwent London PLC | United Kingdom | 34,668 | | 1,600,071 |
| Dexus Property Group | Australia | 185,735 | | 967,706 |
| Great Portland Estates PLC | United Kingdom | 143,873 | | 1,571,416 |
| Highwoods Properties Inc | United States | 30,466 | | 1,288,407 |
| Japan Real Estate Investment Corp | Japan | 220 | | 1,159,425 |
| Kilroy Realty Corp | United States | 23,630 | | 1,320,208 |
| Paramount Group Inc | United States | 45,660 | | 748,824 |
| SL Green Realty Corp | United States | 19,659 | | 1,899,256 |
| Vornado Realty Trust | United States | 26,625 | | 2,355,248 |
| | | | | 18,652,707 |
| Real Estate Development 2.6% | | | | |
| Cheung Kong Property Holdings Ltd | Hong Kong | 276,000 | | 1,473,878 |
| China Overseas Land & Investment Ltd | China | 232,158 | | 669,856 |
| China Resources Land Ltd | China | 248,000 | | 605,601 |
| KWG Property Holdings Ltd | China | 720,500 | | 457,448 |
| Sino Land Co. Ltd | Hong Kong | 622,645 | | 793,841 |
| | | | | 4,000,624 |
| Real Estate Operating Companies 7.8% | | | | |
| b ADO Properties SA | Germany | 10,390 | | 290,250 |
| a,b ADO Properties SA, 144A | Germany | 21,470 | | 599,774 |
| Brookfield Property Partners LP | United States | 49,100 | | 1,030,087 |
| Castellum AB | Sweden | 43,860 | | 651,508 |
| Deutsche Euroshop AG | Germany | 19,317 | | 824,669 |
| a Deutsche Euroshop AG, 144A | Germany | 2,620 | | 111,851 |
| Global Logistic Properties Ltd | Singapore | 449,110 | | 532,909 |
| Hemfosa Fastigheter AB | Sweden | 37,180 | | 366,022 |
| a Hemfosa Fastigheter AB, 144A | Sweden | 31,940 | | 314,436 |
| b Hispania Activos Inmobiliarios SAU | Spain | 1,067 | | 13,201 |
| a,b Hispania Activos Inmobiliarios SAU, 144A | Spain | 14,387 | | 178,002 |
| Hong Kong Land Holdings Ltd | Hong Kong | 321,559 | | 2,016,175 |
| Hufvudstaden AB, A | Sweden | 74,256 | | 1,018,236 |
| Hysan Development Co. Ltd | Hong Kong | 235,624 | | 913,037 |
| Unite Group PLC. | United Kingdom | 78,673 | | 720,836 |
| a Unite Group PLC, 144A | United Kingdom | 3,933 | | 36,036 |
| Vonovia SE | Germany | 81,217 | | 2,464,614 |
| | | | | 12,081,643 |
| Residential REITs 11.6% | | | | |
| Apartment Investment & Management Co., A | United States | 36,997 | | 1,448,433 |
| AvalonBay Communities Inc | United States | 13,848 | | 2,374,793 |
| Canadian Apartment Properties REIT | Canada | 38,600 | | 824,132 |
| Equity Lifestyle Properties Inc | United States | 27,302 | | 1,799,748 |
| Equity Residential | United States | 63,223 | | 4,873,861 |
| Essex Property Trust Inc | United States | 13,100 | | 2,791,741 |
| Invincible Investment Corp | Japan | 2,068 | | 1,253,851 |
| UDR Inc | United States | 70,697 | | 2,516,106 |
| | | | | 17,882,665 |
franklintempleton.com
Semiannual Report 17
FRANKLIN GLOBAL TRUST
STATEMENT OF INVESTMENTS (UNAUDITED)
| | | | | |
| Franklin Global Real Estate Fund (continued) | | | | | |
| | | | Shares/ | | |
| | Country | | Units | | Value |
| |
| Common Stocks and Other Equity Interests (continued) | | | | | |
| Retail REITs 27.3% | | | | | |
| Brixmor Property Group Inc | United States | | 34,100 | $ | 907,742 |
| Eurocommercial Properties NV, IDR | Netherlands | | 21,664 | | 945,638 |
| Federal Realty Investment Trust | United States | | 11,440 | | 1,725,495 |
| General Growth Properties Inc | United States | | 79,916 | | 2,240,845 |
| Hammerson PLC | United Kingdom | | 191,443 | | 1,591,769 |
| Kenedix Retail REIT Corp | Japan | | 12 | | 24,285 |
| a Kenedix Retail REIT Corp., 144A | Japan | | 155 | | 313,687 |
| Kimco Realty Corp | United States | | 66,151 | | 1,798,646 |
| Klepierre | France | | 54,418 | | 2,352,363 |
| Link REIT | Hong Kong | | 379,466 | | 2,160,518 |
| The Macerich Co | United States | | 20,793 | | 1,621,230 |
| National Retail Properties Inc | United States | | 28,600 | | 1,228,084 |
| Realty Income Corp | United States | | 40,024 | | 2,232,939 |
| Regency Centers Corp | United States | | 29,481 | | 2,134,130 |
| Scentre Group | Australia | | 751,569 | | 2,314,355 |
| Simon Property Group Inc | United States | | 45,010 | | 8,384,463 |
| Smart Real Estate Investment Trust | Canada | | 34,800 | | 769,083 |
| Taubman Centers Inc | United States | | 16,171 | | 1,148,788 |
| Unibail-Rodamco SE | France | | 18,116 | | 4,553,435 |
| Weingarten Realty Investors | United States | | 34,060 | | 1,188,353 |
| Westfield Corp | Australia | | 342,680 | | 2,401,573 |
| | | | | | 42,037,421 |
| Specialized REITs 7.9% | | | | | |
| Coresite Realty Corp | United States | | 19,031 | | 1,220,649 |
| CubeSmart | United States | | 59,847 | | 1,872,613 |
| CyrusOne Inc | United States | | 21,200 | | 781,220 |
| Digital Realty Trust Inc | United States | | 22,027 | | 1,763,922 |
| Extra Space Storage Inc | United States | | 26,571 | | 2,409,724 |
| Public Storage | United States | | 16,488 | | 4,180,697 |
| | | | | | 12,228,825 |
| Total Common Stocks and Other Equity Interests | | | | | |
| (Cost $118,112,956) | | | | | 152,115,844 |
| | | | Principal | | |
| | | | Amount | | |
| |
| Short Term Investments (Cost $1,700,000) 1.1% | | | | | |
| Time Deposits 1.1% | | | | | |
| Royal Bank of Canada, 0.28%, 2/01/16 | United States | $ | 1,700,000 | | 1,700,000 |
| Total Investments (Cost $119,812,956) 99.8% | | | | | 153,815,844 |
| Other Assets, less Liabilities 0.2% | | | | | 382,978 |
| Net Assets 100.0% | | | | $ | 154,198,822 |
See Abbreviations on page 30.
aSecurity was purchased pursuant to Rule 144A under the Securities Act of 1933 and may be sold in transactions exempt from registration only to qualified institutional buyers
or in a public offering registered under the Securities Act of 1933. These securities have been deemed liquid under guidelines approved by the Trust’s Board of Trustees. At
January 31, 2016, the aggregate value of these securities was $2,816,056, representing 1.83% of net assets.
bNon-income producing.
18 Semiannual Report | The accompanying notes are an integral part of these financial statements. franklintempleton.com
FRANKLIN GLOBAL TRUST
Financial Statements
Statement of Assets and Liabilities
January 31, 2016 (unaudited)
| | | |
| Franklin Global Real Estate Fund | | | |
| |
| Assets: | | | |
| Investments in securities: | | | |
| Cost. | $ | 119,812,956 | |
| Value | $ | 153,815,844 | |
| Cash | | 275,625 | |
| Receivables: | | | |
| Investment securities sold | | 629,512 | |
| Capital shares sold | | 234,950 | |
| Dividends | | 269,493 | |
| Other assets | | 5 | |
| Total assets | | 155,225,429 | |
| Liabilities: | | | |
| Payables: | | | |
| Investment securities purchased | | 608,482 | |
| Capital shares redeemed | | 175,236 | |
| Management fees | | 113,506 | |
| Distribution fees | | 36,314 | |
| Transfer agent fees | | 29,759 | |
| Trustees’ fees and expenses | | 631 | |
| Accrued expenses and other liabilities | | 62,679 | |
| Total liabilities | | 1,026,607 | |
| Net assets, at value | $ | 154,198,822 | |
| Net assets consist of: | | | |
| Paid-in capital | $ | 186,658,181 | |
| Distributions in excess of net investment income | | (2,788,385 | ) |
| Net unrealized appreciation (depreciation) | | 33,999,380 | |
| Accumulated net realized gain (loss) | | (63,670,354 | ) |
| Net assets, at value | $ | 154,198,822 | |
franklintempleton.com The accompanying notes are an integral part of these financial statements. | Semiannual Report 19
FRANKLIN GLOBAL TRUST
FINANCIAL STATEMENTS
Statement of Assets and Liabilities (continued)
January 31, 2016 (unaudited)
| | |
| Franklin Global Real Estate Fund | | |
| |
| Class A: | | |
| Net assets, at value | $ | 92,234,859 |
| Shares outstanding | | 11,119,437 |
| Net asset value per sharea | $ | 8.29 |
| Maximum offering price per share (net asset value per share ÷ 94.25%) | $ | 8.80 |
| Class C: | | |
| Net assets, at value | $ | 18,980,479 |
| Shares outstanding | | 2,314,909 |
| Net asset value and maximum offering price per sharea | $ | 8.20 |
| Class R6: | | |
| Net assets, at value | $ | 113,668 |
| Shares outstanding | | 13,666 |
| Net asset value and maximum offering price per share | $ | 8.32 |
| Advisor Class: | | |
| Net assets, at value | $ | 42,869,816 |
| Shares outstanding | | 5,149,223 |
| Net asset value and maximum offering price per share | $ | 8.33 |
aRedemption price is equal to net asset value less contingent deferred sales charges, if applicable.
20 Semiannual Report | The accompanying notes are an integral part of these financial statements. franklintempleton.com
|
| FRANKLIN GLOBAL TRUST |
| FINANCIAL STATEMENTS |
Statement of Operations
for the six months ended January 31, 2016 (unaudited)
| | | |
| Franklin Global Real Estate Fund | | | |
| |
| Investment income: | | | |
| Dividends | $ | 1,866,916 | |
| Interest | | 876 | |
| Total investment income | | 1,867,792 | |
| Expenses: | | | |
| Management fees (Note 3a) | | 820,297 | |
| Distribution fees: (Note 3c) | | | |
| Class A | | 123,223 | |
| Class C | | 106,320 | |
| Transfer agent fees: (Note 3e) | | | |
| Class A | | 88,402 | |
| Class C | | 19,067 | |
| Class R6 | | 53 | |
| Advisor Class. | | 39,598 | |
| Custodian fees (Note 4) | | 6,269 | |
| Reports to shareholders | | 19,785 | |
| Registration and filing fees | | 33,242 | |
| Professional fees | | 24,303 | |
| Trustees’ fees and expenses | | 3,274 | |
| Other | | 6,179 | |
| Total expenses. | | 1,290,012 | |
| Expense reductions (Note 4) | | (33 | ) |
| Expenses waived/paid by affiliates (Note 3f) | | (121,363 | ) |
| Net expenses. | | 1,168,616 | |
| Net investment income | | 699,176 | |
| Realized and unrealized gains (losses): | | | |
| Net realized gain (loss) from: | | | |
| Investments | | 135,096 | |
| Foreign currency transactions | | (427 | ) |
| Net realized gain (loss) | | 134,669 | |
| Net change in unrealized appreciation (depreciation) on: | | | |
| Investments | | (8,480,529 | ) |
| Translation of other assets and liabilities denominated in foreign | | | |
| currencies | | 2,024 | |
| Net change in unrealized appreciation (depreciation) | | (8,478,505 | ) |
| Net realized and unrealized gain (loss) | | (8,343,836 | ) |
| Net increase (decrease) in net assets resulting from operations | $ | (7,644,660 | ) |
franklintempleton.com The accompanying notes are an integral part of these financial statements. | Semiannual Report 21
| | | | | | |
| FRANKLIN GLOBAL TRUST | | | | | | |
| FINANCIAL STATEMENTS | | | | | | |
| |
| |
| Statements of Changes in Net Assets | | | | | | |
| |
| Franklin Global Real Estate Fund | | | | | | |
| |
| | | Six Months Ended | | | | |
| | | January 31, 2016 | | | Year Ended | |
| | | (unaudited) | | | July 31, 2015 | |
| Increase (decrease) in net assets: | | | | | | |
| Operations: | | | | | | |
| Net investment income | $ | 699,176 | | $ | 1,819,013 | |
| Net realized gain (loss) | | 134,669 | | | 4,457,137 | |
| Net change in unrealized appreciation (depreciation) | | (8,478,505 | ) | | (1,033,600 | ) |
| Net increase (decrease) in net assets resulting from operations | | (7,644,660 | ) | | 5,242,550 | |
| Distributions to shareholders from: | | | | | | |
| Net investment income: | | | | | | |
| Class A | | (1,589,888 | ) | | (1,474,780 | ) |
| Class C | | (230,329 | ) | | (220,946 | ) |
| Class R6 | | (4,025 | ) | | (15,459 | ) |
| Advisor Class | | (845,427 | ) | | (977,839 | ) |
| Total distributions to shareholders | | (2,669,669 | ) | | (2,689,024 | ) |
| Capital share transactions: (Note 2) | | | | | | |
| Class A | | (3,871,763 | ) | | 10,431,964 | |
| Class C | | (2,818,843 | ) | | 1,986,128 | |
| Class R6 | | (119,771 | ) | | (562,585 | ) |
| Advisor Class | | 274,128 | | | (8,099,218 | ) |
| Total capital share transactions | | (6,536,249 | ) | | 3,756,289 | |
| Net increase (decrease) in net assets | | (16,850,578 | ) | | 6,309,815 | |
| Net assets: | | | | | | |
| Beginning of period | | 171,049,400 | | | 164,739,585 | |
| End of period. | $ | 154,198,822 | | $ | 171,049,400 | |
| Distributions in excess of net investment income included in net assets: | | | | | | |
| End of period | $ | (2,788,385 | ) | $ | (817,892 | ) |
22 Semiannual Report | The accompanying notes are an integral part of these financial statements. franklintempleton.com
FRANKLIN GLOBAL TRUST
Notes to Financial Statements (unaudited)
Franklin Global Real Estate Fund
1. Organization and Significant Accounting Policies
Franklin Global Trust (Trust) is registered under the Investment Company Act of 1940 (1940 Act) as an open-end management investment company, consisting of six separate funds and applies the specialized accounting and reporting guidance in U.S. Generally Accepted Accounting Principles (U.S. GAAP). Franklin Global Real Estate Fund (Fund) is included in this report. The financial statements of the remaining funds in the Trust are presented separately. The Fund offers four classes of shares: Class A, Class C, Class R6 and Advisor Class. Each class of shares differs by its initial sales load, contingent deferred sales charges, voting rights on matters affecting a single class, its exchange privilege and fees primarily due to differing arrangements for distribution and transfer agent fees.
The following summarizes the Fund’s significant accounting policies.
a. Financial Instrument Valuation
The Fund’s investments in financial instruments are carried at fair value daily. Fair value is the price that would be received to sell an asset or paid to transfer a liability in an orderly transaction between market participants on the measurement date. The Fund calculates the net asset value per share as of 4 p.m. Eastern time each day the New York Stock Exchange (NYSE) is open for trading. Under compliance policies and procedures approved by the Trust’s Board of Trustees (the Board), the Fund’s administrator has responsibility for oversight of valuation, including leading the cross-functional Valuation and Liquidity Oversight Committee (VLOC). The VLOC provides administration and oversight of the Fund’s valuation policies and procedures, which are approved annually by the Board. Among other things, these procedures allow the Fund to utilize independent pricing services, quotations from securities and financial instrument dealers, and other market sources to determine fair value.
Equity securities listed on an exchange or on the NASDAQ National Market System are valued at the last quoted sale price or the official closing price of the day, respectively. Foreign equity securities are valued as of the close of trading on the foreign stock exchange on which the security is primarily traded or as 4 p.m. Eastern time, whichever is earlier. The value is then converted into its U.S. dollar equivalent at the foreign exchange rate in effect at 4 p.m. Eastern time on the day that the value of the security is determined. Over-the-counter (OTC) securities are valued within the range of the most recent quoted bid and ask prices. Securities that trade in multiple markets or on multiple exchanges are valued according to the broadest and most representative market. Certain equity securities are valued based upon fundamental characteristics or relationships to similar securities.
Time deposits are valued at cost, which approximates fair value.
The Fund has procedures to determine the fair value of financial instruments for which market prices are not reliable or readily available. Under these procedures, the VLOC convenes on a regular basis to review such financial instruments and considers a number of factors, including significant unobservable valuation inputs, when arriving at fair value. The VLOC primarily employs a market-based approach which may use related or comparable assets or liabilities, recent transactions, market multiples, book values, and other relevant information for the investment to determine the fair value of the investment. An income-based valuation approach may also be used in which the anticipated future cash flows of the investment are discounted to calculate fair value. Discounts may also be applied due to the nature or duration of any restrictions on the disposition of the investments. Due to the inherent uncertainty of valuations of such investments, the fair values may differ significantly from the values that would have been used had an active market existed. The VLOC employs various methods for calibrating these valuation approaches including a regular review of key inputs and assumptions, transactional back-testing or disposition analysis, and reviews of any related market activity.
Trading in securities on foreign securities stock exchanges and OTC markets may be completed before 4 p.m. Eastern time. In addition, trading in certain foreign markets may not take place on every NYSE business day. Occasionally, events occur between the time at which trading in a foreign security is completed and the close of the NYSE that might call into question the reliability of the value of a portfolio security held by the Fund. As a result, differences may arise between the value of the Fund’s portfolio securities as determined at the foreign market close and the latest indications of value at the close of the NYSE. In order to minimize the potential for these differences, the VLOC monitors price movements following the close of trading in foreign stock markets through a series of country specific market proxies (such as baskets of American Depositary Receipts, futures contracts and exchange traded funds). These price movements are measured against
franklintempleton.com
Semiannual Report 23
FRANKLIN GLOBAL TRUST
NOTES TO FINANCIAL STATEMENTS (UNAUDITED)
Franklin Global Real Estate Fund (continued)
1. Organization and Significant Accounting
Policies (continued)
a. Financial Instrument Valuation (continued)
established trigger thresholds for each specific market proxy to assist in determining if an event has occurred that may call into question the reliability of the values of the foreign securities held by the Fund. If such an event occurs, the securities may be valued using fair value procedures, which may include the use of independent pricing services.
When the last day of the reporting period is a non-business day, certain foreign markets may be open on those days that the NYSE is closed, which could result in differences between the value of the Fund’s portfolio securities on the last business day and the last calendar day of the reporting period. Any significant security valuation changes due to an open foreign market are adjusted and reflected by the Fund for financial reporting purposes.
b. Foreign Currency Translation
Portfolio securities and other assets and liabilities denominated in foreign currencies are translated into U.S. dollars based on the exchange rate of such currencies against U.S. dollars on the date of valuation. The Fund may enter into foreign currency exchange contracts to facilitate transactions denominated in a foreign currency. Purchases and sales of securities, income and expense items denominated in foreign currencies are translated into U.S. dollars at the exchange rate in effect on the transaction date. Portfolio securities and assets and liabilities denominated in foreign currencies contain risks that those currencies will decline in value relative to the U.S. dollar. Occasionally, events may impact the availability or reliability of foreign exchange rates used to convert the U.S. dollar equivalent value. If such an event occurs, the foreign exchange rate will be valued at fair value using procedures established and approved by the Board.
The Fund does not separately report the effect of changes in foreign exchange rates from changes in market prices on securities held. Such changes are included in net realized and unrealized gain or loss from investments in the Statement of Operations.
Realized foreign exchange gains or losses arise from sales of foreign currencies, currency gains or losses realized between the trade and settlement dates on securities transactions and the difference between the recorded amounts of dividends, interest, and foreign withholding taxes and the U.S. dollar equivalent of the amounts actually received or paid. Net unrealized foreign exchange gains and losses arise from changes in foreign exchange rates on foreign denominated assets and liabilities other than investments in securities held at the end of the reporting period.
c. Securities Lending
The Fund participates in an agency based securities lending program to earn additional income. The Fund receives cash collateral against the loaned securities in an amount equal to at least 102% of the fair value of the loaned securities. Collateral is maintained over the life of the loan in an amount not less than 100% of the fair value of loaned securities, as determined at the close of Fund business each day; any additional collateral required due to changes in security values is delivered to the Fund on the next business day. The collateral is deposited into a joint cash account with other funds and is used to invest in a money market fund managed by Franklin Advisers, Inc., an affiliate of the Fund, and/or a joint repurchase agreement. The Fund may receive income from the investment of cash collateral, in addition to lending fees and rebates paid by the borrower. Income from securities loaned is reported separately in the Statement of Operations. The Fund bears the market risk with respect to the collateral investment, securities loaned, and the risk that the agent may default on its obligations to the Fund. If the borrower defaults on its obligation to return the securities loaned, the Fund has the right to repurchase the securities in the open market using the collateral received. The securities lending agent has agreed to indemnify the Fund in the event of default by a third party borrower. At January 31, 2016, the Fund had no securities on loan.
d. Income and Deferred Taxes
It is the Fund’s policy to qualify as a regulated investment company under the Internal Revenue Code. The Fund intends to distribute to shareholders substantially all of its taxable income and net realized gains to relieve it from federal income and excise taxes. As a result, no provision for U.S. federal income taxes is required.
The Fund may be subject to foreign taxation related to income received, capital gains on the sale of securities and certain foreign currency transactions in the foreign jurisdictions in which it invests. Foreign taxes, if any, are recorded based on the tax regulations and rates that exist in the foreign markets in which the Fund invests. When a capital gain tax is determined
24 Semiannual Report
franklintempleton.com
FRANKLIN GLOBAL TRUST
NOTES TO FINANCIAL STATEMENTS (UNAUDITED)
Franklin Global Real Estate Fund (continued)
to apply, the Fund records an estimated deferred tax liability in an amount that would be payable if the securities were disposed of on the valuation date.
The Fund may recognize an income tax liability related to its uncertain tax positions under U.S. GAAP when the uncertain tax position has a less than 50% probability that it will be sustained upon examination by the tax authorities based on its technical merits. As of January 31, 2016, the Fund has determined that no tax liability is required in its financial statements related to uncertain tax positions for any open tax years (or expected to be taken on future tax returns). Open tax years are those that remain subject to examination and are based on each tax jurisdiction’s statute of limitation.
e. Security Transactions, Investment Income, Expenses and Distributions
Security transactions are accounted for on trade date. Realized gains and losses on security transactions are determined on a specific identification basis. Interest income and estimated expenses are accrued daily. Dividend income is recorded on the ex-dividend date except for certain dividends from foreign securities where the dividend rate is not available. In such cases, the dividend is recorded as soon as the information is received by the Fund. Distributions to shareholders are recorded on the ex-dividend date and are determined according to income tax regulations (tax basis). Distributable earnings determined on a tax basis may differ from earnings recorded in accordance with U.S. GAAP. These differences may be permanent or temporary. Permanent differences are reclassified among capital accounts to reflect their tax character. These reclassifications have no impact on net assets or the results of operations. Temporary differences are not reclassified, as they may reverse in subsequent periods.
Common expenses incurred by the Trust are allocated among the funds based on the ratio of net assets of each Fund to the combined net assets of the Trust. Fund specific expenses are charged directly to the fund that incurred the expense.
Realized and unrealized gains and losses and net investment income, not including class specific expenses, are allocated daily to each class of shares based upon the relative proportion of net assets of each class. Differences in per share distributions, by class, are generally due to differences in class specific expenses.
Distributions received by the Fund from certain securities may be a return of capital (ROC). Such distributions reduce the cost basis of the securities, and any distributions in excess of the cost basis are recognized as capital gains. For Real Estate Investment Trust (REIT) securities, the Fund records ROC estimates, if any, on the ex-dividend date and are adjusted once actual tax designations are known.
f. Accounting Estimates
The preparation of financial statements in accordance with U.S. GAAP requires management to make estimates and assumptions that affect the reported amounts of assets and liabilities at the date of the financial statements and the amounts of income and expenses during the reporting period. Actual results could differ from those estimates.
g. Guarantees and Indemnifications
Under the Trust’s organizational documents, its officers and trustees are indemnified by the Trust against certain liabilities arising out of the performance of their duties to the Trust. Additionally, in the normal course of business, the Trust, on behalf of the Fund, enters into contracts with service providers that contain general indemnification clauses. The Trust’s maximum exposure under these arrangements is unknown as this would involve future claims that may be made against the Trust that have not yet occurred. Currently, the Trust expects the risk of loss to be remote.
franklintempleton.com
Semiannual Report 25
FRANKLIN GLOBAL TRUST
NOTES TO FINANCIAL STATEMENTS (UNAUDITED)
Franklin Global Real Estate Fund (continued)
2. Shares of Beneficial Interest
At January 31, 2016, there were an unlimited number of shares authorized (without par value). Transactions in the Fund’s shares were as follows:
| | | | | | | | | | |
| | Six Months Ended | | Year Ended | |
| | January 31, 2016 | | July 31, 2015 | |
| | Shares | | | Amount | | Shares | | | Amount | |
| Class A Shares: | | | | | | | | | | |
| Shares sold | 918,119 | | $ | 7,875,136 | | 3,180,359 | | $ | 28,576,850 | |
| Shares issued in reinvestment of distributions | 179,280 | | | 1,517,211 | | 160,334 | | | 1,381,528 | |
| Shares redeemed | (1,550,012 | ) | (13,264,110 | ) | (2,204,762 | ) | | (19,526,414 | ) |
| Net increase (decrease) | (452,613 | ) | $ | (3,871,763 | ) | 1,135,931 | | $ | 10,431,964 | |
| Class C Shares: | | | | | | | | | | |
| Shares sold | 132,372 | | $ | 1,134,696 | | 816,446 | | $ | 7,228,806 | |
| Shares issued in reinvestment of distributions | 25,022 | | | 210,183 | | 22,594 | | | 193,925 | |
| Shares redeemed | (495,680 | ) | | (4,163,722 | ) | (620,953 | ) | | (5,436,603 | ) |
| Net increase (decrease) | (338,286 | ) | $ | (2,818,843 | ) | 218,087 | | $ | 1,986,128 | |
| Class R6 Shares: | | | | | | | | | | |
| Shares sold | 140 | | $ | 1,204 | | 36,191 | | $ | 301,956 | |
| Shares issued in reinvestment of distributions | 475 | | | 4,025 | | 1,793 | | | 15,459 | |
| Shares redeemed | (14,676 | ) | | (125,000 | ) | (98,157 | ) | | (880,000 | ) |
| Net increase (decrease) | (14,061 | ) | $ | (119,771 | ) | (60,173 | ) | $ | (562,585 | ) |
| Advisor Class Shares: | | | | | | | | | | |
| Shares sold | 282,699 | | $ | 2,456,813 | | 492,723 | | $ | 4,389,632 | |
| Shares issued in reinvestment of distributions | 42,776 | | | 362,741 | | 46,674 | | | 402,730 | |
| Shares redeemed | (294,351 | ) | | (2,545,426 | ) | (1,426,315 | ) | | (12,891,580 | ) |
| Net increase (decrease) | 31,124 | | $ | 274,128 | | (886,918 | ) | $ | (8,099,218 | ) |
3. Transactions with Affiliates
Franklin Resources, Inc. is the holding company for various subsidiaries that together are referred to as Franklin Templeton Investments. Certain officers and trustees of the Trust are also officers and/or directors of the following subsidiaries:
| |
| Subsidiary | Affiliation |
| Franklin Templeton Institutional, LLC (FT Institutional) | Investment manager |
| Franklin Templeton Services, LLC (FT Services) | Administrative manager |
| Franklin Templeton Distributors, Inc. (Distributors) | Principal underwriter |
| Franklin Templeton Investor Services, LLC (Investor Services) | Transfer agent |
26 Semiannual Report
franklintempleton.com
FRANKLIN GLOBAL TRUST
NOTES TO FINANCIAL STATEMENTS (UNAUDITED)
Franklin Global Real Estate Fund (continued)
a. Management Fees
The Fund pays an investment management fee to FT Institutional based on the average daily net assets of the Fund as follows:
| | |
| Annualized Fee Rate | | Net Assets |
| 1.000 | % | Up to and including $500 million |
| 0.900 | % | Over $500 million, up to and including $1 billion |
| 0.850 | % | Over $1 billion, up to and including $1.5 billion |
| 0.800 | % | Over $1.5 billion, up to and including $6.5 billion |
| 0.780 | % | Over $6.5 billion, up to and including $11.5 billion |
| 0.760 | % | Over $11.5 billion, up to and including $16.5 billion |
| 0.740 | % | Over $16.5 billion, up to and including $19 billion |
| 0.730 | % | Over $19 billion, up to and including $21.5 billion |
| 0.720 | % | In excess of $21.5 billion |
b. Administrative Fees
Under an agreement with FT Institutional, FT Services provides administrative services to the Fund. The fee is paid by FT Institutional based on the Fund’s average daily net assets, and is not an additional expense of the Fund.
c. Distribution Fees
The Board has adopted distribution plans for each share class, with the exception of Class R6 and Advisor Class shares, pursuant to Rule 12b-1 under the 1940 Act. Under the Fund’s Class A reimbursement distribution plan, the Fund reimburses Distributors for costs incurred in connection with the servicing, sale and distribution of the Fund’s shares up to the maximum annual plan rate. Under the Class A reimbursement distribution plan, costs exceeding the maximum for the current plan year cannot be reimbursed in subsequent periods. In addition, under the Fund’s Class C compensation distribution plan, the Fund pays Distributors for costs incurred in connection with the servicing, sale and distribution of the Fund’s shares up to the maximum annual plan rate. The plan year, for purposes of monitoring compliance with the maximum annual plan rates, is February 1 through January 31.
The maximum annual plan rates, based on the average daily net assets, for each class, are as follows:
Effective August 1, 2015, the Board has set the current rate at 0.25% per year for Class A shares until further notice and approval by the Board. Prior to August 1, 2015, the Board had set the rate at 0.30% per year for Class A shares.
d. Sales Charges/Underwriting Agreements
Front-end sales charges and contingent deferred sales charges (CDSC) do not represent expenses of the Fund. These charges are deducted from the proceeds of sales of Fund shares prior to investment or from redemption proceeds prior to remittance, as applicable. Distributors has advised the Fund of the following commission transactions related to the sales and redemptions of the Fund’s shares for the period:
| | |
| Sales charges retained net of commissions paid to | | |
| unaffiliated brokers/dealers | $ | 10,867 |
| CDSC retained | $ | 1,037 |
franklintempleton.com
Semiannual Report 27
FRANKLIN GLOBAL TRUST
NOTES TO FINANCIAL STATEMENTS (UNAUDITED)
Franklin Global Real Estate Fund (continued)
| 3. | Transactions with Affiliates (continued) |
| e. | Transfer Agent Fees |
Each class of shares, except for Class R6, pays transfer agent fees to Investor Services for its performance of shareholder servicing obligations and reimburses Investor Services for out of pocket expenses incurred, including shareholding servicing fees paid to third parties. These fees are allocated daily based upon their relative proportion of such classes’ aggregate net assets. Class R6 pays Investor Services transfer agent fees specific to that class.
For the period ended January 31, 2016, the Fund paid transfer agent fees of $147,120, of which $70,918 was retained by Investor Services.
f. Waiver and Expense Reimbursements
FT Institutional and Investor Services have contractually agreed in advance to waive or limit their respective fees and to assume as their own expense certain expenses otherwise payable by the Fund so that the expenses (excluding distribution fees and acquired fund fees and expenses) for Class A, Class C and Advisor Class of the Fund do not exceed 1.15% and Class R6 does not exceed 0.99% based on the average net assets of each class (other than certain non-routine expenses or costs, including those relating to litigation, indemnification, reorganizations, and liquidations) until November 30, 2016.
4. Expense Offset Arrangement
The Fund has entered into an arrangement with its custodian whereby credits realized as a result of uninvested cash balances are used to reduce a portion of the Fund’s custodian expenses. During the period ended January 31, 2016, the custodian fees were reduced as noted in the the Statement of Operations.
5. Income Taxes
For tax purposes, capital losses may be carried over to offset future capital gains. Capital loss carryforwards with no expiration, if any, must be fully utilized before those losses with expiration dates.
At July 31, 2015, capital loss carryforwards were as follows:
| | |
| Capital loss carryforwards expiring in: | | |
| 2016 | $ | 520,205 |
| 2017 | | 22,811,914 |
| 2018 | | 35,647,494 |
| 2019 | | 557,818 |
| Total capital loss carryforwards | $ | 59,537,431 |
At January 31, 2016, the cost of investments and net unrealized appreciation (depreciation) for income tax purposes were as follows:
| | | |
| Cost of investments | $ | 126,093,834 | |
| |
| Unrealized appreciation | $ | 38,754,480 | |
| Unrealized depreciation | | (11,032,470 | ) |
| Net unrealized appreciation (depreciation) | $ | 27,722,010 | |
Differences between income and/or capital gains as determined on a book basis and a tax basis are primarily due to differing treatment of passive foreign investment company shares.
28 Semiannual Report
franklintempleton.com
FRANKLIN GLOBAL TRUST
NOTES TO FINANCIAL STATEMENTS (UNAUDITED)
Franklin Global Real Estate Fund (continued)
6. Investment Transactions
Purchases and sales of investments (excluding short term securities) for the period ended January 31, 2016, aggregated $17,303,346 and $24,395,183, respectively.
7. Concentration of Risk
Investing in foreign securities may include certain risks and considerations not typically associated with investing in U.S. securities, such as fluctuating currency values and changing local and regional economic, political and social conditions, which may result in greater market volatility. In addition, certain foreign securities may not be as liquid as U.S. securities.
The Fund invests a large percentage of its total assets in REIT securities. Such concentration may subject the Fund to special risks associated with real estate securities. These securities may be more sensitive to economic or regulatory developments due to a variety of factors such as local, regional, national and global economic conditions, interest rates and tax considerations.
8. Credit Facility
The Fund, together with other U.S. registered and foreign investment funds (collectively, Borrowers), managed by Franklin Templeton Investments, are borrowers in a joint syndicated senior unsecured credit facility totaling $2 billion (Global Credit Facility) which matured on February 12, 2016. This Global Credit Facility provides a source of funds to the Borrowers for temporary and emergency purposes, including the ability to meet future unanticipated or unusually large redemption requests. Effective February 12, 2016, the Borrowers renewed the Global Credit Facility for a one year term, maturing February 10, 2017, for a total of $2 billion.
Under the terms of the Global Credit Facility, the Fund shall, in addition to interest charged on any borrowings made by the Fund and other costs incurred by the Fund, pay its share of fees and expenses incurred in connection with the implementation and maintenance of the Global Credit Facility, based upon its relative share of the aggregate net assets of all of the Borrowers, including an annual commitment fee of 0.07% based upon the unused portion of the Global Credit Facility. Effective February 12, 2016, the annual commitment fee is 0.15%. These fees are reflected in other expenses in the Statement of Operations. During the period ended January 31, 2016, the Fund did not use the Global Credit Facility.
9. Fair Value Measurements
The Fund follows a fair value hierarchy that distinguishes between market data obtained from independent sources (observable inputs) and the Fund’s own market assumptions (unobservable inputs). These inputs are used in determining the value of the Fund’s financial instruments and are summarized in the following fair value hierarchy:
- Level 1 – quoted prices in active markets for identical financial instruments
- Level 2 – other significant observable inputs (including quoted prices for similar financial instruments, interest rates, prepayment speed, credit risk, etc.)
- Level 3 – significant unobservable inputs (including the Fund’s own assumptions in determining the fair value of financial instruments)
The input levels are not necessarily an indication of the risk or liquidity associated with financial instruments at that level.
For movements between the levels within the fair value hierarchy, the Fund has adopted a policy of recognizing the transfers as of the date of the underlying event which caused the movement.
franklintempleton.com
Semiannual Report 29
FRANKLIN GLOBAL TRUST
NOTES TO FINANCIAL STATEMENTS (UNAUDITED)
Franklin Global Real Estate Fund (continued)
9. Fair Value Measurements (continued)
A summary of inputs used as of January 31, 2016, in valuing the Fund’s assets carried at fair value, is as follows:
| | | | | | | | |
| | | Level 1 | | Level 2 | | Level 3 | | Total |
| Assets: | | | | | | | | |
| Investments in Securities: | | | | | | | | |
| Equity Investmentsa,b | $ | 152,115,844 | $ | — | $ | — | $ | 152,115,844 |
| Short Term Investments | | — | | 1,700,000 | | — | | 1,700,000 |
| Total Investments in Securities | $ | 152,115,844 | $ | 1,700,000 | $ | — | $ | 153,815,844 |
aFor detailed categories, see the accompanying Statement of Investments.
bIncludes common stocks as well as other equity investments.
10. Subsequent Events
The Fund has evaluated subsequent events through the issuance of the financial statements and determined that no events have occurred that require disclosure other than those already disclosed in the financial statements.
| |
| Abbreviations |
| Selected Portfolio |
| IDR | International Depository Receipt |
| REIT | Real Estate Investment Trust |
30 Semiannual Report
franklintempleton.com
FRANKLIN GLOBAL TRUST
FRANKLIN GLOBAL REAL ESTATE FUND
Shareholder Information
Proxy Voting Policies and Procedures
The Fund’s investment manager has established Proxy Voting Policies and Procedures (Policies) that the Fund uses to determine how to vote proxies relating to portfolio securities. Shareholders may view the Fund’s complete Policies online at franklintempleton.com. Alternatively, shareholders may request copies of the Policies free of charge by calling the Proxy Group collect at (954) 527-7678 or by sending a written request to: Franklin Templeton Companies, LLC, 300 S.E. 2nd Street, Fort Lauderdale, FL 33301, Attention: Proxy Group. Copies of the Fund’s proxy voting records are also made available online at franklintempleton.com and posted on the U.S. Securities and Exchange Commission’s website at sec.gov and reflect the most recent 12-month period ended June 30.
Quarterly Statement of Investments
The Trust, on behalf of the Fund, files a complete statement of investments with the U.S. Securities and Exchange Commission for the first and third quarters for each fiscal year on Form N-Q. Shareholders may view the filed Form N-Q by visiting the Commission’s website at sec.gov. The filed form may also be viewed and copied at the Commission’s Public Reference Room in Washington, DC. Information regarding the operations of the Public Reference Room may be obtained by calling (800) SEC-0330.
franklintempleton.com
Semiannual Report 31
This page intentionally left blank.
| |
| Contents | |
| |
| Semiannual Report | |
| Economic and Market Overview | 3 |
| Franklin International Growth Fund | 4 |
| Franklin International Small Cap Growth Fund | 12 |
| Financial Highlights and Statements of Investments | 20 |
| FinancialStatements | 35 |
| Notes to Financial Statements | 39 |
| Shareholder Information | 50 |
Visit franklintempleton.com for fund updates, to access your account, or to find helpful financial planning tools.
2 Semiannual Report
franklintempleton.com
Semiannual Report
Economic and Market Overview
The U.S. economy grew moderately during the period ended January 31, 2016. The third and fourth quarters of 2015 experienced healthy consumer spending, slower export growth, and reduced state and local government spending. Non-manufacturing activities expanded, contributing to new jobs and helping drive down the unemployment rate to 4.9% at period-end, the lowest level in nearly eight years. At its December 2015 meeting, the Federal Reserve (Fed) raised its target range for the federal funds rate to 0.25%–0.50%, as policymakers cited the labor market’s considerable improvement and were reasonably confident that inflation would move back to the Fed’s 2% medium-term objective. The Fed kept its interest rate unchanged at its January meeting and indicated it would monitor global economic and financial developments and their implications on the labor market and inflation. The broad U.S. stock market, as measured by the Standard & Poor’s 500 Index, declined for the six months ended January 31, 2016.
The global economy expanded moderately during the six-month period. Global developed and emerging market stocks, as measured by the MSCI All Country World Index, fell during the six-month period mainly due to concerns about China’s slowing economy and tumbling stock market, declining commodity prices, geopolitical tensions in certain regions and ongoing uncertainty about the Fed’s timing for raising interest rates. In the period under review, oil prices declined sharply due to strong global supply that exceeded demand. Gold prices fell for most of the period but recovered in January. The U.S. dollar appreciated against most currencies, which reduced returns of many foreign assets in U.S. dollar terms.
In Europe, U.K. fourth-quarter economic growth gained momentum from the services sector. The eurozone grew slightly and generally benefited during the period from lower oil prices, a weaker euro that supported exports, the European Central Banks’s (ECB’s) accommodative policy and expectations of further ECB stimulus. Although the eurozone’s annual inflation rate declined early in the period, it rose during the rest of the period. The ECB maintained its benchmark interest rates although it reduced its bank deposit rate in December, seeking to boost the region’s slowing growth.
In Asia, preliminary estimates showed that Japan’s economy contracted in the fourth quarter after expanding in the third quarter, as private consumption and housing investment declined. The Bank of Japan (BOJ) took several actions during the period, including lowering its economic growth and inflation forecasts, and reorganizing its stimulus program to increase exposure to long-term government bonds and exchange-traded funds. In January, the BOJ introduced a negative interest rate on excess reserves kept by financial institutions with the central bank, in an effort to boost lending and support inflation. China’s economy expanded in the fourth quarter, but growth was less robust in 2015 than in 2014, as strength in services and consumption was offset by weakness in fixed-asset investment, imports and exports, and manufacturing. The People’s Bank of China (PBOC) cut its benchmark interest rate and reduced the banks’ cash reserve requirement. Toward period-end, the PBOC lowered short-term borrowing costs for smaller banks as part of its efforts to establish an interest rate corridor intended to help banks access funds in times of a liquidity crunch and to avoid heightened volatility in money market rates.
The foregoing information reflects our analysis and opinions as of January 31, 2016. The information is not a complete analysis of every aspect of any market, country, industry, security or fund. Statements of fact are from sources considered reliable.
franklintempleton.com
Semiannual Report 3
Franklin International Growth Fund
This semiannual report for Franklin International Growth Fund covers the period ended January 31, 2016.
Your Fund’s Goal and Main Investments
The Fund seeks long-term capital appreciation by investing predominantly in equity securities of mid- and large-capitalization companies, generally those with market capitalizations greater than $2 billion, located outside of the U.S., including developing or emerging market countries. The Fund considers international companies to be those organized under the laws of a country outside of the U.S. or having a principal office in a country outside of the U.S., or whose securities are listed or traded principally on a recognized stock exchange or over-the-counter market outside of the U.S.
Geographic Breakdown
Based on Total Net Assets as of 1/31/16
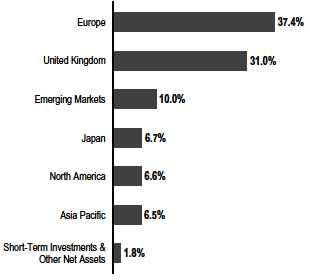
Performance Overview
For the six months ended January 31, 2016, the Fund’s Class A shares had a -12.09% cumulative total return. In comparison, the Fund’s benchmark, the MSCI Europe, Australasia, Far East (EAFE) Index, which measures global developed stock market performance excluding the U.S. and Canada, had a -14.50% total return.1 You can find the Fund’s long-term performance data in the Performance Summary beginning on page 7.
Performance data represent past performance, which does not guarantee future results. Investment return and principal value will fluctuate, and you may have a gain or loss when you sell your shares. Current performance may differ from figures shown. For most recent month-end performance, go to franklintempleton.com or call (800) 342-5236.
Investment Strategy
In choosing individual equity investments, we employ a disciplined, bottom-up approach to identify attractive investment opportunities that have higher expected revenue and earnings growth than their peers. We use a growth investment style and in-depth, fundamental research to identify high-quality companies, across all industry groups, with sustainable business models that offer the most attractive combination of growth potential, quality and valuation.
Manager’s Discussion
During the six months under review, stock selection and an underweighting in financials and stock selection and an overweighting in information technology benefited the Fund’s performance relative to the MSCI EAFE Index.2 Within financials, Germany-based financial exchange operator Deutsche Boerse was a contributor as investors believed renewed market volatility could lead to higher trading volumes and revenues for the company. The stock also benefited from optimism about the company’s new chief executive officer who has been attempting to turn Deutsche Boerse into a faster growing and better executing company through acquisitions and a new cross-divisional sales approach.
In the information technology sector, U.K.-based accounting software company The Sage Group also benefited from business revitalization under a new chief executive officer. We believed Sage has relatively predictable growth, a loyal customer base, generally benign competition in most markets, a strong support and services business, and good cash flow generation.
In other sectors, TAL Education Group3 and DSV also helped relative results. China-based TAL Education Group, an after-school tutoring company, supported relative performance
1. Source: Morningstar.
The index is unmanaged and includes reinvestment of any income or distributions. One cannot invest directly in an index, and an index is not representative of the Fund’s
portfolio.
2. The financials sector comprises banks, capital markets and diversified financial services in the SOI. The information technology sector comprises electronic equipment,
instruments and components; Internet software and services; IT services; semiconductors and semiconductor equipment; and software in the SOI.
3. Not part of the index.
The dollar value, number of shares or principal amount, and names of all portfolio holdings are listed in the Fund’s Statement of Investments (SOI).
The SOI begins on page 25.
4 Semiannual Report
franklintempleton.com
FRANKLIN INTERNATIONAL GROWTH FUND
amid optimism about enrollment growth. We continued to think earnings momentum should remain strong, but we intend to watch developments in teacher compensation, competition in the larger Chinese cities and the company’s acquisition strategy. Denmark-based transportation logistics company DSV contributed as fundamentals were strong and the company announced a major acquisition. We believed the deal would improve the balance and diversity of DSV’s business mix by region and service. It may also give DSV greater scale in freight transportation, which could help with profitability.
| | |
| Top 10 Sectors/Industries | | |
| 1/31/16 | | |
| | % of Total | |
| | Net Assets | |
| Software | 9.0 | % |
| Pharmaceuticals | 8.8 | % |
| Professional Services | 6.8 | % |
| Health Care Equipment & Supplies | 6.2 | % |
| Capital Markets | 5.8 | % |
| Textiles, Apparel & Luxury Goods | 5.6 | % |
| Chemicals | 5.5 | % |
| Machinery | 4.3 | % |
| Trading Companies & Distributors | 4.3 | % |
| Biotechnology | 3.7 | % |
In contrast, stock selection in energy detracted from the Fund’s relative performance.4 Amec Foster Wheeler, a U.K.-based company that designs, constructs and maintains infrastructure assets across various markets that include mining, clean energy and power generation, detracted from relative results after it halved its dividend given the ongoing oil price decline and as customers have pulled back on their capital expenditures. We believed investor reaction to the news and to the company’s lower margin guidance was disproportionate. In our analysis, Amec Foster Wheeler should be able to execute well during this challenging cyclical downturn.
In other sectors, major detractors included Weir Group, Alkermes3 and Noble Group. Ongoing weakness in commodity prices weighed on shares of U.K.-based engineering firm Weir Group. In our view, the company has been investing for longer term growth and has maintained a strong balance sheet and return profile and should benefit once the oil and gas capital
| | |
| Top 10 Countries | | |
| 1/31/16 | | |
| | % of Total | |
| | Net Assets | |
| U.K. | 31.0 | % |
| Germany | 9.8 | % |
| Switzerland | 6.8 | % |
| Japan | 6.7 | % |
| Denmark | 6.6 | % |
| Italy | 5.8 | % |
| Belgium | 5.7 | % |
| Canada | 5.2 | % |
| Australia | 5.0 | % |
| Israel | 3.2 | % |
spending environment recovers. Alkermes, a biotechnology company focused on central nervous system disorders, detracted from relative performance as the biotechnology industry group declined sharply. Concerns about its pipeline following a failed trial further drove down the company’s stock price. However, we believed that given the strength of the current product portfolio and other parts of the pipeline, the sell-off was overdone. Hong Kong-based Noble Group, a global supply chain manager for industrial and energy products, grappled with the continued downturn in commodity prices and questions about its financial strength and accounting practices. Although the company reported better financial performance and announced plans to exit certain businesses to generate cash, we believe Noble’s stock may continue to be volatile.
It is important to recognize the effect of currency movements on the Fund’s performance. In general, if the value of the U.S. dollar goes up compared with a foreign currency, an investment traded in that foreign currency will go down in value because it will be worth fewer U.S. dollars. This can have a negative effect on Fund performance. Conversely, when the U.S. dollar weakens in relation to a foreign currency, an investment traded in that foreign currency will increase in value, which can contribute to Fund performance. For the six months ended January 31, 2016, the U.S. dollar rose in value relative to most currencies. As a result, the Fund’s performance was negatively affected by the portfolio’s investment predominantly in securities with non-U.S. currency exposure.
4. The energy sector comprises energy equipment and services in the SOI.
See www.franklintempletondatasources.com for additional data provider information.
franklintempleton.com
Semiannual Report 5
FRANKLIN INTERNATIONAL GROWTH FUND
| | |
| Top 10 Holdings | | |
| 1/31/16 | | |
| Company | % of Total | |
| Sector/Industry, Country | Net Assets | |
| GN Store Nord AS | 3.5 | % |
| Health Care Equipment & Supplies, Denmark | | |
| Roche Holding AG | 3.4 | % |
| Pharmaceuticals, Switzerland | | |
| SGS SA | 3.4 | % |
| Professional Services, Switzerland | | |
| Experian PLC | 3.4 | % |
| Professional Services, U.K. | | |
| Check Point Software Technologies Ltd. | 3.2 | % |
| Software, Israel | | |
| DSV AS | 3.1 | % |
| Road & Rail, Denmark | | |
| The Sage Group PLC | 3.1 | % |
| Software, U.K. | | |
| Azimut Holding SpA | 3.1 | % |
| Capital Markets, Italy | | |
| KBC Groep NV | 2.9 | % |
| Banks, Belgium | | |
| Burberry Group PLC | 2.9 | % |
| Textiles, Apparel & Luxury Goods, U.K. | | |
Thank you for your continued participation in Franklin International Growth Fund. We look forward to serving your future investment needs.

The foregoing information reflects our analysis, opinions and portfolio holdings as of January 31, 2016, the end of the reporting period. The way we implement our main investment strategies and the resulting portfolio holdings may change depending on factors such as market and economic conditions. These opinions may not be relied upon as investment advice or an offer for a particular security. The information is not a complete analysis of every aspect of any market, country, industry, security or the Fund. Statements of fact are from sources considered reliable, but the investment manager makes no representation or warranty as to their completeness or accuracy. Although historical performance is no guarantee of future results, these insights may help you understand our investment management philosophy.
CFA® is a trademark owned by CFA Institute.
6 Semiannual Report
franklintempleton.com
FRANKLIN INTERNATIONAL GROWTH FUND
Performance Summary as of January 31, 2016
Your dividend income will vary depending on dividends or interest paid by securities in the Fund’s portfolio, adjusted for operating expenses of each class. Capital gain distributions are net profits realized from the sale of portfolio securities. The performance table does not reflect any taxes that a shareholder would pay on Fund dividends, capital gain distributions, if any, or any realized gains on the sale of Fund shares. Total return reflects reinvestment of the Fund’s dividends and capital gain distributions, if any, and any unrealized gains or losses.
| | | | | | |
| Net Asset Value | | | | | | |
| Share Class (Symbol) | | 1/31/16 | | 7/31/15 | | Change |
| A (FNGAX) | $ | 9.81 | $ | 11.16 | -$ | 1.35 |
| C (N/A) | $ | 9.59 | $ | 10.94 | -$ | 1.35 |
| R (N/A) | $ | 9.78 | $ | 11.15 | -$ | 1.37 |
| R6 (FILRX) | $ | 9.86 | $ | 11.25 | -$ | 1.39 |
| Advisor (FNGZX) | $ | 9.86 | $ | 11.24 | -$ | 1.38 |
| |
| |
| Distributions1 (8/1/15–1/31/16) | | | | | | |
| | | Dividend | | | | |
| Share Class | | Income | | | | |
| A | $ | 0.0012 | | | | |
| R | $ | 0.0068 | | | | |
| R6 | $ | 0.0528 | | | | |
| Advisor | $ | 0.0380 | | | | |
See page 9 for Performance Summary footnotes.
franklintempleton.com
Semiannual Report 7
FRANKLIN INTERNATIONAL GROWTH FUND
PERFORMANCE SUMMARY
Performance as of 1/31/162
Cumulative total return excludes sales charges. Average annual total returns and value of $10,000 investment include maximum sales charges. Class A: 5.75% maximum initial sales charge; Class C: 1% contingent deferred sales charge in first year only;
Class R/R6/Advisor Class: no sales charges.
| | | | | | | | | | | | |
| | | | | | | Value of | Average Annual | | | |
| | Cumulative | | Average Annual | | $ | 10,000 | Total Return | | Total Annual Operating Expenses7 | |
| Share Class | Total Return3 | | Total Return4 | | | Investment5 | (12/31/15 | )6 | (with waiver) | | (without waiver) | |
| A | | | | | | | | | 1.44 | % | 1.67 | % |
| 6-Month | -12.09 | % | -17.14 | % | $ | 8,286 | | | | | | |
| 1-Year | -8.39 | % | -13.63 | % | $ | 8,637 | -5.66 | % | | | | |
| 5-Year | +3.69 | % | -0.46 | % | $ | 9,771 | +1.52 | % | | | | |
| Since Inception (6/3/08) | +3.78 | % | -0.29 | % | $ | 9,781 | +0.80 | % | | | | |
| C | | | | | | | | | 2.19 | % | 2.42 | % |
| 6-Month | -12.34 | % | -13.22 | % | $ | 8,678 | | | | | | |
| 1-Year | -9.01 | % | -9.92 | % | $ | 9,008 | -1.66 | % | | | | |
| 5-Year | +0.17 | % | +0.03 | % | $ | 10,017 | +2.03 | % | | | | |
| Since Inception (6/3/08) | -1.75 | % | -0.23 | % | $ | 9,825 | +0.85 | % | | | | |
| R | | | | | | | | | 1.69 | % | 1.92 | % |
| 6-Month | -12.14 | % | -12.14 | % | $ | 8,786 | | | | | | |
| 1-Year | -8.53 | % | -8.53 | % | $ | 9,147 | -0.12 | % | | | | |
| 5-Year | +2.65 | % | +0.53 | % | $ | 10,265 | +2.51 | % | | | | |
| Since Inception (6/3/08) | +2.02 | % | +0.26 | % | $ | 10,202 | +1.35 | % | | | | |
| R6 | | | | | | | | | 1.00 | % | 1.02 | % |
| 6-Month | -11.92 | % | -11.92 | % | $ | 8,808 | | | | | | |
| 1-Year | -7.99 | % | -7.99 | % | $ | 9,201 | +0.50 | % | | | | |
| Since Inception (5/1/13) | -4.39 | % | -1.62 | % | $ | 9,561 | +1.39 | % | | | | |
| Advisor | | | | | | | | | 1.19 | % | 1.42 | % |
| 6-Month | -11.96 | % | -11.96 | % | $ | 8,804 | | | | | | |
| 1-Year | -8.03 | % | -8.03 | % | $ | 9,197 | +0.36 | % | | | | |
| 5-Year | +5.29 | % | +1.04 | % | $ | 10,529 | +3.04 | % | | | | |
| Since Inception (6/3/08) | +6.15 | % | +0.78 | % | $ | 10,615 | +1.88 | % | | | | |
Performance data represent past performance, which does not guarantee future results. Investment return and principal value will fluctuate, and you may have a gain or loss when you sell your shares. Current performance may differ from figures shown. For most recent month-end performance, go to franklintempleton.com or call (800) 342-5236.
See page 9 for Performance Summary footnotes.
8 Semiannual Report
franklintempleton.com
FRANKLIN INTERNATIONAL GROWTH FUND
PERFORMANCE SUMMARY
All investments involve risks, including possible loss of principal. Special risks are associated with foreign investing, including currency fluctuations, economic instability and political developments. Investments in emerging markets involve heightened risks related to the same factors, in addition to those associated with these markets’ smaller size and lesser liquidity. The Fund is actively managed but there is no guarantee that the manager’s investment decisions will produce the desired results. The Fund’s prospectus also includes a description of the main investment risks.
| |
| Class C: | These shares have higher annual fees and expenses than Class A shares. |
| Class R: | Shares are available to certain eligible investors as described in the prospectus. These shares have higher annual fees and expenses than Class A shares. |
| Class R6: | Shares are available to certain eligible investors as described in the prospectus. |
| Advisor Class: | Shares are available to certain eligible investors as described in the prospectus. |
1. The distribution amount is the sum of the dividend payments to shareholders for the period shown and includes only estimated tax-basis net investment income.
2. The Fund has an expense reduction contractually guaranteed through at least 11/30/16 and a fee waiver associated with any investment in a Franklin Templeton money fund,
contractually guaranteed through at least its current fiscal year-end. The transfer agent has contractually agreed to cap transfer agency fees for Class R6 shares until at least
12/31/16. Fund investment results reflect the expense reduction, fee waiver and fee cap, to the extent applicable; without these reductions, the results would have been lower.
3. Cumulative total return represents the change in value of an investment over the periods indicated.
4. Average annual total return represents the average annual change in value of an investment over the periods indicated. Return for less than one year, if any, has not been
annualized.
5. These figures represent the value of a hypothetical $10,000 investment in the Fund over the periods indicated.
6. In accordance with SEC rules, we provide standardized average annual total return information through the latest calendar quarter.
7. Figures are as stated in the Fund’s current prospectus. In periods of market volatility, assets may decline significantly, causing total annual Fund operating expenses to
become higher than the figures shown.
franklintempleton.com
Semiannual Report 9
FRANKLIN INTERNATIONAL GROWTH FUND
Your Fund’s Expenses
As a Fund shareholder, you can incur two types of costs:
- Transaction costs, including sales charges (loads) on Fund purchases; and
- Ongoing Fund costs, including management fees, distribution and service (12b-1) fees, and other Fund expenses. All mutual funds have ongoing costs, sometimes referred to as operating expenses.
The following table shows ongoing costs of investing in the Fund and can help you understand these costs and compare them with those of other mutual funds. The table assumes a $1,000 investment held for the six months indicated.
Actual Fund Expenses
The first line (Actual) for each share class listed in the table provides actual account values and expenses. The “Ending Account Value” is derived from the Fund’s actual return, which includes the effect of Fund expenses.
You can estimate the expenses you paid during the period by following these steps. Of course, your account value and expenses will differ from those in this illustration:
| 1. | Divide your account value by $1,000. |
| | If an account had an $8,600 value, then $8,600 ÷ $1,000 = 8.6. |
| 2. | Multiply the result by the number under the heading “Expenses Paid During Period.” |
| | If Expenses Paid During Period were $7.50, then 8.6 x $7.50 = $64.50. |
In this illustration, the estimated expenses paid this period are $64.50.
Hypothetical Example for Comparison with Other Funds
Information in the second line (Hypothetical) for each class in the table can help you compare ongoing costs of investing in the Fund with those of other mutual funds. This information may not be used to estimate the actual ending account balance or expenses you paid during the period. The hypothetical “Ending Account Value” is based on the actual expense ratio for each class and an assumed 5% annual rate of return before expenses, which does not represent the Fund’s actual return. The figure under the heading “Expenses Paid During Period” shows the hypothetical expenses your account would have incurred under this scenario. You can compare this figure with the 5% hypothetical examples that appear in shareholder reports of other funds.
Please note that expenses shown in the table are meant to highlight ongoing costs and do not reflect any transaction costs, such as sales charges. Therefore, the second line for each class is useful in comparing ongoing costs only, and will not help you compare total costs of owning different funds. In addition, if transaction costs were included, your total costs would have been higher. Please refer to the Fund prospectus for additional information on operating expenses.
10 Semiannual Report
franklintempleton.com
| | | | | | | |
| | | | | FRANKLIN INTERNATIONAL GROWTH FUND |
| | | | | | | YOUR FUND’S EXPENSES |
| |
| |
| |
| | | Beginning Account | | Ending Account | | Expenses Paid During |
| Share Class | | Value 8/1/15 | | Value 1/31/16 | | Period* 8/1/15–1/31/16 |
| A | | | | | | | |
| Actual | $ | 1,000 | $ | 879.10 | | $ | 6.80 |
| Hypothetical (5% return before expenses) | $ | 1,000 | $ | 1,017.90 | | $ | 7.30 |
| C | | | | | | | |
| Actual | $ | 1,000 | $ | 876.60 | $ | 10.33 |
| Hypothetical (5% return before expenses) | $ | 1,000 | $ | 1,014.13 | $ | 11.09 |
| R | | | | | | | |
| Actual | $ | 1,000 | $ | 878.60 | | $ | 7.93 |
| Hypothetical (5% return before expenses) | $ | 1,000 | $ | 1,016.69 | | $ | 8.52 |
| R6 | | | | | | | |
| Actual | $ | 1,000 | $ | 880.80 | | $ | 4.73 |
| Hypothetical (5% return before expenses) | $ | 1,000 | $ | 1,020.11 | | $ | 5.08 |
| Advisor | | | | | | | |
| Actual | $ | 1,000 | $ | 880.40 | | $ | 5.62 |
| Hypothetical (5% return before expenses) | $ | 1,000 | $ | 1,019.15 | | $ | 6.04 |
*Expenses are calculated using the most recent six-month expense ratio, net of expense waivers, annualized for each class (A: 1.44%;
C: 2.19%; R: 1.68%; R6: 1.00%; and Advisor: 1.19%), multiplied by the average account value over the period, multiplied by 184/366 to reflect
the one-half year period.
franklintempleton.com
Semiannual Report 11
Franklin International Small Cap Growth Fund
This semiannual report for Franklin International Small Cap Growth Fund covers the period ended January 31, 2016. Effective June 3, 2013, the Fund closed to new investors, with limited exceptions.
Your Fund’s Goal and Main Investments
The Fund seeks long-term capital appreciation by investing at least 80% of its net assets in a diversified portfolio of marketable equity and equity-related securities of smaller international companies with market capitalizations not exceeding $5 billion (or the equivalent in local currencies), or the highest market capitalization of the MSCI Europe, Australasia, Far East (EAFE) Small Cap Index, whichever is greater, at the time of purchase. The Fund considers international companies to be those organized under the laws a country outside of the U.S. or having a principal office in a country outside of the U.S., or whose securities are listed or traded principally on a recognized stock exchange or over-the-counter market outside of the U.S.

Performance Overview
For the six months ended January 31, 2016, The Fund’s Class A shares had a -9.76% cumulative total return. In comparison, the Fund’s benchmark, the MSCI EAFE Small Cap Index, which tracks small cap equity performance in global developed markets excluding the U.S. and Canada, had a -9.02% total return.1 You can find the Fund’s long-term performance data in the Performance Summary beginning on page 15.
Performance data represent past performance, which does not guarantee future results. Investment return and principal value will fluctuate, and you may have a gain or loss when you sell your shares. Current performance may differ from figures shown. For most recent month-end performance, go to franklintempleton.com or call (800) 342-5236.
Investment Strategy
In choosing individual equity investments, we use a fundamental, bottom-up approach involving in-depth analysis of individual equity securities. We employ a quantitative and qualitative approach to identify smaller international companies that we believe have the potential to generate attractive returns with lower downside risk. Such companies tend to have proprietary products and services, which can sustain a longer term competitive advantage, and they tend to have a higher probability of maintaining a strong balance sheet and/or generating cash flow. After we identify a company, we conduct a thorough analysis to establish its earnings prospects and determine its value. Overall, we seek to invest in companies with attractive valuations.
We do not select investments for the Fund that are merely representative of the small cap asset class but instead aim to produce a portfolio of securities of exceptional companies operating in sectors that offer attractive growth potential.
Although we seek to outperform the MSCI EAFE Small Cap Index, the Fund may take positions that are not represented in the index.
Manager’s Discussion
During the six months under review, stock selection in the information technology, consumer discretionary and financials sectors benefited the Fund’s performance relative to the MSCI EAFE Small Cap Index.2 Within information technology, Paysafe Group, formerly known as Optimal Payments, contributed to relative results. The U.K.-based online payments company benefited from growth in its Asian e-wallet business, and we believed it was well positioned to take advantage of regulated online gaming opportunities in the U.S. Moreover, in our opinion, Paysafe’s recent acquisition of Skrill should boost its market presence in online payments and e-wallets.
1. Source: Morningstar.
The index is unmanaged and includes reinvestment of any income or distributions. One cannot invest directly in an index, and an index is not representative of the Fund’s
portfolio.
2. The information technology sector comprises IT services in the SOI. The consumer discretionary sector comprises distributors; diversified consumer services; hotels,
restaurants and leisure; leisure products; media and specialty retail in the SOI. The financials sector comprises capital markets, diversified financial services, insurance, real
estate investment trusts, and real estate management and development in the SOI.
The dollar value, number of shares or principal amount, and names of all portfolio holdings are listed in the Fund’s Statement of Investments (SOI).
The SOI begins on page 32.
12 Semiannual Report
franklintempleton.com
FRANKLIN INTERNATIONAL SMALL CAP GROWTH FUND
| | |
| Top 10 Sectors/Industries | | |
| 1/31/16 | | |
| | % of Total | |
| | Net Assets | |
| Insurance | 15.6 | % |
| Real Estate Investment Trusts (REITs) | 8.2 | % |
| Machinery | 7.2 | % |
| IT Services | 5.4 | % |
| Commercial Services & Supplies | 5.2 | % |
| Diversified Consumer Services | 4.9 | % |
| Trading Companies & Distributors | 4.5 | % |
| Capital Markets | 4.1 | % |
| Diversified Financial Services | 4.1 | % |
| Professional Services | 4.0 | % |
Within consumer discretionary, China-based tutoring services company New Oriental Education & Technology Group contributed to relative performance.3 We believed New Oriental Education was well placed to benefit from strong demand in China for after-school tutoring and English-language services. The company has a well-respected brand name, and it is the largest player in a number of China’s educational markets. Ireland-based hotel operator Dalata Hotel Group also aided relative results.3 Dalata benefited from the Irish economy’s rebound and its positive impact on hotel property values, particularly in central Dublin.
In the financials sector, Canada-based property and casualty insurer Fairfax Financial Holdings also helped relative performance.3 We believe that the chief executive officer, Prem Watsa, who is widely well regarded for his investment acumen, has the ability to create shareholder value over time.
In contrast, stock selection and an overweighting in industrials detracted from the Fund’s relative performance.4 Vesuvius, a U.K.-based provider of a full range of engineering services and solutions to the steel and foundry industries, hampered relative results as the steel industry continued to struggle given uncertain Chinese growth. Global dry bulk shipper Diana Shipping also detracted as concerns about the strength of the Chinese economy weighed on shipping of commodities such as iron ore.3 However, we believed Diana had one of the strongest management teams in the industry and could use its solid balance sheet to position itself for an eventual recovery by buying ships cheaply during the downturn and selling them once commodity prices rebound. U.K.-based recruitment firm Michael Page International hurt relative performance amid worries that potential economic slowdowns in the U.K. and Asia could negatively impact the hiring market. The share price decline looked overdone to us given the ongoing global economic recovery.
Stock selection in consumer staples also hampered relative performance.5 Japan-based Aderans, a wig and hairpiece manufacturer, detracted as the company’s shares came under pressure when a major investor sold its stake in the firm. However, Aderans continued to perform well, growing its business in Japan and recovering market share lost to its leading competitor.
| | |
| Top 10 Countries | | |
| 1/31/16 | | |
| | % of Total | |
| | Net Assets | |
| U.K. | 28.4 | % |
| Ireland | 10.9 | % |
| U.S. | 8.2 | % |
| Canada | 7.2 | % |
| France | 6.2 | % |
| Isle of Man | 5.4 | % |
| Finland | 5.3 | % |
| China | 4.9 | % |
| Spain | 4.2 | % |
| Japan | 3.6 | % |
From a geographic perspective, an overweighting in off-benchmark Canada helped relative performance. Our positioning in Europe overall was a detractor, but the Fund’s overweighting in Ireland boosted relative results. However, a small off-benchmark position in Greece and stock selection and overweighting in the U.K. detracted from relative performance. In Asia, stock selection and an underweighting in Japan also hindered relative results.
It is important to recognize the effect of currency movements on the Fund’s performance. In general, if the value of the U.S. dollar goes up compared with a foreign currency, an investment traded in that foreign currency will go down in value because it will be worth fewer U.S. dollars. This can have a negative
3. Not part of the index.
4. The industrials sector comprises air freight and logistics, building products, commercial services and supplies, construction and engineering, electrical equipment, machinery,
marine, professional services, and trading companies and distributors in the SOI.
5. The consumer staples sector comprises beverages, food and staples retailing and personal products in the SOI.
See www.franklintempletondatasources.com for additional data provider information.
franklintempleton.com
Semiannual Report 13
FRANKLIN INTERNATIONAL SMALL CAP GROWTH FUND
effect on Fund performance. Conversely, when the U.S. dollar weakens in relation to a foreign currency, an investment traded in that foreign currency will increase in value, which can contribute to Fund performance. For the six months ended January 31, 2016, the U.S. dollar rose in value relative to most currencies. As a result, the Fund’s performance was negatively affected by the portfolio’s investment predominantly in securities with non-U.S. currency exposure.
| | |
| Top 10 Holdings | | |
| 1/31/16 | | |
| Company | % of Total | |
| Sector/Industry, Country | Net Assets | |
| Paysafe Group PLC | 5.4 | % |
| IT Services, Isle of Man | | |
| RenaissanceRe Holdings Ltd. | 5.2 | % |
| Insurance, U.S. | | |
| Fairfax Financial Holdings Ltd. | 5.0 | % |
| Insurance, Canada | | |
| New Oriental Education & Technology Group Inc. | 4.9 | % |
| Diversified Consumer Services, China | | |
| Grafton Group PLC | 4.5 | % |
| Trading Companies & Distributors, U.K. | | |
| Kennedy Wilson Europe Real Estate PLC | 4.1 | % |
| Diversified Financial Services, U.K. | | |
| Green REIT PLC | 3.6 | % |
| Real Estate Investment Trusts (REITs), Ireland | | |
| Sligro Food Group NV | 3.4 | % |
| Food & Staples Retailing, Netherlands | | |
| Prysmian SpA | 3.3 | % |
| Electrical Equipment, Italy | | |
| Vesuvius PLC | 3.3 | % |
| Machinery, U.K. | | |
Thank you for your continued participation in Franklin International Small Cap Growth Fund. We look forward to serving your future investment needs.

The foregoing information reflects our analysis, opinions and portfolio holdings as of January 31, 2016, the end of the reporting period. The way we implement our main investment strategies and the resulting portfolio holdings may change depending on factors such as market and economic conditions. These opinions may not be relied upon as investment advice or an offer for a particular security. The information is not a complete analysis of every aspect of any market, country, industry, security or the Fund. Statements of fact are from sources considered reliable, but the investment manager makes no representation or warranty as to their completeness or accuracy. Although historical performance is no guarantee of future results, these insights may help you understand our investment management philosophy.
14 Semiannual Report
franklintempleton.com
FRANKLIN INTERNATIONAL SMALL CAP GROWTH FUND
Performance Summary as of January 31, 2016
Your dividend income will vary depending on dividends or interest paid by securities in the Fund’s portfolio, adjusted for operating expenses of each class. Capital gain distributions are net profits realized from the sale of portfolio securities. The performance table does not reflect any taxes that a shareholder would pay on Fund dividends, capital gain distributions, if any, or any realized gains on the sale of Fund shares. Total return reflects reinvestment of the Fund’s dividends and capital gain distributions, if any, and any unrealized gains or losses.
| | | | | | | | |
| Net Asset Value | | | | | | | | |
| Share Class (Symbol) | | 1/31/16 | | 7/31/15 | | Change | | |
| A (FINAX) | $ | 17.39 | $ | 19.92 | -$ | 2.53 | | |
| C (FCSMX) | $ | 17.23 | $ | 19.60 | -$ | 2.37 | | |
| R (FISDX) | $ | 17.43 | $ | 19.88 | -$ | 2.45 | | |
| R6 (FCAPX) | $ | 17.42 | $ | 20.03 | -$ | 2.61 | | |
| Advisor (FKSCX) | $ | 17.41 | $ | 20.00 | -$ | 2.59 | | |
| |
| |
| Distributions1 (8/1/15–1/31/16) | | | | | | | | |
| | | Dividend | | Short-Term | | Long-Term | | |
| Share Class | | Income | | Capital Gain | | Capital Gain | | Total |
| A | $ | 0.2445 | $ | 0.0111 | $ | 0.3621 | $ | 0.6177 |
| C | $ | 0.0339 | $ | 0.0111 | $ | 0.3621 | $ | 0.4071 |
| R | $ | 0.1412 | $ | 0.0111 | $ | 0.3621 | $ | 0.5144 |
| R6 | $ | 0.3524 | $ | 0.0111 | $ | 0.3621 | $ | 0.7256 |
| Advisor | $ | 0.3185 | $ | 0.0111 | $ | 0.3621 | $ | 0.6917 |
See page 17 for Performance Summary footnotes.
franklintempleton.com
Semiannual Report 15
FRANKLIN INTERNATIONAL SMALL CAP GROWTH FUND
PERFORMANCE SUMMARY
Performance as of 1/31/16
Cumulative total return excludes sales charges. Average annual total returns and value of $10,000 investment include maximum sales charges. Class A: 5.75% maximum initial sales charge; Class C: 1% contingent deferred sales charge in first year only;
Class R/R6/Advisor Class: no sales charges.
| | | | | | | | | | |
| | Cumulative | | Average Annual | | | Value of | Average Annual | | Total Annual | |
| Share Class | Total Return2 | | Total Return3 | | $ | 10,000 Investment4 | Total Return (12/31/15)5 | | Operating Expenses6 | |
| A | | | | | | | | | 1.36 | % |
| 6-Month | -9.76 | % | -14.95 | % | $ | 8,505 | | | | |
| 1-Year | +0.03 | % | -5.72 | % | $ | 9,428 | +0.29 | % | | |
| 5-Year | +35.60 | % | +5.03 | % | $ | 12,781 | +6.11 | % | | |
| Since Inception (5/15/08) | +55.81 | % | +5.11 | % | $ | 14,685 | +6.06 | % | | |
| C | | | | | | | | | 2.08 | % |
| 6-Month | -10.13 | % | -11.00 | % | $ | 8,900 | | | | |
| 1-Year | -0.70 | % | -1.67 | % | $ | 9,833 | +4.63 | % | | |
| 5-Year | +30.83 | % | +5.52 | % | $ | 13,083 | +6.61 | % | | |
| Since Inception (5/15/08) | +47.81 | % | +5.20 | % | $ | 14,781 | +6.16 | % | | |
| R | | | | | | | | | 1.62 | % |
| 6-Month | -9.87 | % | -9.87 | % | $ | 9,013 | | | | |
| 1-Year | -0.18 | % | -0.18 | % | $ | 9,982 | +6.17 | % | | |
| 5-Year | +34.06 | % | +6.04 | % | $ | 13,406 | +7.12 | % | | |
| Since Inception (5/15/08) | +53.01 | % | +5.67 | % | $ | 15,301 | +6.63 | % | | |
| R6 | | | | | | | | | 0.99 | % |
| 6-Month | -9.60 | % | -9.60 | % | $ | 9,040 | | | | |
| 1-Year | +0.43 | % | +0.43 | % | $ | 10,043 | +6.83 | % | | |
| Since Inception (5/1/13) | +11.36 | % | +3.98 | % | $ | 11,136 | +6.64 | % | | |
| Advisor | | | | | | | | | 1.12 | % |
| 6-Month | -9.62 | % | -9.62 | % | $ | 9,038 | | | | |
| 1-Year | +0.31 | % | +0.31 | % | $ | 10,031 | +6.70 | % | | |
| 5-Year | +37.50 | % | +6.58 | % | $ | 13,750 | +7.66 | % | | |
| 10-Year | +96.97 | % | +7.01 | % | $ | 19,697 | +8.57 | % | | |
Performance data represent past performance, which does not guarantee future results. Investment return and principal value will fluctuate, and you may have a gain or loss when you sell your shares. Current performance may differ from figures shown. For most recent month-end performance, go to franklintempleton.com or call (800) 342-5236.
See page 17 for Performance Summary footnotes.
16 Semiannual Report
franklintempleton.com
FRANKLIN INTERNATIONAL SMALL CAP GROWTH FUND
PERFORMANCE SUMMARY
All investments involve risks, including possible loss of principal. The Fund is intended for long-term investors who are comfortable with fluctuation in the value of their investment, especially over the short term. Smaller, relatively new and/or unseasoned companies can be particularly sensitive to changing economic conditions, and their prospects for growth are less certain than those of larger, more established companies. Foreign investing involves additional risks such as currency and market volatility, as well as political and social instability. Investments in emerging markets involve heightened risks relating to the same factors. The Fund is actively managed but there is no guarantee that the manager’s investment decisions will produce the desired results. The Fund’s prospectus also includes a description of the main investment risks.
| |
| Class C: | These shares have higher annual fees and expenses than Class A shares. |
| Class R: | Shares are available to certain eligible investors as described in the prospectus. These shares have higher annual fees and expenses than Class A shares. |
| Class R6: | Shares are available to certain eligible investors as described in the prospectus. |
| Advisor Class: | Shares are available to certain eligible investors as described in the prospectus. |
1. The distribution amount is the sum of the dividend payments to shareholders for the period shown and includes only estimated tax-basis net investment income and capital
gain.
2. Cumulative total return represents the change in value of an investment over the periods indicated.
3. Average annual total return represents the average annual change in value of an investment over the periods indicated. Return for less than one year, if any, has not been
annualized.
4. These figures represent the value of a hypothetical $10,000 investment in the Fund over the periods indicated.
5. In accordance with SEC rules, we provide standardized average annual total return information through the latest calendar quarter.
6. Figures are as stated in the Fund’s current prospectus. In periods of market volatility, assets may decline significantly, causing total annual Fund operating expenses to
become higher than the figures shown.
franklintempleton.com
Semiannual Report 17
FRANKLIN INTERNATIONAL SMALL CAP GROWTH FUND
Your Fund’s Expenses
As a Fund shareholder, you can incur two types of costs:
- Transaction costs, including sales charges (loads) on Fund purchases; and
- Ongoing Fund costs, including management fees, distribution and service (12b-1) fees, and other Fund expenses. All mutual funds have ongoing costs, sometimes referred to as operating expenses.
The following table shows ongoing costs of investing in the Fund and can help you understand these costs and compare them with those of other mutual funds. The table assumes a $1,000 investment held for the six months indicated.
Actual Fund Expenses
The first line (Actual) for each share class listed in the table provides actual account values and expenses. The “Ending Account Value” is derived from the Fund’s actual return, which includes the effect of Fund expenses.
You can estimate the expenses you paid during the period by following these steps. Of course, your account value and expenses will differ from those in this illustration:
| 1. | Divide your account value by $1,000. |
| | If an account had an $8,600 value, then $8,600 ÷ $1,000 = 8.6. |
| 2. | Multiply the result by the number under the heading “Expenses Paid During Period.” |
| | If Expenses Paid During Period were $7.50, then 8.6 x $7.50 = $64.50. |
In this illustration, the estimated expenses paid this period are $64.50.
Hypothetical Example for Comparison with Other Funds
Information in the second line (Hypothetical) for each class in the table can help you compare ongoing costs of investing in the Fund with those of other mutual funds. This information may not be used to estimate the actual ending account balance or expenses you paid during the period. The hypothetical “Ending Account Value” is based on the actual expense ratio for each class and an assumed 5% annual rate of return before expenses, which does not represent the Fund’s actual return. The figure under the heading “Expenses Paid During Period” shows the hypothetical expenses your account would have incurred under this scenario. You can compare this figure with the 5% hypothetical examples that appear in shareholder reports of other funds.
Please note that expenses shown in the table are meant to highlight ongoing costs and do not reflect any transaction costs, such as sales charges. Therefore, the second line for each class is useful in comparing ongoing costs only, and will not help you compare total costs of owning different funds. In addition, if transaction costs were included, your total costs would have been higher. Please refer to the Fund prospectus for additional information on operating expenses.
18 Semiannual Report
franklintempleton.com
| | | | | | | |
| | | | | FRANKLIN INTERNATIONAL SMALL CAP GROWTH FUND |
| | | | | | | YOUR FUND’S EXPENSES |
| |
| |
| |
| | | Beginning Account | | Ending Account | | Expenses Paid During |
| Share Class | | Value 8/1/15 | | Value 1/31/16 | | Period* 8/1/15–1/31/16 |
| A | | | | | | | |
| Actual | $ | 1,000 | $ | 902.40 | | $ | 6.50 |
| Hypothetical (5% return before expenses) | $ | 1,000 | $ | 1,018.30 | | $ | 6.90 |
| C | | | | | | | |
| Actual | $ | 1,000 | $ | 898.70 | $ | 10.07 |
| Hypothetical (5% return before expenses) | $ | 1,000 | $ | 1,014.53 | $ | 10.68 |
| R | | | | | | | |
| Actual | $ | 1,000 | $ | 901.30 | | $ | 7.74 |
| Hypothetical (5% return before expenses) | $ | 1,000 | $ | 1,016.99 | | $ | 8.21 |
| R6 | | | | | | | |
| Actual | $ | 1,000 | $ | 904.00 | | $ | 4.74 |
| Hypothetical (5% return before expenses) | $ | 1,000 | $ | 1,020.16 | | $ | 5.03 |
| Advisor | | | | | | | |
| Actual | $ | 1,000 | $ | 903.80 | | $ | 5.36 |
| Hypothetical (5% return before expenses) | $ | 1,000 | $ | 1,019.51 | | $ | 5.69 |
*Expenses are calculated using the most recent six-month expense ratio, annualized for each class (A: 1.36%; C: 2.11%; R: 1.62%;
R6: 0.99%; and Advisor: 1.12%), multiplied by the average account value over the period, multiplied by 184/366 to reflect the one-half year
period.
franklintempleton.com
Semiannual Report 19
FRANKLIN GLOBAL TRUST
| | | | | | | | | | | | | | | | | | |
| Financial Highlights | | | | | | | | | | | | | | | | | | |
| Franklin International Growth Fund | | | | | | | | | | | | | | | | | | |
| | | Six Months Ended | | | | | | | | | | | | | | | | |
| | | January 31, 2016 | | | | | | Year Ended July 31, | | | | | | | |
| | | (unaudited) | | | 2015 | | | 2014 | | | 2013 | | | 2012 | | | 2011 | |
| Class A | | | | | | | | | | | | | | | | | | |
| Per share operating performance | | | | | | | | | | | | | | | | | | |
| (for a share outstanding throughout the period) | | | | | | | | | | | | | | | | | | |
| Net asset value, beginning of period | $ | 11.16 | | $ | 11.40 | | $ | 10.45 | | $ | 9.11 | | $ | 9.86 | | $ | 8.47 | |
| Income from investment operationsa: | | | | | | | | | | | | | | | | | | |
| Net investment income (loss)b | | (0.03 | ) | | 0.06 | | | 0.05 | | | 0.10 | | | 0.12 | | | 0.11 | |
| Net realized and unrealized gains (losses) | | (1.32 | ) | | (0.20 | ) | | 0.95 | | | 1.33 | | | (0.77 | ) | | 1.36 | |
| Total from investment operations | | (1.35 | ) | | (0.14 | ) | | 1.00 | | | 1.43 | | | (0.65 | ) | | 1.47 | |
| Less distributions from: | | | | | | | | | | | | | | | | | | |
| Net investment income. | | (—)c | | | (0.03 | ) | | (0.05 | ) | | (0.09 | ) | | (0.10 | ) | | (0.08 | ) |
| Net realized gains | | — | | | (0.07 | ) | | — | | | — | | | — | | | — | |
| Total distributions | | (—)c | | | (0.10 | ) | | (0.05 | ) | | (0.09 | ) | | (0.10 | ) | | (0.08 | ) |
| Net asset value, end of period | $ | 9.81 | | $ | 11.16 | | $ | 11.40 | | $ | 10.45 | | $ | 9.11 | | $ | 9.86 | |
| |
| Total returnd | | (12.09 | )% | | (1.13 | )% | | 9.56 | % | | 15.69 | % | | (6.46 | )% | | 17.34 | % |
| |
| Ratios to average net assetse | | | | | | | | | | | | | | | | | | |
| Expenses before waiver and payments by | | | | | | | | | | | | | | | | | | |
| affiliates | | 1.65 | % | | 1.72 | % | | 1.70 | % | | 1.52 | % | | 1.69 | % | | 1.64 | % |
| Expenses net of waiver and payments by | | | | | | | | | | | | | | | | | | |
| affiliates | | 1.44 | % | | 1.49 | % | | 1.49 | %f | | 1.49 | % | | 1.52 | % | | 1.37 | % |
| Net investment income (loss) | | (0.54 | )% | | 0.61 | % | | 0.48 | % | | 1.07 | % | | 1.46 | % | | 1.15 | % |
| |
| Supplemental data | | | | | | | | | | | | | | | | | | |
| Net assets, end of period (000’s) | $ | 160,098 | | $ | 182,825 | | $ | 179,862 | | $ | 34,466 | | $ | 17,966 | | $ | 13,640 | |
| Portfolio turnover rate | | 14.42 | % | | 47.52 | % | | 29.63 | % | | 26.06 | % | | 28.80 | % | | 13.21 | % |
aThe amount shown for a share outstanding throughout the period may not correlate with the Statement of Operations for the period due to the timing of sales and
repurchases of the Fund’s shares in relation to income earned and/or fluctuating fair value of the investments of the Fund.
bBased on average daily shares outstanding.
cAmount rounds to less than $0.01 per share.
dTotal return does not reflect sales commissions or contingent deferred sales charges, if applicable, and is not annualized for periods less than one year.
eRatios are annualized for periods less than one year.
fBenefit of expense reduction rounds to less than 0.01%.
20 Semiannual Report | The accompanying notes are an integral part of these financial statements. franklintempleton.com
| | | | | | | | | | | | | | | | | | |
| | | | | | | | | | | | FRANKLIN GLOBAL TRUST | |
| | | | | | | | | | | | FINANCIAL HIGHLIGHTS | |
| |
| |
| Franklin International Growth Fund (continued) | | | | | | | | | | | | | | | | |
| | | Six Months Ended | | | | | | | | | | | | | | | | |
| | | January 31, 2016 | | | | | | Year Ended July 31, | | | | | | | |
| | | (unaudited) | | | 2015 | | | 2014 | | | 2013 | | | 2012 | | | 2011 | |
| Class C | | | | | | | | | | | | | | | | | | |
| Per share operating performance | | | | | | | | | | | | | | | | | | |
| (for a share outstanding throughout the period) | | | | | | | | | | | | | | | | | | |
| Net asset value, beginning of period | $ | 10.94 | | $ | 11.22 | | $ | 10.31 | | $ | 9.00 | | $ | 9.73 | | $ | 8.38 | |
| Income from investment operationsa: | | | | | | | | | | | | | | | | | | |
| Net investment income (loss)b | | (0.07 | ) | | (0.01 | ) | | (0.02 | ) | | 0.02 | | | 0.05 | | | 0.04 | |
| Net realized and unrealized gains (losses) | | (1.28 | ) | | (0.20 | ) | | 0.93 | | | 1.32 | | | (0.74 | ) | | 1.34 | |
| Total from investment operations | | (1.35 | ) | | (0.21 | ) | | 0.91 | | | 1.34 | | | (0.69 | ) | | 1.38 | |
| Less distributions from: | | | | | | | | | | | | | | | | | | |
| Net investment income. | | — | | | — | | | — | | | (0.03 | ) | | (0.04 | ) | | (0.03 | ) |
| Net realized gains | | — | | | (0.07 | ) | | — | | | — | | | — | | | — | |
| Total distributions | | — | | | (0.07 | ) | | — | | | (0.03 | ) | | (0.04 | ) | | (0.03 | ) |
| Net asset value, end of period | $ | 9.59 | | $ | 10.94 | | $ | 11.22 | | $ | 10.31 | | $ | 9.00 | | $ | 9.73 | |
| |
| Total returnc | | (12.34 | )% | | (1.84 | )% | | 8.83 | % | | 14.88 | % | | (7.08 | )% | | 16.43 | % |
| |
| Ratios to average net assetsd | | | | | | | | | | | | | | | | | | |
| Expenses before waiver and payments by | | | | | | | | | | | | | | | | | | |
| affiliates | | 2.40 | % | | 2.42 | % | | 2.40 | % | | 2.22 | % | | 2.35 | % | | 2.42 | % |
| Expenses net of waiver and payments by | | | | | | | | | | | | | | | | | | |
| affiliates | | 2.19 | % | | 2.19 | % | | 2.19 | %e | | 2.19 | % | | 2.18 | % | | 2.15 | % |
| Net investment income (loss) | | (1.29 | )% | | (0.09 | )% | | (0.22 | )% | | 0.37 | % | | 0.80 | % | | 0.37 | % |
| |
| Supplemental data | | | | | | | | | | | | | | | | | | |
| Net assets, end of period (000’s) | $ | 6,427 | | $ | 7,179 | | $ | 5,977 | | $ | 4,032 | | $ | 2,545 | | $ | 2,946 | |
| Portfolio turnover rate | | 14.42 | % | | 47.52 | % | | 29.63 | % | | 26.06 | % | | 28.80 | % | | 13.21 | % |
aThe amount shown for a share outstanding throughout the period may not correlate with the Statement of Operations for the period due to the timing of sales and
repurchases of the Fund’s shares in relation to income earned and/or fluctuating fair value of the investments of the Fund.
bBased on average daily shares outstanding.
cTotal return does not reflect sales commissions or contingent deferred sales charges, if applicable, and is not annualized for periods less than one year.
dRatios are annualized for periods less than one year.
eBenefit of expense reduction rounds to less than 0.01%.
franklintempleton.com The accompanying notes are an integral part of these financial statements. | Semiannual Report 21
| | | | | | | | | | | | | | | | | | |
| FRANKLIN GLOBAL TRUST | | | | | | | | | | | | | | | | | | |
| FINANCIAL HIGHLIGHTS | | | | | | | | | | | | | | | | | | |
| |
| |
| Franklin International Growth Fund (continued) | | | | | | | | | | | | | | | | |
| | | Six Months Ended | | | | | | | | | | | | | | | | |
| | | January 31, 2016 | | | | | | Year Ended July 31, | | | | | | | |
| | | (unaudited) | | | 2015 | | | 2014 | | | 2013 | | | 2012 | | | 2011 | |
| Class R | | | | | | | | | | | | | | | | | | |
| Per share operating performance | | | | | | | | | | | | | | | | | | |
| (for a share outstanding throughout the period) | | | | | | | | | | | | | | | | | | |
| Net asset value, beginning of period | $ | 11.15 | | $ | 11.38 | | $ | 10.41 | | $ | 9.08 | | $ | 9.83 | | $ | 8.45 | |
| Income from investment operationsa: | | | | | | | | | | | | | | | | | | |
| Net investment income (loss)b | | (0.04 | ) | | 0.04 | | | 0.03 | | | 0.07 | | | 0.14 | | | 0.08 | |
| Net realized and unrealized gains (losses) | | (1.32 | ) | | (0.19 | ) | | 0.95 | | | 1.33 | | | (0.81 | ) | | 1.35 | |
| Total from investment operations | | (1.36 | ) | | (0.15 | ) | | 0.98 | | | 1.40 | | | (0.67 | ) | | 1.43 | |
| Less distributions from: | | | | | | | | | | | | | | | | | | |
| Net investment income. | | (0.01 | ) | | (0.01 | ) | | (0.01 | ) | | (0.07 | ) | | (0.08 | ) | | (0.05 | ) |
| Net realized gains | | — | | | (0.07 | ) | | — | | | — | | | — | | | — | |
| Total distributions | | (0.01 | ) | | (0.08 | ) | | (0.01 | ) | | (0.07 | ) | | (0.08 | ) | | (0.05 | ) |
| Net asset value, end of period | $ | 9.78 | | $ | 11.15 | | $ | 11.38 | | $ | 10.41 | | $ | 9.08 | | $ | 9.83 | |
| |
| Total returnc | | (12.14 | )% | | (1.31 | )% | | 9.44 | % | | 15.47 | % | | (6.79 | )% | | 17.10 | % |
| |
| Ratios to average net assetsd | | | | | | | | | | | | | | | | | | |
| Expenses before waiver and payments by | | | | | | | | | | | | | | | | | | |
| affiliates | | 1.89 | % | | 1.92 | % | | 1.90 | % | | 1.72 | % | | 1.85 | % | | 1.92 | % |
| Expenses net of waiver and payments by | | | | | | | | | | | | | | | | | | |
| affiliates | | 1.68 | % | | 1.69 | % | | 1.69 | %e | | 1.69 | % | | 1.68 | % | | 1.65 | % |
| Net investment income (loss) | | (0.78 | )% | | 0.41 | % | | 0.28 | % | | 0.87 | % | | 1.30 | % | | 0.87 | % |
| |
| Supplemental data | | | | | | | | | | | | | | | | | | |
| Net assets, end of period (000’s) | $ | 354 | | $ | 363 | | $ | 222 | | $ | 274 | | $ | 150 | | $ | 47 | |
| Portfolio turnover rate | | 14.42 | % | | 47.52 | % | | 29.63 | % | | 26.06 | % | | 28.80 | % | | 13.21 | % |
aThe amount shown for a share outstanding throughout the period may not correlate with the Statement of Operations for the period due to the timing of sales and
repurchases of the Fund’s shares in relation to income earned and/or fluctuating fair value of the investments of the Fund.
bBased on average daily shares outstanding.
cTotal return is not annualized for periods less than one year.
dRatios are annualized for periods less than one year.
eBenefit of expense reduction rounds to less than 0.01%.
22 Semiannual Report | The accompanying notes are an integral part of these financial statements. franklintempleton.com
| | | | | | | | | | | | |
| | | | | | FRANKLIN GLOBAL TRUST | |
| | | | | | FINANCIAL HIGHLIGHTS | |
| |
| |
| Franklin International Growth Fund (continued) | | | | | | | | | | | | |
| | | Six Months Ended | | | | | | | | | | |
| | | January 31, 2016 | | | Year Ended July 31, | | | | |
| | | (unaudited) | | | 2015 | | | 2014 | | | 2013 | a |
| Class R6 | | | | | | | | | | | | |
| Per share operating performance | | | | | | | | | | | | |
| (for a share outstanding throughout the period) | | | | | | | | | | | | |
| Net asset value, beginning of period | $ | 11.25 | | $ | 11.48 | | $ | 10.48 | | $ | 10.56 | |
| Income from investment operationsb: | | | | | | | | | | | | |
| Net investment income (loss)c | | (0.01 | ) | | 0.15 | | | 0.11 | | | 0.07 | |
| Net realized and unrealized gains (losses) | | (1.33 | ) | | (0.23 | ) | | 0.94 | | | (0.15 | ) |
| Total from investment operations | | (1.34 | ) | | (0.08 | ) | | 1.05 | | | (0.08 | ) |
| Less distributions from: | | | | | | | | | | | | |
| Net investment income | | (0.05 | ) | | (0.08 | ) | | (0.05 | ) | | — | |
| Net realized gains | | — | | | (0.07 | ) | | — | | | — | |
| Total distributions | | (0.05 | ) | | (0.15 | ) | | (0.05 | ) | | — | |
| Net asset value, end of period | $ | 9.86 | | $ | 11.25 | | $ | 11.48 | | $ | 10.48 | |
| |
| Total returnd | | (11.92 | )% | | (0.62 | )% | | 10.05 | % | | (0.76 | )% |
| |
| Ratios to average net assetse | | | | | | | | | | | | |
| Expenses before waiver and payments by affiliates | | 1.01 | % | | 1.02 | % | | 1.02 | % | | 1.13 | % |
| Expenses net of waiver and payments by affiliates. | | 1.00 | % | | 1.02 | %f | | 1.02 | %f,g | | 1.10 | % |
| Net investment income (loss) | | (0.10 | )% | | 1.08 | % | | 0.95 | % | | 1.45 | % |
| |
| Supplemental data | | | | | | | | | | | | |
| Net assets, end of period (000’s) | $ | 119,521 | | $ | 137,950 | | $ | 29,132 | | $ | 22,296 | |
| Portfolio turnover rate. | | 14.42 | % | | 47.52 | % | | 29.63 | % | | 26.06 | % |
aFor the period May 1, 2013 (effective date) to July 31, 2013.
bThe amount shown for a share outstanding throughout the period may not correlate with the Statement of Operations for the period due to the timing of sales and
repurchases of the Fund’s shares in relation to income earned and/or fluctuating fair value of the investments of the Fund.
cBased on average daily shares outstanding.
dTotal return is not annualized for periods less than one year.
eRatios are annualized for periods less than one year.
fBenefit of waiver and payments by affiliates rounds to less than 0.01%.
gBenefit of expense reduction rounds to less than 0.01%.
franklintempleton.com The accompanying notes are an integral part of these financial statements. | Semiannual Report 23
| | | | | | | | | | | | | | | | | | |
| FRANKLIN GLOBAL TRUST | | | | | | | | | | | | | | | | | | |
| FINANCIAL HIGHLIGHTS | | | | | | | | | | | | | | | | | | |
| |
| |
| Franklin International Growth Fund (continued) | | | | | | | | | | | | | | | | |
| | | Six Months Ended | | | | | | | | | | | | | | | | |
| | | January 31, 2016 | | | | | | Year Ended July 31, | | | | | | | |
| | | (unaudited) | | | 2015 | | | 2014 | | | 2013 | | | 2012 | | | 2011 | |
| Advisor Class | | | | | | | | | | | | | | | | | | |
| Per share operating performance | | | | | | | | | | | | | | | | | | |
| (for a share outstanding throughout the period) | | | | | | | | | | | | | | | | | | |
| Net asset value, beginning of period | $ | 11.24 | | $ | 11.47 | | $ | 10.48 | | $ | 9.13 | | $ | 9.89 | | $ | 8.49 | |
| Income from investment operationsa: | | | | | | | | | | | | | | | | | | |
| Net investment income (loss)b | | (0.02 | ) | | 0.10 | | | 0.09 | | | 0.13 | | | 0.17 | | | 0.13 | |
| Net realized and unrealized gains (losses) | | (1.32 | ) | | (0.20 | ) | | 0.95 | | | 1.33 | | | (0.80 | ) | | 1.36 | |
| Total from investment operations | | (1.34 | ) | | (0.10 | ) | | 1.04 | | | 1.46 | | | (0.63 | ) | | 1.49 | |
| Less distributions from: | | | | | | | | | | | | | | | | | | |
| Net investment income. | | (0.04 | ) | | (0.06 | ) | | (0.05 | ) | | (0.11 | ) | | (0.13 | ) | | (0.09 | ) |
| Net realized gains | | — | | | (0.07 | ) | | — | | | — | | | — | | | — | |
| Total distributions | | (0.04 | ) | | (0.13 | ) | | (0.05 | ) | | (0.11 | ) | | (0.13 | ) | | (0.09 | ) |
| Net asset value, end of period | $ | 9.86 | | $ | 11.24 | | $ | 11.47 | | $ | 10.48 | | $ | 9.13 | | $ | 9.89 | |
| |
| Total returnc | | (11.96 | )% | | (0.76 | )% | | 9.91 | % | | 16.04 | % | | (6.19 | )% | | 17.65 | % |
| |
| Ratios to average net assetsd | | | | | | | | | | | | | | | | | | |
| Expenses before waiver and payments by | | | | | | | | | | | | | | | | | | |
| affiliates | | 1.40 | % | | 1.42 | % | | 1.40 | % | | 1.22 | % | | 1.35 | % | | 1.42 | % |
| Expenses net of waiver and payments by | | | | | | | | | | | | | | | | | | |
| affiliates | | 1.19 | % | | 1.19 | % | | 1.19 | %e | | 1.19 | % | | 1.18 | % | | 1.15 | % |
| Net investment income (loss) | | (0.29 | )% | | 0.91 | % | | 0.78 | % | | 1.37 | % | | 1.80 | % | | 1.37 | % |
| |
| Supplemental data | | | | | | | | | | | | | | | | | | |
| Net assets, end of period (000’s) | $ | 109,925 | | $ | 126,130 | | $ | 97,134 | | $ | 74,240 | | $ | 48,549 | | $ | 21,873 | |
| Portfolio turnover rate | | 14.42 | % | | 47.52 | % | | 29.63 | % | | 26.06 | % | | 28.80 | % | | 13.21 | % |
aThe amount shown for a share outstanding throughout the period may not correlate with the Statement of Operations for the period due to the timing of sales and
repurchases of the Fund’s shares in relation to income earned and/or fluctuating fair value of the investments of the Fund.
bBased on average daily shares outstanding.
cTotal return is not annualized for periods less than one year.
dRatios are annualized for periods less than one year.
eBenefit of expense reduction rounds to less than 0.01%.
24 Semiannual Report | The accompanying notes are an integral part of these financial statements. franklintempleton.com
FRANKLIN GLOBAL TRUST
| | | | |
| Statement of Investments, January 31, 2016 (unaudited) | | | | |
| Franklin International Growth Fund | | | | |
| | Country | Shares | | Value |
| Common Stocks 98.2% | | | | |
| Aerospace & Defense 2.4% | | | | |
| MTU Aero Engines AG. | Germany | 104,000 | $ | 9,525,426 |
| Auto Components 2.3% | | | | |
| Delphi Automotive PLC | United Kingdom | 140,000 | | 9,091,600 |
| Banks 2.9% | | | | |
| a,b Irish Bank Resolution Corp. Ltd | Ireland | 11,500 | | — |
| KBC Groep NV | Belgium | 203,000 | | 11,610,116 |
| | | | | 11,610,116 |
| Biotechnology 3.7% | | | | |
| a Alkermes PLC | United States | 170,000 | | 5,441,700 |
| CSL Ltd | Australia | 125,000 | | 9,202,700 |
| | | | | 14,644,400 |
| Capital Markets 5.8% | | | | |
| Azimut Holding SpA. | Italy | 585,000 | | 12,263,817 |
| CI Financial Corp | Canada | 480,000 | | 10,601,185 |
| | | | | 22,865,002 |
| Chemicals 5.5% | | | | |
| Symrise AG | Germany | 170,000 | | 10,951,224 |
| Umicore SA | Belgium | 300,000 | | 10,984,051 |
| | | | | 21,935,275 |
| Diversified Consumer Services 2.2% | | | | |
| a TAL Education Group, ADR | China | 182,000 | | 8,730,540 |
| Diversified Financial Services 2.4% | | | | |
| Deutsche Boerse AG | Germany | 110,000 | | 9,368,268 |
| Electronic Equipment, Instruments & Components 1.7% | | | | |
| YASKAWA Electric Corp | Japan | 620,000 | | 6,750,041 |
| Energy Equipment & Services 1.8% | | | | |
| Amec Foster Wheeler PLC | United Kingdom | 1,180,000 | | 6,929,219 |
| Health Care Equipment & Supplies 6.2% | | | | |
| Cochlear Ltd | Australia | 161,400 | | 10,713,697 |
| GN Store Nord AS | Denmark | 750,000 | | 13,989,897 |
| | | | | 24,703,594 |
| Hotels, Restaurants & Leisure 2.2% | | | | |
| Whitbread PLC | United Kingdom | 155,000 | | 8,834,690 |
| Household Products 2.6% | | | | |
| Reckitt Benckiser Group PLC | United Kingdom | 118,000 | | 10,482,103 |
| Internet & Catalog Retail 2.1% | | | | |
| Start Today Co. Ltd | Japan | 270,000 | | 8,430,530 |
| Internet Software & Services 2.1% | | | | |
| MercadoLibre Inc | Argentina | 85,000 | | 8,350,400 |
| IT Services 2.4% | | | | |
| a Worldpay Group PLC | United Kingdom | 2,100,000 | | 9,366,197 |
| Machinery 4.3% | | | | |
| GEA Group AG | Germany | 215,000 | | 8,996,960 |
| Weir Group PLC | United Kingdom | 640,000 | | 7,888,523 |
| | | | | 16,885,483 |
franklintempleton.com
Semiannual Report 25
FRANKLIN GLOBAL TRUST
STATEMENT OF INVESTMENTS (UNAUDITED)
| | | | |
| Franklin International Growth Fund (continued) | | | | |
| | Country | Shares | | Value |
| Common Stocks (continued) | | | | |
| Media 2.7% | | | | |
| ITV PLC | United Kingdom | 2,800,000 | $ | 10,644,947 |
| Multiline Retail 2.5% | | | | |
| Dollarama Inc | Canada | 185,000 | | 9,926,797 |
| Pharmaceuticals 8.8% | | | | |
| Hikma Pharmaceuticals PLC | Jordan | 345,000 | | 9,920,644 |
| Roche Holding AG. | Switzerland | 53,000 | | 13,652,221 |
| Santen Pharmaceutical Co. Ltd | Japan | 730,000 | | 11,463,159 |
| | | | | 35,036,024 |
| Professional Services 6.8% | | | | |
| Experian PLC | United Kingdom | 780,000 | | 13,226,386 |
| SGS SA | Switzerland | 7,000 | | 13,549,049 |
| | | | | 26,775,435 |
| Road & Rail 3.1% | | | | |
| DSV AS | Denmark | 320,000 | | 12,407,206 |
| Semiconductors & Semiconductor Equipment 2.8% | | | | |
| ARM Holdings PLC | United Kingdom | 780,000 | | 11,036,808 |
| Software 9.0% | | | | |
| a Check Point Software Technologies Ltd | Israel | 160,000 | | 12,609,600 |
| Dassault Systemes SA. | France | 140,000 | | 10,797,815 |
| The Sage Group PLC | United Kingdom | 1,400,000 | | 12,388,515 |
| | | | | 35,795,930 |
| Textiles, Apparel & Luxury Goods 5.6% | | | | |
| Burberry Group PLC | United Kingdom | 680,000 | | 11,579,144 |
| Luxottica Group SpA | Italy | 170,000 | | 10,599,444 |
| | | | | 22,178,588 |
| Trading Companies & Distributors 4.3% | | | | |
| Noble Group Ltd | Hong Kong | 27,500,000 | | 5,985,607 |
| Wolseley PLC | United Kingdom | 220,000 | | 10,856,124 |
| | | | | 16,841,731 |
| Total Common Stocks (Cost $407,251,668) | | | | 389,146,350 |
| |
| Short Term Investments (Cost $6,164,504) 1.5% | | | | |
| Money Market Funds 1.5% | | | | |
| a,c Institutional Fiduciary Trust Money Market Portfolio | United States | 6,164,504 | | 6,164,504 |
| Total Investments (Cost $413,416,172) 99.7% | | | | 395,310,854 |
| Other Assets, less Liabilities 0.3% | | | | 1,013,028 |
| Net Assets 100.0% | | | $ | 396,323,882 |
See Abbreviations on page 49.
aNon-income producing.
bSecurity has been deemed illiquid because it may not be able to be sold within seven days.
cSee Note 3(f) regarding investments in affiliated management investment companies.
26 Semiannual Report | The accompanying notes are an integral part of these financial statements. franklintempleton.com
FRANKLIN GLOBAL TRUST
| | | | | | | | | | | | | | | | | | |
| Financial Highlights | | | | | | | | | | | | | | | | | | |
| Franklin International Small Cap Growth Fund | | | | | | | | | | | | | | | | |
| | | Six Months Ended | | | | | | | | | | | | | | | | |
| | | January 31, 2016 | | | | | | Year Ended July 31, | | | | |
| | | (unaudited) | | | 2015 | | | 2014 | | | 2013 | | | 2012 | | | 2011 | |
| Class A | | | | | | | | | | | | | | | | | | |
| Per share operating performance | | | | | | | | | | | | | | | | | | |
| (for a share outstanding throughout the period) | | | | | | | | | | | | | | | | | | |
| Net asset value, beginning of period | $ | 19.92 | | $ | 22.23 | | $ | 19.70 | | $ | 14.38 | | $ | 16.31 | | $ | 14.99 | |
| Income from investment operationsa: | | | | | | | | | | | | | | | | | | |
| Net investment incomeb | | 0.04 | | | 0.19 | | | 0.19 | | | 0.18 | | | 0.25 | | | 0.28 | |
| Net realized and unrealized gains (losses) | | (1.96 | ) | | (0.48 | ) | | 2.65 | | | 5.94 | | | (1.48 | ) | | 1.29 | |
| Total from investment operations | | (1.92 | ) | | (0.29 | ) | | 2.84 | | | 6.12 | | | (1.23 | ) | | 1.57 | |
| Less distributions from: | | | | | | | | | | | | | | | | | | |
| Net investment income. | | (0.24 | ) | | (0.29 | ) | | (0.11 | ) | | (0.19 | ) | | (0.20 | ) | | (0.25 | ) |
| Net realized gains | | (0.37 | ) | | (1.73 | ) | | (0.20 | ) | | (0.61 | ) | | (0.50 | ) | | — | |
| Total distributions | | (0.61 | ) | | (2.02 | ) | | (0.31 | ) | | (0.80 | ) | | (0.70 | ) | | (0.25 | ) |
| Net asset value, end of period | $ | 17.39 | | $ | 19.92 | | $ | 22.23 | | $ | 19.70 | | $ | 14.38 | | $ | 16.31 | |
| |
| Total returnc | | (9.76 | )% | | (0.17 | )% | | 14.48 | % | | 43.69 | % | | (7.14 | )% | | 10.47 | % |
| |
| Ratios to average net assetsd | | | | | | | | | | | | | | | | | | |
| Expenses before waiver and payments by | | | | | | | | | | | | | | | | | | |
| affiliates | | 1.36 | % | | 1.36 | % | | 1.36 | % | | 1.46 | % | | 1.49 | % | | 1.47 | % |
| Expenses net of waiver and payments by | | | | | | | | | | | | | | | | | | |
| affiliates | | 1.36 | %e | | 1.36 | %e | | 1.36 | %e | | 1.40 | %e | | 1.24 | % | | 1.25 | % |
| Net investment income | | 0.39 | % | | 0.98 | % | | 0.89 | % | | 1.03 | % | | 1.72 | % | | 1.75 | % |
| |
| Supplemental data | | | | | | | | | | | | | | | | | | |
| Net assets, end of period (000’s) | $ | 184,592 | | $ | 212,890 | | $ | 257,568 | | $ | 232,712 | | $ | 166,577 | | $ | 150,989 | |
| Portfolio turnover rate | | 11.05 | % | | 24.20 | % | | 16.08 | % | | 22.81 | % | | 17.07 | % | | 17.52 | % |
aThe amount shown for a share outstanding throughout the period may not correlate with the Statement of Operations for the period due to the timing of sales and
repurchases of the Fund’s shares in relation to income earned and/or fluctuating fair value of the investments of the Fund.
bBased on average daily shares outstanding.
cTotal return does not reflect sales commissions or contingent deferred sales charges, if applicable, and is not annualized for periods less than one year.
dRatios are annualized for periods less than one year.
eBenefit of expense reduction rounds to less than 0.01%.
franklintempleton.com The accompanying notes are an integral part of these financial statements. | Semiannual Report 27
| | | | | | | | | | | | | | | | | | |
| FRANKLIN GLOBAL TRUST | | | | | | | | | | | | | | | | | | |
| FINANCIAL HIGHLIGHTS | | | | | | | | | | | | | | | | | | |
| |
| |
| Franklin International Small Cap Growth Fund (continued) | | | | | | | | | | | | | | | | |
| | | Six Months Ended | | | | | | | | | | | | | | | | |
| | | January 31, 2016 | | | | | | Year Ended July 31, | | | | | | | |
| | | (unaudited) | | | 2015 | | | 2014 | | | 2013 | | | 2012 | | | 2011 | |
| Class C | | | | | | | | | | | | | | | | | | |
| Per share operating performance | | | | | | | | | | | | | | | | | | |
| (for a share outstanding throughout the period) | | | | | | | | | | | | | | | | | | |
| Net asset value, beginning of period | $ | 19.60 | | $ | 21.94 | | $ | 19.51 | | $ | 14.25 | | $ | 16.13 | | $ | 14.85 | |
| Income from investment operationsa: | | | | | | | | | | | | | | | | | | |
| Net investment income (loss)b | | (0.03 | ) | | 0.05 | | | 0.02 | | | 0.05 | | | 0.14 | | | 0.17 | |
| Net realized and unrealized gains (losses) | | (1.94 | ) | | (0.47 | ) | | 2.63 | | | 5.90 | | | (1.45 | ) | | 1.27 | |
| Total from investment operations | | (1.97 | ) | | (0.42 | ) | | 2.65 | | | 5.95 | | | (1.31 | ) | | 1.44 | |
| Less distributions from: | | | | | | | | | | | | | | | | | | |
| Net investment income. | | (0.03 | ) | | (0.19 | ) | | (0.02 | ) | | (0.08 | ) | | (0.07 | ) | | (0.16 | ) |
| Net realized gains | | (0.37 | ) | | (1.73 | ) | | (0.20 | ) | | (0.61 | ) | | (0.50 | ) | | — | |
| Total distributions | | (0.40 | ) | | (1.92 | ) | | (0.22 | ) | | (0.69 | ) | | (0.57 | ) | | (0.16 | ) |
| Net asset value, end of period | $ | 17.23 | | $ | 19.60 | | $ | 21.94 | | $ | 19.51 | | $ | 14.25 | | $ | 16.13 | |
| |
| Total returnc | | (10.13 | )% | | (0.86 | )% | | 13.59 | % | | 42.74 | % | | (7.81 | )% | | 9.69 | % |
| |
| Ratios to average net assetsd | | | | | | | | | | | | | | | | | | |
| Expenses before waiver and payments by | | | | | | | | | | | | | | | | | | |
| affiliates | | 2.11 | % | | 2.08 | % | | 2.11 | % | | 2.16 | % | | 2.20 | % | | 2.17 | % |
| Expenses net of waiver and payments by | | | | | | | | | | | | | | | | | | |
| affiliates | | 2.11 | %e | | 2.08 | %e | | 2.11 | %e | | 2.10 | %e | | 1.95 | % | | 1.95 | % |
| Net investment income (loss) | | (0.36 | )% | | 0.26 | % | | 0.14 | % | | 0.33 | % | | 1.01 | % | | 1.05 | % |
| |
| Supplemental data | | | | | | | | | | | | | | | | | | |
| Net assets, end of period (000’s) | $ | 25,777 | | $ | 30,067 | | $ | 35,484 | | $ | 29,786 | | $ | 14,278 | | $ | 19,127 | |
| Portfolio turnover rate | | 11.05 | % | | 24.20 | % | | 16.08 | % | | 22.81 | % | | 17.07 | % | | 17.52 | % |
aThe amount shown for a share outstanding throughout the period may not correlate with the Statement of Operations for the period due to the timing of sales and
repurchases of the Fund’s shares in relation to income earned and/or fluctuating fair value of the investments of the Fund.
bBased on average daily shares outstanding.
cTotal return does not reflect sales commissions or contingent deferred sales charges, if applicable, and is not annualized for periods less than one year.
dRatios are annualized for periods less than one year.
eBenefit of expense reduction rounds to less than 0.01%.
28 Semiannual Report | The accompanying notes are an integral part of these financial statements. franklintempleton.com
| | | | | | | | | | | | | | | | | | |
| | | | | | | | | | | | FRANKLIN GLOBAL TRUST | |
| | | | | | | | | | | | FINANCIAL HIGHLIGHTS | |
| |
| |
| Franklin International Small Cap Growth Fund (continued) | | | | | | | | | | | | | | | | |
| | | Six Months Ended | | | | | | | | | | | | | | | | |
| | | January 31, 2016 | | | | | | Year Ended July 31, | | | | | | | |
| | | (unaudited) | | | 2015 | | | 2014 | | | 2013 | | | 2012 | | | 2011 | |
| Class R | | | | | | | | | | | | | | | | | | |
| Per share operating performance | | | | | | | | | | | | | | | | | | |
| (for a share outstanding throughout the period) | | | | | | | | | | | | | | | | | | |
| Net asset value, beginning of period | $ | 19.88 | | $ | 22.19 | | $ | 19.65 | | $ | 14.35 | | $ | 16.29 | | $ | 14.96 | |
| Income from investment operationsa: | | | | | | | | | | | | | | | | | | |
| Net investment incomeb | | 0.01 | | | 0.15 | | | 0.12 | | | 0.13 | | | 0.22 | | | 0.25 | |
| Net realized and unrealized gains (losses) | | (1.95 | ) | | (0.48 | ) | | 2.66 | | | 5.94 | | | (1.48 | ) | | 1.29 | |
| Total from investment operations | | (1.94 | ) | | (0.33 | ) | | 2.78 | | | 6.07 | | | (1.26 | ) | | 1.54 | |
| Less distributions from: | | | | | | | | | | | | | | | | | | |
| Net investment income. | | (0.14 | ) | | (0.25 | ) | | (0.04 | ) | | (0.16 | ) | | (0.18 | ) | | (0.21 | ) |
| Net realized gains | | (0.37 | ) | | (1.73 | ) | | (0.20 | ) | | (0.61 | ) | | (0.50 | ) | | — | |
| Total distributions | | (0.51 | ) | | (1.98 | ) | | (0.24 | ) | | (0.77 | ) | | (0.68 | ) | | (0.21 | ) |
| Net asset value, end of period | $ | 17.43 | | $ | 19.88 | | $ | 22.19 | | $ | 19.65 | | $ | 14.35 | | $ | 16.29 | |
| |
| Total returnc | | (9.87 | )% | | (0.41 | )% | | 14.17 | % | | 43.40 | % | | (7.37 | )% | | 10.30 | % |
| |
| Ratios to average net assetsd | | | | | | | | | | | | | | | | | | |
| Expenses before waiver and payments by | | | | | | | | | | | | | | | | | | |
| affiliates | | 1.62 | % | | 1.62 | % | | 1.62 | % | | 1.66 | % | | 1.70 | % | | 1.67 | % |
| Expenses net of waiver and payments by | | | | | | | | | | | | | | | | | | |
| affiliates | | 1.62 | %e | | 1.62 | %e | | 1.62 | %e | | 1.60 | %e | | 1.45 | % | | 1.45 | % |
| Net investment income | | 0.13 | % | | 0.72 | % | | 0.63 | % | | 0.83 | % | | 1.51 | % | | 1.55 | % |
| |
| Supplemental data | | | | | | | | | | | | | | | | | | |
| Net assets, end of period (000’s) | $ | 5,120 | | $ | 6,193 | | $ | 9,320 | | $ | 120,877 | | $ | 9,755 | | $ | 7,718 | |
| Portfolio turnover rate | | 11.05 | % | | 24.20 | % | | 16.08 | % | | 22.81 | % | | 17.07 | % | | 17.52 | % |
aThe amount shown for a share outstanding throughout the period may not correlate with the Statement of Operations for the period due to the timing of sales and
repurchases of the Fund’s shares in relation to income earned and/or fluctuating fair value of the investments of the Fund.
bBased on average daily shares outstanding.
cTotal return is not annualized for periods less than one year.
dRatios are annualized for periods less than one year.
eBenefit of expense reduction rounds to less than 0.01%.
franklintempleton.com The accompanying notes are an integral part of these financial statements. | Semiannual Report 29
| | | | | | | | | | | | |
| FRANKLIN GLOBAL TRUST | | | | | | | | | | | | |
| FINANCIAL HIGHLIGHTS | | | | | | | | | | | | |
| |
| |
| Franklin International Small Cap Growth Fund (continued) | | | | | | | | | | | | |
| | | Six Months Ended | | | | | | | | | | |
| | | January 31, 2016 | | | Year Ended July 31, | |
| | | (unaudited) | | | 2015 | | | 2014 | | | 2013 | a |
| Class R6 | | | | | | | | | | | | |
| Per share operating performance | | | | | | | | | | | | |
| (for a share outstanding throughout the period) | | | | | | | | | | | | |
| Net asset value, beginning of period | $ | 20.03 | | $ | 22.32 | | $ | 19.78 | | $ | 18.49 | |
| Income from investment operationsb: | | | | | | | | | | | | |
| Net investment incomec | | 0.07 | | | 0.27 | | | 0.28 | | | 0.09 | |
| Net realized and unrealized gains (losses) | | (1.96 | ) | | (0.48 | ) | | 2.65 | | | 1.20 | |
| Total from investment operations | | (1.89 | ) | | (0.21 | ) | | 2.93 | | | 1.29 | |
| Less distributions from: | | | | | | | | | | | | |
| Net investment income | | (0.35 | ) | | (0.35 | ) | | (0.19 | ) | | — | |
| Net realized gains | | (0.37 | ) | | (1.73 | ) | | (0.20 | ) | | — | |
| Total distributions | | (0.72 | ) | | (2.08 | ) | | (0.39 | ) | | — | |
| Net asset value, end of period | $ | 17.42 | | $ | 20.03 | | $ | 22.32 | | $ | 19.78 | |
| |
| Total returnd | | (9.60 | )% | | 0.22 | % | | 14.89 | % | | 6.98 | % |
| |
| Ratios to average net assetse | | | | | | | | | | | | |
| Expensesf | | 0.99 | % | | 0.99 | % | | 1.00 | % | | 1.01 | % |
| Net investment income | | 0.76 | % | | 1.35 | % | | 1.25 | % | | 1.42 | % |
| |
| Supplemental data | | | | | | | | | | | | |
| Net assets, end of period (000’s) | $ | 390,213 | | $ | 387,070 | | $ | 359,449 | | $ | 220,507 | |
| Portfolio turnover rate. | | 11.05 | % | | 24.20 | % | | 16.08 | % | | 22.81 | % |
aFor the period May 1, 2013 (effective date) to July 31, 2013.
bThe amount shown for a share outstanding throughout the period may not correlate with the Statement of Operations for the period due to the timing of sales and
repurchases of the Fund’s shares in relation to income earned and/or fluctuating fair value of the investments of the Fund.
cBased on average daily shares outstanding.
dTotal return is not annualized for periods less than one year.
eRatios are annualized for periods less than one year.
fBenefit of expense reduction rounds to less than 0.01%.
30 Semiannual Report | The accompanying notes are an integral part of these financial statements. franklintempleton.com
| | | | | | | | | | | | | | | | | | |
| | | | | | | | | | | | FRANKLIN GLOBAL TRUST | |
| | | | | | | | | | | | FINANCIAL HIGHLIGHTS | |
| |
| |
| Franklin International Small Cap Growth Fund (continued) | | | | | | | | | | | | | |
| | | Six Months Ended | | | | | | | | | | | | | | | | |
| | | January 31, 2016 | | | | | | Year Ended July 31, | | | | |
| | | (unaudited) | | | 2015 | | | 2014 | | | 2013 | | | 2012 | | | 2011 | |
| Advisor Class | | | | | | | | | | | | | | | | | | |
| Per share operating performance | | | | | | | | | | | | | | | | | | |
| (for a share outstanding throughout the period) | | | | | | | | | | | | | | | | | | |
| Net asset value, beginning of period | $ | 20.00 | | $ | 22.30 | | $ | 19.77 | | $ | 14.43 | | $ | 16.36 | | $ | 15.02 | |
| Income from investment operationsa: | | | | | | | | | | | | | | | | | | |
| Net investment incomeb | | 0.06 | | | 0.24 | | | 0.25 | | | 0.23 | | | 0.29 | | | 0.34 | |
| Net realized and unrealized gains (losses) | | (1.96 | ) | | (0.48 | ) | | 2.65 | | | 5.95 | | | (1.48 | ) | | 1.29 | |
| Total from investment operations | | (1.90 | ) | | (0.24 | ) | | 2.90 | | | 6.18 | | | (1.19 | ) | | 1.63 | |
| Less distributions from: | | | | | | | | | | | | | | | | | | |
| Net investment income. | | (0.32 | ) | | (0.33 | ) | | (0.17 | ) | | (0.23 | ) | | (0.24 | ) | | (0.29 | ) |
| Net realized gains | | (0.37 | ) | | (1.73 | ) | | (0.20 | ) | | (0.61 | ) | | (0.50 | ) | | — | |
| Total distributions | | (0.69 | ) | | (2.06 | ) | | (0.37 | ) | | (0.84 | ) | | (0.74 | ) | | (0.29 | ) |
| Net asset value, end of period | $ | 17.41 | | $ | 20.00 | | $ | 22.30 | | $ | 19.77 | | $ | 14.43 | | $ | 16.36 | |
| |
| Total returnc | | (9.62 | )% | | 0.09 | % | | 14.74 | % | | 44.06 | % | | (6.87 | )% | | 10.83 | % |
| |
| Ratios to average net assetsd | | | | | | | | | | | | | | | | | | |
| Expenses before waiver and payments by | | | | | | | | | | | | | | | | | | |
| affiliates | | 1.12 | % | | 1.12 | % | | 1.12 | % | | 1.16 | % | | 1.20 | % | | 1.17 | % |
| Expenses net of waiver and payments by | | | | | | | | | | | | | | | | | | |
| affiliates | | 1.12 | %e | | 1.12 | %e | | 1.12 | %e | | 1.10 | %e | | 0.95 | % | | 0.95 | % |
| Net investment income | | 0.63 | % | | 1.22 | % | | 1.13 | % | | 1.33 | % | | 2.01 | % | | 2.05 | % |
| |
| Supplemental data | | | | | | | | | | | | | | | | | | |
| Net assets, end of period (000���s) | $ | 1,148,824 | | $ | 1,300,759 | | $ | 1,223,532 | | $ | 826,218 | | $ | 376,590 | | $ | 380,337 | |
| Portfolio turnover rate | | 11.05 | % | | 24.20 | % | | 16.08 | % | | 22.81 | % | | 17.07 | % | | 17.52 | % |
aThe amount shown for a share outstanding throughout the period may not correlate with the Statement of Operations for the period due to the timing of sales and
repurchases of the Fund’s shares in relation to income earned and/or fluctuating fair value of the investments of the Fund.
bBased on average daily shares outstanding.
cTotal return is not annualized for periods less than one year.
dRatios are annualized for periods less than one year.
eBenefit of expense reduction rounds to less than 0.01%.
franklintempleton.com The accompanying notes are an integral part of these financial statements. | Semiannual Report 31
| | | | |
| FRANKLIN GLOBAL TRUST | | | | |
| |
| |
| |
| |
| Statement of Investments, January 31, 2016 (unaudited) | | | | |
| Franklin International Small Cap Growth Fund | | | | |
| | Country | Shares | | Value |
| |
| Common Stocks 99.2% | | | | |
| Air Freight & Logistics 1.9% | | | | |
| Panalpina Welttransport Holding AG | Switzerland | 343,330 | $ | 33,227,106 |
| Beverages 2.6% | | | | |
| C&C Group PLC | Ireland | 11,927,630 | | 46,262,173 |
| Building Products 3.1% | | | | |
| Uponor OYJ | Finland | 3,500,448 | | 53,624,330 |
| Capital Markets 4.1% | | | | |
| ARA Asset Management Ltd | Singapore | 46,734,622 | | 33,797,901 |
| a Fairfax India Holdings Corp | Canada | 3,810,600 | | 38,487,060 |
| | | | | 72,284,961 |
| Commercial Services & Supplies 5.2% | | | | |
| Elis SA | France | 2,092,274 | | 36,540,327 |
| ISS A/S | Denmark | 997,200 | | 35,175,369 |
| a Serco Group PLC | United Kingdom | 16,610,256 | | 20,201,308 |
| | | | | 91,917,004 |
| Construction & Engineering 1.1% | | | | |
| Morgan Sindall PLC | United Kingdom | 1,839,400 | | 18,740,529 |
| Distributors 1.9% | | | | |
| b Headlam Group PLC | United Kingdom | 4,886,688 | | 34,189,735 |
| Diversified Consumer Services 4.9% | | | | |
| New Oriental Education & Technology Group Inc., ADR | China | 2,718,060 | | 85,374,265 |
| Diversified Financial Services 4.1% | | | | |
| Kennedy Wilson Europe Real Estate PLC | United Kingdom | 1,375,800 | | 21,839,371 |
| c Kennedy Wilson Europe Real Estate PLC, 144A. | United Kingdom | 3,118,600 | | 49,504,479 |
| | | | | 71,343,850 |
| Electrical Equipment 3.3% | | | | |
| Prysmian SpA | Italy | 2,864,029 | | 58,551,517 |
| Energy Equipment & Services 2.6% | | | | |
| Amec Foster Wheeler PLC. | United Kingdom | 7,764,962 | | 45,597,558 |
| Food & Staples Retailing 3.4% | | | | |
| Sligro Food Group NV | Netherlands | 1,628,055 | | 59,626,436 |
| Hotels, Restaurants & Leisure 2.6% | | | | |
| a Dalata Hotel Group PLC | Ireland | 7,616,999 | | 40,436,059 |
| a,c Dalata Hotel Group PLC, 144A | Ireland | 1,132,759 | | 6,013,433 |
| | | | | 46,449,492 |
| Insurance 15.6% | | | | |
| a Arch Capital Group Ltd | United States | 782,307 | | 52,844,838 |
| Euler Hermes Group | France | 491,241 | | 42,044,630 |
| Fairfax Financial Holdings Ltd | Canada | 170,700 | | 87,891,796 |
| RenaissanceRe Holdings Ltd | United States | 806,300 | | 90,829,695 |
| | | | | 273,610,959 |
| IT Services 5.4% | | | | |
| a Paysafe Group PLC | Isle of Man | 16,688,675 | | 95,241,014 |
| Leisure Products 2.9% | | | | |
| Beneteau. | France | 2,454,200 | | 29,779,460 |
| Sankyo Co. Ltd | Japan | 550,200 | | 20,769,982 |
| | | | | 50,549,442 |
32 Semiannual Report
franklintempleton.com
FRANKLIN GLOBAL TRUST
STATEMENT OF INVESTMENTS (UNAUDITED)
| | | | |
| Franklin International Small Cap Growth Fund (continued) | | | | |
| | Country | Shares | | Value |
| |
| Common Stocks (continued) | | | | |
| Machinery 7.2% | | | | |
| Valmet Corp | Finland | 3,932,780 | $ | 38,922,170 |
| Vesuvius PLC. | United Kingdom | 13,313,230 | | 57,234,564 |
| Zardoya Otis SA | Spain | 2,796,035 | | 29,353,184 |
| | | | | 125,509,918 |
| Marine 3.5% | | | | |
| Clarkson PLC | United Kingdom | 1,452,972 | | 42,546,977 |
| a,b Diana Shipping Inc | Greece | 7,451,400 | | 18,628,500 |
| | | | | 61,175,477 |
| Media 1.4% | | | | |
| ASATSU-DK Inc | Japan | 1,143,000 | | 24,529,275 |
| Metals & Mining 1.3% | | | | |
| Straits Trading Co. Ltd | Singapore | 16,050,300 | | 23,045,718 |
| Personal Products 1.0% | | | | |
| b Aderans Co. Ltd | Japan | 3,568,500 | | 17,656,794 |
| Professional Services 4.0% | | | | |
| Michael Page International PLC | United Kingdom | 8,831,770 | | 51,132,168 |
| SThree PLC | United Kingdom | 4,198,260 | | 18,410,561 |
| | | | | 69,542,729 |
| Real Estate Investment Trusts (REITs) 8.2% | | | | |
| b Green REIT PLC | Ireland | 38,429,481 | | 62,451,751 |
| b Irish Residential Properties REIT PLC | Ireland | 11,125,000 | | 13,318,372 |
| b,c Irish Residential Properties REIT PLC, 144A | Ireland | 20,000,000 | | 23,943,141 |
| b Lar Espana Real Estate Socimi SA | Spain | 4,593,500 | | 43,794,062 |
| | | | | 143,507,326 |
| Real Estate Management & Development 1.5% | | | | |
| Countrywide PLC | United Kingdom | 5,111,880 | | 25,567,449 |
| Specialty Retail 1.9% | | | | |
| a,b Carpetright PLC | United Kingdom | 6,064,925 | | 33,942,299 |
| Trading Companies & Distributors 4.5% | | | | |
| Grafton Group PLC | United Kingdom | 7,821,732 | | 78,464,863 |
| Total Common Stocks (Cost $1,747,851,142) | | | | 1,739,532,219 |
franklintempleton.com
Semiannual Report 33
FRANKLIN GLOBAL TRUST
STATEMENT OF INVESTMENTS (UNAUDITED)
| | | | | | |
| Franklin International Small Cap Growth Fund (continued) | | | | | | |
| | | | Principal | | | |
| | Country | | Amount | | Value | |
| |
| Short Term Investments (Cost $16,200,000) 0.9% | | | | | | |
| Time Deposits 0.9% | | | | | | |
| Royal Bank of Canada, 0.28%, 2/01/16 | United States | $ | 16,200,000 | $ | 16,200,000 | |
| Total Investments (Cost $1,764,051,142) 100.1% | | | | | 1,755,732,219 | |
| Other Assets, less Liabilities (0.1)% | | | | | (1,206,168 | ) |
| Net Assets 100.0% | | | | $ | 1,754,526,051 | |
See Abbreviations on page 49.
aNon-income producing.
bSee Note 8 regarding holdings of 5% voting securities.
cSecurity was purchased pursuant to Rule 144A under the Securities Act of 1933 and may be sold in transactions exempt from registration only to qualified institutional buyers
or in a public offering registered under the Securities Act of 1933. These securities have been deemed liquid under guidelines approved by the Trust’s Board of Trustees. At
January 31, 2016, the aggregate value of these securities was $79,461,053, representing 4.53% of net assets.
34 Semiannual Report | The accompanying notes are an integral part of these financial statements. franklintempleton.com
FRANKLIN GLOBAL TRUST
Financial Statements
Statements of Assets and Liabilities
January 31, 2016 (unaudited)
| | | | | | |
| | | | | | Franklin | |
| | | Franklin | | | International | |
| | | International | | | Small Cap | |
| | | Growth Fund | | | Growth Fund | |
| Assets: | | | | | | |
| Investments in securities: | | | | | | |
| Cost - Unaffiliated issuers | $ | 407,251,668 | | $ | 1,441,129,234 | |
| Cost - Non-controlled affiliates (Note 3f and 8) | | 6,164,504 | | | 322,921,908 | |
| Total cost of investments. | $ | 413,416,172 | | $ | 1,764,051,142 | |
| Value - Unaffiliated issuers | $ | 389,146,350 | | $ | 1,507,807,565 | |
| Value - Non-controlled affiliates (Note 3f and 8) | | 6,164,504 | | | 247,924,654 | |
| Total value of investments. | | 395,310,854 | | | 1,755,732,219 | |
| Cash | | 95,148 | | | 276,845 | |
| Receivables: | | | | | | |
| Investment securities sold | | 1,135,427 | | | 2,985,476 | |
| Capital shares sold | | 212,662 | | | 827,410 | |
| Dividends | | 464,215 | | | 2,344,271 | |
| European Union tax reclaims. | | 42,210 | | | 477,559 | |
| Affiliates | | 16,020 | | | — | |
| Other assets | | 6 | | | 37 | |
| Total assets. | | 397,276,542 | | | 1,762,643,817 | |
| Liabilities: | | | | | | |
| Payables: | | | | | | |
| Investment securities purchased | | — | | | 2,567,122 | |
| Capital shares redeemed | | 543,244 | | | 3,661,742 | |
| Management fees | | 317,701 | | | 1,430,786 | |
| Distribution fees. | | 39,978 | | | 62,634 | |
| Transfer agent fees | | — | | | 245,263 | |
| Trustees’ fees and expenses | | 1,057 | | | 4,643 | |
| Accrued expenses and other liabilities | | 50,680 | | | 145,576 | |
| Total liabilities | | 952,660 | | | 8,117,766 | |
| Net assets, at value | $ | 396,323,882 | | $ | 1,754,526,051 | |
| Net assets consist of: | | | | | | |
| Paid-in capital | $ | 430,238,702 | | $ | 1,772,092,977 | |
| Distributions in excess of net investment income | | (749,561 | ) | | (16,264,657 | ) |
| Net unrealized appreciation (depreciation) | | (18,142,760 | ) | | (8,399,110 | ) |
| Accumulated net realized gain (loss) | | (15,022,499 | ) | | 7,096,841 | |
| Net assets, at value | $ | 396,323,882 | | $ | 1,754,526,051 | |
franklintempleton.com The accompanying notes are an integral part of these financial statements. | Semiannual Report 35
| | | | | |
| FRANKLIN GLOBAL TRUST | | | | | |
| FINANCIAL STATEMENTS | | | | | |
| |
| |
| Statements of Assets and Liabilities (continued) | | | | | |
| January 31, 2016 (unaudited) | | | | | |
| |
| | | | | | Franklin |
| | | | Franklin | | International |
| | | | International | | Small Cap |
| | | | Growth Fund | | Growth Fund |
| Class A: | | | | | |
| Net assets, at value | $ | | 160,097,958 | $ | 184,591,844 |
| Shares outstanding | | | 16,314,857 | | 10,614,247 |
| Net asset value per sharea | | $ | 9.81 | $ | 17.39 |
| Maximum offering price per share (net asset value per share ÷ 94.25%) | | $ | 10.41 | $ | 18.45 |
| Class C: | | | | | |
| Net assets, at value | $ | | 6,426,561 | $ | 25,777,400 |
| Shares outstanding | | | 670,325 | | 1,496,040 |
| Net asset value and maximum offering price per sharea | | $ | 9.59 | $ | 17.23 |
| Class R: | | | | | |
| Net assets, at value | $ | | 353,769 | $ | 5,119,818 |
| Shares outstanding | | | 36,155 | | 293,780 |
| Net asset value and maximum offering price per share. | | $ | 9.78 | $ | 17.43 |
| Class R6: | | | | | |
| Net assets, at value | $ | | 119,520,676 | $ | 390,213,481 |
| Shares outstanding | | | 12,116,952 | | 22,403,349 |
| Net asset value and maximum offering price per share. | | $ | 9.86 | $ | 17.42 |
| Advisor Class: | | | | | |
| Net assets, at value | $ | | 109,924,918 | $ | 1,148,823,508 |
| Shares outstanding | | | 11,152,160 | | 65,968,782 |
| Net asset value and maximum offering price per share. | | $ | 9.86 | $ | 17.41 |
aRedemption price is equal to net asset value less contingent deferred sales charges, if applicable.
36 Semiannual Report | The accompanying notes are an integral part of these financial statements. franklintempleton.com
| | | | | | |
| | | FRANKLIN GLOBAL TRUST | |
| | | FINANCIAL STATEMENTS | |
| |
| |
| Statements of Operations | | | | | | |
| for the six months ended January 31, 2016 (unaudited) | | | | | | |
| |
| | | | | | Franklin | |
| | | Franklin | | | International | |
| | | International | | | Small Cap | |
| | | Growth Fund | | | Growth Fund | |
| Investment income: | | | | | | |
| Dividends: (net of foreign taxes)a | | | | | | |
| Unaffiliated issuers | $ | 1,907,388 | | $ | 15,023,959 | |
| Non-controlled affiliates (Note 3f and 8) | | — | | | 970,294 | |
| Interest | | 418 | | | 29,253 | |
| Other Income (Note 1c) | | 41,792 | | | 475,177 | |
| Expenses: | | | | | | |
| Management fees (Note 3a) | | 2,051,096 | | | 8,955,322 | |
| Distribution fees: (Note 3c) | | | | | | |
| Class A | | 214,698 | | | 242,976 | |
| Class C | | 33,890 | | | 140,025 | |
| Class R | | 893 | | | 14,425 | |
| Transfer agent fees: (Note 3e) | | | | | | |
| Class A | | 337,765 | | | 132,880 | |
| Class C | | 13,347 | | | 18,652 | |
| Class R | | 720 | | | 3,799 | |
| Class R6 | | 218 | | | 272 | |
| Advisor Class | | 244,810 | | | 823,615 | |
| Custodian fees (Note 4) | | 21,549 | | | 98,915 | |
| Reports to shareholders | | 8,532 | | | 38,229 | |
| Registration and filing fees | | 52,527 | | | 110,734 | |
| Professional fees | | 24,845 | | | 50,352 | |
| Trustees’ fees and expenses | | 6,432 | | | 34,907 | |
| Other | | 8,869 | | | 20,240 | |
| Total expenses | | 3,020,191 | | | 10,685,343 | |
| Expense reductions (Note 4) | | — | | | (390 | ) |
| Expenses waived/paid by affiliates (Note 3f and 3g) | | (324,458 | ) | | — | |
| Net expenses | | 2,695,733 | | | 10,684,953 | |
| Net investment income (loss) | | (746,135 | ) | | 5,813,730 | |
| Realized and unrealized gains (losses): | | | | | | |
| Net realized gain (loss) from: | | | | | | |
| Investments | | (256,180 | ) | | 33,548,635 | |
| Foreign currency transactions | | 657 | | | (290,910 | ) |
| Net realized gain (loss) | | (255,523 | ) | | 33,257,725 | |
| Net change in unrealized appreciation (depreciation) on: | | | | | | |
| Investments | | (52,832,897 | ) | | (227,617,146 | ) |
| Translation of other assets and liabilities denominated in foreign | | | | | | |
| currencies | | (2,261 | ) | | 37,231 | |
| Net change in unrealized appreciation (depreciation) | | (52,835,158 | ) | | (227,579,915 | ) |
| Net realized and unrealized gain (loss) | | (53,090,681 | ) | | (194,322,190 | ) |
| Net increase (decrease) in net assets resulting from operations | $ | (53,836,816 | ) | $ | (188,508,460 | ) |
aForeign taxes withheld on dividends $ 78,875 $ 905,650
franklintempleton.com The accompanying notes are an integral part of these financial statements. | Semiannual Report 37
| | | | | | | | | | | | |
| FRANKLIN GLOBAL TRUST | | | | | | | | | | | | |
| FINANCIAL STATEMENTS | | | | | | | | | | | | |
| |
| |
| Statements of Changes in Net Assets | | | | | | | | | | | | |
| |
| | | Franklin International | | | Franklin International | |
| | | Growth Fund | | | Small Cap Growth Fund | |
| | | Six Months Ended | | | | | | Six Months Ended | | | | |
| | | January 31, 2016 | | | Year Ended | | | January 31, 2016 | | | Year Ended | |
| | | (unaudited) | | | July 31, 2015 | | | (unaudited) | | | July 31, 2015 | |
| Increase (decrease) in net assets: | | | | | | | | | | | | |
| Operations: | | | | | | | | | | | | |
| Net investment income (loss) | $ | (746,135 | ) | $ | 2,568,270 | | $ | 5,813,730 | | $ | 21,589,885 | |
| Net realized gain (loss) | | (255,523 | ) | | (16,073,620 | ) | | 33,257,725 | | | 72,307,244 | |
| Net change in unrealized appreciation | | | | | | | | | | | | |
| (depreciation) | | (52,835,158 | ) | | 7,258,342 | | | (227,579,915 | ) | | (94,006,113 | ) |
| Net increase (decrease) in net assets | | | | | | | | | | | | |
| resulting from operations | | (53,836,816 | ) | | (6,247,008 | ) | | (188,508,460 | ) | | (108,984 | ) |
| Distributions to shareholders from: | | | | | | | | | | | | |
| Net investment income: | | | | | | | | | | | | |
| Class A | | (19,599 | ) | | (559,559 | ) | | (2,548,731 | ) | | (3,103,197 | ) |
| Class C | | — | | | — | | | (49,994 | ) | | (290,738 | ) |
| Class R | | (243 | ) | | (127 | ) | | (41,028 | ) | | (85,742 | ) |
| Class R6 | | (635,959 | ) | | (33,485 | ) | | (7,578,966 | ) | | (5,783,528 | ) |
| Advisor Class | | (463,438 | ) | | (706,064 | ) | | (20,608,922 | ) | | (17,433,391 | ) |
| Net realized gains: | | | | | | | | | | | | |
| Class A | | — | | | (1,094,749 | ) | | (3,890,324 | ) | | (18,341,270 | ) |
| Class C | | — | | | (36,330 | ) | | (550,381 | ) | | (2,618,898 | ) |
| Class R | | — | | | (1,413 | ) | | (108,438 | ) | | (596,708 | ) |
| Class R6 | | — | | | (29,123 | ) | | (8,026,305 | ) | | (28,814,214 | ) |
| Advisor Class | | — | | | (753,627 | ) | | (24,148,351 | ) | | (90,782,393 | ) |
| Total distributions to shareholders | | (1,119,239 | ) | | (3,214,477 | ) | | (67,551,440 | ) | | (167,850,079 | ) |
| Capital share transactions: (Note 2) | | | | | | | | | | | | |
| Class A | | (660,445 | ) | | 6,542,877 | | | (1,442,909 | ) | | (19,708,559 | ) |
| Class C | | 183,020 | | | 1,387,807 | | | (724,635 | ) | | (1,892,510 | ) |
| Class R | | 37,690 | | | 149,936 | | | (334,865 | ) | | (2,279,156 | ) |
| Class R6 | | (1,623,353 | ) | | 111,559,370 | | | 57,900,354 | | | 61,632,530 | |
| Advisor Class | | (1,104,120 | ) | | 31,940,817 | | | 18,208,606 | | | 181,833,650 | |
| Total capital share transactions | | (3,167,208 | ) | | 151,580,807 | | | 73,606,551 | | | 219,585,955 | |
| Net increase (decrease) in net assets | | (58,123,263 | ) | | 142,119,322 | | | (182,453,349 | ) | | 51,626,892 | |
| Net assets: | | | | | | | | | | | | |
| Beginning of period | | 454,447,145 | | | 312,327,823 | | | 1,936,979,400 | | | 1,885,352,508 | |
| End of period | $ | 396,323,882 | | $ | 454,447,145 | | $ | 1,754,526,051 | | $ | 1,936,979,400 | |
| Undistributed net investment income (distributions in | | | | | | | | | | | | |
| excess of net investment income) included in net | | | | | | | | | | | | |
| assets: | | | | | | | | | | | | |
| End of period | $ | (749,561 | ) | $ | 1,115,813 | | $ | (16,264,657 | ) | $ | 8,749,254 | |
38 Semiannual Report | The accompanying notes are an integral part of these financial statements. franklintempleton.com
FRANKLIN GLOBAL TRUST
Notes to Financial Statements (unaudited)
1. Organization and Significant Accounting Policies
Franklin Global Trust (Trust) is registered under the Investment Company Act of 1940 (1940 Act) as an open-end management investment company, consisting of six separate funds, two of which are included in this report (Funds) and applies the specialized accounting and reporting guidance in U.S. Generally Accepted Accounting Principles (U.S. GAAP). The financial statements of the remaining funds in the Trust are presented separately. The Funds offer five classes of shares: Class A, Class C, Class R, Class R6 and Advisor Class. Each class of shares differs by its initial sales load, contingent deferred sales charges, voting rights on matters affecting a single class, its exchange privilege and fees primarily due to differing arrangements for distribution and transfer agent fees. Franklin International Small Cap Growth Fund was closed to new investors effective June 3, 2013.
The following summarizes the Funds’ significant accounting policies.
a. Financial Instrument Valuation
The Funds’ investments in financial instruments are carried at fair value daily. Fair value is the price that would be received to sell an asset or paid to transfer a liability in an orderly transaction between market participants on the measurement date. The Funds calculate the net asset value (NAV) per share as of 4 p.m. Eastern time each day the New York Stock Exchange (NYSE) is open for trading. Under compliance policies and procedures approved by the Trust’s Board of Trustees (the Board), the Funds’ administrator has responsibility for oversight of valuation, including leading the cross-functional Valuation and Liquidity Oversight Committee (VLOC). The VLOC provides administration and oversight of the Funds’ valuation policies and procedures, which are approved annually by the Board. Among other things, these procedures allow the Funds to utilize independent pricing services, quotations from securities and financial instrument dealers, and other market sources to determine fair value.
Equity securities listed on an exchange or on the NASDAQ National Market System are valued at the last quoted sale price or the official closing price of the day, respectively. Foreign equity securities are valued as of the close of trading on the foreign stock exchange on which the security is primarily traded or as 4 p.m. Eastern time, whichever is earlier. The value is then converted into its U.S. dollar equivalent at the foreign exchange rate in effect at 4 p.m. Eastern time on the day that the value of the security is determined. Over-the-counter (OTC) securities are valued within the range of the most recent quoted bid and ask prices. Securities that trade in multiple markets or on multiple exchanges are valued according to the broadest and most representative market. Certain equity securities are valued based upon fundamental characteristics or relationships to similar securities.
Investments in open-end mutual funds are valued at the closing NAV. Time deposits are valued at cost, which approximates fair value.
The Funds have procedures to determine the fair value of financial instruments for which market prices are not reliable or readily available. Under these procedures, the VLOC convenes on a regular basis to review such financial instruments and considers a number of factors, including significant unobservable valuation inputs, when arriving at fair value. The VLOC primarily employs a market-based approach which may use related or comparable assets or liabilities, recent transactions, market multiples, book values, and other relevant information for the investment to determine the fair value of the investment. An income-based valuation approach may also be used in which the anticipated future cash flows of the investment are discounted to calculate fair value. Discounts may also be applied due to the nature or duration of any restrictions on the disposition of the investments. Due to the inherent uncertainty of valuations of such investments, the fair values may differ significantly from the values that would have been used had an active market existed. The VLOC employs various methods for calibrating these valuation approaches including a regular review of key inputs and assumptions, transactional back-testing or disposition analysis, and reviews of any related market activity.
Trading in securities on foreign securities stock exchanges and OTC markets may be completed before 4 p.m. Eastern time. In addition, trading in certain foreign markets may not take place on every NYSE business day. Occasionally, events occur between the time at which trading in a foreign security is completed and the close of the NYSE that might call into question the reliability of the value of a portfolio security held by the Fund. As a result, differences may arise between the value of the Funds’ portfolio securities as determined at the foreign market close and the latest indications of value at the close of the NYSE. In order to minimize the potential for these differences, the VLOC monitors price movements following the
franklintempleton.com
Semiannual Report 39
FRANKLIN GLOBAL TRUST
NOTES TO FINANCIAL STATEMENTS (UNAUDITED)
1. Organization and Significant Accounting
Policies (continued)
a. Financial Instrument Valuation (continued)
close of trading in foreign stock markets through a series of country specific market proxies (such as baskets of American Depositary Receipts, futures contracts and exchange traded funds). These price movements are measured against established trigger thresholds for each specific market proxy to assist in determining if an event has occurred that may call into question the reliability of the values of the foreign securities held by the Funds. If such an event occurs, the securities may be valued using fair value procedures, which may include the use of independent pricing services.
When the last day of the reporting period is a non-business day, certain foreign markets may be open on those days that the NYSE is closed, which could result in differences between the value of the Funds’ portfolio securities on the last business day and the last calendar day of the reporting period. Any significant security valuation changes due to an open foreign market are adjusted and reflected by the Funds for financial reporting purposes.
b. Foreign Currency Translation
Portfolio securities and other assets and liabilities denominated in foreign currencies are translated into U.S. dollars based on the exchange rate of such currencies against U.S. dollars on the date of valuation. The Funds may enter into foreign currency exchange contracts to facilitate transactions denominated in a foreign currency. Purchases and sales of securities, income and expense items denominated in foreign currencies are translated into U.S. dollars at the exchange rate in effect on the transaction date. Portfolio securities and assets and liabilities denominated in foreign currencies contain risks that those currencies will decline in value relative to the U.S. dollar. Occasionally, events may impact the availability or reliability of foreign exchange rates used to convert the U.S. dollar equivalent value. If such an event occurs, the foreign exchange rate will be valued at fair value using procedures established and approved by the Board.
The Funds do not separately report the effect of changes in foreign exchange rates from changes in market prices on securities held. Such changes are included in net realized and unrealized gain or loss from investments in the Statements of Operations.
Realized foreign exchange gains or losses arise from sales of foreign currencies, currency gains or losses realized between the trade and settlement dates on securities transactions and the difference between the recorded amounts of dividends, interest, and foreign withholding taxes and the U.S. dollar equivalent of the amounts actually received or paid. Net unrealized foreign exchange gains and losses arise from changes in foreign exchange rates on foreign denominated assets and liabilities other than investments in securities held at the end of the reporting period.
c. Income and Deferred Taxes
It is each Fund’s policy to qualify as a regulated investment company under the Internal Revenue Code. Each Fund intends to distribute to shareholders substantially all of its taxable income and net realized gains to relieve it from federal income and excise taxes. As a result, no provision for U.S. federal income taxes is required.
The Funds may be subject to foreign taxation related to income received, capital gains on the sale of securities and certain foreign currency transactions in the foreign jurisdictions in which the Funds invest. Foreign taxes, if any, are recorded based on the tax regulations and rates that exist in the foreign markets in which the Funds invest. When a capital gain tax is determined to apply, certain or all Funds record an estimated deferred tax liability in an amount that would be payable if the securities were disposed of on the valuation date. As a result of several court cases, in certain countries across the European Union, the Funds have filed additional tax reclaims for previously withheld taxes on dividends earned in those countries. These additional filings are subject to various administrative proceedings by the local jurisdictions’ tax authorities within the European Union, as well as a number of related judicial proceedings. During the period ended January 31, 2016, Franklin International Growth Fund and Franklin International Small Cap Growth Fund recognized $42,210 and $477,558, respectively, from Finland and Sweden for previously withheld foreign taxes and interest on such taxes. These amounts are reflected as other income and interest in the Statements of Operations. In regards to filings in other European Union countries, uncertainty exists as to the ultimate resolution of these proceedings, the likelihood of receipt of these reclaims, and the potential timing of payment, and accordingly, no amounts are reflected in the financial statements.
40 Semiannual Report
franklintempleton.com
FRANKLIN GLOBAL TRUST
NOTES TO FINANCIAL STATEMENTS (UNAUDITED)
Each Fund may recognize an income tax liability related to its uncertain tax positions under U.S. GAAP when the uncertain tax position has a less than 50% probability that it will be sustained upon examination by the tax authorities based on its technical merits. As of January 31, 2016, each Fund has determined that no tax liability is required in its financial statements related to uncertain tax positions for any open tax years (or expected to be taken on future tax returns). Open tax years are those that remain subject to examination and are based on each tax jurisdiction’s statute of limitation.
d. Security Transactions, Investment Income, Expenses and Distributions
Security transactions are accounted for on trade date. Realized gains and losses on security transactions are determined on a specific identification basis. Interest income and estimated expenses are accrued daily. Dividend income is recorded on the ex-dividend date except for certain dividends from foreign securities where the dividend rate is not available. In such cases, the dividend is recorded as soon as the information is received by the Funds. Distributions to shareholders are recorded on the ex-dividend date and are determined according to income tax regulations (tax basis). Distributable earnings determined on a tax basis may differ from earnings recorded in accordance with U.S. GAAP. These differences may be permanent or temporary. Permanent differences are reclassified among capital accounts to reflect their tax character. These reclassifications have no impact on net assets or the results of operations. Temporary differences are not reclassified, as they may reverse in subsequent periods.
Common expenses incurred by the Trust are allocated among the Funds based on the ratio of net assets of each Fund to the combined net assets of the Trust. Fund specific expenses are charged directly to the fund that incurred the expense.
Realized and unrealized gains and losses and net investment income, not including class specific expenses, are allocated daily to each class of shares based upon the relative proportion of net assets of each class. Differences in per share distributions, by class, are generally due to differences in class specific expenses.
e. Accounting Estimates
The preparation of financial statements in accordance with U.S. GAAP requires management to make estimates and assumptions that affect the reported amounts of assets and liabilities at the date of the financial statements and the amounts of income and expenses during the reporting period. Actual results could differ from those estimates.
f. Guarantees and Indemnifications
Under the Trust’s organizational documents, its officers and trustees are indemnified by the Trust against certain liabilities arising out of the performance of their duties to the Trust. Additionally, in the normal course of business, the Trust, on behalf of the Funds, enters into contracts with service providers that contain general indemnification clauses. The Trust’s maximum exposure under these arrangements is unknown as this would involve future claims that may be made against the Trust that have not yet occurred. Currently, the Trust expects the risk of loss to be remote.
franklintempleton.com
Semiannual Report 41
FRANKLIN GLOBAL TRUST
NOTES TO FINANCIAL STATEMENTS (UNAUDITED)
2. Shares of Beneficial Interest
At January 31, 2016, there were an unlimited number of shares authorized (without par value). Transactions in the Funds’ shares were as follows:
| | | | | | | | | | | |
| | Franklin International | | Franklin International | |
| | Growth Fund | | | Small Cap Growth Fund | |
| | Shares | | | Amount | | Shares | | | Amount | |
| Class A Shares: | | | | | | | | | | | |
| Six Months ended January 31, 2016 | | | | | | | | | | | |
| Shares sold | 1,469,086 | | $ | 15,382,829 | | 478,105 | | $ | 8,978,717 | |
| Shares issued in reinvestment of distributions | 537 | | | | 5,630 | | 342,933 | | | 6,292,826 | |
| Shares redeemed | (1,535,044 | ) | | (16,048,904 | ) | (892,912 | ) | | (16,714,452 | ) |
| Net increase (decrease) | (65,421 | ) | $ | (660,445 | ) | (71,874 | ) | $ | (1,442,909 | ) |
| Year ended July 31, 2015 | | | | | | | | | | | |
| Shares sold | 3,542,988 | | $ | 39,270,767 | | 1,385,196 | | $ | 27,070,227 | |
| Shares issued in reinvestment of distributions | 41,861 | | | 430,752 | | 1,186,622 | | | 21,003,206 | |
| Shares redeemed | (2,987,861 | ) | | (33,158,642 | ) | (3,471,808 | ) | | (67,781,992 | ) |
| Net increase (decrease) | 596,988 | | $ | 6,542,877 | | (899,990 | ) | $ | (19,708,559 | ) |
| Class C Shares: | | | | | | | | | | | |
| Six Months ended January 31, 2016 | | | | | | | | | | | |
| Shares sold | 128,634 | | $ | 1,323,822 | | 42,735 | | $ | 799,273 | |
| Shares issued in reinvestment of distributions | — | | | | — | | 31,063 | | | 565,353 | |
| Shares redeemed | (114,281 | ) | | (1,140,802 | ) | (112,170 | ) | | (2,089,261 | ) |
| Net increase (decrease) | 14,353 | | $ | 183,020 | | (38,372 | ) | $ | (724,635 | ) |
| Year ended July 31, 2015 | | | | | | | | | | | |
| Shares sold | 264,704 | | $ | 2,936,047 | | 115,517 | | $ | 2,248,839 | |
| Shares issued in reinvestment of distributions | 3,580 | | | | 36,263 | | 157,106 | | | 2,747,790 | |
| Shares redeemed | (145,230 | ) | | (1,584,503 | ) | (355,722 | ) | | (6,889,139 | ) |
| Net increase (decrease) | 123,054 | | $ | 1,387,807 | | (83,099 | ) | $ | (1,892,510 | ) |
| Class R Shares: | | | | | | | | | | | |
| Six Months ended January 31, 2016 | | | | | | | | | | | |
| Shares sold | 3,963 | | | $ | 41,552 | | 23,055 | | $ | 434,065 | |
| Shares issued in reinvestment of distributions | 23 | | | | 243 | | 8,123 | | | 149,466 | |
| Shares redeemed | (409 | ) | | | (4,105 | ) | (48,929 | ) | | (918,396 | ) |
| Net increase (decrease) | 3,577 | | | $ | 37,690 | | (17,751 | ) | $ | (334,865 | ) |
| Year ended July 31, 2015 | | | | | | | | | | | |
| Shares sold | 15,670 | | $ | 179,041 | | 67,056 | | $ | 1,322,293 | |
| Shares issued in reinvestment of distributions | 150 | | | | 1,540 | | 38,578 | | | 682,450 | |
| Shares redeemed | (2,780 | ) | | | (30,645 | ) | (214,071 | ) | | (4,283,899 | ) |
| Net increase (decrease) | 13,040 | | $ | 149,936 | | (108,437 | ) | $ | (2,279,156 | ) |
42 Semiannual Report
franklintempleton.com
| | | | | | | | | | |
| | | | | | | FRANKLIN GLOBAL TRUST | |
| | NOTES TO FINANCIAL STATEMENTS (UNAUDITED) | |
| |
| |
| |
| |
| | Franklin International | | Franklin International | |
| | Growth Fund | | Small Cap Growth Fund | |
| | Shares | | | Amount | | Shares | | | Amount | |
| Class R6 Shares: | | | | | | | | | | |
| Six Months ended January 31, 2016 | | | | | | | | | | |
| Shares sold | 180,775 | | $ | 1,866,008 | | 2,947,052 | | $ | 56,324,450 | |
| Shares issued in reinvestment of distributions | 58,126 | | | 612,647 | | 845,547 | | | 15,532,698 | |
| Shares redeemed | (384,187 | ) | | (4,102,008 | ) | (715,446 | ) | | (13,956,794 | ) |
| Net increase (decrease) | (145,286 | ) | $ | (1,623,353 | ) | 3,077,153 | | $ | 57,900,354 | |
| Year ended July 31, 2015 | | | | | | | | | | |
| Shares sold | 12,016,602 | | $ | 137,428,678 | | 2,340,760 | | $ | 48,541,785 | |
| Shares issued in reinvestment of distributions | 2 | | | 16 | | 1,948,071 | | | 34,597,741 | |
| Shares redeemed | (2,290,941 | ) | | (25,869,324 | ) | (1,067,515 | ) | | (21,506,996 | ) |
| Net increase (decrease) | 9,725,663 | | $ | 111,559,370 | | 3,221,316 | | $ | 61,632,530 | |
| Advisor Class Shares: | | | | | | | | | | |
| Six Months ended January 31, 2016 | | | | | | | | | | |
| Shares sold | 1,656,393 | | $ | 17,164,156 | | 5,070,980 | | $ | 95,109,971 | |
| Shares issued in reinvestment of distributions | 2,228 | | | 23,461 | | 2,273,840 | | | 41,770,429 | |
| Shares redeemed | (1,731,576 | ) | | (18,291,737 | ) | (6,406,836 | ) | | (118,671,794 | ) |
| Net increase (decrease) | (72,955 | ) | $ | (1,104,120 | ) | 937,984 | | $ | 18,208,606 | |
| Year ended July 31, 2015 | | | | | | | | | | |
| Shares sold | 6,836,693 | | $ | 76,040,035 | | 23,635,977 | | $ | 455,113,062 | |
| Shares issued in reinvestment of distributions | 88,125 | | | 911,216 | | 5,783,456 | | | 102,656,340 | |
| Shares redeemed | (4,168,896 | ) | | (45,010,434 | ) | (19,247,355 | ) | | (375,935,752 | ) |
| Net increase (decrease) | 2,755,922 | | $ | 31,940,817 | | 10,172,078 | | $ | 181,833,650 | |
3. Transactions with Affiliates
Franklin Resources, Inc. is the holding company for various subsidiaries that together are referred to as Franklin Templeton Investments. Certain officers and trustees of the Trust are also officers and/or directors of the following subsidiaries:
| |
| Subsidiary | Affiliation |
| Franklin Advisers, Inc. (Advisers) | Investment manager |
| Franklin Templeton Institutional, LLC (FT Institutional) | Investment manager |
| Franklin Templeton Services, LLC (FT Services) | Administrative manager |
| Franklin Templeton Distributors, Inc. (Distributors) | Principal underwriter |
| Franklin Templeton Investor Services, LLC (Investor Services) | Transfer agent |
franklintempleton.com
Semiannual Report 43
FRANKLIN GLOBAL TRUST
NOTES TO FINANCIAL STATEMENTS (UNAUDITED)
| 3. | Transactions with Affiliates (continued) |
| a. | Management Fees |
Franklin International Growth Fund pays an investment management fee to FT Institutional based on the average daily net assets of the Fund as follows:
| | |
| Annualized Fee Rate | | Net Assets |
| 0.950 | % | Up to and including $500 million |
| 0.850 | % | Over $500 million, up to and including $1 billion |
| 0.800 | % | Over $1 billion, up to and including $1.5 billion |
| 0.750 | % | Over $1.5 billion, up to and including $6.5 billion |
| 0.725 | % | Over $6.5 billion, up to and including $11.5 billion |
| 0.700 | % | Over $11.5 billion, up to and including $16.5 billion |
| 0.690 | % | Over $16.5 billion, up to and including $19 billion |
| 0.680 | % | Over $19 billion, up to and including $21.5 billion |
| 0.670 | % | In excess of $21.5 billion |
Franklin International Small Cap Growth Fund pays an investment management fee to Advisers of 0.95% per year of the average daily net assets of the Fund.
Under a subadvisory agreement, FT Institutional, an affiliate of Advisers, provides subadvisory services to Franklin International Small Cap Growth Fund. The subadvisory fee is paid by Advisers based on Fund’s average daily net assets, and is not an additional expense of the Fund.
b. Administrative Fees
Under an agreement with FT Institutional and Advisers, FT Services provides administrative services to the Funds. The fee is paid by FT Institutional and Advisers based on each of the Funds’ average daily net assets, and is not an additional expense of the Funds.
c. Distribution Fees
The Board has adopted distribution plans for each share class, with the exception of Class R6 and Advisor Class shares, pursuant to Rule 12b-1 under the 1940 Act. Under the Funds’ Class A reimbursement distribution plans, the Funds reimburse Distributors for costs incurred in connection with the servicing, sale and distribution of each Fund’s shares up to the maximum annual plan rate for each class. Under the Class A reimbursement distribution plans, costs exceeding the maximum for the current plan year cannot be reimbursed in subsequent periods. In addition, under the Funds’ Class C and R compensation distribution plans, the Funds pay Distributors for costs incurred in connection with the servicing, sale and distribution of each Fund’s shares up to the maximum annual plan rate for each class. The plan year, for purposes of monitoring compliance with the maximum annual plan rates, is February 1 through January 31 for each Fund.
44 Semiannual Report
franklintempleton.com
FRANKLIN GLOBAL TRUST
NOTES TO FINANCIAL STATEMENTS (UNAUDITED)
| | | | |
| The maximum annual plan rates, based on the average daily net assets, for each class, are as follows: | | | |
| |
| | | | Franklin | |
| | Franklin | | International | |
| | International | | Small Cap | |
| | Growth Fund | | Growth Fund | |
| |
| Reimbursement Plans: | | | | |
| Class A. | 0.35 | % | 0.35 | % |
| Compensation Plans: | | | | |
| Class C. | 1.00 | % | 1.00 | % |
| Class R. | 0.50 | % | 0.50 | % |
The Board has set the current rate at 0.25% per year for Class A shares, effective August 1, 2015, until further notice and approval by the Board. Prior to August 1, 2015, the Board had set the rate at 0.30% per year for Class A shares.
d. Sales Charges/Underwriting Agreements
Front-end sales charges and contingent deferred sales charges (CDSC) do not represent expenses of the Funds. These charges are deducted from the proceeds of sales of fund shares prior to investment or from redemption proceeds prior to remittance, as applicable. Distributors has advised the Funds of the following commission transactions related to the sales and redemptions of the Funds’ shares for the period:
| | | | |
| | | | | Franklin |
| | | Franklin | | International |
| | | International | | Small Cap |
| | | Growth Fund | | Growth Fund |
| |
| Sales charges retained net of commissions paid to | | | | |
| unaffiliated brokers/dealers | $ | 12,315 | $ | 8,985 |
| CDSC retained | $ | 2,389 | $ | 546 |
e. Transfer Agent Fees
Each class of shares, except for Class R6, pays transfer agent fees to Investor Services for its performance of shareholder servicing obligations and reimburses Investor Services for out of pocket expenses incurred, including shareholding servicing fees paid to third parties. These fees are allocated daily based upon their relative proportion of such classes’ aggregate net assets. Class R6 pays Investor Services transfer agent fees specific to that class.
For the period ended January 31, 2016, the Funds paid transfer agent fees as noted in the Statements of Operations of which the following amounts were retained by Investor Services:
| | | | |
| | | | | Franklin |
| | | Franklin | | International |
| | | International | | Small Cap |
| | | Growth Fund | | Growth Fund |
| |
| Transfer agent fees | $ | 352,699 | $ | 456,833 |
franklintempleton.com
Semiannual Report 45
FRANKLIN GLOBAL TRUST
NOTES TO FINANCIAL STATEMENTS (UNAUDITED)
| 3. | Transactions with Affiliates (continued) |
| f. | Investments in Affiliated Management Investment Companies |
Certain or all Funds invest in an affiliated management investment company for purposes other than exercising a controlling influence over the management or policies. Management fees paid by the Funds are waived on assets invested in the affiliated management investment company, as noted in the Statements of Operations, in an amount not to exceed the management and administrative fees paid directly or indirectly by each affiliate. Prior to August 1, 2013, the waiver was accounted for as a reduction to management fees.
| | | | | | | | | | | |
| | | | | | | | | | | % of | |
| | | | | | | | | | | Affiliated | |
| | Number of | | | | Number of | | | | | Fund Shares | |
| | Shares Held | | | | Shares | | Value | | | Outstanding | |
| | at Beginning | Gross | Gross | | Held at End | | at End | Investment | Realized | Held at End | |
| | of Period | Additions | Reductions | | of Period | | of Period | Income | Gain (Loss) | of Period | |
| |
| Franklin International Growth Fund | | | | | | | | | | | |
| Non-Controlled Affiliates | | | | | | | | | | | |
| Institutional Fiduciary Trust Money Market | | | | | | | | | | | |
| Portfolio | 12,645,481 | 44,950,188 | (51,431,165 | ) | 6,164,504 | $ | 6,164,504 | $ — | $ — | 0.04 | % |
g. Waiver and Expense Reimbursements
FT Institutional and Investor Services have contractually agreed in advance to waive or limit their respective fees and to assume as their own expense certain expenses otherwise payable by Franklin International Growth Fund so that the expenses (excluding distribution fees, and acquired fund fees and expenses) for Class A, Class C, Class R and Advisor Class of the Fund do not exceed 1.19% and Class R6 does not exceed 1.00% based on the average net assets of each class (other than certain non-routine expenses or costs, including those relating to litigation, indemnification, reorganizations, and liquidations) until November 30, 2016.
h. Other Affiliated Transactions
At January 31, 2016, one or more of the funds in Franklin Fund Allocator Series owned a percentage of the following Funds’ outstanding shares:
| | | |
| | | Franklin | |
| Franklin | | International | |
| International | | Small Cap | |
| Growth Fund | | Growth Fund | |
| |
| 20.88 | % | 15.36 | % |
4. Expense Offset Arrangement
The Funds have entered into an arrangement with their custodian whereby credits realized as a result of uninvested cash balances are used to reduce a portion of the Funds’ custodian expenses. During the period ended January 31, 2016, the custodian fees were reduced as noted in the Statements of Operations.
46 Semiannual Report
franklintempleton.com
FRANKLIN GLOBAL TRUST
NOTES TO FINANCIAL STATEMENTS (UNAUDITED)
5. Income Taxes
For tax purposes, capital losses may be carried over to offset future capital gains, if any. At July 31, 2015, the capital loss carryforwards were as follows:
| | |
| | | Franklin |
| | | International |
| | | Growth Fund |
| Capital loss carryforwards: | | |
| Short term | $ | 1,813,884 |
| Long term | | 10,514,113 |
| Total capital loss carryforwards | $ | 12,327,997 |
At January 31, 2016, the cost of investments and net unrealized appreciation (depreciation) for income tax purposes were as follows:
| | | | | | |
| | | | | | Franklin | |
| | | Franklin | | | International | |
| | | International | | | Small Cap | |
| | | Growth Fund | | | Growth Fund | |
| |
| Cost of investments | $ | 415,526,580 | | $ | 1,777,376,630 | |
| |
| Unrealized appreciation | $ | 39,433,680 | | $ | 243,900,258 | |
| Unrealized depreciation | | (59,649,406 | ) | | (265,544,669 | ) |
| Net unrealized appreciation (depreciation) | $ | (20,215,726 | ) | $ | (21,644,411 | ) |
Differences between income and/or capital gains as determined on a book basis and a tax basis are primarily due to differing treatments of foreign currency transactions, passive foreign investment company shares and wash sales.
6. Investment Transactions
Purchases and sales of investments (excluding short term securities) for the period ended January 31, 2016, were as follows:
| | | | |
| | | | | Franklin |
| | | Franklin | | International |
| | | International | | Small Cap |
| | | Growth Fund | | Growth Fund |
| |
| Purchases | $ | 60,377,162 | $ | 286,549,710 |
| Sales. | $ | 61,456,372 | $ | 199,335,377 |
7. Concentration of Risk
Investing in foreign securities may include certain risks and considerations not typically associated with investing in U.S. securities, such as fluctuating currency values and changing local and regional economic, political and social conditions, which may result in greater market volatility. In addition, certain foreign securities may not be as liquid as U.S. securities.
franklintempleton.com
Semiannual Report 47
FRANKLIN GLOBAL TRUST
NOTES TO FINANCIAL STATEMENTS (UNAUDITED)
8. Holdings of 5% Voting Securities of Portfolio Companies
The 1940 Act defines "affiliated companies" to include investments in portfolio companies in which a fund owns 5% or more of the outstanding voting securities. Investments in "affiliated companies" for Franklin International Small Cap Growth Fund for the period ended January 31, 2016, were as shown below.
| | | | | | | | | | | | |
| | Number of | | | | | Number of | | | | | | Realized |
| | Shares Held | | | | | Shares | | Value at | | | | Capital |
| | at Beginning | Gross | | Gross | | Held at End | | End of | | Investment | | Gain |
| Name of Issuer | of Period | Additions | | Reductions | | of Period | | Period | | Income | | (Loss) |
| Non-Controlled Affiliates | | | | | | | | | | | | |
| Aderans Co. Ltd | 3,568,500 | — | | — | | 3,568,500 | $ | 17,656,794 | $ | — | $ | — |
| Carpetright PLC | 6,064,925 | — | | — | | 6,064,925 | | 33,942,299 | | — | | — |
| Diana Shipping Inc | — | 7,451,400 | | — | | 7,451,400 | | 18,628,500 | | — | | — |
| Green REIT PLC | 38,429,481 | — | | — | | 38,429,481 | | 62,451,751 | | 614,872 | | — |
| Headlam Group PLC | 4,886,688 | — | | — | | 4,886,688 | | 34,189,735 | | 293,201 | | — |
| Irish Residential Properties REIT | | | | | | | | | | | | |
| PLC | 11,125,000 | — | | — | | 11,125,000 | | 13,318,372 | | 22,240 | | — |
| Irish Residential Properties REIT | | | | | | | | | | | | |
| PLC, 144A | 20,000,000 | — | | — | | 20,000,000 | | 23,943,141 | | 39,981 | | — |
| Lar Espana Real Estate Socimi SA . | 2,504,000 | 2,089,500 | a | — | | 4,593,500 | | 43,794,062 | | — | | — |
| Lar Espana Real Estate Socimi SA | | | | | | | | | | | | |
| (interim line) | 2,089,500 | — | | (2,089,500 | )b | — | | — | | — | | — |
| Total Affiliated Securities (Value is 14.13% of Net Assets) | | | | | $ | 247,924,654 | $ | 970,294 | $ | — |
aGross addition was the result of a corporate action.
bGross reduction was the result of a corporate action.
9. Credit Facility
Certain or all Funds, together with other U.S. registered and foreign investment funds (collectively, Borrowers), managed by Franklin Templeton Investments, are borrowers in a joint syndicated senior unsecured credit facility totaling $2 billion (Global Credit Facility) which matured on February 12, 2016. This Global Credit Facility provides a source of funds to the Borrowers for temporary and emergency purposes, including the ability to meet future unanticipated or unusually large redemption requests. Effective February 12, 2016, the Borrowers renewed the Global Credit Facility for a one year term, maturing February 10, 2017, for a total of $2 billion.
Under the terms of the Global Credit Facility, the Funds shall, in addition to interest charged on any borrowings made by the Funds and other costs incurred by the Funds, pay their share of fees and expenses incurred in connection with the implementation and maintenance of the Global Credit Facility, based upon their relative share of the aggregate net assets of all of the Borrowers, including an annual commitment fee of 0.07% based upon the unused portion of the Global Credit Facility. Effective February 12, 2016, the annual commitment fee is 0.15%. These fees are reflected in other expenses in the Statements of Operations. During the period ended January 31, 2016, the Funds did not use the Global Credit Facility.
10. Fair Value Measurements
The Funds follow a fair value hierarchy that distinguishes between market data obtained from independent sources (observable inputs) and the Funds’ own market assumptions (unobservable inputs). These inputs are used in determining the value of the Funds’ financial instruments and are summarized in the following fair value hierarchy:
• Level 1 – quoted prices in active markets for identical financial instruments
48 Semiannual Report
franklintempleton.com
FRANKLIN GLOBAL TRUST
NOTES TO FINANCIAL STATEMENTS (UNAUDITED)
- Level 2 – other significant observable inputs (including quoted prices for similar financial instruments, interest rates, prepayment speed, credit risk, etc.)
- Level 3 – significant unobservable inputs (including the Funds’ own assumptions in determining the fair value of financial instruments)
The input levels are not necessarily an indication of the risk or liquidity associated with financial instruments at that level.
For movements between the levels within the fair value hierarchy, the Funds have adopted a policy of recognizing the transfers as of the date of the underlying event which caused the movement.
A summary of inputs used as of January 31, 2016, in valuing the Funds’ assets carried at fair value, is as follows:
| | | | | | | | |
| | | Level 1 | | Level 2 | | Level 3 | | Total |
| Franklin International Growth Fund | | | | | | | | |
| Assets: | | | | | | | | |
| Investments in Securities: | | | | | | | | |
| Equity Investmentsa | $ | 389,146,350 | $ | — | $ | —b | $ | 389,146,350 |
| Short Term Investments | | 6,164,504 | | — | | — | | 6,164,504 |
| Total Investments in Securities | $ | 395,310,854 | $ | — | $ | — | $ | 395,310,854 |
| |
| Franklin International Small Cap Growth Fund | | | | | | | | |
| Assets: | | | | | | | | |
| Investments in Securities: | | | | | | | | |
| Equity Investmentsa | $ | 1,739,532,219 | $ | — | $ | — | $ | 1,739,532,219 |
| Short Term Investments | | — | | 16,200,000 | | — | | 16,200,000 |
| Total Investments in Securities | $ | 1,739,532,219 | $ | 16,200,000 | $ | — | $ | 1,755,732,219 |
| |
| aFor detailed categories, see the accompanying Statement of Investments. | | | | | | | | |
| bIncludes securities determined to have no value at January 31, 2016. | | | | | | | | |
11. Subsequent Events
The Funds have evaluated subsequent events through the issuance of the financial statements and determined that no events have occurred that require disclosure other than those already disclosed in the financial statements.
| |
| Abbreviations |
| |
| Selected Portfolio |
| ADR | American Depositary Receipt |
| ARM | Adjustable Rate Mortgage |
| REIT | Real Estate Investment Trust |
franklintempleton.com
Semiannual Report 49
FRANKLIN GLOBAL TRUST
Shareholder Information
Proxy Voting Policies and Procedures
The Trust’s investment manager has established Proxy Voting Policies and Procedures (Policies) that the Trust uses to determine how to vote proxies relating to portfolio securities. Shareholders may view the Trust’s complete Policies online at franklintempleton.com. Alternatively, shareholders may request copies of the Policies free of charge by calling the Proxy Group collect at (954) 527-7678 or by sending a written request to: Franklin Templeton Companies, LLC, 300 S.E. 2nd Street, Fort Lauderdale, FL 33301, Attention: Proxy Group. Copies of the Trust’s proxy voting records are also made available online at franklintempleton.com and posted on the U.S. Securities and Exchange Commission’s website at sec.gov and reflect the most recent 12-month period ended June 30.
Quarterly Statement of Investments
The Trust files a complete statement of investments with the U.S. Securities and Exchange Commission for the first and third quarters for each fiscal year on Form N-Q. Shareholders may view the filed Form N-Q by visiting the Commission’s website at sec.gov. The filed form may also be viewed and copied at the Commission’s Public Reference Room in Washington, DC. Information regarding the operations of the Public Reference Room may be obtained by calling (800) SEC-0330.
50 Semiannual Report
franklintempleton.com
This page intentionally left blank.
This page intentionally left blank.
| |
| Contents | |
| Semiannual Report | |
| Franklin Large Cap Equity Fund | 3 |
| Performance Summary | 7 |
| Your Fund’s Expenses | 10 |
| Financial Highlights and Statement of Investments | 12 |
| Financial Statements | 19 |
| Notes to Financial Statements | 23 |
| Shareholder Information | 30 |
Visit franklintempleton.com for fund updates, to access your account, or to find helpful financial planning tools.
2 Semiannual Report
franklintempleton.com
Semiannual Report
Franklin Large Cap Equity Fund
This semiannual report for Franklin Large Cap Equity Fund covers the period ended January 31, 2016. Effective at the close of market on December 10, 2015, the Fund closed to new investors. The Fund is expected to be reorganized into Franklin Growth Fund on or about March 11, 2016, subject to shareholder approval. The Fund reserves the right to change the aforementioned at any time.
Your Fund’s Goal and Main Investments
The Fund seeks long-term growth of principal and income through investing at least 80% of its net assets in equity securities of large capitalization companies, which are companies with market capitalization values within the top 50% of companies in the Russell 1000® Index at the time of purchase.1 The Fund attempts to minimize capital gains distributions.
Performance Overview
The Fund’s Class A shares had a cumulative total return of -11.73% for the six months under review. In comparison, the Fund’s benchmark, the Standard & Poor’s 500 Index (S&P 500®), which is a broad measure of U.S. stock performance, had a -6.77% total return.2 You can find the Fund’s long-term performance data in the Performance Summary beginning on page 7.
Performance data represent past performance, which does not guarantee future results. Investment return and principal value will fluctuate, and you may have a gain or loss when you sell your shares. Current performance may differ from figures shown. For most recent month-end performance, go to franklintempleton.com or call (800) 342-5236.
Economic and Market Overview
The U.S. economy grew moderately during the period ended January 31, 2016. The third and fourth quarters of 2015 experienced healthy consumer spending, slower export growth, and reduced state and local government spending. Non-manufacturing activities expanded, contributing to new jobs and
| | |
| Geographic Breakdown | | |
| 1/31/16 | | |
| | % of Total | |
| | Net Assets | |
| U.S. | 94.3 | % |
| U.K. | 1.5 | % |
| Singapore | 1.4 | % |
| Short-Term Investments & Other Net Assets | 2.8 | % |
helping drive down the unemployment rate to 4.9% at period-end, the lowest level in nearly eight years. At its December 2015 meeting, the Federal Reserve (Fed) raised its target range for the federal funds rate to 0.25%–0.50%, as policymakers cited the labor market’s considerable improvement and were reasonably confident that inflation would move back to the Fed’s 2% medium-term objective. The Fed kept its interest rate unchanged at its January meeting and indicated it would monitor global economic and financial developments and their implications on the labor market and inflation. The broad U.S. stock market, as measured by the S&P 500, declined for the six months ended January 31, 2016.
The global economy expanded moderately during the six-month period. Global developed and emerging market stocks, as measured by the MSCI All Country World Index, fell during the period mainly due to concerns about China’s slowing economy and tumbling stock market, declining commodity prices, geopolitical tensions in certain regions and ongoing uncertainty about the Fed’s timing for raising interest rates. In the period under review, oil prices declined sharply due to strong global supply that exceeded demand. Gold prices fell for most of the period but recovered in January. The U.S. dollar appreciated against most currencies, which reduced returns of many foreign assets in U.S. dollar terms.
In Europe, U.K. fourth-quarter economic growth gained momentum from the services sector. The eurozone grew slightly and generally benefited during the period from lower oil prices, a weaker euro that supported exports, the European Central Banks’s (ECB’s) accommodative policy and
1. The Russell 1000 Index is market capitalization weighted and measures performance of the largest companies in the Russell 3000 Index, which represent the majority of the
U.S. market’s total capitalization. Russell Investment Group is the source and owner of the trademarks, service marks and copyrights related to the Russell Indexes. Russell®
is a trademark of Russell Investment Group.
2. Source: Morningstar.
The index is unmanaged and includes reinvestment of any income or distributions. One cannot invest directly in an index, and an index is not representative of the Fund’s portfolio.
The dollar value, number of shares or principal amount, and names of all portfolio holdings are listed in the Fund’s Statement of Investments (SOI). The SOI
begins on page 16.
franklintempleton.com
Semiannual Report 3
FRANKLIN LARGE CAP EQUITY FUND
expectations of further ECB stimulus. Although the eurozone’s annual inflation rate declined early in the period, it rose during the rest of the period. The ECB maintained its benchmark interest rates although it reduced its bank deposit rate in December, seeking to boost the region’s slowing growth.
In Asia, preliminary estimates showed that Japan’s economy contracted in the fourth quarter after expanding in the third quarter, as private consumption and housing investment declined. The Bank of Japan (BOJ) took several actions during the period, including lowering its economic growth and inflation forecasts, and reorganizing its stimulus program to increase exposure to long-term government bonds and exchange-traded funds. In January, the BOJ introduced a negative interest rate on excess reserves kept by financial institutions with the central bank, in an effort to boost lending and support inflation. China’s economy expanded in the fourth quarter, but growth was less robust in 2015 than in 2014, as strength in services and consumption was offset by weakness in fixed-asset investment, imports and exports, and manufacturing. The People’s Bank of China (PBOC) cut its benchmark interest rate and reduced the banks’ cash reserve requirement. Toward period-end, the PBOC lowered short-term borrowing costs for smaller banks as part of its efforts to establish an interest rate corridor intended to help banks access funds in times of a liquidity crunch and to avoid heightened volatility in money market rates.
Investment Strategy
We are research-driven, fundamental investors, pursuing a blend of growth and value strategies. We use a top-down analysis of macroeconomic trends, industry sectors (with some consideration of the sector weightings in the Fund’s benchmark index) and industries combined with a bottom-up analysis of individual securities. In selecting investments for the Fund, we look for companies we believe are positioned for growth in revenues, earnings or assets, and are selling at reasonable prices. We also consider the dividend growth history. We employ a thematic approach to identify sectors that may benefit from longer term dynamic growth. Within these sectors, we consider the basic financial and operating strength and quality of a company and company management. The Fund, from time to time, may have significant positions in particular sectors. We also seek to identify companies that we believe are temporarily out of favor with investors but have a good intermediate- or long-term outlook.
| | |
| Top 10 Sectors/Industries | | |
| 1/31/16 | | |
| | % of Total | |
| | Net Assets | |
| Software | 7.6 | % |
| Biotechnology | 7.3 | % |
| Banks | 6.8 | % |
| Food & Staples Retailing | 5.1 | % |
| Oil, Gas & Consumable Fuels | 4.7 | % |
| Internet Software & Services | 4.6 | % |
| Insurance | 4.6 | % |
| Capital Markets | 4.3 | % |
| Textiles, Apparel & Luxury Goods | 4.2 | % |
| Chemicals | 4.0 | % |
Manager’s Discussion
During the six-month period, amid a market downturn driven by economic concerns about weaker global growth, nearly all sectors represented in the Fund’s portfolio detracted from absolute performance. Relative to the benchmark S&P 500, key detractors from the Fund’s performance included stock selection in the health care, industrials and consumer discretionary sectors.3 In consumer discretionary, our positions in pharmaceutical distributor McKesson and biopharmaceutical company Gilead Sciences hurt results. In general, the health care sector became subject to short-term selling after drug price controls became a topic of U.S. political debate. Following strong quarterly financial results issued in July, investor sentiment turned negative for McKesson as foreign exchange pressures and an important contract loss weakened shares. Also weighing on the stock were generic drug pricing weakness and a downbeat profit outlook for its current 2016 fiscal year. However, the company made several long-term strategic moves, including an acquisition that took place at the end of 2014 that we believe could give McKesson a platform to build a distribution network in Europe and the company’s well-positioned U.S. oncology specialty drug distribution business. Gilead is a research-based biopharmaceutical company that discovers, develops and commercializes innovative medicines. The company’s primary areas of focus include treatments for HIV and hepatitis. Gilead’s lucrative hepatitis C franchise was pressured by competitors, which drove down the stock price. In the industrials sector, railroad operator Union Pacific was hindered by weak rail volumes and cited energy volumes as a headwind
3. The health care sector comprises biotechnology, health care equipment and supplies, health care providers and services, health care technology, life sciences tools and
services, and pharmaceuticals in the SOI. The industrials sector comprises aerospace and defense, electrical equipment, industrial conglomerates, and road and rail in the
SOI. The consumer discretionary sector comprises hotels, restaurants and leisure; media; specialty retail; and textiles, apparel and luxury goods in the SOI.
4 Semiannual Report
franklintempleton.com
FRANKLIN LARGE CAP EQUITY FUND
in 2016. Despite the company’s challenges, we continue to believe Union Pacific is one of the strongest franchises among public railroads and its situation could improve if rail volumes start to stabilize. In consumer discretionary, Polaris Industries, an off-road vehicle manufacturer, was hurt by slowing demand, inventory adjustments and foreign currency exchange effects. In its latest fourth-quarter financial results, the company reported significantly slower growth in its all-terrain vehicle and snowmobile sales and sought to work through its higher inventory levels as demand declined. Outside of these sectors, another notable detractor was oil and natural gas exploration and production company Anadarko Petroleum. Falling oil prices continued to weigh on energy sector companies, including Anadarko, which hurt Fund performance. We eliminated our positions in Polaris and Anadarko as we believe these head-winds could persist into 2016.
In contrast, major contributors to the Fund’s relative performance included stock selection in the materials and financials sectors.4 Cytec Industries was a global specialty materials and chemicals company focused on developing, manufacturing and selling products for the aerospace, industrials, mining and plastics industries. During the period, the composites manufacturer was acquired by Solvay, a Belgian maker of chemicals and plastics. We sold our position at a premium in advance of the completion and consolidation of Cytec within Solvay. In financials, our position in Chubb Limited helped returns. Formerly ACE Limited, the company is a property and casualty insurer that acquired Chubb Corporation during the reporting period. In January, the newly merged company posted record property and casualty underwriting income for 2015. Outside of these sectors, notable contributors included Alphabet and NIKE. A holding company of various technology businesses, Alphabet (formerly Google) profited over several quarters from lower expenses and stronger advertising revenue and trends, which lifted its shares and benefited Fund performance. Shares of athletic apparel company NIKE hit an all-time high over the period, benefiting from a rise in worldwide future orders for its products and from profit margin improvements. A 2-for-1 stock split announced in December and a stock buyback plan approved the prior month also aided NIKE shares.
| | |
| Top 10 Equity Holdings | | |
| 1/31/16 | | |
| Company | % of Total | |
| Sector/Industry | Net Assets | |
| Alphabet Inc., C | 3.1 | % |
| Internet Software & Services | | |
| Apple Inc. | 3.1 | % |
| Technology Hardware, Storage & Peripherals | | |
| CVS Health Corp. | 2.9 | % |
| Food & Staples Retailing | | |
| BlackRock Inc. | 2.8 | % |
| Capital Markets | | |
| McKesson Corp. | 2.6 | % |
| Health Care Providers & Services | | |
| NIKE Inc., B | 2.6 | % |
| Textiles, Apparel & Luxury Goods | | |
| Starbucks Corp. | 2.5 | % |
| Hotels, Restaurants & Leisure | | |
| MetLife Inc. | 2.5 | % |
| Insurance | | |
| PepsiCo Inc. | 2.5 | % |
| Beverages | | |
| Danaher Corp. | 2.3 | % |
| Industrial Conglomerates | | |
Thank you for your participation in Franklin Large Cap Equity Fund. It has been a pleasure serving your investment needs.

4. The materials sector comprises chemicals in the SOI. The financials sector comprises banks, capital markets, consumer finance, insurance and real estate investment
trusts in the SOI.
See www.franklintempletondatasources.com for additional data provider information.
franklintempleton.com
Semiannual Report 5
FRANKLIN LARGE CAP EQUITY FUND
The foregoing information reflects our analysis, opinions and portfolio holdings as of January 31, 2016, the end of the reporting period. The way we implement our main investment strategies and the resulting portfolio holdings may change depending on factors such as market and economic conditions. These opinions may not be relied upon as investment advice or an offer for a particular security. The information is not a complete analysis of every aspect of any market, country, industry, security or the Fund. Statements of fact are from sources considered reliable, but the investment manager makes no representation or warranty as to their completeness or accuracy. Although historical performance is no guarantee of future results, these insights may help you understand our investment management philosophy.
6 Semiannual Report
franklintempleton.com
FRANKLIN LARGE CAP EQUITY FUND
Performance Summary as of January 31, 2016
Your dividend income will vary depending on dividends or interest paid by securities in the Fund’s portfolio, adjusted for operating expenses of each class. Capital gain distributions are net profits realized from the sale of portfolio securities. The performance table does not reflect any taxes that a shareholder would pay on Fund dividends, capital gain distributions, if any, or any realized gains on the sale of Fund shares. Total return reflects reinvestment of the Fund’s dividends and capital gain distributions, if any, and any unrealized gains or losses.
| | | | | | | | | | |
| Net Asset Value | | | | | | | | | | |
| |
| Share Class (Symbol) | | | | 1/31/16 | | | | 7/31/15 | | Change |
| A (FLCAX) | | | $ | 7.19 | | | $ | 8.45 | -$ | 1.26 |
| C (N/A) | | | $ | 6.95 | | | $ | 8.20 | -$ | 1.25 |
| R (N/A) | | | $ | 7.17 | | | $ | 8.43 | -$ | 1.26 |
| Advisor (FLCIX) | | | $ | 7.24 | | | $ | 8.51 | -$ | 1.27 |
| |
| |
| Distributions1 (8/1/15–1/31/16) | | | | | | | | | | |
| |
| | | Dividend | | | | Short-Term | | Long-Term | | |
| Share Class | | Income | | | | Capital Gain | | Capital Gain | | Total |
| A | $ | 0.0131 | | | $ | 0.0064 | $ | 0.2708 | $ | 0.2903 |
| C | | — | | | $ | 0.0064 | $ | 0.2708 | $ | 0.2772 |
| R | $ | 0.0025 | | | $ | 0.0064 | $ | 0.2708 | $ | 0.2797 |
| Advisor | $ | 0.0248 | | | $ | 0.0064 | $ | 0.2708 | $ | 0.3020 |
See page 9 for Performance Summary footnotes.
franklintempleton.com
Semiannual Report 7
FRANKLIN LARGE CAP EQUITY FUND
PERFORMANCE SUMMARY
Performance as of 1/31/162
Cumulative total return excludes sales charges. Average annual total returns and value of $10,000 investment include maximum sales charges. Class A: 5.75% maximum initial sales charge; Class C: contingent deferred sales charge in first year only;
Class R/Advisor Class: no sales charges.
| | | | | | | | | | | | |
| | | | | | | | Average Annual | | | | | |
| | Cumulative | | Average Annual | | | Value of $10,000 | Total Return | | Total Annual Operating Expenses7 | |
| Share Class | Total Return3 | | Total Return4 | | | Investment5 | (12/31/15 | )6 | (with waiver) | | (without waiver) | |
| A | | | | | | | | | 1.20 | % | 1.30 | % |
| 6-Month | -11.73 | % | -16.80 | % | $ | 8,320 | | | | | | |
| 1-Year | -3.42 | % | -8.98 | % | $ | 9,102 | -4.72 | % | | | | |
| 5-Year | +38.76 | % | -5.51 | % | $ | 13,078 | +7.60 | % | | | | |
| Since Inception (9/30/08) | +63.66 | % | +6.09 | % | $ | 15,425 | +7.28 | % | | | | |
| C | | | | | | | | | 1.95 | % | 2.05 | % |
| 6-Month | -12.12 | % | -12.96 | % | $ | 8,704 | | | | | | |
| 1-Year | -4.04 | % | -4.97 | % | $ | 9,503 | -0.62 | % | | | | |
| 5-Year | +34.54 | % | +6.11 | % | $ | 13,454 | +8.24 | % | | | | |
| Since Inception (9/30/08) | +56.38 | % | +6.28 | % | $ | 15,638 | +7.50 | % | | | | |
| R | | | | | | | | | 1.45 | % | 1.55 | % |
| 6-Month | -11.88 | % | -11.88 | % | $ | 8,812 | | | | | | |
| 1-Year | -3.77 | % | -3.77 | % | $ | 9,623 | +0.75 | % | | | | |
| 5-Year | +37.76 | % | +6.62 | % | $ | 13,776 | +8.69 | % | | | | |
| Since Inception (9/30/08) | +61.69 | % | +6.77 | % | $ | 16,169 | +7.98 | % | | | | |
| Advisor | | | | | | | | | 0.95 | % | 1.05 | % |
| 6-Month | -11.64 | % | -11.64 | % | $ | 8,836 | | | | | | |
| 1-Year | -3.20 | % | -3.20 | % | $ | 9,680 | +1.43 | % | | | | |
| 5-Year | +41.32 | % | +7.16 | % | $ | 14,132 | +9.30 | % | | | | |
| 10-Year | +57.24 | % | +4.63 | % | $ | 15,724 | +5.82 | % | | | | |
Performance data represent past performance, which does not guarantee future results. Investment return and principal value will fluctuate, and you may have a gain or loss when you sell your shares. Current performance may differ from figures shown. For most recent month-end performance, go to franklintempleton.com or call (800) 342-5236.
See page 9 for Performance Summary footnotes.
8 Semiannual Report
franklintempleton.com
FRANKLIN LARGE CAP EQUITY FUND
PERFORMANCE SUMMARY
All investments involve risks, including possible loss of principal. Stock prices fluctuate, sometimes rapidly and dramatically, due to factors affecting individual companies, sectors or general market conditions. A “blend” strategy of investing in both growth and value stocks carries the risk that growth stocks can fall dramatically in price if the company fails to meet projections of future earnings or revenues and/or that value stocks may not increase in value as anticipated if other investors fail to recognize the company’s value. There are special risks involved with significant exposure to a particular sector, including increased susceptibility related to economic, business or other developments affecting that sector, which may result in increased volatility. The Fund’s investments in foreign company stocks involve special risks including currency fluctuations and political uncertainty. The Fund is actively managed but there is no guarantee that the manager’s investment decisions will produce the desired results. The Fund’s prospectus also includes a description of the main investment risks.
| |
| Class C: | These shares have higher annual fees and expenses than Class A shares. |
| Class R: | Shares are available to certain eligible investors as described in the prospectus. These shares have higher annual fees and expenses than Class A shares. |
| Advisor Class: | Shares are available to certain eligible investors as described in the prospectus. |
1. The distribution amount is the sum of the dividend payments to shareholders for the period shown and includes only estimated tax basis net investment income and
capital gain.
2. The Fund has an expense reduction contractually guaranteed through at least 11/30/16 and a fee waiver associated with any investment in a Franklin Templeton money
fund. Fund investment results reflect the expense reduction and fee waiver, to the extent applicable; without these reductions, the results would have been lower.
3. Cumulative total return represents the change in value of an investment over the periods indicated.
4. Average annual total return represents the average annual change in value of an investment over the periods indicated. Return for less than one year, if any, has not
been annualized.
5. These figures represent the value of a hypothetical $10,000 investment in the Fund over the periods indicated.
6. In accordance with SEC rules, we provide standardized average annual total return information through the latest calendar quarter.
7. Figures are as stated in the Fund’s current prospectus. In periods of market volatility, assets may decline significantly, causing total annual Fund operating expenses to
become higher than the figures shown.
franklintempleton.com
Semiannual Report 9
FRANKLIN LARGE CAP EQUITY FUND
Your Fund’s Expenses
As a Fund shareholder, you can incur two types of costs:
- Transaction costs, including sales charges (loads) on Fund purchases; and
- Ongoing Fund costs, including management fees, distribution and service (12b-1) fees, and other Fund expenses. All mutual funds have ongoing costs, sometimes referred to as operating expenses.
The following table shows ongoing costs of investing in the Fund and can help you understand these costs and compare them with those of other mutual funds. The table assumes a $1,000 investment held for the six months indicated.
Actual Fund Expenses
The first line (Actual) for each share class listed in the table provides actual account values and expenses. The “Ending Account Value” is derived from the Fund’s actual return, which includes the effect of Fund expenses.
You can estimate the expenses you paid during the period by following these steps. Of course, your account value and expenses will differ from those in this illustration:
1. Divide your account value by $1,000.
If an account had an $8,600 value, then $8,600 ÷ $1,000 = 8.6.
2. Multiply the result by the number under the heading “Expenses Paid During Period.”
If Expenses Paid During Period were $7.50, then 8.6 × $7.50 = $64.50.
In this illustration, the estimated expenses paid this period are $64.50.
Hypothetical Example for Comparison with Other Funds
Information in the second line (Hypothetical) for each class in the table can help you compare ongoing costs of investing in the Fund with those of other mutual funds. This information may not be used to estimate the actual ending account balance or expenses you paid during the period. The hypothetical “Ending Account Value” is based on the actual expense ratio for each class and an assumed 5% annual rate of return before expenses, which does not represent the Fund’s actual return. The figure under the heading “Expenses Paid During Period” shows the hypothetical expenses your account would have incurred under this scenario. You can compare this figure with the 5% hypothetical examples that appear in shareholder reports of other funds.
Please note that expenses shown in the table are meant to highlight ongoing costs and do not reflect any transaction costs, such as sales charges. Therefore, the second line for each class is useful in comparing ongoing costs only, and will not help you compare total costs of owning different funds. In addition, if transaction costs were included, your total costs would have been higher. Please refer to the Fund prospectus for additional information on operating expenses.
10 Semiannual Report
franklintempleton.com
FRANKLIN LARGE CAP EQUITY FUND
YOUR FUND’S EXPENSES
| | | | | | |
| | | Beginning Account | | Ending Account | | Expenses Paid During |
| Share Class | | Value 8/1/15 | | Value 1/31/16 | | Period* 8/1/15–1/31/16 |
| A | | | | | | |
| Actual | $ | 1,000 | $ | 882.70 | $ | 5.68 |
| Hypothetical (5% return before expenses) | $ | 1,000 | $ | 1,019.10 | $ | 6.09 |
| C | | | | | | |
| Actual | $ | 1,000 | $ | 878.80 | $ | 9.21 |
| Hypothetical (5% return before expenses) | $ | 1,000 | $ | 1,015.33 | $ | 9.88 |
| R | | | | | | |
| Actual | $ | 1,000 | $ | 881.20 | $ | 6.62 |
| Hypothetical (5% return before expenses) | $ | 1,000 | $ | 1,018.10 | $ | 7.10 |
| Advisor | | | | | | |
| Actual | $ | 1,000 | $ | 883.60 | $ | 4.50 |
| Hypothetical (5% return before expenses) | $ | 1,000 | $ | 1,020.36 | $ | 4.82 |
*Expenses are calculated using the most recent six-month expense ratio, net of expense waivers, annualized for each class (A: 1.20%; C: 1.95%;
R: 1.40%; and Advisor: 0.95%), multiplied by the average account value over the period, multiplied by 184/366 to reflect the one-half year period.
franklintempleton.com
Semiannual Report 11
| | | | | | | | | | | | | | | | | | |
| F R A N K L I N G L O B A L T R U S T | | | | | | | | | | | | | | | | | | |
| |
| |
| Financial Highlights | | | | | | | | | | | | | | | | | | |
| Franklin Large Cap Equity Fund | | | | | | | | | | | | | | | | | | |
| | | Six Months Ended | | | | | | Year Ended July 31, | | | | |
| | | January 31, 2016 | | | | | | | | | | | | | | | | |
| | | (unaudited) | | | 2015 | | | 2014 | | | 2013 | | | 2012 | | | 2011 | |
| Class A | | | | | | | | | | | | | | | | | | |
| Per share operating performance | | | | | | | | | | | | | | | | | | |
| (for a share outstanding throughout the period) | | | | | | | | | | | | | | | | | | |
| Net asset value, beginning of period | $ | 8.45 | | $ | 8.25 | | $ | 7.43 | | $ | 6.09 | | $ | 6.21 | | $ | 5.00 | |
| Income from investment operationsa: | | | | | | | | | | | | | | | | | | |
| Net investment incomeb | | 0.01 | | | 0.01 | | | —c | | | 0.01 | | | 0.02 | | | 0.01 | |
| Net realized and unrealized gains (losses) | | (0.98 | ) | | 0.85 | | | 1.11 | | | 1.35 | | | (0.13 | ) | | 1.21 | |
| Total from investment operations | | (0.97 | ) | | 0.86 | | | 1.11 | | | 1.36 | | | (0.11 | ) | | 1.22 | |
| Less distributions from: | | | | | | | | | | | | | | | | | | |
| Net investment income | | (0.01 | ) | | (0.01 | ) | | (0.01 | ) | | (0.02 | ) | | (0.01 | ) | | (0.01 | ) |
| Net realized gains | | (0.28 | ) | | (0.65 | ) | | (0.28 | ) | | — | | | — | | | — | |
| Total distributions | | (0.29 | ) | | (0.66 | ) | | (0.29 | ) | | (0.02 | ) | | (0.01 | ) | | (0.01 | ) |
| Net asset value, end of period | $ | 7.19 | | $ | 8.45 | | $ | 8.25 | | $ | 7.43 | | $ | 6.09 | | $ | 6.21 | |
| |
| Total returnd | | (11.73 | )% | | 11.15 | % | | 15.23 | % | | 22.14 | % | | (1.71 | )% | | 24.35 | % |
| |
| Ratios to average net assetse | | | | | | | | | | | | | | | | | | |
| Expenses before waiver and payments by affiliates | | 1.32 | % | | 1.35 | % | | 1.36 | % | | 1.39 | % | | 1.41 | % | | 1.41 | % |
| Expenses net of waiver and payments by affiliates | | 1.20 | % | | 1.25 | % | | 1.25 | % | | 1.25 | % | | 1.25 | % | | 1.25 | % |
| Net investment income | | 0.38 | % | | 0.11 | % | | 0.06 | % | | 0.21 | % | | 0.26 | % | | 0.15 | % |
| |
| Supplemental data | | | | | | | | | | | | | | | | | | |
| Net assets, end of period (000’s) | $ | 22,150 | | $ | 20,136 | | $ | 12,796 | | $ | 8,911 | | $ | 6,842 | | $ | 6,205 | |
| Portfolio turnover rate | | 14.45 | % | | 37.98 | % | | 50.39 | % | | 33.77 | % | | 21.88 | % | | 24.73 | % |
a The amount shown for a share outstanding throughout the period may not correlate with the Statement of Operations for the period due to the timing of sales and
repurchases of the Fund’s shares in relation to income earned and/or fluctuating fair value of the investments of the Fund.
b Based on average daily shares outstanding.
c Amount rounds to less than $0.01 per share.
d Total return does not reflect sales commissions or contingent deferred sales charges, if applicable, and is not annualized for periods less than one year.
e Ratios are annualized for periods less than one year.
12 Semiannual Report | The accompanying notes are an integral part of these financial statements.
franklintempleton.com
FRANKLIN GLOBAL TRUST
FINANCIAL H IGHLIGHTS
| | | | | | | | | | | | | | | | | | |
| Franklin Large Cap Equity Fund (continued) | | | | | | | | | | | | | | | | | | |
| | | Six Months Ended | | | | | | Year Ended July 31, | | | | |
| | | January 31, 2016 | | | | | | | | | | | | | | | | |
| | | (unaudited) | | | 2015 | | | 2014 | | | 2013 | | | 2012 | | | 2011 | |
| Class C | | | | | | | | | | | | | | | | | | |
| Per share operating performance | | | | | | | | | | | | | | | | | | |
| (for a share outstanding throughout the period) | | | | | | | | | | | | | | | | | | |
| Net asset value, beginning of period | $ | 8.20 | | $ | 8.07 | | $ | 7.31 | | $ | 6.02 | | $ | 6.14 | | $ | 4.97 | |
| Income from investment operationsa: | | | | | | | | | | | | | | | | | | |
| Net investment income (loss)b | | (0.01 | ) | | (0.05 | ) | | (0.05 | ) | | (0.03 | ) | | (0.02 | ) | | (0.03 | ) |
| Net realized and unrealized gains (losses) | | (0.96 | ) | | 0.83 | | | 1.09 | | | 1.32 | | | (0.10 | ) | | 1.20 | |
| Total from investment operations | | (0.97 | ) | | 0.78 | | | 1.04 | | | 1.29 | | | (0.12 | ) | | 1.17 | |
| Less distributions from net realized gains | | (0.28 | ) | | (0.65 | ) | | (0.28 | ) | | — | | | — | | | — | |
| Net asset value, end of period | $ | 6.95 | | $ | 8.20 | | $ | 8.07 | | $ | 7.31 | | $ | 6.02 | | $ | 6.14 | |
| |
| Total returnc | | (12.12 | )% | | 10.42 | % | | 14.37 | % | | 21.43 | % | | (1.95 | )% | | 23.54 | % |
| |
| Ratios to average net assetsd | | | | | | | | | | | | | | | | | | |
| Expenses before waiver and payments by affiliates | | 2.07 | % | | 2.05 | % | | 2.05 | % | | 2.07 | % | | 2.07 | % | | 2.08 | % |
| Expenses net of waiver and payments by affiliates | | 1.95 | % | | 1.95 | % | | 1.94 | % | | 1.93 | % | | 1.91 | % | | 1.92 | % |
| Net investment income (loss) | | (0.37 | )% | | (0.59 | )% | | (0.63 | )% | | (0.47 | )% | | (0.40 | )% | | (0.52 | )% |
| |
| Supplemental data | | | | | | | | | | | | | | | | | | |
| Net assets, end of period (000’s) | $ | 3,780 | | $ | 4,062 | | $ | 3,330 | | $ | 2,214 | | $ | 1,116 | | $ | 1,221 | |
| Portfolio turnover rate | | 14.45 | % | | 37.98 | % | | 50.39 | % | | 33.77 | % | | 21.88 | % | | 24.73 | % |
a The amount shown for a share outstanding throughout the period may not correlate with the Statement of Operations for the period due to the timing of sales and
repurchases of the Fund’s shares in relation to income earned and/or fluctuating fair value of the investments of the Fund.
b Based on average daily shares outstanding.
c Total return does not reflect sales commissions or contingent deferred sales charges, if applicable, and is not annualized for periods less than one year.
d Ratios are annualized for periods less than one year.
franklintempleton.com
The accompanying notes are an integral part of these financial statements. | Semiannual Report 13
FRANKLIN GLOBAL TRUST
FINANCIAL H IGHLIGHTS
| | | | | | | | | | | | | | | | | | |
| Franklin Large Cap Equity Fund (continued) | | | | | | | | | | | | | | | | | | |
| |
| | | Six Months Ended | | | | | | Year Ended July 31, | | | | |
| | | January 31, 2016 | | | | | | | | | | | | | | | | |
| | | (unaudited) | | | 2015 | | | 2014 | | | 2013 | | | 2012 | | | 2011 | |
| Class R | | | | | | | | | | | | | | | | | | |
| Per share operating performance | | | | | | | | | | | | | | | | | | |
| (for a share outstanding throughout the period) | | | | | | | | | | | | | | | | | | |
| Net asset value, beginning of period | $ | 8.43 | | $ | 8.25 | | $ | 7.44 | | $ | 6.10 | | $ | 6.20 | | $ | 5.00 | |
| Income from investment operationsa: | | | | | | | | | | | | | | | | | | |
| Net investment income (loss)b | | 0.01 | | | (0.01 | ) | | (0.01 | ) | | —c | | | —c | | | (—)c | |
| Net realized and unrealized gains (losses) | | (0.99 | ) | | 0.84 | | | 1.10 | | | 1.35 | | | (0.09 | ) | | 1.20 | |
| Total from investment operations | | (0.98 | ) | | 0.83 | | | 1.09 | | | 1.35 | | | (0.09 | ) | | 1.20 | |
| Less distributions from: | | | | | | | | | | | | | | | | | | |
| Net investment income | | (—)c | | | (—)c | | | (—)c | | | (0.01 | ) | | (0.01 | ) | | — | |
| Net realized gains | | (0.28 | ) | | (0.65 | ) | | (0.28 | ) | | — | | | — | | | — | |
| Total distributions | | (0.28 | ) | | (0.65 | ) | | (0.28 | ) | | (0.01 | ) | | (0.01 | ) | | — | |
| Net asset value, end of period | $ | 7.17 | | $ | 8.43 | | $ | 8.25 | | $ | 7.44 | | $ | 6.10 | | $ | 6.20 | |
| |
| Total returnd | | (11.88 | )% | | 10.81 | % | | 14.99 | % | | 21.91 | % | | (1.48 | )% | | 24.00 | % |
| |
| Ratios to average net assetse | | | | | | | | | | | | | | | | | | |
| Expenses before waiver and payments by affiliates | | 1.52 | % | | 1.55 | % | | 1.56 | % | | 1.59 | % | | 1.61 | % | | 1.61 | % |
| Expenses net of waiver and payments by affiliates | | 1.40 | % | | 1.45 | % | | 1.45 | % | | 1.45 | % | | 1.45 | % | | 1.45 | % |
| Net investment income (loss) | | 0.18 | % | | (0.09 | )% | | (0.14 | )% | | 0.01 | % | | 0.06 | % | | (0.05 | )% |
| |
| Supplemental data | | | | | | | | | | | | | | | | | | |
| Net assets, end of period (000’s) | $ | 16 | | $ | 19 | | $ | 14 | | $ | 24 | | $ | 15 | | $ | 12 | |
| Portfolio turnover rate | | 14.45 | % | | 37.98 | % | | 50.39 | % | | 33.77 | % | | 21.88 | % | | 24.73 | % |
a The amount shown for a share outstanding throughout the period may not correlate with the Statement of Operations for the period due to the timing of sales and
repurchases of the Fund’s shares in relation to income earned and/or fluctuating fair value of the investments of the Fund.
b Based on average daily shares outstanding.
c Amount rounds to less than $0.01 per share.
d Total return is not annualized for periods less than one year.
e Ratios are annualized for periods less than one year.
14 Semiannual Report | The accompanying notes are an integral part of these financial statements.
franklintempleton.com
FRANKLIN GLOBAL TRUST
FINANCIAL H IGHLIGHTS
| | | | | | | | | | | | | | | | | | |
| Franklin Large Cap Equity Fund (continued) | | | | | | | | | | | | | | | | |
| |
| | | Six Months Ended | | | | | | Year Ended July 31, | | | | |
| | | January 31, 2016 | | | | | | | | | | | | | | | | |
| | | (unaudited) | | | 2015 | | | 2014 | | | 2013 | | | 2012 | | | 2011 | |
| Advisor Class | | | | | | | | | | | | | | | | | | |
| Per share operating performance | | | | | | | | | | | | | | | | | | |
| (for a share outstanding throughout the period) | | | | | | | | | | | | | | | | | | |
| Net asset value, beginning of period | $ | 8.51 | | $ | 8.31 | | $ | 7.47 | | $ | 6.12 | | $ | 6.22 | | $ | 5.01 | |
| Income from investment operationsa: | | | | | | | | | | | | | | | | | | |
| Net investment incomeb | | 0.03 | | | 0.03 | | | 0.03 | | | 0.03 | | | 0.03 | | | 0.03 | |
| Net realized and unrealized gains (losses) | | (1.00 | ) | | 0.85 | | | 1.12 | | | 1.36 | | | (0.10 | ) | | 1.20 | |
| Total from investment operations | | (0.97 | ) | | 0.88 | | | 1.15 | | | 1.39 | | | (0.07 | ) | | 1.23 | |
| Less distributions from: | | | | | | | | | | | | | | | | | | |
| Net investment income | | (0.02 | ) | | (0.03 | ) | | (0.03 | ) | | (0.04 | ) | | (0.03 | ) | | (0.02 | ) |
| Net realized gains | | (0.28 | ) | | (0.65 | ) | | (0.28 | ) | | — | | | — | | | — | |
| Total distributions | | (0.30 | ) | | (0.68 | ) | | (0.31 | ) | | (0.04 | ) | | (0.03 | ) | | (0.02 | ) |
| Net asset value, end of period | $ | 7.24 | | $ | 8.51 | | $ | 8.31 | | $ | 7.47 | | $ | 6.12 | | $ | 6.22 | |
| |
| Total returnc | | (11.64 | )% | | 11.36 | % | | 15.59 | % | | 22.71 | % | | (1.07 | )% | | 24.63 | % |
| |
| Ratios to average net assetsd | | | | | | | | | | | | | | | | | | |
| Expenses before waiver and payments by | | | | | | | | | | | | | | | | | | |
| affiliates | | 1.07 | % | | 1.05 | % | | 1.06 | % | | 1.09 | % | | 1.11 | % | | 1.11 | % |
| Expenses net of waiver and payments by | | | | | | | | | | | | | | | | | | |
| affiliates | | 0.95 | % | | 0.95 | % | | 0.95 | % | | 0.95 | % | | 0.95 | % | | 0.95 | % |
| Net investment income | | 0.63 | % | | 0.41 | % | | 0.36 | % | | 0.51 | % | | 0.56 | % | | 0.45 | % |
| |
| Supplemental data | | | | | | | | | | | | | | | | | | |
| Net assets, end of period (000’s) | $ | 163,672 | | $ | 196,285 | | $ | 147,173 | | $ | 105,558 | | $ | 86,143 | | $ | 84,930 | |
| Portfolio turnover rate | | 14.45 | % | | 37.98 | % | | 50.39 | % | | 33.77 | % | | 21.88 | % | | 24.73 | % |
a The amount shown for a share outstanding throughout the period may not correlate with the Statement of Operations for the period due to the timing of sales and
repurchases of the Fund’s shares in relation to income earned and/or fluctuating fair value of the investments of the Fund.
b Based on average daily shares outstanding.
c Total return is not annualized for periods less than one year.
d Ratios are annualized for periods less than one year.
franklintempleton.com
The accompanying notes are an integral part of these financial statements. | Semiannual Report 15
FRANKLIN GLOBAL TRUST
| | | |
| Statement of Investments, January 31, 2016 (unaudited) | | | |
| |
| Franklin Large Cap Equity Fund | | | |
| | Shares | | Value |
| Common Stocks 97.2% | | | |
| Aerospace & Defense 1.6% | | | |
| United Technologies Corp | 35,000 | $ | 3,069,150 |
| Banks 6.8% | | | |
| Bank of America Corp | 130,000 | | 1,838,200 |
| JPMorgan Chase & Co | 65,000 | | 3,867,500 |
| a Signature Bank | 23,000 | | 3,204,820 |
| U.S. Bancorp | 100,000 | | 4,006,000 |
| | | | 12,916,520 |
| Beverages 2.5% | | | |
| PepsiCo Inc | 47,000 | | 4,667,100 |
| Biotechnology 7.3% | | | |
| AbbVie Inc | 60,000 | | 3,294,000 |
| a Celgene Corp | 42,000 | | 4,213,440 |
| Gilead Sciences Inc | 50,000 | | 4,150,000 |
| a Regeneron Pharmaceuticals Inc | 5,000 | | 2,100,450 |
| | | | 13,757,890 |
| Capital Markets 4.3% | | | |
| BlackRock Inc | 17,000 | | 5,342,420 |
| Morgan Stanley | 110,000 | | 2,846,800 |
| | | | 8,189,220 |
| Chemicals 4.0% | | | |
| The Dow Chemical Co | 90,000 | | 3,780,000 |
| Ecolab Inc | 20,000 | | 2,157,400 |
| Praxair Inc | 17,000 | | 1,700,000 |
| | | | 7,637,400 |
| Consumer Finance 1.5% | | | |
| Discover Financial Services | 60,000 | | 2,747,400 |
| Electrical Equipment 1.5% | | | |
| AMETEK Inc | 60,000 | | 2,823,000 |
| Energy Equipment & Services 0.9% | | | |
| Schlumberger Ltd | 23,700 | | 1,712,799 |
| Food & Staples Retailing 5.1% | | | |
| Costco Wholesale Corp | 28,000 | | 4,231,360 |
| CVS Health Corp | 56,000 | | 5,409,040 |
| | | | 9,640,400 |
| Food Products 2.2% | | | |
| Mondelez International Inc., A | 96,000 | | 4,137,600 |
| Health Care Equipment & Supplies 2.0% | | | |
| Abbott Laboratories | 99,000 | | 3,747,150 |
| Health Care Providers & Services 2.6% | | | |
| McKesson Corp | 31,000 | | 4,990,380 |
| Health Care Technology 2.1% | | | |
| a Cerner Corp | 68,000 | | 3,944,680 |
| Hotels, Restaurants & Leisure 3.5% | | | |
| a Chipotle Mexican Grill Inc | 4,000 | | 1,811,880 |
| Starbucks Corp | 78,000 | | 4,740,060 |
| | | | 6,551,940 |
16 Semiannual Report
franklintempleton.com
FRANKLIN GLOBAL TRUST
STATEMENT OF INVESTMENTS (UNAUDITED)
| | | |
| Franklin Large Cap Equity Fund (continued) | | | |
| |
| | Shares | | Value |
| Common Stocks (continued) | | | |
| Industrial Conglomerates 2.3% | | | |
| Danaher Corp | 50,000 | $ | 4,332,500 |
| Insurance 4.6% | | | |
| Chubb Ltd | 35,000 | | 3,957,450 |
| MetLife Inc | 105,000 | | 4,688,250 |
| | | | 8,645,700 |
| Internet Software & Services 4.6% | | | |
| a Alphabet Inc., C | 8,021 | | 5,959,202 |
| a Facebook Inc., A | 25,000 | | 2,805,250 |
| | | | 8,764,452 |
| IT Services 2.2% | | | |
| MasterCard Inc., A | 47,000 | | 4,184,410 |
| Life Sciences Tools & Services 1.3% | | | |
| a Quintiles Transnational Holdings Inc | 40,000 | | 2,433,200 |
| Media 3.5% | | | |
| Comcast Corp., A | 55,000 | | 3,064,050 |
| The Walt Disney Co | 37,000 | | 3,545,340 |
| | | | 6,609,390 |
| Oil, Gas & Consumable Fuels 4.7% | | | |
| Cabot Oil & Gas Corp., A | 100,000 | | 2,075,000 |
| Chevron Corp | 10,000 | | 864,700 |
| EOG Resources Inc | 45,000 | | 3,195,900 |
| Royal Dutch Shell PLC, A, ADR (United Kingdom) | 65,000 | | 2,855,450 |
| | | | 8,991,050 |
| Pharmaceuticals 1.5% | | | |
| Perrigo Co. PLC | 20,000 | | 2,891,600 |
| Real Estate Investment Trusts (REITs) 1.2% | | | |
| American Tower Corp | 25,000 | | 2,358,500 |
| Road & Rail 1.1% | | | |
| Union Pacific Corp | 30,000 | | 2,160,000 |
| Semiconductors & Semiconductor Equipment 3.6% | | | |
| Avago Technologies Ltd. (Singapore) | 20,000 | | 2,674,200 |
| Lam Research Corp | 30,000 | | 2,153,700 |
| Microchip Technology Inc | 45,000 | | 2,016,450 |
| | | | 6,844,350 |
| Software 7.6% | | | |
| a Fortinet Inc | 67,000 | | 1,885,380 |
| Microsoft Corp | 65,000 | | 3,580,850 |
| Oracle Corp | 70,000 | | 2,541,700 |
| a Red Hat Inc | 33,000 | | 2,311,650 |
| a Salesforce.com Inc | 61,000 | | 4,151,660 |
| | | | 14,471,240 |
| Specialty Retail 3.8% | | | |
| Lowe’s Cos. Inc | 60,000 | | 4,299,600 |
| The TJX Cos. Inc | 40,000 | | 2,849,600 |
| | | | 7,149,200 |
franklintempleton.com
Semiannual Report 17
FRANKLIN GLOBAL TRUST
STATEMENT OF INVESTMENTS (UNAUDITED)
| | | |
| | Shares | | Value |
| Common Stocks (continued) | | | |
| Technology Hardware, Storage & Peripherals 3.1% | | | |
| Apple Inc | 61,000 | $ | 5,937,740 |
| Textiles, Apparel & Luxury Goods 4.2% | | | |
| NIKE Inc., B | 80,000 | | 4,960,800 |
| VF Corp | 48,000 | | 3,004,800 |
| | | | 7,965,600 |
| Total Common Stocks (Cost $159,868,951) | | | 184,271,561 |
| Short Term Investments (Cost $1,640,377) 0.8% | | | |
| Money Market Funds 0.8% | | | |
| a,b Institutional Fiduciary Trust Money Market Portfolio | 1,640,377 | | 1,640,377 |
| Total Investments (Cost $161,509,328) 98.0% | | | 185,911,938 |
| Other Assets, less Liabilities 2.0% | | | 3,705,223 |
| Net Assets 100.0% | | $ | 189,617,161 |
See Abbreviations on page 29.
a Non-income producing.
b See Note 3(f) regarding investments in affiliated management investment companies.
18 Semiannual Report | The accompanying notes are an integral part of these financial statements.
franklintempleton.com
FRANKLIN GLOBAL TRUST
Financial Statements
Statements of Assets and Liabilities
January 31, 2016 (unaudited)
| | | |
| Franklin Large Cap Equity Fund | | | |
| |
| Assets: | | | |
| Investments in securities: | | | |
| Cost - Unaffiliated issuers | $ | 159,868,951 | |
| Cost - Non-controlled affiliates (Note 3f) | | 1,640,377 | |
| Total cost of investments | $ | 161,509,328 | |
| Value - Unaffiliated issuers | $ | 184,271,561 | |
| Value - Non-controlled affiliates (Note 3f) | | 1,640,377 | |
| Total value of investments | | 185,911,938 | |
| Receivables: | | | |
| Investment securities sold | | 3,681,613 | |
| Capital shares sold | | 29,502 | |
| Dividends | | 178,868 | |
| Total assets | | 189,801,921 | |
| Liabilities: | | | |
| Payables: | | | |
| Capital shares redeemed | | 39,216 | |
| Management fees | | 119,907 | |
| Distribution fees | | 8,140 | |
| Transfer agent fees | | 3,591 | |
| Trustees’ fees and expenses | | 412 | |
| Accrued expenses and other liabilities | | 13,494 | |
| Total liabilities | | 184,760 | |
| Net assets, at value | $ | 189,617,161 | |
| Net assets consist of: | | | |
| Paid-in capital | $ | 168,324,382 | |
| Undistributed net investment income | | 124,442 | |
| Net unrealized appreciation (depreciation) | | 24,401,653 | |
| Accumulated net realized gain (loss) | | (3,233,316 | ) |
| Net assets, at value | $ | 189,617,161 | |
franklintempleton.com
The accompanying notes are an integral part of these financial statements. | Semiannual Report 19
FRANKLIN GLOBAL TRUST
FINANCIAL STATEMENTS
Statements of Assets and Liabilities (continued)
January 31, 2016 (unaudited)
| | |
| Franklin Large Cap Equity Fund | | |
| |
| Class A: | | |
| Net assets, at value | $ | 22,149,994 |
| Shares outstanding | | 3,081,833 |
| Net asset value per sharea | $ | 7.19 |
| Maximum offering price per share (net asset value per share ÷ 94.25%) | $ | 7.63 |
| Class C: | | |
| Net assets, at value | $ | 3,779,705 |
| Shares outstanding | | 544,001 |
| Net asset value and maximum offering price per sharea | $ | 6.95 |
| Class R: | | |
| Net assets, at value | $ | 15,888 |
| Shares outstanding | | 2,216 |
| Net asset value and maximum offering price per share | $ | 7.17 |
| Advisor Class: | | |
| Net assets, at value | $ | 163,671,574 |
| Shares outstanding | | 22,609,205 |
| Net asset value and maximum offering price per share | $ | 7.24 |
a Redemption price is equal to net asset value less contingent deferred sales charges, if applicable.
20 Semiannual Report | The accompanying notes are an integral part of these financial statements.
franklintempleton.com
FRANKLIN GLOBAL TRUST
FINANCIAL STATEMENTS
Statements of Operations
for the six months ended January 31, 2016 (unaudited)
| | | |
| Franklin Large Cap Equity Fund | | | |
| |
| Investment income: | | | |
| Dividends | $ | 1,642,938 | |
| Expenses: | | | |
| Management fees (Note 3a) | | 983,758 | |
| Distribution fees: (Note 3c) | | | |
| Class A | | 27,801 | |
| Class C | | 20,815 | |
| Class R | | 41 | |
| Transfer agent fees: (Note 3e) | | | |
| Class A | | 2,965 | |
| Class C | | 554 | |
| Class R | | 2 | |
| Advisor Class | | 23,992 | |
| Custodian fees (Note 4) | | 1,039 | |
| Reports to shareholders | | 8,286 | |
| Registration and filing fees | | 48,632 | |
| Professional fees | | 6,780 | |
| Trustees’ fees and expenses | | 3,795 | |
| Other | | 22,550 | |
| Total expenses | | 1,151,010 | |
| Expenses waived/paid by affiliates (Note 3f and 3g) | | (118,617 | ) |
| Net expenses | | 1,032,393 | |
| Net investment income | | 610,545 | |
| Realized and unrealized gains (losses): | | | |
| Net realized gain (loss) from investments | | 1,245,991 | |
| Net change in unrealized appreciation (depreciation) on: | | | |
| Investments | | (27,544,556 | ) |
| Translation of other assets and liabilities denominated in foreign currencies | | (66 | ) |
| Net change in unrealized appreciation (depreciation) | | (27,544,622 | ) |
| Net realized and unrealized gain (loss) | | (26,298,631 | ) |
| Net increase (decrease) in net assets resulting from operations | $ | (25,688,086 | ) |
franklintempleton.com
The accompanying notes are an integral part of these financial statements. | Semiannual Report 21
FRANKLIN GLOBAL TRUST
FINANCIAL STATEMENTS
| | | | | | |
| Statements of Changes in Net Assets | | | | | | |
| |
| Franklin Large Cap Equity Fund | | | | | | |
| |
| | | Six Months Ended | | | | |
| | | January 31, 2016 | | | Year Ended | |
| | | (unaudited) | | | July 31, 2015 | |
| Increase (decrease) in net assets: | | | | | | |
| Operations: | | | | | | |
| Net investment income | $ | 610,545 | | $ | 727,057 | |
| Net realized gain (loss) | | 1,245,991 | | | 2,590,146 | |
| Net change in unrealized appreciation (depreciation) | | (27,544,622 | ) | | 17,734,914 | |
| Net increase (decrease) in net assets resulting from operations | | (25,688,086 | ) | | 21,052,117 | |
| Distributions to shareholders from: | | | | | | |
| Net investment income: | | | | | | |
| Class A | | (32,085 | ) | | (16,029 | ) |
| Class R | | (6 | ) | | (1 | ) |
| Advisor Class | | (548,648 | ) | | (629,608 | ) |
| Net realized gains: | | | | | | |
| Class A | | (803,139 | ) | | (1,173,454 | ) |
| Class C | | (152,765 | ) | | (287,867 | ) |
| Class R | | (654 | ) | | (1,112 | ) |
| Advisor Class | | (6,098,237 | ) | | (13,297,929 | ) |
| Total distributions to shareholders | | (7,635,534 | ) | | (15,406,000 | ) |
| Capital share transactions: (Note 2) | | | | | | |
| Class A | | 5,702,120 | | | 6,834,187 | |
| Class C | | 401,493 | | | 645,259 | |
| Class R | | (418 | ) | | 4,526 | |
| Advisor Class | | (3,664,828 | ) | | 44,059,517 | |
| Total capital share transactions | | 2,438,367 | | | 51,543,489 | |
| Net increase (decrease) in net assets | | (30,885,253 | ) | | 57,189,606 | |
| Net assets: | | | | | | |
| Beginning of period | | 220,502,414 | | | 163,312,808 | |
| End of period | $ | 189,617,161 | | $ | 220,502,414 | |
| Undistributed net investment income included in net assets: | | | | | | |
| End of period | $ | 124,442 | | $ | 94,636 | |
22 Semiannual Report | The accompanying notes are an integral part of these financial statements.
franklintempleton.com
FRANKLIN GLOBAL TRUST
Notes to Financial Statements (unaudited)
Franklin Large Cap Equity Fund
1. Organization and Significant Accounting Policies
Franklin Global Trust (Trust) is registered under the Investment Company Act of 1940 (1940 Act) as an open-end management investment company, consisting of six separate funds and applies the specialized accounting and reporting guidance in U.S. Generally Accepted Accounting Principles (U.S. GAAP). Franklin Large Cap Equity Fund (Fund) is included in this report. The financial statements of the remaining funds in the Trust are presented separately. The Fund offers four classes of shares: Class A, Class C, Class R, and Advisor Class. Each class of shares differs by its initial sales load, contingent deferred sales charges, voting rights on matters affecting a single class, its exchange privilege and fees primarily due to differing arrangements for distribution and transfer agent fees.
The following summarizes the Fund’s significant accounting policies.
a. Financial Instrument Valuation
The Fund’s investments in financial instruments are carried at fair value daily. Fair value is the price that would be received to sell an asset or paid to transfer a liability in an orderly transaction between market participants on the measurement date. The Fund calculates the net asset value (NAV) per share as of 4 p.m. Eastern time each day the New York Stock Exchange (NYSE) is open for trading. Under compliance policies and procedures approved by the Trust’s Board of Trustees (the Board), the Fund’s administrator has responsibility for oversight of valuation, including leading the cross-functional Valuation and Liquidity Oversight Committee (VLOC). The VLOC provides administration and oversight of the Fund’s valuation policies and procedures, which are approved annually by the Board. Among other things, these procedures allow the Fund to utilize independent pricing services, quotations from securities and financial instrument dealers, and other market sources to determine fair value.
Equity securities listed on an exchange or on the NASDAQ National Market System are valued at the last quoted sale price or the official closing price of the day, respectively. Foreign equity securities are valued as of the close of trading on the foreign stock exchange on which the security is primarily traded or as of 4 p.m. Eastern time whichever is earlier. The value is then converted into its U.S. dollar equivalent at the foreign exchange rate in effect at 4 p.m. Eastern time on the day that the value of the security is determined. Over-the-counter (OTC) securities are valued within the range of the most recent quoted bid and ask prices. Securities that trade in multiple markets or on multiple exchanges are valued according to the broadest and most representative market. Certain equity securities are valued based upon fundamental characteristics or relationships to similar securities.
Investments in open-end mutual funds are valued at the closing NAV.
The Fund has procedures to determine the fair value of financial instruments for which market prices are not reliable or readily available. Under these procedures, the VLOC convenes on a regular basis to review such financial instruments and considers a number of factors, including significant unobservable valuation inputs, when arriving at fair value. The VLOC primarily employs a market-based approach which may use related or comparable assets or liabilities, recent transactions, market multiples, book values, and other relevant information for the investment to determine the fair value of the investment. An income-based valuation approach may also be used in which the anticipated future cash flows of the investment are discounted to calculate fair value. Discounts may also be applied due to the nature or duration of any restrictions on the disposition of the investments. Due to the inherent uncertainty of valuations of such investments, the fair values may differ significantly from the values that would have been used had an active market existed. The VLOC employs various methods for calibrating these valuation approaches including a regular review of key inputs and assumptions, transactional back-testing or disposition analysis, and reviews of any related market activity.
Trading in securities on foreign securities stock exchanges and OTC markets may be completed before 4 p.m. Eastern time. In addition, trading in certain foreign markets may not take place on every NYSE business day. Occasionally, events occur between the time at which trading in a foreign security is completed and the close of the NYSE that might call into question the reliability of the value of a portfolio security held by the Fund. As a result, differences may arise between the value of the Fund’s portfolio securities as determined at the foreign market close and the latest indications of value at the close of the NYSE. In order to minimize the potential for these differences, the VLOC monitors price movements following the close of trading in foreign stock markets through a series of country specific market proxies (such as baskets of American Depositary Receipts, futures contracts and exchange traded funds). These price movements are measured against established trigger thresholds for each specific market proxy to assist in determining if an event has occurred that may call into question the
franklintempleton.com
Semiannual Report 23
FRANKLIN GLOBAL TRUST
NOTES TO FINANCIAL STATEMENTS (UNAUDITED)
Franklin Large Cap Equity Fund (continued)
1. Organization and Significant Accounting
Policies (continued)
a. Financial Instrument Valuation (continued)
reliability of the values of the foreign securities held by the Fund. If such an event occurs, the securities may be valued using fair value procedures, which may include the use of independent pricing services.
When the last day of the reporting period is a non-business day, certain foreign markets may be open on those days that the NYSE is closed, which could result in differences between the value of the Fund’s portfolio securities on the last business day and the last calendar day of the reporting period. Any significant security valuation changes due to an open foreign market are adjusted and reflected by the Fund for financial reporting purposes.
b. Foreign Currency Translation
Portfolio securities and other assets and liabilities denominated in foreign currencies are translated into U.S. dollars based on the exchange rate of such currencies against U.S. dollars on the date of valuation. The Fund may enter into foreign currency exchange contracts to facilitate transactions denominated in a foreign currency. Purchases and sales of securities, income and expense items denominated in foreign currencies are translated into U.S. dollars at the exchange rate in effect on the transaction date. Portfolio securities and assets and liabilities denominated in foreign currencies contain risks that those currencies will decline in value relative to the U.S. dollar. Occasionally, events may impact the availability or reliability of foreign exchange rates used to convert the U.S. dollar equivalent value. If such an event occurs, the foreign exchange rate will be valued at fair value using procedures established and approved by the Board.
The Fund does not separately report the effect of changes in foreign exchange rates from changes in market prices on securities held. Such changes are included in net realized and unrealized gain or loss from investments in the Statement of Operations.
Realized foreign exchange gains or losses arise from sales of foreign currencies, currency gains or losses realized between the trade and settlement dates on securities transactions and the difference between the recorded amounts of dividends, interest, and foreign withholding taxes and the U.S. dollar equivalent of the amounts actually received or paid. Net unrealized foreign exchange gains and losses arise from changes in foreign exchange rates on foreign denominated assets and liabilities other than investments in securities held at the end of the reporting period.
c. Income and Deferred Taxes
It is the Fund’s policy to qualify as a regulated investment company under the Internal Revenue Code. The Fund intends to distribute to shareholders substantially all of its taxable income and net realized gains to relieve it from federal income and excise taxes. As a result, no provision for U.S. federal income taxes is required.
The Fund may be subject to foreign taxation related to income received, capital gains on the sale of securities and certain foreign currency transactions in the foreign jurisdictions in which it invests. Foreign taxes, if any, are recorded based on the tax regulations and rates that exist in the foreign markets in which the Fund invests. When a capital gain tax is determined to apply, the Fund records an estimated deferred tax liability in an amount that would be payable if the securities were disposed of on the valuation date.
The Fund may recognize an income tax liability related to its uncertain tax positions under U.S. GAAP when the uncertain tax position has a less than 50% probability that it will be sustained upon examination by the tax authorities based on its technical merits. As of January 31, 2016, the Fund has determined that no tax liability is required in its financial statements related to uncertain tax positions for any open tax years (or expected to be taken on future tax returns). Open tax years are those that remain subject to examination and are based on each tax jurisdiction’s statute of limitation.
d. Security Transactions, Investment Income, Expenses and Distributions
Security transactions are accounted for on trade date. Realized gains and losses on security transactions are determined on a specific identification basis. Estimated expenses are accrued daily. Dividend income is recorded on the ex-dividend date except for certain dividends from foreign securities where the dividend rate is not available. In such cases, the dividend is recorded as soon as the information is received by the Fund. Distributions to shareholders are recorded on the ex-dividend date and are determined according to income tax regulations (tax basis). Distributable earnings determined on a tax basis may differ from earnings recorded in accordance with U.S. GAAP.
24 Semiannual Report
franklintempleton.com
FRANKLIN GLOBAL TRUST
NOTES TO FINANCIAL STATEMENTS (UNAUDITED)
Franklin Large Cap Equity Fund (continued)
These differences may be permanent or temporary. Permanent differences are reclassified among capital accounts to reflect their tax character. These reclassifications have no impact on net assets or the results of operations. Temporary differences are not reclassified, as they may reverse in subsequent periods.
Common expenses incurred by the Trust are allocated among the Funds based on the ratio of net assets of each Fund to the combined net assets of the Trust. Fund specific expenses are charged directly to the fund that incurred the expense.
Realized and unrealized gains and losses and net investment income, not including class specific expenses, are allocated daily to each class of shares based upon the relative proportion of net assets of each class. Differences in per share distributions, by class, are generally due to differences in class specific expenses.
e. Accounting Estimates
The preparation of financial statements in accordance with U.S. GAAP requires management to make estimates and assumptions that affect the reported amounts of assets and liabilities at the date of the financial statements and the amounts of income and expenses during the reporting period. Actual results could differ from those estimates.
f. Guarantees and Indemnifications
Under the Trust’s organizational documents, its officers and trustees are indemnified by the Trust against certain liabilities arising out of the performance of their duties to the Trust. Additionally, in the normal course of business, the Trust, on behalf of the Fund, enters into contracts with service providers that contain general indemnification clauses. The Trust’s maximum exposure under these arrangements is unknown as this would involve future claims that may be made against the Trust that have not yet occurred. Currently, the Trust expects the risk of loss to be remote.
2. Shares of Beneficial Interest
At January 31, 2016, there were an unlimited number of shares authorized (without par value). Transactions in the Fund’s shares were as follows:
| | | | | | | | | | | |
| | Six Months Ended | | Year Ended | |
| | January 31, 2016 | | July 31, 2015 | |
| | Shares | | | Amount | | Shares | | | Amount | |
| Class A Shares: | | | | | | | | | | | |
| Shares sold | 966,060 | | $ | 7,755,226 | | 1,308,927 | | $ | 10,816,851 | |
| Shares issued in reinvestment of distributions | 103,236 | | | 801,607 | | 144,567 | | | 1,114,194 | |
| Shares redeemed | (370,509 | ) | | (2,854,713 | ) | (620,531 | ) | | (5,096,858 | ) |
| Net increase (decrease) | 698,787 | | $ | 5,702,120 | | 832,963 | | $ | 6,834,187 | |
| |
| Class C Shares: | | | | | | | | | | | |
| Shares sold | 105,882 | | $ | 809,573 | | 221,675 | | $ | 1,778,626 | |
| Shares issued in reinvestment of distributions | 20,120 | | | 151,100 | | 37,910 | | | | 283,945 | |
| Shares redeemed | (77,623 | ) | | (559,180 | ) | (176,332 | ) | | (1,417,312 | ) |
| Net increase (decrease) | 48,379 | | $ | 401,493 | | 83,253 | | | $ | 645,259 | |
| |
| Class R Shares: | | | | | | | | | | | |
| Shares sold | 217 | | $ | 1,710 | | 493 | | | $ | 4,013 | |
| Shares issued in reinvestment of distributions | 52 | | | 402 | | 67 | | | | 513 | |
| Shares redeemed | (327 | ) | | (2,530 | ) | — | | | | — | |
| Net increase (decrease) | (58 | ) | $ | (418 | ) | 560 | | | $ | 4,526 | |
franklintempleton.com
Semiannual Report 25
FRANKLIN GLOBAL TRUST
NOTES TO FINANCIAL STATEMENTS (UNAUDITED)
| | | | | | | | | | |
| Franklin Large Cap Equity Fund (continued) | | | | | | | | | | |
| |
| 2. Shares of Beneficial Interest (continued) | | | | | | | | | | |
| | Six Months Ended | | Year Ended | |
| | January 31, 2016 | | July 31, 2015 | |
| | Shares | | | Amount | | Shares | | | Amount | |
| Advisor Class Shares: | | | | | | | | | | |
| Shares sold | 746,189 | | $ | 6,063,239 | | 5,734,334 | | $ | 48,215,353 | |
| Shares issued in reinvestment of distributions | 752,349 | | | 5,883,624 | | 1,650,795 | | | 12,795,150 | |
| Shares redeemed | (1,951,135 | ) | | (15,611,691 | ) | (2,037,980 | ) | | (16,950,986 | ) |
| Net increase (decrease) | (452,597 | ) | $ | (3,664,828 | ) | 5,347,149 | | $ | 44,059,517 | |
3. Transactions with Affiliates
Franklin Resources, Inc. is the holding company for various subsidiaries that together are referred to as Franklin Templeton Investments. Certain officers and trustees of the Trust are also officers and/or directors of the following subsidiaries:
| |
| Subsidiary | Affiliation |
| Fiduciary International, Inc. (Fiduciary) | Investment manager |
| Franklin Templeton Services, LLC (FT Services) | Administrative manager |
| Franklin Templeton Distributors, Inc. (Distributors) | Principal underwriter |
| Franklin Templeton Investor Services, LLC (Investor Services) | Transfer agent |
a. Management Fees
The Fund pays an investment management fee to Fiduciary based on the average daily net assets of the Fund as follows:
| | |
| Annualized Fee Rate | | Net Assets |
| 0.950 | % | Up to and including $500 million |
| 0.850 | % | Over $500 million, up to and including $1 billion |
| 0.800 | % | Over $1 billion, up to and including $1.5 billion |
| 0.750 | % | Over $1.5 billion, up to and including $6.5 billion |
| 0.730 | % | Over $6.5 billion, up to and including $11.5 billion |
| 0.700 | % | In excess of $11.5 billion |
b. Administrative Fees
Under an agreement with Fiduciary, FT Services provides administrative services to the Fund. The fee is paid by Fiduciary based on the Fund’s average net assets, and is not an additional expense of the Fund.
c. Distribution Fees
The Board has adopted distribution plans for each share class, with the exception of Advisor Class shares, pursuant to Rule 12b-1 under the 1940 Act. Under the Fund’s Class A reimbursement distribution plan, the Fund reimburses Distributors for costs incurred in connection with the servicing, sale and distribution of the Fund’s shares up to the maximum annual plan rate. Under the Class A reimbursement distribution plan, costs exceeding the maximum for the current plan year cannot be reimbursed in subsequent periods. In addition, under the Fund’s Class C and R compensation distribution plans, the Fund pays Distributors for costs incurred in connection with the servicing, sale and distribution of the Fund’s shares up to the maximum annual plan rate for each class. The plan year, for purposes of monitoring compliance with the maximum annual plan rates, is February 1 through January 31.
26 Semiannual Report
franklintempleton.com
FRANKLIN GLOBAL TRUST
NOTES TO FINANCIAL STATEMENTS (UNAUDITED)
Franklin Large Cap Equity Fund (continued)
The maximum annual plan rates, based on the average daily net assets, for each class, are as follows:
| | |
| Reimbursement Plan: | | |
| Class A | 0.35 | % |
| Compensation Plans: | | |
| Class C | 1.00 | % |
| Class R | 0.50 | % |
Effective August 1, 2015, the Board set the current rate at 0.25% per year for Class A shares until further notice and approval by the Board. Prior to August 1, 2015, the Board had set the rate at 0.30% per year for Class A shares.
d. Sales Charges/Underwriting Agreements
Front-end sales charges and contingent deferred sales charges (CDSC) do not represent expenses of the Fund. These charges are deducted from the proceeds of sales of Fund shares prior to investment or from redemption proceeds prior to remittance, as applicable. Distributors has advised the Fund of the following commission transactions related to the sales and redemptions of the Fund’s shares for the period:
| | |
| Sales charges retained net of commissions | | |
| paid to unaffiliated broker/dealers | $ | 11,461 |
| CDSC retained | $ | 251 |
e. Transfer Agent Fees
Each class of shares pays transfer agent fees to Investor Services for its performance of shareholder servicing obligations and reimburses Investor Services for out of pocket expenses incurred, including shareholding servicing fees paid to third parties. These fees are allocated daily based upon their relative proportion of such classes’ aggregate net assets.
For the period ended January 31, 2016, the Fund paid transfer agent fees of $27,513, of which $19,195 was retained by Investor Services.
f. Investments in Affiliated Management Investment Companies
The Fund invests in an affiliated management investment company for purposes other than exercising a controlling influence over the management or policies. Management fees paid by the Fund are waived on assets invested in the affiliated management investment company, as noted in the Statement of Operations, in an amount not to exceed the management and administrative fees paid directly or indirectly by each affiliate. Prior to August 1, 2013, the waiver was accounted for as a reduction to management fees.
| | | | | | | | | | | |
| | | | | | | | | | | % of | |
| | | | | | | | | | | Affiliated | |
| | Number of | | | | Number of | | | | | Fund Shares | |
| | Shares Held | | | | Shares Held | | Value | | Realized | Outstanding | |
| | at Beginning | Gross | Gross | | at End | | at End | Investment | Gain | Held at End | |
| | of Period | Additions | Reductions | | of Period | | of Period | Income | (Loss) | of Period | |
| Non-Controlled Affiliates | | | | | | | | | | | |
| Institutional Fiduciary Trust | | | | | | | | | | | |
| Money Market Portfolio | 3,386,115 | 29,708,706 | (31,454,444 | ) | 1,640,377 | $ | 1,640,377 | $ — | $ — | 0.01 | % |
g. Waiver and Expense Reimbursements
Fiduciary has contractually agreed in advance to waive or limit its fees and to assume as its own expense certain expenses otherwise payable by the Fund so that the expenses (excluding distribution fees and acquired fund fees and expenses) for each class of the Fund does not exceed 0.95% based on the average net assets of each class (other than certain non-routine expenses or costs, including those relating to litigation, indemnification, reorganizations, and liquidations) until November 30, 2016.
franklintempleton.com
Semiannual Report 27
| |
| F R A N K L I N | G L O B A L T R U S T |
| N O T E S T O | F I N A N C I A L S T A T E M E N T S ( U N A U D I T E D ) |
Franklin Large Cap Equity Fund (continued)
4. Expense Offset Arrangement
The Fund has entered into an arrangement with its custodian whereby credits realized as a result of uninvested cash balances are used to reduce a portion of the Fund’s custodian expenses. During the period ended January 31, 2016, there were no credits earned.
5. Income Taxes
At January 31, 2016, the cost of investments and net unrealized appreciation (depreciation) for income tax purposes were as follows:
| | | |
| Cost of investments | $ | 161,514,655 | |
| Unrealized appreciation | $ | 34,443,779 | |
| Unrealized depreciation | | (10,046,496 | ) |
| Net unrealized appreciation (depreciation) | $ | 24,397,283 | |
Differences between income and/or capital gains as determined on a book basis and a tax basis are primarily due to differing treatments of foreign currency transactions and wash sales.
6. Investment Transactions
Purchases and sales of investments (excluding short term securities) for the period ended January 31, 2016, aggregated $29,159,830 and $29,465,701, respectively.
7. Upcoming Acquisitions/Reorganization
On October 7, 2015, the Board for Franklin Global Trust approved a proposal to reorganize Franklin Large Cap Equity Fund with and into Franklin Growth Fund. On March 11, 2016, the reorganization was completed transferring the assets from Franklin Large Cap Equity Fund into Franklin Growth Fund.
8. Credit Facility
The Fund, together with other U.S. registered and foreign investment funds (collectively, Borrowers), managed by Franklin Templeton Investments, are borrowers in a joint syndicated senior unsecured credit facility totaling $2 billion (Global Credit Facility) which, matured on February 12, 2016. This Global Credit Facility provides a source of funds to the Borrowers for temporary and emergency purposes, including the ability to meet future unanticipated or unusually large redemption requests. Effective February 12, 2016, the Borrowers renewed the Global Credit Facility for a one year term, maturing February 10, 2017, for a total of $2 billion.
Under the terms of the Global Credit Facility, the Fund shall, in addition to interest charged on any borrowings made by the Fund and other costs incurred by the Fund, pay its share of fees and expenses incurred in connection with the implementation and maintenance of the Global Credit Facility, based upon its relative share of the aggregate net assets of all of the Borrowers, including an annual commitment fee of 0.07% based upon the unused portion of the Global Credit Facility. Effective February 12, 2016, the annual commitment fee is 0.15%. These fees are reflected in other expenses in the Statement of Operations. During the period ended January 31, 2016, the Fund did not use the Global Credit Facility.
9. Fair Value Measurements
The Fund follows a fair value hierarchy that distinguishes between market data obtained from independent sources (observable inputs) and the Fund’s own market assumptions (unobservable inputs). These inputs are used in determining the value of the Fund’s financial instruments and are summarized in the following fair value hierarchy:
• Level 1 – quoted prices in active markets for identical financial instruments
28 Semiannual Report
franklintempleton.com
FRANKLIN GLOBAL TRUST
NOTES TO FINANCIAL STATEMENTS (UNAUDITED)
Franklin Large Cap Equity Fund (continued)
- Level 2 – other significant observable inputs (including quoted prices for similar financial instruments, interest rates, prepay- ment speed, credit risk, etc.)
- Level 3 – significant unobservable inputs (including the Fund’s own assumptions in determining the fair value of financial instruments)
The input levels are not necessarily an indication of the risk or liquidity associated with financial instruments at that level.
For movements between the levels within the fair value hierarchy, the Fund has adopted a policy of recognizing the transfers as of the date of the underlying event which caused the movement.
At January 31, 2016, all of the Fund’s investments in financial instruments carried at fair value were valued using Level 1 inputs.
For detailed categories, see the accompanying Statement of Investments.
10. Subsequent Events
The Fund has evaluated subsequent events through the issuance of the financial statements and determined that no events have occurred that require disclosure other than those already disclosed in the financial statements.
|
| Abbreviations |
| Selected Portfolio |
| ADR American Depositary Receipt |
franklintempleton.com
Semiannual Report 29
FRANKLIN GLOBAL TRUST
FRANKLIN LARGE CAP EQUITY FUND
Shareholder Information
Proxy Voting Policies and Procedures
The Fund’s investment manager has established Proxy Voting Policies and Procedures (Policies) that the Fund uses to determine how to vote proxies relating to portfolio securities. Shareholders may view the Fund’s complete Policies online at franklintempleton.com. Alternatively, shareholders may request copies of the Policies free of charge by calling the Proxy Group collect at (954) 527-7678 or by sending a written request to: Franklin Templeton Companies, LLC, 300 S.E. 2nd Street, Fort Lauderdale, FL 33301, Attention: Proxy Group. Copies of the Fund’s proxy voting records are also made available online at franklintempleton.com and posted on the U.S. Securities and Exchange Commission’s website at sec.gov and reflect the most recent 12-month period ended June 30.
Quarterly Statement of Investments
The Trust, on behalf of the Fund, files a complete statement of investments with the U.S. Securities and Exchange Commission for the first and third quarters for each fiscal year on Form N-Q. Shareholders may view the filed Form N-Q by visiting the Commission’s website at sec.gov. The filed form may also be viewed and copied at the Commission’s Public Reference Room in Washington, DC. Information regarding the operations of the Public Reference Room may be obtained by calling (800) SEC-0330.
30 Semiannual Report
franklintempleton.com
This page intentionally left blank
This page intentionally left blank

Franklin Templeton Investments
Gain From Our Perspective®
At Franklin Templeton Investments, we’re dedicated to one goal: delivering exceptional asset management for our clients. By bringing together multiple, world-class investment teams in a single firm, we’re able to offer specialized expertise across styles and asset classes, all supported by the strength and resources of one of the world’s largest asset managers. This has helped us to become a trusted partner to individual and institutional investors across the globe.
| |
| Contents | |
| Semiannual Report | |
| Franklin Emerging Market Debt Opportunities Fund | 2 |
| Performance Summary | 6 |
| Your Fund’s Expenses | 8 |
| Consolidated Financial Highlights and | |
| Consolidated Statement of Investments | 9 |
| Consolidated Financial Statements | 15 |
| Notes to Consolidated Financial Statements | 18 |
| Shareholder Information | 30 |
Visit ftinstitutional.com for fund updates, to access your account, or to find helpful financial planning tools.
Not FDIC Insured | May Lose Value | No Bank Guarantee
ftinstitutional.com
1
Semiannual Report
Franklin Emerging Market Debt Opportunities Fund
This semiannual report for Franklin Emerging Market Debt Opportunities Fund covers the period ended January 31, 2016.
Your Fund’s Goal and Main Investments
The Fund seeks high total return through investing at least 80% of its net assets in debt securities of emerging market countries, mainly securities issued by sovereign and subsovereign government entities, but also including securities issued by corporate entities that are controlled by a sovereign entity, and corporate emerging market debt.

*Figures reflect certain derivatives held in the portfolio (or their underlying reference
assets) and may not total 100% or may be negative due to rounding, use of
derivatives, unsettled trades or other factors.
**Includes securities determined to have no value at 1/31/16.
Performance Overview
The Fund had a -5.75% cumulative total return for the six months under review. In comparison, the J.P. Morgan (JPM) Emerging Markets Bond Index (EMBI) Global Diversified Index, which tracks total returns for U.S. dollar-denominated debt instruments issued by emerging market sovereign and quasi-sovereign entities, had a -1.14% total return,1 and the Fund’s second benchmark, the JPM Government Bond Index-Emerging Markets (GBI-EM) Broad Diversified Index (US$ Unhedged), which tracks local currency bonds issued in emerging markets, had a -6.98% total return.2 Also for comparison, the Fund’s third benchmark, the Bank of America Merrill Lynch (BofAML) Emerging Markets Corporate Plus (EMCB) Index (100% US$ Hedged), which tracks the performance of U.S. dollar-denominated and euro-denominated emerging market non-sovereign debt publicly issued within the major domestic and Eurobond markets, had a -2.40% total return.1 You can find the Fund’s long-term performance data in the Performance Summary beginning on page 6.
Performance data represent past performance, which does not guarantee future results. Investment return and principal value will fluctuate, and you may have a gain or loss when you sell your shares. Current performance may differ from figures shown. For most recent month-end performance, go to ftinstitutional.com or call a Franklin Templeton Institutional Services representative at (800) 321-8563.
Economic and Market Overview
The six months under review were characterized by substantial volatility in financial markets. Early in the period, Greece and Ukraine reached agreements with their main creditors, which came as a relief to investors. However, declines in Chinese equity markets, which had commenced prior to the period, significantly affected other emerging markets (EM) and developed markets beginning in August. This market turbulence dashed investors’ earlier expectations of a September interest rate increase by the U.S. Federal Reserve (Fed). Expectations of an interest rate increase resurfaced in November, after U.S. employment data appeared strong enough to justify a rate increase. When the Fed finally raised its benchmark interest rate in December, some market stability ensued, but it was short-lived. Stock, bond and commodity prices, as well as interest rates, continued to decline in January.
1. Source: Morningstar.
2. Source: J.P. Morgan.
The indexes are unmanaged and include reinvestment of any income or distributions. One cannot invest directly in an index, and an index is not representative of the Fund’s
portfolio.
See www.franklintempletondatasources.com for additional data provider information.
The dollar value, number of shares or principal amount, and names of all portfolio holdings are listed in the Fund’s Consolidated Statement of Investments (SOI).
The Consolidated SOI begins on page 10.
2 Semiannual Report
ftinstitutional.com
FRANKLIN EMERGING MARKET DEBT OPPORTUNITIES FUND
Ten-year U.S. Treasury yields — the pricing benchmark for U.S. dollar-denominated EM issues — fell 26 basis points (0.26%) during the six-month period, as the Fed’s normalization of U.S. monetary policy took longer to begin than many investors had expected. Ten-year U.S. Treasury yields continued to fall despite the Fed’s December interest rate increase, which led to a further flattening of the U.S. Treasury yield curve, resulting in little difference between short-term and long-term rates.
However, EM risk spread, as measured by the JPM EMBI Global Diversified Index, widened significantly, from 367 basis points (3.67%) on July 31, 2015, to 463 basis points (4.63%) at period-end, as the index’s yield-to-worst, or the lowest potential yield, rose to 6.50%.2 For the six months ended January 31, 2016, U.S. dollar-denominated sovereign and quasi-sovereign bonds, as measured by the index, had a -1.14% total return.1
As measured by the BofAML EMCB Index, U.S. dollar-denominated and euro-denominated EM corporate bonds underperformed their hard-currency sovereign and quasi-sovereign counterparts with a -2.40% total return.1 Local currency-denominated sovereign EM bonds, as measured by the JPM GBI-EM Broad Diversified Index, had a -6.98% total return, largely due to currency effects as investors’ anticipation of a U.S. interest rate increase drove EM currencies lower relative to the U.S. dollar.2
Investment Strategy
Our portfolio construction process can be summarized in three integral steps — country allocation, currency allocation and issue selection. The first stage of our emerging market debt investment process is identifying the countries for which we have a favorable outlook, which we manage with a bottom-up, research-driven perspective. Since the portfolio is constructed through bottom-up, fundamental research and not relative to a benchmark index, there is no requirement to hold issues from any one country. The next decision is whether to take exposure in the form of “hard currency” or local currency instruments. Hard currencies are typically currencies of economically and politically stable industrialized nations. The last decision concerns security selection. This depends on a number of factors, including the type of the issue’s coupon (fixed or floating). We may seek to manage the Fund’s exposure to various currencies, and may from time to time seek to hedge (protect) against currency risk through the use of derivative currency transactions, including currency forward contracts.
| | |
| Geographic Breakdown* | | |
| 1/31/16 | | |
| | % of Total | |
| Country | Net Assets | |
| Brazil | 6.2 | % |
| Ukraine | 6.1 | % |
| Russia | 5.7 | % |
| South Africa | 4.8 | % |
| Angola | 4.7 | % |
| Turkey | 4.5 | % |
| Nigeria | 4.5 | % |
| Argentina | 4.1 | % |
| Iraq | 3.6 | % |
| Azerbaijan | 3.4 | % |
| Colombia | 3.4 | % |
| Mexico | 3.1 | % |
| Ghana | 2.8 | % |
| El Salvador | 2.7 | % |
| Uruguay | 2.4 | % |
| Georgia | 2.4 | % |
| Venezuela | 2.3 | % |
| Mozambique | 2.3 | % |
| Republic of Armenia | 2.3 | % |
| Tunisia | 2.1 | % |
| Republic of Seychelles | 2.1 | % |
| Kenya | 1.9 | % |
| Cameroon | 1.9 | % |
| Bosnia & Herzegovina | 1.8 | % |
| Ethiopia | 1.7 | % |
| Mongolia | 1.6 | % |
| Kazakhstan | 1.6 | % |
| Supranational | 1.5 | % |
| Other | 9.5 | % |
| Short-Term Investments & Other Net Assets | 3.0 | % |
*Figures reflect certain derivatives held in the portfolio (or their underlying reference
assets) and may not total 100% or may be negative due to rounding, use of
derivatives, unsettled trades or other factors. May differ from the Consolidated SOI
because percentages reflect the issuing country of the Fund’s long-term securities
and include the effect of interest receivable balances.
What is a currency forward contract?
A currency forward contract is an agreement between the Fund and a counterparty to buy or sell a foreign currency at a specific exchange rate on a future date.
ftinstitutional.com
Semiannual Report 3
FRANKLIN EMERGING MARKET DEBT OPPORTUNITIES FUND
| | |
| Currency Breakdown* | | |
| 1/31/16 | | |
| | % of Total | |
| Currency | Net Assets | |
| U.S. Dollar | 77.5 | % |
| Turkish Lira | 3.6 | % |
| Mexican Peso | 3.1 | % |
| Russian Ruble | 2.6 | % |
| South African Rand | 2.6 | % |
| Uruguayan Peso | 2.4 | % |
| Colombian Peso | 2.1 | % |
| Indian Rupee | 1.5 | % |
| Zambian Kwacha | 1.3 | % |
| Ugandan Shilling | 1.3 | % |
| Kenyan Shilling | 1.2 | % |
| Ghanaian Cedi | 1.2 | % |
| Brazilian Real | 0.1 | % |
| Swiss Franc | 0.0 | %** |
| Japanese Yen | -0.1 | % |
| Euro | -0.4 | % |
*Figures reflect certain derivatives held in the portfolio (or their underlying reference
assets) and may not total 100% or may be negative due to rounding, use of
derivatives, unsettled trades or other factors. Percentages may differ from the Con-
solidated SOI due to the underlying currency exposure on credit-linked notes, pass-
through notes and currency forward contracts and include the effect of interest
receivable balances.
**Rounds to less than 0.1%.
Manager’s Discussion
The Fund’s performance was significantly impacted by EM currency weakness. One of the largest detractors was the depreciation of the Brazilian real, as investors remained concerned about the country’s economic challenges. The central bank continued to tighten monetary policy and the government planned further fiscal consolidation, amid rising inflation and an extended recession. Additionally, a corruption scandal involving state-owned oil company Petrobras (Petroleo Brasileiro) eventually led to impeachment proceedings against President Dilma Rousseff, causing a degree of policy paralysis. At the security level, the Fund’s holdings of oil price-linked securities issued by the Republic of Venezuela detracted from performance during the period, as crude oil prices continued to fall.
In contrast, the Fund’s holdings of quasi-sovereign U.S. dollar-denominated debt of Ukrainian issuers City of Kyiv and Oschadbank (State Savings Bank of Ukraine) were significant contributors to performance. In late August, Ukraine reached an agreement with its key creditors to restructure the country’s sovereign debt, and the quasi-sovereign securities held by the Fund increased in value, in line with better sentiment toward
| | |
| Top 10 Holdings* | | |
| 1/31/16 | | |
| Issue | % of Total | |
| Sector, Country | Net Assets | |
| Government of Angola** | 4.7 | % |
| Foreign Government & Agency Securities, Angola | | |
| Government of Iraq** | 3.6 | % |
| Foreign Government & Agency Securities, Iraq | | |
| Government of Turkey | 3.5 | % |
| Foreign Government & Agency Securities, Turkey | | |
| Nota Do Tesouro Nacional | 3.3 | % |
| Foreign Government & Agency Securities, Brazil | | |
| SSB No. 1 PLC | 2.9 | % |
| Loan Participations & Assignments, Ukraine | | |
| Government of El Salvador | 2.7 | % |
| Foreign Government & Agency Securities, El Salvador | | |
| Government of Russia | 2.6 | % |
| Foreign Government & Agency Securities, Russia | | |
| Government of South Africa | 2.6 | % |
| Foreign Government & Agency Securities, South Africa | | |
| Government of Uruguay | 2.4 | % |
| Foreign Government & Agency Securities, Uruguay | | |
| Government of Venezuela*** | 2.3 | % |
| Foreign Government & Agency Securities, Venezuela | | |
*May differ from the Consolidated SOI because percentages include the effect of
interest receivable balances.
**Includes loan participations and assignments.
***Includes warrants.
Ukrainian debt overall. In December, the City of Kyiv made a partially successful offer to exchange some of the existing bonds held by the portfolio into sovereign bonds with a later maturity date and a principal reduction, plus a so-called Value Recovery Instrument. Although we did not participate in the exchange, Kyiv’s offer had a positive effect on our bond holdings. The Fund’s holding of a U.S. dollar-denominated bond issued by Grenada also contributed to performance after the country launched a debt exchange offer in October based on a restructuring deal made with creditors earlier in 2015.
On January 31, 2016, the Fund had exposure to 39 EM countries. The largest single country exposure was Brazil (6.2% of total net assets), followed by Ukraine (6.1%) and Russia (5.7%). Securities denominated in hard currencies constituted 72.6% of total net assets, with 66.7% denominated in the U.S. dollar, 3.3% in the euro, 2.6% in the Japanese yen and less than 0.1% in the Swiss franc. During the period, the Fund’s exposures to the Japanese yen and euro were fully hedged back into the U.S. dollar. In addition, 26.9% of total net assets were denominated in 12 EM currencies, of which the largest was the Brazilian real at 4.2% of total net assets. These figures may differ from the currency breakdown table because they do not
4 Semiannual Report
ftinstitutional.com
FRANKLIN EMERGING MARKET DEBT OPPORTUNITIES FUND
include the Fund’s holdings in currency forward contracts and other hedging instruments.
We thank you for your confidence in Franklin Emerging Market Debt Opportunities Fund and hope to serve your investment needs at the highest level of expectations.
CFA® is a trademark owned by CFA Institute.
The foregoing information reflects our analysis, opinions and portfolio holdings as of January 31, 2016, the end of the reporting period. The way we implement our main investment strategies and the resulting portfolio holdings may change depending on factors such as market and economic conditions. These opinions may not be relied upon as investment advice or an offer for a particular security. The information is not a complete analysis of every aspect of any market, country, industry, security or the Fund. Statements of fact are from sources considered reliable, but the investment manager makes no representation or warranty as to their completeness or accuracy. Although historical performance is no guarantee of future results, these insights may help you understand our investment management philosophy.
Stephanie Ouwendijk has been a portfolio manager of the Fund since December 2015, providing research and advice on the purchases and sales of individual securities, and portfolio risk assessment. Prior to joining Franklin Temple-ton Investments in 2015, she was a fund manager at Ashmore Group responsible for CEE and African quasi-sovereign debt. Before that, she was an analyst/portfolio assistant at Gulf International Bank Asset Management.

ftinstitutional.com
Semiannual Report 5
FRANKLIN EMERGING MARKET DEBT OPPORTUNITIES FUND
Performance Summary as of January 31, 2016
Your dividend income will vary depending on dividends or interest paid by securities in the Fund’s portfolio, adjusted for operating expenses. Capital gain distributions are net profits realized from the sale of portfolio securities. The performance table does not reflect any taxes that a shareholder would pay on Fund dividends, capital gain distributions, if any, or any realized gains on the sale of Fund shares. Total return reflects reinvestment of the Fund’s dividends and capital gain distributions, if any, and any unrealized gains or losses.
| | | | | | |
| Share Price | | | | | | |
| |
| Symbol: FEMDX | | 1/31/16 | | 7/31/15 | | Change |
| Net Asset Value | $ | 9.53 | $ | 10.72 | -$ | 1.19 |
| | |
| Distributions1 (8/1/15–1/31/16) | | |
| |
| | | Dividend |
| | | Income |
| | $ | 0.5901 |
| | | | | | | | | | | | |
| Performance2 | | | | | | | | | | | | |
| |
| | | | | | | Value of | Average Annual | | | | | |
| | Cumulative | | Average Annual | | $ | 50,000 | Total Return | | Total Annual Operating Expenses7 | |
| | Total Return3 | | Total Return4 | | | Investment5 | (12/31/15 | )6 | (with waiver) | | (without waiver) | |
| 6-Month | -5.75 | % | -5.75 | % | $ | 47,123 | | | 1.01 | % | 1.09 | % |
| 1-Year | -3.78 | % | -3.78 | % | $ | 48,110 | -2.38 | % | | | | |
| 5-Year | +12.52 | % | +2.39 | % | $ | 56,262 | +3.09 | % | | | | |
| Since Inception (5/24/06) | +76.97 | % | +6.07 | % | $ | 88,667 | +6.40 | % | | | | |
Performance data represent past performance, which does not guarantee future results. Investment return and principal value will fluctuate, and you may have a gain or loss when you sell your shares. Current performance may differ from figures shown. For most recent month-end performance, go to ftinstitutional.com or call a Franklin Templeton Institutional Services representative at (800) 321-8563.
See page 7 for Performance Summary footnotes.
6 Semiannual Report ftinstitutional.com
FRANKLIN EMERGING MARKET DEBT OPPORTUNITIES FUND
PERFORMANCE SUMMARY
All investments involve risks, including possible loss of principal. Special risks are associated with foreign investing including currency volatility, economic
instability, and social and political developments of countries where the Fund invests. Investments in emerging markets, of which frontier markets are a subset,
involve heightened risks related to the same factors, in addition to those associated with these markets’ smaller size, lesser liquidity and lack of established
legal, political, business and social frameworks to support securities markets. Because these frameworks are typically even less developed in frontier markets,
as well as various factors including the increased potential for extreme price volatility, illiquidity, trade barriers and exchange controls, the risks associated with
emerging markets are magnified in frontier markets. The risks associated with higher yielding, lower rated securities include higher risk of default and loss of
principal. In addition, interest rate movements will affect the Fund’s share price and yield. Prices of debt securities generally move in the opposite direction of
interest rates. Thus, as prices of debt securities in the Fund adjust to a rise in interest rates, the Fund’s share price may decline. The Fund is actively managed
but there is no guarantee that the manager’s investment decisions will produce the desired results. The Fund’s prospectus also includes a description of the
main investment risks.
1. The distribution amount is the sum of the dividend payments to shareholders for the period shown and includes only estimated tax basis net investment income.
2. The Fund has an expense reduction contractually guaranteed through at least 11/30/16, a waiver related to the management fee paid by a Fund subsidiary, and a fee waiver
associated with any investment in a Franklin Templeton money fund, contractually guaranteed through at least its current fiscal year-end. Fund investment results reflect the
expense reduction and fee waivers, to the extent applicable; without these reductions, the results would have been lower.
3. Cumulative total return represents the change in value of an investment over the periods indicated.
4. Average annual total return represents the average annual change in value of an investment over the periods indicated. Return for less than one year, if any, has not
been annualized.
5. These figures represent the value of a hypothetical $50,000 investment in the Fund over the periods indicated.
6. In accordance with SEC rules, we provide standardized average annual total return information through the latest calendar quarter.
7. Figures are as stated in the Fund’s current prospectus. In periods of market volatility, assets may decline significantly, causing total annual Fund operating expenses to
become higher than the figures shown.
ftinstitutional.com
Semiannual Report 7
FRANKLIN EMERGING MARKET DEBT OPPORTUNITIES FUND
Your Fund’s Expenses
As a Fund shareholder, you can incur two types of costs:
- Transaction costs, including sales charges (loads) on Fund purchases, if applicable; and
- Ongoing Fund costs, including management fees, distribution and service (12b-1) fees, if applicable, and other Fund expenses. All mutual funds have ongoing costs, sometimes referred to as operating expenses.
The following table shows ongoing costs of investing in the Fund and can help you understand these costs and compare them with those of other mutual funds. The table assumes a $1,000 investment held for the six months indicated.
Actual Fund Expenses
The first line (Actual) of the table provides actual account values and expenses. The “Ending Account Value” is derived from the Fund’s actual return, which includes the effect of Fund expenses.
You can estimate the expenses you paid during the period by following these steps. Of course, your account value and expenses will differ from those in this illustration:
1. Divide your account value by $1,000.
If an account had an $8,600 value, then $8,600 ÷ $1,000 = 8.6.
2. Multiply the result by the number under the heading “Expenses Paid During Period.”
If Expenses Paid During Period were $7.50, then 8.6 × $7.50 = $64.50.
In this illustration, the estimated expenses paid this period are $64.50.
Hypothetical Example for Comparison with Other Funds
Information in the second line (Hypothetical) of the table can help you compare ongoing costs of investing in the Fund with those of other mutual funds. This information may not be used to estimate the actual ending account balance or expenses you paid during the period. The hypothetical “Ending Account Value” is based on the Fund’s actual expense ratio and an assumed 5% annual rate of return before expenses, which does not represent the Fund’s actual return. The figure under the heading “Expenses Paid During Period” shows the hypothetical expenses your account would have incurred under this scenario. You can compare this figure with the 5% hypothetical examples that appear in shareholder reports of other funds.
Please note that expenses shown in the table are meant to highlight ongoing costs and do not reflect any transaction costs, such as sales charges. Therefore, the second line of the table is useful in comparing ongoing costs only, and will not help you compare total costs of owning different funds. In addition, if transaction costs were included, your total costs would have been higher. Please refer to the Fund prospectus for additional information on operating expenses.
| | | | | | |
| | | Beginning Account | | Ending Account | | Expenses Paid During |
| | | Value 8/1/15 | | Value 1/31/16 | | Period* 8/1/15–1/31/16 |
| Actual | $ | 1,000 | $ | 942.50 | $ | 4.88 |
| Hypothetical (5% return before expenses) | $ | 1,000 | $ | 1,020.11 | $ | 5.08 |
*Expenses are calculated using the most recent six-month annualized expense ratio, net of expense waivers, of 1.00%, multiplied by the aver-
age account value over the period, multiplied by 184/366 to reflect the one-half year period.
8 Semiannual Report
ftinstitutional.com
FRANKLIN GLOBAL TRUST
Consolidated Financial Highlights
Franklin Emerging Market Debt Opportunities Fund
| | | | | | | | | | | | | | | | | | |
| | | Six Months Ended | | | | | | Year Ended July 31, | | | | |
| | | January 31, 2016 | | | | | | | | | | | | | | | | |
| | | (unaudited) | | | 2015 | | | 2014 | | | 2013 | | | 2012 | | | 2011 | |
| Per share operating performance | | | | | | | | | | | | | | | | | | |
| (for a share outstanding throughout the period) | | | | | | | | | | | | | | | | | | |
| Net asset value, beginning of period | $ | 10.72 | | $ | 12.35 | | $ | 12.06 | | $ | 12.33 | | $ | 12.80 | | $ | 11.94 | |
| Income from investment operationsa: | | | | | | | | | | | | | | | | | | |
| Net investment incomeb | | 0.46 | | | 0.87 | | | 0.87 | | | 0.83 | | | 0.90 | | | 0.79 | |
| Net realized and unrealized gains (losses) | | (1.06 | ) | | (1.53 | ) | | 0.04 | | | (0.04 | ) | | (0.51 | ) | | 0.54 | |
| Total from investment operations | | (0.60 | ) | | (0.66 | ) | | 0.91 | | | 0.79 | | | 0.39 | | | 1.33 | |
| Less distributions from: | | | | | | | | | | | | | | | | | | |
| Net investment income | | (0.59 | ) | | (0.91 | ) | | (0.58 | ) | | (0.89 | ) | | (0.70 | ) | | (0.36 | ) |
| Net realized gains | | — | | | (0.06 | ) | | (0.04 | ) | | (0.17 | ) | | (0.16 | ) | | (0.11 | ) |
| Total distributions | | (0.59 | ) | | (0.97 | ) | | (0.62 | ) | | (1.06 | ) | | (0.86 | ) | | (0.47 | ) |
| Net asset value, end of period | $ | 9.53 | | $ | 10.72 | | $ | 12.35 | | $ | 12.06 | | $ | 12.33 | | $ | 12.80 | |
| |
| Total returnc | | (5.75 | )% | | (5.16 | )% | | 7.82 | % | | 6.40 | % | | 3.73 | % | | 11.40 | % |
| |
| Ratios to average net assetsd | | | | | | | | | | | | | | | | | | |
| Expenses before waiver and payments by | | | | | | | | | | | | | | | | | | |
| affiliates | | 1.04 | % | | 1.05 | % | | 1.10 | % | | 1.07 | % | | 1.09 | % | | 1.11 | % |
| Expenses net of waiver and payments by | | | | | | | | | | | | | | | | | | |
| affiliates | | 1.00 | %e | | 1.00 | %e | | 1.00 | %e | | 1.00 | %e | | 1.00 | % | | 1.00 | % |
| Net investment income | | 8.79 | % | | 7.78 | % | | 7.29 | % | | 6.63 | % | | 7.52 | % | | 6.38 | % |
| |
| Supplemental data | | | | | | | | | | | | | | | | | | |
| Net assets, end of period (000’s) | $ | 489,199 | | $ | 713,575 | | $ | 630,597 | | $ | 568,794 | | $ | 464,714 | | $ | 400,887 | |
| Portfolio turnover rate | | 13.04 | % | | 17.56 | % | | 29.70 | % | | 30.95 | % | | 33.17 | % | | 29.09 | % |
aThe amount shown for a share outstanding throughout the period may not correlate with the Consolidated Statement of Operations for the period due to the timing of sales
and repurchases of the Fund’s shares in relation to income earned and/or fluctuating fair value of the investments of the Fund.
bBased on average daily shares outstanding.
cTotal return is not annualized for periods less than one year.
dRatios are annualized for periods less than one year.
eBenefit of expense reduction rounds to less than 0.01%.
ftinstitutional.com The accompanying notes are an integral part of these consolidated financial statements. | Semiannual Report 9
| | | | | | |
| | F R A N K L I N G L O B A L T R U S T | | | | | |
| |
| |
| |
| | Consolidated Statement of Investments, January 31, 2016 (unaudited) | | | | |
| | Franklin Emerging Market Debt Opportunities Fund | | | | | |
| | | Country/ | | | | |
| | | Organization | Warrants | | | Value |
| | Warrants 2.1% | | | | | |
| | a Central Bank of Nigeria, wts., 11/15/20 | Nigeria | 64,000 | $ | | 6,240,000 |
| | a Government of Venezuela, Oil Value Recovery wts., 4/15/20 | Venezuela | 925,920 | | | 3,935,160 |
| | Total Warrants (Cost $29,514,666) | | | | | 10,175,160 |
| |
| | | | Principal | | | |
| | | | Amount* | | | |
| |
| Quasi-Sovereign and Corporate Bonds 30.1% | | | | | |
| | Banks 4.9% | | | | | |
| | b Fidelity Bank PLC, senior note, 144A, 6.875%, 5/09/18 | Nigeria | 12,100,000 | | | 9,732,937 |
| | c International Bank of Azerbaijan OJSC, senior note, Reg S, 5.625%, 6/11/19 | Azerbaijan | 12,000,000 | | | 10,050,000 |
| | b National Savings Bank, senior note, 144A, 8.875%, 9/18/18 | Sri Lanka | 4,000,000 | | | 4,100,000 |
| | | | | | | 23,882,937 |
| | Chemicals 0.8% | | | | | |
| | b Braskem Finance Ltd., senior note, 144A, 5.375%, 5/02/22 | Brazil | 4,450,000 | | | 3,922,341 |
| | Commercial Services & Supplies 1.0% | | | | | |
| | c Red de Carreteras de Occidente Sapib de CV, secured bond, Reg S, 9.00%, | | | | | |
| | 6/10/28 | Mexico | 90,000,000 | MXN | 4,992,927 |
| | Diversified Financial Services 1.6% | | | | | |
| | b,d Astana Finance JSC, secured note, 144A, zero cpn., 12/22/24 | Kazakhstan | 136,566 | | | 1,366 |
| | d,e,f Sphynx Capital Markets (National Investment Bank of Ghana), PTN, zero cpn., | | | | | |
| | 2/05/09 | Ghana | 8,000,000 | | | 7,781,066 |
| | | | | | | 7,782,432 |
| | Diversified Telecommunication Services 3.5% | | | | | |
| | c Empresa de Telecommunicaciones de Bogota SA, senior note, Reg S, 7.00%, | | | | | |
| | 1/17/23 | Colombia | 26,200,000,000 | COP | 6,571,272 |
| b MTN(Mauritius) Investments Ltd., 144A, 4.755%, 11/11/24 | South Africa | 7,500,000 | | | 6,579,150 |
| | c Oi SA, senior note, Reg S, 9.75%, 9/15/16 | Brazil | 24,500,000 | BRL | 4,112,640 |
| | | | | | | 17,263,062 |
| | Food & Staples Retailing 1.2% | | | | | |
| | b JBS Investments GmbH, senior note, 144A, 7.25%, 4/03/24 | Brazil | 7,300,000 | | | 5,908,438 |
| | Industrial Conglomerates 1.0% | | | | | |
| | b Yasar Holdings SA, senior note, 144A, 8.875%, 5/06/20 | Turkey | 5,000,000 | | | 5,125,000 |
| | Metals & Mining 2.2% | | | | | |
| | b Ferrexpo Finance PLC, senior note, 144A, 10.375%, 4/07/19 | Ukraine | 10,000,000 | | | 5,415,000 |
| | c Vedanta Resources PLC, senior note, Reg S, 9.50%, 7/18/18 | India | 7,700,000 | | | 5,548,812 |
| | | | | | | 10,963,812 |
| | Municipal Bonds 4.4% | | | | | |
| | c Bogota Distrito Capital, senior note, Reg S, 9.75%, 7/26/28 | Colombia | 10,401,000,000 | COP | 3,370,621 |
| | Province de Neuquen, senior secured note, | | | | | |
| | b 144A, 7.875%, 4/26/21 | Argentina | 4,672,000 | | | 4,610,820 |
| | c Reg S, 7.875%, 4/26/21 | Argentina | 5,427,200 | | | 5,356,131 |
| | Province of Salta Argentina, senior secured note, | | | | | |
| | b 144A, 9.50%, 3/16/22 | Argentina | 3,309,300 | | | 3,358,940 |
| | c Reg S, 9.50%, 3/16/22 | Argentina | 4,643,316 | | | 4,712,965 |
| | | | | | | 21,409,477 |
| | Oil, Gas & Consumable Fuels 3.9% | | | | | |
| | b Georgian Oil & Gas Corp., 144A, 6.875%, 5/16/17 | Georgia | 8,550,000 | | | 8,480,531 |
10 Semiannual Report
ftinstitutional.com
FRANKLIN GLOBAL TRUST
CONSOLIDATED STATEMENT OF INVESTMENTS (UNAUDITED)
| | | | | | |
| Franklin Emerging Market Debt Opportunities Fund (continued) | | | | | | |
| |
| | | Country/ | Principal | | | |
| | | Organization | Amount* | | | Value |
| |
| Quasi-Sovereign and Corporate Bonds (continued) | | | | | | |
| Oil, Gas & Consumable Fuels (continued) | | | | | | |
| Petroleum Co. of Trinidad and Tobago Ltd., senior bond, | | | | | | |
| b 144A, 6.00%, 5/08/22 | | Trinidad and Tobago | 3,087,500 | $ | | 2,790,328 |
| c Reg S, 6.00%, 5/08/22 | | Trinidad and Tobago | 1,408,333 | | | 1,272,782 |
| c State Oil Co., Government of Azerbaijan, senior note, Reg S, 4.75%, | | | | | | |
| 3/13/23 | | Azerbaijan | 7,800,000 | | | 6,440,928 |
| | | | | | | 18,984,569 |
| Paper & Forest Products 0.8% | | | | | | |
| b Masisa SA, senior note, 144A, 9.50%, 5/05/19 | | Chile | 4,300,000 | | | 3,824,313 |
| Road & Rail 1.7% | | | | | | |
| b Georgian Railway LLC, senior bond, 144A, 7.75%, 7/11/22 | | Georgia | 2,900,000 | | | 2,943,892 |
| b Kazakhstan Temir Zholy Finance BV, senior bond, 144A, 6.95%, 7/10/42 | | Kazakhstan | 6,250,000 | | | 5,304,687 |
| | | | | | | 8,248,579 |
| Specialty Retail 0.8% | | | | | | |
| b Edcon Ltd., secured note, 144A, 9.50%, 3/01/18 | | South Africa | 6,800,000 | EUR | 3,757,231 |
| Textiles, Apparel & Luxury Goods 1.0% | | | | | | |
| b Golden Legacy Pte. Ltd., senior note, 144A, 9.00%, 4/24/19 | | Indonesia | 5,000,000 | | | 4,815,625 |
| Wireless Telecommunication Services 1.3% | | | | | | |
| b Millicom International Cellular SA, senior note, 144A, 6.625%, 10/15/21 | | Luxembourg | 6,900,000 | | | 6,175,500 |
| Total Quasi-Sovereign and Corporate Bonds | | | | | | |
| (Cost $172,623,379) | | | | | | 147,056,243 |
| |
| g Loan Participations and Assignments 19.0% | | | | | | |
| b Alfa Bond Issuance PLC (Alfa Bank OJSC), 144A, 7.50%, 9/26/19 | | Russia | 5,000,000 | | | 5,087,775 |
| b Ardshininvestbank CJSC, senior note, 144A, 12.00%, 7/29/20 | | Republic of Armenia | 6,620,000 | | | 6,367,613 |
| c,e Credit Suisse First Boston International (City of Kyiv), secured bond, Reg S, | | | | | | |
| 8.00%, 11/06/15 | | Ukraine | 11,975,000 | | | 9,876,980 |
| h,i Development Bank of South Africa Ltd. (Government of Angola), | | | | | | |
| Tranche 2, senior note, FRN, 7.045%, 12/20/23 | | Angola | 11,900,000 | | | 10,157,796 |
| Tranche 3B, senior note, FRN, 7.045%, 12/20/23 | | Angola | 11,200,000 | | | 9,560,279 |
| h,i Ethiopian Railway Corp. (Republic of Ethiopia), FRN, | | | | | | |
| 4.084%, 8/02/21 | | Ethiopia | 479,288 | | | 428,474 |
| 4.089%, 8/02/21 | | Ethiopia | 312,061 | | | 278,976 |
| 4.146%, 8/02/21 | | Ethiopia | 97,644 | | | 87,292 |
| 4.156%, 8/02/21 | | Ethiopia | 320,423 | | | 286,452 |
| 4.161%, 8/02/21 | | Ethiopia | 293,582 | | | 262,456 |
| 4.187%, 8/02/21 | | Ethiopia | 205,967 | | | 184,129 |
| 4.23%, 8/02/21 | | Ethiopia | 7,591,035 | | | 6,786,231 |
| c FBN Finance Co. BV (First Bank of Nigeria Ltd.), sub. note, Reg S, 8.00% | | | | | | |
| to 7/23/19, FRN thereafter, 7/23/21 | | Nigeria | 7,800,000 | | | 5,908,266 |
| h,i Government of Iraq, Tranche A3, Sumitomo Corp. Loan, FRN, 0.625%, | | | | | | |
| 1/01/28 | | Iraq | 297,342,212 | JPY | 1,292,905 |
| h,i Merrill Lynch & Co. Inc. (Government of Iraq), FRN, 0.625%, 1/01/28 | | Iraq | 520,366,882 | JPY | 2,262,663 |
| c Mozambique EMATUM Finance 2020 BV (Republic of Mozambique), senior | | | | | | |
| note, Reg S, 6.305%, 9/11/20 | | Mozambique | 13,832,000 | | | 10,961,860 |
| e,i NK Debt Corp., | | | | | | |
| b 144A, zero cpn., 3/12/20 | | North Korea | 4,250,000 | DEM | — |
| c Reg S, zero cpn., 3/12/20 | | North Korea | 2,000,000 | CHF | — |
| c Reg S, zero cpn., 3/12/20 | | North Korea | 18,000,000 | DEM | — |
ftinstitutional.com
Semiannual Report 11
FRANKLIN GLOBAL TRUST
CONSOLIDATED STATEMENT OF INVESTMENTS (UNAUDITED)
| | | | | |
| Franklin Emerging Market Debt Opportunities Fund (continued) | | | | |
| |
| | Country/ | Principal | | | |
| | Organization | Amount* | | | Value |
| |
| g Loan Participations and Assignments (continued) | | | | | |
| b RSHB Capital SA (Russian Agricultural Bank OJSC), senior sub. note, | | | | | |
| 144A, 6.00% to 6/03/16, FRN thereafter, 6/03/21 | Russia | 6,000,000 | | $ | 5,738,040 |
| c RZD Capital PLC (Russian Railways), senior bond, Reg S, 5.70%, | | | | | |
| 4/05/22 | Russia | 4,000,000 | | | 3,853,900 |
| b SSB No. 1 PLC (OJSC State Savings Bank of Ukraine), senior note, | | | | | |
| 144A, 9.625%, 3/20/25 | Ukraine | 15,800,000 | | | 13,515,320 |
| Total Loan Participations and Assignments | | | | | |
| (Cost $105,490,892) | | | | | 92,897,407 |
| Foreign Government and Agency Securities 44.0% | | | | | |
| Banque Centrale de Tunisie International Bond, | | | | | |
| c Reg S, 4.50%, 6/22/20 | Tunisia | 1,261,000 | EUR | | 1,334,049 |
| senior bond, 4.30%, 8/02/30 | Tunisia | 610,000,000 | JPY | | 4,192,024 |
| senior bond, 4.20%, 3/17/31 | Tunisia | 680,000,000 | JPY | | 4,559,668 |
| b Government of Angola, senior note, 144A, 9.50%, 11/12/25 | Angola | 3,650,000 | | | 3,044,885 |
| e Government of Argentina, 11.75%, 5/20/11 | Argentina | 3,000,000 | DEM | | 1,778,127 |
| b Government of Armenia, 144A, 7.15%, 3/26/25 | Republic of Armenia | 5,000,000 | | | 4,794,250 |
| h Government of Bosnia & Herzegovina, | | | | | |
| FRN, 0.813%, 12/11/17 | Bosnia & Herzegovina | 1,400,000 | DEM | | 700,865 |
| c senior bond, B, Reg S, FRN, 0.813%, 12/11/21 | Bosnia & Herzegovina | 17,571,000 | DEM | | 8,279,276 |
| b Government of Cameroon, senior note, 144A, 9.50%, 11/19/25 | Cameroon | 10,400,000 | | | 8,958,612 |
| c Government of El Salvador, senior bond, Reg S, 7.65%, 6/15/35 | El Salvador | 16,400,000 | | | 13,031,522 |
| b Government of Gabon, 144A, 6.95%, 6/16/25 | Gabon | 8,700,000 | | | 6,679,120 |
| Government of Ghana, | | | | | |
| 25.40%, 7/31/17 | Ghana | 10,000,000 | GHS | | 2,572,023 |
| 23.00%, 8/21/17 | Ghana | 10,000,000 | GHS | | 2,507,340 |
| b Government of Grenada, senior bond, 144A, 5.31% to 5/16/16, 7.00% | | | | | |
| thereafter, 5/12/30 | Grenada | 9,422,000 | | | 5,229,210 |
| c Government of Iraq, Reg S, 5.80%, 1/15/28 | Iraq | 22,100,000 | | | 13,945,873 |
| Government of Jamaica, senior bond, 7.875%, 7/28/45 | Jamaica | 3,700,000 | | | 3,567,004 |
| b Government of Kazakhstan, senior bond, 144A, 4.875%, 10/14/44 | Kazakhstan | 3,000,000 | | | 2,480,070 |
| c Government of Kenya, senior note, Reg S, 6.875%, 6/24/24 | Kenya | 3,500,000 | | | 3,133,918 |
| c Government of Mongolia, Reg S, 5.125%, 12/05/22 | Mongolia | 10,500,000 | | | 7,844,602 |
| Government of Russia, 7.50%, 3/15/18 | Russia | 970,000,000 | RUB | | 12,292,149 |
| c Government of Rwanda, Reg S, 6.625%, 5/02/23 | Rwanda | 1,700,000 | | | 1,587,919 |
| c Government of Seychelles, Reg S, 7.00% to 1/01/18, 8.00% thereafter, | | | | | |
| 1/01/26 | Republic of Seychelles | 10,500,000 | | | 10,011,750 |
| Government of South Africa, 8.00%, 12/21/18 | South Africa | 200,000,000 | ZAR | | 12,438,813 |
| Government of Turkey, 8.20%, 11/16/16 | Turkey | 50,000,000 | TRY | | 16,600,514 |
| Government of Uganda, | | | | | |
| 10.25%, 4/21/16 | Uganda | 3,000,000,000 | UGX | | 841,132 |
| 16.75%, 2/23/17 | Uganda | 5,334,500,000 | UGX | | 1,449,818 |
| 10.75%, 2/22/18 | Uganda | 2,200,000,000 | UGX | | 511,614 |
| 14.625%, 11/01/18 | Uganda | 1,221,800,000 | UGX | | 294,012 |
| j Government of Uruguay, senior bond, Index Linked, 3.70%, 6/26/37 | Uruguay | 479,327,435 | UYU | | 11,890,577 |
| c Government of Venezuela, | | | | | |
| Reg S, 6.00%, 12/09/20 | Venezuela | 12,800,000 | | | 4,232,384 |
| senior bond, Reg S, 7.65%, 4/21/25 | Venezuela | 9,000,000 | | | 2,990,520 |
| International Finance Corp., senior note, | | | | | |
| 7.75%, 12/03/16 | Supranationalk | 300,000,000 | INR | | 4,468,397 |
| 6.45%, 10/30/18 | Supranationalk | 200,000,000 | INR | | 2,940,760 |
| Kenya Infrastructure Bond, 11.00%, 9/15/25 | Kenya | 700,000,000 | KES | | 5,912,737 |
12 Semiannual Report
ftinstitutional.com
FRANKLIN GLOBAL TRUST
CONSOLIDATED STATEMENT OF INVESTMENTS (UNAUDITED)
| | | | | |
| Franklin Emerging Market Debt Opportunities Fund (continued) | | | | | |
| | Country/ | | Principal | | |
| | Organization | | Amount* | | Value |
| Foreign Government and Agency Securities (continued) | | | | | |
| j Mexican Udibonos, Index Linked, 4.00%, 11/15/40 | Mexico | | 1,785,154l MXN | $ | 10,139,685 |
| m Nota Do Tesouro Nacional, Index Linked, 6.00%, 8/15/30 | Brazil | | 25,200n BRL | | 15,601,210 |
| c,h Tanzania Government International Bond, Reg S, FRN, 6.538%, 3/09/20 | United Republic | | | | |
| | of Tanzania | | 2,800,000 | | 2,668,834 |
| Total Foreign Government and Agency Securities | | | | | |
| (Cost $277,544,650) | | | | | 215,505,263 |
| |
| | | | Shares/Units | | |
| Common Stocks (Cost $—) 0.0% | | | | | |
| d,o Astana Finance JSC, GDR, 144A | Kazakhstan | | 193,625 | | — |
| Private Limited Partnership Fund (Cost $4,600,000) 0.1% | | | | | |
| Diversified Financial Services 0.1% | | | | | |
| a,i,o,p Global Distressed Alpha Fund III LP | Bermuda | | 4,424,861 | | 648,450 |
| Total Investments before Short Term Investments | | | | | |
| (Cost $589,773,587) | | | | | 466,282,523 |
| |
| | | | Principal | | |
| | | | Amount* | | |
| Short Term Investments 2.5% | | | | | |
| Foreign Government and Agency Securities 1.9% | | | | | |
| q Uganda Treasury Bill, 5/26/16 | Uganda | | 11,280,000,000 | UGX | 3,066,750 |
| q Zambia Treasury Bill, 3/21/16 - 5/02/16 | Zambia | | 72,375,000 | ZMW | 6,136,631 |
| Total Foreign Government and Agency Securities | | | | | |
| (Cost $11,697,450) | | | | | 9,203,381 |
| U.S. Government and Agency Securities | | | | | |
| (Cost $149,997) 0.0%† | | | | | |
| a,q U.S. Treasury Bill, 2/04/16 | United States | | 150,000 | | 149,998 |
| Total Investments before Money Market Funds | | | | | |
| (Cost $601,621,034) | | | | | 475,635,902 |
| |
| | | | Shares | | |
| Money Market Funds (Cost $2,879,428) 0.6% | | | | | |
| o,r Institutional Fiduciary Trust Money Market Portfolio | United States | | 2,879,428 | | 2,879,428 |
| Total Investments (Cost $604,500,462) 97.8% | | | | | 478,515,330 |
| Other Assets, less Liabilities 2.2% | | | | | 10,683,253 |
| Net Assets 100.0% | | $ | 489,198,583 |
ftinstitutional.com
Semiannual Report 13
FRANKLIN GLOBAL TRUST
CONSOLIDATED STATEMENT OF INVESTMENTS (UNAUDITED)
Franklin Emerging Market Debt Opportunities Fund (continued)
†Rounds to less than 0.1% of net assets.
*The principal amount is stated in U.S. dollars unless otherwise indicated.
aThe security is owned by Alternative Strategies (FT) Ltd., a wholly-owned subsidiary of the Fund. See Note 1(f).
bSecurity was purchased pursuant to Rule 144A under the Securities Act of 1933 and may be sold in transactions exempt from registration only to qualified institutional buyers
or in a public offering registered under the Securities Act of 1933. These securities have been deemed liquid under guidelines approved by the Trust’s Board of Trustees. At
January 31, 2016, the aggregate value of these securities was $148,740,994, representing 30.41% of net assets.
cSecurity was purchased pursuant to Regulation S under the Securities Act of 1933, which exempts from registration securities offered and sold outside of the United States.
Such a security cannot be sold in the United States without either an effective registration statement filed pursuant to the Securities Act of 1933, or pursuant to an exemption
from registration. These securities have been deemed liquid under guidelines approved by the Trust’s Board of Trustees. At January 31, 2016, the aggregate value of these
securities was $152,090,731, representing 31.09% of net assets.
dSecurity has been deemed illiquid because it may not be able to be sold within seven days. At January 31, 2016, the aggregate value of these securities was $7,782,432,
representing 1.59% of net assets.
eSee Note 7 regarding defaulted securities.
fRepresents claims that have been filed with a Ghanaian court against National Investment Bank of Ghana.
gSee Note 1(e) regarding loan participations and assignments.
hThe coupon rate shown represents the rate at period end.
iSee Note 9 regarding restricted securities.
jPrincipal amount of security is adjusted for inflation. See Note 1(h).
kA supranational organization is an entity formed by two or more central governments through international treaties.
lPrincipal amount is stated in Unidad de Inversion Units.
mRedemption price at maturity is adjusted for inflation. See Note 1(h).
nPrincipal amount is stated in 1,000 Brazilian Real Units.
oNon-income producing.
pThe Global Distressed Alpha Fund III LP is a fund focused on the purchase of and the recovery on private distressed commercial, sovereign and sovereign-related debt
claims around the world, principally in Africa and Asia.
qThe security is traded on a discount basis with no stated coupon rate.
rSee Note 3(d) regarding investments in affiliated management investment companies.
| | | | | | | | | | | |
| At January 31, 2016, the Fund had the following forward exchange contracts outstanding. See Note 1(c). | | | | | |
| |
| Forward Exchange Contracts | | | | | | | | | | | |
| | | | | | Contract | Settlement | | Unrealized | | Unrealized | |
| Currency | Counterpartya Type | Quantity | | Amount | Date | | Appreciation | | Depreciation | |
| OTC Forward Exchange Contracts | | | | | | | | | | | |
| Brazilian Real | DBAB | Buy | 23,500,000 | $ | 5,879,410 | 3/02/16 | $ | 44,801 | $ | (104,039 | ) |
| Brazilian Real | DBAB | Sell | 61,000,000 | | 15,472,558 | 3/02/16 | | 364,876 | | — | |
| Brazilian Real | DBAB | Buy | 11,500,000 | | 2,796,693 | 3/09/16 | | 44,694 | | — | |
| Brazilian Real | DBAB | Sell | 55,000,000 | | 14,326,648 | 3/09/16 | | 737,408 | | — | |
| Euro | CITI | Sell | 5,500,000 | | 6,040,650 | 3/15/16 | | 74,812 | | — | |
| Euro | MSCO | Sell | 5,500,000 | | 6,042,941 | 3/15/16 | | 77,104 | | — | |
| Euro | RBCCM | Sell | 5,600,000 | | 6,146,840 | 3/15/16 | | 72,533 | | — | |
| Japanese Yen | CITI | Sell | 500,000,000 | | 4,128,949 | 3/15/16 | | — | | (5,885 | ) |
| Japanese Yen | MSCO | Sell | 600,000,000 | | 4,952,882 | 3/15/16 | | — | | (8,918 | ) |
| Japanese Yen | RBCCM | Sell | 500,000,000 | | 4,125,736 | 3/15/16 | | — | | (9,098 | ) |
| Swiss Franc | RBCCM | Buy | 6,200,000 | | 6,195,754 | 3/15/16 | | — | | (132,509 | ) |
| Swiss Franc | RBCCM | Sell | 6,200,000 | | 6,307,659 | 3/15/16 | | 244,414 | | — | |
| Total Forward Exchange Contracts | | | | | | | $ | 1,660,642 | $ | (260,449 | ) |
| Net unrealized appreciation (depreciation) | | | | | | $ | 1,400,193 | | | |
aMay be comprised of multiple contracts with the same counterparty, currency and settlement date.
See Abbreviations on page 28.
14 Semiannual Report | The accompanying notes are an integral part of these consolidated financial statements. ftinstitutional.com
FRANKLIN GLOBAL TRUST
CONSOLIDATED FINANCIAL STATEMENTS
Consolidated Statement of Assets and Liabilities
January 31, 2016 (unaudited)
| | | |
| Franklin Emerging Market Debt Opportunities Fund | | | |
| |
| Assets: | | | |
| Investments in securities: | | | |
| Cost - Unaffiliated issuers | $ | 601,621,034 | |
| Cost - Non-controlled affiliates (Note 3d) | | 2,879,428 | |
| Total cost of investments | $ | 604,500,462 | |
| Value - Unaffiliated issuers | $ | 475,635,902 | |
| Value - Non-controlled affiliates (Note 3d) | | 2,879,428 | |
| Total value of investments | | 478,515,330 | |
| Cash | | 2,334,491 | |
| Restricted Cash (Note 1d) | | 1,470,000 | |
| Foreign currency, at value (Cost $918,991) | | 922,318 | |
| Receivables: | | | |
| Capital shares sold | | 230,149 | |
| Interest | | 8,323,437 | |
| Unrealized appreciation on OTC forward exchange contracts | | 1,660,642 | |
| Other assets | | 12 | |
| Total assets | | 493,456,379 | |
| Liabilities: | | | |
| Payables: | | | |
| Investment securities purchased | | 1,370,470 | |
| Capital shares redeemed | | 435,471 | |
| Management fees | | 442,778 | |
| Transfer agent fees | | 5,984 | |
| Trustees’ fees and expenses | | 1,117 | |
| Due to brokers | | 1,470,000 | |
| Unrealized depreciation on OTC forward exchange contracts | | 260,449 | |
| Deferred tax | | 190,846 | |
| Accrued expenses and other liabilities | | 80,681 | |
| Total liabilities | | 4,257,796 | |
| Net assets, at value | $ | 489,198,583 | |
| Net assets consist of: | | | |
| Paid-in capital | $ | 640,689,885 | |
| Distributions in excess of net investment income | | (1,321,389 | ) |
| Net unrealized appreciation (depreciation) | | (124,687,263 | ) |
| Accumulated net realized gain (loss) | | (25,482,650 | ) |
| Net assets, at value | $ | 489,198,583 | |
| Shares outstanding | | 51,335,290 | |
| Net asset value and maximum offering price per share | $ | 9.53 | |
ftinstitutional.com The accompanying notes are an integral part of these consolidated financial statements. | Semiannual Report 15
FRANKLIN GLOBAL TRUST
CONSOLIDATED FINANCIAL STATEMENTS
Consolidated Statement of Operations
for the six months ended January 31, 2016 (unaudited)
| | | |
| Franklin Emerging Market Debt Opportunities Fund | | | |
| |
| Investment income: | | | |
| Dividends | $ | 3,617,295 | |
| Interest | | 26,078,207 | |
| Inflation principal adjustments | | 2,725,089 | |
| Total investment income | | 32,420,591 | |
| Expenses: | | | |
| Management fees (Note 3a) | | 3,237,354 | |
| Transfer agent fees (Note 3c) | | 21,600 | |
| Custodian fees (Note 4) | | 111,924 | |
| Reports to shareholders | | 11,514 | |
| Registration and filing fees | | 28,577 | |
| Professional fees | | 8,499 | |
| Trustees’ fees and expenses | | 12,388 | |
| Other | | 10,196 | |
| Total expenses | | 3,442,052 | |
| Expense reductions (Note 4) | | (264 | ) |
| Expenses waived/paid by affiliates (Notes 3d and 3e) | | (130,706 | ) |
| Net expenses | | 3,311,082 | |
| Net investment income | | 29,109,509 | |
| Realized and unrealized gains (losses): | | | |
| Net realized gain (loss) from: | | | |
| Investments | | (24,377,176 | ) |
| Foreign currency transactions | | (695,227 | ) |
| Net realized gain (loss) | | (25,072,403 | ) |
| Net change in unrealized appreciation (depreciation) on: | | | |
| Investments | | (44,860,473 | ) |
| Translation of other assets and liabilities denominated in foreign currencies | | 206,497 | |
| Change in deferred taxes on unrealized appreciation | | (46,057 | ) |
| Net change in unrealized appreciation (depreciation) | | (44,700,033 | ) |
| Net realized and unrealized gain (loss) | | (69,772,436 | ) |
| Net increase (decrease) in net assets resulting from operations | $ | (40,662,927 | ) |
16 Semiannual Report | The accompanying notes are an integral part of these consolidated financial statements. ftinstitutional.com
FRANKLIN GLOBAL TRUST
CONSOLIDATED FINANCIAL STATEMENTS
| | | | | | |
| Consolidated Statements of Changes in Net Assets | | | | | | |
| |
| Franklin Emerging Market Debt Opportunities Fund | | | | | | |
| | | Six Months Ended | | | | |
| | | January 31, 2016 | | | Year Ended | |
| | | (unaudited) | | | July 31, 2015 | |
| Increase (decrease) in net assets: | | | | | | |
| Operations: | | | | | | |
| Net investment income | $ | 29,109,509 | | $ | 51,173,141 | |
| Net realized gain (loss) | | (25,072,403 | ) | | (8,992,026 | ) |
| Net change in unrealized appreciation (depreciation) | | (44,700,033 | ) | | (74,139,370 | ) |
| Net increase (decrease) in net assets resulting from operations | | (40,662,927 | ) | | (31,958,255 | ) |
| Distributions to shareholders from: | | | | | | |
| Net investment income | | (36,997,804 | ) | | (47,966,524 | ) |
| Net realized gains | | – | | | (3,266,613 | ) |
| Total distributions to shareholders | | (36,997,804 | ) | | (51,233,137 | ) |
| Capital share transactions (Note 2) | | (146,715,986 | ) | | 166,169,622 | |
| Net increase (decrease) in net assets | | (224,376,717 | ) | | 82,978,230 | |
| Net assets: | | | | | | |
| Beginning of period | | 713,575,300 | | | 630,597,070 | |
| End of period | $ | 489,198,583 | | $ | 713,575,300 | |
| Undistributed net investment income (distributions in excess of net investment income) included in | | | | | | |
| net assets: | | | | | | |
| End of period | $ | (1,321,389 | ) | $ | 6,566,906 | |
ftinstitutional.com The accompanying notes are an integral part of these consolidated financial statements. | Semiannual Report 17
FRANKLIN GLOBAL TRUST
Notes to Consolidated Financial Statements (unaudited)
Franklin Emerging Market Debt Opportunities Fund
1. Organization and Significant Accounting Policies
Franklin Global Trust (Trust) is registered under the Investment Company Act of 1940 (1940 Act) as an open-end management investment company, consisting of six separate funds and applies the specialized accounting and reporting guidance in U.S. Generally Accepted Accounting Principles (U.S. GAAP). Franklin Emerging Market Debt Opportunities Fund (Fund) is included in this report. The financial statements of the remaining funds in the Trust are presented separately.
The following summarizes the Fund’s significant accounting policies.
a. Financial Instrument Valuation
The Fund’s investments in financial instruments are carried at fair value daily. Fair value is the price that would be received to sell an asset or paid to transfer a liability in an orderly transaction between market participants on the measurement date. The Fund calculates the net asset value (NAV) per share as of 4 p.m. Eastern time each day the New York Stock Exchange (NYSE) is open for trading. Under compliance policies and procedures approved by the Trust’s Board of Trustees (the Board), the Fund’s administrator has responsibility for oversight of valuation, including leading the cross-functional Valuation and Liquidity Oversight Committee (VLOC). The VLOC provides administration and oversight of the Fund’s valuation policies and procedures, which are approved annually by the Board. Among other things, these procedures allow the Fund to utilize independent pricing services, quotations from securities and financial instrument dealers, and other market sources to determine fair value.
Equity securities listed on an exchange or on the NASDAQ National Market System are valued at the last quoted sale price or the official closing price of the day, respectively. Foreign equity securities are valued as of the close of trading on the foreign stock exchange on which the security is primarily traded or as of 4 p.m. Eastern time whichever is earlier. The value is then converted into its U.S. dollar equivalent at the foreign exchange rate in effect at 4 p.m. Eastern time on the day that the value of the security is determined. Over-the-counter (OTC) securities are valued within the range of the most recent quoted bid and ask prices. Securities that trade in multiple markets or on multiple exchanges are valued according to the broadest and most representative market. Certain equity securities are valued based upon fundamental characteristics or relationships to similar securities.
Debt securities generally trade in the OTC market rather than on a securities exchange. The Fund’s pricing services use multiple valuation techniques to determine fair value. In instances where sufficient market activity exists, the pricing services may utilize a market-based approach through which quotes from market makers are used to determine fair value. In instances where sufficient market activity may not exist or is limited, the pricing services also utilize proprietary valuation models which may consider market characteristics such as benchmark yield curves, credit spreads, estimated default rates, anticipated market interest rate volatility, coupon rates, anticipated timing of principal repayments, underlying collateral, and other unique security features in order to estimate the relevant cash flows, which are then discounted to calculate the fair value. Securities denominated in a foreign currency are converted into their U.S. dollar equivalent at the foreign exchange rate in effect at 4 p.m. Eastern time on the date that the values of the foreign debt securities are determined.
Investments in open-end mutual funds are valued at the closing NAV.
Certain derivative financial instruments (derivatives) trade in the OTC market. The Fund’s pricing services use various techniques including industry standard option pricing models and proprietary discounted cash flow models to determine the fair value of those instruments. The Fund’s net benefit or obligation under the derivative contract, as measured by the fair value of the contract, is included in net assets.
The Fund has procedures to determine the fair value of financial instruments for which market prices are not reliable or readily available. Under these procedures, the VLOC convenes on a regular basis to review such financial instruments and considers a number of factors, including significant unobservable valuation inputs, when arriving at fair value. The VLOC primarily employs a market-based approach which may use related or comparable assets or liabilities, recent transactions, market multiples, book values, and other relevant information for the investment to determine the fair value of the investment. An income-based valuation approach may also be used in which the anticipated future cash flows of the investment are discounted to calculate fair value. Discounts may also be applied due to the nature or duration of any restrictions on the disposition of the investments. Due to the inherent uncertainty of valuations of such investments, the fair values may differ significantly from the values that would have been used had an active market existed. The VLOC employs various methods for calibrating
18 Semiannual Report
ftinstitutional.com
FRANKLIN GLOBAL TRUST
NOTES TO CONSOLIDATED FINANCIAL STATEMENTS (UNAUDITED)
Franklin Emerging Market Debt Opportunities Fund (continued)
these valuation approaches including a regular review of key inputs and assumptions, transactional back-testing or disposition analysis, and reviews of any related market activity.
Trading in securities on foreign securities stock exchanges and OTC markets may be completed before 4 p.m. Eastern time. In addition, trading in certain foreign markets may not take place on every NYSE business day. Occasionally, events occur between the time at which trading in a foreign security is completed and the close of the NYSE that might call into question the reliability of the value of a portfolio security held by the Fund. As a result, differences may arise between the value of the Fund’s portfolio securities as determined at the foreign market close and the latest indications of value at the close of the NYSE. In order to minimize the potential for these differences, the VLOC monitors price movements following the close of trading in foreign stock markets through a series of country specific market proxies (such as baskets of American Depositary Receipts, futures contracts and exchange traded funds). These price movements are measured against established trigger thresholds for each specific market proxy to assist in determining if an event has occurred that may call into question the reliability of the values of the foreign securities held by the Fund. If such an event occurs, the securities may be valued using fair value procedures, which may include the use of independent pricing services.
When the last day of the reporting period is a non-business day, certain foreign markets may be open on those days that the NYSE is closed, which could result in differences between the value of the Fund’s portfolio securities on the last business day and the last calendar day of the reporting period. Any significant security valuation changes due to an open foreign market are adjusted and reflected by the Fund for financial reporting purposes.
b. Foreign Currency Translation
Portfolio securities and other assets and liabilities denominated in foreign currencies are translated into U.S. dollars based on the exchange rate of such currencies against U.S. dollars on the date of valuation. The Fund may enter into foreign currency exchange contracts to facilitate transactions denominated in a foreign currency. Purchases and sales of securities, income and expense items denominated in foreign currencies are translated into U.S. dollars at the exchange rate in effect on the transaction date. Portfolio securities and assets and liabilities denominated in foreign currencies contain risks that those currencies will decline in value relative to the U.S. dollar. Occasionally, events may impact the availability or reliability of foreign exchange rates used to convert the U.S. dollar equivalent value. If such an event occurs, the foreign exchange rate will be valued at fair value using procedures established and approved by the Board.
The Fund does not separately report the effect of changes in foreign exchange rates from changes in market prices on securities held. Such changes are included in net realized and unrealized gain or loss from investments in the Consolidated Statement of Operations.
Realized foreign exchange gains or losses arise from sales of foreign currencies, currency gains or losses realized between the trade and settlement dates on securities transactions and the difference between the recorded amounts of dividends, interest, and foreign withholding taxes and the U.S. dollar equivalent of the amounts actually received or paid. Net unrealized foreign exchange gains and losses arise from changes in foreign exchange rates on foreign denominated assets and liabilities other than investments in securities held at the end of the reporting period.
c. Derivative Financial Instruments
The Fund invested in derivatives in order to manage risk or gain exposure to various other investments or markets. Derivatives are financial contracts based on an underlying or notional amount, require no initial investment or an initial net investment that is smaller than would normally be required to have a similar response to changes in market factors, and require or permit net settlement. Derivatives contain various risks including the potential inability of the counterparty to fulfill their obligations under the terms of the contract, the potential for an illiquid secondary market, and/or the potential for market movements which expose the Fund to gains or losses in excess of the amounts shown in the Consolidated Statement of Assets and Liabilities. Realized gain and loss and unrealized appreciation and depreciation on these contracts for the period are included in the Consolidated Statement of Operations.
Derivative counterparty credit risk is managed through a formal evaluation of the creditworthiness of all potential counter-parties. The Fund attempts to reduce its exposure to counterparty credit risk on OTC derivatives, whenever possible, by entering into International Swaps and Derivatives Association (ISDA) master agreements with certain counterparties. These agreements contain various provisions, including but not limited to collateral requirements, events of default, or early
ftinstitutional.com
Semiannual Report 19
FRANKLIN GLOBAL TRUST
NOTES TO CONSOLIDATED FINANCIAL STATEMENTS (UNAUDITED)
Franklin Emerging Market Debt Opportunities Fund (continued)
1. Organization and Significant Accounting
Policies (continued)
c. Derivative Financial Instruments (continued)
termination. Termination events applicable to the counterparty include certain deteriorations in the credit quality of the counterparty. Termination events applicable to the Fund include failure of the Fund to maintain certain net asset levels and/or limit the decline in net assets over various periods of time. In the event of default or early termination, the ISDA master agreement gives the non-defaulting party the right to net and close-out all transactions traded, whether or not arising under the ISDA agreement, to one net amount payable by one counterparty to the other. However, absent an event of default or early termination, OTC derivative assets and liabilities are presented gross and not offset in the Consolidated Statement of Assets and Liabilities. Early termination by the counterparty may result in an immediate payment by the Fund of any net liability owed to that counterparty under the ISDA agreement. At January 31, 2016, the Fund had no OTC derivatives in a net liability position for such contracts.
Collateral requirements differ by type of derivative. Collateral terms are contract specific for OTC derivatives. For OTC derivatives traded under an ISDA master agreement, posting of collateral is required by either the Fund or the applicable coun-terparty if the total net exposure of all OTC derivatives with the applicable counterparty exceeds the minimum transfer amount, which typically ranges from $100,000 to $250,000, and can vary depending on the counterparty and the type of the agreement. Generally, collateral is determined at the close of Fund business each day and any additional collateral required due to changes in derivative values may be delivered by the Fund or the counterparty within a few business days. Collateral pledged and/or received by the Fund, if any, is held in segregated accounts with the Fund’s custodian/counterparty broker and can be in the form of cash and/or securities. Unrestricted cash may be invested according to the Fund’s investment objectives. To the extent that the amounts due to the Fund from its counterparties are not subject to collateralization or are not fully collateralized, the Fund bears the risk of loss from counterparty non-performance.
The Fund entered into OTC forward exchange contracts primarily to manage and/or gain exposure to certain foreign currencies. A forward exchange contract is an agreement between the Fund and a counterparty to buy or sell a foreign currency at a specific exchange rate on a future date.
See Note 10 regarding other derivative information.
d. Restricted Cash
At January 31, 2016, the Fund held restricted cash in connection with investments in certain derivative securities. Restricted cash is held in a segregated account with the Fund’s custodian and is reflected in the Consolidated Statement of Assets and Liabilities.
e. Loan Participations and Assignments
The Fund may invest in debt instruments which are interests in amounts owed to lenders or lending syndicates by corporate, governmental, or other borrowers. The Fund’s investments in loans may be in the form of participations in loans or assignments of all or portion of loans from third parties. A loan is often administered by a bank or other financial institution (the lender”) that acts as agent for all holders. The agent administers the terms of the loan, as specified in the loan agreement. The Fund may invest in multiple series or tranches of a loan, which may have varying terms and carry different associated risks. When investing in a loan participation, a Fund has the right to receive payments of principal, interest and any fees only from the lender selling the loan and only upon receipt of payments from the borrower. The Fund generally has no right to enforce compliance with the terms of the loan agreement with the borrower. As a result, the Fund may be subject to credit risk of both the borrower and the lender that is selling the loan. When the Fund purchases assignments from lenders it acquires direct rights against the borrower of the loan.
f. Investments in Alternative Strategies (FT) Ltd. (FT Subsidiary)
The Fund invests in certain financial instruments, warrants or commodities through its investment in the FT Subsidiary. The FT Subsidiary is a Cayman Islands exempted company with limited liability, is a wholly-owned subsidiary of the Fund, and is able to invest in certain financial instruments consistent with the investment objective of the Fund. At January 31, 2016, the FT Subsidiary’s investments as well as any other assets and liabilities of the FT Subsidiary are reflected in the Fund’s Consolidated Statement of Investments and Consolidated Statement of Assets and Liabilities. The financial statements have been consolidated and include the accounts of the Fund and the FT Subsidiary. All intercompany transactions and balances have been eliminated. At January 31, 2016, the net assets of the FT Subsidiary were $11,016,162, representing 2.25% of the Fund’s consolidated net assets. The Fund’s investment in the FT Subsidiary is limited to 25% of consolidated assets.
20 Semiannual Report
ftinstitutional.com
FRANKLIN GLOBAL TRUST
NOTES TO CONSOLIDATED FINANCIAL STATEMENTS (UNAUDITED)
Franklin Emerging Market Debt Opportunities Fund (continued)
g. Income and Deferred Taxes
It is the Fund’s policy to qualify as a regulated investment company under the Internal Revenue Code. The Fund intends to distribute to shareholders substantially all of its taxable income and net realized gains to relieve it from federal income and excise taxes. As a result, no provision for U.S. federal income taxes is required.
The Fund may be subject to foreign taxation related to income received, capital gains on the sale of securities and certain foreign currency transactions in the foreign jurisdictions in which it invests. Foreign taxes, if any, are recorded based on the tax regulations and rates that exist in the foreign markets in which the Fund invests. When a capital gain tax is determined to apply, the Fund records an estimated deferred tax liability in an amount that would be payable if the securities were disposed of on the valuation date.
The Fund may recognize an income tax liability related to its uncertain tax positions under U.S. GAAP when the uncertain tax position has a less than 50% probability that it will be sustained upon examination by the tax authorities based on its technical merits. As of January 31, 2016, and for all open tax years, the Fund has determined that no liability for unrecognized tax benefits is required in the Fund’s financial statements related to uncertain tax positions taken on a tax return (or expected to be taken on future tax returns). Open tax years are those that remain subject to examination and are based on each tax jurisdiction’s statute of limitation.
h. Security Transactions, Investment Income, Expenses and Distributions
Security transactions are accounted for on trade date. Realized gains and losses on security transactions are determined on a specific identification basis. Interest income and estimated expenses are accrued daily. Amortization of premium and accretion of discount on debt securities are included in interest income. Dividend income is recorded on the ex-dividend date except for certain dividends from foreign securities where the dividend rate is not available. In such cases, the dividend is recorded as soon as the information is received by the Fund. Distributions to shareholders are recorded on the ex-dividend date and are determined according to income tax regulations (tax basis). Distributable earnings determined on a tax basis may differ from earnings recorded in accordance with U.S. GAAP. These differences may be permanent or temporary. Permanent differences are reclassified among capital accounts to reflect their tax character. These reclassifications have no impact on net assets or the results of operations. Temporary differences are not reclassified, as they may reverse in subsequent periods.
Common expenses incurred by the Trust are allocated among the Funds based on the ratio of net assets of each Fund to the combined net assets of the Trust. Fund specific expenses are charged directly to the fund that incurred the expense.
Inflation-indexed bonds are adjusted for inflation through periodic increases or decreases in the security’s interest accruals, face amount, or principal redemption value, by amounts corresponding to the rate of inflation as measured by an index. Any increase or decrease in the face amount or principal redemption value will be included as inflation principal adjustments in the Consolidated Statement of Operations.
i. Accounting Estimates
The preparation of financial statements in accordance with U.S. GAAP requires management to make estimates and assumptions that affect the reported amounts of assets and liabilities at the date of the financial statements and the amounts of income and expenses during the reporting period. Actual results could differ from those estimates.
j. Guarantees and Indemnifications
Under the Trust’s organizational documents, its officers and trustees are indemnified by the Trust against certain liabilities arising out of the performance of their duties to the Trust. Additionally, in the normal course of business, the Trust, on behalf of the Fund, enters into contracts with service providers that contain general indemnification clauses. The Trust’s maximum exposure under these arrangements is unknown as this would involve future claims that may be made against the Trust that have not yet occurred. Currently, the Trust expects the risk of loss to be remote.
ftinstitutional.com
Semiannual Report 21
| | |
| F R A N K L I N | G L O B A L T R U S T | |
| N O T E S T O | C O N S O L I D A T E D | F I N A N C I A L S T A T E M E N T S ( U N A U D I T E D ) |
Franklin Emerging Market Debt Opportunities Fund (continued)
2. Shares of Beneficial Interest
At January 31, 2016, there were an unlimited number of shares authorized (without par value). Transactions in the Fund’s shares were as follows:
| | | | | | | | | | |
| | Six Months Ended | | Year Ended | |
| | January 31, 2016 | | July 31, 2015 | |
| | Shares | | | Amount | | Shares | | | Amount | |
| Shares sold | 2,997,370 | | $ | 31,439,035 | | 21,287,782 | | $ | 233,443,499 | |
| Shares issued in reinvestment of distributions | 3,650,364 | | | 35,810,070 | | 4,440,488 | | | 46,625,128 | |
| Shares redeemed | (21,857,516 | ) | | (213,965,091 | ) | (10,232,523 | ) | | (113,899,005 | ) |
| Net increase (decrease) | (15,209,782 | ) | $ | (146,715,986 | ) | 15,495,747 | | $ | 166,169,622 | |
3. Transactions with Affiliates
Franklin Resources, Inc. is the holding company for various subsidiaries that together are referred to as Franklin Templeton Investments. Certain officers and trustees of the Trust are also officers and/or directors of the following subsidiaries:
| |
| Subsidiary | Affiliation |
| Franklin Templeton Investment Management Limited (FTIML) | Investment manager |
| Franklin Templeton Services, LLC (FT Services) | Administrative manager |
| Franklin Templeton Investor Services, LLC (Investor Services) | Transfer agent |
a. Management Fees
The Fund and FT Subsidiary pay an investment management fee to FTIML based on the average daily net assets of each of the Fund and FT Subsidiary as follows:
| | |
| Annualized Fee Rate | | Net Assets |
| 1.000 | % | Up to and including $500 Million |
| 0.900 | % | Over $500 Million, up to and including $1 billion |
| 0.850 | % | In excess of $1 billion |
Management fees paid by the Fund are reduced on assets invested in FT Subsidiary, in an amount not to exceed the management fees paid by FT Subsidiary.
b. Administrative Fees
Under an agreement with FTIML, FT Services provides administrative services to the Fund and FT Subsidiary. The fee is paid by FTIML based on each of the Fund’s and FT Subsidiary’s average daily net assets, and is not an additional expense of the Fund or FT Subsidiary.
c. Transfer Agent Fees
The Fund pays transfer agent fees to Investor Services for its performance of shareholder servicing obligations and reimburses Investor Services for out of pocket expenses incurred, including shareholding servicing fees paid to third parties.
For the period ended January 31, 2016, the Fund paid transfer agent fees of $21,600, of which $18,099 was retained by Investor Services.
22 Semiannual Report
ftinstitutional.com
FRANKLIN GLOBAL TRUST
NOTES TO CONSOLIDATED FINANCIAL STATEMENTS (UNAUDITED)
Franklin Emerging Market Debt Opportunities Fund (continued)
d. Investments in Affiliated Management Investment Companies
The Fund invests in an affiliated management investment company for purposes other than exercising a controlling influence over the management or policies. Management fees paid by the Fund are waived on assets invested in the affiliated management investment company, as noted in the Consolidated Statement of Operations, in an amount not to exceed the management and administrative fees paid directly or indirectly by each affiliate. Prior to August 1, 2013, the waiver was accounted for as a reduction to management fees.
| | | | | | | | | | | |
| | | | | | | | | | | % of | |
| | | | | | | | | | | Affiliated | |
| | Number of | | | | Number of | | | | | Fund Shares | |
| | Shares Held | | | | Shares Held | | Value | | Realized | Outstanding | |
| | at Beginning | Gross | Gross | | at End | | at End | Investment | Gain | Held at End | |
| | of Period | Additions | Reductions | | of Period | | of Period | Income | (Loss) | of Period | |
| Non-Controlled Affiliates | | | | | | | | | | | |
| Institutional Fiduciary Trust | | | | | | | | | | | |
| Money Market Portfolio | 71,325,819 | 114,283,793 | (182,730,184 | ) | 2,879,428 | $ | 2,879,428 | $ — | $ — | 0.02 | % |
e. Waiver and Expense Reimbursements
FTIML has contractually agreed in advance to waive or limit its fees and to assume as its own expense certain expenses otherwise payable by the Fund so that the expenses (excluding acquired fund fees and expenses) do not exceed 1.00% (other than certain non-routine expenses or costs, including those relating to litigation, indemnification, reorganizations, and liquidations) until November 30, 2016.
4. Expense Offset Arrangement
The Fund has entered into an arrangement with its custodian whereby credits realized as a result of uninvested cash balances are used to reduce a portion of the Fund’s custodian expenses. During the period ended January 31, 2016, the custodian fees were reduced as noted in the Consolidated Statement of Operations.
5. Income Taxes
For tax purposes, the Fund may elect to defer any portion of a post-October capital loss to the first day of the following fiscal year. At July 31, 2015, the Fund deferred post-October capital losses of $409,641.
At January 31, 2016, the cost of investments and net unrealized appreciation (depreciation) for income tax purposes were as follows:
| | | |
| Cost of investments | $ | 596,813,990 | |
| Unrealized appreciation | $ | 34,517,127 | |
| Unrealized depreciation | | (152,815,787 | ) |
| Net unrealized appreciation (depreciation) | $ | (118,298,660 | ) |
Differences between income and/or capital gains as determined on a book basis and a tax basis are primarily due to differing treatments of bond discounts and premiums, foreign currency transactions, commodity-based derivatives and inflation related adjustments on foreign securities.
6. Investment Transactions
Purchases and sales of investments (excluding short term securities) for the period ended January 31, 2016, aggregated $75,159,337 and $166,161,001, respectively.
ftinstitutional.com
Semiannual Report 23
FRANKLIN GLOBAL TRUST
NOTES TO CONSOLIDATED FINANCIAL STATEMENTS (UNAUDITED)
Franklin Emerging Market Debt Opportunities Fund (continued)
7. Credit Risk and Defaulted Securities
At January 31, 2016, the Fund had 75.69% of its portfolio invested in high yield or other securities rated below investment grade. These securities may be more sensitive to economic conditions causing greater price volatility and are potentially subject to a greater risk of loss due to default than higher rated securities.
The Fund held defaulted securities and/or other securities for which the income has been deemed uncollectible. At January 31, 2016, the aggregate value of these securities was $19,436,173, representing 3.97% of the Fund’s net assets. The Fund discontinues accruing income on securities for which income has been deemed uncollectible and provides an estimate for losses on interest receivable. The securities have been identified in the accompanying Consolidated Statement of Investments.
8. Concentration of Risk
Investing in foreign securities may include certain risks and considerations not typically associated with investing in U.S. securities, such as fluctuating currency values and changing local and regional economic, political and social conditions, which may result in greater market volatility. In addition, certain foreign securities may not be as liquid as U.S. securities.
The United States and other nations have imposed and could impose additional sanctions on certain issuers in Russia due to regional conflicts. These sanctions could result in the devaluation of Russia’s currency, a downgrade in Russian issuers’ credit ratings, or a decline in the value and liquidity of Russian stocks or other securities. Such sanctions could also adversely affect Russia’s economy, possibly forcing the economy into a recession. The Fund may be prohibited from investing in securities issued by companies subject to such sanctions. In addition, if the Fund holds the securities of an issuer that is subject to such sanctions, an immediate freeze of that issuer’s securities could result, impairing the ability of the Fund to buy, sell, receive or deliver those securities. There is also the risk that countermeasures could be taken by Russia’s government, which could involve the seizure of the Fund’s assets. These risks could affect the value of the Fund’s portfolio. While the Fund holds securities of certain companies recently impacted by the sanctions, the restrictions do not impact the existing investments in those issuers. At January 31, 2016, the Fund had 5.5% of its net assets invested in Russia.
9. Restricted Securities
The Fund invests in securities that are restricted under the Securities Act of 1933 (1933 Act) or which are subject to legal, contractual, or other agreed upon restrictions on resale. Restricted securities are often purchased in private placement transactions, and cannot be sold without prior registration unless the sale is pursuant to an exemption under the 1933 Act. Disposal of these securities may require greater effort and expense, and prompt sale at an acceptable price may be difficult. The Fund may have registration rights for restricted securities. The issuer generally incurs all registration costs.
At January 31, 2016, the Fund held investments in restricted securities, excluding certain securities exempt from registration under the 1933 Act deemed to be liquid, as follows:
24 Semiannual Report
ftinstitutional.com
FRANKLIN GLOBAL TRUST
NOTES TO CONSOLIDATED FINANCIAL STATEMENTS (UNAUDITED)
| | | | | | | |
| Franklin Emerging Market Debt Opportunities Fund (continued) | | | | | |
| |
| Principal | | | | | | | |
| Amount*/Units | | Issuer | Acquisition Dates | | Cost | | Value |
| 11,900,000 | | Development Bank of South Africa Ltd. (Government of | 12/16/13 | $ | 11,900,000 | $ | 10,157,796 |
| | | Angola), Tranche 2, senior note, FRN, 6.693%, | | | | | |
| | | 12/20/23 | | | | | |
| 11,200,000 | | Development Bank of South Africa Ltd. (Government of | 6/06/14 | | 11,200,000 | | 9,560,279 |
| | | Angola), Tranche 3B, senior note, FRN, 6.693%, | | | | | |
| | | 12/20/23 | | | | | |
| 479,288 | | Ethiopian Railway Corp. (Republic of Ethiopia), FRN, | 10/28/15 | | 438,748 | | 428,474 |
| | | 4.084%, 8/02/21 | | | | | |
| 312,061 | | Ethiopian Railway Corp. (Republic of Ethiopia), FRN, | 11/26/15 | | 285,374 | | 278,976 |
| | | 4.089%, 8/02/21 | | | | | |
| 97,644 | | Ethiopian Railway Corp. (Republic of Ethiopia), FRN, | 1/15/16 | | 88,931 | | 87,292 |
| | | 4.146%, 8/02/21 | | | | | |
| 320,423 | | Ethiopian Railway Corp. (Republic of Ethiopia), FRN, | 9/28/15 | | 293,848 | | 286,452 |
| | | 4.156%, 8/02/21 | | | | | |
| 293,582 | | Ethiopian Railway Corp. (Republic of Ethiopia), FRN, | 9/21/15 | | 269,578 | | 262,456 |
| | | 4.161%, 8/02/21 | | | | | |
| 205,967 | | Ethiopian Railway Corp. (Republic of Ethiopia), FRN, | 12/23/15 | | 187,909 | | 184,129 |
| | | 4.187%, 8/02/21 | | | | | |
| 7,591,035 | | Ethiopian Railway Corp. (Republic of Ethiopia), FRN, | 8/04/14-6/26/15 | | 6,869,544 | | 6,786,231 |
| | | 4.23%, 8/02/21 | | | | | |
| 4,424,861 | | Global Distressed Alpha Fund III LP | 10/11/12-1/22/16 | | 4,600,000 | | 648,450 |
| 297,342,212 | JPY | Government of Iraq, Tranche A3, Sumitomo Corp. Loan, | 10/16/07-1/06/11 | | 1,802,318 | | 1,292,905 |
| | | FRN, 0.63%, 1/01/28 | | | | | |
| 520,366,882 | JPY | Merrill Lynch & Co. Inc. (Government of Iraq), FRN, | 7/19/07-1/06/11 | | 3,042,250 | | 2,262,663 |
| | | 0.63%, 1/01/28 | | | | | |
| 4,250,000 | DEM | NK Debt Corp., 144A, zero cpn., 3/12/20 | 6/19/07-10/14/08 | | 723,263 | | — |
| 18,000,000 | DEM | NK Debt Corp., Reg S, zero cpn., 3/12/20 | 1/25/11-6/06/11 | | 2,023,663 | | — |
| 2,000,000 | CHF | NK Debt Corp., Reg S, zero cpn., 3/12/20 | 6/17/11 | | 388,830 | | — |
| | | Total Restricted Securities (Value is 6.59% of Net Assets) | | $ | 44,114,256 | $ | 32,236,103 |
| |
| *In U.S. dollars unless otherwise indicated. | | | | | |
10. Other Derivative Information
At January 31, 2016, the Fund’s investments in derivative contracts are reflected in the Consolidated Statement of Assets and Liabilities as follows:
| | | | | | |
| | Asset Derivatives | | | Liability Derivatives |
| |
| Derivative Contracts | Consolidated Statement | | | Consolidated Statement | | |
| Not Accounted for as | of Assets and | | | of Assets and | | |
| Hedging Instruments | Liabilities Location | | Fair Value | Liabilities Location | | Fair Value |
| Foreign exchange contracts | Unrealized appreciation on | $ | 1,660,642 | Unrealized depreciation on | $ | 260,449 |
| | OTC forward exchange | | | OTC forward exchange | | |
| | contracts | | | contracts | | |
| Totals | | $ | 1,660,642 | | $ | 260,449 |
ftinstitutional.com
Semiannual Report 25
FRANKLIN GLOBAL TRUST
NOTES TO CONSOLIDATED FINANCIAL STATEMENTS (UNAUDITED)
Franklin Emerging Market Debt Opportunities Fund (continued)
10. Other Derivative Information (continued)
For the period ended January 31, 2016, the effect of derivative contracts in the Fund’s Consolidated Statement of Operations was as follows:
| | | | | | | | |
| | | | | | | | Net Change in | |
| | | | | | | | Unrealized | |
| Derivative Contracts | | | Net Realized | | | | Appreciation | |
| Not Accounted for as | Consolidated Statement | | Gain (Loss) | | Consolidated Statement | | (Depreciation) | |
| Hedging Instruments | of Operations Locations | | for the Period | | of Operations Locations | | for the Period | |
| | Net realized gain (loss) from: | | | | Net change in unrealized | | | |
| | | | | | appreciation (depreciation) on: | | | |
| Foreign exchange contracts | Foreign currency transactions | $ | 77,363 | a | Translation of other assets and | $ | 99,033 | a |
| | | | | | liabilities denominated in | | | |
| | | | | | foreign currencies | | | |
| Totals | | $ | 77,363 | | | $ | 99,033 | |
aForward exchange contracts are included in net realized gain (loss) from foreign currency transactions and net change in unrealized appreciation (depreciation) on translation
of other assets and liabilities denominated in foreign currencies in the Consolidated Statement of Operations.
For the period ended January 31, 2016, the average month end fair value of derivatives represented 0.27% of average month end net assets. The average month end number of open derivative contracts for the period was 11.
See Note 1(c) regarding derivative financial instruments.
11. Credit Facility
The Fund, together with other U.S. registered and foreign investment funds (collectively, Borrowers), managed by Franklin Templeton Investments, are borrowers in a joint syndicated senior unsecured credit facility totaling $2 billion (Global Credit Facility) which matured on February 12, 2016. This Global Credit Facility provides a source of funds to the Borrowers for temporary and emergency purposes, including the ability to meet future unanticipated or unusually large redemption requests. Effective February 12, 2016, the Borrowers renewed the Global Credit Facility for a one year term, maturing February 10, 2017, for a total of $2 billion.
Under the terms of the Global Credit Facility, the Fund shall, in addition to interest charged on any borrowings made by the Fund and other costs incurred by the Fund, pay its share of fees and expenses incurred in connection with the implementation and maintenance of the Global Credit Facility, based upon its relative share of the aggregate net assets of all of the Borrowers, including an annual commitment fee of 0.07% based upon the unused portion of the Global Credit Facility. Effective February 12, 2016, the annual commitment fee is 0.15%. These fees are reflected in other expenses in the Consolidated Statement of Operations. During the period ended January 31, 2016, the Fund did not use the Global Credit Facility.
12. Fair Value Measurements
The Fund follows a fair value hierarchy that distinguishes between market data obtained from independent sources (observable inputs) and the Fund’s own market assumptions (unobservable inputs). These inputs are used in determining the value of the Fund’s financial instruments and are summarized in the following fair value hierarchy:
- Level 1 – quoted prices in active markets for identical financial instruments
- Level 2 – other significant observable inputs (including quoted prices for similar financial instruments, interest rates, prepay- ment speed, credit risk, etc.)
- Level 3 – significant unobservable inputs (including the Fund’s own assumptions in determining the fair value of financial instruments)
26 Semiannual Report
ftinstitutional.com
FRANKLIN GLOBAL TRUST
NOTES TO CONSOLIDATED FINANCIAL STATEMENTS (UNAUDITED)
Franklin Emerging Market Debt Opportunities Fund (continued)
The input levels are not necessarily an indication of the risk or liquidity associated with financial instruments at that level.
For movements between the levels within the fair value hierarchy, the Fund has adopted a policy of recognizing the transfers as of the date of the underlying event which caused the movement.
A summary of inputs used as of January 31, 2016, in valuing the Fund’s assets and liabilities carried at fair value, is as follows:
| | | | | | | | | |
| | | Level 1 | | Level 2 | | Level 3 | | | Total |
| |
| Assets: | | | | | | | | | |
| Investments in Securities: | | | | | | | | | |
| Warrants | $ | — | $ | 10,175,160 | $ | — | | $ | 10,175,160 |
| Quasi-Sovereign and Corporate Bonds | | — | | 139,273,811 | | 7,782,432 | | | 147,056,243 |
| Loan Participations and Assignments | | — | | 61,309,754 | | 31,587,653 | a | | 92,897,407 |
| Foreign Government and Agency Securities | | — | | 215,505,263 | | — | | | 215,505,263 |
| Common Stocks | | — | | — | | —a | | | — |
| Private Limited Partnership Fund | | — | | — | | 648,450 | | | 648,450 |
| Short Term Investments | | 3,029,426 | | 9,203,381 | | — | | | 12,232,807 |
| Total Investments in Securities | $ | 3,029,426 | $ | 435,467,369 | $ | 40,018,535 | | $ | 478,515,330 |
| Other Financial Instruments | | | | | | | | | |
| Forward Exchange Contracts | $ | — | $ | 1,660,642 | $ | — | | $ | 1,660,642 |
| |
| Liabilities: | | | | | | | | | |
| Other Financial Instruments | | | | | | | | | |
| Forward Exchange Contracts | $ | — | $ | 260,449 | $ | — | | $ | 260,449 |
| |
| aIncludes securities determined to have no value at January 31, 2016. | | | | | | | | | |
A reconciliation of assets and liabilities in which Level 3 inputs are used in determining fair value is presented when there are significant Level 3 financial instruments at the end of the period. At January 31, 2016, the reconciliation of assets and liabilities, is as follows:
| | | | | | | | | | | | | | | | | | | | | |
| | | | | | | | | | | | | | | | | | | | | Net Change | |
| | | | | | | | | | | | | | | | | | | | | in Unrealized | |
| | | | | | | | | | | | | | | | | | | | | Appreciation | |
| | | | | | | | | | | | | | | Net | | Net | | | | (Depreciation) | |
| | | Balance at | | | | | | Transfers | Transfers | | | | | Realized | | Unrealized | | Balance at | | on Assets | |
| | | Beginning | | | | | | Into | Out of | | Cost Basis | | Gain | | Appreciation | | End of | | Held at | |
| | | of Period | | Purchases | Sales | | | Level 3 | Level 3a | | | Adjustmentsb | | (Loss) | | (Depreciation) | | Period | | Period End | |
| |
| Assets: | | | | | | | | | | | | | | | | | | | | | |
| Investments in | | | | | | | | | | | | | | | | | | | | | |
| Securities: | | | | | | | | | | | | | | | | | | | | | |
| Warrants | $ | 8,832,000 | $ | — $ | — | | $ | — $(6,240,000) | | $ | — | $ | — | $ | (2,592,000 | ) $ | — | $ | — | |
| Quasi-Sovereign | | | | | | | | | | | | | | | | | | | | | |
| and Corporate | | | | | | | | | | | | | | | | | | | | | |
| Bonds | | 8,680,808 | c | — | — | | | — | — | | | — | | — | | (898,376 | ) | 7,782,432 | | (898,376 | ) |
| Loan Participations and | | | | | | | | | | | | | | | | | | | | | |
| Assignments | | 33,179,113 | | 1,555,157 | (99,449) | | | — | — | | | 154,033 | | — | | (3,201,201 | ) | 31,587,653 | | (3,201,201 | ) |
| Private Limited | | | | | | | | | | | | | | | | | | | | | |
| Partnership Fund | | 491,049 | | 290,756 | — | | | — | — | | | — | | — | | (133,355 | ) | 648,450 | | (133,355 | ) |
| Total Investments | | | | | | | | | | | | | | | | | | | | | |
| in Securities | $ | 51,182,970 | | $1,845,913 | $(99,449) | | $ | — | $(6,240,000) | $ | 154,033 | $ | — | $ | (6,824,932) | | $40,018,535 | $ | (4,232,932 | ) |
| |
| Liabilities: | | | | | | | | | | | | | | | | | | | | | |
| Other Financial | | | | | | | | | | | | | | | | | | | | | |
| Instruments | | | | | | | | | | | | | | | | | | | | | |
| Unfunded Loan | | | | | | | | | | | | | | | | | | | | | |
| Commitments | $ | 203,232 | $ | — $ | — | | $ | — $ | — | | $ | — | $ | — | $ | (203,232 | ) $ | — | $ | — | |
a The investment was transferred out of Level 3 as a result of the availability of a quoted market for identical securities.
b May include accretion, amortization, partnership adjustments, and/or other cost basis adjustments.
c Includes securities determined to have no value.
ftinstitutional.com
Semiannual Report 27
FRANKLIN GLOBAL TRUST
NOTES TO CONSOLIDATED FINANCIAL STATEMENTS (UNAUDITED)
Franklin Emerging Market Debt Opportunities Fund (continued)
12. Fair Value Measurements (continued)
Significant unobservable valuation inputs developed by the VLOC for material Level 3 financial instruments and impact to fair value as a result of changes in unobservable valuation inputs as of January 31, 2016, are as follows:
| | | | | | | | |
| | | | | | | | | Impact to |
| | | | | | | | | Fair Value |
| | | Fair Value at | | Valuation | | | | if Input |
| Description | | End of Period | | Technique | Unobservable Inputs | Amount/Range | | Increasesa |
| |
| Assets: | | | | | | | | |
| Investments in Securities: | | | | | | | | |
| | | | | Probability Weighted | | | | |
| Quasi-Sovereign and | | | | Discounted Cash | | | | |
| Corporate Bonds | $ | 7,781,066 | | Flow Model | Free Cash Flowb | $ 0.0-$15.8 (mil) | | Increasec |
| | | | | | Credit spread | 13.8 | % | Decrease |
| | | | | | Discount for lack of | | | |
| | | | | Market Comparables | marketability | 30 | % | Decreased |
| Loan Participations and | | | | | Weighted average of | | | |
| Assignments | | 31,587,653 | | Consensus Pricing | offered quotes | 52.07-61.02 JPY | | Increased |
| | | | | Discounted Cash | | | | |
| | | | | Flow Model | Free Cash Flow | $28.2-$28.6 (mil) | | Increasec |
| | | | | | Credit spread | 9.6%-13.5% | | Decrease |
| |
| Assets: | | | | | | | | |
| Investments in Securities: | | | | | | | | |
| | | | | Probability Weighted | | | | |
| Private Limited | | | | Discounted Cash | | | | |
| Partnership Fund | $ | 648,450 | | Flow Model | Free Cash Flowb | $ 0.0-$12.7 (mil) | | Increasec |
| | | | | | Cost of Equity Capital | 20 | % | Decreased |
| | | | | | Discount for lack of | | | |
| | | | | Market Comparables | marketability | 50 | % | Decreased |
| All Other Investmentse | | 1,366 | f | | | | | |
| Total | $ | 40,018,535 | | | | | | |
aRepresents the directional change in the fair value of the Level 3 financial instruments that would result from a significant and reasonable increase in the corresponding input.
A significant and reasonable decrease in the input would have the opposite effect. Significant impacts, if any, to fair value and/or net assets have been indicated.
bIncludes probability assumptions for various outcomes from ongoing legal proceedings.
cRepresents a significant impact to fair value and net assets.
dRepresents a significant impact to fair value but not net assets.
eIncludes financial instruments with values derived using prior transaction prices or third party pricing information without adjustment for which such inputs are unobservable.
May also include fair value of immaterial financial instruments developed using various valuation techniques and unobservable inputs.
fIncludes securities determined to have no value at January 31, 2016.
13. Subsequent Events
The Fund has evaluated subsequent events through the issuance of the consolidated financial statements and determined that no events have occurred that require disclosure other than those already disclosed in the consolidated financial statements.
28 Semiannual Report
ftinstitutional.com
FRANKLIN GLOBAL TRUST
NOTES TO CONSOLIDATED FINANCIAL STATEMENTS (UNAUDITED)
| | | | | |
| Abbreviations | | | | |
| Counterparty | Currency | Selected Portfolio |
| CITI | Citibank N.A. | BRL | Brazilian Real | FRN | Floating Rate Note |
| DBAB | Deutsche Bank AG | CHF | Swiss Franc | GDR | Global Depositary Receipt |
| MSCO | Morgan Stanley | COP | Colombian Peso | PTN | Pass-through Note |
| RBCCM | Royal Bank of Canada | DEM | Deutsche Mark | | |
| | | EUR | Euro | | |
| | | GHS | Ghanaian Cedi | | |
| | | INR | Indian Rupee | | |
| | | JPY | Japanese Yen | | |
| | | KES | Kenyan Shilling | | |
| | | MXN | Mexican Peso | | |
| | | RUB | Russian Ruble | | |
| | | TRY | Turkish Lira | | |
| | | UGX | Ugandan Shilling | | |
| | | UYU | Uruguayan Peso | | |
| | | ZAR | South African Rand | | |
| | | ZMW | Zambian Kwacha | | |
ftinstitutional.com
Semiannual Report 29
FRANKLIN GLOBAL TRUST
FRANKLIN EMERGING MARKET DEBT OPPORTUNITIES FUND
Shareholder Information
Proxy Voting Policies and Procedures
The Fund’s investment manager has established Proxy Voting Policies and Procedures (Policies) that the Fund uses to determine how to vote proxies relating to portfolio securities. Shareholders may view the Fund’s complete Policies online at franklintempleton.com. Alternatively, shareholders may request copies of the Policies free of charge by calling the Proxy Group collect at (954) 527-7678 or by sending a written request to: Franklin Templeton Companies, LLC, 300 S.E. 2nd Street, Fort Lauderdale, FL 33301, Attention: Proxy Group. Copies of the Fund’s proxy voting records are also made available online at franklintempleton.com and posted on the U.S. Securities and Exchange Commission’s website at sec.gov and reflect the most recent 12-month period ended June 30.
Quarterly Consolidated Statement of Investments
The Trust, on behalf of the Fund, files a complete consolidated statement of investments with the U.S. Securities and Exchange Commission for the first and third quarters for each fiscal year on Form N-Q. Shareholders may view the filed Form N-Q by visiting the Commission’s website at sec.gov. The filed form may also be viewed and copied at the Commission’s Public Reference Room in Washington, DC. Information regarding the operations of the Public Reference Room may be obtained by calling (800) SEC-0330.
30 Semiannual Report
ftinstitutional.com
This page intentionally left blank
This page intentionally left blank
| |
| Contents | |
| |
| Semiannual Report | |
| Franklin Global Listed Infrastructure Fund | 3 |
| Performance Summary | 7 |
| Your Fund’s Expenses | 10 |
| Financial Highlights and Statement of Investments | 12 |
| FinancialStatements | 19 |
| Notes to Financial Statements | 23 |
| Shareholder Information | 30 |
Visit franklintempleton.com for fund updates, to access your account, or to find helpful financial planning tools.
2 Semiannual Report
franklintempleton.com
Semiannual Report
Franklin Global Listed Infrastructure Fund
This semiannual report for Franklin Global Listed Infrastructure Fund covers the period ended January 31, 2016.
Your Fund’s Goal and Main Investments
The Fund seeks total investment return consisting of income and capital appreciation by investing, under normal market conditions, predominantly in infrastructure related companies globally, as defined in the Fund’s prospectus.
Performance Overview
For the period under review, Franklin Global Listed Infrastructure Fund – Class A had a -10.56% cumulative total return. In comparison, the Standard & Poor’s (S&P) Global Infrastructure Index, which tracks performance of stocks of large infrastructure companies around the world, had a -10.78% cumulative total return.1 You can find more of the Fund’s performance data in the Performance Summary beginning on page 7.
Performance data represent past performance, which does not guarantee future results. Investment return and principal value will fluctuate, and you may have a gain or loss when you sell your shares. Current performance may differ from figures shown. For most recent month-end performance, go to franklintempleton.com or call (800) 342-5236.
Economic and Market Overview
The U.S. economy grew moderately during the period ended January 31, 2016. The third and fourth quarters of 2015 experienced healthy consumer spending, slower export growth, and reduced state and local government spending. Non-manufacturing activities expanded, contributing to new jobs and helping drive down the unemployment rate to 4.9% at period-end, the lowest level in nearly eight years. At its December 2015 meeting, the Federal Reserve (Fed) raised its target range for the federal funds rate to 0.25%–0.50%, as policymakers cited the labor market’s considerable improvement and were reasonably confident that inflation would move back to the Fed’s 2% medium-term objective. The Fed kept its interest rate unchanged at its January meeting and

indicated it would monitor global economic and financial developments and their implications on the labor market and inflation. The broad U.S. stock market, as measured by the Standard & Poor’s 500 Index, declined for the six months ended January 31, 2016.
The global economy expanded moderately during the six-month period. Global developed and emerging market stocks, as measured by the MSCI All Country World Index, fell during the six-month period mainly due to concerns about China’s slowing economy and tumbling stock market, declining commodity prices, geopolitical tensions in certain regions and ongoing uncertainty about the Fed’s timing for raising interest rates.
1. Source: Morningstar.
The index is unmanaged and includes reinvested dividends. One cannot invest directly in and index, and an index is not representative of the Fund’s portfolio.
The dollar value, number of shares or principal amount, and names of all portfolio holdings are listed in the Fund’s Statement of Investments (SOI).
The SOI begins on page 17.
franklintempleton.com
Semiannual Report 3
FRANKLIN GLOBAL LISTED INFRASTRUCTURE FUND
In the period under review, oil prices declined sharply due to strong global supply that exceeded demand. Gold prices fell for most of the period but recovered in January. The U.S. dollar appreciated against most currencies, which reduced returns of many foreign assets in U.S. dollar terms.
In Europe, U.K. fourth-quarter economic growth gained momentum from the services sector. The eurozone grew slightly and generally benefited during the period from lower oil prices, a weaker euro that supported exports, the European Central Banks’s (ECB’s) accommodative policy and expectations of further ECB stimulus. Although the eurozone’s annual inflation rate declined early in the period, it rose during the rest of the period. The ECB maintained its benchmark interest rates although it reduced its bank deposit rate in December, seeking to boost the region’s slowing growth.
In Asia, preliminary estimates showed that Japan’s economy contracted in the fourth quarter after expanding in the third quarter, as private consumption and housing investment declined. The Bank of Japan (BOJ) took several actions during the period, including lowering its economic growth and inflation forecasts, and reorganizing its stimulus program to increase exposure to long-term government bonds and exchange-traded funds. In January, the BOJ introduced a negative interest rate on excess reserves kept by financial institutions with the central bank, in an effort to boost lending and support inflation. China’s economy expanded in the fourth quarter, but growth was less robust in 2015 than in 2014, as strength in services and consumption was offset by weakness in fixed-asset investment, imports and exports, and manufacturing. The People’s Bank of China (PBOC) cut its benchmark interest rate and reduced the banks’ cash reserve requirement. Toward period-end, the PBOC lowered short-term borrowing costs for smaller banks as part of its efforts to establish an interest rate corridor intended to help banks access funds in times of a liquidity crunch and to avoid heightened volatility in money market rates.
Investment Strategy
When selecting investments for the Fund’s portfolio, we use a bottom-up stock selection process that incorporates macro-level views in the evaluation process. Our portfolio construction process combines bottom-up analysis of individual stock and infrastructure market fundamentals with top-down macro overlays to provide country/regional, infrastructure sector and company size perspectives in identifying international/local cyclical and thematic trends that highlight investment opportunities. Under normal market conditions, the Fund invests at least 80% of its net assets in securities listed on a
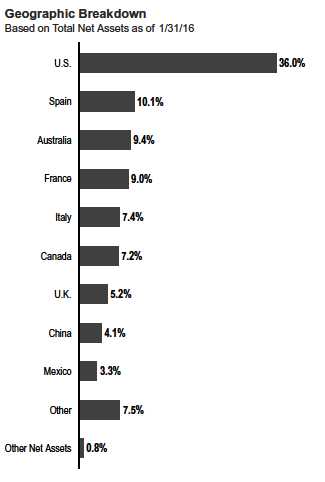
domestic or foreign exchange of companies that are located around the world (including emerging markets) and whose principal business is the ownership, management, construction, operation, use or financing of infrastructure assets. Under normal market conditions, the Fund expects to invest at least 40% of its net assets in foreign securities. We may invest up to 20% of net assets in emerging markets and may invest in infrastructure-related companies of any market capitalization size. We may use derivative instruments, including currency forward and futures contracts from time to time to help manage currency risks and manage local currency exposure.
What is a currency forward contract?
A currency forward contract is an agreement between the Fund and a counterparty to buy or sell a foreign currency at a specific exchange rate on a future date.
4 Semiannual Report
franklintempleton.com
FRANKLIN GLOBAL LISTED INFRASTRUCTURE FUND
What is a futures contract?
A futures contract is an agreement between the Fund and a counterparty made through a U.S. or foreign futures exchange to buy or sell an asset at a specific price on a future date.
| | |
| Top 10 Holdings | | |
| 1/31/16 | | |
| Company | % of Total | |
| Sector/Industry, Country | Net Assets | |
| Transurban Group | 7.7 | % |
| Highways & Railtracks, Australia | | |
| Atlantia SpA | 4.5 | % |
| Highways & Railtracks, Italy | | |
| NextEra Energy Inc. | 4.0 | % |
| Electric Utilities, U.S. | | |
| Iberdrola SA | 3.8 | % |
| Electric Utilities, Spain | | |
| National Grid PLC | 3.7 | % |
| Multi-Utilities, U.K. | | |
| Enbridge Inc. | 3.7 | % |
| Oil & Gas Storage & Transportation, Canada | | |
| Groupe Eurotunnel SE | 3.7 | % |
| Highways & Railtracks, France | | |
| Aena SA | 3.7 | % |
| Airport Services, Spain | | |
| American Electric Power Co. Inc. | 3.6 | % |
| Electric Utilities, U.S. | | |
| Dominion Resources Inc. | 3.1 | % |
| Multi-Utilities, U.S. | | |
Manager’s Discussion
During the six-months under review, key contributors to the Fund’s performance relative to the S&P Global Infrastructure Index included security selection in the utilities sector, notably U.S.-based independent electricity transmission company ITC Holdings.2,3 The company operates, maintains and invests in transmission infrastructure with customers including investor-owned utilities, municipalities, cooperatives, power marketers and alternative energy suppliers. ITC Holdings is regulated by the Federal Energy Regulatory Commission (FERC) with a potential return on equity earned on investments as allowed by the FERC, and we favor the long-term contracted nature of its assets. In December 2015, the company announced it was considering bids for a potential sale. Investors anticipated a buyout at a premium, which helped lift the company’s share price significantly during December. Near period-end, Canada-based utility Fortis was announced as the winning bidder.
The Fund’s investment in transportation infrastructure firm Grupo Aeroportuario del Pacifico also supported relative performance compared to the Fund’s benchmark. The company operates 12 airports in Mexico, most notably Guadalajara, Los Cabos and Tijuana, as well as Montego Bay in Jamaica. During the fourth quarter of 2015, the company’s share price rose amid significant acceleration of traffic growth rates. During the period, the company benefited from new route additions by low-cost airlines, particularly in its Tijuana-based operation. Also aiding the company were the reopening of hotel capacity in Los Cabos after the previous hurricane season hurt business and the depreciation of the Mexican peso. Grupo Aeroportu-ario’s Montego Bay operation also experienced an increase in traffic due to strong tourist demand.
Relative to the Fund’s benchmark index, an underweighted investment in North American energy infrastructure company Kinder Morgan aided Fund returns. In general, the company operates pipeline transportation of resources including natural gases, refined petroleum products, crude oil and carbon dioxide. The company also stores or handles a variety of products and materials including gasoline, jet fuel, ethanol, coal, petroleum coke and steel at the company’s terminals. During the period, we were underweighted in Kinder Morgan as we had an unfavorable view of the company’s merger and acquisition strategy. In particular, we believed the company overpaid for some acquisitions in 2014 and in the beginning of 2015. In November 2015, Kinder Morgan announced an acquisition, which put the company’s credit rating at risk for a downgrade to below investment grade due to the target company’s debt. Kinder Morgan sought to avoid a downgrade and reduced its dividend significantly, which contributed to the company’s share price decline.
In contrast, key detractors from the Fund’s performance included the Fund’s investment in Canada-based energy company Veresen. The company manages pipeline transportation, midstream services, power generation and liquefied natural gas (LNG) businesses. Veresen is constructing an LNG export terminal at the port of Coos Bay, Oregon. However, due to the global price decline for LNG, the project has been delayed. Additionally, Veresen has been unable to secure long-term contracts from customers to use the LNG
2. The utilities sector comprises electric utilities, gas utilities, multi-utilities, renewable electricity and water utilities in the SOI.
3. Not part of the index.
See www.franklintempletondatasources.com for additional data provider information.
franklintempleton.com
Semiannual Report 5
FRANKLIN GLOBAL LISTED INFRASTRUCTURE FUND
export facility. The delay and costs associated with this project hurt the company’s share price.
An investment in U.S.-based utility company NRG Energy also detracted from the Fund’s returns.3 NRG is a power company that produces, sells and delivers energy and energy products and services in U.S. power markets. The company operates through four business segments, including NRG Business, NRG Home, NRG Renew and NRG Yield. The company has a large merchant coal power fleet located in the U.S. In 2014 and 2015, NRG’s management began moving away from coal power business into renewables. However, this strategy did not meet expectations quickly enough and consequently NRG’s chief executive officer resigned in 2015. During the period, NRG’s home solar business also failed to meet growth expectations and led to company losses. The company’s yield strategy also fell below expectations as the company encountered difficulties in raising equity capital for renewable projects in a volatile market. The U.S. Environment Protection Agency’s clean power plan also caused investor concern regarding the viability of NRG’s merchant coal business. The company’s share price declined in response to these issues.
Transportation infrastructure company Sydney Airport was another relative detractor during the period. The company develops and maintains the Australian airport’s infrastructure and leases terminal space to airlines and retailers. The company charges airlines fees on a per-passenger basis and generates revenues by renting space to retailers, hotels and parking lots within the airport area. Sydney Airport continued to experience growth in total passenger traffic year-over-year due to an increase in Asian tourists. In Australia, international passenger fees are significantly higher than domestic passenger fees, and this increase in Asian tourism led to disproportionate operating earnings. Moreover, international tourists generally increase the value of retail space rented to duty free shops. In 2015, we did not believe this Asian passenger growth trend would continue given the weakness in major Asian economies such as China and subsequently we reduced our holdings in this position, which led to an underweighting relative to the benchmark. However, despite these risks the company’s share price continued to outperform its peers during the period.
It is important to recognize the effect of currency movements on the Fund’s performance. In general, if the value of the U.S. dollar goes up compared with a foreign currency, an investment traded in that foreign currency will go down in value because it will be worth fewer U.S. dollars. This can have a negative effect on Fund performance. Conversely, when the U.S. dollar weakens in relation to a foreign currency, an investment traded in that foreign currency will increase in value, which can contribute to Fund performance. For the six months ended January 31, 2016, the U.S. dollar rose in value relative to most currencies. As a result, the Fund’s performance was negatively affected by the portfolio’s substantial investment in securities with non-U.S. currency exposure.
Thank you for your continued participation in Franklin Global Listed Infrastructure Fund. We look forward to serving your future investment needs.

The foregoing information reflects our analysis, opinions and portfolio holdings as of January 31, 2016, the end of the reporting period. The way we implement our main investment strategies and the resulting portfolio holdings may change depending on factors such as market and economic conditions. These opinions may not be relied upon as investment advice or an offer for a particular security. The information is not a complete analysis of every aspect of any market, country, industry, security or the Fund. Statements of fact are from sources considered reliable, but the investment manager makes no representation or warranty as to their completeness or accuracy. Although historical performance is no guarantee of future results, these insights may help you understand our investment management philosophy.
CFA® is a trademark owned by CFA Institute.
6 Semiannual Report
franklintempleton.com
FRANKLIN GLOBAL LISTED INFRASTRUCTURE FUND
Performance Summary as of January 31, 2016
Your dividend income will vary depending on dividends or interest paid by securities in the Fund’s portfolio, adjusted for operating expenses of each class. Capital gain distributions are net profits realized from the sale of portfolio securities. The performance table does not reflect any taxes that a shareholder would pay on Fund dividends, capital gain distributions, if any, or any realized gains on the sale of Fund shares. Total return reflects reinvestment of the Fund’s dividends and capital gain distributions, if any, and any unrealized gains or losses.
| | | | | | |
| Net Asset Value | | | | | | |
| Share Class (Symbol) | | 1/31/16 | | 7/31/15 | | Change |
| A (FLGIX) | $ | 10.42 | $ | 11.81 | -$ | 1.39 |
| C (N/A) | $ | 10.37 | $ | 11.74 | -$ | 1.37 |
| R (N/A) | $ | 10.41 | $ | 11.80 | -$ | 1.39 |
| R6 (N/A) | $ | 10.43 | $ | 11.83 | -$ | 1.40 |
| Advisor (N/A) | $ | 10.44 | $ | 11.83 | -$ | 1.39 |
| |
| |
| Distributions1 (8/1/15–1/31/16) | | | | | | |
| | | Dividend | | Short-Term | | |
| Share Class | | Income | | Capital Gain | | Total |
| A | $ | 0.1386 | $ | 0.0056 | $ | 0.1442 |
| C | $ | 0.0874 | $ | 0.0056 | $ | 0.0930 |
| R | $ | 0.1224 | $ | 0.0056 | $ | 0.1280 |
| R6 | $ | 0.1642 | $ | 0.0056 | $ | 0.1698 |
| Advisor | $ | 0.1564 | $ | 0.0056 | $ | 0.1620 |
See page 9 for Performance Summary footnotes.
franklintempleton.com
Semiannual Report 7
FRANKLIN GLOBAL LISTED INFRASTRUCTURE FUND
PERFORMANCE SUMMARY
Performance as of 1/31/162
Cumulative total return excludes sales charges. Average annual total returns and value of $10,000 investment include maximum sales charges. Class A: 5.75% maximum initial sales charge; Class C: 1% contingent deferred sales charge in first year only;
Class R/R6/Advisor Class: no sales charges.
| | | | | | | | | | | | |
| | | | | | | Value of | Average Annual | | | |
| | Cumulative | | Average Annual | | $ | 10,000 | Total Return | | Total Annual Operating Expenses7 | |
| Share Class | Total Return3 | | Total Return4 | | | Investment5 | (12/31/15 | )6 | (with waiver) | | (without waiver) | |
| A | | | | | | | | | 1.40 | % | 2.16 | % |
| 6-Month | -10.56 | % | -15.70 | % | $ | 8,430 | | | | | | |
| 1-Year | -11.86 | % | -16.91 | % | $ | 8,309 | -14.83 | % | | | | |
| Since Inception (9/6/13) | +10.42 | % | +1.67 | % | $ | 10,407 | +2.62 | % | | | | |
| C | | | | | | | | | 2.15 | % | 2.91 | % |
| 6-Month | -10.89 | % | -11.77 | % | $ | 8,823 | | | | | | |
| 1-Year | -12.45 | % | -13.32 | % | $ | 8,668 | -11.11 | % | | | | |
| Since Inception (9/6/13) | +8.49 | % | +3.45 | % | $ | 10,849 | +4.52 | % | | | | |
| R | | | | | | | | | 1.65 | % | 2.41 | % |
| 6-Month | -10.71 | % | -10.71 | % | $ | 8,929 | | | | | | |
| 1-Year | -11.99 | % | -11.99 | % | $ | 8,801 | -9.75 | % | | | | |
| Since Inception (9/6/13) | +9.72 | % | +3.94 | % | $ | 10,972 | +5.03 | % | | | | |
| R6 | | | | | | | | | 0.96 | % | 2.17 | % |
| 6-Month | -10.59 | % | -10.59 | % | $ | 8,941 | | | | | | |
| 1-Year | -11.68 | % | -11.68 | % | $ | 8,832 | -9.28 | % | | | | |
| Since Inception (9/6/13) | +11.10 | % | +4.48 | % | $ | 11,110 | +5.64 | % | | | | |
| Advisor | | | | | | | | | 1.15 | % | 1.91 | % |
| 6-Month | -10.47 | % | -10.47 | % | $ | 8,953 | | | | | | |
| 1-Year | -11.54 | % | -11.54 | % | $ | 8,846 | -9.31 | % | | | | |
| Since Inception (9/6/13) | +11.19 | % | +4.51 | % | $ | 11,119 | +5.59 | % | | | | |
Performance data represent past performance, which does not guarantee future results. Investment return and principal value will fluctuate, and you may have a gain or loss when you sell your shares. Current performance may differ from figures shown. For most recent month-end performance, go to franklintempleton.com or call (800) 342-5236.
See page 9 for Performance Summary footnotes.
8 Semiannual Report
franklintempleton.com
FRANKLIN GLOBAL LISTED INFRASTRUCTURE FUND
PERFORMANCE SUMMARY
All investments involve risks, including possible loss of principal. The Fund’s investments in infrastructure-related securities involve special risks, including but not limited to high interest costs, high leverage and increased susceptibility to adverse economic or regulatory developments affecting the sector. The risks of foreign investing may be greater in developing or emerging markets. Investors should be comfortable with fluctuations in the value of their investment, as small-and midsized-company stocks can be volatile, especially over the short term. Investments in utility company securities, if purchased for dividend yield, involve additional interest rate risks. When interest rates have risen, the stock prices of these companies have tended to fall. Thus, as prices of utility company stocks in the Fund adjust to a rise in interest rates, the Fund’s share price may decline. By focusing on an industry or group of industries, the Fund carries much greater risk of adverse developments and price movements in such industries than a fund that invests in a wider variety of industries. Special risks are associated with foreign investing, including currency rate fluctuations, economic instability and political developments. Smaller or relatively new or unseasoned companies can be particularly sensitive to changing economic conditions, and their prospects for growth are less certain than those of larger, more established companies. The Fund’s use of derivatives and foreign currency techniques involve special risks as such techniques may not achieve the anticipated benefits and/or may result in losses to the Fund. The Fund is actively managed but there is no guarantee that the manager’s investment decisions will produce the desired results. The Fund’s prospectus also includes a description of the main investment risks.
| |
| Class C: | These shares have higher annual fees and expenses than Class A shares. |
| Class R: | Shares are available to certain eligible investors as described in the prospectus. These shares have higher annual fees and expenses than Class A shares. |
| Class R6: | Shares are available to certain eligible investors as described in the prospectus. |
| Advisor Class: | Shares are available to certain eligible investors as described in the prospectus. |
1. The distribution amount is the sum of the dividend payments to shareholders for the period shown and includes only estimated tax basis net investment income and capital
gain.
2. The Fund has an expense reduction contractually guaranteed through at least 11/30/16. The transfer agent has contractually agreed to cap transfer agency fees for Class R6
shares so that transfer agency fees for that class do not exceed 0.01% until at least 11/30/16. Fund investment results reflect the expense reduction and fee cap, to the extent
applicable; without these reductions, the results would have been lower.
3. Cumulative total return represents the change in value of an investment over the periods indicated.
4. Average annual total return represents the average annual change in value of an investment over the periods indicated. Return for less than one year, if any, has not been
annualized.
5. These figures represent the value of a hypothetical $10,000 investment in the Fund over the periods indicated.
6. In accordance with SEC rules, we provide standardized total return information through the latest calendar quarter.
7. Figures are as stated in the Fund’s current prospectus. In periods of market volatility, assets may decline significantly, causing total annual Fund operating expenses to
become higher than the figures shown.
franklintempleton.com
Semiannual Report 9
FRANKLIN GLOBAL LISTED INFRASTRUCTURE FUND
Your Fund’s Expenses
As a Fund shareholder, you can incur two types of costs:
- Transaction costs, including sales charges (loads) on Fund purchases; and
- Ongoing Fund costs, including management fees, distribution and service (12b-1) fees, and other Fund expenses. All mutual funds have ongoing costs, sometimes referred to as operating expenses.
The following table shows ongoing costs of investing in the Fund and can help you understand these costs and compare them with those of other mutual funds. The table assumes a $1,000 investment held for the six months indicated.
Actual Fund Expenses
The first line (Actual) for each share class listed in the table provides actual account values and expenses. The “Ending Account Value” is derived from the Fund’s actual return, which includes the effect of Fund expenses.
You can estimate the expenses you paid during the period by following these steps. Of course, your account value and expenses will differ from those in this illustration:
| 1. | Divide your account value by $1,000. |
| | If an account had an $8,600 value, then $8,600 ÷ $1,000 = 8.6. |
| 2. | Multiply the result by the number under the heading “Expenses Paid During Period.” |
| | If Expenses Paid During Period were $7.50, then 8.6 x $7.50 = $64.50. |
In this illustration, the estimated expenses paid this period are $64.50.
Hypothetical Example for Comparison with Other Funds
Information in the second line (Hypothetical) for each class in the table can help you compare ongoing costs of investing in the Fund with those of other mutual funds. This information may not be used to estimate the actual ending account balance or expenses you paid during the period. The hypothetical “Ending Account Value” is based on the actual expense ratio for each class and an assumed 5% annual rate of return before expenses, which does not represent the Fund’s actual return. The figure under the heading “Expenses Paid During Period” shows the hypothetical expenses your account would have incurred under this scenario. You can compare this figure with the 5% hypothetical examples that appear in shareholder reports of other funds.
Please note that expenses shown in the table are meant to highlight ongoing costs and do not reflect any transaction costs, such as sales charges. Therefore, the second line for each class is useful in comparing ongoing costs only, and will not help you compare total costs of owning different funds. In addition, if transaction costs were included, your total costs would have been higher. Please refer to the Fund prospectus for additional information on operating expenses.
10 Semiannual Report
franklintempleton.com
| | | | | | | |
| | | | | FRANKLIN GLOBAL LISTED INFRASTRUCTURE FUND |
| | | | | | | YOUR FUND’S EXPENSES |
| |
| |
| |
| | | Beginning Account | | Ending Account | | Expenses Paid During |
| Share Class | | Value 8/1/15 | | Value 1/31/16 | | Period* 8/1/15–1/31/16 |
| A | | | | | | | |
| Actual | $ | 1,000 | $ | 894.40 | | $ | 6.67 |
| Hypothetical (5% return before expenses) | $ | 1,000 | $ | 1,018.10 | | $ | 7.10 |
| C | | | | | | | |
| Actual | $ | 1,000 | $ | 891.10 | $ | 10.22 |
| Hypothetical (5% return before expenses) | $ | 1,000 | $ | 1,014.33 | $ | 10.89 |
| R | | | | | | | |
| Actual | $ | 1,000 | $ | 892.90 | | $ | 7.76 |
| Hypothetical (5% return before expenses) | $ | 1,000 | $ | 1,016.94 | | $ | 8.26 |
| R6 | | | | | | | |
| Actual | $ | 1,000 | $ | 894.10 | | $ | 4.95 |
| Hypothetical (5% return before expenses) | $ | 1,000 | $ | 1,019.91 | | $ | 5.28 |
| Advisor | | | | | | | |
| Actual | $ | 1,000 | $ | 895.30 | | $ | 5.48 |
| Hypothetical (5% return before expenses) | $ | 1,000 | $ | 1,019.36 | | $ | 5.84 |
*Expenses are calculated using the most recent six-month expense ratio, net of expense waivers, annualized for each class (A: 1.40%;
C: 2.15%; R: 1.63%; R6: 1.04%; and Advisor: 1.15%), multiplied by the average account value over the period, multiplied by 184/366 to reflect
the one-half year period.
franklintempleton.com
Semiannual Report 11
| | | | | | | | | |
| FRANKLIN GLOBAL TRUST | | | | | | | | | |
| |
| |
| |
| Financial Highlights | | | | | | | | | |
| Franklin Global Listed Infrastructure Fund | | | | | | | | | |
| | | Six Months Ended | | | | | | | |
| | | January 31, 2016 | | | Year Ended July 31, | |
| | | (unaudited) | | | 2015 | | | 2014 | a |
| Class A | | | | | | | | | |
| Per share operating performance | | | | | | | | | |
| (for a share outstanding throughout the period) | | | | | | | | | |
| Net asset value, beginning of period | $ | 11.81 | | $ | 12.35 | | $ | 10.00 | |
| Income from investment operationsb: | | | | | | | | | |
| Net investment incomec | | 0.07 | | | 0.19 | | | 0.27 | |
| Net realized and unrealized gains (losses) | | (1.31 | ) | | (0.34 | ) | | 2.20 | |
| Total from investment operations | | (1.24 | ) | | (0.15 | ) | | 2.47 | |
| Less distributions from: | | | | | | | | | |
| Net investment income | | (0.14 | ) | | (0.19 | ) | | (0.11 | ) |
| Net realized gains. | | (0.01 | ) | | (0.20 | ) | | (0.01 | ) |
| Total distributions | | (0.15 | ) | | (0.39 | ) | | (0.12 | ) |
| Net asset value, end of period | $ | 10.42 | | $ | 11.81 | | $ | 12.35 | |
| |
| Total returnd | | (10.56 | )% | | (1.08 | )% | | 24.81 | % |
| |
| Ratios to average net assetse | | | | | | | | | |
| Expenses before waiver and payments by affiliates | | 2.12 | % | | 2.21 | % | | 4.03 | % |
| Expenses net of waiver and payments by affiliatesf | | 1.40 | % | | 1.45 | % | | 1.28 | % |
| Net investment income | | 1.31 | % | | 1.62 | % | | 2.59 | % |
| |
| Supplemental data | | | | | | | | | |
| Net assets, end of period (000’s) | $ | 21,203 | | $ | 28,568 | | $ | 14,934 | |
| Portfolio turnover rate | | 31.18 | % | | 50.75 | % | | 35.24 | % |
aFor the period September 6, 2013 (commencement of operations) to July 31, 2014.
bThe amount shown for a share outstanding throughout the period may not correlate with the Statement of Operations for the period due to the timing of sales and
repurchases of the Fund’s shares in relation to income earned and/or fluctuating fair value of the investments of the Fund.
cBased on average daily shares outstanding.
dTotal return does not reflect sales commissions or contingent deferred sales charges, if applicable, and is not annualized for periods less than one year.
eRatios are annualized for periods less than one year.
fBenefit of expense reduction rounds to less than 0.01%.
12 Semiannual Report | The accompanying notes are an integral part of these financial statements. franklintempleton.com
| | | | | | | | | |
| | | FRANKLIN GLOBAL TRUST | |
| | | FINANCIAL HIGHLIGHTS | |
| |
| |
| Franklin Global Listed Infrastructure Fund (continued) | | | | | | | | | |
| | | Six Months Ended | | | | | | | |
| | | January 31, 2016 | | | Year Ended July 31, | |
| | | (unaudited) | | | 2015 | | | 2014 | a |
| Class C | | | | | | | | | |
| Per share operating performance | | | | | | | | | |
| (for a share outstanding throughout the period) | | | | | | | | | |
| Net asset value, beginning of period | $ | 11.74 | | $ | 12.28 | | $ | 10.00 | |
| Income from investment operationsb: | | | | | | | | | |
| Net investment incomec | | 0.03 | | | 0.11 | | | 0.22 | |
| Net realized and unrealized gains (losses) | | (1.30 | ) | | (0.33 | ) | | 2.16 | |
| Total from investment operations | | (1.27 | ) | | (0.22 | ) | | 2.38 | |
| Less distributions from: | | | | | | | | | |
| Net investment income | | (0.09 | ) | | (0.12 | ) | | (0.09 | ) |
| Net realized gains. | | (0.01 | ) | | (0.20 | ) | | (0.01 | ) |
| Total distributions | | (0.10 | ) | | (0.32 | ) | | (0.10 | ) |
| Net asset value, end of period | $ | 10.37 | | $ | 11.74 | | $ | 12.28 | |
| |
| Total returnd | | (10.89 | )% | | (1.78 | )% | | 23.95 | % |
| |
| Ratios to average net assetse | | | | | | | | | |
| Expenses before waiver and payments by affiliates | | 2.87 | % | | 2.91 | % | | 4.85 | % |
| Expenses net of waiver and payments by affiliatesf | | 2.15 | % | | 2.15 | % | | 2.10 | % |
| Net investment income | | 0.56 | % | | 0.92 | % | | 1.77 | % |
| |
| Supplemental data | | | | | | | | | |
| Net assets, end of period (000’s) | $ | 3,604 | | $ | 4,855 | | $ | 2,988 | |
| Portfolio turnover rate | | 31.18 | % | | 50.75 | % | | 35.24 | % |
aFor the period September 6, 2013 (commencement of operations) to July 31, 2014.
bThe amount shown for a share outstanding throughout the period may not correlate with the Statement of Operations for the period due to the timing of sales and
repurchases of the Fund’s shares in relation to income earned and/or fluctuating fair value of the investments of the Fund.
cBased on average daily shares outstanding.
dTotal return does not reflect sales commissions or contingent deferred sales charges, if applicable, and is not annualized for periods less than one year.
eRatios are annualized for periods less than one year.
fBenefit of expense reduction rounds to less than 0.01%.
franklintempleton.com The accompanying notes are an integral part of these financial statements. | Semiannual Report 13
| | | | | | | | | |
| FRANKLIN GLOBAL TRUST | | | | | | | | | |
| FINANCIAL HIGHLIGHTS | | | | | | | | | |
| |
| |
| Franklin Global Listed Infrastructure Fund (continued) | | | | | | | | | |
| | | Six Months Ended | | | | | | | |
| | | January 31, 2016 | | | Year Ended July 31, | |
| | | (unaudited) | | | 2015 | | | 2014 | a |
| Class R | | | | | | | | | |
| Per share operating performance | | | | | | | | | |
| (for a share outstanding throughout the period) | | | | | | | | | |
| Net asset value, beginning of period | $ | 11.80 | | $ | 12.32 | | $ | 10.00 | |
| Income from investment operationsb: | | | | | | | | | |
| Net investment incomec | | 0.06 | | | 0.16 | | | 0.25 | |
| Net realized and unrealized gains (losses) | | (1.32 | ) | | (0.33 | ) | | 2.18 | |
| Total from investment operations | | (1.26 | ) | | (0.17 | ) | | 2.43 | |
| Less distributions from: | | | | | | | | | |
| Net investment income | | (0.12 | ) | | (0.15 | ) | | (0.10 | ) |
| Net realized gains. | | (0.01 | ) | | (0.20 | ) | | (0.01 | ) |
| Total distributions | | (0.13 | ) | | (0.35 | ) | | (0.11 | ) |
| Net asset value, end of period | $ | 10.41 | | $ | 11.80 | | $ | 12.32 | |
| |
| Total returnd | | (10.71 | )% | | (1.29 | )% | | 24.48 | % |
| |
| Ratios to average net assetse | | | | | | | | | |
| Expenses before waiver and payments by affiliates | | 2.35 | % | | 2.41 | % | | 4.35 | % |
| Expenses net of waiver and payments by affiliatesf | | 1.63 | % | | 1.65 | % | | 1.60 | % |
| Net investment income | | 1.08 | % | | 1.42 | % | | 2.27 | % |
| |
| Supplemental data | | | | | | | | | |
| Net assets, end of period (000’s) | $ | 53 | | $ | 62 | | $ | 81 | |
| Portfolio turnover rate | | 31.18 | % | | 50.75 | % | | 35.24 | % |
aFor the period September 6, 2013 (commencement of operations) to July 31, 2014.
bThe amount shown for a share outstanding throughout the period may not correlate with the Statement of Operations for the period due to the timing of sales and
repurchases of the Fund’s shares in relation to income earned and/or fluctuating fair value of the investments of the Fund.
cBased on average daily shares outstanding.
dTotal return is not annualized for periods less than one year.
eRatios are annualized for periods less than one year.
fBenefit of expense reduction rounds to less than 0.01%.
14 Semiannual Report | The accompanying notes are an integral part of these financial statements. franklintempleton.com
| | | | | | | | | |
| | | FRANKLIN GLOBAL TRUST | |
| | | FINANCIAL HIGHLIGHTS | |
| |
| |
| Franklin Global Listed Infrastructure Fund (continued) | | | | | | | | | |
| | | Six Months Ended | | | | | | | |
| | | January 31, 2016 | | | Year Ended July 31, | |
| | | (unaudited) | | | 2015 | | | 2014 | a |
| Class R6 | | | | | | | | | |
| Per share operating performance | | | | | | | | | |
| (for a share outstanding throughout the period) | | | | | | | | | |
| Net asset value, beginning of period | $ | 11.83 | | $ | 12.36 | | $ | 10.00 | |
| Income from investment operationsb: | | | | | | | | | |
| Net investment incomec | | 0.09 | | | 0.23 | | | 0.26 | |
| Net realized and unrealized gains (losses) | | (1.32 | ) | | (0.33 | ) | | 2.24 | |
| Total from investment operations | | (1.23 | ) | | (0.10 | ) | | 2.50 | |
| Less distributions from: | | | | | | | | | |
| Net investment income | | (0.16 | ) | | (0.23 | ) | | (0.13 | ) |
| Net realized gains. | | (0.01 | ) | | (0.20 | ) | | (0.01 | ) |
| Total distributions | | (0.17 | ) | | (0.43 | ) | | (0.14 | ) |
| Net asset value, end of period | $ | 10.43 | | $ | 11.83 | | $ | 12.36 | |
| |
| Total returnd | | (10.59 | )% | | (0.75 | )% | | 25.20 | % |
| |
| Ratios to average net assetse | | | | | | | | | |
| Expenses before waiver and payments by affiliates | | 2.13 | % | | 2.17 | % | | 5.21 | % |
| Expenses net of waiver and payments by affiliatesf | | 1.04 | % | | 1.07 | % | | 1.03 | % |
| Net investment income | | 1.67 | % | | 2.00 | % | | 2.84 | % |
| |
| Supplemental data | | | | | | | | | |
| Net assets, end of period (000’s) | $ | 10 | | $ | 12 | | $ | 12 | |
| Portfolio turnover rate | | 31.18 | % | | 50.75 | % | | 35.24 | % |
aFor the period September 6, 2013 (commencement of operations) to July 31, 2014.
bThe amount shown for a share outstanding throughout the period may not correlate with the Statement of Operations for the period due to the timing of sales and
repurchases of the Fund’s shares in relation to income earned and/or fluctuating fair value of the investments of the Fund.
cBased on average daily shares outstanding.
dTotal return is not annualized for periods less than one year.
eRatios are annualized for periods less than one year.
fBenefit of expense reduction rounds to less than 0.01%.
franklintempleton.com The accompanying notes are an integral part of these financial statements. | Semiannual Report 15
| | | | | | | | | |
| FRANKLIN GLOBAL TRUST | | | | | | | | | |
| FINANCIAL HIGHLIGHTS | | | | | | | | | |
| |
| |
| Franklin Global Listed Infrastructure Fund (continued) | | | | | | | | | |
| | | Six Months Ended | | | | | | | |
| | | January 31, 2016 | | | Year Ended July 31, | |
| | | (unaudited) | | | 2015 | | | 2014 | a |
| Advisor Class | | | | | | | | | |
| Per share operating performance | | | | | | | | | |
| (for a share outstanding throughout the period) | | | | | | | | | |
| Net asset value, beginning of period | $ | 11.83 | | $ | 12.36 | | $ | 10.00 | |
| Income from investment operationsb: | | | | | | | | | |
| Net investment incomec | | 0.08 | | | 0.20 | | | 0.29 | |
| Net realized and unrealized gains (losses) | | (1.30 | ) | | (0.31 | ) | | 2.20 | |
| Total from investment operations | | (1.22 | ) | | (0.11 | ) | | 2.49 | |
| Less distributions from: | | | | | | | | | |
| Net investment income | | (0.16 | ) | | (0.22 | ) | | (0.12 | ) |
| Net realized gains. | | (0.01 | ) | | (0.20 | ) | | (0.01 | ) |
| Total distributions | | (0.17 | ) | | (0.42 | ) | | (0.13 | ) |
| Net asset value, end of period | $ | 10.44 | | $ | 11.83 | | $ | 12.36 | |
| |
| Total returnd | | (10.47 | )% | | (0.74 | )% | | 25.13 | % |
| |
| Ratios to average net assetse | | | | | | | | | |
| Expenses before waiver and payments by affiliates | | 1.87 | % | | 1.91 | % | | 3.85 | % |
| Expenses net of waiver and payments by affiliatesf | | 1.15 | % | | 1.15 | % | | 1.10 | % |
| Net investment income | | 1.56 | % | | 1.92 | % | | 2.77 | % |
| |
| Supplemental data | | | | | | | | | |
| Net assets, end of period (000’s) | $ | 695 | | $ | 556 | | $ | 357 | |
| Portfolio turnover rate | | 31.18 | % | | 50.75 | % | | 35.24 | % |
aFor the period September 6, 2013 (commencement of operations) to July 31, 2014.
bThe amount shown for a share outstanding throughout the period may not correlate with the Statement of Operations for the period due to the timing of sales and
repurchases of the Fund’s shares in relation to income earned and/or fluctuating fair value of the investments of the Fund.
cBased on average daily shares outstanding.
dTotal return is not annualized for periods less than one year.
eRatios are annualized for periods less than one year.
fBenefit of expense reduction rounds to less than 0.01%.
16 Semiannual Report | The accompanying notes are an integral part of these financial statements. franklintempleton.com
FRANKLIN GLOBAL TRUST
| | | | |
| Statement of Investments, January 31, 2016 (unaudited) | | | | |
| Franklin Global Listed Infrastructure Fund | | | | |
| | | Shares/ | | |
| | Country | Units | | Value |
| |
| Common Stocks and Other Equity Interests 99.2% | | | | |
| Airport Services 14.5% | | | | |
| a Aena SA | Spain | 8,545 | $ | 946,595 |
| Aeroports de Paris (ADP) | France | 1,990 | | 224,975 |
| Auckland International Airport Ltd | New Zealand | 78,240 | | 281,122 |
| Flughafen Zuerich AG | Switzerland | 830 | | 610,044 |
| Grupo Aeroportuario del Pacifico SAB de CV, ADR. | Mexico | 6,841 | | 574,918 |
| Grupo Aeroportuario del Sureste SAB de CV, ADR. | Mexico | 1,040 | | 142,168 |
| Japan Airport Terminal Co. Ltd | Japan | 13,900 | | 545,391 |
| SATS Ltd | Singapore | 68,200 | | 186,272 |
| Sydney Airport | Australia | 39,929 | | 185,988 |
| | | | | 3,697,473 |
| Construction & Engineering 2.6% | | | | |
| Eiffage SA | France | 4,030 | | 276,374 |
| a Ferrovial SA | Spain | 6,841 | | 149,232 |
| Vinci SA | France | 3,560 | | 240,748 |
| | | | | 666,354 |
| Electric Utilities 22.2% | | | | |
| American Electric Power Co. Inc | United States | 15,020 | | 915,769 |
| a Avangrid Inc | United States | 5,990 | | 230,316 |
| Duke Energy Corp | United States | 2,700 | | 203,310 |
| Edison International | United States | 5,780 | | 357,204 |
| Enel SpA | Italy | 182,149 | | 743,578 |
| Exelon Corp | United States | 14,400 | | 425,808 |
| Iberdrola SA | Spain | 139,956 | | 977,699 |
| ITC Holdings Corp | United States | 15,890 | | 634,011 |
| NextEra Energy Inc | United States | 9,170 | | 1,024,381 |
| Xcel Energy Inc | United States | 3,920 | | 149,822 |
| | | | | 5,661,898 |
| Gas Utilities 2.1% | | | | |
| Atmos Energy Corp | United States | 5,960 | | 412,551 |
| Infraestructura Energetica Nova SAB de CV | Mexico | 30,300 | | 119,044 |
| | | | | 531,595 |
| Highways & Railtracks 18.3% | | | | |
| Abertis Infraestructuras SA | Spain | 24,258 | | 360,182 |
| Atlantia SpA. | Italy | 44,261 | | 1,154,693 |
| Groupe Eurotunnel SE | France | 82,600 | | 947,687 |
| Macquarie Atlas Roads Group | Australia | 42,634 | | 128,871 |
| Qube Logistics Holdings Ltd | Australia | 85,327 | | 137,115 |
| Transurban Group | Australia | 256,460 | | 1,957,088 |
| | | | | 4,685,636 |
| Marine Ports & Services 4.0% | | | | |
| China Merchants Holdings International Co. Ltd | China | 220,000 | | 600,845 |
| COSCO Pacific Ltd | China | 208,000 | | 234,447 |
| DP World Ltd | United Arab Emirates | 10,983 | | 190,555 |
| | | | | 1,025,847 |
| Multi-Utilities 17.2% | | | | |
| Centrica PLC | United Kingdom | 131,540 | | 383,873 |
| Dominion Resources Inc | United States | 11,130 | | 803,252 |
| DTE Energy Co | United States | 5,310 | | 451,403 |
franklintempleton.com
Semiannual Report 17
FRANKLIN GLOBAL TRUST
STATEMENT OF INVESTMENTS (UNAUDITED)
| | | | |
| Franklin Global Listed Infrastructure Fund (continued) | | | | |
| | | Shares/ | | |
| | Country | Units | | Value |
| |
| Common Stocks and Other Equity Interests (continued) | | | | |
| Multi-Utilities (continued) | | | | |
| Engie | France | 22,180 | $ | 353,118 |
| National Grid PLC. | United Kingdom | 68,160 | | 957,454 |
| PG&E Corp | United States | 8,630 | | 473,873 |
| Public Service Enterprise Group Inc | United States | 8,260 | | 341,138 |
| Sempra Energy | United States | 4,190 | | 397,003 |
| Suez Environnement Co | France | 13,390 | | 247,703 |
| | | | | 4,408,817 |
| Oil & Gas Storage & Transportation 14.5% | | | | |
| Altagas Ltd | Canada | 3,450 | | 80,727 |
| a Cheniere Energy Inc | United States | 10,550 | | 317,027 |
| Columbia Pipeline Group Inc | United States | 25,380 | | 470,799 |
| Enbridge Inc | Canada | 27,544 | | 956,736 |
| Energy Transfer Equity LP | United States | 19,578 | | 169,937 |
| Golar LNG Ltd | Bermuda | 1,830 | | 34,075 |
| Inter Pipeline Ltd | Canada | 7,500 | | 121,529 |
| Kinder Morgan Inc | United States | 22,250 | | 366,012 |
| Pembina Pipeline Corp | Canada | 8,000 | | 181,826 |
| Targa Resources Corp | United States | 5,280 | | 118,642 |
| TransCanada Corp | Canada | 9,200 | | 319,495 |
| Ultrapar Participacoes SA, ADR | Brazil | 5,201 | | 77,755 |
| Veresen Inc | Canada | 31,400 | | 178,865 |
| The Williams Cos. Inc | United States | 16,450 | | 317,485 |
| | | | | 3,710,910 |
| Renewable Electricity 1.7% | | | | |
| a EDP Renovaveis SA | Spain | 17,670 | | 137,050 |
| Pattern Energy Group Inc | United States | 15,930 | | 301,873 |
| | | | | 438,923 |
| Water Utilities 2.1% | | | | |
| American Water Works Co. Inc | United States | 4,940 | | 320,655 |
| Beijing Enterprises Water Group Ltd | China | 134,000 | | 66,133 |
| Guangdong Investment Ltd | China | 64,000 | | 81,186 |
| a Sound Global Ltd | China | 207,000 | | 76,620 |
| | | | | 544,594 |
| Total Common Stocks and Other Equity Interests | | | | |
| (Cost $26,379,933) | | | | 25,372,047 |
| Other Assets, less Liabilities 0.8% | | | | 193,041 |
| Net Assets 100.0% | | | $ | 25,565,088 |
| |
| |
| |
| |
| See Abbreviations on page 29. | | | | |
| |
| aNon-income producing. | | | | |
18 Semiannual Report | The accompanying notes are an integral part of these financial statements. franklintempleton.com
FRANKLIN GLOBAL TRUST
Financial Statements
Statement of Assets and Liabilities
January 31, 2016 (unaudited)
| | | |
| Franklin Global Listed Infrastructure Fund | | | |
| |
| Assets: | | | |
| Investments in securities: | | | |
| Cost | $ | 26,379,933 | |
| Value | $ | 25,372,047 | |
| Receivables: | | | |
| Investment securities sold | | 271,045 | |
| Capital shares sold | | 4,562 | |
| Dividends | | 59,488 | |
| Affiliates | | 5,899 | |
| Other assets. | | 18,695 | |
| Total assets | | 25,731,736 | |
| Liabilities: | | | |
| Payables: | | | |
| Capital shares redeemed | | 107,551 | |
| Management fees | | 4,313 | |
| Distribution fees | | 7,605 | |
| Professional fees. | | 31,318 | |
| Reports to shareholders | | 8,661 | |
| Funds advanced by custodian | | 5,643 | |
| Accrued expenses and other liabilities | | 1,557 | |
| Total liabilities | | 166,648 | |
| Net assets, at value. | $ | 25,565,088 | |
| Net assets consist of: | | | |
| Paid-in capital. | $ | 29,016,459 | |
| Distributions in excess of net investment income. | | (28,095 | ) |
| Net unrealized appreciation (depreciation) | | (1,008,451 | ) |
| Accumulated net realized gain (loss) | | (2,414,825 | ) |
| Net assets, at value. | $ | 25,565,088 | |
franklintempleton.com The accompanying notes are an integral part of these financial statements. | Semiannual Report 19
FRANKLIN GLOBAL TRUST
FINANCIAL STATEMENTS
Statement of Assets and Liabilities (continued)
January 31, 2016 (unaudited)
| | |
| Franklin Global Listed Infrastructure Fund | | |
| |
| Class A: | | |
| Net assets, at value. | $ | 21,203,059 |
| Shares outstanding | | 2,035,342 |
| Net asset value per sharea | $ | 10.42 |
| Maximum offering price per share (net asset value per share ÷ 94.25%) | $ | 11.06 |
| Class C: | | |
| Net assets, at value. | $ | 3,603,515 |
| Shares outstanding | | 347,610 |
| Net asset value and maximum offering price per sharea | $ | 10.37 |
| Class R: | | |
| Net assets, at value. | $ | 52,786 |
| Shares outstanding | | 5,072 |
| Net asset value and maximum offering price per share | $ | 10.41 |
| Class R6: | | |
| Net assets, at value. | $ | 10,431 |
| Shares outstanding | | 1,000 |
| Net asset value and maximum offering price per share | $ | 10.43 |
| Advisor Class: | | |
| Net assets, at value. | $ | 695,297 |
| Shares outstanding | | 66,626 |
| Net asset value and maximum offering price per share | $ | 10.44 |
aRedemption price is equal to net asset value less contingent deferred sales charges, if applicable.
20 Semiannual Report | The accompanying notes are an integral part of these financial statements. franklintempleton.com
|
| FRANKLIN GLOBAL TRUST |
| FINANCIAL STATEMENTS |
Statement of Operations
for the six months ended January 31, 2016 (unaudited)
| | | |
| Franklin Global Listed Infrastructure Fund | | | |
| |
| Investment income: | | | |
| Dividends | $ | 405,306 | |
| Expenses: | | | |
| Management fees (Note 3a) | | 149,290 | |
| Distribution fees: (Note 3c) | | | |
| Class A | | 31,168 | |
| Class C | | 21,256 | |
| Class R | | 138 | |
| Transfer agent fees: (Note 3e) | | | |
| Class A | | 27,750 | |
| Class C | | 4,731 | |
| Class R | | 64 | |
| Class R6 | | 27 | |
| Advisor Class. | | 649 | |
| Custodian fees (Note 4) | | 1,554 | |
| Reports to shareholders | | 11,121 | |
| Registration and filing fees | | 40,015 | |
| Professional fees | | 39,965 | |
| Other | | 4,348 | |
| Total expenses. | | 332,076 | |
| Expense reductions (Note 4) | | (14 | ) |
| Expenses waived/paid by affiliates (Note 3f) | | (108,086 | ) |
| Net expenses. | | 223,976 | |
| Net investment income | | 181,330 | |
| Realized and unrealized gains (losses): | | | |
| Net realized gain (loss) from: | | | |
| Investments | | (1,770,042 | ) |
| Foreign currency transactions | | 503 | |
| Net realized gain (loss) | | (1,769,539 | ) |
| Net change in unrealized appreciation (depreciation) on: | | | |
| Investments | | (1,947,307 | ) |
| Translation of other assets and liabilities denominated in foreign | | | |
| currencies | | 1,967 | |
| Net change in unrealized appreciation (depreciation) | | (1,945,340 | ) |
| Net realized and unrealized gain (loss) | | (3,714,879 | ) |
| Net increase (decrease) in net assets resulting from operations | $ | (3,533,549 | ) |
franklintempleton.com The accompanying notes are an integral part of these financial statements. | Semiannual Report 21
| | | | | | |
| FRANKLIN GLOBAL TRUST | | | | | | |
| FINANCIAL STATEMENTS | | | | | | |
| |
| |
| Statements of Changes in Net Assets | | | | | | |
| |
| Franklin Global Listed Infrastructure Fund | | | | | | |
| |
| | | Six Months Ended | | | | |
| | | January 31, 2016 | | | Year Ended | |
| | | (unaudited) | | | July 31, 2015 | |
| Increase (decrease) in net assets: | | | | | | |
| Operations: | | | | | | |
| Net investment income | $ | 181,330 | | $ | 456,768 | |
| Net realized gain (loss) | | (1,769,539 | ) | | (390,888 | ) |
| Net change in unrealized appreciation (depreciation) | | (1,945,340 | ) | | (474,357 | ) |
| Net increase (decrease) in net assets resulting from operations | | (3,533,549 | ) | | (408,477 | ) |
| Distributions to shareholders from: | | | | | | |
| Net investment income: | | | | | | |
| Class A | | (313,775 | ) | | (341,492 | ) |
| Class C | | (33,884 | ) | | (38,398 | ) |
| Class R | | (630 | ) | | (1,004 | ) |
| Class R6 | | (164 | ) | | (228 | ) |
| Advisor Class | | (8,127 | ) | | (14,227 | ) |
| Net realized gains: | | | | | | |
| Class A | | (12,503 | ) | | (398,036 | ) |
| Class C | | (2,105 | ) | | (75,949 | ) |
| Class R | | (28 | ) | | (1,327 | ) |
| Class R6 | | (6 | ) | | (200 | ) |
| Advisor Class | | (295 | ) | | (24,403 | ) |
| Total distributions to shareholders | | (371,517 | ) | | (895,264 | ) |
| Capital share transactions: (Note 2) | | | | | | |
| Class A | | (4,087,329 | ) | | 14,658,899 | |
| Class C | | (701,458 | ) | | 2,070,985 | |
| Class R | | (2,405 | ) | | (15,503 | ) |
| Class R6 | | — | | | — | |
| Advisor Class | | 208,568 | | | 270,867 | |
| Total capital share transactions | | (4,582,624 | ) | | 16,983,248 | |
| Net increase (decrease) in net assets | | (8,487,690 | ) | | 15,679,507 | |
| Net assets: | | | | | | |
| Beginning of period | | 34,052,778 | | | 18,373,271 | |
| End of period. | $ | 25,565,088 | | $ | 34,052,778 | |
| Undistributed net investment income (distributions in excess of net investment income) included in | | | | | | |
| net assets: | | | | | | |
| End of period | $ | (28,095 | ) | $ | 147,155 | |
22 Semiannual Report | The accompanying notes are an integral part of these financial statements. franklintempleton.com
FRANKLIN GLOBAL TRUST
Notes to Financial Statements (unaudited)
Franklin Global Listed Infrastructure Fund
1. Organization and Significant Accounting Policies
Franklin Global Trust (Trust) is registered under the Investment Company Act of 1940 (1940 Act) as an open-end management investment company, consisting of six separate funds and applies the specialized accounting and reporting guidance in U.S. Generally Accepted Accounting Principles (U.S. GAAP). Franklin Global Listed Infrastructure Fund (Fund) is included in this report. The financial statements of the remaining funds in the Trust are presented separately. The Fund offers five classes of shares: Class A, Class C, Class R, Class R6, and Advisor Class. Each class of shares differs by its initial sales load, contingent deferred sales charges, voting rights on matters affecting a single class, its exchange privilege and fees primarily due to differing arrangements for distribution and transfer agent fees.
The following summarizes the Fund’s significant accounting policies.
a. Financial Instrument Valuation
The Fund’s investments in financial instruments are carried at fair value daily. Fair value is the price that would be received to sell an asset or paid to transfer a liability in an orderly transaction between market participants on the measurement date. The Fund calculates the net asset value (NAV) per share as of 4 p.m. Eastern time each day the New York Stock Exchange (NYSE) is open for trading. Under compliance policies and procedures approved by the Trust’s Board of Trustees (the Board), the Fund’s administrator has responsibility for oversight of valuation, including leading the cross-functional Valuation and Liquidity Oversight Committee (VLOC). The VLOC provides administration and oversight of the Fund’s valuation policies and procedures, which are approved annually by the Board. Among other things, these procedures allow the Fund to utilize independent pricing services, quotations from securities and financial instrument dealers, and other market sources to determine fair value.
Equity securities listed on an exchange or on the NASDAQ National Market System are valued at the last quoted sale price or the official closing price of the day, respectively. Foreign equity securities are valued as of the close of trading on the foreign stock exchange on which the security is primarily traded or as 4 p.m. Eastern time, whichever is earlier. The value is then converted into its U.S. dollar equivalent at the foreign exchange rate in effect at 4 p.m. Eastern time on the day that the value of the security is determined. Over-the-counter (OTC) securities are valued within the range of the most recent quoted bid and ask prices. Securities that trade in multiple markets or on multiple exchanges are valued according to the broadest and most representative market. Certain equity securities are valued based upon fundamental characteristics or relationships to similar securities.
The Fund has procedures to determine the fair value of financial instruments for which market prices are not reliable or readily available. Under these procedures, the VLOC convenes on a regular basis to review such financial instruments and considers a number of factors, including significant unobservable valuation inputs, when arriving at fair value. The VLOC primarily employs a market-based approach which may use related or comparable assets or liabilities, recent transactions, market multiples, book values, and other relevant information for the investment to determine the fair value of the investment. An income-based valuation approach may also be used in which the anticipated future cash flows of the investment are discounted to calculate fair value. Discounts may also be applied due to the nature or duration of any restrictions on the disposition of the investments. Due to the inherent uncertainty of valuations of such investments, the fair values may differ significantly from the values that would have been used had an active market existed. The VLOC employs various methods for calibrating these valuation approaches including a regular review of key inputs and assumptions, transactional back-testing or disposition analysis, and reviews of any related market activity.
Trading in securities on foreign securities stock exchanges and OTC markets may be completed before 4 p.m. Eastern time. In addition, trading in certain foreign markets may not take place on every NYSE business day. Occasionally, events occur between the time at which trading in a foreign security is completed and the close of the NYSE that might call into question the reliability of the value of a portfolio security held by the Fund. As a result, differences may arise between the value of the Fund’s portfolio securities as determined at the foreign market close and the latest indications of value at the close of the NYSE . In order to minimize the potential for these differences, the VLOC monitors price movements following the close of trading in foreign stock markets through a series of country specific market proxies (such as baskets of American Depositary Receipts, futures contracts and exchange traded funds). These price movements are measured against
franklintempleton.com
Semiannual Report 23
FRANKLIN GLOBAL TRUST
NOTES TO FINANCIAL STATEMENTS (UNAUDITED)
Franklin Global Listed Infrastructure Fund (continued)
1. Organization and Significant Accounting
Policies (continued)
a. Financial Instrument Valuation (continued)
established trigger thresholds for each specific market proxy to assist in determining if an event has occurred that may call into question the reliability of the values of the foreign securities held by the Fund. If such an event occurs, the securities may be valued using fair value procedures, which may include the use of independent pricing services.
When the last day of the reporting period is a non-business day, certain foreign markets may be open on those days that the NYSE is closed, which could result in differences between the value of the Fund’s portfolio securities on the last business day and the last calendar day of the reporting period. Any significant security valuation changes due to an open foreign market are adjusted and reflected by the Fund for financial reporting purposes.
b. Foreign Currency Translation
Portfolio securities and other assets and liabilities denominated in foreign currencies are translated into U.S. dollars based on the exchange rate of such currencies against U.S. dollars on the date of valuation. The Fund may enter into foreign currency exchange contracts to facilitate transactions denominated in a foreign currency. Purchases and sales of securities, income and expense items denominated in foreign currencies are translated into U.S. dollars at the exchange rate in effect on the transaction date. Portfolio securities and assets and liabilities denominated in foreign currencies contain risks that those currencies will decline in value relative to the U.S. dollar. Occasionally, events may impact the availability or reliability of foreign exchange rates used to convert the U.S. dollar equivalent value. If such an event occurs, the foreign exchange rate will be valued at fair value using procedures established and approved by the Board.
The Fund does not separately report the effect of changes in foreign exchange rates from changes in market prices on securities held. Such changes are included in net realized and unrealized gain or loss from investments in the Statement of Operations.
Realized foreign exchange gains or losses arise from sales of foreign currencies, currency gains or losses realized between the trade and settlement dates on securities transactions and the difference between the recorded amounts of dividends, interest, and foreign withholding taxes and the U.S. dollar equivalent of the amounts actually received or paid. Net unrealized foreign exchange gains and losses arise from changes in foreign exchange rates on foreign denominated assets and liabilities other than investments in securities held at the end of the reporting period.
c. Income and Deferred Taxes
It is the Fund’s policy to qualify as a regulated investment company under the Internal Revenue Code. The Fund intends to distribute to shareholders substantially all of its taxable income and net realized gains to relieve it from federal income and excise taxes. As a result, no provision for U.S. federal income taxes is required.
The Fund may be subject to foreign taxation related to income received, capital gains on the sale of securities and certain foreign currency transactions in the foreign jurisdictions in which it invests. Foreign taxes, if any, are recorded based on the tax regulations and rates that exist in the foreign markets in which the Fund invests. When a capital gain tax is determined to apply, the Fund records an estimated deferred tax liability in an amount that would be payable if the securities were disposed of on the valuation date.
The Fund may recognize an income tax liability related to its uncertain tax positions under U.S. GAAP when the uncertain tax position has a less than 50% probability that it will be sustained upon examination by the tax authorities based on its technical merits. As of January 31, 2016, the Fund has determined that no tax liability is required in its financial statements related to uncertain tax positions for any open tax years (or expected to be taken on future tax returns). Open tax years are those that remain subject to examination and are based on each tax jurisdiction’s statute of limitation.
d. Security Transactions, Investment Income, Expenses and Distributions
Security transactions are accounted for on trade date. Realized gains and losses on security transactions are determined on a specific identification basis. Estimated expenses are accrued daily. Dividend income is recorded on the ex-dividend date except for certain dividends from foreign securities where the dividend rate is not available. In such cases, the dividend is recorded as soon as the information is received by the Fund. Distributions to shareholders are recorded on the ex-dividend date and are determined according to income tax regulations (tax basis). Distributable earnings determined on a tax basis
24 Semiannual Report
franklintempleton.com
FRANKLIN GLOBAL TRUST
NOTES TO FINANCIAL STATEMENTS (UNAUDITED)
Franklin Global Listed Infrastructure Fund (continued)
may differ from earnings recorded in accordance with U.S. GAAP. These differences may be permanent or temporary. Permanent differences are reclassified among capital accounts to reflect their tax character. These reclassifications have no impact on net assets or the results of operations. Temporary differences are not reclassified, as they may reverse in subsequent periods.
Common expenses incurred by the Trust are allocated among the Funds based on the ratio of net assets of each Fund to the combined net assets of the Trust. Fund specific expenses are charged directly to the fund that incurred the expense.
Realized and unrealized gains and losses and net investment income, not including class specific expenses, are allocated daily to each class of shares based upon the relative proportion of net assets of each class. Differences in per share distributions, by class, are generally due to differences in class specific expenses.
e. Accounting Estimates
The preparation of financial statements in accordance with U.S. GAAP requires management to make estimates and assumptions that affect the reported amounts of assets and liabilities at the date of the financial statements and the amounts of income and expenses during the reporting period. Actual results could differ from those estimates.
f. Guarantees and Indemnifications
Under the Trust’s organizational documents, its officers and trustees are indemnified by the Trust against certain liabilities arising out of the performance of their duties to the Trust. Additionally, in the normal course of business, the Trust, on behalf of the Fund, enters into contracts with service providers that contain general indemnification clauses. The Trust’s maximum exposure under these arrangements is unknown as this would involve future claims that may be made against the Trust that have not yet occurred. Currently, the Trust expects the risk of loss to be remote.
2. Shares of Beneficial Interest
At January 31, 2016, there were an unlimited number of shares authorized (without par value). Transactions in the Fund’s shares were as follows:
| | | | | | | | | | | |
| | Six Months Ended | | Year Ended | |
| | January 31, 2016a | | July 31, 2015a | |
| | Shares | | | Amount | | Shares | | | Amount | |
| Class A Shares: | | | | | | | | | | | |
| Shares sold | 114,685 | | $ | 1,264,488 | | 1,760,814 | | $ | 21,316,096 | |
| Shares issued in reinvestment of distributions | 23,901 | | | | 252,625 | | 46,733 | | | 542,339 | |
| Shares redeemed | (521,887 | ) | | (5,604,442 | ) | (598,387 | ) | | (7,201,536 | ) |
| Net increase (decrease) | (383,301 | ) | $ | (4,087,329 | ) | 1,209,160 | | $ | 14,656,899 | |
| Class C Shares: | | | | | | | | | | | |
| Shares sold | 28,716 | | | $ | 313,587 | | 332,603 | | $ | 4,015,545 | |
| Shares issued in reinvestment of distributions | 3,389 | | | | 35,748 | | 9,848 | | | 113,657 | |
| Shares redeemed | (97,993 | ) | | (1,050,793 | ) | (172,202 | ) | | (2,058,217 | ) |
| Net increase (decrease) | (65,888 | ) | | $ | (701,458 | ) | 170,249 | | $ | 2,070,985 | |
| Class R Shares: | | | | | | | | | | | |
| Shares sold | — | | | $ | — | | 1,610 | | $ | 20,245 | |
| Shares issued in reinvestment of distributions | 50 | | | | 530 | | 170 | | | 1,977 | |
| Shares redeemed | (269 | ) | | | (2,935 | ) | (3,089 | ) | | (37,725 | ) |
| Net increase (decrease) | (219 | ) | | $ | (2,405 | ) | (1,309 | ) | $ | (15,503 | ) |
franklintempleton.com
Semiannual Report 25
FRANKLIN GLOBAL TRUST
NOTES TO FINANCIAL STATEMENTS (UNAUDITED)
| | | | | | | | | | |
| Franklin Global Listed Infrastructure Fund (continued) | | | | | | | | | | |
| |
| 2. Shares of Beneficial Interest (continued) | | | | | | | | | | |
| |
| | Six Months Ended | | Year Ended | |
| | January 31, 2016a | | July 31, 2015a | |
| | Shares | | | Amount | | Shares | | | Amount | |
| Advisor Class Shares: | | | | | | | | | | |
| Shares sold | 23,329 | | $ | 246,556 | | 125,197 | | $ | 1,521,972 | |
| Shares issued in reinvestment of distributions | 695 | | | 7,352 | | 3,281 | | | 37,718 | |
| Shares redeemed | (4,348 | ) | | (45,340 | ) | (11,450 | ) | | (1,288,823 | ) |
| Net increase (decrease) | 19,676 | | $ | 208,568 | | 18,028 | | $ | 270,867 | |
| |
| aDuring the period, Class R6 did not report any share transactions. | | | | | | | | | | |
3. Transactions with Affiliates
Franklin Resources, Inc. is the holding company for various subsidiaries that together are referred to as Franklin Templeton Investments. Certain officers and trustees of the Trust are also officers and/or directors of the following subsidiaries:
| |
| Subsidiary | Affiliation |
| Franklin Templeton Institutional, LLC (FT Institutional) | Investment manager |
| Franklin Templeton Services, LLC (FT Services) | Administrative manager |
| Franklin Templeton Distributors, Inc. (Distributors) | Principal underwriter |
| Franklin Templeton Investor Services, LLC (Investor Services) | Transfer agent |
a. Management Fees
The Fund pays an investment management fee to FT Institutional based on the average daily net assets of the Fund as follows:
| | |
| Annualized Fee Rate | | Net Assets |
| 1.000 | % | Up to and including $500 million |
| 0.900 | % | Over $500 million, up to and including $1 billion |
| 0.850 | % | Over $1 billion, up to and including $1.5 billion |
| 0.800 | % | Over $1.5 billion, up to and including $6.5 billion |
| 0.780 | % | Over $6.5 billion, up to and including $11.5 billion |
| 0.760 | % | Over $11.5 billion, up to and including $16.5 billion |
| 0.740 | % | Over $16.5 billion, up to and including $19 billion |
| 0.730 | % | Over $19 billion, up to and including $21.5 billion |
| 0.720 | % | In excess of $21.5 billion |
b. Administrative Fees
Under an agreement with FT Institutional, FT Services provides administrative services to the Fund. The fee is paid by FT Institutional based on the Fund’s average daily net assets, and is not an additional expense of the Fund.
c. Distribution Fees
The Board has adopted distribution plans for each share class, with the exception of Class R6 and Advisor Class shares, pursuant to Rule 12b-1 under the 1940 Act. Under the Fund’s Class A reimbursement distribution plan, the Fund reimburses Distributors for costs incurred in connection with the servicing, sale and distribution of the Fund’s shares up to the maximum annual plan rate.
26 Semiannual Report
franklintempleton.com
FRANKLIN GLOBAL TRUST
NOTES TO FINANCIAL STATEMENTS (UNAUDITED)
Franklin Global Listed Infrastructure Fund (continued)
Under the Class A reimbursement distribution plan, costs exceeding the maximum for the current plan year cannot be reimbursed in subsequent periods. In addition, under the Fund’s Class C and R compensation distribution plans, the Fund pays Distributors for costs incurred in connection with the servicing, sale and distribution of the Fund’s shares up to the maximum annual plan rate for each class. The plan year, for purposes of monitoring compliance with the maximum annual plan rates, is February 1 through January 31.
The maximum annual plan rates, based on the average daily net assets, for each class, are as follows:
| | |
| Class A | 0.35 | % |
| Class C | 1.00 | % |
| Class R | 0.50 | % |
Effective August 1, 2015, the Board has set the current rate at 0.25% per year for Class A shares until further notice and approval by the Board. Prior to August 1, 2015, the Board had set the rate at 0.30% per year for Class A shares.
d. Sales Charges/Underwriting Agreements
Front-end sales charges and contingent deferred sales charges (CDSC) do not represent expenses of the Fund. These charges are deducted from the proceeds of sales of Fund shares prior to investment or from redemption proceeds prior to remittance, as applicable. Distributors has advised the Fund of the following commission transactions related to the sales and redemptions of the Fund’s shares for the period:
| | |
| Sales charges retained net of commissions paid to unaffiliated | | |
| brokers/dealers | $ | 4,547 |
| CDSC retained | $ | 855 |
e. Transfer Agent Fees
Each class of shares, except for Class R6, pays transfer agent fees to Investor Services for its performance of shareholder servicing obligations and reimburses Investor Services for out of pocket expenses incurred, including shareholding servicing fees paid to third parties. These fees are allocated daily based upon their relative proportion of such classes’ aggregate net assets. Class R6 pays Investor Services transfer agent fees specific to that class.
For the period ended January 31, 2016, the Fund paid transfer agent fees of $33,221, of which $20,842 was retained by Investor Services.
f. Waiver and Expense Reimbursements
FT Institutional and Investor Services contractually agreed in advance to waive or limit their respective fees and to assume as their own expense certain expenses otherwise payable by the Fund so that the expenses (excluding distribution fees and acquired fund fees and expenses) for Class A, Class C, Class R and Advisor Class of the Fund do not exceed 1.15%, and Class R6 does not exceed 0.96% based on the average net assets of each class (other than certain non-routine expenses or costs, including those relating to litigation, indemnification, reorganizations, and liquidations) until November 30, 2016.
g. Other Affiliated Transactions
At January 31, 2016, Franklin Advisers, Inc., an affiliate of FT Institutional, owned 14.01% of the Fund’s outstanding shares.
franklintempleton.com
Semiannual Report 27
FRANKLIN GLOBAL TRUST
NOTES TO FINANCIAL STATEMENTS (UNAUDITED)
Franklin Global Listed Infrastructure Fund (continued)
4. Expense Offset Arrangement
The Fund has entered into an arrangement with its custodian whereby credits realized as a result of uninvested cash balances are used to reduce a portion of the Fund’s custodian expenses. During the period ended January 31, 2016, the custodian fees were reduced as noted in the Statement of Operations.
5. Income Taxes
For tax purposes, the Fund may elect to defer any portion of a post-October capital loss to the first day of the following fiscal year. At July 31, 2015, the Fund deferred post-October capital losses of $283,289.
At January 31, 2016, the cost of investments and net unrealized appreciation (depreciation) for income tax purposes were as follows:
| | | |
| Cost of investments | $ | 26,790,847 | |
| |
| Unrealized appreciation | $ | 1,831,417 | |
| Unrealized depreciation | | (3,250,217 | ) |
| Net unrealized appreciation (depreciation) | $ | (1,418,800 | ) |
Differences between income and/or capital gains as determined on a book basis and a tax basis are primarily due to differing treatments of pass-through entity income and wash sales.
6. Investment Transactions
Purchases and sales of investments (excluding short term securities) for the period ended January 31, 2016, aggregated $9,219,968 and $13,803,868, respectively.
7. Concentration of Risk
Investing in foreign securities may include certain risks and considerations not typically associated with investing in U.S. securities, such as fluctuating currency values and changing local and regional economic, political and social conditions, which may result in greater market volatility. In addition, certain foreign securities may not be as liquid as U.S. securities.
8. Credit Facility
The Fund, together with other U.S. registered and foreign investment funds (collectively, Borrowers), managed by Franklin Templeton Investments, are borrowers in a joint syndicated senior unsecured credit facility totaling $2 billion (Global Credit Facility) which matured on February 12, 2016. This Global Credit Facility provides a source of funds to the Borrowers for temporary and emergency purposes, including the ability to meet future unanticipated or unusually large redemption requests. Effective February 12, 2016, the Borrowers renewed the Global Credit Facility for a one year term, maturing February 10, 2017, for a total of $2 billion.
Under the terms of the Global Credit Facility, the Fund shall, in addition to interest charged on any borrowings made by the Fund and other costs incurred by the Fund, pay its share of fees and expenses incurred in connection with the implementation and maintenance of the Global Credit Facility, based upon its relative share of the aggregate net assets of all of the Borrowers, including
28 Semiannual Report
franklintempleton.com
FRANKLIN GLOBAL TRUST
NOTES TO FINANCIAL STATEMENTS (UNAUDITED)
Franklin Global Listed Infrastructure Fund (continued)
an annual commitment fee of 0.07% based upon the unused portion of the Global Credit Facility. Effective February 12, 2016, the annual commitment fee is 0.15%. These fees are reflected in other expenses in the Statement of Operations. During the period ended January 31, 2016, the Fund did not use the Global Credit Facility.
9. Fair Value Measurements
The Fund follows a fair value hierarchy that distinguishes between market data obtained from independent sources (observable inputs) and the Fund’s own market assumptions (unobservable inputs). These inputs are used in determining the value of the Fund’s financial instruments and are summarized in the following fair value hierarchy:
- Level 1 – quoted prices in active markets for identical financial instruments
- Level 2 – other significant observable inputs (including quoted prices for similar financial instruments, interest rates, prepayment speed, credit risk, etc.)
- Level 3 – significant unobservable inputs (including the Fund’s own assumptions in determining the fair value of financial instruments)
The input levels are not necessarily an indication of the risk or liquidity associated with financial instruments at that level.
For movements between the levels within the fair value hierarchy, the Fund has adopted a policy of recognizing the transfers as of the date of the underlying event which caused the movement.
At January 31, 2016, all of the Fund’s investments in financial instruments carried at fair value were valued using Level 1 inputs.
For detailed categories, see the accompanying Statement of Investments.
10. Subsequent Events
The Fund has evaluated subsequent events through the issuance of the financial statements and determined that no events have occurred that require disclosure other than those already disclosed in the financial statements.
|
| Abbreviations |
| Selected Portfolio |
| ADR American Depositary Receipt |
franklintempleton.com
Semiannual Report 29
FRANKLIN GLOBAL TRUST
FRANKLIN GLOBAL LISTED INFRASTRUCTURE FUND
Shareholder Information
Proxy Voting Policies and Procedures
The Fund’s investment manager has established Proxy Voting Policies and Procedures (Policies) that the Fund uses to determine how to vote proxies relating to portfolio securities. Shareholders may view the Fund’s complete Policies online at franklintempleton.com. Alternatively, shareholders may request copies of the Policies free of charge by calling the Proxy Group collect at (954) 527-7678 or by sending a written request to: Franklin Templeton Companies, LLC, 300 S.E. 2nd Street, Fort Lauderdale, FL 33301, Attention: Proxy Group. Copies of the Fund’s proxy voting records are also made available online at franklintempleton.com and posted on the U.S. Securities and Exchange Commission’s website at sec.gov and reflect the most recent 12-month period ended June 30.
Quarterly Statement of Investments
The Trust, on behalf of the Fund, files a complete statement of investments with the U.S. Securities and Exchange Commission for the first and third quarters for each fiscal year on Form N-Q. Shareholders may view the filed Form N-Q by visiting the Commission’s website at sec.gov. The filed form may also be viewed and copied at the Commission’s Public Reference Room in Washington, DC. Information regarding the operations of the Public Reference Room may be obtained by calling (800) SEC-0330.
30 Semiannual Report
franklintempleton.com
This page intentionally left blank.
This page intentionally left blank.
Item 2. Code OF Ethics.
(a) The Registrant has adopted a code of ethics that applies to its principal executive officers and principal financial and accounting officer.
(c) N/A
(d) N/A
(f) Pursuant to Item 12(a)(1), the Registrant is attaching as an exhibit a copy of its code of ethics that applies to its principal executive officers and
principal financial and accounting officer.
Item 3. Audit Committee Financial Expert.
(a)(1) The Registrant has an audit committee financial expert serving on its audit committee.
(2) The audit committee financial expert is John B. Wilson and he is
"independent" as defined under the relevant Securities and Exchange Commission Rules and Releases.
Item 4. Principal Accountant Fees and Services. N/A
Item 5. Audit Committee of Listed Registrants. N/A
Item 6. Schedule of Investments. N/A
Item 7. Disclosure of Proxy Voting Policies and Procedures for Closed-End Management Investment Companies. N/A
Item 8. Portfolio Managers of Closed-End Management Investment Companies. N/A
Item 9. Purchases of Equity Securities by Closed-End Management Investment Company and Affiliated Purchasers. N/A
Item 10. Submission of Matters to a Vote of Security Holders.
There have been no changes to the procedures by which shareholders may recommend nominees to the Registrant's Board of Trustees that would require disclosure herein.
Item 11. Controls and Procedures.
(a) Evaluation of Disclosure Controls And Procedures. The Registrant maintains disclosure controls and procedures that are designed to ensure that information required to be disclosed in the Registrant's filings under the Securities Exchange Act of 1934 and the Investment Company Act of 1940 is recorded, processed, summarized and reported within the periods specified in the rules and forms of the Securities and Exchange Commission. Such information is accumulated and communicated to the Registrant's management, including its principal executive officer and principal financial officer, as appropriate, to allow timely decisions regarding required disclosure. The Registrant's management, including the principal executive officer and the principal financial officer, recognizes that any set of controls and procedures, no matter how well designed and operated, can provide only reasonable assurance of achieving the desired control objectives.
Within 90 days prior to the filing date of this Shareholder Report on Form N-CSR, the Registrant had carried out an evaluation, under the supervision and with the participation of the Registrant's management, including the Registrant's principal executive officer and the Registrant's principal financial officer, of the effectiveness of the design and operation of the Registrant's disclosure controls and procedures. Based on such evaluation, the Registrant's principal executive officer and principal financial officer concluded that the Registrant's disclosure controls and procedures are effective.
(b) Changes in Internal Controls. There have been no changes in the Registrant's internal controls or in other factors that could materially affect the internal controls over financial reporting subsequent to the date of their evaluation in connection with the preparation of this Shareholder Report on Form N-CSR.
Item 12. Exhibits.
(a) (1) Code of Ethics
(a) (2) Certifications pursuant to Section 302 of the Sarbanes-Oxley Act of 2002 of Laura F. Fergerson, Chief Executive Officer - Finance and Administration, and Gaston Gardey, Chief Financial Officer and Chief Accounting Officer
(b) Certifications pursuant to Section 906 of the Sarbanes-Oxley Act of 2002 of Laura F. Fergerson, Chief Executive Officer - Finance and Administration, and Gaston Gardey, Chief Financial Officer and Chief Accounting Officer
SIGNATURES
Pursuant to the requirements of the Securities Exchange Act of 1934 and the Investment Company Act of 1940, the registrant has duly caused this report to be signed on its behalf by the undersigned, thereunto duly authorized.
FRANKLIN GLOBAL TRUST
By /s/Laura F. Fergerson
Laura F. Fergerson
Chief Executive Officer - Finance and Administration
Date March 28, 2016
Pursuant to the requirements of the Securities Exchange Act of 1934 and the Investment Company Act of 1940, this report has been signed below by the following persons on behalf of the registrant and in the capacities and on the dates indicated.
By /s/Laura F. Fergerson
Laura F. Fergerson
Chief Executive Officer - Finance and Administration
Date March 28, 2016
By /s/Gaston Gardey
Gaston Gardey
Chief Financial Officer and Chief Accounting Officer
Date March 28, 2016