UNITED STATES
SECURITIES AND EXCHANGE COMMISSION
Washington, D.C. 20549
FORM N-CSRS
CERTIFIED SHAREHOLDER REPORT OF REGISTERED MANAGEMENT INVESTMENT
COMPANIES
Investment Company Act file number 811-10157
Franklin Global Trust
(Exact name of registrant as specified in charter)
One Franklin Parkway, San Mateo, CA 94403-1906
(Address of principal executive offices) (Zip code)
Craig S. Tyle, One Franklin Parkway, San Mateo, CA 94403-1906
(Name and address of agent for service)
Registrant's telephone number, including area code: 650 312-2000
Date of fiscal year end: 7/31
Date of reporting period: 1/31/17
Item 1. Reports to Stockholders.
| |
| Contents | |
| |
| Semiannual Report | |
| Franklin Global Real Estate Fund | 3 |
| Performance Summary | 8 |
| Your Fund's Expenses | 10 |
| Financial Highlights and Statement of Investments | 11 |
| Financial Statements | 18 |
| Notes to Financial Statements | 22 |
| Shareholder Information | 30 |
Visit franklintempleton.com for fund updates, to access your account, or to find helpful financial planning tools.
2 Semiannual Report
franklintempleton.com
Semiannual Report
Franklin Global Real Estate Fund
This semiannual report for Franklin Global Real Estate Fund covers the period ended January 31, 2017.
Your Fund’s Goal and Main Investments
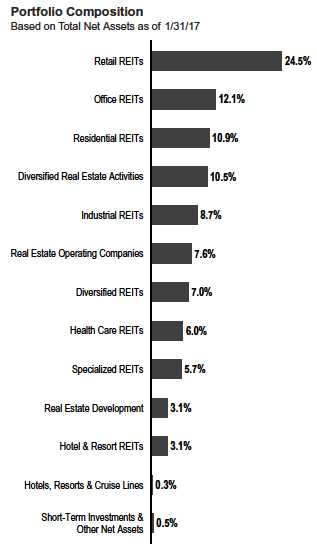
The Fund seeks high total return. Under normal market conditions, the Fund invests at least 80% of its net assets in securities of companies located anywhere in the world that operate in the real estate sector, including real estate investment trusts (REITs) and similar REIT-like entities domiciled outside the U.S.1
Performance Overview
For the six months ended January 31, 2017, the Fund’s Class A shares had a -9.54% cumulative total return. In comparison, the FTSE® EPRA®/NAREIT® Developed Index, which measures global real estate markets in North America, Europe and Asia, delivered a -8.12% total return.2 You can find the Fund’s long-term performance data in the Performance Summary beginning on page 8.
Performance data represent past performance, which does not guarantee future results. Investment return and principal value will fluctuate, and you may have a gain or loss when you sell your shares. Current performance may differ from figures shown. For most recent month-end performance, go to franklintempleton.com or call (800) 342-5236.
Economic and Market Overview
The U.S. economy continued to grow in 2016’s fourth quarter, though at a slower pace compared to the third quarter. Strength in consumer spending, private inventory investment, residential and non-residential fixed investments, and state and local government spending was partially offset by declines in net exports and federal government spending. The manufacturing sector generally expanded, and the services sector continued to grow. The unemployment rate decreased slightly from 4.9% in July 2016 to 4.8% at period-end.3 Annual inflation, as measured by the Consumer Price Index, ended the period at its highest level in more than four years. At its December meeting, the U.S. Federal Reserve (Fed) raised its target range for the federal funds rate to 0.50%–0.75%, as policymakers cited improved labor market conditions and higher inflation. The broad U.S. stock market, as measured by the Standard & Poor’s® 500 Index, advanced for the six months ended January 31, 2017.
The global economy in general expanded during the six months under review, aided by accommodative monetary policies of various central banks. In this environment, global developed and emerging market stocks rose, as measured by the MSCI All Country World Index. Further supporting global markets were an improvement in industrial commodity prices, encouraging earnings reports from the U.S. banking sector, investor optimism about U.S. President Donald Trump’s pro-growth policies, and an Organization of the Petroleum Exporting Countries deal to curb oil production. However, investors expressed concerns about the terms of the U.K.’s exit from the European Union, President Trump’s protectionist policies and executive order banning entry from seven Muslim-majority countries, uncertainty about the Fed’s timing for raising interest rates and the health of European banks.
In Europe, the U.K.’s annualized economic growth accelerated in 2016’s second half, driven by gross fixed capital formation in the third quarter and manufacturing and services in the fourth quarter. The eurozone’s economic growth improved in the third and fourth quarters, while the region’s annual inflation rate rose to its highest level in four years. At its December meeting, the European Central Bank (ECB) extended the continuation of its monthly asset purchases from March to December 2017, but it planned to scale back the purchase amount beginning in April. In January, the ECB kept its key policy rates unchanged and
1. REITs are real estate investment trust companies, usually with publicly traded stock, that manage a portfolio of income-producing real estate properties such as apartments,
hotels, industrial properties, office buildings or shopping centers. The Fund predominantly invests in “equity” REITs, which also take ownership positions in real estate.
Shareholders of equity REITs generally receive income from rents received and receive capital gains when properties are sold at a profit. REITs are generally operated by
experienced property management teams and typically concentrate on a specific geographic region or property type.
2. Source: Morningstar.
The index is unmanaged and includes reinvestment of any income or distributions. One cannot invest directly in an index, and an index is not representative of the Fund’s
portfolio.
3. Bureau of Labor Statistics.
The dollar value, number of shares or principal amount, and names of all portfolio holdings are listed in the Fund’s Statement of Investments (SOI).
The SOI begins on page 15.
franklintempleton.com
Semiannual Report 3
FRANKLIN GLOBAL REAL ESTATE FUND
retained its monthly asset purchases, indicating that it could increase the program in size and duration if needed.
In Asia, Japan’s quarterly gross domestic product grew slower in 2016’s third quarter compared with the second quarter, mainly due to declines in private non-residential and public investments. At its September meeting, the Bank of Japan overhauled its monetary stimulus program to adjust Japanese government bond purchases with the aim of keeping the 10-year rate for these bonds near 0%. China’s economy grew at a faster-than-expected rate in 2016’s fourth quarter compared to 2015’s fourth quarter, supported by consumer spending and a property market driven by robust bank lending. The People’s Bank of China also devalued its currency against the U.S. dollar during the period.
Global Real Estate Market Overview
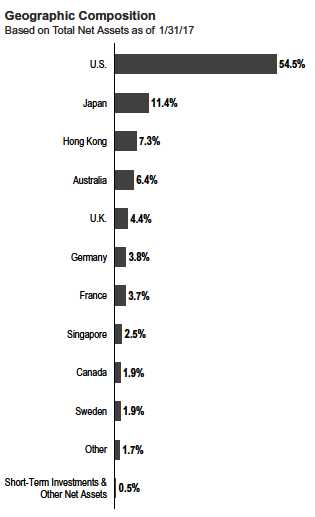
According to the FTSE EPRA/NAREIT Developed Index, in U.S. dollar terms, Norway and Austria performed well. Sweden, New Zealand and Australia also posted solid results. In contrast, most markets represented in the index lost value, including France, Germany and Australia. At period-end, the U.S. was the index’s largest country weighting.
Investment Strategy
We are research-driven, fundamental investors. We seek to limit price volatility by investing across markets and property types. We also seek to provide a consistently high level of income. We center our active investment strategy on the belief that unsynchronized regional economic activity within the global economy can provide consistent, attractive return opportunities in the global real estate markets. We use a bottom-up stock selection process that incorporates macro-level views in the evaluation process. We use top-down macro overlays to provide country/regional, property type and
4 Semiannual Report
franklintempleton.com
FRANKLIN GLOBAL REAL ESTATE FUND
company size perspectives in identifying international/local cyclical and thematic trends that highlight investment opportunities. We may use derivative instruments, such as currency forward contracts, from time to time to help manage currency risk and the Fund’s exposure to various currencies.
What is a currency forward contract?
A currency forward contract is an agreement between the Fund and a counterparty to buy or sell a foreign currency in exchange for another currency at a specific exchange rate on a future date.
| | |
| Top 10 Holdings | | |
| 1/31/17 | | |
| Company | % of Total | |
| Sector/Industry, Country | Net Assets | |
| Simon Property Group Inc. | 5.0 | % |
| Retail REITs, U.S. | | |
| Mitsui Fudosan Co. Ltd. | 2.8 | % |
| Diversified Real Estate Activities, Japan | | |
| Mitsubishi Estate Co. Ltd. | 2.5 | % |
| Diversified Real Estate Activities, Japan | | |
| Unibail-Rodamco SE | 2.4 | % |
| Retail REITs, France | | |
| Prologis Inc. | 2.3 | % |
| Industrial REITs, U.S. | | |
| AvalonBay Communities Inc. | 2.2 | % |
| Residential REITs, U.S. | | |
| Ventas Inc. | 2.1 | % |
| Health Care REITs, U.S. | | |
| Scentre Group | 1.9 | % |
| Retail REITs, Australia | | |
| Welltower Inc. | 1.9 | % |
| Health Care REITs, U.S. | | |
| Public Storage | 1.9 | % |
| Specialized REITs, U.S. | | |
Manager’s Discussion
During the six months under review, key detractors from the Fund’s performance relative to the FTSE EPRA/NAREIT Developed Index included stock selection and an overweighting in the retail property industry, with holdings including France-based European shopping mall operator Klepierre.4 Shares of Klepierre underperformed during the period along with French property stocks. France was among the worst performing countries in the index, possibly due to uncertainty over the upcoming French election. Klepierre reported solid full-year 2016 results with strong rental growth from existing properties and a boost in sales from lease re-letting, which involves securing a lease with a new tenant and releasing the former tenant from obligation. The company’s balance sheet has been relatively conservative for European property stocks in general, with a good loan-to-value ratio and average cost of debt, which management anticipates to be slightly lower in 2017. In our view, the stock looks oversold and has a discount to net asset value that we consider attractive. Furthermore, the company operates in an investment market for high quality dominant shopping malls in Europe and maintains what we view as an attractive dividend yield.
The Fund’s stock selection and underweighting in the office space industry also weighed on results, as did stock selection in the triple-net leasing industry.5 In a triple-net lease, in addition to rent and utilities, the tenant is generally responsible for real estate taxes, building insurance, maintenance and other property expenses. VEREIT, an owner of triple-net lease assets across the U.S., unperformed the index over the period along with other triple-net lease REITs, largely due to a significant increase in the 10-year U.S. Treasury bond yield. In addition, VEREIT’s fee business, Cole Capital, experienced a deceleration in fundraising activity over the period largely due to recent legislative changes pertaining to the non-traded fund industry. However, we have maintained an overweighting as we enter 2017, largely based on the company’s encouraging transition toward stronger portfolio and balance sheet metrics, along with what we view as a compelling value proposition.
Other key individual detractors included the Fund’s investment in U.S.-based shopping center REIT Regency Centers. Shares of the owner and developer of high-quality, grocery-anchored, shopping centers in the U.S. underperformed the index along with its peers, with most of the decline coming in the wake of its acquisition of competitor Equity One6 and investor concerns about the merits of the deal and its integration risk. Nevertheless, we maintained an overweighted position given what we viewed as the company’s superior portfolio, above-average organic growth profile and potential longer term upside from its recent merger.
It is important to recognize the effect of currency movements on the Fund’s performance. In general, if the value of the U.S. dollar goes up compared with a foreign currency, an investment traded in that foreign currency will go down in value because it
4. Retail property holdings are in diversified REITs, real estate operating companies and retail REITs in the SOI.
5. Office space holdings are in office REITs in the SOI. Triple Net Leasing holdings are in diversified REITS and retail REITS in the SOI.
6. Not a Fund holding.
franklintempleton.com
Semiannual Report 5
FRANKLIN GLOBAL REAL ESTATE FUND
will be worth fewer U.S. dollars. This can have a negative effect on Fund performance. Conversely, when the U.S. dollar weakens in relation to a foreign currency, an investment traded in that foreign currency will increase in value, which can contribute to Fund performance. For the six months ended January 31, 2017, the U.S. dollar rose in value relative to most currencies. As a result, the Fund’s performance was negatively affected by the portfolio’s significant investment in Securities with non-U.S. currency exposure.
In contrast, an overweighting in the specialty industry enhanced relative performance, with our off-benchmark position in datacenter company CoreSite Realty contributing notably.7 Shares of CoreSite significantly outperformed property stocks within the U.S. as well as the global property benchmark. The company reported strong third quarter financial results due to leasing success in its data center properties. Compared to the third quarter of 2015, the company reported that funds from operations (FFO) per share increased significantly as revenues rose and earnings increased. The FFO per share was impressive to us since the company operates with a lower leverage ratio than many U.S. REITs.
Security selection in the diversified industry also boosted relative results.8 Mitsui Fudosan, one of Japan’s largest property developers, performed well during the six months under review. Since reaching a low in October 2016, shares of Mitsui Fudosan, along with those of other real estate developers, rebounded substantially amid improving market sentiment. The better sentiment was partly due to a combination of a weaker currency and better reflation expectations in Japan. Company management expects strong earnings growth for Mitsui Fudosan over the next two years, driven by upcoming new office and retail developments. Despite looming office space supply in 2018, Mitsui Fudosan is achieving better-than-expected pre-leasing for its office projects resulting from its premium market positioning. We like its diversified business model, solid balance sheet and strong profit outlook and remain overweighted in the stock.
Relative performance was supported further by the Fund’s stock selection within the hotel/resort industry.9 Summit Hotel Properties, a premium select-service hotel REIT, outperformed its peers and the index during the reporting period. Despite a challenging current backdrop for lodging fundamentals, the stock’s outperformance, we believe, was largely due to the
company’s lack of exposure to gateway cities in coastal markets where fundamentals weakened due to higher supply, softer in-bound international travel and availability of other lodging alternatives for travelers. The company’s focus to grow and upgrade its portfolio outside the top 25 lodging markets through acquisitions over the past 12 to 18 months has started to impact its results positively, with quarterly results consistently better than expectations and many of its peers. We have a cautious outlook for the lodging industry and maintain an underweighted position given the deceleration in revenue growth and negative outlook for the next 12 months, but we maintained our overweighted position in the stock.
Thank you for your continued participation in Franklin Global Real Estate Fund. We look forward to serving your future investment needs.

7. Specialty holdings are in office REITs and specialized REITs in the SOI.
8. Diversified holdings are in diversified real estate activities, diversified REITs, real estate development, real estate operating companies and residential REITs in the SOI.
9. Hotel/Resort holdings are in hotel and resort REITs and hotels, resorts and cruise lines in the SOI.
See www.franklintempletondatasources.com for additional data provider information.
6 Semiannual Report
franklintempleton.com
FRANKLIN GLOBAL REAL ESTATE FUND
The foregoing information reflects our analysis, opinions and portfolio
holdings as of January 31, 2017, the end of the reporting period. The
way we implement our main investment strategies and the resulting
portfolio holdings may change depending on factors such as market
and economic conditions. These opinions may not be relied upon as
investment advice or an offer for a particular security. The information
is not a complete analysis of every aspect of any market, country,
industry, security or the Fund. Statements of fact are from sources
considered reliable, but the investment manager makes no
representation or warranty as to their completeness or accuracy.
Although historical performance is no guarantee of future results,
these insights may help you understand our investment management
philosophy.
franklintempleton.com
Semiannual Report 7
FRANKLIN GLOBAL REAL ESTATE FUND
Performance Summary as of January 31, 2017
The performance table does not reflect any taxes that a shareholder would pay on Fund dividends, capital gain distributions, if any, or any realized gains on the sale of Fund shares. Total return reflects reinvestment of the Fund’s dividends and capital gain distributions, if any, and any unrealized gains or losses.
Performance as of 1/31/171
Cumulative total return excludes sales charges. Average annual total return includes maximum sales charges. Sales charges will vary depending on the size of the investment and the class of share purchased. The maximum is 5.75% and the minimum is 0%. Class A: 5.75% maximum initial sales charge; Advisor Class: no sales charges. For other share classes, visit franklintempleton.com.
| | | | |
| | Cumulative | | Average Annual | |
| Share Class | Total Return2 | | Total Return3 | |
| A | | | | |
| 6-Month | -9.54 | % | -14.71 | % |
| 1-Year | +6.18 | % | +0.02 | % |
| 5-Year | +41.20 | % | +5.89 | % |
| 10-Year | -2.05 | % | -0.79 | % |
| Advisor | | | | |
| 6-Month | -9.45 | % | -9.45 | % |
| 1-Year | +6.32 | % | +6.32 | % |
| 5-Year | +43.34 | % | +7.47 | % |
| 10-Year | +0.93 | % | +0.09 | % |
Performance data represent past performance, which does not guarantee future results. Investment return and principal value will fluctuate, and you may have a gain or loss when you sell your shares. Current performance may differ from figures shown. For most recent month-end performance, go to franklintempleton.com or call (800) 342-5236.
See page 9 for Performance Summary footnotes.
8 Semiannual Report
franklintempleton.com
| | | | | |
| | | | | | FRANKLIN GLOBAL REAL ESTATE FUND |
| | | | | | PERFORMANCE SUMMARY |
| |
| Total Annual Operating Expenses4 | | | | |
| Share Class | With Waiver | | Without Waiver | | |
| A | 1.40 | % | 1.54 | % | |
| Advisor | 1.15 | % | 1.29 | % | |
Each class of shares is available to certain eligible investors and has different annual fees and expenses, as described in the prospectus.
All investments involve risks, including possible loss of principal. The Fund concentrates in real estate securities, which involve special risks, such as declines in
the value of real estate and increased susceptibility to adverse economic or regulatory developments affecting the sector. The Fund’s investments in REITs involve
additional risks; since REITs typically are invested in a limited number of projects or in a particular market segment, they are more susceptible to adverse
developments affecting a single project or market segment than more broadly diversified investments. Foreign investing, especially in emerging markets, involves
additional risks such as currency and market volatility, as well as political and social instability. Investments in derivatives involve costs and create economic
leverage, which may result in significant volatility and cause the Fund to participate in losses (as well as gains) that significantly exceed the Fund’s initial
investment. The Fund is actively managed but there is no guarantee that the manager’s investment decisions will produce the desired results. The Fund’s
prospectus also includes a description of the main investment risks.
1. The Fund has an expense reduction and a fee waiver associated with any investments it makes in a Franklin Templeton money fund and/or other Franklin Templeton fund,
contractually guaranteed through 11/30/17. Fund investment results reflect the expense reduction and fee waiver; without these reductions, the results would have been lower.
2. Cumulative total return represents the change in value of an investment over the periods indicated.
3. Average annual total return represents the average annual change in value of an investment over the periods indicated. Return for less than one year, ifany,hasnotbeen
annualized.
4. Figures are as stated in the Fund’s current prospectus and may differ from the expense ratios disclosed in the Your Fund’s Expenses and Financial Highlights inthisreport.
In periods of market volatility, assets may decline significantly, causing total annual Fund operating expenses to become higher than the figures shown.
franklintempleton.com
Semiannual Report 9
FRANKLIN GLOBAL REAL ESTATE FUND
Your Fund’s Expenses
As a Fund shareholder, you can incur two types of costs: (1) transaction costs, including sales charges (loads) on Fund purchases and redemptions; and (2) ongoing Fund costs, including management fees, distribution and service (12b-1) fees, and other Fund expenses. All mutual funds have ongoing costs, sometimes referred to as operating expenses. The table below shows ongoing costs of investing in the Fund and can help you understand these costs and compare them with those of other mutual funds. The table assumes a $1,000 investment held for the six months indicated.
Actual Fund Expenses
The table below provides information about actual account values and actual expenses in the columns under the heading “Actual.” In these columns the Fund’s actual return, which includes the effect of Fund expenses, is used to calculate the “Ending Account Value” for each class of shares. You can estimate the expenses you paid during the period by following these steps (of course, your account value and expenses will differ from those in this illustration): Divide your account value by $1,000 (if your account had an $8,600 value, then $8,600 ÷ $1,000 = 8.6). Then multiply the result by the number in the row for your class of shares under the headings “Actual” and “Expenses Paid During Period” (if Actual Expenses Paid During Period were $7.50, then 8.6 x $7.50 = $64.50). In this illustration, the actual expenses paid this period are $64.50.
Hypothetical Example for Comparison with Other Funds
Under the heading “Hypothetical” in the table, information is provided about hypothetical account values and hypothetical expenses based on the Fund’s actual expense ratio and an assumed rate of return of 5% per year before expenses, which is not the Fund’s actual return. This information may not be used to estimate the actual ending account balance or expenses you paid for the period, but it can help you compare ongoing costs of investing in the Fund with those of other funds. To do so, compare this 5% hypothetical example for the class of shares you hold with the 5% hypothetical examples that appear in the shareholder reports of other funds.
Please note that expenses shown in the table are meant to highlight ongoing costs and do not reflect any transactional costs. Therefore, information under the heading “Hypothetical” is useful in comparing ongoing costs only, and will not help you compare total costs of owning different funds. In addition, if transactional costs were included, your total costs would have been higher.
| | | | | | | | | | | | |
| | | | | | | Actual | | Hypothetical | | |
| | | | | (actual return after expenses) | | (5% annual return before expenses) | | |
| | | | | | | Expenses | | | | Expenses | Net | |
| | | Beginning | | Ending | | Paid During | | Ending | | Paid During | Annualized | |
| Share | | Account | | Account | | Period | | Account | | Period | Expense | |
| Class | | Value 8/1/16 | | Value 1/31/17 | | 8/1/16–1/31/171,2 | | Value 1/31/17 | | 8/1/16–1/31/171,2 | Ratio2 | |
| A | $ | 1,000 | $ | 904.60 | $ | 6.72 | $ | 1,018.15 | $ | 7.12 | 1.40 | % |
| C | $ | 1,000 | $ | 902.20 | $ | 10.31 | $ | 1,014.37 | $ | 10.92 | 2.15 | % |
| R6 | $ | 1,000 | $ | 906.90 | $ | 4.76 | $ | 1,020.21 | $ | 5.04 | 0.99 | % |
| Advisor | $ | 1,000 | $ | 905.50 | $ | 5.52 | $ | 1,019.41 | $ | 5.85 | 1.15 | % |
1. Expenses are equal to the annualized expense ratio for the six-month period as indicated above–in the far right column–multiplied by the simple average account value
over the period indicated, and then multiplied by 184/365 to reflect the one-half year period.
2. Reflects expenses after fee waivers and expense reimbursements.
10 Semiannual Report
franklintempleton.com
FRANKLIN GLOBAL TRUST
| | | | | | | | | | | | | | | | | | |
| Financial Highlights | | | | | | | | | | | | | | | | | | |
| Franklin Global Real Estate Fund | | | | | | | | | | | | | | | | | | |
| | | Six Months Ended | | | | | | | | | | | | | | | | |
| | | January 31, 2017 | | | | | | Year Ended July 31, | | | | | | | |
| | | (unaudited) | | | 2016 | | | 2015 | | | 2014 | | | 2013 | | | 2012 | |
| Class A | | | | | | | | | | | | | | | | | | |
| Per share operating performance | | | | | | | | | | | | | | | | | | |
| (for a share outstanding throughout the period) | | | | | | | | | | | | | | | | | | |
| Net asset value, beginning of period | $ | 9.73 | | $ | 8.83 | | $ | 8.69 | | $ | 7.88 | | $ | 7.42 | | $ | 7.21 | |
| Income from investment operationsa: | | | | | | | | | | | | | | | | | | |
| Net investment incomeb | | 0.01 | | | 0.15 | | | 0.10 | | | 0.11 | | | 0.11 | | | 0.12 | |
| Net realized and unrealized gains (losses) | | (0.94 | ) | | 0.89 | | | 0.18 | | | 0.82 | | | 0.59 | | | 0.17 | |
| Total from investment operations | | (0.93 | ) | | 1.04 | | | 0.28 | | | 0.93 | | | 0.70 | | | 0.29 | |
| Less distributions from net investment income . | | (0.30 | ) | | (0.14 | ) | | (0.14 | ) | | (0.12 | ) | | (0.24 | ) | | (0.08 | ) |
| Net asset value, end of period | $ | 8.50 | | $ | 9.73 | | $ | 8.83 | | $ | 8.69 | | $ | 7.88 | | $ | 7.42 | |
| |
| Total returnc | | (9.54 | )% | | 12.05 | % | | 3.27 | % | | 12.13 | % | | 9.44 | % | | 4.12 | % |
| |
| Ratios to average net assetsd | | | | | | | | | | | | | | | | | | |
| Expenses before waiver and payments by | | | | | | | | | | | | | | | | | | |
| affiliates and expense reduction | | 1.54 | % | | 1.54 | % | | 1.58 | % | | 1.61 | % | | 1.62 | % | | 1.68 | % |
| Expenses net of waiver and payments by | | | | | | | | | | | | | | | | | | |
| affiliates and expense reduction | | 1.40 | %e | | 1.40 | %e | | 1.45 | %e | | 1.45 | %e | | 1.44 | %e | | 1.37 | % |
| Net investment income | | 0.21 | % | | 1.69 | % | | 1.06 | % | | 1.31 | % | | 1.37 | % | | 1.72 | % |
| |
| Supplemental data | | | | | | | | | | | | | | | | | | |
| Net assets, end of period (000’s) | $ | 83,041 | | $ | 102,958 | | $ | 102,228 | | $ | 90,653 | | $ | 86,575 | | $ | 53,727 | |
| Portfolio turnover rate | | 12.97 | % | | 28.00 | % | | 26.05 | % | | 22.37 | % | | 19.43 | % | | 25.74 | % |
aThe amount shown for a share outstanding throughout the period may not correlate with the Statement of Operations for the period due to the timing of sales and
repurchases of the Fund’s shares in relation to income earned and/or fluctuating fair value of the investments of the Fund.
bBased on average daily shares outstanding.
cTotal return does not reflect sales commissions or contingent deferred sales charges, if applicable, and is not annualized for periods less than one year.
dRatios are annualized for periods less than one year.
eBenefit of expense reduction rounds to less than 0.01%.
franklintempleton.com The accompanying notes are an integral part of these financial statements. | Semiannual Report 11
| | | | | | | | | | | | | | | | | | |
| FRANKLIN GLOBAL TRUST | | | | | | | | | | | | | | | | | | |
| FINANCIAL HIGHLIGHTS | | | | | | | | | | | | | | | | | | |
| |
| |
| Franklin Global Real Estate Fund (continued) | | | | | | | | | | | | | | | | |
| | | Six Months Ended | | | | | | | | | | | | | | | | |
| | | January 31, 2017 | | | | | | Year Ended July 31, | | | | | | | |
| | | (unaudited) | | | 2016 | | | 2015 | | | 2014 | | | 2013 | | | 2012 | |
| Class C | | | | | | | | | | | | | | | | | | |
| Per share operating performance | | | | | | | | | | | | | | | | | | |
| (for a share outstanding throughout the period) | | | | | | | | | | | | | | | | | | |
| Net asset value, beginning of period | $ | 9.58 | | $ | 8.72 | | $ | 8.58 | | $ | 7.80 | | $ | 7.34 | | $ | 7.17 | |
| Income from investment operationsa: | | | | | | | | | | | | | | | | | | |
| Net investment income (loss)b | | (0.02 | ) | | 0.08 | | | 0.03 | | | 0.05 | | | 0.05 | | | 0.07 | |
| Net realized and unrealized gains (losses) | | (0.92 | ) | | 0.88 | | | 0.20 | | | 0.81 | | | 0.59 | | | 0.16 | |
| Total from investment operations | | (0.94 | ) | | 0.96 | | | 0.23 | | | 0.86 | | | 0.64 | | | 0.23 | |
| Less distributions from net investment income . | | (0.23 | ) | | (0.10 | ) | | (0.09 | ) | | (0.08 | ) | | (0.18 | ) | | (0.06 | ) |
| Net asset value, end of period | $ | 8.41 | | $ | 9.58 | | $ | 8.72 | | $ | 8.58 | | $ | 7.80 | | $ | 7.34 | |
| |
| Total returnc | | (9.78 | )% | | 11.11 | % | | 2.70 | % | | 11.28 | % | | 8.64 | % | | 3.39 | % |
| |
| Ratios to average net assetsd | | | | | | | | | | | | | | | | | | |
| Expenses before waiver and payments by | | | | | | | | | | | | | | | | | | |
| affiliates and expense reduction | | 2.29 | % | | 2.29 | % | | 2.28 | % | | 2.31 | % | | 2.32 | % | | 2.38 | % |
| Expenses net of waiver and payments by | | | | | | | | | | | | | | | | | | |
| affiliates and expense reduction | | 2.15 | %e | | 2.15 | %e | | 2.15 | %e | | 2.15 | %e | | 2.14 | %e | | 2.07 | % |
| Net investment income (loss) | | (0.54 | )% | | 0.94 | % | | 0.36 | % | | 0.61 | % | | 0.67 | % | | 1.02 | % |
| |
| Supplemental data | | | | | | | | | | | | | | | | | | |
| Net assets, end of period (000’s) | $ | 16,616 | | $ | 20,906 | | $ | 23,124 | | $ | 20,896 | | $ | 21,350 | | $ | 12,043 | |
| Portfolio turnover rate | | 12.97 | % | | 28.00 | % | | 26.05 | % | | 22.37 | % | | 19.43 | % | | 25.74 | % |
aThe amount shown for a share outstanding throughout the period may not correlate with the Statement of Operations for the period due to the timing of sales and
repurchases of the Fund’s shares in relation to income earned and/or fluctuating fair value of the investments of the Fund.
bBased on average daily shares outstanding.
cTotal return does not reflect sales commissions or contingent deferred sales charges, if applicable, and is not annualized for periods less than one year.
dRatios are annualized for periods less than one year.
eBenefit of expense reduction rounds to less than 0.01%.
12 Semiannual Report | The accompanying notes are an integral part of these financial statements. franklintempleton.com
| | | | | | | | | | | | | | | |
| | | | | | | | | FRANKLIN GLOBAL TRUST | |
| | | | | | | | | FINANCIAL HIGHLIGHTS | |
| |
| |
| Franklin Global Real Estate Fund (continued) | | | | | | | | | | | | | | | |
| | | Six Months Ended | | | | | | | | | | | | | |
| | | January 31, 2017 | | | | | | Year Ended July 31, | | | | |
| | | (unaudited) | | | 2016 | | | 2015 | | | 2014 | | | 2013 | a |
| Class R6 | | | | | | | | | | | | | | | |
| Per share operating performance | | | | | | | | | | | | | | | |
| (for a share outstanding throughout the period) | | | | | | | | | | | | | | | |
| Net asset value, beginning of period | $ | 9.78 | | $ | 8.88 | | $ | 8.74 | | $ | 7.92 | | $ | 8.70 | |
| Income from investment operationsb: | | | | | | | | | | | | | | | |
| Net investment incomec | | 0.03 | | | 0.18 | | | 0.14 | | | 0.15 | | | 0.04 | |
| Net realized and unrealized gains (losses) | | (0.95 | ) | | 0.90 | | | 0.18 | | | 0.82 | | | (0.82 | ) |
| Total from investment operations. | | (0.92 | ) | | 1.08 | | | 0.32 | | | 0.97 | | | (0.78 | ) |
| Less distributions from net investment income | | (0.34 | ) | | (0.18 | ) | | (0.18 | ) | | (0.15 | ) | | — | |
| Net asset value, end of period. | $ | 8.52 | | $ | 9.78 | | $ | 8.88 | | $ | 8.74 | | $ | 7.92 | |
| |
| Total returnd | | (9.31 | )% | | 12.49 | % | | 3.71 | % | | 12.51 | % | | (8.97 | )% |
| |
| Ratios to average net assetse | | | | | | | | | | | | | | | |
| Expenses before waiver and payments by affiliates and | | | | | | | | | | | | | | | |
| expense reduction | | 1.93 | % | | 1.23 | % | | 1.13 | % | | 1.15 | % | | 1.15 | % |
| Expenses net of waiver and payments by affiliates and | | | | | | | | | | | | | | | |
| expense reductionf | | 0.99 | % | | 0.99 | % | | 0.99 | % | | 0.99 | % | | 0.99 | % |
| Net investment income. | | 0.62 | % | | 2.10 | % | | 1.52 | % | | 1.77 | % | | 1.82 | % |
| |
| Supplemental data | | | | | | | | | | | | | | | |
| Net assets, end of period (000’s) | $ | 16 | | $ | 16 | | $ | 246 | | $ | 768 | | $ | 379 | |
| Portfolio turnover rate | | 12.97 | % | | 28.00 | % | | 26.05 | % | | 22.37 | % | | 19.43 | % |
aFor the period May 1, 2013 (effective date) to July 31, 2013.
bThe amount shown for a share outstanding throughout the period may not correlate with the Statement of Operations for the period due to the timing of sales and
repurchases of the Fund’s shares in relation to income earned and/or fluctuating fair value of the investments of the Fund.
cBased on average daily shares outstanding.
dTotal return is not annualized for periods less than one year.
eRatios are annualized for periods less than one year.
fBenefit of expense reduction rounds to less than 0.01%.
franklintempleton.com The accompanying notes are an integral part of these financial statements. | Semiannual Report 13
| | | | | | | | | | | | | | | | | | |
| FRANKLIN GLOBAL TRUST | | | | | | | | | | | | | | | | | | |
| FINANCIAL HIGHLIGHTS | | | | | | | | | | | | | | | | | | |
| |
| |
| Franklin Global Real Estate Fund (continued) | | | | | | | | | | | | | | | | |
| | | Six Months Ended | | | | | | | | | | | | | | | | |
| | | January 31, 2017 | | | | | | Year Ended July 31, | | | | | | | |
| | | (unaudited) | | | 2016 | | | 2015 | | | 2014 | | | 2013 | | | 2012 | |
| Advisor Class | | | | | | | | | | | | | | | | | | |
| Per share operating performance | | | | | | | | | | | | | | | | | | |
| (for a share outstanding throughout the period) | | | | | | | | | | | | | | | | | | |
| Net asset value, beginning of period | $ | 9.78 | | $ | 8.88 | | $ | 8.73 | | $ | 7.91 | | $ | 7.46 | | $ | 7.23 | |
| Income from investment operationsa: | | | | | | | | | | | | | | | | | | |
| Net investment incomeb | | 0.02 | | | 0.17 | | | 0.12 | | | 0.13 | | | 0.13 | | | 0.13 | |
| Net realized and unrealized gains (losses) | | (0.94 | ) | | 0.90 | | | 0.19 | | | 0.83 | | | 0.59 | | | 0.18 | |
| Total from investment operations | | (0.92 | ) | | 1.07 | | | 0.31 | | | 0.96 | | | 0.72 | | | 0.31 | |
| Less distributions from net investment income . | | (0.33 | ) | | (0.17 | ) | | (0.16 | ) | | (0.14 | ) | | (0.27 | ) | | (0.08 | ) |
| Net asset value, end of period | $ | 8.53 | | $ | 9.78 | | $ | 8.88 | | $ | 8.73 | | $ | 7.91 | | $ | 7.46 | |
| |
| Total returnc | | (9.45 | )% | | 12.31 | % | | 3.67 | % | | 12.39 | % | | 9.78 | % | | 4.48 | % |
| |
| Ratios to average net assetsd | | | | | | | | | | | | | | | | | | |
| Expenses before waiver and payments by | | | | | | | | | | | | | | | | | | |
| affiliates and expense reduction | | 1.29 | % | | 1.29 | % | | 1.28 | % | | 1.31 | % | | 1.32 | % | | 1.38 | % |
| Expenses net of waiver and payments by | | | | | | | | | | | | | | | | | | |
| affiliates and expense reduction | | 1.15 | %e | | 1.15 | %e | | 1.15 | %e | | 1.15 | %e | | 1.14 | %e | | 1.07 | % |
| Net investment income | | 0.46 | % | | 1.94 | % | | 1.36 | % | | 1.61 | % | | 1.67 | % | | 2.02 | % |
| |
| Supplemental data | | | | | | | | | | | | | | | | | | |
| Net assets, end of period (000’s) | $ | 46,677 | | $ | 51,617 | | $ | 45,451 | | $ | 52,423 | | $ | 48,116 | | $ | 39,255 | |
| Portfolio turnover rate | | 12.97 | % | | 28.00 | % | | 26.05 | % | | 22.37 | % | | 19.43 | % | | 25.74 | % |
aThe amount shown for a share outstanding throughout the period may not correlate with the Statement of Operations for the period due to the timing of sales and
repurchases of the Fund’s shares in relation to income earned and/or fluctuating fair value of the investments of the Fund.
bBased on average daily shares outstanding.
cTotal return is not annualized for periods less than one year.
dRatios are annualized for periods less than one year.
eBenefit of expense reduction rounds to less than 0.01%.
14 Semiannual Report | The accompanying notes are an integral part of these financial statements. franklintempleton.com
FRANKLIN GLOBAL TRUST
| | | | |
| Statement of Investments, January 31, 2017 (unaudited) | | | | |
| Franklin Global Real Estate Fund | | | | |
| | Country | Shares | | Value |
| |
| Common Stocks 99.5% | | | | |
| Diversified Real Estate Activities 10.5% | | | | |
| CapitaLand Ltd | Singapore | 663,924 | $ | 1,549,376 |
| City Developments Ltd | Singapore | 165,600 | | 1,084,188 |
| Mitsubishi Estate Co. Ltd | Japan | 189,854 | | 3,635,359 |
| Mitsui Fudosan Co. Ltd | Japan | 178,595 | | 4,137,724 |
| New World Development Co. Ltd | Hong Kong | 1,320,000 | | 1,531,135 |
| Sun Hung Kai Properties Ltd | Hong Kong | 122,727 | | 1,698,797 |
| Tokyo Tatemono Co. Ltd | Japan | 79,690 | | 1,057,029 |
| The Wharf Holdings Ltd | Hong Kong | 89,694 | | 676,842 |
| | | | | 15,370,450 |
| Diversified REITs 7.0% | | | | |
| Activia Properties Inc | Japan | 209 | | 1,021,543 |
| Hispania Activos Inmobiliarios SOCIMI SA | Spain | 87,009 | | 1,070,660 |
| Hulic REIT Inc | Japan | 450 | | 780,980 |
| Kenedix Office Investment Corp | Japan | 235 | | 1,385,841 |
| Land Securities Group PLC | United Kingdom | 139,205 | | 1,740,346 |
| Spirit Realty Capital Inc | United States | 103,800 | | 1,091,976 |
| United Urban Investment Corp | Japan | 625 | | 996,702 |
| VEREIT Inc | United States | 210,900 | | 1,798,977 |
| Washington REIT. | United States | 9,800 | | 308,210 |
| | | | | 10,195,235 |
| Health Care REITs 6.0% | | | | |
| HCP Inc | United States | 70,854 | | 2,148,293 |
| Physicians Realty Trust. | United States | 45,600 | | 845,880 |
| Ventas Inc | United States | 49,309 | | 3,040,886 |
| Welltower Inc | United States | 41,958 | | 2,781,816 |
| | | | | 8,816,875 |
| Hotel & Resort REITs 3.1% | | | | |
| Hoshino Resorts REIT Inc | Japan | 118 | | 630,044 |
| Host Hotels & Resorts Inc | United States | 103,420 | | 1,868,799 |
| Summit Hotel Properties Inc | United States | 71,800 | | 1,136,594 |
| Sunstone Hotel Investors Inc | United States | 62,699 | | 922,929 |
| | | | | 4,558,366 |
| Hotels, Resorts & Cruise Lines 0.3% | | | | |
| Hilton Worldwide Holdings Inc | United States | 8,103 | | 466,571 |
| Industrial REITs 8.7% | | | | |
| Duke Realty Corp | United States | 69,200 | | 1,683,636 |
| First Industrial Realty Trust Inc | United States | 49,900 | | 1,289,915 |
| Frasers Logistics & Industrial Trust | Singapore | 805,600 | | 537,143 |
| Goodman Group | Australia | 275,614 | | 1,446,267 |
| Mapletree Logistics Trust | Singapore | 632,537 | | 471,105 |
| Nippon Prologis REIT Inc | Japan | 480 | | 1,003,055 |
| PLA Administradora Industrial S de RL de CV | Mexico | 402,800 | | 557,164 |
| Prologis Inc | United States | 70,220 | | 3,430,247 |
| Rexford Industrial Realty Inc | United States | 38,000 | | 862,980 |
| Segro PLC | United Kingdom | 244,100 | | 1,416,882 |
| | | | | 12,698,394 |
| Office REITs 12.1% | | | | |
| Alexandria Real Estate Equities Inc | United States | 20,484 | | 2,270,037 |
| Boston Properties Inc | United States | 20,832 | | 2,726,909 |
| Brandywine Realty Trust | United States | 53,900 | | 867,790 |
franklintempleton.com
Semiannual Report 15
FRANKLIN GLOBAL TRUST
STATEMENT OF INVESTMENTS (UNAUDITED)
| | | | |
| Franklin Global Real Estate Fund (continued) | | | | |
| | Country | Shares | | Value |
| |
| Common Stocks (continued) | | | | |
| Office REITs (continued) | | | | |
| Derwent London PLC | United Kingdom | 31,568 | $ | 979,514 |
| Dexus Property Group | Australia | 237,630 | | 1,618,150 |
| Highwoods Properties Inc | United States | 31,566 | | 1,622,808 |
| Japan Real Estate Investment Corp | Japan | 245 | | 1,392,748 |
| Kilroy Realty Corp | United States | 25,330 | | 1,895,950 |
| Mack-Cali Realty Corp | United States | 44,200 | | 1,238,484 |
| SL Green Realty Corp | United States | 16,759 | | 1,826,228 |
| Vornado Realty Trust | United States | 11,625 | | 1,235,854 |
| | | | | 17,674,472 |
| Real Estate Development 3.1% | | | | |
| Cheung Kong Property Holdings Ltd | Hong Kong | 411,000 | | 2,722,714 |
| China Overseas Land & Investment Ltd | China | 144,158 | | 426,401 |
| China Resources Land Ltd | China | 174,000 | | 433,713 |
| Sino Land Co. Ltd | Hong Kong | 601,045 | | 999,295 |
| | | | | 4,582,123 |
| Real Estate Operating Companies 7.6% | | | | |
| ADO Properties SA | Germany | 10,670 | | 381,162 |
| a ADO Properties SA, 144A. | Germany | 26,279 | | 938,758 |
| Deutsche Wohnen AG | Germany | 68,340 | | 2,223,313 |
| Fabege AB | Sweden | 58,410 | | 995,306 |
| First Capital Realty Inc | Canada | 45,100 | | 717,028 |
| Hemfosa Fastigheter AB | Sweden | 77,982 | | 720,554 |
| Hufvudstaden AB, A | Sweden | 62,846 | | 1,001,227 |
| Hysan Development Co. Ltd | Hong Kong | 220,624 | | 1,009,434 |
| Unite Group PLC | United Kingdom | 140,515 | | 1,036,537 |
| Vonovia SE | Germany | 64,217 | | 2,098,190 |
| | | | | 11,121,509 |
| Residential REITs 10.9% | | | | |
| American Homes 4 Rent, A | United States | 86,900 | | 1,936,132 |
| Apartment Investment & Management Co., A | United States | 40,397 | | 1,780,296 |
| AvalonBay Communities Inc | United States | 18,248 | | 3,162,561 |
| Camden Property Trust | United States | 15,500 | | 1,295,335 |
| Canadian Apartment Properties REIT | Canada | 52,500 | | 1,279,032 |
| Education Realty Trust Inc | United States | 26,400 | | 1,061,544 |
| Equity Lifestyle Properties Inc | United States | 22,502 | | 1,663,798 |
| Equity Residential | United States | 32,223 | | 1,958,192 |
| Essex Property Trust Inc | United States | 3,700 | | 829,910 |
| Invincible Investment Corp | Japan | 1,297 | | 613,271 |
| UDR Inc | United States | 9,797 | | 342,405 |
| | | | | 15,922,476 |
| Retail REITs 24.5% | | | | |
| CBL & Associates Properties Inc | United States | 55,000 | | 596,750 |
| Federal Realty Investment Trust | United States | 4,140 | | 581,380 |
| GGP Inc | United States | 64,716 | | 1,607,546 |
| Hammerson PLC | United Kingdom | 178,443 | | 1,226,547 |
| Kimco Realty Corp | United States | 66,351 | | 1,651,476 |
| Klepierre | France | 50,918 | | 1,931,875 |
| Link REIT | Hong Kong | 297,466 | | 2,037,688 |
| The Macerich Co | United States | 8,393 | | 576,515 |
| National Retail Properties Inc | United States | 23,400 | | 1,020,240 |
| Realty Income Corp | United States | 39,324 | | 2,344,890 |
16 Semiannual Report
franklintempleton.com
FRANKLIN GLOBAL TRUST
STATEMENT OF INVESTMENTS (UNAUDITED)
| | | | | | |
| Franklin Global Real Estate Fund (continued) | | | | | | |
| | Country | | Shares | | Value | |
| |
| Common Stocks (continued) | | | | | | |
| Retail REITs (continued) | | | | | | |
| Regency Centers Corp | United States | | 27,781 | $ | 1,937,169 | |
| Retail Properties of America Inc., A | United States | | 71,300 | | 1,067,361 | |
| Scentre Group | Australia | | 858,178 | | 2,863,328 | |
| Simon Property Group Inc | United States | | 39,810 | | 7,315,884 | |
| Smart Real Estate Investment Trust | Canada | | 32,500 | | 799,270 | |
| Unibail-Rodamco SE | France | | 15,016 | | 3,451,551 | |
| Vicinity Centres | Australia | | 542,201 | | 1,175,892 | |
| Weingarten Realty Investors | United States | | 44,060 | | 1,569,858 | |
| Westfield Corp | Australia | | 320,486 | | 2,136,186 | |
| | | | | | 35,891,406 | |
| Specialized REITs 5.7% | | | | | | |
| Coresite Realty Corp | United States | | 13,531 | | 1,165,425 | |
| CubeSmart | United States | | 43,747 | | 1,099,362 | |
| CyrusOne Inc | United States | | 11,300 | | 544,208 | |
| Digital Realty Trust Inc | United States | | 24,027 | | 2,586,026 | |
| Extra Space Storage Inc | United States | | 2,100 | | 151,305 | |
| Public Storage | United States | | 12,688 | | 2,727,920 | |
| | | | | | 8,274,246 | |
| Total Common Stocks (Cost $110,902,438) | | | | | 145,572,123 | |
| | | | Principal | | | |
| | | | Amount | | | |
| |
| Short Term Investments (Cost $900,000) 0.6% | | | | | | |
| Time Deposits 0.6% | | | | | | |
| Royal Bank of Canada, 0.50%, 2/01/17 | United States | $ | 900,000 | | 900,000 | |
| Total Investments (Cost $111,802,438) 100.1% | | | | | 146,472,123 | |
| Other Assets, less Liabilities (0.1)% | | | | | (121,614 | ) |
| Net Assets 100.0% | | | | $ | 146,350,509 | |
See Abbreviations on page 29.
aSecurity was purchased pursuant to Rule 144A under the Securities Act of 1933 and may be sold in transactions exempt from registration only to qualified institutional buyers
or in a public offering registered under the Securities Act of 1933. This security has been deemed liquid under guidelines approved by the Trust’s Board of Trustees. At
January 31, 2017, the value of this security was $938,758, representing 0.6% of net assets.
franklintempleton.com The accompanying notes are an integral part of these financial statements. | Semiannual Report 17
| | | |
| FRANKLIN GLOBAL TRUST | | | |
| |
| |
| |
| |
| Financial Statements | | | |
| |
| |
| Statement of Assets and Liabilities | | | |
| January 31, 2017 (unaudited) | | | |
| |
| Franklin Global Real Estate Fund | | | |
| |
| Assets: | | | |
| Investments in securities: | | | |
| Cost. | $ | 111,802,438 | |
| Value | $ | 146,472,123 | |
| Cash | | 15,542 | |
| Foreign currency, at value (cost $74,367) | | 74,417 | |
| Receivables: | | | |
| Investment securities sold | | 324,341 | |
| Capital shares sold | | 88,591 | |
| Dividends | | 214,064 | |
| European Union tax reclaims | | 29,218 | |
| Other assets | | 4 | |
| Total assets | | 147,218,300 | |
| Liabilities: | | | |
| Payables: | | | |
| Investment securities purchased | | 309,801 | |
| Capital shares redeemed | | 332,902 | |
| Management fees | | 105,918 | |
| Distribution fees | | 32,029 | |
| Transfer agent fees | | 24,923 | |
| Accrued expenses and other liabilities | | 62,218 | |
| Total liabilities | | 867,791 | |
| Net assets, at value | $ | 146,350,509 | |
| Net assets consist of: | | | |
| Paid-in capital | $ | 174,843,605 | |
| Distributions in excess of net investment income | | (5,854,697 | ) |
| Net unrealized appreciation (depreciation) | | 34,674,463 | |
| Accumulated net realized gain (loss) | | (57,312,862 | ) |
| Net assets, at value | $ | 146,350,509 | |
18 Semiannual Report | The accompanying notes are an integral part of these financial statements. franklintempleton.com
FRANKLIN GLOBAL TRUST
FINANCIAL STATEMENTS
Statement of Assets and Liabilities (continued)
January 31, 2017 (unaudited)
| | |
| Franklin Global Real Estate Fund | | |
| |
| Class A: | | |
| Net assets, at value | $ | 83,041,340 |
| Shares outstanding | | 9,765,693 |
| Net asset value per sharea | $ | 8.50 |
| Maximum offering price per share (net asset value per share ÷ 94.25%) | $ | 9.02 |
| Class C: | | |
| Net assets, at value | $ | 16,615,891 |
| Shares outstanding | | 1,976,763 |
| Net asset value and maximum offering price per sharea | $ | 8.41 |
| Class R6: | | |
| Net assets, at value | $ | 16,206 |
| Shares outstanding | | 1,901 |
| Net asset value and maximum offering price per share | $ | 8.52 |
| Advisor Class: | | |
| Net assets, at value | $ | 46,677,072 |
| Shares outstanding | | 5,469,681 |
| Net asset value and maximum offering price per share | $ | 8.53 |
aRedemption price is equal to net asset value less contingent deferred sales charges, if applicable.
franklintempleton.com The accompanying notes are an integral part of these financial statements. | Semiannual Report 19
|
| FRANKLIN GLOBAL TRUST |
| FINANCIAL STATEMENTS |
Statement of Operations
for the six months ended January 31, 2017 (unaudited)
| | | |
| Franklin Global Real Estate Fund | | | |
| |
| Investment income: | | | |
| Dividends (net of foreign taxes of $67,388) | $ | 1,248,083 | |
| Interest | | 1,989 | |
| Other income (Note 1d) | | 29,637 | |
| Total investment income | | 1,279,709 | |
| Expenses: | | | |
| Management fees (Note 3a) | | 794,712 | |
| Distribution fees: (Note 3c) | | | |
| Class A | | 114,099 | |
| Class C | | 91,807 | |
| Transfer agent fees: (Note 3e) | | | |
| Class A | | 75,906 | |
| Class C | | 15,207 | |
| Class R6 | | 63 | |
| Advisor Class | | 40,785 | |
| Custodian fees (Note 4) | | 5,995 | |
| Reports to shareholders | | 20,171 | |
| Registration and filing fees | | 30,397 | |
| Professional fees | | 25,298 | |
| Trustees’ fees and expenses | | 2,998 | |
| Other | | 7,119 | |
| Total expenses | | 1,224,557 | |
| Expense reductions (Note 4) | | (400 | ) |
| Expenses waived/paid by affiliates (Note 3f) | | (110,405 | ) |
| Net expenses | | 1,113,752 | |
| Net investment income. | | 165,957 | |
| Realized and unrealized gains (losses): | | | |
| Net realized gain (loss) from: | | | |
| Investments | | 3,232,390 | |
| Realized gain distributions from REITs. | | 1,100,826 | |
| Foreign currency transactions | | (40,299 | ) |
| Net realized gain (loss) | | 4,292,917 | |
| Net change in unrealized appreciation (depreciation) on: | | | |
| Investments | | (21,352,418 | ) |
| Translation of other assets and liabilities | | | |
| denominated in foreign currencies. | | 1,588 | |
| Net change in unrealized appreciation (depreciation) | | (21,350,830 | ) |
| Net realized and unrealized gain (loss) | | (17,057,913 | ) |
| Net increase (decrease) in net assets resulting from operations | $ | (16,891,956 | ) |
20 Semiannual Report | The accompanying notes are an integral part of these financial statements. franklintempleton.com
| | | | | | |
| | | FRANKLIN GLOBAL TRUST | |
| | | FINANCIAL STATEMENTS | |
| |
| |
| Statements of Changes in Net Assets | | | | | | |
| |
| Franklin Global Real Estate Fund | | | | | | |
| |
| | | Six Months Ended | | | | |
| | | January 31, 2017 | | | Year Ended | |
| | | (unaudited) | | | July 31, 2016 | |
| Increase (decrease) in net assets: | | | | | | |
| Operations: | | | | | | |
| Net investment income | $ | 165,957 | | $ | 2,714,297 | |
| Net realized gain (loss) | | 4,292,917 | | | 2,300,939 | |
| Net change in unrealized appreciation (depreciation) | | (21,350,830 | ) | | 13,547,408 | |
| Net increase (decrease) in net assets resulting from operations | | (16,891,956 | ) | | 18,562,644 | |
| Distributions to shareholders from: | | | | | | |
| Net investment income: | | | | | | |
| Class A | | (3,081,330 | ) | | (1,589,886 | ) |
| Class C | | (479,915 | ) | | (230,329 | ) |
| Class R6 | | (588 | ) | | (4,025 | ) |
| Advisor Class | | (1,788,146 | ) | | (845,427 | ) |
| Total distributions to shareholders | | (5,349,979 | ) | | (2,669,667 | ) |
| Capital share transactions: (Note 2) | | | | | | |
| Class A | | (7,020,367 | ) | | (8,688,545 | ) |
| Class C | | (1,774,233 | ) | | (3,966,078 | ) |
| Class R6 | | 2,154 | | | (220,045 | ) |
| Advisor Class | | 1,887,779 | | | 1,429,402 | |
| Total capital share transactions | | (6,904,667 | ) | | (11,445,266 | ) |
| Net increase (decrease) in net assets | | (29,146,602 | ) | | 4,447,711 | |
| Net assets: | | | | | | |
| Beginning of period | | 175,497,111 | | | 171,049,400 | |
| End of period. | $ | 146,350,509 | | $ | 175,497,111 | |
| Distributions in excess of net investment income included in net assets: | | | | | | |
| End of period. | $ | (5,854,697 | ) | $ | (670,675 | ) |
franklintempleton.com The accompanying notes are an integral part of these financial statements. | Semiannual Report 21
FRANKLIN GLOBAL TRUST
Notes to Financial Statements (unaudited)
Franklin Global Real Estate Fund
1. Organization and Significant Accounting Policies
Franklin Global Trust (Trust) is registered under the Investment Company Act of 1940 (1940 Act) as an open-end management investment company, consisting of five separate funds and applies the specialized accounting and reporting guidance in U.S. Generally Accepted Accounting Principles (U.S. GAAP). Franklin Global Real Estate Fund (Fund) is included in this report. The financial statements of the remaining funds in the Trust are presented separately. The Fund offers four classes of shares: Class A, Class C, Class R6 and Advisor Class. Each class of shares differs by its initial sales load, contingent deferred sales charges, voting rights on matters affecting a single class, its exchange privilege and fees primarily due to differing arrangements for distribution and transfer agent fees.
The following summarizes the Fund’s significant accounting policies.
a. Financial Instrument Valuation
The Fund’s investments in financial instruments are carried at fair value daily. Fair value is the price that would be received to sell an asset or paid to transfer a liability in an orderly transaction between market participants on the measurement date. The Fund calculates the net asset value (NAV) per share as of 4 p.m. Eastern time each day the New York Stock Exchange (NYSE) is open for trading. Under compliance policies and procedures approved by the Trust’s Board of Trustees (the Board), the Fund’s administrator has responsibility for oversight of valuation, including leading the cross-functional Valuation Committee (VC). The VC provides administration and oversight of the Fund’s valuation policies and procedures, which are approved annually by the Board. Among other things, these procedures allow the Fund to utilize independent pricing services, quotations from securities and financial instrument dealers, and other market sources to determine fair value.
Equity securities listed on an exchange or on the NASDAQ National Market System are valued at the last quoted sale price or the official closing price of the day, respectively. Foreign equity securities are valued as of the close of trading on the foreign stock exchange on which the security is primarily traded or as of 4 p.m. Eastern time. The value is then converted into its U.S. dollar equivalent at the foreign exchange rate in effect at 4 p.m. Eastern time on the day that the value of the security is determined. Over-the-counter (OTC) securities are valued within the range of the most recent quoted bid and ask prices. Securities that trade in multiple markets or on multiple exchanges are valued according to the broadest and most representative market. Certain equity securities are valued based upon fundamental characteristics or relationships to similar securities.
Investments in time deposits are valued at cost, which approximates fair value.
The Fund has procedures to determine the fair value of financial instruments for which market prices are not reliable or readily available. Under these procedures, the VC convenes on a regular basis to review such financial instruments and considers a number of factors, including significant unobservable valuation inputs, when arriving at fair value. The VC primarily employs a market-based approach which may use related or comparable assets or liabilities, recent transactions, market multiples, book values, and other relevant information for the investment to determine the fair value of the investment. An income-based valuation approach may also be used in which the anticipated future cash flows of the investment are discounted to calculate fair value. Discounts may also be applied due to the nature or duration of any restrictions on the disposition of the investments. Due to the inherent uncertainty of valuations of such investments, the fair values may differ significantly from the values that would have been used had an active market existed. The VC employs various methods for calibrating these valuation approaches including a regular review of key inputs and assumptions, transactional back-testing or disposition analysis, and reviews of any related market activity.
Trading in securities on foreign securities stock exchanges and OTC markets may be completed before 4 p.m. Eastern time. In addition, trading in certain foreign markets may not take place on every Fund’s business day. Occasionally, events occur between the time at which trading in a foreign security is completed and 4 p.m. Eastern time that might call into question the reliability of the value of a portfolio security held by the Fund. As a result, differences may arise between the value of the Fund’s portfolio securities as determined at the foreign market close and the latest indications of value at 4 p.m. Eastern time. In order to minimize the potential for these differences, the VC monitors price movements following the close of trading in foreign stock markets through a series of country specific market proxies (such as baskets of American Depositary Receipts, futures contracts and exchange traded funds). These price movements are measured against
22 Semiannual Report
franklintempleton.com
FRANKLIN GLOBAL TRUST
NOTES TO FINANCIAL STATEMENTS (UNAUDITED)
Franklin Global Real Estate Fund (continued)
established trigger thresholds for each specific market proxy to assist in determining if an event has occurred that may call into question the reliability of the values of the foreign securities held by the Fund. If such an event occurs, the securities may be valued using fair value procedures, which may include the use of independent pricing services.
When the last day of the reporting period is a non-business day, certain foreign markets may be open on those days that the Fund’s NAV is not calculated, which could result in differences between the value of the Fund’s portfolio securities on the last business day and the last calendar day of the reporting period. Any significant security valuation changes due to an open foreign market are adjusted and reflected by the Fund for financial reporting purposes.
b. Foreign Currency Translation
Portfolio securities and other assets and liabilities denominated in foreign currencies are translated into U.S. dollars based on the exchange rate of such currencies against U.S. dollars on the date of valuation. The Fund may enter into foreign currency exchange contracts to facilitate transactions denominated in a foreign currency. Purchases and sales of securities, income and expense items denominated in foreign currencies are translated into U.S. dollars at the exchange rate in effect on the transaction date. Portfolio securities and assets and liabilities denominated in foreign currencies contain risks that those currencies will decline in value relative to the U.S. dollar. Occasionally, events may impact the availability or reliability of foreign exchange rates used to convert the U.S. dollar equivalent value. If such an event occurs, the foreign exchange rate will be valued at fair value using procedures established and approved by the Board.
The Fund does not separately report the effect of changes in foreign exchange rates from changes in market prices on securities held. Such changes are included in net realized and unrealized gain or loss from investments in the Statement of Operations.
Realized foreign exchange gains or losses arise from sales of foreign currencies, currency gains or losses realized between the trade and settlement dates on securities transactions and the difference between the recorded amounts of dividends, interest, and foreign withholding taxes and the U.S. dollar equivalent of the amounts actually received or paid. Net unrealized foreign exchange gains and losses arise from changes in foreign exchange rates on foreign denominated assets and liabilities other than investments in securities held at the end of the reporting period.
c. Securities Lending
The Fund participates in an agency based securities lending program to earn additional income. The Fund receives cash collateral against the loaned securities in an amount equal to at least 102% of the fair value of the loaned securities. Collateral is maintained over the life of the loan in an amount not less than 100% of the fair value of loaned securities, as determined at the close of Fund business each day; any additional collateral required due to changes in security values is delivered to the Fund on the next business day. The collateral is deposited into a joint cash account with other funds and is used to invest in a money market fund managed by Franklin Advisers, Inc., an affiliate of the Fund, and/or a joint repurchase agreement. The Fund may receive income from the investment of cash collateral, in addition to lending fees and rebates paid by the borrower. Income from securities loaned, net of fees paid to the securities lending agent and/or third-party vendor, is reported separately in the Statement of Operations. The Fund bears the market risk with respect to the collateral investment, securities loaned, and the risk that the agent may default on its obligations to the Fund. If the borrower defaults on its obligation to return the securities loaned, the Fund has the right to repurchase the securities in the open market using the collateral received. The securities lending agent has agreed to indemnify the Fund in the event of default by a third party borrower. At January 31, 2017, the Fund had no securities on loan.
d. Income and Deferred Taxes
It is the Fund’s policy to qualify as a regulated investment company under the Internal Revenue Code. The Fund intends to distribute to shareholders substantially all of its taxable income and net realized gains to relieve it from federal income and excise taxes. As a result, no provision for U.S. federal income taxes is required.
The Fund may be subject to foreign taxation related to income received, capital gains on the sale of securities and certain foreign currency transactions in the foreign jurisdictions in which it invests. Foreign taxes, if any, are recorded based on the tax regulations and rates that exist in the foreign markets in which the Fund invests. When a capital gain tax is determined to apply, the Fund records an estimated deferred tax liability in an amount that would be payable if the securities were disposed
franklintempleton.com
Semiannual Report 23
FRANKLIN GLOBAL TRUST
NOTES TO FINANCIAL STATEMENTS (UNAUDITED)
Franklin Global Real Estate Fund (continued)
1. Organization and Significant Accounting
Policies (continued)
d. Income and Deferred Taxes (continued)
of on the valuation date. As a result of several court cases, in certain countries across the European Union, the Fund filed additional tax reclaims for previously withheld taxes on dividends earned in those countries (EU reclaims). These additional filings are subject to various administrative proceedings by the local jurisdictions’ tax authorities within the European Union, as well as a number of related judicial proceedings. Income recognized, if any, for EU reclaims is reflected as other income in the Statement of Operations and any related receivable, if any, is reflected as European Union tax reclaims in the Statement of Assets and Liabilities. When uncertainty exists as to the ultimate resolution of these proceedings, the likelihood of receipt of these EU reclaims, and the potential timing of payment, no amounts are reflected in the financial statements. For U.S. income tax purposes, when EU reclaims are received by the Fund and the Fund previously passed foreign tax credit on to its shareholders, the Fund must either amend historic tax reporting to shareholders or enter into a closing agreement with the Internal Revenue Service (IRS) in order to pay the associated tax liability on behalf of the Fund’s shareholders.
The Fund may recognize an income tax liability related to its uncertain tax positions under U.S. GAAP when the uncertain tax position has a less than 50% probability that it will be sustained upon examination by the tax authorities based on its technical merits. As of January 31, 2017, the Fund has determined that no tax liability is required in its financial statements related to uncertain tax positions for any open tax years (or expected to be taken in future tax years). Open tax years are those that remain subject to examination and are based on each tax jurisdiction’s statute of limitation.
e. Security Transactions, Investment Income, Expenses and Distributions
Security transactions are accounted for on trade date. Realized gains and losses on security transactions are determined on a specific identification basis. Interest income and estimated expenses are accrued daily. Dividend income is recorded on the ex-dividend date except for certain dividends from securities where the dividend rate is not available. In such cases, the dividend is recorded as soon as the information is received by the Fund. Distributions to shareholders are recorded on the ex-dividend date and are determined according to income tax regulations (tax basis). Distributable earnings determined on a tax basis may differ from earnings recorded in accordance with U.S. GAAP. These differences may be permanent or temporary. Permanent differences are reclassified among capital accounts to reflect their tax character. These reclassifications have no impact on net assets or the results of operations. Temporary differences are not reclassified, as they may reverse in subsequent periods.
Common expenses incurred by the Trust are allocated among the Funds based on the ratio of net assets of each Fund to the combined net assets of the Trust. Fund specific expenses are charged directly to the Fund that incurred the expense.
Realized and unrealized gains and losses and net investment income, not including class specific expenses, are allocated daily to each class of shares based upon the relative proportion of net assets of each class. Differences in per share distributions, by class, are generally due to differences in class specific expenses.
Distributions received by the Fund from certain securities may be a return of capital (ROC). Such distributions reduce the cost basis of the securities, and any distributions in excess of the cost basis are recognized as capital gains. For Real Estate Investment Trust (REIT) securities, the Fund records ROC estimates, if any, on the ex-dividend date and are adjusted once actual tax designations are known.
f. Accounting Estimates
The preparation of financial statements in accordance with U.S. GAAP requires management to make estimates and assumptions that affect the reported amounts of assets and liabilities at the date of the financial statements and the amounts of income and expenses during the reporting period. Actual results could differ from those estimates.
g. Guarantees and Indemnifications
Under the Trust’s organizational documents, its officers and trustees are indemnified by the Trust against certain liabilities arising out of the performance of their duties to the Trust. Additionally, in the normal course of business, the Trust, on behalf of the Fund, enters into contracts with service providers that contain general indemnification clauses. The Trust’s maximum exposure under these arrangements is unknown as
24 Semiannual Report
franklintempleton.com
FRANKLIN GLOBAL TRUST
NOTES TO FINANCIAL STATEMENTS (UNAUDITED)
Franklin Global Real Estate Fund (continued)
this would involve future claims that may be made against the
Trust that have not yet occurred. Currently, the Trust expects
the risk of loss to be remote.
2. Shares of Beneficial Interest
At January 31, 2017, there were an unlimited number of shares authorized (without par value). Transactions in the Fund’s shares were as follows:
| | | | | | | | | | |
| | Six Months Ended | | Year Ended | |
| | January 31, 2017 | | July 31, 2016 | |
| | Shares | | | Amount | | Shares | | | Amount | |
| Class A Shares: | | | | | | | | | | |
| Shares sold | 641,164 | | $ | 5,683,493 | | 1,590,561 | | $ | 13,887,493 | |
| Shares issued in reinvestment of distributions | 342,632 | | | 2,941,339 | | 179,281 | | | 1,517,212 | |
| Shares redeemed | (1,798,327 | ) | (15,645,199 | ) | (2,761,668 | ) | | (24,093,250 | ) |
| Net increase (decrease) | (814,531 | ) | $ | (7,020,367 | ) | (991,826 | ) | $ | (8,688,545 | ) |
| Class C Shares: | | | | | | | | | | |
| Shares sold | 171,194 | | $ | 1,509,613 | | 290,034 | | $ | 2,532,929 | |
| Shares issued in reinvestment of distributions | 53,133 | | | 449,781 | | 25,022 | | | 210,183 | |
| Shares redeemed | (429,112 | ) | | (3,733,627 | ) | (786,703 | ) | | (6,709,190 | ) |
| Net increase (decrease) | (204,785 | ) | $ | (1,774,233 | ) | (471,647 | ) | $ | (3,966,078 | ) |
| Class R6 Shares: | | | | | | | | | | |
| Shares sold | 181 | | $ | 1,566 | | 262 | | $ | 2,287 | |
| Shares issued in reinvestment of distributions | 68 | | | 588 | | 475 | | | 4,025 | |
| Shares redeemed | — | | | — | | (26,812 | ) | | (226,357 | ) |
| Net increase (decrease) | 249 | | $ | 2,154 | | (26,075 | ) | $ | (220,045 | ) |
| Advisor Class Shares: | | | | | | | | | | |
| Shares sold | 619,526 | | $ | 5,628,353 | | 757,568 | | $ | 6,730,739 | |
| Shares issued in reinvestment of distributions | 85,296 | | | 735,620 | | 42,776 | | | 362,740 | |
| Shares redeemed | (513,413 | ) | | (4,476,194 | ) | (640,171 | ) | | (5,664,077 | ) |
| Net increase (decrease) | 191,409 | | $ | 1,887,779 | | 160,173 | | $ | 1,429,402 | |
3. Transactions with Affiliates
Franklin Resources, Inc. is the holding company for various subsidiaries that together are referred to as Franklin Templeton Investments. Certain officers and trustees of the Trust are also officers and/or directors of the following subsidiaries:
| |
| Subsidiary | Affiliation |
| Franklin Templeton Institutional, LLC (FT Institutional) | Investment manager |
| Franklin Templeton Services, LLC (FT Services) | Administrative manager |
| Franklin Templeton Distributors, Inc. (Distributors) | Principal underwriter |
| Franklin Templeton Investor Services, LLC (Investor Services) | Transfer agent |
franklintempleton.com
Semiannual Report 25
FRANKLIN GLOBAL TRUST
NOTES TO FINANCIAL STATEMENTS (UNAUDITED)
Franklin Global Real Estate Fund (continued)
| 3. | Transactions with Affiliates (continued) |
| a. | Management Fees |
The Fund pays an investment management fee to FT Institutional based on the average daily net assets of the Fund as follows:
| | |
| Annualized Fee Rate | | Net Assets |
| 1.000 | % | Up to and including $500 million |
| 0.900 | % | Over $500 million, up to and including $1 billion |
| 0.850 | % | Over $1 billion, up to and including $1.5 billion |
| 0.800 | % | Over $1.5 billion, up to and including $6.5 billion |
| 0.780 | % | Over $6.5 billion, up to and including $11.5 billion |
| 0.760 | % | Over $11.5 billion, up to and including $16.5 billion |
| 0.740 | % | Over $16.5 billion, up to and including $19 billion |
| 0.730 | % | Over $19 billion, up to and including $21.5 billion |
| 0.720 | % | In excess of $21.5 billion |
For the period ended January 31, 2017, the annualized effective investment management fee rate was 1.000% of the Fund’s average daily net assets.
b. Administrative Fees
Under an agreement with FT Institutional, FT Services provides administrative services to the Fund. The fee is paid by FT Institutional based on the Fund’s average daily net assets, and is not an additional expense of the Fund.
c. Distribution Fees
The Board has adopted distribution plans for each share class, with the exception of Class R6 and Advisor Class shares, pursuant to Rule 12b-1 under the 1940 Act. Under the Fund’s Class A reimbursement distribution plan, the Fund reimburses Distributors for costs incurred in connection with the servicing, sale and distribution of the Fund’s shares up to the maximum annual plan rate. Under the Class A reimbursement distribution plan, costs exceeding the maximum for the current plan year cannot be reimbursed in subsequent periods. In addition, under the Fund’s Class C compensation distribution plan, the Fund pays Distributors for costs incurred in connection with the servicing, sale and distribution of the Fund’s shares up to the maximum annual plan rate. The plan year, for purposes of monitoring compliance with the maximum annual plan rates, is February 1 through January 31.
The maximum annual plan rates, based on the average daily net assets, for each class, are as follows:
The Board has set the current rate at 0.25% per year for Class A shares until further notice and approval by the Board.
d. Sales Charges/Underwriting Agreements
Front-end sales charges and contingent deferred sales charges (CDSC) do not represent expenses of the Fund. These charges are deducted from the proceeds of sales of Fund shares prior to investment or from redemption proceeds prior to remittance, as applicable. Distributors has advised the Fund of the following commission transactions related to the sales and redemptions of the Fund’s shares for the period:
| | |
| Sales charges retained net of commissions paid to | | |
| unaffiliated broker/dealers | $ | 12,659 |
| CDSC retained | $ | 440 |
26 Semiannual Report
franklintempleton.com
FRANKLIN GLOBAL TRUST
NOTES TO FINANCIAL STATEMENTS (UNAUDITED)
Franklin Global Real Estate Fund (continued)
e. Transfer Agent Fees
Each class of shares, except for Class R6, pays transfer agent fees to Investor Services for its performance of shareholder servicing obligations and reimburses Investor Services for out of pocket expenses incurred, including shareholder servicing fees paid to third parties. These fees are allocated daily based upon their relative proportion of such classes’ aggregate net assets. Class R6 pays Investor Services transfer agent fees specific to that class.
For the period ended January 31, 2017, the Fund paid transfer agent fees of $131,961, of which $65,792 was retained by Investor Services.
f. Waiver and Expense Reimbursements
FT Institutional and Investor Services have contractually agreed in advance to waive or limit their respective fees and to assume as their own expense certain expenses otherwise payable by the Fund so that the expenses (excluding distribution fees, and acquired fund fees and expenses) for Class A, Class C and Advisor Class of the Fund do not exceed 1.15% and Class R6 does not exceed 0.98% based on the average net assets of each class (other than certain non-routine expenses or costs, including those relating to litigation, indemnification, reorganizations, and liquidations) until November 30, 2017. Total expenses waived or paid are not subject to recapture subsequent to the Fund’s fiscal year end. Prior to December 1, 2016, expenses for Class R6 were limited to 0.99%.
4. Expense Offset Arrangement
The Fund has entered into an arrangement with its custodian whereby credits realized as a result of uninvested cash balances are used to reduce a portion of the Fund’s custodian expenses. During the period ended January 31, 2017, the custodian fees were reduced as noted in the Statement of Operations.
5. Income Taxes
For tax purposes, capital losses may be carried over to offset future capital gains. Capital loss carryforwards with no expiration, if any, must be fully utilized before those losses with expiration dates.
At July 31, 2016, capital loss carryforwards were as follows:
| | |
| Capital loss carryforwards subject to expiration: | | |
| 2017 | $ | 20,729,968 |
| 2018 | | 35,647,494 |
| 2019 | | 557,818 |
| Total capital loss carryforwards | $ | 56,935,280 |
For tax purposes, the Fund may elect to defer any portion of a post-October capital loss to the first day of the following fiscal year. At July 31, 2016, the Fund deferred post-October capital losses of $298,845.
At January 31, 2017, the cost of investments and net unrealized appreciation (depreciation) for income tax purposes were as follows:
| | | |
| Cost of investments | $ | 122,193,385 | |
| |
| Unrealized appreciation | $ | 36,642,219 | |
| Unrealized depreciation | | (12,363,481 | ) |
| Net unrealized appreciation (depreciation) | $ | 24,278,738 | |
franklintempleton.com
Semiannual Report 27
FRANKLIN GLOBAL TRUST
NOTES TO FINANCIAL STATEMENTS (UNAUDITED)
Franklin Global Real Estate Fund (continued)
5. Income Taxes (continued)
Differences between income and/or capital gains as determined on a book basis and a tax basis are primarily due to differing treatment of passive foreign investment company shares.
6. Investment Transactions
Purchases and sales of investments (excluding short term securities) for the period ended January 31, 2017, aggregated $20,440,978 and $31,321,123, respectively.
7. Concentration of Risk
Investing in foreign securities may include certain risks and considerations not typically associated with investing in U.S. securities, such as fluctuating currency values and changing local and regional economic, political and social conditions, which may result in greater market volatility. In addition, certain foreign securities may not be as liquid as U.S. securities.
The Fund invests a large percentage of its total assets in REIT securities. Such concentration may subject the Fund to special risks associated with real estate securities. These securities may be more sensitive to economic or regulatory developments due to a variety of factors such as local, regional, national and global economic conditions, interest rates and tax considerations.
8. Credit Facility
The Fund, together with other U.S. registered and foreign investment funds (collectively, Borrowers), managed by Franklin Templeton Investments, are borrowers in a joint syndicated senior unsecured credit facility totaling $2 billion (Global Credit Facility) which matured on February 10, 2017. This Global Credit Facility provides a source of funds to the Borrowers for temporary and emergency purposes, including the ability to meet future unanticipated or unusually large redemption requests. Effective February 10, 2017, the Borrowers renewed the Global Credit Facility for a one year term, maturing February 9, 2018, for a total of $2 billion.
Under the terms of the Global Credit Facility, the Fund shall, in addition to interest charged on any borrowings made by the Fund and other costs incurred by the Fund, pay its share of fees and expenses incurred in connection with the implementation and maintenance of the Global Credit Facility, based upon its relative share of the aggregate net assets of all of the Borrowers, including an annual commitment fee of 0.15% based upon the unused portion of the Global Credit Facility. These fees are reflected in other expenses in the Statement of Operations. During the period ended January 31, 2017, the Fund did not use the Global Credit Facility.
9. Fair Value Measurements
The Fund follows a fair value hierarchy that distinguishes between market data obtained from independent sources (observable inputs) and the Fund’s own market assumptions (unobservable inputs). These inputs are used in determining the value of the Fund’s financial instruments and are summarized in the following fair value hierarchy:
- Level 1 – quoted prices in active markets for identical financial instruments
- Level 2 – other significant observable inputs (including quoted prices for similar financial instruments, interest rates, prepayment speed, credit risk, etc.)
- Level 3 – significant unobservable inputs (including the Fund’s own assumptions in determining the fair value of financial instruments)
28 Semiannual Report
franklintempleton.com
FRANKLIN GLOBAL TRUST
NOTES TO FINANCIAL STATEMENTS (UNAUDITED)
Franklin Global Real Estate Fund (continued)
The input levels are not necessarily an indication of the risk or liquidity associated with financial instruments at that level.
For movements between the levels within the fair value hierarchy, the Fund has adopted a policy of recognizing the transfers as of the date of the underlying event which caused the movement.
| | | | | | | | |
| | | Level 1 | | Level 2 | | Level 3 | | Total |
| Assets: | | | | | | | | |
| Investments in Securities: | | | | | | | | |
| Equity Investmentsa | $ | 145,572,123 | $ | — | $ | — | $ | 145,572,123 |
| Short Term Investments | | — | | 900,000 | | — | | 900,000 |
| Total Investments in Securities | $ | 145,572,123 | $ | 900,000 | $ | — | $ | 146,472,123 |
| aFor detailed categories, see the accompanying Statement of Investments. | | | | | | | |
| |
| 10. Investment Company Reporting Modernization | | | | | | |
In October 2016, the U.S. Securities and Exchange Commission adopted new rules and amended existing rules (together, final rules) intended to modernize the reporting and disclosure of information by registered investment companies. In part, the final rules amend Regulation S-X and require standardized, enhanced disclosures about derivatives in investment company financial statements, as well as other amendments. The compliance date for the amendments to Regulation S-X is August 1, 2017. Management is currently evaluating the impact that the adoption of the amendments to Regulation S-X will have on the Fund’s financial statements and related disclosures.
11. Subsequent Events
The Fund has evaluated subsequent events through the issuance of the financial statements and determined that no events have occurred that require disclosure other than those already disclosed in the financial statements.
|
| Abbreviations |
| Selected Portfolio |
| REIT Real Estate Investment Trust |
franklintempleton.com
Semiannual Report 29
FRANKLIN GLOBAL TRUST
FRANKLIN GLOBAL REAL ESTATE FUND
Shareholder Information
Proxy Voting Policies and Procedures
The Fund’s investment manager has established Proxy Voting Policies and Procedures (Policies) that the Fund uses to determine how to vote proxies relating to portfolio securities. Shareholders may view the Fund’s complete Policies online at franklintempleton.com. Alternatively, shareholders may request copies of the Policies free of charge by calling the Proxy Group collect at (954) 527-7678 or by sending a written request to: Franklin Templeton Companies, LLC, 300 S.E. 2nd Street, Fort Lauderdale, FL 33301, Attention: Proxy Group. Copies of the Fund’s proxy voting records are also made available online at franklintempleton.com and posted on the U.S. Securities and Exchange Commission’s website at sec.gov and reflect the most recent 12-month period ended June 30.
Quarterly Statement of Investments
The Trust, on behalf of the Fund, files a complete statement of investments with the U.S. Securities and Exchange Commission for the first and third quarters for each fiscal year on Form N-Q. Shareholders may view the filed Form N-Q by visiting the Commission’s website at sec.gov. The filed form may also be viewed and copied at the Commission’s Public Reference Room in Washington, DC. Information regarding the operations of the Public Reference Room may be obtained by calling (800) SEC-0330.
30 Semiannual Report
franklintempleton.com
This page intentionally left blank.
This page intentionally left blank.
| |
| Contents | |
| |
| Semiannual Report | |
| Economic and Market Overview | 3 |
| Franklin International Growth Fund | 4 |
| Franklin International Small Cap Growth Fund | 11 |
| Financial Highlights and Statements of Investments | 18 |
| Financial Statements | 32 |
| Notes to Financial Statements | 36 |
| Shareholder Information | 48 |
Visit franklintempleton.com for fund updates, to access your account, or to find helpful financial planning tools.
2 Semiannual Report
franklintempleton.com
Semiannual Report
Economic and Market Overview
The U.S. economy continued to grow in 2016’s fourth quarter, though at a slower pace compared to the third quarter. Strength in consumer spending, private inventory investment, residential and non-residential fixed investments, and state and local government spending was partially offset by declines in net exports and federal government spending. The manufacturing sector generally expanded, and the services sector continued to grow. The unemployment rate decreased slightly from 4.9% in July 2016 to 4.8% at period-end.1 Annual inflation, as measured by the Consumer Price Index, ended the period at its highest level in more than four years. At its December meeting, the U.S. Federal Reserve (Fed) raised its target range for the federal funds rate to 0.50%–0.75%, as policymakers cited improved labor market conditions and higher inflation. The broad U.S. stock market, as measured by the Standard & Poor’s® 500 Index, advanced for the six months ended January 31, 2017.
The global economy in general expanded during the six months under review, aided by accommodative monetary policies of various central banks. In this environment, global developed and emerging market stocks rose, as measured by the MSCI All Country World Index. Further supporting global markets were an improvement in industrial commodity prices, encouraging earnings reports from the U.S. banking sector, investor optimism about U.S. President Donald Trump’s pro-growth policies, and an Organization of the Petroleum Exporting Countries deal to curb oil production. However, investors expressed concerns about the terms of the U.K.’s exit from the European Union, President Trump’s protectionist policies and executive order banning entry from seven Muslim-majority countries, uncertainty about the Fed’s timing for raising interest rates and the health of European banks.
In Europe, the U.K.’s annualized economic growth accelerated in 2016’s second half, driven by gross fixed capital formation in the third quarter and manufacturing and services in the fourth quarter. The eurozone’s economic growth improved in the third and fourth quarters, while the region’s annual inflation rate rose to its highest level in four years. At its December meeting, the European Central Bank (ECB) extended the continuation of its monthly asset purchases from March to December 2017, but it planned to scale back the purchase amount beginning in April. In January, the ECB kept its key policy rates unchanged and retained its monthly asset purchases, indicating that it could increase the program in size and duration if needed.
In Asia, Japan’s quarterly gross domestic product grew slower in 2016’s third quarter compared with the second quarter, mainly due to declines in private non-residential and public investments. At its September meeting, the Bank of Japan overhauled its monetary stimulus program to adjust Japanese government bond purchases with the aim of keeping the 10-year rate for these bonds near 0%. China’s economy grew at a faster-than-expected rate in 2016’s fourth quarter compared to 2015’s fourth quarter, supported by consumer spending and a property market driven by robust bank lending. The People’s Bank of China also devalued its currency against the U.S. dollar during the period.
The foregoing information reflects our analysis and opinions as of January 31, 2017. The information is not a complete analysis of every aspect of any market, country, industry, security or fund. Statements of fact are from sources considered reliable.
1. Source: Bureau of Labor Statistics.
franklintempleton.com
Semiannual Report 3
Franklin International Growth Fund
This semiannual report for Franklin International Growth Fund covers the period ended January 31, 2017.
Your Fund’s Goal and Main Investments
The Fund seeks long-term capital appreciation by investing predominantly in equity securities of mid- and large-capitalization companies, generally those with market capitalizations greater than $2 billion, located outside of the U.S., including developing or emerging market countries. The Fund considers international companies to be those organized under the laws of a country outside of the U.S. or having a principal office in a country outside of the U.S., or whose securities are listed or traded principally on a recognized stock exchange or over-the-counter market outside of the U.S.

Performance Overview
For the six months ended January 31, 2017, the Fund’s Class A shares delivered a +0.90% cumulative total return. In comparison, the Fund’s new benchmark, the MSCI Europe, Australasia, Far East (EAFE) (Net Dividends) Index, returned +3.50%, while the Fund’s old benchmark, the MSCI EAFE (Gross Dividends) Index, returned +3.60%.1 The MSCI EAFE Index measures global developed stock market performance excluding the U.S. and Canada. The investment manager believes the Net Dividends Index is more in line with the Fund, taking into account the impact of foreign withholding taxes. You can find the Fund’s long-term performance data in the Performance Summary beginning on page 8.
Performance data represent past performance, which does not guarantee future results. Investment return and principal value will fluctuate, and you may have a gain or loss when you sell your shares. Current performance may differ from figures shown. For most recent month-end performance, go to franklintempleton.com or call (800) 342-5236.
Investment Strategy
In choosing individual equity investments, we employ a disciplined, bottom-up approach to identify attractive investment opportunities that have higher expected revenue and earnings growth than their peers. We use a growth investment style and in-depth, fundamental research to identify high-quality companies, across all industry groups, with sustainable business models that offer the most attractive combination of growth potential, quality and valuation.
Manager’s Discussion
During the six months ended January 31, 2017, key detractors from the Fund’s performance relative to its benchmark, the MSCI EAFE (Net Dividends) Index, included stock selection in the materials and information technology (IT) sectors.2 An overweighting in health care and an underweighting in financials also hurt relative results.3
In materials, Germany-based flavors and fragrances company Symrise and Netherlands-based health, nutrition and chemicals company Koninklijke DSM detracted from relative performance. Historically, less volatile chemicals stocks in general underperformed during the market rally that favored cyclical stocks. Despite weak stock price performance, fundamentals have remained robust, in our analysis. Symrise reported strong earnings for the first nine months of 2016 and remained optimistic about the fourth quarter, as it continued to grow faster than the overall industry.
1. Source: MorningStar.
The index is unmanaged and includes reinvestment of any income or distributions. It does not reflect any fees, expenses or sales charges. One cannot invest directly in an
index, and an index is not representative of the Fund’s portfolio.
2. The materials sector comprises chemicals in the SOI. The IT sector comprises Internet software and services, IT services and software in the SOI.
3. The health care sector comprises biotechnology, health care equipment and supplies, and pharmaceuticals in the SOI. The financials sector comprises banks and capital
markets in the SOI.
The dollar value, number of shares or principal amount, and names of all portfolio holdings are listed in the Fund’s Statement of Investments (SOI).
The SOI begins on page 23.
4 Semiannual Report
franklintempleton.com
FRANKLIN INTERNATIONAL GROWTH FUND
| | |
| Top 10 Sectors/Industries | | |
| 1/31/17 | | |
| | % of Total | |
| | Net Assets | |
| Software | 11.0 | % |
| Capital Markets | 8.1 | % |
| Pharmaceuticals | 8.0 | % |
| Chemicals | 7.9 | % |
| Machinery | 5.6 | % |
| Health Care Equipment & Supplies | 5.4 | % |
| Internet & Direct Marketing Retail | 5.4 | % |
| Biotechnology | 4.9 | % |
| Internet Software & Services | 4.7 | % |
| Trading Companies & Distributors | 4.5 | % |
In the IT sector, a combination of profit taking by many investors and overall sector weakness during the market rally weighed on a wide range of individual companies, including Japan-based social media company Line, U.K.-based accounting software company The Sage Group and U.K.-based payments processor Worldpay Group. We believe Line could benefit from its transition from a messaging app to a broader media portal over time. Sage Group, in our view, could continue to benefit from its transition to a cloud-based subscription business model over time. Worldpay’s long-term prospects continue to look attractive to us as cash card penetration in Europe increases.
Health care sector detractors from relative performance included U.K.-listed generic drug maker Hikma Pharmaceuticals and Japan-based ophthalmic drug manufacturer Santen Pharmaceutical. Hikma’s stock price fell after an earnings warning related to recently acquired West Ward’s integration issues, primarily those associated with delayed U.S. Food and Drug Administration filings and increased litigation costs in pursuit of generic drug filings. We believe these to be temporary issues that do not change our long-term outlook for the company’s injectables business. Santen’s shares declined due to the Japanese currency’s strength, and we have not identified any fundamental issues with the company’s underlying drug business.
Additional key individual detractors included China-based Vipshop Holdings, an Internet flash sale operator.4 Its shares fell following the company’s latest earnings report. Sales continued to decelerate, due to the company’s increased size, but remained at a double-digit percentage pace. Although the
| | |
| Top 10 Holdings | | |
| 1/31/17 | | |
| Company | % of Total | |
| Sector/Industry, Country | Net Assets | |
| Delphi Automotive PLC | 3.3 | % |
| Auto Components, U.K. | | |
| DSV AS | 3.3 | % |
| Road & Rail, Denmark | | |
| Azimut Holding SpA | 3.2 | % |
| Capital Markets, Italy | | |
| KBC Groep NV | 3.2 | % |
| Banks, Belgium | | |
| Weir Group PLC | 3.1 | % |
| Machinery, U.K. | | |
| GN Store Nord A/S | 2.9 | % |
| Health Care Equipment & Supplies, Denmark | | |
| Vipshop Holdings Ltd. | 2.9 | % |
| Internet & Direct Marketing Retail, China | | |
| Wolseley PLC | 2.8 | % |
| Trading Companies & Distributors, U.K. | | |
| Roche Holding AG | 2.8 | % |
| Pharmaceuticals, Switzerland | | |
| Hikma Pharmaceuticals PLC | 2.8 | % |
| Pharmaceuticals, U.K. | | |
stock may continue to be volatile, we believe growth should remain robust, given Vipshop’s strong market position.
GEA Group, a Germany-based food processing equipment manufacturer, hampered relative returns after the company issued a profit warning due to order delays. Moreover, weakness in the dairy market continued to crimp demand for equipment, and margins have declined. However, we expect these issues to be temporary and anticipate strong long-term demand for food processing equipment.
It is important to recognize the effect of currency movements on the Fund’s performance. In general, if the value of the U.S. dollar goes up compared with a foreign currency, an investment traded in that foreign currency will go down in value because it will be worth fewer U.S. dollars. This can have a negative effect on Fund performance. Conversely, when the U.S. dollar weakens in relation to a foreign currency, an investment traded in that foreign currency will increase in value, which can contribute to Fund performance. For the six months ended January 31, 2017, the U.S. dollar rose in value relative to most currencies. As a result, the Fund’s performance was negatively affected by the portfolio’s investment predominantly in securities with non-U.S. currency exposure.
4. Not part of the index.
franklintempleton.com
Semiannual Report 5
FRANKLIN INTERNATIONAL GROWTH FUND
Conversely, key contributors to the Fund’s relative performance included an underweighting in the defensive consumer staples sector and a lack of exposures to the utilities, telecommunication services and real estate sectors.5 Stock selection and overweightings in industrials and consumer discretionary also supported relative performance.6
In the industrials sector, shares of U.K. plumbing and heating products provider Wolseley and U.K. engineering firm Weir Group advanced amid investor optimism about greater infrastructure spending, potentially faster economic growth and rebounding commodities prices. Germany-based airplane engine manufacturer MTU Aero Engines also contributed to relative performance following a strong earnings report.4 We believe its business momentum remained strong despite a slight delay in delivering new engines.
Several Asia-based holdings contributed to relative performance in the consumer discretionary sector, particularly China-based after-school tutoring company TAL Education Group and Japan-based online retailer Start Today.4 We continue to think that TAL Education Group’s earnings momentum will likely remain strong, given the Chinese education system’s heavy focus on testing. Start Today, Japan’s leading online apparel specialist selling third-party brands through its Zozotown website, is likely to continue to take advantage of the secular growth opportunity in Japanese online retail, in our analysis, as online penetration levels remain low.
Other notable contributors included GN Store Nord, a Danish hearing aid and communications headset manufacturer.4 During the period, GN Store bought a private practice consultancy business and announced a shift in its Costco strategy in the U.S., both of which we believe could potentially support longer term growth.
Belgian bank KBC Groep and Italian wealth manager Azimut Holding4 also contributed to relative returns amid a broad-based rebound in financials stocks and subsiding concerns about European banks during the period. KBC could continue to see steady growth in its Belgium operations, in our view, while it should benefit from faster growth in its Eastern European and Irish businesses. Azimut, which recently completed a legal reorganization, continued to benefit from strong inflows given negative interest rates and challenges at some of Italy’s largest banks.
Check Point Software Technologies, an Israel-based network security company, aided relative returns. The company reported better-than-anticipated earnings, resulting from a recent product refresh that gained good marketplace traction, and highlighted a healthy spending environment for security products. Shares of Argentina-based online marketplace operator MercadoLibre rose as the company continued to exhibit robust fundamentals across its business and greater adoption of its payment services.4
Top 10 Countries
1/31/17
| | |
| | % of Total | |
| | Net Assets | |
| U.K. | 31.2 | % |
| Germany | 12.7 | % |
| Japan | 7.4 | % |
| Denmark | 6.2 | % |
| Belgium | 5.9 | % |
| Italy | 5.7 | % |
| Canada | 5.2 | % |
| China | 5.1 | % |
| Australia | 4.7 | % |
| Switzerland | 2.8 | % |
From a geographic perspective, key detractors from the Fund’s relative performance included stock selection and an underweighting in Japan, as well as stock selection and an overweighting in the U.K. Stock selection in Asia Pacific ex-Japan, particularly in Australia, also hurt results. Conversely, key contributors to relative performance included stock selection in Europe, particularly in Denmark, Belgium and Italy. Emerging markets exposure, notably in Argentina, supported relative returns, as did North American exposure, especially in the U.S.
5. The consumer staples sector comprises household products in the SOI.
6. The industrials sector comprises aerospace and defense, machinery, professional services, road and rail, and trading companies and distributors in the SOI. The consumer
discretionary sector comprises auto components; diversified consumer services; Internet and direct marketing retail; media; multiline retail; and textiles, apparel and luxury
goods in the SOI.
See www.franklintempletondatasources.com for additional data provider information.
6 Semiannual Report
franklintempleton.com
FRANKLIN INTERNATIONAL GROWTH FUND
Thank you for your continued participation in Franklin
International Growth Fund. We look forward to serving your
future investment needs.

The foregoing information reflects our analysis, opinions and portfolio
holdings as of January 31, 2017, the end of the reporting period. The
way we implement our main investment strategies and the resulting
portfolio holdings may change depending on factors such as market
and economic conditions. These opinions may not be relied upon as
investment advice or an offer for a particular security. The information
is not a complete analysis of every aspect of any market, country,
industry, security or the Fund. Statements of fact are from sources
considered reliable, but the investment manager makes no
representation or warranty as to their completeness or accuracy.
Although historical performance is no guarantee of future results,
these insights may help you understand our investment management
philosophy.
CFA® is a trademark owned by CFA Institute.
franklintempleton.com
Semiannual Report 7
FRANKLIN INTERNATIONAL GROWTH FUND
Performance Summary as of January 31, 2017
The performance table does not reflect any taxes that a shareholder would pay on Fund dividends, capital gain distributions, if any, or any realized gains on the sale of Fund shares. Total return reflects reinvestment of the Fund’s dividends and capital gain distributions, if any, and any unrealized gains or losses.
Performance as of 1/31/171
Cumulative total return excludes sales charges. Average annual total return includes maximum sales charges. Sales charges will vary depending on the size of the investment and the class of share purchased. The maximum is 5.75% and the minimum is 0%. Class A: 5.75% maximum initial sales charge; Advisor Class: no sales charges. For other share classes, visit franklintempleton.com.
| | | | |
| | Cumulative | | Average Annual | |
| Share Class | Total Return2 | | Total Return3 | |
| A | | | | |
| 6-Month | +0.90 | % | -4.94 | % |
| 1-Year | +13.86 | % | +7.30 | % |
| 5-Year | +27.40 | % | +3.72 | % |
| Since Inception (6/3/08) | +18.17 | % | +1.25 | % |
| Advisor | | | | |
| 6-Month | +1.09 | % | +1.09 | % |
| 1-Year | +14.11 | % | +14.11 | % |
| 5-Year | +29.28 | % | +5.27 | % |
| Since Inception (6/3/08) | +21.13 | % | +2.24 | % |
Performance data represent past performance, which does not guarantee future results. Investment return and principal value will fluctuate, and you may have a gain or loss when you sell your shares. Current performance may differ from figures shown. For most recent month-end performance, go to franklintempleton.com or call (800) 342-5236.
See page 9 for Performance Summary footnotes.
8 Semiannual Report
franklintempleton.com
| | | | |
| | | | FRANKLIN INTERNATIONAL GROWTH FUND | |
| | | | PERFORMANCE SUMMARY | |
| |
| Total Annual Operating Expenses4 | | | |
| Share Class | With Waiver | | Without Waiver | |
| A | 1.25 | % | 1.46 | % |
| Advisor | 1.00 | % | 1.21 | % |
Each class of shares is available to certain eligible investors and has different annual fees and expenses, as described in the prospectus.
All investments involve risks, including possible loss of principal. Special risks are associated with foreign investing, including currency fluctuations, economic
instability and political developments. Investments in emerging markets involve heightened risks related to the same factors, in addition to those associated with
these markets’ smaller size and lesser liquidity. The Fund is actively managed but there is no guarantee that the manager’s investment decisions will produce the
desired results. The Fund’s prospectus also includes a description of the main investment risks.
1. The Fund has an expense reduction and a fee waiver associated with any investments it makes in a Franklin Templeton money fund and/or other Franklin Templeton fund,
contractually guaranteed through 11/30/17. Fund investment results reflect the expense reduction and fee waiver; without these reductions, the results would have been lower.
2. Cumulative total return represents the change in value of an investment over the periods indicated.
3. Average annual total return represents the average annual change in value of an investment over the periods indicated. Return for less than one year, ifany,hasnotbeen
annualized.
4. Figures are as stated in the Fund’s current prospectus and may differ from the expense ratios disclosed in the Your Fund’s Expenses and Financial Highlights sections in this
report. In periods of market volatility, assets may decline significantly, causing total annual Fund operating expenses to become higher than the figures shown.
franklintempleton.com
Semiannual Report 9
FRANKLIN INTERNATIONAL GROWTH FUND
Your Fund’s Expenses
As a Fund shareholder, you can incur two types of costs: (1) transaction costs, including sales charges (loads) on Fund purchases and redemptions; and (2) ongoing Fund costs, including management fees, distribution and service (12b-1) fees, and other Fund expenses. All mutual funds have ongoing costs, sometimes referred to as operating expenses. The table below shows ongoing costs of investing in the Fund and can help you understand these costs and compare them with those of other mutual funds. The table assumes a $1,000 investment held for the six months indicated.
Actual Fund Expenses
The table below provides information about actual account values and actual expenses in the columns under the heading “Actual.” In these columns the Fund’s actual return, which includes the effect of Fund expenses, is used to calculate the “Ending Account Value” for each class of shares. You can estimate the expenses you paid during the period by following these steps (of course, your account value and expenses will differ from those in this illustration): Divide your account value by $1,000 (if your account had an $8,600 value, then $8,600 ÷ $1,000 = 8.6). Then multiply the result by the number in the row for your class of shares under the headings “Actual” and “Expenses Paid During Period” (if Actual Expenses Paid During Period were $7.50, then 8.6 x $7.50 = $64.50). In this illustration, the actual expenses paid this period are $64.50.
Hypothetical Example for Comparison with Other Funds
Under the heading “Hypothetical” in the table, information is provided about hypothetical account values and hypothetical expenses based on the Fund’s actual expense ratio and an assumed rate of return of 5% per year before expenses, which is not the Fund’s actual return. This information may not be used to estimate the actual ending account balance or expenses you paid for the period, but it can help you compare ongoing costs of investing in the Fund with those of other funds. To do so, compare this 5% hypothetical example for the class of shares you hold with the 5% hypothetical examples that appear in the shareholder reports of other funds.
Please note that expenses shown in the table are meant to highlight ongoing costs and do not reflect any transactional costs. Therefore, information under the heading “Hypothetical” is useful in comparing ongoing costs only, and will not help you compare total costs of owning different funds. In addition, if transactional costs were included, your total costs would have been higher.
| | | | | | | | | | | | | | |
| | | | | | | Actual | | | Hypothetical | | | |
| | | | | (actual return after expenses) | | (5% annual return before expenses) | | |
| | | | | | | Expenses | | | | Expenses | Net | |
| | | Beginning | | Ending | | Paid During | | Ending | | Paid During | Annualized | |
| Share | | Account | | Account | | Period | | Account | | Period | Expense | |
| Class | | Value 8/1/16 | | Value 1/31/17 | | 8/1/16–1/31/171,2,3 | | Value 1/31/17 | | 8/1/16–1/31/171,2,3 | Ratio2,3 | |
| A | $ | 1,000 | $ | 1,009.00 | | $ | 7.04 | $ | 1,018.20 | | $ | 7.07 | 1.39 | % |
| C | $ | 1,000 | $ | 1,005.60 | $ | 10.82 | $ | 1,014.42 | $ | 10.87 | 2.14 | % |
| R | $ | 1,000 | $ | 1,008.30 | | $ | 8.15 | $ | 1,017.09 | | $ | 8.19 | 1.61 | % |
| R6 | $ | 1,000 | $ | 1,012.00 | | $ | 4.82 | $ | 1,020.42 | | $ | 4.84 | 0.95 | % |
| Advisor | $ | 1,000 | $ | 1,010.90 | | $ | 5.78 | $ | 1,019.46 | | $ | 5.80 | 1.14 | % |
|
| 1. Expenses are equal to the annualized expense ratio for the six-month period as indicated above–in the far right column–multiplied by the simple average account value |
| over the period indicated, and then multiplied by 184/365 to reflect the one-half year period. |
| 2. Reflects expenses after fee waivers and expense reimbursements. Does not include acquired fund fees and expenses. |
| 3. From 8/1/16 through 11/30/16, expense waivers resulted in net annualized expense ratios (excluding acquired fund fees and expenses) for each share class of: A 1.44%, |
| C 2.19%, R 1.69%, R6 1.00% (reflecting the Class R6 fee cap effective through 11/30/16) and Advisor 1.19%. Effective 12/1/16, the Fund’s management fee and expense |
| cap were reduced and, as a result, net annualized expense ratios (excluding acquired fund fees and expenses) for each share class changed to: A 1.25%, C 2.00%, R 1.50%, |
| R6 0.82% and Advisor 1.00%. If the reduced management fee and expense cap had been in effect for the entire six-month period (8/1/16—1/31/17), the Actual expenses paid |
| for each share class during the period would have been: A $6.33, C $10.11, R $7.59, R6 $4.16 and Advisor $5.07, and the Hypothetical expenses paid for each share class |
| during the period would have been: A $6.36, C $10.16, R $7.63, R6 $4.18 and Advisor $5.09. |
10 Semiannual Report
franklintempleton.com
Franklin International Small Cap Growth Fund
We are pleased to bring you Franklin International Small Cap Growth Fund’s semiannual report for the period ended January 31, 2017. Effective June 3, 2013, the Fund closed to new investors, with limited exceptions.
Your Fund’s Goal and Main Investments
The Fund seeks long-term capital appreciation by investing at least 80% of its net assets in a diversified portfolio of marketable equity and equity-related securities of smaller international companies with market capitalizations not exceeding $5 billion (or the equivalent in local currencies), or the highest market capitalization of the MSCI Europe, Australasia, Far East (EAFE) Small Cap Index, whichever is greater, at the time of purchase. The Fund considers international companies to be those organized under the laws of a country outside of the U.S. or having a principal office in a country outside of the U.S., or whose securities are listed or traded principally on a recognized stock exchange or over-the-counter market outside of the U.S.
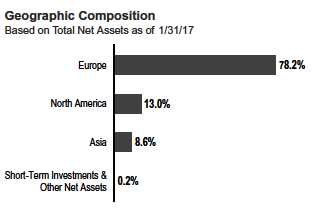
Performance Overview
For the six months ended January 31, 2017, The Fund’s Class A shares delivered a +6.14% cumulative total return. In comparison, the Fund’s new benchmark, the MSCI Europe, Australasia, Far East (EAFE) Small Cap (Net Dividends) Index, returned +2.96%, while the Fund’s old benchmark, the MSCI EAFE Small Cap (Gross Dividends) Index, returned +3.05%.1 The MSCI EAFE Small Cap Index tracks small cap equity performance in global developed markets excluding the U.S. and Canada. The investment manager believes the Net Dividends Index is more in line with the Fund, taking into
account the impact of foreign withholding taxes. You can find the Fund’s long-term performance data in the Performance Summary beginning on page 15.
Performance data represent past performance, which does not guarantee future results. Investment return and principal value will fluctuate, and you may have a gain or loss when you sell your shares. Current performance may differ from figures shown. For most recent month-end performance, go to franklintempleton.com or call (800) 342-5236.
Investment Strategy
In choosing individual equity investments, we use a fundamental, bottom-up approach involving in-depth analysis of individual equity securities. We employ a quantitative and qualitative approach to identify smaller international companies that we believe have the potential to generate attractive returns with lower downside risk. Such companies tend to have proprietary products and services, which can sustain a longer term competitive advantage, and they tend to have a higher probability of maintaining a strong balance sheet and/or generating cash flow. After we identify a company, we conduct a thorough analysis to establish its earnings prospects and determine its value. Overall, we seek to invest in companies with attractive valuations.
We do not select investments for the Fund that are merely representative of the small cap asset class but instead aim to produce a portfolio of securities of exceptional companies operating in sectors that offer attractive growth potential.
Although we seek to outperform the MSCI EAFE Small Cap (Net Dividends) Index, the Fund may take positions that are not represented in the index.
Manager’s Discussion
During the six months ended January 31, 2017, stock selection and sector allocations in general contributed to the Fund’s performance relative to its benchmark, the MSCI EAFE Small Cap (Net Dividends) Index. In particular, stock selection and overweightings in the financials and industrials sectors, as well as stock selection in consumer discretionary and consumer staples, boosted relative results, as a number of U.K. holdings recovered from a sharp sell-off following the U.K.’s historic
1. Source: MorningStar.
The index is unmanaged and includes reinvestment of any income or distributions. It does not reflect any fees, expenses or sales charges. One cannot invest directly in an
index, and an index is not representative of the Fund’s portfolio.
The dollar value, number of shares or principal amount, and names of all portfolio holdings are listed in the Fund’s Statement of Investments (SOI).
The SOI begins on page 30.
franklintempleton.com
Semiannual Report 11
FRANKLIN INTERNATIONAL SMALL CAP GROWTH FUND
referendum to leave the European Union (also known as “Brexit”).2
A broad range of individual industrials stocks contributed to relative performance as sentiment toward the sector turned more favorable and earnings remained relatively solid despite recent economic uncertainties. Diana Shipping, a dry-bulk shipper based in Greece, contributed to relative performance as the broader sector benefited from investor optimism that potential infrastructure spending in the U.S. under President Trump’s administration would result in increased demand for commodities, such as iron ore.3 Shares of Vesuvius, a U.K.-based global engineered ceramics company, benefited from optimism about growth in China and the potential for greater steel production. Additionally, a number of U.K.-based industrials stocks recovered following the Brexit referendum. Key contributors included global staffing firm PageGroup, shipping broker Clarkson3 and construction company Morgan Sindall Group.3 Clarkson further benefited from optimism about a recovery in global growth.
In the financials sector, notable contributors included ARA Asset Management, a Singapore-based real estate investment manager, following the announcement by company management to take the firm private to focus on expanding the business. Reinsurers Arch Capital Group and RenaissanceRe Holdings aided relative performance as fundamentals for the broader industry remained largely solid despite recent natural disasters.3
Within consumer discretionary, Beneteau, a France-based recreational boat and leisure home manufacturer, reported better-than-anticipated earnings. Furthermore, company management indicated that it expected positive trends in upcoming U.S. and European boat shows.
In contrast, key detractors from the Fund’s relative performance included stock selection in the energy sector. An underweighting in materials and an overweighting in real estate also weighed on relative results.4
In the energy sector, shares of Amec Foster Wheeler, a U.K.-based consultancy, engineering and project management
| | |
| Top 10 Sectors/Industries | | |
| 1/31/17 | | |
| | % of Total | |
| | Net Assets | |
| Insurance | 11.2 | % |
| Real Estate Investment Trusts (REITs) | 10.6 | % |
| Commercial Services & Supplies | 8.4 | % |
| Marine | 7.2 | % |
| Capital Markets | 6.9 | % |
| Machinery | 6.0 | % |
| Professional Services | 5.5 | % |
| Trading Companies & Distributors | 4.6 | % |
| Diversified Financial Services | 4.4 | % |
| Food & Staples Retailing | 4.0 | % |
firm, declined after the company postponed a capital markets day at which it was expected to outline turnaround plans. Despite the disappointing news, Amec Foster Wheeler continued to generate strong free cash flow and, in our longer term view, it could benefit from efforts to overhaul the business.
Within real estate, shares of Irish real estate investment trust Green REIT declined despite ongoing improvements in the Irish economy and real estate market, where property values and rental income increased. U.K. real estate broker Countrywide also dampened performance, as housing transactions remained soft in recent quarters, with Brexit-related anxieties and increased online competition compounding the challenges for the company. We expect that once economic uncertainty lessens, housing transactions could continue to trend higher.
Other key detractors included U.K.-based property and real estate loan investor Kennedy Wilson Europe Real Estate, whose shares declined despite improvements in the U.K. economy and real estate markets.3 Carpetright, a U.K.-based carpet retailer, weakened due to investor concerns about a sluggish housing market and increased competition.3 However, recent sales figures indicated to us that its business remains resilient and could continue to improve as housing transactions recover and consumer confidence improves.
2. The financials sector comprises capital markets, diversified financial services and insurance in the SOI. The industrials sector comprises air freight and logistics, building
products, commercial services and supplies, construction and engineering, machinery, marine, professional services, and trading companies and distributors in the SOI. The
consumer discretionary sector comprises distributors; hotels, restaurants and leisure; leisure products; media; and specialty retail in the SOI. The consumer staples sector
comprises beverages, food and staples retailing, and tobacco in the SOI.
3. Not part of the index.
4. The energy sector comprises energy equipment and services in the SOI. The materials sector comprises metals and mining in the SOI. The real estate sector comprises real
estate investment trusts and real estate management and development in the SOI.
See www.franklintempletondatasources.com for additional data provider information.
12 Semiannual Report
franklintempleton.com
FRANKLIN INTERNATIONAL SMALL CAP GROWTH FUND
| | |
| Top 10 Holdings | | |
| 1/31/17 | | |
| Company | % of Total | |
| Sector/Industry, Country | Net Assets | |
| Grafton Group PLC | 4.6 | % |
| Trading Companies & Distributors, U.K. | | |
| Clarkson PLC | 4.5 | % |
| Marine, U.K. | | |
| Elis SA | 4.5 | % |
| Commercial Services & Supplies, France | | |
| Kennedy Wilson Europe Real Estate PLC | 4.4 | % |
| Diversified Financial Services, U.K. | | |
| PageGroup PLC | 4.2 | % |
| Professional Services, U.K. | | |
| Lar Espana Real Estate Socimi SA | 4.0 | % |
| Real Estate Investment Trusts (REITs), Spain | | |
| Vesuvius PLC | 3.8 | % |
| Machinery, U.K. | | |
| Green REIT PLC | 3.7 | % |
| Real Estate Investment Trusts (REITs), Ireland | | |
| Fairfax India Holdings Corp. | 3.5 | % |
| Capital Markets, Canada | | |
| Amec Foster Wheeler PLC | 3.4 | % |
| Energy Equipment & Services, U.K. | | |
Shares of Canada-based insurer Fairfax Financial Holdings fell despite the company’s improved revenue and profitability.3 Fairfax’s continued move into specialty insurance has allowed the firm to improve its overall revenue despite weak pricing in a number of insurance lines, most notably reinsurance. The performance of the insurer’s investment portfolio has also performed well.
A number of European industrials holdings also hampered performance, including Swiss logistics company Panalpina Welttransport Holding, Spanish elevator and escalator manufacturer Zardoya Otis,3 Finnish plastic pipe maker Uponor and Danish facilities outsourcing company ISS.3 Panalpina benefited from increased volumes in its air business and from its ongoing efforts to improve efficiencies. Despite Zardoya Otis’s recent share price decline, we have begun to see signs of improvement in its business as the Spanish economy rebounded. Uponor, meanwhile, continued to benefit from a recovery in the U.S. and European construction markets. With manufacturing plants across Europe and the U.S., Uponor maintained a market-leading position in the higher margin above-ground pipe business. Shares of ISS declined due to what we viewed as an overreaction to the company’s reduced financial guidance for full-year 2016. The company was negatively affected by weak fourth-quarter growth in Australia and Brazil, but the company indicated it had solid organic growth in 2016’s first three quarters.
It is important to recognize the effect of currency movements on the Fund’s performance. In general, if the value of the U.S. dollar goes up compared with a foreign currency, an investment traded in that foreign currency will go down in value because it will be worth fewer U.S. dollars. This can have a negative effect on Fund performance. Conversely, when the U.S. dollar weakens in relation to a foreign currency, an investment traded in that foreign currency will increase in value, which can contribute to Fund performance. For the six months ended January 31, 2017, the U.S. dollar rose in value relative to most currencies. As a result, the Fund’s performance was negatively affected by the portfolio’s investment predominantly in securities with non-U.S. currency exposure.
Top 10 Countries
1/31/17
| | |
| | % of Total | |
| | Net Assets | |
| U.K. | 35.0 | % |
| Ireland | 14.4 | % |
| France | 9.0 | % |
| Canada | 6.8 | % |
| U.S. | 6.2 | % |
| Spain | 6.2 | % |
| Singapore | 5.4 | % |
| Denmark | 4.4 | % |
| Switzerland | 3.2 | % |
| Greece | 2.7 | % |
From a geographic perspective, exposure to North America, notably in the U.S., contributed to relative performance. Stock selection in Japan also contributed, but an underweighting detracted. In Asia Pacific ex-Japan, stock selection and an underweighting enhanced relative returns, led by our investments in Singapore. Stock selection in the U.K. aided relative returns, although the benefit was partially offset by an overweighting. In contrast, stock selection in Europe, particularly in Switzerland, Ireland and Denmark, hampered relative results.
franklintempleton.com
Semiannual Report 13
FRANKLIN INTERNATIONAL SMALL CAP GROWTH FUND
Thank you for your continued participation in Franklin International Small Cap Growth Fund. We look forward to serving your future investment needs.

The foregoing information reflects our analysis, opinions and portfolio holdings as of January 31, 2017, the end of the reporting period. The way we implement our main investment strategies and the resulting portfolio holdings may change depending on factors such as market and economic conditions. These opinions may not be relied upon as investment advice or an offer for a particular security. The information is not a complete analysis of every aspect of any market, country, industry, security or the Fund. Statements of fact are from sources considered reliable, but the investment manager makes no representation or warranty as to their completeness or accuracy. Although historical performance is no guarantee of future results, these insights may help you understand our investment management philosophy.
14 Semiannual Report
franklintempleton.com
FRANKLIN INTERNATIONAL SMALL CAP GROWTH FUND
Performance Summary as of January 31, 2017
The performance table does not reflect any taxes that a shareholder would pay on Fund dividends, capital gain distributions, if any, or any realized gains on the sale of Fund shares. Total return reflects reinvestment of the Fund’s dividends and capital gain distributions, if any, and any unrealized gains or losses.
Performance as of 1/31/17
Cumulative total return excludes sales charges. Average annual total return includes maximum sales charges. Sales charges will vary depending on the size of the investment and the class of share purchased. The maximum is 5.75% and the minimum is 0%. Class A: 5.75% maximum initial sales charge; Advisor Class: no sales charges. For other share classes, visit franklintempleton.com.
| | | | |
| | Cumulative | | Average Annual | |
| Share Class | Total Return1 | | Total Return2 | |
| A | | | | |
| 6-Month | +6.14 | % | +0.04 | % |
| 1-Year | +7.12 | % | +0.96 | % |
| 5-Year | +60.98 | % | +8.69 | % |
| Since Inception (5/15/08) | +66.91 | % | +5.34 | % |
| Advisor | | | | |
| 6-Month | +6.33 | % | +6.33 | % |
| 1-Year | +7.37 | % | +7.37 | % |
| 5-Year | +63.15 | % | +10.29 | % |
| 10-Year | +80.15 | % | +6.06 | % |
Performance data represent past performance, which does not guarantee future results. Investment return and principal value will fluctuate, and you may have a gain or loss when you sell your shares. Current performance may differ from figures shown. For most recent month-end performance, go to franklintempleton.com or call (800) 342-5236.
See page 16 for Performance Summary footnotes.
franklintempleton.com
Semiannual Report 15
FRANKLIN INTERNATIONAL SMALL CAP GROWTH FUND
PERFORMANCE SUMMARY
| | |
| Total Annual Operating Expenses3 | | |
| Share Class | | |
| A | 1.38 | % |
| Advisor | 1.14 | % |
Each class of shares is available to certain eligible investors and has different annual fees and expenses, as described in the prospectus.
All investments involve risks, including possible loss of principal. The Fund is intended for long-term investors who are comfortable with fluctuation inthevalue
of their investment, especially over the short term. Smaller, relatively new and/or unseasoned companies can be particularly sensitive to changing economic
conditions, and their prospects for growth are less certain than those of larger, more established companies. Foreign investing involves additional risks such as
currency and market volatility, as well as political and social instability. Investments in emerging markets involve heightened risks relating to the same factors. The
Fund is actively managed but there is no guarantee that the manager’s investment decisions will produce the desired results. The Fund’s prospectus also
includes a description of the main investment risks.
1. Cumulative total return represents the change in value of an investment over the periods indicated.
2. Average annual total return represents the average annual change in value of an investment over the periods indicated. Return for less than one year, ifany,hasnotbeen
annualized.
3. Figures are as stated in the Fund’s current prospectus and may differ from the expense ratios disclosed in the Your Fund’s Expenses and Financial Highlights sections in this
report. In periods of market volatility, assets may decline significantly, causing total annual Fund operating expenses to become higher than the figures shown.
16 Semiannual Report
franklintempleton.com
FRANKLIN INTERNATIONAL SMALL CAP GROWTH FUND
Your Fund’s Expenses
As a Fund shareholder, you can incur two types of costs: (1) transaction costs, including sales charges (loads) on Fund purchases and redemptions; and (2) ongoing Fund costs, including management fees, distribution and service (12b-1) fees, and other Fund expenses. All mutual funds have ongoing costs, sometimes referred to as operating expenses. The table below shows ongoing costs of investing in the Fund and can help you understand these costs and compare them with those of other mutual funds. The table assumes a $1,000 investment held for the six months indicated.
Actual Fund Expenses
The table below provides information about actual account values and actual expenses in the columns under the heading “Actual.” In these columns the Fund’s actual return, which includes the effect of Fund expenses, is used to calculate the “Ending Account Value” for each class of shares. You can estimate the expenses you paid during the period by following these steps (of course, your account value and expenses will differ from those in this illustration): Divide your account value by $1,000 (if your account had an $8,600 value, then $8,600 ÷ $1,000 = 8.6). Then multiply the result by the number in the row for your class of shares under the headings “Actual” and “Expenses Paid During Period” (if Actual Expenses Paid During Period were $7.50, then 8.6 x $7.50 = $64.50). In this illustration, the actual expenses paid this period are $64.50.
Hypothetical Example for Comparison with Other Funds
Under the heading “Hypothetical” in the table, information is provided about hypothetical account values and hypothetical expenses based on the Fund’s actual expense ratio and an assumed rate of return of 5% per year before expenses, which is not the Fund’s actual return. This information may not be used to estimate the actual ending account balance or expenses you paid for the period, but it can help you compare ongoing costs of investing in the Fund with those of other funds. To do so, compare this 5% hypothetical example for the class of shares you hold with the 5% hypothetical examples that appear in the shareholder reports of other funds.
Please note that expenses shown in the table are meant to highlight ongoing costs and do not reflect any transactional costs. Therefore, information under the heading “Hypothetical” is useful in comparing ongoing costs only, and will not help you compare total costs of owning different funds. In addition, if transactional costs were included, your total costs would have been higher.
| | | | | | | | | | | | | | |
| | | | | | | Actual | | | Hypothetical | | | |
| | | | | (actual return after expenses) | | (5% annual return before expenses) | | |
| | | | | | | Expenses | | | | Expenses | | |
| | | Beginning | | Ending | | Paid During | | Ending | | Paid During | Annualized | |
| Share | | Account | | Account | | Period | | Account | | Period | Expense | |
| Class | | Value 8/1/16 | | Value 1/31/17 | | 8/1/16–1/31/171 | | Value 1/31/17 | | 8/1/16–1/31/171 | Ratio | |
| A | $ | 1,000 | $ | 1,061.40 | | $ | 7.38 | $ | 1,018.05 | | $ | 7.22 | 1.42 | % |
| C | $ | 1,000 | $ | 1,057.40 | $ | 11.25 | $ | 1,014.27 | $ | 11.02 | 2.17 | % |
| R | $ | 1,000 | $ | 1,060.60 | | $ | 8.73 | $ | 1,016.74 | | $ | 8.54 | 1.68 | % |
| R6 | $ | 1,000 | $ | 1,064.30 | | $ | 5.20 | $ | 1,020.16 | | $ | 5.09 | 1.00 | % |
| Advisor | $ | 1,000 | $ | 1,063.30 | | $ | 6.14 | $ | 1,019.26 | | $ | 6.01 | 1.18 | % |
1. Expenses are equal to the annualized expense ratio for the six-month period as indicated above–in the far right column–multiplied by the simple average account value
over the period indicated, and then multiplied by 184/365 to reflect the one-half year period.
franklintempleton.com
Semiannual Report 17
FRANKLIN GLOBAL TRUST
| | | | | | | | | | | | | | | | | | |
| Financial Highlights | | | | | | | | | | | | | | | | | | |
| Franklin International Growth Fund | | | | | | | | | | | | | | | | | | |
| | | Six Months Ended | | | | | | | | | | | | | | | | |
| | | January 31, 2017 | | | | | | Year Ended July 31, | | | | | | | |
| | | (unaudited) | | | 2016 | | | 2015 | | | 2014 | | | 2013 | | | 2012 | |
| Class A | | | | | | | | | | | | | | | | | | |
| Per share operating performance | | | | | | | | | | | | | | | | | | |
| (for a share outstanding throughout the period) | | | | | | | | | | | | | | | | | | |
| Net asset value, beginning of period | $ | 11.07 | | $ | 11.16 | | $ | 11.40 | | $ | 10.45 | | $ | 9.11 | | $ | 9.86 | |
| Income from investment operationsa: | | | | | | | | | | | | | | | | | | |
| Net investment income (loss)b | | (0.01 | ) | | 0.03 | | | 0.06 | | | 0.05 | | | 0.10 | | | 0.12 | |
| Net realized and unrealized gains (losses) | | 0.11 | | | (0.12 | ) | | (0.20 | ) | | 0.95 | | | 1.33 | | | (0.77 | ) |
| Total from investment operations | | 0.10 | | | (0.09 | ) | | (0.14 | ) | | 1.00 | | | 1.43 | | | (0.65 | ) |
| Less distributions from: | | | | | | | | | | | | | | | | | | |
| Net investment income. | | (0.06 | ) | | (—)c | | | (0.03 | ) | | (0.05 | ) | | (0.09 | ) | | (0.10 | ) |
| Net realized gains | | — | | | — | | | (0.07 | ) | | — | | | — | | | — | |
| Total distributions | | (0.06 | ) | | (—)c | | | (0.10 | ) | | (0.05 | ) | | (0.09 | ) | | (0.10 | ) |
| Net asset value, end of period | $ | 11.11 | | $ | 11.07 | | $ | 11.16 | | $ | 11.40 | | $ | 10.45 | | $ | 9.11 | |
| |
| Total returnd | | 0.90 | % | | (0.80 | )% | | (1.13 | )% | | 9.56 | % | | 15.69 | % | | (6.46 | )% |
| |
| Ratios to average net assetse | | | | | | | | | | | | | | | | | | |
| Expenses before waiver and payments by | | | | | | | | | | | | | | | | | | |
| affiliates | | 1.60 | % | | 1.65 | % | | 1.72 | % | | 1.70 | % | | 1.52 | % | | 1.69 | % |
| Expenses net of waiver and payments by | | | | | | | | | | | | | | | | | | |
| affiliates | | 1.39 | %f | | 1.44 | %f | | 1.49 | % | | 1.49 | %f | | 1.49 | % | | 1.52 | % |
| Net investment income (loss) | | (0.21 | )% | | 0.25 | % | | 0.61 | % | | 0.48 | % | | 1.07 | % | | 1.46 | % |
| |
| Supplemental data | | | | | | | | | | | | | | | | | | |
| Net assets, end of period (000’s) | $ | 167,580 | | $ | 169,994 | | $ | 182,825 | | $ | 179,862 | | $ | 34,466 | | $ | 17,966 | |
| Portfolio turnover rate | | 17.66 | % | | 27.27 | % | | 47.52 | % | | 29.63 | % | | 26.06 | % | | 28.80 | % |
aThe amount shown for a share outstanding throughout the period may not correlate with the Statement of Operations for the period due to the timing of sales and
repurchases of the Fund’s shares in relation to income earned and/or fluctuating fair value of the investments of the Fund.
bBased on average daily shares outstanding.
cAmount rounds to less than $0.01 per share.
dTotal return does not reflect sales commissions or contingent deferred sales charges, if applicable, and is not annualized for periods less than one year.
eRatios are annualized for periods less than one year.
fBenefit of expense reduction rounds to less than 0.01%.
18 Semiannual Report | The accompanying notes are an integral part of these financial statements. franklintempleton.com
| | | | | | | | | | | | | | | | | | |
| | | | | | | | | | | | FRANKLIN GLOBAL TRUST | |
| | | | | | | | | | | | FINANCIAL HIGHLIGHTS | |
| |
| |
| Franklin International Growth Fund (continued) | | | | | | | | | | | | | | | | |
| | | Six Months Ended | | | | | | | | | | | | | | | | |
| | | January 31, 2017 | | | | | | Year Ended July 31, | | | | | | | |
| | | (unaudited) | | | 2016 | | | 2015 | | | 2014 | | | 2013 | | | 2012 | |
| Class C | | | | | | | | | | | | | | | | | | |
| Per share operating performance | | | | | | | | | | | | | | | | | | |
| (for a share outstanding throughout the period) | | | | | | | | | | | | | | | | | | |
| Net asset value, beginning of period | $ | 10.77 | | $ | 10.94 | | $ | 11.22 | | $ | 10.31 | | $ | 9.00 | | $ | 9.73 | |
| Income from investment operationsa: | | | | | | | | | | | | | | | | | | |
| Net investment income (loss)b | | (0.05 | ) | | (0.05 | ) | | (0.01 | ) | | (0.02 | ) | | 0.02 | | | 0.05 | |
| Net realized and unrealized gains (losses) | | 0.11 | | | (0.12 | ) | | (0.20 | ) | | 0.93 | | | 1.32 | | | (0.74 | ) |
| Total from investment operations | | 0.06 | | | (0.17 | ) | | (0.21 | ) | | 0.91 | | | 1.34 | | | (0.69 | ) |
| Less distributions from: | | | | | | | | | | | | | | | | | | |
| Net investment income. | | — | | | — | | | — | | | — | | | (0.03 | ) | | (0.04 | ) |
| Net realized gains | | — | | | — | | | (0.07 | ) | | — | | | — | | | — | |
| Total distributions | | — | | | — | | | (0.07 | ) | | — | | | (0.03 | ) | | (0.04 | ) |
| Net asset value, end of period | $ | 10.83 | | $ | 10.77 | | $ | 10.94 | | $ | 11.22 | | $ | 10.31 | | $ | 9.00 | |
| |
| Total returnc | | 0.56 | % | | (1.55 | )% | | (1.84 | )% | | 8.83 | % | | 14.88 | % | | (7.08 | )% |
| |
| Ratios to average net assetsd | | | | | | | | | | | | | | | | | | |
| Expenses before waiver and payments by | | | | | | | | | | | | | | | | | | |
| affiliates | | 2.35 | % | | 2.40 | % | | 2.42 | % | | 2.40 | % | | 2.22 | % | | 2.35 | % |
| Expenses net of waiver and payments by | | | | | | | | | | | | | | | | | | |
| affiliates | | 2.14 | %e | | 2.19 | %e | | 2.19 | % | | 2.19 | %e | | 2.19 | % | | 2.18 | % |
| Net investment income (loss) | | (0.96 | )% | | (0.50 | )% | | (0.09 | )% | | (0.22 | )% | | 0.37 | % | | 0.80 | % |
| |
| Supplemental data | | | | | | | | | | | | | | | | | | |
| Net assets, end of period (000’s) | $ | 6,439 | | $ | 6,773 | | $ | 7,179 | | $ | 5,977 | | $ | 4,032 | | $ | 2,545 | |
| Portfolio turnover rate | | 17.66 | % | | 27.27 | % | | 47.52 | % | | 29.63 | % | | 26.06 | % | | 28.80 | % |
aThe amount shown for a share outstanding throughout the period may not correlate with the Statement of Operations for the period due to the timing of sales and
repurchases of the Fund’s shares in relation to income earned and/or fluctuating fair value of the investments of the Fund.
bBased on average daily shares outstanding.
cTotal return does not reflect sales commissions or contingent deferred sales charges, if applicable, and is not annualized for periods less than one year.
dRatios are annualized for periods less than one year.
eBenefit of expense reduction rounds to less than 0.01%.
franklintempleton.com The accompanying notes are an integral part of these financial statements. | Semiannual Report 19
| | | | | | | | | | | | | | | | | | |
| FRANKLIN GLOBAL TRUST | | | | | | | | | | | | | | | | | | |
| FINANCIAL HIGHLIGHTS | | | | | | | | | | | | | | | | | | |
| |
| |
| Franklin International Growth Fund (continued) | | | | | | | | | | | | | | | | |
| | | Six Months Ended | | | | | | | | | | | | | | | | |
| | | January 31, 2017 | | | | | | Year Ended July 31, | | | | | | | |
| | | (unaudited) | | | 2016 | | | 2015 | | | 2014 | | | 2013 | | | 2012 | |
| Class R | | | | | | | | | | | | | | | | | | |
| Per share operating performance | | | | | | | | | | | | | | | | | | |
| (for a share outstanding throughout the period) | | | | | | | | | | | | | | | | | | |
| Net asset value, beginning of period | $ | 11.02 | | $ | 11.15 | | $ | 11.38 | | $ | 10.41 | | $ | 9.08 | | $ | 9.83 | |
| Income from investment operationsa: | | | | | | | | | | | | | | | | | | |
| Net investment income (loss)b | | (0.03 | ) | | (—)c | | | 0.04 | | | 0.03 | | | 0.07 | | | 0.14 | |
| Net realized and unrealized gains (losses) | | 0.12 | | | (0.12 | ) | | (0.19 | ) | | 0.95 | | | 1.33 | | | (0.81 | ) |
| Total from investment operations | | 0.09 | | | (0.12 | ) | | (0.15 | ) | | 0.98 | | | 1.40 | | | (0.67 | ) |
| Less distributions from: | | | | | | | | | | | | | | | | | | |
| Net investment income. | | (0.01 | ) | | (0.01 | ) | | (0.01 | ) | | (0.01 | ) | | (0.07 | ) | | (0.08 | ) |
| Net realized gains | | — | | | — | | | (0.07 | ) | | — | | | — | | | — | |
| Total distributions | | (0.01 | ) | | (0.01 | ) | | (0.08 | ) | | (0.01 | ) | | (0.07 | ) | | (0.08 | ) |
| Net asset value, end of period | $ | 11.10 | | $ | 11.02 | | $ | 11.15 | | $ | 11.38 | | $ | 10.41 | | $ | 9.08 | |
| |
| Total returnd | | 0.83 | % | | (1.10 | )% | | (1.31 | )% | | 9.44 | % | | 15.47 | % | | (6.79 | )% |
| |
| Ratios to average net assetse | | | | | | | | | | | | | | | | | | |
| Expenses before waiver and payments by | | | | | | | | | | | | | | | | | | |
| affiliates | | 1.82 | % | | 1.90 | % | | 1.92 | % | | 1.90 | % | | 1.72 | % | | 1.85 | % |
| Expenses net of waiver and payments by | | | | | | | | | | | | | | | | | | |
| affiliates | | 1.61 | %f | | 1.69 | %f | | 1.69 | % | | 1.69 | %f | | 1.69 | % | | 1.68 | % |
| Net investment income (loss) | | (0.43 | )% | | (—)%g | | | 0.41 | % | | 0.28 | % | | 0.87 | % | | 1.30 | % |
| |
| Supplemental data | | | | | | | | | | | | | | | | | | |
| Net assets, end of period (000’s) | $ | 304 | | $ | 295 | | $ | 363 | | $ | 222 | | $ | 274 | | $ | 150 | |
| Portfolio turnover rate | | 17.66 | % | | 27.27 | % | | 47.52 | % | | 29.63 | % | | 26.06 | % | | 28.80 | % |
aThe amount shown for a share outstanding throughout the period may not correlate with the Statement of Operations for the period due to the timing of sales and
repurchases of the Fund’s shares in relation to income earned and/or fluctuating fair value of the investments of the Fund.
bBased on average daily shares outstanding.
cAmount rounds to less than $0.01 per share.
dTotal return is not annualized for periods less than one year.
eRatios are annualized for periods less than one year.
fBenefit of expense reduction rounds to less than 0.01%.
gRounds to less than 0.01%.
20 Semiannual Report | The accompanying notes are an integral part of these financial statements. franklintempleton.com
| | | | | | | | | | | | | | | |
| | | | | | | | | FRANKLIN GLOBAL TRUST | |
| | | | | | | | | FINANCIAL HIGHLIGHTS | |
| |
| |
| Franklin International Growth Fund (continued) | | | | | | | | | | | | | | | |
| | | Six Months Ended | | | | | | | | | | | | | |
| | | January 31, 2017 | | | | | | Year Ended July 31, | | | | |
| | | (unaudited) | | | 2016 | | | 2015 | | | 2014 | | | 2013 | a |
| Class R6 | | | | | | | | | | | | | | | |
| Per share operating performance | | | | | | | | | | | | | | | |
| (for a share outstanding throughout the period) | | | | | | | | | | | | | | | |
| Net asset value, beginning of period | $ | 11.15 | | $ | 11.25 | | $ | 11.48 | | $ | 10.48 | | $ | 10.56 | |
| Income from investment operationsb: | | | | | | | | | | | | | | | |
| Net investment incomec | | 0.02 | | | 0.07 | | | 0.15 | | | 0.11 | | | 0.07 | |
| Net realized and unrealized gains (losses) | | 0.11 | | | (0.12 | ) | | (0.23 | ) | | 0.94 | | | (0.15 | ) |
| Total from investment operations. | | 0.13 | | | (0.05 | ) | | (0.08 | ) | | 1.05 | | | (0.08 | ) |
| Less distributions from: | | | | | | | | | | | | | | | |
| Net investment income | | (0.13 | ) | | (0.05 | ) | | (0.08 | ) | | (0.05 | ) | | — | |
| Net realized gains | | — | | | — | | | (0.07 | ) | | — | | | — | |
| Total distributions | | (0.13 | ) | | (0.05 | ) | | (0.15 | ) | | (0.05 | ) | | — | |
| Net asset value, end of period. | $ | 11.15 | | $ | 11.15 | | $ | 11.25 | | $ | 11.48 | | $ | 10.48 | |
| |
| Total returnd | | 1.20 | % | | (0.39 | )% | | (0.62 | )% | | 10.05 | % | | (0.76 | )% |
| |
| Ratios to average net assetse | | | | | | | | | | | | | | | |
| Expenses before waiver and payments by affiliates | | 0.96 | % | | 1.01 | % | | 1.02 | % | | 1.02 | % | | 1.13 | % |
| Expenses net of waiver and payments by affiliates | | 0.95 | %f | | 1.00 | %f | | 1.02 | %g | | 1.02 | %f,g | | 1.10 | % |
| Net investment income. | | 0.23 | % | | 0.69 | % | | 1.08 | % | | 0.95 | % | | 1.45 | % |
| |
| Supplemental data | | | | | | | | | | | | | | | |
| Net assets, end of period (000’s) | $ | 46,501 | | $ | 122,862 | | $ | 137,950 | | $ | 29,132 | | $ | 22,296 | |
| Portfolio turnover rate | | 17.66 | % | | 27.27 | % | | 47.52 | % | | 29.63 | % | | 26.06 | % |
aFor the period May 1, 2013 (effective date) to July 31, 2013.
bThe amount shown for a share outstanding throughout the period may not correlate with the Statement of Operations for the period due to the timing of sales and
repurchases of the Fund’s shares in relation to income earned and/or fluctuating fair value of the investments of the Fund.
cBased on average daily shares outstanding.
dTotal return is not annualized for periods less than one year.
eRatios are annualized for periods less than one year.
fBenefit of expense reduction rounds to less than 0.01%.
gBenefit of waiver and payments by affiliates rounds to less than 0.01%.
franklintempleton.com The accompanying notes are an integral part of these financial statements. | Semiannual Report 21
| | | | | | | | | | | | | | | | | | |
| FRANKLIN GLOBAL TRUST | | | | | | | | | | | | | | | | | | |
| FINANCIAL HIGHLIGHTS | | | | | | | | | | | | | | | | | | |
| |
| |
| Franklin International Growth Fund (continued) | | | | | | | | | | | | | | | | |
| | | Six Months Ended | | | | | | | | | | | | | | | | |
| | | January 31, 2017 | | | | | | Year Ended July 31, | | | | | | | |
| | | (unaudited) | | | 2016 | | | 2015 | | | 2014 | | | 2013 | | | 2012 | |
| Advisor Class | | | | | | | | | | | | | | | | | | |
| Per share operating performance | | | | | | | | | | | | | | | | | | |
| (for a share outstanding throughout the period) | | | | | | | | | | | | | | | | | | |
| Net asset value, beginning of period | $ | 11.13 | | $ | 11.24 | | $ | 11.47 | | $ | 10.48 | | $ | 9.13 | | $ | 9.89 | |
| Income from investment operationsa: | | | | | | | | | | | | | | | | | | |
| Net investment incomeb | | —c | | | 0.05 | | | 0.10 | | | 0.09 | | | 0.13 | | | 0.17 | |
| Net realized and unrealized gains (losses) | | 0.12 | | | (0.12 | ) | | (0.20 | ) | | 0.95 | | | 1.33 | | | (0.80 | ) |
| Total from investment operations | | 0.12 | | | (0.07 | ) | | (0.10 | ) | | 1.04 | | | 1.46 | | | (0.63 | ) |
| Less distributions from: | | | | | | | | | | | | | | | | | | |
| Net investment income. | | (0.10 | ) | | (0.04 | ) | | (0.06 | ) | | (0.05 | ) | | (0.11 | ) | | (0.13 | ) |
| Net realized gains | | — | | | — | | | (0.07 | ) | | — | | | — | | | — | |
| Total distributions | | (0.10 | ) | | (0.04 | ) | | (0.13 | ) | | (0.05 | ) | | (0.11 | ) | | (0.13 | ) |
| Net asset value, end of period | $ | 11.15 | | $ | 11.13 | | $ | 11.24 | | $ | 11.47 | | $ | 10.48 | | $ | 9.13 | |
| |
| Total returnd | | 1.09 | % | | (0.62 | )% | | (0.76 | )% | | 9.91 | % | | 16.04 | % | | (6.19 | )% |
| |
| Ratios to average net assetse | | | | | | | | | | | | | | | | | | |
| Expenses before waiver and payments by | | | | | | | | | | | | | | | | | | |
| affiliates | | 1.35 | % | | 1.40 | % | | 1.42 | % | | 1.40 | % | | 1.22 | % | | 1.35 | % |
| Expenses net of waiver and payments by | | | | | | | | | | | | | | | | | | |
| affiliates | | 1.14 | %f | | 1.19 | %f | | 1.19 | % | | 1.19 | %f | | 1.19 | % | | 1.18 | % |
| Net investment income | | 0.04 | % | | 0.50 | % | | 0.91 | % | | 0.78 | % | | 1.37 | % | | 1.80 | % |
| |
| Supplemental data | | | | | | | | | | | | | | | | | | |
| Net assets, end of period (000’s) | $ | 105,955 | | $ | 110,441 | | $ | 126,130 | | $ | 97,134 | | $ | 74,240 | | $ | 48,549 | |
| Portfolio turnover rate | | 17.66 | % | | 27.27 | % | | 47.52 | % | | 29.63 | % | | 26.06 | % | | 28.80 | % |
aThe amount shown for a share outstanding throughout the period may not correlate with the Statement of Operations for the period due to the timing of sales and
repurchases of the Fund’s shares in relation to income earned and/or fluctuating fair value of the investments of the Fund.
bBased on average daily shares outstanding.
cAmount rounds to less than $0.01 per share.
dTotal return is not annualized for periods less than one year.
eRatios are annualized for periods less than one year.
fBenefit of expense reduction rounds to less than 0.01%.
22 Semiannual Report | The accompanying notes are an integral part of these financial statements. franklintempleton.com
FRANKLIN GLOBAL TRUST
| | | | |
| Statement of Investments, January 31, 2017 (unaudited) | | | | |
| Franklin International Growth Fund | | | | |
| | Country | Shares | | Value |
| |
| Common Stocks 97.4% | | | | |
| Aerospace & Defense 2.7% | | | | |
| MTU Aero Engines AG. | Germany | 75,000 | $ | 8,953,623 |
| Auto Components 3.4% | | | | |
| Delphi Automotive PLC | United Kingdom | 156,000 | | 10,929,360 |
| Banks 3.2% | | | | |
| a,b Irish Bank Resolution Corp. Ltd | Ireland | 11,500 | | — |
| KBC Groep NV | Belgium | 160,000 | | 10,365,694 |
| | | | | 10,365,694 |
| Biotechnology 4.9% | | | | |
| a Alkermes PLC | United States | 164,000 | | 8,874,040 |
| CSL Ltd | Australia | 82,000 | | 6,982,881 |
| | | | | 15,856,921 |
| Capital Markets 8.1% | | | | |
| Azimut Holding SpA. | Italy | 590,000 | | 10,571,644 |
| CI Financial Corp | Canada | 420,000 | | 8,774,194 |
| a Deutsche Boerse AG | Germany | 78,000 | | 7,176,628 |
| | | | | 26,522,466 |
| Chemicals 7.9% | | | | |
| Koninklijke DSM NV. | Netherlands | 132,000 | | 8,406,367 |
| Symrise AG | Germany | 139,000 | | 8,349,537 |
| Umicore SA | Belgium | 160,000 | | 8,946,068 |
| | | | | 25,701,972 |
| Diversified Consumer Services 2.2% | | | | |
| a TAL Education Group, ADR | China | 90,000 | | 7,289,100 |
| Energy Equipment & Services 2.4% | | | | |
| Amec Foster Wheeler PLC | United Kingdom | 1,400,000 | | 7,781,196 |
| Health Care Equipment & Supplies 5.4% | | | | |
| Cochlear Ltd | Australia | 86,000 | | 8,162,811 |
| GN Store Nord A/S | Denmark | 430,000 | | 9,593,352 |
| | | | | 17,756,163 |
| Household Products 2.3% | | | | |
| Reckitt Benckiser Group PLC | United Kingdom | 88,000 | | 7,530,803 |
| Internet & Direct Marketing Retail 5.4% | | | | |
| Start Today Co. Ltd | Japan | 440,000 | | 8,271,306 |
| a Vipshop Holdings Ltd., ADR | China | 830,000 | | 9,395,600 |
| | | | | 17,666,906 |
| Internet Software & Services 4.7% | | | | |
| a Just Eat PLC. | United Kingdom | 1,107,000 | | 7,511,616 |
| MercadoLibre Inc | Argentina | 43,000 | | 7,971,770 |
| | | | | 15,483,386 |
| IT Services 2.8% | | | | |
| Worldpay Group PLC | United Kingdom | 2,542,000 | | 9,140,796 |
| Machinery 5.6% | | | | |
| GEA Group AG | Germany | 200,000 | | 8,255,251 |
| Weir Group PLC | United Kingdom | 400,000 | | 10,087,155 |
| | | | | 18,342,406 |
franklintempleton.com
Semiannual Report 23
FRANKLIN GLOBAL TRUST
STATEMENT OF INVESTMENTS (UNAUDITED)
| | | | |
| Franklin International Growth Fund (continued) | | | | |
| | Country | Shares | | Value |
| |
| Common Stocks (continued) | | | | |
| Media 1.9% | | | | |
| ITV PLC | United Kingdom | 2,484,000 | $ | 6,348,478 |
| Multiline Retail 2.5% | | | | |
| Dollarama Inc | Canada | 106,000 | | 8,023,272 |
| Pharmaceuticals 8.0% | | | | |
| Hikma Pharmaceuticals PLC | United Kingdom | 400,000 | | 9,176,544 |
| Roche Holding AG. | Switzerland | 39,000 | | 9,181,106 |
| Santen Pharmaceutical Co. Ltd | Japan | 630,000 | | 7,899,057 |
| | | | | 26,256,707 |
| Professional Services 2.7% | | | | |
| Experian PLC | United Kingdom | 450,000 | | 8,653,948 |
| Road & Rail 3.3% | | | | |
| DSV AS | Denmark | 220,000 | | 10,678,666 |
| Software 11.0% | | | | |
| a Check Point Software Technologies Ltd | Israel | 35,000 | | 3,456,950 |
| a Line Corp | Japan | 250,000 | | 8,024,528 |
| The Sage Group PLC | United Kingdom | 1,025,000 | | 7,902,757 |
| SAP SE | Germany | 98,000 | | 8,952,263 |
| Sophos Group PLC | United Kingdom | 2,200,000 | | 7,587,251 |
| | | | | 35,923,749 |
| Textiles, Apparel & Luxury Goods 2.5% | | | | |
| Luxottica Group SpA | Italy | 155,000 | | 8,313,485 |
| Trading Companies & Distributors 4.5% | | | | |
| a Noble Group Ltd | Hong Kong | 45,000,000 | | 5,458,221 |
| Wolseley PLC | United Kingdom | 150,000 | | 9,257,668 |
| | | | | 14,715,889 |
| Total Common Stocks (Cost $286,313,348) | | | | 318,234,986 |
| |
| Short Term Investments (Cost $7,946,677) 2.4% | | | | |
| Money Market Funds 2.4% | | | | |
| c,d Institutional Fiduciary Trust Money Market Portfolio, 0.15%. | United States | 7,946,677 | | 7,946,677 |
| Total Investments (Cost $294,260,025) 99.8% | | | | 326,181,663 |
| Other Assets, less Liabilities 0.2% | | | | 597,123 |
| Net Assets 100.0% | | | $ | 326,778,786 |
See Abbreviations on page 47.
aNon-income producing.
bSecurity has been deemed illiquid because it may not be able to be sold within seven days.
cSee Note 3(f) regarding investments in affiliated management investment companies.
dThe rate shown is the annualized seven-day yield at period end.
24 Semiannual Report | The accompanying notes are an integral part of these financial statements. franklintempleton.com
FRANKLIN GLOBAL TRUST
| | | | | | | | | | | | | | | | | | |
| Financial Highlights | | | | | | | | | | | | | | | | | | |
| Franklin International Small Cap Growth Fund | | | | | | | | | | | | | | | | |
| | | Six Months Ended | | | | | | | | | | | | | | | | |
| | | January 31, 2017 | | | | | | Year Ended July 31, | | | | |
| | | (unaudited) | | | 2016 | | | 2015 | | | 2014 | | | 2013 | | | 2012 | |
| Class A | | | | | | | | | | | | | | | | | | |
| Per share operating performance | | | | | | | | | | | | | | | | | | |
| (for a share outstanding throughout the period) | | | | | | | | | | | | | | | | | | |
| Net asset value, beginning of period | $ | 17.55 | | $ | 19.92 | | $ | 22.23 | | $ | 19.70 | | $ | 14.38 | | $ | 16.31 | |
| Income from investment operationsa: | | | | | | | | | | | | | | | | | | |
| Net investment incomeb | | 0.04 | | | 0.22 | | | 0.19 | | | 0.19 | | | 0.18 | | | 0.25 | |
| Net realized and unrealized gains (losses) | | 0.96 | | | (1.98 | ) | | (0.48 | ) | | 2.65 | | | 5.94 | | | (1.48 | ) |
| Total from investment operations | | 1.00 | | | (1.76 | ) | | (0.29 | ) | | 2.84 | | | 6.12 | | | (1.23 | ) |
| Less distributions from: | | | | | | | | | | | | | | | | | | |
| Net investment income. | | (0.18 | ) | | (0.24 | ) | | (0.29 | ) | | (0.11 | ) | | (0.19 | ) | | (0.20 | ) |
| Net realized gains | | (1.32 | ) | | (0.37 | ) | | (1.73 | ) | | (0.20 | ) | | (0.61 | ) | | (0.50 | ) |
| Total distributions | | (1.50 | ) | | (0.61 | ) | | (2.02 | ) | | (0.31 | ) | | (0.80 | ) | | (0.70 | ) |
| Net asset value, end of period | $ | 17.05 | | $ | 17.55 | | $ | 19.92 | | $ | 22.23 | | $ | 19.70 | | $ | 14.38 | |
| |
| Total returnc | | 6.14 | % | | (8.93 | )% | | (0.17 | )% | | 14.48 | % | | 43.69 | % | | (7.14 | )% |
| |
| Ratios to average net assetsd | | | | | | | | | | | | | | | | | | |
| Expenses before waiver and payments by | | | | | | | | | | | | | | | | | | |
| affiliates | | 1.42 | % | | 1.38 | % | | 1.36 | % | | 1.36 | % | | 1.46 | % | | 1.49 | % |
| Expenses net of waiver and payments by | | | | | | | | | | | | | | | | | | |
| affiliates | | 1.42 | %e | | 1.38 | %e | | 1.36 | %e | | 1.36 | %e | | 1.40 | %e | | 1.24 | % |
| Net investment income | | 0.47 | % | | 1.14 | % | | 0.98 | % | | 0.89 | % | | 1.03 | % | | 1.72 | % |
| |
| Supplemental data | | | | | | | | | | | | | | | | | | |
| Net assets, end of period (000’s) | $ | 144,079 | | $ | 169,943 | | $ | 212,890 | | $ | 257,568 | | $ | 232,712 | | $ | 166,577 | |
| Portfolio turnover rate | | 8.19 | % | | 21.93 | % | | 24.20 | % | | 16.08 | % | | 22.81 | % | | 17.07 | % |
aThe amount shown for a share outstanding throughout the period may not correlate with the Statement of Operations for the period due to the timing of sales and
repurchases of the Fund’s shares in relation to income earned and/or fluctuating fair value of the investments of the Fund.
bBased on average daily shares outstanding.
cTotal return does not reflect sales commissions or contingent deferred sales charges, if applicable, and is not annualized for periods less than one year.
dRatios are annualized for periods less than one year.
eBenefit of expense reduction rounds to less than 0.01%.
franklintempleton.com The accompanying notes are an integral part of these financial statements. | Semiannual Report 25
| | | | | | | | | | | | | | | | | | |
| FRANKLIN GLOBAL TRUST | | | | | | | | | | | | | | | | | | |
| FINANCIAL HIGHLIGHTS | | | | | | | | | | | | | | | | | | |
| |
| |
| Franklin International Small Cap Growth Fund (continued) | | | | | | | | | | | | | | | | |
| | | Six Months Ended | | | | | | | | | | | | | | | | |
| | | January 31, 2017 | | | | | | Year Ended July 31, | | | | | | | |
| | | (unaudited) | | | 2016 | | | 2015 | | | 2014 | | | 2013 | | | 2012 | |
| Class C | | | | | | | | | | | | | | | | | | |
| Per share operating performance | | | | | | | | | | | | | | | | | | |
| (for a share outstanding throughout the period) | | | | | | | | | | | | | | | | | | |
| Net asset value, beginning of period | $ | 17.32 | | $ | 19.60 | | $ | 21.94 | | $ | 19.51 | | $ | 14.25 | | $ | 16.13 | |
| Income from investment operationsa: | | | | | | | | | | | | | | | | | | |
| Net investment income (loss)b | | (0.03 | ) | | 0.07 | | | 0.05 | | | 0.02 | | | 0.05 | | | 0.14 | |
| Net realized and unrealized gains (losses) | | 0.95 | | | (1.95 | ) | | (0.47 | ) | | 2.63 | | | 5.90 | | | (1.45 | ) |
| Total from investment operations | | 0.92 | | | (1.88 | ) | | (0.42 | ) | | 2.65 | | | 5.95 | | | (1.31 | ) |
| Less distributions from: | | | | | | | | | | | | | | | | | | |
| Net investment income. | | (0.02 | ) | | (0.03 | ) | | (0.19 | ) | | (0.02 | ) | | (0.08 | ) | | (0.07 | ) |
| Net realized gains | | (1.32 | ) | | (0.37 | ) | | (1.73 | ) | | (0.20 | ) | | (0.61 | ) | | (0.50 | ) |
| Total distributions | | (1.34 | ) | | (0.40 | ) | | (1.92 | ) | | (0.22 | ) | | (0.69 | ) | | (0.57 | ) |
| Net asset value, end of period | $ | 16.90 | | $ | 17.32 | | $ | 19.60 | | $ | 21.94 | | $ | 19.51 | | $ | 14.25 | |
| |
| Total returnc | | 5.74 | % | | (9.66 | )% | | (0.86 | )% | | 13.59 | % | | 42.74 | % | | (7.81 | )% |
| |
| Ratios to average net assetsd | | | | | | | | | | | | | | | | | | |
| Expenses before waiver and payments by | | | | | | | | | | | | | | | | | | |
| affiliates | | 2.17 | % | | 2.15 | % | | 2.08 | % | | 2.11 | % | | 2.16 | % | | 2.20 | % |
| Expenses net of waiver and payments by | | | | | | | | | | | | | | | | | | |
| affiliates | | 2.17 | %e | | 2.15 | %e | | 2.08 | %e | | 2.11 | %e | | 2.10 | %e | | 1.95 | % |
| Net investment income (loss) | | (0.28 | )% | | 0.37 | % | | 0.26 | % | | 0.14 | % | | 0.33 | % | | 1.01 | % |
| |
| Supplemental data | | | | | | | | | | | | | | | | | | |
| Net assets, end of period (000’s) | $ | 20,182 | | $ | 22,699 | | $ | 30,067 | | $ | 35,484 | | $ | 29,786 | | $ | 14,278 | |
| Portfolio turnover rate | | 8.19 | % | | 21.93 | % | | 24.20 | % | | 16.08 | % | | 22.81 | % | | 17.07 | % |
aThe amount shown for a share outstanding throughout the period may not correlate with the Statement of Operations for the period due to the timing of sales and
repurchases of the Fund’s shares in relation to income earned and/or fluctuating fair value of the investments of the Fund.
bBased on average daily shares outstanding.
cTotal return does not reflect sales commissions or contingent deferred sales charges, if applicable, and is not annualized for periods less than one year.
dRatios are annualized for periods less than one year.
eBenefit of expense reduction rounds to less than 0.01%.
26 Semiannual Report | The accompanying notes are an integral part of these financial statements. franklintempleton.com
| | | | | | | | | | | | | | | | | | |
| | | | | | | | | | | | FRANKLIN GLOBAL TRUST | |
| | | | | | | | | | | | FINANCIAL HIGHLIGHTS | |
| |
| |
| Franklin International Small Cap Growth Fund (continued) | | | | | | | | | | | | | | | | |
| | | Six Months Ended | | | | | | | | | | | | | | | | |
| | | January 31, 2017 | | | | | | Year Ended July 31, | | | | |
| | | (unaudited) | | | 2016 | | | 2015 | | | 2014 | | | 2013 | | | 2012 | |
| Class R | | | | | | | | | | | | | | | | | | |
| Per share operating performance | | | | | | | | | | | | | | | | | | |
| (for a share outstanding throughout the period) | | | | | | | | | | | | | | | | | | |
| Net asset value, beginning of period | $ | 17.56 | | $ | 19.88 | | $ | 22.19 | | $ | 19.65 | | $ | 14.35 | | $ | 16.29 | |
| Income from investment operationsa: | | | | | | | | | | | | | | | | | | |
| Net investment incomeb | | 0.02 | | | 0.17 | | | 0.15 | | | 0.12 | | | 0.13 | | | 0.22 | |
| Net realized and unrealized gains (losses) | | 0.97 | | | (1.98 | ) | | (0.48 | ) | | 2.66 | | | 5.94 | | | (1.48 | ) |
| Total from investment operations | | 0.99 | | | (1.81 | ) | | (0.33 | ) | | 2.78 | | | 6.07 | | | (1.26 | ) |
| Less distributions from: | | | | | | | | | | | | | | | | | | |
| Net investment income. | | (0.12 | ) | | (0.14 | ) | | (0.25 | ) | | (0.04 | ) | | (0.16 | ) | | (0.18 | ) |
| Net realized gains | | (1.32 | ) | | (0.37 | ) | | (1.73 | ) | | (0.20 | ) | | (0.61 | ) | | (0.50 | ) |
| Total distributions | | (1.44 | ) | | (0.51 | ) | | (1.98 | ) | | (0.24 | ) | | (0.77 | ) | | (0.68 | ) |
| Net asset value, end of period | $ | 17.11 | | $ | 17.56 | | $ | 19.88 | | $ | 22.19 | | $ | 19.65 | | $ | 14.35 | |
| |
| Total returnc | | 6.06 | % | | (9.20 | )% | | (0.41 | )% | | 14.17 | % | | 43.40 | % | | (7.37 | )% |
| |
| Ratios to average net assetsd | | | | | | | | | | | | | | | | | | |
| Expenses before waiver and payments by | | | | | | | | | | | | | | | | | | |
| affiliates | | 1.68 | % | | 1.64 | % | | 1.62 | % | | 1.62 | % | | 1.66 | % | | 1.70 | % |
| Expenses net of waiver and payments by | | | | | | | | | | | | | | | | | | |
| affiliates | | 1.68 | %e | | 1.64 | %e | | 1.62 | %e | | 1.62 | %e | | 1.60 | %e | | 1.45 | % |
| Net investment income | | 0.21 | % | | 0.88 | % | | 0.72 | % | | 0.63 | % | | 0.83 | % | | 1.51 | % |
| |
| Supplemental data | | | | | | | | | | | | | | | | | | |
| Net assets, end of period (000’s) | $ | 3,464 | | $ | 4,735 | | $ | 6,193 | | $ | 9,320 | | $ | 120,877 | | $ | 9,755 | |
| Portfolio turnover rate | | 8.19 | % | | 21.93 | % | | 24.20 | % | | 16.08 | % | | 22.81 | % | | 17.07 | % |
aThe amount shown for a share outstanding throughout the period may not correlate with the Statement of Operations for the period due to the timing of sales and
repurchases of the Fund’s shares in relation to income earned and/or fluctuating fair value of the investments of the Fund.
bBased on average daily shares outstanding.
cTotal return is not annualized for periods less than one year.
dRatios are annualized for periods less than one year.
eBenefit of expense reduction rounds to less than 0.01%.
franklintempleton.com The accompanying notes are an integral part of these financial statements. | Semiannual Report 27
| | | | | | | | | | | | | | | |
| FRANKLIN GLOBAL TRUST | | | | | | | | | | | | | | | |
| FINANCIAL HIGHLIGHTS | | | | | | | | | | | | | | | |
| |
| |
| Franklin International Small Cap Growth Fund (continued) | | | | | | | | | | | | | |
| | | Six Months Ended | | | | | | | | | | | | | |
| | | January 31, 2017 | | | | | | Year Ended July 31, | | | | |
| | | (unaudited) | | | 2016 | | | 2015 | | | 2014 | | | 2013 | a |
| Class R6 | | | | | | | | | | | | | | | |
| Per share operating performance | | | | | | | | | | | | | | | |
| (for a share outstanding throughout the period) | | | | | | | | | | | | | | | |
| Net asset value, beginning of period | $ | 17.61 | | $ | 20.03 | | $ | 22.32 | | $ | 19.78 | | $ | 18.49 | |
| Income from investment operationsb: | | | | | | | | | | | | | | | |
| Net investment incomec | | 0.07 | | | 0.30 | | | 0.27 | | | 0.28 | | | 0.09 | |
| Net realized and unrealized gains (losses) | | 0.97 | | | (2.00 | ) | | (0.48 | ) | | 2.65 | | | 1.20 | |
| Total from investment operations. | | 1.04 | | | (1.70 | ) | | (0.21 | ) | | 2.93 | | | 1.29 | |
| Less distributions from: | | | | | | | | | | | | | | | |
| Net investment income | | (0.26 | ) | | (0.35 | ) | | (0.35 | ) | | (0.19 | ) | | — | |
| Net realized gains | | (1.32 | ) | | (0.37 | ) | | (1.73 | ) | | (0.20 | ) | | — | |
| Total distributions | | (1.58 | ) | | (0.72 | ) | | (2.08 | ) | | (0.39 | ) | | — | |
| Net asset value, end of period. | $ | 17.07 | | $ | 17.61 | | $ | 20.03 | | $ | 22.32 | | $ | 19.78 | |
| |
| Total returnd | | 6.43 | % | | (8.61 | )% | | 0.22 | % | | 14.89 | % | | 6.98 | % |
| |
| Ratios to average net assetse | | | | | | | | | | | | | | | |
| Expensesf | | 1.00 | % | | 0.99 | % | | 0.99 | % | | 1.00 | % | | 1.01 | % |
| Net investment income. | | 0.89 | % | | 1.53 | % | | 1.35 | % | | 1.25 | % | | 1.42 | % |
| |
| Supplemental data | | | | | | | | | | | | | | | |
| Net assets, end of period (000’s) | $ | 433,764 | | $ | 383,411 | | $ | 387,070 | | $ | 359,449 | | $ | 220,507 | |
| Portfolio turnover rate | | 8.19 | % | | 21.93 | % | | 24.20 | % | | 16.08 | % | | 22.81 | % |
aFor the period May 1, 2013 (effective date) to July 31, 2013.
bThe amount shown for a share outstanding throughout the period may not correlate with the Statement of Operations for the period due to the timing of sales and
repurchases of the Fund’s shares in relation to income earned and/or fluctuating fair value of the investments of the Fund.
cBased on average daily shares outstanding.
dTotal return is not annualized for periods less than one year.
eRatios are annualized for periods less than one year.
fBenefit of expense reduction rounds to less than 0.01%.
28 Semiannual Report | The accompanying notes are an integral part of these financial statements. franklintempleton.com
| | | | | | | | | | | | | | | | | | |
| | | | | | | | | | | | FRANKLIN GLOBAL TRUST | |
| | | | | | | | | | | | FINANCIAL HIGHLIGHTS | |
| |
| |
| Franklin International Small Cap Growth Fund (continued) | | | | | | | | | | | | | | | | |
| | | Six Months Ended | | | | | | | | | | | | | | | | |
| | | January 31, 2017 | | | | | | Year Ended July 31, | | | | |
| | | (unaudited) | | | 2016 | | | 2015 | | | 2014 | | | 2013 | | | 2012 | |
| Advisor Class | | | | | | | | | | | | | | | | | | |
| Per share operating performance | | | | | | | | | | | | | | | | | | |
| (for a share outstanding throughout the period) | | | | | | | | | | | | | | | | | | |
| Net asset value, beginning of period | $ | 17.59 | | $ | 20.00 | | $ | 22.30 | | $ | 19.77 | | $ | 14.43 | | $ | 16.36 | |
| Income from investment operationsa: | | | | | | | | | | | | | | | | | | |
| Net investment incomeb | | 0.07 | | | 0.25 | | | 0.24 | | | 0.25 | | | 0.23 | | | 0.29 | |
| Net realized and unrealized gains (losses) | | 0.96 | | | (1.97 | ) | | (0.48 | ) | | 2.65 | | | 5.95 | | | (1.48 | ) |
| Total from investment operations | | 1.03 | | | (1.72 | ) | | (0.24 | ) | | 2.90 | | | 6.18 | | | (1.19 | ) |
| Less distributions from: | | | | | | | | | | | | | | | | | | |
| Net investment income. | | (0.22 | ) | | (0.32 | ) | | (0.33 | ) | | (0.17 | ) | | (0.23 | ) | | (0.24 | ) |
| Net realized gains | | (1.32 | ) | | (0.37 | ) | | (1.73 | ) | | (0.20 | ) | | (0.61 | ) | | (0.50 | ) |
| Total distributions | | (1.54 | ) | | (0.69 | ) | | (2.06 | ) | | (0.37 | ) | | (0.84 | ) | | (0.74 | ) |
| Net asset value, end of period | $ | 17.08 | | $ | 17.59 | | $ | 20.00 | | $ | 22.30 | | $ | 19.77 | | $ | 14.43 | |
| |
| Total returnc | | 6.33 | % | | (8.74 | )% | | 0.09 | % | | 14.74 | % | | 44.06 | % | | (6.87 | )% |
| |
| Ratios to average net assetsd | | | | | | | | | | | | | | | | | | |
| Expenses before waiver and payments by | | | | | | | | | | | | | | | | | | |
| affiliates | | 1.18 | % | | 1.14 | % | | 1.12 | % | | 1.12 | % | | 1.16 | % | | 1.20 | % |
| Expenses net of waiver and payments by | | | | | | | | | | | | | | | | | | |
| affiliates | | 1.18 | %e | | 1.14 | %e | | 1.12 | %e | | 1.12 | %e | | 1.10 | %e | | 0.95 | % |
| Net investment income | | 0.71 | % | | 1.38 | % | | 1.22 | % | | 1.13 | % | | 1.33 | % | | 2.01 | % |
| |
| Supplemental data | | | | | | | | | | | | | | | | | | |
| Net assets, end of period (000’s) | $ | 611,971 | | $ | 827,351 | | $ | 1,300,759 | | $ | 1,223,532 | | $ | 826,218 | | $ | 376,590 | |
| Portfolio turnover rate | | 8.19 | % | | 21.93 | % | | 24.20 | % | | 16.08 | % | | 22.81 | % | | 17.07 | % |
aThe amount shown for a share outstanding throughout the period may not correlate with the Statement of Operations for the period due to the timing of sales and
repurchases of the Fund’s shares in relation to income earned and/or fluctuating fair value of the investments of the Fund.
bBased on average daily shares outstanding.
cTotal return is not annualized for periods less than one year.
dRatios are annualized for periods less than one year.
eBenefit of expense reduction rounds to less than 0.01%.
franklintempleton.com The accompanying notes are an integral part of these financial statements. | Semiannual Report 29
| | | | |
| FRANKLIN GLOBAL TRUST | | | | |
| |
| |
| |
| |
| Statement of Investments, January 31, 2017 (unaudited) | | | | |
| Franklin International Small Cap Growth Fund | | | | |
| | Country | Shares | | Value |
| |
| Common Stocks 99.8% | | | | |
| Air Freight & Logistics 3.2% | | | | |
| Panalpina Welttransport Holding AG | Switzerland | 317,499 | $ | 39,136,022 |
| Beverages 2.3% | | | | |
| C&C Group PLC | Ireland | 6,621,330 | | 28,252,343 |
| Building Products 1.6% | | | | |
| Uponor OYJ | Finland | 1,062,912 | | 19,217,396 |
| Capital Markets 6.9% | | | | |
| ARA Asset Management Ltd | Singapore | 33,298,522 | | 40,625,236 |
| a Fairfax India Holdings Corp | Canada | 3,810,600 | | 42,831,144 |
| | | | | 83,456,380 |
| Commercial Services & Supplies 8.4% | | | | |
| Elis SA | France | 3,053,159 | | 54,657,192 |
| ISS A/S | Denmark | 662,700 | | 23,538,512 |
| a Serco Group PLC | United Kingdom | 13,028,010 | | 23,595,809 |
| | | | | 101,791,513 |
| Construction & Engineering 1.8% | | | | |
| Morgan Sindall Group PLC | United Kingdom | 2,086,500 | | 21,571,707 |
| Distributors 3.0% | | | | |
| b Headlam Group PLC | United Kingdom | 5,372,888 | | 36,694,580 |
| Diversified Financial Services 4.4% | | | | |
| Kennedy Wilson Europe Real Estate PLC | United Kingdom | 4,456,500 | | 53,136,942 |
| Energy Equipment & Services 3.3% | | | | |
| Amec Foster Wheeler PLC. | United Kingdom | 7,316,100 | | 40,662,862 |
| Food & Staples Retailing 4.0% | | | | |
| Sligro Food Group NV | Netherlands | 532,874 | | 19,297,430 |
| Total Produce PLC | Ireland | 15,245,100 | | 29,620,010 |
| | | | | 48,917,440 |
| Hotels, Restaurants & Leisure 3.1% | | | | |
| a Dalata Hotel Group PLC | Ireland | 8,042,958 | | 37,243,931 |
| Insurance 11.2% | | | | |
| a Arch Capital Group Ltd | United States | 394,407 | | 34,845,859 |
| Euler Hermes Group | France | 224,921 | | 20,293,958 |
| Fairfax Financial Holdings Ltd | Canada | 86,000 | | 40,159,754 |
| RenaissanceRe Holdings Ltd | United States | 295,500 | | 40,282,560 |
| | | | | 135,582,131 |
| Leisure Products 2.8% | | | | |
| Beneteau SA | France | 2,721,600 | | 33,489,724 |
| Machinery 6.0% | | | | |
| Vesuvius PLC. | United Kingdom | 7,759,875 | | 46,086,637 |
| Zardoya Otis SA | Spain | 3,149,108 | | 26,513,348 |
| | | | | 72,599,985 |
| Marine 7.2% | | | | |
| b Clarkson PLC | United Kingdom | 1,861,220 | | 54,778,215 |
| a,b Diana Shipping Inc | Greece | 7,909,500 | | 32,745,330 |
| | | | | 87,523,545 |
| Media 1.9% | | | | |
| ASATSU-DK Inc | Japan | 883,800 | | 23,406,790 |
30 Semiannual Report
franklintempleton.com
FRANKLIN GLOBAL TRUST
STATEMENT OF INVESTMENTS (UNAUDITED)
| | | | | | |
| Franklin International Small Cap Growth Fund (continued) | | | | | | |
| | Country | | Shares | | Value | |
| Common Stocks (continued) | | | | | | |
| Metals & Mining 2.0% | | | | | | |
| c Straits Trading Co. Ltd | Singapore | | 17,186,300 | $ | 23,771,659 | |
| Professional Services 5.5% | | | | | | |
| PageGroup PLC | United Kingdom | | 9,307,501 | | 50,501,879 | |
| SThree PLC | United Kingdom | | 4,069,860 | | 16,341,980 | |
| | | | | | 66,843,859 | |
| Real Estate Investment Trusts (REITs) 10.6% | | | | | | |
| Green REIT PLC | Ireland | | 32,323,781 | | 45,357,377 | |
| b Irish Residential Properties REIT PLC | Ireland | | 28,014,700 | | 35,077,318 | |
| b Lar Espana Real Estate Socimi SA | Spain | | 6,357,210 | | 48,280,839 | |
| | | | | | 128,715,534 | |
| Real Estate Management & Development 2.3% | | | | | | |
| Countrywide PLC | United Kingdom | | 5,111,880 | | 11,267,641 | |
| Hang Lung Group Ltd | Hong Kong | | 4,262,100 | | 16,397,023 | |
| | | | | | 27,664,664 | |
| Specialty Retail 1.2% | | | | | | |
| a,b Carpetright PLC | United Kingdom | | 6,064,925 | | 14,436,291 | |
| Tobacco 2.5% | | | | | | |
| Scandinavian Tobacco Group AS | Denmark | | 1,803,373 | | 30,966,945 | |
| Trading Companies & Distributors 4.6% | | | | | | |
| Grafton Group PLC, units consisting of A shares and C shares | United Kingdom | | 7,597,932 | | 55,808,783 | |
| Total Common Stocks (Cost $1,243,452,798) | | | | | 1,210,891,026 | |
| |
| | | | Principal | | | |
| | | | Amount | | | |
| Short Term Investments (Cost $4,200,000) 0.3% | | | | | | |
| Time Deposits 0.3% | | | | | | |
| Royal Bank of Canada, 0.50%, 2/01/17 | United States | $ | 4,200,000 | | 4,200,000 | |
| Total Investments (Cost $1,247,652,798) 100.1% | | | | | 1,215,091,026 | |
| Other Assets, less Liabilities (0.1)% | | | | | (1,631,764 | ) |
| Net Assets 100.0% | | | | $ | 1,213,459,262 | |
See Abbreviations on page 47.
aNon-income producing.
bSee Note 8 regarding holdings of 5% voting securities.
cAt January 31, 2017, pursuant to the Fund’s policies and the requirements of applicable securities law, the Fund is restricted from trading this security at period end.
franklintempleton.com The accompanying notes are an integral part of these financial statements. | Semiannual Report 31
| | | | | | |
| FRANKLIN GLOBAL TRUST | | | | | | |
| |
| |
| |
| |
| Financial Statements | | | | | | |
| |
| |
| Statements of Assets and Liabilities | | | | | | |
| January 31, 2017 (unaudited) | | | | | | |
| |
| | | | | | Franklin | |
| | | Franklin | | | International | |
| | | International | | | Small Cap | |
| | | Growth Fund | | | Growth Fund | |
| Assets: | | | | | | |
| Investments in securities: | | | | | | |
| Cost - Unaffiliated issuers | $ | 286,313,348 | | $ | 962,831,945 | |
| Cost - Non-controlled affiliates (Note 3f and 8) | | 7,946,677 | | | 284,820,853 | |
| Total cost of investments. | $ | 294,260,025 | | $ | 1,247,652,798 | |
| Value - Unaffiliated issuers | $ | 318,234,986 | | $ | 993,078,453 | |
| Value - Non-controlled affiliates (Note 3f and 8) | | 7,946,677 | | | 222,012,573 | |
| Total value of investments. | | 326,181,663 | | | 1,215,091,026 | |
| Cash | | — | | | 39,095 | |
| Receivables: | | | | | | |
| Investment securities sold | | — | | | 5,387,415 | |
| Capital shares sold | | 161,162 | | | 1,207,219 | |
| Dividends | | 518,266 | | | 1,533,899 | |
| European Union tax reclaims. | | 47,610 | | | 877,107 | |
| Affiliates | | 386,369 | | | — | |
| Other assets | | 7 | | | 36 | |
| Total assets. | | 327,295,077 | | | 1,224,135,797 | |
| Liabilities: | | | | | | |
| Payables: | | | | | | |
| Investment securities purchased | | — | | | 7,710,615 | |
| Capital shares redeemed | | 194,875 | | | 1,428,076 | |
| Management fees | | 204,689 | | | 966,233 | |
| Distribution fees. | | 40,926 | | | 47,932 | |
| Transfer agent fees | | — | | | 370,018 | |
| Accrued expenses and other liabilities | | 75,801 | | | 153,661 | |
| Total liabilities | | 516,291 | | | 10,676,535 | |
| Net assets, at value | $ | 326,778,786 | | $ | 1,213,459,262 | |
| Net assets consist of: | | | | | | |
| Paid-in capital | $ | 313,785,673 | | $ | 1,238,333,842 | |
| Distributions in excess of net investment income | | (533,107 | ) | | (8,387,428 | ) |
| Net unrealized appreciation (depreciation) | | 31,909,949 | | | (32,688,995 | ) |
| Accumulated net realized gain (loss) | | (18,383,729 | ) | | 16,201,843 | |
| Net assets, at value | $ | 326,778,786 | | $ | 1,213,459,262 | |
32 Semiannual Report | The accompanying notes are an integral part of these financial statements. franklintempleton.com
| | | | | |
| | | | FRANKLIN GLOBAL TRUST |
| | | | FINANCIAL STATEMENTS |
| |
| |
| Statements of Assets and Liabilities (continued) | | | | | |
| January 31, 2017 (unaudited) | | | | | |
| |
| | | | | | Franklin |
| | | | Franklin | | International |
| | | | International | | Small Cap |
| | | | Growth Fund | | Growth Fund |
| Class A: | | | | | |
| Net assets, at value | $ | | 167,579,526 | $ | 144,078,931 |
| Shares outstanding | | | 15,079,818 | | 8,448,896 |
| Net asset value per sharea | | $ | 11.11 | $ | 17.05 |
| Maximum offering price per share (net asset value per share ÷ 94.25%) | | $ | 11.79 | $ | 18.09 |
| Class C: | | | | | |
| Net assets, at value | $ | | 6,439,245 | $ | 20,182,156 |
| Shares outstanding | | | 594,364 | | 1,193,967 |
| Net asset value and maximum offering price per sharea | | $ | 10.83 | $ | 16.90 |
| Class R: | | | | | |
| Net assets, at value | $ | | 303,754 | $ | 3,463,506 |
| Shares outstanding | | | 27,358 | | 202,444 |
| Net asset value and maximum offering price per share. | | $ | 11.10 | $ | 17.11 |
| Class R6: | | | | | |
| Net assets, at value | $ | | 46,501,133 | $ | 433,763,921 |
| Shares outstanding | | | 4,170,750 | | 25,413,247 |
| Net asset value and maximum offering price per share. | | $ | 11.15 | $ | 17.07 |
| Advisor Class: | | | | | |
| Net assets, at value | $ | | 105,955,128 | $ | 611,970,748 |
| Shares outstanding | | | 9,502,461 | | 35,833,970 |
| Net asset value and maximum offering price per share. | | $ | 11.15 | $ | 17.08 |
aRedemption price is equal to net asset value less contingent deferred sales charges, if applicable.
franklintempleton.com The accompanying notes are an integral part of these financial statements. | Semiannual Report 33
| | | | | | |
| FRANKLIN GLOBAL TRUST | | | | | | |
| FINANCIAL STATEMENTS | | | | | | |
| |
| |
| Statements of Operations | | | | | | |
| for the six months ended January 31, 2017 (unaudited) | | | | | | |
| |
| | | | | | Franklin | |
| | | Franklin | | | International | |
| | | International | | | Small Cap | |
| | | Growth Fund | | | Growth Fund | |
| Investment income: | | | | | | |
| Dividends: (net of foreign taxes)a | | | | | | |
| Unaffiliated issuers | $ | 2,235,658 | | $ | 10,381,183 | |
| Non-controlled affiliates (Note 3f and 8) | | 994 | | | 1,413,129 | |
| Interest | | 83 | | | 49,871 | |
| Other income (Note 1c) | | 8,273 | | | 409,866 | |
| Total investment income | | 2,245,008 | | | 12,254,049 | |
| Expenses: | | | | | | |
| Management fees (Note 3a) | | 1,705,177 | | | 6,150,274 | |
| Distribution fees: (Note 3c) | | | | | | |
| Class A | | 206,056 | | | 186,518 | |
| Class C | | 32,652 | | | 106,177 | |
| Class R | | 688 | | | 10,270 | |
| Transfer agent fees: (Note 3e) | | | | | | |
| Class A | | 321,881 | | | 141,909 | |
| Class C | | 12,753 | | | 19,804 | |
| Class R | | 575 | | | 3,787 | |
| Class R6 | | 232 | | | 228 | |
| Advisor Class | | 214,007 | | | 671,239 | |
| Custodian fees (Note 4) | | 18,561 | | | 88,585 | |
| Reports to shareholders | | 16,702 | | | 39,166 | |
| Registration and filing fees | | 47,353 | | | 80,917 | |
| Professional fees. | | 26,162 | | | 54,191 | |
| Trustees’ fees and expenses. | | 8,006 | | | 33,004 | |
| Other | | 10,456 | | | 20,880 | |
| Total expenses | | 2,621,261 | | | 7,606,949 | |
| Expense reductions (Note 4) | | (11 | ) | | (146 | ) |
| Expenses waived/paid by affiliates (Note 3f and 3g) | | (315,270 | ) | | — | |
| Net expenses | | 2,305,980 | | | 7,606,803 | |
| Net investment income (loss) | | (60,972 | ) | | 4,647,246 | |
| Realized and unrealized gains (losses): | | | | | | |
| Net realized gain (loss) from: | | | | | | |
| Investments: | | | | | | |
| Unaffiliated issuers. | | 663,457 | | | 62,767,995 | |
| Non-controlled affiliates (Note 8) | | — | | | (31,484,487 | ) |
| Foreign currency transactions | | (138,858 | ) | | (543,882 | ) |
| Net realized gain (loss) | | 524,599 | | | 30,739,626 | |
| Net change in unrealized appreciation (depreciation) on: | | | | | | |
| Investments | | 406,482 | | | 40,202,552 | |
| Translation of other assets and liabilities | | | | | | |
| denominated in foreign currencies | | (3,391 | ) | | 9,722 | |
| Net change in unrealized appreciation (depreciation) | | 403,091 | | | 40,212,274 | |
| Net realized and unrealized gain (loss) | | 927,690 | | | 70,951,900 | |
| Net increase (decrease) in net assets resulting from operations | $ | 866,718 | | $ | 75,599,146 | |
| |
| |
| |
| aForeign taxes withheld on dividends | $ | 432,293 | | $ | 591,165 | |
34 Semiannual Report | The accompanying notes are an integral part of these financial statements. franklintempleton.com
| | | | | | | | | | | | | | |
| | | | | | | | | | FRANKLIN GLOBAL TRUST | |
| | | | | | | | | | FINANCIAL STATEMENTS | |
| |
| |
| Statements of Changes in Net Assets | | | | | | | | | | | | | | |
| |
| | | Franklin International | | | Franklin International | |
| | | Growth Fund | | | | Small Cap Growth Fund | |
| | | Six Months Ended | | | | | | | Six Months Ended | | | | | |
| | | January 31, 2017 | | | Year Ended | | | January 31, 2017 | | | | Year Ended | |
| | | (unaudited) | | | July 31, 2016 | | | (unaudited) | | | July 31, 2016 | |
| Increase (decrease) in net assets: | | | | | | | | | | | | | | |
| Operations: | | | | | | | | | | | | | | |
| Net investment income (loss) | $ | (60,972 | ) | | $ | 1,845,049 | | $ | 4,647,246 | | | $ | 23,933,557 | |
| Net realized gain (loss) | | 524,599 | | | | (4,136,305 | ) | | 30,739,626 | | | | 99,132,581 | |
| Net change in unrealized appreciation | | | | | | | | | | | | | | |
| (depreciation) | | 403,091 | | | | (3,185,540 | ) | | 40,212,274 | | | | (292,082,074 | ) |
| Net increase (decrease) in net assets | | | | | | | | | | | | | | |
| resulting from operations | | 866,718 | | | | (5,476,796 | ) | | 75,599,146 | | | | (169,015,936 | ) |
| Distributions to shareholders from: | | | | | | | | | | | | | | |
| Net investment income: | | | | | | | | | | | | | | |
| Class A | | (841,402 | ) | | | (19,599 | ) | | (1,425,659 | ) | | | (2,548,731 | ) |
| Class C | | — | | | | — | | | (25,239 | ) | | | (49,994 | ) |
| Class R | | (294 | ) | | | (243 | ) | | (24,719 | ) | | | (41,028 | ) |
| Class R6 | | (527,530 | ) | | | (635,959 | ) | | (5,916,833 | ) | | | (7,578,966 | ) |
| Advisor Class | | (949,579 | ) | | | (463,438 | ) | | (7,468,726 | ) | | | (20,608,922 | ) |
| Net realized gains: | | | | | | | | | | | | | | |
| Class A | | — | | | | — | | | (10,724,992 | ) | | | (3,890,324 | ) |
| Class C | | — | | | | — | | | (1,534,356 | ) | | | (550,381 | ) |
| Class R | | — | | | | — | | | (283,306 | ) | | | (108,438 | ) |
| Class R6 | | — | | | | — | | | (29,674,221 | ) | | | (8,026,305 | ) |
| Advisor Class | | — | | | | — | | | (45,321,273 | ) | | | (24,148,351 | ) |
| Total distributions to shareholders | | (2,318,805 | ) | | | (1,119,239 | ) | | (102,399,324 | ) | | | (67,551,440 | ) |
| Capital share transactions: (Note 2) | | | | | | | | | | | | | | |
| Class A | | (3,245,061 | ) | | | (10,690,485 | ) | | (22,623,414 | ) | | | (17,999,696 | ) |
| Class C | | (364,282 | ) | | | (239,793 | ) | | (2,108,591 | ) | | | (3,969,619 | ) |
| Class R | | 6,193 | | | | (64,088 | ) | | (1,192,496 | ) | | | (769,612 | ) |
| Class R6 | | (74,096,206 | ) | | | (13,351,970 | ) | | 60,320,010 | | | | 45,508,976 | |
| Advisor Class | | (4,433,988 | ) | | | (13,140,557 | ) | | (202,275,526 | ) | | | (315,042,616 | ) |
| Total capital share transactions | | (82,133,344 | ) | | | (37,486,893 | ) | | (167,880,017 | ) | | | (292,272,567 | ) |
| Net increase (decrease) in net assets | | (83,585,431 | ) | | | (44,082,928 | ) | | (194,680,195 | ) | | | (528,839,943 | ) |
| Net assets: | | | | | | | | | | | | | | |
| Beginning of period | | 410,364,217 | | | 454,447,145 | | | 1,408,139,457 | | | 1,936,979,400 | |
| End of period | $ | 326,778,786 | | $ | 410,364,217 | | $ | 1,213,459,262 | | $ | 1,408,139,457 | |
| Undistributed net investment income included in net | | | | | | | | | | | | | | |
| assets: | | | | | | | | | | | | | | |
| End of period | $ | — | | | $ | 1,846,670 | | $ | — | | | $ | 1,826,502 | |
| Distributions in excess of net investment income | | | | | | | | | | | | | | |
| included in net assets: | | | | | | | | | | | | | | |
| End of period | $ | (533,107 | ) | | $ | — | | $ | (8,387,428 | ) | | $ | — | |
franklintempleton.com The accompanying notes are an integral part of these financial statements. | Semiannual Report 35
FRANKLIN GLOBAL TRUST
Notes to Financial Statements (unaudited)
1. Organization and Significant Accounting Policies
Franklin Global Trust (Trust) is registered under the Investment Company Act of 1940 (1940 Act) as an open-end management investment company, consisting of five separate funds, two of which are included in this report (Funds) and applies the specialized accounting and reporting guidance in U.S. Generally Accepted Accounting Principles (U.S. GAAP). The financial statements of the remaining funds in the Trust are presented separately. The Funds offer five classes of shares: Class A, Class C, Class R, Class R6 and Advisor Class. Each class of shares differs by its initial sales load, contingent deferred sales charges, voting rights on matters affecting a single class, its exchange privilege and fees primarily due to differing arrangements for distribution and transfer agent fees. Franklin International Small Cap Growth Fund was closed to new investors with limited exceptions effective June 3, 2013.
The following summarizes the Funds’ significant accounting policies.
a. Financial Instrument Valuation
The Funds’ investments in financial instruments are carried at fair value daily. Fair value is the price that would be received to sell an asset or paid to transfer a liability in an orderly transaction between market participants on the measurement date. The Funds calculate the net asset value (NAV) per share as of 4 p.m. Eastern time each day the New York Stock Exchange (NYSE) is open for trading. Under compliance policies and procedures approved by the Trust’s Board of Trustees (the Board), the Funds’ administrator has responsibility for oversight of valuation, including leading the cross-functional Valuation Committee (VC). The VC provides administration and oversight of the Funds’ valuation policies and procedures, which are approved annually by the Board. Among other things, these procedures allow the Funds to utilize independent pricing services, quotations from securities and financial instrument dealers, and other market sources to determine fair value.
Equity securities listed on an exchange or on the NASDAQ National Market System are valued at the last quoted sale price or the official closing price of the day, respectively. Foreign equity securities are valued as of the close of trading on the foreign stock exchange on which the security is primarily traded, or as of 4 p.m. Eastern time. The value is then converted into its U.S. dollar equivalent at the foreign exchange rate in effect at 4 p.m. Eastern time on the day that the value of the security is determined. Over-the-counter (OTC) securities are valued within the range of the most recent quoted bid and ask prices. Securities that trade in multiple markets or on multiple exchanges are valued according to the broadest and most representative market. Certain equity securities are valued based upon fundamental characteristics or relationships to similar securities.
Investments in open-end mutual funds are valued at the closing NAV. Investments in time deposits are valued at cost, which approximates fair value.
The Funds have procedures to determine the fair value of financial instruments for which market prices are not reliable or readily available. Under these procedures, the VC convenes on a regular basis to review such financial instruments and considers a number of factors, including significant unobservable valuation inputs, when arriving at fair value. The VC primarily employs a market-based approach which may use related or comparable assets or liabilities, recent transactions, market multiples, book values, and other relevant information for the investment to determine the fair value of the investment. An income-based valuation approach may also be used in which the anticipated future cash flows of the investment are discounted to calculate fair value. Discounts may also be applied due to the nature or duration of any restrictions on the disposition of the investments. Due to the inherent uncertainty of valuations of such investments, the fair values may differ significantly from the values that would have been used had an active market existed. The VC employs various methods for calibrating these valuation approaches including a regular review of key inputs and assumptions, transactional back-testing or disposition analysis, and reviews of any related market activity.
Trading in securities on foreign securities stock exchanges and OTC markets may be completed before 4 p.m. Eastern time. In addition, trading in certain foreign markets may not take place on every Funds’ business day. Occasionally, events occur between the time at which trading in a foreign security is completed and 4 p.m. Eastern time that might call into question the reliability of the value of a portfolio security held by the Fund. As a result, differences may arise between the value of the Funds’ portfolio securities as determined at the foreign market close and the latest indications of value at 4 p.m. Eastern time. In order to minimize the potential for these differences, the VC monitors price movements following the close of
36 Semiannual Report
franklintempleton.com
FRANKLIN GLOBAL TRUST
NOTES TO FINANCIAL STATEMENTS (UNAUDITED)
trading in foreign stock markets through a series of country specific market proxies (such as baskets of American Depositary Receipts, futures contracts and exchange traded funds). These price movements are measured against established trigger thresholds for each specific market proxy to assist in determining if an event has occurred that may call into question the reliability of the values of the foreign securities held by the Funds. If such an event occurs, the securities may be valued using fair value procedures, which may include the use of independent pricing services.
When the last day of the reporting period is a non-business day, certain foreign markets may be open on those days that the Funds’ NAV is not calculated, which could result in differences between the value of the Funds’ portfolio securities on the last business day and the last calendar day of the reporting period. Any significant security valuation changes due to an open foreign market are adjusted and reflected by the Funds for financial reporting purposes.
b. Foreign Currency Translation
Portfolio securities and other assets and liabilities denominated in foreign currencies are translated into U.S. dollars based on the exchange rate of such currencies against U.S. dollars on the date of valuation. The Funds may enter into foreign currency exchange contracts to facilitate transactions denominated in a foreign currency. Purchases and sales of securities, income and expense items denominated in foreign currencies are translated into U.S. dollars at the exchange rate in effect on the transaction date. Portfolio securities and assets and liabilities denominated in foreign currencies contain risks that those currencies will decline in value relative to the U.S. dollar. Occasionally, events may impact the availability or reliability of foreign exchange rates used to convert the U.S. dollar equivalent value. If such an event occurs, the foreign exchange rate will be valued at fair value using procedures established and approved by the Board.
The Funds do not separately report the effect of changes in foreign exchange rates from changes in market prices on securities held. Such changes are included in net realized and unrealized gain or loss from investments in the Statements of Operations.
Realized foreign exchange gains or losses arise from sales of foreign currencies, currency gains or losses realized between the trade and settlement dates on securities transactions and the difference between the recorded amounts of dividends, interest, and foreign withholding taxes and the U.S. dollar equivalent of the amounts actually received or paid. Net unrealized foreign exchange gains and losses arise from changes in foreign exchange rates on foreign denominated assets and liabilities other than investments in securities held at the end of the reporting period.
c. Income and Deferred Taxes
It is each Fund’s policy to qualify as a regulated investment company under the Internal Revenue Code. Each Fund intends to distribute to shareholders substantially all of its taxable income and net realized gains to relieve it from federal income and excise taxes. As a result, no provision for U.S. federal income taxes is required.
The Funds may be subject to foreign taxation related to income received, capital gains on the sale of securities and certain foreign currency transactions in the foreign jurisdictions in which the Funds invest. Foreign taxes, if any, are recorded based on the tax regulations and rates that exist in the foreign markets in which the Funds invest. When a capital gain tax is determined to apply, certain or all Funds record an estimated deferred tax liability in an amount that would be payable if the securities were disposed of on the valuation date. As a result of several court cases, in certain countries across the European Union, certain or all Funds filed additional tax reclaims for previously withheld taxes on dividends earned in those countries (EU reclaims). These additional filings are subject to various administrative proceedings by the local jurisdictions’ tax authorities within the European Union, as well as a number of related judicial proceedings. Income recognized, if any, for EU reclaims is reflected as other income in the Statements of Operations and any related receivable, if any, is reflected as European Union tax reclaims in the Statements of Assets and Liabilities. When uncertainty exists as to the ultimate resolution of these proceedings, the likelihood of receipt of these EU reclaims, and the potential timing of payment, no amounts are reflected in the financial statements. For U.S. income tax purposes, EU reclaims received by the Funds, if any, reduce the amounts of foreign taxes Fund shareholders can use as tax credits in their individual income tax returns.
Each Fund may recognize an income tax liability related to its uncertain tax positions under U.S. GAAP when the uncertain tax position has a less than 50% probability that it will be sustained upon examination by the tax authorities based on its technical merits. As of January 31, 2017, each Fund has
franklintempleton.com
Semiannual Report 37
FRANKLIN GLOBAL TRUST
NOTES TO FINANCIAL STATEMENTS (UNAUDITED)
1. Organization and Significant Accounting
Policies (continued)
c. Income and Deferred Taxes (continued)
determined that no tax liability is required in its financial statements related to uncertain tax positions for any open tax years (or expected to be taken in future tax years). Open tax years are those that remain subject to examination and are based on each tax jurisdiction’s statute of limitation.
d. Security Transactions, Investment Income, Expenses and Distributions
Security transactions are accounted for on trade date. Realized gains and losses on security transactions are determined on a specific identification basis. Interest income and estimated expenses are accrued daily. Dividend income is recorded on the ex-dividend date except for certain dividends from securities where the dividend rate is not available. In such cases, the dividend is recorded as soon as the information is received by the Funds. Distributions to shareholders are recorded on the ex-dividend date and are determined according to income tax regulations (tax basis). Distributable earnings determined on a tax basis may differ from earnings recorded in accordance with U.S. GAAP. These differences may be permanent or temporary. Permanent differences are reclassified among capital accounts to reflect their tax character. These reclassifications have no impact on net assets or the results of operations. Temporary differences are not reclassified, as they may reverse in subsequent periods.
Common expenses incurred by the Trust are allocated among the Funds based on the ratio of net assets of each Fund to the combined net assets of the Trust. Fund specific expenses are charged directly to the Fund that incurred the expense.
Realized and unrealized gains and losses and net investment income, not including class specific expenses, are allocated daily to each class of shares based upon the relative proportion of net assets of each class. Differences in per share distributions, by class, are generally due to differences in class specific expenses.
e. Accounting Estimates
The preparation of financial statements in accordance with U.S. GAAP requires management to make estimates and assumptions that affect the reported amounts of assets and liabilities at the date of the financial statements and the amounts of income and expenses during the reporting period. Actual results could differ from those estimates.
f. Guarantees and Indemnifications
Under the Trust’s organizational documents, its officers and trustees are indemnified by the Trust against certain liabilities arising out of the performance of their duties to the Trust. Additionally, in the normal course of business, the Trust, on behalf of the Funds, enters into contracts with service providers that contain general indemnification clauses. The Trust’s maximum exposure under these arrangements is unknown as this would involve future claims that may be made against the Trust that have not yet occurred. Currently, the Trust expects the risk of loss to be remote.
38 Semiannual Report
franklintempleton.com
FRANKLIN GLOBAL TRUST
NOTES TO FINANCIAL STATEMENTS (UNAUDITED)
2. Shares of Beneficial Interest
At January 31, 2017, there were an unlimited number of shares authorized (without par value). Transactions in the Funds’ shares were as follows:
| | | | | | | | | | | |
| | Franklin International | | Franklin International | |
| | Growth Fund | | | Small Cap Growth Fund | |
| | Shares | | | Amount | | Shares | | | Amount | |
| Class A Shares: | | | | | | | | | | | |
| Six Months ended January 31, 2017 | | | | | | | | | | | |
| Shares sold | 1,605,975 | | $ | 17,413,191 | | 333,803 | | $ | 5,759,025 | |
| Shares issued in reinvestment of distributions | 21,796 | | | 231,036 | | 734,002 | | | 11,839,446 | |
| Shares redeemed | (1,906,020 | ) | | (20,889,288 | ) | (2,303,855 | ) | | (40,221,885 | ) |
| Net increase (decrease) | (278,249 | ) | $ | (3,245,061 | ) | (1,236,050 | ) | $ | (22,623,414 | ) |
| Year ended July 31, 2016 | | | | | | | | | | | |
| Shares sold | 2,126,119 | | $ | 22,225,883 | | 844,211 | | $ | 15,571,525 | |
| Shares issued in reinvestment of distributions | 537 | | | | 5,630 | | 342,934 | | | 6,292,827 | |
| Shares redeemed | (3,148,867 | ) | | (32,921,998 | ) | (2,188,320 | ) | | (39,864,048 | ) |
| Net increase (decrease) | (1,022,211 | ) | $ | (10,690,485 | ) | (1,001,175 | ) | $ | (17,999,696 | ) |
| Class C Shares: | | | | | | | | | | | |
| Six Months ended January 31, 2017 | | | | | | | | | | | |
| Shares sold | 65,760 | | $ | 697,691 | | 26,275 | | $ | 446,464 | |
| Shares issued in reinvestment of distributions | — | | | | — | | 91,684 | | | 1,467,863 | |
| Shares redeemed | (100,011 | ) | | (1,061,973 | ) | (234,747 | ) | | (4,022,918 | ) |
| Net increase (decrease) | (34,251 | ) | $ | (364,282 | ) | (116,788 | ) | $ | (2,108,591 | ) |
| Year ended July 31, 2016 | | | | | | | | | | | |
| Shares sold | 180,338 | | $ | 1,844,832 | | 76,096 | | $ | 1,398,430 | |
| Shares issued in reinvestment of distributions | — | | | | — | | 31,063 | | | 565,353 | |
| Shares redeemed | (207,695 | ) | | (2,084,625 | ) | (330,816 | ) | | (5,933,402 | ) |
| Net increase (decrease) | (27,357 | ) | $ | (239,793 | ) | (223,657 | ) | $ | (3,969,619 | ) |
| Class R Shares: | | | | | | | | | | | |
| Six Months ended January 31, 2017 | | | | | | | | | | | |
| Shares sold | 1,796 | | | $ | 19,503 | | 14,912 | | $ | 260,978 | |
| Shares issued in reinvestment of distributions | 28 | | | | 294 | | 19,026 | | | 308,025 | |
| Shares redeemed | (1,201 | ) | | (13,604 | ) | (101,150 | ) | | (1,761,499 | ) |
| Net increase (decrease) | 623 | | | $ | 6,193 | | (67,212 | ) | $ | (1,192,496 | ) |
| Year ended July 31, 2016 | | | | | | | | | | | |
| Shares sold | 7,433 | | | $ | 77,410 | | 42,617 | | $ | 782,563 | |
| Shares issued in reinvestment of distributions | 23 | | | | 244 | | 8,123 | | | 149,466 | |
| Shares redeemed | (13,299 | ) | | (141,742 | ) | (92,615 | ) | | (1,701,641 | ) |
| Net increase (decrease) | (5,843 | ) | $ | (64,088 | ) | (41,875 | ) | $ | (769,612 | ) |
franklintempleton.com
Semiannual Report 39
FRANKLIN GLOBAL TRUST
NOTES TO FINANCIAL STATEMENTS (UNAUDITED)
| | | | | | | | | | |
| 2. Shares of Beneficial Interest (continued) | | | | | | | | | | |
| |
| | Franklin International | | Franklin International | |
| | Growth Fund | | Small Cap Growth Fund | |
| | Shares | | | Amount | | Shares | | | Amount | |
| Class R6 Shares: | | | | | | | | | | |
| Six Months ended January 31, 2017 | | | | | | | | | | |
| Shares sold | 121,533 | | $ | 1,338,681 | | 5,015,106 | | $ | 87,650,572 | |
| Shares issued in reinvestment of distributions | 44,509 | | | 473,134 | | 2,201,724 | | | 35,535,834 | |
| Shares redeemed | (7,013,843 | ) | | (75,908,021 | ) | (3,575,823 | ) | | (62,866,396 | ) |
| Net increase (decrease) | (6,847,801 | ) | $ | (74,096,206 | ) | 3,641,007 | | $ | 60,320,010 | |
| Year ended July 31, 2016 | | | | | | | | | | |
| Shares sold | 868,195 | | $ | 8,780,940 | | 4,556,506 | | $ | 84,758,875 | |
| Shares issued in reinvestment of distributions | 58,126 | | | 612,647 | | 845,547 | | | 15,532,698 | |
| Shares redeemed | (2,170,008 | ) | | (22,745,557 | ) | (2,956,009 | ) | | (54,782,597 | ) |
| Net increase (decrease) | (1,243,687 | ) | $ | (13,351,970 | ) | 2,446,044 | | $ | 45,508,976 | |
| Advisor Class Shares: | | | | | | | | | | |
| Six Months ended January 31, 2017 | | | | | | | | | | |
| Shares sold | 797,356 | | $ | 8,734,758 | | 3,333,358 | | $ | 57,711,984 | |
| Shares issued in reinvestment of distributions | 6,201 | | | 65,975 | | 3,058,640 | | | 49,397,037 | |
| Shares redeemed | (1,221,650 | ) | | (13,234,721 | ) | (17,590,005 | ) | | (309,384,547 | ) |
| Net increase (decrease) | (418,093 | ) | $ | (4,433,988 | ) | (11,198,007 | ) | $ | (202,275,526 | ) |
| Year ended July 31, 2016 | | | | | | | | | | |
| Shares sold | 2,405,030 | | $ | 25,169,272 | | 8,690,236 | | $ | 159,644,505 | |
| Shares issued in reinvestment of distributions | 2,228 | | | 23,461 | | 2,273,840 | | | 41,770,430 | |
| Shares redeemed | (3,711,819 | ) | | (38,333,290 | ) | (28,962,897 | ) | | (516,457,551 | ) |
| Net increase (decrease) | (1,304,561 | ) | $ | (13,140,557 | ) | (17,998,821 | ) | $ | (315,042,616 | ) |
3. Transactions with Affiliates
Franklin Resources, Inc. is the holding company for various subsidiaries that together are referred to as Franklin Templeton Investments. Certain officers and trustees of the Trust are also officers and/or directors of the following subsidiaries:
| |
| Subsidiary | Affiliation |
| Franklin Advisers, Inc. (Advisers) | Investment manager |
| Franklin Templeton Institutional, LLC (FT Institutional) | Investment manager |
| Franklin Templeton Services, LLC (FT Services) | Administrative manager |
| Franklin Templeton Distributors, Inc. (Distributors) | Principal underwriter |
| Franklin Templeton Investor Services, LLC (Investor Services) | Transfer agent |
40 Semiannual Report
franklintempleton.com
FRANKLIN GLOBAL TRUST
NOTES TO FINANCIAL STATEMENTS (UNAUDITED)
a. Management Fees
Effective December 1, 2016, Franklin International Growth Fund pays an investment management fee to FT Institutional based on the average daily net assets of the Fund as follows:
| | |
| Annualized Fee Rate | | Net Assets |
| 0.760 | % | Up to and including $500 million |
| 0.740 | % | Over $500 million, up to and including $1 billion |
| 0.720 | % | Over $1 billion, up to and including $1.5 billion |
| 0.700 | % | Over $1.5 billion, up to and including $6.5 billion |
| 0.675 | % | Over $6.5 billion, up to and including $11.5 billion |
| 0.655 | % | Over $11.5 billion, up to and including $16.5 billion |
| 0.635 | % | Over $16.5 billion, up to and including $19 billion |
| 0.615 | % | Over $19 billion, up to and including $21.5 billion |
| 0.600 | % | In excess of $21.5 billion |
Prior to December 1, 2016, Franklin International Growth Fund paid fees to FT Institutional based on the average daily net assets of the Fund as follows:
| | |
| Annualized Fee Rate | | Net Assets |
| 0.950 | % | Up to and including $500 million |
| 0.850 | % | Over $500 million, up to and including $1 billion |
| 0.800 | % | Over $1 billion, up to and including $1.5 billion |
| 0.750 | % | Over $1.5 billion, up to and including $6.5 billion |
| 0.725 | % | Over $6.5 billion, up to and including $11.5 billion |
| 0.700 | % | Over $11.5 billion, up to and including $16.5 billion |
| 0.690 | % | Over $16.5 billion, up to and including $19 billion |
| 0.680 | % | Over $19 billion, up to and including $21.5 billion |
| 0.670 | % | In excess of $21.5 billion |
For the period ended January 31, 2017, the annualized effective investment management fee rate was 0.895% of the Fund’s average daily net assets.
Franklin International Small Cap Growth Fund pays an investment management fee to Advisers of 0.95% per year of the average daily net assets of the Fund.
Under a subadvisory agreement, FT Institutional, an affiliate of Advisers, provides subadvisory services to Franklin International Small Cap Growth Fund. The subadvisory fee is paid by Advisers based on the Fund’s average daily net assets, and is not an additional expense of the Fund.
b. Administrative Fees
Under an agreement with FT Institutional and Advisers, FT Services provides administrative services to the Funds. The fee is paid by FT Institutional and Advisers based on each of the Fund’s average daily net assets, and is not an additional expense of the Funds.
c. Distribution Fees
The Board has adopted distribution plans for each share class, with the exception of Class R6 and Advisor Class shares, pursuant to Rule 12b-1 under the 1940 Act. Under the Funds’ Class A reimbursement distribution plans, the Funds reimburse Distributors for costs incurred in connection with the servicing, sale and distribution of each Fund’s shares up to the maximum annual plan rate for
franklintempleton.com
Semiannual Report 41
FRANKLIN GLOBAL TRUST
NOTES TO FINANCIAL STATEMENTS (UNAUDITED)
| 3. | Transactions with Affiliates (continued) |
| c. | Distribution Fees (continued) |
each class. Under the Class A reimbursement distribution plans, costs exceeding the maximum for the current plan year cannot be reimbursed in subsequent periods. In addition, under the Funds’ Class C and R compensation distribution plans, the Funds pay Distributors for costs incurred in connection with the servicing, sale and distribution of each Fund’s shares up to the maximum annual plan rate for each class. The plan year, for purposes of monitoring compliance with the maximum annual plan rate, is February 1 through January 31 for each Fund.
| | | | |
| The maximum annual plan rates, based on the average daily net assets, for each class, are as follows: | | | |
| |
| | | | Franklin | |
| | Franklin | | International | |
| | International | | Small Cap | |
| | Growth Fund | | Growth Fund | |
| |
| Reimbursement Plans: | | | | |
| Class A. | 0.35 | % | 0.35 | % |
| Compensation Plans: | | | | |
| Class C. | 1.00 | % | 1.00 | % |
| Class R. | 0.50 | % | 0.50 | % |
The Board has set the current rate at 0.25% per year for Class A shares, until further notice and approval by the Board.
d. Sales Charges/Underwriting Agreements
Front-end sales charges and contingent deferred sales charges (CDSC) do not represent expenses of the Funds. These charges are deducted from the proceeds of sales of fund shares prior to investment or from redemption proceeds prior to remittance, as applicable. Distributors has advised the Funds of the following commission transactions related to the sales and redemptions of the Funds’ shares for the period:
| | | | |
| | | | | Franklin |
| | | Franklin | | International |
| | | International | | Small Cap |
| | | Growth Fund | | Growth Fund |
| |
| Sales charges retained net of commissions paid to | | | | |
| unaffiliated brokers/dealers | $ | 8,667 | $ | 5,496 |
| CDSC retained | $ | 721 | $ | 733 |
| |
| e. Transfer Agent Fees | | | | |
Each class of shares, except for Class R6, pays transfer agent fees to Investor Services for its performance of shareholder servicing obligations and reimburses Investor Services for out of pocket expenses incurred, including shareholder servicing fees paid to third parties. These fees are allocated daily based upon their relative proportion of such classes’ aggregate net assets. Class R6 pays Investor Services transfer agent fees specific to that class.
For the period ended January 31, 2017, the Funds paid transfer agent fees as noted in the Statements of Operations of which the following amounts were retained by Investor Services:
| | | | |
| | | | | Franklin |
| | | Franklin | | International |
| | | International | | Small Cap |
| | | Growth Fund | | Growth Fund |
| |
| Transfer agent fees | $ | 342,816 | $ | 376,724 |
42 Semiannual Report
franklintempleton.com
FRANKLIN GLOBAL TRUST
NOTES TO FINANCIAL STATEMENTS (UNAUDITED)
f. Investments in Affiliated Management Investment Companies
Certain or all Funds invest in one or more affiliated management investment companies for purposes other than exercising a controlling influence over the management or policies. Management fees paid by the Funds are waived on assets invested in the affiliated management investment companies, as noted in the Statements of Operations, in an amount not to exceed the management and administrative fees paid directly or indirectly by each affiliate. Prior to August 1, 2013, the waiver was accounted for as a reduction to management fees. During the period ended January 31, 2017, certain or all Funds held investments in affiliated management investment companies as follows:
| | | | | | | | | | | | |
| | | | | | | | | | | | % of | |
| | | | | | | | | | | | Affiliated | |
| | Number of | | | | Number of | | | | | | Fund Shares | |
| | Shares Held | | | | Shares | | Value | | | | Outstanding | |
| | at Beginning | Gross | Gross | | Held at End | | at End | | Investment | Realized | Held at End | |
| | of Period | Additions | Reductions | | of Period | | of Period | | Income | Gain (Loss) | of Period | |
| |
| Franklin International Growth Fund | | | | | | | | | | | | |
| Non-Controlled Affiliates | | | | | | | | | | | | |
| Institutional Fiduciary Trust Money Market | | | | | | | | | | | | |
| Portfolio, 0.15% | 5,411,318 | 69,470,227 | (66,934,868 | ) | 7,946,677 | $ | 7,946,677 | $ | 994 | $ – | 0.1 | % |
| |
| |
| g. Waiver and Expense Reimbursements | | | | | | | | | | | |
Effective December 1, 2016, FT Institutional and Investor Services have contractually agreed in advance to waive or limit their respective fees and to assume as their own expense certain expenses otherwise payable by Franklin International Growth Fund so that the expenses (excluding distribution fees, and acquired fund fees and expenses) for Class A, Class C, Class R and Advisor Class of the Fund does not exceed 1.00% and Class R6 does not exceed 0.82% based on the average net assets of each class (other than certain non-routine expenses or costs, including those relating to litigation, indemnification, reorganizations, and liquidations) until November 30, 2017. Prior to December 1, 2016, expenses for Class A, Class C, Class R and Advisor Class were limited to 1.19% and expenses for Class R6 were limited to 1.00%. Total expenses waived or paid are not subject to recapture subsequent to the Fund’s fiscal year end.
Additionally, Investor Services has contractually agreed in advance to waive or limit its fees so that the Class R6 transfer agent fees do not exceed 0.01% until November 30, 2017. For Franklin International Small Cap Growth Fund, there were no Class R6 transfer agent fees waived during the period ended January 31, 2017.
h. Other Affiliated Transactions
At January 31, 2017, one or more of the funds in Franklin Fund Allocator Series owned 24.5% of Franklin International Small Cap Growth Fund’s outstanding shares.
4. Expense Offset Arrangement
The Funds have entered into an arrangement with their custodian whereby credits realized as a result of uninvested cash balances are used to reduce a portion of the Funds’ custodian expenses. During the period ended January 31, 2017, the custodian fees were reduced as noted in the Statements of Operations.
franklintempleton.com
Semiannual Report 43
FRANKLIN GLOBAL TRUST
NOTES TO FINANCIAL STATEMENTS (UNAUDITED)
5. Income Taxes
For tax purposes, capital losses may be carried over to offset future capital gains, if any. At July 31, 2016, the capital loss carryforwards were as follows:
| | |
| | | Franklin |
| | | International |
| | | Growth Fund |
| Capital loss carryforwards: | | |
| Short term | $ | 5,006,647 |
| Long term | | 11,506,031 |
| Total capital loss carryforwards | $ | 16,512,678 |
At January 31, 2017, the cost of investments and net unrealized appreciation (depreciation) for income tax purposes were as follows:
| | | | | | |
| | | | | | Franklin | |
| | | Franklin | | | International | |
| | | International | | | Small Cap | |
| | | Growth Fund | | | Growth Fund | |
| |
| Cost of investments | $ | 296,655,676 | | $ | 1,256,613,858 | |
| |
| Unrealized appreciation | $ | 57,429,141 | | $ | 142,714,151 | |
| Unrealized depreciation | | (27,903,154 | ) | | (184,236,983 | ) |
| Net unrealized appreciation (depreciation) | $ | 29,525,987 | | $ | (41,522,832 | ) |
Differences between income and/or capital gains as determined on a book basis and a tax basis are primarily due to differing treatments of foreign currency transactions, passive foreign investment company shares and wash sales.
6. Investment Transactions
Purchases and sales of investments (excluding short term securities) for the period ended January 31, 2017, were as follows:
| | | | |
| | | | | Franklin |
| | | Franklin | | International |
| | | International | | Small Cap |
| | | Growth Fund | | Growth Fund |
| |
| Purchases | $ | 64,959,767 | $ | 104,360,016 |
| Sales. | $ | 152,378,880 | $ | 345,696,221 |
7. Concentration of Risk
Investing in foreign securities may include certain risks and considerations not typically associated with investing in U.S. securities, such as fluctuating currency values and changing local and regional economic, political and social conditions, which may result in greater market volatility. In addition, certain foreign securities may not be as liquid as U.S. securities.
44 Semiannual Report
franklintempleton.com
FRANKLIN GLOBAL TRUST
NOTES TO FINANCIAL STATEMENTS (UNAUDITED)
8. Holdings of 5% Voting Securities of Portfolio Companies
The 1940 Act defines "affiliated companies" to include investments in portfolio companies in which a fund owns 5% or more of the outstanding voting securities. During the period ended January 31, 2017, certain or all Funds held investments in “affiliated companies” as follows:
| | | | | | | | | | | | | |
| | Number of | | | | | Number of | | | | | | | |
| | Shares Held | | | | | Shares | | Value at | | | | | |
| | at Beginning | Gross | | Gross | | Held at End | | End of | | Investment | | Realized | |
| Name of Issuer | of Period | Additions | | Reductions | | of Period | | Period | | Income | | Gain (Loss) | |
| Franklin International Small Cap Growth Fund | | | | | | | | | | | | |
| Non-Controlled Affiliates | | | | | | | | | | | | | |
| Aderans Co. Ltd | 3,568,500 | — | | (3,568,500 | ) | — | $ | — | $ | — | $ | (25,596,842 | ) |
| Carpetright PLC | 6,064,925 | — | | — | | 6,064,925 | | 14,436,291 | | — | | — | |
| Clarkson PLC. | 1,929,420 | — | | (68,200 | ) | 1,861,220 | | 54,778,215 | | 566,098 | | (1,084,350 | ) |
| Diana Shipping Inc | 7,909,500 | — | | — | | 7,909,500 | | 32,745,330 | | — | | — | |
| Headlam Group PLC. | 5,372,888 | — | | — | | 5,372,888 | | 36,694,580 | | 450,267 | | — | |
| Irish Residential Properties REIT | | | | | | | | | | | | | |
| PLC | 31,125,000 | — | | (3,110,300 | ) | 28,014,700 | | 35,077,318 | | — | | (579,902 | ) |
| Lar Espana Real Estate Socimi | | | | | | | | | | | | | |
| SA | 4,593,500 | 2,271,510 | a | (507,800 | ) | 6,357,210 | | 48,280,839 | | — | | (3,036,675 | ) |
| Lar Espana Real Estate Socimi | | | | | | | | | | | | | |
| SA (interim line) | 2,271,510 | — | | (2,271,510 | )b | — | | — | | — | | — | |
| Morgan Sindall Group PLC | 2,498,900 | — | | (412,400 | ) | 2,086,500 | | —c | | 396,764 | | (1,186,718 | ) |
| Total Affiliated Securities (Value is 18.3% of Net Assets) | | | | | $ | 222,012,573 | $ | 1,413,129 | $ | (31,484,487 | ) |
aGross addition was the result of a corporate action.
bGross reduction was the result of a corporate action.
cAs of January 31, 2017, no longer an affiliate.
9. Credit Facility
The Funds, together with other U.S. registered and foreign investment funds (collectively, Borrowers), managed by Franklin Templeton Investments, are borrowers in a joint syndicated senior unsecured credit facility totaling $2 billion (Global Credit Facility) which matured on February 10, 2017. This Global Credit Facility provides a source of funds to the Borrowers for temporary and emergency purposes, including the ability to meet future unanticipated or unusually large redemption requests. Effective February 10, 2017, the Borrowers renewed the Global Credit Facility for a one year term, maturing February 9, 2018, for a total of $2 billion.
Under the terms of the Global Credit Facility, the Funds shall, in addition to interest charged on any borrowings made by the Funds and other costs incurred by the Funds, pay their share of fees and expenses incurred in connection with the implementation and maintenance of the Global Credit Facility, based upon their relative share of the aggregate net assets of all of the Borrowers, including an annual commitment fee of 0.15% based upon the unused portion of the Global Credit Facility. These fees are reflected in other expenses in the Statements of Operations. During the period ended January 31, 2017, the Funds did not use the Global Credit Facility.
franklintempleton.com
Semiannual Report 45
FRANKLIN GLOBAL TRUST
NOTES TO FINANCIAL STATEMENTS (UNAUDITED)
10. Fair Value Measurements
The Funds follow a fair value hierarchy that distinguishes between market data obtained from independent sources (observable inputs) and the Funds’ own market assumptions (unobservable inputs). These inputs are used in determining the value of the Funds’ financial instruments and are summarized in the following fair value hierarchy:
- Level 1 – quoted prices in active markets for identical financial instruments
- Level 2 – other significant observable inputs (including quoted prices for similar financial instruments, interest rates, prepayment speed, credit risk, etc.)
- Level 3 – significant unobservable inputs (including the Funds’ own assumptions in determining the fair value of financial instruments)
The input levels are not necessarily an indication of the risk or liquidity associated with financial instruments at that level.
For movements between the levels within the fair value hierarchy, the Funds have adopted a policy of recognizing the transfers as of the date of the underlying event which caused the movement.
A summary of inputs used as of January 31, 2017, in valuing the Funds’ assets carried at fair value, is as follows:
| | | | | | | | |
| | | Level 1 | | Level 2 | | Level 3 | | Total |
| Franklin International Growth Fund | | | | | | | | |
| Assets: | | | | | | | | |
| Investments in Securities: | | | | | | | | |
| Equity Investmentsa | $ | 318,234,986 | $ | — | $ | —b | $ | 318,234,986 |
| Short Term Investments | | 7,946,677 | | — | | — | | 7,946,677 |
| Total Investments in Securities | $ | 326,181,663 | $ | — | $ | — | $ | 326,181,663 |
| |
| Franklin International Small Cap Growth Fund | | | | | | | | |
| Assets: | | | | | | | | |
| Investments in Securities: | | | | | | | | |
| Equity Investmentsa | $ | 1,210,891,026 | $ | — | $ | — | $ | 1,210,891,026 |
| Short Term Investments | | — | | 4,200,000 | | — | | 4,200,000 |
| Total Investments in Securities | $ | 1,210,891,026 | $ | 4,200,000 | $ | — | $ | 1,215,091,026 |
aFor detailed categories, see the accompanying Statement of Investments.
bIncludes securities determined to have no value at January 31, 2017.
11. Investment Company Reporting Modernization
In October 2016, the U.S. Securities and Exchange Commission adopted new rules and amended existing rules (together, final rules) intended to modernize the reporting and disclosure of information by registered investment companies. In part, the final rules amend Regulation S-X and require standardized, enhanced disclosures about derivatives in investment company financial statements, as well as other amendments. The compliance date for the amendments to Regulation S-X is August 1, 2017. Management is currently evaluating the impact that the adoption of the amendments to Regulation S-X will have on the Funds’ financial statements and related disclosures.
12. Subsequent Events
The Funds have evaluated subsequent events through the issuance of the financial statements and determined that no events have occurred that require disclosure other than those already disclosed in the financial statements.
46 Semiannual Report
franklintempleton.com
FRANKLIN GLOBAL TRUST
NOTES TO FINANCIAL STATEMENTS (UNAUDITED)
| |
| Abbreviations |
| Selected Portfolio |
| ADR | American Depositary Receipt |
| REIT | Real Estate Investment Trust |
franklintempleton.com
Semiannual Report 47
FRANKLIN GLOBAL TRUST
Shareholder Information
Proxy Voting Policies and Procedures
The Trust’s investment manager has established Proxy Voting Policies and Procedures (Policies) that the Trust uses to determine how to vote proxies relating to portfolio securities. Shareholders may view the Trust’s complete Policies online at franklintempleton.com. Alternatively, shareholders may request copies of the Policies free of charge by calling the Proxy Group collect at (954) 527-7678 or by sending a written request to: Franklin Templeton Companies, LLC, 300 S.E. 2nd Street, Fort Lauderdale, FL 33301, Attention: Proxy Group. Copies of the Trust’s proxy voting records are also made available online at franklintempleton.com and posted on the U.S. Securities and Exchange Commission’s website at sec.gov and reflect the most recent 12-month period ended June 30.
Quarterly Statement of Investments
The Trust files a complete statement of investments with the U.S. Securities and Exchange Commission for the first and third quarters for each fiscal year on Form N-Q. Shareholders may view the filed Form N-Q by visiting the Commission’s website at sec.gov. The filed form may also be viewed and copied at the Commission’s Public Reference Room in Washington, DC. Information regarding the operations of the Public Reference Room may be obtained by calling (800) SEC-0330.
48 Semiannual Report
franklintempleton.com

| |
| Contents | |
| |
| Semiannual Report | |
| Franklin Emerging Market Debt Opportunities Fund | 2 |
| Performance Summary | 6 |
| Your Fund's Expenses | 8 |
| Consolidated Financial Highlights and Consolidated | |
| Statement of Investments | 9 |
| Consolidated Financial Statements | 15 |
| Notes to Consolidated Financial Statements | 19 |
| Shareholder Information | 31 |
Semiannual Report
Franklin Emerging Market Debt Opportunities Fund
We are pleased to bring you Franklin Emerging Market Debt Opportunities Fund’s semiannual report for the period ended January 31, 2017.
Your Fund’s Goal and Main Investments
The Fund seeks high total return through investing at least 80% of its net assets in debt securities of emerging market countries—mainly securities issued by sovereign and subsovereign government entities, but also including securities issued by corporate entities that are controlled by a sovereign entity, and corporate emerging market debt.
Performance Overview
The Fund delivered a +3.97% cumulative total return for the six months under review. In comparison, the Fund’s first benchmark, the J.P. Morgan (JPM) Emerging Markets Bond Index (EMBI) Global Diversified Index, which tracks total returns for U.S. dollar-denominated debt instruments issued by emerging market sovereign and quasi-sovereign entities, had a total return of -0.50%,1 and the Fund’s second benchmark, the JPM Government Bond Index-Emerging Markets (GBI-EM) Broad Diversified Index (US$ Unhedged), which tracks local currency bonds issued in emerging markets, had a -1.43% total return.2 Also for comparison, the Fund’s third benchmark, the Bank of America Merrill Lynch (BofAML) Emerging Markets Corporate Plus (EMCB) Index (100% US$ Hedged), which tracks the performance of U.S. dollar-denominated and euro-denominated emerging market non-sovereign debt publicly issued within the major domestic and Eurobond markets, posted a +1.07% total return.1 You can find more of the Fund’s performance data in the Performance Summary beginning on page 6.

*Figures reflect certain derivatives held in the portfolio (or their underlying reference
assets) and may not total 100% or may be negative due to rounding, use of
derivatives, unsettled trades or other factors.
**Includes securities determined to have no value at 1/31/17.
Performance data represent past performance, which does not guarantee future results. Investment return and principal value will fluctuate, and you may have a gain or loss when you sell your shares. Current performance may differ from figures shown. For most recent month-end performance, go to ftinstitutional.com or call a Franklin Templeton Institutional Services representative at (800) 321-8563.
Economic and Market Overview
The six-month period under review started with good omens for emerging market (EM) debt. Concerns about the impact of slowing world growth receded, economic data suggested that China’s slowdown was gradual rather than a hard landing, and monetary policy stayed dovish in both developed economies and emerging markets. Commodity prices stabilized, with oil
1. Source: Morningstar.
2. Source: J.P. Morgan.
The indexes are unmanaged and include reinvested interest. They do not reflect any fees, expenses or sales charges. One cannot invest directly in an index and an index is not
representative of the Fund’s portfolio.
See www.franklintempletondatasources.com for additional data provider information.
The dollar value, number of shares or principal amount, and names of all portfolio holdings are listed in the Fund’s Consolidated Statement of
Investments (SOI). The Consolidated SOI begins on page 10.
2 Semiannual Report
ftinstitutional.com
FRANKLIN EMERGING MARKET DEBT OPPORTUNITIES FUND
more stable at around US$50 per barrel. EM bonds prospered in what many considered to be a favorable environment.
However, significant challenges appeared in the final quarter of 2016, mainly because of ripples caused by the U.S. Donald Trump’s surprise election victory as U.S. president raised hopes for greater fiscal stimulus, but also led to sharply higher U.S. Treasury yields, and many investors viewed his announcements on trade with caution. On the monetary front, the U.S. Federal Reserve finally went ahead with its second interest-rate hike in just over a decade. The U.S. dollar posted significant gains, with corresponding volatility among EM currencies. EM bonds surrendered the gains they had posted at the beginning of the period, but stabilized nearer the end of the year, as spreads compressed. Many emerging markets found some support from higher oil prices as the result of a November agreement among Organization of Petroleum Exporting Countries (OPEC) members.
Over the six-month period, 10-year U.S. Treasury yields—the pricing benchmark for U.S. dollar-denominated EM bonds—increased 99 basis points (bps) higher, to 2.45%, and EM sovereign risk spreads mostly narrowed. Hard currency-denominated EM sovereign bonds returned -0.50% during the period, as measured by the JPM EMBI Global Diversified Index.1 Local-currency sovereign EM bonds had a return of -1.43%, as measured by the JPM GBI-EM Broad Diversified Index (US$ Unhedged), undermined by a number of weaker EM currencies.2 U.S. dollar- and euro-denominated EM corporate bonds delivered a return of +1.07%, as measured by the BofAML EMCB Index (100% US$ Hedged), as corporate risk spreads narrowed significantly.1
Investment Strategy
Our portfolio construction process can be summarized in three integral steps—country allocation, currency allocation and issue selection. The first stage of our emerging market debt investment process is identifying the countries for which we have a favorable outlook, which we manage with a bottom-up, research-driven perspective. Since the portfolio is constructed through bottom-up, fundamental research and not relative to a benchmark index, there is no requirement to hold issues from any one country. The next decision is whether to take exposure in the form of “hard currency” or local currency instruments. Hard currencies are typically currencies of economically and politically stable industrialized nations. The last decision concerns security selection. This depends on a number of factors, including the type of the issue’s coupon (fixed or floating). We may seek to manage the Fund’s exposure to various currencies, and may from time to time seek to hedge
| |
| Geographic Composition* | |
| 1/31/17 | |
| | % of Total |
| Country | Net Assets |
| Ukraine | 6.2 |
| Brazil | 5.3 |
| Colombia | 5.2 |
| South Africa | 4.5 |
| Nigeria | 4.5 |
| Iraq | 4.5 |
| Angola | 3.8 |
| Argentina | 3.6 |
| Ghana | 3.5 |
| Venezuela | 3.5 |
| Russia | 3.2 |
| Chad | 3.2 |
| Azerbaijan | 3.2 |
| Mexico | 3.0 |
| Uruguay | 2.8 |
| EI Salvador | 2.6 |
| Armenia | 2.2 |
| Ethiopia | 2.0 |
| Seychelles | 1.9 |
| Georgia | 1.9 |
| Tunisia | 1.9 |
| Mongolia | 1.8 |
| Cameroon | 1.8 |
| Gabon | 1.6 |
| Other | 15.4 |
| Short-Term Investments & Other Net Assets | 6.9 |
*Figures reflect certain derivatives held in the portfolio (or their underlying reference
assets) and may not total 100% or may be negative due to rounding, use of
derivatives, unsettled trades or other factors. May differ from the Consolidated SOI
because percentages reflect the issuing country of the Fund’s long-term securities
and include the effect of interest receivable balances.
(protect) against currency risk through the use of derivative currency transactions, including currency forward contracts.
What is a currency forward contract?
A currency forward contract is an agreement between the Fund and a counterparty to buy or sell a foreign currency in exchange for another currency at a specific exchange rate on a future date.
Manager’s Discussion
During the reporting period, the Fund delivered positive results and outperformed many categories of emerging market debt including hard currency-denominated sovereign bonds, local-currency sovereign bonds and U.S. dollar- and euro-denominated corporate bonds.
ftinstitutional.com
Semiannual Report 3
FRANKLIN EMERGING MARKET DEBT OPPORTUNITIES FUND
The Fund’s position in U.S. dollar-denominated oil certificates issued by Venezuela was a major contributor during the period. State oil company Petróleos de Venezuela launched an offer to extend its short-term debt, which the Fund does not own. In our opinion, the possibility of the company defaulting on its debt could become less likely if the proposed exchange is successful. Helped by rising oil prices, the offer boosted the value of Venezuela’s other U.S.-dollar debt, including the certificates owned by the Fund, even though the country’s economy continued to languish.
Currency Composition*
1/31/17
| | |
| | % of Total | |
| Currency | Net Assets | |
| U.S. Dollar | 77.3 | % |
| Colombian Peso | 3.1 | % |
| Mexican Peso | 3.0 | % |
| South African Rand | 2.9 | % |
| Turkish Lira | 2.9 | % |
| Uruguayan Peso | 2.8 | % |
| Russian Ruble | 2.1 | % |
| Ghanaian Cedi | 1.7 | % |
| Kenyan Shilling | 1.4 | % |
| Ugandan Shilling | 1.4 | % |
| Indian Rupee | 0.6 | % |
| Azerbaijan Manat | 0.4 | % |
| Brazilian Real | 0.4 | % |
| Peruvian Nuevo Sol | 0.3 | % |
| Japanese Yen** | – | |
| Euro | -0.3 | % |
*Figures reflect certain derivatives held in the portfolio (or their underlying reference
assets) and may not total 100% or may be negative due to rounding, use of
derivatives, unsettled trades or other factors. Percentages may differ from the
Consolidated SOI due to the underlying currency exposure on pass-through notes
and currency forward contracts and include the effect of interest receivable
balances.
**Rounds to less than 0.1% of total net assets.
The Fund’s holdings of Iraqi sovereign U.S.-dollar debt also contributed to returns. In July, the International Monetary Fund approved a US$5.3 billion package to support the country, and an agreement among OPEC members reached in late November lifted oil prices to their highest level for the year. At the end of 2016, some reports indicated that Iraq was exporting record amounts of oil from its southern ports.
U.S.-dollar bonds issued by Ukrainian mining company Ferrexpo also lifted the Fund’s results, based on rising prices for iron ore. The company reported strong results for the first half of 2016, thanks to operational improvements, favorable fuel prices and the lower Ukrainian hryvnia. The company also paid down its bank debt in the first half of 2016, and hinted at the availability of further bank loans by the time its 50% repayment on the outstanding bond falls due, in April 2018.
Top 10 Holdings*
1/31/17
| | |
| Issue | % of Total | |
| Sector, Country | Net Assets | |
| Government of Angola** | 3.8 | % |
| Loan Participations & Assignments, Angola | | |
| Government of Venezuela*** | 3.5 | % |
| Foreign Government & Agency Securities, Venezuela | | |
| Societe des Hydrocarbures du Tchad | 3.2 | % |
| Loan Participations & Assignments, Chad | | |
| Government of Iraq**** | 2.9 | % |
| Foreign Government & Agency Securities, Iraq | | |
| Government of South Africa | 2.9 | % |
| Foreign Government & Agency Securities, South Africa | | |
| Government of Uruguay | 2.8 | % |
| Foreign Government & Agency Securities, Uruguay | | |
| Government of El Salvador | 2.6 | % |
| Foreign Government & Agency Securities, El Salvador | | |
| SSB No. 1 PLC (OJSC State Savings Bank of Ukraine) | 2.2 | % |
| Loan Participations & Assignments, Ukraine | | |
| Fidelity Bank PLC | 2.1 | % |
| Quasi-Sovereign & Corporate Bonds, Nigeria | | |
| Government of Russia | 2.1 | % |
| Quasi-Sovereign & Corporate Bonds, Russia | | |
*May differ from the Consolidated SOI because percentages include the effect of
interest receivable balances.
**Includes foreign government and agency securities.
***Includes warrants.
****Includes loan participations and assignments.
The Fund’s exposure to the Turkish lira was a major detractor from returns during the period. The country’s economy shrank in the third quarter of 2016, and the Turkish government’s crackdown after July’s failed military coup triggered a series of downward steps in the lira’s value. At the same time, Turkey’s security situation deteriorated as a result of multiple terrorist attacks, and political wrangling continued over a new constitution and over Kurdish representation in parliament.
The Fund’s holding of Salvadoran U.S.-dollar bonds also detracted from performance, as the country’s fiscal situation continued to deteriorate. In addition, benchmark U.S. Treasury yields rose substantially, and then-U.S. President-elect Trump’s threats to reduce imports from Latin America, intercept foreign workers’ remittances and limit immigration into the U.S.
4 Semiannual Report
ftinstitutional.com
FRANKLIN EMERGING MARKET DEBT OPPORTUNITIES FUND
hampered investors’ expectations for El Salvador’s economy. Over the course of the review period, credit rating agencies Moody’s Investors Service cut El Salvador’s sovereign rating from Ba3 to B3 and Standard & Poor’s downgraded El Salvador from B+ to B-.
The Fund’s exposure to the Mexican peso detracted from returns as well. Higher U.S. Treasury yields undermined investor expectations for emerging market bonds worldwide, and many investors consider the liquid Mexican peso the most straightforward way to express that view. President Trump’s announcements about trade, immigration and remittances also damaged investor projections for the Mexican economy.
We thank you for your confidence in Franklin Emerging Market Debt Opportunities Fund and hope to serve your investment needs at the highest level of expectations.

The foregoing information reflects our analysis, opinions and portfolio holdings as of January 31, 2017, the end of the reporting period. The way we implement our main investment strategies and the resulting portfolio holdings may change depending on factors such as market and economic conditions. These opinions may not be relied upon as investment advice or an offer for a particular security. The information is not a complete analysis of every aspect of any market, country, industry, security or the Fund. Statements of fact are from sources considered reliable, but the investment manager makes no representation or warranty as to their completeness or accuracy. Although historical performance is no guarantee of future results, these insights may help you understand our investment management philosophy.
CFA® is a trademark owned by CFA Institute.
ftinstitutional.com
Semiannual Report 5
FRANKLIN EMERGING MARKET DEBT OPPORTUNITIES FUND
Performance Summary as of January 31, 2017
The performance table does not reflect any taxes that a shareholder would pay on Fund dividends, capital gain distributions, if any, or any realized gains on the sale of Fund shares. Total return reflects reinvestment of the Fund’s dividends and capital gain distributions, if any, and any unrealized gains or losses.
| | | | |
| Performance as of 1/31/171 | | | | |
| | Cumulative | | Average Annual | |
| | Total Return2 | | Total Return3 | |
| 6-Month | +3.97 | % | +3.97 | % |
| 1-Year | +17.39 | % | +17.39 | % |
| 5-Year | +27.18 | % | +4.93 | % |
| 10-Year | +91.68 | % | +6.72 | % |
Performance data represent past performance, which does not guarantee future results. Investment return and principal value will fluctuate, and you may have a gain or loss when you sell your shares. Current performance may differ from figures shown. For most recent month-end performance, go to ftinstitutional.com or call a Franklin Templeton Institutional Services representative at
(800) 321-8563.
See page 7 for Performance Summary footnotes.
6 Semiannual Report
ftinstitutional.com
| | | |
| | | FRANKLIN EMERGING MARKET DEBT OPPORTUNITIES FUND | |
| | | PERFORMANCE SUMMARY | |
| |
| Total Annual Operating Expenses4 | | | |
| With Waiver | | Without Waiver | |
| 1.01 | % | 1.09 | % |
All investments involve risks, including possible loss of principal. Special risks are associated with foreign investing including currency volatility, economic
instability, and social and political developments of countries where the Fund invests. Investments in emerging markets involve heightened risks related to the
same factors, in addition to those associated with these markets’ smaller size, lesser liquidity and lack of established legal, political, business and social
frameworks to support securities markets. The risks associated with higher yielding, lower rated securities include higher risk of default and loss of principal. In
addition, interest rate movements will affect the Fund’s share price and yield. Prices of debt securities generally move in the opposite direction of interest rates.
Thus, as prices of debt securities in the Fund adjust to a rise in interest rates, the Fund’s share price may decline. The Fund is actively managed but there is no
guarantee that the manager’s investment decisions will produce the desired results. The Fund’s prospectus also includes a description of the main investment
risks.
1. The Fund has an expense reduction, a waiver related to the management fee paid by a Fund subsidiary and a fee waivers associated with any investments it makes in a
Franklin Templeton money fund and/or other Franklin Templeton fund, contractually guaranteed through 11/30/17. Fund investment results reflect the expense reduction and fee
waivers; without these reductions, the results would have been lower.
2. Cumulative total return represents the change in value of an investment over the periods indicated.
3. Average annual total return represents the average annual change in value of an investment over the periods indicated. Return for less than one year, ifany,hasnotbeen
annualized.
4. Figures are as stated in the Fund’s current prospectus and may differ from the expense ratios disclosed in the Your Fund’s Expenses and Consolidated Financial Highlights
in this report. In periods of market volatility, assets may decline significantly, causing total annual Fund operating expenses to become higher than the figures shown.
ftinstitutional.com
Semiannual Report 7
FRANKLIN EMERGING MARKET DEBT OPPORTUNITIES FUND
Your Fund’s Expenses
As a Fund shareholder, you can incur two types of costs: (1) transaction costs, including sales charges (loads) on Fund purchases and redemptions, if applicable; and (2) ongoing Fund costs, including management fees, distribution and service (12b-1) fees, if applicable, and other Fund expenses. All mutual funds have ongoing costs, sometimes referred to as operating expenses. The table below shows ongoing costs of investing in the Fund and can help you understand these costs and compare them with those of other mutual funds. The table assumes a $1,000 investment held for the six months indicated.
Actual Fund Expenses
The table below provides information about actual account values and actual expenses in the columns under the heading “Actual.” In these columns the Fund’s actual return, which includes the effect of Fund expenses, is used to calculate the “Ending Account Value.” You can estimate the expenses you paid during the period by following these steps (of course, your account value and expenses will differ from those in this illustration): Divide your account value by $1,000 (if your account had an $8,600 value, then $8,600 ÷ $1,000 = 8.6). Then multiply the result by the number in the row for your class of shares under the headings “Actual” and “Expenses Paid During Period” (if Actual Expenses Paid During Period were $7.50, then 8.6 x $7.50 = $64.50). In this illustration, the actual expenses paid this period are $64.50.
Hypothetical Example for Comparison with Other Funds
Under the heading “Hypothetical” in the table, information is provided about hypothetical account values and hypothetical expenses based on the Fund’s actual expense ratio and an assumed rate of return of 5% per year before expenses, which is not the Fund’s actual return. This information may not be used to estimate the actual ending account balance or expenses you paid for the period, but it can help you compare ongoing costs of investing in the Fund with those of other funds. To do so, compare this 5% hypothetical example for the class of shares you hold with the 5% hypothetical examples that appear in the shareholder reports of other funds.
Please note that expenses shown in the table are meant to highlight ongoing costs and do not reflect any transactional costs. Therefore, information under the heading “Hypothetical” is useful in comparing ongoing costs only, and will not help you compare total costs of owning different funds. In addition, if transactional costs were included, your total costs would have been higher.
| | | | | | | | | | | |
| | | | | | Actual | | | | Hypothetical | | |
| | | | (actual return after expenses) | | (5% annual return before expenses) | | |
| |
| | | | | | Fund-Level | | | | Fund-Level | | |
| | | | | | Expenses | | | | Expenses | Net | |
| | Beginning | | Ending | | Paid During | | Ending | | Paid During | Annualized | |
| | Account | | Account | | Period | | Account | | Period | Expense | |
| | Value 8/1/16 | | Value 1/31/17 | | 8/1/16–1/31/171,2 | | Value 1/31/17 | | 8/1/16–1/31/171,2 | Ratio2 | |
| |
| $ | 1,000 | $ | 1,039.70 | $ | 5.14 | $ | 1,020.16 | $ | 5.09 | 1.00 | % |
1. Expenses are equal to the annualized expense ratio for the six-month period as indicated above—in the far right column—multiplied by the simple average account value
over the period indicated, and then multiplied by 184/365 to reflect the one-half year period.
2. Reflects expenses after fee waivers and expense reimbursements. Does not include acquired fund fees and expenses.
8 Semiannual Report
ftinstitutional.com
FRANKLIN GLOBAL TRUST
| | | | | | | | | | | | | | | | | | |
| Consolidated Financial Highlights | | | | | | | | | | | | | | | | | | |
| Franklin Emerging Market Debt Opportunities Fund | | | | | | | | | | | | | | | | |
| | | Six Months Ended | | | | | | | | | | | | | | | | |
| | | January 31, 2017 | | | | | | Year Ended July 31, | | | | |
| | | (unaudited) | | | 2016 | | | 2015 | | | 2014 | | | 2013 | | | 2012 | |
| Per share operating performance | | | | | | | | | | | | | | | | | | |
| (for a share outstanding throughout the period) | | | | | | | | | | | | | | | | | | |
| Net asset value, beginning of period | $ | 10.76 | | $ | 10.72 | | $ | 12.35 | | $ | 12.06 | | $ | 12.33 | | $ | 12.80 | |
| Income from investment operationsa: | | | | | | | | | | | | | | | | | | |
| Net investment incomeb | | 0.40 | | | 0.89 | | | 0.87 | | | 0.87 | | | 0.83 | | | 0.90 | |
| Net realized and unrealized gains (losses) | | 0.03 | | | (0.26 | ) | | (1.53 | ) | | 0.04 | | | (0.04 | ) | | (0.51 | ) |
| Total from investment operations | | 0.43 | | | 0.63 | | | (0.66 | ) | | 0.91 | | | 0.79 | | | 0.39 | |
| Less distributions from: | | | | | | | | | | | | | | | | | | |
| Net investment income. | | — | | | (0.59 | ) | | (0.91 | ) | | (0.58 | ) | | (0.89 | ) | | (0.70 | ) |
| Net realized gains | | (0.08 | ) | | — | | | (0.06 | ) | | (0.04 | ) | | (0.17 | ) | | (0.16 | ) |
| Total distributions | | (0.08 | ) | | (0.59 | ) | | (0.97 | ) | | (0.62 | ) | | (1.06 | ) | | (0.86 | ) |
| Net asset value, end of period | $ | 11.11 | | $ | 10.76 | | $ | 10.72 | | $ | 12.35 | | $ | 12.06 | | $ | 12.33 | |
| |
| Total returnc | | 3.97 | % | | 6.41 | % | | (5.16 | )% | | 7.82 | % | | 6.40 | % | | 3.73 | % |
| |
| Ratios to average net assetsd | | | | | | | | | | | | | | | | | | |
| Expenses before waiver and payments by | | | | | | | | | | | | | | | | | | |
| affiliates | | 1.08 | % | | 1.06 | % | | 1.05 | % | | 1.10 | % | | 1.07 | % | | 1.09 | % |
| Expenses net of waiver and payments by | | | | | | | | | | | | | | | | | | |
| affiliates | | 1.00 | %e | | 1.00 | %e | | 1.00 | %e | | 1.00 | %e | | 1.00 | %e | | 1.00 | % |
| Net investment income | | 7.27 | % | | 8.70 | % | | 7.78 | % | | 7.29 | % | | 6.63 | % | | 7.52 | % |
| |
| Supplemental data | | | | | | | | | | | | | | | | | | |
| Net assets, end of period (000’s) | $ | 505,130 | | $ | 552,835 | | $ | 713,575 | | $ | 630,597 | | $ | 568,794 | | $ | 464,714 | |
| Portfolio turnover rate | | 14.14 | % | | 21.61 | % | | 17.56 | % | | 29.70 | % | | 30.95 | % | | 33.17 | % |
aThe amount shown for a share outstanding throughout the period may not correlate with the Consolidated Statement of Operations for the period due to the timing of sales
and repurchases of the Fund’s shares in relation to income earned and/or fluctuating fair value of the investments of the Fund.
bBased on average daily shares outstanding.
cTotal return is not annualized for periods less than one year.
dRatios are annualized for periods less than one year, except for non-recurring expenses, if any.
eBenefit of expense reduction rounds to less than 0.01%.
ftinstitutional.com The accompanying notes are an integral part of these consolidated financial statements. | Semiannual Report 9
FRANKLIN GLOBAL TRUST
| | | | | | | |
| | Consolidated Statement of Investments, January 31, 2017 (unaudited) | | | | |
| | Franklin Emerging Market Debt Opportunities Fund | | | | | | |
| | | | Country/ | | | | |
| | | | Organization | Warrants | | | Value |
| |
| | Warrants 2.7% | | | | | | |
| | a Central Bank of Nigeria, wts., 11/15/20 | | Nigeria | 64,000 | | $ | 5,312,000 |
| | b,c,d Government of Ukraine, Reg S, VRI, GDP Linked Security, | | | | | | |
| | 5/31/40 | | Ukraine | 7,700,000 | | | 2,277,853 |
| | a Government of Venezuela, Oil Value Recovery wts., 4/15/20 | | Venezuela | 925,920 | | | 6,249,960 |
| | Total Warrants (Cost $31,791,416) | | | | | | 13,839,813 |
| |
| |
| | | | | Principal | | | |
| | | | | Amount* | | | |
| |
| Quasi-Sovereign and Corporate Bonds 33.1% | | | | | | |
| | Banks 7.5% | | | | | | |
| | e,f Astana Finance JSC, secured note, 144A, zero cpn., 12/22/24 | | Kazakhstan | 136,566 | | | 1,366 |
| | e BGEO Group JSC, senior note, 144A, 6.00%, 7/26/23 | | Georgia | 3,000,000 | | | 3,052,500 |
| | e Fidelity Bank PLC, senior note, 144A, 6.875%, 5/09/18 | | Nigeria | 12,100,000 | | | 10,648,000 |
| | c International Bank of Azerbaijan OJSC, senior note, Reg S, | | | | | | |
| | 5.625%, 6/11/19 | | Azerbaijan | 10,500,000 | | | 10,540,740 |
| | e National Savings Bank, senior note, 144A, 8.875%, 9/18/18 | | Sri Lanka | 4,000,000 | | | 4,278,480 |
| | f,g,h Sphynx Capital Markets PCC (National Investment Bank of | | | | | | |
| | Ghana), PTN, zero cpn., 2/05/09 | | Ghana | 8,000,000 | | | 9,409,308 |
| | | | | | | | 37,930,394 |
| | Building Products 1.9% | | | | | | |
| | e St. Marys Cement Inc., senior bond, 144A, 5.75%, 1/28/27 | | Brazil | 4,600,000 | | | 4,525,779 |
| | e Tecnoglass Inc., senior note, 144A, 8.20%, 1/31/22 | | Colombia | 5,000,000 | | | 4,975,000 |
| | | | | | | | 9,500,779 |
| | Chemicals 0.9% | | | | | | |
| | e Braskem Finance Ltd., senior note, 144A, 5.375%, 5/02/22 | | Brazil | 4,200,000 | | | 4,363,212 |
| | Commercial Services & Supplies 0.8% | | | | | | |
| | c Red de Carreteras de Occidente Sapib de CV, senior secured | | | | | | |
| | bond, Reg S, 9.00%, 6/10/28 | | Mexico | 90,000,000 | MXN | | 4,108,448 |
| | Diversified Financial Services 3.8% | | | | | | |
| | e 01 Properties Finance PLC, senior note, 144A, 8.25%, 9/27/21 | | Russia | 5,400,000 | | | 5,332,500 |
| | e Fideicomiso PA Costera, | | | | | | |
| | senior bond, 144A, 6.75%, 1/15/34 | | Colombia | 2,000,000 | | | 1,895,760 |
| | i senior secured bond, B, 144A, Index Linked, 6.25%, | | | | | | |
| | 1/15/34 | . | Colombia | 10,000,679,138 | COP | | 3,333,844 |
| | a,j,k,l Global Distressed Alpha Fund III LP, PIK, 12.00%, Perpetual | | Bermuda | 442,486 | | | 442,486 |
| | e Rio Oil Finance Trust, senior secured bond, 144A, 9.25%, | | | | | | |
| | 7/06/24 | | Brazil | 8,182,452 | | | 8,100,628 |
| | | | | | | | 19,105,218 |
| | Diversified Telecommunication Services 3.2% | | | | | | |
| | c Empresa de Telecommunicaciones de Bogota SA, senior note, | | | | | | |
| | Reg S, 7.00%, 1/17/23 | | Colombia | 27,200,000,000 | COP | | 7,093,893 |
| e MTN(Mauritius) Investments Ltd., 144A, 4.755%, 11/11/24 | | South Africa | 7,500,000 | | | 7,090,800 |
| | c,g Oi SA, senior note, Reg S, 9.75%, 9/15/16 | | Brazil | 26,100,000 | BRL | | 1,749,830 |
| | | | | | | | 15,934,523 |
| | Food & Staples Retailing 1.5% | | | | | | |
| | e JBS Investments GmbH, senior note, 144A, 7.25%, 4/03/24 | | Brazil | 7,300,000 | | | 7,681,607 |
| | Industrial Conglomerates 1.0% | | | | | | |
| | e Yasar Holdings SA, senior note, 144A, 8.875%, 5/06/20 | | Turkey | 5,000,000 | | | 5,090,125 |
10 Semiannual Report
ftinstitutional.com
FRANKLIN GLOBAL TRUST
CONSOLIDATED STATEMENT OF INVESTMENTS (UNAUDITED)
| | | | | |
| Franklin Emerging Market Debt Opportunities Fund (continued) | | | | |
| | Country/ | Principal | | | |
| | Organization | Amount* | | | Value |
| |
| Quasi-Sovereign and Corporate Bonds (continued) | | | | | |
| Metals & Mining 1.7% | | | | | |
| e Ferrexpo Finance PLC, senior note, 144A, 10.375%, 4/07/19. | Ukraine | 8,000,000 | | $ | 8,354,280 |
| Municipal Bonds 4.5% | | | | | |
| c Bogota Distrito Capital, senior bond, Reg S, 9.75%, 7/26/28 | Colombia | 14,600,000,000 | COP | | 5,121,299 |
| Province of Salta Argentina, | | | | | |
| e senior secured note, 144A, 9.50%, 3/16/22 | Argentina | 2,780,100 | | | 2,998,338 |
| c senior secured note, Reg S, 9.50%, 3/16/22 | Argentina | 3,900,789 | | | 4,207,001 |
| e Provincia de Neuquen Argentina, senior secured bond, 144A, | | | | | |
| 8.625%, 5/12/28 | Argentina | 9,913,000 | | | 10,510,506 |
| | | | | | 22,837,144 |
| Oil, Gas & Consumable Fuels 3.2% | | | | | |
| e Georgian Oil and Gas Corp JSC, senior note, 144A, 6.75%, | | | | | |
| 4/26/21 | Georgia | 6,000,000 | | | 6,334,020 |
| Petroleum Co. of Trinidad and Tobago Ltd., | | | | | |
| e senior bond, 144A, 6.00%, 5/08/22 | Trinidad and Tobago | 3,620,833 | | | 3,542,605 |
| c senior bond, Reg S, 6.00%, 5/08/22 | Trinidad and Tobago | 1,191,667 | | | 1,165,921 |
| c State Oil Co., Government of Azerbaijan, senior note, Reg S, | | | | | |
| 4.75%, 3/13/23 | Azerbaijan | 5,402,000 | | | 5,248,043 |
| | | | | | 16,290,589 |
| Road & Rail 1.2% | | | | | |
| e Kazakhstan Temir Zholy Finance BV, senior bond, 144A, 6.95%, | | | | | |
| 7/10/42 | Kazakhstan | 6,250,000 | | | 6,326,563 |
| Specialty Retail 0.2% | | | | | |
| e,g,m Edcon Ltd., secured note, 144A, 9.50%, 3/01/18 | South Africa | 6,800,000 | EUR | | 862,441 |
| Textiles, Apparel & Luxury Goods 1.0% | | | | | |
| e Golden Legacy PT Ltd., senior note, 144A, 8.25%, 6/07/21 | Indonesia | 5,000,000 | | | 5,267,975 |
| Wireless Telecommunication Services 0.7% | | | | | |
| e Millicom International Cellular SA, senior note, 144A, 6.625%, | | | | | |
| 10/15/21 | Colombia | 3,536,000 | | | 3,708,380 |
| Total Quasi-Sovereign and Corporate Bonds | | | | | |
| (Cost $179,164,206) | | | | | 167,361,678 |
| |
| n Loan Participations and Assignments 17.6% | | | | | |
| e Ardshininvestbank CJSC, senior note, 144A, 12.00%, 7/29/20 | Armenia | 6,620,000 | | | 6,454,500 |
| c,g Credit Suisse First Boston International (City of Kyiv), secured | | | | | |
| bond, Reg S, 8.00%, 11/06/15 | Ukraine | 11,975,000 | | | 9,580,000 |
| l,o Development Bank of South Africa Ltd. (Government of Angola), | | | | | |
| Tranche 2, senior note, FRN, 7.57%, 12/20/23 | Angola | 10,412,500 | | | 9,725,681 |
| Tranche 3B, senior note, FRN, 7.57%, 12/20/23 | Angola | 9,800,000 | | | 9,153,582 |
| l,o Ethiopian Railway Corp. (Republic of Ethiopia), FRN, 4.865%, | | | | | |
| 8/02/21 | Ethiopia | 9,300,000 | | | 8,487,502 |
| c FBN Finance Co. BV, (First Bank of Nigeria Ltd.), sub. note, Reg | | | | | |
| S, 8.00% to 7/23/19, FRN thereafter, 7/23/21 | Nigeria | 7,800,000 | | | 6,532,500 |
| l,o Government of Iraq, Tranche A3, Sumitomo Corp. Loan, FRN, | | | | | |
| 0.563%, 1/01/28 | Iraq | 272,563,694 | JPY | | 1,567,361 |
| l,o Merrill Lynch & Co. Inc. (Government of Iraq), FRN, 0.563%, | | | | | |
| 1/01/28 | Iraq | 477,002,974 | JPY | | 2,742,977 |
| g,l NK Debt Corp., | | | | | |
| 144A, zero cpn., 3/12/20 | North Korea | 4,250,000 | DEM | | — |
| Reg S, zero cpn., 3/12/20 | North Korea | 2,000,000 | CHF | | — |
| Reg S, zero cpn., 3/12/20 | North Korea | 18,000,000 | DEM | | — |
ftinstitutional.com
Semiannual Report 11
FRANKLIN GLOBAL TRUST
CONSOLIDATED STATEMENT OF INVESTMENTS (UNAUDITED)
| | | | | | | |
| Franklin Emerging Market Debt Opportunities Fund (continued) | | | | | |
| | | Country/ | Principal | | | | |
| | | Organization | Amount* | | | | Value |
| |
| n Loan Participations and Assignments (continued) | | | | | | | |
| e Oilflow SPV 1 DAC (Kurdistan Regional Government), secured | | | | | | | |
| note, 144A, 12.00%, 1/13/22 | | Iraq | 7,600,000 | | | $ | 7,662,966 |
| l,o Societe des Hydrocarbures du Tchad, Tranche 4, FRN, 7.848%, | | | | | | | |
| 12/30/22 | | Chad | 16,609,437 | | | | 16,136,068 |
| e SSB No. 1 PLC (OJSC State Savings Bank of Ukraine), senior | | | | | | | |
| note, 144A, 9.625%, 3/20/25 | | Ukraine | 11,000,000 | | | | 10,600,755 |
| Total Loan Participations and Assignments | | | | | | | |
| (Cost $95,400,103) | | | | | | | 88,643,892 |
| |
| Foreign Government and Agency Securities | | | | | | | |
| 38.3% | | | | | | | |
| Banque Centrale de Tunisie International Bond, | | | | | | | |
| senior bond, 4.30%, 8/02/30 | | Tunisia | 610,000,000 | | JPY | | 4,344,971 |
| senior bond, 4.20%, 3/17/31 | | Tunisia | 680,000,000 | | JPY | | 4,814,160 |
| c Ethiopia International Bond, Reg S, 6.625%, 12/11/24 | | Ethiopia | 1,800,000 | | | | 1,627,506 |
| e Government of Armenia, 144A, 7.15%, 3/26/25 | | Armenia | 4,500,000 | | | | 4,725,000 |
| o Government of Bosnia & Herzegovina, | | | | | | | |
| FRN, 0.563%, 12/11/17 | | Bosnia and Herzegovina | 700,000 | | DEM | | 368,937 |
| c senior bond, B, Reg S, FRN, 0.563%, 12/11/21. | | Bosnia and Herzegovina | 14,642,500 | | DEM | | 6,808,265 |
| e Government of Cameroon, senior note, 144A, 9.50%, 11/19/25 | | Cameroon | 8,200,000 | | | | 8,866,250 |
| e Government of Egypt, senior note, 144A, 7.50%, 1/31/27 | | Egypt | 1,400,000 | | | | 1,403,500 |
| c Government of El Salvador, senior bond, Reg S, 7.65%, 6/15/35 . | | El Salvador | 14,800,000 | | | | 13,072,174 |
| e Government of Gabon, 144A, 6.95%, 6/16/25 | | Gabon | 8,700,000 | | | | 8,109,140 |
| Government of Ghana, | | | | | | | |
| 25.40%, 7/31/17 | | Ghana | 11,250,000 | | GHS | | 2,644,672 |
| 23.00%, 8/21/17 | | Ghana | 12,450,000 | | GHS | | 2,898,945 |
| 24.75%, 7/19/21 | | Ghana | 8,840,000 | | GHS | | 2,395,477 |
| e Government of Grenada, senior bond, 144A, 7.00%, 5/12/30 | | Grenada | 10,682,170 | | | | 5,928,604 |
| c Government of Iraq, Reg S, 5.80%, 1/15/28 | | Iraq | 12,600,000 | | | | 10,496,430 |
| Government of Jamaica, senior bond, 7.875%, 7/28/45 | | Jamaica | 5,000,000 | | | | 5,580,400 |
| p Government of Mexico, senior note, M, 5.00%, 12/11/19. | | Mexico | 694,000 | q | MXN | | 3,168,070 |
| c Government of Mongolia, Reg S, 5.125%, 12/05/22 | | Mongolia | 10,500,000 | | | | 9,143,295 |
| Government of Russia, 7.50%, 3/15/18. | | Russia | 637,000,000 | | RUB | | 10,527,936 |
| c Government of Seychelles, senior bond, Reg S, 7.00% to | | | | | | | |
| 1/01/18, 8.00% thereafter, 1/01/26 | | Seychelles | 9,450,000 | | | | 9,473,625 |
| Government of South Africa, | | | | | | | |
| 8.00%, 12/21/18 | | South Africa | 121,900,000 | | ZAR | | 9,064,245 |
| p 7.00%, 2/28/31 | | South Africa | 87,700,000 | | ZAR | | 5,370,316 |
| Government of Uganda, | | | | | | | |
| 16.75%, 2/23/17 | | Uganda | 5,474,500,000 | | UGX | | 1,530,385 |
| 10.75%, 2/22/18 | | Uganda | 2,200,000,000 | | UGX | | 591,443 |
| 16.125%, 3/22/18 | | Uganda | 4,420,000,000 | | UGX | | 1,253,945 |
| 14.625%, 11/01/18 | | Uganda | 1,294,800,000 | | UGX | | 359,597 |
| 13.75%, 6/13/19 | | Uganda | 10,750,000,000 | | UGX | | 2,915,311 |
| i Government of Uruguay, senior bond, Index Linked, 3.70%, | | | | | | | |
| 6/26/37 | | Uruguay | 476,779,650 | | UYU | | 14,097,953 |
| c Government of Venezuela, | | | | | | | |
| Reg S, 6.00%, 12/09/20 | | Venezuela | 12,800,000 | | | | 6,787,200 |
| senior bond, Reg S, 7.65%, 4/21/25 | | Venezuela | 9,000,000 | | | | 4,241,250 |
| International Finance Corp., | | | | | | | |
| senior note, 6.45%, 10/30/18 | | Supranationalr | 200,000,000 | | INR | | 2,991,661 |
| f senior note, 10.25%, 12/05/18 | | Supranationalr | 3,407,800 | | AZN | | 1,758,562 |
| Kenya Infrastructure Bond, 11.00%, 9/15/25 | | Kenya | 776,100,000 | | KES | | 6,924,337 |
12 Semiannual Report
ftinstitutional.com
FRANKLIN GLOBAL TRUST
CONSOLIDATED STATEMENT OF INVESTMENTS (UNAUDITED)
| | | | | | |
| Franklin Emerging Market Debt Opportunities Fund (continued) | | | | | |
| | Country/ | Principal | | | | |
| | Organization | Amount* | | | | Value |
| Foreign Government and Agency | | | | | | |
| Securities (continued) | | | | | | |
| c Mestenio Ltd., secured note, Reg S, 8.50%, 1/02/20 | Dominican Republic | 1,920,000 | | | $ | 2,035,200 |
| i Mexican Udibonos, | | | | | | |
| Index Linked, 4.50%, 12/04/25 | Mexico | 373,465 | s | MXN | | 1,979,087 |
| Index Linked, 4.00%, 11/15/40 | Mexico | 1,207,444 | s | MXN | | 5,942,569 |
| e,g Mozambique International Bond, senior note, 144A, 10.50%, | | | | | | |
| 1/18/23 | Mozambique | 8,664,000 | | | | 5,288,376 |
| e Peruvian Government International Bond, senior bond, 144A, | | | | | | |
| 6.35%, 8/12/28 | Peru | 4,600,000 | | PEN | | 1,434,916 |
| e Republic of Suriname, senior note, 144A, 9.25%, 10/26/26 | Suriname | 2,500,000 | | | | 2,528,779 |
| Total Foreign Government and Agency | | | | | | |
| Securities (Cost $220,000,442) | | | | | | 193,492,489 |
| |
| |
| | | Shares | | | | |
| Common Stocks (Cost $—) 0.0% | | | | | | |
| b,f Astana Finance JSC, GDR, 144A | Kazakhstan | 193,625 | | | | — |
| |
| |
| | | Units | | | | |
| Private Limited Partnership Fund | | | | | | |
| (Cost $4,600,000) 0.1% | | | | | | |
| Diversified Financial Services 0.1% | | | | | | |
| a,b,l,t Global Distressed Alpha Fund III LP | Bermuda | 4,424,861 | | | | 365,356 |
| Total Investments before Short Term | | | | | | |
| Investments (Cost $530,956,167) | | | | | | 463,703,228 |
| |
| |
| | | Principal | | | | |
| | | Amount* | | | | |
| Short Term Investments 5.4% | | | | | | |
| Foreign Government and Agency Securities | | | | | | |
| (Cost $16,046,663) 2.8% | | | | | | |
| Turkey Government Bond, 9.00%, 3/08/17. | Turkey | 53,300,000 | | TRY | | 14,108,878 |
| Total Investments before Money Market Funds | | | | | | |
| (Cost $547,002,830) | | | | | | 477,812,106 |
| |
| |
| | | Shares | | | | |
| Money Market Funds (Cost $13,112,865) 2.6% | | | | | | |
| u,v Institutional Fiduciary Trust Money Market Portfolio, 0.15% | United States | 13,112,865 | | | | 13,112,865 |
| Total Investments (Cost $560,115,695) 97.2% | | | | | | 490,924,971 |
| Other Assets, less Liabilities 2.8% | | | | | | 14,205,120 |
| Net Assets 100.0%. | | | | | $ | 505,130,091 |
ftinstitutional.com
Semiannual Report 13
FRANKLIN GLOBAL TRUST
CONSOLIDATED STATEMENT OF INVESTMENTS (UNAUDITED)
Franklin Emerging Market Debt Opportunities Fund (continued)
*The principal amount is stated in U.S. dollars unless otherwise indicated.
aThe security is owned by Alternative Strategies (FT) Ltd., a wholly-owned subsidiary of the Fund. See Note 1(g).
bNon-income producing.
cSecurity was purchased pursuant to Regulation S under the Securities Act of 1933, which exempts from registration securities offered and sold outside of the United States.
Such a security cannot be sold in the United States without either an effective registration statement filed pursuant to the Securities Act of 1933, or pursuant to an exemption
from registration. These securities have been deemed liquid under guidelines approved by the Trust’s Board of Trustees. At January 31, 2017, the aggregate value of these
securities was $121,310,473, representing 24.0% of net assets.
dThe principal represents the notional amount. See Note 1(d) regarding value recovery instruments.
eSecurity was purchased pursuant to Rule 144A under the Securities Act of 1933 and may be sold in transactions exempt from registration only to qualified institutional buyers
or in a public offering registered under the Securities Act of 1933. These securities have been deemed liquid under guidelines approved by the Trust’s Board of Trustees. At
January 31, 2017, the aggregate value of these securities was $181,277,495, representing 35.9% of net assets.
fSecurity has been deemed illiquid because it may not be able to be sold within seven days. At January 31, 2017, the aggregate value of these securities was $11,169,236,
representing 2.2% of net assets.
gSee Note 7 regarding defaulted securities.
hRepresents claims that have been filed with a Ghanaian court against National Investment Bank of Ghana.
iPrincipal amount of security is adjusted for inflation. See Note 1(i).
jPerpetual security with no stated maturity date.
kIncome may be received in additional securities and/or cash.
lSee Note 9 regarding restricted securities.
mAt January 31, 2017, pursuant to the Fund’s policies and the requirements of applicable securities law, the Fund is restricted from trading this security at period end.
nSee Note 1(f) regarding loan participations and assignments.
oThe coupon rate shown represents the rate at period end.
pA portion or all of the security purchased on a delayed delivery basis. See Note 1(c).
qPrincipal amount is stated in 100 Mexican Peso Units.
rA supranational organization is an entity formed by two or more central governments through international treaties.
sPrincipal amount is stated in Unidad de Inversion Units.
tThe Global Distressed Alpha Fund III LP is a fund focused on the purchase of and the recovery on private distressed commercial, sovereign and sovereign-related debt
claims around the world, principally in Africa and Asia.
uSee Note 3(d) regarding investments in affiliated management investment companies.
vThe rate shown is the annualized seven-day yield at period end.
| | | | | | | | | | | |
| At January 31, 2017, the Fund had the following forward exchange contracts outstanding. See Note 1(d). | | | | |
| |
| Forward Exchange Contracts | | | | | | | | | | | |
| | | | | | Contract | Settlement | Unrealized | | Unrealized | |
| Currency | Counterpartya Type | Quantity | | Amount | Date | Appreciation | | Depreciation | |
| OTC Forward Exchange Contracts | | | | | | | | | | | |
| Euro | CITI | Sell | 3,000,000 | $ | 3,237,060 | 3/06/17 | $ | — | $ | (5,232 | ) |
| Euro | MSCO | Sell | 3,000,000 | | 3,236,370 | 3/06/17 | | — | | (5,922 | ) |
| Euro | RBCCM | Sell | 2,800,000 | | 3,019,794 | 3/06/17 | | — | | (6,345 | ) |
| Japanese Yen | CITI | Sell | 1,079,608,600 | | 9,450,124 | 3/06/17 | | — | | (118,695 | ) |
| Japanese Yen | MSCO | Sell | 500,000,000 | | 4,401,215 | 3/06/17 | | — | | (30,400 | ) |
| Japanese Yen | RBCCM | Sell | 560,000,000 | | 4,930,554 | 3/06/17 | | — | | (32,855 | ) |
| Total Forward Exchange Contracts | | | | | | | $ | — | $ | (199,449 | ) |
| Net unrealized appreciation (depreciation) | | | | | | | | $ | (199,449 | ) |
| |
| aMay be comprised of multiple contracts with the same counterparty, currency and settlement date. | | | | | | | | |
See Abbreviations on page 30.
14 Semiannual Report | The accompanying notes are an integral part of these consolidated financial statements. ftinstitutional.com
FRANKLIN GLOBAL TRUST
Consolidated Financial Statements
Consolidated Statement of Assets and Liabilities
January 31, 2017 (unaudited)
| | | |
| Franklin Emerging Market Debt Opportunities Fund | | | |
| |
| Assets: | | | |
| Investments in securities: | | | |
| Cost - Unaffiliated issuers | $ | 547,002,830 | |
| Cost - Non-controlled affiliates (Note 3d) | | 13,112,865 | |
| Total cost of investments | $ | 560,115,695 | |
| Value - Unaffiliated issuers | $ | 477,812,106 | |
| Value - Non-controlled affiliates (Note 3d) | | 13,112,865 | |
| Total value of investments | | 490,924,971 | |
| Cash | | 2,179,810 | |
| Restricted Cash (Note 1e) | | 90,000 | |
| Foreign currency, at value (cost $5,582,326) | | 5,619,212 | |
| Receivables: | | | |
| Investment securities sold | | 5,694,224 | |
| Capital shares sold | | 64,443 | |
| Interest. | | 6,806,161 | |
| Other assets | | 9 | |
| Total assets | | 511,378,830 | |
| Liabilities: | | | |
| Payables: | | | |
| Investment securities purchased | | 5,323,323 | |
| Capital shares redeemed | | 94,306 | |
| Management fees | | 418,837 | |
| Transfer agent fees | | 3,756 | |
| Due to brokers | | 90,000 | |
| Unrealized depreciation on OTC forward exchange contracts | | 199,449 | |
| Deferred tax | | 21,774 | |
| Accrued expenses and other liabilities | | 97,294 | |
| Total liabilities | | 6,248,739 | |
| Net assets, at value | $ | 505,130,091 | |
| Net assets consist of: | | | |
| Paid-in capital | $ | 581,063,426 | |
| Undistributed net investment income | | 4,062,609 | |
| Net unrealized appreciation (depreciation) | | (69,439,102 | ) |
| Accumulated net realized gain (loss) | | (10,556,842 | ) |
| Net assets, at value | $ | 505,130,091 | |
| Shares outstanding | | 45,451,348 | |
| Net asset value and maximum offering price per share | $ | 11.11 | |
ftinstitutional.com The accompanying notes are an integral part of these consolidated financial statements. | Semiannual Report 15
| | | |
| FRANKLIN GLOBAL TRUST | | | |
| CONSOLIDATED FINANCIAL STATEMENTS | | | |
| |
| |
| Consolidated Statement of Operations | | | |
| for the six months ended January 31, 2017 (unaudited) | | | |
| |
| Franklin Emerging Market Debt Opportunities Fund | | | |
| |
| Investment income: | | | |
| Dividends: | | | |
| Unaffiliated issuers | $ | 960,000 | |
| Non-controlled affiliates (Note 3d) | | 3,042 | |
| Interest (net of foreign taxes of $115,096) | | 19,113,663 | |
| Inflation principal adjustments | | 1,732,108 | |
| Total investment income | | 21,808,813 | |
| Expenses: | | | |
| Management fees (Note 3a) | | 2,624,795 | |
| Transfer agent fees (Note 3c) | | 14,333 | |
| Custodian fees (Note 4) | | 66,486 | |
| Reports to shareholders | | 7,425 | |
| Registration and filing fees | | 28,639 | |
| Professional fees. | | 103,031 | |
| Trustees’ fees and expenses. | | 11,733 | |
| Other | | 9,939 | |
| Total expenses | | 2,866,381 | |
| Expense reductions (Note 4) | | (3,477 | ) |
| Expenses waived/paid by affiliates (Note 3d and 3e) | | (230,045 | ) |
| Net expenses | | 2,632,859 | |
| Net investment income | | 19,175,954 | |
| Realized and unrealized gains (losses): | | | |
| Net realized gain (loss) from: | | | |
| Investments | | (6,218,511 | ) |
| Foreign currency transactions | | (730,024 | ) |
| Net realized gain (loss) | | (6,948,535 | ) |
| Net change in unrealized appreciation (depreciation) on: | | | |
| Investments | | 6,594,202 | |
| Translation of other assets and liabilities | | | |
| denominated in foreign currencies | | 1,966,601 | |
| Change in deferred taxes on unrealized appreciation | | (15,578 | ) |
| Net change in unrealized appreciation (depreciation) | | 8,545,225 | |
| Net realized and unrealized gain (loss) | | 1,596,690 | |
| Net increase (decrease) in net assets resulting from operations | $ | 20,772,644 | |
16 Semiannual Report | The accompanying notes are an integral part of these consolidated financial statements. ftinstitutional.com
| | | | | | | |
| | | FRANKLIN GLOBAL TRUST | |
| | | CONSOLIDATED FINANCIAL STATEMENTS | |
| |
| |
| Consolidated Statements of Changes in Net Assets | | | | | | | |
| |
| Franklin Emerging Market Debt Opportunities Fund | | | | | | | |
| |
| | | Six Months Ended | | | | | |
| | | January 31, 2017 | | | Year Ended | |
| | | (unaudited) | | | July 31, 2016 | |
| Increase (decrease) in net assets: | | | | | | | |
| Operations: | | | | | | | |
| Net investment income | $ | 19,175,954 | | $ | 51,310,295 | |
| Net realized gain (loss) | | (6,948,535 | ) | | (31,156,241 | ) |
| Net change in unrealized appreciation (depreciation) | | 8,545,225 | | | 2,002,903 | |
| Net increase (decrease) in net assets resulting from operations. | | 20,772,644 | | | 22,156,957 | |
| Distributions to shareholders from: | | | | | | | |
| Net investment income | | — | | | (36,997,804 | ) |
| Net realized gains | | (3,393,270 | ) | | | — | |
| Total distributions to shareholders | | (3,393,270 | ) | | (36,997,804 | ) |
| Capital share transactions (Note 2) | | (65,083,869 | ) | | (145,899,867 | ) |
| Net increase (decrease) in net assets. | | (47,704,495 | ) | | (160,740,714 | ) |
| Net assets: | | | | | | | |
| Beginning of period | | 552,834,586 | | | 713,575,300 | |
| End of period | $ | 505,130,091 | | $ | 552,834,586 | |
| Undistributed net investment income (loss) included in net assets: | | | | | | | |
| End of period | $ | 4,062,609 | | | $ | — | |
| Distributions in excess of net investment income included in net assets: | | | | | | | |
| End of period | $ | — | | $ | (15,113,345 | ) |
ftinstitutional.com The accompanying notes are an integral part of these consolidated financial statements. | Semiannual Report 17
| | | |
| FRANKLIN GLOBAL TRUST | | | |
| CONSOLIDATED FINANCIAL STATEMENTS | | | |
| |
| |
| Consolidated Statement of Cash Flows | | | |
| for the six months ended January 31, 2017 (unaudited) | | | |
| |
| Franklin Emerging Market Debt Opportunities Fund | | | |
| |
| Cash flow from operating activities: | | | |
| Dividends, interest and other income received | $ | 19,744,561 | |
| Operating expenses paid | | (2,622,290 | ) |
| Purchases of long-term investments. | | (65,358,544 | ) |
| Cash on deposit with brokers | | 1,770,000 | |
| Realized loss on foreign currency transactions. | | (730,024 | ) |
| Sales and maturities of long-term investments | | 120,799,360 | |
| Net purchases of short-term investments | | (8,680,942 | ) |
| Cash provided - operating activities | | 64,922,121 | |
| Cash flow from financing activities: | | | |
| Proceeds from shares sold | | 62,886,009 | |
| Payment of shares redeemed | | (121,100,333 | ) |
| Cash distributions to shareholders | | (135,969 | ) |
| Cash used - financing activities | | (58,350,293 | ) |
| Net increase (decrease) in cash | | 6,571,828 | |
| Cash, restricted cash (Note 1e) and foreign currency at beginning of period | | 1,317,194 | |
| Cash, restricted cash (Note 1e) and foreign currency at end of period | $ | 7,889,022 | |
| |
| |
| Reconciliation of Net Increase (Decrease) in Net Assets resulting from Operating Activities to Net Cash Provided | | | |
| by Operating Activities | | | |
| for the six months ended January 31, 2017 (unaudited) | | | |
| |
| Net increase (decrease) in net assets resulting from operating activities | $ | 20,772,644 | |
| Adjustments to reconcile net increase (decrease) in net assets resulting from operating activities to net cash provided by | | | |
| operating activities: | | | |
| Net amortization income | | (3,300,742 | ) |
| Reinvested dividends from non-controlled affiliates | | (3,042 | ) |
| Other investment transactions | | (45,980 | ) |
| Decrease in dividends and interest receivable and other assets | | 1,285,512 | |
| Increase in receivable for investments sold. | | (5,694,224 | ) |
| Increase in payable for investments purchased | | 5,323,323 | |
| Increase in affiliates, accrued expenses, and other liabilities. | | 10,569 | |
| Decrease in cost of investments | | 53,349,286 | |
| Decrease in unrealized depreciation on investments | | (8,545,225 | ) |
| Decrease in cash on deposit with broker | | 1,770,000 | |
| Net cash provided by operating activities | $ | 64,922,121 | |
| Noncash financing activities - reinvestment of dividends | $ | 3,257,301 | |
18 Semiannual Report | The accompanying notes are an integral part of these consolidated financial statements. ftinstitutional.com
FRANKLIN GLOBAL TRUST
Notes to Consolidated Financial Statements (unaudited)
Franklin Emerging Market Debt Opportunities Fund
1. Organization and Significant Accounting Policies
Franklin Global Trust (Trust) is registered under the Investment Company Act of 1940 (1940 Act) as an open-end management investment company, consisting of five separate funds and applies the specialized accounting and reporting guidance in U.S. Generally Accepted Accounting Principles (U.S. GAAP). Franklin Emerging Market Debt Opportunities Fund (Fund) is included in this report. The financial statements of the remaining funds in the Trust are presented separately.
The following summarizes the Fund’s significant accounting policies.
a. Financial Instrument Valuation
The Fund’s investments in financial instruments are carried at fair value daily. Fair value is the price that would be received to sell an asset or paid to transfer a liability in an orderly transaction between market participants on the measurement date. The Fund calculates the net asset value (NAV) per share as of 4 p.m. Eastern time each day the New York Stock Exchange (NYSE) is open for trading. Under compliance policies and procedures approved by the Trust’s Board of Trustees (the Board), the Fund’s administrator has responsibility for oversight of valuation, including leading the cross-functional Valuation Committee (VC). The VC provides administration and oversight of the Fund’s valuation policies and procedures, which are approved annually by the Board. Among other things, these procedures allow the Fund to utilize independent pricing services, quotations from securities and financial instrument dealers, and other market sources to determine fair value.
Equity securities listed on an exchange or on the NASDAQ National Market System are valued at the last quoted sale price or the official closing price of the day, respectively. Foreign equity securities are valued as of the close of trading on the foreign stock exchange on which the security is primarily traded, or as of 4 p.m. Eastern time. The value is then converted into its U.S. dollar equivalent at the foreign exchange rate in effect at 4 p.m. Eastern time on the day that the value of the security is determined. Over-the-counter (OTC) securities are valued within the range of the most recent quoted bid and ask prices. Securities that trade in multiple markets or on multiple exchanges are valued according to the broadest and most representative market. Certain equity securities are valued based upon fundamental characteristics or relationships to similar securities.
Debt securities generally trade in the OTC market rather than on a securities exchange. The Fund’s pricing services use multiple valuation techniques to determine fair value. In instances where sufficient market activity exists, the pricing services may utilize a market-based approach through which quotes from market makers are used to determine fair value. In instances where sufficient market activity may not exist or is limited, the pricing services also utilize proprietary valuation models which may consider market characteristics such as benchmark yield curves, credit spreads, estimated default rates, anticipated market interest rate volatility, coupon rates, anticipated timing of principal repayments, underlying collateral, and other unique security features in order to estimate the relevant cash flows, which are then discounted to calculate the fair value. Securities denominated in a foreign currency are converted into their U.S. dollar equivalent at the foreign exchange rate in effect at 4 p.m. Eastern time on the date that the values of the foreign debt securities are determined.
Investments in open-end mutual funds are valued at the closing NAV.
Certain derivative financial instruments trade in the OTC market. The Fund’s pricing services use various techniques including industry standard option pricing models and proprietary discounted cash flow models to determine the fair value of those instruments. The Fund’s net benefit or obligation under the derivative contract, as measured by the fair value of the contract, is included in net assets.
The Fund has procedures to determine the fair value of financial instruments for which market prices are not reliable or readily available. Under these procedures, the VC convenes on a regular basis to review such financial instruments and considers a number of factors, including significant unobservable valuation inputs, when arriving at fair value. The VC primarily employs a market-based approach which may use related or comparable assets or liabilities, recent transactions, market multiples, book values, and other relevant information for the investment to determine the fair value of the investment. An income-based valuation approach may also be used in which the anticipated future cash flows of the investment are discounted to calculate fair value. Discounts may also be applied due to the
ftinstitutional.com
Semiannual Report 19
FRANKLIN GLOBAL TRUST
NOTES TO CONSOLIDATED FINANCIAL STATEMENTS (UNAUDITED)
Franklin Emerging Market Debt Opportunities Fund (continued)
1. Organization and Significant Accounting
Policies (continued)
a. Financial Instrument Valuation (continued)
nature or duration of any restrictions on the disposition of the investments. Due to the inherent uncertainty of valuations of such investments, the fair values may differ significantly from the values that would have been used had an active market existed. The VC employs various methods for calibrating these valuation approaches including a regular review of key inputs and assumptions, transactional back-testing or disposition analysis, and reviews of any related market activity.
Trading in securities on foreign securities stock exchanges and OTC markets may be completed before 4 p.m. Eastern time. In addition, trading in certain foreign markets may not take place on every Fund’s business day. Occasionally, events occur between the time at which trading in a foreign security is completed and 4 p.m. Eastern time that might call into question the reliability of the value of a portfolio security held by the Fund. As a result, differences may arise between the value of the Fund’s portfolio securities as determined at the foreign market close and the latest indications of value at 4 p.m. Eastern time. In order to minimize the potential for these differences, the VC monitors price movements following the close of trading in foreign stock markets through a series of country specific market proxies (such as baskets of American Depositary Receipts, futures contracts and exchange traded funds). These price movements are measured against established trigger thresholds for each specific market proxy to assist in determining if an event has occurred that may call into question the reliability of the values of the foreign securities held by the Fund. If such an event occurs, the securities may be valued using fair value procedures, which may include the use of independent pricing services.
When the last day of the reporting period is a non-business day, certain foreign markets may be open on those days that the Fund’s NAV is not calculated, which could result in differences between the value of the Fund’s portfolio securities on the last business day and the last calendar day of the reporting period. Any significant security valuation changes due to an open foreign market are adjusted and reflected by the Fund for financial reporting purposes
b. Foreign Currency Translation
Portfolio securities and other assets and liabilities denominated in foreign currencies are translated into U.S. dollars based on the exchange rate of such currencies against U.S. dollars on the date of valuation. The Fund may enter into foreign currency exchange contracts to facilitate transactions denominated in a foreign currency. Purchases and sales of securities, income and expense items denominated in foreign currencies are translated into U.S. dollars at the exchange rate in effect on the transaction date. Portfolio securities and assets and liabilities denominated in foreign currencies contain risks that those currencies will decline in value relative to the U.S. dollar. Occasionally, events may impact the availability or reliability of foreign exchange rates used to convert the U.S. dollar equivalent value. If such an event occurs, the foreign exchange rate will be valued at fair value using procedures established and approved by the Board.
The Fund does not separately report the effect of changes in foreign exchange rates from changes in market prices on securities held. Such changes are included in net realized and unrealized gain or loss from investments in the Consolidated Statement of Operations.
Realized foreign exchange gains or losses arise from sales of foreign currencies, currency gains or losses realized between the trade and settlement dates on securities transactions and the difference between the recorded amounts of dividends, interest, and foreign withholding taxes and the U.S. dollar equivalent of the amounts actually received or paid. Net unrealized foreign exchange gains and losses arise from changes in foreign exchange rates on foreign denominated assets and liabilities other than investments in securities held at the end of the reporting period.
c. Securities Purchased on a Delayed Delivery Basis
The Fund purchases securities on a delayed delivery basis, with payment and delivery scheduled for a future date. These transactions are subject to market fluctuations and are subject to the risk that the value at delivery may be more or less than the trade date purchase price. Although the Fund will generally purchase these securities with the intention of holding the securities, it may sell the securities before the settlement date.
d. Derivative Financial Instruments
The Fund invested in derivative financial instruments in order to manage risk or gain exposure to various other investments or markets. Derivatives are financial contracts based on an
20 Semiannual Report
ftinstitutional.com
FRANKLIN GLOBAL TRUST
NOTES TO CONSOLIDATED FINANCIAL STATEMENTS (UNAUDITED)
Franklin Emerging Market Debt Opportunities Fund (continued)
underlying or notional amount, require no initial investment or an initial net investment that is smaller than would normally be required to have a similar response to changes in market factors, and require or permit net settlement. Derivatives contain various risks including the potential inability of the counterparty to fulfill their obligations under the terms of the contract, the potential for an illiquid secondary market, and/or the potential for market movements which expose the Fund to gains or losses in excess of the amounts shown in the Consolidated Statement of Assets and Liabilities. Realized gain and loss and unrealized appreciation and depreciation on these contracts for the period are included in the Consolidated Statement of Operations.
Derivative counterparty credit risk is managed through a formal evaluation of the creditworthiness of all potential counter-parties. The Fund attempts to reduce its exposure to counterparty credit risk on OTC derivatives, whenever possible, by entering into International Swaps and Derivatives Association (ISDA) master agreements with certain counterparties. These agreements contain various provisions, including but not limited to collateral requirements, events of default, or early termination. Termination events applicable to the counterparty include certain deteriorations in the credit quality of the counterparty. Termination events applicable to the Fund include failure of the Fund to maintain certain net asset levels and/or limit the decline in net assets over various periods of time. In the event of default or early termination, the ISDA master agreement gives the non-defaulting party the right to net and close-out all transactions traded, whether or not arising under the ISDA agreement, to one net amount payable by one counterparty to the other. However, absent an event of default or early termination, OTC derivative assets and liabilities are presented gross and not offset in the Consolidated Statement of Assets and Liabilities. Early termination by the counterparty may result in an immediate payment by the Fund of any net liability owed to that counterparty under the ISDA agreement. At January 31, 2017, the Fund had OTC derivatives in a net liability position of $160,249.
Collateral requirements differ by type of derivative. Collateral terms are contract specific for OTC derivatives. For OTC derivatives traded under an ISDA master agreement, posting of collateral is required by either the Fund or the applicable counterparty if the total net exposure of all OTC derivatives with the applicable counterparty exceeds the minimum transfer amount, which typically ranges from $100,000 to $250,000, and can vary depending on the counterparty and the type of the agreement. Generally, collateral is determined at the close of Fund business each day and any additional collateral required due to changes in derivative values may be delivered by the fund or the counterparty within a few business days. Collateral pledged and/or received by the Fund, if any, is held in segregated accounts with the Fund’s custodian/counterparty broker and can be in the form of cash and/or securities. Unrestricted cash may be invested according to the Fund’s investment objectives. To the extent that the amounts due to the Fund from its counterparties are not subject to collateralization or are not fully collateralized, the Fund bears the risk of loss from counterparty non-performance.
The Fund entered into OTC forward exchange contracts primarily to manage and/or gain exposure to certain foreign currencies. A forward exchange contract is an agreement between the Fund and a counterparty to buy or sell a foreign currency at a specific exchange rate on a future date.
The Fund invests in value recovery instruments (VRI) primarily to gain exposure to growth risk. Periodic payments from VRI are dependent on established benchmarks for underlying variables. VRI has a notional amount, which is used to calculate amounts of payments to holders. Payments are recorded upon receipt as realized gains in the Consolidated Statement of Operations. The risks of investing in VRI include growth risk, liquidity, and the potential loss of investment.
See Note 10 regarding other derivative information.
e. Restricted Cash
At January 31, 2017, the Fund held restricted cash in connection with investments in certain derivative securities. Restricted cash is held in a segregated account with the Fund’s custodian and is reflected in the Consolidated Statement of Assets and Liabilities.
f. Loan Participations and Assignments
The Fund may invest in debt instruments which are interests in amounts owed to lenders or lending syndicates by corporate, governmental, or other borrowers. The Fund’s investments in loans may be in the form of participations in loans or assignments of all or portion of loans from third parties. A loan is often administered by a bank or other financial institution (the lender”) that acts as agent for all holders. The agent administers the terms of the loan, as specified in the loan agreement. The Fund may invest in multiple series or tranches of a loan, which
ftinstitutional.com
Semiannual Report 21
FRANKLIN GLOBAL TRUST
NOTES TO CONSOLIDATED FINANCIAL STATEMENTS (UNAUDITED)
Franklin Emerging Market Debt Opportunities Fund (continued)
1. Organization and Significant Accounting
Policies (continued)
f. Loan Participations and Assignments (continued)
may have varying terms and carry different associated risks. When investing in a loan participation, a Fund has the right to receive payments of principal, interest and any fees only from the lender selling the loan and only upon receipt of payments from the borrower. The Fund generally has no right to enforce compliance with the terms of the loan agreement with the borrower. As a result, the Fund may be subject to credit risk of both the borrower and the lender that is selling the loan. When the Fund purchases assignments from lenders it acquires direct rights against the borrower of the loan.
g. Investments in Alternative Strategies (FT) Ltd. (FT Subsidiary)
The Fund invests in certain financial instruments, warrants or commodities through its investment in the FT Subsidiary. The FT Subsidiary is a Cayman Islands exempted company with limited liability, is a wholly-owned subsidiary of the Fund, and is able to invest in certain financial instruments consistent with the investment objective of the Fund. At January 31, 2017, the FT Subsidiary’s investments as well as any other assets and liabilities of the FT Subsidiary are reflected in the Fund’s Consolidated Statement of Investments and Consolidated Statement of Assets and Liabilities. The financial statements have been consolidated and include the accounts of the Fund and the FT Subsidiary. All intercompany transactions and balances have been eliminated. At January 31, 2017, the net assets of the FT Subsidiary were $14,145,980, representing 2.8% of the Fund’s consolidated net assets. The Fund’s investment in the FT Subsidiary is limited to 25% of consolidated assets.
h. Income and Deferred Taxes
It is the Fund’s policy to qualify as a regulated investment company under the Internal Revenue Code. The Fund intends to distribute to shareholders substantially all of its taxable income and net realized gains to relieve it from federal income and excise taxes. As a result, no provision for U.S. federal income taxes is required.
The Fund may be subject to foreign taxation related to income received, capital gains on the sale of securities and certain foreign currency transactions in the foreign jurisdictions in which it invests. Foreign taxes, if any, are recorded based on the tax regulations and rates that exist in the foreign markets in which the Fund invests. When a capital gain tax is determined to apply, the Fund records an estimated deferred tax liability in an amount that would be payable if the securities were disposed of on the valuation date.
The Fund may recognize an income tax liability related to its uncertain tax positions under U.S. GAAP when the uncertain tax position has a less than 50% probability that it will be sustained upon examination by the tax authorities based on its technical merits. As of January 31, 2017, the Fund has determined that no tax liability is required in its financial statements related to uncertain tax positions for any open tax years (or expected to be taken in future tax years). Open tax years are those that remain subject to examination and are based on each tax jurisdiction’s statute of limitation.
i. Security Transactions, Investment Income, Expenses and Distributions
Security transactions are accounted for on trade date. Realized gains and losses on security transactions are determined on a specific identification basis. Interest income and estimated expenses are accrued daily. Amortization of premium and accretion of discount on debt securities are included in interest income. Dividend income is recorded on the ex-dividend date except for certain dividends from securities where the dividend rate is not available. In such cases, the dividend is recorded as soon as the information is received by the Fund. Distributions to shareholders are recorded on the ex-dividend date and are determined according to income tax regulations (tax basis). Distributable earnings determined on a tax basis may differ from earnings recorded in accordance with U.S. GAAP. These differences may be permanent or temporary. Permanent differences are reclassified among capital accounts to reflect their tax character. These reclassifications have no impact on net assets or the results of operations. Temporary differences are not reclassified, as they may reverse in subsequent periods.
Common expenses incurred by the Trust are allocated among the Funds based on the ratio of net assets of each fund to the combined net assets of the Trust. Fund specific expenses are charged directly to the fund that incurred the expense.
Inflation-indexed bonds are adjusted for inflation through periodic increases or decreases in the security’s interest accruals, face amount, or principal redemption value, by amounts corresponding to the rate of inflation as measured by an index. Any increase or decrease in the face amount or
22 Semiannual Report
ftinstitutional.com
FRANKLIN GLOBAL TRUST
NOTES TO CONSOLIDATED FINANCIAL STATEMENTS (UNAUDITED)
Franklin Emerging Market Debt Opportunities Fund (continued)
principal redemption value will be included as inflation principal adjustments in the Consolidated Statement of Operations.
j. Accounting Estimates
The preparation of financial statements in accordance with U.S. GAAP requires management to make estimates and assumptions that affect the reported amounts of assets and liabilities at the date of the financial statements and the amounts of income and expenses during the reporting period. Actual results could differ from those estimates.
k. Guarantees and Indemnifications
Under the Trust’s organizational documents, its officers and trustees are indemnified by the Trust against certain liabilities arising out of the performance of their duties to the Trust.
2. Shares of Beneficial Interest
Additionally, in the normal course of business, the Trust, on behalf of the Fund, enters into contracts with service providers that contain general indemnification clauses. The Trust’s maximum exposure under these arrangements is unknown as this would involve future claims that may be made against the Trust that have not yet occurred. Currently, the Trust expects the risk of loss to be remote.
At January 31, 2017, there were an unlimited number of shares authorized (without par value). Transactions in the Fund’s shares were as follows:
| | | | | | | | | | |
| | Six Months Ended | | Year Ended | |
| | January 31, 2017 | | July 31, 2016 | |
| | Shares | | | Amount | | Shares | | | Amount | |
| Shares sold | 4,781,638 | | $ | 52,443,206 | | 5,756,631 | | $ | 59,886,896 | |
| Shares issued in reinvestment of distributions | 299,660 | | | 3,257,301 | | 3,650,364 | | | 35,810,070 | |
| Shares redeemed | (11,008,489 | ) | | (120,784,376 | ) | (24,573,528 | ) | | (241,596,833 | ) |
| Net increase (decrease) | (5,927,191 | ) | $ | (65,083,869 | ) | (15,166,533 | ) | $ | (145,899,867 | ) |
3. Transactions with Affiliates
Franklin Resources, Inc. is the holding company for various subsidiaries that together are referred to as Franklin Templeton Investments. Certain officers and trustees of the Trust are also officers and/or directors of the following subsidiaries:
| |
| Subsidiary | Affiliation |
| Franklin Templeton Investment Management Limited (FTIML) | Investment manager |
| Franklin Templeton Services, LLC (FT Services) | Administrative manager |
| Franklin Templeton Investor Services, LLC (Investor Services) | Transfer agent |
ftinstitutional.com
Semiannual Report 23
FRANKLIN GLOBAL TRUST
NOTES TO CONSOLIDATED FINANCIAL STATEMENTS (UNAUDITED)
Franklin Emerging Market Debt Opportunities Fund (continued)
| 3. | Transactions with Affiliates (continued) |
| a. | Management Fees |
The Fund and FT Subsidiary pay an investment management fee to FTIML based on the average daily net assets of each of the Fund and FT Subsidiary as follows:
| | |
| Annualized Fee Rate | | Net Assets |
| 1.000 | % | Up to and including $500 million |
| 0.900 | % | Over $500 million, up to and including $1 billion |
| 0.850 | % | In excess of $1 billion |
For the period ended January 31, 2017, the annualized effective management fee rate was 0.996% of the Fund’s average daily net assets.
Management fees paid by the Fund are reduced on assets invested in FT Subsidiary, in an amount not to exceed the management fees paid by FT Subsidiary.
b. Administrative Fees
Under an agreement with FTIML, FT Services provides administrative services to the Fund and FT Subsidiary. The fee is paid by FTIML based on each of the Fund’s and FT Subsidiary’s average daily net assets, and is not an additional expense of the Fund or FT Subsidiary.
c. Transfer Agent Fees
The Fund pays transfer agent fees to Investor Services for its performance of shareholder servicing obligations and reimburses Investor Services for out of pocket expenses incurred, including shareholder servicing fees paid to third parties.
For the period ended January 31, 2017, the Fund paid transfer agent fees of $14,333, of which $12,654 was retained by Investor Services.
d. Investments in Affiliated Management Investment Companies
The Fund invests in one or more affiliated management investment companies for purposes other than exercising a controlling influence over the management or policies. Management fees paid by the Fund are waived on assets invested in the affiliated management investment companies, as noted in the Consolidated Statement of Operations, in an amount not to exceed the management and administrative fees paid directly or indirectly by each affiliate. Prior to August 1, 2013, the waiver was accounted for as a reduction to management fees. During the period ended January 31, 2017, the Fund held investments in affiliated management investment companies as follows:
| | | | | | | | | | | | |
| | | | | | | | | | | | % of | |
| | | | | | | | | | | | Affiliated | |
| | Number of | | | | Number of | | | | | | Fund Shares | |
| | Shares Held | | | | Shares | | Value | | | | Outstanding | |
| | at Beginning | Gross | Gross | | Held at End | | at End | | Investment | Realized | Held at End | |
| | of Period | Additions | Reductions | | of Period | | of Period | | Income | Gain (Loss) | of Period | |
| |
| Non-Controlled Affiliates | | | | | | | | | | | | |
| Institutional Fiduciary Trust Money | | | | | | | | | | | | |
| Market Portfolio, 0.15% | 20,493,180 | 127,093,313 | (134,473,628 | ) | 13,112,865 | $ | 13,112,865 | $ | 3,042 | $ – | 0.1 | % |
24 Semiannual Report
ftinstitutional.com
FRANKLIN GLOBAL TRUST
NOTES TO CONSOLIDATED FINANCIAL STATEMENTS (UNAUDITED)
Franklin Emerging Market Debt Opportunities Fund (continued)
e. Waiver and Expense Reimbursements
FTIML has contractually agreed in advance to waive or limit its fees and to assume as its own expense certain expenses otherwise payable by the Fund so that the expenses (excluding acquired fund fees and expenses) do not exceed 1.00% (other than certain non-routine expenses or costs, including those relating to litigation, indemnification, reorganizations, and liquidations) until November 30, 2017. Total expenses waived or paid are not subject to recapture subsequent to the Fund’s fiscal year end.
4. Expense Offset Arrangement
The Fund has entered into an arrangement with its custodian whereby credits realized as a result of uninvested cash balances are used to reduce a portion of the Fund’s custodian expenses. During the period ended January 31, 2017, the custodian fees were reduced as noted in the Consolidated Statement of Operations.
5. Income Taxes
For tax purposes, capital losses may be carried over to offset future capital gains, if any. At July 31, 2016, the Fund had long-term capital loss carryforwards of $238,557.
For tax purposes, the Fund may elect to defer any portion of a late-year ordinary loss to the first day of the following fiscal year. At July 31, 2016, the Fund deferred late-year ordinary losses of $16,243,879.
At January 31, 2017, the cost of investments and net unrealized appreciation (depreciation), for income tax purposes were as follows:
| | | |
| Cost of investments | $ | 538,587,183 | |
| |
| Unrealized appreciation | $ | 40,942,403 | |
| Unrealized depreciation | | (88,604,615 | ) |
| Net unrealized appreciation (depreciation) | $ | (47,662,212 | ) |
Differences between income and/or capital gains as determined on a book basis and a tax basis are primarily due to differing treatments of bond discounts and premiums, foreign currency transactions, commodity-based derivatives and inflation related adjustments on foreign securities.
6. Investment Transactions
Purchases and sales of investments (excluding short term securities) for the period ended January 31, 2017, aggregated $70,681,867 and $126,493,584, respectively.
7. Credit Risk and Defaulted Securities
At January 31, 2017, the Fund had 84.9% of its portfolio invested in high yield or other securities rated below investment grade and unrated securities, if any. These securities may be more sensitive to economic conditions causing greater price volatility and are potentially subject to a greater risk of loss due to default than higher rated securities.
The Fund held defaulted securities and/or other securities for which the income has been deemed uncollectible. At January 31, 2017, the aggregate value of these securities was $26,889,955, representing 5.3% of the Fund’s net assets. The Fund discontinues accruing income on securities for which income has been deemed uncollectible and provides an estimate for losses on interest receivable. The securities have been identified in the accompanying Consolidated Statement of Investments.
ftinstitutional.com
Semiannual Report 25
FRANKLIN GLOBAL TRUST
NOTES TO CONSOLIDATED FINANCIAL STATEMENTS (UNAUDITED)
Franklin Emerging Market Debt Opportunities Fund (continued)
8. Concentration of Risk
Investing in foreign securities may include certain risks and considerations not typically associated with investing in U.S. securities, such as fluctuating currency values and changing local and regional economic, political and social conditions, which may result in greater market volatility. In addition, certain foreign securities may not be as liquid as U.S. securities.
9. Restricted Securities
The Fund invests in securities that are restricted under the Securities Act of 1933 (1933 Act) or which are subject to legal, contractual, or other agreed upon restrictions on resale. Restricted securities are often purchased in private placement transactions, and cannot be sold without prior registration unless the sale is pursuant to an exemption under the 1933 Act. Disposal of these securities may require greater effort and expense, and prompt sale at an acceptable price may be difficult. The Fund may have registration rights for restricted securities. The issuer generally incurs all registration costs.
At January 31, 2017, the Fund held investments in restricted securities, excluding certain securities exempt from registration under the 1933 Act deemed to be liquid, as follows:
| | | | | | | |
| Principal | | | | | | | |
| Amount*/ | | | Acquisition | | | | |
| Units | | Issuer | Dates | | Cost | | Value |
| 10,412,500 | | Development Bank of South Africa Ltd. (Government of | | | | | |
| | | Angola), Tranche 2, senior note, FRN, 7.57%, 12/20/23 | 12/16/13 | $ | 10,412,500 | $ | 9,725,681 |
| 9,800,000 | | Development Bank of South Africa Ltd. (Government of | | | | | |
| | | Angola), Tranche 3B, senior note, FRN, 7.57%, 12/20/23 | 6/06/14 | | 9,800,000 | | 9,153,582 |
| 9,300,000 | | Ethiopian Railway Corp. (Republic of Ethiopia), FRN, 4.865%, | | | | | |
| | | 8/02/21 | 8/04/14 - 1/15/16 | | 8,797,978 | | 8,487,502 |
| 4,424,861 | | Global Distressed Alpha Fund III LP | 10/11/12 - 1/22/16 | | 4,600,000 | | 365,356 |
| 442,486 | | Global Distressed Alpha Fund III LP, PIK, 12.00%, Perpetual | 12/28/16 | | 442,486 | | 442,486 |
| 272,563,694 | JPY | Government of Iraq, Tranche A3, Sumitomo Corp. Loan, FRN, | | | | | |
| | | 0.563%, 1/01/28. | 10/16/07 - 1/06/11 | | 1,611,211 | | 1,567,361 |
| 477,002,974 | JPY | Merrill Lynch & Co. Inc. (Government of Iraq), FRN, 0.563%, | | | | | |
| | | 1/01/28 | 7/19/07 - 1/06/11 | | 2,715,531 | | 2,742,977 |
| 4,250,000 | DEM | NK Debt Corp., 144A, zero cpn., 3/12/20 | 6/19/07 - 10/14/08 | | 723,263 | | — |
| 2,000,000 | CHF | NK Debt Corp., Reg S, zero cpn., 3/12/20 | 6/17/11 | | 388,830 | | — |
| 18,000,000 | DEM | NK Debt Corp., Reg S, zero cpn., 3/12/20 | 1/25/11 - 6/06/11 | | 2,023,663 | | — |
| 16,609,437 | | Societe des Hydrocarbures du Tchad, Tranche 4, FRN, | | | | | |
| | | 7.848%, 12/30/22 | 10/03/16 | | 16,155,659 | | 16,136,068 |
| | | Total Restricted Securities (Value is 9.6% of Net Assets) | | $ | 57,671,121 | $ | 48,621,013 |
| |
| *In U.S. dollars unless otherwise indicated. | | | | | |
10. Other Derivative Information
At January 31, 2017, the Fund’s investments in derivative contracts are reflected in the Consolidated Statement of Assets and Liabilities as follows:
| | | | | | |
| | Asset Derivatives | | | Liability Derivatives | | |
| Derivative Contracts | Consolidated Statement of | | | Consolidated Statement of | | |
| Not Accounted for as | Assets and Liabilities | | | Assets and Liabilities | | |
| Hedging Instruments | Location | | Fair Value | Location | | Fair Value |
| Foreign exchange contracts | Unrealized appreciation on OTC | $ | — | Unrealized depreciation on OTC | $ | 199,449 |
| | forward exchange contracts | | | forward exchange contracts | | |
| Value recovery instruments. | Investments in securities, at value | | 2,277,853 | Investments in securities, at value | | — |
| Totals | | $ | 2,277,853 | | $ | 199,449 |
26 Semiannual Report
ftinstitutional.com
FRANKLIN GLOBAL TRUST
NOTES TO CONSOLIDATED FINANCIAL STATEMENTS (UNAUDITED)
Franklin Emerging Market Debt Opportunities Fund (continued)
For the period ended January 31, 2017, the effect of derivative contracts in the Fund’s Consolidated Statement of Operations was as follows:
| | | | | | | | |
| | | | | | | | Net Change in | |
| | | | | | | | Unrealized | |
| Derivative Contracts | | | Net Realized | | | | Appreciation | |
| Not Accounted for as | Consolidated Statement of | | Gain (Loss) for | | Consolidated Statement of | | (Depreciation) | |
| Hedging Instruments | Operations Locations | | the Period | | Operations Locations | | for the Period | |
| |
| | Net realized gain (loss) from: | | | | Net change in unrealized | | | |
| | | | | | appreciation (depreciation) on: | | | |
| Foreign exchange contracts | Foreign currency transactions | $ | (399,509 | )a | Translation of other assets and | $ | 2,013,036 | a |
| | | | | | liabilities denominated in | | | |
| | | | | | foreign currencies | | | |
| Value recovery instruments | Investments | | — | | Investments | | 1,103 | |
| Totals | | $ | (399,509 | ) | | $ | 2,014,139 | |
aForward exchange contracts are included in net realized gain (loss) from foreign currency transactions and net change in unrealized appreciation (depreciation) on
translation of other assets and liabilities denominated in foreign currencies in the Consolidated Statement of Operations.
For the period ended January 31, 2017, the average month end fair value of derivatives represented 0.2% of average month end net assets. The average month end number of open derivative contracts for the period was 7.
See Note 1(d) regarding derivative financial instruments.
11. Credit Facility
The Fund, together with other U.S. registered and foreign investment funds (collectively, Borrowers), managed by Franklin Templeton Investments, are borrowers in a joint syndicated senior unsecured credit facility totaling $2 billion (Global Credit Facility) which matured on February 10, 2017. This Global Credit Facility provides a source of funds to the Borrowers for temporary and emergency purposes, including the ability to meet future unanticipated or unusually large redemption requests. Effective February 10, 2017, the Borrowers renewed the Global Credit Facility for a one year term, maturing February 9, 2018, for a total of $2 billion.
Under the terms of the Global Credit Facility, the Fund shall, in addition to interest charged on any borrowings made by the Fund and other costs incurred by the Fund, pay its share of fees and expenses incurred in connection with the implementation and maintenance of the Global Credit Facility, based upon its relative share of the aggregate net assets of all of the Borrowers, including an annual commitment fee of 0.15% based upon the unused portion of the Global Credit Facility. These fees are reflected in other expenses in the Consolidated Statement of Operations. During the period ended January 31, 2017, the Fund did not use the Global Credit Facility.
12. Fair Value Measurements
The Fund follows a fair value hierarchy that distinguishes between market data obtained from independent sources (observable inputs) and the Fund’s own market assumptions (unobservable inputs). These inputs are used in determining the value of the Fund’s financial instruments and are summarized in the following fair value hierarchy:
- Level 1 – quoted prices in active markets for identical financial instruments
- Level 2 – other significant observable inputs (including quoted prices for similar financial instruments, interest rates, prepayment speed, credit risk, etc.)
- Level 3 – significant unobservable inputs (including the Fund’s own assumptions in determining the fair value of financial instruments)
ftinstitutional.com
Semiannual Report 27
FRANKLIN GLOBAL TRUST
NOTES TO CONSOLIDATED FINANCIAL STATEMENTS (UNAUDITED)
Franklin Emerging Market Debt Opportunities Fund (continued)
12. Fair Value Measurements (continued)
The input levels are not necessarily an indication of the risk or liquidity associated with financial instruments at that level.
For movements between the levels within the fair value hierarchy, the Fund has adopted a policy of recognizing the transfers as of the date of the underlying event which caused the movement.
A summary of inputs used as of January 31, 2017, in valuing the Fund’s assets and liabilities carried at fair value, is as follows:
| | | | | | | | | |
| | | Level 1 | | Level 2 | | Level 3 | | | Total |
| Assets: | | | | | | | | | |
| Investments in Securities: | | | | | | | | | |
| Warrants | $ | — | $ | 13,839,813 | $ | — | | $ | 13,839,813 |
| Quasi-Sovereign and Corporate Bonds | | — | | 157,508,518 | | 9,853,160 | | | 167,361,678 |
| Loan Participations and Assignments | | — | | 40,830,721 | | 47,813,171 | a | | 88,643,892 |
| Foreign Government and Agency Securities | | — | | 191,733,927 | | 1,758,562 | | | 193,492,489 |
| Common Stocks | | — | | — | | —a | | | — |
| Private Limited Partnership Fund. | | — | | — | | 365,356 | | | 365,356 |
| Short Term Investments | | 13,112,865 | | 14,108,878 | | — | | | 27,221,743 |
| Total Investments in Securities | $ | 13,112,865 | $ | 418,021,857 | $ | 59,790,249 | | $ | 490,924,971 |
| |
| Liabilities: | | | | | | | | | |
| Other Financial Instruments: | | | | | | | | | |
| Forward Exchange Contracts | $ | — | $ | 199,449 | $ | — | | $ | 199,449 |
aIncludes securities determined to have no value at January 31, 2017.
A reconciliation of assets in which Level 3 inputs are used in determining fair value is presented when there are significant Level 3 financial instruments at the end of the period. At January 31, 2017, the reconciliation of assets, is as follows:
| | | | | | | | | | | | | | | | | | | | | | | | |
| | | | | | | | | | | | | | | | | | | | | | | | Net Change in | |
| | | | | | | | | | | | | | | | | | | | | | | | Unrealized | |
| | | | | | | | | | | | | | | | | | | | | | | | Appreciation | |
| | | | | | | | | | | | | | | | Net | | Net | | | | | | (Depreciation) | |
| | | Balance at | | | | | | | | Transfer | Transfer | | | | Realized | | Unrealized | | | Balance | | | on Assets | |
| | | Beginning of | | | | | | | | Into | Out of | | Cost Basis | | Gain | | Appreciation | | | at End | | | Held at | |
| | | Period | | | Purchases | | | Sales | | Level 3 | Level 3 | | Adjustmentsa | | (Loss) | | (Depreciation) | | | of Period | | | Period End | |
| Assets: | | | | | | | | | | | | | | | | | | | | | | | | |
| Investments in Securities: | | | | | | | | | | | | | | | | | | | | | | | | |
| Quasi-Sovereign and | | | | | | | | | | | | | | | | | | | | | | | | |
| Corporate Bonds | $ | 9,013,227 | | $ | 442,486 | | $ | – $ | | – | $– | | $ – | | $ – | $ | 397,447 | | $ | 9,853,160 | | $ | 397,447 | |
| Loan Participations and | | | | | | | | | | | | | | | | | | | | | | | | |
| Assignments | | 33,026,695 | b | | 16,515,500 | | (2,129,213 | ) | – | – | | 272,216 | | 211 | | 127,762 | | | 47,813,171 | b | | 127,762 | |
| Foreign Government and | | | | | | | | | | | | | | | | | | | | | | | | |
| Agency Securities | | – | | | – | | | – | | 1,758,562 | – | | – | | – | | – | | | 1,758,562 | | | – | |
| Private Limited Partnership | | | | | | | | | | | | | | | | | | | | | | | | |
| Fund | | 568,829 | | | – | | | – | | – | – | | – | | – | | (203,473 | ) | | 365,356 | | | (203,473 | ) |
| Total Investments in | | | | | | | | | | | | | | | | | | | | | | | | |
| Securities | $ | 42,608,751 | | $ | 16,957,986 | $ | (2,129,213) $1,758,562 | $– | $ | 272,216 | $ | 211 | $ | 321,736 | | $ | 59,790,249 | | $ | 321,736 | |
| aMay include accretion, amortization, partnership adjustments, and/or other cost basis adjustments. | | | | | | | | | | | | | |
| bIncludes securities determined to have no value. | | | | | | | | | | | | | | | | | | | | | | |
28 Semiannual Report
ftinstitutional.com
FRANKLIN GLOBAL TRUST
NOTES TO CONSOLIDATED FINANCIAL STATEMENTS (UNAUDITED)
Franklin Emerging Market Debt Opportunities Fund (continued)
Significant unobservable valuation inputs developed by the VC for material Level 3 financial instruments and impact to fair value as a result of changes in unobservable valuation inputs as of January 31, 2017, are as follows:
| | | | | | | | |
| | | | | | | | | Impact to Fair |
| | | Fair Value at | | | | Amount/ | | Value if Input |
| Description | | End of Period | | Valuation Technique | Unobservable Inputs | Range | | Increasesa |
| Assets: | | | | | | | | |
| Investments in | | | | | | | | |
| Securities: | | | | | | | | |
| Quasi-Sovereign | $ | 9,409,308 | | Probability Weighted | Free Cash Flow | $0.0-$15.8 (mil) | | Increasec |
| and Corporate | | | | Discounted Cash Flow | | | | |
| Bonds. | | | | Modelb | | | | |
| | | | | | Discount rate | 3.6 | % | Decrease |
| | | | | | Time to settlement | 9 months | | Increased |
| | | | | Market Comparables | Discount for lack of marketability | 30 | % | Decreasec |
| |
| Loan Participations | | 31,677,103 | | Consensus Pricing | Weighted average of offered quotes | 60.34-69.33 | | JPY Increasee |
| and Assignments . | | | | | | | | |
| | | | | Discounted Cash Flow | Free Cash Flow | $37.3 | (mil) | Increasec |
| | | | | Model | | | | |
| |
| | | | | | Discount rate | 8.8%-11.0% | | Decrease |
| All Other | | 18,703,838 | g | | | | | |
| Investmentsf | | | | | | | | |
| |
| Total | $ | 59,790,249 | | | | | | |
aRepresents the directional change in the fair value of the Level 3 financial instruments that would result from a significant and reasonable increase in the corresponding
input. A significant and reasonable decrease in the input would have the opposite effect. Significant impacts, if any, to fair value and/or net assets have been indicated.
bAs noted in the Consolidated Statement of Investments, this security represents Ghanaian court claims filed against the National Investment Bank of Ghana. The valuation
of these claims is based on principal plus 11% simple interest commencing on default date, and is adjusted for several probability weighted outcomes arising from the legal
proceedings. Considerations include the receipt and form of payment and related timing. There is uncertainty due to the risk of adverse litigation, political and economic
conditions, and timing of the payment. Actual results could differ from management’s estimates and these differences could be material.
cRepresents a significant impact to fair value and net assets.
dImpact to fair value takes into consideration accrual of interest as indicated above.
eRepresents a significant impact to fair value but not net assets.
fIncludes financial instruments with values derived using prior transaction prices or third party pricing information without adjustment for which such inputs are unobservable.
May also include fair value of immaterial financial instruments developed using various valuation techniques and unobservable inputs.
gIncludes securities determined to have no value at January 31, 2017.
13. Investment Company Reporting Modernization
In October 2016, the U.S. Securities and Exchange Commission adopted new rules and amended existing rules (together, final rules) intended to modernize the reporting and disclosure of information by registered investment companies. In part, the final rules amend Regulation S-X and require standardized, enhanced disclosures about derivatives in investment company financial statements, as well as other amendments. The compliance date for the amendments to Regulation S-X is August 1, 2017. Management is currently evaluating the impact that the adoption of the amendments to Regulation S-X will have on the Fund’s consolidated financial statements and related disclosures.
14. Subsequent Events
The Fund has evaluated subsequent events through the issuance of the consolidated financial statements and determined that no events have occurred that require disclosure other than those already disclosed in the consolidated financial statements.
ftinstitutional.com
Semiannual Report 29
FRANKLIN GLOBAL TRUST
NOTES TO CONSOLIDATED FINANCIAL STATEMENTS (UNAUDITED)
Franklin Emerging Market Debt Opportunities Fund (continued)
| | | | | |
| Abbreviations | | | | |
| |
| Counterparty | Currency | Selected Portfolio |
| CITI | Citibank N.A. | AZN | Azerbaijan Manat | FRN | Floating Rate Note |
| MSCO | Morgan Stanley | BRL | Brazilian Real | GDP | Gross Domestic Product |
| RBCCM | Royal Bank of Canada | CHF | Swiss Franc | GDR | Global Depositary Receipt |
| | | COP | Colombian Peso | PIK | Payment-In-Kind |
| | | DEM | Deutsche Mark | PTN | Pass-through Note |
| | | EUR | Euro | VRI | Value Recovery Instruments |
| | | GHS | Ghanaian Cedi | | |
| | | INR | Indian Rupee | | |
| | | JPY | Japanese Yen | | |
| | | KES | Kenyan Shilling | | |
| | | MXN | Mexican Peso | | |
| | | PEN | Peruvian Nuevo Sol | | |
| | | RUB | Russian Ruble | | |
| | | TRY | Turkish Lira | | |
| | | UGX | Ugandan Shilling | | |
| | | UYU | Uruguayan Peso | | |
| | | ZAR | South African Rand | | |
30 Semiannual Report
ftinstitutional.com
FRANKLIN GLOBAL TRUST
FRANKLIN EMERGING MARKET DEBT OPPORTUNITIES FUND
Shareholder Information
Proxy Voting Policies and Procedures
The Fund’s investment manager has established Proxy Voting
Policies and Procedures (Policies) that the Fund uses to
determine how to vote proxies relating to portfolio securities.
Shareholders may view the Fund’s complete Policies online at
franklintempleton.com. Alternatively, shareholders may request
copies of the Policies free of charge by calling the Proxy Group
collect at (954) 527-7678 or by sending a written request
to: Franklin Templeton Companies, LLC, 300 S.E. 2nd Street,
Fort Lauderdale, FL 33301, Attention: Proxy Group. Copies of
the Fund’s proxy voting records are also made available online
at franklintempleton.com and posted on the U.S. Securities and
Exchange Commission’s website at sec.gov and reflect the
most recent 12-month period ended June 30.
Quarterly Consolidated Statement of
Investments
The Trust, on behalf of the Fund, files a complete consolidated
statement of investments with the U.S. Securities and Exchange
Commission for the first and third quarters for each fiscal year
on Form N-Q. Shareholders may view the filed Form N-Q by
visiting the Commission’s website at sec.gov. The filed form
may also be viewed and copied at the Commission’s Public
Reference Room in Washington, DC. Information regarding the
operations of the Public Reference Room may be obtained by
calling (800) SEC-0330.
ftinstitutional.com
Semiannual Report 31
This page intentionally left blank.
| |
| Contents | |
| |
| Semiannual Report | |
| Franklin Global Listed Infrastructure Fund | 3 |
| Performance Summary | 8 |
| Your Fund's Expenses | 10 |
| Financial Highlights and Statement of Investments | 11 |
| Financial Statements | 19 |
| Notes to Financial Statements | 23 |
| Shareholder Information | 30 |
Visit franklintempleton.com for fund updates, to access your account, or to find helpful financial planning tools.
2 Semiannual Report
franklintempleton.com
Semiannual Report
Franklin Global Listed Infrastructure Fund
This semiannual report for Franklin Global Listed Infrastructure Fund covers the period ended January 31, 2017.
Your Fund’s Goal and Main Investments
The Fund seeks total investment return consisting of income and capital appreciation by investing, under normal market conditions, predominantly in infrastructure related companies globally, as defined in the Fund’s prospectus.
Performance Overview
For the period under review, the Fund’s Class A shares had a -4.51%% cumulative total return. In comparison, the Standard & Poor’s (S&P) Global Infrastructure Index, which tracks performance of stocks of large infrastructure companies around the world, had a -2.82% cumulative total return.1 You can find more of the Fund’s performance data in the Performance Summary beginning on page 8.
Performance data represent past performance, which does not guarantee future results. Investment return and principal value will fluctuate, and you may have a gain or loss when you sell your shares. Current performance may differ from figures shown. For most recent month-end performance, go to franklintempleton.com or call (800) 342-5236.
Economic and Market Overview
The U.S. economy continued to grow in 2016’s fourth quarter, though at a slower pace compared to the third quarter. Strength in consumer spending, private inventory investment, residential and non-residential fixed investments, and state and local government spending was partially offset by declines in net exports and federal government spending. The manufacturing sector generally expanded, and the services sector continued to grow. The unemployment rate decreased slightly from 4.9% in July 2016 to 4.8% at period-end.2 Annual inflation, as measured by the Consumer Price Index, ended the period at its highest level in more than four years. At its December meeting, the U.S. Federal Reserve (Fed) raised its target range for the federal funds rate to 0.50%–0.75%, as policymakers cited
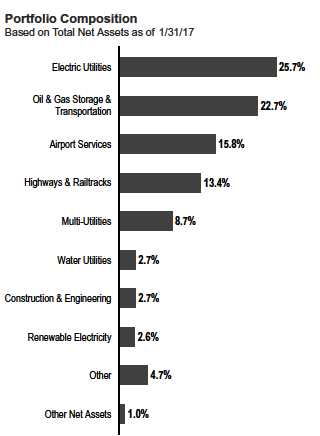
improved labor market conditions and higher inflation. The broad U.S. stock market, as measured by the Standard & Poor’s 500 Index, advanced for the six months ended January 31, 2017.
The global economy in general expanded during the six months under review, aided by accommodative monetary policies of various central banks. In this environment, global developed and emerging market stocks rose, as measured by the MSCI All Country World Index. Further supporting global markets were an improvement in industrial commodity prices, encouraging earnings reports from the U.S. banking sector, investor optimism about U.S. President Donald Trump’s pro-growth policies, and an Organization of the Petroleum Exporting
1. Source: Morningstar.
The index is unmanaged and includes reinvestment of any income or distributions. It does not reflect any fees, expenses or sales charges. One cannot invest directly in an
index, and an index is not representative of the Fund’s portfolio.
2. Source: Bureau of Labor Statistics.
The dollar value, number of shares or principal amount, and names of all portfolio holdings are listed in the Fund’s Statement of Investments (SOI).
The SOI begins on page 16.
franklintempleton.com
Semiannual Report 3
FRANKLIN GLOBAL LISTED INFRASTRUCTURE FUND
Countries deal to curb oil production. However, investors expressed concerns about the terms of the U.K.’s exit from the European Union, President Trump’s protectionist policies and executive order banning entry from seven Muslim-majority countries, uncertainty about the Fed’s timing for raising interest rates and the health of European banks.
In Europe, the U.K.’s annualized economic growth accelerated in 2016’s second half, driven by gross fixed capital formation in the third quarter and manufacturing and services in the fourth quarter. The eurozone’s economic growth improved in the third and fourth quarters, while the region’s annual inflation rate rose to its highest level in four years. At its December meeting, the European Central Bank (ECB) extended the continuation of its monthly asset purchases from March to December 2017, but it planned to scale back the purchase amount beginning in April. In January, the ECB kept its key policy rates unchanged and retained its monthly asset purchases, indicating that it could increase the program in size and duration if needed.
In Asia, Japan’s quarterly gross domestic product grew slower in 2016’s third quarter compared with the second quarter, mainly due to declines in private non-residential and public investments. At its September meeting, the Bank of Japan overhauled its monetary stimulus program to adjust Japanese government bond purchases with the aim of keeping the 10-year rate for these bonds near 0%. China’s economy grew at a faster-than-expected rate in 2016’s fourth quarter compared to 2015’s fourth quarter, supported by consumer spending and a property market driven by robust bank lending. The People’s Bank of China also devalued its currency against the U.S. dollar during the period.
Investment Strategy
When selecting investments for the Fund’s portfolio, we use a bottom-up stock selection process that incorporates macro-level views in the evaluation process. Our portfolio construction process combines bottom-up analysis of individual stock and infrastructure market fundamentals with top-down macro overlays to provide country/regional, infrastructure sector and company size perspectives in identifying international/local cyclical and thematic trends that highlight investment opportunities. Under normal market conditions, the Fund invests at least 80% of its net assets in securities listed on a domestic or foreign exchange of companies that are located around the world (including emerging markets) and whose principal business is the ownership, management, construction, operation, use or financing of infrastructure assets. Under normal market conditions, the Fund expects to invest at least 40% of its net assets in foreign securities. We may invest up to
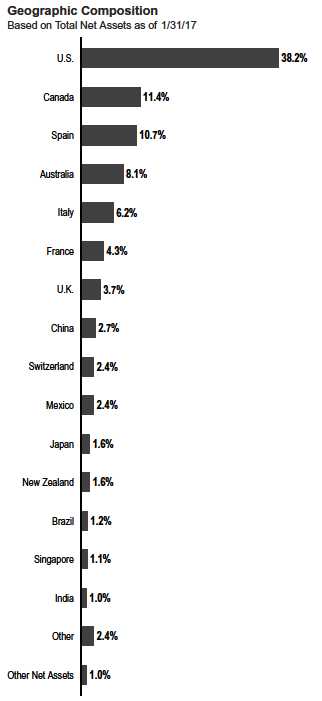
20% of net assets in emerging markets and may invest in infrastructure-related companies of any market capitalization size. We may use derivative instruments, including currency forward and futures contracts from time to time to help manage currency risks and manage local currency exposure.
Manager’s Discussion
During the six-month period under review, key detractors from the Fund’s performance relative to the S&P Global
4 Semiannual Report
franklintempleton.com
FRANKLIN GLOBAL LISTED INFRASTRUCTURE FUND
What is a currency forward contract?
A currency forward contract is an agreement between the Fund and a counterparty to buy or sell a foreign currency in exchange for another currency at a specific exchange rate on a future date.
What is a futures contract?
A futures contract is an agreement between the Fund and a counterparty made through a U.S. or foreign futures exchange to buy or sell an underlying instrument or asset at a specific priceonafuturedate.
| | |
| Top 10 Holdings | | |
| 1/31/17 | | |
| Company | % of Total | |
| Sector/Industry, Country | Net Assets | |
| Transurban Group | 6.2 | % |
| Highways & Railtracks, Australia | | |
| Aena SA | 5.0 | % |
| Airport Services, Spain | | |
| TransCanada Corp. | 4.7 | % |
| Oil & Gas Storage & Transportation, Canada | | |
| PG&E Corp. | 4.4 | % |
| Electric Utilities, U.S. | | |
| NextEra Energy Inc. | 4.4 | % |
| Electric Utilities, U.S. | | |
| Enbridge Inc. | 3.4 | % |
| Oil & Gas Storage & Transportation, Canada | | |
| Atlantia SpA | 3.3 | % |
| Highways & Railtracks, Italy | | |
| National Grid PLC | 2.9 | % |
| Multi-Utilities, U.K. | | |
| Enel SpA | 2.8 | % |
| Electric Utilities, Italy | | |
| Iberdrola SA | 2.8 | % |
| Electric Utilities, Spain | | |
Infrastructure Index included stock selection in the industrials sector, with holdings such as Japan Airport Terminal.3 Japan Airport Terminal is the operator of Tokyo Haneda Airport’s domestic and international terminals as well as retail shops in the international terminals of Narita and Kansai airports. The company has been the main beneficiary of continued strength in inbound tourism as Japan prepares for an expected increase in annual tourist arrivals. Although strong inbound traffic growth continued in 2016, lower-than-expected per passenger retail spending impacted the company’s merchandise sales business. The company was forced to lower its operating profit guidance during the period. Despite shorter term headwinds, however, we have continued to see upside potential in the company relative to its Japanese infrastructure peers. We believe the company’s publication of its medium-term business plan after its fiscal year ends in March could be a supportive catalyst, highlighting the demand for new investment as the company expands the number of international airline slots at Haneda Airport.
Stock selection and overweighting in the utilities sector also detracted from results compared to the benchmark.4 Shares of EDP Renovaveis declined over the reporting period.5 EDPisa global renewable energy company headquartered in Spain. The company expects to increase its global capacity by 2020, and a majority of its investments will be in wind generation in the U.S. The market interpreted Donald Trump’s U.S. presidential election victory as negative for the renewable energy business, which prompted a sharp sell-off in the stock. Companies in the renewable energy sector in the U.S. have also benefited in the past from selling stakes in their projects to institutional investors that take advantage of tax credits associated with renewable energy production, and so market participants have suggested that this source of funding may be unavailable if President Trump indeed tackles tax reform. In our view, the current incentive schemes in place at the federal level should continue given the strong bipartisan support they received in Congress in 2015. In EDP’s case specifically, given the percentage of its pipeline that is already under development, we view any uncertainty as less material than for peers. We also find the company’s valuation compelling after the sell-off, and believe the long-term attractiveness of its renewables assets and development expertise is not likely to change despite short-term uncertainty.
The Fund’s underweighted investment in natural gas infrastructure company Spectra Energy pressured Fund performance further. The company owns and operates natural gas-related energy assets and a crude oil pipeline system connecting Canadian and U.S.-based producers to refineries. We held an underweighted position in Spectra since we believed it to be one of the most expensive midstream stocks in the market. However, in September 2016, Canadian oil and gas transportation and distribution company Enbridge, also a Fund holding, bought Spectra at a premium to the stock’s previous closing price. Moreover, the stock increased in value prior to
3. The industrials sector comprises airport services, construction and engineering, highways and railtracks, and marine ports and services in the SOI.
4. The utilities sector comprises electric utilities, gas utilities, multi-utilities, renewable electricity and water utilities in the SOI.
5. Not part of the index.
franklintempleton.com
Semiannual Report 5
FRANKLIN GLOBAL LISTED INFRASTRUCTURE FUND
September in anticipation of the buyout which hurt our portfolio performance.
It is important to recognize the effect of currency movements on the Fund’s performance. In general, if the value of the U.S. dollar goes up compared with a foreign currency, an investment traded in that foreign currency will go down in value because it will be worth fewer U.S. dollars. This can have a negative effect on Fund performance. Conversely, when the U.S. dollar weakens in relation to a foreign currency, an investment traded in that foreign currency will increase in value, which can contribute to Fund performance. For the six months ended January 31, 2017, the U.S. dollar rose in value relative to most currencies. As a result, the Fund’s performance was negatively affected by the portfolio’s substantial investment in securities with non-U.S. currency exposure.
In contrast, the Fund’s investment in electric utility Adani Transmissions supported relative performance over the reporting period.5 India-based Adani Transmissions builds and owns regulated electricity transmission lines across India. We believe the firm is one of India’s best managed transmission companies. We expect the company’s earnings-per-share to grow over the next few years based on current construction projects and approved future projects. The company also has been buying transmission assets from distressed infrastructure developers. The firm completed two sets of transmission acquisitions over the last three months of the period. We like their strategy of growth through acquisitions as well as building new transmission lines. The company’s management team has had extensive experience in developing infrastructure assets across India. We also believe company valuations in India are quite cheap due to assets being sold at fire sale prices by distressed infrastructure companies in India.
Also within the utilities sector, the Fund’s underweighted position in Engie boosted results.6 Engie is a French electric utility with global operations across electricity generation and distribution, natural gas and renewable energy. The company announced an ambitious restructuring plan at the end of 2015, which outlined its intention to divest its oil and gas exploration and production and coal power generation businesses to focus more on renewables and electricity and gas distribution networks going forward. Management’s decision to cut Engie’s dividend as it concentrated on executing the restructuring plan, however, severely limited the market’s appetite for Engie in 2016. Given that Engie is our largest underweighted position in the European utility sector, we also benefited when Donald Trump’s November victory in the U.S. presidential election helped catalyze a sector rotation from defensive industry stocks (i.e. utilities) into more cyclical stocks.
Although industrials was an overall detractor at the sector level, an underweighted investment in Sydney Airport enhanced relative Fund returns. The company develops and maintains the airport infrastructure and leases terminal space to airlines and retailers. The company charges airlines fees on a per-passenger basis and generates revenues by renting space to retailers, hotels and parking lots within the airport area. Growth in passenger numbers year-over-year has been improving due to increased inbound tourism from Asia. International passenger fees are significantly higher than operating earnings. Moreover, international tourists also increase the value of retail space rented to duty free shops. However, there was uncertainty around the Australian government’s willingness to partner with Sydney Airport in building a second airport in western Sydney, expected to be operational by 2026. In the fourth quarter of 2016, the Australian government decided not to finance any portion of the second Sydney airport, leaving the financing responsibility to Sydney Airport exclusively. The market reacted negatively to this development since the company’s balance sheet is stretched and cannot finance such a huge project. Consequently, the stock has underperformed its infrastructure peers in Australia.
6. Not held at period-end.
See www.franklintempletondatasources.com for additional data provider information.
6 Semiannual Report
franklintempleton.com
FRANKLIN GLOBAL LISTED INFRASTRUCTURE FUND
Thank you for your continued participation in Franklin Global Listed Infrastructure Fund. We look forward to serving your future investment needs.

The foregoing information reflects our analysis, opinions and portfolio holdings as of January 31, 2017, the end of the reporting period. The way we implement our main investment strategies and the resulting portfolio holdings may change depending on factors such as market and economic conditions. These opinions may not be relied upon as investment advice or an offer for a particular security. The information is not a complete analysis of every aspect of any market, country, industry, security or the Fund. Statements of fact are from sources considered reliable, but the investment manager makes no representation or warranty as to their completeness or accuracy. Although historical performance is no guarantee of future results, these insights may help you understand our investment management philosophy.
Emily Foshag is a portfolio manager and research analyst for the global listed infrastructure strategy. She focuses her research efforts on listed infrastructure securities in Europe, Latin America and Asia, and has been a member of the listed infrastructure team since the strategy’s inception in 2013. Previously, Ms. Foshag was involved in the development of Franklin Real Asset Advisors’ private infrastructure and real resources strategy. She began her career with Franklin Templeton in 2010 as an associate in the firm’s rotational training program.
CFA® is a trademark owned by CFA Institute.
franklintempleton.com
Semiannual Report 7
FRANKLIN GLOBAL LISTED INFRASTRUCTURE FUND
Performance Summary as of January 31, 2017
The performance table does not reflect any taxes that a shareholder would pay on Fund dividends, capital gain distributions, if any, or any realized gains on the sale of Fund shares. Total return reflects reinvestment of the Fund’s dividends and capital gain distributions, if any, and any unrealized gains or losses.
Performance as of 1/31/171
Cumulative total return excludes sales charges. Average annual total return includes maximum sales charges. Sales charges will vary depending on the size of the investment and the class of share purchased. The maximum is 5.75% and the minimum is 0%. Class A: 5.75% maximum initial sales charge; Advisor Class: no sales charges. For other share classes, visit franklintempleton.com.
| | | | |
| | Cumulative | | Average Annual | |
| Share Class | Total Return2 | | Total Return3 | |
| A | | | | |
| 6-Month | -4.51 | % | -9.98 | % |
| 1-Year | +13.54 | % | +6.97 | % |
| 3-Year | +16.23 | % | +3.10 | % |
| Since Inception (9/6/13) | +25.37 | % | +5.03 | % |
| Advisor | | | | |
| 6-Month | -4.34 | % | -4.34 | % |
| 1-Year | +13.83 | % | +13.83 | % |
| 3-Year | +17.17 | % | +5.42 | % |
| Since Inception (9/6/13) | +26.57 | % | +7.17 | % |
Performance data represent past performance, which does not guarantee future results. Investment return and principal value will fluctuate, and you may have a gain or loss when you sell your shares. Current performance may differ from figures shown. For most recent month-end performance, go to franklintempleton.com or call (800) 342-5236.
See page 9 for Performance Summary footnotes.
8 Semiannual Report
franklintempleton.com
| | | | |
| | | | FRANKLIN GLOBAL LISTED INFRASTRUCTURE FUND | |
| | | | PERFORMANCE SUMMARY | |
| |
| Total Annual Operating Expenses4 | | | |
| Share Class | With Waiver | | Without Waiver | |
| A | 1.40 | % | 2.24 | % |
| Advisor | 1.15 | % | 1.99 | % |
Each class of shares is available to certain eligible investors and has different annual fees and expenses, as described in the prospectus.
All investments involve risks, including possible loss of principal. Investments in infrastructure-related securities involve special risks, such as high interest
costs, high leverage and increased susceptibility to adverse economic or regulatory developments affecting the sector. Special risks are associated with foreign
investing, including currency rate fluctuations, economic instability and political developments. Because the Fund may invest at least a significant portion of its
assets in companies in a specific region, including Europe, the Fund is subject to greater risks of adverse developments in that region (i.e., including uncertainty
related to the U.K.’s vote to exit the European Union (EU) and financial instability in some countries in the EU including Greece, Italy and Spain) and/or the
surrounding regions than a fund that is more broadly diversified geographically. Investments in utility company securities, if purchased for dividend yield, involve
additional interest rate risks. When interest rates have risen, the stock prices of these companies have tended to fall. Thus, as the prices of utility company stocks
in the Fund adjust to a rise in interest rates, the Fund’s share price may decline. By focusing on an industry or group of industries, the Fund carries much greater
risk of adverse developments and price movements in such industries than a fund that invests in a wider variety of industries. The Fund is actively managed but
there is no guarantee that the manager’s investment decisions will produce the desired results. The Fund’s prospectus also includes a description of the main
investment risks.
1. The Fund has an expense reduction contractually guaranteed through 11/30/17. Fund investment results reflect the expense reduction; without this reduction, the results
would have been lower.
2. Cumulative total return represents the change in value of an investment over the periods indicated.
3. Average annual total return represents the average annual change in value of an investment over the periods indicated. Return for less than one year, ifany,hasnotbeen
annualized.
4. Figures are as stated in the Fund’s current prospectus and may differ from the expense ratios disclosed in the Your Fund’s Expenses and Financial Highlights sections in this
report. In periods of market volatility, assets may decline significantly, causing total annual Fund operating expenses to become higher than the figures shown.
franklintempleton.com
Semiannual Report 9
FRANKLIN GLOBAL LISTED INFRASTRUCTURE FUND
Your Fund’s Expenses
As a Fund shareholder, you can incur two types of costs: (1) transaction costs, including sales charges (loads) on Fund purchases and redemptions; and (2) ongoing Fund costs, including management fees, distribution and service (12b-1) fees, and other Fund expenses. All mutual funds have ongoing costs, sometimes referred to as operating expenses. The table below shows ongoing costs of investing in the Fund and can help you understand these costs and compare them with those of other mutual funds. The table assumes a $1,000 investment held for the six months indicated.
Actual Fund Expenses
The table below provides information about actual account values and actual expenses in the columns under the heading “Actual.” In these columns the Fund’s actual return, which includes the effect of Fund expenses, is used to calculate the “Ending Account Value” for each class of shares. You can estimate the expenses you paid during the period by following these steps (of course, your account value and expenses will differ from those in this illustration): Divide your account value by $1,000 (if your account had an $8,600 value, then $8,600 ÷ $1,000 = 8.6). Then multiply the result by the number in the row for your class of shares under the headings “Actual” and “Expenses Paid During Period” (if Actual Expenses Paid During Period were $7.50, then 8.6 x $7.50 = $64.50). In this illustration, the actual expenses paid this period are $64.50.
Hypothetical Example for Comparison with Other Funds
Under the heading “Hypothetical” in the table, information is provided about hypothetical account values and hypothetical expenses based on the Fund’s actual expense ratio and an assumed rate of return of 5% per year before expenses, which is not the Fund’s actual return. This information may not be used to estimate the actual ending account balance or expenses you paid for the period, but it can help you compare ongoing costs of investing in the Fund with those of other funds. To do so, compare this 5% hypothetical example for the class of shares you hold with the 5% hypothetical examples that appear in the shareholder reports of other funds.
Please note that expenses shown in the table are meant to highlight ongoing costs and do not reflect any transactional costs. Therefore, information under the heading “Hypothetical” is useful in comparing ongoing costs only, and will not help you compare total costs of owning different funds. In addition, if transactional costs were included, your total costs would have been higher.
| | | | | | | | | | | | | | |
| | | | | | | Actual | | | Hypothetical | | | |
| | | | | (actual return after expenses) | | (5% annual return before expenses) | | |
| | | | | | | Expenses | | | | Expenses | Net | |
| | | Beginning | | Ending | | Paid During | | Ending | | Paid During | Annualized | |
| Share | | Account | | Account | | Period | | Account | | Period | Expense | |
| Class | | Value 8/1/16 | | Value 1/31/17 | | 8/1/16–1/31/171,2 | | Value 1/31/17 | | 8/1/16–1/31/171,2 | Ratio2 | |
| A | $ | 1,000 | $ | 954.90 | | $ | 6.90 | $ | 1,018.15 | | $ | 7.12 | 1.40 | % |
| C | $ | 1,000 | $ | 951.00 | | $ 10.57 | $ | 1,014.37 | | $ 10.92 | 2.15 | % |
| R | $ | 1,000 | $ | 953.60 | | $ | 7.83 | $ | 1,017.19 | | $ | 8.08 | 1.59 | % |
| R6 | $ | 1,000 | $ | 957.30 | | $ | 4.69 | $ | 1,020.42 | | $ | 4.84 | 0.95 | % |
| Advisor | $ | 1,000 | $ | 956.60 | | $ | 5.67 | $ | 1,019.41 | | $ | 5.85 | 1.15 | % |
1. Expenses are equal to the annualized expense ratio for the six-month period as indicated above–in the far right column–multiplied by the simple average account value
over the period indicated, and then multiplied by 184/365 to reflect the one-half year period.
2. Reflects expenses after fee waivers and expense reimbursements.
10 Semiannual Report
franklintempleton.com
FRANKLIN GLOBAL TRUST
| | | | | | | | | | | | |
| Financial Highlights | | | | | | | | | | | | |
| Franklin Global Listed Infrastructure Fund | | | | | | | | | | | | |
| | | Six Months Ended | | | | | | | | | | |
| | | January 31, 2017 | | | Year Ended July 31, | | | | |
| | | (unaudited) | | | 2016 | | | 2015 | | | 2014 | a |
| Class A | | | | | | | | | | | | |
| Per share operating performance | | | | | | | | | | | | |
| (for a share outstanding throughout the period) | | | | | | | | | | | | |
| Net asset value, beginning of period | $ | 12.35 | | $ | 11.81 | | $ | 12.35 | | $ | 10.00 | |
| Income from investment operationsb: | | | | | | | | | | | | |
| Net investment incomec | | 0.08 | | | 0.22 | | | 0.19 | | | 0.27 | |
| Net realized and unrealized gains (losses) | | (0.64 | ) | | 0.51 | | | (0.34 | ) | | 2.20 | |
| Total from investment operations | | (0.56 | ) | | 0.73 | | | (0.15 | ) | | 2.47 | |
| Less distributions from: | | | | | | | | | | | | |
| Net investment income | | (0.17 | ) | | (0.18 | ) | | (0.19 | ) | | (0.11 | ) |
| Net realized gains | | — | | | (0.01 | ) | | (0.20 | ) | | (0.01 | ) |
| Total distributions | | (0.17 | ) | | (0.19 | ) | | (0.39 | ) | | (0.12 | ) |
| Net asset value, end of period | $ | 11.62 | | $ | 12.35 | | $ | 11.81 | | $ | 12.35 | |
| |
| Total returnd | | (4.51 | )% | | 6.35 | % | | (1.08 | )% | | 24.81 | % |
| |
| Ratios to average net assetse | | | | | | | | | | | | |
| Expenses before waiver and payments by affiliates | | 2.12 | % | | 2.24 | % | | 2.21 | % | | 4.03 | % |
| Expenses net of waiver and payments by affiliatesf | | 1.40 | % | | 1.40 | % | | 1.45 | % | | 1.28 | % |
| Net investment income | | 1.43 | % | | 1.93 | % | | 1.62 | % | | 2.59 | % |
| |
| Supplemental data | | | | | | | | | | | | |
| Net assets, end of period (000’s) | $ | 27,845 | | $ | 24,889 | | $ | 28,568 | | $ | 14,934 | |
| Portfolio turnover rate. | | 33.36 | % | | 63.57 | % | | 50.75 | % | | 35.24 | % |
aFor the period September 6, 2013 (commencement of operations) to July 31, 2014.
bThe amount shown for a share outstanding throughout the period may not correlate with the Statement of Operations for the period due to the timing of sales and
repurchases of the Fund’s shares in relation to income earned and/or fluctuating fair value of the investments of the Fund.
cBased on average daily shares outstanding.
dTotal return does not reflect sales commissions or contingent deferred sales charges, if applicable, and is not annualized for periods less than one year.
eRatios are annualized for periods less than one year.
fBenefit of expense reduction rounds to less than 0.01%.
franklintempleton.com The accompanying notes are an integral part of these financial statements. | Semiannual Report 11
| | | | | | | | | | | | |
| FRANKLIN GLOBAL TRUST | | | | | | | | | | | | |
| FINANCIAL HIGHLIGHTS | | | | | | | | | | | | |
| |
| |
| Franklin Global Listed Infrastructure Fund (continued) | | | | | | | | | | | | |
| | | Six Months Ended | | | | | | | | | | |
| | | January 31, 2017 | | | Year Ended July 31, | | | | |
| | | (unaudited) | | | 2016 | | | 2015 | | | 2014 | a |
| Class C | | | | | | | | | | | | |
| Per share operating performance | | | | | | | | | | | | |
| (for a share outstanding throughout the period) | | | | | | | | | | | | |
| Net asset value, beginning of period | $ | 12.28 | | $ | 11.74 | | $ | 12.28 | | $ | 10.00 | |
| Income from investment operationsb: | | | | | | | | | | | | |
| Net investment incomec | | 0.04 | | | 0.13 | | | 0.11 | | | 0.22 | |
| Net realized and unrealized gains (losses) | | (0.64 | ) | | 0.51 | | | (0.33 | ) | | 2.16 | |
| Total from investment operations | | (0.60 | ) | | 0.64 | | | (0.22 | ) | | 2.38 | |
| Less distributions from: | | | | | | | | | | | | |
| Net investment income | | (0.13 | ) | | (0.09 | ) | | (0.12 | ) | | (0.09 | ) |
| Net realized gains | | — | | | (0.01 | ) | | (0.20 | ) | | (0.01 | ) |
| Total distributions | | (0.13 | ) | | (0.10 | ) | | (0.32 | ) | | (0.10 | ) |
| Net asset value, end of period | $ | 11.55 | | $ | 12.28 | | $ | 11.74 | | $ | 12.28 | |
| |
| Total returnd | | (4.90 | )% | | 5.58 | % | | (1.78 | )% | | 23.95 | % |
| |
| Ratios to average net assetse | | | | | | | | | | | | |
| Expenses before waiver and payments by affiliates | | 2.87 | % | | 2.99 | % | | 2.91 | % | | 4.85 | % |
| Expenses net of waiver and payments by affiliatesf | | 2.15 | % | | 2.15 | % | | 2.15 | % | | 2.10 | % |
| Net investment income | | 0.68 | % | | 1.18 | % | | 0.92 | % | | 1.77 | % |
| |
| Supplemental data | | | | | | | | | | | | |
| Net assets, end of period (000’s) | $ | 6,021 | | $ | 4,515 | | $ | 4,855 | | $ | 2,988 | |
| Portfolio turnover rate. | | 33.36 | % | | 63.57 | % | | 50.75 | % | | 35.24 | % |
aFor the period September 6, 2013 (commencement of operations) to July 31, 2014.
bThe amount shown for a share outstanding throughout the period may not correlate with the Statement of Operations for the period due to the timing of sales and
repurchases of the Fund’s shares in relation to income earned and/or fluctuating fair value of the investments of the Fund.
cBased on average daily shares outstanding.
dTotal return does not reflect sales commissions or contingent deferred sales charges, if applicable, and is not annualized for periods less than one year.
eRatios are annualized for periods less than one year.
fBenefit of expense reduction rounds to less than 0.01%.
12 Semiannual Report | The accompanying notes are an integral part of these financial statements. franklintempleton.com
| | | | | | | | | | | | |
| | | | | | FRANKLIN GLOBAL TRUST | |
| | | | | | FINANCIAL HIGHLIGHTS | |
| |
| |
| Franklin Global Listed Infrastructure Fund (continued) | | | | | | | | | | | | |
| | | Six Months Ended | | | | | | | | | | |
| | | January 31, 2017 | | | Year Ended July 31, | | | | |
| | | (unaudited) | | | 2016 | | | 2015 | | | 2014 | a |
| Class R | | | | | | | | | | | | |
| Per share operating performance | | | | | | | | | | | | |
| (for a share outstanding throughout the period) | | | | | | | | | | | | |
| Net asset value, beginning of period | $ | 12.34 | | $ | 11.80 | | $ | 12.32 | | $ | 10.00 | |
| Income from investment operationsb: | | | | | | | | | | | | |
| Net investment incomec | | 0.07 | | | 0.19 | | | 0.16 | | | 0.25 | |
| Net realized and unrealized gains (losses) | | (0.63 | ) | | 0.51 | | | (0.33 | ) | | 2.18 | |
| Total from investment operations | | (0.56 | ) | | 0.70 | | | (0.17 | ) | | 2.43 | |
| Less distributions from: | | | | | | | | | | | | |
| Net investment income | | (0.17 | ) | | (0.15 | ) | | (0.15 | ) | | (0.10 | ) |
| Net realized gains | | — | | | (0.01 | ) | | (0.20 | ) | | (0.01 | ) |
| Total distributions | | (0.17 | ) | | (0.16 | ) | | (0.35 | ) | | (0.11 | ) |
| Net asset value, end of period | $ | 11.61 | | $ | 12.34 | | $ | 11.80 | | $ | 12.32 | |
| |
| Total returnd | | (4.64 | )% | | 6.08 | % | | (1.29 | )% | | 24.48 | % |
| |
| Ratios to average net assetse | | | | | | | | | | | | |
| Expenses before waiver and payments by affiliates | | 2.31 | % | | 2.47 | % | | 2.41 | % | | 4.35 | % |
| Expenses net of waiver and payments by affiliatesf | | 1.59 | % | | 1.63 | % | | 1.65 | % | | 1.60 | % |
| Net investment income | | 1.24 | % | | 1.70 | % | | 1.42 | % | | 2.27 | % |
| |
| Supplemental data | | | | | | | | | | | | |
| Net assets, end of period (000’s) | $ | 77 | | $ | 63 | | $ | 62 | | $ | 81 | |
| Portfolio turnover rate. | | 33.36 | % | | 63.57 | % | | 50.75 | % | | 35.24 | % |
aFor the period September 6, 2013 (commencement of operations) to July 31, 2014.
bThe amount shown for a share outstanding throughout the period may not correlate with the Statement of Operations for the period due to the timing of sales and
repurchases of the Fund’s shares in relation to income earned and/or fluctuating fair value of the investments of the Fund.
cBased on average daily shares outstanding.
dTotal return is not annualized for periods less than one year.
eRatios are annualized for periods less than one year.
fBenefit of expense reduction rounds to less than 0.01%.
franklintempleton.com The accompanying notes are an integral part of these financial statements. | Semiannual Report 13
| | | | | | | | | | | | |
| FRANKLIN GLOBAL TRUST | | | | | | | | | | | | |
| FINANCIAL HIGHLIGHTS | | | | | | | | | | | | |
| |
| |
| Franklin Global Listed Infrastructure Fund (continued) | | | | | | | | | | | | |
| | | Six Months Ended | | | | | | | | | | |
| | | January 31, 2017 | | | Year Ended July 31, | | | | |
| | | (unaudited) | | | 2016 | | | 2015 | | | 2014 | a |
| Class R6 | | | | | | | | | | | | |
| Per share operating performance | | | | | | | | | | | | |
| (for a share outstanding throughout the period) | | | | | | | | | | | | |
| Net asset value, beginning of period | $ | 12.37 | | $ | 11.83 | | $ | 12.36 | | $ | 10.00 | |
| Income from investment operationsb: | | | | | | | | | | | | |
| Net investment incomec | | 0.11 | | | 0.27 | | | 0.23 | | | 0.26 | |
| Net realized and unrealized gains (losses) | | (0.64 | ) | | 0.50 | | | (0.33 | ) | | 2.24 | |
| Total from investment operations | | (0.53 | ) | | 0.77 | | | (0.10 | ) | | 2.50 | |
| Less distributions from: | | | | | | | | | | | | |
| Net investment income | | (0.20 | ) | | (0.22 | ) | | (0.23 | ) | | (0.13 | ) |
| Net realized gains | | — | | | (0.01 | ) | | (0.20 | ) | | (0.01 | ) |
| Total distributions | | (0.20 | ) | | (0.23 | ) | | (0.43 | ) | | (0.14 | ) |
| Net asset value, end of period | $ | 11.64 | | $ | 12.37 | | $ | 11.83 | | $ | 12.36 | |
| |
| Total returnd | | (4.27 | )% | | 6.78 | % | | (0.75 | )% | | 25.20 | % |
| |
| Ratios to average net assetse | | | | | | | | | | | | |
| Expenses before waiver and payments by affiliates | | 2.12 | % | | 2.26 | % | | 2.17 | % | | 5.21 | % |
| Expenses net of waiver and payments by affiliatesf | | 0.95 | % | | 1.00 | % | | 1.07 | % | | 1.03 | % |
| Net investment income | | 1.88 | % | | 2.33 | % | | 2.00 | % | | 2.84 | % |
| |
| Supplemental data | | | | | | | | | | | | |
| Net assets, end of period (000’s) | $ | 12 | | $ | 12 | | $ | 12 | | $ | 12 | |
| Portfolio turnover rate. | | 33.36 | % | | 63.57 | % | | 50.75 | % | | 35.24 | % |
aFor the period September 6, 2013 (commencement of operations) to July 31, 2014.
bThe amount shown for a share outstanding throughout the period may not correlate with the Statement of Operations for the period due to the timing of sales and
repurchases of the Fund’s shares in relation to income earned and/or fluctuating fair value of the investments of the Fund.
cBased on average daily shares outstanding.
dTotal return is not annualized for periods less than one year.
eRatios are annualized for periods less than one year.
fBenefit of expense reduction rounds to less than 0.01%.
14 Semiannual Report | The accompanying notes are an integral part of these financial statements. franklintempleton.com
| | | | | | | | | | | | |
| | | | | | FRANKLIN GLOBAL TRUST | |
| | | | | | FINANCIAL HIGHLIGHTS | |
| |
| |
| Franklin Global Listed Infrastructure Fund (continued) | | | | | | | | | | | | |
| | | Six Months Ended | | | | | | | | | | |
| | | January 31, 2017 | | | Year Ended July 31, | | | | |
| | | (unaudited) | | | 2016 | | | 2015 | | | 2014 | a |
| Advisor Class | | | | | | | | | | | | |
| Per share operating performance | | | | | | | | | | | | |
| (for a share outstanding throughout the period) | | | | | | | | | | | | |
| Net asset value, beginning of period | $ | 12.37 | | $ | 11.83 | | $ | 12.36 | | $ | 10.00 | |
| Income from investment operationsb: | | | | | | | | | | | | |
| Net investment incomec | | 0.10 | | | 0.25 | | | 0.20 | | | 0.29 | |
| Net realized and unrealized gains (losses) | | (0.64 | ) | | 0.51 | | | (0.31 | ) | | 2.20 | |
| Total from investment operations | | (0.54 | ) | | 0.76 | | | (0.11 | ) | | 2.49 | |
| Less distributions from: | | | | | | | | | | | | |
| Net investment income | | (0.19 | ) | | (0.21 | ) | | (0.22 | ) | | (0.12 | ) |
| Net realized gains | | — | | | (0.01 | ) | | (0.20 | ) | | (0.01 | ) |
| Total distributions | | (0.19 | ) | | (0.22 | ) | | (0.42 | ) | | (0.13 | ) |
| Net asset value, end of period | $ | 11.64 | | $ | 12.37 | | $ | 11.83 | | $ | 12.36 | |
| |
| Total returnd | | (4.34 | )% | | 6.53 | % | | (0.74 | )% | | 25.13 | % |
| |
| Ratios to average net assetse | | | | | | | | | | | | |
| Expenses before waiver and payments by affiliates | | 1.87 | % | | 1.99 | % | | 1.91 | % | | 3.85 | % |
| Expenses net of waiver and payments by affiliatesf | | 1.15 | % | | 1.15 | % | | 1.15 | % | | 1.10 | % |
| Net investment income | | 1.68 | % | | 2.18 | % | | 1.92 | % | | 2.77 | % |
| |
| Supplemental data | | | | | | | | | | | | |
| Net assets, end of period (000’s) | $ | 1,967 | | $ | 957 | | $ | 556 | | $ | 357 | |
| Portfolio turnover rate. | | 33.36 | % | | 63.57 | % | | 50.75 | % | | 35.24 | % |
aFor the period September 6, 2013 (commencement of operations) to July 31, 2014.
bThe amount shown for a share outstanding throughout the period may not correlate with the Statement of Operations for the period due to the timing of sales and
repurchases of the Fund’s shares in relation to income earned and/or fluctuating fair value of the investments of the Fund.
cBased on average daily shares outstanding.
dTotal return is not annualized for periods less than one year.
eRatios are annualized for periods less than one year.
fBenefit of expense reduction rounds to less than 0.01%.
franklintempleton.com The accompanying notes are an integral part of these financial statements. | Semiannual Report 15
| | | | |
| FRANKLIN GLOBAL TRUST | | | | |
| |
| |
| |
| |
| Statement of Investments, January 31, 2017 (unaudited) | | | | |
| Franklin Global Listed Infrastructure Fund | | | | |
| | | Shares/ | | |
| | Country | Units | | Value |
| |
| Common Stocks and Other Equity Interests 98.3% | | | | |
| Airport Services 15.8% | | | | |
| Aena SA | Spain | 12,321 | $ | 1,786,759 |
| Auckland International Airport Ltd | New Zealand | 113,258 | | 568,348 |
| BBA Aviation PLC | United Kingdom | 26,450 | | 92,983 |
| Beijing Capital International Airport Co. Ltd | China | 266,000 | | 258,494 |
| Flughafen Zuerich AG | Switzerland | 4,370 | | 857,001 |
| Grupo Aeroportuario del Pacifico SAB de CV, ADR. | Mexico | 9,501 | | 734,617 |
| Grupo Aeroportuario del Sureste SAB de CV, ADR. | Mexico | 870 | | 126,037 |
| Japan Airport Terminal Co. Ltd | Japan | 15,900 | | 570,195 |
| SATS Ltd | Singapore | 105,000 | | 393,247 |
| Sydney Airport | Australia | 63,980 | | 283,819 |
| | | | | 5,671,500 |
| Construction & Engineering 2.7% | | | | |
| Eiffage SA | France | 5,480 | | 393,828 |
| a Ferrovial SA | Spain | 9,080 | | 164,166 |
| Vinci SA | France | 5,670 | | 397,201 |
| | | | | 955,195 |
| Electric Utilities 25.7% | | | | |
| a Adani Transmissions Ltd | India | 281,125 | | 263,366 |
| American Electric Power Co. Inc | United States | 9,720 | | 622,663 |
| CLP Holdings Ltd | Hong Kong | 18,000 | | 175,964 |
| Duke Energy Corp | United States | 1,560 | | 122,522 |
| Edison International | United States | 6,390 | | 465,703 |
| Emera Inc | Canada | 16,800 | | 586,323 |
| Enel Americas SA, ADR | Chile | 14,830 | | 133,915 |
| Enel SpA | Italy | 244,684 | | 1,020,528 |
| Eversource Energy | United States | 5,180 | | 286,558 |
| Exelon Corp | United States | 18,200 | | 653,016 |
| Iberdrola SA | Spain | 157,468 | | 991,611 |
| NextEra Energy Inc | United States | 12,780 | | 1,581,142 |
| PG&E Corp | United States | 25,620 | | 1,585,622 |
| Xcel Energy Inc | United States | 17,990 | | 743,347 |
| | | | | 9,232,280 |
| Gas Utilities 1.8% | | | | |
| Atmos Energy Corp | United States | 8,640 | | 658,195 |
| Highways & Railtracks 13.4% | | | | |
| Abertis Infraestructuras SA | Spain | 23,369 | | 334,098 |
| Atlantia SpA. | Italy | 52,358 | | 1,189,645 |
| Groupe Eurotunnel SE | France | 47,640 | | 442,594 |
| Jiangsu Expressway Co. Ltd., H | China | 162,000 | | 203,154 |
| Macquarie Atlas Roads Group | Australia | 53,210 | | 202,553 |
| Qube Logistics Holdings Ltd | Australia | 126,194 | | 220,094 |
| Transurban Group | Australia | 286,682 | | 2,217,388 |
| | | | | 4,809,526 |
| Independent Power Producers & Energy Traders 0.8% | | | | |
| a Uniper SE | Germany | 18,981 | | 269,316 |
| Integrated Telecommunication Services 0.8% | | | | |
| Bharti Infratel Ltd | India | 22,204 | | 96,624 |
| Cellnex Telecom SAU | Spain | 12,427 | | 176,524 |
| | | | | 273,148 |
16 Semiannual Report
franklintempleton.com
FRANKLIN GLOBAL TRUST
STATEMENT OF INVESTMENTS (UNAUDITED)
| | | | |
| Franklin Global Listed Infrastructure Fund (continued) | | | | |
| | | Shares/ | | |
| | Country | Units | | Value |
| |
| Common Stocks and Other Equity Interests (continued) | | | | |
| Marine Ports & Services 1.3% | | | | |
| COSCO Shipping Ports Ltd | China | 200,000 | $ | 199,512 |
| DP World Ltd | United Arab Emirates | 14,989 | | 283,292 |
| | | | | 482,804 |
| Multi-Utilities 8.7% | | | | |
| Centrica PLC | United Kingdom | 60,900 | | 171,807 |
| Dominion Resources Inc | United States | 3,710 | | 282,999 |
| DTE Energy Co | United States | 7,200 | | 710,208 |
| National Grid PLC. | United Kingdom | 90,740 | | 1,058,767 |
| Public Service Enterprise Group Inc | United States | 2,280 | | 100,890 |
| Sempra Energy | United States | 4,740 | | 485,329 |
| Veolia Environnement | France | 18,720 | | 318,149 |
| | | | | 3,128,149 |
| Oil & Gas Storage & Transportation 22.7% | | | | |
| a Cheniere Energy Inc | United States | 7,220 | | 344,033 |
| Cheniere Energy Partners LP Holdings LLC | United States | 42,450 | | 969,982 |
| Enbridge Inc | Canada | 29,044 | | 1,235,820 |
| Energy Transfer Equity LP | United States | 32,900 | | 590,555 |
| EQT GP Holdings LP | United States | 7,670 | | 211,309 |
| Kinder Morgan Inc | United States | 35,430 | | 791,506 |
| Pembina Pipeline Corp | Canada | 12,300 | | 381,376 |
| Spectra Energy Corp | United States | 21,270 | | 885,896 |
| Targa Resources Corp | United States | 5,070 | | 292,133 |
| TransCanada Corp | Canada | 35,507 | | 1,674,174 |
| Ultrapar Participacoes SA, ADR | Brazil | 8,881 | | 185,968 |
| The Williams Cos. Inc | United States | 20,980 | | 605,063 |
| | | | | 8,167,815 |
| Renewable Electricity 2.6% | | | | |
| Boralex Inc., A | Canada | 14,900 | | 227,048 |
| EDP Renovaveis SA | Spain | 58,960 | | 378,221 |
| Pattern Energy Group Inc | United States | 17,280 | | 341,107 |
| | | | | 946,376 |
| Water Utilities 2.0% | | | | |
| American Water Works Co. Inc | United States | 5,440 | | 399,514 |
| Beijing Enterprises Water Group Ltd | China | 236,000 | | 164,553 |
| Guangdong Investment Ltd | China | 126,000 | | 156,709 |
| | | | | 720,776 |
| Total Common Stocks and Other Equity Interests | | | | |
| (Cost $32,177,615) | | | | 35,315,080 |
franklintempleton.com
Semiannual Report 17
FRANKLIN GLOBAL TRUST
STATEMENT OF INVESTMENTS (UNAUDITED)
| | | | |
| Franklin Global Listed Infrastructure Fund (continued) | | | | |
| | Country | Shares | | Value |
| Preferred Stocks (Cost $163,271) 0.7% | | | | |
| Water Utilities 0.7% | | | | |
| b Cia de Saneamento do Parana, 4.465%, pfd | Brazil | 56,100 | $ | 251,038 |
| Total Investments (Cost $32,340,886) 99.0% | | | | 35,566,118 |
| Other Assets, less Liabilities 1.0% | | | | 355,082 |
| Net Assets 100.0% | | | $ | 35,921,200 |
See Abbreviations on page 29.
aNon-income producing.
bVariable rate security. The rate shown represents the yield at period end.
18 Semiannual Report | The accompanying notes are an integral part of these financial statements. franklintempleton.com
FRANKLIN GLOBAL TRUST
Financial Statements
Statement of Assets and Liabilities
January 31, 2017 (unaudited)
| | | |
| Franklin Global Listed Infrastructure Fund | | | |
| |
| Assets: | | | |
| Investments in securities: | | | |
| Cost | $ | 32,340,886 | |
| Value | $ | 35,566,118 | |
| Cash | | 670,347 | |
| Foreign currency, at value (cost $4,038) | | 4,055 | |
| Receivables: | | | |
| Capital shares sold | | 256,286 | |
| Dividends | | 76,519 | |
| Affiliates | | 845 | |
| Total assets | | 36,574,170 | |
| Liabilities: | | | |
| Payables: | | | |
| Investment securities purchased | | 499,958 | |
| Capital shares redeemed | | 67,398 | |
| Management fees | | 9,515 | |
| Distribution fees | | 10,643 | |
| Transfer agent fees | | 10,393 | |
| Professional fees. | | 33,634 | |
| Deferred tax | | 7,465 | |
| Accrued expenses and other liabilities | | 13,964 | |
| Total liabilities | | 652,970 | |
| Net assets, at value. | $ | 35,921,200 | |
| Net assets consist of: | | | |
| Paid-in capital. | $ | 36,436,208 | |
| Undistributed net investment income | | 23,013 | |
| Net unrealized appreciation (depreciation) | | 3,219,619 | |
| Accumulated net realized gain (loss) | | (3,757,640 | ) |
| Net assets, at value. | $ | 35,921,200 | |
franklintempleton.com The accompanying notes are an integral part of these financial statements. | Semiannual Report 19
FRANKLIN GLOBAL TRUST
FINANCIAL STATEMENTS
Statement of Assets and Liabilities (continued)
January 31, 2017 (unaudited)
| | |
| Franklin Global Listed Infrastructure Fund | | |
| |
| Class A: | | |
| Net assets, at value. | $ | 27,844,633 |
| Shares outstanding | | 2,395,569 |
| Net asset value per sharea | $ | 11.62 |
| Maximum offering price per share (net asset value per share ÷ 94.25%) | $ | 12.33 |
| Class C: | | |
| Net assets, at value. | $ | 6,021,202 |
| Shares outstanding | | 521,099 |
| Net asset value and maximum offering price per sharea | $ | 11.55 |
| Class R: | | |
| Net assets, at value. | $ | 76,980 |
| Shares outstanding | | 6,633 |
| Net asset value and maximum offering price per share | $ | 11.61 |
| Class R6: | | |
| Net assets, at value. | $ | 11,641 |
| Shares outstanding | | 1,000 |
| Net asset value and maximum offering price per share | $ | 11.64 |
| Advisor Class: | | |
| Net assets, at value. | $ | 1,966,744 |
| Shares outstanding | | 168,923 |
| Net asset value and maximum offering price per share | $ | 11.64 |
aRedemption price is equal to net asset value less contingent deferred sales charges, if applicable.
20 Semiannual Report | The accompanying notes are an integral part of these financial statements. franklintempleton.com
|
| FRANKLIN GLOBAL TRUST |
| FINANCIAL STATEMENTS |
Statement of Operations
for the six months ended January 31, 2017 (unaudited)
| | | |
| Franklin Global Listed Infrastructure Fund | | | |
| |
| Investment income: | | | |
| Dividends (net of foreign taxes of $26,558) | $ | 444,308 | |
| Expenses: | | | |
| Management fees (Note 3a) | | 156,970 | |
| Distribution fees: (Note 3c) | | | |
| Class A | | 31,193 | |
| Class C | | 25,030 | |
| Class R | | 196 | |
| Transfer agent fees: (Note 3e) | | | |
| Class A | | 26,710 | |
| Class C | | 5,356 | |
| Class R | | 95 | |
| Class R6 | | 27 | |
| Advisor Class. | | 1,440 | |
| Custodian fees (Note 4) | | 1,845 | |
| Reports to shareholders | | 11,023 | |
| Registration and filing fees | | 42,821 | |
| Professional fees | | 43,456 | |
| Other | | 4,486 | |
| Total expenses. | | 350,648 | |
| Expense reductions (Note 4) | | (453 | ) |
| Expenses waived/paid by affiliates (Note 3f) | | (113,373 | ) |
| Net expenses. | | 236,822 | |
| Net investment income | | 207,486 | |
| Realized and unrealized gains (losses): | | | |
| Net realized gain (loss) from: | | | |
| Investments | | (588,846 | ) |
| Foreign currency transactions | | (11,616 | ) |
| Net realized gain (loss) | | (600,462 | ) |
| Net change in unrealized appreciation (depreciation) on: | | | |
| Investments | | (817,327 | ) |
| Translation of other assets and liabilities | | | |
| denominated in foreign currencies | | 2,638 | |
| Change in deferred taxes on unrealized appreciation | | (7,465 | ) |
| Net change in unrealized appreciation (depreciation) | | (822,154 | ) |
| Net realized and unrealized gain (loss) | | (1,422,616 | ) |
| Net increase (decrease) in net assets resulting from operations | $ | (1,215,130 | ) |
franklintempleton.com The accompanying notes are an integral part of these financial statements. | Semiannual Report 21
| | | | | | |
| FRANKLIN GLOBAL TRUST | | | | | | |
| FINANCIAL STATEMENTS | | | | | | |
| |
| |
| Statements of Changes in Net Assets | | | | | | |
| |
| Franklin Global Listed Infrastructure Fund | | | | | | |
| |
| | | Six Months Ended | | | | |
| | | January 31, 2017 | | | Year Ended | |
| | | (unaudited) | | | July 31, 2016 | |
| Increase (decrease) in net assets: | | | | | | |
| Operations: | | | | | | |
| Net investment income | $ | 207,486 | | $ | 519,941 | |
| Net realized gain (loss) | | (600,462 | ) | | (2,479,116 | ) |
| Net change in unrealized appreciation (depreciation) | | (822,154 | ) | | 3,104,884 | |
| Net increase (decrease) in net assets resulting from operations | | (1,215,130 | ) | | 1,145,709 | |
| Distributions to shareholders from: | | | | | | |
| Net investment income: | | | | | | |
| Class A | | (363,328 | ) | | (388,128 | ) |
| Class C | | (52,657 | ) | | (36,162 | ) |
| Class R | | (1,482 | ) | | (761 | ) |
| Class R6 | | (202 | ) | | (221 | ) |
| Advisor Class | | (22,131 | ) | | (11,501 | ) |
| Net realized gains: | | | | | | |
| Class A | | — | | | (12,503 | ) |
| Class C | | — | | | (2,105 | ) |
| Class R | | — | | | (28 | ) |
| Class R6 | | — | | | (6 | ) |
| Advisor Class | | — | | | (295 | ) |
| Total distributions to shareholders | | (439,800 | ) | | (451,710 | ) |
| Capital share transactions: (Note 2) | | | | | | |
| Class A | | 4,333,219 | | | (4,192,015 | ) |
| Class C | | 1,737,878 | | | (453,708 | ) |
| Class R | | 20,997 | | | (2,325 | ) |
| Advisor Class | | 1,047,601 | | | 337,706 | |
| Total capital share transactions | | 7,139,695 | | | (4,310,342 | ) |
| Net increase (decrease) in net assets | | 5,484,765 | | | (3,616,343 | ) |
| Net assets: | | | | | | |
| Beginning of period | | 30,436,435 | | | 34,052,778 | |
| End of period. | $ | 35,921,200 | | $ | 30,436,435 | |
| Undistributed net investment income included in net assets: | | | | | | |
| End of period. | $ | 23,013 | | $ | 255,327 | |
22 Semiannual Report | The accompanying notes are an integral part of these financial statements. franklintempleton.com
FRANKLIN GLOBAL TRUST
Notes to Financial Statements (unaudited)
Franklin Global Listed Infrastructure Fund
1. Organization and Significant Accounting Policies
Franklin Global Trust (Trust) is registered under the Investment Company Act of 1940 (1940 Act) as an open-end management investment company, consisting of five separate funds and applies the specialized accounting and reporting guidance in U.S. Generally Accepted Accounting Principles (U.S. GAAP). Franklin Global Listed Infrastructure Fund (Fund) is included in this report. The financial statements of the remaining funds in the Trust are presented separately. The Fund offers five classes of shares: Class A, Class C, Class R, Class R6, and Advisor Class. Each class of shares differs by its initial sales load, contingent deferred sales charges, voting rights on matters affecting a single class, its exchange privilege and fees primarily due to differing arrangements for distribution and transfer agent fees.
The following summarizes the Fund’s significant accounting policies.
a. Financial Instrument Valuation
The Fund’s investments in financial instruments are carried at fair value daily. Fair value is the price that would be received to sell an asset or paid to transfer a liability in an orderly transaction between market participants on the measurement date. The Fund calculates the net asset value (NAV) per share as of 4 p.m. Eastern time each day the New York Stock Exchange (NYSE) is open for trading. Under compliance policies and procedures approved by the Trust’s Board of Trustees (the Board), the Fund’s administrator has responsibility for oversight of valuation, including leading the cross-functional Valuation Committee (VC). The VC provides administration and oversight of the Fund’s valuation policies and procedures, which are approved annually by the Board. Among other things, these procedures allow the Fund to utilize independent pricing services, quotations from securities and financial instrument dealers, and other market sources to determine fair value.
Equity securities listed on an exchange or on the NASDAQ National Market System are valued at the last quoted sale price or the official closing price of the day, respectively. Foreign equity securities are valued as of the close of trading on the foreign stock exchange on which the security is primarily traded, or as of 4 p.m. Eastern time. The value is then converted into its U.S. dollar equivalent at the foreign exchange rate in effect at 4 p.m. Eastern time on the day that the value of the security is determined. Over-the-counter (OTC) securities are valued within the range of the most recent quoted bid and ask prices. Securities that trade in multiple markets or on multiple exchanges are valued according to the broadest and most representative market. Certain equity securities are valued based upon fundamental characteristics or relationships to similar securities.
The Fund has procedures to determine the fair value of financial instruments for which market prices are not reliable or readily available. Under these procedures, the VC convenes on a regular basis to review such financial instruments and considers a number of factors, including significant unobservable valuation inputs, when arriving at fair value. The VC primarily employs a market-based approach which may use related or comparable assets or liabilities, recent transactions, market multiples, book values, and other relevant information for the investment to determine the fair value of the investment. An income-based valuation approach may also be used in which the anticipated future cash flows of the investment are discounted to calculate fair value. Discounts may also be applied due to the nature or duration of any restrictions on the disposition of the investments. Due to the inherent uncertainty of valuations of such investments, the fair values may differ significantly from the values that would have been used had an active market existed. The VC employs various methods for calibrating these valuation approaches including a regular review of key inputs and assumptions, transactional back-testing or disposition analysis, and reviews of any related market activity.
Trading in securities on foreign securities stock exchanges and OTC markets may be completed before 4 p.m. Eastern time. In addition, trading in certain foreign markets may not take place on every Fund’s business day. Occasionally, events occur between the time at which trading in a foreign security is completed and 4 p.m. Eastern time that might call into question the reliability of the value of a portfolio security held by the Fund. As a result, differences may arise between the value of the Fund’s portfolio securities as determined at the foreign market close and the latest indications of value at 4 p.m. Eastern time. In order to minimize the potential for these differences, the VC monitors price movements following the close of trading in foreign stock markets through a series of country specific market proxies (such as baskets of American Depositary Receipts, futures contracts and exchange traded funds). These price movements are measured against established trigger thresholds for each specific market proxy to
franklintempleton.com
Semiannual Report 23
FRANKLIN GLOBAL TRUST
NOTES TO FINANCIAL STATEMENTS (UNAUDITED)
Franklin Global Listed Infrastructure Fund (continued)
1. Organization and Significant Accounting
Policies (continued)
a. Financial Instrument Valuation (continued)
assist in determining if an event has occurred that may call into question the reliability of the values of the foreign securities held by the Fund. If such an event occurs, the securities may be valued using fair value procedures, which may include the use of independent pricing services.
When the last day of the reporting period is a non-business day, certain foreign markets may be open on those days that the Fund’s NAV is not calculated, which could result in differences between the value of the Fund’s portfolio securities on the last business day and the last calendar day of the reporting period. Any significant security valuation changes due to an open foreign market are adjusted and reflected by the Fund for financial reporting purposes.
b. Foreign Currency Translation
Portfolio securities and other assets and liabilities denominated in foreign currencies are translated into U.S. dollars based on the exchange rate of such currencies against U.S. dollars on the date of valuation. The Fund may enter into foreign currency exchange contracts to facilitate transactions denominated in a foreign currency. Purchases and sales of securities, income and expense items denominated in foreign currencies are translated into U.S. dollars at the exchange rate in effect on the transaction date. Portfolio securities and assets and liabilities denominated in foreign currencies contain risks that those currencies will decline in value relative to the U.S. dollar. Occasionally, events may impact the availability or reliability of foreign exchange rates used to convert the U.S. dollar equivalent value. If such an event occurs, the foreign exchange rate will be valued at fair value using procedures established and approved by the Board.
The Fund does not separately report the effect of changes in foreign exchange rates from changes in market prices on securities held. Such changes are included in net realized and unrealized gain or loss from investments in the Statement of Operations.
Realized foreign exchange gains or losses arise from sales of foreign currencies, currency gains or losses realized between the trade and settlement dates on securities transactions and the difference between the recorded amounts of dividends, interest, and foreign withholding taxes and the U.S. dollar equivalent of the amounts actually received or paid. Net unrealized foreign exchange gains and losses arise from changes in foreign exchange rates on foreign denominated assets and liabilities other than investments in securities held at the end of the reporting period.
c. Income and Deferred Taxes
It is the Fund’s policy to qualify as a regulated investment company under the Internal Revenue Code. The Fund intends to distribute to shareholders substantially all of its taxable income and net realized gains to relieve it from federal income and excise taxes. As a result, no provision for U.S. federal income taxes is required
The Fund may be subject to foreign taxation related to income received, capital gains on the sale of securities and certain foreign currency transactions in the foreign jurisdictions in which it invests. Foreign taxes, if any, are recorded based on the tax regulations and rates that exist in the foreign markets in which the Fund invests. When a capital gain tax is determined to apply, the Fund records an estimated deferred tax liability in an amount that would be payable if the securities were disposed of on the valuation date.
The Fund may recognize an income tax liability related to its uncertain tax positions under U.S. GAAP when the uncertain tax position has a less than 50% probability that it will be sustained upon examination by the tax authorities based on its technical merits. As of January 31, 2017, the Fund has determined that no tax liability is required in its financial statements related to uncertain tax positions for any open tax years (or expected to be taken in future tax years). Open tax years are those that remain subject to examination and are based on each tax jurisdiction’s statute of limitation.
d. Security Transactions, Investment Income, Expenses and Distributions
Security transactions are accounted for on trade date. Realized gains and losses on security transactions are determined on a specific identification basis. Estimated expenses are accrued daily. Dividend income is recorded on the ex-dividend date except for certain dividends from securities where the dividend rate is not available. In such cases, the dividend is recorded as soon as the information is received by the Fund. Distributions to shareholders are recorded on the ex-dividend date and are determined according to income tax regulations (tax basis). Distributable earnings determined on a tax basis may differ from earnings recorded in accordance with U.S. GAAP. These
24 Semiannual Report
franklintempleton.com
FRANKLIN GLOBAL TRUST
NOTES TO FINANCIAL STATEMENTS (UNAUDITED)
Franklin Global Listed Infrastructure Fund (continued)
differences may be permanent or temporary. Permanent differences are reclassified among capital accounts to reflect their tax character. These reclassifications have no impact on net assets or the results of operations. Temporary differences are not reclassified, as they may reverse in subsequent periods.
Common expenses incurred by the Trust are allocated among the Funds based on the ratio of net assets of each Fund to the combined net assets of the Trust. Fund specific expenses are charged directly to the Fund that incurred the expense.
Realized and unrealized gains and losses and net investment income, not including class specific expenses, are allocated daily to each class of shares based upon the relative proportion of net assets of each class. Differences in per share distributions, by class, are generally due to differences in class specific expenses.
e. Accounting Estimates
The preparation of financial statements in accordance with U.S. GAAP requires management to make estimates and assumptions that affect the reported amounts of assets and liabilities at the date of the financial statements and the amounts of income and expenses during the reporting period. Actual results could differ from those estimates.
f. Guarantees and Indemnifications
Under the Trust’s organizational documents, its officers and trustees are indemnified by the Trust against certain liabilities arising out of the performance of their duties to the Trust. Additionally, in the normal course of business, the Trust, on behalf of the Fund, enters into contracts with service providers that contain general indemnification clauses. The Trust’s maximum exposure under these arrangements is unknown as this would involve future claims that may be made against the Trust that have not yet occurred. Currently, the Trust expects the risk of loss to be remote.
2. Shares of Beneficial Interest
At January 31, 2017, there were an unlimited number of shares authorized (without par value). Transactions in the Fund’s shares were as follows:
| | | | | | | | | | | | |
| | Six Months Ended | | Year Ended | | |
| | January 31, 2017a | | July 31, 2016a | |
| | Shares | | | Amount | | Shares | | | Amount | |
| Class A Shares: | | | | | | | | | | | | |
| Shares sold | 813,935 | | $ | 9,344,735 | | 419,330 | | $ | 4,778,360 | |
| Shares issued in reinvestment of distributions | 26,634 | | | | 309,906 | | 29,342 | | | 315,361 | |
| Shares redeemed | (460,618 | ) | | (5,321,422 | ) | (851,697 | ) | | (9,285,736 | ) |
| Net increase (decrease) | 379,951 | | $ | 4,333,219 | | (403,025 | ) | $ | (4,192,015 | ) |
| Class C Shares: | | | | | | | | | | | | |
| Shares sold | 239,146 | | $ | 2,729,452 | | 92,952 | | $ | 1,046,570 | |
| Shares issued in reinvestment of distributions | 4,515 | | | | 52,519 | | 3,587 | | | 38,020 | |
| Shares redeemed | (90,403 | ) | | (1,044,093 | ) | (142,196 | ) | | (1,538,298 | ) |
| Net increase (decrease) | 153,258 | | $ | 1,737,878 | | (45,657 | ) | $ | (453,708 | ) |
| Class R Shares: | | | | | | | | | | | | |
| Shares sold | 3,762 | | | $ | 45,871 | | 1 | | | $ | 15 | |
| Shares issued in reinvestment of distributions | 113 | | | | 1,315 | | 60 | | | | 635 | |
| Shares redeemed | (2,321 | ) | | | (26,189 | ) | (273 | ) | | | (2,975 | ) |
| Net increase (decrease) | 1,554 | | | $ | 20,997 | | (212 | ) | | $ | (2,325 | ) |
franklintempleton.com
Semiannual Report 25
FRANKLIN GLOBAL TRUST
NOTES TO FINANCIAL STATEMENTS (UNAUDITED)
| | | | | | | | | | |
| Franklin Global Listed Infrastructure Fund (continued) | | | | | | | | | | |
| |
| 2. Shares of Beneficial Interest (continued) | | | | | | | | | | |
| |
| | Six Months Ended | | Year Ended | |
| | January 31, 2017a | | July 31, 2016a | |
| | Shares | | | Amount | | Shares | | | Amount | |
| Advisor Class Shares: | | | | | | | | | | |
| Shares sold | 118,901 | | $ | 1,362,032 | | 40,110 | | $ | 445,500 | |
| Shares issued in reinvestment of distributions | 1,731 | | | 19,994 | | 963 | | | 10,446 | |
| Shares redeemed | (29,007 | ) | | (334,425 | ) | (10,725 | ) | | (118,240 | ) |
| Net increase (decrease) | 91,625 | | $ | 1,047,601 | | 30,348 | | $ | 337,706 | |
| aDuring the period, Class R6 did not report any share transactions. | | | | | | | | | | |
3. Transactions with Affiliates
Franklin Resources, Inc. is the holding company for various subsidiaries that together are referred to as Franklin Templeton Investments. Certain officers and trustees of the Trust are also officers and/or directors of the following subsidiaries:
| |
| Subsidiary | Affiliation |
| Franklin Templeton Institutional, LLC (FT Institutional) | Investment manager |
| Franklin Templeton Services, LLC (FT Services) | Administrative manager |
| Franklin Templeton Distributors, Inc. (Distributors) | Principal underwriter |
| Franklin Templeton Investor Services, LLC (Investor Services) | Transfer agent |
a. Management Fees
The Fund pays an investment management fee to FT Institutional based on the average daily net assets of the Fund as follows:
| | |
| Annualized Fee Rate | | Net Assets |
| 1.000 | % | Up to and including $500 million |
| 0.900 | % | Over $500 million, up to and including $1 billion |
| 0.850 | % | Over $1 billion, up to and including $1.5 billion |
| 0.800 | % | Over $1.5 billion, up to and including $6.5 billion |
| 0.780 | % | Over $6.5 billion, up to and including $11.5 billion |
| 0.760 | % | Over $11.5 billion, up to and including $16.5 billion |
| 0.740 | % | Over $16.5 billion, up to and including $19 billion |
| 0.730 | % | Over $19 billion, up to and including $21.5 billion |
| 0.720 | % | In excess of $21.5 billion |
For the period ended January 31, 2017, the annualized effective investment management fee rate was 1.000% of the Fund’s average daily net assets.
b. Administrative Fees
Under an agreement with FT Institutional, FT Services provides administrative services to the Fund. The fee is paid by FT Institutional based on the Fund’s average net assets, and is not an additional expense of the Fund.
26 Semiannual Report
franklintempleton.com
FRANKLIN GLOBAL TRUST
NOTES TO FINANCIAL STATEMENTS (UNAUDITED)
Franklin Global Listed Infrastructure Fund (continued)
c. Distribution Fees
The Board has adopted distribution plans for each share class, with the exception of Class R6 and Advisor Class shares, pursuant to Rule 12b-1 under the 1940 Act. Under the Fund’s Class A reimbursement distribution plan, the Fund reimburses Distributors for costs incurred in connection with the servicing, sale and distribution of the Fund’s shares up to the maximum annual plan rate. Under the Class A reimbursement distribution plan, costs exceeding the maximum for the current plan year cannot be reimbursed in subsequent periods. In addition, under the Fund’s Class C and R compensation distribution plans, the Fund pays Distributors for costs incurred in connection with the servicing, sale and distribution of the Fund’s shares up to the maximum annual plan rate for each class. The plan year, for purposes of monitoring compliance with the maximum annual plan rates, is February 1 through January 31.
The maximum annual plan rates, based on the average daily net assets, for each class, are as follows:
| | |
| Class A | 0.35 | % |
| Class C | 1.00 | % |
| Class R | 0.50 | % |
The Board has set the current rate at 0.25% per year for Class A shares until further notice and approval by the Board.
d. Sales Charges/Underwriting Agreements
Front-end sales charges and contingent deferred sales charges (CDSC) do not represent expenses of the Fund. These charges are deducted from the proceeds of sales of Fund shares prior to investment or from redemption proceeds prior to remittance, as applicable. Distributors has advised the Fund of the following commission transactions related to the sales and redemptions of the Fund’s shares for the period:
| | |
| Sales charges retained net of commissions paid to | | |
| unaffiliated brokers/dealers. | $ | 27,726 |
| CDSC retained | $ | 1,603 |
| |
| e. Transfer Agent Fees | | |
Each class of shares, except for Class R6, pays transfer agent fees to Investor Services for its performance of shareholder servicing obligations and reimburses Investor Services for out of pocket expenses incurred, including shareholder servicing fees paid to third parties. These fees are allocated daily based upon their relative proportion of such classes’ aggregate net assets. Class R6 pays Investor Services transfer agent fees specific to that class.
For the period ended January 31, 2017, the Fund paid transfer agent fees of $33,628, of which $20,093 was retained by Investor Services.
f. Waiver and Expense Reimbursements
FT Institutional and Investor Services have contractually agreed in advance to waive or limit their respective fees and to assume as their own expense certain expenses otherwise payable by the Fund so that the expenses (excluding distribution fees, and acquired fund fees and expenses) for Class A, Class C, Class R and Advisor Class of the Fund do not exceed 1.15%, and Class R6 does not exceed 0.93% based on the average net assets of each class (other than certain non-routine expenses or costs, including those relating to litigation, indemnification, reorganizations, and liquidations) until November 30, 2017. Total expenses waived or paid are not subject to recapture subsequent to the Fund’s fiscal year end. Prior to December 1, 2016, the expenses for Class R6 were limited to 0.96%.
g. Other Affiliated Transactions
At January 31, 2017, Franklin Advisers, Inc., an affiliate of FT Institutional, owned 6.4% of the Fund’s outstanding shares.
franklintempleton.com
Semiannual Report 27
FRANKLIN GLOBAL TRUST
NOTES TO FINANCIAL STATEMENTS (UNAUDITED)
Franklin Global Listed Infrastructure Fund (continued)
4. Expense Offset Arrangement
The Fund has entered into an arrangement with its custodian whereby credits realized as a result of uninvested cash balances are used to reduce a portion of the Fund’s custodian expenses. During the period ended January 31, 2017, the custodian fees were reduced as noted in the Statement of Operations.
5. Income Taxes
For tax purposes, capital losses may be carried over to offset future capital gains, if any. At July 31, 2016, the capital loss carryforwards were as follows:
| | |
| Capital loss carryforwards: | | |
| Short term | $ | 965,602 |
| Long term | | 1,591,772 |
| Total capital loss carryforwards | $ | 2,557,374 |
At January 31, 2017, the cost of investments and net unrealized appreciation (depreciation) for income tax purposes were as follows:
| | | |
| Cost of investments | $ | 32,942,405 | |
| |
| Unrealized appreciation | $ | 3,912,144 | |
| Unrealized depreciation | | (1,288,431 | ) |
| Net unrealized appreciation (depreciation) | $ | 2,623,713 | |
Differences between income and/or capital gains as determined on a book basis and a tax basis are primarily due to differing treatment of wash sales.
6. Investment Transactions
Purchases and sales of investments (excluding short term securities) for the period ended January 31, 2017, aggregated $17,195,325 and $10,394,866, respectively.
7. Concentration of Risk
Investing in foreign securities may include certain risks and considerations not typically associated with investing in U.S. securities, such as fluctuating currency values and changing local and regional economic, political and social conditions, which may result in greater market volatility. In addition, certain foreign securities may not be as liquid as U.S. securities.
8. Credit Facility
The Fund, together with other U.S. registered and foreign investment funds (collectively, Borrowers), managed by Franklin Templeton Investments, are borrowers in a joint syndicated senior unsecured credit facility totaling $2 billion (Global Credit Facility) which matured on February 10, 2017. This Global Credit Facility provides a source of funds to the Borrowers for temporary and emergency purposes, including the ability to meet future unanticipated or unusually large redemption requests. Effective February 10, 2017, the Borrowers renewed the Global Credit Facility for a one year term, maturing February 9, 2018, for a total of $2 billion.
28 Semiannual Report
franklintempleton.com
FRANKLIN GLOBAL TRUST
NOTES TO FINANCIAL STATEMENTS (UNAUDITED)
Franklin Global Listed Infrastructure Fund (continued)
Under the terms of the Global Credit Facility, the Fund shall, in addition to interest charged on any borrowings made by the Fund and other costs incurred by the Fund, pay its share of fees and expenses incurred in connection with the implementation and maintenance of the Global Credit Facility, based upon its relative share of the aggregate net assets of all of the Borrowers, including an annual commitment fee of 0.15% based upon the unused portion of the Global Credit Facility. These fees are reflected in other expenses in the Statement of Operations. During the period ended January 31, 2017, the Fund did not use the Global Credit Facility.
9. Fair Value Measurements
The Fund follows a fair value hierarchy that distinguishes between market data obtained from independent sources (observable inputs) and the Fund’s own market assumptions (unobservable inputs). These inputs are used in determining the value of the Fund’s financial instruments and are summarized in the following fair value hierarchy:
- Level 1 – quoted prices in active markets for identical financial instruments
- Level 2 – other significant observable inputs (including quoted prices for similar financial instruments, interest rates, prepayment speed, credit risk, etc.)
- Level 3 – significant unobservable inputs (including the Fund’s own assumptions in determining the fair value of financial instruments)
The input levels are not necessarily an indication of the risk or liquidity associated with financial instruments at that level.
For movements between the levels within the fair value hierarchy, the Fund has adopted a policy of recognizing the transfers as of the date of the underlying event which caused the movement.
At January 31, 2017, all of the Fund’s investments in financial instruments carried at fair value were valued using Level 1 inputs.
For detailed categories, see the accompanying Statement of Investments.
10. Investment Company Reporting Modernization
In October 2016, the U.S. Securities and Exchange Commission adopted new rules and amended existing rules (together, final rules) intended to modernize the reporting and disclosure of information by registered investment companies. In part, the final rules amend Regulation S-X and require standardized, enhanced disclosures about derivatives in investment company financial statements, as well as other amendments. The compliance date for the amendments to Regulation S-X is August 1, 2017. Management is currently evaluating the impact that the adoption of the amendments to Regulation S-X will have on the Fund’s financial statements and related disclosures.
11. Subsequent Events
The Fund has evaluated subsequent events through the issuance of the financial statements and determined that no events have occurred that require disclosure other than those that have already been disclosed in the financial statements
| |
| Abbreviations |
| |
| Selected Portfolio |
| ADR | American Depositary Receipt |
| BBA | British Bankers Association |
| GP | Graduated Payment |
franklintempleton.com
Semiannual Report 29
FRANKLIN GLOBAL TRUST
FRANKLIN GLOBAL LISTED INFRASTRUCTURE FUND
Shareholder Information
Proxy Voting Policies and Procedures
The Fund’s investment manager has established Proxy Voting Policies and Procedures (Policies) that the Fund uses to determine how to vote proxies relating to portfolio securities. Shareholders may view the Fund’s complete Policies online at franklintempleton.com. Alternatively, shareholders may request copies of the Policies free of charge by calling the Proxy Group collect at (954) 527-7678 or by sending a written request to: Franklin Templeton Companies, LLC, 300 S.E. 2nd Street, Fort Lauderdale, FL 33301, Attention: Proxy Group. Copies of the Fund’s proxy voting records are also made available online at franklintempleton.com and posted on the U.S. Securities and Exchange Commission’s website at sec.gov and reflect the most recent 12-month period ended June 30.
Quarterly Statement of Investments
The Trust, on behalf of the Fund, files a complete statement of investments with the U.S. Securities and Exchange Commission for the first and third quarters for each fiscal year on Form N-Q. Shareholders may view the filed Form N-Q by visiting the Commission’s website at sec.gov. The filed form may also be viewed and copied at the Commission’s Public Reference Room in Washington, DC. Information regarding the operations of the Public Reference Room may be obtained by calling (800) SEC-0330.
30 Semiannual Report
franklintempleton.com
This page intentionally left blank.
This page intentionally left blank.
Item 2. Code OF Ethics.
(a) The Registrant has adopted a code of ethics that applies to its principal executive officers and principal financial and accounting officer.
(c) N/A
(d) N/A
(f) Pursuant to Item 12(a)(1), the Registrant is attaching as an exhibit a copy of its code of ethics that applies to its principal executive officers and
principal financial and accounting officer.
Item 3. Audit Committee Financial Expert.
(a)(1) The Registrant has an audit committee financial expert serving on its audit committee.
(2) The audit committee financial expert is John B. Wilson and he is
"independent" as defined under the relevant Securities and Exchange Commission Rules and Releases.
Item 4. Principal Accountant Fees and Services. N/A
Item 5. Audit Committee of Listed Registrants. N/A
Item 6. Schedule of Investments. N/A
Item 7. Disclosure of Proxy Voting Policies and Procedures for Closed-End Management Investment Companies. N/A
Item 8. Portfolio Managers of Closed-End Management Investment Companies. N/A
Item 9. Purchases of Equity Securities by Closed-End Management Investment Company and Affiliated Purchasers. N/A
Item 10. Submission of Matters to a Vote of Security Holders.
There have been no changes to the procedures by which shareholders may recommend nominees to the Registrant's Board of Trustees that would require disclosure herein.
Item 11. Controls and Procedures.
(a) Evaluation of Disclosure Controls And Procedures. The Registrant maintains disclosure controls and procedures that are designed to ensure that information required to be disclosed in the Registrant's filings under the Securities Exchange Act of 1934 and the Investment Company Act of 1940 is recorded, processed, summarized and reported within the periods specified in the rules and forms of the Securities and Exchange Commission. Such information is accumulated and communicated to the Registrant's management, including its principal executive officer and principal financial officer, as appropriate, to allow timely decisions regarding required disclosure. The Registrant's management, including the principal executive officer and the principal financial officer, recognizes that any set of controls and procedures, no matter how well designed and operated, can provide only reasonable assurance of achieving the desired control objectives.
Within 90 days prior to the filing date of this Shareholder Report on Form N-CSR, the Registrant had carried out an evaluation, under the supervision and with the participation of the Registrant's management, including the Registrant's principal executive officer and the Registrant's principal financial officer, of the effectiveness of the design and operation of the Registrant's disclosure controls and procedures. Based on such evaluation, the Registrant's principal executive officer and principal financial officer concluded that the Registrant's disclosure controls and procedures are effective.
(b) Changes in Internal Controls. There have been no changes in the Registrant's internal controls or in other factors that could materially affect the internal controls over financial reporting subsequent to the date of their evaluation in connection with the preparation of this Shareholder Report on Form N-CSR.
Item 12. Exhibits.
(a) (1) Code of Ethics
(a) (2) Certifications pursuant to Section 302 of the Sarbanes-Oxley Act of 2002 of Laura F. Fergerson, Chief Executive Officer - Finance and Administration, and Gaston Gardey, Chief Financial Officer and Chief Accounting Officer
(b) Certifications pursuant to Section 906 of the Sarbanes-Oxley Act of 2002 of Laura F. Fergerson, Chief Executive Officer - Finance and Administration, and Gaston Gardey, Chief Financial Officer and Chief Accounting Officer
SIGNATURES
Pursuant to the requirements of the Securities Exchange Act of 1934 and the Investment Company Act of 1940, the registrant has duly caused this report to be signed on its behalf by the undersigned, thereunto duly authorized.
FRANKLIN GLOBAL TRUST
By /s/Laura F. Fergerson
Laura F. Fergerson
Chief Executive Officer - Finance and Administration
Date March 28, 2017
Pursuant to the requirements of the Securities Exchange Act of 1934 and the Investment Company Act of 1940, this report has been signed below by the following persons on behalf of the registrant and in the capacities and on the dates indicated.
By /s/Laura F. Fergerson
Laura F. Fergerson
Chief Executive Officer - Finance and Administration
Date March 28, 2017
By /s/Gaston Gardey
Gaston Gardey
Chief Financial Officer and Chief Accounting Officer
Date March 28, 2017