UNITED STATES
SECURITIES AND EXCHANGE COMMISSION
Washington, DC 20549
FORM N-CSR
CERTIFIED SHAREHOLDER REPORT OF REGISTERED
MANAGEMENT INVESTMENT COMPANIES
Investment Company Act file number 811-10157
Franklin Global Trust
(Exact name of registrant as specified in charter)
One Franklin Parkway, San Mateo, CA 94403-1906
(Address of principal executive offices) (Zip code)
Craig S. Tyle, One Franklin Parkway, San Mateo, CA 94403-1906
(Name and address of agent for service)
Registrant’s telephone number, including area code: 650 312-2000
Date of fiscal year end: 7/31
Date of reporting period: 7/31/17
| Item 1. | Reports to Stockholders. |
| | | | |
 | | | | Annual Report and Shareholder Letter July 31, 2017 |
| | | |


Sign up for electronic delivery at franklintempleton.com/edelivery
Franklin Templeton Investments
Gain From Our Perspective®
At Franklin Templeton Investments, we’re dedicated to one goal: delivering exceptional asset management for our clients. By bringing together multiple, world-class investment teams in a single firm, we’re able to offer specialized expertise across styles and asset classes, all supported by the strength and resources of one of the world’s largest asset managers. This has helped us to become a trusted partner to individual and institutional investors across the globe.
Dear Shareholder:
The 12 months ended July 31, 2017, benefited from mostly upbeat global economic data, improved U.S. corporate earnings and generally supportive monetary policies. The U.S. job market remained healthy as the unemployment rate declined. The U.S. Federal Reserve raised its federal funds target rate three times during the period and hinted at its July meeting that it may begin reducing its balance sheet. The global economy expanded moderately as the eurozone and Japanese economies reported strong economic data and their respective central banks maintained low interest rates. In this environment, U.S. stocks, as measured by the Standard & Poor’s® 500 Index, and global developed market stocks, as measured by the MSCI World Index, ended the period with positive returns.
We are committed to our long-term perspective and disciplined investment approach as we conduct a rigorous, fundamental analysis of securities with a regular emphasis on investment risk management.
We believe active, professional investment management serves investors well. We also recognize the important role of financial advisors in today’s markets and encourage investors to continue to seek their advice. Amid changing markets and economic conditions, we are confident investors with a well-diversified portfolio and a patient, long-term outlook should be well positioned for the years ahead.
Franklin Global Real Estate Fund’s annual report includes more detail about prevailing conditions and a discussion about investment decisions during the period. Please remember all securities markets fluctuate, as do mutual fund share prices.
We thank you for investing with Franklin Templeton, welcome your questions and comments, and look forward to serving your future investment needs.
Sincerely,

Edward B. Jamieson
President and Chief Executive Officer –
Investment Management
Franklin Global Trust
This letter reflects our analysis and opinions as of July 31, 2017, unless otherwise indicated. The information is not a complete analysis of every aspect of any market, country, industry, security or fund. Statements of fact are from sources considered reliable.
| | | | | | | | |
Not FDIC Insured | | | | | May Lose Value | | | | | No Bank Guarantee |
| | | | |
| | | |
franklintempleton.com | | Not part of the annual report | | 1 |
Visit franklintempleton.com for fund updates, to access your account, or to find helpful financial planning tools.
| | | | |
| | | |
2 | | Annual Report | | franklintempleton.com |
Annual Report
Franklin Global Real Estate Fund
This annual report for Franklin Global Real Estate Fund covers the fiscal year ended July 31, 2017.
Your Fund’s Goal and Main Investments
The Fund seeks high total return. Under normal market conditions, the Fund invests at least 80% of its net assets in securities of companies located anywhere in the world that operate in the real estate sector, including real estate investment trusts (REITs) and similar REIT-like entities domiciled outside the U.S.1
Performance Overview
For the 12 months ended July 31, 2017, the Fund’s Class A shares had a -3.68% cumulative total return. In comparison, the FTSE® EPRA®/NAREIT® Developed Index, which measures global real estate markets in North America, Europe and Asia, had a -1.93% total return.2 You can find the Fund’s long-term performance data in the Performance Summary beginning on page 8.
Performance data represent past performance, which does not guarantee future results. Investment return and principal value will fluctuate, and you may have a gain or loss when you sell your shares. Current performance may differ from figures shown. For most recent month-end performance, go to franklintempleton.com or call (800) 342-5236.
Economic and Market Overview
The U.S. economy generally expanded during the 12-month period ended July 31, 2017. The economy strengthened in 2017’s second quarter, after moderating in the previous two quarters, largely due to growth in consumer spending, business investment and federal government spending. The manufacturing sector generally expanded, and the services sector also continued to grow during the period. The unemployment rate decreased from 4.9% in July 2016 to 4.3%
at period-end.3 Annual inflation, as measured by the Consumer Price Index, increased from 0.8% to 1.7% during the period. Monthly retail sales were volatile, but mostly grew during the period.
The U.S. Federal Reserve (Fed) raised its target range for the federal funds rate by 0.25% three times during the period amid signs of a growing U.S. economy, a strengthening labor market and an improvement in business spending. At its July meeting, the Fed kept its target range unchanged, but signaled it expects to begin implementing its balance sheet reduction relatively soon, provided the economy continues to evolve as anticipated. The broad U.S. stock market, as measured by the Standard & Poor’s® 500 Index, advanced for the 12 months ended July 31, 2017.
The global economy grew moderately during the 12 months under review. In this environment, global developed and emerging market stocks rose, as measured by the MSCI All Country World Index. Global markets were aided by improved industrial commodity prices at certain points during the period, generally upbeat economic data across regions, investor optimism about pro-growth and pro-business policies in the U.S., hopes of tax reforms under the Trump administration, Emmanuel Macron’s election as France’s president, accommodative monetary policies of various global central banks, and encouraging corporate earnings reports.
However, investors expressed concerns about the timing and economic effects of the U.K.’s exit from the European Union (also known as “Brexit”) and the U.S. executive order banning entry from some Muslim-majority countries. Other headwinds included the health of European banks, concerns surrounding political uncertainty in the U.S. and European Union, geopolitical tensions in certain regions, worries about global oversupply in oil production despite a pact to extend cuts, and hawkish comments from key central bankers around the world.
1. REITs are real estate investment trust companies, usually with publicly traded stock, that manage a portfolio of income-producing real estate properties such as apartments, hotels, industrial properties, office buildings or shopping centers. The Fund predominantly invests in “equity” REITs, which also take ownership positions in real estate. Shareholders of equity REITs generally receive income from rents received and receive capital gains when properties are sold at a profit. REITs are generally operated by experienced property management teams and typically concentrate on a specific geographic region or property type.
2. Source: Morningstar.
The index is unmanaged and includes reinvestment of any income or distributions. One cannot invest directly in an index, and an index is not representative of the Fund’s portfolio.
3. Bureau of Labor Statistics.
The dollar value, number of shares or principal amount, and names of all portfolio holdings are listed in the Fund’s Statement of Investments (SOI). The SOI begins on page 16.
| | | | |
| | | |
franklintempleton.com | | Annual Report | | 3 |
F R A N K L I N G L O B A L R E A L E S T A T E F U N D
In Europe, the U.K.’s economy grew at a slower rate in 2017’s first quarter over the previous quarter, largely due to slower growth in household spending. However, the nation’s growth rate improved slightly in 2017’s second quarter, supported by growth in services. The Bank of England cut its benchmark interest rate and expanded its massive bond-buying program in August 2016 to boost the nation’s growth. The eurozone’s growth increased in 2017’s second quarter over the previous quarter. The bloc’s annual inflation rate, while low, ended higher than it was at the start of the period. The European Central Bank (ECB) kept its key policy rates unchanged during the period. However, at its July meeting, ECB president Mario Draghi signaled that the bank would reassess its policy stance on quantitative easing in the fall of 2017.
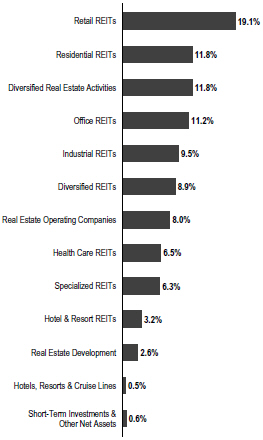
Portfolio Composition
Based on Total Net Assets as of 7/31/17
In Asia, Japan’s quarterly gross domestic product (GDP) grew at the fastest rate in more than two years, driven by household spending, capital expenditure and government spending. In July
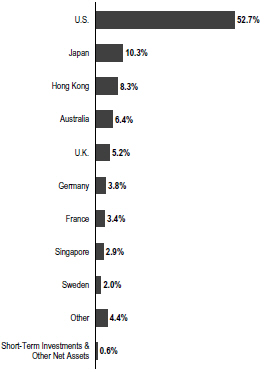
Geographic Composition
Based on Total Net Assets as of 7/31/17
2017, the Bank of Japan slightly increased its GDP forecasts for the 2017 and 2018 fiscal years, but lowered its inflation forecasts for the same period. China’s annual GDP grew faster in the first and second quarters of 2017 compared with the third and fourth quarters of 2016. The People’s Bank of China left its benchmark interest rate unchanged during the period.
Global Real Estate Market Overview
According to the FTSE EPRA/NAREIT Developed Index, in U.S. dollar terms, Austria and Norway performed well. Singapore, Sweden and Spain also posted solid results. In contrast, most markets represented in the index lost value, including France, Japan and Australia. At period-end, the U.S. was the index’s largest country weighting.
Investment Strategy
We are research-driven, fundamental investors. We seek to limit price volatility by investing across markets and property types. We also seek to provide a consistently high level of income. We center our active investment strategy on the belief that unsynchronized regional economic activity within the global economy can provide consistent, attractive return
| | | | |
4 | | Annual Report | | franklintempleton.com |
F R A N K L I N G L O B A L R E A L E S T A T E F U N D
opportunities in the global real estate markets. We use a bottom-up stock selection process that incorporates macro-level views in the evaluation process. We use top-down macro overlays to provide country/regional, property type and company size perspectives in identifying international/local cyclical and thematic trends that highlight investment opportunities. We may use derivative instruments, such as currency forward contracts, from time to time to help manage currency risk and the Fund’s exposure to various currencies.
|
What is a currency forward contract? A currency forward contract is an agreement between the Fund and a counterparty to buy or sell a foreign currency in exchange for another currency at a specific exchange rate on a future date. |
| | | | |
| Top 10 Holdings | | | |
| 7/31/17 | | | |
| |
Company Sector/Industry, Country | | % of Total
Net Assets | |
Simon Property Group Inc. Retail REITs, U.S. | | | 3.9% | |
Prologis Inc. Industrial REITs, U.S. | | | 2.8% | |
Mitsui Fudosan Co. Ltd. Diversified Real Estate Activities, Japan | | | 2.7% | |
AvalonBay Communities Inc. Residential REITs, U.S. | | | 2.6% | |
Mitsubishi Estate Co. Ltd. Diversified Real Estate Activities, Japan | | | 2.3% | |
Unibail-Rodamco SE Retail REITs, France | | | 2.3% | |
Welltower Inc. Health Care REITs, U.S. | | | 2.3% | |
Cheung Kong Property Holdings Ltd. Real Estate Development, Hong Kong | | | 2.2% | |
Equity Residential Residential REITs, U.S. | | | 2.1% | |
Sun Hung Kai Properties Ltd. Diversified Real Estate Activities, Hong Kong | | | 1.9% | |
Manager’s Discussion
During the 12 months under review, key contributors to the Fund’s performance relative to the FTSE EPRA/NAREIT Developed Index included stock selection and an underweighting in the specialty industry.4 Shares of Alexandria Real Estate Equities, a specialty office REIT with a niche focus on
4. Specialty holdings are in office REITs and specialized REITs in the SOI.
5. Industrial property holdings are in industrial REITs in the SOI.
6. Hotel/resort holdings are in hotel and resort REITs in the SOI.
serving real estate needs of life-sciences and technology tenants, outperformed during the reporting period. Alexandria owns a unique portfolio of assets located in the so called “innovation centers or cluster markets (i.e., close to major universities and hospitals)” in gateway cities in the U.S. such as Cambridge, Massachusetts; San Francisco; and New York City. The company’s operating results have consistently beaten expectations with steady and solid leasing statistics reflecting the prevailing strong fundamentals in the life-science and technology industries. We believe Alexandria, the only REIT that solely focuses on laboratory office space, has remained well positioned to generate above average earnings growth for the next two years especially with the delivery of its development projects as well as steady growth.
The Fund’s positioning in the industrial property industry also boosted results, with an off-benchmark investment in U.S.-based Rexford Industrial Realty proving especially beneficial.5 Shares of Rexford, a small-capitalization industrial REIT, performed well during the reporting period. The stock benefited from strong existing industrial fundamentals with continued healthy tenant demand for space both from traditional and e-commerce-related businesses. We like the company’s strategy to grow through acquisitions in markets where it faces less competition from larger industrial players. We also think the company’s core market, Southern California infill (infill is the rededication of land in an urban environment, either open space or an under-utilized strip mall, church, etc. to new construction), remains less susceptible to any potential pick-up in supply given the difficulty of building in infill markets due to the lack of available land. Rexford’s track record has been strong as its equity market capitalization has increased, while its recent core results have shown higher occupancy and double-digit rent spreads (the difference between the ending cash rent on an old lease and the beginning cash rent on a new lease).
Within the hotel/resort industry, shares of Summit Hotel Properties, a U.S.-based premium select-service focused hotel REIT, performed well during the reporting period.6 Despite challenges in lodging fundamentals and a negative revenue growth outlook, the stock’s strong performance, we believe, was largely due to the company’s lack of exposure to major gateway cities in coastal markets that suffer from above average supply, softer international travel, and other lodging alternatives. Summit has been active with new acquisitions for
| | | | | | |
franklintempleton.com | | Annual Report | | | 5 | |
F R A N K L I N G L O B A L R E A L E S T A T E F U N D
the past few years, which have upgraded its hotel portfolio. We believe the company’s focus to grow outside the non-gateway, non-coastal markets benefited operations as it consistently generated strong quarterly results with above industry average revenue growth.
Conversely, stock selection in the office space industry detracted from the Fund’s relative performance.7 Shares of Vornado Realty Trust, a dominant REIT in New York City with a portfolio of mainly Manhattan office and street retail assets, declined during the reporting period. We believe the stock’s weak performance mainly reflected the prevailing diminished investor sentiment for New York City REITs given the negative outlook for Manhattan office fundamentals largely due to supply pressures as it is anticipated that a large number of projects are due to become available over the next few years as well as weaker street retail fundamentals. The company has made significant progress on its simplification strategy laid out a few years back as it exited most of its non-core assets. Nevertheless, it has yet to announce further details about its highly anticipated development and re-development plans for New York City’s Penn Plaza district. Thus, we believe management’s lack of capital allocation and investment decisions in recent years have been disappointing as it continues to maintain a large cash balance that remains earnings dilutive.
Security selection and an underweighting in the diversified industry also hampered results.8 Invincible Investment,9 a diversified Japanese REIT, which invests primarily in hotel and residences in Japan, declined during the reporting period due to a slowdown in hotel fundamentals. Inbound tourist arrivals decelerated and limited growth in the average daily rate led to a downward revision in earnings for the second half of 2016. Meanwhile, the REIT’s core markets have seen increased competition from other hotels as well as online marketplace and hospitality services such as Airbnb. Lastly, the weak share performance has made it harder for the REIT to obtain new acquisitions and slowed the pace for external growth despite a defined pipeline from its property sourcer, Fortress Investment Group.10
Relative Fund performance was pressured further by stock selection in the triple-net leasing industry with holdings such as
7. Office space holdings are in office REITs in the SOI.
8. Diversified holdings are in diversified REITs in the SOI
9. Not held at period-end.
10. Not a Fund holding.
11. Triple-net leasing holdings are in diversified REITs in the SOI.
See www.franklintempletondatasources.com for additional data provider information.
VEREIT, an owner of single tenant triple-net lease assets across the U.S.11 VEREIT, along with other triple-net lease REITs, performed poorly late in 2016 when the 10-year U.S. Treasury bond yield increased sharply following the U.S. election. Although VEREIT’s business has shown overall improvement in 2017, its fee business, Cole Capital, has seen a deceleration in capital raising activity, largely as a function of recent legislative changes pertaining to the non-traded fund industry. However, in our view, the company represents a compelling value proposition as it continues to make headway in improving its tenant line-up, while setting and meeting earnings expectations and repairing its balance sheet.
Thank you for your continued participation in Franklin Global Real Estate Fund. We look forward to serving your future investment needs.
| | |
 | | 
Wilson Magee |
| |
 | | 
Daniel Pettersson |
| |
| | Portfolio Management Team |
| | | | |
6 | | Annual Report | | franklintempleton.com |
F R A N K L I N G L O B A L R E A L E S T A T E F U N D
The foregoing information reflects our analysis, opinions and portfolio holdings as of July 31, 2017, the end of the reporting period. The way we implement our main investment strategies and the resulting portfolio holdings may change depending on factors such as market and economic conditions. These opinions may not be relied upon as investment advice or an offer for a particular security. The information is not a complete analysis of every aspect of any market, country, industry, security or the Fund. Statements of fact are from sources considered reliable, but the investment manager makes no representation or warranty as to their completeness or accuracy. Although historical performance is no guarantee of future results, these insights may help you understand our investment management philosophy.
| | | | | | |
franklintempleton.com | | Annual Report | | | 7 | |
F R A N K L I N G L O B A L R E A L E S T A T E F U N D
Performance Summary as of July 31, 2017
The performance table and graphs do not reflect any taxes that a shareholder would pay on Fund dividends, capital gain distributions, if any, or any realized gains on the sale of Fund shares. Total return reflects reinvestment of the Fund’s dividends and capital gain distributions, if any, and any unrealized gains or losses. Your dividend income will vary depending on dividends or interest paid by securities in the Fund’s portfolio, adjusted for operating expenses of each class. Capital gain distributions are net profits realized from the sale of portfolio securities.
Performance as of 7/31/171
Cumulative total return excludes sales charges. Average annual total return includes maximum sales charges. Sales charges will vary depending on the size of the investment and the class of share purchased. The maximum is 5.75% and the minimum is 0%. Class A: 5.75% maximum initial sales charge; Advisor Class: no sales charges. For other share classes, visit franklintempleton.com.
| | | | |
Share Class | | Cumulative Total Return2 | | Average Annual Total Return3 |
A | | | | |
1-Year | | -3.68% | | -9.18% |
5-Year | | +36.77% | | +5.22% |
10-Year | | +17.34% | | +1.01% |
Advisor | | | | |
1-Year | | -3.39% | | -3.39% |
5-Year | | +38.79% | | +6.77% |
10-Year | | +20.98% | | +1.92% |
Performance data represent past performance, which does not guarantee future results. Investment return and principal value will fluctuate, and you may have a gain or loss when you sell your shares. Current performance may differ from figures shown. For most recent month-end performance, go to franklintempleton.com or call (800) 342-5236.
See page 10 for Performance Summary footnotes.
| | | | |
8 | | Annual Report | | franklintempleton.com |
F R A N K L I N G L O B A L R E A L E S T A T E F U N D
P E R F O R M A N C E S U M M A R Y
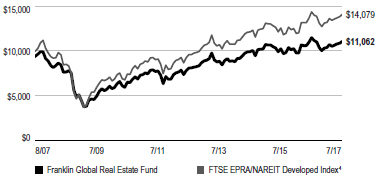
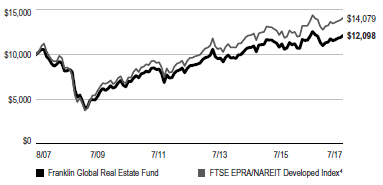
Total Return Index Comparison for a Hypothetical $10,000 Investment1
Total return represents the change in value of an investment over the periods shown. It includes any applicable maximum sales charge, Fund expenses, account fees and reinvested distributions. The unmanaged index includes reinvestment of any income or distributions. It differs from the Fund in composition and does not pay management fees or expenses. One cannot invest directly in an index.
Class A (8/1/07–7/31/17)
Advisor Class (8/1/07–7/31/17)
See page 10 for Performance Summary footnotes.
| | | | | | |
franklintempleton.com | | Annual Report | | | 9 | |
F R A N K L I N G L O B A L R E A L E S T A T E F U N D
P E R F O R M A N C E S U M M A R Y
Distributions (8/1/16–7/31/17)
| | | | |
| Share Class | | Net Investment
Income | |
A | | | $0.3027 | |
C | | | $0.2335 | |
R6 | | | $0.3399 | |
Advisor | | | $0.3268 | |
Total Annual Operating Expenses5
| | | | | | |
| Share Class | | With Waiver | | | Without Waiver |
A | | | 1.40% | | | 1.54% |
Advisor | | | 1.15% | | | 1.29% |
Each class of shares is available to certain eligible investors and has different annual fees and expenses, as described in the prospectus.
All investments involve risks, including possible loss of principal. The Fund concentrates in real estate securities, which involve special risks, such as declines in the value of real estate and increased susceptibility to adverse economic or regulatory developments affecting the sector. The Fund’s investments in REITs involve additional risks; since REITs typically are invested in a limited number of projects or in a particular market segment, they are more susceptible to adverse developments affecting a single project or market segment than more broadly diversified investments. Foreign investing, especially in emerging markets, involves additional risks such as currency and market volatility, as well as political and social instability. Investments in derivatives involve costs and create economic leverage, which may result in significant volatility and cause the Fund to participate in losses (as well as gains) that significantly exceed the Fund’s initial investment. The Fund is actively managed but there is no guarantee that the manager’s investment decisions will produce the desired results. The Fund’s prospectus also includes a description of the main investment risks.
1. The Fund has an expense reduction contractually guaranteed through 11/30/17. Fund investment results reflect the expense reduction; without this reduction, the results would have been lower.
2. Cumulative total return represents the change in value of an investment over the periods indicated.
3. Average annual total return represents the average annual change in value of an investment over the periods indicated. Return for less than one year, if any, has not been annualized.
4. Source: Morningstar. The FTSE EPRA/NAREIT Developed Index is a free-float adjusted index designed to measure the performance of publicly traded real estate securities in the North American, European and Asian real estate markets.
5. Figures are as stated in the Fund’s current prospectus and may differ from the expense ratios disclosed in the Your Fund’s Expenses and Financial Highlights in this report. In periods of market volatility, assets may decline significantly, causing total annual Fund operating expenses to become higher than the figures shown.
See www.franklintempletondatasources.com for additional data provider information.
| | | | |
10 | | Annual Report | | franklintempleton.com |
F R A N K L I N G L O B A L R E A L E S T A T E F U N D
Your Fund’s Expenses
As a Fund shareholder, you can incur two types of costs: (1) transaction costs, including sales charges (loads) on Fund purchases and redemptions; and (2) ongoing Fund costs, including management fees, distribution and service (12b-1) fees, and other Fund expenses. All mutual funds have ongoing costs, sometimes referred to as operating expenses. The table below shows ongoing costs of investing in the Fund and can help you understand these costs and compare them with those of other mutual funds. The table assumes a $1,000 investment held for the six months indicated.
Actual Fund Expenses
The table below provides information about actual account values and actual expenses in the columns under the heading “Actual.” In these columns the Fund’s actual return, which includes the effect of Fund expenses, is used to calculate the “Ending Account Value” for each class of shares. You can estimate the expenses you paid during the period by following these steps (of course, your account value and expenses will differ from those in this illustration): Divide your account value by $1,000 (if your account had an $8,600 value, then $8,600 ÷ $1,000 = 8.6). Then multiply the result by the number in the row for your class of shares under the headings “Actual” and “Expenses Paid During Period” (if Actual Expenses Paid During Period were $7.50, then 8.6 x $7.50 = $64.50). In this illustration, the actual expenses paid this period are $64.50.
Hypothetical Example for Comparison with Other Funds
Under the heading “Hypothetical” in the table, information is provided about hypothetical account values and hypothetical expenses based on the Fund’s actual expense ratio and an assumed rate of return of 5% per year before expenses, which is not the Fund’s actual return. This information may not be used to estimate the actual ending account balance or expenses you paid for the period, but it can help you compare ongoing costs of investing in the Fund with those of other funds. To do so, compare this 5% hypothetical example for the class of shares you hold with the 5% hypothetical examples that appear in the shareholder reports of other funds.
Please note that expenses shown in the table are meant to highlight ongoing costs and do not reflect any transactional costs. Therefore, information under the heading “Hypothetical” is useful in comparing ongoing costs only, and will not help you compare total costs of owning different funds. In addition, if transactional costs were included, your total costs would have been higher.
| | | | | | | | | | | | | | | | | | |
| | | | | | | Actual (actual return after expenses) | | | | Hypothetical (5% annual return before expenses) | | | | |
Share Class | | Beginning
Account
Value 2/1/17 | | | | Ending
Account
Value 7/31/17 | | Expenses Paid During
Period 2/1/17–7/31/171,2 | | | | Ending
Account
Value 7/31/17 | | Expenses Paid During
Period 2/1/17–7/31/171,2 | | | | Net
Annualized
Expense
Ratio2 |
| A | | $1,000 | | | | $1,064.80 | | $ 7.12 | | | | $1,017.90 | | $ 6.95 | | | | 1.39% |
| C | | $1,000 | | | | $1,060.70 | | $ 10.93 | | | | $1,014.18 | | $ 10.69 | | | | 2.14% |
| R6 | | $1,000 | | | | $1,066.90 | | $ 5.02 | | | | $1,019.93 | | $ 4.91 | | | | 0.98% |
| Advisor | | $1,000 | | | | $1,066.90 | | $ 5.84 | | | | $1,019.14 | | $ 5.71 | | | | 1.14% |
1. Expenses are equal to the annualized expense ratio for the six-month period as indicated above—in the far right column—multiplied by the simple average account value over the period indicated, and then multiplied by 181/365 to reflect the one-half year period.
2. Reflects expenses after fee waivers and expense reimbursements.
| | | | | | |
franklintempleton.com | | Annual Report | | | 11 | |
F R A N K L I N G L O B A L T R U S T
Financial Highlights
Franklin Global Real Estate Fund
| | | | | | | | | | | | | | | | | | | | |
| | | Year Ended July 31, | |
| | | 2017 | | | 2016 | | | 2015 | | | 2014 | | | 2013 | |
| | | | | |
Class A | | | | | | | | | | | | | | | | | | | | |
| | | | | |
Per share operating performance
(for a share outstanding throughout the year) | | | | | | | | | | | | | | | | | | | | |
| | | | | |
Net asset value, beginning of year | | | $ 9.73 | | | | $8.83 | | | | $8.69 | | | | $7.88 | | | | $7.42 | |
| | | | |
| | | | | |
Income from investment operationsa: | | | | | | | | | | | | | | | | | | | | |
| | | | | |
Net investment incomeb | | | 0.10 | | | | 0.15 | | | | 0.10 | | | | 0.11 | | | | 0.11 | |
| | | | | |
Net realized and unrealized gains (losses) | | | (0.48 | ) | | | 0.89 | | | | 0.18 | | | | 0.82 | | | | 0.59 | |
| | | | |
| | | | | |
Total from investment operations | | | (0.38 | ) | | | 1.04 | | | | 0.28 | | | | 0.93 | | | | 0.70 | |
| | | | |
| | | | | |
Less distributions from net investment income | | | (0.30 | ) | | | (0.14 | ) | | | (0.14 | ) | | | (0.12 | ) | | | (0.24 | ) |
| | | | |
| | | | | |
Net asset value, end of year. | | | $ 9.05 | | | | $9.73 | | | | $8.83 | | | | $8.69 | | | | $7.88 | |
| | | | |
| | | | | |
Total returnc | | | (3.68)% | | | | 12.05% | | | | 3.27% | | | | 12.13% | | | | 9.44% | |
| | | | | |
| Ratios to average net assets | | | | | | | | | | | | | | | | | | | | |
| | | | | |
Expenses before waiver and payments by affiliates and expense reduction | | | 1.55% | | | | 1.54% | | | | 1.58% | | | | 1.61% | | | | 1.62% | |
| | | | | |
Expenses net of waiver and payments by affiliates and expense reductiond | | | 1.39% | | | | 1.40% | | | | 1.45% | | | | 1.45% | | | | 1.44% | |
| | | | | |
Net investment income | | | 1.16% | | | | 1.69% | | | | 1.06% | | | | 1.31% | | | | 1.37% | |
| | | | | |
| Supplemental data | | | | | | | | | | | | | | | | | | | | |
| | | | | |
Net assets, end of year (000’s) | | | $80,700 | | | | $102,958 | | | | $102,228 | | | | $90,653 | | | | $86,575 | |
| | | | | |
Portfolio turnover rate | | | 27.67% | | | | 28.00% | | | | 26.05% | | | | 22.37% | | | | 19.43% | |
aThe amount shown for a share outstanding throughout the period may not correlate with the Statement of Operations for the period due to the timing of sales and repurchases of the Fund’s shares in relation to income earned and/or fluctuating fair value of the investments of the Fund.
bBased on average daily shares outstanding.
cTotal return does not reflect sales commissions or contingent deferred sales charges, if applicable.
dBenefit of expense reduction rounds to less than 0.01%.
| | | | |
12 | | Annual Report | The accompanying notes are an integral part of these financial statements. | | franklintempleton.com |
F R A N K L I N G L O B A L T R U S T
F I N A N C I A L H I G H L I G H T S
Franklin Global Real Estate Fund (continued)
| | | | | | | | | | | | | | | | | | | | |
| | | Year Ended July 31, | |
| | | 2017 | | | 2016 | | | 2015 | | | 2014 | | | 2013 | |
| | | | | |
Class C | | | | | | | | | | | | | | | | | | | | |
| | | | | |
| Per share operating performance | | | | | | | | | | | | | | | | | | | | |
(for a share outstanding throughout the year) | | | | | | | | | | | | | | | | | | | | |
| | | | | |
Net asset value, beginning of year | | | $ 9.58 | | | | $ 8.72 | | | | $ 8.58 | | | | $ 7.80 | | | | $ 7.34 | |
| | | | |
| | | | | |
Income from investment operationsa: | | | | | | | | | | | | | | | | | | | | |
| | | | | |
Net investment incomeb | | | 0.04 | | | | 0.08 | | | | 0.03 | | | | 0.05 | | | | 0.05 | |
| | | | | |
Net realized and unrealized gains (losses) | | | (0.47 | ) | | | 0.88 | | | | 0.20 | | | | 0.81 | | | | 0.59 | |
| | | | |
| | | | | |
Total from investment operations | | | (0.43 | ) | | | 0.96 | | | | 0.23 | | | | 0.86 | | | | 0.64 | |
| | | | |
| | | | | |
Less distributions from net investment income | | | (0.23 | ) | | | (0.10 | ) | | | (0.09 | ) | | | (0.08 | ) | | | (0.18 | ) |
| | | | |
| | | | | |
Net asset value, end of year. | | | $ 8.92 | | | | $ 9.58 | | | | $ 8.72 | | | | $ 8.58 | | | | $ 7.80 | |
| | | | |
| | | | | |
Total returnc | | | (4.30)% | | | | 11.11% | | | | 2.70% | | | | 11.28% | | | | 8.64% | |
| | | | | |
| Ratios to average net assets | | | | | | | | | | | | | | | | | | | | |
| | | | | |
Expenses before waiver and payments by affiliates and expense reduction | | | 2.30% | | | | 2.29% | | | | 2.28% | | | | 2.31% | | | | 2.32% | |
| | | | | |
Expenses net of waiver and payments by affiliates and expense reductiond | | | 2.14% | | | | 2.15% | | | | 2.15% | | | | 2.15% | | | | 2.14% | |
| | | | | |
Net investment income | | | 0.41% | | | | 0.94% | | | | 0.36% | | | | 0.61% | | | | 0.67% | |
| | | | | |
| Supplemental data | | | | | | | | | | | | | | | | | | | | |
| | | | | |
Net assets, end of year (000’s) | | | $15,529 | | | | $20,906 | | | | $23,124 | | | | $20,896 | | | | $21,350 | |
| | | | | |
Portfolio turnover rate | | | 27.67% | | | | 28.00% | | | | 26.05% | | | | 22.37% | | | | 19.43% | |
aThe amount shown for a share outstanding throughout the period may not correlate with the Statement of Operations for the period due to the timing of sales and repurchases of the Fund’s shares in relation to income earned and/or fluctuating fair value of the investments of the Fund.
bBased on average daily shares outstanding.
cTotal return does not reflect sales commissions or contingent deferred sales charges, if applicable.
dBenefit of expense reduction rounds to less than 0.01%.
| | | | |
franklintempleton.com | | The accompanying notes are an integral part of these financial statements. | Annual Report | | 13 |
F R A N K L I N G L O B A L T R U S T
F I N A N C I A L H I G H L I G H T S
Franklin Global Real Estate Fund (continued)
| | | | | | | | | | | | | | | | | | | | |
| | | Year Ended July 31, | |
| | | 2017 | | | 2016 | | | 2015 | | | 2014 | | | 2013a | |
| | | | | |
Class R6 | | | | | | | | | | | | | | | | | | | | |
| | | | | |
| Per share operating performance | | | | | | | | | | | | | | | | | | | | |
(for a share outstanding throughout the year) | | | | | | | | | | | | | | | | | | | | |
| | | | | |
Net asset value, beginning of year | | | $ 9.78 | | | | $ 8.88 | | | | $ 8.74 | | | | $ 7.92 | | | | $ 8.70 | |
| | | | |
| | | | | |
Income from investment operationsb: | | | | | | | | | | | | | | | | | | | | |
| | | | | |
Net investment incomec | | | 0.14 | | | | 0.18 | | | | 0.14 | | | | 0.15 | | | | 0.04 | |
| | | | | |
Net realized and unrealized gains (losses) | | | (0.49 | ) | | | 0.90 | | | | 0.18 | | | | 0.82 | | | | (0.82 | ) |
| | | | |
| | | | | |
Total from investment operations | | | (0.35 | ) | | | 1.08 | | | | 0.32 | | | | 0.97 | | | | (0.78 | ) |
| | | | |
| | | | | |
Less distributions from net investment income | | | (0.34 | ) | | | (0.18 | ) | | | (0.18 | ) | | | (0.15 | ) | | | — | |
| | | | |
| | | | | |
Net asset value, end of year. | | | $ 9.09 | | | | $ 9.78 | | | | $ 8.88 | | | | $ 8.74 | | | | $ 7.92 | |
| | | | |
| | | | | |
Total returnd | | | (3.24)% | | | | 12.49% | | | | 3.71% | | | | 12.51% | | | | (8.97)% | |
| | | | | |
| Ratios to average net assetse | | | | | | | | | | | | | | | | | | | | |
| | | | | |
Expenses before waiver and payments by affiliates and expense reduction | | | 2.03% | | | | 1.23% | | | | 1.13% | | | | 1.15% | | | | 1.15% | |
| | | | | |
Expenses net of waiver and payments by affiliates and expense reductionf | | | 0.98% | | | | 0.99% | | | | 0.99% | | | | 0.99% | | | | 0.99% | |
| | | | | |
Net investment income | | | 1.58% | | | | 2.10% | | | | 1.52% | | | | 1.77% | | | | 1.82% | |
| | | | | |
| Supplemental data | | | | | | | | | | | | | | | | | | | | |
| | | | | |
Net assets, end of year (000’s) | | | $18 | | | | $16 | | | | $246 | | | | $768 | | | | $379 | |
| | | | | |
Portfolio turnover rate | | | 27.67% | | | | 28.00% | | | | 26.05% | | | | 22.37% | | | | 19.43% | |
aFor the period May 1, 2013 (effective date) to July 31, 2013.
bThe amount shown for a share outstanding throughout the period may not correlate with the Statement of Operations for the period due to the timing of sales and repurchases of the Fund’s shares in relation to income earned and/or fluctuating fair value of the investments of the Fund.
cBased on average daily shares outstanding.
dTotal return is not annualized for periods less than one year.
eRatios are annualized for periods less than one year.
fBenefit of expense reduction rounds to less than 0.01%.
| | | | |
14 | | Annual Report | The accompanying notes are an integral part of these financial statements. | | franklintempleton.com |
F R A N K L I N G L O B A L T R U S T
F I N A N C I A L H I G H L I G H T S
Franklin Global Real Estate Fund (continued)
| | | | | | | | | | | | | | | | | | | | |
| | | Year Ended July 31, | |
| | | 2017 | | | 2016 | | | 2015 | | | 2014 | | | 2013 | |
| | | | | |
Advisor Class | | | | | | | | | | | | | | | | | | | | |
| | | | | |
| Per share operating performance | | | | | | | | | | | | | | | | | | | | |
(for a share outstanding throughout the year) | | | | | | | | | | | | | | | | | | | | |
| | | | | |
Net asset value, beginning of year | | | $ 9.78 | | | | $ 8.88 | | | | $ 8.73 | | | | $ 7.91 | | | | $ 7.46 | |
| | | | |
| | | | | |
Income from investment operationsa: | | | | | | | | | | | | | | | | | | | | |
| | | | | |
Net investment incomeb | | | 0.12 | | | | 0.17 | | | | 0.12 | | | | 0.13 | | | | 0.13 | |
| | | | | |
Net realized and unrealized gains (losses) | | | (0.47 | ) | | | 0.90 | | | | 0.19 | | | | 0.83 | | | | 0.59 | |
| | | | |
| | | | | |
Total from investment operations | | | (0.35 | ) | | | 1.07 | | | | 0.31 | | | | 0.96 | | | | 0.72 | |
| | | | |
| | | | | |
Less distributions from net investment income | | | (0.33 | ) | | | (0.17 | ) | | | (0.16 | ) | | | (0.14 | ) | | | (0.27 | ) |
| | | | |
| | | | | |
Net asset value, end of year. | | | $ 9.10 | | | | $ 9.78 | | | | $ 8.88 | | | | $ 8.73 | | | | $ 7.91 | |
| | | | |
| | | | | |
Total return | | | (3.39)% | | | | 12.31% | | | | 3.67% | | | | 12.39% | | | | 9.78% | |
| | | | | |
| Ratios to average net assets | | | | | | | | | | | | | | | | | | | | |
| | | | | |
Expenses before waiver and payments by affiliates and expense reduction | | | 1.30% | | | | 1.29% | | | | 1.28% | | | | 1.31% | | | | 1.32% | |
| | | | | |
Expenses net of waiver and payments by affiliates and expense reductionc | | | 1.14% | | | | 1.15% | | | | 1.15% | | | | 1.15% | | | | 1.14% | |
| | | | | |
Net investment income | | | 1.41% | | | | 1.94% | | | | 1.36% | | | | 1.61% | | | | 1.67% | |
| | | | | |
| Supplemental data | | | | | | | | | | | | | | | | | | | | |
| | | | | |
Net assets, end of year (000’s) | | | $51,915 | | | | $51,617 | | | | $45,451 | | | | $52,423 | | | | $48,116 | |
| | | | | |
Portfolio turnover rate | | | 27.67% | | | | 28.00% | | | | 26.05% | | | | 22.37% | | | | 19.43% | |
aThe amount shown for a share outstanding throughout the period may not correlate with the Statement of Operations for the period due to the timing of sales and repurchases of the Fund’s shares in relation to income earned and/or fluctuating fair value of the investments of the Fund.
bBased on average daily shares outstanding.
cBenefit of expense reduction rounds to less than 0.01%.
| | | | |
franklintempleton.com | | The accompanying notes are an integral part of these financial statements. | Annual Report | | 15 |
F R A N K L I N G L O B A L T R U S T
Statement of Investments, July 31, 2017
Franklin Global Real Estate Fund
| | | | | | | | | | | | |
| | | Country | | | Shares | | | Value | |
Common Stocks 99.4% | | | | | | | | | | | | |
| Diversified Real Estate Activities 11.8% | | | | | | | | | | | | |
CapitaLand Ltd. | | | Singapore | | | | 647,624 | | | $ | 1,763,445 | |
City Developments Ltd. | | | Singapore | | | | 161,300 | | | | 1,340,249 | |
Mitsubishi Estate Co. Ltd. | | | Japan | | | | 185,154 | | | | 3,367,657 | |
Mitsui Fudosan Co. Ltd. | | | Japan | | | | 174,095 | | | | 4,000,759 | |
New World Development Co. Ltd. | | | Hong Kong | | | | 1,471,000 | | | | 1,988,767 | |
Sun Hung Kai Properties Ltd. | | | Hong Kong | | | | 182,727 | | | | 2,830,710 | |
Tokyo Tatemono Co. Ltd. | | | Japan | | | | 100,590 | | | | 1,369,899 | |
The Wharf Holdings Ltd. | | | Hong Kong | | | | 87,694 | | | | 746,057 | |
| | | | | | | | | | | | |
| | | |
| | | | | | | | | | | 17,407,543 | |
| | | | | | | | | | | | |
Diversified REITs 8.9% | | | | | | | | | | | | |
Activia Properties Inc. | | | Japan | | | | 266 | | | | 1,195,058 | |
GPT Group | | | Australia | | | | 333,490 | | | | 1,277,454 | |
Gramercy Property Trust | | | United States | | | | 33,500 | | | | 1,012,370 | |
Hispania Activos Inmobiliarios SOCIMI SA | | | Spain | | | | 84,954 | | | | 1,531,953 | |
Hulic REIT Inc. | | | Japan | | | | 639 | | | | 1,006,386 | |
Kenedix Office Investment Corp. | | | Japan | | | | 227 | | | | 1,282,265 | |
Land Securities Group PLC | | | United Kingdom | | | | 136,389 | | | | 1,837,306 | |
Stockland | | | Australia | | | | 413,803 | | | | 1,389,857 | |
VEREIT Inc. | | | United States | | | | 179,700 | | | | 1,493,307 | |
Washington REIT | | | United States | | | | 32,800 | | | | 1,096,504 | |
| | | | | | | | | | | | |
| | | |
| | | | | | | | | | | 13,122,460 | |
| | | | | | | | | | | | |
Health Care REITs 6.5% | | | | | | | | | | | | |
CareTrust REIT Inc. | | | United States | | | | 49,700 | | | | 906,528 | |
HCP Inc. | | | United States | | | | 77,854 | | | | 2,464,079 | |
Physicians Realty Trust | | | United States | | | | 50,900 | | | | 947,758 | |
Ventas Inc. | | | United States | | | | 29,609 | | | | 1,994,166 | |
Welltower Inc. | | | United States | | | | 45,558 | | | | 3,343,502 | |
| | | | | | | | | | | | |
| | | |
| | | | | | | | | | | 9,656,033 | |
| | | | | | | | | | | | |
Hotel & Resort REITs 3.2% | | | | | | | | | | | | |
Hoshino Resorts REIT Inc. | | | Japan | | | | 112 | | | | 576,806 | |
Host Hotels & Resorts Inc. | | | United States | | | | 101,020 | | | | 1,885,033 | |
Summit Hotel Properties Inc. | | | United States | | | | 69,800 | | | | 1,251,514 | |
Sunstone Hotel Investors Inc. | | | United States | | | | 60,999 | | | | 993,064 | |
| | | | | | | | | | | | |
| | | |
| | | | | | | | | | | 4,706,417 | |
| | | | | | | | | | | | |
Hotels, Resorts & Cruise Lines 0.5% | | | | | | | | | | | | |
| | | |
Hilton Worldwide Holdings Inc. | | | United States | | | | 12,303 | | | | 769,307 | |
| | | | | | | | | | | | |
Industrial REITs 9.5% | | | | | | | | | | | | |
First Industrial Realty Trust Inc. | | | United States | | | | 48,300 | | | | 1,474,116 | |
Frasers Logistics & Industrial Trust | | | Singapore | | | | 786,100 | | | | 635,191 | |
Goodman Group | | | Australia | | | | 316,540 | | | | 2,014,971 | |
Mapletree Logistics Trust | | | Singapore | | | | 617,037 | | | | 546,393 | |
Nippon Prologis REIT Inc. | | | Japan | | | | 502 | | | | 1,058,256 | |
PLA Administradora Industrial S de RL de CV | | | Mexico | | | | 438,900 | | | | 763,819 | |
Prologis Inc. | | | United States | | | | 68,220 | | | | 4,148,458 | |
Rexford Industrial Realty Inc. | | | United States | | | | 43,400 | | | | 1,237,768 | |
Segro PLC | | | United Kingdom | | | | 310,524 | | | | 2,159,147 | |
| | | | | | | | | | | | |
| | | |
| | | | | | | | | | | 14,038,119 | |
| | | | | | | | | | | | |
| | | | |
16 | | Annual Report | | franklintempleton.com |
F R A N K L I N G L O B A L T R U S T
S T A T E M E N T O F I N V E S T M E N T S
Franklin Global Real Estate Fund (continued)
| | | | | | | | | | | | |
| | | Country | | | Shares | | | Value | |
Common Stocks (continued) | | | | | | | | | | | | |
Office REITs 11.2% | | | | | | | | | | | | |
Alexandria Real Estate Equities Inc. | | | United States | | | | 19,684 | | | $ | 2,386,685 | |
Boston Properties Inc. | | | United States | | | | 19,232 | | | | 2,325,341 | |
Brandywine Realty Trust | | | United States | | | | 70,100 | | | | 1,178,381 | |
Derwent London plc | | | United Kingdom | | | | 30,692 | | | | 1,153,298 | |
Dexus | | | Australia | | | | 232,023 | | | | 1,740,448 | |
Highwoods Properties Inc. | | | United States | | | | 18,866 | | | | 971,976 | |
Japan Real Estate Investment Corp. | | | Japan | | | | 265 | | | | 1,391,196 | |
Kilroy Realty Corp. | | | United States | | | | 24,530 | | | | 1,702,627 | |
SL Green Realty Corp. | | | United States | | | | 16,159 | | | | 1,668,740 | |
Vornado Realty Trust | | | United States | | | | 26,725 | | | | 2,120,629 | |
| | | | | | | | | | | | |
| | | |
| | | | | | | | | | | 16,639,321 | |
| | | | | | | | | | | | |
Real Estate Development 2.6% | | | | | | | | | | | | |
Cheung Kong Property Holdings Ltd. | | | Hong Kong | | | | 400,500 | | | | 3,243,175 | |
a Howard Hughes Corp. | | | United States | | | | 5,110 | | | | 642,889 | |
| | | | | | | | | | | | |
| | | |
| | | | | | | | | | | 3,886,064 | |
| | | | | | | | | | | | |
Real Estate Operating Companies 8.0% | | | | | | | | | | | | |
ADO Properties SA | | | Germany | | | | 10,451 | | | | 471,830 | |
b ADO Properties SA, 144A | | | Germany | | | | 25,609 | | | | 1,156,167 | |
BUWOG AG | | | Austria | | | | 49,225 | | | | 1,446,527 | |
Deutsche Wohnen AG | | | Germany | | | | 66,682 | | | | 2,642,016 | |
Fabege AB | | | Sweden | | | | 57,005 | | | | 1,125,647 | |
First Capital Realty Inc. | | | Canada | | | | 43,800 | | | | 716,536 | |
Hemfosa Fastigheter AB | | | Sweden | | | | 76,103 | | | | 933,221 | |
Hufvudstaden AB, A | | | Sweden | | | | 61,321 | | | | 1,067,390 | |
Hysan Development Co. Ltd. | | | Hong Kong | | | | 212,624 | | | | 1,028,990 | |
Vonovia SE | | | Germany | | | | 32,686 | | | | 1,324,836 | |
| | | | | | | | | | | | |
| | | |
| | | | | | | | | | | 11,913,160 | |
| | | | | | | | | | | | |
Residential REITs 11.8% | | | | | | | | | | | | |
American Homes 4 Rent, A | | | United States | | | | 85,000 | | | | 1,955,850 | |
AvalonBay Communities Inc. | | | United States | | | | 19,848 | | | | 3,817,763 | |
Camden Property Trust | | | United States | | | | 16,600 | | | | 1,489,020 | |
Canadian Apartment Properties REIT | | | Canada | | | | 50,900 | | | | 1,322,910 | |
Equity Lifestyle Properties Inc. | | | United States | | | | 21,702 | | | | 1,894,585 | |
Equity Residential | | | United States | | | | 46,423 | | | | 3,159,549 | |
Essex Property Trust Inc. | | | United States | | | | 4,100 | | | | 1,072,970 | |
Mid-America Apartment Communities Inc. | | | United States | | | | 15,100 | | | | 1,563,303 | |
Unite Group PLC | | | United Kingdom | | | | 137,596 | | | | 1,218,161 | |
| | | | | | | | | | | | |
| | | |
| | | | | | | | | | | 17,494,111 | |
| | | | | | | | | | | | |
Retail REITs 19.1% | | | | | | | | | | | | |
Agree Realty Corp. | | | United States | | | | 16,600 | | | | 816,222 | |
GGP Inc. | | | United States | | | | 75,516 | | | | 1,707,417 | |
Hammerson PLC | | | United Kingdom | | | | 174,139 | | | | 1,319,965 | |
Kimco Realty Corp. | | | United States | | | | 26,151 | | | | 527,727 | |
Klepierre | | | France | | | | 40,222 | | | | 1,635,998 | |
Link REIT | | | Hong Kong | | | | 289,466 | | | | 2,353,307 | |
The Macerich Co. | | | United States | | | | 8,393 | | | | 481,674 | |
Realty Income Corp. | | | United States | | | | 38,124 | | | | 2,175,355 | |
Regency Centers Corp. | | | United States | | | | 30,381 | | | | 2,011,830 | |
Retail Properties of America Inc., A | | | United States | | | | 88,900 | | | | 1,176,147 | |
Scentre Group | | | Australia | | | | 660,962 | | | | 2,183,000 | |
| | | | |
franklintempleton.com | | Annual Report | | 17 |
F R A N K L I N G L O B A L T R U S T
S T A T E M E N T O F I N V E S T M E N T S
Franklin Global Real Estate Fund (continued)
| | | | | | | | | | | | |
| | | Country | | | Shares | | | Value | |
Common Stocks (continued) | | | | | | | | | | | | |
| Retail REITs (continued) | | | | | | | | | | | | |
Simon Property Group Inc. | | | United States | | | | 36,810 | | | | $ 5,834,385 | |
Smart REIT | | | Canada | | | | 31,300 | | | | 787,144 | |
Unibail-Rodamco SE | | | France | | | | 13,381 | | | | 3,346,319 | |
Weingarten Realty Investors | | | United States | | | | 38,160 | | | | 1,238,674 | |
Westfield Corp. | | | Australia | | | | 113,671 | | | | 698,133 | |
| | | | | | | | | | | | |
| | | | | | | | | | | 28,293,297 | |
| | | | | | | | | | | | |
Specialized REITs 6.3% | | | | | | | | | | | | |
American Tower Corp. | | | United States | | | | 7,900 | | | | 1,077,007 | |
Coresite Realty Corp. | | | United States | | | | 12,931 | | | | 1,404,048 | |
CubeSmart | | | United States | | | | 36,147 | | | | 891,385 | |
CyrusOne Inc. | | | United States | | | | 16,400 | | | | 979,244 | |
Digital Realty Trust Inc. | | | United States | | | | 21,227 | | | | 2,448,322 | |
Public Storage | | | United States | | | | 12,088 | | | | 2,484,930 | |
| | | | | | | | | | | | |
| | | | | | | | | | | 9,284,936 | |
| | | | | | | | | | | | |
Total Common Stocks (Cost $106,974,409) | | | | | | | | | | | 147,210,768 | |
| | | | | | | | | | | | |
| | | | | | Principal
Amount | | | | |
Short Term Investments (Cost $200,000) 0.1% | | | | | | | | | | | | |
Time Deposits 0.1% | | | | | | | | | | | | |
Royal Bank of Canada, 1.10%, 8/01/17 | | | United States | | | | $ 200,000 | | | | 200,000 | |
| | | | | | | | | | | | |
Total Investments (Cost $107,174,409) 99.5% | | | | | | | | | | | 147,410,768 | |
Other Assets, less Liabilities 0.5% | | | | | | | | | | | 751,981 | |
| | | | | | | | | | | | |
Net Assets 100.0% | | | | | | | | | | | $148,162,749 | |
| | | | | | | | | | | | |
See Abbreviations on page 30.
aNon-income producing.
bSecurity was purchased pursuant to Rule 144A under the Securities Act of 1933 and may be sold in transactions exempt from registration only to qualified institutional buyers or in a public offering registered under the Securities Act of 1933. This security has been deemed liquid under guidelines approved by the Trust’s Board of Trustees. At July 31, 2017, the value of this security was $1,156,167, representing 0.8% of net assets.
| | | | |
18 | | Annual Report | The accompanying notes are an integral part of these financial statements. | | franklintempleton.com |
F R A N K L I N G L O B A L T R U S T
Financial Statements
Statement of Assets and Liabilities
July 31, 2017
Franklin Global Real Estate Fund
| | | | |
Assets: | | | | |
Investments in securities: | | | | |
Cost - Unaffiliated issuers | | | $107,174,409 | |
| | | | |
Value - Unaffiliated issuers | | | $147,410,768 | |
Cash | | | 109,023 | |
Receivables: | | | | |
Investment securities sold | | | 729,745 | |
Capital shares sold | | | 195,876 | |
Dividends | | | 235,332 | |
European Union tax reclaims | | | 31,652 | |
Other assets | | | 81 | |
| | | | |
Total assets | | | 148,712,477 | |
| | | | |
Liabilities: | | | | |
Payables: | | | | |
Investment securities purchased | | | 222,811 | |
Capital shares redeemed | | | 142,527 | |
Management fees | | | 97,285 | |
Distribution fees | | | 30,034 | |
Transfer agent fees | | | 35,025 | |
Accrued expenses and other liabilities | | | 22,046 | |
| | | | |
Total liabilities | | | 549,728 | |
| | | | |
Net assets, at value | | | $148,162,749 | |
| | | | |
Net assets consist of: | | | | |
Paid-in capital | | | $152,370,980 | |
Distributions in excess of net investment income | | | (3,445,622 | ) |
Net unrealized appreciation (depreciation) | | | 40,245,222 | |
Accumulated net realized gain (loss) | | | (41,007,831 | ) |
| | | | |
Net assets, at value | | | $148,162,749 | |
| | | | |
| | | | | | |
franklintempleton.com | | The accompanying notes are an integral part of these financial statements. | Annual Report | | | 19 | |
F R A N K L I N G L O B A L T R U S T
F I N A N C I A L S T A T E M E N T S
Statement of Assets and Liabilities (continued)
July 31, 2017
Franklin Global Real Estate Fund
| | | | |
| |
| Class A: | | | | |
Net assets, at value | | | $80,699,638 | |
| | | | |
Shares outstanding | | | 8,913,058 | |
| | | | |
Net asset value per sharea | | | $9.05 | |
| | | | |
Maximum offering price per share (net asset value per share ÷ 94.25%) | | | $9.60 | |
| | | | |
| |
| Class C: | | | | |
Net assets, at value | | | $15,529,394 | |
| | | | |
Shares outstanding | | | 1,741,352 | |
| | | | |
Net asset value and maximum offering price per sharea | | | $8.92 | |
| | | | |
| |
| Class R6: | | | | |
Net assets, at value | | | $ 18,462 | |
| | | | |
Shares outstanding | | | 2,030 | |
| | | | |
Net asset value and maximum offering price per share | | | $9.09 | |
| | | | |
| |
| Advisor Class: | | | | |
Net assets, at value | | | $51,915,255 | |
| | | | |
Shares outstanding | | | 5,706,196 | |
| | | | |
Net asset value and maximum offering price per share | | | $9.10 | |
| | | | |
aRedemption price is equal to net asset value less contingent deferred sales charges, if applicable.
| | | | |
20 | | Annual Report | The accompanying notes are an integral part of these financial statements. | | franklintempleton.com |
F R A N K L I N G L O B A L T R U S T
F I N A N C I A L S T A T E M E N T S
Statement of Operations
for the year ended July 31, 2017
Franklin Global Real Estate Fund
| | | | |
Investment income: | | | | |
Dividends | | | $ 3,849,890 | |
Interest | | | 5,057 | |
Other income (Note 1d) | | | 29,637 | |
| | | | |
Total investment income | | | 3,884,584 | |
| | | | |
Expenses: | | | | |
Management fees (Note 3a) | | | 1,522,711 | |
Distribution fees: (Note 3c) | | | | |
Class A | | | 214,806 | |
Class C | | | 171,241 | |
Transfer agent fees: (Note 3e) | | | | |
Class A | | | 146,324 | |
Class C | | | 29,100 | |
Class R6 | | | 147 | |
Advisor Class | | | 83,411 | |
Custodian fees (Note 4) | | | 12,834 | |
Reports to shareholders | | | 36,855 | |
Registration and filing fees | | | 65,781 | |
Professional fees | | | 62,452 | |
Trustees’ fees and expenses | | | 5,997 | |
Other | | | 11,116 | |
| | | | |
Total expenses | | | 2,362,775 | |
Expense reductions (Note 4) | | | (470 | ) |
Expenses waived/paid by affiliates (Note 3f) | | | (235,590 | ) |
| | | | |
Net expenses | | | 2,126,715 | |
| �� | | | |
Net investment income. | | | 1,757,869 | |
| | | | |
Realized and unrealized gains (losses): | | | | |
Net realized gain (loss) from: | | | | |
Investments | | | 5,266,030 | |
Realized gain distributions from REITs | | | 1,101,372 | |
Foreign currency transactions | | | (24,952 | ) |
| | | | |
Net realized gain (loss) | | | 6,342,450 | |
| | | | |
Net change in unrealized appreciation (depreciation) on: | | | | |
Investments | | | (15,785,744 | ) |
Translation of other assets and liabilities denominated in foreign currencies | | | 5,673 | |
| | | | |
Net change in unrealized appreciation (depreciation) | | | (15,780,071 | ) |
| | | | |
Net realized and unrealized gain (loss) | | | (9,437,621 | ) |
| | | | |
Net increase (decrease) in net assets resulting from operations | | | $ (7,679,752 | ) |
| | | | |
| | | | | | |
franklintempleton.com | | The accompanying notes are an integral part of these financial statements. | Annual Report | | | 21 | |
F R A N K L IN G L O B A L T R U S T
F I N A N C I A L S T A T E M E N T S
Statements of Changes in Net Assets
Franklin Global Real Estate Fund
| | | | | | | | |
| | | Year Ended July 31, | |
| | |
| | | 2017 | | | 2016 | |
Increase (decrease) in net assets: | | | | | | | | |
Operations: | | | | | | | | |
Net investment income. | | $ | 1,757,869 | | | $ | 2,714,297 | |
Net realized gain (loss) | | | 6,342,450 | | | | 2,300,939 | |
Net change in unrealized appreciation (depreciation) | | | (15,780,071 | ) | | | 13,547,408 | |
| | | | |
Net increase (decrease) in net assets resulting from operations | | | (7,679,752 | ) | | | 18,562,644 | |
| | | | |
Distributions to shareholders from: | | | | | | | | |
Net investment income: | | | | | | | | |
Class A | | | (3,089,261 | ) | | | (1,589,886 | ) |
Class C | | | (481,142 | ) | | | (230,329 | ) |
Class R6 | | | (589 | ) | | | (4,025 | ) |
Advisor Class | | | (1,792,637 | ) | | | (845,427 | ) |
| | | | |
Total distributions to shareholders. | | | (5,363,629 | ) | | | (2,669,667 | ) |
| | | | |
Capital share transactions: (Note 2) | | | | | | | | |
Class A | | | (14,476,653 | ) | | | (8,688,545 | ) |
Class C | | | (3,802,833 | ) | | | (3,966,078 | ) |
Class R6 | | | 3,286 | | | | (220,045 | ) |
Advisor Class | | | 3,985,219 | | | | 1,429,402 | |
| | | | |
Total capital share transactions | | | (14,290,981 | ) | | | (11,445,266 | ) |
| | | | |
Net increase (decrease) in net assets | | | (27,334,362 | ) | | | 4,447,711 | |
Net assets: | | | | | | | | |
Beginning of year | | | 175,497,111 | | | | 171,049,400 | |
| | | | |
End of year | | $ | 148,162,749 | | | $ | 175,497,111 | |
| | | | |
Distributions in excess of net investment income included in net assets: | | | | | | | | |
End of year | | $ | (3,445,622 | ) | | $ | (670,675 | ) |
| | | | |
| | | | |
22 | | Annual Report | The accompanying notes are an integral part of these financial statements. | | franklintempleton.com |
F R A N K L I N G L O B A L T R U S T
Notes to Financial Statements
Franklin Global Real Estate Fund
1. Organization and Significant Accounting Policies
Franklin Global Trust (Trust) is registered under the Investment Company Act of 1940 (1940 Act) as an open-end management investment company, consisting of five separate funds and applies the specialized accounting and reporting guidance in U.S. Generally Accepted Accounting Principles (U.S. GAAP). Franklin Global Real Estate Fund (Fund) is included in this report. The Fund offers four classes of shares: Class A, Class C, Class R6 and Advisor Class. Each class of shares may differ by its initial sales load, contingent deferred sales charges, voting rights on matters affecting a single class, its exchange privilege and fees due to differing arrangements for distribution and transfer agent fees.
The following summarizes the Fund’s significant accounting policies.
a. Financial Instrument Valuation
The Fund’s investments in financial instruments are carried at fair value daily. Fair value is the price that would be received to sell an asset or paid to transfer a liability in an orderly transaction between market participants on the measurement date. The Fund calculates the net asset value (NAV) per share as of 4 p.m. Eastern time each day the New York Stock Exchange (NYSE) is open for trading. Under compliance policies and procedures approved by the Trust’s Board of Trustees (the Board), the Fund’s administrator has responsibility for oversight of valuation, including leading the cross-functional Valuation Committee (VC). The VC provides administration and oversight of the Fund’s valuation policies and procedures, which are approved annually by the Board. Among other things, these procedures allow the Fund to utilize independent pricing services, quotations from securities and financial instrument dealers, and other market sources to determine fair value.
Equity securities listed on an exchange or on the NASDAQ National Market System are valued at the last quoted sale price or the official closing price of the day, respectively. Foreign equity securities are valued as of the close of trading on the foreign stock exchange on which the security is primarily traded, or as of 4 p.m. Eastern time. The value is then converted into its U.S. dollar equivalent at the foreign exchange rate in effect at 4 p.m. Eastern time on the day that the value of the security is determined. Over-the-counter (OTC) securities are valued within the range of the most recent quoted bid and ask
prices. Securities that trade in multiple markets or on multiple exchanges are valued according to the broadest and most representative market. Certain equity securities are valued based upon fundamental characteristics or relationships to similar securities.
Investments in time deposits are valued at cost, which approximates fair value.
The Fund has procedures to determine the fair value of financial instruments for which market prices are not reliable or readily available. Under these procedures, the VC convenes on a regular basis to review such financial instruments and considers a number of factors, including significant unobservable valuation inputs, when arriving at fair value. The VC primarily employs a market-based approach which may use related or comparable assets or liabilities, recent transactions, market multiples, book values, and other relevant information for the investment to determine the fair value of the investment. An income-based valuation approach may also be used in which the anticipated future cash flows of the investment are discounted to calculate fair value. Discounts may also be applied due to the nature or duration of any restrictions on the disposition of the investments. Due to the inherent uncertainty of valuations of such investments, the fair values may differ significantly from the values that would have been used had an active market existed. The VC employs various methods for calibrating these valuation approaches including a regular review of key inputs and assumptions, transactional back-testing or disposition analysis, and reviews of any related market activity.
Trading in securities on foreign securities stock exchanges and OTC markets may be completed before 4 p.m. Eastern time. In addition, trading in certain foreign markets may not take place on every Fund’s business day. Occasionally, events occur between the time at which trading in a foreign security is completed and 4 p.m. Eastern time that might call into question the reliability of the value of a portfolio security held by the Fund. As a result, differences may arise between the value of the Fund’s portfolio securities as determined at the foreign market close and the latest indications of value at 4 p.m. Eastern time. In order to minimize the potential for these differences, the VC monitors price movements following the close of trading in foreign stock markets through a series of country specific market proxies (such as baskets of American Depositary Receipts, futures contracts and exchange traded funds). These price movements are measured against established trigger thresholds for each specific market proxy to
| | | | |
franklintempleton.com | | Annual Report | | 23 |
F R A N K L I N G L O B A L T R U S T
N O T E S T O F I N A N C I A L S T A T E M E N T S
Franklin Global Real Estate Fund (continued)
1. Organization and Significant Accounting Policies (continued)
a. Financial Instrument Valuation (continued)
assist in determining if an event has occurred that may call into question the reliability of the values of the foreign securities held by the Fund. If such an event occurs, the securities may be valued using fair value procedures, which may include the use of independent pricing services.
When the last day of the reporting period is a non-business day, certain foreign markets may be open on those days that the Fund’s NAV is not calculated, which could result in differences between the value of the Fund’s portfolio securities on the last business day and the last calendar day of the reporting period. Any significant security valuation changes due to an open foreign market are adjusted and reflected by the Fund for financial reporting purposes.
b. Foreign Currency Translation
Portfolio securities and other assets and liabilities denominated in foreign currencies are translated into U.S. dollars based on the exchange rate of such currencies against U.S. dollars on the date of valuation. The Fund may enter into foreign currency exchange contracts to facilitate transactions denominated in a foreign currency. Purchases and sales of securities, income and expense items denominated in foreign currencies are translated into U.S. dollars at the exchange rate in effect on the transaction date. Portfolio securities and assets and liabilities denominated in foreign currencies contain risks that those currencies will decline in value relative to the U.S. dollar. Occasionally, events may impact the availability or reliability of foreign exchange rates used to convert the U.S. dollar equivalent value. If such an event occurs, the foreign exchange rate will be valued at fair value using procedures established and approved by the Board.
The Fund does not separately report the effect of changes in foreign exchange rates from changes in market prices on securities held. Such changes are included in net realized and unrealized gain or loss from investments in the Statement of Operations.
Realized foreign exchange gains or losses arise from sales of foreign currencies, currency gains or losses realized between the trade and settlement dates on securities transactions and the difference between the recorded amounts of dividends, interest, and foreign withholding taxes and the U.S. dollar equivalent of the amounts actually received or paid. Net unrealized foreign
exchange gains and losses arise from changes in foreign exchange rates on foreign denominated assets and liabilities other than investments in securities held at the end of the reporting period.
c. Securities Lending
The Fund participates in an agency based securities lending program to earn additional income. The Fund receives cash collateral against the loaned securities in an amount equal to at least 102% of the fair value of the loaned securities. Collateral is maintained over the life of the loan in an amount not less than 100% of the fair value of loaned securities, as determined at the close of Fund business each day; any additional collateral required due to changes in security values is delivered to the Fund on the next business day. The collateral is deposited into a joint cash account with other funds and is used to invest in a money market fund managed by Franklin Advisers, Inc., an affiliate of the Fund, and/or a joint repurchase agreement. The Fund may receive income from the investment of cash collateral, in addition to lending fees and rebates paid by the borrower. Income from securities loaned, net of fees paid to the securities lending agent and/or third-party vendor, is reported separately in the Statement of Operations. The Fund bears the market risk with respect to the collateral investment, securities loaned, and the risk that the agent may default on its obligations to the Fund. If the borrower defaults on its obligation to return the securities loaned, the Fund has the right to repurchase the securities in the open market using the collateral received. The securities lending agent has agreed to indemnify the Fund in the event of default by a third party borrower. At July 31, 2017, the Fund had no securities on loan.
d. Income and Deferred Taxes
It is the Fund’s policy to qualify as a regulated investment company under the Internal Revenue Code. The Fund intends to distribute to shareholders substantially all of its taxable income and net realized gains to relieve it from federal income and excise taxes. As a result, no provision for U.S. federal income taxes is required.
The Fund may be subject to foreign taxation related to income received, capital gains on the sale of securities and certain foreign currency transactions in the foreign jurisdictions in which it invests. Foreign taxes, if any, are recorded based on the tax regulations and rates that exist in the foreign markets in which the Fund invests. When a capital gain tax is determined
| | | | |
24 | | Annual Report | | franklintempleton.com |
F R A N K L I N G L O B A L T R U S T
N O T E S T O F I N A N C I A L S T A T E M E N T S
Franklin Global Real Estate Fund (continued)
to apply, the Fund records an estimated deferred tax liability in an amount that would be payable if the securities were disposed of on the valuation date.
As a result of several court cases, in certain countries across the European Union, the Fund filed additional tax reclaims for previously withheld taxes on dividends earned in those countries (EU reclaims). These additional filings are subject to various administrative proceedings by the local jurisdictions’ tax authorities within the European Union, as well as a number of related judicial proceedings. Income recognized, if any, for EU reclaims is reflected as other income in the Statement of Operations and any related receivable, if any, is reflected as European Union tax reclaims in the Statement of Assets and Liabilities. When uncertainty exists as to the ultimate resolution of these proceedings, the likelihood of receipt of these EU reclaims, and the potential timing of payment, no amounts are reflected in the financial statements. For U.S. income tax purposes, EU reclaims received by the Fund, if any, reduce the amounts of foreign taxes Fund shareholders can use as tax credits in their individual income tax returns. In the event that EU reclaims received by the Fund during the fiscal year exceed foreign withholding taxes paid, and the Fund previously passed foreign tax credit on to its shareholders, the Fund must either amend historic tax reporting to shareholders or enter into a closing agreement with the Internal Revenue Service (IRS) in order to pay the associated tax liability on behalf of the Fund’s shareholders.
The Fund may recognize an income tax liability related to its uncertain tax positions under U.S. GAAP when the uncertain tax position has a less than 50% probability that it will be sustained upon examination by the tax authorities based on its technical merits. As of July 31, 2017, the Fund has determined that no tax liability is required in its financial statements related to uncertain tax positions for any open tax years (or expected to be taken in future tax years). Open tax years are those that remain subject to examination and are based on the statute of limitations in each jurisdiction in which the Fund invests.
e. Security Transactions, Investment Income, Expenses and Distributions
Security transactions are accounted for on trade date. Realized gains and losses on security transactions are determined on a specific identification basis. Interest income and estimated expenses are accrued daily. Dividend income is recorded on the ex-dividend date except for certain dividends from securities
where the dividend rate is not available. In such cases, the dividend is recorded as soon as the information is received by the Fund. Distributions to shareholders are recorded on the ex-dividend date. Distributable earnings are determined according to income tax regulations (tax basis) and may differ from earnings recorded in accordance with U.S. GAAP. These differences may be permanent or temporary. Permanent differences are reclassified among capital accounts to reflect their tax character. These reclassifications have no impact on net assets or the results of operations. Temporary differences are not reclassified, as they may reverse in subsequent periods.
Common expenses incurred by the Trust are allocated among the Funds based on the ratio of net assets of each Fund to the combined net assets of the Trust. Fund specific expenses are charged directly to the Fund that incurred the expense.
Realized and unrealized gains and losses and net investment income, excluding class specific expenses, are allocated daily to each class of shares based upon the relative proportion of net assets of each class. Differences in per share distributions by class are generally due to differences in class specific expenses.
Distributions received by the Fund from certain securities may be a return of capital (ROC). Such distributions reduce the cost basis of the securities, and any distributions in excess of the cost basis are recognized as capital gains. For Real Estate Investment Trust (REIT) securities, the Fund records ROC estimates, if any, on the ex-dividend date and are adjusted once actual tax designations are known.
f. Accounting Estimates
The preparation of financial statements in accordance with U.S. GAAP requires management to make estimates and assumptions that affect the reported amounts of assets and liabilities at the date of the financial statements and the amounts of income and expenses during the reporting period. Actual results could differ from those estimates.
g. Guarantees and Indemnifications
Under the Trust’s organizational documents, its officers and trustees are indemnified by the Trust against certain liabilities arising out of the performance of their duties to the Trust. Additionally, in the normal course of business, the Trust, on behalf of the Fund, enters into contracts with service providers that contain general indemnification clauses. The Trust’s maximum exposure under these arrangements is unknown as
| | | | |
franklintempleton.com | | Annual Report | | 25 |
F R A N K L I N G L O B A L T R U S T
N O T E S T O F I N A N C I A L S T A T E M E N T S
Franklin Global Real Estate Fund (continued)
1. Organization and Significant Accounting Policies (continued)
g. Guarantees and Indemnifications (continued)
this would involve future claims that may be made against the Trust that have not yet occurred. Currently, the Trust expects the risk of loss to be remote.
2. Shares of Beneficial Interest
At July 31, 2017, there were an unlimited number of shares authorized (without par value). Transactions in the Fund’s shares were as follows:
| | | | | | | | | | | | | | | | |
| | | Year Ended July 31, | |
| | | 2017 | | | 2016 | |
| | | Shares | | | Amount | | | Shares | | | Amount | |
| Class A Shares: | | | | | | | | | | | | | | | | |
Shares sold | | | 1,144,042 | | | $ | 10,099,188 | | | | 1,590,561 | | | $ | 13,887,493 | |
Shares issued in reinvestment of distributions | | | 343,522 | | | | 2,948,908 | | | | 179,281 | | | | 1,517,212 | |
Shares redeemed | | | (3,154,730 | ) | | | (27,524,749 | ) | | | (2,761,668 | ) | | | (24,093,250 | ) |
Net increase (decrease) | | | (1,667,166 | ) | | $ | (14,476,653 | ) | | | (991,826 | ) | | $ | (8,688,545 | ) |
| | | | |
Class C Shares: | | | | | | | | | | | | | | | | |
Shares sold | | | 264,357 | | | $ | 2,316,608 | | | | 290,034 | | | $ | 2,532,929 | |
Shares issued in reinvestment of distributions | | | 53,268 | | | | 450,927 | | | | 25,022 | | | | 210,183 | |
Shares redeemed | | | (757,821 | ) | | | (6,570,368 | ) | | | (786,703 | ) | | | (6,709,190 | ) |
Net increase (decrease) | | | (440,196 | ) | | $ | (3,802,833 | ) | | | (471,647 | ) | | $ | (3,966,078 | ) |
| | | | |
Class R6 Shares: | | | | | | | | | | | | | | | | |
Shares sold | | | 309 | | | $ | 2,697 | | | | 262 | | | $ | 2,287 | |
Shares issued in reinvestment of distributions | | | 69 | | | | 589 | | | | 475 | | | | 4,025 | |
Shares redeemed | | | — | | | | — | | | | (26,812 | ) | | | (226,357 | ) |
Net increase (decrease) | | | 378 | | | $ | 3,286 | | | | (26,075 | ) | | $ | (220,045 | ) |
| | | | |
Advisor Class Shares: | | | | | | | | | | | | | | | | |
Shares sold | | | 1,226,464 | | | $ | 10,987,526 | | | | 757,568 | | | $ | 6,730,739 | |
Shares issued in reinvestment of distributions | | | 85,507 | | | | 737,427 | | | | 42,776 | | | | 362,740 | |
Shares redeemed | | | (884,047 | ) | | | (7,739,734 | ) | | | (640,171 | ) | | | (5,664,077 | ) |
Net increase (decrease) | | | 427,924 | | | $ | 3,985,219 | | | | 160,173 | | | $ | 1,429,402 | |
3. Transactions with Affiliates
Franklin Resources, Inc. is the holding company for various subsidiaries that together are referred to as Franklin Templeton Investments. Certain officers and trustees of the Trust are also officers and/or directors of the following subsidiaries:
| | |
| Subsidiary | | Affiliation |
Franklin Templeton Institutional, LLC (FT Institutional) | | Investment manager |
Franklin Templeton Services, LLC (FT Services) | | Administrative manager |
Franklin Templeton Distributors, Inc. (Distributors) | | Principal underwriter |
Franklin Templeton Investor Services, LLC (Investor Services) | | Transfer agent |
| | | | |
26 | | Annual Report | | franklintempleton.com |
F R A N K L I N G L O B A L T R U S T
N O T E S T O F I N A N C I A L S T A T E M E N T S
Franklin Global Real Estate Fund (continued)
a. Management Fees
The Fund pays an investment management fee to FT Institutional based on the average daily net assets of the Fund as follows:
| | |
| Annualized Fee Rate | | Net Assets |
1.000% | | Up to and including $500 million |
0.900% | | Over $500 million, up to and including $1 billion |
0.850% | | Over $1 billion, up to and including $1.5 billion |
0.800% | | Over $1.5 billion, up to and including $6.5 billion |
0.780% | | Over $6.5 billion, up to and including $11.5 billion |
0.760% | | Over $11.5 billion, up to and including $16.5 billion |
0.740% | | Over $16.5 billion, up to and including $19 billion |
0.730% | | Over $19 billion, up to and including $21.5 billion |
0.720% | | In excess of $21.5 billion |
For the year ended July 31, 2017, the effective investment management fee rate was 1.000% of the Fund’s average daily net assets.
b. Administrative Fees
Under an agreement with FT Institutional, FT Services provides administrative services to the Fund. The fee is paid by FT Institutional based on the Fund’s average daily net assets, and is not an additional expense of the Fund.
c. Distribution Fees
The Board has adopted a distribution plan for each share class, with the exception of Class R6 and Advisor Class shares, pursuant to Rule 12b-1 under the 1940 Act. Under the Fund’s Class A reimbursement distribution plan, the Fund reimburses Distributors for costs incurred in connection with the servicing, sale and distribution of the Fund’s shares up to the maximum annual plan rate. Under the Class A reimbursement distribution plan, costs exceeding the maximum for the current plan year cannot be reimbursed in subsequent periods. In addition, under the Fund’s Class C compensation distribution plan, the Fund pays Distributors for costs incurred in connection with the servicing, sale and distribution of the Fund’s shares up to the maximum annual plan rate. The plan year, for purposes of monitoring compliance with the maximum annual plan rates, is February 1 through January 31.
The maximum annual plan rates, based on the average daily net assets, for each class, are as follows:
| | | | |
Class A | | | 0.35 | % |
Class C | | | 1.00 | % |
The Board has set the current rate at 0.25% per year for Class A shares until further notice and approval by the Board.
d. Sales Charges/Underwriting Agreements
Front-end sales charges and contingent deferred sales charges (CDSC) do not represent expenses of the Fund. These charges are deducted from the proceeds of sales of Fund shares prior to investment or from redemption proceeds prior to remittance, as applicable. Distributors has advised the Fund of the following commission transactions related to the sales and redemptions of the Fund’s shares for the year:
| | | | |
Sales charges retained net of commissions paid to unaffiliated brokers/dealers. | | $ | 21,539 | |
CDSC retained | | $ | 540 | |
| | | | |
franklintempleton.com | | Annual Report | | 27 |
F R A N K L I N G L O B A L T R U S T
N O T E S T O F I N A N C I A L S T A T E M E N T S
Franklin Global Real Estate Fund (continued)
3. Transactions with Affiliates (continued)
e. Transfer Agent Fees
Each class of shares, except for Class R6, pays transfer agent fees to Investor Services for its performance of shareholder servicing obligations and reimburses Investor Services for out of pocket expenses incurred, including shareholder servicing fees paid to third parties. These fees are allocated daily based upon their relative proportion of such classes’ aggregate net assets. Class R6 pays Investor Services transfer agent fees specific to that class.
For the year ended July 31, 2017, the Fund paid transfer agent fees of $ 258,982, of which $126,267 was retained by Investor Services.
f. Waiver and Expense Reimbursements
FT Institutional and Investor Services have contractually agreed in advance to waive or limit their fees and to assume as their own expense certain expenses otherwise payable by the Fund so that the expenses (excluding distribution fees, and acquired fund fees and expenses), for Class A, Class C and Advisor Class of the Fund do not exceed 1.15%, and Class R6 does not exceed 0.98% based on the average net assets of each class (other than certain non-routine expenses or costs, including those relating to litigation, indemnification, reorganizations, and liquidations) until November 30, 2017. Total expenses waived or paid are not subject to recapture subsequent to the Fund’s fiscal year end. Prior to December 1, 2016, expenses for Class R6 were limited to 0.99%.
4. Expense Offset Arrangement
The Fund has entered into an arrangement with its custodian whereby credits realized as a result of uninvested cash balances are used to reduce a portion of the Fund’s custodian expenses. During the year ended July 31, 2017, the custodian fees were reduced as noted in the Statement of Operations.
5. Income Taxes
For tax purposes, capital losses may be carried over to offset future capital gains. Capital loss carryforwards with no expiration, if any, must be fully utilized before those losses with expiration dates.
At July 31, 2017, capital loss carryforwards were as follows:
| | | | |
Capital loss carryforwards expiring in: | | | | |
2018 | | $ | 35,647,494 | |
2019 | | | 557,818 | |
| | | | |
Total capital loss carryforwards | | $ | 36,205,312 | |
| | | | |
During the year ended July 31, 2017, the Fund utilized $5,819,685 of capital loss carryforwards.
On July 31, 2017, the Fund had expired capital loss carryforwards of $14,909,341 which were reclassified to paid-in capital.
For tax purposes, the Fund may elect to defer any portion of a post-October capital loss to the first day of the following fiscal year. At July 31, 2017, the Fund deferred post-October capital losses of $811,587.
The tax character of distributions paid during the years ended July 31, 2017 and 2016, was as follows:
| | | | | | | | |
| | | 2017 | | | 2016 | |
Distributions paid from ordinary income | | $ | 5,361,912 | | | $ | 2,669,667 | |
| | | | |
| | | | |
28 | | Annual Report | | franklintempleton.com |
F R A N K L I N G L O B A L T R U S T
N O T E S T O F I N A N C I A L S T A T E M E N T S
Franklin Global Real Estate Fund (continued)
At July 31, 2017, the cost of investments and net unrealized appreciation (depreciation) for income tax purposes were as follows:
| | | | |
Cost of investments | | $ | 114,641,233 | |
| | | | |
| |
Unrealized appreciation | | $ | 41,292,475 | |
Unrealized depreciation | | | (8,522,940) | |
| | | | |
Net unrealized appreciation (depreciation) | | $ | 32,769,535 | |
| | | | |
Differences between income and/or capital gains as determined on a book basis and a tax basis are primarily due to differing treatment of passive foreign investment company shares.
6. Investment Transactions
Purchases and sales of investments (excluding short term securities) for the year ended July 31, 2017, aggregated $42,102,776 and $59,041,299, respectively.
7. Concentration of Risk
Investing in foreign securities may include certain risks and considerations not typically associated with investing in U.S. securities, such as fluctuating currency values and changing local and regional economic, political and social conditions, which may result in greater market volatility. In addition, certain foreign securities may not be as liquid as U.S. securities.
The Fund invests a large percentage of its total assets in REIT securities. Such concentration may subject the Fund to special risks associated with real estate securities. These securities may be more sensitive to economic or regulatory developments due to a variety of factors such as local, regional, national and global economic conditions, interest rates and tax considerations.
8. Credit Facility
The Fund, together with other U.S. registered and foreign investment funds (collectively, Borrowers), managed by Franklin Templeton Investments, are borrowers in a joint syndicated senior unsecured credit facility totaling $2 billion (Global Credit Facility) which matures on February 9, 2018. This Global Credit Facility provides a source of funds to the Borrowers for temporary and emergency purposes, including the ability to meet future unanticipated or unusually large redemption requests.
Under the terms of the Global Credit Facility, the Fund shall, in addition to interest charged on any borrowings made by the Fund and other costs incurred by the Fund, pay its share of fees and expenses incurred in connection with the implementation and maintenance of the Global Credit Facility, based upon its relative share of the aggregate net assets of all of the Borrowers, including an annual commitment fee of 0.15% based upon the unused portion of the Global Credit Facility. These fees are reflected in other expenses in the Statement of Operations. During the year ended July 31, 2017, the Fund did not use the Global Credit Facility.
9. Fair Value Measurements
The Fund follows a fair value hierarchy that distinguishes between market data obtained from independent sources (observable inputs) and the Fund’s own market assumptions (unobservable inputs). These inputs are used in determining the value of the Fund’s financial instruments and are summarized in the following fair value hierarchy:
| | • | | Level 1 – quoted prices in active markets for identical financial instruments |
| | • | | Level 2 – other significant observable inputs (including quoted prices for similar financial instruments, interest rates, prepayment speed, credit risk, etc.) |
| | | | | | |
franklintempleton.com | | Annual Report | | | 29 | |
F R A N K L I N G L O B A L T R U S T
N O T E S T O F I N A N C I A L S T A T E M E N T S
Franklin Global Real Estate Fund (continued)
9. Fair Value Measurements (continued)
| | • | | Level 3 – significant unobservable inputs (including the Fund’s own assumptions in determining the fair value of financial instruments) |
The input levels are not necessarily an indication of the risk or liquidity associated with financial instruments at that level.
For movements between the levels within the fair value hierarchy, the Fund has adopted a policy of recognizing the transfers as of the date of the underlying event which caused the movement.
A summary of inputs used as of July 31, 2017, in valuing the Fund’s assets carried at fair value, is as follows:
| | | | | | | | | | | | | | | | |
| | | Level 1 | | | Level 2 | | | Level 3 | | | Total | |
| Assets: | | | | | | | | | | | | | | | | |
Investments in Securities: | | | | | | | | | | | | | | | | |
Equity Investmentsa | | $ | 147,210,768 | | | $ | — | | | $ | — | | | $ | 147,210,768 | |
Short Term Investments | | | — | | | | 200,000 | | | | — | | | | 200,000 | |
| | | | |
Total Investments in Securities | | $ | 147,210,768 | | | $ | 200,000 | | | $ | — | | | $ | 147,410,768 | |
| | | | |
aFor detailed categories, see the accompanying Statement of Investments.
10. Investment Company Reporting Modernization
In October 2016, the U.S. Securities and Exchange Commission adopted new rules and amended existing rules (together, final rules) intended to modernize the reporting and disclosure of information by registered investment companies. In part, the final rules amend Regulation S-X and require standardized, enhanced disclosures about derivatives in investment company financial statements, as well as other amendments. The compliance date for the amendments to Regulation S-X is August 1, 2017. Management has reviewed the requirements and believes the adoption of the amendments to Regulation S-X will not have a material impact on the Fund’s financial statements and related disclosures.
11. Subsequent Events
The Fund has evaluated subsequent events through the issuance of the financial statements and determined that no events have occurred that require disclosure.
Abbreviations
|
| Selected Portfolio |
| REIT Real Estate Investment Trust |
| | | | |
30 | | Annual Report | | franklintempleton.com |
F R A N K L I N G L O B A L T R U S T
Report of Independent Registered Public Accounting Firm
To the Board of Trustees of Franklin Global Trust and Shareholders of the Franklin Global Real Estate Fund
In our opinion, the accompanying statement of assets and liabilities, including the statement of investments, and the related statements of operations and of changes in net assets and the financial highlights present fairly, in all material respects, the financial position of the Franklin Global Real Estate Fund (the “Fund”) as of July 31, 2017, the results of its operations for the year then ended, the changes in its net assets for each of the two years in the period then ended and the financial highlights for each of the periods indicated, in conformity with accounting principles generally accepted in the United States of America. These financial statements and financial highlights (hereafter referred to as “financial statements”) are the responsibility of the Fund’s management. Our responsibility is to express an opinion on these financial statements based on our audits. We conducted our audits of these financial statements in accordance with the standards of the Public Company Accounting Oversight Board (United States). Those standards require that we plan and perform the audit to obtain reasonable assurance about whether the financial statements are free of material misstatement. An audit includes examining, on a test basis, evidence supporting the amounts and disclosures in the financial statements, assessing the accounting principles used and significant estimates made by management, and evaluating the overall financial statement presentation. We believe that our audits, which included confirmation of securities as of July 31, 2017 by correspondence with the custodian and brokers, provide a reasonable basis for our opinion.
PricewaterhouseCoopers LLP
San Francisco, California
September 15, 2017
| | | | | | |
franklintempleton.com | | Annual Report | | | 31 | |
F R A N K L I N G L O B A L T R U S T
Tax Information (unaudited)
Franklin Global Real Estate Fund
Under Section 854(b)(1)(B) of the Internal Revenue Code (Code), the Fund hereby reports the maximum amount allowable but no less than $773,556 as qualified dividends for purposes of the maximum rate under Section 1(h)(11) of the Code for the fiscal year ended July 31, 2017. Distributions, including qualified dividend income, paid during calendar year 2017 will be reported to shareholders on Form 1099-DIV by mid-February 2018. Shareholders are advised to check with their tax advisors for information on the treatment of these amounts on their individual income tax returns.
| | | | |
32 | | Annual Report | | franklintempleton.com |
F R A N K L I N G L O B A L T R U S T
Board Members and Officers
The name, year of birth and address of the officers and board members, as well as their affiliations, positions held with the Trust, principal occupations during at least the past five years and number of U.S. registered portfolios overseen in the Franklin Templeton Investments fund complex, are shown below. Generally, each board member serves until that person’s successor is elected and qualified.
Independent Board Members
| | | | | | | | |
Name,Year of Birth and Address | | Position | | Length of Time Served | | Number of Portfolios in Fund Complex Overseen by Board Member* | | Other Directorships Held During at Least the Past 5 Years |
| | | | |
Harris J. Ashton (1932) One Franklin Parkway San Mateo, CA 94403-1906 | | Trustee | | Since 2000 | | 140 | | Bar-S Foods (meat packing company) (1981-2010). |
|
Principal Occupation During at Least the Past 5 Years: Director of various companies; and formerly, Director, RBC Holdings, Inc. (bank holding company) (until 2002); and President, Chief Executive Officer and Chairman of the Board, General Host Corporation (nursery and craft centers) (until 1998). |
| | | | |
Mary C. Choksi (1950) One Franklin Parkway San Mateo, CA 94403-1906 | | Trustee | | Since 2014 | | 134 | | Avis Budget Group Inc. (car rental) (2007-present), Omnicom Group Inc. (advertising and marketing communications services) (2011-present). |
|
Principal Occupation During at Least the Past 5 Years: Director of various companies; and formerly, Founder and Senior Advisor, Strategic Investment Group (investment management group) (2015-2017), Founding Partner and Senior Managing Director, Strategic Investment Group (1987-2015); Founding Partner and Managing Director, Emerging Markets Management LLC (investment management firm) (1987-2011); and Loan Officer/Senior Loan Officer/Senior Pension Investment Officer, World Bank Group (international financial institution) (1977-1987). |
| | | | |
Edith E. Holiday (1952) One Franklin Parkway San Mateo, CA 94403-1906 | | Trustee | | Since 2000 | | 140 | | Hess Corporation (exploration of oil and gas) (1993-present), Canadian National Railway (railroad) (2001-present), White Mountains Insurance Group, Ltd. (holding company) (2004-present), Santander Consumer USA Holdings, Inc. (consumer finance) (2016-present), RTI International Metals, Inc. (manufacture and distribution of titanium) (1999-2015) and H.J. Heinz Company (processed foods and allied products) (1994-2013). |
|
Principal Occupation During at Least the Past 5 Years: Director or Trustee of various companies and trusts; and formerly, Assistant to the President of the United States and Secretary of the Cabinet (1990-1993); General Counsel to the United States Treasury Department (1989-1990); and Counselor to the Secretary and Assistant Secretary for Public Affairs and Public Liaison – United States Treasury Department (1988-1989). |
| | | | |
J. Michael Luttig (1954) One Franklin Parkway San Mateo, CA 94403-1906 | | Trustee | | Since 2009 | | 140 | | Boeing Capital Corporation (aircraft financing) (2006-2013). |
|
Principal Occupation During at Least the Past 5 Years: Executive Vice President, General Counsel and member of the Executive Council, The Boeing Company (aerospace company) (2006-present); and formerly, Federal Appeals Court Judge, U.S. Court of Appeals for the Fourth Circuit (1991-2006). |
| | | | | | |
franklintempleton.com | | Annual Report | | | 33 | |
F R A N K L I N G L O B A L T R U S T
Independent Board Members (continued)
| | | | | | | | |
Name,Year of Birth and Address | | Position | | Length of
Time Served | | Number of Portfolios in Fund Complex Overseen by Board Member* | | Other Directorships Held During at Least the Past 5 Years |
| | | | |
Larry D. Thompson (1945) One Franklin Parkway San Mateo, CA 94403-1906 | | Trustee | | Since 2007 | | 140 | | The Southern Company (energy company) (2014-present; previously 2010-2012), Graham Holdings Company (education and media organization) (2011-present) and Cbeyond, Inc. (business communications provider) (2010-2012). |
|
Principal Occupation During at Least the Past 5 Years: Director of various companies; John A. Sibley Professor of Corporate and Business Law, University of Georgia School of Law (2015-present; previously 2011-2012); and formerly, Executive Vice President – Government Affairs, General Counsel and Corporate Secretary, PepsiCo, Inc. (consumer products) (2012-2014); Senior Vice President – Government Affairs, General Counsel and Secretary, PepsiCo, Inc. (2004-2011); Senior Fellow of The Brookings Institution (2003-2004); Visiting Professor, University of Georgia School of Law (2004); and Deputy Attorney General, U.S. Department of Justice (2001-2003). |
| | | | |
John B. Wilson (1959) One Franklin Parkway San Mateo, CA 94403-1906 | | Lead Independent Trustee | | Trustee since 2006 and Lead Independent Trustee since 2008 | | 114 | | None |
|
Principal Occupation During at Least the Past 5 Years: President and Founder, Hyannis Port Capital, Inc. (real estate and private equity investing); (2002-present); serves on private and non-profit boards; and formerly, President, Staples International and Head of Global Transformation (office supplies) (2012-2016); Chief Operating Officer and Executive Vice President, Gap, Inc. (retail) (1996-2000); Chief Financial Officer and Executive Vice President – Finance and Strategy, Staples, Inc. (1992-1996); Senior Vice President – Corporate Planning, Northwest Airlines, Inc. (airlines) (1990-1992); and Vice President and Partner, Bain & Company (consulting firm) (1986-1990). |
| | |
| Interested Board Members and Officers | | | | |
| | | | |
Name,Year of Birth and Address | | Position | | Length of
Time Served | | Number of Portfolios in
Fund Complex Overseen
by Board Member* | | Other Directorships Held During at Least the Past 5 Years |
| | | | |
**Gregory E. Johnson (1961) One Franklin Parkway San Mateo, CA 94403-1906 | | Trustee | | Since 2007 | | 156 | | None |
|
Principal Occupation During at Least the Past 5 Years: Chairman of the Board, Member – Office of the Chairman, Director and Chief Executive Officer, Franklin Resources, Inc.; officer and/or director or trustee, as the case may be, of some of the other subsidiaries of Franklin Resources, Inc. and of 44 of the investment companies in Franklin Templeton Investments; Vice Chairman, Investment Company Institute; and formerly, President, Franklin Resources, Inc. (1994-2015). |
| | | | |
**Rupert H. Johnson, Jr. (1940) One Franklin Parkway San Mateo, CA 94403-1906 | | Chairman of the Board and Trustee | | Since 2013 | | 140 | | None |
|
Principal Occupation During at Least the Past 5 Years: Vice Chairman, Member – Office of the Chairman and Director, Franklin Resources, Inc.; Director, Franklin Advisers, Inc.; Senior Vice President, Franklin Advisory Services, LLC; and officer and/or director or trustee, as the case may be, of some of the other subsidiaries of Franklin Resources, Inc. and of 42 of the investment companies in Franklin Templeton Investments. |
| | | | |
Alison E. Baur (1964) One Franklin Parkway San Mateo, CA 94403-1906 | | Vice President | | Since 2012 | | Not Applicable | | Not Applicable |
|
Principal Occupation During at Least the Past 5 Years: Deputy General Counsel, Franklin Templeton Investments; and officer of some of the other subsidiaries of Franklin Resources, Inc. and of 45 of the investment companies in Franklin Templeton Investments. |
| | | | |
34 | | Annual Report | | franklintempleton.com |
F R A N K L I N G L O B A L T R U S T
Interested Board Members and Officers (continued)
| | | | | | | | |
Name,Year of Birth and Address | | Position | | Length of Time Served | | Number of Portfolios in Fund Complex Overseen by Board Member* | | Other Directorships Held During at Least the Past 5 Years |
| | | | |
Gaston Gardey (1967) One Franklin Parkway San Mateo, CA 94403-1906 | | Chief Financial
Officer, Chief
Accounting
Officer and
Treasurer | | Since 2009 | | Not Applicable | | Not Applicable |
|
Principal Occupation During at Least the Past 5 Years: Treasurer, U.S. Fund Administration & Reporting, Franklin Templeton Investments; and officer of 27 of the investment companies in Franklin Templeton Investments. |
| | | | |
Aliya S. Gordon (1973) One Franklin Parkway San Mateo, CA 94403-1906 | | Vice President | | Since 2009 | | Not Applicable | | Not Applicable |
|
Principal Occupation During at Least the Past 5 Years: Senior Associate General Counsel, Franklin Templeton Investments; and officer of 45 of the investment companies in Franklin Templeton Investments. |
| | | | |
Steven J. Gray (1955) One Franklin Parkway San Mateo, CA 94403-1906 | | Vice President | | Since 2009 | | Not Applicable | | Not Applicable |
|
Principal Occupation During at Least the Past 5 Years: Senior Associate General Counsel, Franklin Templeton Investments; Vice President, Franklin Templeton Distributors, Inc. and FT AlphaParity, LLC; and officer of 45 of the investment companies in Franklin Templeton Investments. |
| | | | |
Matthew T. Hinkle (1971) One Franklin Parkway San Mateo, CA 94403-1906 | | Chief Executive
Officer –
Finance and
Administration | | Since June 2017 | | Not Applicable | | Not Applicable |
|
Principal Occupation During at Least the Past 5 Years: Senior Vice President, U.S. Fund Administration Reporting & Fund Tax, Franklin Templeton Investments; officer of 45 of the investment companies in Franklin Templeton Investments; and formerly, Vice President, Global Tax (2012-April 2017) and Treasurer/Assistant Treasurer, Franklin Templeton Investments (2009-2017). |
| | | | |
Edward B. Jamieson (1948) One Franklin Parkway San Mateo, CA 94403-1906 | | President and
Chief Executive
Officer –
Investment
Management | | Since 2010 | | Not Applicable | | Not Applicable |
|
Principal Occupation During at Least the Past 5 Years: President and Director, Franklin Advisers, Inc.; Executive Vice President, Franklin Templeton Institutional, LLC; and officer and/or trustee, as the case may be, of some of the other subsidiaries of Franklin Resources, Inc. and of 10 of the investment companies in Franklin Templeton Investments. |
| | | | |
Robert Lim (1948) One Franklin Parkway San Mateo, CA 94403-1906 | | Vice President
–AML
Compliance | | Since 2016 | | Not Applicable | | Not Applicable |
|
Principal Occupation During at Least the Past 5 Years: Vice President, Franklin Templeton Companies, LLC; Chief Compliance Officer, Franklin Templeton Distributors, Inc. and Franklin Templeton Investor Services, LLC; and officer of 45 of the investment companies in Franklin Templeton Investments. |
| | | | |
Christopher J. Molumphy (1962) One Franklin Parkway San Mateo, CA 94403-1906 | | Vice President | | Since 2000 | | Not Applicable | | Not Applicable |
|
Principal Occupation During at Least the Past 5 Years: Director and Executive Vice President, Franklin Advisers, Inc.; Executive Vice President, Franklin Templeton Institutional, LLC; and officer of some of the other subsidiaries of Franklin Resources, Inc. and of 22 of the investment companies in Franklin Templeton Investments. |
| | | | | | |
franklintempleton.com | | Annual Report | | | 35 | |
F R A N K L I N G L O B A L T R U S T
Interested Board Members and Officers (continued)
| | | | | | | | |
Name,Year of Birth and Address | | Position | | Length of Time Served | | Number of Portfolios in Fund Complex Overseen by Board Member* | | Other Directorships Held During at Least the Past 5 Years |
| | | | |
Kimberly H. Novotny (1972) 300 S.E. 2nd Street Fort Lauderdale, FL 33301-1923 | | Vice President | | Since 2013 | | Not Applicable | | Not Applicable |
|
Principal Occupation During at Least the Past 5 Years: Associate General Counsel, Franklin Templeton Investments; Vice President and Corporate Secretary, Fiduciary Trust International of the South; Vice President, Templeton Investment Counsel, LLC; Assistant Secretary, Franklin Resources, Inc.; and officer of 45 of the investment companies in Franklin Templeton Investments. |
| | | | |
Robert C. Rosselot (1960) 300 S.E. 2nd Street Fort Lauderdale, FL 33301-1923 | | Chief Compliance
Officer | | Since 2013 | | Not Applicable | | Not Applicable |
|
Principal Occupation During at Least the Past 5 Years: Director, Global Compliance, Franklin Templeton Investments; Vice President, Franklin Templeton Companies, LLC; officer of 45 of the investment companies in Franklin Templeton Investments; and formerly, Senior Associate General Counsel, Franklin Templeton Investments (2007-2013); and Secretary and Vice President, Templeton Group of Funds (2004-2013). |
| | | | |
Karen L. Skidmore (1952) One Franklin Parkway San Mateo, CA 94403-1906 | | Vice President
and Secretary | | Since 2006 | | Not Applicable | | Not Applicable |
|
Principal Occupation During at Least the Past 5 Years: Senior Associate General Counsel, Franklin Templeton Investments; and officer of 45 of the investment companies in Franklin Templeton Investments. |
| | | | |
Navid J. Tofigh (1972) One Franklin Parkway San Mateo, CA 94403-1906 | | Vice President | | Since 2015 | | Not Applicable | | Not Applicable |
|
Principal Occupation During at Least the Past 5 Years: Associate General Counsel, Franklin Templeton Investments; and officer of 45 of the investment companies in Franklin Templeton Investments. |
| | | | |
Craig S. Tyle (1960) One Franklin Parkway San Mateo, CA 94403-1906 | | Vice President | | Since 2005 | | Not Applicable | | Not Applicable |
|
Principal Occupation During at Least the Past 5 Years: General Counsel and Executive Vice President, Franklin Resources, Inc.; and officer of some of the other subsidiaries of Franklin Resources, Inc. and of 45 of the investment companies in Franklin Templeton Investments. |
| | | | |
Lori A. Weber (1964) 300 S.E. 2nd Street Fort Lauderdale, FL 33301-1923 | | Vice President | | Since 2011 | | Not Applicable | | Not Applicable |
|
Principal Occupation During at Least the Past 5 Years: Senior Associate General Counsel, Franklin Templeton Investments; Assistant Secretary, Franklin Resources, Inc.; Vice President and Secretary, Templeton Investment Counsel, LLC; and officer of 45 of the investment companies in Franklin Templeton Investments. |
*We base the number of portfolios on each separate series of the U.S. registered investment companies within the Franklin Templeton Investments fund complex. These portfolios have a common investment manager or affiliated investment managers.
**Gregory E. Johnson is considered to be an interested person of the Fund under the federal securities laws due to his position as an officer and director of Franklin
Resources, Inc. (Resources), which is the parent company of the Fund’s investment manager and distributor. Rupert H. Johnson, Jr. is considered to be an interested person of the Fund under the federal securities laws due to his position as officer and director and major shareholder of Resources.
Note 1: Rupert H. Johnson, Jr. is the uncle of Gregory E. Johnson.
Note 2: Officer information is current as of the date of this report. It is possible that after this date, information about officers may change.
Note 3: Effective November 1, 2016, Frank Olson ceased to be a trustee of the Trust.
The Sarbanes-Oxley Act of 2002 and Rules adopted by the Securities and Exchange Commission require the Fund to disclose whether the Fund’s Audit Committee includes at least one member who is an audit committee financial expert within the meaning of such Act and Rules. The Fund’s Board has determined that there is at least one such financial expert on the Audit Committee and has designated John B. Wilson as its audit committee financial expert. The Board believes that Mr. Wilson qualifies as such an expert in view of his extensive business background and experience, including service as chief financial officer of Staples, Inc. from 1992 to 1996. Mr. Wilson has been a Member and Chairman of the Fund’s Audit Committee since 2006. As a result of such background and
| | | | |
36 | | Annual Report | | franklintempleton.com |
F R A N K L I N G L O B A L T R U S T
Interested Board Members and Officers (continued)
experience, the Board believes that Mr. Wilson has acquired an understanding of generally accepted accounting principles and financial statements, the general application of such principles in connection with the accounting estimates, accruals and reserves, and analyzing and evaluating financial statements that present a breadth and level of complexity of accounting issues generally comparable to those of the Fund, as well as an understanding of internal controls and procedures for financial reporting and an understanding of audit committee functions. Mr. Wilson is an independent Board member as that term is defined under the relevant Securities and Exchange Commission Rules and Releases.
The Statement of Additional Information (SAI) includes additional information about the board members and is available, without charge, upon request. Shareholders may call (800) DIAL BEN/342-5236 to request the SAI.
| | | | | | |
franklintempleton.com | | Annual Report | | | 37 | |
F R A N K L I N G L O B A L T R U S T
F R A N K L I N G L O B A L R E A L E S T A T E F U N D
Shareholder Information
Board Approval of Investment Management Agreements
FRANKLIN GLOBAL TRUST
Franklin Global Real Estate Fund
(Fund)
At an in-person meeting held on February 28, 2017 (Meeting), the Board of Trustees (Board) of Franklin Global Trust, including a majority of the trustees who are not “interested persons” as defined in the Investment Company Act of 1940 (Independent Trustees), reviewed and approved the continuance of the investment management agreement between Franklin Templeton Institutional, LLC (Manager) and the Fund (Management Agreement) for an additional one-year period. The Independent Trustees received advice from and met separately with Independent Trustee counsel in considering whether to approve the continuation of the Management Agreement.
In considering the continuation of the Management Agreement, the Board reviewed and considered information provided by the Manager at the Meeting and throughout the year at meetings of the Board and its committees. The Board also reviewed and considered information provided in response to a detailed set of requests for information submitted to the Manager by Independent Trustee counsel on behalf of the Independent Trustees in connection with the annual contract renewal process. In addition, prior to the Meeting, the Independent Trustees held a telephonic contract renewal meeting at which the Independent Trustees conferred amongst themselves and Independent Trustee counsel about contract renewal matters. The Board reviewed and considered all of the factors it deemed relevant in approving the continuance of the Management Agreement, including, but not limited to: (i) the nature, extent, and quality of the services provided by the Manager; (ii) the investment performance of the Fund; (iii) the costs of the services provided and profits realized by the Manager and its affiliates from the relationship with the Fund; (iv) the extent to which economies of scale are realized as the Fund grows; and (v) whether fee levels reflect these economies of scale for the benefit of Fund investors.
In approving the continuance of the Management Agreement, the Board, including a majority of the Independent Trustees, determined that the existing management fees are fair and reasonable and that the continuance of such Management Agreement is in the interests of the Fund and its shareholders. While attention was given to all information furnished, the
following discusses some primary factors relevant to the Board’s determination.
Nature, Extent and Quality of Services
The Board reviewed and considered information regarding the nature, extent and quality of investment management services provided by the Manager and its affiliates to the Fund and its shareholders. This information included, among other things, the qualifications, background and experience of the senior management and investment personnel of the Manager; the structure of investment personnel compensation; oversight of third-party service providers; investment performance reports and related financial information for the Fund; reports on expenses, shareholder services, marketing support payments made to financial intermediaries and third party servicing arrangements; legal and compliance matters; risk controls; pricing and other services provided by the Manager and its affiliates; and management fees charged by the Manager and its affiliates to U.S. funds and other accounts, including management’s explanation of differences among accounts where relevant. The Board noted management’s continual efforts and expenditures in establishing effective business continuity plans and developing strategies to address areas of heightened concern in the mutual fund industry, such as cybersecurity, derivatives and liquidity risk management.
The Board also reviewed and considered the benefits provided to Fund shareholders of investing in a fund that is part of the Franklin Templeton family of funds. The Board noted the financial position of Franklin Resources, Inc. (FRI), the Manager’s parent, and its commitment to the mutual fund business as evidenced by its continued introduction of new funds, reassessment of the fund offerings in response to the market environment and project initiatives and capital investments relating to the services provided to the Fund by the Franklin Templeton Investments (FTI) organization.
Following consideration of such information, the Board was satisfied with the nature, extent and quality of services provided by the Manager and its affiliates to the Fund and its shareholders.
Fund Performance
The Board reviewed and considered the performance results of the Fund over various time periods ended December 31, 2016. The Board considered the performance returns for the Fund in comparison to the performance returns of mutual funds deemed comparable to the Fund included in a universe (Performance Universe) selected by Broadridge Financial Solutions, Inc. (Broadridge), an independent provider of investment company
| | | | |
38 | | Annual Report | | franklintempleton.com |
F R A N K L I N G L O B A L T R U S T
F R A N K L I N G L O B A L R E A L E S T A T E F U N D
S H A R E H O L D E R I N F O R M A T I O N
data. The Board received a description of the methodology used by Broadridge to select the mutual funds included in a Performance Universe. The Board also reviewed and considered Fund performance reports provided and discussions that occurred with portfolio managers at Board meetings throughout the year. A summary of the Fund’s performance results is below.
The Performance Universe for the Fund included the Fund and all retail and institutional global real estate funds. The Board noted that the Fund’s annualized total return for the one-, three-, five- and 10-year periods was below the median of its Performance Universe. The Board concluded that the Fund’s performance was acceptable. In doing so, the Board noted management’s explanation that Fund underperformance was largely due to the Fund’s investment in stocks with larger market capitalizations and lower dividend yields consistent with its investment strategies, which emphasize quality companies, but that such investments posted negative total returns during the period. The Board also noted the Fund’s positive returns and that the Fund’s annualized total return for the three- and five-year periods, while below the median, exceeded 5.0% and 8.5%, respectively.
Comparative Fees and Expenses
The Board reviewed and considered information regarding the Fund’s actual total expense ratio and its various components, including, as applicable, management fees; transfer agent expenses; underlying fund expenses; Rule 12b-1 and non-Rule 12b-1 service fees; and other non-management fees. The Board also noted that at its February meeting each year, it receives an annual report on all marketing support payments made by FTI to financial intermediaries. The Board considered the actual total expense ratio and, separately, the contractual management fee rate, without the effect of fee waivers, if any (Management Rate) of the Fund in comparison to the median ratio and median Management Rate, respectively, of other mutual funds deemed comparable to and with a similar expense structure as the Fund selected by Broadridge (Expense Group). Broadridge fee and expense data is based upon information taken from the fund’s most recent annual report, which reflects historical asset levels that may be quite different from those currently existing, particularly in a period of market volatility. While recognizing such inherent limitation and the fact that expense ratios and Management Rates generally increase as assets decline and decrease as assets grow, the Board believed the independent analysis conducted by Broadridge to be an appropriate measure of comparative fees and expenses. The Broadridge Management Rate includes administrative charges,
and the actual total expense ratio, for comparative consistency, was shown for Class A shares for funds with multiple classes of shares. The Board received a description of the methodology used by Broadridge to select the mutual funds included in an Expense Group.
The Expense Group for the Fund included the Fund and ten other global real estate funds. The Board noted that the Management Rate for the Fund was above the median of its Expense Group, but its actual total expense ratio was below the median of its Expense Group. The Board concluded that the Management Rate charged to the Fund is fair and reasonable. In doing so, the Board noted that the Fund’s actual total expense ratio reflected a fee waiver from management.
Profitability
The Board reviewed and considered information regarding the profits realized by the Manager and its affiliates in connection with the operation of the Fund. In this respect, the Board considered the Fund profitability analysis provided by the Manager that addresses the overall profitability of FTI’s U.S. fund business, as well as its profits in providing investment management and other services to each of the individual funds during the 12-month period ended September 30, 2016, being the most recent fiscal year-end for FRI. The Board noted that although management continually makes refinements to its methodologies used in calculating profitability in response to organizational and product related changes, the overall methodology has remained consistent with that used in the Fund’s profitability report presentations from prior years. Additionally, the Fund’s independent registered public accounting firm has been engaged by the Manager to periodically review the reasonableness of the allocation methodologies to be used solely by the Fund’s Board with respect to the profitability analysis.
The Board noted management’s belief that costs incurred in establishing the infrastructure necessary for the type of mutual fund operations conducted by the Manager and its affiliates may not be fully reflected in the expenses allocated to the Fund in determining its profitability, as well as the fact that the level of profits, to a certain extent, reflected operational cost savings and efficiencies initiated by management. The Board also noted management’s expenditures in improving shareholder services provided to the Fund, as well as the need to implement systems and meet additional regulatory and compliance requirements resulting from recent SEC and other regulatory requirements.
The Board also considered the extent to which the Manager and its affiliates might derive ancillary benefits from fund
| | | | | | |
franklintempleton.com | | Annual Report | | | 39 | |
F R A N K L I N G L O B A L T R U S T
F R A N K L I N G L O B A L R E A L E S T A T E F U N D
S H A R E H O L D E R I N F O R M A T I O N
operations, including revenues generated from transfer agent services, potential benefits resulting from personnel and systems enhancements necessitated by fund growth, as well as increased leverage with service providers and counterparties. Based upon its consideration of all these factors, the Board concluded that the level of profits realized by the Manager and its affiliates from providing services to the Fund was not excessive in view of the nature, quality and extent of services provided to the Fund.
Economies of Scale
The Board reviewed and considered the extent to which the Manager may realize economies of scale, if any, as the Fund grows larger and whether the Fund’s management fee structure reflects any economies of scale for the benefit of shareholders. With respect to possible economies of scale, the Board noted the existence of management fee breakpoints, which operate generally to share any economies of scale with a Fund’s shareholders by reducing the Fund’s effective management fees as the Fund grows in size. The Board considered the Manager’s view that any analyses of potential economies of scale in managing a particular fund are inherently limited in light of the joint and common costs and investments the Manager incurs across the Franklin Templeton family of funds as a whole. The Board noted that the Fund has not yet reached an asset size that would likely enable the Fund to achieve economies of scale, but concluded that to the extent economies of scale may be realized by the Manager and its affiliates, the Fund’s management fee structure provided a sharing of benefits with the Fund and its shareholders as the Fund grows.
Conclusion
Based on its review, consideration and evaluation of all factors it believed relevant, including the above-described factors and conclusions, the Board unanimously approved the continuation of the Management Agreement for an additional one-year period.
Proxy Voting Policies and Procedures
The Fund’s investment manager has established Proxy Voting Policies and Procedures (Policies) that the Fund uses to determine how to vote proxies relating to portfolio securities. Shareholders may view the Fund’s complete Policies online at franklintempleton.com. Alternatively, shareholders may request copies of the Policies free of charge by calling the Proxy Group collect at (954) 527-7678 or by sending a written request to: Franklin Templeton Companies, LLC, 300 S.E. 2nd Street, Fort Lauderdale, FL 33301, Attention: Proxy Group. Copies of the Fund’s proxy voting records are also made available online
at franklintempleton.com and posted on the U.S. Securities and Exchange Commission’s website at sec.gov and reflect the most recent 12-month period ended June 30.
Quarterly Statement of Investments
The Trust, on behalf of the Fund, files a complete statement of investments with the U.S. Securities and Exchange Commission for the first and third quarters for each fiscal year on Form N-Q. Shareholders may view the filed Form N-Q by visiting the Commission’s website at sec.gov. The filed form may also be viewed and copied at the Commission’s Public Reference Room in Washington, DC. Information regarding the operations of the Public Reference Room may be obtained by calling (800) SEC-0330.
Householding of Reports and Prospectuses
You will receive the Fund’s financial reports every six months as well as an annual updated summary prospectus (prospectus available upon request). To reduce Fund expenses, we try to identify related shareholders in a household and send only one copy of the financial reports and summary prospectus. This process, called “householding,” will continue indefinitely unless you instruct us otherwise. If you prefer not to have these documents householded, please call us at (800) 632-2301. At any time you may view current prospectuses/summary prospectuses and financial reports on our website. If you choose, you may receive these documents through electronic delivery.
| | | | |
40 | | Annual Report | | franklintempleton.com |
| | |
| | Annual Report and Shareholder Letter Franklin Global Real Estate Fund Investment Manager Franklin Templeton Institutional, LLC Distributor Franklin Templeton Distributors, Inc. (800) DIAL BEN® / 342-5236 franklintempleton.com Shareholder Services (800) 632-2301 |
Authorized for distribution only when accompanied or preceded by a summary prospectus and/or prospectus. Investors should carefully consider a fund’s investment goals, risks, charges and expenses before investing. A prospectus contains this and other information; please read it carefully before investing.
To help ensure we provide you with quality service, all calls to and from our service areas are monitored and/or recorded.
| | |
| © 2017 Franklin Templeton Investments. All rights reserved. | | 495 A 09/17 |
| | | | |
| | | | Annual Report and Shareholder Letter July 31, 2017 |
| | | |

Franklin International Growth Fund
Franklin International Small Cap Growth Fund
Sign up for electronic delivery at franklintempleton.com/edelivery
Franklin Templeton Investments
Gain From Our Perspective®
At Franklin Templeton Investments, we’re dedicated to one goal: delivering exceptional asset management for our clients. By bringing together multiple, world-class investment teams in a single firm, we’re able to offer specialized expertise across styles and asset classes, all supported by the strength and resources of one of the world’s largest asset managers. This has helped us to become a trusted partner to individual and institutional investors across the globe.
Dear Shareholder:
The 12 months ended July 31, 2017, benefited from mostly upbeat global economic data, improved U.S. corporate earnings and generally supportive monetary policies. The U.S. job market remained healthy as the unemployment rate declined. The U.S. Federal Reserve raised its federal funds target rate three times during the period and hinted at its July meeting that it may begin reducing its balance sheet. The global economy expanded moderately as the eurozone and Japanese economies reported strong economic data and their respective central banks maintained low interest rates. In this environment, stocks in global developed markets excluding the U.S. and Canada ended the period with positive returns, as measured by the MSCI Europe, Australasia and Far East Index.
We are committed to our long-term perspective and disciplined investment approach as we conduct a rigorous, fundamental analysis of securities with a regular emphasis on investment risk management.
We believe active, professional investment management serves investors well. We also recognize the important role of financial advisors in today’s markets and encourage investors to continue to seek their advice. Amid changing markets and economic conditions, we are confident investors with a well-diversified portfolio and a patient, long-term outlook should be well positioned for the years ahead.
Franklin Global Trust’s annual report includes more detail about prevailing conditions and discussions about investment decisions during the period. Please remember all securities markets fluctuate, as do mutual fund share prices.
We thank you for investing with Franklin Templeton, welcome your questions and comments, and look forward to serving your future investment needs.
Sincerely,
Edward B. Jamieson
President and Chief Executive Officer –
Investment Management
Franklin Global Trust
This letter reflects our analysis and opinions as of July 31, 2017, unless otherwise indicated. The information is not a complete analysis of every aspect of any market, country, industry, security or fund. Statements of fact are from sources considered reliable.
| | | | | | | | |
Not FDIC Insured | | | | | May Lose Value | | | | | No Bank Guarantee |
| | | | |
| | | |
franklintempleton.com | | Not part of the annual report | | 1 |
Visit franklintempleton.com for fund updates, to access your account, or to find helpful financial planning tools.
| | | | |
| | | |
2 | | Annual Report | | franklintempleton.com |
Annual Report
Economic and Market Overview
The U.S. economy generally expanded during the 12-month period ended July 31, 2017. The economy strengthened in 2017’s second quarter, after moderating in the previous two quarters, largely due to growth in consumer spending, business investment and federal government spending. The manufacturing sector generally expanded, and the services sector also continued to grow during the period. The unemployment rate decreased from 4.9% in July 2016 to 4.3% at period-end.1 Annual inflation, as measured by the Consumer Price Index, increased from 0.8% to 1.7% during the period. Monthly retail sales were volatile, but mostly grew during the period.
The U.S. Federal Reserve (Fed) raised its target range for the federal funds rate by 0.25% three times during the period amid signs of a growing U.S. economy, a strengthening labor market and an improvement in business spending. At its July meeting, the Fed kept its target range unchanged, but signaled it expects to begin implementing its balance sheet reduction relatively soon, provided the economy continues to evolve as anticipated. The broad U.S. stock market, as measured by the Standard & Poor’s® 500 Index, advanced for the 12 months ended July 31, 2017.
The global economy grew moderately during the 12 months under review. In this environment, global developed and emerging market stocks rose, as measured by the MSCI All Country World Index. Global markets were aided by improved industrial commodity prices at certain points during the period, generally upbeat economic data across regions, investor optimism about pro-growth and pro-business policies in the U.S., hopes of tax reforms under the Trump administration, Emmanuel Macron’s election as France’s president, accommodative monetary policies of various global central banks, and encouraging corporate earnings reports.
However, investors expressed concerns about the timing and economic effects of the U.K.’s exit from the European Union (also known as “Brexit”) and the U.S. executive order banning entry from some Muslim-majority countries. Other headwinds included the health of European banks, concerns surrounding political uncertainty in the U.S. and European Union, geopolitical tensions in certain regions, worries about global oversupply in oil production despite a pact to extend cuts, and hawkish comments from key central bankers around the world.
In Europe, the U.K.’s economy grew at a slower rate in 2017’s first quarter over the previous quarter, largely due to slower growth in household spending. However, the nation’s growth rate improved slightly in 2017’s second quarter, supported by growth in services. The Bank of England cut its benchmark interest rate and expanded its massive bond-buying program in August 2016 to boost the nation’s growth. The eurozone’s growth increased in 2017’s second quarter over the previous quarter. The bloc’s annual inflation rate, while low, ended higher than it was at the start of the period. The European Central Bank (ECB) kept its key policy rates unchanged during the period. However, at its July meeting, ECB president Mario Draghi signaled that the bank would reassess its policy stance on quantitative easing in the fall of 2017.
In Asia, Japan’s quarterly gross domestic product (GDP) grew at the fastest rate in more than two years, driven by household spending, capital expenditure and government spending. In July 2017, the Bank of Japan slightly increased its GDP forecasts for the 2017 and 2018 fiscal years, but lowered its inflation forecasts for the same period. China’s annual GDP grew faster in the first and second quarters of 2017 compared with the third and fourth quarters of 2016. The People’s Bank of China left its benchmark interest rate unchanged during the period.
The foregoing information reflects our analysis and opinions as of July 31, 2017. The information is not a complete analysis of every aspect of any market, country, industry, security or fund.
Statements of fact are from sources considered reliable.
1. Source: Bureau of Labor Statistics.
| | | | |
| | | |
franklintempleton.com | | Annual Report | | 3 |
Franklin International Growth Fund
We are pleased to bring you Franklin International Growth Fund’s annual report for the fiscal year ended July 31, 2017.
Your Fund’s Goal and Main Investments
The Fund seeks long-term capital appreciation by investing predominantly in equity securities of mid- and large-capitalization companies, generally those with market capitalizations greater than $2 billion, located outside of the U.S., including developing or emerging market countries. The Fund considers international companies to be those organized under the laws of a country outside of the U.S. or having a principal office in a country outside of the U.S., or whose securities are listed or traded principally on a recognized stock exchange or over-the-counter market outside of the U.S.
Performance Overview
For the 12 months ended July 31, 2017, the Fund’s Class A shares delivered a +19.70% cumulative total return. In comparison, the Fund’s new benchmark, the MSCI Europe, Australasia and Far East (EAFE) (Net Dividends) Index, returned +17.77%, while the Fund’s old benchmark, the MSCI EAFE Index, returned +18.32%.1 The MSCI EAFE Index measures global developed stock market performance excluding the U.S. and Canada. The investment manager believes the Net Dividends Index is more in line with the Fund, taking into account the impact of foreign withholding taxes. You can find the Fund’s long-term performance data in the Performance Summary beginning on page 8.
Performance data represent past performance, which does not guarantee future results. Investment return and principal value will fluctuate, and you may have a gain or loss when you sell your shares. Current performance may differ from figures shown. For most recent month-end performance, go to franklintempleton.com or call (800) 342-5236.
Investment Strategy
In choosing individual equity investments, we employ a disciplined, bottom-up approach to identify attractive
Geographic Composition
Based on Total Net Assets as of 7/31/17
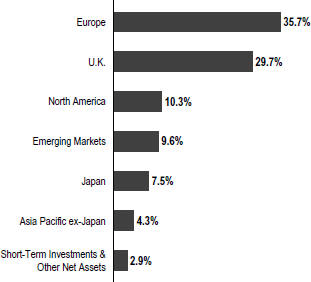
investment opportunities that have higher expected revenue and earnings growth than their peers. We use a growth investment style and in-depth, fundamental research to identify high-quality companies, across all industry groups, with sustainable business models that offer the most attractive combination of growth potential, quality and valuation.
Manager’s Discussion
The Fund, before sales charges, outperformed its benchmark, the MSCI EAFE (Net Dividends) Index, during the 12 months under review, as stock selection and sector weightings contributed to relative performance. Security selection in the consumer discretionary, information technology (IT), health care and financials sectors contributed, while stock selection in the industrials, materials and energy sectors detracted.2
Asia-based holdings contributed to relative performance in the consumer discretionary sector during the 12-month period. China-based TAL Education Group, an after-school tutoring company, supported relative performance.3 We continue to think the company’s earnings momentum will likely remain
1. Source: Morningstar.
The indexes are unmanaged and include reinvestment of any income or distributions. They do not reflect any fees, expenses or sales charges. One cannot invest directly in an index, and an index is not representative of the Fund’s portfolio.
2. The consumer discretionary sector comprises auto components; diversified consumer services; Internet and direct marketing retail; media; multiline retail; and textiles, apparel and luxury goods in the SOI. The IT sector comprises Internet software and services, IT services and software in the SOI. The health care sector comprises biotechnology, health care equipment and supplies, and pharmaceuticals in the SOI. The financials sector comprises banks and capital markets in the SOI. The industrials sector comprises aerospace and defense, machinery, professional services, road and rail, and trading companies and distributors in the SOI. The materials sector comprises chemicals in the SOI. The energy sector comprises energy equipment and services in the SOI.
3. Not part of the index.
The dollar value, number of shares or principal amount, and names of all portfolio holdings are listed in the Fund’s Statement of Investments (SOI). The SOI begins on page 25.
| | | | |
4 | | Annual Report | | franklintempleton.com |
F R A N K L I N INTERNATIONAL GROWTH FUND
strong, given the Chinese education system’s heavy focus on testing and the company’s consistent approach to teaching. Start Today, a Japan-based online retailer that sells third-party brands through its Zozotown website, also contributed. As a major online apparel specialist in Japan, Start Today, in our assessment, is likely to continue to take advantage of the secular growth opportunity in Japanese online retail as online penetration levels remain low.
| | | | |
| Top 10 Sectors/Industries | | | |
| 7/31/17 | | | |
| |
| | | % of Total
Net Assets | |
| Software | | | 11.4% | |
| Chemicals | | | 8.5% | |
| Pharmaceuticals | | | 7.8% | |
| Capital Markets | | | 7.7% | |
| Internet & Direct Marketing Retail | | | 5.6% | |
| Internet Software & Services | | | 5.5% | |
| Machinery | | | 5.3% | |
| Health Care Equipment & Supplies | | | 4.5% | |
| Biotechnology | | | 4.5% | |
| Road & Rail | | | 3.6% | |
IT contributors to relative performance included Argentina-based MercadoLibre, a pan-Latin American online marketplace operator, and U.K.-based Sophos Group, a security software company.3 MercadoLibre benefited from strong growth across Latin America as well as greater adoption of its payment services. Sophos was supported by a combination of good earnings results and expectations that recent cyberattacks would lead to greater demand for its services. Israel-based network security firm Check Point Software Technologies also contributed amid a strong demand for security solutions.4
In the health care sector, GN Store Nord, a Denmark-based hearing aid and headset manufacturer, contributed to relative performance amid robust earnings.3 The company generated strong growth across its business and expects a recently launched hearing aid to further support sales.
In financials, Belgian bank KBC Groep supported relative returns due to more positive sentiment toward European banks during the period and optimism about its growth outlook. KBC is investing in digital initiatives, which we expect will help support longer-term growth. Italian wealth manager Azimut Holding contributed amid solid inflows and optimism about the state of the Italian financial system.3 The company has
4. No longer held by period-end.
| | | | |
| Top 10 Holdings | | | |
| 7/31/17 | | | |
| |
Company Sector/Industry, Country | | % of Total
Net Assets | |
DSV AS Road & Rail, Denmark | | | 3.6% | |
TAL Education Group Diversified Consumer Services, China | | | 3.6% | |
KBC Groep NV Banks, Belgium | | | 3.4% | |
Umicore SA Chemicals, Belgium | | | 3.4% | |
Vipshop Holdings Ltd. Internet & Direct Marketing Retail, China | | | 3.4% | |
Azimut Holding SpA Capital Markets, Italy | | | 3.1% | |
Sophos Group PLC Software, U.K. | | | 3.0% | |
Hikma Pharmaceuticals PLC Pharmaceuticals, U.K. | | | 3.0% | |
Line Corp. Software, Japan | | | 2.9% | |
Just Eat PLC Internet Software & Services, U.K. | | | 2.8% | |
continued to attract assets as investors look for higher returns given the low interest-rate environment in Italy and Europe more broadly. We also believe ongoing asset quality issues at Italian banks should continue to support inflows.
Other notable individual contributors to relative performance included Germany-based airplane engine manufacturer MTU Aero Engines3 and Danish logistics firm DSV in the industrials sector. We believe MTU’s business momentum remains strong despite a slight delay in delivering new engines. DSV is starting to see improvements in Europe and has benefited from the integration of a recent acquisition.
In contrast, key detractors from relative performance in the industrials sector included Hong Kong-based commodities trader Noble Group, which hindered relative performance amid heightened concerns about its profitability and its ability to service its debt load.4 Germany-based GEA Group, a food processing equipment manufacturer, also detracted due to investor concerns about its order book and recent investments in overhauling its technology systems.
Materials stock Symrise, a flavors and fragrances manufacturer, advanced but lagged the sector, causing our overweighted position to hurt relative performance during the period. We
| | | | | | |
franklintempleton.com | | Annual Report | | | 5 | |
F R A N K L I N I N T E R N A T I O N A L G R O W T H F U N D
expect Symrise could grow faster than the industry as it may benefit from its exposure to emerging markets as well as the longer-term trends toward urbanization, a growing global middle class and demand for healthier and more sustainable food and personal products.
In the energy sector, shares of Amec Foster Wheeler, a U.K.-based engineering and consulting services company, rose slightly, but lagged the index’s energy sector returns and dampened relative results.3 In addition to the pressure from falling oil prices and a weak capital spending environment, the company’s stock was negatively affected by concerns about a U.K. bribery investigation into the company and oilfield services company John Wood Group (not a Fund holding), which is acquiring Amec Foster Wheeler. Although we believe the market has overreacted to the news, we continue to monitor the developments closely.
Other key individual detractors from relative performance included U.K.-listed generic drug maker Hikma Pharmaceuticals and Japanese ophthalmic drug manufacturer Santen Pharmaceutical in the health care sector. Hikma Pharmaceuticals’ shares declined after the company received a letter from the U.S. Food and Drug Administration suggesting the likelihood of gaining approval for a generic asthma drug was low.
Our position in Japanese social media company Line detracted from relative results in the IT sector. The company continues to invest in its business, which has led to weaker profits. We believe many of these investments will generate future growth and that the better performance in its advertising business is encouraging. U.K.-based accounting software firm The Sage Group was another detractor despite its progress in transitioning from a license-based business toward a cloud-based subscription model.
Vipshop Holdings, a Chinese Internet flash sale operator, curbed relative returns in the consumer discretionary sector.3 Vipshop’s stock price has been volatile as the company’s growth begins to decelerate to a more sustainable level.
In terms of sector allocations, an underweighting in consumer staples5 and an overweighting in IT contributed. In contrast, an underweighting in financials and an overweighting in health care detracted from relative returns.
5. The consumer staples sector comprises household products in the SOI.
See www.franklintempletondatasources.com for additional data provider information.
| | | | |
| Top 10 Countries | | | |
| 7/31/17 | | | |
| |
| | | % of Total
Net Assets | |
| U.K. | | | 29.7% | |
| Germany | | | 12.6% | |
| Japan | | | 7.5% | |
| China | | | 6.9% | |
| Belgium | | | 6.9% | |
| Denmark | | | 5.9% | |
| Italy | | | 5.4% | |
| U.S. | | | 5.2% | |
| Canada | | | 5.1% | |
| Australia | | | 4.3% | |
Regionally, exposure to emerging markets, namely China and Argentina, contributed significantly to relative performance.3 In contrast, an overweighting in the U.K. hampered relative returns. In Asia Pacific ex-Japan, stock selection in Hong Kong dampened relative results.
It is important to recognize the effect of currency movements on the Fund’s performance. In general, if the value of the U.S. dollar goes up compared with a foreign currency, an investment traded in that foreign currency will go down in value because it will be worth fewer U.S. dollars. This can have a negative effect on Fund performance. Conversely, when the U.S. dollar weakens in relation to a foreign currency, an investment traded in that foreign currency will increase in value, which can contribute to Fund performance. For the 12 months ended July 31, 2017, the U.S. dollar declined in value relative to most currencies. As a result, the Fund’s performance was positively affected by the portfolio’s investment predominantly in securities with non-U.S. currency exposure. However, one cannot expect the same result in future periods.
| | | | |
| 6 | | Annual Report | | franklintempleton.com |
F R A N K L I N I N T E R N A T I O N A L G R O W T H F U N D
Thank you for your continued participation in Franklin International Growth Fund. We look forward to serving your future investment needs.
| | |
 | | 
Donald G. Huber, CFA |
| |

| | 
Coleen F. Barbeau, CFA |
| |
| | M. Par Rostom, CFA |
| |
| | Portfolio Management Team |
The foregoing information reflects our analysis, opinions and portfolio holdings as of July 31, 2017, the end of the reporting period. The way we implement our main investment strategies and the resulting portfolio holdings may change depending on factors such as market and economic conditions. These opinions may not be relied upon as investment advice or an offer for a particular security. The information is not a complete analysis of every aspect of any market, country, industry, security or the Fund. Statements of fact are from sources considered reliable, but the investment manager makes no representation or warranty as to their completeness or accuracy. Although historical performance is no guarantee of future results, these insights may help you understand our investment management philosophy.
CFA® is a trademark owned by CFA Institute.
| | | | | | |
| franklintempleton.com | | Annual Report | | | 7 | |
F R A N K L I N I N T E R N A T I O N A L G R O W T H F U N D
Performance Summary as of July 31, 2017
The performance table and graphs do not reflect any taxes that a shareholder would pay on Fund dividends, capital gain distributions, if any, or any realized gains on the sale of Fund shares. Total return reflects reinvestment of the Fund’s dividends and capital gain distributions, if any, and any unrealized gains or losses. Your dividend income will vary depending on dividends or interest paid by securities in the Fund’s portfolio, adjusted for operating expenses of each class. Capital gain distributions are net profits realized from the sale of portfolio securities.
Performance as of 7/31/171
Cumulative total return excludes sales charges. Average annual total return includes maximum sales charges. Sales charges will vary depending on the size of the investment and the class of share purchased. The maximum is 5.75% and the minimum is 0%. Class A: 5.75% maximum initial sales charge; Advisor Class: no sales charges. For other share classes, visit franklintempleton.com.
| | | | |
Share Class | | Cumulative Total Return2 | | Average Annual Total Return3 |
| | |
| A | | | | |
1-Year | | +19.70% | | +12.78% |
5-Year | | +48.82% | | +6.99% |
Since Inception (6/3/08) | | +40.19% | | +3.09% |
| | |
| Advisor | | | | |
1-Year | | +20.04% | | +20.04% |
5-Year | | +50.99% | | +8.59% |
Since Inception (6/3/08) | | +43.83% | | +4.05% |
Performance data represent past performance, which does not guarantee future results. Investment return and principal value will fluctuate, and you may have a gain or loss when you sell your shares. Current performance may differ from figures shown. For most recent month-end performance, go to franklintempleton.com or call (800) 342-5236.
See page 10 for Performance Summary footnotes.
| | | | |
| 8 | | Annual Report | | franklintempleton.com |
F R A N K L I N I N T E R N A T I O N A L G R O W T H F U N D
P E R F O R M A N C E S U M M A R Y
Total Return Index Comparison for a Hypothetical $10,000 Investment1
Total return represents the change in value of an investment over the periods shown. It includes any applicable maximum sales charge, Fund expenses, account fees and reinvested distributions. The unmanaged indexes include reinvestment of any income or distributions. They differ from the Fund in composition and do not pay management fees or expenses. One cannot invest directly in an index.
Class A (6/3/08–7/31/17)
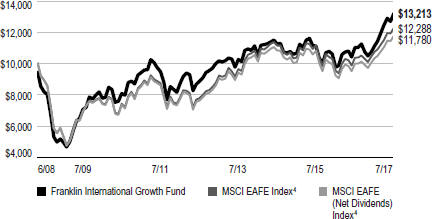
Advisor Class (6/3/08–7/31/17)
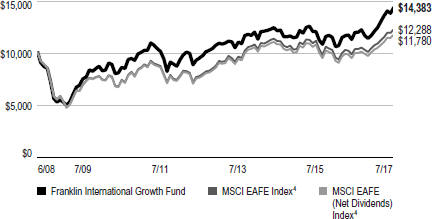
See page 10 for Performance Summary footnotes.
| | | | | | |
| franklintempleton.com | | Annual Report | | | 9 | |
F R A N K L I N I N T E R N A T I O N A L G R O W T H F U N D
P E R F O R M A N C E S U M M A R Y
Distributions (8/1/16–7/31/17)
| | | | |
| Share Class | | Net Investment
Income | |
A | | | $0.0572 | |
| R | | | $0.0110 | |
| R6 | | | $0.1279 | |
| Advisor | | | $0.0964 | |
Total Annual Operating Expenses5
| | | | | | |
| Share Class | | With Waiver | | | Without Waiver |
A | | | 1.25% | | | 1.46% |
Advisor | | | 1.00% | | | 1.21% |
Each class of shares is available to certain eligible investors and has different annual fees and expenses, as described in the prospectus.
All investments involve risks, including possible loss of principal. Special risks are associated with foreign investing, including currency fluctuations, economic instability and political developments. Investments in emerging markets involve heightened risks related to the same factors, in addition to those associated with these markets’ smaller size and lesser liquidity. The Fund is actively managed but there is no guarantee that the manager’s investment decisions will produce the desired results. The Fund’s prospectus also includes a description of the main investment risks.
1. The Fund has an expense reduction contractually guaranteed through 11/30/17. Fund investment results reflect the expense reduction; without this reduction, the results would have been lower.
2. Cumulative total return represents the change in value of an investment over the periods indicated.
3. Average annual total return represents the average annual change in value of an investment over the periods indicated. Return for less than one year, if any, has not been annualized.
4. Source: Morningstar. The MSCI EAFE Index is a free float-adjusted, market capitalization-weighted index designed to measure equity market performance in global developed markets excluding the U.S. and Canada. The Net Dividends Index reflects the deduction of withholding taxes on reinvested dividends.
5. Figures are as stated in the Fund’s current prospectus and may differ from the expense ratios disclosed in the Your Fund’s Expenses and Financial Highlights sections in this report. In periods of market volatility, assets may decline significantly, causing total annual Fund operating expenses to become higher than the figures shown.
See www.franklintempletondatasources.com for additional data provider information.
| | | | |
| 10 | | Annual Report | | franklintempleton.com |
F R A N K L I N I N T E R N A T I O N A L G R O W T H F U N D
Your Fund’s Expenses
As a Fund shareholder, you can incur two types of costs: (1) transaction costs, including sales charges (loads) on Fund purchases and redemptions; and (2) ongoing Fund costs, including management fees, distribution and service (12b-1) fees, and other Fund expenses. All mutual funds have ongoing costs, sometimes referred to as operating expenses. The table below shows ongoing costs of investing in the Fund and can help you understand these costs and compare them with those of other mutual funds. The table assumes a $1,000 investment held for the six months indicated.
Actual Fund Expenses
The table below provides information about actual account values and actual expenses in the columns under the heading “Actual.” In these columns the Fund’s actual return, which includes the effect of Fund expenses, is used to calculate the “Ending Account Value” for each class of shares. You can estimate the expenses you paid during the period by following these steps (of course, your account value and expenses will differ from those in this illustration): Divide your account value by $1,000 (if your account had an $8,600 value, then $8,600 ÷ $1,000 = 8.6). Then multiply the result by the number in the row for your class of shares under the headings “Actual” and “Expenses Paid During Period” (if Actual Expenses Paid During Period were $7.50, then 8.6 x $7.50 = $64.50). In this illustration, the actual expenses paid this period are $64.50.
Hypothetical Example for Comparison with Other Funds
Under the heading “Hypothetical” in the table, information is provided about hypothetical account values and hypothetical expenses based on the Fund’s actual expense ratio and an assumed rate of return of 5% per year before expenses, which is not the Fund’s actual return. This information may not be used to estimate the actual ending account balance or expenses you paid for the period, but it can help you compare ongoing costs of investing in the Fund with those of other funds. To do so, compare this 5% hypothetical example for the class of shares you hold with the 5% hypothetical examples that appear in the shareholder reports of other funds.
Please note that expenses shown in the table are meant to highlight ongoing costs and do not reflect any transactional costs. Therefore, information under the heading “Hypothetical” is useful in comparing ongoing costs only, and will not help you compare total costs of owning different funds. In addition, if transactional costs were included, your total costs would have been higher.
| | | | | | | | | | | | | | | | | | |
| | | | | | | Actual (actual return after expenses) | | | | Hypothetical (5% annual return before expenses) | | | | |
Share Class | | Beginning
Account
Value 2/1/17 | | | | Ending
Account
Value 7/31/17 | | Expenses Paid During
Period 2/1/17–7/31/171,2 | | | | Ending
Account
Value 7/31/17 | | Expenses Paid During
Period 2/1/17–7/31/171,2 | | | | Net
Annualized
Expense
Ratio2 |
| A | | $1,000 | | | | $1,186.30 | | $ 6.78 | | | | $1,018.60 | | $6.26 | | | | 1.25% |
| C | | $1,000 | | | | $1,181.90 | | $10.82 | | | | $1,014.88 | | $9.99 | | | | 2.00% |
| R | | $1,000 | | | | $1,185.60 | | $ 7.97 | | | | $1,017.50 | | $7.35 | | | | 1.47% |
| R6 | | $1,000 | | | | $1,188.30 | | $ 4.45 | | | | $1,020.73 | | $4.11 | | | | 0.82% |
| Advisor | | $1,000 | | | | $1,187.40 | | $ 5.42 | | | | $1,019.84 | | $5.01 | | | | 1.00% |
1. Expenses are equal to the annualized expense ratio for the six-month period as indicated above—in the far right column—multiplied by the simple average account value over the period indicated, and then multiplied by 181/365 to reflect the one-half year period.
2. Reflects expenses after fee waivers and expense reimbursements. Does not include acquired fund fees and expenses.
| | | | | | |
franklintempleton.com | | Annual Report | | | 11 | |
Franklin International Small Cap Growth Fund
We are pleased to bring you Franklin International Small Cap Growth Fund’s annual report for the fiscal year ended July 31, 2017. Effective June 3, 2013, the Fund closed to new investors, with limited exceptions.
Your Fund’s Goal and Main Investments
The Fund seeks long-term capital appreciation by investing at least 80% of its net assets in a diversified portfolio of marketable equity and equity-related securities of smaller international companies with market capitalizations not exceeding $5 billion (or the equivalent in local currencies), or the highest market capitalization of the MSCI Europe, Australasia and Far East (EAFE) Small Cap Index, whichever is greater, at the time of purchase. The Fund considers international companies to be those organized under the laws of a country outside of the U.S. or having a principal office in a country outside of the U.S., or whose securities are listed or traded principally on a recognized stock exchange or over-the-counter market outside of the U.S.
Performance Overview
For the 12 months ended July 31, 2017, the Fund’s Class A shares delivered a +28.31% cumulative total return. In comparison, the Fund’s new benchmark, the MSCI Europe, Australasia and Far East (EAFE) Small Cap (Net Dividends) Index, returned +20.27%, while the Fund’s old benchmark, the MSCI EAFE Small Cap Index, returned +20.73%.1 The MSCI EAFE Small Cap Index tracks small cap equity performance in global developed markets excluding the U.S. and Canada. The investment manager believes the Net Dividends Index is more in line with the Fund, taking into account the impact of foreign withholding taxes. You can find the Fund’s long-term performance data in the Performance Summary beginning on page 16.
Performance data represent past performance, which does not guarantee future results. Investment return and principal value will fluctuate, and you may have a gain or loss when you sell your shares. Current performance may differ from figures shown. For most recent month-end performance, go to franklintempleton.com or call (800) 342-5236.
Geographic Composition
Based on Total Net Assets as of 7/31/17
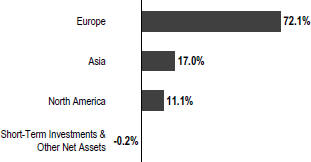
Investment Strategy
In choosing individual equity investments, we use a fundamental, bottom-up approach involving in-depth analysis of individual equity securities. We employ a quantitative and qualitative approach to identify smaller international companies that we believe have the potential to generate attractive returns with lower downside risk. Such companies tend to have proprietary products and services, which can sustain a longer term competitive advantage, and they tend to have a higher probability of maintaining a strong balance sheet and/or generating cash flow. After we identify a company, we conduct a thorough analysis to establish its earnings prospects and determine its value. Overall, we seek to invest in companies with attractive valuations.
We do not select investments for the Fund that are merely representative of the small cap asset class but instead aim to produce a portfolio of securities of exceptional companies operating in sectors that offer attractive growth potential.
Although we seek to outperform the MSCI EAFE Small Cap (Net Dividends) Index, the Fund may take positions that are not represented in the index.
Manager’s Discussion
During the 12 months under review, the Fund, before sales charges, outperformed its benchmark, the MSCI EAFE Small Cap (Net Dividends) Index, as stock selection drove relative performance. In particular, stock selection in the industrials, real estate, consumer discretionary and financials sectors
1. Source: Morningstar.
The indexes are unmanaged and include reinvestment of any income or distributions. They do not reflect any fees, expenses or sales charges. One cannot invest directly in an index, and an index is not representative of the Fund’s portfolio.
The dollar value, number of shares or principal amount, and names of all portfolio holdings are listed in the Fund’s Statement of Investments (SOI). The SOI begins on page 32.
| | | | |
12 | | Annual Report | | franklintempleton.com |
F R A N K L I N I N T E R N A T I O N A L S M A L L C A P G R O W T H F U N D
contributed significantly to relative returns.2 In contrast, stock selection in the energy sector detracted from relative returns.3
| | | | |
| Top 10 Sectors/Industries | | | |
| 7/31/17 | | | |
| |
| | | % of Total
Net Assets | |
| Equity Real Estate Investment Trusts (REITs) | | | 11.5% | |
| Insurance | | | 10.8% | |
| Commercial Services & Supplies | | | 6.9% | |
| Marine | | | 6.6% | |
| Leisure Products | | | 5.5% | |
| Professional Services | | | 5.4% | |
| Capital Markets | | | 5.3% | |
| Trading Companies & Distributors | | | 4.9% | |
| Diversified Financial Services | | | 4.7% | |
| Internet Software & Services | | | 4.5% | |
A number of U.K.-based industrials stocks contributed to relative performance over the period as global stocks generally recovered from the post-Brexit sell-off in June 2016. Notable contributors included construction company Morgan Sindall Group,4 engineered ceramics maker Vesuvius (serves the steel industry), shipping broker Clarkson,4 building materials merchant Grafton Group and global staffing firm PageGroup. Morgan Sindall’s earnings have been robust as it experienced growth across a number of its businesses, including construction and partnership housing. Shares of Vesuvius have improved due to investor optimism about better profits in the company’s foundry division in recent quarters. Grafton Group has benefited from construction and remodeling activity in both the U.K. and Ireland. Improving global growth and an uptick in hiring have helped PageGroup. Also in the sector, France-based laundry services company Elis contributed to relative performance as the company made a number of acquisitions to help boost its long-term growth potential.
In the real estate sector, Lar Espana Real Estate Socimi, a Spanish real estate investment trust (REIT), supported relative performance. The value of this commercial property investor’s holdings has been rising alongside a recovery in the broader Spanish economy.
In the consumer discretionary sector, France-based recreational boat and leisure home manufacturer Beneteau contributed to
| | | | |
| Top 10 Holdings | | | |
| 7/31/17 | | | |
| |
Company Sector/Industry, Country | | % of Total
Net Assets | |
Fairfax India Holdings Corp. Capital Markets, India | | | 5.3% | |
Grafton Group PLC Trading Companies & Distributors, U.K. | | | 5.0% | |
Kennedy Wilson Europe Real Estate PLC Diversified Financial Services, U.K. | | | 4.7% | |
58.com Inc. Internet Software & Services, China | | | 4.5% | |
Lar Espana Real Estate Socimi SA Equity Real Estate Investment Trusts (REITs), Spain | | | 4.5% | |
Clarkson PLC Marine, U.K. | | | 4.4% | |
PageGroup PLC Professional Services, U.K. | | | 4.2% | |
Green REIT PLC Equity Real Estate Investment Trusts (REITs), Ireland | | | 3.9% | |
Elis SA Commercial Services & Supplies, France | | | 3.7% | |
Scandinavian Tobacco Group AS Tobacco, Denmark | | | 3.5% | |
relative performance. The company reported strong demand for its boats, particularly in North America, during the first half of its fiscal-year 2017 and resilience in its home business. Beneteau is a market leader with what we view as a strong brand name and an excellent distribution network.
In the financials sector, Fairfax India Holdings, an investment company focused on India, boosted relative performance amid improving sentiment toward the country and increased valuations for a number of its portfolio holdings.4 ARA Asset Management, a Singapore-based real estate fund manager, was also a contributor after management took the company private.5
In contrast, energy sector holding Amec Foster Wheeler, a U.K.-based engineering and consultancy firm, detracted from relative returns as its shares rose slightly but lagged the sector. In addition to the pressure from falling oil prices and weak capital spending, Amec Foster Wheeler was hampered by an ongoing U.K. bribery investigation related to one of its legacy company’s dealings with a Monaco-based company. During the
2. The industrials sector comprises air freight and logistics, building products, commercial services and supplies, construction and engineering, machinery, marine, professional services, and trading companies and distributors in the SOI. The real estate sector comprises equity real estate investment trusts (REITs) and real estate management and development in the SOI. The consumer discretionary sector comprises distributors; hotels, restaurants and leisure; Internet and direct marketing retail; leisure products; media; and specialty retail in the SOI. The financials sector comprises capital markets, diversified financial services and insurance in the SOI.
3. The energy sector comprises energy equipment and services in the SOI.
4. Not part of the index.
5. No longer held by period-end.
| | | | | | |
| franklintempleton.com | | Annual Report | | | 13 | |
F R A N K L I N I N T E R N A T I O N A L S M A L L C A P G R O W T H F U N D
year, the company agreed to be acquired by U.K. rival John Wood Group (not a Fund holding).
Elsewhere, Canadian insurer Fairfax Financial Holdings hindered relative performance in the financials sector as the stock has been under pressure following a change in investment stance that worried some investors.4 However, the firm’s underlying fundamentals have been strong, in our analysis. Fairfax Financial has focused more on costs and loss ratios within its disparate underwriting activities, leading to improved profitability.
Swiss logistics firm Panalpina Welttransport Holding, Finnish plastic pipe manufacturer Uponor and U.K. outsourcing company Serco Group detracted from relative performance in the industrials sector. According to our analysis, Panalpina’s longstanding position as one of the world’s leading freight forwarders provides it with a sustainable competitive advantage, given the cost disadvantage that new entrants face in an industry based on volume discounts and the difficulty of building trade route knowledge and relationships from scratch. Serco’s stock, meanwhile, continued to struggle due to investor concerns about the slow pace of the company’s turnaround initiatives. The company has been eliminating loss-making contracts but has seen few new contract wins. We believe that as the bid pipeline continues to increase, Serco could begin to see faster growth over time.
U.K.-based property broker Countrywide detracted from relative performance in the real estate sector as housing transactions in the U.K. have remained weak in recent years and as it faces growing online competition. Ireland-based Green REIT also curbed relative performance, but we expect the stock to potentially benefit from an improving Irish real estate market.
Carpetright, a U.K.-based floor covering retailer, dampened relative performance in the consumer discretionary sector.4 The stock has struggled from weaker demand for rugs due to a softening consumer spending environment in the U.K. and increased competitive pressures.
Scandinavian Tobacco Group, a Denmark-based cigar manufacturer, detracted from relative performance in the consumer staples sector following a disappointing earnings report for 2017’s first quarter.6 The company attributed the implementation of a new technology system in the U.S. and
| | | | |
| Top 10 Countries | | | |
| 7/31/17 | | | |
| | | % of Total
Net Assets | |
| U.K. | | | 30.4% | |
| Ireland | | | 13.1% | |
| France | | | 8.8% | |
| U.S. | | | 8.2% | |
| Spain | | | 6.8% | |
| Denmark | | | 5.4% | |
| India | | | 5.3% | |
| China | | | 4.5% | |
| Japan | | | 3.8% | |
| Sweden | | | 3.3% | |
market issues in France for the weakness. We expect that over the longer term, the company should benefit from its ability to raise prices even as volumes decline. Swedish confectionary company Cloetta also hurt relative returns during the period.
Sector allocations slightly dragged on relative performance, with an overweighting in real estate and underweighting in information technology (IT)7 dampening relative performance. In contrast, overweightings in industrials and financials boosted relative returns. Regionally, emerging markets exposure and stock selection in the U.K. contributed to relative performance. Stock selection in continental Europe hindered relative performance.
Thank you for your continued participation in Franklin International Small Cap Growth Fund. We look forward to serving your future investment needs.
| | |

| |  Edwin Lugo, CFA Portfolio Manager |
6. The consumer staples sector comprises beverages, food and staples retailing, food products and tobacco in the SOI.
7. The IT sector comprises Internet software and services in the SOI.
See www.franklintempletondatasources.com for additional data provider information.
| | | | |
14 | | Annual Report | | franklintempleton.com |
F R A N K L I N I N T E R N A T I O N A L S M A L L C A P G R O W T H F U N D
The foregoing information reflects our analysis, opinions and portfolio holdings as of July 31, 2017, the end of the reporting period. The way we implement our main investment strategies and the resulting portfolio holdings may change depending on factors such as market and economic conditions. These opinions may not be relied upon as investment advice or an offer for a particular security. The information is not a complete analysis of every aspect of any market, country, industry, security or the Fund. Statements of fact are from sources considered reliable, but the investment manager makes no representation or warranty as to their completeness or accuracy. Although historical performance is no guarantee of future results, these insights may help you understand our investment management philosophy.
| | | | | | |
franklintempleton.com | | Annual Report | | | 15 | |
F R A N K L I N I N T E R N A T I O N A L S M A L L C A P G R O W T H F U N D
Performance Summary as of July 31, 2017
The performance table and graphs do not reflect any taxes that a shareholder would pay on Fund dividends, capital gain distributions, if any, or any realized gains on the sale of Fund shares. Total return reflects reinvestment of the Fund’s dividends and capital gain distributions, if any, and any unrealized gains or losses. Your dividend income will vary depending on dividends or interest paid by securities in the Fund’s portfolio, adjusted for operating expenses of each class. Capital gain distributions are net profits realized from the sale of portfolio securities.
Performance as of 7/31/17
Cumulative total return excludes sales charges. Average annual total return includes maximum sales charges. Sales charges will vary depending on the size of the investment and the class of share purchased. The maximum is 5.75% and the minimum is 0%. Class A: 5.75% maximum initial sales charge; Advisor Class: no sales charges. For other share classes, visit franklintempleton.com.
��
| | | | | | | | |
| Share Class | | Cumulative
Total Return1 | | | Average Annual
Total Return2 | |
| | |
| A | | | | | | | | |
| | |
1-Year | | | +28.31% | | | | +20.93% | |
5-Year | | | +91.88% | | | | +12.58% | |
Since Inception (5/15/08) | | | +101.76% | | | | +7.23% | |
| | |
| Advisor | | | | | | | | |
| | |
1-Year | | | +28.68% | | | | +28.68% | |
5-Year | | | +94.30% | | | | +14.21% | |
10-Year | | | +92.70% | | | | +6.78% | |
Performance data represent past performance, which does not guarantee future results. Investment return and principal value will fluctuate, and you may have a gain or loss when you sell your shares. Current performance may differ from figures shown. For most recent month-end performance, go to franklintempleton.com or call (800) 342-5236.
See page 18 for Performance Summary footnotes.
| | | | |
16 | | Annual Report | | franklintempleton.com |
F R A N K L I N I N T E R N A T I O N A L S M A L L C A P G R O W T H F U N D
P E R F O R M A N C E S U M M A R Y
Total Return Index Comparison for a Hypothetical $10,000 Investment
Total return represents the change in value of an investment over the periods shown. It includes any applicable maximum sales charge, Fund expenses, account fees and reinvested distributions. The unmanaged indexes include reinvestment of any income or distributions. They differ from the Fund in composition and do not pay management fees or expenses. One cannot invest directly in an index.
Class A (5/15/08–7/31/17)
Advisor Class (8/1/07–7/31/17)
See page 18 for Performance Summary footnotes.
| | | | | | |
franklintempleton.com | | Annual Report | | | 17 | |
F R A N K L I N I N T E R N A T I O N A L S M A L L C A P G R O W T H F U N D
P E R F O R M A N C E S U M M A R Y
Distributions (8/1/16–7/31/17)
| | | | | | | | | | | | | | | | |
| Share Class | | Net Investment
Income | | | Short-Term
Capital Gain | | | Long-Term
Capital Gain | | | Total | |
| | | | |
A | | | $0.1752 | | | | $0.9931 | | | | $0.3249 | | | | $1.4932 | |
C | | | $0.0219 | | | | $0.9931 | | | | $0.3249 | | | | $1.3399 | |
R | | | $0.1150 | | | | $0.9931 | | | | $0.3249 | | | | $1.4330 | |
R6 | | | $0.2628 | | | | $0.9931 | | | | $0.3249 | | | | $1.5808 | |
Advisor | | | $0.2172 | | | | $0.9931 | | | | $0.3249 | | | | $1.5352 | |
Total Annual Operating Expenses4 | | | | | | | | | |
| Share Class | | | | | | | | | | | | |
| | | | |
A | | | 1.38% | | | | | | | | | | | | | |
| | | | |
Advisor | | | 1.14% | | | | | | | | | | | | | |
Each class of shares is available to certain eligible investors and has different annual fees and expenses, as described in the prospectus.
All investments involve risks, including possible loss of principal. The Fund is intended for long-term investors who are comfortable with fluctuation in the value of their investment, especially over the short term. Smaller, relatively new and/or unseasoned companies can be particularly sensitive to changing economic conditions, and their prospects for growth are less certain than those of larger, more established companies. Foreign investing involves additional risks such as currency and market volatility, as well as political and social instability. Investments in emerging markets involve heightened risks relating to the same factors. The Fund is actively managed but there is no guarantee that the manager’s investment decisions will produce the desired results. The Fund’s prospectus also includes a description of the main investment risks.
1. Cumulative total return represents the change in value of an investment over the periods indicated.
2. Average annual total return represents the average annual change in value of an investment over the periods indicated. Return for less than one year, if any, has not been annualized.
3. Source: Morningstar. The MSCI EAFE Small Cap Index is a free float-adjusted, market capitalization-weighted index designed to measure the performance of small cap equity securities of global developed markets excluding the U.S. and Canada. The Net Dividends Index reflects the deduction of withholding taxes on reinvested dividends.
4. Figures are as stated in the Fund’s current prospectus and may differ from the expense ratios disclosed in the Your Fund’s Expenses and Financial Highlights sections in this report. In periods of market volatility, assets may decline significantly, causing total annual Fund operating expenses to become higher than the figures shown.
See www.franklintempletondatasource.com for additional data provider information.
| | | | |
18 | | Annual Report | | franklintempleton.com |
F R A N K L I N I N T E R N A T I O N A L S M A L L C A P G R O W T H F U N D
Your Fund’s Expenses
As a Fund shareholder, you can incur two types of costs: (1) transaction costs, including sales charges (loads) on Fund purchases and redemptions; and (2) ongoing Fund costs, including management fees, distribution and service (12b-1) fees, and other Fund expenses. All mutual funds have ongoing costs, sometimes referred to as operating expenses. The table below shows ongoing costs of investing in the Fund and can help you understand these costs and compare them with those of other mutual funds. The table assumes a $1,000 investment held for the six months indicated.
Actual Fund Expenses
The table below provides information about actual account values and actual expenses in the columns under the heading “Actual.” In these columns the Fund’s actual return, which includes the effect of Fund expenses, is used to calculate the “Ending Account Value” for each class of shares. You can estimate the expenses you paid during the period by following these steps (of course, your account value and expenses will differ from those in this illustration): Divide your account value by $1,000 (if your account had an $8,600 value, then $8,600 ÷ $1,000 = 8.6). Then multiply the result by the number in the row for your class of shares under the headings “Actual” and “Expenses Paid During Period” (if Actual Expenses Paid During Period were $7.50, then 8.6 x $7.50 = $64.50). In this illustration, the actual expenses paid this period are $64.50.
Hypothetical Example for Comparison with Other Funds
Under the heading “Hypothetical” in the table, information is provided about hypothetical account values and hypothetical expenses based on the Fund’s actual expense ratio and an assumed rate of return of 5% per year before expenses, which is not the Fund’s actual return. This information may not be used to estimate the actual ending account balance or expenses you paid for the period, but it can help you compare ongoing costs of investing in the Fund with those of other funds. To do so, compare this 5% hypothetical example for the class of shares you hold with the 5% hypothetical examples that appear in the shareholder reports of other funds.
Please note that expenses shown in the table are meant to highlight ongoing costs and do not reflect any transactional costs. Therefore, information under the heading “Hypothetical” is useful in comparing ongoing costs only, and will not help you compare total costs of owning different funds. In addition, if transactional costs were included, your total costs would have been higher.
| | | | | | | | | | | | | | | | | | |
| | | | | | | Actual
(actual return after expenses) | | | | Hypothetical
(5% annual return before expenses) | | | | |
Share Class | | Beginning
Account
Value 2/1/17 | | | | Ending
Account
Value 7/31/17 | | Expenses
Paid During
Period
2/1/17–7/31/171 | | | | Ending
Account
Value 7/31/17 | | Expenses
Paid During
Period
2/1/17–7/31/171 | | | | Annualized
Expense
Ratio |
| A | | $1,000 | | | | $1,208.80 | | $ 7.28 | | | | $1,018.20 | | $ 6.66 | | | | 1.33% |
| C | | $1,000 | | | | $1,204.70 | | $11.42 | | | | $1,014.43 | | $10.44 | | | | 2.09% |
| R | | $1,000 | | | | $1,207.50 | | $ 8.70 | | | | $1,016.91 | | $ 7.95 | | | | 1.59% |
| R6 | | $1,000 | | | | $1,210.90 | | $ 5.37 | | | | $1,019.93 | | $ 4.91 | | | | 0.98% |
| Advisor | | $1,000 | | | | $1,210.20 | | $ 5.97 | | | | $1,019.39 | | $ 5.46 | | | | 1.09% |
1. Expenses are equal to the annualized expense ratio for the six-month period as indicated above—in the far right column—multiplied by the simple average account value over the period indicated, and then multiplied by 181/365 to reflect the one-half year period.
| | | | | | |
franklintempleton.com | | Annual Report | | | 19 | |
F R A N K L I N G L O B A L T R U S T
Financial Highlights
Franklin International Growth Fund
| | | | | | | | | | | | | | | | | | | | |
| | | Year Ended July 31, | |
| | | 2017 | | | 2016 | | | 2015 | | | 2014 | | | 2013 | |
| | | | | |
| Class A | | | | | | | | | | | | | | | | | | | | |
| | | | | |
| Per share operating performance | | | | | | | | | | | | | | | | | | | | |
(for a share outstanding throughout the year) | | | | | | | | | | | | | | | | | | | | |
| | | | | |
Net asset value, beginning of year | | | $11.07 | | | | $11.16 | | | | $11.40 | | | | $10.45 | | | | $9.11 | |
| | | | |
| | | | | |
| Income from investment operationsa: | | | | | | | | | | | | | | | | | | | | |
| | | | | |
Net investment incomeb | | | 0.05 | | | | 0.03 | | | | 0.06 | | | | 0.05 | | | | 0.10 | |
| | | | | |
Net realized and unrealized gains (losses) | | | 2.12 | | | | (0.12 | ) | | | (0.20 | ) | | | 0.95 | | | | 1.33 | |
| | | | |
| | | | | |
Total from investment operations | | | 2.17 | | | | (0.09 | ) | | | (0.14 | ) | | | 1.00 | | | | 1.43 | |
| | | | |
| | | | | |
Less distributions from: | | | | | | | | | | | | | | | | | | | | |
| | | | | |
Net investment income | | | (0.06 | ) | | | (— | )c | | | (0.03 | ) | | | (0.05 | ) | | | (0.09 | ) |
| | | | | |
Net realized gains | | | — | | | | — | | | | (0.07 | ) | | | — | | | | — | |
| | | | |
| | | | | |
Total distributions | | | (0.06 | ) | | | (— | )c | | | (0.10 | ) | | | (0.05 | ) | | | (0.09 | ) |
| | | | |
| | | | | |
Net asset value, end of year | | | $13.18 | | | | $11.07 | | | | $11.16 | | | | $11.40 | | | | $10.45 | |
| | | | |
| | | | | |
Total returnd | | | 19.70% | | | | (0.80)% | | | | (1.13)% | | | | 9.56% | | | | 15.69% | |
| | | | | |
| Ratios to average net assets | | | | | | | | | | | | | | | | | | | | |
| | | | | |
Expenses before waiver and payments by affiliates | | | 1.54% | | | | 1.65% | | | | 1.72% | | | | 1.70% | | | | 1.52% | |
| | | | | |
Expenses net of waiver and payments by affiliates | | | 1.31% | e | | | 1.44% | e | | | 1.49% | | | | 1.49% | e | | | 1.49% | |
| | | | | |
Net investment income | | | 0.37% | | | | 0.25% | | | | 0.61% | | | | 0.48% | | | | 1.07% | |
| | | | | |
| Supplemental data | | | | | | | | | | | | | | | | | | | | |
| | | | | |
Net assets, end of year (000’s) | | | $185,680 | | | | $169,994 | | | | $182,825 | | | | $179,862 | | | | $34,466 | |
| | | | | |
Portfolio turnover rate | | | 28.66% | | | | 27.27% | | | | 47.52% | | | | 29.63% | | | | 26.06% | |
aThe amount shown for a share outstanding throughout the period may not correlate with the Statement of Operations for the period due to the timing of sales and repurchases of the Fund’s shares in relation to income earned and/or fluctuating fair value of the investments of the Fund.
bBased on average daily shares outstanding.
cAmount rounds to less than $0.01 per share.
dTotal return does not reflect sales commissions or contingent deferred sales charges, if applicable.
eBenefit of expense reduction rounds to less than 0.01%.
| | | | |
| 20 | | Annual Report | The accompanying notes are an integral part of these financial statements. | | franklintempleton.com |
F R A N K L I N G L O B A L T R U S T
F I N A N C I A L H I G H L I G H T S
Franklin International Growth Fund (continued)
| | | | | | | | | | | | | | | | | | | | |
| | | Year Ended July 31, | |
| | | 2017 | | | 2016 | | | 2015 | | | 2014 | | | 2013 | |
| | | | | |
| Class C | | | | | | | | | | | | | | | | | | | | |
| | | | | |
| Per share operating performance | | | | | | | | | | | | | | | | | | | | |
(for a share outstanding throughout the year) | | | | | | | | | | | | | | | | | | | | |
| | | | | |
Net asset value, beginning of year | | | $10.77 | | | | $10.94 | | | | $11.22 | | | | $10.31 | | | | $9.00 | |
| | | | |
| | | | | |
| Income from investment operationsa: | | | | | | | | | | | | | | | | | | | | |
| | | | | |
Net investment income (loss)b | | | (0.04 | ) | | | (0.05 | ) | | | (0.01 | ) | | | (0.02 | ) | | | 0.02 | |
| | | | | |
Net realized and unrealized gains (losses) | | | 2.07 | | | | (0.12 | ) | | | (0.20 | ) | | | 0.93 | | | | 1.32 | |
| | | | |
| | | | | |
Total from investment operations | | | 2.03 | | | | (0.17 | ) | | | (0.21 | ) | | | 0.91 | | | | 1.34 | |
| | | | |
| | | | | |
Less distributions from: | | | | | | | | | | | | | | | | | | | | |
| | | | | |
Net investment income | | | — | | | | — | | | | — | | | | — | | | | (0.03 | ) |
| | | | | |
Net realized gains | | | — | | | | — | | | | (0.07 | ) | | | — | | | | — | |
| | | | |
| | | | | |
Total distributions | | | — | | | | — | | | | (0.07 | ) | | | — | | | | (0.03 | ) |
| | | | |
| | | | | |
Net asset value, end of year | | | $12.80 | | | | $10.77 | | | | $10.94 | | | | $11.22 | | | | $10.31 | |
| | | | |
| | | | | |
Total returnc | | | 18.85% | | | | (1.55)% | | | | (1.84)% | | | | 8.83% | | | | 14.88% | |
| | | | | |
| Ratios to average net assets | | | | | | | | | | | | | | | | | | | | |
| | | | | |
Expenses before waiver and payments by affiliates | | | 2.29% | | | | 2.40% | | | | 2.42% | | | | 2.40% | | | | 2.22% | |
| | | | | |
Expenses net of waiver and payments by affiliates | | | 2.06%d | | | | 2.19%d | | | | 2.19% | | | | 2.19%d | | | | 2.19% | |
| | | | | |
Net investment income (loss) | | | (0.38)% | | | | (0.50)% | | | | (0.09)% | | | | (0.22)% | | | | 0.37% | |
| | | | | |
| Supplemental data | | | | | | | | | | | | | | | | | | | | |
| | | | | |
Net assets, end of year (000’s) | | | $8,702 | | | | $6,773 | | | | $7,179 | | | | $5,977 | | | | $4,032 | |
| | | | | |
Portfolio turnover rate | | | 28.66% | | | | 27.27% | | | | 47.52% | | | | 29.63% | | | | 26.06% | |
aThe amount shown for a share outstanding throughout the period may not correlate with the Statement of Operations for the period due to the timing of sales and repurchases of the Fund’s shares in relation to income earned and/or fluctuating fair value of the investments of the Fund.
bBased on average daily shares outstanding.
cTotal return does not reflect sales commissions or contingent deferred sales charges, if applicable.
dBenefit of expense reduction rounds to less than 0.01%.
| | | | | | |
| franklintempleton.com | | The accompanying notes are an integral part of these financial statements. | Annual Report | | | 21 | |
F R A N K L I N G L O B A L T R U S T
F I N A N C I A L H I G H L I G H T S
Franklin International Growth Fund (continued)
| | | | | | | | | | | | | | | | | | | | |
| | | Year Ended July 31, | |
| | | 2017 | | | 2016 | | | 2015 | | | 2014 | | | 2013 | |
| | | | | |
| Class R | | | | | | | | | | | | | | | | | | | | |
| | | | | |
| Per share operating performance | | | | | | | | | | | | | | | | | | | | |
(for a share outstanding throughout the year) | | | | | | | | | | | | | | | | | | | | |
| | | | | |
Net asset value, beginning of year | | | $11.02 | | | | $11.15 | | | | $11.38 | | | | $10.41 | | | | $9.08 | |
| | | | |
| | | | | |
| Income from investment operationsa: | | | | | | | | | | | | | | | | | | | | |
| | | | | |
Net investment incomeb | | | 0.02 | | | | (— | )c | | | 0.04 | | | | 0.03 | | | | 0.07 | |
| | | | | |
Net realized and unrealized gains (losses) | | | 2.13 | | | | (0.12 | ) | | | (0.19 | ) | | | 0.95 | | | | 1.33 | |
| | | | |
| | | | | |
Total from investment operations | | | 2.15 | | | | (0.12 | ) | | | (0.15 | ) | | | 0.98 | | | | 1.40 | |
| | | | |
| | | | | |
Less distributions from: | | | | | | | | | | | | | | | | | | | | |
| | | | | |
Net investment income | | | (0.01 | ) | | | (0.01 | ) | | | (0.01 | ) | | | (0.01 | ) | | | (0.07 | ) |
| | | | | |
Net realized gains | | | — | | | | — | | | | (0.07 | ) | | | — | | | | — | |
| | | | |
| | | | | |
Total distributions | | | (0.01 | ) | | | (0.01 | ) | | | (0.08 | ) | | | (0.01 | ) | | | (0.07 | ) |
| | | | |
| | | | | |
Net asset value, end of year | | | $13.16 | | | | $11.02 | | | | $11.15 | | | | $11.38 | | | | $10.41 | |
| | | | |
| | | | | |
Total return | | | 19.54% | | | | (1.10)% | | | | (1.31)% | | | | 9.44% | | | | 15.47% | |
| | | | | |
| Ratios to average net assets | | | | | | | | | | | | | | | | | | | | |
| | | | | |
Expenses before waiver and payments by affiliates | | | 1.76% | | | | 1.90% | | | | 1.92% | | | | 1.90% | | | | 1.72% | |
| | | | | |
Expenses net of waiver and payments by affiliates | | | 1.53%d | | | | 1.69%d | | | | 1.69% | | | | 1.69%d | | | | 1.69% | |
| | | | | |
Net investment income | | | 0.15% | | | | (—)%e | | | | 0.41% | | | | 0.28% | | | | 0.87% | |
| | | | | |
| Supplemental data | | | | | | | | | | | | | | | | | | | | |
| | | | | |
Net assets, end of year (000’s) | | | $371 | | | | $295 | | | | $363 | | | | $222 | | | | $274 | |
| | | | | |
Portfolio turnover rate | | | 28.66% | | | | 27.27% | | | | 47.52% | | | | 29.63% | | | | 26.06% | |
aThe amount shown for a share outstanding throughout the period may not correlate with the Statement of Operations for the period due to the timing of sales and repurchases of the Fund’s shares in relation to income earned and/or fluctuating fair value of the investments of the Fund.
bBased on average daily shares outstanding.
cAmount rounds to less than $0.01 per share.
dBenefit of expense reduction rounds to less than 0.01%.
eRounds to less than 0.01%.
| | | | |
| 22 | | Annual Report | The accompanying notes are an integral part of these financial statements. | | franklintempleton.com |
F R A N K L I N G L O B A L T R U S T
F I N A N C I A L H I G H L I G H T S
Franklin International Growth Fund (continued)
| | | | | | | | | | | | | | | | | | | | |
| | | Year Ended July 31, | |
| | | 2017 | | | 2016 | | | 2015 | | | 2014 | | | 2013a | |
| | | | | |
| Class R6 | | | | | | | | | | | | | | | | | | | | |
| | | | | |
| Per share operating performance | | | | | | | | | | | | | | | | | | | | |
(for a share outstanding throughout the year) | | | | | | | | | | | | | | | | | | | | |
| | | | | |
Net asset value, beginning of year | | | $11.15 | | | | $11.25 | | | | $11.48 | | | | $10.48 | | | | $10.56 | |
| | | | |
| | | | | |
| Income from investment operationsb: | | | | | | | | | | | | | | | | | | | | |
| | | | | |
Net investment incomec | | | 0.08 | | | | 0.07 | | | | 0.15 | | | | 0.11 | | | | 0.07 | |
| | | | | |
Net realized and unrealized gains (losses) | | | 2.15 | | | | (0.12 | ) | | | (0.23 | ) | | | 0.94 | | | | (0.15 | ) |
| | | | |
| | | | | |
Total from investment operations | | | 2.23 | | | | (0.05 | ) | | | (0.08 | ) | | | 1.05 | | | | (0.08 | ) |
| | | | |
| | | | | |
Less distributions from: | | | | | | | | | | | | | | | | | | | | |
| | | | | |
Net investment income | | | (0.13 | ) | | | (0.05 | ) | | | (0.08 | ) | | | (0.05 | ) | | | — | |
| | | | | |
Net realized gains | | | — | | | | — | | | | (0.07 | ) | | | — | | | | — | |
| | | | |
| | | | | |
Total distributions | | | (0.13 | ) | | | (0.05 | ) | | | (0.15 | ) | | | (0.05 | ) | | | — | |
| | | | |
| | | | | |
Net asset value, end of year | | | $13.25 | | | | $11.15 | | | | $11.25 | | | | $11.48 | | | | $10.48 | |
| | | | |
| | | | | |
Total returnd | | | 20.26% | | | | (0.39)% | | | | (0.62)% | | | | 10.05% | | | | (0.76)% | |
| | | | | |
| Ratios to average net assetse | | | | | | | | | | | | | | | | | | | | |
| | | | | |
Expenses before waiver and payments by affiliates | | | 0.90% | | | | 1.01% | | | | 1.02% | | | | 1.02% | | | | 1.13% | |
| | | | | |
Expenses net of waiver and payments by affiliates | | | 0.88% | f | | | 1.00% | f | | | 1.02% | g | | | 1.02% | f,g | | | 1.10% | |
| | | | | |
Net investment income | | | 0.80% | | | | 0.69% | | | | 1.08% | | | | 0.95% | | | | 1.45% | |
| | | | | |
| Supplemental data | | | | | | | | | | | | | | | | | | | | |
| | | | | |
Net assets, end of year (000’s) | | | $54,347 | | | | $122,862 | | | | $137,950 | | | | $29,132 | | | | $22,296 | |
| | | | | |
Portfolio turnover rate | | | 28.66% | | | | 27.27% | | | | 47.52% | | | | 29.63% | | | | 26.06% | |
aFor the period May 1, 2013 (effective date) to July 31, 2013.
bThe amount shown for a share outstanding throughout the period may not correlate with the Statement of Operations for the period due to the timing of sales and repurchases of the Fund’s shares in relation to income earned and/or fluctuating fair value of the investments of the Fund.
cBased on average daily shares outstanding.
dTotal return is not annualized for periods less than one year.
eRatios are annualized for periods less than one year.
fBenefit of expense reduction rounds to less than 0.01%.
gBenefit of waiver and payments by affiliates rounds to less than 0.01%.
| | | | | | |
| franklintempleton.com | | The accompanying notes are an integral part of these financial statements. | Annual Report | | | 23 | |
F R A N K L I N G L O B A L T R U S T
F I N A N C I A L H I G H L I G H T S
Franklin International Growth Fund (continued)
| | | | | | | | | | | | | | | | | | | | |
| | | Year Ended July 31, | |
| | | 2017 | | | 2016 | | | 2015 | | | 2014 | | | 2013 | |
| | | | | |
| Advisor Class | | | | | | | | | | | | | | | | | | | | |
| | | | | |
| Per share operating performance | | | | | | | | | | | | | | | | | | | | |
(for a share outstanding throughout the year) | | | | | | | | | | | | | | | | | | | | |
| | | | | |
Net asset value, beginning of year | | | $11.13 | | | | $11.24 | | | | $11.47 | | | | $10.48 | | | | $9.13 | |
| | | | |
| | | | | |
| Income from investment operationsa: | | | | | | | | | | | | | | | | | | | | |
| | | | | |
Net investment incomeb | | | 0.08 | | | | 0.05 | | | | 0.10 | | | | 0.09 | | | | 0.13 | |
| | | | | |
Net realized and unrealized gains (losses) | | | 2.13 | | | | (0.12 | ) | | | (0.20 | ) | | | 0.95 | | | | 1.33 | |
| | | | |
| | | | | |
Total from investment operations | | | 2.21 | | | | (0.07 | ) | | | (0.10 | ) | | | 1.04 | | | | 1.46 | |
| | | | |
| | | | | |
Less distributions from: | | | | | | | | | | | | | | | | | | | | |
| | | | | |
Net investment income | | | (0.10 | ) | | | (0.04 | ) | | | (0.06 | ) | | | (0.05 | ) | | | (0.11 | ) |
| | | | | |
Net realized gains | | | — | | | | — | | | | (0.07 | ) | | | — | | | | — | |
| | | | |
| | | | | |
Total distributions | | | (0.10 | ) | | | (0.04 | ) | | | (0.13 | ) | | | (0.05 | ) | | | (0.11 | ) |
| | | | |
| | | | | |
Net asset value, end of year | | | $13.24 | | | | $11.13 | | | | $11.24 | | | | $11.47 | | | | $10.48 | |
| | | | |
| | | | | |
Total return | | | 20.04% | | | | (0.62)% | | | | (0.76)% | | | | 9.91% | | | | 16.04% | |
| | | | | |
| Ratios to average net assets | | | | | | | | | | | | | | | | | | | | |
| | | | | |
Expenses before waiver and payments by affiliates | | | 1.29% | | | | 1.40% | | | | 1.42% | | | | 1.40% | | | | 1.22% | |
| | | | | |
Expenses net of waiver and payments by affiliates | | | 1.06% | c | | | 1.19% | c | | | 1.19% | | | | 1.19% | c | | | 1.19% | |
| | | | | |
Net investment income | | | 0.62% | | | | 0.50% | | | | 0.91% | | | | 0.78% | | | | 1.37% | |
| | | | | |
| Supplemental data | | | | | | | | | | | | | | | | | | | | |
| | | | | |
Net assets, end of year (000’s) | | | $147,926 | | | | $110,441 | | | | $126,130 | | | | $97,134 | | | | $74,240 | |
| | | | | |
Portfolio turnover rate | | | 28.66% | | | | 27.27% | | | | 47.52% | | | | 29.63% | | | | 26.06% | |
aThe amount shown for a share outstanding throughout the period may not correlate with the Statement of Operations for the period due to the timing of sales and repurchases of the Fund’s shares in relation to income earned and/or fluctuating fair value of the investments of the Fund.
bBased on average daily shares outstanding.
cBenefit of expense reduction rounds to less than 0.01%.
| | | | |
| 24 | | Annual Report | The accompanying notes are an integral part of these financial statements. | | franklintempleton.com |
F R A N K L I N G L O B A L T R U S T
Statement of Investments, July 31, 2017
Franklin International Growth Fund
| | | | | | | | | | | | |
| | | Country | | | Shares | | | Value | |
| | | | | | | | | | | | |
Common Stocks 97.1% | | | | | | | | | | | | |
Aerospace & Defense 2.8% | | | | | | | | | | | | |
MTU Aero Engines AG | | | Germany | | | | 75,000 | | | $ | 10,999,788 | |
| | | | | | | | | | | | |
Auto Components 2.7% | | | | | | | | | | | | |
Delphi Automotive PLC | | | United States | | | | 120,000 | | | | 10,850,400 | |
| | | | | | | | | | | | |
Banks 3.4% | | | | | | | | | | | | |
a Irish Bank Resolution Corp. Ltd. | | | Ireland | | | | 11,500 | | | | — | |
KBC Groep NV | | | Belgium | | | | 165,000 | | | | 13,666,538 | |
| | | | | | | | | | | | |
| | | |
| | | | | | | | | | | 13,666,538 | |
| | | | | | | | | | | | |
Biotechnology 4.5% | | | | | | | | | | | | |
a Alkermes PLC | | | United States | | | | 178,000 | | | | 9,684,980 | |
CSL Ltd. | | | Australia | | | | 82,000 | | | | 8,262,501 | |
| | | | | | | | | | | | |
| | | |
| | | | | | | | | | | 17,947,481 | |
| | | | | | | | | | | | |
Capital Markets 7.7% | | | | | | | | | | | | |
Azimut Holding SpA | | | Italy | | | | 550,000 | | | | 12,325,916 | |
CI Financial Corp. | | | Canada | | | | 460,000 | | | | 10,018,925 | |
Deutsche Boerse AG | | | Germany | | | | 78,000 | | | | 8,159,669 | |
| | | | | | | | | | | | |
| | | |
| | | | | | | | | | | 30,504,510 | |
| | | | | | | | | | | | |
Chemicals 8.5% | | | | | | | | | | | | |
Koninklijke DSM NV | | | Netherlands | | | | 132,000 | | | | 9,743,070 | |
Symrise AG | | | Germany | | | | 150,000 | | | | 10,512,585 | |
Umicore SA | | | Belgium | | | | 170,000 | | | | 13,654,233 | |
| | | | | | | | | | | | |
| | | |
| | | | | | | | | | | 33,909,888 | |
| | | | | | | | | | | | |
Diversified Consumer Services 3.5% | | | | | | | | | | | | |
TAL Education Group, ADR | | | China | | | | 90,000 | | | | 14,109,300 | |
| | | | | | | | | | | | |
Energy Equipment & Services 2.4% | | | | | | | | | | | | |
Amec Foster Wheeler PLC | | | United Kingdom | | | | 1,600,000 | | | | 9,368,795 | |
| | | | | | | | | | | | |
Health Care Equipment & Supplies 4.5% | | | | | | | | | | | | |
Cochlear Ltd. | | | Australia | | | | 78,000 | | | | 8,910,498 | |
GN Store Nord A/S | | | Denmark | | | | 300,000 | | | | 9,125,838 | |
| | | | | | | | | | | | |
| | | |
| | | | | | | | | | | 18,036,336 | |
| | | | | | | | | | | | |
Household Products 2.2% | | | | | | | | | | | | |
Reckitt Benckiser Group PLC | | | United Kingdom | | | | 88,000 | | | | 8,555,939 | |
| | | | | | | | | | | | |
Internet & Direct Marketing Retail 5.6% | | | | | | | | | | | | |
Start Today Co. Ltd. | | | Japan | | | | 320,000 | | | | 9,037,991 | |
a Vipshop Holdings Ltd., ADR | | | China | | | | 1,080,000 | | | | 13,284,000 | |
| | | | | | | | | | | | |
| | | |
| | | | | | | | | | | 22,321,991 | |
| | | | | | | | | | | | |
Internet Software & Services 5.5% | | | | | | | | | | | | |
a Just Eat PLC | | | United Kingdom | | | | 1,380,000 | | | | 11,297,890 | |
MercadoLibre Inc. | | | Argentina | | | | 37,000 | | | | 10,671,540 | |
| | | | | | | | | | | | |
| | | |
| | | | | | | | | | | 21,969,430 | |
| | | | | | | | | | | | |
IT Services 2.7% | | | | | | | | | | | | |
Worldpay Group PLC | | | United Kingdom | | | | 2,202,000 | | | | 10,749,679 | |
| | | | | | | | | | | | |
Machinery 5.3% | | | | | | | | | | | | |
GEA Group AG | | | Germany | | | | 250,000 | | | | 10,159,681 | |
Weir Group PLC | | | United Kingdom | | | | 450,000 | | | | 10,889,007 | |
| | | | | | | | | | | | |
| | | |
| | | | | | | | | | | 21,048,688 | |
| | | | | | | | | | | | |
| | | | | | |
franklintempleton.com | | Annual Report | | | 25 | |
F R A N K L I N G L O B A L T R U S T
S T A T E M E N T O F I N V E S T M E N T S
Franklin International Growth Fund (continued)
| | | | | | | | | | | | |
| | | Country | | | Shares | | | Value | |
Common Stocks (continued) | | | | | | | | | | | | |
Media 2.6% | | | | | | | | | | | | |
Ascential PLC | | | United Kingdom | | | | 1,500,000 | | | $ | 7,104,969 | |
ITV PLC | | | United Kingdom | | | | 1,400,000 | | | | 3,195,586 | |
| | | | | | | | | | | | |
| | | |
| | | | | | | | | | | 10,300,555 | |
| | | | | | | | | | | | |
Multiline Retail 2.6% | | | | | | | | | | | | |
Dollarama Inc. | | | Canada | | | | 106,000 | | | | 10,359,439 | |
| | | | | | | | | | | | |
Pharmaceuticals 7.8% | | | | | | | | | | | | |
Hikma Pharmaceuticals PLC | | | United Kingdom | | | | 630,000 | | | | 11,736,854 | |
Roche Holding AG | | | Switzerland | | | | 39,000 | | | | 9,868,368 | |
Santen Pharmaceutical Co. Ltd. | | | Japan | | | | 660,000 | | | | 9,317,436 | |
| | | | | | | | | | | | |
| | | |
| | | | | | | | | | | 30,922,658 | |
| | | | | | | | | | | | |
Professional Services 2.8% | | | | | | | | | | | | |
Experian PLC | | | United Kingdom | | | | 550,000 | | | | 10,935,846 | |
| | | | | | | | | | | | |
Road & Rail 3.6% | | | | | | | | | | | | |
DSV AS | | | Denmark | | | | 220,000 | | | | 14,196,597 | |
| | | | | | | | | | | | |
Software 11.4% | | | | | | | | | | | | |
a Line Corp. | | | Japan | | | | 310,000 | | | | 11,510,110 | |
The Sage Group PLC | | | United Kingdom | | | | 1,250,000 | | | | 11,115,944 | |
SAP SE | | | Germany | | | | 98,000 | | | | 10,399,159 | |
Sophos Group PLC | | | United Kingdom | | | | 2,030,000 | | | | 12,092,894 | |
| | | | | | | | | | | | |
| | | |
| | | | | | | | | | | 45,118,107 | |
| | | | | | | | | | | | |
Textiles, Apparel & Luxury Goods 2.3% | | | | | | | | | | | | |
Luxottica Group SpA | | | Italy | | | | 155,000 | | | | 8,962,942 | |
| | | | | | | | | | | | |
Trading Companies & Distributors 2.7% | | | | | | | | | | | | |
Ferguson PLC | | | United Kingdom | | | | 180,000 | | | | 10,751,262 | |
| | | | | | | | | | | | |
| | | |
Total Common Stocks (Cost $291,218,112) | | | | | | | | | | | 385,586,169 | |
| | | | | | | | | | | | |
| | | |
Short Term Investments (Cost $12,826,423) 3.2% | | | | | | | | | | | | |
Money Market Funds 3.2% | | | | | | | | | | | | |
b,c Institutional Fiduciary Trust Money Market Portfolio, 0.63% | | | United States | | | | 12,826,423 | | | | 12,826,423 | |
| | | | | | | | | | | | |
| | | |
Total Investments (Cost $304,044,535) 100.3% | | | | | | | | | | | 398,412,592 | |
Other Assets, less Liabilities (0.3)% | | | | | | | | | | | (1,387,328 | ) |
| | | | | | | | | | | | |
| | | |
Net Assets 100.0% | | | | | | | | | | $ | 397,025,264 | |
| | | | | | | | | | | | |
See Abbreviations on page 49.
aNon-income producing.
bSee Note 3(f) regarding investments in affiliated management investment companies.
cThe rate shown is the annualized seven-day yield at period end.
| | | | |
26 | | Annual Report | The accompanying notes are an integral part of these financial statements. | | franklintempleton.com |
F R A N K L I N G L O B A L T R U S T
Financial Highlights
Franklin International Small Cap Growth Fund
| | | | | | | | | | | | | | | | | | | | |
| | | Year Ended July 31, | |
| | | 2017 | | | 2016 | | | 2015 | | | 2014 | | | 2013 | |
| Class A | | | | | | | | | | | | | | | | | | | | |
| | | | | |
| Per share operating performance | | | | | | | | | | | | | | | | | | | | |
(for a share outstanding throughout the year) | | | | | | | | | | | | | | | | | | | | |
| | | | | |
Net asset value, beginning of year | | | $17.55 | | | | $19.92 | | | | $22.23 | | | | $19.70 | | | | $14.38 | |
| | | | |
| | | | | |
| Income from investment operationsa: | | | | | | | | | | | | | | | | | | | | |
| | | | | |
Net investment incomeb | | | 0.19 | | | | 0.22 | | | | 0.19 | | | | 0.19 | | | | 0.18 | |
| | | | | |
Net realized and unrealized gains (losses) | | | 4.37 | | | | (1.98 | ) | | | (0.48 | ) | | | 2.65 | | | | 5.94 | |
| | | | |
| | | | | |
Total from investment operations | | | 4.56 | | | | (1.76 | ) | | | (0.29 | ) | | | 2.84 | | | | 6.12 | |
| | | | |
| | | | | |
Less distributions from: | | | | | | | | | | | | | | | | | | | | |
| | | | | |
Net investment income | | | (0.18 | ) | | | (0.24 | ) | | | (0.29 | ) | | | (0.11 | ) | | | (0.19 | ) |
| | | | | |
Net realized gains | | | (1.32 | ) | | | (0.37 | ) | | | (1.73 | ) | | | (0.20 | ) | | | (0.61 | ) |
| | | | |
| | | | | |
Total distributions | | | (1.50 | ) | | | (0.61 | ) | | | (2.02 | ) | | | (0.31 | ) | | | (0.80 | ) |
| | | | |
| | | | | |
Net asset value, end of year | | | $20.61 | | | | $17.55 | | | | $19.92 | | | | $22.23 | | | | $19.70 | |
| | | | |
| | | | | |
Total returnc | | | 28.31% | | | | (8.93)% | | | | (0.17)% | | | | 14.48% | | | | 43.69% | |
| | | | | |
| Ratios to average net assets | | | | | | | | | | | | | | | | | | | | |
| | | | | |
Expenses before waiver and payments by affiliates | | | 1.38% | | | | 1.38% | | | | 1.36% | | | | 1.36% | | | | 1.46% | |
| | | | | |
Expenses net of waiver and payments by affiliatesd | | | 1.38% | | | | 1.38% | | | | 1.36% | | | | 1.36% | | | | 1.40% | |
| | | | | |
Net investment income | | | 1.05% | | | | 1.14% | | | | 0.98% | | | | 0.89% | | | | 1.03% | |
| | | | | |
| Supplemental data | | | | | | | | | | | | | | | | | | | | |
| | | | | |
Net assets, end of year (000’s) | | | $161,355 | | | | $169,943 | | | | $212,890 | | | | $257,568 | | | | $232,712 | |
| | | | | |
Portfolio turnover rate | | | 21.71% | | | | 21.93% | | | | 24.20% | | | | 16.08% | | | | 22.81% | |
aThe amount shown for a share outstanding throughout the period may not correlate with the Statement of Operations for the period due to the timing of sales and repurchases of the Fund’s shares in relation to income earned and/or fluctuating fair value of the investments of the Fund.
bBased on average daily shares outstanding.
cTotal return does not reflect sales commissions or contingent deferred sales charges, if applicable.
dBenefit of expense reduction rounds to less than 0.01%.
| | | | | | |
franklintempleton.com | | The accompanying notes are an integral part of these financial statements. | Annual Report | | | 27 | |
F R A N K L I N G L O B A L T R U S T
F I N A N C I A L H I G H L I G H T S
Franklin International Small Cap Growth Fund (continued)
| | | | | | | | | | | | | | | | | | | | |
| | | Year Ended July 31, | |
| | | 2017 | | | 2016 | | | 2015 | | | 2014 | | | 2013 | |
| Class C | | | | | | | | | | | | | | | | | | | | |
| | | | | |
| Per share operating performance | | | | | | | | | | | | | | | | | | | | |
(for a share outstanding throughout the year) | | | | | | | | | | | | | | | | | | | | |
| | | | | |
Net asset value, beginning of year | | | $17.32 | | | | $19.60 | | | | $21.94 | | | | $19.51 | | | | $14.25 | |
| | | | |
| | | | | |
| Income from investment operationsa: | | | | | | | | | | | | | | | | | | | | |
| | | | | |
Net investment incomeb | | | 0.05 | | | | 0.07 | | | | 0.05 | | | | 0.02 | | | | 0.05 | |
| | | | | |
Net realized and unrealized gains (losses) | | | 4.33 | | | | (1.95 | ) | | | (0.47 | ) | | | 2.63 | | | | 5.90 | |
| | | | |
| | | | | |
Total from investment operations | | | 4.38 | | | | (1.88 | ) | | | (0.42 | ) | | | 2.65 | | | | 5.95 | |
| | | | |
| | | | | |
Less distributions from: | | | | | | | | | | | | | | | | | | | | |
| | | | | |
Net investment income | | | (0.02 | ) | | | (0.03 | ) | | | (0.19 | ) | | | (0.02 | ) | | | (0.08 | ) |
| | | | | |
Net realized gains | | | (1.32 | ) | | | (0.37 | ) | | | (1.73 | ) | | | (0.20 | ) | | | (0.61 | ) |
| | | | |
| | | | | |
Total distributions | | | (1.34 | ) | | | (0.40 | ) | | | (1.92 | ) | | | (0.22 | ) | | | (0.69 | ) |
| | | | |
| | | | | |
Net asset value, end of year | | | $20.36 | | | | $17.32 | | | | $19.60 | | | | $21.94 | | | | $19.51 | |
| | | | |
| | | | | |
Total returnc | | | 27.39% | | | | (9.66)% | | | | (0.86)% | | | | 13.59% | | | | 42.74% | |
| | | | | |
| Ratios to average net assets | | | | | | | | | | | | | | | | | | | | |
| | | | | |
Expenses before waiver and payments by affiliates | | | 2.13% | | | | 2.15% | | | | 2.08% | | | | 2.11% | | | | 2.16% | |
| | | | | |
Expenses net of waiver and payments by affiliatesd | | | 2.13% | | | | 2.15% | | | | 2.08% | | | | 2.11% | | | | 2.10% | |
| | | | | |
Net investment income | | | 0.30% | | | | 0.37% | | | | 0.26% | | | | 0.14% | | | | 0.33% | |
| | | | | |
| Supplemental data | | | | | | | | | | | | | | | | | | | | |
| | | | | |
Net assets, end of year (000’s) | | | $22,191 | | | | $22,699 | | | | $30,067 | | | | $35,484 | | | | $29,786 | |
| | | | | |
Portfolio turnover rate | | | 21.71% | | | | 21.93% | | | | 24.20% | | | | 16.08% | | | | 22.81% | |
aThe amount shown for a share outstanding throughout the period may not correlate with the Statement of Operations for the period due to the timing of sales and repurchases of the Fund’s shares in relation to income earned and/or fluctuating fair value of the investments of the Fund.
bBased on average daily shares outstanding.
cTotal return does not reflect sales commissions or contingent deferred sales charges, if applicable.
dBenefit of expense reduction rounds to less than 0.01%.
| | | | |
28 | | Annual Report | The accompanying notes are an integral part of these financial statements. | | franklintempleton.com |
F R A N K L I N G L O B A L T R U S T
F I N A N C I A L H I G H L I G H T S
Franklin International Small Cap Growth Fund (continued)
| | | | | | | | | | | | | | | | | | | | |
| | | Year Ended July 31, | |
| | | 2017 | | | 2016 | | | 2015 | | | 2014 | | | 2013 | |
| Class R | | | | | | | | | | | | | | | | | | | | |
| | | | | |
| Per share operating performance | | | | | | | | | | | | | | | | | | | | |
(for a share outstanding throughout the year) | | | | | | | | | | | | | | | | | | | | |
| | | | | |
Net asset value, beginning of year | | | $17.56 | | | | $19.88 | | | | $22.19 | | | | $19.65 | | | | $14.35 | |
| | | | |
| | | | | |
| Income from investment operationsa: | | | | | | | | | | | | | | | | | | | | |
| | | | | |
Net investment incomeb | | | 0.13 | | | | 0.17 | | | | 0.15 | | | | 0.12 | | | | 0.13 | |
| | | | | |
Net realized and unrealized gains (losses) | | | 4.41 | | | | (1.98 | ) | | | (0.48 | ) | | | 2.66 | | | | 5.94 | |
| | | | |
| | | | | |
Total from investment operations | | | 4.54 | | | | (1.81 | ) | | | (0.33 | ) | | | 2.78 | | | | 6.07 | |
| | | | |
| | | | | |
Less distributions from: | | | | | | | | | | | | | | | | | | | | |
| | | | | |
Net investment income | | | (0.12 | ) | | | (0.14 | ) | | | (0.25 | ) | | | (0.04 | ) | | | (0.16 | ) |
| | | | | |
Net realized gains | | | (1.32 | ) | | | (0.37 | ) | | | (1.73 | ) | | | (0.20 | ) | | | (0.61 | ) |
| | | | |
| | | | | |
Total distributions | | | (1.44 | ) | | | (0.51 | ) | | | (1.98 | ) | | | (0.24 | ) | | | (0.77 | ) |
| | | | |
| | | | | |
Net asset value, end of year | | | $20.66 | | | | $17.56 | | | | $19.88 | | | | $22.19 | | | | $19.65 | |
| | | | |
| | | | | |
Total return | | | 28.07% | | | | (9.20)% | | | | (0.41)% | | | | 14.17% | | | | 43.40% | |
| | | | | |
| Ratios to average net assets | | | | | | | | | | | | | | | | | | | | |
| | | | | |
Expenses before waiver and payments by affiliates | | | 1.64% | | | | 1.64% | | | | 1.62% | | | | 1.62% | | | | 1.66% | |
| | | | | |
Expenses net of waiver and payments by affiliatesc | | | 1.64% | | | | 1.64% | | | | 1.62% | | | | 1.62% | | | | 1.60% | |
| | | | | |
Net investment income | | | 0.79% | | | | 0.88% | | | | 0.72% | | | | 0.63% | | | | 0.83% | |
| | | | | |
| Supplemental data | | | | | | | | | | | | | | | | | | | | |
| | | | | |
Net assets, end of year (000’s) | | | $3,592 | | | | $4,735 | | | | $6,193 | | | | $9,320 | | | | $120,877 | |
| | | | | |
Portfolio turnover rate | | | 21.71% | | | | 21.93% | | | | 24.20% | | | | 16.08% | | | | 22.81% | |
aThe amount shown for a share outstanding throughout the period may not correlate with the Statement of Operations for the period due to the timing of sales and repurchases of the Fund’s shares in relation to income earned and/or fluctuating fair value of the investments of the Fund.
bBased on average daily shares outstanding.
cBenefit of expense reduction rounds to less than 0.01%.
| | | | | | |
franklintempleton.com | | The accompanying notes are an integral part of these financial statements. | Annual Report | | | 29 | |
F R A N K L I N G L O B A L T R U S T
F I N A N C I A L H I G H L I G H T S
Franklin International Small Cap Growth Fund (continued)
| | | | | | | | | | | | | | | | | | | | |
| | | Year Ended July 31, | |
| | | 2017 | | | 2016 | | | 2015 | | | 2014 | | | 2013a | |
| Class R6 | | | | | | | | | | | | | | | | | | | | |
| | | | | |
| Per share operating performance | | | | | | | | | | | | | | | | | | | | |
(for a share outstanding throughout the year) | | | | | | | | | | | | | | | | | | | | |
| | | | | |
Net asset value, beginning of year | | | $17.61 | | | | $20.03 | | | | $22.32 | | | | $19.78 | | | | $18.49 | |
| | | | |
| | | | | |
| Income from investment operationsb: | | | | | | | | | | | | | | | | | | | | |
| | | | | |
Net investment incomec | | | 0.27 | | | | 0.30 | | | | 0.27 | | | | 0.28 | | | | 0.09 | |
| | | | | |
Net realized and unrealized gains (losses) | | | 4.37 | | | | (2.00 | ) | | | (0.48 | ) | | | 2.65 | | | | 1.20 | |
| | | | |
| | | | | |
Total from investment operations | | | 4.64 | | | | (1.70 | ) | | | (0.21 | ) | | | 2.93 | | | | 1.29 | |
| | | | |
| | | | | |
Less distributions from: | | | | | | | | | | | | | | | | | | | | |
| | | | | |
Net investment income | | | (0.26 | ) | | | (0.35 | ) | | | (0.35 | ) | | | (0.19 | ) | | | — | |
| | | | | |
Net realized gains | | | (1.32 | ) | | | (0.37 | ) | | | (1.73 | ) | | | (0.20 | ) | | | — | |
| | | | |
| | | | | |
Total distributions | | | (1.58 | ) | | | (0.72 | ) | | | (2.08 | ) | | | (0.39 | ) | | | — | |
| | | | |
| | | | | |
Net asset value, end of year | | | $20.67 | | | | $17.61 | | | | $20.03 | | | | $22.32 | | | | $19.78 | |
| | | | |
| | | | | |
Total returnd | | | 28.87% | | | | (8.61)% | | | | 0.22% | | | | 14.89% | | | | 6.98% | |
| | | | | |
| Ratios to average net assetse | | | | | | | | | | | | | | | | | | | | |
| | | | | |
Expensesf | | | 0.99% | | | | 0.99% | | | | 0.99% | | | | 1.00% | | | | 1.01% | |
| | | | | |
Net investment income | | | 1.44% | | | | 1.53% | | | | 1.35% | | | | 1.25% | | | | 1.42% | |
| | | | | |
| Supplemental data | | | | | | | | | | | | | | | | | | | | |
| | | | | |
Net assets, end of year (000’s) | | | $492,010 | | | | $383,411 | | | | $387,070 | | | | $359,449 | | | | $220,507 | |
| | | | | |
Portfolio turnover rate | | | 21.71% | | | | 21.93% | | | | 24.20% | | | | 16.08% | | | | 22.81% | |
aFor the period May 1, 2013 (effective date) to July 31, 2013.
bThe amount shown for a share outstanding throughout the period may not correlate with the Statement of Operations for the period due to the timing of sales and repurchases of the Fund’s shares in relation to income earned and/or fluctuating fair value of the investments of the Fund.
cBased on average daily shares outstanding.
dTotal return is not annualized for periods less than one year.
eRatios are annualized for periods less than one year.
fBenefit of expense reduction rounds to less than 0.01%.
| | | | |
30 | | Annual Report | The accompanying notes are an integral part of these financial statements. | | franklintempleton.com |
F R A N K L I N G L O B A L T R U S T
F I N A N C I A L H I G H L I G H T S
Franklin International Small Cap Growth Fund (continued)
| | | | | | | | | | | | | | | | | | | | |
| | | Year Ended July 31, | |
| | | 2017 | | | 2016 | | | 2015 | | | 2014 | | | 2013 | |
| Advisor Class | | | | | | | | | | | | | | | | | | | | |
| | | | | |
Per share operating performance (for a share outstanding throughout the year) | | | | | | | | | | | | | | | | | | | | |
| | | | | |
Net asset value, beginning of year | | | $17.59 | | | | $20.00 | | | | $22.30 | | | | $19.77 | | | | $14.43 | |
| | | | |
| | | | | |
| Income from investment operationsa: | | | | | | | | | | | | | | | | | | | | |
| | | | | |
Net investment incomeb | | | 0.23 | | | | 0.25 | | | | 0.24 | | | | 0.25 | | | | 0.23 | |
| | | | | |
Net realized and unrealized gains (losses) | | | 4.39 | | | | (1.97 | ) | | | (0.48 | ) | | | 2.65 | | | | 5.95 | |
| | | | |
| | | | | |
Total from investment operations | | | 4.62 | | | | (1.72 | ) | | | (0.24 | ) | | | 2.90 | | | | 6.18 | |
| | | | |
| | | | | |
| Less distributions from: | | | | | | | | | | | | | | | | | | | | |
| | | | | |
Net investment income | | | (0.22 | ) | | | (0.32 | ) | | | (0.33 | ) | | | (0.17 | ) | | | (0.23 | ) |
| | | | | |
Net realized gains | | | (1.32 | ) | | | (0.37 | ) | | | (1.73 | ) | | | (0.20 | ) | | | (0.61 | ) |
| | | | |
| | | | | |
Total distributions | | | (1.54 | ) | | | (0.69 | ) | | | (2.06 | ) | | | (0.37 | ) | | | (0.84 | ) |
| | | | |
| | | | | |
Net asset value, end of year | | | $20.67 | | | | $17.59 | | | | $20.00 | | | | $22.30 | | | | $19.77 | |
| | | | |
| | | | | |
Total return | | | 28.68% | | | | (8.74)% | | | | 0.09% | | | | 14.74% | | | | 44.06% | |
| | | | | |
| Ratios to average net assets | | | | | | | | | | | | | | | | | | | | |
| | | | | |
Expenses before waiver and payments by affiliates | | | 1.14% | | | | 1.14% | | | | 1.12% | | | | 1.12% | | | | 1.16% | |
| | | | | |
Expenses net of waiver and payments by affiliatesc | | | 1.14% | | | | 1.14% | | | | 1.12% | | | | 1.12% | | | | 1.10% | |
| | | | | |
Net investment income | | | 1.29% | | | | 1.38% | | | | 1.22% | | | | 1.13% | | | | 1.33% | |
| | | | | |
| Supplemental data | | | | | | | | | | | | | | | | | | | | |
| | | | | |
Net assets, end of year (000’s) | | | $749,573 | | | | $827,351 | | | | $1,300,759 | | | | $1,223,532 | | | | $826,218 | |
| | | | | |
Portfolio turnover rate | | | 21.71% | | | | 21.93% | | | | 24.20% | | | | 16.08% | | | | 22.81% | |
aThe amount shown for a share outstanding throughout the period may not correlate with the Statement of Operations for the period due to the timing of sales and repurchases of the Fund’s shares in relation to income earned and/or fluctuating fair value of the investments of the Fund.
bBased on average daily shares outstanding.
cBenefit of expense reduction rounds to less than 0.01%.
| | | | | | |
franklintempleton.com | | The accompanying notes are an integral part of these financial statements. | Annual Report | | | 31 | |
F R A N K L I N G L O B A L T R U S T
Statement of Investments, July 31, 2017
Franklin International Small Cap Growth Fund
| | | | | | | | | | | | |
| | | Country | | | Shares | | | Value | |
| | | | | | | | | | | | |
Common Stocks 100.2% | | | | | | | | | | | | |
Air Freight & Logistics 2.8% | | | | | | | | | | | | |
Panalpina Welttransport Holding AG | | | Switzerland | | | | 317,499 | | | $ | 40,185,594 | |
| | | | | | | | | | | | |
Beverages 0.4% | | | | | | | | | | | | |
C&C Group PLC | | | Ireland | | | | 1,621,330 | | | | 5,870,423 | |
| | | | | | | | | | | | |
Building Products 0.4% | | | | | | | | | | | | |
Uponor OYJ | | | Finland | | | | 358,948 | | | | 5,793,252 | |
| | | | | | | | | | | | |
Capital Markets 5.3% | | | | | | | | | | | | |
a Fairfax India Holdings Corp. | | | India | | | | 4,492,000 | | | | 76,139,400 | |
| | | | | | | | | | | | |
Commercial Services & Supplies 6.9% | | | | | | | | | | | | |
Elis SA | | | France | | | | 2,181,860 | | | | 52,756,753 | |
ISS AS | | | Denmark | | | | 662,700 | | | | 27,170,336 | |
a Serco Group PLC | | | United Kingdom | | | | 13,028,010 | | | | 19,079,963 | |
| | | | | | | | | | | | |
| | | |
| | | | | | | | | | | 99,007,052 | |
| | | | | | | | | | | | |
Construction & Engineering 1.2% | | | | | | | | | | | | |
Morgan Sindall Group PLC | | | United Kingdom | | | | 913,165 | | | | 16,506,169 | |
| | | | | | | | | | | | |
Distributors 2.9% | | | | | | | | | | | | |
b Headlam Group PLC | | | United Kingdom | | | | 5,372,888 | | | | 41,683,250 | |
| | | | | | | | | | | | |
Diversified Financial Services 4.7% | | | | | | | | | | | | |
Kennedy Wilson Europe Real Estate PLC | | | United Kingdom | | | | 4,456,500 | | | | 67,207,324 | |
| | | | | | | | | | | | |
Energy Equipment & Services 3.3% | | | | | | | | | | | | |
Amec Foster Wheeler PLC | | | United Kingdom | | | | 8,026,206 | | | | 46,997,425 | |
| | | | | | | | | | | | |
Equity Real Estate Investment Trusts (REITs) 11.5% | | | | | | | | | | | | |
Green REIT PLC | | | Ireland | | | | 32,323,781 | | | | 56,376,248 | |
b Irish Residential Properties REIT PLC | | | Ireland | | | | 28,014,700 | | | | 44,418,850 | |
b,c Lar Espana Real Estate Socimi SA | | | Spain | | | | 6,357,210 | | | | 63,787,994 | |
| | | | | | | | | | | | |
| | | |
| | | | | | | | | | | 164,583,092 | |
| | | | | | | | | | | | |
Food & Staples Retailing 3.8% | | | | | | | | | | | | |
Sligro Food Group NV | | | Netherlands | | | | 347,274 | | | | 15,717,383 | |
Total Produce PLC | | | Ireland | | | | 15,245,100 | | | | 39,234,315 | |
| | | | | | | | | | | | |
| | | |
| | | | | | | | | | | 54,951,698 | |
| | | | | | | | | | | | |
Food Products 2.3% | | | | | | | | | | | | |
Cloetta AB, B | | | Sweden | | | | 9,197,800 | | | | 32,908,661 | |
| | | | | | | | | | | | |
Hotels, Restaurants & Leisure 2.9% | | | | | | | | | | | | |
a Dalata Hotel Group PLC | | | Ireland | | | | 7,332,358 | | | | 41,211,062 | |
| | | | | | | | | | | | |
Insurance 10.8% | | | | | | | | | | | | |
a Arch Capital Group Ltd. | | | United States | | | | 446,907 | | | | 43,466,175 | |
Euler Hermes Group | | | France | | | | 224,921 | | | | 26,879,916 | |
Fairfax Financial Holdings Ltd. | | | Canada | | | | 86,000 | | | | 41,000,690 | |
RenaissanceRe Holdings Ltd. | | | United States | | | | 295,500 | | | | 43,411,905 | |
| | | | | | | | | | | | |
| | | |
| | | | | | | | | | | 154,758,686 | |
| | | | | | | | | | | | |
Internet & Direct Marketing Retail 1.0% | | | | | | | | | | | | |
Dustin Group AB | | | Sweden | | | | 1,643,669 | | | | 13,786,438 | |
| | | | | | | | | | | | |
Internet Software & Services 4.5% | | | | | | | | | | | | |
a 58.com Inc., ADR | | | China | | | | 1,266,600 | | | | 64,659,930 | |
| | | | | | | | | | | | |
Leisure Products 5.5% | | | | | | | | | | | | |
Bandai Namco Holdings Inc. | | | Japan | | | | 894,700 | | | | 31,110,477 | |
Beneteau SA | | | France | | | | 2,721,600 | | | | 46,743,138 | |
| | | | | | | | | | | | |
| | | |
| | | | | | | | | | | 77,853,615 | |
| | | | | | | | | | | | |
| | | | |
32 | | Annual Report | | franklintempleton.com |
F R A N K L I N G L O B A L T R U S T
S T A T E M E N T O F I N V E S T M E N T S
Franklin International Small Cap Growth Fund (continued)
| | | | | | | | | | | | |
| | | Country | | | Shares | | | Value | |
Common Stocks (continued) | | | | | | | | | | | | |
| Machinery 2.7% | | | | | | | | | | | | |
Vesuvius PLC | | | United Kingdom | | | | 686,975 | | | $ | 4,926,256 | |
Zardoya Otis SA | | | Spain | | | | 3,149,108 | | | | 33,051,236 | |
| | | | | | | | | | | | |
| | | |
| | | | | | | | | | | 37,977,492 | |
| | | | | | | | | | | | |
Marine 6.6% | | | | | | | | | | | | |
b Clarkson PLC | | | United Kingdom | | | | 1,798,229 | | | | 63,395,424 | |
a,b Diana Shipping Inc. | | | United States | | | | 7,909,500 | | | | 30,609,765 | |
| | | | | | | | | | | | |
| | | |
| | | | | | | | | | | 94,005,189 | |
| | | | | | | | | | | | |
Media 1.6% | | | | | | | | | | | | |
ASATSU-DK Inc. | | | Japan | | | | 883,800 | | | | 22,669,963 | |
| | | | | | | | | | | | |
Metals & Mining 2.2% | | | | | | | | | | | | |
Straits Trading Co. Ltd. | | | Singapore | | | | 17,186,300 | | | | 31,325,064 | |
| | | | | | | | | | | | |
| Professional Services 5.4% | | | | | | | | | | | | |
PageGroup PLC | | | United Kingdom | | | | 9,307,501 | | | | 60,136,709 | |
SThree PLC | | | United Kingdom | | | | 4,069,860 | | | | 17,062,454 | |
| | | | | | | | | | | | |
| | | |
| | | | | | | | | | | 77,199,163 | |
| | | | | | | | | | | | |
| Real Estate Management & Development 2.0% | | | | | | | | | | | | |
Countrywide PLC | | | United Kingdom | | | | 5,737,000 | | | | 11,694,719 | |
Hang Lung Group Ltd. | | | Hong Kong | | | | 4,262,100 | | | | 16,206,430 | |
| | | | | | | | | | | | |
| | | |
| | | | | | | | | | | 27,901,149 | |
| | | | | | | | | | | | |
Specialty Retail 1.1% | | | | | | | | | | | | |
a,b Carpetright PLC | | | United Kingdom | | | | 6,064,925 | | | | 15,604,020 | |
| | | | | | | | | | | | |
Tobacco 3.5% | | | | | | | | | | | | |
Scandinavian Tobacco Group AS | | | Denmark | | | | 3,070,573 | | | | 49,536,008 | |
| | | | | | | | | | | | |
Trading Companies & Distributors 4.9% | | | | | | | | | | | | |
Grafton Group PLC, units consisting of A shares and C shares | | | United Kingdom | | | | 6,970,732 | | | | 70,680,354 | |
| | | | | | | | | | | | |
| | | |
Total Common Stocks (Cost $1,263,687,818) | | | | | | | | | | | 1,431,001,473 | |
| | | | | | | | | | | | |
| | | |
| | | | | | Principal
Amount | | | | |
Short Term Investments (Cost $7,500,000) 0.5% | | | | | | | | | | | | |
Time Deposits 0.5% | | | | | | | | | | | | |
Royal Bank of Canada, 1.10%, 8/01/17 | | | United States | | | $ | 7,500,000 | | | | 7,500,000 | |
| | | | | | | | | | | | |
Total Investments (Cost $1,271,187,818) 100.7% | | | | | | | | | | | 1,438,501,473 | |
Other Assets, less Liabilities (0.7)% | | | | | | | | | | | (9,780,270 | ) |
| | | | | | | | | | | | |
| | | |
Net Assets 100.0% | | | | | | | | | | $ | 1,428,721,203 | |
| | | | | | | | | | | | |
See Abbreviations on page 49.
aNon-income producing.
bSee Note 8 regarding holdings of 5% voting securities.
cAt July 31, 2017, pursuant to the Fund’s policies and the requirements of applicable securities law, the Fund is restricted from trading this security at year end.
| | | | | | |
franklintempleton.com | | The accompanying notes are an integral part of these financial statements. | Annual Report | | | 33 | |
F R A N K L I N G L O B A L T R U S T
Financial Statements
Statements of Assets and Liabilities
July 31, 2017
| | | | | | | | |
| | | Franklin
International
Growth Fund | | | Franklin
International
Small Cap
Growth Fund | |
Assets: | | | | | | | | |
Investments in securities: | | | | | | | | |
Cost - Unaffiliated issuers | | | $291,218,112 | | | | $ 989,108,354 | |
Cost - Non-controlled affiliates (Note 3f and 8) | | | 12,826,423 | | | | 282,079,464 | |
| | | | |
| | |
Total cost of investments | | | $304,044,535 | | | | $1,271,187,818 | |
| | | | |
Value - Unaffiliated issuers | | | $385,586,169 | | | | $1,179,002,170 | |
Value - Non-controlled affiliates (Note 3f and 8) | | | 12,826,423 | | | | 259,499,303 | |
| | | | |
Total value of investments | | | 398,412,592 | | | | 1,438,501,473 | |
Cash | | | — | | | | 130,323 | |
Receivables: | | | | | | | | |
Investment securities sold | | | 1,666,664 | | | | 235,450 | |
Capital shares sold | | | 207,154 | | | | 477,030 | |
Dividends | | | 565,511 | | | | 1,567,355 | |
European Union tax reclaims | | | 51,574 | | | | 457,217 | |
Other assets | | | 182 | | | | 679 | |
| | | | |
| | |
Total assets | | | 400,903,677 | | | | 1,441,369,527 | |
| | | | |
Liabilities: | | | | | | | | |
Payables: | | | | | | | | |
Investment securities purchased | | | 3,319,245 | | | | 10,667,130 | |
Capital shares redeemed | | | 192,981 | | | | 478,101 | |
Management fees | | | 240,947 | | | | 1,127,496 | |
Distribution fees | | | 46,038 | | | | 52,476 | |
Transfer agent fees | | | 28,401 | | | | 207,399 | |
Accrued expenses and other liabilities | | | 50,801 | | | | 115,722 | |
| | | | |
| | |
Total liabilities | | | 3,878,413 | | | | 12,648,324 | |
| | | | |
| | |
Net assets, at value | | | $397,025,264 | | | | $1,428,721,203 | |
| | | | |
Net assets consist of: | | | | | | | | |
Paid-in capital | | | $323,232,014 | | | | $1,223,621,445 | |
Undistributed net investment income | | | 1,324,424 | | | | 2,798,817 | |
Net unrealized appreciation (depreciation) | | | 94,391,396 | | | | 167,323,919 | |
Accumulated net realized gain (loss) | | | (21,922,570 | ) | | | 34,977,022 | |
| | | | |
| | |
Net assets, at value | | | $397,025,264 | | | | $1,428,721,203 | |
| | | | |
| | | | |
34 | | Annual Report | The accompanying notes are an integral part of these financial statements. | | franklintempleton.com |
F R A N K L I N G L O B A L T R U S T
F I N A N C I A L S T A T E M E N T S
Statements of Assets and Liabilities (continued)
July 31, 2017
| | | | | | | | |
| | | Franklin
International
Growth Fund | | | Franklin
International
Small Cap
Growth Fund | |
| | |
| Class A: | | | | | | | | |
Net assets, at value | | $ | 185,679,835 | | | $ | 161,354,958 | |
| | | | |
Shares outstanding | | | 14,085,523 | | | | 7,827,673 | |
| | | | |
Net asset value per sharea | | | $13.18 | | | | $20.61 | |
| | | | |
Maximum offering price per share (net asset value per share ÷ 94.25%) | | | $13.98 | | | | $21.87 | |
| | | | |
| | |
| Class C: | | | | | | | | |
Net assets, at value | | $ | 8,702,187 | | | $ | 22,190,813 | |
| | | | |
Shares outstanding | | | 679,651 | | | | 1,090,087 | |
| | | | |
Net asset value and maximum offering price per sharea | | | $12.80 | | | | $20.36 | |
| | | | |
| | |
| Class R: | | | | | | | | |
Net assets, at value | | $ | 370,738 | | | $ | 3,592,286 | |
| | | | |
Shares outstanding | | | 28,180 | | | | 173,916 | |
| | | | |
Net asset value and maximum offering price per share | | | $13.16 | | | | $20.66 | |
| | | | |
| | |
| Class R6: | | | | | | | | |
Net assets, at value | | $ | 54,346,993 | | | $ | 492,009,821 | |
| | | | |
Shares outstanding | | | 4,100,448 | | | | 23,804,853 | |
| | | | |
Net asset value and maximum offering price per share | | | $13.25 | | | | $20.67 | |
| | | | |
| | |
| Advisor Class: | | | | | | | | |
Net assets, at value | | $ | 147,925,511 | | | $ | 749,573,325 | |
| | | | |
Shares outstanding | | | 11,169,817 | | | | 36,267,070 | |
| | | | |
Net asset value and maximum offering price per share | | | $13.24 | | | | $20.67 | |
| | | | |
aRedemption price is equal to net asset value less contingent deferred sales charges, if applicable.
| | | | | | |
franklintempleton.com | | The accompanying notes are an integral part of these financial statements. | Annual Report | | | 35 | |
F R A N K L I N G L O B A L T R U S T
F I N A N C I A L S T A T E M E N T S
Statements of Operations
for the year ended July 31, 2017
| | | | | | | | |
| | | Franklin International Growth Fund | | | Franklin International Small Cap Growth Fund | |
| | |
Investment income: | | | | | | | | |
Dividends: (net of foreign taxes)a | | | | | | | | |
Unaffiliated issuers | | | $ 6,218,968 | | | | $ 23,253,981 | |
Non-controlled affiliates (Note 3f and 8) | | | 21,113 | | | | 7,948,430 | |
Interest | | | 97 | | | | 108,745 | |
Other income (Note 1c) | | | 8,273 | | | | 409,867 | |
| | | | |
| | |
Total investment income | | | 6,248,451 | | | | 31,721,023 | |
| | | | |
| | |
Expenses: | | | | | | | | |
Management fees (Note 3a) | | | 3,071,014 | | | | 12,408,195 | |
Distribution fees: (Note 3c) | | | | | | | | |
Class A | | | 425,178 | | | | 367,380 | |
Class C | | | 69,764 | | | | 211,356 | |
Class R | | | 1,493 | | | | 18,718 | |
Transfer agent fees: (Note 3e) | | | | | | | | |
Class A | | | 662,260 | | | | 226,423 | |
Class C | | | 27,163 | | | | 31,710 | |
Class R | | | 1,233 | | | | 5,585 | |
Class R6 | | | 443 | | | | 571 | |
Advisor Class | | | 457,489 | | | | 1,049,191 | |
Custodian fees (Note 4) | | | 52,774 | | | | 169,633 | |
Reports to shareholders | | | 18,954 | | | | 68,657 | |
Registration and filing fees | | | 78,227 | | | | 111,689 | |
Professional fees | | | 77,879 | | | | 90,907 | |
Trustees’ fees and expenses | | | 14,510 | | | | 51,378 | |
Other | | | 16,918 | | | | 35,728 | |
| | | | |
| | |
Total expenses | | | 4,975,299 | | | | 14,847,121 | |
Expense reductions (Note 4) | | | (38 | ) | | | (146 | ) |
Expenses waived/paid by affiliates (Note 3f and 3g) | | | (665,944 | ) | | | — | |
| | | | |
| | |
Net expenses | | | 4,309,317 | | | | 14,846,975 | |
| | | | |
| | |
Net investment income | | | 1,939,134 | | | | 16,874,048 | |
| | | | |
| | |
Realized and unrealized gains (losses): | | | | | | | | |
Net realized gain (loss) from: | | | | | | | | |
Investments: | | | | | | | | |
Unaffiliated issuers | | | (3,014,242 | ) | | | 95,114,716 | |
Non-controlled affiliates (Note 8) | | | — | | | | (24,672,506 | ) |
Foreign currency transactions | | | (142,574 | ) | | | (246,503 | ) |
| | | | |
| | |
Net realized gain (loss) | | | (3,156,816 | ) | | | 70,195,707 | |
| | | | |
| | |
Net change in unrealized appreciation (depreciation) on: | | | | | | | | |
Investments | | | 62,852,900 | | | | 240,077,979 | |
Translation of other assets and liabilities denominated in foreign currencies | | | 31,638 | | | | 147,209 | |
| | | | |
| | |
Net change in unrealized appreciation (depreciation) | | | 62,884,538 | | | | 240,225,188 | |
| | | | |
| | |
Net realized and unrealized gain (loss) | | | 59,727,722 | | | | 310,420,895 | |
| | | | |
| | |
Net increase (decrease) in net assets resulting from operations | | | $61,666,856 | | | | $327,294,943 | |
| | | | |
| | |
aForeign taxes withheld on dividends | | | $ 859,437 | | | | $ 1,786,974 | |
| | | | |
36 | | Annual Report | The accompanying notes are an integral part of these financial statements. | | franklintempleton.com |
F R A N K L I N G L O B A L T R U S T
F I N A N C I A L S T A T E M E N T S
Statements of Changes in Net Assets
| | | | | | | | | | | | | | | | |
| | | Franklin International Growth Fund | | | Franklin International Small Cap Growth Fund | |
| | | | |
| | | Year Ended July 31, | | | Year Ended July 31, | |
| | | | |
| | | 2017 | | | 2016 | | | 2017 | | | 2016 | |
| |
| | | | |
Increase (decrease) in net assets: | | | | | | | | | | | | | | | | |
Operations: | | | | | | | | | | | | | | | | |
Net investment income | | $ | 1,939,134 | | | $ | 1,845,049 | | | $ | 16,874,048 | | | $ | 23,933,557 | |
Net realized gain (loss) | | | (3,156,816 | ) | | | (4,136,305 | ) | | | 70,195,707 | | | | 99,132,581 | |
Net change in unrealized appreciation (depreciation) | | | 62,884,538 | | | | (3,185,540 | ) | | | 240,225,188 | | | | (292,082,074 | ) |
| | | | |
| | | | |
Net increase (decrease) in net assets resulting from operations | | | 61,666,856 | | | | (5,476,796 | ) | | | 327,294,943 | | | | (169,015,936 | ) |
| | | | |
| | | | |
Distributions to shareholders from: | | | | | | | | | | | | | | | | |
Net investment income: | | | | | | | | | | | | | | | | |
Class A | | | (841,402 | ) | | | (19,599 | ) | | | (1,425,763 | ) | | | (2,548,731 | ) |
Class C | | | — | | | | — | | | | (25,457 | ) | | | (49,994 | ) |
Class R | | | (295 | ) | | | (243 | ) | | | (24,719 | ) | | | (41,028 | ) |
Class R6 | | | (527,530 | ) | | | (635,959 | ) | | | (5,916,833 | ) | | | (7,578,966 | ) |
Advisor Class | | | (949,579 | ) | | | (463,438 | ) | | | (7,468,726 | ) | | | (20,608,922 | ) |
Net realized gains: | | | | | | | | | | | | | | | | |
Class A | | | — | | | | — | | | | (10,725,449 | ) | | | (3,890,324 | ) |
Class C | | | — | | | | — | | | | (1,533,621 | ) | | | (550,381 | ) |
Class R | | | — | | | | — | | | | (283,306 | ) | | | (108,438 | ) |
Class R6 | | | — | | | | — | | | | (29,674,221 | ) | | | (8,026,305 | ) |
Advisor Class | | | — | | | | — | | | | (45,321,273 | ) | | | (24,148,351 | ) |
| | | | |
| | | | |
Total distributions to shareholders | | | (2,318,806 | ) | | | (1,119,239 | ) | | | (102,399,368 | ) | | | (67,551,440 | ) |
| | | | |
| | | | |
Capital share transactions: (Note 2) | | | | | | | | | | | | | | | | |
Class A | | | (14,875,113 | ) | | | (10,690,485 | ) | | | (33,815,434 | ) | | | (17,999,696 | ) |
Class C | | | 687,333 | | | | (239,793 | ) | | | (4,027,645 | ) | | | (3,969,619 | ) |
Class R | | | 16,119 | | | | (64,088 | ) | | | (1,705,023 | ) | | | (769,612 | ) |
Class R6 | | | (75,081,157 | ) | | | (13,351,970 | ) | | | 29,575,056 | | | | 45,508,976 | |
Advisor Class | | | 16,565,815 | | | | (13,140,557 | ) | | | (194,340,783 | ) | | | (315,042,616 | ) |
| | | | |
| | | | |
Total capital share transactions | | | (72,687,003 | ) | | | (37,486,893 | ) | | | (204,313,829 | ) | | | (292,272,567 | ) |
| | | | |
| | | | |
Net increase (decrease) in net assets | | | (13,338,953 | ) | | | (44,082,928 | ) | | | 20,581,746 | | | | (528,839,943 | ) |
Net assets: | | | | | | | | | | | | | | | | |
Beginning of year | | | 410,364,217 | | | | 454,447,145 | | | | 1,408,139,457 | | | | 1,936,979,400 | |
| | | | |
| | | | |
End of year | | $ | 397,025,264 | | | $ | 410,364,217 | | | $ | 1,428,721,203 | | | $ | 1,408,139,457 | |
| | | | |
| | | | |
Undistributed net investment income included in net assets: | | | | | | | | | | | | | | | | |
End of year | | $ | 1,324,424 | | | $ | 1,846,670 | | | $ | 2,798,817 | | | $ | 1,826,502 | |
| | | | |
| | | | | | |
franklintempleton.com | | The accompanying notes are an integral part of these financial statements. | Annual Report | | | 37 | |
F R A N K L I N G L O B A L T R U S T
Notes to Financial Statements
1. Organization and Significant Accounting Policies
Franklin Global Trust (Trust) is registered under the Investment Company Act of 1940 (1940 Act) as an open-end management investment company, consisting of five separate funds, two of which are included in this report (Funds) and applies the specialized accounting and reporting guidance in U.S. Generally Accepted Accounting Principles (U.S. GAAP). The Funds offer five classes of shares: Class A, Class C, Class R, Class R6 and Advisor Class. Each class of shares may differ by its initial sales load, contingent deferred sales charges, voting rights on matters affecting a single class, its exchange privilege and fees due to differing arrangements for distribution and transfer agent fees. Franklin International Small Cap Growth Fund was closed to new investors with limited exceptions effective June 3, 2013.
The following summarizes the Funds’ significant accounting policies.
a. Financial Instrument Valuation
The Funds’ investments in financial instruments are carried at fair value daily. Fair value is the price that would be received to sell an asset or paid to transfer a liability in an orderly transaction between market participants on the measurement date. The Funds calculate the net asset value (NAV) per share as of 4 p.m. Eastern time each day the New York Stock Exchange (NYSE) is open for trading. Under compliance policies and procedures approved by the Trust’s Board of Trustees (the Board), the Funds’ administrator has responsibility for oversight of valuation, including leading the cross-functional Valuation Committee (VC). The VC provides administration and oversight of the Funds’ valuation policies and procedures, which are approved annually by the Board. Among other things, these procedures allow the Funds to utilize independent pricing services, quotations from securities and financial instrument dealers, and other market sources to determine fair value.
Equity securities listed on an exchange or on the NASDAQ National Market System are valued at the last quoted sale price or the official closing price of the day, respectively. Foreign equity securities are valued as of the close of trading on the foreign stock exchange on which the security is primarily traded, or as of 4 p.m. Eastern time. The value is then converted into its U.S. dollar equivalent at the foreign exchange rate in effect at 4 p.m. Eastern time on the day that the value of the security is determined. Over-the-counter (OTC) securities are
valued within the range of the most recent quoted bid and ask prices. Securities that trade in multiple markets or on multiple exchanges are valued according to the broadest and most representative market. Certain equity securities are valued based upon fundamental characteristics or relationships to similar securities.
Investments in open-end mutual funds are valued at the closing NAV. Investments in time deposits are valued at cost, which approximates fair value.
The Funds have procedures to determine the fair value of financial instruments for which market prices are not reliable or readily available. Under these procedures, the VC convenes on a regular basis to review such financial instruments and considers a number of factors, including significant unobservable valuation inputs, when arriving at fair value. The VC primarily employs a market-based approach which may use related or comparable assets or liabilities, recent transactions, market multiples, book values, and other relevant information for the investment to determine the fair value of the investment. An income-based valuation approach may also be used in which the anticipated future cash flows of the investment are discounted to calculate fair value. Discounts may also be applied due to the nature or duration of any restrictions on the disposition of the investments. Due to the inherent uncertainty of valuations of such investments, the fair values may differ significantly from the values that would have been used had an active market existed. The VC employs various methods for calibrating these valuation approaches including a regular review of key inputs and assumptions, transactional back-testing or disposition analysis, and reviews of any related market activity.
Trading in securities on foreign securities stock exchanges and OTC markets may be completed before 4 p.m. Eastern time. In addition, trading in certain foreign markets may not take place on every Funds’ business day. Occasionally, events occur between the time at which trading in a foreign security is completed and 4 p.m. Eastern time that might call into question the reliability of the value of a portfolio security held by the Fund. As a result, differences may arise between the value of the Funds’ portfolio securities as determined at the foreign market close and the latest indications of value at 4 p.m. Eastern time. In order to minimize the potential for these differences, the VC monitors price movements following the close of trading in foreign stock markets through a series of country specific market proxies (such as baskets of American
| | | | |
38 | | Annual Report | | franklintempleton.com |
F R A N K L I N G L O B A L T R U S T
N O T E S T O F I N A N C I A L S T A T E M E N T S
Depositary Receipts, futures contracts and exchange traded funds). These price movements are measured against established trigger thresholds for each specific market proxy to assist in determining if an event has occurred that may call into question the reliability of the values of the foreign securities held by the Funds. If such an event occurs, the securities may be valued using fair value procedures, which may include the use of independent pricing services.
When the last day of the reporting period is a non-business day, certain foreign markets may be open on those days that the Funds’ NAV is not calculated, which could result in differences between the value of the Funds’ portfolio securities on the last business day and the last calendar day of the reporting period. Any significant security valuation changes due to an open foreign market are adjusted and reflected by the Funds for financial reporting purposes.
b. Foreign Currency Translation
Portfolio securities and other assets and liabilities denominated in foreign currencies are translated into U.S. dollars based on the exchange rate of such currencies against U.S. dollars on the date of valuation. The Funds may enter into foreign currency exchange contracts to facilitate transactions denominated in a foreign currency. Purchases and sales of securities, income and expense items denominated in foreign currencies are translated into U.S. dollars at the exchange rate in effect on the transaction date. Portfolio securities and assets and liabilities denominated in foreign currencies contain risks that those currencies will decline in value relative to the U.S. dollar. Occasionally, events may impact the availability or reliability of foreign exchange rates used to convert the U.S. dollar equivalent value. If such an event occurs, the foreign exchange rate will be valued at fair value using procedures established and approved by the Board.
The Funds do not separately report the effect of changes in foreign exchange rates from changes in market prices on securities held. Such changes are included in net realized and unrealized gain or loss from investments in the Statements of Operations.
Realized foreign exchange gains or losses arise from sales of foreign currencies, currency gains or losses realized between the trade and settlement dates on securities transactions and the difference between the recorded amounts of dividends, interest, and foreign withholding taxes and the U.S. dollar equivalent of the amounts actually received or paid. Net unrealized foreign
exchange gains and losses arise from changes in foreign exchange rates on foreign denominated assets and liabilities other than investments in securities held at the end of the reporting period.
c. Income and Deferred Taxes
It is each Fund’s policy to qualify as a regulated investment company under the Internal Revenue Code. Each Fund intends to distribute to shareholders substantially all of its taxable income and net realized gains to relieve it from federal income and excise taxes. As a result, no provision for U.S. federal income taxes is required.
The Funds may be subject to foreign taxation related to income received, capital gains on the sale of securities and certain foreign currency transactions in the foreign jurisdictions in which the Funds invest. Foreign taxes, if any, are recorded based on the tax regulations and rates that exist in the foreign markets in which the Funds invest. When a capital gain tax is determined to apply, certain or all Funds record an estimated deferred tax liability in an amount that would be payable if the securities were disposed of on the valuation date.
As a result of several court cases, in certain countries across the European Union, certain or all Funds filed additional tax reclaims for previously withheld taxes on dividends earned in those countries (EU reclaims). These additional filings are subject to various administrative proceedings by the local jurisdictions’ tax authorities within the European Union, as well as a number of related judicial proceedings. Income recognized, if any, for EU reclaims is reflected as other income in the Statements of Operations and any related receivable, if any, is reflected as European Union tax reclaims in the Statements of Assets and Liabilities. When uncertainty exists as to the ultimate resolution of these proceedings, the likelihood of receipt of these EU reclaims, and the potential timing of payment, no amounts are reflected in the financial statements. For U.S. income tax purposes, EU reclaims received by the Funds, if any, reduce the amounts of foreign taxes Fund shareholders can use as tax credits in their individual income tax returns.
Each Fund may recognize an income tax liability related to its uncertain tax positions under U.S. GAAP when the uncertain tax position has a less than 50% probability that it will be sustained upon examination by the tax authorities based on its technical merits. As of July 31, 2017, each Fund has determined
| | | | | | |
franklintempleton.com | | Annual Report | | | 39 | |
F R A N K L I N G L O B A L T R U S T
N O T E S T O F I N A N C I A L S T A T E M E N T S
1. Organization and Significant Accounting
Policies (continued)
c. Income and Deferred Taxes (continued)
that no tax liability is required in its financial statements related to uncertain tax positions for any open tax years (or expected to be taken in future tax years). Open tax years are those that remain subject to examination and are based on the statute of limitations in each jurisdiction in which the Fund invests.
d. Security Transactions, Investment Income, Expenses and Distributions
Security transactions are accounted for on trade date. Realized gains and losses on security transactions are determined on a specific identification basis. Interest income and estimated expenses are accrued daily. Dividend income is recorded on the ex-dividend date except for certain dividends from securities where the dividend rate is not available. In such cases, the dividend is recorded as soon as the information is received by the Funds. Distributions to shareholders are recorded on the ex-dividend date. Distributable earnings are determined according to income tax regulations (tax basis) and may differ from earnings recorded in accordance with U.S. GAAP. These differences may be permanent or temporary. Permanent differences are reclassified among capital accounts to reflect their tax character. These reclassifications have no impact on net assets or the results of operations. Temporary differences are not reclassified, as they may reverse in subsequent periods.
Common expenses incurred by the Trust are allocated among the Funds based on the ratio of net assets of each Fund to the combined net assets of the Trust. Fund specific expenses are charged directly to the Fund that incurred the expense.
Realized and unrealized gains and losses and net investment income, excluding class specific expenses, are allocated daily to each class of shares based upon the relative proportion of net assets of each class. Differences in per share distributions by class are generally due to differences in class specific expenses.
e. Accounting Estimates
The preparation of financial statements in accordance with U.S. GAAP requires management to make estimates and assumptions that affect the reported amounts of assets and liabilities at the date of the financial statements and the amounts of income and expenses during the reporting period. Actual results could differ from those estimates.
f. Guarantees and Indemnifications
Under the Trust’s organizational documents, its officers and trustees are indemnified by the Trust against certain liabilities arising out of the performance of their duties to the Trust. Additionally, in the normal course of business, the Trust, on behalf of the Funds, enters into contracts with service providers that contain general indemnification clauses. The Trust’s maximum exposure under these arrangements is unknown as this would involve future claims that may be made against the Trust that have not yet occurred. Currently, the Trust expects the risk of loss to be remote.
| | | | |
40 | | Annual Report | | franklintempleton.com |
F R A N K L I N G L O B A L T R U S T
N O T E S TO F I N A N C I A L S T A T E M E N T S
2. Shares of Beneficial Interest
At July 31, 2017, there were an unlimited number of shares authorized (without par value). Transactions in the Funds’ shares were as follows:
| | | | | | | | | | | | | | | | | | | | |
| | | Franklin International Growth Fund | | | | | | Franklin International Small Cap Growth Fund | |
| | | Shares | | | Amount | | | | | | Shares | | | Amount | |
| | | | | |
| Class A Shares: | | | | | | | | | | | | | | | | | | | | |
| Year ended July 31, 2017 | | | | | | | | | | | | | | | | | | | | |
| Shares sold | | | 5,449,763 | | | $ | 62,616,764 | | | | | | | | 796,265 | | | $ | 14,658,914 | |
| Shares issued in reinvestment of distributions | | | 21,796 | | | | 231,036 | | | | | | | | 734,034 | | | | 11,840,007 | |
| Shares redeemed | | | (6,744,103 | ) | | | (77,722,913 | ) | | | | | | | (3,387,572 | ) | | | (60,314,355 | ) |
| | | | |
| | | | | |
Net increase (decrease) | | | (1,272,544 | ) | | $ | (14,875,113 | ) | | | | | | | (1,857,273 | ) | | $ | (33,815,434 | ) |
| | | | |
| | | | | |
Year ended July 31, 2016 | | | | | | | | | | | | | | | | | | | | |
| Shares sold | | | 2,126,119 | | | $ | 22,225,883 | | | | | | | | 844,211 | | | $ | 15,571,525 | |
| Shares issued in reinvestment of distributions | | | 537 | | | | 5,630 | | | | | | | | 342,934 | | | | 6,292,827 | |
| Shares redeemed | | | (3,148,867 | ) | | | (32,921,998 | ) | | | | | | | (2,188,320 | ) | | | (39,864,048 | ) |
| | | | |
| | | | | |
| Net increase (decrease) | | | (1,022,211 | ) | | $ | (10,690,485 | ) | | | | | | | (1,001,175 | ) | | $ | (17,999,696 | ) |
| | | | |
| | | | | |
| Class C Shares: | | | | | | | | | | | | | | | | | | | | |
| Year ended July 31, 2017 | | | | | | | | | | | | | | | | | | | | |
| Shares sold | | | 204,694 | | | $ | 2,385,416 | | | | | | | | 57,747 | | | $ | 1,034,118 | |
| Shares issued in reinvestment of distributions | | | — | | | | — | | | | | | | | 91,654 | | | | 1,467,346 | |
| Shares redeemed | | | (153,658 | ) | | | (1,698,083 | ) | | | | | | | (370,069 | ) | | | (6,529,109 | ) |
| | | | |
| | | | | |
| Net increase (decrease) | | | 51,036 | | | $ | 687,333 | | | | | | | | (220,668 | ) | | $ | (4,027,645 | ) |
| | | | |
| | | | | |
| Year ended July 31, 2016 | | | | | | | | | | | | | | | | | | | | |
| Shares sold | | | 180,338 | | | $ | 1,844,832 | | | | | | | | 76,096 | | | $ | 1,398,430 | |
| Shares issued in reinvestment of distributions | | | — | | | | — | | | | | | | | 31,063 | | | | 565,353 | |
| Shares redeemed | | | (207,695 | ) | | | (2,084,625 | ) | | | | | | | (330,816 | ) | | | (5,933,402 | ) |
| | | | |
| | | | | |
| Net increase (decrease) | | | (27,357 | ) | | $ | (239,793 | ) | | | | | | | (223,657 | ) | | $ | (3,969,619 | ) |
| | | | |
| | | | | |
| Class R Shares: | | | | | | | | | | | | | | | | | | | | |
| Year ended July 31, 2017 | | | | | | | | | | | | | | | | | | | | |
| Shares sold | | | 3,773 | | | $ | 43,390 | | | | | | | | 29,482 | | | $ | 538,817 | |
| Shares issued in reinvestment of distributions | | | 28 | | | | 295 | | | | | | | | 19,026 | | | | 308,025 | |
| Shares redeemed | | | (2,356 | ) | | | (27,566 | ) | | | | | | | (144,248 | ) | | | (2,551,865 | ) |
| | | | |
| | | | | |
| Net increase (decrease) | | | 1,445 | | | $ | 16,119 | | | | | | | | (95,740 | ) | | $ | (1,705,023 | ) |
| | | | |
| | | | | |
| Year ended July 31, 2016 | | | | | | | | | | | | | | | | | | | | |
| Shares sold | | | 7,433 | | | $ | 77,410 | | | | | | | | 42,617 | | | $ | 782,563 | |
| Shares issued in reinvestment of distributions | | | 23 | | | | 244 | | | | | | | | 8,123 | | | | 149,466 | |
| Shares redeemed | | | (13,299 | ) | | | (141,742 | ) | | | | | | | (92,615 | ) | | | (1,701,641 | ) |
| | | | |
| | | | | |
| Net increase (decrease) | | | (5,843 | ) | | $ | (64,088 | ) | | | | | | | (41,875 | ) | | $ | (769,612 | ) |
| | | | |
| | | | | | |
franklintempleton.com | | Annual Report | | | 41 | |
F R A N K L I N G L O B A L T R U S T
N O T E S TO F I N A N C I A L S T A T E M E N T S
2. Shares of Beneficial Interest (continued)
| | | | | | | | | | | | | | | | | | | | |
| | | Franklin International
Growth Fund | | | | | | Franklin International Small Cap Growth Fund | |
| | | Shares | | | Amount | | | | | | Shares | | | Amount | |
| | | | | |
| Class R6 Shares: | | | | | | | | | | | | | | | | | | | | |
| Year ended July 31, 2017 | | | | | | | | | | | | | | | | | | | | |
| Shares sold | | | 318,411 | | | $ | 3,760,600 | | | | | | | | 5,386,087 | | | $ | 94,671,471 | |
| Shares issued in reinvestment of distributions | | | 44,509 | | | | 473,134 | | | | | | | | 2,201,724 | | | | 35,535,834 | |
| Shares redeemed | | | (7,281,023 | ) | | | (79,314,891 | ) | | | | | | | (5,555,198 | ) | | | (100,632,249 | ) |
| | | | |
| | | | | |
Net increase (decrease) | | | (6,918,103 | ) | | $ | (75,081,157 | ) | | | | | | | 2,032,613 | | | $ | 29,575,056 | |
| | | | |
| | | | | |
Year ended July 31, 2016 | | | | | | | | | | | | | | | | | | | | |
| Shares sold | | | 868,195 | | | $ | 8,780,940 | | | | | | | | 4,556,506 | | | $ | 84,758,875 | |
| Shares issued in reinvestment of distributions | | | 58,126 | | | | 612,647 | | | | | | | | 845,547 | | | | 15,532,698 | |
| Shares redeemed | | | (2,170,008 | ) | | | (22,745,557 | ) | | | | | | | (2,956,009 | ) | | | (54,782,597 | ) |
| | | | |
| | | | | |
| Net increase (decrease) | | | (1,243,687 | ) | | $ | (13,351,970 | ) | | | | | | | 2,446,044 | | | $ | 45,508,976 | |
| | | | |
| | | | | |
| Advisor Class Shares: | | | | | | | | | | | | | | | | | | | | |
Year ended July 31, 2017 | | | | | | | | | | | | | | | | | | | | |
| Shares sold | | | 2,984,830 | | | $ | 36,087,649 | | | | | | | | 7,102,289 | | | $ | 127,985,896 | |
| Shares issued in reinvestment of distributions | | | 6,201 | | | | 65,975 | | | | | | | | 3,058,640 | | | | 49,397,037 | |
| Shares redeemed | | | (1,741,768 | ) | | | (19,587,809 | ) | | | | | | | (20,925,836 | ) | | | (371,723,716 | ) |
| | | | |
| | | | | |
| Net increase (decrease) | | | 1,249,263 | | | $ | 16,565,815 | | | | | | | | (10,764,907 | ) | | $ | (194,340,783 | ) |
| | | | |
| Year ended July 31, 2016 | | | | | | | | | | | | | | | | | | | | |
| Shares sold | | | 2,405,030 | | | $ | 25,169,272 | | | | | | | | 8,690,236 | | | $ | 159,644,505 | |
| Shares issued in reinvestment of distributions | | | 2,228 | | | | 23,461 | | | | | | | | 2,273,840 | | | | 41,770,430 | |
| Shares redeemed | | | (3,711,819 | ) | | | (38,333,290 | ) | | | | | | | (28,962,897 | ) | | | (516,457,551 | ) |
| | | | |
| | | | | |
Net increase (decrease) | | | (1,304,561 | ) | | $ | (13,140,557 | ) | | | | | | | (17,998,821 | ) | | $ | (315,042,616 | ) |
| | | | |
3. Transactions with Affiliates
Franklin Resources, Inc. is the holding company for various subsidiaries that together are referred to as Franklin Templeton Investments. Certain officers and trustees of the Trust are also officers and/or directors of the following subsidiaries:
| | |
| Subsidiary | | Affiliation |
Franklin Advisers, Inc. (Advisers) | | Investment manager |
Franklin Templeton Institutional, LLC (FT Institutional) | | Investment manager |
Franklin Templeton Services, LLC (FT Services) | | Administrative manager |
Franklin Templeton Distributors, Inc. (Distributors) | | Principal underwriter |
Franklin Templeton Investor Services, LLC (Investor Services) | | Transfer agent |
| | | | |
42 | | Annual Report | | franklintempleton.com |
F R A N K L I N G L O B A L T R U S T
N O T E S TO F I N A N C I A L S T A T E M E N T S
a. Management Fees
Effective December 1, 2016, Franklin International Growth Fund pays an investment management fee to FT Institutional based on the average daily net assets of the Fund as follows:
| | |
| Annualized Fee Rate | | Net Assets |
0.760% | | Up to and including $500 million |
0.740% | | Over $500 million, up to and including $1 billion |
0.720% | | Over $1 billion, up to and including $1.5 billion |
0.700% | | Over $1.5 billion, up to and including $6.5 billion |
0.675% | | Over $6.5 billion, up to and including $11.5 billion |
0.655% | | Over $11.5 billion, up to and including $16.5 billion |
0.635% | | Over $16.5 billion, up to and including $19 billion |
0.615% | | Over $19 billion, up to and including $21.5 billion |
0.600% | | In excess of $21.5 billion |
Prior to December 1, 2016, Franklin International Growth Fund paid fees to FT Institutional based on the average daily net assets of the Fund as follows:
| | |
| Annualized Fee Rate | | Net Assets |
0.950% | | Up to and including $500 million |
0.850% | | Over $500 million, up to and including $1 billion |
0.800% | | Over $1 billion, up to and including $1.5 billion |
0.750% | | Over $1.5 billion, up to and including $6.5 billion |
0.725% | | Over $6.5 billion, up to and including $11.5 billion |
0.700% | | Over $11.5 billion, up to and including $16.5 billion |
0.690% | | Over $16.5 billion, up to and including $19 billion |
0.680% | | Over $19 billion, up to and including $21.5 billion |
0.670% | | In excess of $21.5 billion |
For the year ended July 31, 2017, the effective investment management fee rate was 0.829% of the Fund’s average daily net assets.
Franklin International Small Cap Growth Fund pays an investment management fee to Advisers of 0.950% per year of the average daily net assets of the Fund.
Under a subadvisory agreement, FT Institutional, an affiliate of Advisers, provides subadvisory services to Franklin International Small Cap Growth Fund. The subadvisory fee is paid by Advisers based on the Fund’s average daily net assets, and is not an additional expense of the Fund.
b. Administrative Fees
Under an agreement with FT Institutional and Advisers, FT Services provides administrative services to the Funds. The fee is paid by FT Institutional and Advisers based on each of the Fund’s average daily net assets, and is not an additional expense of the Funds.
c. Distribution Fees
The Board has adopted distribution plans for each share class, with the exception of Class R6 and Advisor Class shares, pursuant to Rule 12b-1 under the 1940 Act. Under the Funds’ Class A reimbursement distribution plans, the Funds reimburse Distributors for costs incurred in connection with the servicing, sale and distribution of each Fund’s shares up to the maximum annual plan rate for each class. Under the Class A reimbursement distribution plans, costs exceeding the maximum for the current plan year cannot be
| | | | | | |
franklintempleton.com | | Annual Report | | | 43 | |
F R A N K L I N G L O B A L T R U S T
N O T E S TO F I N A N C I A L S T A T E M E N T S
3. Transactions with Affiliates (continued)
c. Distribution Fees (continued)
reimbursed in subsequent periods. In addition, under the Funds’ Class C and R compensation distribution plans, the Funds pay Distributors for costs incurred in connection with the servicing, sale and distribution of each Fund’s shares up to the maximum annual plan rate for each class. The plan year, for purposes of monitoring compliance with the maximum annual plan rates, is February 1 through January 31 for each Fund.
The maximum annual plan rates, based on the average daily net assets, for each class, are as follows:
| | | | | | | | |
| | | Franklin
International
Growth Fund | | | Franklin
International
Small Cap
Growth Fund | |
| | |
Reimbursement Plans: | | | | | | | | |
Class A | | | 0.35% | | | | 0.35% | |
| | |
Compensation Plans: | | | | | | | | |
Class C | | | 1.00% | | | | 1.00% | |
Class R | | | 0.50% | | | | 0.50% | |
The Board has set the current rate at 0.25% per year for Class A shares, until further notice and approval by the Board.
d. Sales Charges/Underwriting Agreements
Front-end sales charges and contingent deferred sales charges (CDSC) do not represent expenses of the Funds. These charges are deducted from the proceeds of sales of fund shares prior to investment or from redemption proceeds prior to remittance, as applicable. Distributors has advised the Funds of the following commission transactions related to the sales and redemptions of the Funds’ shares for the year:
| | | | | | | | |
| | | Franklin
International
Growth Fund | | | Franklin
International
Small Cap
Growth Fund | |
| | |
Sales charges retained net of commissions paid to unaffiliated brokers/dealers | | $ | 32,221 | | | $ | 10,761 | |
CDSC retained | | $ | 13,784 | | | $ | 837 | |
e. Transfer Agent Fees
Each class of shares, except for Class R6, pays transfer agent fees to Investor Services for its performance of shareholder servicing obligations and reimburses Investor Services for out of pocket expenses incurred, including shareholder servicing fees paid to third parties. These fees are allocated daily based upon their relative proportion of such classes’ aggregate net assets. Class R6 pays Investor Services transfer agent fees specific to that class.
For the year ended July 31, 2017, the Funds paid transfer agent fees as noted in the Statements of Operations of which the following amounts were retained by Investor Services:
| | | | | | | | |
| | | Franklin
International
Growth Fund | | | Franklin
International
Small Cap
Growth Fund | |
Transfer agent fees | | | $718,570 | | | | $694,705 | |
| | | | |
44 | | Annual Report | | franklintempleton.com |
F R A N K L I N G L O B A L T R U S T
N O T E S TO F I N A N C I A L S T A T E M E N T S
f. Investments in Affiliated Management Investment Companies
Certain or all Funds invest in one or more affiliated management investment companies for purposes other than exercising a controlling influence over the management or policies. Management fees paid by the Funds are waived on assets invested in the affiliated management investment companies, as noted in the Statements of Operations, in an amount not to exceed the management and administrative fees paid directly or indirectly by each affiliate. Prior to August 1, 2013, the waiver was accounted for as a reduction to management fees. During the year ended July 31, 2017, investments in affiliated management investment companies were as follows:
| | | | | | | | | | | | | | | | | | | | | | | | | | | | | | | | |
| | | Number of
Shares Held
at Beginning
of Year | | | Gross
Additions | | | Gross
Reductions | | | Number of
Shares
Held at End
of Year | | | Value
at End of Year | | | Investment
Income | | | Realized
Gain (Loss) | | | % of
Affiliated
Fund Shares
Outstanding
Held at End
of Year | |
| | | | | | | |
| Franklin International Growth Fund | | | | | | | | | | | | | | | | | | | | | | | | | | | | | |
| Non-Controlled Affiliates | | | | | | | | | | | | | | | | | | | | | | | | | | | | | | | | |
Institutional Fiduciary Trust Money Market Portfolio, 0.63% | | | 5,411,318 | | | | 107,228,011 | | | | 99,812,906 | | | | 12,826,423 | | | | $12,826,423 | | | | $21,113 | | | | $– | | | | 0.1% | |
g. Waiver and Expense Reimbursements
Effective December 1, 2016, FT Institutional and Investor Services have contractually agreed in advance to waive or limit their respective fees and to assume as their own expense certain expenses otherwise payable by Franklin International Growth Fund so that the expenses (excluding distribution fees, and acquired fund fees and expenses) for Class A, Class C, Class R and Advisor Class of the Fund do not exceed 1.00% and Class R6 does not exceed 0.82% based on the average net assets of each class (other than certain non-routine expenses or costs, including those relating to litigation, indemnification, reorganizations, and liquidations) until November 30, 2017. Prior to December 1, 2016, expenses for Class A, Class C, Class R and Advisor Class were limited to 1.19% and expenses for Class R6 were limited to 1.00%. Total expenses waived or paid are not subject to recapture subsequent to the Fund’s fiscal year end.
h. Other Affiliated Transactions
At July 31, 2017, one or more of the funds in Franklin Fund Allocator Series owned 22.6% of Franklin International Small Cap Growth Fund’s outstanding shares.
4. Expense Offset Arrangement
The Funds have entered into an arrangement with their custodian whereby credits realized as a result of uninvested cash balances are used to reduce a portion of the Funds’ custodian expenses. During the year ended July 31, 2017, the custodian fees were reduced as noted in the Statements of Operations.
| | | | | | |
franklintempleton.com | | Annual Report | | | 45 | |
F R A N K L I N G L O B A L T R U S T
N O T E S T O F I N A N C I A L S T A T E M E N T S
5. Income Taxes
For tax purposes, capital losses may be carried over to offset future capital gains, if any. At July 31, 2017, the capital loss carryforwards were as follows:
| | | | |
| | | Franklin
International
Growth Fund | |
| |
| |
| Capital loss carryforwards: | | | | |
Short term | | | $ 4,971,133 | |
Long term | | | 15,447,536 | |
| | | | |
| |
Total capital loss carryforwards | | | $20,418,669 | |
| | | | |
The tax character of distributions paid during the years ended July 31, 2017 and 2016, was as follows:
| | | | | | | | | | | | | | | | |
| | | Franklin International
Growth Fund | | | Franklin International
Small Cap Growth Fund | |
| | | | |
| | | 2017 | | | 2016 | | | 2017 | | | 2016 | |
| | | | |
| | | | |
| Distributions paid from: | | | | | | | | | | | | | | | | |
Ordinary income | | $ | 2,318,806 | | | $ | 1,119,239 | | | $ | 80,820,430 | | | $ | 31,919,909 | |
Long term capital gain | | | — | | | | — | | | | 21,578,938 | | | | 35,631,531 | |
| | | | |
| | | | |
| | $ | 2,318,806 | | | $ | 1,119,239 | | | $ | 102,399,368 | | | $ | 67,551,440 | |
| | | | |
At July 31, 2017, the cost of investments, net unrealized appreciation (depreciation), undistributed ordinary income and undistributed long term capital gains for income tax purposes were as follows:
| | | | | | | | |
| | | Franklin
International
Growth Fund | | | Franklin
International
Small Cap
Growth Fund | |
| |
| | |
Cost of investments | | $ | 305,548,436 | | | $ | 1,327,888,590 | |
| | | | |
| | |
Unrealized appreciation | | $ | 109,513,900 | | | $ | 290,969,210 | |
Unrealized depreciation | | | (16,649,744 | ) | | | (180,356,327 | ) |
| | | | |
| | |
Net unrealized appreciation (depreciation) | | $ | 92,864,156 | | | $ | 110,612,883 | |
| | | | |
| | |
Undistributed ordinary income | | $ | 1,274,821 | | | $ | 66,063,776 | |
Undistributed long term capital gains | | | — | | | | 27,982,473 | |
| | | | |
| | |
Distributable earnings | | $ | 1,274,821 | | | $ | 94,046,249 | |
| | | | |
Differences between income and/or capital gains as determined on a book basis and a tax basis are primarily due to differing treatments of foreign currency transactions, passive foreign investment company shares and wash sales.
The Franklin International Small Cap Growth Fund utilized a tax accounting practice to treat a portion of the proceeds from capital shares redeemed as a distribution from realized capital gains.
6. Investment Transactions
Purchases and sales of investments (excluding short term securities) for the year ended July 31, 2017, were as follows:
| | | | |
46 | | Annual Report | | franklintempleton.com |
F R A N K L I N G L O B A L T R U S T
N O T E S T O F I N A N C I A L S T A T E M E N T S
| | | | | | | | |
| | | Franklin
International
Growth Fund | | | Franklin
International
Small Cap
Growth Fund | |
| | | | |
| | |
Purchases | | $ | 103,796,813 | | | $ | 282,483,972 | |
Sales | | $ | 182,633,464 | | | $ | 542,743,858 | |
7. Concentration of Risk
Investing in foreign securities may include certain risks and considerations not typically associated with investing in U.S. securities, such as fluctuating currency values and changing local and regional economic, political and social conditions, which may result in greater market volatility. In addition, certain foreign securities may not be as liquid as U.S. securities.
8. Holdings of 5% Voting Securities of Portfolio Companies
The 1940 Act defines “affiliated companies” to include investments in portfolio companies in which a fund owns 5% or more of the outstanding voting securities. During the year ended July 31, 2017, investments in “affiliated companies” were as follows:
| | | | | | | | | | | | | | | | | | | | | | | | | | | | |
| Name of Issuer | | Number of
Shares Held
at Beginning
of Year | | | Gross
Additions | | | Gross
Reductions | | | Number of
Shares Held
at End
of Year | | | Value at
End of Year | | | Investment
Income | | | Realized
Gain (Loss) | |
|
| Franklin International Small Cap Growth Fund | |
| Non-Controlled Affiliates | | | | | | | | | | | | | | | | | | | | | |
Aderans Co. Ltd. | | | 3,568,500 | | | | — | | | | (3,568,500 | ) | | | — | | | $ | — | | | $ | — | | | | $(25,596,842 | ) |
Carpetright PLC | | | 6,064,925 | | | | — | | | | — | | | | 6,064,925 | | | | 15,604,020 | | | | — | | | | — | |
Clarkson PLC | | | 1,929,420 | | | | — | | | | (131,191 | ) | | | 1,798,229 | | | | 63,395,424 | | | | 1,568,447 | | | | (1,682,795 | ) |
Diana Shipping Inc. | | | 7,909,500 | | | | — | | | | — | | | | 7,909,500 | | | | 30,609,765 | | | | — | | | | — | |
Headlam Group PLC | | | 5,372,888 | | | | — | | | | — | | | | 5,372,888 | | | | 41,683,250 | | | | 2,082,289 | | | | — | |
Irish Residential Properties REIT PLC | | | 31,125,000 | | | | — | | | | (3,110,300 | ) | | | 28,014,700 | | | | 44,418,850 | | | | 1,447,602 | | | | (579,902 | ) |
Lar Espana Real Estate Socimi SA | | | 4,593,500 | | | | 2,271,510 | a | | | (507,800 | ) | | | 6,357,210 | | | | 63,787,994 | | | | 1,912,623 | | | | (3,036,675 | ) |
Lar Espana Real Estate Socimi SA (interim line) | | | 2,271,510 | | | | — | | | | (2,271,510 | )b | | | — | | | | — | | | | — | | | | — | |
Morgan Sindall Group PLC | | | 2,498,900 | | | | — | | | | (1,585,735 | ) | | | 913,165 | | | | — | c | | | 937,469 | | | | 6,223,708 | |
| | | | | | | | | | | | | | | | | | | | |
| | | |
Total Affiliated Securities (Value is 18.2% of Net Assets) | | | | $259,499,303 | | | | $7,948,430 | | | | $(24,672,506 | ) |
| | | | | | | | | | | | | | | | | | | | |
aGross addition was the result of a corporate action.
bGross reduction was the result of a corporate action.
cAs of July 31, 2017, no longer an affiliate.
9. Credit Facility
The Funds, together with other U.S. registered and foreign investment funds (collectively, Borrowers), managed by Franklin Templeton Investments, are borrowers in a joint syndicated senior unsecured credit facility totaling $2 billion (Global Credit Facility) which matures on February 9, 2018. This Global Credit Facility provides a source of funds to the Borrowers for temporary and emergency purposes, including the ability to meet future unanticipated or unusually large redemption requests.
| | | | |
franklintempleton.com | | Annual Report | | 47 |
F R A N K L I N G L O B A L T R U S T
N O T E S T O F I N A N C I A L S T A T E M E N T S
9. Credit Facility (continued)
Under the terms of the Global Credit Facility, the Funds shall, in addition to interest charged on any borrowings made by the Funds and other costs incurred by the Funds, pay their share of fees and expenses incurred in connection with the implementation and maintenance of the Global Credit Facility, based upon their relative share of the aggregate net assets of all of the Borrowers, including an annual commitment fee of 0.15% based upon the unused portion of the Global Credit Facility. These fees are reflected in other expenses in the Statements of Operations. During the year ended July 31, 2017, the Funds did not use the Global Credit Facility.
10. Fair Value Measurements
The Funds follow a fair value hierarchy that distinguishes between market data obtained from independent sources (observable inputs) and the Funds’ own market assumptions (unobservable inputs). These inputs are used in determining the value of the Funds’ financial instruments and are summarized in the following fair value hierarchy:
| | • | | Level 1 – quoted prices in active markets for identical financial instruments |
| | • | | Level 2 – other significant observable inputs (including quoted prices for similar financial instruments, interest rates, prepayment speed, credit risk, etc.) |
| | • | | Level 3 – significant unobservable inputs (including the Funds’ own assumptions in determining the fair value of financial instruments) |
The input levels are not necessarily an indication of the risk or liquidity associated with financial instruments at that level.
For movements between the levels within the fair value hierarchy, the Funds have adopted a policy of recognizing the transfers as of the date of the underlying event which caused the movement.
A summary of inputs used as of July 31, 2017, in valuing the Funds’ assets carried at fair value, is as follows:
| | | | | | | | | | | | | | | | |
| | | Level 1 | | | Level 2 | | | Level 3 | | | Total | |
| | | | |
| Franklin International Growth Fund | | | | | | | | | | | | | | | | |
Assets: | | | | | | | | | | | | | | | | |
Investments in Securities: | | | | | | | | | | | | | | | | |
Equity Investmentsa | | $ | 385,586,169 | | | $ | — | | | $ | —b | | | $ | 385,586,169 | |
Short Term Investments | | | 12,826,423 | | | | — | | | | — | | | | 12,826,423 | |
| | | | |
| | | | |
Total Investments in Securities | | $ | 398,412,592 | | | $ | — | | | $ | — | | | $ | 398,412,592 | |
| | | | |
| | | | |
| Franklin International Small Cap Growth Fund | | | | | | | | | | | | | | | | |
Assets: | | | | | | | | | | | | | | | | |
Investments in Securities: | | | | | | | | | | | | | | | | |
Equity Investmentsa | | $ | 1,431,001,473 | | | $ | — | | | $ | — | | | $ | 1,431,001,473 | |
Short Term Investments | | | — | | | | 7,500,000 | | | | — | | | | 7,500,000 | |
| | | | |
| | | | |
Total Investments in Securities | | $ | 1,431,001,473 | | | $ | 7,500,000 | | | $ | — | | | $ | 1,438,501,473 | |
| | | | |
aFor detailed categories, see the accompanying Statement of Investments.
bIncludes securities determined to have no value at July 31, 2017.
| | | | |
48 | | Annual Report | | franklintempleton.com |
F R A N K L I N G L O B A L T R U S T
N O T E S T O F I N A N C I A L S T A T E M E N T S
11. Investment Company Reporting Modernization
In October 2016, the U.S. Securities and Exchange Commission adopted new rules and amended existing rules (together, final rules) intended to modernize the reporting and disclosure of information by registered investment companies. In part, the final rules amend Regulation S-X and require standardized, enhanced disclosures about derivatives in investment company financial statements, as well as other amendments. The compliance date for the amendments to Regulation S-X is August 1, 2017. Management has reviewed the requirements and believes the adoption of the amendments to Regulation S-X will not have a material impact on the Funds’ financial statements and related disclosures.
12. Subsequent Events
The Funds have evaluated subsequent events through the issuance of the financial statements and determined that no events have occurred that require disclosure.
Abbreviations
| | |
| Selected Portfolio |
ADR | | American Depositary Receipt |
| REIT | | Real Estate Investment Trust |
| | | | | | |
| franklintempleton.com | | Annual Report | | | 49 | |
F R A N K L I N G L O B A L T R U S T
Report of Independent Registered Public Accounting Firm
To the Board of Trustees of Franklin Global Trust and Shareholders of the Franklin International Growth Fund and Franklin International Small Cap Growth Fund
In our opinion, the accompanying statements of assets and liabilities, including the statements of investments, and the related statements of operations and of changes in net assets and the financial highlights present fairly, in all material respects, the financial position of the Franklin International Growth Fund and Franklin International Small Cap Growth Fund (the “Funds”) as of July 31, 2017, the results of each of their operations for the year then ended, the changes in each of their net assets for each of the two years in the period then ended and the financial highlights for each of the periods indicated, in conformity with accounting principles generally accepted in the United States of America. These financial statements and financial highlights (hereafter referred to as “financial statements”) are the responsibility of the Funds’ management. Our responsibility is to express an opinion on these financial statements based on our audits. We conducted our audits of these financial statements in accordance with the standards of the Public Company Accounting Oversight Board (United States). Those standards require that we plan and perform the audit to obtain reasonable assurance about whether the financial statements are free of material misstatement. An audit includes examining, on a test basis, evidence supporting the amounts and disclosures in the financial statements, assessing the accounting principles used and significant estimates made by management, and evaluating the overall financial statement presentation. We believe that our audits, which included confirmation of securities as of July 31, 2017 by correspondence with the custodian, transfer agent and brokers, provide a reasonable basis for our opinion.
PricewaterhouseCoopers LLP
San Francisco, California
September 15, 2017
| | | | |
50 | | Annual Report | | franklintempleton.com |
F R A N K L I N G L O B A L T R U S T
Tax Information (unaudited)
Under Section 852(b)(3)(C) of the Internal Revenue Code (Code), Franklin International Small Cap Growth Fund hereby reports the maximum amount allowable but no less than $33,001,637 as a long term capital gain dividend for the fiscal year ended July 31, 2017.
Under Section 871(k)(2)(C) of the Code, Franklin International Small Cap Growth Fund hereby reports the maximum amount allowable but no less than $65,958,933 as a short term capital gain dividend for purposes of the tax imposed under Section 871(a)(1)(A) of the Code for the fiscal year ended July 31, 2017.
Under Section 854(b)(1)(B) of the Code, the Funds hereby report the maximum amount allowable but no less than the following amounts as qualified dividends for purposes of the maximum rate under Section 1(h)(11) of the Code for the fiscal year ended July 31, 2017:
| | | | | | |
Franklin International
Growth Fund | | | Franklin
International
Small Cap
Growth Fund | |
| | |
| |
| | 6,733,878 | | | | 20,287,293 | |
Distributions, including qualified dividend income, paid during calendar year 2017 will be reported to shareholders on Form 1099-DIV by mid-February 2018. Shareholders are advised to check with their tax advisors for information on the treatment of these amounts on their individual income tax returns.
At July 31, 2016, more than 50% of the Funds’ total assets were invested in securities of foreign issuers. In most instances, foreign taxes were withheld from income paid to the Funds on these investments. As shown in the table below, the Funds hereby report to shareholders the foreign source income and foreign taxes paid, pursuant to Section 853 of the Code. This written statement will allow shareholders of record on December 14, 2016, to treat their proportionate share of foreign taxes paid by the Funds as having been paid directly by them. The shareholder shall consider these amounts as foreign taxes paid in the tax year in which they receive the Fund distribution.
The following tables provide a detailed analysis of foreign tax paid, foreign source income, and foreign source qualified dividends as reported by the Funds, to Class A, Class C, Class R, Class R6 and Advisor Class shareholders of record.
| | | | | | |
| Class | | Foreign Tax Paid
Per Share | | Foreign Source
Income Per Share | | Foreign Source Qualified
Dividends Per Share |
| | | |
| Franklin International Growth Fund | | | | | | |
Class A | | $0.0175 | | $0.0638 | | $0.0592 |
Class C | | $0.0175 | | $0.0000 | | $0.0000 |
Class R | | $0.0175 | | $0.0268 | | $0.0248 |
Class R6 | | $0.0175 | | $0.1137 | | $0.1055 |
Advisor Class | | $0.0175 | | $0.0913 | | $0.0846 |
| | | |
| Franklin International Small Cap Growth Fund | | | | | | |
Class A | | $0.0289 | | $0.5480 | | $0.4058 |
Class C | | $0.0289 | | $0.4794 | | $0.3550 |
Class R
| | $0.0289 | | $0.5192 | | $0.3844 |
Class R6 | | $0.0289 | | $0.5843 | | $0.4326 |
Advisor Class | | $0.0289 | | $0.5649 | | $0.4183 |
Foreign Tax Paid Per Share (Column 1) is the amount per share available to you, as a tax credit (assuming you held your shares in the Fund for a minimum of 16 days during the 31-day period beginning 15 days before the ex-dividend date of the Fund’s distribution to which the foreign taxes relate), or, as a tax deduction.
Foreign Source Income Per Share (Column 2) is the amount per share of income dividends attributable to foreign securities held by the Fund, plus any foreign taxes withheld on these dividends. The amounts reported include foreign source qualified dividends that have not been adjusted for the rate differential applicable to such dividend income.1
| | | | | | |
franklintempleton.com | | Annual Report | | | 51 | |
F R A N K L I N G L O B A L T R U S T
T A X I N F O R M A T I O N ( U N A U D I T E D )
Foreign Source Qualified Dividends Per Share (Column 3) is the amount per share of foreign source qualified dividends, plus any foreign taxes withheld on these dividends. These amounts represent the portion of the Foreign Source Income reported to you in column 2 that were derived from qualified foreign securities held by the Fund.1
By mid-February 2018, shareholders will receive Form 1099-DIV which will include their share of taxes paid and foreign source income distributed during the calendar year 2017. The Foreign Source Income reported on Form 1099-DIV has not been adjusted for the rate differential on foreign source qualified dividend income. Shareholders are advised to check with their tax advisors for information on the treatment of these amounts on their 2017 individual income tax returns.
1Qualified dividends are taxed at reduced long term capital gains tax rates. In determining the amount of foreign tax credit that may be applied against the U.S. tax liability of individuals receiving foreign source qualified dividends, adjustments may be required to the foreign tax credit limitation calculation to reflect the rate differential applicable to such dividend income. The rules however permit certain individuals to elect not to apply the rate differential adjustments for capital gains and/or dividends for any taxable year. Please consult your tax advisor and the instructions to Form 1116 for more information.
| | | | |
52 | | Annual Report | | franklintempleton.com |
F R A N K L I N G L O B A L T R U S T
Board Members and Officers
The name, year of birth and address of the officers and board members, as well as their affiliations, positions held with the Trust, principal occupations during at least the past five years and number of U.S. registered portfolios overseen in the Franklin Templeton Investments fund complex, are shown below. Generally, each board member serves until that person’s successor is elected and qualified.
Independent Board Members
| | | | | | | | |
Name, Year of Birth
and Address | | Position | | Length of
Time Served | | Number of Portfolios in
Fund Complex Overseen
by Board Member* | | Other Directorships Held During at Least the Past 5 Years |
| | | | |
Harris J. Ashton (1932)
One Franklin Parkway
San Mateo, CA 94403-1906 | | Trustee | | Since 2000 | | 140 | | Bar-S Foods (meat packing company) (1981-2010). |
| |
| Principal Occupation During at Least the Past 5 Years: | | |
Director of various companies; and formerly, Director, RBC Holdings, Inc. (bank holding company) (until 2002); and President, Chief Executive Officer and Chairman of the Board, General Host Corporation (nursery and craft centers) (until 1998). |
| | | | |
Mary C. Choksi (1950)
One Franklin Parkway
San Mateo, CA 94403-1906 | | Trustee | | Since 2014 | | 134 | | Avis Budget Group Inc. (car rental) (2007-present), Omnicom Group Inc. (advertising and marketing communications services) (2011-present). |
| |
| Principal Occupation During at Least the Past 5 Years: | | |
Director of various companies; and formerly, Founder and Senior Advisor, Strategic Investment Group (investment management group) (2015-2017), Founding Partner and Senior Managing Director, Strategic Investment Group (1987-2015); Founding Partner and Managing Director, Emerging Markets Management LLC (investment management firm) (1987-2011); and Loan Officer/Senior Loan Officer/Senior Pension Investment Officer, World Bank Group (international financial institution) (1977-1987). |
| | | | |
Edith E. Holiday (1952)
One Franklin Parkway
San Mateo, CA 94403-1906 | | Trustee | | Since 2000 | | 140 | | Hess Corporation (exploration of oil and gas) (1993-present), Canadian National Railway (railroad) (2001-present), White Mountains Insurance Group, Ltd. (holding company) (2004-present), Santander Consumer USA Holdings, Inc. (consumer finance) (2016-present), RTI International Metals, Inc. (manufacture and distribution of titanium) (1999-2015) and H.J. Heinz Company (processed foods and allied products) (1994-2013). |
| |
| Principal Occupation During at Least the Past 5 Years: | | |
Director or Trustee of various companies and trusts; and formerly, Assistant to the President of the United States and Secretary of the Cabinet (1990-1993); General Counsel to the United States Treasury Department (1989-1990); and Counselor to the Secretary and Assistant Secretary for Public Affairs and Public Liaison – United States Treasury Department (1988-1989). |
| | | | |
J. Michael Luttig (1954)
One Franklin Parkway
San Mateo, CA 94403-1906 | | Trustee | | Since 2009 | | 140 | | Boeing Capital Corporation (aircraft financing) (2006-2013). |
| |
| Principal Occupation During at Least the Past 5 Years: | | |
Executive Vice President, General Counsel and member of the Executive Council, The Boeing Company (aerospace company) (2006-present); and formerly, Federal Appeals Court Judge, U.S. Court of Appeals for the Fourth Circuit (1991-2006). |
| | | | | | |
| franklintempleton.com | | Annual Report | | | 53 | |
F R A N K L I N G L O B A L T R U S T
Independent Board Members (continued)
| | | | | | | | |
Name, Year of Birth
and Address | | Position | | Length of
Time Served | | Number of Portfolios in
Fund Complex Overseen
by Board Member* | | Other Directorships Held
During at Least the Past 5 Years |
| | | | |
Larry D. Thompson (1945)
One Franklin Parkway
San Mateo, CA 94403-1906 | | Trustee | | Since 2007 | | 140 | | The Southern Company (energy company) (2014-present; previously 2010-2012), Graham Holdings Company (education and media organization) (2011-present) and Cbeyond, Inc. (business communications provider) (2010-2012). |
| |
| Principal Occupation During at Least the Past 5 Years: | | |
Director of various companies; John A. Sibley Professor of Corporate and Business Law, University of Georgia School of Law (2015-present; previously 2011-2012); and formerly, Executive Vice President – Government Affairs, General Counsel and Corporate Secretary, PepsiCo, Inc. (consumer products) (2012-2014); Senior Vice President - Government Affairs, General Counsel and Secretary, PepsiCo, Inc. (2004-2011); Senior Fellow of The Brookings Institution (2003-2004); Visiting Professor, University of Georgia School of Law (2004); and Deputy Attorney General, U.S. Department of Justice (2001-2003). |
| | | | |
John B. Wilson (1959)
One Franklin Parkway
San Mateo, CA 94403-1906 | | Lead Independent Trustee | | Trustee since 2006 and Lead Independent Trustee since 2008 | | 114 | | None |
| |
| Principal Occupation During at Least the Past 5 Years: | | |
President and Founder, Hyannis Port Capital, Inc. (real estate and private equity investing); (2002-present); serves on private and non-profit boards; and formerly, President, Staples International and Head of Global Transformation (office supplies) (2012-2016); Chief Operating Officer and Executive Vice President, Gap, Inc. (retail) (1996-2000); Chief Financial Officer and Executive Vice President – Finance and Strategy, Staples, Inc. (1992-1996); Senior Vice President – Corporate Planning, Northwest Airlines, Inc. (airlines) (1990-1992); and Vice President and Partner, Bain & Company (consulting firm) (1986-1990). |
Interested Board Members and Officers
| | | | | | | | |
Name, Year of Birth
and Address | | Position | | Length of
Time Served | | Number of Portfolios in
Fund Complex Overseen
by Board Member* | | Other Directorships Held
During at Least the Past 5 Years |
| | | | |
**Gregory E. Johnson (1961)
One Franklin Parkway
San Mateo, CA 94403-1906 | | Trustee | | Since 2007 | | 156 | | None |
| |
| Principal Occupation During at Least the Past 5 Years: | | |
Chairman of the Board, Member – Office of the Chairman, Director and Chief Executive Officer, Franklin Resources, Inc.; officer and/or director or trustee, as the case may be, of some of the other subsidiaries of Franklin Resources, Inc. and of 44 of the investment companies in Franklin Templeton Investments; Vice Chairman, Investment Company Institute; and formerly, President, Franklin Resources, Inc. (1994-2015). |
| | | | |
**Rupert H. Johnson, Jr. (1940)
One Franklin Parkway
San Mateo, CA 94403-1906 | | Chairman of the Board and Trustee | | Since 2013 | | 140 | | None |
| |
| Principal Occupation During at Least the Past 5 Years: | | |
Vice Chairman, Member - Office of the Chairman and Director, Franklin Resources, Inc.; Director, Franklin Advisers, Inc.; Senior Vice President, Franklin Advisory Services, LLC; and officer and/or director or trustee, as the case may be, of some of the other subsidiaries of Franklin Resources, Inc. and of 42 of the investment companies in Franklin Templeton Investments. |
| | | | |
Alison E. Baur (1964)
One Franklin Parkway
San Mateo, CA 94403-1906 | | Vice President | | Since 2012 | | Not Applicable | | Not Applicable |
| |
| Principal Occupation During at Least the Past 5 Years: | | |
Deputy General Counsel, Franklin Templeton Investments; and officer of some of the other subsidiaries of Franklin Resources, Inc. and of 45 of the investment companies in Franklin Templeton Investments. |
| | | | |
| 54 | | Annual Report | | franklintempleton.com |
F R A N K L I N G L O B A L T R U S T
Interested Board Members and Officers (continued)
| | | | | | | | | | |
Name, Year of Birth
and Address | | Position | | Length of
Time Served | | Number of Portfolios in
Fund Complex Overseen
by Board Member* | | Other Directorships Held
During at Least the Past 5 Years | |
| | | | |
Gaston Gardey (1967)
One Franklin Parkway
San Mateo, CA 94403-1906 | | Chief Financial Officer, Chief Accounting Officer and Treasurer | | Since 2009 | | Not Applicable | | | Not Applicable | |
| |
| Principal Occupation During at Least the Past 5 Years: | | | | |
Treasurer, U.S. Fund Administration & Reporting, Franklin Templeton Investments; and officer of 27 of the investment companies in Franklin Templeton Investments. | |
| | | | |
Aliya S. Gordon (1973)
One Franklin Parkway
San Mateo, CA 94403-1906 | | Vice President | | Since 2009 | | Not Applicable | | | Not Applicable | |
| |
| Principal Occupation During at Least the Past 5 Years: | | | | |
Senior Associate General Counsel, Franklin Templeton Investments; and officer of 45 of the investment companies in Franklin Templeton Investments. | |
| | | | |
Steven J. Gray (1955)
One Franklin Parkway
San Mateo, CA 94403-1906 | | Vice President | | Since 2009 | | Not Applicable | | | Not Applicable | |
| |
| Principal Occupation During at Least the Past 5 Years: | | | | |
Senior Associate General Counsel, Franklin Templeton Investments; Vice President, Franklin Templeton Distributors, Inc. and FT AlphaParity, LLC; and officer of 45 of the investment companies in Franklin Templeton Investments. | |
| | | | |
| Matthew T. Hinkle (1971) One Franklin Parkway San Mateo, CA 94403-1906 | | Chief Executive Officer – Finance and Administration | | Since June
2017 | | Not Applicable | | | Not Applicable | |
| |
| Principal Occupation During at Least the Past 5 Years: | | | | |
Senior Vice President, U.S. Fund Administration Reporting & Fund Tax, Franklin Templeton Investments; officer of 45 of the investment companies in Franklin Templeton Investments; and formerly, Vice President, Global Tax (2012-April 2017) and Treasurer/Assistant Treasurer, Franklin Templeton Investments (2009-2017). | |
| | | | |
Edward B. Jamieson (1948)
One Franklin Parkway
San Mateo, CA 94403-1906 | | President and Chief Executive Officer – Investment Management | | Since 2010 | | Not Applicable | | | Not Applicable | |
| |
| Principal Occupation During at Least the Past 5 Years: | | | | |
President and Director, Franklin Advisers, Inc.; Executive Vice President, Franklin Templeton Institutional, LLC; and officer and/or trustee, as the case may be, of some of the other subsidiaries of Franklin Resources, Inc. and of 10 of the investment companies in Franklin Templeton Investments. | |
| | | | |
Robert Lim (1948)
One Franklin Parkway
San Mateo, CA 94403-1906 | | Vice President – AML Compliance | | Since 2016 | | Not Applicable | | | Not Applicable | |
| |
| Principal Occupation During at Least the Past 5 Years: | | | | |
Vice President, Franklin Templeton Companies, LLC; Chief Compliance Officer, Franklin Templeton Distributors, Inc. and Franklin Templeton Investor Services, LLC; and officer of 45 of the investment companies in Franklin Templeton Investments. | |
| | | | |
Christopher J. Molumphy (1962)
One Franklin Parkway
San Mateo, CA 94403-1906 | | Vice President | | Since 2000 | | Not Applicable | | | Not Applicable | |
| |
| Principal Occupation During at Least the Past 5 Years: | | | | |
Director and Executive Vice President, Franklin Advisers, Inc.; Executive Vice President, Franklin Templeton Institutional, LLC; and officer of some of the other subsidiaries of Franklin Resources, Inc. and of 22 of the investment companies in Franklin Templeton Investments. | |
| | | | | | |
| franklintempleton.com | | Annual Report | | | 55 | |
F R A N K L I N G L O B A L T R U S T
Interested Board Members and Officers (continued)
| | | | | | | | |
Name, Year of Birth and Address | | Position | | Length of Time Served | | Number of Portfolios in Fund Complex Overseen by Board Member* | | Other Directorships Held During at Least the Past 5 Years |
| | | | |
Kimberly H. Novotny (1972) 300 S.E. 2nd Street Fort Lauderdale, FL 33301-1923 | | Vice President | | Since 2013 | | Not Applicable | | Not Applicable |
| |
| Principal Occupation During at Least the Past 5 Years: | | |
Associate General Counsel, Franklin Templeton Investments; Vice President and Corporate Secretary, Fiduciary Trust International of the South; Vice President, Templeton Investment Counsel, LLC; Assistant Secretary, Franklin Resources, Inc.; and officer of 45 of the investment companies in Franklin Templeton Investments. |
| | | | |
Robert C. Rosselot (1960) 300 S.E. 2nd Street Fort Lauderdale, FL 33301-1923 | | Chief Compliance Officer | | Since 2013 | | Not Applicable | | Not Applicable |
|
| Principal Occupation During at Least the Past 5 Years: |
Director, Global Compliance, Franklin Templeton Investments; Vice President, Franklin Templeton Companies, LLC; officer of 45 of the investment companies in Franklin Templeton Investments; and formerly, Senior Associate General Counsel, Franklin Templeton Investments (2007-2013); and Secretary and Vice President, Templeton Group of Funds (2004-2013). |
| | | | |
Karen L. Skidmore (1952) One Franklin Parkway San Mateo, CA 94403-1906 | | Vice President and Secretary | | Since 2006 | | Not Applicable | | Not Applicable |
|
| Principal Occupation During at Least the Past 5 Years: |
Senior Associate General Counsel, Franklin Templeton Investments; and officer of 45 of the investment companies in Franklin Templeton Investments. |
| | | | |
Navid J. Tofigh (1972) One Franklin Parkway San Mateo, CA 94403-1906 | | Vice President | | Since 2015 | | Not Applicable | | Not Applicable |
|
| Principal Occupation During at Least the Past 5 Years: |
Associate General Counsel, Franklin Templeton Investments; and officer of 45 of the investment companies in Franklin Templeton Investments. |
| | | | |
Craig S. Tyle (1960) One Franklin Parkway San Mateo, CA 94403-1906 | | Vice President | | Since 2005 | | Not Applicable | | Not Applicable |
|
| Principal Occupation During at Least the Past 5 Years: |
General Counsel and Executive Vice President, Franklin Resources, Inc.; and officer of some of the other subsidiaries of Franklin Resources, Inc. and of 45 of the investment companies in Franklin Templeton Investments. |
| | | | |
Lori A. Weber (1964) 300 S.E. 2nd Street Fort Lauderdale, FL 33301-1923 | | Vice President | | Since 2011 | | Not Applicable | | Not Applicable |
|
| Principal Occupation During at Least the Past 5 Years: |
Senior Associate General Counsel, Franklin Templeton Investments; Assistant Secretary, Franklin Resources, Inc.; Vice President and Secretary, Templeton Investment Counsel, LLC; and officer of 45 of the investment companies in Franklin Templeton Investments. |
*We base the number of portfolios on each separate series of the U.S. registered investment companies within the Franklin Templeton Investments fund complex. These portfolios have a common investment manager or affiliated investment managers.
**Gregory E. Johnson is considered to be an interested person of the Fund under the federal securities laws due to his position as an officer and director of Franklin Resources, Inc. (Resources), which is the parent company of the Fund’s investment manager and distributor. Rupert H. Johnson, Jr. is considered to be an interested person of the Fund under the federal securities laws due to his position as officer and director and major shareholder of Resources.
Note 1: Rupert H. Johnson, Jr. is the uncle of Gregory E. Johnson.
Note 2: Officer information is current as of the date of this report. It is possible that after this date, information about officers may change.
Note 3: Effective November 1, 2016, Frank Olson ceased to be a trustee of the Trust.
The Sarbanes-Oxley Act of 2002 and Rules adopted by the Securities and Exchange Commission require the Fund to disclose whether the Fund’s Audit Committee includes at least one member who is an audit committee financial expert within the meaning of such Act and Rules. The Fund’s Board has determined that there is at least one such financial expert on the Audit Committee and has designated John B. Wilson as its audit committee financial expert. The Board believes that Mr. Wilson qualifies as such an expert in view of his extensive business background and experience, including service as chief financial officer of Staples, Inc. from 1992 to 1996. Mr. Wilson has been a Member and Chairman of the Fund’s Audit Committee since 2006. As a result of such background and
| | | | |
56 | | Annual Report | | franklintempleton.com |
F R A N K L I N G L O B A L T R U S T
Interested Board Members and Officers (continued)
experience, the Board believes that Mr. Wilson has acquired an understanding of generally accepted accounting principles and financial statements, the general application of such principles in connection with the accounting estimates, accruals and reserves, and analyzing and evaluating financial statements that present a breadth and level of complexity of accounting issues generally comparable to those of the Fund, as well as an understanding of internal controls and procedures for financial reporting and an understanding of audit committee functions. Mr. Wilson is an independent Board member as that term is defined under the relevant Securities and Exchange Commission Rules and Releases.
The Statement of Additional Information (SAI) includes additional information about the board members and is available, without charge, upon request. Shareholders may call (800) DIAL BEN/342-5236 to request the SAI.
| | | | | | |
franklintempleton.com | | Annual Report | | | 57 | |
F R A N K L I N G L O B A L T R U S T
Shareholder Information
Board Approval of Investment Management Agreements
FRANKLIN GLOBAL TRUST
Franklin International Growth Fund
Franklin International Small Cap Growth Fund
(each a Fund)
At an in-person meeting held on February 28, 2017 (Meeting), the Board of Trustees (Board) of Franklin Global Trust, including a majority of the trustees who are not “interested persons” as defined in the Investment Company Act of 1940 (Independent Trustees), reviewed and approved the continuance of the investment management agreement between Franklin Templeton Institutional, LLC (FTI LLC) and Franklin International Growth Fund, the investment management agreement between Franklin Advisers, Inc. (FAI) and Franklin International Small Cap Growth Fund and the investment sub-advisory agreement between FAI and FTI LLC on behalf of the Franklin International Small Cap Growth Fund (each a Management Agreement) for an additional one-year period. The Independent Trustees received advice from and met separately with Independent Trustee counsel in considering whether to approve the continuation of each Management Agreement. Although the Management Agreements for the Funds were considered at the same Board meeting, the Board considered the information provided to it about the Funds together and with respect to each Fund separately as the Board deemed appropriate. FTI LLC and FAI are each referred to herein as a Manager.
In considering the continuation of each Management Agreement, the Board reviewed and considered information provided by each Manager at the Meeting and throughout the year at meetings of the Board and its committees. The Board also reviewed and considered information provided in response to a detailed set of requests for information submitted to each Manager by Independent Trustee counsel on behalf of the Independent Trustees in connection with the annual contract renewal process. In addition, prior to the Meeting, the Independent Trustees held a telephonic contract renewal meeting at which the Independent Trustees conferred amongst themselves and Independent Trustee counsel about contract renewal matters. The Board reviewed and considered all of the factors it deemed relevant in approving the continuance of each Management Agreement, including, but not limited to: (i) the nature, extent, and quality of the services provided by each Manager; (ii) the investment performance of each Fund; (iii) the costs of the services provided and profits realized by each
Manager and its affiliates from the relationship with each Fund; (iv) the extent to which economies of scale are realized as each Fund grows; and (v) whether fee levels reflect these economies of scale for the benefit of Fund investors.
In approving the continuance of each Management Agreement, the Board, including a majority of the Independent Trustees, determined that the existing management fees are fair and reasonable and that the continuance of such Management Agreement is in the interests of the applicable Fund and its shareholders. While attention was given to all information furnished, the following discusses some primary factors relevant to the Board’s determination.
Nature, Extent and Quality of Services
The Board reviewed and considered information regarding the nature, extent and quality of investment management services provided by each Manager and its affiliates to the Funds and their shareholders. This information included, among other things, the qualifications, background and experience of the senior management and investment personnel of each Manager; the structure of investment personnel compensation; oversight of third-party service providers; investment performance reports and related financial information for each Fund; reports on expenses, shareholder services, marketing support payments made to financial intermediaries and third party servicing arrangements; legal and compliance matters; risk controls; pricing and other services provided by each Manager and its affiliates; and management fees charged by each Manager and its affiliates to U.S. funds and other accounts, including management’s explanation of differences among accounts where relevant. The Board noted management’s continual efforts and expenditures in establishing effective business continuity plans and developing strategies to address areas of heightened concern in the mutual fund industry, such as cybersecurity, derivatives and liquidity risk management.
The Board also reviewed and considered the benefits provided to Fund shareholders of investing in a fund that is part of the Franklin Templeton family of funds. The Board noted the financial position of Franklin Resources, Inc. (FRI), the Managers’ parent, and its commitment to the mutual fund business as evidenced by its continued introduction of new funds, reassessment of the fund offerings in response to the market environment and project initiatives and capital investments relating to the services provided to the Funds by the Franklin Templeton Investments (FTI) organization.
Following consideration of such information, the Board was satisfied with the nature, extent and quality of services provided
| | | | |
58 | | Annual Report | | franklintempleton.com |
F R A N K L I N G L O B A L T R U S T
S H A R E H O L D E R I N F O R M A T I O N
by each Manager and its affiliates to the Funds and their shareholders.
Fund Performance
The Board reviewed and considered the performance results of each Fund over various time periods ended December 31, 2016. The Board considered the performance returns for each Fund in comparison to the performance returns of mutual funds deemed comparable to the Fund included in a universe (Performance Universe) selected by Broadridge Financial Solutions, Inc. (Broadridge), an independent provider of investment company data. The Board received a description of the methodology used by Broadridge to select the mutual funds included in a Performance Universe. The Board also reviewed and considered Fund performance reports provided and discussions that occurred with portfolio managers at Board meetings throughout the year. A summary of each Fund’s performance results is below.
Franklin International Growth Fund - The Performance Universe for this Fund included the Fund and all retail and institutional international multi-cap growth funds. The Board noted that the Fund’s annualized total return for the one- and three-year periods was above the median of its Performance Universe, and for the five-year period was below the median of its Performance Universe. The Board concluded that the Fund’s performance was satisfactory, noting that the Fund has been in operation for less than 10 years and that the Fund’s annualized total return for the five-year period, while below median, exceeded 5.6%.
Franklin International Small Cap Growth Fund - The Performance Universe for this Fund included the Fund and all retail and institutional international small-/mid-cap growth funds. The Board noted that the Fund’s annualized total return for the one- and three-year periods was below the median of its Performance Universe, but for the five- and 10-year periods was above the median of its Performance Universe. The Board concluded that the Fund’s performance was acceptable, noting that the Fund’s long-term five- and 10-year performance was in the first quintile of its Performance Universe and that the Fund is currently closed to new investors.
Comparative Fees and Expenses
The Board reviewed and considered information regarding each Fund’s actual total expense ratio and its various components, including, as applicable, management fees; transfer agent expenses; underlying fund expenses; Rule 12b-1 and non-Rule 12b-1 service fees; and other non-management fees. The Board also noted that at its February meeting each year, it
receives an annual report on all marketing support payments made by FTI to financial intermediaries. The Board considered the actual total expense ratio and, separately, the contractual management fee rate, without the effect of fee waivers, if any (Management Rate) of each Fund in comparison to the median ratio and median Management Rate, respectively, of other mutual funds deemed comparable to and with a similar expense structure as the Fund selected by Broadridge (Expense Group). Broadridge fee and expense data is based upon information taken from each fund’s most recent annual report, which reflects historical asset levels that may be quite different from those currently existing, particularly in a period of market volatility. While recognizing such inherent limitation and the fact that expense ratios and Management Rates generally increase as assets decline and decrease as assets grow, the Board believed the independent analysis conducted by Broadridge to be an appropriate measure of comparative fees and expenses. The Broadridge Management Rate includes administrative charges. The Board received a description of the methodology used by Broadridge to select the mutual funds included in an Expense Group.
Franklin International Growth Fund - The Expense Group for this Fund included the Fund and fourteen other international multi-cap growth funds. The Board noted that the Management Rate and actual total expense ratio for the Fund were above the medians of its Expense Group. The Board concluded that the Management Rate charged to the Fund is fair and reasonable. In doing so, the Board noted that the Fund’s actual total expense ratio reflected a fee waiver from management. The Board also noted that, effective December 1, 2016, the Fund’s Management Rate was reduced from 0.95% to 0.76% and the cap on the Fund’s total operating expenses was reduced from 1.19% to 1.00% for all share classes except Class R6, which was reduced from 1.01% to 0.82%.
Franklin International Small Cap Growth Fund - The Expense Group for this Fund included the Fund and nine other international small-/mid-cap growth funds. The Board noted that the Management Rate for the Fund was below the median of its Expense Group, but its actual total expense ratio was above the median of its Expense Group. The Board concluded that the Management Rate charged to the Fund is fair and reasonable. In doing so, the Board noted that the actual total expense ratio for the Fund was only 1.3 basis points above the median of its Expense Group. The Board also noted that FTI LLC, as sub-adviser to the Fund, is paid by FAI out of the management fee FAI receives from the Fund.
| | | | | | |
franklintempleton.com | | Annual Report | | | 59 | |
F R A N K L I N G L O B A L T R U S T
S H A R E H O L D E R I N F O R M A T I O N
Profitability
The Board reviewed and considered information regarding the profits realized by each Manager and its affiliates in connection with the operation of each Fund. In this respect, the Board considered the Fund profitability analysis provided by each Manager that addresses the overall profitability of FTI’s U.S. fund business, as well as its profits in providing investment management and other services to each of the individual funds during the 12-month period ended September 30, 2016, being the most recent fiscal year-end for FRI. The Board noted that although management continually makes refinements to its methodologies used in calculating profitability in response to organizational and product-related changes, the overall methodology has remained consistent with that used in the Funds’ profitability report presentations from prior years. Additionally, the Funds’ independent registered public accounting firm has been engaged by each Manager to periodically review the reasonableness of the allocation methodologies to be used solely by the Funds’ Board with respect to the profitability analysis.
The Board noted management’s belief that costs incurred in establishing the infrastructure necessary for the type of mutual fund operations conducted by each Manager and its affiliates may not be fully reflected in the expenses allocated to each Fund in determining its profitability, as well as the fact that the level of profits, to a certain extent, reflected operational cost savings and efficiencies initiated by management. The Board also noted management’s expenditures in improving shareholder services provided to the Funds, as well as the need to implement systems and meet additional regulatory and compliance requirements resulting from recent SEC and other regulatory requirements.
The Board also considered the extent to which each Manager and its affiliates might derive ancillary benefits from fund operations, including revenues generated from transfer agent services, potential benefits resulting from personnel and systems enhancements necessitated by fund growth, as well as increased leverage with service providers and counterparties. Based upon its consideration of all these factors, the Board concluded that the level of profits realized by each Manager and its affiliates from providing services to each Fund was not excessive in view of the nature, quality and extent of services provided to each Fund.
Economies of Scale
The Board reviewed and considered the extent to which each Manager may realize economies of scale, if any, as each Fund
grows larger and whether the Fund’s management fee structure reflects any economies of scale for the benefit of shareholders. With respect to possible economies of scale, the Board noted the existence of management fee breakpoints for the Franklin International Growth Fund, which operate generally to share any economies of scale with the Fund’s shareholders by reducing the Fund’s effective management fees as the Fund grows in size. The Board considered the Managers’ view that any analyses of potential economies of scale in managing a particular fund are inherently limited in light of the joint and common costs and investments the Managers incur across the Franklin Templeton family of funds as a whole. The Board concluded that to the extent economies of scale may be realized by a Manager and its affiliates, the Franklin International Growth Fund’s management fee structure provided a sharing of benefits with the Fund and its shareholders as the Fund grows. The Board noted that the Franklin International Small Cap Growth Fund had experienced a decrease in assets and would not be expected to demonstrate additional economies of scale in the near term.
Conclusion
Based on its review, consideration and evaluation of all factors it believed relevant, including the above-described factors and conclusions, the Board unanimously approved the continuation of each Management Agreement for an additional one-year period.
Proxy Voting Policies and Procedures
The Trust’s investment manager has established Proxy Voting Policies and Procedures (Policies) that the Trust uses to determine how to vote proxies relating to portfolio securities. Shareholders may view the Trust’s complete Policies online at franklintempleton.com. Alternatively, shareholders may request copies of the Policies free of charge by calling the Proxy Group collect at (954) 527-7678 or by sending a written request to: Franklin Templeton Companies, LLC, 300 S.E. 2nd Street, Fort Lauderdale, FL 33301, Attention: Proxy Group. Copies of the Trust’s proxy voting records are also made available online at franklintempleton.com and posted on the U.S. Securities and Exchange Commission’s website at sec.gov and reflect the most recent 12-month period ended June 30.
Quarterly Statement of Investments
The Trust files a complete statement of investments with the U.S. Securities and Exchange Commission for the first and third quarters for each fiscal year on Form N-Q. Shareholders may view the filed Form N-Q by visiting the Commission’s
| | | | |
60 | | Annual Report | | franklintempleton.com |
F R A N K L I N G L O B A L T R U S T
S H A R E H O L D E R I N F O R M A T I O N
website at sec.gov. The filed form may also be viewed and copied at the Commission’s Public Reference Room in Washington, DC. Information regarding the operations of the Public Reference Room may be obtained by calling (800) SEC-0330.
Householding of Reports and Prospectuses
You will receive each Fund’s financial reports every six months as well as an annual updated summary prospectus (prospectus available upon request). To reduce Fund expenses, we try to identify related shareholders in a household and send only one copy of the financial reports and summary prospectus. This process, called “householding,” will continue indefinitely unless you instruct us otherwise. If you prefer not to have these documents householded, please call us at (800) 632-2301. At any time you may view current prospectuses/summary prospectuses and financial reports on our website. If you choose, you may receive these documents through electronic delivery.
| | | | | | |
franklintempleton.com | | Annual Report | | | 61 | |
This page intentionally left blank.
This page intentionally left blank.
This page intentionally left blank.
| | |
| | Annual Report and Shareholder Letter Franklin Global Trust Investment Managers Franklin Advisers, Inc. Franklin Templeton Institutional, LLC Subadvisor Franklin Templeton Institutional, LLC Distributor Franklin Templeton Distributors, Inc. (800) DIAL BEN® / 342-5236 franklintempleton.com Shareholder Services (800) 632-2301 |
Authorized for distribution only when accompanied or preceded by a summary prospectus and/or prospectus. Investors should carefully consider a fund’s investment goals, risks, charges and expenses before investing. A prospectus contains this and other information; please read it carefully before investing.
To help ensure we provide you with quality service, all calls to and from our service areas are monitored and/or recorded.
| | |
| © 2017 Franklin Templeton Investments. All rights reserved. | | FGT3 A 09/17 |
| | | | |
| | | | Annual Report July 31, 2017 |
| | | |


Franklin Templeton Investments
Gain From Our Perspective®
At Franklin Templeton Investments, we’re dedicated to one goal: delivering exceptional asset management for our clients. By bringing together multiple, world-class investment teams in a single firm, we’re able to offer specialized expertise across styles and asset classes, all supported by the strength and resources of one of the world’s largest asset managers. This has helped us to become a trusted partner to individual and institutional investors across the globe.
Visit ftinstitutional.com for fund updates, to access your account, or to find investment insights.
| | | | | | | | |
Not FDIC Insured | | | | | May Lose Value | | | | | No Bank Guarantee |
| | | | |
| | | |
| ftinstitutional.com | | Not part of the annual report | | 1 |
Annual Report
Franklin Emerging Market Debt Opportunities Fund
We are pleased to bring you Franklin Emerging Market Debt Opportunities Fund’s annual report for the fiscal year ended July 31, 2017.
Your Fund’s Goal and Main Investments
The Fund seeks high total return through investing at least 80% of its net assets in debt securities of emerging market countries—mainly securities issued by sovereign and subsovereign government entities, but also including securities issued by corporate entities that are controlled by a sovereign entity, and corporate emerging markets debt.
Performance Overview
The Fund delivered a +9.40% cumulative total return for the 12 months under review. In comparison, the Fund’s first benchmark, the J.P. Morgan (JPM) Emerging Markets Bond Index (EMBI) Global Diversified Index, which tracks total returns for U.S. dollar-denominated debt instruments issued by emerging market sovereign and quasi-sovereign entities, generated a total return of +5.04%,1 and the Fund’s second benchmark, the JPM Government Bond Index-Emerging Markets (GBI-EM) Broad Diversified Index (US$ Unhedged), which tracks local currency bonds issued in emerging markets, produced a +8.04% total return.2 Also for comparison, the Fund’s third benchmark, the Bank of America Merrill Lynch (BofAML) Emerging Markets Corporate Plus Index (EMCB) (100% US$ Hedged), which tracks the performance of U.S. dollar-denominated and euro-denominated emerging market non-sovereign debt publicly issued within the major domestic and Eurobond markets, posted a +5.10% total return.1 You can find more of the Fund’s performance data in the Performance Summary beginning on page 6.
Performance data represent past performance, which does not guarantee future results. Investment return and principal value will fluctuate, and you may have a gain or loss when you sell your shares. Current performance may differ from figures shown. For most recent month-end performance, go to
Portfolio Composition*
Based on Total Net Assets as of 7/31/17
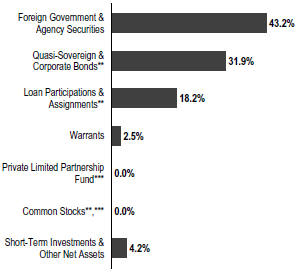
*Figures reflect certain derivatives held in the portfolio (or their underlying reference assets) and may not total 100% or may be negative due to rounding, use of derivatives, unsettled trades or other factors.
**Includes securities determined to have no value at 7/31/17.
***Rounds to less than 0.1%.
ftinstitutional.com or call a Franklin Templeton Institutional Services representative at (800) 321-8563.
Economic and Market Overview
At the beginning of the 12 months under review, emerging markets experienced moderate economic growth with low inflation. Commodity prices, especially oil, had recovered from their historic lows at the beginning of 2016, but traded within a relatively tight price range. The U.S. economy performed well, but the Federal Reserve (Fed) held off on raising interest rates after its first rate hike in a decade in December 2015. Investors’ search for yield continued to direct capital toward emerging-market (EM) assets, and central banks in emerging markets had room for further accommodation.
1. Source: Morningstar.
2. Source: J.P. Morgan.
The indexes are unmanaged and include reinvested interest. They do not reflect any fees, expenses or sales charges. One cannot invest directly in an index and an index is not representative of the Fund’s portfolio.
See www.franklintempletondatasources.com for additional data provider information.
The dollar value, number of shares or principal amount, and names of all portfolio holdings are listed in the Fund’s Consolidated Statement of Investments (SOI). The Consolidated SOI begins on page 11.
| | | | |
| | | |
| 2 | | Annual Report | | ftinstitutional.com |
FRANKLIN EMERGING MARKET DEBT OPPORTUNITIES FUND
In the fourth quarter of calendar year 2016, however, the U.S. presidential election took a surprise turn. U.S. Treasury yields had been rising gently, but Donald Trump’s promises to cut taxes and invest in infrastructure sent yields soaring after he won the U.S. presidency. U.S. 10-year Treasury yields, for example, rose from 1.78% in early November to as high as 2.60% in December.
In addition, Trump’s positions on international trade, immigration and border security raised the possibility of greater protectionism. EM asset prices duly adjusted, and volatility and risk aversion rose. EM currencies sold off, relative to the resurgent U.S. dollar, but recovered somewhat in December.
After President Trump’s inauguration, it became clear to us that not all his campaign promises would be realized right away. The U.S. administration’s focus on tax cuts and infrastructure spending quickly dissipated. Instead, other topics came to the fore, including an immigration ban, the appointment of a new Supreme Court justice and, later, an investigation into Russia’s influence on the presidential election.
Importantly, the U.S. administration softened its tone on international trade and took a more constructive stance, in particular toward China and Mexico. U.S. 10-year Treasury yields fell from a high of 2.63% in March back to 2.30% at the end of July.
Oil prices remained stable during the period, between US$45 and US$55 per barrel for most of the period. Wildfires in Canada, rebel activity in Nigeria and economic unrest in Venezuela reduced supply in early 2016. In late November, the Organization of Petroleum Exporting Countries (OPEC), put oil prices on a surer footing by agreeing to its first production cuts since 2008.
OPEC’s agreement was later joined by non-OPEC producers such as Russia, and was renewed in May 2017. Higher, more stable oil prices underpinned improved fundamentals in many EM economies and, notably, helped some EM currencies return to strength in 2017.
Country-specific issues continued to garner investors’ attention in 2017, particularly in Venezuela, where political turmoil continued to deepen, and in South Africa, which lost its investment-grade status.
However, EM growth prospects improved, trade among EM economies rose, risk spreads narrowed and yields declined. As a whole, the asset class has seen resilient inflows in 2017.
| | | | |
Geographic Composition* | | | | |
| 7/31/17 | | | |
| Country | | % of Total
Net Assets | |
| Ukraine | | | 6.2% | |
| Iraq | | | 5.8% | |
| South Africa | | | 5.4% | |
| Colombia | | | 5.4% | |
| Nigeria | | | 4.7% | |
| Brazil | | | 4.5% | |
| Turkey | | | 4.3% | |
| Uruguay | | | 3.7% | |
| Argentina | | | 3.6% | |
| Mexico | | | 3.6% | |
| Angola | | | 3.3% | |
| Russia | | | 3.2% | |
| Chad | | | 3.0% | |
| Georgia | | | 2.9% | |
| Azerbaijan | | | 2.8% | |
| El Salvador | | | 2.7% | |
| Venezuela | | | 2.4% | |
| Armenia | | | 2.3% | |
| Cameroon | | | 1.9% | |
| Tunisia | | | 1.9% | |
| Ethiopia | | | 1.8% | |
| Ghana | | | 1.8% | |
| Gabon | | | 1.7% | |
| Seychelles | | | 1.5% | |
| Kenya | | | 1.5% | |
| Bosnia & Herzegovina | | | 1.4% | |
| Kazakhstan | | | 1.3% | |
| Other | | | 12.6% | |
| Short-Term Investments & Other Net Assets | | | 2.8% | |
*Figures reflect certain derivatives held in the portfolio (or their underlying reference assets) and may not total 100% or may be negative due to rounding, use of derivatives, unsettled trades or other factors. May differ from the Consolidated SOI because percentages reflect the issuing country of the Fund’s long-term securities and include the effect of interest receivable balances.
Hard currency-denominated EM sovereign bonds returned +5.04% during the review period, as measured by the JPM EMBI Global Diversified Index.1 U.S. 10-year Treasury yields fell by 84 basis points (bps) during the period. The JPM EMBI Global Diversified Index’s spread over U.S. Treasuries, on a yield-to-worst basis, fell 65 bps. Local-currency sovereign EM bonds delivered a +8.04% return, as measured by the JPM GBI-EM Broad Diversified Index (US$ Unhedged), as local-currency yields fell and EM currencies mainly strengthened.2 U.S. dollar- and euro-denominated EM corporate bonds delivered a +5.10% return, as measured by the BofAML EMCB Index (100% US$ Hedged).1
| | | | |
| | | |
| ftinstitutional.com | | Annual Report | | 3 |
FRANKLIN EMERGING MARKET DEBT OPPORTUNITIES FUND
Investment Strategy
Our portfolio construction process can be summarized in three integral steps—country allocation, currency allocation and issue selection. The first stage of our emerging market debt investment process is identifying the countries for which we have a favorable outlook, which we manage with a bottom-up, research-driven perspective. Since the portfolio is constructed through bottom-up, fundamental research and not relative to a benchmark index, there is no requirement to hold issues from any one country. The next decision is whether to take exposure in the form of “hard currency” or local currency instruments. Hard currencies are typically currencies of economically and politically stable industrialized nations. The last decision concerns security selection. This depends on a number of factors, including the type of the issue’s coupon (fixed or floating).
Manager’s Discussion
During the 12 months under review, the Fund’s holding of local-currency Uruguayan debt was the main contributor to performance. Real yields in the Uruguayan peso fell significantly during the period, which boosted the long-dated bonds selected by the Fund. In addition, Uruguay issued its first international local-currency nominal bond in June 2017, aiming to become eligible for inclusion in JPM’s local-currency EM debt indexes. Uruguay’s government wants to increase foreign participation in the market for Uruguayan-peso bonds.
The Fund’s holding of Iraqi sovereign bonds, denominated in U.S. dollars, also contributed to returns. OPEC agreed at the end of November to cut output beginning in January 2017. Oil prices spiked to more than US$50 per barrel as a result. Iraq’s oil production, meanwhile, increased during the year, helped by its increased output of the cheaper Basrah Heavy oil grade. In addition, the country’s security situation improved to the point where focus could gradually return to its economy, helped by the International Monetary Fund’s ongoing support.
By contrast, the Fund’s position in Ghanaian U.S.-dollar bonds, held by way of special-purpose vehicle Sphynx Capital Markets, was a major detractor from returns. The notes’ original guarantor, Ghana’s National Investment Bank (NIB), defaulted on the notes in 2009. In March 2010, the trustee, on behalf of the note holders, sued NIB to enforce its guarantee of payment on the defaulted notes. In February 2013, Ghana’s High Court awarded the trustee the original face value of the notes (US$60 million) plus interest. NIB appealed, but the Ghanaian appellate court upheld the High Court’s judgment. NIB then appealed to Ghana’s Supreme Court. In June 2017, the Supreme Court ruled against the trustee. Given that further
| | | | |
Currency Composition* | | | | |
| 7/31/17 | | | |
| | | % of Total
Net Assets | |
| |
U.S. Dollar | | | 71.7% | |
| |
Uruguayan Peso | | | 3.7% | |
| |
Mexican Peso | | | 3.7% | |
| |
South Africa Rand | | | 3.4% | |
| |
Turkish Lira | | | 3.2% | |
| |
Colombian Peso | | | 3.2% | |
| |
Ghanaian Cedi | | | 2.5% | |
| |
Russian Ruble | | | 2.1% | |
| |
Kenyan Shilling | | | 1.6% | |
| |
Ugandan Shilling | | | 1.1% | |
| |
Georgian Lari | | | 1.0% | |
| |
Peruvian Nuevo Sol | | | 1.0% | |
| |
Indian Rupee | | | 0.6% | |
| |
Egyptian Pound | | | 0.5% | |
| |
Brazilian Real | | | 0.5% | |
| |
Azarbaijan Manat | | | 0.4% | |
| |
Japanese Yen** | | | 0.0% | |
| |
Euro | | | -0.2% | |
*Figures reflect certain derivatives held in the portfolio (or their underlying reference assets) and may not total 100% or may be negative due to rounding, use of derivatives, unsettled trades or other factors. Percentages may differ from the Consolidated SOI due to the underlying currency exposure on pass-through notes and currency forward contracts and include the effect of interest receivable balances.
**Rounds to less than 0.1%.
litigation options were limited and there appeared to be no market for the notes, their value was written down.
The Fund’s exposure to the weaker Turkish lira also weighed on performance. A failed military coup in July 2016 led to a crackdown by President Erdoğan’s government. This triggered a series of downward steps in the value of the currency, and Turkey’s economy fell into a recession in the second half of 2016, before returning to growth in the first quarter of 2017. Despite increasing inflation and rising interest rates across the U.S. and Europe, Turkey’s central bank was slow to tighten monetary policy. This stance undermined investors’ perceptions of the bank’s independence from Turkish politics, and further weakened the country’s currency. Meanwhile, the country’s security situation deteriorated as a result of multiple terrorist attacks, and political wrangling continued over a new constitution and over Kurdish representation in parliament. The
| | | | |
| | | |
| 4 | | Annual Report | | ftinstitutional.com |
FRANKLIN EMERGING MARKET DEBT OPPORTUNITIES FUND
lira only rebounded somewhat after President Erdoğan won a referendum in April, which lowered the likelihood of early elections.
| | | | |
| Top 10 Holdings* | | | |
| 7/31/17 | | | |
| |
Issue Sector, Country | | % of Total
Net Assets | |
| Government of Uruguay | | | 3.7% | |
Foreign Government and Agency Securities, Uruguay | | | | |
| Government of South Africa | | | 3.4% | |
Foreign Government and Agency Securities, South Africa | | | | |
Development Bank of South Africa (Government of Angola) | | | 3.3% | |
Loan Participations and Assignments, Angola | | | | |
| Government of Iraq** | | | 3.2% | |
Foreign Government and Agency Securities, Iraq | | | | |
| Government of Turkey | | | 3.2% | |
Foreign Government and Agency Securities, Turkey | | | | |
| Societe des Hydrocarbures du Tchad | | | 3.0% | |
Loan Participations and Assignments, Chad | | | | |
| Government of El Salvador | | | 2.7% | |
Foreign Government and Agency Securities, El Salvador | | | | |
| Government of Venezuela*** | | | 2.4% | |
Foreign Government and Agency Securities, Venezuela | | | | |
| Fidelity Bank PLC | | | 2.3% | |
Quasi-Sovereign and Corporate Bonds, Nigeria | | | | |
SSB No. 1 PLC (OJSC State Savings Bank of Ukraine) | | | 2.3% | |
Loan Participations and Assignments, Ukraine | | | | |
*May differ from the Consolidated SOI because percentages include the effect of interest receivable balances.
**Includes loan participations and assignments.
***Includes warrants.
As of period-end, the Fund had exposure to 41 emerging markets and one supranational. The largest single country exposure was to Ukraine (6.2% of total net assets), followed by Iraq (5.8%) and South Africa (5.4%). Long-term securities denominated in G7 currencies constituted 71.6% of total net assets, with 66.4% denominated in the U.S. dollar, 3.9% in the Japanese yen and 1.3% in the euro. At the end of the review period, the Fund’s exposures to the euro and the Japanese yen were fully hedged back into the U.S. dollar. Additionally,
27.7% of total net assets were denominated in 15 local currencies, of which the largest currency exposure was to the Uruguayan peso, at 3.7% of total net assets.
We thank you for your confidence in Franklin Emerging Market Debt Opportunities Fund and hope to serve your investment needs at the highest level of expectations.
| | |
 | |  |
| | William Ledward Portfolio Manager and Research Analyst of Franklin Templeton Investment Management Limited (FTIML) |
| |
 | |  |
| | Nicholas Hardingham, CFA Portfolio Manager and Research Analyst of FTIML |
| |
| | Stephanie Ouwendijk, CFA Portfolio Manager and Research Analyst of FTIML Portfolio Management Team |
The foregoing information reflects our analysis, opinions and portfolio holdings as of July 31, 2017, the end of the reporting period. The way we implement our main investment strategies and the resulting portfolio holdings may change depending on factors such as market and economic conditions. These opinions may not be relied upon as investment advice or an offer for a particular security. The information is not a complete analysis of every aspect of any market, country, industry, security or the Fund. Statements of fact are from sources considered reliable, but the investment manager makes no representation or warranty as to their completeness or accuracy. Although historical performance is no guarantee of future results, these insights may help you understand our investment management philosophy.
| | | | |
| | | |
| ftinstitutional.com | | Annual Report | | 5 |
FRANKLIN EMERGING MARKET DEBT OPPORTUNITIES FUND
Performance Summary as of July 31, 2017
The performance table and graph do not reflect any taxes that a shareholder would pay on Fund dividends, capital gain distributions, if any, or any realized gains on the sale of Fund shares. Total return reflects reinvestment of the Fund’s dividends and capital gain distributions, if any, and any unrealized gains or losses. Your dividend income will vary depending on dividends or interest paid by securities in the Fund’s portfolio, adjusted for operating expenses. Capital gain distributions are net profits realized from the sale of portfolio securities.
Performance as of 7/31/171
| | | | | | | | |
| | | Cumulative
Total Return2 | | | Average Annual
Total Return3 | |
1-Year | | | +9.40% | | | | +9.40% | |
5-Year | | | +26.66% | | | | +4.84% | |
10-Year | | | +88.59% | | | | +6.55% | |
Performance data represent past performance, which does not guarantee future results. Investment return and principal value will fluctuate, and you may have a gain or loss when you sell your shares. Current performance may differ from figures shown. For most recent month-end performance, go to ftinstitutional.com or call a Franklin Templeton Institutional Services representative at (800) 321-8563.
See page 8 for Performance Summary footnotes.
| | | | |
| | | |
| 6 | | Annual Report | | ftinstitutional.com |
FRANKLIN EMERGING MARKET DEBT OPPORTUNITIES FUND
PERFORMANCE SUMMARY
Total Return Index Comparison for a Hypothetical $50,000 Investment1
Total return represents the change in value of an investment over the periods shown. It includes any applicable maximum sales charge, Fund expenses, account fees and reinvested distributions. The unmanaged indexes include reinvestment of any income or distributions. They differ from the Fund in composition and do not pay management fees or expenses. One cannot invest directly in an index.
8/1/07–7/31/17
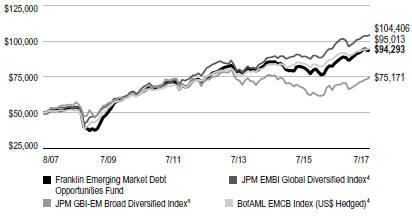
See page 8 for Performance Summary footnotes.
| | | | |
| | | |
| ftinstitutional.com | | Annual Report | | 7 |
FRANKLIN EMERGING MARKET DEBT OPPORTUNITIES FUND
PERFORMANCE SUMMARY
Distributions (8/1/16–7/31/17)
| | | | | | | | |
Short-Term Capital Gain | | Long-Term
Capital Gain | | | Total | |
$0.0228 | | | $0.0526 | | | | $0.0754 | |
Total Annual Operating Expenses6 | | | | | |
| | | With Waiver | | | Without Waiver | |
| | | | 1.01% | | | | 1.09% | |
All investments involve risks, including possible loss of principal. Special risks are associated with foreign investing including currency volatility, economic instability, and social and political developments of countries where the Fund invests. Investments in emerging markets involve heightened risks related to the same factors, in addition to those associated with these markets’ smaller size, lesser liquidity and lack of established legal, political, business and social frameworks to support securities markets. The risks associated with higher yielding, lower rated securities include higher risk of default and loss of principal. In addition, interest rate movements will affect the Fund’s share price and yield. Prices of debt securities generally move in the opposite direction of interest rates. Thus, as prices of debt securities in the Fund adjust to a rise in interest rates, the Fund’s share price may decline. The Fund is actively managed but there is no guarantee that the manager’s investment decisions will produce the desired results. The Fund’s prospectus also includes a description of the main investment risks.
1. The Fund has an expense reduction, a waiver related to the management fee paid by a Fund subsidiary and a fee waiver associated with any investments it makes in a Franklin Templeton money fund and/or other Franklin Templeton fund, contractually guaranteed through 11/30/17. Fund investment results reflect the expense reduction and fee waiver; without these reductions, the results would have been lower.
2. Cumulative total return represents the change in value of an investment over the periods indicated.
3. Average annual total return represents the average annual change in value of an investment over the periods indicated. Return for less than one year, if any, has not been annualized.
4. Source: Morningstar: The JPM EMBI Global Diversified Index is a uniquely weighted version of the JPM EMBI Global Index, which tracks total returns for U.S. dollar-denominated debt instruments issued by emerging market sovereign and quasi-sovereign entities: Brady bonds, loans and Eurobonds. The index includes all countries except those that have been classified by the World Bank as high income for the past two consecutive years. The diversified index limits the weights of those index countries with larger debt stocks by only including specified portions of these countries’ eligible current face amounts of debt outstanding. The BofAML EMCB Index (100% US$ Hedged) tracks the performance of U.S. dollar-denominated and euro-denominated emerging market non-sovereign debt publicly issued within the major domestic and Eurobond markets.
5. Source: J.P. Morgan. The JPM GBI-EM Broad Diversified Index tracks local currency bonds issued by emerging markets. Weightings among countries are more evenly distributed within the index than in the global diversified index.
6. Figures are as stated in the Fund’s current prospectus and may differ from the expense ratios disclosed in the Your Fund’s Expenses and Consolidated Financial Highlights sections in this report. In periods of market volatility, assets may decline significantly, causing total annual Fund operating expenses to become higher than the figures shown.
See www.franklintempletondatasources.com for additional data provider information.
| | | | |
| | | |
| 8 | | Annual Report | | ftinstitutional.com |
FRANKLIN EMERGING MARKET DEBT OPPORTUNITIES FUND
Your Fund’s Expenses
As a Fund shareholder, you can incur two types of costs: (1) transaction costs, including sales charges (loads) on Fund purchases and redemptions, if applicable; and (2) ongoing Fund costs, including management fees, distribution and service (12b-1) fees, if applicable, and other Fund expenses. All mutual funds have ongoing costs, sometimes referred to as operating expenses. The table below shows ongoing costs of investing in the Fund and can help you understand these costs and compare them with those of other mutual funds. The table assumes a $1,000 investment held for the six months indicated.
Actual Fund Expenses
The table below provides information about actual account values and actual expenses in the columns under the heading “Actual.” In these columns the Fund’s actual return, which includes the effect of Fund expenses, is used to calculate the “Ending Account Value.” You can estimate the expenses you paid during the period by following these steps (of course, your account value and expenses will differ from those in this illustration): Divide your account value by $1,000 (if your account had an $8,600 value, then $8,600 ÷ $1,000 = 8.6). Then multiply the result by the number in the row for your class of shares under the headings “Actual” and “Expenses Paid During Period” (if Actual Expenses Paid During Period were $7.50, then 8.6 x $7.50 = $64.50). In this illustration, the actual expenses paid this period are $64.50.
Hypothetical Example for Comparison with Other Funds
Under the heading “Hypothetical” in the table, information is provided about hypothetical account values and hypothetical expenses based on the Fund’s actual expense ratio and an assumed rate of return of 5% per year before expenses, which is not the Fund’s actual return. This information may not be used to estimate the actual ending account balance or expenses you paid for the period, but it can help you compare ongoing costs of investing in the Fund with those of other funds. To do so, compare this 5% hypothetical example for the class of shares you hold with the 5% hypothetical examples that appear in the shareholder reports of other funds.
Please note that expenses shown in the table are meant to highlight ongoing costs and do not reflect any transactional costs. Therefore, information under the heading “Hypothetical” is useful in comparing ongoing costs only, and will not help you compare total costs of owning different funds. In addition, if transactional costs were included, your total costs would have been higher.
| | | | | | | | | | |
| | | Actual (actual return after expenses) | | Hypothetical (5% annual return before expenses) | | |
| | | | | | |
| | | | | Fund-Level | | | | Fund-Level | | |
| | | | | Expenses | | | | Expenses | | Net |
| Beginning | | Ending | | Paid During | | Ending | | Paid During | | Annualized |
| Account | | Account | | Period | | Account | | Period | | Expense |
| Value 2/1/17 | | Value 7/31/17 | | 2/1/17–7/31/171,2 | | Value 7/31/17 | | 2/1/17–7/31/171,2 | | Ratio2 |
| | | | | | |
$1,000 | | $1,052.20 | | $5.09 | | $1,019.84 | | $5.01 | | 1.00% |
1. Expenses are equal to the annualized expense ratio for the six-month period as indicated above—in the far right column—multiplied by the simple average account value over the period indicated, and then multiplied by 181/365 to reflect the one-half year period.
2. Reflects expenses after fee waivers and expense reimbursements. Does not include acquired fund fees and expenses.
| | | | |
| | | |
| ftinstitutional.com | | Annual Report | | 9 |
FRANKLIN GLOBAL TRUST
Consolidated Financial Highlights
Franklin Emerging Market Debt Opportunities Fund
| | | | | | | | | | | | | | | | | | | | |
| | | Year Ended July 31, | |
| | | | |
| | | 2017 | | | 2016 | | | 2015 | | | 2014 | | | 2013 | |
| |
| | | | | |
Per share operating performance (for a share outstanding throughout the year) | | | | | | | | | | | | | | | | | | | | |
Net asset value, beginning of year | | | $10.76 | | | | $10.72 | | | | $12.35 | | | | $12.06 | | | | $12.33 | |
| | | | |
| | | | | |
Income from investment operationsa: | | | | | | | | | | | | | | | | | | | | |
Net investment incomeb | | | 0.83 | | | | 0.89 | | | | 0.87 | | | | 0.87 | | | | 0.83 | |
Net realized and unrealized gains (losses) | | | 0.17 | | | | (0.26) | | | | (1.53) | | | | 0.04 | | | | (0.04) | |
| | | | |
Total from investment operations | | | 1.00 | | | | 0.63 | | | | (0.66) | | | | 0.91 | | | | 0.79 | |
| | | | |
Less distributions from: | | | | | | | | | | | | | | | | | | | | |
Net investment income | | | — | | | | (0.59) | | | | (0.91) | | | | (0.58) | | | | (0.89) | |
Net realized gains | | | (0.08) | | | | — | | | | (0.06) | | | | (0.04) | | | | (0.17) | |
| | | | |
Total distributions | | | (0.08) | | | | (0.59) | | | | (0.97) | | | | (0.62) | | | | (1.06) | |
| | | | |
Net asset value, end of year | | | $11.68 | | | | $10.76 | | | | $10.72 | | | | $12.35 | | | | $12.06 | |
| | | | |
| | | | | |
Total return | | | 9.40% | | | | 6.41% | | | | (5.16)% | | | | 7.82% | | | | 6.40% | |
| | | | | |
| Ratios to average net assets | | | | | | | | | | | | | | | | | | | | |
Expenses before waiver and payments by affiliates | | | 1.07% | | | | 1.06% | | | | 1.05% | | | | 1.10% | | | | 1.07% | |
Expenses net of waiver and payments by affiliatesc | | | 1.00% | | | | 1.00% | | | | 1.00% | | | | 1.00% | | | | 1.00% | |
Net investment income | | | 7.43% | | | | 8.70% | | | | 7.78% | | | | 7.29% | | | | 6.63% | |
| | | | | |
| Supplemental data | | | | | | | | | | | | | | | | | | | | |
Net assets, end of year (000’s) | | $ | 514,406 | | | $ | 552,835 | | | $ | 713,575 | | | $ | 630,597 | | | $ | 568,794 | |
Portfolio turnover rate | | | 29.45% | | | | 21.61% | | | | 17.56% | | | | 29.70% | | | | 30.95% | |
aThe amount shown for a share outstanding throughout the period may not correlate with the Consolidated Statement of Operations for the period due to the timing of sales and repurchases of the Fund’s shares in relation to income earned and/or fluctuating fair value of the investments of the Fund.
bBased on average daily shares outstanding.
cBenefit of expense reduction rounds to less than 0.01%.
| | | | |
| 10 | | Annual Report | The accompanying notes are an integral part of these consolidated financial statements. | | ftinstitutional.com |
FRANKLIN GLOBAL TRUST
Consolidated Statement of Investments, July 31, 2017
Franklin Emerging Market Debt Opportunities Fund
| | | | | | | | | | | | | | |
| | | | | Country/ | | | | | | | | |
| | | | | Organization | | Warrants | | | | | Value | |
| |
| | Warrants 2.5% | | | | | | | | | | | | |
a,b | | Central Bank of Nigeria, Reg S, wts., 11/15/20 | | Nigeria | | | 64,000 | | | | | $ | 4,944,000 | |
b,c,d | | Government of Ukraine, Reg S, VRI, GDP Linked Security, 5/31/40 | | Ukraine | | | 7,700,000 | | | | | | 3,399,550 | |
a,c | | Government of Venezuela, Oil Value Recovery wts., 4/15/20 | | Venezuela | | | 925,920 | | | | | | 4,398,120 | |
| | | | | | | | | | | | | | |
| | Total Warrants (Cost $31,791,416) | | | | | | | | | | | 12,741,670 | |
| | | | | | | | | | | | | | |
| | | | | |
| | | | | | | Principal | | | | | | |
| | | | | | | Amount* | | | | | | |
| | | | | | | | | | | | | | |
| | Quasi-Sovereign and Corporate Bonds 31.9% | | | | | | | | | | | | |
| | Banks 6.4% | | | | | | | | | | | | |
e | | Astana Finance JSC, secured note, 144A, zero cpn., 12/22/24 | | Kazakhstan | | | 136,566 | | | | | | 1,366 | |
f | | Bank of Georgia JSC, senior note, 144A, 11.00%, 6/01/20 | | Georgia | | | 12,300,000 | | | GEL | | | 5,176,591 | |
f | | BGEO Group JSC, senior note, 144A, 6.00%, 7/26/23 | | Georgia | | | 3,000,000 | | | | | | 3,067,500 | |
f | | Fidelity Bank PLC, senior note, 144A, 6.875%, 5/09/18 | | Nigeria | | | 12,100,000 | | | | | | 11,786,852 | |
b,g | | International Bank of Azerbaijan OJSC, senior note, Reg S, 5.625%, 6/11/19 | | Azerbaijan | | | 10,500,000 | | | | | | 8,625,750 | |
f | | National Savings Bank, senior note, 144A, 8.875%, 9/18/18 | | Sri Lanka | | | 4,000,000 | | | | | | 4,234,340 | |
e,g,h | | Sphynx Capital Markets PCC (National Investment Bank of Ghana), PTN, Reg S, zero cpn., 2/05/09 | | Ghana | | | 8,000,000 | | | | | | — | |
| | | | | | | | | | | | | | |
| | | | | | | | | | | | | 32,892,399 | |
| | | | | | | | | | | | | | |
| | Building Products 1.9% | | | | | | | | | | | | |
f | | St. Marys Cement Inc., senior bond, 144A, 5.75%, 1/28/27 | | Brazil | | | 4,600,000 | | | | | | 4,704,604 | |
f | | Tecnoglass Inc., senior note, 144A, 8.20%, 1/31/22 | | Colombia | | | 5,000,000 | | | | | | 5,268,750 | |
| | | | | | | | | | | | | | |
| | | | | | | | | | | | | 9,973,354 | |
| | | | | | | | | | | | | | |
| | Commercial Services & Supplies 1.0% | | | | | | | | | | | | |
b | | Red de Carreteras de Occidente Sapib de CV, senior secured bond, Reg S, 9.00%, 6/10/28 | | Mexico | | | 90,000,000 | | | MXN | | | 4,976,753 | |
| | | | | | | | | | | | | | |
| | Diversified Financial Services 3.8% | | | | | | | | | | | | |
f | | Fideicomiso PA Costera, | | | | | | | | | | | | |
| | senior bond, 144A, 6.75%, 1/15/34 | | Colombia | | | 2,000,000 | | | | | | 2,110,000 | |
| | isenior secured bond, B, 144A, Index Linked, 6.25%, 1/15/34. | | Colombia | | | 10,351,394,176 | | | COP | | | 3,631,345 | |
f | | O1 Properties Finance PLC, senior note, 144A, 8.25%, 9/27/21 | | Russia | | | 5,400,000 | | | | | | 5,386,500 | |
f | | Rio Oil Finance Trust, senior secured bond, 144A, 9.25%, 7/06/24 | | Brazil | | | 8,036,284 | | | | | | 8,279,261 | |
| | | | | | | | | | | | | | |
| | | | | | | | | | | | | 19,407,106 | |
| | | | | | | | | | | | | | |
| | Diversified Telecommunication Services 3.3% | | | | | | | | | | | | |
b | | Empresa de Telecommunicaciones de Bogota SA, senior note, Reg S, 7.00%, 1/17/23 | | Colombia | | | 27,200,000,000 | | | COP | | | 7,302,901 | |
f | | MTN (Mauritius) Investments Ltd., 144A, 4.755%, 11/11/24 | | South Africa | | | 7,500,000 | | | | | | 7,243,800 | |
b,g | | Oi SA, senior note, Reg S, 9.75%, 9/15/16 | | Brazil | | | 26,100,000 | | | BRL | | | 2,405,318 | |
| | | | | | | | | | | | | | |
| | | | | | | | | | | | | 16,952,019 | |
| | | | | | | | | | | | | | |
| | Food & Staples Retailing 1.5% | | | | | | | | | | | | |
f | | JBS Investments GmbH, senior note, 144A, 7.25%, 4/03/24 | | Brazil | | | 7,900,000 | | | | | | 7,692,388 | |
| | | | | | | | | | | | | | |
| | Gas Utilities 1.1% | | | | | | | | | | | | |
f | | Southern Gas Corridor CJSC, senior note, 144A, 6.875%, 3/24/26 | | Azerbaijan | | | 4,900,000 | | | | | | 5,403,377 | |
| | | | | | | | | | | | | | |
| | Industrial Conglomerates 1.0% | | | | | | | | | | | | |
f | | Yasar Holdings SA, senior note, 144A, 8.875%, 5/06/20 | | Turkey | | | 5,000,000 | | | | | | 5,235,325 | |
| | | | | | | | | | | | | | |
| | | | |
| | | |
| ftinstitutional.com | | Annual Report | | 11 |
FRANKLIN GLOBAL TRUST
CONSOLIDATED STATEMENT OF INVESTMENTS
Franklin Emerging Market Debt Opportunities Fund (continued)
| | | | | | | | | | | | | | |
| | | | | Country/ | | Principal | | | | | | |
| | | | | Organization | | Amount* | | | | | Value | |
| |
| | Quasi-Sovereign and Corporate Bonds (continued) | | | | | | | | | | | | |
| | Metals & Mining 2.0% | | | | | | | | | | | | |
f | | Ferrexpo Finance PLC, senior note, 144A, 10.375%, 4/07/19 | | Ukraine | | | 8,000,000 | | | | | $ | 8,488,600 | |
f | | Petra Diamonds U.S. Treasury PLC, secured note, second lien, 144A, 7.25%, 5/01/22 | | South Africa | | | 1,900,000 | | | | | | 1,946,721 | |
| | | | | | | | | | | | | | |
| | | | | | | | | | | | | 10,435,321 | |
| | | | | | | | | | | | | | |
| | Multiline Retail 0.2% | | | | | | | | | | | | |
f,j | | K2016470219 South Africa Ltd., senior secured note, 144A, PIK, 3.00%, 12/31/22 | | South Africa | | | 4,172,938 | | | | | | 187,314 | |
f,j | | K2016740260 South Africa Ltd., senior secured note, 144A, PIK, 25.00%, 12/31/22 | | South Africa | | | 656,942 | | | | | | 592,052 | |
| | | | | | | | | | | | | | |
| | | | | | | | | | | | | 779,366 | |
| | | | | | | | | | | | | | |
| | Municipal Bonds 4.6% | | | | | | | | | | | | |
b | | Bogota Distrito Capital, senior bond, Reg S, 9.75%, 7/26/28 | | Colombia | | | 14,600,000,000 | | | COP | | | 5,268,473 | |
| | Province of Salta Argentina, | | | | | | | | | | | | |
| | f senior secured note, 144A, 9.50%, 3/16/22 | | Argentina | | | 2,515,500 | | | | | | 2,726,676 | |
| | b senior secured note, Reg S, 9.50%, 3/16/22 | | Argentina | | | 1,852,526 | | | | | | 2,008,046 | |
f | | Provincia de Neuquen Argentina, senior secured bond, 144A, 8.625%, 5/12/28 | | Argentina | | | 9,913,000 | | | | | | 10,986,974 | |
f | | Provincia de Tierra Del Fuego Argentina, senior secured bond, 144A, 8.95%, 4/17/27 | | Argentina | | | 2,600,000 | | | | | | 2,784,600 | |
| | | | | | | | | | | | | | |
| | | | | | | | | | | | | 23,774,769 | |
| | | | | | | | | | | | | | |
| | Oil, Gas & Consumable Fuels 2.1% | | | | | | | | | | | | |
f | | Georgian Oil and Gas Corp JSC, senior note, 144A, 6.75%, 4/26/21 | | Georgia | | | 6,000,000 | | | | | | 6,329,940 | |
| | Petroleum Co. of Trinidad and Tobago Ltd., | | | | | | | | | | | | |
| | f senior bond, 144A, 6.00%, 5/08/22 | | Trinidad and Tobago | | | 3,375,000 | | | | | | 3,341,250 | |
| | b senior bond, Reg S, 6.00%, 5/08/22 | | Trinidad and Tobago | | | 1,083,334 | | | | | | 1,072,500 | |
| | | | | | | | | | | | | | |
| | | | | | | | | | | | | 10,743,690 | |
| | | | | | | | | | | | | | |
| | Road & Rail 1.3% | | | | | | | | | | | | |
f | | Kazakhstan Temir Zholy Finance BV, senior bond, 144A, 6.95%, 7/10/42 | | Kazakhstan | | | 6,250,000 | | | | | | 6,758,375 | |
| | | | | | | | | | | | | | |
| | Textiles, Apparel & Luxury Goods 1.0% | | | | | | | | | | | | |
f | | Golden Legacy PT Ltd., senior note, 144A, 8.25%, 6/07/21 | | Indonesia | | | 5,000,000 | | | | | | 5,379,450 | |
| | | | | | | | | | | | | | |
| | Wireless Telecommunication Services 0.7% | | | | | | | | | | | | |
f | | Millicom International Cellular SA, senior note, 144A, 6.625%, 10/15/21 | | Colombia | | | 3,536,000 | | | | | | 3,680,693 | |
| | | | | | | | | | | | | | |
| | Total Quasi-Sovereign and Corporate Bonds (Cost $182,530,493) | | | | | | | | | | | 164,084,385 | |
| | | | | | | | | | | | | | |
k | | Loan Participations and Assignments 18.2% | | | | | | | | | | | | |
b,g | | Credit Suisse First Boston International, (City of Kyiv), secured bond, Reg S, 8.00%, 11/06/15 | | Ukraine | | | 11,975,000 | | | | | | 8,083,125 | |
e | | Deutsche Bank AG (Government of Iraq), 2.571%, 1/01/28 | | Iraq | | | 873,490,163 | | | JPY | | | 5,583,557 | |
e,l | | Development Bank of South Africa Ltd. (Government of Angola), | | | | | | | | | | | | |
| | Tranche 2, senior note, FRN, 7.683%, 12/20/23 | | Angola | | | 9,668,750 | | | | | | 8,792,418 | |
| | Tranche 3B, senior note, FRN, 7.683%, 12/20/23 | | Angola | | | 9,100,000 | | | | | | 8,275,217 | |
| | | | |
| | | |
| 12 | | Annual Report | | ftinstitutional.com |
FRANKLIN GLOBAL TRUST
CONSOLIDATED STATEMENT OF INVESTMENTS
Franklin Emerging Market Debt Opportunities Fund (continued)
| | | | | | | | | | | | | | |
| | | | | Country/ Organization | | Principal
Amount* | | | | | Value | |
| |
k | | Loan Participations and Assignments (continued) | | Armenia | | | 6,620,000 | | | | | $ | 6,586,900 | |
f | | Dilijan Finance B.V., (Ardshinbank CJSC), senior note, 144A, 12.00%, 7/29/20 | | | | | | | | | | | | |
e,l | | Ethiopian Railway Corp. (Republic of Ethiopia), FRN, 5.10%, 8/02/21 | | Ethiopia | | | 9,300,000 | | | | | | 8,890,246 | |
b | | FBN Finance Co. BV, (First Bank of Nigeria Ltd.), sub. note, Reg S, 8.00% to 7/23/19, FRN thereafter, 7/23/21 | | Nigeria | | | 7,800,000 | | | | | | 7,195,188 | |
a,e,j,m | | Global Distressed Alpha Fund III LP, PIK, 12.00%, Perpetual | | United States | | | 469,434 | | | | | | 469,434 | |
e,l | | Government of Iraq, Tranche A3, Sumitomo Corp. Loan, FRN, 0.688%, 1/01/28 | | Iraq | | | 260,174,434 | | | JPY | | | 1,705,178 | |
e,l | | Merrill Lynch & Co. Inc. (Government of Iraq), FRN, 0.688%, 1/01/28 | | Iraq | | | 455,321,020 | | | JPY | | | 2,984,165 | |
e,g | | NK Debt Corp., | | North Korea | | | 4,250,000 | | | DEM | | | — | |
| | 144A, zero cpn., 3/12/20 | | | | | | | | | | | | |
| | Reg S, zero cpn., 3/12/20 | | North Korea | | | 2,000,000 | | | CHF | | | — | |
| | Reg S, zero cpn., 3/12/20 | | North Korea | | | 18,000,000 | | | DEM | | | — | |
f | | Oilflow SPV 1 DAC (Kurdistan Regional Government), secured note, 144A, 12.00%, 1/13/22 | | Iraq | | | 7,600,000 | | | | | | 8,018,000 | |
e,l | | Societe des Hydrocarbures du Tchad, Tranche 4, FRN, 8.324%, 12/30/22 | | Chad | | | 16,478,377 | | | | | | 15,489,674 | |
f | | SSB No. 1 PLC (OJSC State Savings Bank of Ukraine), senior note, 144A, 9.625%, 3/20/25 | | Ukraine | | | 11,000,000 | | | | | | 11,538,340 | |
| | | | | | | | | | | | | | |
| | Total Loan Participations and Assignments
(Cost $99,350,246) | | | | | | | | | | | 93,611,442 | |
| | | | | | | | | | | | | | |
| | | | | |
| | Foreign Government and Agency Securities 43.2% | | | | | | | | | | | | |
| | Banque Centrale de Tunisie International Bond, | | | | | | | | | | | | |
| | senior bond, 4.30%, 8/02/30 | | Tunisia | | | 610,000,000 | | | JPY | | | 4,466,678 | |
| | senior bond, 4.20%, 3/17/31 | | Tunisia | | | 680,000,000 | | | JPY | | | 4,979,124 | |
f | | Government of Armenia, 144A, 7.15%, 3/26/25 | | Armenia | | | 4,500,000 | | | | | | 4,961,250 | |
l | | Government of Bosnia & Herzegovina, | | | | | | | | | | | | |
| | FRN, 0.50%, 12/11/17 | | Bosnia and Herzegovina | | | 350,000 | | | DEM | | | 210,898 | |
| | b senior bond, B, Reg S, FRN, 0.50%, 12/11/21 | | Bosnia and Herzegovina | | | 13,178,250 | | | DEM | | | 6,796,691 | |
f | | Government of Cameroon, senior note, 144A, 9.50%, 11/19/25 | | Cameroon | | | 8,200,000 | | | | | | 9,652,958 | |
| | Government of Egypt, 16.75%, 9/06/19 | | Egypt | | | 47,500,000 | | | EGP | | | 2,526,260 | |
b | | Government of El Salvador, senior bond, Reg S, 7.65%, 6/15/35 | | El Salvador | | | 14,800,000 | | | | | | 13,833,782 | |
f | | Government of Gabon, 144A, 6.95%, 6/16/25 | | Gabon | | | 8,700,000 | | | | | | 8,686,602 | |
| | Government of Ghana, | | | | | | | | | | | | |
| | 23.00%, 8/21/17 | | Ghana | | | 12,450,000 | | | GHS | | | 2,836,464 | |
| | 24.75%, 7/19/21 | | Ghana | | | 9,180,000 | | | GHS | | | 2,441,918 | |
| | senior note, 18.25%, 7/25/22 | | Ghana | | | 15,250,000 | | | GHS | | | 3,465,913 | |
f | | Government of Grenada, senior bond, 144A, 7.00%, 5/12/30 | | Grenada | | | 10,400,254 | | | | | | 6,500,159 | |
b | | Government of Iraq, Reg S, 5.80%, 1/15/28 | | Iraq | | | 12,600,000 | | | | | | 11,584,944 | |
| | Government of Jamaica, senior bond, 7.875%, 7/28/45 | | Jamaica | | | 5,000,000 | | | | | | 5,964,625 | |
f | | Government of Jordan, senior bond, 144A, 6.125%, 1/29/26 | | Jordan | | | 2,300,000 | | | | | | 2,369,966 | |
| | Government of Mexico, senior note, M, 5.00%, 12/11/19 | | Mexico | | | 2,041,000 | n | | MXN | | | 11,028,538 | |
| | Government of Russia, 7.50%, 3/15/18 | | Russia | | | 637,000,000 | | | RUB | | | 10,640,644 | |
b | | Government of Seychelles, senior bond, Reg S, 7.00% to 1/01/18, 8.00% thereafter, 1/01/26 | | Seychelles | | | 7,650,000 | | | | | | 7,948,656 | |
| | Government of South Africa, 7.00%, 2/28/31 | | South Africa | | | 270,000,000 | | | ZAR | | | 16,950,868 | |
| | Government of Turkey, 8.70%, 7/11/18 | | Turkey | | | 59,500,000 | | | TRY | | | 16,506,162 | |
| | | | |
| | | |
| ftinstitutional.com | | Annual Report | | 13 |
FRANKLIN GLOBAL TRUST
CONSOLIDATED STATEMENT OF INVESTMENTS
Franklin Emerging Market Debt Opportunities Fund (continued)
| | | | | | | | | | | | | | |
| | | | | Country/ | | Principal | | | | | | |
| | | | | Organization | | Amount* | | | | | Value | |
| |
| | Foreign Government and Agency Securities | | | | | | | | | | | | |
| | (continued) | | | | | | | | | | | | |
| | Government of Uganda, | | | | | | | | | | | | |
| | 10.75%, 2/22/18 | | Uganda | | | 2,200,000,000 | | | UGX | | $ | 601,039 | |
| | 16.125%, 3/22/18 | | Uganda | | | 4,420,000,000 | | | UGX | | | 1,244,377 | |
| | 14.625%, 11/01/18 | | Uganda | | | 1,294,800,000 | | | UGX | | | 365,065 | |
| | 13.75%, 6/13/19 | | Uganda | | | 10,750,000,000 | | | UGX | | | 3,027,881 | |
i | | Government of Uruguay, senior bond, Index Linked, 3.70%, 6/26/37 | | Uruguay | | | 496,890,655 | | | UYU | | | 19,003,281 | |
b | | Government of Venezuela, | | | | | | | | | | | | |
| | Reg S, 6.00%, 12/09/20 | | Venezuela | | | 5,400,000 | | | | | | 2,146,365 | |
| | senior bond, Reg S, 7.65%, 4/21/25 | | Venezuela | | | 13,500,000 | | | | | | 5,231,250 | |
| | International Finance Corp., | | | | | | | | | | | | |
| | senior note, 6.45%, 10/30/18 | | Supranationalo | | | 200,000,000 | | | INR | | | 3,153,038 | |
| | senior note, 10.25%, 12/05/18 | | Supranationalo | | | 3,407,800 | | | AZN | | | 1,991,020 | |
| | Kenya Infrastructure Bond, | | | | | | | | | | | | |
| | 11.00%, 9/15/25 | | Kenya | | | 806,900,000 | | | KES | | | 7,470,848 | |
| | senior note, 12.50%, 5/12/25 | | Kenya | | | 13,000,000 | | | KES | | | 126,581 | |
b | | Mestenio Ltd., secured note, Reg S, 8.50%, 1/02/20 | | Dominican Republic | | | 1,600,000 | | | | | | 1,704,000 | |
i | | Mexican Udibonos, Index Linked, 4.50%, 12/04/25 | | Mexico | | | 383,323 | p | | MXN | | | 2,372,116 | |
f,g | | Mozambique International Bond, senior note, 144A, 10.50%, 1/18/23 | | Mozambique | | | 8,664,000 | | | | | | 6,649,620 | |
f | | Peruvian Government International Bond, senior bond, 144A, 6.35%, 8/12/28 | | Peru | | | 15,600,000 | | | PEN | | | 5,115,852 | |
f | | Republic of Belarus International Bond, senior note, 144A, 6.875%, 2/28/23 | | Belarus | | | 4,800,000 | | | | | | 5,112,000 | |
f | | Republic of Suriname, senior note, 144A, 9.25%, 10/26/26 | | Suriname | | | 2,500,000 | | | | | | 2,552,979 | |
| | | | | | | | | | | | | | |
| | Total Foreign Government and Agency Securities (Cost $228,576,993) | | | | | | | | | | | 222,220,412 | |
| | | | | | | | | | | | | | |
| | | | | |
| | | | | | | Shares | | | | | | |
| | | | | | | | | | | | | | |
| | Common Stocks 0.0%† | | | | | | | | | | | | |
c,e | | Astana Finance JSC, GDR, 144A | | Kazakhstan | | | 193,625 | | | | | | — | |
c,e | | Holdco 2, A | | South Africa | | | 55,882,058 | | | | | | 42,396 | |
c,e | | Holdco 2, B | | South Africa | | | 5,561,052 | | | | | | 4,219 | |
| | | | | | | | | | | | | | |
| | Total Common Stocks (Cost $433,379) | | | | | | | | | | | 46,615 | |
| | | | | | | | | | | | | | |
| | | | | |
| | | | | | | Units | | | | | | |
| | | | | | | | | | | | | | |
| | Private Limited Partnership Fund (Cost $4,600,000) 0.0%† | | | | | | | | | | | | |
| | Diversified Financial Services 0.0%† | | | | | | | | | | | | |
a,c,e,q | | Global Distressed Alpha Fund III LP | | United States | | | 4,424,861 | | | | | | 313,302 | |
| | | | | | | | | | | | | | |
| | Total Investments before Short Term Investments (Cost $547,282,527) | | | | | | | | | | | 493,017,826 | |
| | | | | | | | | | | | | | |
| | | | |
| | | |
| 14 | | Annual Report | | ftinstitutional.com |
FRANKLIN GLOBAL TRUST
CONSOLIDATED STATEMENT OF INVESTMENTS
Franklin Emerging Market Debt Opportunities Fund (continued)
| | | | | | | | | | | | | | |
| | | | | Country/ | | | | | | | | |
| | | | | Organization | | Shares | | | | | Value | |
| |
| | Short Term Investments (Cost $11,026,616) 2.2% | | | | | | | | | | | | |
| | Money Market Funds 2.2% | | | | | | | | | | | | |
r,s | | Institutional Fiduciary Trust Money Market Portfolio, 0.63% | | United States | | | 11,026,616 | | | | | $ | 11,026,616 | |
| | | | | | | | | | | | | | |
| | Total Investments (Cost $558,309,143) 98.0% | | | | | | | | | | | 504,044,442 | |
| | Other Assets, less Liabilities 2.0% | | | | | | | | | | | 10,361,590 | |
| | | | | | | | | | | | | | |
| | Net Assets 100.0%. | | | | | | | | | | $ | 514,406,032 | |
| | | | | | | | | | | | | | |
†Rounds to less than 0.1% of net assets.
*The principal amount is stated in U.S. dollars unless otherwise indicated.
aThe security is owned by Alternative Strategies (FT) Ltd., a wholly-owned subsidiary of the Fund. See Note 1(e).
bSecurity was purchased pursuant to Regulation S under the Securities Act of 1933, which exempts from registration securities offered and sold outside of the United States. Such a security cannot be sold in the United States without either an effective registration statement filed pursuant to the Securities Act of 1933, or pursuant to an exemption from registration. These securities have been deemed liquid under guidelines approved by the Trust’s Board of Trustees. At July 31, 2017, the aggregate value of these securities was $104,527,292, representing 20.3% of net assets.
cNon-income producing.
dThe principal represents the notional amount. See Note 1(c) regarding value recovery instruments.
eSee Note 9 regarding restricted securities.
fSecurity was purchased pursuant to Rule 144A under the Securities Act of 1933 and may be sold in transactions exempt from registration only to qualified institutional buyers or in a public offering registered under the Securities Act of 1933. These securities have been deemed liquid under guidelines approved by the Trust’s Board of Trustees. At July 31, 2017, the aggregate value of these securities was $210,167,904, representing 40.9% of net assets.
gSee Note 7 regarding defaulted securities.
hRepresents claims that have been filed with a Ghanaian court against National Investment Bank of Ghana.
iPrincipal amount of security is adjusted for inflation. See Note 1(g).
jIncome may be received in additional securities and/or cash.
kSee Note 1(d) regarding loan participations and assignments.
lThe coupon rate shown represents the rate at period end.
mPerpetual security with no stated maturity date.
nPrincipal amount is stated in 100 Mexican Peso Units.
oA supranational organization is an entity formed by two or more central governments through international treaties.
pPrincipal amount is stated in Unidad de Inversion Units.
qThe Global Distressed Alpha Fund III LP is a fund focused on the purchase of and the recovery on private distressed commercial, sovereign and sovereign-related debt claims around the world, principally in Africa and Asia.
rSee Note 3(d) regarding investments in affiliated management investment companies.
sThe rate shown is the annualized seven-day yield at period end.
| | | | |
| | | |
| ftinstitutional.com | | Annual Report | | 15 |
FRANKLIN GLOBAL TRUST
CONSOLIDATED STATEMENT OF INVESTMENTS
Franklin Emerging Market Debt Opportunities Fund (continued)
At July 31, 2017, the Fund had the following forward exchange contracts outstanding. See Note 1(c).
Forward Exchange Contracts
| | | | | | | | | | | | | | | | | | | | | | | | | | | | |
| Currency | | Counterpartya
| | | Type | | | Quantity | | | Contract
Amount | | | Settlement
Date | | | Unrealized
Appreciation | | | Unrealized
Depreciation | |
| | | | | | | |
| OTC Forward Exchange Contracts | | | | | | | | | | | | | | | | | | | | | | | | | | | | |
Euro | | | CITI | | | | Sell | | | | 2,700,000 | | | $ | 3,034,400 | | | | 9/19/17 | | | $ | — | | | $ | (169,259 | ) |
Euro | | | MSCO | | | | Sell | | | | 2,000,000 | | | | 2,248,020 | | | | 9/19/17 | | | | — | | | | (125,061 | ) |
Euro | | | RBCCM | | | | Sell | | | | 2,000,000 | | | | 2,247,198 | | | | 9/19/17 | | | | — | | | | (125,884 | ) |
Japanese Yen | | | CITI | | | | Sell | | | | 820,000,000 | | | | 7,511,772 | | | | 9/19/17 | | | | 59,364 | | | | — | |
Japanese Yen | | | MSCO | | | | Sell | | | | 700,000,000 | | | | 6,413,725 | | | | 9/19/17 | | | | 51,913 | | | | — | |
Japanese Yen | | | RBCCM | | | | Sell | | | | 700,000,000 | | | | 6,416,132 | | | | 9/19/17 | | | | 54,320 | | | | — | |
Total Forward Exchange Contracts | | | | | | | | | | | | | | | | | | | | | | $ | 165,597 | | | $ | (420,204 | ) |
Net unrealized appreciation (depreciation) | | | | | | | | | | | | | | | | | | | | | | | $ | (254,607 | ) |
aMay be comprised of multiple contracts with the same counterparty, currency and settlement date.
See Abbreviations on page 32.
| | | | |
| | | |
| 16 | | Annual Report | The accompanying notes are an integral part of these consolidated financial statements. | | ftinstitutional.com |
FRANKLIN GLOBAL TRUST
Consolidated Financial Statements
Consolidated Statement of Assets and Liabilities
July 31, 2017
Franklin Emerging Market Debt Opportunities Fund
| | | | |
Assets: | | | | |
Investments in securities: | | | | |
Cost - Unaffiliated issuers | | $ | 547,282,527 | |
Cost - Non-controlled affiliates (Note 3d) | | | 11,026,616 | |
Total cost of investments | | $ | 558,309,143 | |
Value - Unaffiliated issuers | | $ | 493,017,826 | |
Value - Non-controlled affiliates (Note 3d) | | | 11,026,616 | |
Total value of investments | | | 504,044,442 | |
Cash | | | 2,929,121 | |
Foreign currency, at value (cost $4,599,260) | | | 4,597,119 | |
Receivables: | | | | |
Capital shares sold | | | 44,612 | |
Interest | | | 7,152,406 | |
Unrealized appreciation on OTC forward exchange contracts | | | 165,597 | |
Other assets | | | 323 | |
Total assets | | | 518,933,620 | |
Liabilities: | | | | |
Payables: | | | | |
Investment securities purchased | | | 3,473,452 | |
Capital shares redeemed | | | 115,585 | |
Management fees | | | 360,821 | |
Transfer agent fees | | | 2,304 | |
Unrealized depreciation on OTC forward exchange contracts | | | 420,204 | |
Deferred tax | | | 44,610 | |
Accrued expenses and other liabilities | | | 110,612 | |
Total liabilities | | | 4,527,588 | |
Net assets, at value | | $ | 514,406,032 | |
Net assets consist of: | | | | |
Paid-in capital | | $ | 566,374,582 | |
Undistributed net investment income | | | 2,759,171 | |
Net unrealized appreciation (depreciation) | | | (54,564,019 | ) |
Accumulated net realized gain (loss) | | | (163,702 | ) |
Net assets, at value | | $ | 514,406,032 | |
Shares outstanding | | | 44,024,293 | |
Net asset value and maximum offering price per share | | $ | 11.68 | |
| | | | | | |
| | | |
| ftinstitutional.com | | The accompanying notes are an integral part of these consolidated financial statements. | Annual Report | | | 17 | |
FRANKLIN GLOBAL TRUST
CONSOLIDATED FINANCIAL STATEMENTS
Consolidated Statement of Operations
for the year ended July 31, 2017
Franklin Emerging Market Debt Opportunities Fund
| | | | |
Investment income: | | | | |
Dividends: | | | | |
Unaffiliated issuers | | $ | 1,920,000 | |
Non-controlled affiliates (Note 3d) | | | 27,995 | |
Interest (net of foreign taxes of $211,344) | | | 41,832,249 | |
Total investment income | | | 43,780,244 | |
Expenses: | | | | |
Management fees (Note 3a) | | | 5,179,059 | |
Transfer agent fees (Note 3c) | | | 25,563 | |
Custodian fees (Note 4) | | | 119,459 | |
Reports to shareholders | | | 12,310 | |
Registration and filing fees | | | 33,876 | |
Professional fees | | | 135,015 | |
Trustees’ fees and expenses | | | 19,683 | |
Other | | | 22,103 | |
Total expenses | | | 5,547,068 | |
Expense reductions (Note 4) | | | (3,554 | ) |
Expenses waived/paid by affiliates (Note 3d and 3e) | | | (348,609 | ) |
Net expenses | | | 5,194,905 | |
Net investment income | | | 38,585,339 | |
Realized and unrealized gains (losses): | | | | |
Net realized gain (loss) from: | | | | |
Investments | | | (13,788,444 | ) |
Foreign currency transactions | | | (1,649,131 | ) |
Net realized gain (loss) | | | (15,437,575 | ) |
Net change in unrealized appreciation (depreciation) on: | | | | |
Investments | | | 21,520,225 | |
Translation of other assets and liabilities denominated in foreign currencies | | | 1,938,497 | |
Change in deferred taxes on unrealized appreciation | | | (38,414 | ) |
Net change in unrealized appreciation (depreciation) | | | 23,420,308 | |
Net realized and unrealized gain (loss) | | | 7,982,733 | |
Net increase (decrease) in net assets resulting from operations | | $ | 46,568,072 | |
| | | | |
| | | |
| 18 | | Annual Report | The accompanying notes are an integral part of these consolidated financial statements. | | ftinstitutional.com |
FRANKLIN GLOBAL TRUST
CONSOLIDATED FINANCIAL STATEMENTS
Consolidated Statements of Changes in Net Assets
Franklin Emerging Market Debt Opportunities Fund
| | | | | | | | |
| | | Year Ended July 31, | |
| | |
| | | 2017 | | | 2016 | |
Increase (decrease) in net assets: | | | | | | | | |
Operations: | | | | | | | | |
Net investment income | | $ | 38,585,339 | | | $ | 51,310,295 | |
Net realized gain (loss) | | | (15,437,575 | ) | | | (31,156,241 | ) |
Net change in unrealized appreciation (depreciation) | | | 23,420,308 | | | | 2,002,903 | |
Net increase (decrease) in net assets resulting from operations | | | 46,568,072 | | | | 22,156,957 | |
Distributions to shareholders from: | | | | | | | | |
Net investment income | | | — | | | | (36,997,804 | ) |
Net realized gains | | | (3,393,271 | ) | | | — | |
Total distributions to shareholders | | | (3,393,271 | ) | | | (36,997,804 | ) |
Capital share transactions (Note 2) | | | (81,603,355 | ) | | | (145,899,867 | ) |
Net increase (decrease) in net assets | | | (38,428,554 | ) | | | (160,740,714 | ) |
Net assets: | | | | | | | | |
Beginning of year | | | 552,834,586 | | | | 713,575,300 | |
End of year | | $ | 514,406,032 | | | $ | 552,834,586 | |
Undistributed net investment income included in net assets: | | | | | | | | |
End of year | | $ | 2,759,171 | | | $ | — | |
Distributions in excess of net investment income included in net assets: | | | | | | | | |
End of year | | $ | — | | | $ | (15,113,345 | ) |
| | | | | | |
| | | |
| ftinstitutional.com | | The accompanying notes are an integral part of these consolidated financial statements. | Annual Report | | | 19 | |
FRANKLIN GLOBAL TRUST
CONSOLIDATED FINANCIAL STATEMENTS
Consolidated Statement of Cash Flows
for the year ended July 31, 2017
Franklin Emerging Market Debt Opportunities Fund
| | | | |
Cash flow from operating activities: | | | | |
Dividends, interest and other income received | | $ | 37,944,228 | |
Operating expenses paid | | | (5,230,486 | ) |
Purchases of long-term investments | | | (142,639,702 | ) |
Cash on deposit with brokers | | | 1,680,000 | |
Realized loss on foreign currency transactions | | | (1,649,131 | ) |
Sales and maturities of long-term investments | | | 183,024,140 | |
Net sales of short-term investments | | | 7,910,808 | |
| | | | |
Cash provided - operating activities | | | 81,039,857 | |
| | | | |
Cash flow from financing activities: | | | | |
Proceeds from shares sold | | | 96,718,889 | |
Payment of shares redeemed | | | (171,411,589 | ) |
Cash distributions to shareholders | | | (135,970 | ) |
| | | | |
Cash used - financing activities | | | (74,828,670 | ) |
| | | | |
Net increase (decrease) in cash | | | 6,211,187 | |
Cash and foreign currency at beginning of year | | | 1,317,194 | |
Effect of exchange rate changes on foreign currency | | | (2,141 | ) |
| | | | |
Cash and foreign currency at end of year | | $ | 7,526,240 | |
| | | | |
| |
| Reconciliation of Net Increase (Decrease) in Net Assets resulting from Operating Activities to Net Cash Provided by Operating Activities | | | | |
for the year ended July 31, 2017 | | | | |
| |
Net increase (decrease) in net assets resulting from operating activities | | $ | 46,568,072 | |
Adjustments to reconcile net increase (decrease) in net assets resulting from operating activities to net cash provided by operating activities: | | | | |
Net amortization income | | | (6,526,032 | ) |
Reinvested dividends from non-controlled affiliates | | | (27,995 | ) |
Interest received in the form of securities | | | (196,246 | ) |
Decrease in dividends and interest receivable and other assets | | | 1,110,503 | |
Decrease in payable to affiliates, accrued expenses, and other liabilities | | | (35,581 | ) |
Increase in payable for investments purchased | | | 3,481,364 | |
Decrease in cost of investments | | | 58,406,080 | |
Decrease in unrealized depreciation on investments | | | (23,420,308 | ) |
Decrease in cash on deposit with broker | | | 1,680,000 | |
| | | | |
Net cash provided by operating activities | | $ | 81,039,857 | |
| | | | |
Non cash financing activities - reinvestment of dividends | | $ | 3,257,301 | |
| | | | |
| | | | |
| | | |
| 20 | | Annual Report | The accompanying notes are an integral part of these consolidated financial statements. | | ftinstitutional.com |
FRANKLIN GLOBAL TRUST
Notes to Consolidated Financial Statements
Franklin Emerging Market Debt Opportunities Fund
1. Organization and Significant Accounting Policies
Franklin Global Trust (Trust) is registered under the Investment Company Act of 1940 (1940 Act) as an open-end management investment company, consisting of five separate funds and applies the specialized accounting and reporting guidance in U.S. Generally Accepted Accounting Principles (U.S. GAAP). Franklin Emerging Market Debt Opportunities Fund (Fund) is included in this report.
The following summarizes the Fund’s significant accounting policies.
a. Financial Instrument Valuation
The Fund’s investments in financial instruments are carried at fair value daily. Fair value is the price that would be received to sell an asset or paid to transfer a liability in an orderly transaction between market participants on the measurement date. The Fund calculates the net asset value (NAV) per share as of 4 p.m. Eastern time each day the New York Stock Exchange (NYSE) is open for trading. Under compliance policies and procedures approved by the Trust’s Board of Trustees (the Board), the Fund’s administrator has responsibility for oversight of valuation, including leading the cross-functional Valuation Committee (VC). The VC provides administration and oversight of the Fund’s valuation policies and procedures, which are approved annually by the Board. Among other things, these procedures allow the Fund to utilize independent pricing services, quotations from securities and financial instrument dealers, and other market sources to determine fair value.
Equity securities listed on an exchange or on the NASDAQ National Market System are valued at the last quoted sale price or the official closing price of the day, respectively. Foreign equity securities are valued as of the close of trading on the foreign stock exchange on which the security is primarily traded, or as of 4 p.m. Eastern time. The value is then converted into its U.S. dollar equivalent at the foreign exchange rate in effect at 4 p.m. Eastern time on the day that the value of the security is determined. Over-the-counter (OTC) securities are valued within the range of the most recent quoted bid and ask prices. Securities that trade in multiple markets or on multiple exchanges are valued according to the broadest and most representative market. Certain equity securities are valued based upon fundamental characteristics or relationships to similar securities.
Debt securities generally trade in the OTC market rather than on a securities exchange. The Fund’s pricing services use multiple valuation techniques to determine fair value. In instances where sufficient market activity exists, the pricing services may utilize a market-based approach through which quotes from market makers are used to determine fair value. In instances where sufficient market activity may not exist or is limited, the pricing services also utilize proprietary valuation models which may consider market characteristics such as benchmark yield curves, credit spreads, estimated default rates, anticipated market interest rate volatility, coupon rates, anticipated timing of principal repayments, underlying collateral, and other unique security features in order to estimate the relevant cash flows, which are then discounted to calculate the fair value. Securities denominated in a foreign currency are converted into their U.S. dollar equivalent at the foreign exchange rate in effect at 4 p.m. Eastern time on the date that the values of the foreign debt securities are determined.
Investments in open-end mutual funds are valued at the closing NAV.
Certain derivative financial instruments trade in the OTC market. The Fund’s pricing services use various techniques including industry standard option pricing models and proprietary discounted cash flow models to determine the fair value of those instruments. The Fund’s net benefit or obligation under the derivative contract, as measured by the fair value of the contract, is included in net assets.
The Fund has procedures to determine the fair value of financial instruments for which market prices are not reliable or readily available. Under these procedures, the VC convenes on a regular basis to review such financial instruments and considers a number of factors, including significant unobservable valuation inputs, when arriving at fair value. The VC primarily employs a market-based approach which may use related or comparable assets or liabilities, recent transactions, market multiples, book values, and other relevant information for the investment to determine the fair value of the investment. An income-based valuation approach may also be used in which the anticipated future cash flows of the investment are discounted to calculate fair value. Discounts may also be applied due to the nature or duration of any restrictions on the disposition of the investments. Due to the inherent uncertainty of valuations of such investments, the fair values may differ significantly from the values that would have been used had an active market existed. The VC employs various methods for calibrating these
| | | | |
| | | |
| ftinstitutional.com | | Annual Report | | 21 |
FRANKLIN GLOBAL TRUST
NOTES TO CONSOLIDATED FINANCIAL STATEMENTS
Franklin Emerging Market Debt Opportunities Fund (continued)
1. Organization and Significant Accounting Policies (continued)
a. Financial Instrument Valuation (continued)
valuation approaches including a regular review of key inputs and assumptions, transactional back-testing or disposition analysis, and reviews of any related market activity.
Trading in securities on foreign securities stock exchanges and OTC markets may be completed before 4 p.m. Eastern time. In addition, trading in certain foreign markets may not take place on every Fund’s business day. Occasionally, events occur between the time at which trading in a foreign security is completed and 4 p.m. Eastern time that might call into question the reliability of the value of a portfolio security held by the Fund. As a result, differences may arise between the value of the Fund’s portfolio securities as determined at the foreign market close and the latest indications of value at 4 p.m. Eastern time. In order to minimize the potential for these differences, the VC monitors price movements following the close of trading in foreign stock markets through a series of country specific market proxies (such as baskets of American Depositary Receipts, futures contracts and exchange traded funds). These price movements are measured against established trigger thresholds for each specific market proxy to assist in determining if an event has occurred that may call into question the reliability of the values of the foreign securities held by the Fund. If such an event occurs, the securities may be valued using fair value procedures, which may include the use of independent pricing services.
When the last day of the reporting period is a non-business day, certain foreign markets may be open on those days that the Fund’s NAV is not calculated, which could result in differences between the value of the Fund’s portfolio securities on the last business day and the last calendar day of the reporting period. Any significant security valuation changes due to an open foreign market are adjusted and reflected by the Fund for financial reporting purposes.
b. Foreign Currency Translation
Portfolio securities and other assets and liabilities denominated in foreign currencies are translated into U.S. dollars based on the exchange rate of such currencies against U.S. dollars on the date of valuation. The Fund may enter into foreign currency exchange contracts to facilitate transactions denominated in a foreign currency. Purchases and sales of securities, income and
expense items denominated in foreign currencies are translated into U.S. dollars at the exchange rate in effect on the transaction date. Portfolio securities and assets and liabilities denominated in foreign currencies contain risks that those currencies will decline in value relative to the U.S. dollar. Occasionally, events may impact the availability or reliability of foreign exchange rates used to convert the U.S. dollar equivalent value. If such an event occurs, the foreign exchange rate will be valued at fair value using procedures established and approved by the Board.
The Fund does not separately report the effect of changes in foreign exchange rates from changes in market prices on securities held. Such changes are included in net realized and unrealized gain or loss from investments in the Consolidated Statement of Operations.
Realized foreign exchange gains or losses arise from sales of foreign currencies, currency gains or losses realized between the trade and settlement dates on securities transactions and the difference between the recorded amounts of dividends, interest, and foreign withholding taxes and the U.S. dollar equivalent of the amounts actually received or paid. Net unrealized foreign exchange gains and losses arise from changes in foreign exchange rates on foreign denominated assets and liabilities other than investments in securities held at the end of the reporting period.
c. Derivative Financial Instruments
The Fund invested in derivative financial instruments in order to manage risk or gain exposure to various other investments or markets. Derivatives are financial contracts based on an underlying or notional amount, require no initial investment or an initial net investment that is smaller than would normally be required to have a similar response to changes in market factors, and require or permit net settlement. Derivatives contain various risks including the potential inability of the counterparty to fulfill their obligations under the terms of the contract, the potential for an illiquid secondary market, and/or the potential for market movements which expose the Fund to gains or losses in excess of the amounts shown in the Consolidated Statement of Assets and Liabilities. Realized gain and loss and unrealized appreciation and depreciation on these contracts for the period are included in the Consolidated Statement of Operations.
Derivative counterparty credit risk is managed through a formal evaluation of the creditworthiness of all potential counter-parties. The Fund attempts to reduce its exposure to
| | | | |
| | | |
| 22 | | Annual Report | | ftinstitutional.com |
FRANKLIN GLOBAL TRUST
NOTES TO CONSOLIDATED FINANCIAL STATEMENTS
Franklin Emerging Market Debt Opportunities Fund (continued)
counterparty credit risk on OTC derivatives, whenever possible, by entering into International Swaps and Derivatives Association (ISDA) master agreements with certain counterparties. These agreements contain various provisions, including but not limited to collateral requirements, events of default, or early termination. Termination events applicable to the counterparty include certain deteriorations in the credit quality of the counterparty. Termination events applicable to the Fund include failure of the Fund to maintain certain net asset levels and/or limit the decline in net assets over various periods of time. In the event of default or early termination, the ISDA master agreement gives the non-defaulting party the right to net and close-out all transactions traded, whether or not arising under the ISDA agreement, to one net amount payable by one counterparty to the other. However, absent an event of default or early termination, OTC derivative assets and liabilities are presented gross and not offset in the Consolidated Statement of Assets and Liabilities. Early termination by the counterparty may result in an immediate payment by the Fund of any net liability owed to that counterparty under the ISDA agreement. At July 31, 2017, the Fund had OTC derivatives in a net liability position of $183,043.
Collateral requirements differ by type of derivative. Collateral terms are contract specific for OTC derivatives. For OTC derivatives traded under an ISDA master agreement, posting of collateral is required by either the fund or the applicable counterparty if the total net exposure of all OTC derivatives with the applicable counterparty exceeds the minimum transfer amount, which typically ranges from $100,000 to $250,000, and can vary depending on the counterparty and the type of the agreement. Generally, collateral is determined at the close of Fund business each day and any additional collateral required due to changes in derivative values may be delivered by the Fund or the counterparty the next business day, or within a few business days. Collateral pledged and/or received by the Fund, if any, is held in segregated accounts with the Fund’s custodian/counterparty broker and can be in the form of cash and/or securities. Unrestricted cash may be invested according to the Fund’s investment objectives. To the extent that the amounts due to the Fund from its counterparties are not subject to collateralization or are not fully collateralized, the Fund bears the risk of loss from counterparty non-performance.
The Fund entered into OTC forward exchange contracts primarily to manage and/or gain exposure to certain foreign currencies. A forward exchange contract is an agreement between the Fund and a counterparty to buy or sell a foreign currency at a specific exchange rate on a future date.
The Fund invests in value recovery instruments (VRI) primarily to gain exposure to growth risk. Periodic payments from VRI are dependent on established benchmarks for underlying variables. VRI has a notional amount, which is used to calculate amounts of payments to holders. Payments are recorded upon receipt as realized gains in the Consolidated Statement of Operations. The risks of investing in VRI include growth risk, liquidity, and the potential loss of investment.
See Note 10 regarding other derivative information.
d. Loan Participations and Assignments
The Fund may invest in debt instruments which are interests in amounts owed to lenders or lending syndicates by corporate, governmental, or other borrowers. The Fund’s investments in loans may be in the form of participations in loans or assignments of all or portion of loans from third parties. A loan is often administered by a bank or other financial institution (the lender”) that acts as agent for all holders. The agent administers the terms of the loan, as specified in the loan agreement. The Fund may invest in multiple series or tranches of a loan, which may have varying terms and carry different associated risks. When investing in a loan participation, a Fund has the right to receive payments of principal, interest and any fees only from the lender selling the loan and only upon receipt of payments from the borrower. The Fund generally has no right to enforce compliance with the terms of the loan agreement with the borrower. As a result, the Fund may be subject to credit risk of both the borrower and the lender that is selling the loan. When the Fund purchases assignments from lenders it acquires direct rights against the borrower of the loan.
e. Investments in Alternative Strategies (FT) Ltd. (FT Subsidiary)
The Fund invests in certain financial instruments, warrants or commodities through its investments in the FT Subsidiary. The FT Subsidiary is a Cayman Islands exempted company with limited liability, is a wholly-owned subsidiary of the Fund, and is able to invest in certain financial instruments consistent with the investment objective of the Fund. At July 31, 2017, the FT Subsidiary’s investments as well as any other assets and
| | | | |
| | | |
| ftinstitutional.com | | Annual Report | | 23 |
FRANKLIN GLOBAL TRUST
NOTES TO CONSOLIDATED FINANCIAL STATEMENTS
Franklin Emerging Market Debt Opportunities Fund (continued)
1. Organization and Significant Accounting Policies (continued)
e. Investments in Alternative Strategies (FT) Ltd. (FT Subsidiary) (continued)
liabilities of the FT Subsidiary are reflected in the Fund’s Consolidated Statement of Investments and Consolidated Statement of Assets and Liabilities. The financial statements have been consolidated and include the accounts of the Fund and the FT Subsidiary. All intercompany transactions and balances have been eliminated. At July 31, 2017, the net assets of the FT Subsidiary were $12,793,458, representing 2.5% of the Fund’s consolidated net assets. The Fund’s investment in the FT Subsidiary is limited to 25% of consolidated assets.
f. Income and Deferred Taxes
It is the Fund’s policy to qualify as a regulated investment company under the Internal Revenue Code. The Fund intends to distribute to shareholders substantially all of its taxable income and net realized gains to relieve it from federal income and excise taxes. As a result, no provision for U.S. federal income taxes is required.
The Fund may be subject to foreign taxation related to income received, capital gains on the sale of securities and certain foreign currency transactions in the foreign jurisdictions in which it invests. Foreign taxes, if any, are recorded based on the tax regulations and rates that exist in the foreign markets in which the Fund invests. When a capital gain tax is determined to apply, the Fund records an estimated deferred tax liability in an amount that would be payable if the securities were disposed of on the valuation date.
The Fund may recognize an income tax liability related to its uncertain tax positions under U.S. GAAP when the uncertain tax position has a less than 50% probability that it will be sustained upon examination by the tax authorities based on its technical merits. As of July 31, 2017, the Fund has determined that no tax liability is required in its financial statements related to uncertain tax positions for any open tax years (or expected to be taken in future tax years). Open tax years are those that remain subject to examination and are based on the statute of limitations in each jurisdiction in which the Fund invests.
g. Security Transactions, Investment Income, Expenses and Distributions
Security transactions are accounted for on trade date. Realized gains and losses on security transactions are determined on a specific identification basis. Interest income and estimated expenses are accrued daily. Amortization of premium and accretion of discount on debt securities are included in interest income. Dividend income is recorded on the ex-dividend date except for certain dividends from securities where the dividend rate is not available. In such cases, the dividend is recorded as soon as the information is received by the Fund. Distributions to shareholders are recorded on the ex-dividend date. Distributable earnings are determined according to income tax regulations (tax basis) and may differ from earnings recorded in accordance with U.S. GAAP. These differences may be permanent or temporary. Permanent differences are reclassified among capital accounts to reflect their tax character. These reclassifications have no impact on net assets or the results of operations. Temporary differences are not reclassified, as they may reverse in subsequent periods.
Common expenses incurred by the Trust are allocated among the funds based on the ratio of net assets of each fund to the combined net assets of the Trust. Fund specific expenses are charged directly to the fund that incurred the expense.
Inflation-indexed bonds are adjusted for inflation through periodic increases or decreases in the security’s interest accruals, face amount, or principal redemption value, by amounts corresponding to the rate of inflation as measured by an index. Any increase or decrease in the face amount or principal redemption value will be included as interest income in the Consolidated Statement of Operations.
h. Accounting Estimates
The preparation of financial statements in accordance with U.S. GAAP requires management to make estimates and assumptions that affect the reported amounts of assets and liabilities at the date of the financial statements and the amounts of income and expenses during the reporting period. Actual results could differ from those estimates.
i. Guarantees and Indemnifications
Under the Trust’s organizational documents, its officers and trustees are indemnified by the Trust against certain liabilities arising out of the performance of their duties to the Trust. Additionally, in the normal course of business, the Trust, on
| | | | |
| | | |
| 24 | | Annual Report | | ftinstitutional.com |
FRANKLIN GLOBAL TRUST
NOTES TO CONSOLIDATED FINANCIAL STATEMENTS
Franklin Emerging Market Debt Opportunities Fund (continued)
behalf of the Fund, enters into contracts with service providers that contain general indemnification clauses. The Trust’s maximum exposure under these arrangements is unknown as
this would involve future claims that may be made against the Trust that have not yet occurred. Currently, the Trust expects the risk of loss to be remote.
2. Shares of Beneficial Interest
At July 31, 2017, there were an unlimited number of shares authorized (without par value). Transactions in the Fund’s shares were as follows:
| | | | | | | | | | | | | | | | |
| | | Year Ended July 31, | |
| | | 2017 | | | 2016 | |
| | | Shares | | | Amount | | | Shares | | | Amount | |
Shares sold | | | 7,726,411 | | | $ | 86,256,255 | | | | 5,756,631 | | | $ | 59,886,896 | |
Shares issued in reinvestment of distributions | | | 299,660 | | | | 3,257,301 | | | | 3,650,364 | | | | 35,810,070 | |
Shares redeemed | | | (15,380,317 | ) | | | (171,116,911 | ) | | | (24,573,528 | ) | | | (241,596,833 | ) |
Net increase (decrease) | | | (7,354,246 | ) | | $ | (81,603,355 | ) | | | (15,166,533 | ) | | $ | (145,899,867 | ) |
3. Transactions with Affiliates
Franklin Resources, Inc. is the holding company for various subsidiaries that together are referred to as Franklin Templeton Investments. Certain officers and trustees of the Trust are also officers and/or directors of the following subsidiaries:
| | |
| Subsidiary | | Affiliation |
Franklin Templeton Investment Management Limited (FTIML) | | Investment manager |
Franklin Templeton Services, LLC (FT Services) | | Administrative manager |
Franklin Templeton Investor Services, LLC (Investor Services) | | Transfer agent |
a. Management Fees
The Fund and FT Subsidiary pay an investment management fee to FTIML based on the average daily net assets of each of the Fund and FT Subsidiary as follows:
| | |
| Annualized Fee Rate | | Net Assets |
1.000% | | Up to and including $500 million |
0.900% | | Over $500 million, up to and including $1 billion |
0.850% | | In excess of $1 billion |
For the year ended July 31, 2017, the effective management fee rate was 0.996% of the Fund’s average daily net assets.
Management fees paid by the Fund are reduced on assets invested in FT Subsidiary, in an amount not to exceed the management fees paid by FT Subsidiary.
b. Administrative Fees
Under an agreement with FTIML, FT Services provides administrative services to the Fund and FT Subsidiary. The fee is paid by FTIML based on each of the Fund’s and FT Subsidiary’s average daily net assets, and is not an additional expense of the Fund or FT Subsidiary.
| | | | |
| | | |
| ftinstitutional.com | | Annual Report | | 25 |
FRANKLIN GLOBAL TRUST
NOTES TO CONSOLIDATED FINANCIAL STATEMENTS
Franklin Emerging Market Debt Opportunities Fund (continued)
3. Transactions with Affiliates (continued)
c. Transfer Agent Fees
The Fund pays transfer agent fees to Investor Services for its performance of shareholder servicing obligations and reimburses Investor Services for out of pocket expenses incurred, including shareholder servicing fees paid to third parties.
For the year ended July 31, 2017, the Fund paid transfer agent fees of $25,563, of which $24,879 was retained by Investor Services.
d. Investments in Affiliated Management Investment Companies
The Fund invests in one or more affiliated management investment companies for purposes other than exercising a controlling influence over the management or policies. Management fees paid by the Fund are waived on assets invested in the affiliated management investment companies, as noted in the Consolidated Statement of Operations, in an amount not to exceed the management and administrative fees paid directly or indirectly by each affiliate. Prior to August 1, 2013, the waiver was accounted for as a reduction to management fees. During the year ended July 31, 2017, the Fund held investments in affiliated management investment companies as follows:
| | | | | | | | | | | | | | | | | | | | | | | | | | | | | | | | |
| | | Number of
Shares Held
at Beginning
of Year | | | Gross
Additions | | | Gross
Reductions | | | Number of
Shares Held at End
of Year | | | Value at End of Year | | | Investment
Income | | | Realized
Gain (Loss) | | | %of Affiliated
Fund Shares
Outstanding
Held at End
of Year | |
| Non-Controlled Affiliates | | | | | | | | | | | | | | | | | | | | | | | | | | | | | | | | |
Institutional Fiduciary Trust Money Market Portfolio, 0.63% | | | 20,493,180 | | | | 191,990,821 | | | | (201,457,385 | ) | | | 11,026,616 | | | | $11,026,616 | | | | $27,995 | | | | — | | | | 0.1% | |
| | | | | | | | | | | | | | | | | | | | |
e. Waiver and Expense Reimbursements
FTIML has contractually agreed in advance to waive or limit its fees and to assume as its own expense certain expenses otherwise payable by the Fund so that the expenses (excluding acquired fund fees and expenses) do not exceed 1.00% (other than certain non-routine expenses or costs, including those relating to litigation, indemnification, reorganizations, and liquidations) until November 30, 2017. Total expenses waived or paid are not subject to recapture subsequent to the Fund’s fiscal year end.
4. Expense Offset Arrangement
The Fund has entered into an arrangement with its custodian whereby credits realized as a result of uninvested cash balances are used to reduce a portion of the Fund’s custodian expenses. During the year ended July 31, 2017, the custodian fees were reduced as noted in the Consolidated Statement of Operations.
5. Income Taxes
During the year ended July 31, 2017, the Fund utilized $238,557 of capital loss carryforwards.
For tax purposes, the Fund may elect to defer any portion of a post-October capital loss to the first day of the following fiscal year. At July 31, 2017, the Fund deferred post-October capital losses of $163,291.
The tax character of distributions paid during the years ended July 31, 2017 and 2016, was as follows:
| | | | | | | | |
| | | 2017 | | | 2016 | |
| | | | |
Distributions paid from: | | | | | | | | |
Ordinary income. | | | $1,029,830 | | | | $36,997,804 | |
| | | | |
| | | |
| 26 | | Annual Report | | ftinstitutional.com |
FRANKLIN GLOBAL TRUST
NOTES TO CONSOLIDATED FINANCIAL STATEMENTS
Franklin Emerging Market Debt Opportunities Fund (continued)
| | | | | | | | |
| | | 2017 | | | 2016 | |
| | | | |
Long term capital gain | | | 2,363,441 | | | | — | |
| | | | |
| | | $3,393,271 | | | | $36,997,804 | |
| | | | |
At July 31, 2017, the cost of investments, net unrealized appreciation (depreciation), and undistributed ordinary income for income tax purposes were as follows:
| | | | |
Cost of investments | | $ | 534,360,157 | |
| | | | |
| |
Unrealized appreciation | | $ | 47,046,991 | |
Unrealized depreciation | | | (77,362,706) | |
| | | | |
Net unrealized appreciation (depreciation) | | $ | (30,315,715) | |
| | | | |
Distributable earnings - undistributed ordinary income . | | $ | 6,167,396 | |
| | | | |
Differences between income and/or capital gains as determined on a book basis and a tax basis are primarily due to differing treatments of defaulted securities, foreign currency transactions and inflation related adjustments on foreign securities.
6. Investment Transactions
Purchases and sales of investments (excluding short term securities) for the year ended July 31, 2017, aggregated $146,121,066 and $183,024,140, respectively.
7. Credit Risk and Defaulted Securities
At July 31, 2017, the Fund had 77.5% of its portfolio invested in high yield or other securities rated below investment grade and unrated securities, if any. These securities may be more sensitive to economic conditions causing greater price volatility and are potentially subject to a greater risk of loss due to default than higher rated securities.
The Fund held defaulted securities and/or other securities for which the income has been deemed uncollectible. At July 31, 2017, the aggregate value of these securities was $25,763,813, representing 5.0% of the Fund’s net assets. The Fund discontinues accruing income on securities for which income has been deemed uncollectible and provides an estimate for losses on interest receivable. The securities have been identified in the accompanying Consolidated Statement of Investments.
8. Concentration of Risk
Investing in foreign securities may include certain risks and considerations not typically associated with investing in U.S. securities, such as fluctuating currency values and changing local and regional economic, political and social conditions, which may result in greater market volatility. In addition, certain foreign securities may not be as liquid as U.S. securities.
9. Restricted Securities
The Fund invests in securities that are restricted under the Securities Act of 1933 (1933 Act) or which are subject to legal, contractual, or other agreed upon restrictions on resale. Restricted securities are often purchased in private placement transactions, and cannot be sold without prior registration unless the sale is pursuant to an exemption under the 1933 Act. Disposal of these securities may require greater effort and expense, and prompt sale at an acceptable price may be difficult. The Fund may have registration rights for restricted securities. The issuer generally incurs all registration costs.
| | | | |
| | | |
| ftinstitutional.com | | Annual Report | | 27 |
FRANKLIN GLOBAL TRUST
NOTES TO CONSOLIDATED FINANCIAL STATEMENTS
Franklin Emerging Market Debt Opportunities Fund (continued)
9. Restricted Securities (continued)
At July 31, 2017, investments in restricted securities, excluding certain securities exempt from registration under the 1933 Act deemed to be liquid, were as follows:
| | | | | | | | | | | | | | |
Principal
Amount*/
Units | | | | Issuer | | Acquisition Date | | Cost | | | Value | |
| 193,625 | | | | Astana Finance JSC, GDR, 144A. | | 5/22/15 | | $ | — | | | $ | — | |
| 136,566 | | | | Astana Finance JSC, secured note, 144A, zero cpn., 12/22/24 | | 5/22/15 | | | — | | | | 1,366 | |
| 873,490,163 | | JPY | | Deutsche Bank AG (Government of Iraq), 2.571%, 1/01/28 | | 1/26/17 | | | 4,964,879 | | | | 5,583,557 | |
| 9,668,750 | | | | Development Bank of South Africa Ltd. (Government of Angola), Tranche 2, senior note, FRN, 7.683%, 12/20/23 | | 12/16/13 | | | 9,668,750 | | | | 8,792,418 | |
| 9,100,000 | | | | Development Bank of South Africa Ltd. (Government of Angola), Tranche 3B, senior note, FRN, 7.683%, 12/20/23 | | 6/06/14 | | | 9,100,000 | | | | 8,275,217 | |
| 9,300,000 | | | | Ethiopian Railway Corp. (Republic of Ethiopia), FRN, 5.10%, 8/02/21 | | 8/04/14 - 1/15/16 | | | 8,894,773 | | | | 8,890,246 | |
| 4,424,861 | | | | Global Distressed Alpha Fund III LP | | 10/11/12 - 1/22/16 | | | 4,600,000 | | | | 313,302 | |
| 469,434 | | | | Global Distressed Alpha Fund III LP, PIK, 12.00%, Perpetual | | 12/28/16 - 6/30/17 | | | 469,434 | | | | 469,434 | |
| 260,174,434 | | JPY | | Government of Iraq, Tranche A3, Sumitomo Corp. Loan, FRN, 0.688%, 1/01/28 | | 10/16/07 - 1/06/11 | | | 1,554,520 | | | | 1,705,178 | |
| 55,882,058 | | | | Holdco 2, A | | 2/08/13 - 2/01/17 | | | 429,250 | | | | 42,396 | |
| 5,561,052 | | | | Holdco 2, B | | 2/01/17 | | | 4,129 | | | | 4,219 | |
| 455,321,020 | | JPY | | Merrill Lynch & Co. Inc. (Government of Iraq), FRN, 0.688%, 1/01/28 | | 7/19/07 - 1/06/11 | | | 2,618,254 | | | | 2,984,165 | |
| 4,250,000 | | DEM | | NK Debt Corp., 144A, zero cpn., 3/12/20 | | 6/19/07 - 10/14/08 | | | 723,263 | | | | — | |
| 2,000,000 | | CHF | | NK Debt Corp., Reg S, zero cpn., 3/12/20 | | 6/17/11 | | | 388,830 | | | | — | |
| 18,000,000 | | DEM | | NK Debt Corp., Reg S, zero cpn., 3/12/20 | | 1/25/11 - 6/06/11 | | | 2,023,663 | | | | — | |
| 16,478,377 | | | | Societe des Hydrocarbures du Tchad, Tranche 4, FRN, 8.324%, 12/30/22 | | 10/03/16 | | | 16,069,282 | | | | 15,489,674 | |
| 8,000,000 | | | | Sphynx Capital Markets PCC (National Investment Bank of Ghana), PTN, Reg S, zero cpn., 2/05/09 | | 10/12/09 - 10/13/11 | | | 3,100,000 | | | | — | |
| | | | | | | | | | |
| | | | Total Restricted Securities (Value is 10.2% of Net Assets) | | | | $ | 64,609,027 | | | $ | 52,551,172 | |
| | | | | | | | | | |
*In U.S. dollars unless otherwise indicated.
10. Other Derivative Information
At July 31, 2017, the Fund’s investments in derivative contracts are reflected in the Consolidated Statement of Assets and Liabilities as follows:
| | | | | | | | | | | | |
| | | Asset Derivatives | | | Liability Derivatives | |
Derivative Contracts Not Accounted for as Hedging Instruments | | Consolidated Statement of Assets and Liabilities Location | | Fair Value | | | Consolidated Statement of
Assets and Liabilities
Location | | Fair Value | |
Foreign exchange contracts | | Unrealized appreciation on OTC forward exchange contracts | | | $165,597 | | | Unrealized depreciation on OTC forward exchange contracts | | | $420,204 | |
Value recovery instruments | | Investments in securities, at value | | | 3,399,550 | | | Investments in securities, at value | | | — | |
| | | | | | | | | | | | |
Totals | | | | | $3,565,147 | | | | | | $420,204 | |
| | | | | | | | | | | | |
| | | | |
| | | |
| 28 | | Annual Report | | ftinstitutional.com |
FRANKLIN GLOBAL TRUST
NOTES TO CONSOLIDATED FINANCIAL STATEMENTS
Franklin Emerging Market Debt Opportunities Fund (continued)
For the year ended July 31, 2017, the effect of derivative contracts in the Fund’s Consolidated Statement of Operations was as follows:
| | | | | | | | | | | | |
Derivative Contracts Not
Accounted for as Hedging
Instruments | | Consolidated Statement of
Operations Locations | | Net Realized
Gain (Loss) for
the Year | | | Consolidated Statement of
Operations Locations | | Net Change in
Unrealized
Appreciation
(Depreciation)
for the Year | |
| | Net realized gain (loss) from: | | | | | | Net change in unrealized appreciation (depreciation) on: | | | | |
Foreign exchange contracts | | Foreign currency transactions | |
| $(1,245,509)a
|
| | Translation of other assets and liabilities denominated in foreign currencies | |
| $1,957,878a
|
|
| | | | |
Value recovery instruments | | Investments | | | — | | | Investments | | | 743,225 | |
| | | | | | | | | | | | |
Totals | | | | | $(1,245,509) | | | | | | $2,701,103 | |
| | | | | | | | | | | | |
a Forward exchange contracts are included in net realized gain (loss) from foreign currency transactions and net change in unrealized appreciation (depreciation) on translation of other assets and liabilities denominated in foreign currencies in the Consolidated Statement of Operations.
For the year ended July 31, 2017, the average month end contract value and fair value of forward exchange contracts and VRI was $31,386,970 and $2,631,406, respectively.
See Note 1(c) regarding derivative financial instruments.
11. Credit Facility
The Fund, together with other U.S. registered and foreign investment funds (collectively, Borrowers), managed by Franklin Templeton Investments, are borrowers in a joint syndicated senior unsecured credit facility totaling $2 billion (Global Credit Facility) which matures on February 9, 2018. This Global Credit Facility provides a source of funds to the Borrowers for temporary and emergency purposes, including the ability to meet future unanticipated or unusually large redemption requests.
Under the terms of the Global Credit Facility, the Fund shall, in addition to interest charged on any borrowings made by the Fund and other costs incurred by the Fund, pay its share of fees and expenses incurred in connection with the implementation and maintenance of the Global Credit Facility, based upon its relative share of the aggregate net assets of all of the Borrowers, including an annual commitment fee of 0.15% based upon the unused portion of the Global Credit Facility. These fees are reflected in other expenses in the Consolidated Statement of Operations. During the year ended July 31, 2017, the Fund did not use the Global Credit Facility.
12. Fair Value Measurements
The Fund follows a fair value hierarchy that distinguishes between market data obtained from independent sources (observable inputs) and the Fund’s own market assumptions (unobservable inputs). These inputs are used in determining the value of the Fund’s financial instruments and are summarized in the following fair value hierarchy:
| | • | | Level 1 – quoted prices in active markets for identical financial instruments |
| | • | | Level 2 – other significant observable inputs (including quoted prices for similar financial instruments, interest rates, prepayment speed, credit risk, etc.) |
| | • | | Level 3 – significant unobservable inputs (including the Fund’s own assumptions in determining the fair value of financial instruments) |
| | | | |
| | | |
| ftinstitutional.com | | Annual Report | | 29 |
FRANKLIN GLOBAL TRUST
NOTES TO CONSOLIDATED FINANCIAL STATEMENTS
Franklin Emerging Market Debt Opportunities Fund (continued)
12. Fair Value Measurements (continued)
The input levels are not necessarily an indication of the risk or liquidity associated with financial instruments at that level.
For movements between the levels within the fair value hierarchy, the Fund has adopted a policy of recognizing the transfers as of the date of the underlying event which caused the movement.
A summary of inputs used as of July 31, 2017, in valuing the Fund’s assets and liabilities carried at fair value, is as follows:
| | | | | | | | | | | | | | | | |
| | | Level 1 | | | Level 2 | | | Level 3 | | | Total | |
| | | | |
| Assets: | | | | | | | | | | | | | | | | |
Investments in Securities: | | | | | | | | | | | | | | | | |
Warrants | | $ | — | | | $ | 12,741,670 | | | $ | — | | | $ | 12,741,670 | |
Quasi-Sovereign and Corporate Bonds | | | — | | | | 164,083,019 | | | | 1,366a | | | | 164,084,385 | |
Loan Participations and Assignments | | | — | | | | 41,421,553 | | | | 52,189,889a | | | | 93,611,442 | |
Foreign Government and Agency Securities | | | — | | | | 220,229,392 | | | | 1,991,020 | | | | 222,220,412 | |
Common Stocks | | | — | | | | — | | | | 46,615a | | | | 46,615 | |
Private Limited Partnership Fund | | | — | | | | — | | | | 313,302 | | | | 313,302 | |
Short Term Investments | | | 11,026,616 | | | | — | | | | — | | | | 11,026,616 | |
| | | | |
Total Investments in Securities | | $ | 11,026,616 | | | $ | 438,475,634 | | | $ | 54,542,192 | | | $ | 504,044,442 | |
| | | | |
Other Financial Instruments: | | | | | | | | | | | | | | | | |
Forward Exchange Contracts | | $ | — | | | $ | 165,597 | | | $ | — | | | $ | 165,597 | |
| | | | |
| Liabilities: | | | | | | | | | | | | | | | | |
Other Financial Instruments: | | | | | | | | | | | | | | | | |
Forward Exchange Contracts | | $ | — | | | $ | 420,204 | | | $ | — | | | $ | 420,204 | |
| | | | |
aIncludes securities determined to have no value at July 31, 2017.
A reconciliation of assets in which Level 3 inputs are used in determining fair value is presented when there are significant Level 3 financial instruments at the end of the year. At July 31, 2017, the reconciliation of assets, is as follows:
| | | | | | | | | | | | | | | | | | | | | | | | | | | | | | | | | | | | | | | | |
| | | Balance at
Beginning
of Year | | | Purchases | | | Sales | | | Transfer Into Level
3a | | | Transfer
Out of
Level 3 | | | Cost Basis
Adjustmentsb
| | | Net
Realized
Gain
(Loss) | | | Net
Unrealized
Appreciation
(Depreciation) | | | Balance at End of Year | | | Net Change in
Unrealized
Appreciation
(Depreciation)
on Assets
Held at Year End | |
Assets: | | | | | | | | | | | | | | | | | | | | | | | | | | | | | | | | | | | | | | | | |
Investments in Securities: | | | | | | | | | | | | | | | | | | | | | | | | | | | | | | | | | | | | | | | | |
Quasi-Sovereign and Corporate Bonds | | | $9,013,227 | | | | $ — | | | | $ — | | | | $ — | | | | $ — | | | | $ — | | | | $ — | | | | $(9,011,861) | | | | $ 1,366c | | | | $(9,011,861) | |
Loan Participations and Assignments | | | 33,026,695c | | | | 22,054,184 | | | | (4,374,774) | | | | — | | | | — | | | | 811,154 | | | | 15,161 | | | | 657,469 | | | | 52,189,889c | | | | 500,156 | |
Foreign Government and Agency Securities | | | — | | | | — | | | | — | | | | 1,758,562 | | | | — | | | | — | | | | — | | | | 232,458 | | | | 1,991,020 | | | | 232,458 | |
Common Stocks | | | — | c | | | — | | | | — | | | | 45,619 | | | | — | | | | — | | | | — | | | | 996 | | | | 46,615c | | | | 996 | |
Private Limited Partnership Fund . | | | 568,829 | | | | — | | | | — | | | | — | | | | — | | | | — | | | | — | | | | (255,527) | | | | 313,302 | | | | (255,527) | |
| | | | |
Total Investments in Securities | | | $42,608,751 | | | | $22,054,184 | | | | $(4,374,774) | | | | $1,804,181 | | | | $— | | | | $811,154 | | | | $15,161 | | | | $(8,376,465) | | | | $54,542,192 | | | | $(8,533,778) | |
| | | | |
aThe investments were transferred into Level 3 as a result of the unavailability of a quoted market price in an active market for identical securities. May include amounts related to a corporate action.
bMay include accretion, amortization, partnership adjustments, and/or other cost basis adjustments.
cIncludes securities determined to have no value.
| | | | |
| | | |
| 30 | | Annual Report | | ftinstitutional.com |
FRANKLIN GLOBAL TRUST
NOTES TO CONSOLIDATED FINANCIAL STATEMENTS
Franklin Emerging Market Debt Opportunities Fund (continued)
Significant unobservable valuation inputs developed by the VC for material Level 3 investments and impact to fair value as a result of changes in unobservable valuation inputs as of July 31, 2017, are as follows:
| | | | | | | | | | | | | | | | | | | | | | | | |
Description | | Fair Value at
End of Year | | | Valuation Technique | | | Unobservable Inputs | | | Amount/ Range | | | | | | Impact to Fair
Value if Input
Increasesa | |
Assets: | | | | | | | | | | | | | | | | | | | | | | | | |
Investments in Securities: | | | | | | | | | | | | | | | | | | | | | | | | |
Loan Participations and Assignments | | | $46,136,898 | | | | Consensus Pricing | | |
| Weighted average of
offered quotes |
| | | 66.8 - 73.3 | | | | JPY | | | | Increase | |
| | | | | |
| Discounted Cash Flow
Model |
| | | Free Cash Flow | | | | $57.8 (mil | ) | | | | | | | Increaseb | |
| | | | | | |
| | | | | | | | | | | Discount rate | | | | 7.2%-12.3% | | | | | | | | Decreasec | |
| | | | | | | |
All Other Investmentsd | | | 8,405,294e | | | | | | | | | | | | | | | | | | | | | |
Total | | | $54,542,192 | | | | | | | | | | | | | | | | | | | | | |
aRepresents the directional change in the fair value of the Level 3 financial instruments that would result from a significant and reasonable increase in the corresponding input. A significant and reasonable decrease in the input would have the opposite effect. Significant impacts, if any, to fair value and/or net assets have been indicated.
bRepresents a significant impact to fair value and net assets.
cRepresents a significant impact to fair value but not net assets.
dIncludes financial instruments with values derived using prior transaction prices or third party pricing information without adjustment for which such inputs are unobservable. May also include fair value of immaterial financial instruments developed using various valuation techniques and unobservable inputs.
eIncludes securities determined to have no value at July 31, 2017.
13. New Accounting Pronouncements
In March 2017, the Financial Accounting Standards Board issued Accounting Standards Update (ASU) No. 2017-08, Receivables—Nonrefundable Fees and Other Costs (Subtopic 310-20): Premium Amortization on Purchased Callable Debt Securities. The amendments in the ASU shorten the amortization period for certain callable debt securities acquired at a premium, to be amortized to the earliest call date. The ASU does not require an accounting change for securities acquired at a discount, which continues to be amortized to maturity. The ASU is effective for fiscal years and interim periods within those fiscal years beginning after December 15, 2018. Management is currently evaluating the impact, if any, of applying this provision.
14. Investment Company Reporting Modernization
In October 2016, the U.S. Securities and Exchange Commission adopted new rules and amended existing rules (together, final rules) intended to modernize the reporting and disclosure of information by registered investment companies. In part, the final rules amend Regulation S-X and require standardized, enhanced disclosures about derivatives in investment company financial statements, as well as other amendments. The compliance date for the amendments to Regulation S-X is August 1, 2017. Management has reviewed the requirements and believes the adoption of the amendments to Regulation S-X will not have a material impact on the Fund’s financial statements and related disclosures.
15. Subsequent Events
The Fund has evaluated subsequent events through the issuance of the consolidated financial statements and determined that no events have occurred that require disclosure.
| | | | |
| | | |
| ftinstitutional.com | | Annual Report | | 31 |
FRANKLIN GLOBAL TRUST
NOTES TO CONSOLIDATED FINANCIAL STATEMENTS
Franklin Emerging Market Debt Opportunities Fund (continued)
Abbreviations
| | | | | | | | | | |
| Counterparty | | Currency | | Selected Portfolio |
| CITI | | Citibank N.A. | | AZN | | Azerbaijan Manat | | FRN | | Floating Rate Note |
| MSCO | | Morgan Stanley | | BRL | | Brazilian Real | | GDP | | Gross Domestic Product |
| RBCCM | | Royal Bank of Canada | | CHF | | Swiss Franc | | GDR | | Global Depositary Receipt |
| | | | COP | | Colombian Peso | | PIK | | Payment-In-Kind |
| | | | DEM | | Deutsche Mark | | PTN | | Pass-through Note |
| | | | EGP | | Egyptian Pound | | VRI | | Value Recovery Instruments |
| | | | GEL | | Georgian Lari | | | | |
| | | | GHS | | Ghanaian Cedi | | | | |
| | | | INR | | Indian Rupee | | | | |
| | | | JPY | | Japanese Yen | | | | |
| | | | KES | | Kenyan Shilling | | | | |
| | | | MXN | | Mexican Peso | | | | |
| | | | PEN | | Peruvian Nuevo Sol | | | | |
| | | | RUB | | Russian Ruble | | | | |
| | | | TRY | | Turkish Lira | | | | |
| | | | UGX | | Ugandan Shilling | | | | |
| | | | UYU | | Uruguayan Peso | | | | |
| | | | ZAR | | South African Rand | | | | |
| | | | |
| | | |
| 32 | | Annual Report | | ftinstitutional.com |
FRANKLIN GLOBAL TRUST
Report of Independent Registered Public Accounting Firm
To the Board of Trustees of Franklin Global Trust and Shareholders of the Franklin Emerging Market Debt Opportunities Fund
In our opinion, the accompanying consolidated statement of assets and liabilities, including the consolidated statement of investments, and the related consolidated statements of operations, of changes in net assets, and of cash flows and the consolidated financial highlights present fairly, in all material respects, the financial position of the Franklin Emerging Market Debt Opportunities Fund (the “Fund”) as of July 31, 2017, the results of its operations and its cash flows for the year then ended, the changes in its net assets for each of the two years in the period then ended and the financial highlights for each of the five years in the period then ended, in conformity with accounting principles generally accepted in the United States of America. These consolidated financial statements and consolidated financial highlights (hereafter referred to as “financial statements”) are the responsibility of the Fund’s management. Our responsibility is to express an opinion on these financial statements based on our audits. We conducted our audits of these financial statements in accordance with the standards of the Public Company Accounting Oversight Board (United States). Those standards require that we plan and perform the audit to obtain reasonable assurance about whether the financial statements are free of material misstatement. An audit includes examining, on a test basis, evidence supporting the amounts and disclosures in the financial statements, assessing the accounting principles used and significant estimates made by management, and evaluating the overall financial statement presentation. We believe that our audits, which included confirmation of securities as of July 31, 2017 by correspondence with the custodian, transfer agent and brokers, provide a reasonable basis for our opinion.
PricewaterhouseCoopers LLP
San Francisco, California
September 15, 2017
| | | | |
| | | |
| ftinstitutional.com | | Annual Report | | 33 |
FRANKLIN GLOBAL TRUST
Tax Information (unaudited)
Under Section 852(b)(3)(C) of the Internal Revenue Code (Code), the Fund hereby reports the maximum amount allowable but no less than $2,336,601 as a long term capital gain dividend for the fiscal year ended July 31, 2017.
Under Section 871(k)(2)(C) of the Code, the Fund hereby reports the maximum amount allowable but no less than $1,023,520 as a short term capital gain dividend for purposes of the tax imposed under Section 871(a)(1)(A) of the Code for the fiscal year ended July 31, 2017.
At July 31, 2016 more than 50% of the Fund’s total assets were invested in securities of foreign issuers. In most instances, foreign taxes were withheld from income paid to the Fund on these investments. As shown in the table below, the Fund hereby reports to shareholders the foreign source income and foreign taxes paid, pursuant to Section 853 of the Code. This written statement will allow shareholders of record on December 14, 2016, to treat their proportionate share of foreign taxes paid by the Fund as having been paid directly by them. The shareholder shall consider these amounts as foreign taxes paid in the tax year in which they receive the Fund distribution.
The following table provides a detailed analysis of foreign tax paid, and foreign source income, and foreign source qualified dividends as reported by the Fund to shareholders of record.
| | | | | | | | | | |
Foreign Tax Paid
Per Share | | | Foreign Source
Income Per Share | | | Foreign Source Qualified
Dividends Per Share | |
| $0.0113 | | | | $1.0611 | | | | $0.0000 | |
Foreign Tax Paid Per Share (Column 1) is the amount per share available to you, as a tax credit (assuming you held your shares in the Fund for a minimum of 16 days during the 31-day period beginning 15 days before the ex-dividend date of the Fund’s distribution to which the foreign taxes relate), or, as a tax deduction.
Foreign Source Income Per Share (Column 2) is the amount per share of income dividends attributable to foreign securities held by the Fund, plus any foreign taxes withheld on these dividends. The amounts reported include foreign source qualified dividends that have not been adjusted for the rate differential applicable to such dividend income.1
Foreign Source Qualified Dividends Per Share (Column 3) is the amount per share of foreign source qualified dividends, plus any foreign taxes withheld on these dividends. These amounts represent the portion of the Foreign Source Income reported to you in column 2 that were derived from qualified foreign securities held by the Fund.1
By mid-February 2017, shareholders received Form 1099-DIV which included their share of taxes paid and foreign source income distributed during the calendar year 2016. The Foreign Source Income reported on Form 1099-DIV had not been adjusted for the rate differential on foreign source qualified dividend income. Shareholders are advised to check with their tax advisors for information on the treatment of these amounts on their 2016 individual income tax returns.
1. Qualified dividends are taxed at reduced long term capital gains tax rates. In determining the amount of foreign tax credit that may be applied against the U.S. tax liability of individuals receiving foreign source qualified dividends, adjustments may be required to the foreign tax credit limitation calculation to reflect the rate differential applicable to such dividend income. The rules however permit certain individuals to elect not to apply the rate differential adjustments for capital gains and/or dividends for any taxable year. Please consult your tax advisor and the instructions to Form 1116 for more information.
| | | | |
| | | |
| 34 | | Annual Report | | ftinstitutional.com |
FRANKLIN GLOBAL TRUST
Board Members and Officers
The name, year of birth and address of the officers and board members, as well as their affiliations, positions held with the Trust, principal occupations during at least the past five years and number of U.S. registered portfolios overseen in the Franklin Templeton Investments fund complex, are shown below. Generally, each board member serves until that person’s successor is elected and qualified.
Independent Board Members
| | | | | | | | |
Name, Year of Birth
and Address | | Position | | Length of Time Served | | Number of Portfolios in
Fund Complex Overseen
by Board Member* | | Other Directorships Held During at Least the Past 5 Years |
| | | | |
Harris J. Ashton (1932)
One Franklin Parkway
San Mateo, CA 94403-1906 | | Trustee | | Since 2000 | | 140 | | Bar-S Foods (meat packing company) (1981-2010). |
|
| Principal Occupation During at Least the Past 5 Years: |
| Director of various companies; and formerly, Director, RBC Holdings, Inc. (bank holding company) (until 2002); and President, Chief Executive Officer and Chairman of the Board, General Host Corporation (nursery and craft centers) (until 1998). |
| | | | |
Mary C. Choksi (1950)
One Franklin Parkway
San Mateo, CA 94403-1906 | | Trustee | | Since 2014 | | 134 | | Avis Budget Group Inc. (car rental) (2007-present), Omnicom Group Inc. (advertising and marketing communications services) (2011-present). |
|
| Principal Occupation During at Least the Past 5 Years: |
| Director of various companies; and formerly, Founder and Senior Advisor, Strategic Investment Group (investment management group) (2015-2017), Founding Partner and Senior Managing Director, Strategic Investment Group (1987-2015); Founding Partner and Managing Director, Emerging Markets Management LLC (investment management firm) (1987-2011); and Loan Officer/Senior Loan Officer/Senior Pension Investment Officer, World Bank Group (international financial institution) (1977-1987). |
| | | | |
Edith E. Holiday (1952)
One Franklin Parkway
San Mateo, CA 94403-1906 | | Trustee | | Since 2000 | | 140 | | Hess Corporation (exploration of oil and gas) (1993-present), Canadian National Railway (railroad) (2001-present), White Mountains Insurance Group, Ltd. (holding company) (2004-present), Santander Consumer USA Holdings, Inc. (consumer finance) (2016-present), RTI International Metals, Inc. (manufacture and distribution of titanium) (1999-2015) and H.J. Heinz Company (processed foods and allied products) (1994-2013). |
|
| Principal Occupation During at Least the Past 5 Years: |
| Director or Trustee of various companies and trusts; and formerly, Assistant to the President of the United States and Secretary of the Cabinet (1990-1993); General Counsel to the United States Treasury Department (1989-1990); and Counselor to the Secretary and Assistant Secretary for Public Affairs and Public Liaison – United States Treasury Department (1988-1989). |
| | | | |
J. Michael Luttig (1954)
One Franklin Parkway
San Mateo, CA 94403-1906 | | Trustee | | Since 2009 | | 140 | | Boeing Capital Corporation (aircraft financing) (2006-2013). |
|
| Principal Occupation During at Least the Past 5 Years: |
| Executive Vice President, General Counsel and member of the Executive Council, The Boeing Company (aerospace company) (2006-present); and formerly, Federal Appeals Court Judge, U.S. Court of Appeals for the Fourth Circuit (1991-2006). |
| | | | |
| | | |
| ftinstitutional.com | | Annual Report | | 35 |
FRANKLIN GLOBAL TRUST
Independent Board Members (continued)
| | | | | | | | |
Name, Year of Birth
and Address | | Position | | Length of Time Served | | Number of Portfolios in
Fund Complex Overseen
by Board Member* | | Other Directorships Held During at Least the Past 5 Years |
| | | | |
Larry D. Thompson (1945)
One Franklin Parkway
San Mateo, CA 94403-1906 | | Trustee | | Since 2007 | | 140 | | The Southern Company (energy company) (2014-present; previously 2010-2012), Graham Holdings Company (education and media organization) (2011-present) and Cbeyond, Inc. (business communications provider) (2010-2012). |
|
| Principal Occupation During at Least the Past 5 Years: |
| Director of various companies; John A. Sibley Professor of Corporate and Business Law, University of Georgia School of Law (2015-present; previously 2011-2012); and formerly, Executive Vice President – Government Affairs, General Counsel and Corporate Secretary, PepsiCo, Inc. (consumer products) (2012-2014); Senior Vice President - Government Affairs, General Counsel and Secretary, PepsiCo, Inc. (2004-2011); Senior Fellow of The Brookings Institution (2003-2004); Visiting Professor, University of Georgia School of Law (2004); and Deputy Attorney General, U.S. Department of Justice (2001-2003). |
| | | | |
John B. Wilson (1959)
One Franklin Parkway
San Mateo, CA 94403-1906 | | Lead Independent Trustee | | Trustee since 2006 and Lead Independent Trustee since 2008 | | 114 | | None |
|
| Principal Occupation During at Least the Past 5 Years: |
| President and Founder, Hyannis Port Capital, Inc. (real estate and private equity investing); (2002-present); serves on private and non-profit boards; and formerly, President, Staples International and Head of Global Transformation (office supplies) (2012-2016); Chief Operating Officer and Executive Vice President, Gap, Inc. (retail) (1996-2000); Chief Financial Officer and Executive Vice President – Finance and Strategy, Staples, Inc. (1992-1996); Senior Vice President – Corporate Planning, Northwest Airlines, Inc. (airlines) (1990-1992); and Vice President and Partner, Bain & Company (consulting firm) (1986-1990). |
Interested Board Members and Officers |
Name, Year of Birth and Address | | Position | | Length of Time Served | | Number of Portfolios in
Fund Complex Overseen
by Board Member* | | Other Directorships Held During at
Least the Past 5 Years |
| | | | |
**Gregory E. Johnson (1961)
One Franklin Parkway
San Mateo, CA 94403-1906 | | Trustee | | Since 2007 | | 156 | | None |
|
| Principal Occupation During at Least the Past 5 Years: |
| Chairman of the Board, Member – Office of the Chairman, Director and Chief Executive Officer, Franklin Resources, Inc.; officer and/or director or trustee, as the case may be, of some of the other subsidiaries of Franklin Resources, Inc. and of 44 of the investment companies in Franklin Templeton Investments; Vice Chairman, Investment Company Institute; and formerly, President, Franklin Resources, Inc. (1994-2015). |
| | | | |
**Rupert H. Johnson, Jr. (1940)
One Franklin Parkway
San Mateo, CA 94403-1906 | | Chairman of the Board and Trustee | | Since 2013 | | 140 | | None |
|
| Principal Occupation During at Least the Past 5 Years: |
| Vice Chairman, Member - Office of the Chairman and Director, Franklin Resources, Inc.; Director, Franklin Advisers, Inc.; Senior Vice President, Franklin Advisory Services, LLC; and officer and/or director or trustee, as the case may be, of some of the other subsidiaries of Franklin Resources, Inc. and of 42 of the investment companies in Franklin Templeton Investments. |
| | | | |
Alison E. Baur (1964)
One Franklin Parkway
San Mateo, CA 94403-1906 | | Vice President | | Since 2012 | | Not Applicable | | Not Applicable |
|
| Principal Occupation During at Least the Past 5 Years: |
| Deputy General Counsel, Franklin Templeton Investments; and officer of some of the other subsidiaries of Franklin Resources, Inc. and of 45 of the investment companies in Franklin Templeton Investments. |
| | | | |
| | | |
| 36 | | Annual Report | | ftinstitutional.com |
FRANKLIN GLOBAL TRUST
Interested Board Members and Officers (continued)
| | | | | | | | |
Name, Year of Birth and Address | | Position | | Length of Time Served | | Number of Portfolios in
Fund Complex Overseen
by Board Member* | | Other Directorships Held During at Least the Past 5 Years |
| | | | |
Gaston Gardey (1967)
One Franklin Parkway
San Mateo, CA 94403-1906 | | Chief Financial Officer, Chief Accounting Officer and Treasurer | | Since 2009 | | Not Applicable | | Not Applicable |
|
| Principal Occupation During at Least the Past 5 Years: |
| Treasurer, U.S. Fund Administration & Reporting, Franklin Templeton Investments; and officer of 27 of the investment companies in Franklin Templeton Investments. |
| | | | |
Aliya S. Gordon (1973)
One Franklin Parkway
San Mateo, CA 94403-1906 | | Vice President | | Since 2009 | | Not Applicable | | Not Applicable |
|
| Principal Occupation During at Least the Past 5 Years: |
| Senior Associate General Counsel, Franklin Templeton Investments; and officer of 45 of the investment companies in Franklin Templeton Investments. |
| | | | |
Steven J. Gray (1955)
One Franklin Parkway
San Mateo, CA 94403-1906 | | Vice President | | Since 2009 | | Not Applicable | | Not Applicable |
|
| Principal Occupation During at Least the Past 5 Years: |
| Senior Associate General Counsel, Franklin Templeton Investments; Vice President, Franklin Templeton Distributors, Inc. and FT AlphaParity, LLC; and officer of 45 of the investment companies in Franklin Templeton Investments. |
| | | | |
Matthew T. Hinkle (1971)
One Franklin Parkway
San Mateo, CA 94403-1906 | | Chief Executive Officer – Finance and Administration | | Since June 2017 | | Not Applicable | | Not Applicable |
|
| Principal Occupation During at Least the Past 5 Years: |
| Senior Vice President, U.S. Fund Administration Reporting & Fund Tax, Franklin Templeton Investments; officer of 45 of the investment companies in Franklin Templeton Investments; and formerly, Vice President, Global Tax (2012-April 2017) and Treasurer/Assistant Treasurer, Franklin Templeton Investments (2009-2017). |
| | | | |
Edward B. Jamieson (1948)
One Franklin Parkway
San Mateo, CA 94403-1906 | | President and Chief Executive Officer – Investment Management | | Since 2010 | | Not Applicable | | Not Applicable |
|
| Principal Occupation During at Least the Past 5 Years: |
| President and Director, Franklin Advisers, Inc.; Executive Vice President, Franklin Templeton Institutional, LLC; and officer and/or trustee, as the case may be, of some of the other subsidiaries of Franklin Resources, Inc. and of 10 of the investment companies in Franklin Templeton Investments. |
| | | | |
Robert Lim (1948)
One Franklin Parkway
San Mateo, CA 94403-1906 | | Vice President –AML Compliance | | Since 2016 | | Not Applicable | | Not Applicable |
|
| Principal Occupation During at Least the Past 5 Years: |
| Vice President, Franklin Templeton Companies, LLC; Chief Compliance Officer, Franklin Templeton Distributors, Inc. and Franklin Templeton Investor Services, LLC; and officer of 45 of the investment companies in Franklin Templeton Investments. |
| | | | |
Christopher J. Molumphy (1962)
One Franklin Parkway
San Mateo, CA 94403-1906 | | Vice President | | Since 2000 | | Not Applicable | | Not Applicable |
|
| Principal Occupation During at Least the Past 5 Years: |
| Director and Executive Vice President, Franklin Advisers, Inc.; Executive Vice President, Franklin Templeton Institutional, LLC; and officer of some of the other subsidiaries of Franklin Resources, Inc. and of 22 of the investment companies in Franklin Templeton Investments. |
| | | | |
| | | |
| ftinstitutional.com | | Annual Report | | 37 |
FRANKLIN GLOBAL TRUST
Interested Board Members and Officers (continued)
| | | | | | | | |
Name, Year of Birth
and Address | | Position | �� | Length of Time Served | | Number of Portfolios in
Fund Complex Overseen
by Board Member* | | Other Directorships Held During at Least the Past 5 Years |
| | | | |
Kimberly H. Novotny (1972)
300 S.E. 2nd Street
Fort Lauderdale, FL 33301-1923 | | Vice President | | Since 2013 | | Not Applicable | | Not Applicable |
|
| Principal Occupation During at Least the Past 5 Years: |
| Associate General Counsel, Franklin Templeton Investments; Vice President and Corporate Secretary, Fiduciary Trust International of the South; Vice President, Templeton Investment Counsel, LLC; Assistant Secretary, Franklin Resources, Inc.; and officer of 45 of the investment companies in Franklin Templeton Investments. |
| | | | |
Robert C. Rosselot (1960)
300 S.E. 2nd Street
Fort Lauderdale, FL 33301-1923 | | Chief Compliance Officer | | Since 2013 | | Not Applicable | | Not Applicable |
|
| Principal Occupation During at Least the Past 5 Years: |
| Director, Global Compliance, Franklin Templeton Investments; Vice President, Franklin Templeton Companies, LLC; officer of 45 of the investment companies in Franklin Templeton Investments; and formerly, Senior Associate General Counsel, Franklin Templeton Investments (2007-2013); and Secretary and Vice President, Templeton Group of Funds (2004-2013). |
| | | | |
Karen L. Skidmore (1952)
One Franklin Parkway
San Mateo, CA 94403-1906 | | Vice President and Secretary | | Since 2006 | | Not Applicable | | Not Applicable |
|
| Principal Occupation During at Least the Past 5 Years: |
| Senior Associate General Counsel, Franklin Templeton Investments; and officer of 45 of the investment companies in Franklin Templeton Investments. |
| | | | |
Navid J. Tofigh (1972)
One Franklin Parkway
San Mateo, CA 94403-1906 | | Vice President | | Since 2015 | | Not Applicable | | Not Applicable |
|
| Principal Occupation During at Least the Past 5 Years: |
| Associate General Counsel, Franklin Templeton Investments; and officer of 45 of the investment companies in Franklin Templeton Investments. |
| | | | |
Craig S. Tyle (1960)
One Franklin Parkway
San Mateo, CA 94403-1906 | | Vice President | | Since 2005 | | Not Applicable | | Not Applicable |
|
| Principal Occupation During at Least the Past 5 Years: |
| General Counsel and Executive Vice President, Franklin Resources, Inc.; and officer of some of the other subsidiaries of Franklin Resources, Inc. and of 45 of the investment companies in Franklin Templeton Investments. |
| | | | |
Lori A. Weber (1964)
300 S.E. 2nd Street
Fort Lauderdale, FL 33301-1923 | | Vice President | | Since 2011 | | Not Applicable | | Not Applicable |
|
| Principal Occupation During at Least the Past 5 Years: |
| Senior Associate General Counsel, Franklin Templeton Investments; Assistant Secretary, Franklin Resources, Inc.; Vice President and Secretary, Templeton Investment Counsel, LLC; and officer of 45 of the investment companies in Franklin Templeton Investments. |
*We base the number of portfolios on each separate series of the U.S. registered investment companies within the Franklin Templeton Investments fund complex. These portfolios have a common investment manager or affiliated investment managers.
**Gregory E. Johnson is considered to be an interested person of the Fund under the federal securities laws due to his position as an officer and director of Franklin Resources, Inc. (Resources), which is the parent company of the Fund’s investment manager and distributor. Rupert H. Johnson, Jr. is considered to be an interested person of the Fund under the federal securities laws due to his position as officer and director and major shareholder of Resources.
Note 1: Rupert H. Johnson, Jr. is the uncle of Gregory E. Johnson.
Note 2: Officer information is current as of the date of this report. It is possible that after this date, information about officers may change.
Note 3: Effective November 1, 2016, Frank Olson ceased to be a trustee of the Trust.
The Sarbanes-Oxley Act of 2002 and Rules adopted by the Securities and Exchange Commission require the Fund to disclose whether the Fund’s Audit Committee includes at least one member who is an audit committee financial expert within the meaning of such Act and Rules. The Fund’s Board has determined that there is at least one such financial expert on the Audit Committee and has designated John B. Wilson as its audit committee financial expert. The Board believes that Mr. Wilson qualifies as such an expert in view of his extensive business background and experience, including service as chief financial officer of Staples, Inc. from 1992 to 1996. Mr. Wilson has been a Member and Chairman of the Fund’s Audit Committee since 2006. As a result of such background and
| | | | |
| | | |
| 38 | | Annual Report | | ftinstitutional.com |
FRANKLIN GLOBAL TRUST
Interested Board Members and Officers (continued)
experience, the Board believes that Mr. Wilson has acquired an understanding of generally accepted accounting principles and financial statements, the general application of such principles in connection with the accounting estimates, accruals and reserves, and analyzing and evaluating financial statements that present a breadth and level of complexity of accounting issues generally comparable to those of the Fund, as well as an understanding of internal controls and procedures for financial reporting and an understanding of audit committee functions. Mr. Wilson is an independent Board member as that term is defined under the relevant Securities and Exchange Commission Rules and Releases.
The Statement of Additional Information (SAI) includes additional information about the board members and is available, without charge, upon request. Shareholders may call (800) DIAL BEN/342-5236 to request the SAI.
| | | | |
| | | |
| ftinstitutional.com | | Annual Report | | 39 |
FRANKLIN GLOBAL TRUST
FRANKLIN EMERGING MARKET DEBT OPPORTUNITIES FUND
Shareholder Information
Board Approval of Investment Management Agreements
FRANKLIN GLOBAL TRUST
Franklin Emerging Market Debt Opportunities Fund
(Fund)
At an in-person meeting held on February 28, 2017 (Meeting), the Board of Trustees (Board) of Franklin Global Trust, including a majority of the trustees who are not “interested persons” as defined in the Investment Company Act of 1940 (Independent Trustees), reviewed and approved the continuance of the investment management agreement between Franklin Templeton Investment Management, Ltd. (Manager) and the Fund (Management Agreement) for an additional one-year period. The Independent Trustees received advice from and met separately with Independent Trustee counsel in considering whether to approve the continuation of the Management Agreement.
In considering the continuation of the Management Agreement, the Board reviewed and considered information provided by the Manager at the Meeting and throughout the year at meetings of the Board and its committees. The Board also reviewed and considered information provided in response to a detailed set of requests for information submitted to the Manager by Independent Trustee counsel on behalf of the Independent Trustees in connection with the annual contract renewal process. In addition, prior to the Meeting, the Independent Trustees held a telephonic contract renewal meeting at which the Independent Trustees conferred amongst themselves and Independent Trustee counsel about contract renewal matters. The Board reviewed and considered all of the factors it deemed relevant in approving the continuance of the Management Agreement, including, but not limited to: (i) the nature, extent, and quality of the services provided by the Manager; (ii) the investment performance of the Fund; (iii) the costs of the services provided and profits realized by the Manager and its affiliates from the relationship with the Fund; (iv) the extent to which economies of scale are realized as the Fund grows; and (v) whether fee levels reflect these economies of scale for the benefit of Fund investors.
In approving the continuance of the Management Agreement, the Board, including a majority of the Independent Trustees, determined that the existing management fees are fair and reasonable and that the continuance of such Management Agreement is in the interests of the Fund and its shareholders. While attention was given to all information furnished, the
following discusses some primary factors relevant to the Board’s determination.
Nature, Extent and Quality of Services
The Board reviewed and considered information regarding the nature, extent and quality of investment management services provided by the Manager and its affiliates to the Fund and its shareholders. This information included, among other things, the qualifications, background and experience of the senior management and investment personnel of the Manager; the structure of investment personnel compensation; oversight of third-party service providers; investment performance reports and related financial information for the Fund; reports on expenses, shareholder services, marketing support payments made to financial intermediaries and third party servicing arrangements; legal and compliance matters; risk controls; pricing and other services provided by the Manager and its affiliates; and management fees charged by the Manager and its affiliates to U.S. funds and other accounts, including management’s explanation of differences among accounts where relevant. The Board noted management’s continual efforts and expenditures in establishing effective business continuity plans and developing strategies to address areas of heightened concern in the mutual fund industry, such as cybersecurity, derivatives and liquidity risk management.
The Board also reviewed and considered the benefits provided to Fund shareholders of investing in a fund that is part of the Franklin Templeton family of funds. The Board noted the financial position of Franklin Resources, Inc. (FRI), the Manager’s parent, and its commitment to the mutual fund business as evidenced by its continued introduction of new funds, reassessment of the fund offerings in response to the market environment and project initiatives and capital investments relating to the services provided to the Fund by the Franklin Templeton Investments (FTI) organization.
Following consideration of such information, the Board was satisfied with the nature, extent and quality of services provided by the Manager and its affiliates to the Fund and its shareholders.
Fund Performance
The Board reviewed and considered the performance results of the Fund over various time periods ended December 31, 2016. The Board considered the performance returns for the Fund in comparison to the performance returns of mutual funds deemed comparable to the Fund included in a universe (Performance Universe) selected by Broadridge Financial Solutions, Inc. (Broadridge), an independent provider of investment company
| | | | |
| | | |
| 40 | | Annual Report | | ftinstitutional.com |
FRANKLIN GLOBAL TRUST
FRANKLIN EMERGING MARKET DEBT OPPORTUNITIES FUND
SHAREHOLDER INFORMATION
data. The Board received a description of the methodology used by Broadridge to select the mutual funds included in a Performance Universe. The Board also reviewed and considered Fund performance reports provided and discussions that occurred with portfolio managers at Board meetings throughout the year. A summary of the Fund’s performance results is below.
The Performance Universe for the Fund included the Fund and all retail and institutional emerging markets hard currency debt funds. The Board noted that the Fund’s annualized total return for the one-, five- and 10-year periods was above the median of its Performance Universe, and for the three-year period was below the median of its Performance Universe. The Board concluded that the Fund’s performance was satisfactory. In doing so, the Board noted that the Fund’s annualized total return for the one-year period was 12.44%.
Comparative Fees and Expenses
The Board reviewed and considered information regarding the Fund’s actual total expense ratio and its various components, including, as applicable, management fees; transfer agent expenses; underlying fund expenses; Rule 12b-1 and non-Rule 12b-1 service fees; and other non-management fees. The Board also noted that at its February meeting each year, it receives an annual report on all marketing support payments made by FTI to financial intermediaries. The Board considered the actual total expense ratio and, separately, the contractual management fee rate, without the effect of fee waivers, if any (Management Rate) of the Fund in comparison to the median ratio and median Management Rate, respectively, of other mutual funds deemed comparable to and with a similar expense structure as the Fund selected by Broadridge (Expense Group). Broadridge fee and expense data is based upon information taken from the fund’s most recent annual report, which reflects historical asset levels that may be quite different from those currently existing, particularly in a period of market volatility. While recognizing such inherent limitation and the fact that expense ratios and Management Rates generally increase as assets decline and decrease as assets grow, the Board believed the independent analysis conducted by Broadridge to be an appropriate measure of comparative fees and expenses. The Broadridge Management Rate includes administrative charges, and the actual total expense ratio, for comparative consistency, was shown for Institutional Class shares for funds with multiple classes of shares. The Board received a description of the methodology used by Broadridge to select the mutual funds included in an Expense Group.
The Expense Group for the Fund included the Fund and thirteen other emerging markets hard currency debt funds. The Board noted that the Management Rate and actual total expense ratio for the Fund were above the medians of its Expense Group. The Board concluded that the Management Rate charged to the Fund is fair and reasonable. In doing so, the Board acknowledged management’s explanation that there are additional complexities and expenses associated with the management of the specialized portfolio. Further, the Board noted that the Fund’s actual total expense ratio reflected a fee waiver from management after which the Fund was only slightly above the median.
Profitability
The Board reviewed and considered information regarding the profits realized by the Manager and its affiliates in connection with the operation of the Fund. In this respect, the Board considered the Fund profitability analysis provided by the Manager that addresses the overall profitability of FTI’s U.S. fund business, as well as its profits in providing investment management and other services to each of the individual funds during the 12-month period ended September 30, 2016, being the most recent fiscal year-end for FRI. The Board noted that although management continually makes refinements to its methodologies used in calculating profitability in response to organizational and product related changes, the overall methodology has remained consistent with that used in the Fund’s profitability report presentations from prior years. Additionally, the Fund’s independent registered public accounting firm has been engaged by the Manager to periodically review the reasonableness of the allocation methodologies to be used solely by the Fund’s Board with respect to the profitability analysis.
The Board noted management’s belief that costs incurred in establishing the infrastructure necessary for the type of mutual fund operations conducted by the Manager and its affiliates may not be fully reflected in the expenses allocated to the Fund in determining its profitability, as well as the fact that the level of profits, to a certain extent, reflected operational cost savings and efficiencies initiated by management. The Board also noted management’s expenditures in improving shareholder services provided to the Fund, as well as the need to implement systems and meet additional regulatory and compliance requirements resulting from recent SEC and other regulatory requirements.
The Board also considered the extent to which the Manager and its affiliates might derive ancillary benefits from fund operations, including revenues generated from transfer agent
| | | | |
| | | |
| ftinstitutional.com | | Annual Report | | 41 |
FRANKLIN GLOBAL TRUST
FRANKLIN EMERGING MARKET DEBT OPPORTUNITIES FUND
SHAREHOLDER INFORMATION
services, potential benefits resulting from personnel and systems enhancements necessitated by fund growth, as well as increased leverage with service providers and counterparties. Based upon its consideration of all these factors, the Board concluded that the level of profits realized by the Manager and its affiliates from providing services to the Fund was not excessive in view of the nature, quality and extent of services provided to the Fund.
Economies of Scale
The Board reviewed and considered the extent to which the Manager may realize economies of scale, if any, as the Fund grows larger and whether the Fund’s management fee structure reflects any economies of scale for the benefit of shareholders. With respect to possible economies of scale, the Board noted the existence of management fee breakpoints, which operate generally to share any economies of scale with a Fund’s shareholders by reducing the Fund’s effective management fees as the Fund grows in size. The Board considered the Manager’s view that any analyses of potential economies of scale in managing a particular fund are inherently limited in light of the joint and common costs and investments the Manager incurs across the Franklin Templeton family of funds as a whole. The Board concluded that to the extent economies of scale may be realized by the Manager and its affiliates, the Fund’s management fee structure provided a sharing of benefits with the Fund and its shareholders as the Fund grows.
Conclusion
Based on its review, consideration and evaluation of all factors it believed relevant, including the above-described factors and conclusions, the Board unanimously approved the continuation of the Management Agreement for an additional one-year period.
Proxy Voting Policies and Procedures
The Fund’s investment manager has established Proxy Voting Policies and Procedures (Policies) that the Fund uses to determine how to vote proxies relating to portfolio securities. Shareholders may view the Fund’s complete Policies online at franklintempleton.com. Alternatively, shareholders may request copies of the Policies free of charge by calling the Proxy Group collect at (954) 527-7678 or by sending a written request to: Franklin Templeton Companies, LLC, 300 S.E. 2nd Street, Fort Lauderdale, FL 33301, Attention: Proxy Group. Copies of the Fund’s proxy voting records are also made available online at franklintempleton.com and posted on the U.S. Securities and Exchange Commission’s website at sec.gov and reflect the most recent 12-month period ended June 30.
Quarterly Consolidated Statement of Investments
The Trust, on behalf of the Fund, files a complete consolidated statement of investments with the U.S. Securities and Exchange Commission for the first and third quarters for each fiscal year on Form N-Q. Shareholders may view the filed Form N-Q by visiting the Commission’s website at sec.gov. The filed form may also be viewed and copied at the Commission’s Public Reference Room in Washington, DC. Information regarding the operations of the Public Reference Room may be obtained by calling (800) SEC-0330.
Householding of Reports and Prospectuses
You will receive the Fund’s financial reports every six months as well as an annual updated summary prospectus (prospectus available upon request). To reduce Fund expenses, we try to identify related shareholders in a household and send only one copy of the financial reports and summary prospectus. This process, called “householding,” will continue indefinitely unless you instruct us otherwise. If you prefer not to have these documents householded, please call us at (800) 632-2301. At any time you may view current prospectuses/summary prospectuses and financial reports on our website. If you choose, you may receive these documents through electronic delivery.
| | | | |
| | | |
| 42 | | Annual Report | | ftinstitutional.com |
This page intentionally left blank.
This page intentionally left blank.
| | |
 | | Annual Report Franklin Emerging Market Debt Opportunities Fund Investment Manager Franklin Templeton Investment Management Limited Distributor Franklin Templeton Distributors, Inc. Franklin Templeton Institutional Services (800) 321-8563 ftinstitutional.com |
Authorized for distribution only when accompanied or preceded by a summary prospectus and/or prospectus. Investors should carefully consider a fund’s investment goals, risks, charges and expenses before investing. A prospectus contains this and other information; please read it carefully before investing.
To help ensure we provide you with quality service, all calls to and from our service areas are monitored and/or recorded.
| | |
| © 2017 Franklin Templeton Investments. All rights reserved. . | | 699 A 09/17 |
| | |
| | Annual Report and Shareholder Letter July 31, 2017 |
Franklin Global Listed Infrastructure Fund
A SERIES OF FRANKLIN GLOBAL TRUST
Sign up for electronic delivery at franklintempleton.com/edelivery
Franklin Templeton Investments
Gain From Our Perspective®
At Franklin Templeton Investments, we’re dedicated to one goal: delivering exceptional asset management for our clients. By bringing together multiple, world-class investment teams in a single firm, we’re able to offer specialized expertise across styles and asset classes, all supported by the strength and resources of one of the world���s largest asset managers. This has helped us to become a trusted partner to individual and institutional investors across the globe.
Dear Shareholder:
The 12 months ended July 31, 2017, benefited from mostly upbeat global economic data, improved corporate earnings and generally supportive monetary policies. The U.S. job market remained healthy as the unemployment rate declined. The U.S. Federal Reserve raised its federal funds target rate three times during the period and hinted at its July meeting that it may begin reducing its balance sheet. The global economy expanded moderately as the eurozone and Japanese economies reported strong economic data and their respective central banks maintained low interest rates. In this environment, U.S. stocks, as measured by the Standard & Poor’s® 500 Index, and global developed market stocks, as measured by the MSCI World Index, ended the period with positive returns.
We are committed to our long-term perspective and disciplined investment approach as we conduct a rigorous, fundamental analysis of securities with a regular emphasis on investment risk management.
We believe active, professional investment management serves investors well. We also recognize the important role of financial advisors in today’s markets and encourage investors to continue to seek their advice. Amid changing markets and economic conditions, we are confident investors with a well-diversified portfolio and a patient, long-term outlook should be well positioned for the years ahead.
Franklin Global Listed Infrastructure Fund’s annual report includes more detail about prevailing conditions and discussions about investment decisions during the period. Please remember all securities markets fluctuate, as do mutual fund share prices.
We thank you for investing with Franklin Templeton, welcome your questions and comments, and look forward to serving your future investment needs.
Sincerely,
Edward B. Jamieson
President and Chief Executive Officer –
Investment Management
Franklin Global Trust
This letter reflects our analysis and opinions as of July 31, 2017, unless otherwise indicated. The information is not a complete analysis of every aspect of any market, country, industry, security or fund. Statements of fact are from sources considered reliable.
| | | | | | | | |
| Not FDIC Insured | | | | | May Lose Value | | | | | No Bank Guarantee |
| | | | |
franklintempleton.com | | Not part of the annual report | | 1 |
Contents
Annual Report
Visit franklintempleton.com for fund updates, to access your account, or to find helpful financial planning tools.
| | | | | | |
| 2 | | | Annual Report | | franklintempleton.com |
Annual Report
Franklin Global Listed Infrastructure Fund
This annual report for Franklin Global Listed Infrastructure Fund covers the fiscal year ended July 31, 2017.
Your Fund’s Goal and Main Investments
The Fund seeks total investment return consisting of income and capital appreciation by investing, under normal market conditions, predominantly in infrastructure related companies globally, as defined in the Fund’s prospectus.
Performance Overview
For the period under review, the Fund’s Class A shares generated a +12.68% cumulative total return. In comparison, the Standard & Poor’s (S&P) Global Infrastructure Index, which tracks performance of stocks of large infrastructure companies around the world, posted a +13.31% cumulative total return.1 You can find more of the Fund’s performance data in the Performance Summary beginning on page 8.
Performance data represent past performance, which does not guarantee future results. Investment return and principal value will fluctuate, and you may have a gain or loss when you sell your shares. Current performance may differ from figures shown. For most recent month-end performance, go to franklintempleton.com or call (800) 342-5236.
Economic and Market Overview
The U.S. economy generally expanded during the 12-month period ended July 31, 2017. The economy strengthened in 2017’s second quarter, after moderating in the previous two quarters, largely due to growth in consumer spending, business investment and federal government spending. The manufacturing sector generally expanded, and the services sector also continued to grow during the period. The unemployment rate decreased from 4.9% in July 2016 to 4.3% at period-end.2 Annual inflation, as measured by the Consumer Price Index, increased from 0.8% to 1.7% during the period. Monthly retail sales were volatile, but mostly grew during the period.
Portfolio Composition
Based on Total Net Assets as of 7/31/17
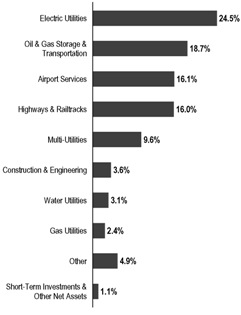
The U.S. Federal Reserve (Fed) raised its target range for the federal funds rate by 0.25% three times during the period amid signs of a growing U.S. economy, a strengthening labor market and an improvement in business spending. At its July meeting, the Fed kept its target range unchanged, but signaled it expects to begin implementing its balance sheet reduction relatively soon, provided the economy continues to evolve as anticipated. The broad U.S. stock market, as measured by the Standard & Poor’s® 500 Index, advanced for the 12 months ended July 31, 2017.
The global economy grew moderately during the 12 months under review. In this environment, global developed and emerging market stocks rose, as measured by the MSCI All
1. Source: Morningstar.
The index is unmanaged and includes reinvestment of any income or distributions. It does not reflect any fees, expenses or sales charges. One cannot invest directly in an index, and an index is not representative of the Fund’s portfolio.
2. Source: Bureau of Labor Statistics.
The dollar value, number of shares or principal amount, and names of all portfolio holdings are listed in the Fund’s Statement of Investments (SOI). The SOI begins on page 17.
| | | | | | |
| franklintempleton.com | | Annual Report | | | 3 | |
FRANKLIN GLOBAL LISTED INFRASTRUCTURE FUND
Country World Index. Global markets were aided by improved industrial commodity prices at certain points during the period, generally upbeat economic data across regions, investor optimism about pro-growth and pro-business policies in the U.S., hopes of tax reforms under the Trump administration, Emmanuel Macron’s election as France’s president, accommodative monetary policies of various global central banks, and encouraging corporate earnings reports.
However, investors expressed concerns about the timing and economic effects of the U.K.’s exit from the European Union (also known as “Brexit”) and the U.S. executive order banning entry from some Muslim-majority countries. Other headwinds included the health of European banks, concerns surrounding political uncertainty in the U.S. and European Union, geopolitical tensions in certain regions, worries about global oversupply in oil production despite a pact to extend cuts, and hawkish comments from key central bankers around the world.
In Europe, the U.K.’s economy grew at a slower rate in 2017’s first quarter over the previous quarter, largely due to slower growth in household spending. However, the nation’s growth rate improved slightly in 2017’s second quarter, supported by growth in services. The Bank of England cut its benchmark interest rate and expanded its massive bond-buying program in August 2016 to boost the nation’s growth. The eurozone’s growth increased in 2017’s second quarter over the previous quarter. The bloc’s annual inflation rate, while low, ended higher than it was at the start of the period. The European Central Bank (ECB) kept its key policy rates unchanged during the period. However, at its July meeting, ECB president Mario Draghi signaled that the bank would reassess its policy stance on quantitative easing in the fall of 2017.
In Asia, Japan’s quarterly gross domestic product (GDP) grew at the fastest rate in more than two years, driven by household spending, capital expenditure and government spending. In July 2017, the Bank of Japan slightly increased its GDP forecasts for the 2017 and 2018 fiscal years, but lowered its inflation forecasts for the same period. China’s annual GDP grew faster in the first and second quarters of 2017 compared with the third and fourth quarters of 2016. The People’s Bank of China left its benchmark interest rate unchanged during the period.
Investment Strategy
When selecting investments for the Fund’s portfolio, we use a bottom-up stock selection process that incorporates macro-level views in the evaluation process. Our portfolio construction process combines bottom-up analysis of individual stock and infrastructure market fundamentals with top-down macro overlays to provide country/regional, infrastructure sector and
Geographic Composition
Based on Total Net Assets as of 7/31/17
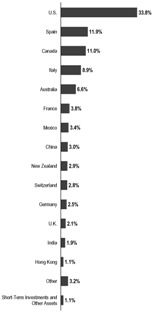
company size perspectives in identifying international/local cyclical and thematic trends that highlight investment opportunities. Under normal market conditions, the Fund invests at least 80% of its net assets in securities listed on a domestic or foreign exchange of companies that are located around the world (including emerging markets) and whose principal business is the ownership, management, construction, operation, use or financing of infrastructure assets. Under normal market conditions, the Fund expects to invest at least 40% of its net assets in foreign securities. We may invest up to 20% of net assets in emerging markets and may invest in
| | | | |
4 | | Annual Report | | franklintempleton.com |
FRANKLIN GLOBAL LISTED INFRASTRUCTURE FUND
infrastructure-related companies of any market capitalization size. We may use derivative instruments, including currency forward and futures contracts from time to time to help manage currency risks and manage local currency exposure.
What is a currency forward contract?
A currency forward contract is an agreement between the Fund and a counterparty to buy or sell a foreign currency in exchange for another currency at a specific exchange rate on a future date.
What is a futures contract?
A futures contract is an agreement between the Fund and a counterparty made through a U.S. or foreign futures exchange to buy or sell an underlying instrument or asset at a specific price on a future date.
| | | | |
| Top 10 Holdings | | | |
| 7/31/17 | | | |
| |
Company Sector/Industry, Country | | % of Total
Net Assets | |
Transurban Group Highways & Railtracks, Australia | | | 6.0% | |
Atlantia SpA Highways & Railtracks, Italy | | | 4.9% | |
Aena SA Airport Services, Spain | | | 4.7% | |
American Electric Power Co. Inc. Electric Utilities, U.S. | | | 4.2% | |
TransCanada Corp. Oil & Gas Storage & Transportation, Canada | | | 4.2% | |
PG&E Corp. Electric Utilities, U.S. | | | 3.5% | |
Enel SpA Electric Utilities, Italy | | | 3.3% | |
DTE Energy Co. Multi-Utilities, U.S. | | | 3.2% | |
NextEra Energy Inc. Electric Utilities, U.S. | | | 3.0% | |
Sempra Energy Multi-Utilities, U.S. | | | 2.9% | |
Manager’s Discussion
During the 12-month period under review, key contributors to the Fund’s performance relative to the S&P Global Infrastructure Index included stock selection in the utilities
sector, notably the Fund’s investment in electric utility Adani Transmission.3,4 India-based Adani Transmission builds and owns regulated transmission lines across India. We believe the firm is one of India’s best managed transmission companies. We expect the company’s earnings-per-share to grow significantly over the next three years based on currently approved and under-construction projects. The company has also bought transmission assets from distressed infrastructure developers. The firm completed two sets of transmission acquisitions over the past several months of the reporting period. We like their strategy of growth through acquisitions and building new transmission lines. The company’s management team has extensive experience developing infrastructure assets across India. We also believe company valuations in India are cheap due to assets being sold at fire sale prices by distressed infrastructure companies. As Adani sought to reduce risk with new projects, the company’s stock continued to rise. Also, due to the contractual fixed-fee nature of this business, once a transmission line is commissioned it does not have any exposure to power markets.
Security selection in the energy sector also boosted relative Fund performance significantly, due to our investment in U.S.-based pipeline operator Cheniere Energy Partners.4 Shares of Cheniere Energy rose steadily during the reporting period as investors responded to the successful implementation of the company’s Sabine Pass terminal in Louisiana, which has delivered shipments of liquefied natural gas to South America and Mexico since the terminal opened in February 2016.
Although industrials were an overall detractor at the sector level, the Fund’s overweighted investment in Flughafen Zurich, operator of the Zurich airport, boosted results relative to the benchmark.5 The company has benefited from above-trend traffic growth based on positive developments from flagship carrier Swiss Air. Flughafen Zurich boasts the strongest balance sheet of its European airport peers, which should allow for a yearly capital distribution through the end of the decade and has supported the share price. We also see the management team as particularly disciplined with relatively low appetite for transformational international investments. More generally, many global airports have seen strong price share performance in the period, which has corresponded with solid passenger traffic momentum across the industry.
3. The utilities sector comprises electric utilities, gas utilities, multi-utilities, renewable electricity and water utilities in the SOI.
4. Not part of the index.
5. The industrials sector comprises airport services, construction and engineering, highways and railtracks, and marine ports and services in the SOI.
| | | | | | |
| franklintempleton.com | | Annual Report | | | 5 | |
FRANKLIN GLOBAL LISTED INFRASTRUCTURE FUND
It is important to recognize the effect of currency movements on the Fund’s performance. In general, if the value of the U.S. dollar goes up compared with a foreign currency, an investment traded in that foreign currency will go down in value because it will be worth fewer U.S. dollars. This can have a negative effect on Fund performance. Conversely, when the U.S. dollar weakens in relation to a foreign currency, an investment traded in that foreign currency will increase in value, which can contribute to Fund performance. For the 12 months ended July 31, 2017, the U.S. dollar declined in value relative to most currencies. As a result, the Fund’s performance was positively affected by the portfolio’s substantial investment in securities with non-U.S. currency exposure. However, one cannot expect the same result in future periods.
In contrast, security selection and an underweighted position in the industrials sector (specifically the transportation infrastructure industry) detracted from relative Fund performance over the 12-month reporting period. Shares of Spain-based Abertis, the largest operator of toll roads globally, with assets in multiple countries have underperformed European transportation peers for much of the past few years. The market seemed fixated on the company’s struggles to invest its cash given the high demand for operational toll roads from direct institutional investors. The share price was also hampered by a legal dispute with the Spanish government over the company’s right to collect a receivable that represents a material portion of its equity value. During the period, however, Abertis successfully increased its stake in a French toll road, easing market concerns about near-term capital deployment, and experienced a favorable ruling in the aforementioned court case. Then, in April 2017, toll-road operator peer Atlantia communicated its intentions to make a cash and stock offer for Abertis shares. The Atlantia offer, as well as market rumors suggesting there may be competing bids, has further supported Abertis’ share price since that time.
Although utilities were an overall contributor at the sector level, the Fund’s investment in EDP Renovaveis, a global renewable energy company headquartered in Spain, detracted from results compared to the benchmark.4,6 The company expects to increase its global capacity by 2020, and a majority of its investments will be in U.S. wind generation. During the period under review, the market interpreted Donald Trump’s victory in the U.S. presidential election as a negative for the renewable energy business, which prompted a sharp sell-off in the stock. We found the company’s valuation compelling after
the sell-off, and believed the long-term attractiveness of its renewables assets and development expertise would likely not change despite short-term uncertainty.
The Fund’s investment in U.S.-based MPLX also hindered relative returns.4 MPLX is a fee-based, growth-oriented master limited partnership formed in 2012 by Marathon Petroleum Corporation to own, operate, develop and acquire pipelines and other midstream assets related to the transportation and storage of crude oil, refined products and other hydrocarbon-based products. MPLX’s assets consist of a network of common carrier crude oil and product pipeline systems located in the Midwest and Gulf Coast regions of the U.S. and a butane storage cavern located in West Virginia with approximately one million barrels of natural gas liquids storage capacity. The company has experienced substantial equity dilution to finance growth projects in the first half of 2017. Secondly, some project delays also reduced MPLX gas processing volumes. Finally, investors were concerned about the structure of the company, as the company is set to eliminate incentive distribution rights in 2018.
Thank you for your continued participation in Franklin Global Listed Infrastructure Fund. We look forward to serving your future investment needs.
| | |
 | | 
Wilson Magee |
| | |
 | | 
Ketul Sakhpara, CFA |
| | Emily Foshag, CFA Portfolio Management Team |
CFA® is a trademark owned by CFA Institute.
6. No longer held at period-end.
See www.franklintempletondatasources.com for additional data provider information.
| | | | |
| 6 | | Annual Report | | franklintempleton.com |
FRANKLIN GLOBAL LISTED INFRASTRUCTURE FUND
The foregoing information reflects our analysis, opinions and portfolio holdings as of July 31, 2017, the end of the reporting period. The way we implement our main investment strategies and the resulting portfolio holdings may change depending on factors such as market and economic conditions. These opinions may not be relied upon as investment advice or an offer for a particular security. The information is not a complete analysis of every aspect of any market, country, industry, security or the Fund. Statements of fact are from sources considered reliable, but the investment manager makes no representation or warranty as to their completeness or accuracy. Although historical performance is no guarantee of future results, these insights may help you understand our investment management philosophy.
| | | | | | |
| franklintempleton.com | | Annual Report | | | 7 | |
FRANKLIN GLOBAL LISTED INFRASTRUCTURE FUND
Performance Summary as of July 31, 2017
The performance table and graphs do not reflect any taxes that a shareholder would pay on Fund dividends, capital gain distributions, if any, or any realized gains on the sale of Fund shares. Total return reflects reinvestment of the Fund’s dividends and capital gain distributions, if any, and any unrealized gains or losses. Your dividend income will vary depending on dividends or interest paid by securities in the Fund’s portfolio, adjusted for operating expenses of each class. Capital gain distributions are net profits realized from the sale of portfolio securities.
Performance as of 7/31/171
Cumulative total return excludes sales charges. Average annual total return includes maximum sales charges. Sales charges will vary depending on the size of the investment and the class of share purchased. The maximum is 5.75% and the minimum is 0%. Class A: 5.75% maximum initial sales charge; Advisor Class: no sales charges. For other share classes, visit franklintempleton.com.
| | | | | | | | |
| Share Class | | Cumulative
Total Return2 | | | Average Annual
Total Return3 | |
| | |
A | | | | | | | | |
1-Year | | | +12.68% | | | | +6.23% | |
3-Year | | | +18.55% | | | | +3.77% | |
Since Inception (9/6/13) | | | +47.95% | | | | +8.90% | |
| | |
Advisor | | | | | | | | |
1-Year | | | +13.05% | | | | +13.05% | |
3-Year | | | +19.54% | | | | +6.13% | |
Since Inception (9/6/13) | | | +49.57% | | | | +10.88% | |
Performance data represent past performance, which does not guarantee future results. Investment return and principal value will fluctuate, and you may have a gain or loss when you sell your shares. Current performance may differ from figures shown. For most recent month-end performance, go to franklintempleton.com or call (800) 342-5236.
See page 10 for Performance Summary footnotes.
| | | | |
| 8 | | Annual Report | | franklintempleton.com |
FRANKLIN GLOBAL LISTED INFRASTRUCTURE FUND
PERFORMANCE SUMMARY
Total Return Index Comparison for a Hypothetical $10,000 Investment1
Total return represents the change in value of an investment over the periods shown. It includes any applicable maximum sales charge, Fund expenses, account fees and reinvested distributions. The unmanaged index includes reinvestment of any income or distributions. It differs from the Fund in composition and does not pay management fees or expenses. One cannot invest directly in an index.
Class A (9/6/13–7/31/17)
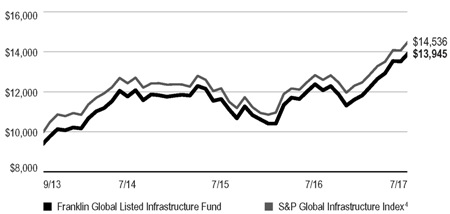
Advisor Class (9/6/13–7/31/17)
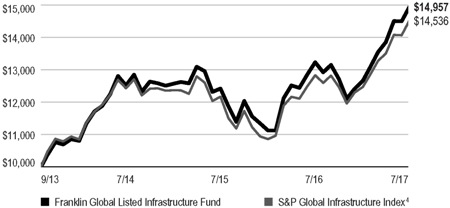
See page 10 for Performance Summary footnotes.
| | | | | | |
| franklintempleton.com | | Annual Report | | | 9 | |
FRANKLIN GLOBAL LISTED INFRASTRUCTURE FUND
PERFORMANCE SUMMARY
Distributions (8/1/16–7/31/17)
| | | | |
Share Class | | Net Investment
Income | |
A | | | $0.2238 | |
C | | | $0.1442 | |
R | | | $0.2092 | |
R6 | | | $0.2719 | |
Advisor | | | $0.2563 | |
| | | | | | | | | | | | |
Total Annual Operating Expenses5 | | | | | | |
Share Class | | With Waiver | | | Without Waiver | | | | | | |
A | | | 1.40% | | | 2.24% | | | | | | |
Advisor | | | 1.15% | | | 1.99% | | | | | | |
Each class of shares is available to certain eligible investors and has different annual fees and expenses, as described in the prospectus.
All investments involve risks, including possible loss of principal. Investments in infrastructure-related securities involve special risks, such as high interest costs, high leverage and increased susceptibility to adverse economic or regulatory developments affecting the sector. Special risks are associated with foreign investing, including currency rate fluctuations, economic instability and political developments. Because the Fund may invest at least a significant portion of its assets in companies in a specific region, including Europe, the Fund is subject to greater risks of adverse developments in that region (i.e., including uncertainty related to the U.K.’s vote to exit the European Union (EU) and financial instability in some countries in the EU including Greece, Italy and Spain) and/or the surrounding regions than a fund that is more broadly diversified geographically. Investments in utility company securities, if purchased for dividend yield, involve additional interest rate risks. When interest rates have risen, the stock prices of these companies have tended to fall. Thus, as the prices of utility company stocks in the Fund adjust to a rise in interest rates, the Fund’s share price may decline. The Fund is actively managed but there is no guarantee that the manager’s investment decisions will produce the desired results. The Fund’s prospectus also includes a description of the main investment risks.
1. The Fund has an expense reduction contractually guaranteed through 11/30/17. Fund investment results reflect the expense reduction; without this reduction, the results would have been lower.
2. Cumulative total return represents the change in value of an investment over the periods indicated.
3. Average annual total return represents the average annual change in value of an investment over the periods indicated. Return for less than one year, if any, has not been annualized.
4. Source: Morningstar. The S&P Global Infrastructure Index tracks performance of stocks of large infrastructure companies around the world. The index includes companies involved in utilities, energy and transportation infrastructure, such as management or ownership of oil and gas storage and transportation; airport services; highways and rail tracks; marine ports and services; and electric, gas and water utilities.
5. Figures are as stated in the Fund’s current prospectus and may differ from the expense ratios disclosed in the Your Fund’s Expenses and Financial Highlights sections in this report. In periods of market volatility, assets may decline significantly, causing total annual Fund operating expenses to become higher than the figures shown.
See www.franklintempletondatasources.com for additional data provider information.
| | | | |
10 | | Annual Report | | franklintempleton.com |
FRANKLIN GLOBAL LISTED INFRASTRUCTURE FUND
Your Fund’s Expenses
As a Fund shareholder, you can incur two types of costs: (1) transaction costs, including sales charges (loads) on Fund purchases and redemptions; and (2) ongoing Fund costs, including management fees, distribution and service (12b-1) fees, and other Fund expenses. All mutual funds have ongoing costs, sometimes referred to as operating expenses. The table below shows ongoing costs of investing in the Fund and can help you understand these costs and compare them with those of other mutual funds. The table assumes a $1,000 investment held for the six months indicated.
Actual Fund Expenses
The table below provides information about actual account values and actual expenses in the columns under the heading “Actual.” In these columns the Fund’s actual return, which includes the effect of Fund expenses, is used to calculate the “Ending Account Value” for each class of shares. You can estimate the expenses you paid during the period by following these steps (of course, your account value and expenses will differ from those in this illustration): Divide your account value by $1,000 (if your account had an $8,600 value, then $8,600 ÷ $1,000 = 8.6). Then multiply the result by the number in the row for your class of shares under the headings “Actual” and “Expenses Paid During Period” (if Actual Expenses Paid During Period were $7.50, then 8.6 x $7.50 = $64.50). In this illustration, the actual expenses paid this period are $64.50.
Hypothetical Example for Comparison with Other Funds
Under the heading “Hypothetical” in the table, information is provided about hypothetical account values and hypothetical expenses based on the Fund’s actual expense ratio and an assumed rate of return of 5% per year before expenses, which is not the Fund’s actual return. This information may not be used to estimate the actual ending account balance or expenses you paid for the period, but it can help you compare ongoing costs of investing in the Fund with those of other funds. To do so, compare this 5% hypothetical example for the class of shares you hold with the 5% hypothetical examples that appear in the shareholder reports of other funds.
Please note that expenses shown in the table are meant to highlight ongoing costs and do not reflect any transactional costs. Therefore, information under the heading “Hypothetical” is useful in comparing ongoing costs only, and will not help you compare total costs of owning different funds. In addition, if transactional costs were included, your total costs would have been higher.
| | | | | | | | | | | | | | | | | | |
| | | | | | | Actual (actual return after expenses) | | | | Hypothetical (5% annual return before expenses) | | | | |
Share Class | | Beginning Account Value 2/1/17 | | | | Ending Account Value 7/31/17 | | Expenses Paid During Period 2/1/17–7/31/171,2 | | | | Ending Account Value 7/31/17 | | Expenses Paid During Period 2/1/17–7/31/171,2 | | | | Net Annualized Expense Ratio2 |
| A | | $1,000 | | | | $1,180.10 | | $ 7.35 | | | | $1,018.05 | | $ 6.80 | | | | 1.36% |
| C | | $1,000 | | | | $1,176.20 | | $11.39 | | | | $1,014.33 | | $10.54 | | | | 2.11% |
| R | | $1,000 | | | | $1,179.50 | | $ 8.48 | | | | $1,017.01 | | $ 7.85 | | | | 1.57% |
| R6 | | $1,000 | | | | $1,183.20 | | $ 4.98 | | | | $1,020.23 | | $ 4.61 | | | | 0.92% |
| Advisor | | $1,000 | | | | $1,181.80 | | $ 6.00 | | | | $1,019.29 | | $ 5.56 | | | | 1.11% |
1. Expenses are equal to the annualized expense ratio for the six-month period as indicated above—in the far right column—multiplied by the simple average account value over the period indicated, and then multiplied by 181/365 to reflect the one-half year period.
2. Reflects expenses after fee waivers and expense reimbursements. Does not include acquired fund fees and expenses.
| | | | | | |
franklintempleton.com | | Annual Report | | | 11 | |
FRANKLIN GLOBAL TRUST
Financial Highlights
Franklin Global Listed Infrastructure Fund
| | | | | | | | | | | | | | | | |
| | | Year Ended July 31, | |
| | | 2017 | | | 2016 | | | 2015 | | | 2014a | |
| Class A | | | | | | | | | | | | | | | | |
Per share operating performance (for a share outstanding throughout the year) | | | | | | | | | | | | | | | | |
| | | | |
Net asset value, beginning of year | | | $12.35 | | | | $11.81 | | | | $12.35 | | | | $10.00 | |
| | | | |
| | | | |
| Income from investment operationsb: | | | | | | | | | | | | | | | | |
| | | | |
Net investment incomec | | | 0.26 | | | | 0.22 | | | | 0.19 | | | | 0.27 | |
| | | | |
Net realized and unrealized gains (losses) | | | 1.27 | | | | 0.51 | | | | (0.34 | ) | | | 2.20 | |
| | | | |
| | | | |
Total from investment operations | | | 1.53 | | | | 0.73 | | | | (0.15 | ) | | | 2.47 | |
| | | | |
| | | | |
| Less distributions from: | | | | | | | | | | | | | | | | |
| | | | |
Net investment income | | | (0.22 | ) | | | (0.18 | ) | | | (0.19 | ) | | | (0.11 | ) |
| | | | |
Net realized gains | | | — | | | | (0.01 | ) | | | (0.20 | ) | | | (0.01 | ) |
| | | | |
| | | | |
Total distributions | | | (0.22 | ) | | | (0.19 | ) | | | (0.39 | ) | | | (0.12 | ) |
| | | | |
| | | | |
Net asset value, end of year | | | $13.66 | | | | $12.35 | | | | $11.81 | | | | $12.35 | |
| | | | |
| | | | |
Total returnd | | | 12.68% | | | | 6.35% | | | | (1.08)% | | | | 24.81% | |
| | | | |
| Ratios to average net assetse | | | | | | | | | | | | | | | | |
| | | | |
Expenses before waiver and payments by affiliates | | | 1.99% | | | | 2.24% | | | | 2.21% | | | | 4.03% | |
| | | | |
Expenses net of waiver and payments by affiliatesf | | | 1.38% | | | | 1.40% | | | | 1.45% | | | | 1.28% | |
| | | | |
Net investment income | | | 2.10% | | | | 1.93% | | | | 1.62% | | | | 2.59% | |
| | | | |
| Supplemental data | | | | | | | | | | | | | | | | |
| | | | |
Net assets, end of year (000’s) | | | $39,991 | | | | $24,889 | | | | $28,568 | | | | $14,934 | |
| | | | |
Portfolio turnover rate | | | 71.81% | | | | 63.57% | | | | 50.75% | | | | 35.24% | |
aFor the period September 6, 2013 (commencement of operations) to July 31, 2014.
bThe amount shown for a share outstanding throughout the period may not correlate with the Statement of Operations for the period due to the timing of sales and repurchases of the Fund’s shares in relation to income earned and/or fluctuating fair value of the investments of the Fund.
cBased on average daily shares outstanding.
dTotal return does not reflect sales commissions or contingent deferred sales charges, if applicable, and is not annualized for periods less than one year.
eRatios are annualized for periods less than one year.
fBenefit of expense reduction rounds to less than 0.01%.
| | | | |
12 | | Annual Report | The accompanying notes are an integral part of these financial statements. | | franklintempleton.com |
FRANKLIN GLOBAL TRUST
FINANCIAL HIGHLIGHTS
Franklin Global Listed Infrastructure Fund (continued)
| | | | | | | | | | | | | | | | |
| | | Year Ended July 31, | |
| | | 2017 | | | 2016 | | | 2015 | | | 2014a | |
| | | | |
| Class C | | | | | | | | | | | | | | | | |
Per share operating performance (for a share outstanding throughout the year) | | | | | | | | | | | | | | | | |
| | | | |
Net asset value, beginning of year | | | $12.28 | | | | $11.74 | | | | $12.28 | | | | $10.00 | |
| | | | |
| Income from investment operationsb: | | | | | | | | | | | | | | | | |
| | | | |
Net investment incomec | | | 0.17 | | | | 0.13 | | | | 0.11 | | | | 0.22 | |
| | | | |
Net realized and unrealized gains (losses) | | | 1.26 | | | | 0.51 | | | | (0.33 | ) | | | 2.16 | |
| | | | |
Total from investment operations | | | 1.43 | | | | 0.64 | | | | (0.22 | ) | | | 2.38 | |
| | | | |
Less distributions from: | | | | | | | | | | | | | | | | |
| | | | |
Net investment income | | | (0.14 | ) | | | (0.09 | ) | | | (0.12 | ) | | | (0.09) | |
| | | | |
Net realized gains | | | — | | | | (0.01 | ) | | | (0.20 | ) | | | (0.01) | |
| | | | |
Total distributions | | | (0.14 | ) | | | (0.10 | ) | | | (0.32 | ) | | | (0.10) | |
| | | | |
Net asset value, end of year | | | $13.57 | | | | $12.28 | | | | $11.74 | | | | $12.28 | |
| | | | |
Total returnd | | | 11.86% | | | | 5.58% | | | | (1.78)% | | | | 23.95% | |
| | | | |
| Ratios to average net assetse | | | | | | | | | | | | | | | | |
| | | | |
Expenses before waiver and payments by affiliates | | | 2.74% | | | | 2.99% | | | | 2.91% | | | | 4.85% | |
| | | | |
Expenses net of waiver and payments by affiliatesf | | | 2.13% | | | | 2.15% | | | | 2.15% | | | | 2.10% | |
| | | | |
Net investment income | | | 1.35% | | | | 1.18% | | | | 0.92% | | | | 1.77% | |
| | | | |
| Supplemental data | | | | | | | | | | | | | | | | |
| | | | |
Net assets, end of year (000’s) | | | $8,299 | | | | $4,515 | | | | $4,855 | | | | $2,988 | |
| | | | |
Portfolio turnover rate | | | 71.81% | | | | 63.57% | | | | 50.75% | | | | 35.24% | |
aFor the period September 6, 2013 (commencement of operations) to July 31, 2014.
bThe amount shown for a share outstanding throughout the period may not correlate with the Statement of Operations for the period due to the timing of sales and repurchases of the Fund’s shares in relation to income earned and/or fluctuating fair value of the investments of the Fund.
cBased on average daily shares outstanding.
dTotal return does not reflect sales commissions or contingent deferred sales charges, if applicable, and is not annualized for periods less than one year.
eRatios are annualized for periods less than one year.
fBenefit of expense reduction rounds to less than 0.01%.
| | | | | | |
franklintempleton.com | | The accompanying notes are an integral part of these financial statements. | Annual Report | | | 13 | |
FRANKLIN GLOBAL TRUST
FINANCIAL HIGHLIGHTS
Franklin Global Listed Infrastructure Fund (continued)
| | | | | | | | | | | | | | | | |
| | | Year Ended July 31, | |
| | | 2017 | | | 2016 | | | 2015 | | | 2014a | |
| | | | |
| Class R | | | | | | | | | | | | | | | | |
Per share operating performance (for a share outstanding throughout the year) | | | | | | | | | | | | | | | | |
| | | | |
Net asset value, beginning of year | | | $12.34 | | | | $11.80 | | | | $12.32 | | | | $10.00 | |
| | | | |
| Income from investment operationsb: | | | | | | | | | | | | | | | | |
| | | | |
Net investment incomec | | | 0.24 | | | | 0.19 | | | | 0.16 | | | | 0.25 | |
| | | | |
Net realized and unrealized gains (losses) | | | 1.27 | | | | 0.51 | | | | (0.33 | ) | | | 2.18 | |
| | | | |
Total from investment operations | | | 1.51 | | | | 0.70 | | | | (0.17 | ) | | | 2.43 | |
| | | | |
Less distributions from: | | | | | | | | | | | | | | | | |
| | | | |
Net investment income | | | (0.21 | ) | | | (0.15 | ) | | | (0.15 | ) | | | (0.10) | |
| | | | |
Net realized gains | | | — | | | | (0.01 | ) | | | (0.20 | ) | | | (0.01) | |
| | | | |
Total distributions | | | (0.21 | ) | | | (0.16 | ) | | | (0.35 | ) | | | (0.11) | |
| | | | |
Net asset value, end of year | | | $13.64 | | | | $12.34 | | | | $11.80 | | | | $12.32 | |
| | | | |
Total returnd | | | 12.48% | | | | 6.08% | | | | (1.29)% | | | | 24.48% | |
| | | | |
| Ratios to average net assetse | | | | | | | | | | | | | | | | |
| | | | |
Expenses before waiver and payments by affiliates | | | 2.19% | | | | 2.47% | | | | 2.41% | | | | 4.35% | |
| | | | |
Expenses net of waiver and payments by affiliatesf | | | 1.58% | | | | 1.63% | | | | 1.65% | | | | 1.60% | |
| | | | |
Net investment income | | | 1.90% | | | | 1.70% | | | | 1.42% | | | | 2.27% | |
| | | | |
| Supplemental data | | | | | | | | | | | | | | | | |
| | | | |
Net assets, end of year (000’s) | | | $96 | | | | $63 | | | | $62 | | | | $81 | |
| | | | |
Portfolio turnover rate | | | 71.81% | | | | 63.57% | | | | 50.75% | | | | 35.24% | |
aFor the period September 6, 2013 (commencement of operations) to July 31, 2014.
bThe amount shown for a share outstanding throughout the period may not correlate with the Statement of Operations for the period due to the timing of sales and repurchases of the Fund’s shares in relation to income earned and/or fluctuating fair value of the investments of the Fund.
cBased on average daily shares outstanding.
dTotal return is not annualized for periods less than one year.
eRatios are annualized for periods less than one year.
fBenefit of expense reduction rounds to less than 0.01%.
| | | | |
14 | | Annual Report | The accompanying notes are an integral part of these financial statements. | | franklintempleton.com |
FRANKLIN GLOBAL TRUST
FINANCIAL HIGHLIGHTS
Franklin Global Listed Infrastructure Fund (continued)
| | | | | | | | | | | | | | | | |
| | | Year Ended July 31, | |
| | | 2017 | | | 2016 | | | 2015 | | | 2014a | |
Class R6 | | | | | | | | | | | | | | | | |
Per share operating performance (for a share outstanding throughout the year) | | | | | | | | | | | | | | | | |
| | | | |
Net asset value, beginning of year | | | $12.37 | | | | $11.83 | | | | $12.36 | | | | $10.00 | |
| | | | |
| Income from investment operationsb: | | | | | | | | | | | | | | | | |
| | | | |
Net investment incomec | | | 0.30 | | | | 0.27 | | | | 0.23 | | | | 0.26 | |
| | | | |
Net realized and unrealized gains (losses) | | | 1.30 | | | | 0.50 | | | | (0.33 | ) | | | 2.24 | |
| | | | |
Total from investment operations | | | 1.60 | | | | 0.77 | | | | (0.10 | ) | | | 2.50 | |
| | | | |
Less distributions from: | | | | | | | | | | | | | | | | |
| | | | |
Net investment income | | | (0.27 | ) | | | (0.22 | ) | | | (0.23 | ) | | | (0.13) | |
| | | | |
Net realized gains | | | — | | | | (0.01 | ) | | | (0.20 | ) | | | (0.01) | |
| | | | |
Total distributions | | | (0.27 | ) | | | (0.23 | ) | | | (0.43 | ) | | | (0.14) | |
| | | | |
Net asset value, end of year | | | $13.70 | | | | $12.37 | | | | $11.83 | | | | $12.36 | |
| | | | |
Total returnd | | | 13.27% | | | | 6.78% | | | | (0.75)% | | | | 25.20% | |
| | | | |
| Ratios to average net assetse | | | | | | | | | | | | | | | | |
| | | | |
Expenses before waiver and payments by affiliates | | | 2.31% | | | | 2.26% | | | | 2.17% | | | | 5.21% | |
| | | | |
Expenses net of waiver and payments by affiliatesf | | | 0.94% | | | | 1.00% | | | | 1.07% | | | | 1.03% | |
| | | | |
Net investment income | | | 2.54% | | | | 2.33% | | | | 2.00% | | | | 2.84% | |
| | | | |
| Supplemental data | | | | | | | | | | | | | | | | |
| | | | |
Net assets, end of year (000’s) | | | $14 | | | | $12 | | | | $12 | | | | $12 | |
| | | | |
Portfolio turnover rate | | | 71.81% | | | | 63.57% | | | | 50.75% | | | | 35.24% | |
aFor the period September 6, 2013 (commencement of operations) to July 31, 2014.
bThe amount shown for a share outstanding throughout the period may not correlate with the Statement of Operations for the period due to the timing of sales and repurchases of the Fund’s shares in relation to income earned and/or fluctuating fair value of the investments of the Fund.
cBased on average daily shares outstanding.
dTotal return is not annualized for periods less than one year.
eRatios are annualized for periods less than one year.
fBenefit of expense reduction rounds to less than 0.01%.
| | | | | | |
franklintempleton.com | | The accompanying notes are an integral part of these financial statements. | Annual Report | | | 15 | |
FRANKLIN GLOBAL TRUST
FINANCIAL HIGHLIGHTS
Franklin Global Listed Infrastructure Fund (continued)
| | | | | | | | | | | | | | | | |
| | | Year Ended July 31, | |
| | | 2017 | | | 2016 | | | 2015 | | | 2014a | |
Advisor Class | | | | | | | | | | | | | | | | |
| Per share operating performance | | | | | | | | | | | | | | | | |
| (for a share outstanding throughout the year) | | | | | | | | | | | | | | | | |
| | | | |
Net asset value, beginning of year | | | $12.37 | | | | $11.83 | | | | $12.36 | | | | $10.00 | |
| | | | |
| Income from investment operationsb: | | | | | | | | | | | | | | | | |
| | | | |
Net investment incomec | | | 0.32 | | | | 0.25 | | | | 0.20 | | | | 0.29 | |
| | | | |
Net realized and unrealized gains (losses) | | | 1.26 | | | | 0.51 | | | | (0.31 | ) | | | 2.20 | |
| | | | |
Total from investment operations | | | 1.58 | | | | 0.76 | | | | (0.11 | ) | | | 2.49 | |
| | | | |
| Less distributions from: | | | | | | | | | | | | | | | | |
| | | | |
Net investment income | | | (0.26 | ) | | | (0.21 | ) | | | (0.22 | ) | | | (0.12 | ) |
| | | | |
Net realized gains | | | — | | | | (0.01 | ) | | | (0.20 | ) | | | (0.01 | ) |
| | | | |
Total distributions | | | (0.26 | ) | | | (0.22 | ) | | | (0.42 | ) | | | (0.13 | ) |
| | | | |
Net asset value, end of year | | | $13.69 | | | | $12.37 | | | | $11.83 | | | | $12.36 | |
| | | | |
Total returnd | | | 13.05% | | | | 6.53% | | | | (0.74)% | | | | 25.13% | |
| | | | |
| Ratios to average net assetse | | | | | | | | | | | | | | | | |
| | | | |
Expenses before waiver and payments by affiliates | | | 1.74% | | | | 1.99% | | | | 1.91% | | | | 3.85% | |
| | | | |
Expenses net of waiver and payments by affiliatesf | | | 1.13% | | | | 1.15% | | | | 1.15% | | | | 1.10% | |
| | | | |
Net investment income | | | 2.35% | | | | 2.18% | | | | 1.92% | | | | 2.77% | |
| | | | |
| Supplemental data | | | | | | | | | | | | | | | | |
| | | | |
Net assets, end of year (000’s) | | | $5,220 | | | | $957 | | | | $556 | | | | $357 | |
| | | | |
Portfolio turnover rate | | | 71.81% | | | | 63.57% | | | | 50.75% | | | | 35.24% | |
aFor the period September 6, 2013 (commencement of operations) to July 31, 2014.
bThe amount shown for a share outstanding throughout the period may not correlate with the Statement of Operations for the period due to the timing of sales and repurchases of the Fund’s shares in relation to income earned and/or fluctuating fair value of the investments of the Fund.
cBased on average daily shares outstanding.
dTotal return is not annualized for periods less than one year.
eRatios are annualized for periods less than one year.
fBenefit of expense reduction rounds to less than 0.01%.
| | | | |
16 | | Annual Report | The accompanying notes are an integral part of these financial statements. | | franklintempleton.com |
FRANKLIN GLOBAL TRUST
Statement of Investments, July 31, 2017
Franklin Global Listed Infrastructure Fund
| | | | | | | | | | | | | | | | | | | | | | |
| | | | | Country | | | | | | Shares/
Units | | | | | | Value | |
| | Common Stocks and Other Equity Interests 98.5% | | | | | | | | | | | | | | | | | | | | |
| | Airport Services 16.1% | | | | | | | | | | | | | | | | | | | | |
| | Aena SA. | | | Spain | | | | | | | | 12,720 | | | | | | | $ | 2,487,168 | |
| | Auckland International Airport Ltd. | | | New Zealand | | | | | | | | 291,338 | | | | | | | | 1,522,812 | |
| | Beijing Capital International Airport Co. Ltd. | | | China | | | | | | | | 348,000 | | | | | | | | 548,014 | |
| | Enav SpA | | | Italy | | | | | | | | 83,374 | | | | | | | | 382,574 | |
| | Flughafen Zurich AG | | | Switzerland | | | | | | | | 5,817 | | | | | | | | 1,482,723 | |
| | Grupo Aeroportuario del Centro Norte SAB de CV, ADR | | | Mexico | | | | | | | | 8,600 | | | | | | | | 435,074 | |
| | Grupo Aeroportuario del Pacifico SAB de CV, ADR | | | Mexico | | | | | | | | 11,951 | | | | | | | | 1,369,585 | |
| | Japan Airport Terminal Co. Ltd. | | | Japan | | | | | | | | 10,500 | | | | | | | | 389,383 | |
| | | | | | | | | | | | | | | | | | | | | 8,617,333 | |
| | Construction & Engineering 3.6% | | | | | | | | | | | | | | | | | | | | |
| | Eiffage SA | | | France | | | | | | | | 8,945 | | | | | | | | 866,314 | |
| a | | Ferrovial SA | | | Spain | | | | | | | | 20,482 | | | | | | | | 442,174 | |
| | Vinci SA | | | France | | | | | | | | 7,190 | | | | | | | | 644,363 | |
| | | | | | |
| | | | | | | | | | | | | | | | | | | | | 1,952,851 | |
| | Electric Utilities 24.5% | | | | | | | | | | | | | | | | | | | | |
| a | | Adani Transmissions Ltd. | | | India | | | | | | | | 362,091 | | | | | | | | 705,508 | |
| | American Electric Power Co. Inc. | | | United States | | | | | | | | 31,970 | | | | | | | | 2,255,164 | |
| | CLP Holdings Ltd. | | | Hong Kong | | | | | | | | 18,000 | | | | | | | | 191,851 | |
| | Emera Inc. | | | Canada | | | | | | | | 18,900 | | | | | | | | 703,256 | |
| | Enel Americas SA, ADR | | | Chile | | | | | | | | 25,840 | | | | | | | | 258,400 | |
| | Enel SpA | | | Italy | | | | | | | | 311,318 | | | | | | | | 1,777,002 | |
| | Exelon Corp. | | | United States | | | | | | | | 20,220 | | | | | | | | 775,235 | |
| | Iberdrola SA | | | Spain | | | | | | | | 191,427 | | | | | | | | 1,509,436 | |
| | NextEra Energy Inc. | | | United States | | | | | | | | 11,140 | | | | | | | | 1,627,442 | |
| | PG&E Corp. | | | United States | | | | | | | | 27,870 | | | | | | | | 1,886,520 | |
| | Xcel Energy Inc. | | | United States | | | | | | | | 30,190 | | | | | | | | 1,428,289 | |
| | | | | | | | | | | | | | | | | | | | | 13,118,103 | |
| | Gas Utilities 2.4% | | | | | | | | | | | | | | | | | | | | |
| | Atmos Energy Corp. | | | United States | | | | | | | | 2,100 | | | | | | | | 182,196 | |
| | Gujarat State Petronet Ltd. | | | India | | | | | | | | 50,935 | | | | | | | | 154,559 | |
| | Hong Kong and China Gas Co. Ltd. | | | Hong Kong | | | | | | | | 197,400 | | | | | | | | 373,533 | |
| | Southwest Gas Holdings Inc. | | | United States | | | | | | | | 7,300 | | | | | | | | 584,730 | |
| | | | | | | | | | | | | | | | | | | | | 1,295,018 | |
| | Highways & Railtracks 16.0% | | | | | | | | | | | | | | | | | | | | |
| | Abertis Infraestructuras SA | | | Spain | | | | | | | | 72,235 | | | | | | | | 1,426,529 | |
| | Atlantia SpA | | | Italy | | | | | | | | 86,019 | | | | | | | | 2,614,779 | |
| | CCR SA | | | Brazil | | | | | | | | 38,400 | | | | | | | | 210,239 | |
| | Groupe Eurotunnel SE | | | France | | | | | | | | 49,007 | | | | | | | | 542,879 | |
| | Jiangsu Expressway Co. Ltd., H | | | China | | | | | | | | 180,000 | | | | | | | | 261,332 | |
| | Macquarie Atlas Roads Group | | | Australia | | | | | | | | 68,574 | | | | | | | | 304,903 | |
| | Transurban Group | | | Australia | | | | | | | | 353,956 | | | | | | | | 3,229,699 | |
| | | | | | | | | | | | | | | | | | | | | 8,590,360 | |
| | Independent Power Producers & Energy Traders 1.1% | | | | | | | | | | | | | | | | | | | | |
| | Uniper SE | | | Germany | | | | | | | | 29,179 | | | | | | | | 600,408 | |
| | Integrated Telecommunication Services 1.4% | | | | | | | | | | | | | | | | | | | | |
| | Bharti Infratel Ltd. | | | India | | | | | | | | 28,618 | | | | | | | | 178,985 | |
| | Cellnex Telecom SAU | | | Spain | | | | | | | | 24,951 | | | | | | | | 560,942 | |
| | | | | | | | | | | | | | | | | | | | | 739,927 | |
| | | | | | |
franklintempleton.com | | Annual Report | | | 17 | |
FRANKLIN GLOBAL TRUST
STATEMENT OF INVESTMENTS
Franklin Global Listed Infrastructure Fund (continued)
| | | | | | | | | | | | | | | | | | | | | | |
| | | | | Country | | | | | | Shares/
Units | | | | | | Value | |
| | Common Stocks and Other Equity Interests (continued) | | | | | | | | | | | | | | | | | | | | |
| | Marine Ports & Services 1.8% | | | | | | | | | | | | | | | | | | | | |
| | COSCO Shipping Ports Ltd. | | | China | | | | | | | | 272,000 | | | | | | | $ | 332,916 | |
| | DP World Ltd. | | | United Arab Emirates | | | | | | | | 18,005 | | | | | | | | 414,115 | |
| a | | Global Ports Holding Ltd. | | | Turkey | | | | | | | | 3,280 | | | | | | | | 30,077 | |
| a,b | | Global Ports Holding Ltd., 144A | | | Turkey | | | | | | | | 23,000 | | | | | | | | 210,906 | |
| | | | | | | | | | | | | | | | | | | | | 988,014 | |
| | Multi-Utilities 9.6% | | | | | | | | | | | | | | | | | | | | |
| | DTE Energy Co. | | | United States | | | | | | | | 16,050 | | | | | | | | 1,718,313 | |
| | E.ON SE | | | Germany | | | | | | | | 77,057 | | | | | | | | 762,519 | |
| | National Grid PLC | | | United Kingdom | | | | | | | | 88,921 | | | | | | | | 1,099,076 | |
| | Sempra Energy | | | United States | | | | | | | | 13,660 | | | | | | | | 1,543,717 | |
| | | | | | | | | | | | | | | | | | | | | 5,123,625 | |
| | Oil & Gas Storage & Transportation 18.7% | | | | | | | | | | | | | | | | | | | | |
| a | | Cheniere Energy Inc. | | | United States | | | | | | | | 9,350 | | | | | | | | 422,620 | |
| | Cheniere Energy Partners LP Holdings LLC | | | United States | | | | | | | | 54,280 | | | | | | | | 1,420,508 | |
| | Enbridge Inc. | | | Canada | | | | | | | | 22,744 | | | | | | | | 942,590 | |
| | Energy Transfer Equity LP | | | United States | | | | | | | | 35,287 | | | | | | | | 623,521 | |
| | Energy Transfer Partners LP | | | United States | | | | | | | | 12,500 | | | | | | | | 258,625 | |
| | EQT GP Holdings LP | | | United States | | | | | | | | 9,863 | | | | | | | | 288,000 | |
| | MPLX LP | | | United States | | | | | | | | 8,480 | | | | | | | | 308,248 | |
| | Pembina Pipeline Corp. | | | Canada | | | | | | | | 28,200 | | | | | | | | 960,881 | |
| | Targa Resources Corp. | | | United States | | | | | | | | 7,420 | | | | | | | | 344,362 | |
| | TransCanada Corp. | | | Canada | | | | | | | | 44,107 | | | | | | | | 2,253,100 | |
| | Veresen Inc. | | | Canada | | | | | | | | 48,500 | | | | | | | | 708,248 | |
| | The Williams Cos. Inc. | | | United States | | | | | | | | 46,640 | | | | | | | | 1,482,219 | |
| | | | | | | | | | | | | | | | | | | | | 10,012,922 | |
| | Renewable Electricity 0.6% | | | | | | | | | | | | | | | | | | | | |
| | Boralex Inc., A | | | Canada | | | | | | | | 19,300 | | | | | | | | 344,676 | |
| | Water Utilities 2.7% | | | | | | | | | | | | | | | | | | | | |
| | American Water Works Co. Inc. | | | United States | | | | | | | | 11,820 | | | | | | | | 958,602 | |
| | Beijing Enterprises Water Group Ltd. | | | China | | | | | | | | 242,000 | | | | | | | | 201,079 | |
| | Guangdong Investment Ltd. | | | China | | | | | | | | 184,000 | | | | | | | | 259,130 | |
| | | | | | | | | | | | | | | | | | | | | 1,418,811 | |
| | Total Common Stocks and Other Equity Interests
(Cost $43,573,566) | | | | | | | | | | | | | | | | | | | 52,802,048 | |
| | | | |
18 | | Annual Report | | franklintempleton.com |
FRANKLIN GLOBAL TRUST
STATEMENT OF INVESTMENTS
Franklin Global Listed Infrastructure Fund (continued)
| | | | | | | | | | | | |
| | | Country | | | Shares | | | Value | |
| |
Preferred Stocks (Cost $215,841) 0.4% | | | | | | | | | | | | |
Water Utilities 0.4% | | | | | | | | | | | | |
c Cia de Saneamento do Parana, 6.06%, pfd | | | Brazil | | | | 71,900 | | | $ | 244,303 | |
| | | | | | | | | | | | |
Total Investments before Short Term Investments | | | | | | | | | | | | |
(Cost $43,789,407) | | | | | | | | | | | 53,046,351 | |
| | | | | | | | | | | | |
Short Term Investments (Cost $839,543) 1.6% | | | | | | | | | | | | |
| Money Market Funds 1.6% | | | | | | | | | | | | |
d,e Institutional Fiduciary Trust Money Market Portfolio, 0.63% | | | United States | | | | 839,543 | | | | 839,543 | |
| | | | | | | | | | | | |
Total Investments (Cost $44,628,950) 100.5% | | | | | | | | | | | 53,885,894 | |
Other Assets, less Liabilities (0.5)% | | | | | | | | | | | (266,822 | ) |
| | | | | | | | | | | | |
Net Assets 100.0% | | | | | | | | | | $ | 53,619,072 | |
| | | | | | | | | | | | |
See Abbreviations on page 31.
aNon-income producing.
bSecurity was purchased pursuant to Rule 144A under the Securities Act of 1933 and may be sold in transactions exempt from registration only to qualified institutional buyers or in a public offering registered under the Securities Act of 1933. This security has been deemed liquid under guidelines approved by the Trust’s Board of Trustees. At July 31, 2017, the value of this security was $210,906, representing 0.4% of net assets.
cVariable rate security. The rate shown represents the yield at period end.
dSee Note 3(f) regarding investments in affiliated management investment companies.
eThe rate shown is the annualized seven-day yield at period end.
| | | | | | |
franklintempleton.com | | The accompanying notes are an integral part of these financial statements. | Annual Report | | | 19 | |
FRANKLIN GLOBAL TRUST
Financial Statements
Statement of Assets and Liabilities
July 31, 2017
Franklin Global Listed Infrastructure Fund
| | | | |
Assets: | | | | |
Investments in securities: | | | | |
Cost - Unaffiliated issuers | | $ | 43,789,407 | |
Cost - Non-controlled affiliates (Note 3f) | | | 839,543 | |
| | | | |
Total cost of investments | | $ | 44,628,950 | |
| | | | |
Value - Unaffiliated issuers | | $ | 53,046,351 | |
Value - Non-controlled affiliates (Note 3f) | | | 839,543 | |
| | | | |
Total value of investments | | | 53,885,894 | |
Receivables: | | | | |
Investment securities sold | | | 682,446 | |
Capital shares sold | | | 424,102 | |
Dividends | | | 137,927 | |
Other assets. | | | 21 | |
| | | | |
Total assets | | | 55,130,390 | |
| | | | |
Liabilities: | | | | |
Payables: | | | | |
Investment securities purchased | | | 1,311,399 | |
Capital shares redeemed | | | 66,680 | |
Management fees | | | 32,694 | |
Distribution fees | | | 15,023 | |
Transfer agent fees | | | 7,489 | |
Deferred tax | | | 63,949 | |
Accrued expenses and other liabilities | | | 14,084 | |
| | | | |
Total liabilities | | | 1,511,318 | |
| | | | |
Net assets, at value. | | $ | 53,619,072 | |
| | | | |
Net assets consist of: | | | | |
Paid-in capital. | | $ | 47,261,242 | |
Undistributed net investment income | | | 336,878 | |
Net unrealized appreciation (depreciation) | | | 9,195,971 | |
Accumulated net realized gain (loss) | | | (3,175,019 | ) |
| | | | |
Net assets, at value. | | $ | 53,619,072 | |
| | | | |
| | | | |
20 | | Annual Report | The accompanying notes are an integral part of these financial statements. | | franklintempleton.com |
FRANKLIN GLOBAL TRUST
FINANCIAL STATEMENT
Statement of Assets and Liabilities (continued)
July 31, 2017
Franklin Global Listed Infrastructure Fund
| | | | |
| |
| Class A: | | | | |
Net assets, at value | | $ | 39,990,652 | |
| | | | |
Shares outstanding | | | 2,926,922 | |
| | | | |
Net asset value per sharea | | | $13.66 | |
| | | | |
Maximum offering price per share (net asset value per share ÷ 94.25%) | | | $14.49 | |
| | | | |
Class C: | | | | |
Net assets, at value | | $ | 8,299,498 | |
| | | | |
Shares outstanding | | | 611,624 | |
| | | | |
Net asset value and maximum offering price per sharea | | | $13.57 | |
| | | | |
Class R: | | | | |
Net assets, at value | | $ | 95,508 | |
| | | | |
Shares outstanding | | | 7,002 | |
| | | | |
Net asset value and maximum offering price per share | | | $13.64 | |
| | | | |
Class R6: | | | | |
Net assets, at value | | $ | 13,696 | |
| | | | |
Shares outstanding | | | 1,000 | |
| | | | |
Net asset value and maximum offering price per share | | | $13.70 | |
| | | | |
Advisor Class: | | | | |
Net assets, at value | | $ | 5,219,718 | |
| | | | |
Shares outstanding | | | 381,264 | |
| | | | |
Net asset value and maximum offering price per share | | | $13.69 | |
| | | | |
aRedemption price is equal to net asset value less contingent deferred sales charges, if applicable.
| | | | | | |
franklintempleton.com | | The accompanying notes are an integral part of these financial statements. | Annual Report | | | 21 | |
FRANKLIN GLOBAL TRUST
FINANCIAL STATEMENT
Statement of Operations
for the year ended July 31, 2017
Franklin Global Listed Infrastructure Fund
| | | | |
Investment income: | | | | |
Dividends: (net of foreign taxes of $89,820) | | | | |
Unaffiliated issuers | | $ | 1,299,469 | |
Non-controlled affiliates (Note 3f) | | | 1,212 | |
| | | | |
Total investment income | | | 1,300,681 | |
| | | | |
Expenses: | | | | |
Management fees (Note 3a) | | | 373,005 | |
Distribution fees: (Note 3c) | | | | |
Class A | | | 71,708 | |
Class C | | | 60,465 | |
Class R | | | 479 | |
Transfer agent fees: (Note 3e) | | | | |
Class A | | | 58,618 | |
Class C | | | 12,357 | |
Class R | | | 217 | |
Class R6 | | | 95 | |
Advisor Class | | | 5,064 | |
Custodian fees (Note 4) | | | 6,781 | |
Reports to shareholders | | | 22,139 | |
Registration and filing fees | | | 81,644 | |
Professional fees | | | 84,800 | |
Other | | | 7,421 | |
| | | | |
Total expenses | | | 784,793 | |
Expense reductions (Note 4) | | | (835 | ) |
Expenses waived/paid by affiliates (Note 3f and 3g) | | | (230,377 | ) |
| | | | |
Net expenses | | | 553,581 | |
| | | | |
Net investment income | | | 747,100 | |
| | | | |
Realized and unrealized gains (losses): | | | | |
Net realized gain (loss) from: | | | | |
Investments (net of foreign taxes of $802) | | | (56,415 | ) |
Foreign currency transactions | | | (17,032 | ) |
| | | | |
Net realized gain (loss) | | | (73,447 | ) |
| | | | |
Net change in unrealized appreciation (depreciation) on: | | | | |
Investments | | | 5,214,385 | |
Translation of other assets and liabilities denominated in foreign currencies | | | 3,762 | |
Change in deferred taxes on unrealized appreciation | | | (63,949 | ) |
| | | | |
Net change in unrealized appreciation (depreciation) | | | 5,154,198 | |
| | | | |
Net realized and unrealized gain (loss) | | | 5,080,751 | |
| | | | |
Net increase (decrease) in net assets resulting from operations | | $ | 5,827,851 | |
| | | | |
| | | | |
22 | | Annual Report | The accompanying notes are an integral part of these financial statements. | | franklintempleton.com |
FRANKLIN GLOBAL TRUST
FINANCIAL STATEMENTS
Statements of Changes in Net Assets
Franklin Global Listed Infrastructure Fund
| | | | | | | | |
| | | Year Ended July 31, | |
| | | 2017 | | | 2016 | |
| |
Increase (decrease) in net assets: | | | | | | | | |
Operations: | | | | | | | | |
Net investment income | | $ | 747,100 | | | $ | 519,941 | |
Net realized gain (loss) | | | (73,447 | ) | | | (2,479,116 | ) |
Net change in unrealized appreciation (depreciation) | | | 5,154,198 | | | | 3,104,884 | |
| | | | |
Net increase (decrease) in net assets resulting from operations | | | 5,827,851 | | | | 1,145,709 | |
| | | | |
Distributions to shareholders from: | | | | | | | | |
Net investment income: | | | | | | | | |
Class A | | | (504,180 | ) | | | (388,128 | ) |
Class C | | | (61,544 | ) | | | (36,162 | ) |
Class R | | | (1,914 | ) | | | (761 | ) |
Class R6 | | | (272 | ) | | | (221 | ) |
Advisor Class | | | (43,103 | ) | | | (11,501 | ) |
Net realized gains: | | | | | | | | |
Class A | | | — | | | | (12,503 | ) |
Class C | | | — | | | | (2,105 | ) |
Class R | | | — | | | | (28 | ) |
Class R6 | | | — | | | | (6 | ) |
Advisor Class | | | — | | | | (295 | ) |
| | | | |
Total distributions to shareholders | | | (611,013 | ) | | | (451,710 | ) |
| | | | |
Capital share transactions: (Note 2) | | | | | | | | |
Class A | | | 11,321,710 | | | | (4,192,015 | ) |
Class C | | | 2,885,515 | | | | (453,708 | ) |
Class R | | | 19,672 | | | | (2,325 | ) |
Advisor Class | | | 3,738,902 | | | | 337,706 | |
| | | | |
Total capital share transactions | | | 17,965,799 | | | | (4,310,342 | ) |
| | | | |
Net increase (decrease) in net assets | | | 23,182,637 | | | | (3,616,343 | ) |
Net assets: | | | | | | | | |
Beginning of year | | | 30,436,435 | | | | 34,052,778 | |
| | | | |
End of year | | $ | 53,619,072 | | | $ | 30,436,435 | |
| | | | |
Undistributed net investment income included in net assets: | | | | | | | | |
End of year | | $ | 336,878 | | | $ | 255,327 | |
| | | | |
| | | | | | |
franklintempleton.com | | The accompanying notes are an integral part of these financial statements. | Annual Report | | | 23 | |
FRANKLIN GLOBAL TRUST
Notes to Financial Statements
Franklin Global Listed Infrastructure Fund
1. Organization and Significant Accounting Policies
Franklin Global Trust (Trust) is registered under the Investment Company Act of 1940 (1940 Act) as an open-end management investment company, consisting of five separate funds and applies the specialized accounting and reporting guidance in U.S. Generally Accepted Accounting Principles (U.S. GAAP). Franklin Global Listed Infrastructure Fund (Fund) is included in this report. The Fund offers five classes of shares: Class A, Class C, Class R, Class R6 and Advisor Class. Each class of shares may differ by its initial sales load, contingent deferred sales charges, voting rights on matters affecting a single class, its exchange privilege and fees due to differing arrangements for distribution and transfer agent fees.
The following summarizes the Fund’s significant accounting policies.
a. Financial Instrument Valuation
The Fund’s investments in financial instruments are carried at fair value daily. Fair value is the price that would be received to sell an asset or paid to transfer a liability in an orderly transaction between market participants on the measurement date. The Fund calculates the net asset value (NAV) per share as of 4 p.m. Eastern time each day the New York Stock Exchange (NYSE) is open for trading. Under compliance policies and procedures approved by the Trust’s Board of Trustees (the Board), the Fund’s administrator has responsibility for oversight of valuation, including leading the cross-functional Valuation Committee (VC). The VC provides administration and oversight of the Fund’s valuation policies and procedures, which are approved annually by the Board. Among other things, these procedures allow the Fund to utilize independent pricing services, quotations from securities and financial instrument dealers, and other market sources to determine fair value.
Equity securities listed on an exchange or on the NASDAQ National Market System are valued at the last quoted sale price or the official closing price of the day, respectively. Foreign equity securities are valued as of the close of trading on the foreign stock exchange on which the security is primarily traded, or as of 4 p.m. Eastern time. The value is then converted into its U.S. dollar equivalent at the foreign exchange rate in effect at 4 p.m. Eastern time on the day that the value of the security is determined. Over-the-counter (OTC) securities are valued within the range of the most recent quoted bid and ask prices. Securities that trade in multiple markets or on multiple
exchanges are valued according to the broadest and most representative market. Certain equity securities are valued based upon fundamental characteristics or relationships to similar securities.
Investments in open-end mutual funds are valued at the closing NAV.
The Fund has procedures to determine the fair value of financial instruments for which market prices are not reliable or readily available. Under these procedures, the VC convenes on a regular basis to review such financial instruments and considers a number of factors, including significant unobservable valuation inputs, when arriving at fair value. The VC primarily employs a market-based approach which may use related or comparable assets or liabilities, recent transactions, market multiples, book values, and other relevant information for the investment to determine the fair value of the investment. An income-based valuation approach may also be used in which the anticipated future cash flows of the investment are discounted to calculate fair value. Discounts may also be applied due to the nature or duration of any restrictions on the disposition of the investments. Due to the inherent uncertainty of valuations of such investments, the fair values may differ significantly from the values that would have been used had an active market existed. The VC employs various methods for calibrating these valuation approaches including a regular review of key inputs and assumptions, transactional back-testing or disposition analysis, and reviews of any related market activity.
Trading in securities on foreign securities stock exchanges and OTC markets may be completed before 4 p.m. Eastern time. In addition, trading in certain foreign markets may not take place on every Fund’s business day. Occasionally, events occur between the time at which trading in a foreign security is completed and 4 p.m. Eastern time that might call into question the reliability of the value of a portfolio security held by the Fund. As a result, differences may arise between the value of the Fund’s portfolio securities as determined at the foreign market close and the latest indications of value at 4 p.m. Eastern time. In order to minimize the potential for these differences, the VC monitors price movements following the close of trading in foreign stock markets through a series of country specific market proxies (such as baskets of American Depositary Receipts, futures contracts and exchange traded funds). These price movements are measured against established trigger thresholds for each specific market proxy to
| | | | |
| 24 | | Annual Report | | franklintempleton.com |
FRANKLIN GLOBAL TRUST
NOTES TO FINANCIAL STATEMENTS
Franklin Global Listed Infrastructure Fund (continued)
assist in determining if an event has occurred that may call into question the reliability of the values of the foreign securities held by the Fund. If such an event occurs, the securities may be valued using fair value procedures, which may include the use of independent pricing services.
When the last day of the reporting period is a non-business day, certain foreign markets may be open on those days that the Fund’s NAV is not calculated, which could result in differences between the value of the Fund’s portfolio securities on the last business day and the last calendar day of the reporting period. Any significant security valuation changes due to an open foreign market are adjusted and reflected by the Fund for financial reporting purposes.
b. Foreign Currency Translation
Portfolio securities and other assets and liabilities denominated in foreign currencies are translated into U.S. dollars based on the exchange rate of such currencies against U.S. dollars on the date of valuation. The Fund may enter into foreign currency exchange contracts to facilitate transactions denominated in a foreign currency. Purchases and sales of securities, income and expense items denominated in foreign currencies are translated into U.S. dollars at the exchange rate in effect on the transaction date. Portfolio securities and assets and liabilities denominated in foreign currencies contain risks that those currencies will decline in value relative to the U.S. dollar. Occasionally, events may impact the availability or reliability of foreign exchange rates used to convert the U.S. dollar equivalent value. If such an event occurs, the foreign exchange rate will be valued at fair value using procedures established and approved by the Board.
The Fund does not separately report the effect of changes in foreign exchange rates from changes in market prices on securities held. Such changes are included in net realized and unrealized gain or loss from investments in the Statement of Operations.
Realized foreign exchange gains or losses arise from sales of foreign currencies, currency gains or losses realized between the trade and settlement dates on securities transactions and the difference between the recorded amounts of dividends, interest, and foreign withholding taxes and the U.S. dollar equivalent of the amounts actually received or paid. Net unrealized foreign exchange gains and losses arise from changes in foreign exchange rates on foreign denominated assets and liabilities other than investments in securities held at the end of the reporting period.
c. Income and Deferred Taxes
It is the Fund’s policy to qualify as a regulated investment company under the Internal Revenue Code. The Fund intends to distribute to shareholders substantially all of its taxable income and net realized gains to relieve it from federal income and if applicable, excise taxes. As a result, no provision for U.S. federal income taxes is required.
The Fund may be subject to foreign taxation related to income received, capital gains on the sale of securities and certain foreign currency transactions in the foreign jurisdictions in which it invests. Foreign taxes, if any, are recorded based on the tax regulations and rates that exist in the foreign markets in which the Fund invests. When a capital gain tax is determined to apply, the Fund records an estimated deferred tax liability in an amount that would be payable if the securities were disposed of on the valuation date.
The Fund may recognize an income tax liability related to its uncertain tax positions under U.S. GAAP when the uncertain tax position has a less than 50% probability that it will be sustained upon examination by the tax authorities based on its technical merits. As of July 31, 2017, the Fund has determined that no tax liability is required in its financial statements related to uncertain tax positions for any open tax years (or expected to be taken in future tax years). Open tax years are those that remain subject to examination and are based on the statute of limitations in each jurisdiction in which the Fund invests.
d. Security Transactions, Investment Income, Expenses and Distributions
Security transactions are accounted for on trade date. Realized gains and losses on security transactions are determined on a specific identification basis. Estimated expenses are accrued daily. Dividend income is recorded on the ex-dividend date except for certain dividends from securities where the dividend rate is not available. In such cases, the dividend is recorded as soon as the information is received by the Fund. Distributions to shareholders are recorded on the ex-dividend date. Distributable earnings are determined according to income tax regulations (tax basis) and may differ from earnings recorded in accordance with U.S. GAAP. These differences may be permanent or temporary. Permanent differences are reclassified among capital
| | | | | | |
| franklintempleton.com | | Annual Report | | | 25 | |
FRANKLIN GLOBAL TRUST
NOTES TO FINANCIAL STATEMENTS
Franklin Global Listed Infrastructure Fund (continued)
1. Organization and Significant Accounting Policies (continued)
d. Security Transactions, Investment Income, Expenses and Distributions (continued)
accounts to reflect their tax character. These reclassifications have no impact on net assets or the results of operations. Temporary differences are not reclassified, as they may reverse in subsequent periods.
Common expenses incurred by the Trust are allocated among the Funds based on the ratio of net assets of each Fund to the combined net assets of the Trust. Fund specific expenses are charged directly to the Fund that incurred the expense.
Realized and unrealized gains and losses and net investment income, excluding class specific expenses, are allocated daily to each class of shares based upon the relative proportion of net assets of each class. Differences in per share distributions by class are generally due to differences in class specific expenses.
e. Accounting Estimates
The preparation of financial statements in accordance with U.S. GAAP requires management to make estimates and assump-
tions that affect the reported amounts of assets and liabilities at the date of the financial statements and the amounts of income and expenses during the reporting period. Actual results could differ from those estimates.
f. Guarantees and Indemnifications
Under the Trust’s organizational documents, its officers and trustees are indemnified by the Trust against certain liabilities arising out of the performance of their duties to the Trust. Additionally, in the normal course of business, the Trust, on behalf of the Fund, enters into contracts with service providers that contain general indemnification clauses. The Trust’s maximum exposure under these arrangements is unknown as this would involve future claims that may be made against the Trust that have not yet occurred. Currently, the Trust expects the risk of loss to be remote.
2. Shares of Beneficial Interest
At July 31, 2017, there were an unlimited number of shares authorized (without par value). Transactions in the Fund’s shares were as follows:
| | | | | | | | | | | | | | | | |
| | | Year Ended July 31, | |
| | | 2017a | | | 2016a | |
| | | | |
| | | Shares | | | Amount | | | Shares | | | Amount | |
| |
| Class A Shares: | | | | | | | | | | | | | | | | |
Shares sold | | | 1,846,908 | | | $ | 22,519,248 | | | | 419,330 | | | $ | 4,778,360 | |
Shares issued in reinvestment of distributions | | | 37,190 | | | | 449,990 | | | | 29,342 | | | | 315,361 | |
Shares redeemed | | | (972,794 | ) | | | (11,647,528 | ) | | | (851,697 | ) | | | (9,285,736) | |
| | | | |
Net increase (decrease) | | | 911,304 | | | $ | 11,321,710 | | | | (403,025 | ) | | $ | (4,192,015) | |
| | | | |
| Class C Shares: | | | | | | | | | | | | | | | | |
Shares sold | | | 407,842 | | | $ | 4,869,479 | | | | 92,952 | | | $ | 1,046,570 | |
Shares issued in reinvestment of distributions | | | 5,185 | | | | 61,357 | | | | 3,587 | | | | 38,020 | |
Shares redeemed | | | (169,244 | ) | | | (2,045,321 | ) | | | (142,196 | ) | | | (1,538,298) | |
| | | | |
Net increase (decrease) | | | 243,783 | | | $ | 2,885,515 | | | | (45,657 | ) | | $ | (453,708) | |
| | | | |
| Class R Shares: | | | | | | | | | | | | | | | | |
Shares sold | | | 7,598 | | | $ | 91,810 | | | | 1 | | | $ | 15 | |
Shares issued in reinvestment of distributions | | | 145 | | | | 1,746 | | | | 60 | | | | 635 | |
Shares redeemed | | | (5,820 | ) | | | (73,884 | ) | | | (273 | ) | | | (2,975) | |
| | | | |
Net increase (decrease) | | | 1,923 | | | $ | 19,672 | | | | (212 | ) | | $ | (2,325) | |
| | | | |
| | | | |
| 26 | | Annual Report | | franklintempleton.com |
FRANKLIN GLOBAL TRUST
NOTES TO FINANCIAL STATEMENTS
Franklin Global Listed Infrastructure Fund (continued)
| | | | | | | | | | | | | | | | |
| | | Year Ended July 31, | |
| | | 2017a | | | 2016a | |
| | | Shares | | | Amount | | | Shares | | | Amount | |
| Advisor Class Shares: | | | | | | | | | | | | | | | | |
Shares sold | | | 394,717 | | | $ | 4,861,041 | | | | 40,110 | | | $ | 445,500 | |
Shares issued in reinvestment of distributions | | | 3,276 | | | | 40,539 | | | | 963 | | | | 10,446 | |
Shares redeemed | | | (94,027 | ) | | | (1,162,678 | ) | | | (10,725 | ) | | | (118,240 | ) |
Net increase (decrease) | | | 303,966 | | | $ | 3,738,902 | | | | 30,348 | | | $ | 337,706 | |
aDuring the year, Class R6 did not report any share transactions.
3. Transactions with Affiliates
Franklin Resources, Inc. is the holding company for various subsidiaries that together are referred to as Franklin Templeton Investments. Certain officers and trustees of the Trust are also officers and/or directors of the following subsidiaries:
| | |
| Subsidiary | | Affiliation |
Franklin Templeton Institutional, LLC (FT Institutional) | | Investment manager |
Franklin Templeton Services, LLC (FT Services) | | Administrative manager |
Franklin Templeton Distributors, Inc. (Distributors) | | Principal underwriter |
Franklin Templeton Investor Services, LLC (Investor Services) | | Transfer agent |
a. Management Fees
The Fund pays an investment management fee to FT Institutional based on the average daily net assets of the Fund as follows:
| | |
| Annualized Fee Rate | | Net Assets |
1.000% | | Up to and including $500 million |
0.900% | | Over $500 million, up to and including $1 billion |
0.850% | | Over $1 billion, up to and including $1.5 billion |
0.800% | | Over $1.5 billion, up to and including $6.5 billion |
0.780% | | Over $6.5 billion, up to and including $11.5 billion |
0.760% | | Over $11.5 billion, up to and including $16.5 billion |
0.740% | | Over $16.5 billion, up to and including $19 billion |
0.730% | | Over $19 billion, up to and including $21.5 billion |
0.720% | | In excess of $21.5 billion |
For the year ended July 31, 2017, the effective investment management fee rate was 1.000% of the Fund’s average daily net assets.
b. Administrative Fees
Under an agreement with FT Institutional, FT Services provides administrative services to the Fund. The fee is paid by FT Institutional based on the Fund’s average net assets, and is not an additional expense of the Fund.
c. Distribution Fees
The Board has adopted distribution plans for each share class, with the exception of Class R6 and Advisor Class shares, pursuant to Rule 12b-1 under the 1940 Act. Under the Fund’s Class A reimbursement distribution plan, the Fund reimburses Distributors for costs incurred in connection with the servicing, sale and distribution of the Fund’s shares up to the maximum annual plan rate. Under the Class A reimbursement distribution plan, costs exceeding the maximum for the current plan year cannot be reimbursed in
| | | | | | |
franklintempleton.com | | Annual Report | | | 27 | |
FRANKLIN GLOBAL TRUST
NOTES TO FINANCIAL STATEMENTS
Franklin Global Listed Infrastructure Fund (continued)
3. Transactions with Affiliates (continued)
c. Distribution Fees (continued)
subsequent periods. In addition, under the Fund’s Class C and R compensation distribution plans, the Fund pays Distributors for costs incurred in connection with the servicing, sale and distribution of the Fund’s shares up to the maximum annual plan rate for each class. The plan year, for purposes of monitoring compliance with the maximum annual plan rates, is February 1 through January 31.
The maximum annual plan rates, based on the average daily net assets, for each class, are as follows:
| | | | |
Class A | | | 0.35% | |
Class C | | | 1.00% | |
Class R | | | 0.50% | |
The Board has set the current rate at 0.25% per year for Class A shares until further notice and approval by the Board.
d. Sales Charges/Underwriting Agreements
Front-end sales charges and contingent deferred sales charges (CDSC) do not represent expenses of the Fund. These charges are deducted from the proceeds of sales of Fund shares prior to investment or from redemption proceeds prior to remittance, as applicable. Distributors has advised the Fund of the following commission transactions related to the sales and redemptions of the Fund’s shares for the year:
| | | | |
Sales charges retained net of commissions paid to unaffiliated brokers/dealers. | | $ | 59,817 | |
CDSC retained | | $ | 3,364 | |
e. Transfer Agent Fees
Each class of shares, except for Class R6, pays transfer agent fees to Investor Services for its performance of shareholder servicing obligations and reimburses Investor Services for out of pocket expenses incurred, including shareholder servicing fees paid to third parties. These fees are allocated daily based upon their relative proportion of such classes’ aggregate net assets. Class R6 pays Investor Services transfer agent fees specific to that class.
For the year ended July 31, 2017, the Fund paid transfer agent fees of $76,351, of which $45,473 was retained by Investor Services.
f. Investments in Affiliated Management Investment Companies
The Fund invests in one or more affiliated management investment companies for purposes other than exercising a controlling influence over the management or policies. Management fees paid by the Fund are waived on assets invested in the affiliated management investment companies, as noted in the Statement of Operations, in an amount not to exceed the management and administrative fees paid directly or indirectly by each affiliate. During the year ended July 31, 2017, the Fund held investments in affiliated management investment companies as follows:
| | | | | | | | | | | | | | | | | | | | | | | | | | | | | | | | |
| | | Number of
Shares Held
at Beginning
of Year | | | Gross
Additions | | | Gross
Reductions | | | Number of
Shares
Held at End
of Year | | | Value
at End
of Year | | | Investment
Income | | | Realized
Gain (Loss) | | | % of
Affiliated
Fund Shares
Outstanding
Held at End
of Year | |
| Non-Controlled Affiliates | | | | | | | | | | | | | | | | | | | | | | | | | | | | | | | | |
Institutional Fiduciary Trust Money Market Portfolio, 0.63% | | | — | | | | 9,544,687 | | | | (8,705,144 | ) | | | 839,543 | | | $ | 839,543 | | | $ | 1,212 | | | | $– | | | | 0.0 | %a |
| | | | | | | | | | | | | | | | | | | | | | | | |
| | | | | | | | | | | | | | | | | | | | | | | | | | | | | | | | |
aRounds to less than 0.1%. | | | | | | | | | | | | | | | | | | | | | | | | | | | | | | | | |
| | | | |
28 | | Annual Report | | franklintempleton.com |
FRANKLIN GLOBAL TRUST
NOTES TO FINANCIAL STATEMENTS
Franklin Global Listed Infrastructure Fund (continued)
g. Waiver and Expense Reimbursements
FT Institutional and Investor Services have contractually agreed in advance to waive or limit their respective fees and to assume as their own expense certain expenses otherwise payable by the Fund so that the expenses (excluding distribution fees, and acquired fund fees and expenses) for Class A, Class C, Class R and Advisor Class of the Fund do not exceed 1.15%, and Class R6 does not exceed 0.93% based on the average net assets of each class (other than certain non-routine expenses or costs, including those relating to litigation, indemnification, reorganizations, and liquidations) until November 30, 2017. Total expenses waived or paid are not subject to recapture subsequent to the Fund’s fiscal year end. Prior to December 1, 2016, the expenses for Class R6 were limited to 0.96%.
4. Expense Offset Arrangement
The Fund has entered into an arrangement with its custodian whereby credits realized as a result of uninvested cash balances are used to reduce a portion of the Fund’s custodian expenses. During the year ended July 31, 2017, the custodian fees were reduced as noted in the Statement of Operations.
5. Income Taxes
For tax purposes, capital losses may be carried over to offset future capital gains, if any. At July 31, 2017, the capital loss carryforwards were as follows:
| | | | |
Capital loss carryforwards: | | | | |
Short term | | $ | 555,014 | |
Long term | | | 1,818,269 | |
| | | | |
Total capital loss carryforwards | | $ | 2,373,283 | |
| | | | |
During the year ended July 31, 2017, the Fund utilized $184,090 of capital loss carryforwards.
The tax character of distributions paid during the years ended July 31, 2017 and 2016, was as follows:
| | | | | | | | |
| | | 2017 | | | 2016 | |
Distributions paid from ordinary income | | $ | 611,013 | | | $ | 451,710 | |
At July 31, 2017, the cost of investments, net unrealized appreciation (depreciation), and undistributed ordinary income for income tax purposes were as follows:
| | | | |
Cost of investments | | $ | 45,457,316 | |
| | | | |
| |
Unrealized appreciation | | $ | 9,333,322 | |
Unrealized depreciation | | | (904,744) | |
| | | | |
Net unrealized appreciation (depreciation) | | $ | 8,428,578 | |
| | | | |
Distributable earnings - undistributed ordinary income | | $ | 363,341 | |
| | | | |
Differences between income and/or capital gains as determined on a book basis and a tax basis are primarily due to differing treatment of wash sales.
6. Investment Transactions
Purchases and sales of investments (excluding short term securities) for the year ended July 31, 2017, aggregated $44,483,635 and $26,765,962, respectively.
| | | | | | |
franklintempleton.com | | Annual Report | | | 29 | |
FRANKLIN GLOBAL TRUST
NOTES TO FINANCIAL STATEMENTS
Franklin Global Listed Infrastructure Fund (continued)
7. Concentration of Risk
Investing in foreign securities may include certain risks and considerations not typically associated with investing in U.S. securities, such as fluctuating currency values and changing local and regional economic, political and social conditions, which may result in greater market volatility. In addition, certain foreign securities may not be as liquid as U.S. securities.
8. Credit Facility
The Fund, together with other U.S. registered and foreign investment funds (collectively, Borrowers), managed by Franklin Templeton Investments, are borrowers in a joint syndicated senior unsecured credit facility totaling $2 billion (Global Credit Facility) which matures on February 9, 2018. This Global Credit Facility provides a source of funds to the Borrowers for temporary and emergency purposes, including the ability to meet future unanticipated or unusually large redemption requests.
Under the terms of the Global Credit Facility, the Fund shall, in addition to interest charged on any borrowings made by the Fund and other costs incurred by the Fund, pay its share of fees and expenses incurred in connection with the implementation and maintenance of the Global Credit Facility, based upon its relative share of the aggregate net assets of all of the Borrowers, including an annual commitment fee of 0.15% based upon the unused portion of the Global Credit Facility. These fees are reflected in other expenses in the Statement of Operations. During the year ended July 31, 2017, the Fund did not use the Global Credit Facility.
9. Fair Value Measurements
The Fund follows a fair value hierarchy that distinguishes between market data obtained from independent sources (observable inputs) and the Fund’s own market assumptions (unobservable inputs). These inputs are used in determining the value of the Fund’s financial instruments and are summarized in the following fair value hierarchy:
| | • | | Level 1 – quoted prices in active markets for identical financial instruments |
| | • | | Level 2 – other significant observable inputs (including quoted prices for similar financial instruments, interest rates, prepayment speed, credit risk, etc.) |
| | • | | Level 3 – significant unobservable inputs (including the Fund’s own assumptions in determining the fair value of financial instruments) |
The input levels are not necessarily an indication of the risk or liquidity associated with financial instruments at that level.
For movements between the levels within the fair value hierarchy, the Fund has adopted a policy of recognizing the transfers as of the date of the underlying event which caused the movement.
At July 31, 2017, all of the Fund’s investments in financial instruments carried at fair value were valued using Level 1 inputs. For detailed categories, see the accompanying Statement of Investments.
10. Investment Company Reporting Modernization
In October 2016, the U.S. Securities and Exchange Commission adopted new rules and amended existing rules (together, final rules) intended to modernize the reporting and disclosure of information by registered investment companies. In part, the final rules amend Regulation S-X and require standardized, enhanced disclosures about derivatives in investment company financial statements, as well as other amendments. The compliance date for the amendments to Regulation S-X is August 1, 2017. Management has reviewed the requirements and believes the adoption of the amendments to Regulation S-X will not have a material impact on the Fund’s financial statements and related disclosures.
| | | | |
30 | | Annual Report | | franklintempleton.com |
FRANKLIN GLOBAL TRUST
NOTES TO FINANCIAL STATEMENTS
Franklin Global Listed Infrastructure Fund (continued)
11. Subsequent Events
The Fund has evaluated subsequent events through the issuance of the financial statements and determined that no events have occurred that require disclosure.
Abbreviations
| | |
| Selected Portfolio |
| ADR | | American Depositary Receipt |
| | | | | | |
franklintempleton.com | | Annual Report | | | 31 | |
FRANKLIN GLOBAL TRUST
Report of Independent Registered Public Accounting Firm
To the Board of Trustees of Franklin Global Trust and Shareholders of the Franklin Global Listed Infrastructure Fund
In our opinion, the accompanying statement of assets and liabilities, including the statement of investments, and the related statements of operations and of changes in net assets and the financial highlights present fairly, in all material respects, the financial position of the Franklin Global Listed Infrastructure Fund (the “Fund”) as of July 31, 2017, the results of its operations for the year then ended, the changes in its net assets for each of the two years in the period then ended and the financial highlights for each of the periods indicated, in conformity with accounting principles generally accepted in the United States of America. These financial statements and financial highlights (hereafter referred to as “financial statements”) are the responsibility of the Fund’s management. Our responsibility is to express an opinion on these financial statements based on our audits. We conducted our audits of these financial statements in accordance with the standards of the Public Company Accounting Oversight Board (United States). Those standards require that we plan and perform the audit to obtain reasonable assurance about whether the financial statements are free of material misstatement. An audit includes examining, on a test basis, evidence supporting the amounts and disclosures in the financial statements, assessing the accounting principles used and significant estimates made by management, and evaluating the overall financial statement presentation. We believe that our audits, which included confirmation of securities as of July 31, 2017 by correspondence with the custodian, transfer agent and brokers, provide a reasonable basis for our opinion.
PricewaterhouseCoopers LLP
San Francisco, California
September 15, 2017
| | | | |
32 | | Annual Report | | franklintempleton.com |
FRANKLIN GLOBAL TRUST
Tax Information (unaudited)
Under Section 854(b)(1)(A) of the Internal Revenue Code (Code), the Fund hereby reports 51.30% of the ordinary income dividends as income qualifying for the dividends received deduction for the fiscal year ended July 31, 2017.
Under Section 854(b)(1)(B) of the Code, the Fund hereby reports the maximum amount allowable but no less than $1,235,636 as qualified dividends for purposes of the maximum rate under Section 1(h)(11) of the Code for the fiscal year ended July 31, 2017. Distributions, including qualified dividend income, paid during calendar year 2017 will be reported to shareholders on Form 1099-DIV by mid-February 2018. Shareholders are advised to check with their tax advisors for information on the treatment of these amounts on their individual income tax returns.
At July 31, 2016, more than 50% of Fund’s total assets were invested in securities of foreign issuers. In most instances, foreign taxes were withheld from income paid to the Funds on these investments. As shown in the table below, the Fund hereby reports to shareholders the foreign source income and foreign taxes paid, pursuant to Section 853 of the Code. This written statement will allow shareholders of record on September 14, 2016, to treat their proportionate share of foreign taxes paid by the Fund as having been paid directly by them. The shareholder shall consider these amounts as foreign taxes paid in the tax year in which they receive the Fund distribution.
The following table provides a detailed analysis of foreign tax paid, foreign source income, and foreign source qualified dividends as reported by the Fund, to Class A, Class C, Class R, Class R6, and Advisor Class shareholders of record.
| | | | | | | | | | | | |
| Class | | Foreign Tax Paid
Per Share | | | Foreign Source
Income Per Share | | | Foreign Source Qualified
Dividends Per Share | |
| Franklin Global Listed Infrastructure Fund | | | | | | | | | | | | |
Class A | | | $0.0215 | | | | $0.1562 | | | | $0.1378 | |
Class C | | | $0.0215 | | | | $0.1099 | | | | $0.0971 | |
Class R | | | $0.0215 | | | | $0.1602 | | | | $0.1415 | |
Class R6 | | | $0.0215 | | | | $0.1851 | | | | $0.1634 | |
Advisor Class | | | $0.0215 | | | | $0.1783 | | | | $0.1575 | |
Foreign Tax Paid Per Share (Column 1) is the amount per share available to you, as a tax credit (assuming you held your shares in the Fund for a minimum of 16 days during the 31-day period beginning 15 days before the ex-dividend date of the Fund’s distribution to which the foreign taxes relate), or, as a tax deduction.
Foreign Source Income Per Share (Column 2) is the amount per share of income dividends attributable to foreign securities held by the Fund, plus any foreign taxes withheld on these dividends. The amounts reported include foreign source qualified dividends that have not been adjusted for the rate differential applicable to such dividend income.1
Foreign Source Qualified Dividends Per Share (Column 3) is the amount per share of foreign source qualified dividends, plus any foreign taxes withheld on these dividends. These amounts represent the portion of the Foreign Source Income reported to you in column 2 that were derived from qualified foreign securities held by the Fund.1
By mid-February 2017, shareholders received Form 1099-DIV which included their share of taxes paid and foreign source income distributed during the calendar year 2016. The Foreign Source Income reported on Form 1099-DIV has not been adjusted for the rate differential on foreign source qualified dividend income. Shareholders are advised to check with their tax advisors for information on the treatment of these amounts on their 2016 individual income tax returns.
1Qualified dividends are taxed at reduced long term capital gains tax rates. In determining the amount of foreign tax credit that may be applied against the U.S. tax liability of individuals receiving foreign source qualified dividends, adjustments may be required to the foreign tax credit limitation calculation to reflect the rate differential applicable to such dividend income. The rules however permit certain individuals to elect not to apply the rate differential adjustments for capital gains and/or dividends for any taxable year. Please consult your tax advisor and the instructions to Form 1116 for more information.
| | | | | | |
franklintempleton.com | | Annual Report | | | 33 | |
FRANKLIN GLOBAL TRUST
Board Members and Officers
The name, year of birth and address of the officers and board members, as well as their affiliations, positions held with the Trust, principal occupations during at least the past five years and number of U.S. registered portfolios overseen in the Franklin Templeton Investments fund complex, are shown below. Generally, each board member serves until that person’s successor is elected and qualified.
Independent Board Members
| | | | | | | | |
Name, Year of Birth and Address | | Position | | Length of Time Served | | Number of Portfolios in
Fund Complex Overseen
by Board Member* | | Other Directorships Held During at Least the Past 5 Years |
| | | | |
Harris J. Ashton (1932) One Franklin Parkway San Mateo, CA 94403-1906 | | Trustee | | Since 2000 | | 140 | | Bar-S Foods (meat packing company) (1981-2010). |
| | |
| Principal Occupation During at Least the Past 5 Years: | | | | |
Director of various companies; and formerly, Director, RBC Holdings, Inc. (bank holding company) (until 2002); and President, Chief Executive Officer and Chairman of the Board, General Host Corporation (nursery and craft centers) (until 1998). |
| | | | |
Mary C. Choksi (1950) One Franklin Parkway San Mateo, CA 94403-1906 | | Trustee | | Since 2014 | | 134 | | Avis Budget Group Inc. (car rental)
(2007-present), Omnicom Group Inc.
(advertising and marketing communications services) (2011-present). |
| | |
| Principal Occupation During at Least the Past 5 Years: | | | | |
Director of various companies; and formerly, Founder and Senior Advisor, Strategic Investment Group (investment management group) (2015-2017), Founding Partner and Senior Managing Director, Strategic Investment Group (1987-2015); Founding Partner and Managing Director, Emerging Markets Management LLC (investment management firm) (1987-2011); and Loan Officer/Senior Loan Officer/Senior Pension Investment Officer, World Bank Group (international financial institution) (1977-1987). |
| | | | |
Edith E. Holiday (1952) One Franklin Parkway San Mateo, CA 94403-1906 | | Trustee | | Since 2000 | | 140 | | Hess Corporation (exploration of oil and gas) (1993-present), Canadian National Railway (railroad) (2001-present), White Mountains Insurance Group, Ltd. (holding company) (2004-present), Santander Consumer USA Holdings, Inc. (consumer finance) (2016-present), RTI International Metals, Inc. (manufacture and distribution of titanium) (1999-2015) and H.J. Heinz Company (processed foods and allied products) (1994-2013). |
| | |
| Principal Occupation During at Least the Past 5 Years: | | | | |
Director or Trustee of various companies and trusts; and formerly, Assistant to the President of the United States and Secretary of the Cabinet (1990-1993); General Counsel to the United States Treasury Department (1989-1990); and Counselor to the Secretary and Assistant Secretary for Public Affairs and Public Liaison – United States Treasury Department (1988-1989). |
| | | | |
J. Michael Luttig (1954) One Franklin Parkway San Mateo, CA 94403-1906 | | Trustee | | Since 2009 | | 140 | | Boeing Capital Corporation (aircraft financing) (2006-2013). |
| | |
| Principal Occupation During at Least the Past 5 Years: | | | | |
Executive Vice President, General Counsel and member of the Executive Council, The Boeing Company (aerospace company) (2006-present); and formerly, Federal Appeals Court Judge, U.S. Court of Appeals for the Fourth Circuit (1991-2006). |
| | | | |
34 | | Annual Report | | franklintempleton.com |
FRANKLIN GLOBAL TRUST
Independent Board Members (continued)
| | | | | | | | |
Name, Year of Birth and Address | | Position | | Length of Time Served | | Number of Portfolios in
Fund Complex Overseen
by Board Member* | | Other Directorships Held During at
Least the Past 5 Years |
| | | | |
Larry D. Thompson (1945) One Franklin Parkway San Mateo, CA 94403-1906 | | Trustee | | Since 2007 | | 140 | | The Southern Company (energy company) (2014-present; previously 2010-2012), Graham Holdings Company (education and media organization) (2011-present) and Cbeyond, Inc. (business communications provider) (2010-2012). |
| | |
| Principal Occupation During at Least the Past 5 Years: | | | | |
Director of various companies; John A. Sibley Professor of Corporate and Business Law, University of Georgia School of Law (2015-present; previously 2011-2012); and formerly, Executive Vice President – Government Affairs, General Counsel and Corporate Secretary, PepsiCo, Inc. (consumer products) (2012-2014); Senior Vice President - Government Affairs, General Counsel and Secretary, PepsiCo, Inc. (2004-2011); Senior Fellow of The Brookings Institution (2003-2004); Visiting Professor, University of Georgia School of Law (2004); and Deputy Attorney General, U.S. Department of Justice (2001-2003). |
| | | | |
John B. Wilson (1959) One Franklin Parkway San Mateo, CA 94403-1906 | | Lead Independent Trustee | | Trustee since 2006 and Lead Independent Trustee since 2008 | | 114 | | None |
| | |
| Principal Occupation During at Least the Past 5 Years: | | | | |
| President and Founder, Hyannis Port Capital, Inc. (real estate and private equity investing); (2002-present); serves on private and non-profit boards; and formerly, President, Staples International and Head of Global Transformation (office supplies) (2012-2016); Chief Operating Officer and Executive Vice President, Gap, Inc. (retail) (1996-2000); Chief Financial Officer and Executive Vice President – Finance and Strategy, Staples, Inc. (1992-1996); Senior Vice President – Corporate Planning, Northwest Airlines, Inc. (airlines) (1990-1992); and Vice President and Partner, Bain & Company (consulting firm) (1986-1990). |
Interested Board Members and Officers
| | | | | | | | |
Name, Year of Birth and Address | | Position | | Length of Time Served | | Number of Portfolios in
Fund Complex Overseen
by Board Member* | | Other Directorships Held During at Least the Past 5 Years |
| | | | |
**Gregory E. Johnson (1961) One Franklin Parkway San Mateo, CA 94403-1906 | | Trustee | | Since 2007 | | 156 | | None |
| | |
| Principal Occupation During at Least the Past 5 Years: | | | | |
Chairman of the Board, Member – Office of the Chairman, Director and Chief Executive Officer, Franklin Resources, Inc.; officer and/or director or trustee, as the case may be, of some of the other subsidiaries of Franklin Resources, Inc. and of 44 of the investment companies in Franklin Templeton Investments; Vice Chairman, Investment Company Institute; and formerly, President, Franklin Resources, Inc. (1994-2015). |
| | | | |
**Rupert H. Johnson, Jr. (1940) One Franklin Parkway San Mateo, CA 94403-1906 | | Chairman of the Board and Trustee | | Since 2013 | | 140 | | None |
| | |
| Principal Occupation During at Least the Past 5 Years: | | | | |
Vice Chairman, Member - Office of the Chairman and Director, Franklin Resources, Inc.; Director, Franklin Advisers, Inc.; Senior Vice President, Franklin Advisory Services, LLC; and officer and/or director or trustee, as the case may be, of some of the other subsidiaries of Franklin Resources, Inc. and of 42 of the investment companies in Franklin Templeton Investments. |
| | | | |
Alison E. Baur (1964) One Franklin Parkway San Mateo, CA 94403-1906 | | Vice President | | Since 2012 | | Not Applicable | | Not Applicable |
| | |
| Principal Occupation During at Least the Past 5 Years: | | | | |
Deputy General Counsel, Franklin Templeton Investments; and officer of some of the other subsidiaries of Franklin Resources, Inc. and of 45 of the investment companies in Franklin Templeton Investments. |
| | | | | | |
franklintempleton.com | | Annual Report | | | 35 | |
FRANKLIN GLOBAL TRUST
Interested Board Members and Officers (continued)
| | | | | | | | |
Name, Year of Birth and Address | | Position | | Length of Time Served | | Number of Portfolios in
Fund Complex Overseen
by Board Member* | | Other Directorships Held During at Least the Past 5 Years |
| Gaston Gardey (1967) | | Chief Financial | | Since 2009 | | Not Applicable | | Not Applicable |
| One Franklin Parkway | | Officer, | | | | | | |
| San Mateo, CA 94403-1906 | | Chief | | | | | | |
| | Accounting | | | | | | |
| | Officer and | | | | | | |
| | Treasurer | | | | | | |
| | |
| Principal Occupation During at Least the Past 5 Years: | | | | |
Treasurer, U.S. Fund Administration & Reporting, Franklin Templeton Investments; and officer of 27 of the investment companies in Franklin Templeton Investments. |
| | | | |
| Aliya S. Gordon (1973) | | Vice President | | Since 2009 | | Not Applicable | | Not Applicable |
| One Franklin Parkway | | | | | | | | |
| San Mateo, CA 94403-1906 | | | | | | | | |
| | |
| Principal Occupation During at Least the Past 5 Years: | | | | |
Senior Associate General Counsel, Franklin Templeton Investments; and officer of 45 of the investment companies in Franklin Templeton Investments. |
| | | | |
| Steven J. Gray (1955) | | Vice President | | Since 2009 | | Not Applicable | | Not Applicable |
| One Franklin Parkway | | | | | | | | |
| San Mateo, CA 94403-1906 | | | | | | | | |
| | |
| Principal Occupation During at Least the Past 5 Years: | | | | |
Senior Associate General Counsel, Franklin Templeton Investments; Vice President, Franklin Templeton Distributors, Inc. and FT AlphaParity, LLC; and officer of 45 of the investment companies in Franklin Templeton Investments. |
| | | | |
| Matthew T. Hinkle (1971) | | Chief Executive | | Since June 2017 | | Not Applicable | | Not Applicable |
| One Franklin Parkway | | Officer – | | | | | | |
| San Mateo, CA 94403-1906 | | Finance and | | | | | | |
| | Administration | | | | | | |
| | |
| Principal Occupation During at Least the Past 5 Years: | | | | |
Senior Vice President, U.S. Fund Administration Reporting & Fund Tax, Franklin Templeton Investments; officer of 45 of the investment companies in Franklin Templeton Investments; and formerly, Vice President, Global Tax (2012-April 2017) and Treasurer/Assistant Treasurer, Franklin Templeton Investments (2009-2017). |
| | | | |
| Edward B. Jamieson (1948) | | President and | | Since 2010 | | Not Applicable | | Not Applicable |
| One Franklin Parkway | | Chief Executive Officer – | | | | | | |
| San Mateo, CA 94403-1906 | | | | | | | |
| | Investment | | | | | | |
| | Management | | | | | | |
| | |
| Principal Occupation During at Least the Past 5 Years: | | | | |
President and Director, Franklin Advisers, Inc.; Executive Vice President, Franklin Templeton Institutional, LLC; and officer and/or trustee, as the case may be, of some of the other subsidiaries of Franklin Resources, Inc. and of 10 of the investment companies in Franklin Templeton Investments. |
| | | | |
| Robert Lim (1948) | | Vice President | | Since 2016 | | Not Applicable | | Not Applicable |
| One Franklin Parkway | | –AML | | | | | | |
| San Mateo, CA 94403-1906 | | Compliance | | | | | | |
| | |
| Principal Occupation During at Least the Past 5 Years: | | | | |
Vice President, Franklin Templeton Companies, LLC; Chief Compliance Officer, Franklin Templeton Distributors, Inc. and Franklin Templeton Investor Services, LLC; and officer of 45 of the investment companies in Franklin Templeton Investments. |
| | | | |
Christopher J. Molumphy (1962) | | Vice President | | Since 2000 | | Not Applicable | | Not Applicable |
| One Franklin Parkway | | | | | | | | |
| San Mateo, CA 94403-1906 | | | | | | | | |
| | |
| Principal Occupation During at Least the Past 5 Years: | | | | |
| Director and Executive Vice President, Franklin Advisers, Inc.; Executive Vice President, Franklin Templeton Institutional, LLC; and officer of some of the other subsidiaries of Franklin Resources, Inc. and of 22 of the investment companies in Franklin Templeton Investments. |
| | |
| | | | |
| 36 | | Annual Report | | franklintempleton.com |
FRANKLIN GLOBAL TRUST
Interested Board Members and Officers (continued)
| | | | | | | | |
Name, Year of Birth and Address | | Position | | Length of Time Served | | Number of Portfolios in
Fund Complex Overseen
by Board Member* | | Other Directorships Held During at Least the Past 5 Years |
| Kimberly H. Novotny (1972) | | Vice President | | Since 2013 | | Not Applicable | | Not Applicable |
| 300 S.E. 2nd Street | | | | | | | | |
| Fort Lauderdale, FL 33301-1923 | | | | | | | | |
| | |
| Principal Occupation During at Least the Past 5 Years: | | | | |
Associate General Counsel, Franklin Templeton Investments; Vice President and Corporate Secretary, Fiduciary Trust International of the South; Vice President, Templeton Investment Counsel, LLC; Assistant Secretary, Franklin Resources, Inc.; and officer of 45 of the investment companies in Franklin Templeton Investments. |
| | | | |
| Robert C. Rosselot (1960) | | Chief | | Since 2013 | | Not Applicable | | Not Applicable |
| 300 S.E. 2nd Street | | Compliance | | | | | | |
| Fort Lauderdale, FL 33301-1923 | | Officer | | | | | | |
| | |
| Principal Occupation During at Least the Past 5 Years: | | | | |
Director, Global Compliance, Franklin Templeton Investments; Vice President, Franklin Templeton Companies, LLC; officer of 45 of the investment companies in Franklin Templeton Investments; and formerly, Senior Associate General Counsel, Franklin Templeton Investments (2007-2013); and Secretary and Vice President, Templeton Group of Funds (2004-2013). |
| | | | |
| Karen L. Skidmore (1952) | | Vice President | | Since 2006 | | Not Applicable | | Not Applicable |
| One Franklin Parkway | | and Secretary | | | | | | |
| San Mateo, CA 94403-1906 | | | | | | | | |
| | |
| Principal Occupation During at Least the Past 5 Years: | | | | |
Senior Associate General Counsel, Franklin Templeton Investments; and officer of 45 of the investment companies in Franklin Templeton Investments. |
| | | | |
| Navid J. Tofigh (1972) | | Vice President | | Since 2015 | | Not Applicable | | Not Applicable |
| One Franklin Parkway | | | | | | | | |
| San Mateo, CA 94403-1906 | | | | | | | | |
| | |
| Principal Occupation During at Least the Past 5 Years: | | | | |
Associate General Counsel, Franklin Templeton Investments; and officer of 45 of the investment companies in Franklin Templeton Investments. |
| | | | |
| Craig S. Tyle (1960) | | Vice President | | Since 2005 | | Not Applicable | | Not Applicable |
| One Franklin Parkway | | | | | | | | |
| San Mateo, CA 94403-1906 | | | | | | | | |
| | |
| Principal Occupation During at Least the Past 5 Years: | | | | |
General Counsel and Executive Vice President, Franklin Resources, Inc.; and officer of some of the other subsidiaries of Franklin Resources, Inc. and of 45 of the investment companies in Franklin Templeton Investments. |
| | | | |
| Lori A. Weber (1964) | | Vice President | | Since 2011 | | Not Applicable | | Not Applicable |
| 300 S.E. 2nd Street | | | | | | | | |
| Fort Lauderdale, FL 33301-1923 | | | | | | | | |
| | |
| Principal Occupation During at Least the Past 5 Years: | | | | |
| Senior Associate General Counsel, Franklin Templeton Investments; Assistant Secretary, Franklin Resources, Inc.; Vice President and |
Secretary, Templeton Investment Counsel, LLC; and officer of 45 of the investment companies in Franklin Templeton Investments. |
*We base the number of portfolios on each separate series of the U.S. registered investment companies within the Franklin Templeton Investments fund complex. These portfolios have a common investment manager or affiliated investment managers.
**Gregory E. Johnson is considered to be an interested person of the Fund under the federal securities laws due to his position as an officer and director of Franklin Resources, Inc. (Resources), which is the parent company of the Fund’s investment manager and distributor. Rupert H. Johnson, Jr. is considered to be an interested person of the Fund under the federal securities laws due to his position as officer and director and major shareholder of Resources.
Note 1: Rupert H. Johnson, Jr. is the uncle of Gregory E. Johnson.
Note 2: Officer information is current as of the date of this report. It is possible that after this date, information about officers may change.
Note 3: Effective November 1, 2016, Frank Olson ceased to be a trustee of the trust.
The Sarbanes-Oxley Act of 2002 and Rules adopted by the Securities and Exchange Commission require the Fund to disclose whether the Fund’s Audit Committee includes at least one member who is an audit committee financial expert within the meaning of such Act and Rules. The Fund’s Board has determined that there is at least one such financial expert on the Audit Committee and has designated John B. Wilson as its audit committee financial expert. The Board believes that Mr. Wilson qualifies as such an expert in view of his extensive business background and experience, including service as chief financial officer of Staples, Inc. from 1992 to 1996. Mr. Wilson has been a Member and Chairman of the Fund’s Audit Committee since 2006. As a result of such background and
| | | | | | |
| franklintempleton.com | | Annual Report | | | 37 | |
FRANKLIN GLOBAL TRUST
Interested Board Members and Officers (continued)
experience, the Board believes that Mr. Wilson has acquired an understanding of generally accepted accounting principles and financial statements, the general application of such principles in connection with the accounting estimates, accruals and reserves, and analyzing and evaluating financial statements that present a breadth and level of complexity of accounting issues generally comparable to those of the Fund, as well as an understanding of internal controls and procedures for financial reporting and an understanding of audit committee functions. Mr. Wilson is an independent Board member as that term is defined under the relevant Securities and Exchange Commission Rules and Releases.
The Statement of Additional Information (SAI) includes additional information about the board members and is available, without charge, upon request. Shareholders may call (800) DIAL BEN/342-5236 to request the SAI.
| | | | |
38 | | Annual Report | | franklintempleton.com |
FRANKLIN GLOBAL TRUST
FRANKLIN GLOBAL LISTED INFRASTRUCTURE FUND
Shareholder Information
Board Review of Investment Management Agreements
FRANKLIN GLOBAL TRUST
Franklin Global Listed Infrastructure Fund
(Fund)
At an in-person meeting held on February 28, 2017 (Meeting), the Board of Trustees (Board) of Franklin Global Trust, including a majority of the trustees who are not “interested persons” as defined in the Investment Company Act of 1940 (Independent Trustees), reviewed and approved the continuance of the investment management agreement between Franklin Templeton Institutional, LLC (Manager) and the Fund (Management Agreement) for an additional one-year period. The Independent Trustees received advice from and met separately with Independent Trustee counsel in considering whether to approve the continuation of the Management Agreement.
In considering the continuation of the Management Agreement, the Board reviewed and considered information provided by the Manager at the Meeting and throughout the year at meetings of the Board and its committees. The Board also reviewed and considered information provided in response to a detailed set of requests for information submitted to the Manager by Independent Trustee counsel on behalf of the Independent Trustees in connection with the annual contract renewal process. In addition, prior to the Meeting, the Independent Trustees held a telephonic contract renewal meeting at which the Independent Trustees conferred amongst themselves and Independent Trustee counsel about contract renewal matters. The Board reviewed and considered all of the factors it deemed relevant in approving the continuance of the Management Agreement, including, but not limited to: (i) the nature, extent, and quality of the services provided by the Manager; (ii) the investment performance of the Fund; (iii) the costs of the services provided and profits realized by the Manager and its affiliates from the relationship with the Fund; (iv) the extent to which economies of scale are realized as the Fund grows; and (v) whether fee levels reflect these economies of scale for the benefit of Fund investors.
In approving the continuance of the Management Agreement, the Board, including a majority of the Independent Trustees, determined that the existing management fees are fair and reasonable and that the continuance of such Management Agreement is in the interests of the Fund and its shareholders. While attention was given to all information furnished, the
following discusses some primary factors relevant to the Board’s determination.
Nature, Extent and Quality of Services
The Board reviewed and considered information regarding the nature, extent and quality of investment management services provided by the Manager and its affiliates to the Fund and its shareholders. This information included, among other things, the qualifications, background and experience of the senior management and investment personnel of the Manager; the structure of investment personnel compensation; oversight of third-party service providers; investment performance reports and related financial information for the Fund; reports on expenses, shareholder services, marketing support payments made to financial intermediaries and third party servicing arrangements; legal and compliance matters; risk controls; pricing and other services provided by the Manager and its affiliates; and management fees charged by the Manager and its affiliates to U.S. funds and other accounts, including management’s explanation of differences among accounts where relevant. The Board noted management’s continual efforts and expenditures in establishing effective business continuity plans and developing strategies to address areas of heightened concern in the mutual fund industry, such as cybersecurity, derivatives and liquidity risk management.
The Board also reviewed and considered the benefits provided to Fund shareholders of investing in a fund that is part of the Franklin Templeton family of funds. The Board noted the financial position of Franklin Resources, Inc. (FRI), the Manager’s parent, and its commitment to the mutual fund business as evidenced by its continued introduction of new funds, reassessment of the fund offerings in response to the market environment and project initiatives and capital investments relating to the services provided to the Fund by the Franklin Templeton Investments (FTI) organization.
Following consideration of such information, the Board was satisfied with the nature, extent and quality of services provided by the Manager and its affiliates to the Fund and its shareholders.
Fund Performance
The Board reviewed and considered the performance results of the Fund over various time periods ended December 31, 2016. The Board considered the performance returns for the Fund in comparison to the performance returns of mutual funds deemed comparable to the Fund included in a universe (Performance Universe) selected by Broadridge Financial Solutions, Inc. (Broadridge), an independent provider of investment company
| | | | | | |
| franklintempleton.com | | Annual Report | | | 39 | |
FRANKLIN GLOBAL TRUST
FRANKLIN GLOBAL LISTED INFRASTRUCTURE FUND
SHAREHOLDER INFORMATION
data. The Board received a description of the methodology used by Broadridge to select the mutual funds included in a Performance Universe. The Board also reviewed and considered Fund performance reports provided and discussions that occurred with portfolio managers at Board meetings throughout the year. A summary of the Fund’s performance results is below.
The Performance Universe for the Fund included the Fund and all retail and institutional global infrastructure funds. The Board noted that the Fund’s annualized total return for the one-and three-year periods was above the median of its Performance Universe. The Board concluded that the Fund’s performance was satisfactory, further noting that the Fund has been in operation for less than five years.
Comparative Fees and Expenses
The Board reviewed and considered information regarding the Fund’s actual total expense ratio and its various components, including, as applicable, management fees; transfer agent expenses; underlying fund expenses; Rule 12b-1 and non-Rule 12b-1 service fees; and other non-management fees. The Board also noted that at its February meeting each year, it receives an annual report on all marketing support payments made by FTI to financial intermediaries. The Board considered the actual total expense ratio and, separately, the contractual management fee rate, without the effect of fee waivers, if any (Management Rate) of the Fund in comparison to the median ratio and median Management Rate, respectively, of other mutual funds deemed comparable to and with a similar expense structure as the Fund selected by Broadridge (Expense Group). Broadridge fee and expense data is based upon information taken from the fund’s most recent annual report, which reflects historical asset levels that may be quite different from those currently existing, particularly in a period of market volatility. While recognizing such inherent limitation and the fact that expense ratios and Management Rates generally increase as assets decline and decrease as assets grow, the Board believed the independent analysis conducted by Broadridge to be an appropriate measure of comparative fees and expenses. The Broadridge Management Rate includes administrative charges, and the actual total expense ratio, for comparative consistency, was shown for Class A shares for funds with multiple classes of shares. The Board received a description of the methodology used by Broadridge to select the mutual funds included in an Expense Group.
The Expense Group for the Fund included the Fund and ten other global infrastructure funds. The Board noted that the
Management Rate for the Fund was above the median of its Expense Group, but its actual total expense ratio was equal to the median of its Expense Group. The Board concluded that the Management Rate charged to the Fund is fair and reasonable. In doing so, the Board acknowledged management’s explanation that there are additional complexities and expenses associated with the management of the portfolio. Further, the Board noted that the Fund’s actual total expense ratio reflected a fee waiver from management and the Fund’s Management Rate.
Profitability
The Board reviewed and considered information regarding the profits realized by the Manager and its affiliates in connection with the operation of the Fund. In this respect, the Board considered the Fund profitability analysis provided by the Manager that addresses the overall profitability of FTI’s U.S. fund business, as well as its profits in providing investment management and other services to each of the individual funds during the 12-month period ended September 30, 2016, being the most recent fiscal year-end for FRI. The Board noted that although management continually makes refinements to its methodologies used in calculating profitability in response to organizational and product related changes, the overall methodology has remained consistent with that used in the Fund’s profitability report presentations from prior years. Additionally, the Fund’s independent registered public accounting firm has been engaged by the Manager to periodically review the reasonableness of the allocation methodologies to be used solely by the Fund’s Board with respect to the profitability analysis.
The Board noted management’s belief that costs incurred in establishing the infrastructure necessary for the type of mutual fund operations conducted by the Manager and its affiliates may not be fully reflected in the expenses allocated to the Fund in determining its profitability, as well as the fact that the level of profits, to a certain extent, reflected operational cost savings and efficiencies initiated by management. The Board also noted management’s expenditures in improving shareholder services provided to the Fund, as well as the need to implement systems and meet additional regulatory and compliance requirements resulting from recent SEC and other regulatory requirements.
The Board also considered the extent to which the Manager and its affiliates might derive ancillary benefits from fund operations, including revenues generated from transfer agent services, potential benefits resulting from personnel and systems enhancements necessitated by fund growth, as well as
| | | | |
40 | | Annual Report | | franklintempleton.com |
FRANKLIN GLOBAL TRUST
FRANKLIN GLOBAL LISTED INFRASTRUCTURE FUND
SHAREHOLDER INFORMATION
increased leverage with service providers and counterparties. Based upon its consideration of all these factors, the Board concluded that the level of profits realized by the Manager and its affiliates from providing services to the Fund was not excessive in view of the nature, quality and extent of services provided to the Fund.
Economies of Scale
The Board reviewed and considered the extent to which the Manager may realize economies of scale, if any, as the Fund grows larger and whether the Fund’s management fee structure reflects any economies of scale for the benefit of shareholders. With respect to possible economies of scale, the Board noted the existence of management fee breakpoints, which operate generally to share any economies of scale with a Fund’s shareholders by reducing the Fund’s effective management fees as the Fund grows in size. The Board considered the Manager’s view that any analyses of potential economies of scale in managing a particular fund are inherently limited in light of the joint and common costs and investments the Manager incurs across the Franklin Templeton family of funds as a whole. The Board noted that the Fund has not yet reached an asset size that would likely enable the Fund to achieve economies of scale, but concluded that to the extent economies of scale may be realized by the Manager and its affiliates, the Fund’s management fee structure provided a sharing of benefits with the Fund and its shareholders as the Fund grows.
Conclusion
Based on its review, consideration and evaluation of all factors it believed relevant, including the above-described factors and conclusions, the Board unanimously approved the continuation of the Management Agreement for an additional one-year period.
Proxy Voting Policies and Procedures
The Fund’s investment manager has established Proxy Voting Policies and Procedures (Policies) that the Fund uses to determine how to vote proxies relating to portfolio securities. Shareholders may view the Fund’s complete Policies online at franklintempleton.com. Alternatively, shareholders may request copies of the Policies free of charge by calling the Proxy Group collect at (954) 527-7678 or by sending a written request to: Franklin Templeton Companies, LLC, 300 S.E. 2nd Street, Fort Lauderdale, FL 33301, Attention: Proxy Group. Copies of the Fund’s proxy voting records are also made available online at franklintempleton.com and posted on the U.S. Securities and Exchange Commission’s website at sec.gov and reflect the most recent 12-month period ended June 30.
Quarterly Statement of Investments
The Trust, on behalf of the Fund, files a complete statement of investments with the U.S. Securities and Exchange Commission for the first and third quarters for each fiscal year on Form N-Q. Shareholders may view the filed Form N-Q by visiting the Commission’s website at sec.gov. The filed form may also be viewed and copied at the Commission’s Public Reference Room in Washington, DC. Information regarding the operations of the Public Reference Room may be obtained by calling (800) SEC-0330.
Householding of Reports and Prospectuses
You will receive the Fund’s financial reports every six months as well as an annual updated summary prospectus (prospectus available upon request). To reduce Fund expenses, we try to identify related shareholders in a household and send only one copy of the financial reports and summary prospectus. This process, called “householding,” will continue indefinitely unless you instruct us otherwise. If you prefer not to have these documents householded, please call us at (800) 632-2301. At any time you may view current prospectuses/summary prospectuses and financial reports on our website. If you choose, you may receive these documents through electronic delivery.
| | | | | | |
franklintempleton.com | | Annual Report | | | 41 | |
This page intentionally left blank.
This page intentionally left blank.
This page intentionally left blank.
| | |

| | Annual Report and Shareholder Letter |
| | Franklin Global Listed Infrastructure Fund |
| | |
| | |
| | Investment Manager |
| | Franklin Templeton Institutional, LLC |
| | |
| | Distributor |
| | Franklin Templeton Distributors, Inc. |
| | (800) DIAL BEN® / 342-5236 |
| | franklintempleton.com |
| | |
| | Shareholder Services |
| | (800) 632-2301 |
Authorized for distribution only when accompanied or preceded by a summary prospectus and/or prospectus. Investors should carefully consider a fund’s investment goals, risks, charges and expenses before investing. A prospectus contains this and other information; please read it carefully before investing.
To help ensure we provide you with quality service, all calls to and from our service areas are monitored and/or recorded.
| | |
| © 2017 Franklin Templeton Investments. All rights reserved. | | 997 A 09/17 |
(a) The Registrant has adopted a code of ethics that applies to its principal executive officers and principal financial and accounting officer.
(c) N/A
(d) N/A
(f) Pursuant to Item 12(a)(1), the Registrant is attaching as an exhibit a copy of its code of ethics that applies to its principal executive officers and principal financial and accounting officer.
| Item 3. | Audit Committee Financial Expert. |
(a)(1) The Registrant has an audit committee financial expert serving on its audit committee.
(2) The audit committee financial expert is John B. Wilson and he is “independent” as defined under the relevant Securities and Exchange Commission Rules and Releases.
| Item 4. | Principal Accountant Fees and Services. |
(a) Audit Fees
The aggregate fees paid to the principal accountant for professional services rendered by the principal accountant for the audit of the registrant’s annual financial statements or for services that are normally provided by the principal accountant in connection with statutory and regulatory filings or engagements were $233,920 for the fiscal year ended July 31, 2017 and $298,236 for the fiscal year ended July 31, 2016.
(b) Audit-Related Fees
There were no fees paid to the principal accountant for assurance and related services rendered by the principal accountant to the registrant that are reasonably related to the performance of the audit of the registrant’s financial statements and are not reported under paragraph (a) of Item 4.
There were no fees paid to the principal accountant for assurance and related services rendered by the principal accountant to the registrant’s investment adviser and any entity controlling, controlled by or under common control with the investment adviser that provides ongoing services to the registrant that are reasonably related to the performance of the audit of their financial statements.
(c) Tax Fees
There were no fees paid to the principal accountant for professional services rendered by the principal accountant to the registrant for tax compliance, tax advice and tax planning.
There were no fees paid to the principal accountant for professional services rendered by the principal accountant to the registrant’s investment adviser and any entity controlling, controlled by or under common control with the investment adviser that provides ongoing services to the registrant for tax compliance, tax advice and tax planning.
(d) All Other Fees
The aggregate fees paid to the principal accountant for products and services rendered by the principal accountant to the registrant not reported in paragraphs (a)-(c) of Item 4 were $0 for the fiscal year ended July 31, 2017 and $1,006 for the fiscal year ended July 31, 2016. The services for which these fees were paid included review of materials provided to the fund Board in connection with the investment management contract renewal process.
The aggregate fees paid to the principal accountant for products and services rendered by the principal accountant to the registrant’s investment adviser and any entity controlling, controlled by or under common control with the investment adviser that provides ongoing services to the registrant, other than services reported in paragraphs (a)-(c) of Item 4 were $258,717 for the fiscal year ended July 31, 2017 and $446,983 for the fiscal year ended July 31, 2016. The services for which these fees were paid included preparation and review of materials provided to the fund Board in connection with the investment management contract renewal process and derivatives assessment, and review of system processes related to fixed income securities. Other services include XBRL tagging on financial statements and compliance examination for Investment Advisor Act rule 204-2 and 206-4(2).
(e) (1) The registrant’s audit committee is directly responsible for approving the services to be provided by the auditors, including:
(i) pre-approval of all audit and audit related services;
(ii) pre-approval of all non-audit related services to be provided to the Fund by the auditors;
(iii) pre-approval of all non-audit related services to be provided to the registrant by the auditors to the registrant’s investment adviser or to any entity that controls, is controlled by or is under common control with the registrant’s investment adviser and that provides ongoing services to the registrant where the non-audit services relate directly to the operations or financial reporting of the registrant; and
(iv) establishment by the audit committee, if deemed necessary or appropriate, as an alternative to committee pre-approval of services to be provided by the auditors, as required by paragraphs (ii) and (iii) above, of policies and procedures to permit such services to be pre-approved by other means, such as through establishment of guidelines or by action of a designated member or members of the committee; provided the policies and procedures are detailed as to the particular service and the committee is informed of each service and such policies and procedures do not include delegation of audit committee responsibilities, as contemplated under the Securities Exchange Act of 1934, to management; subject, in the case of (ii) through (iv), to any waivers, exceptions or exemptions that may be available under applicable law or rules.
(e) (2) None of the services provided to the registrant described in paragraphs (b)-(d) of Item 4 were approved by the audit committee pursuant to paragraph (c)(7)(i)(C) of Rule 2-01 of regulation S-X.
(f) No disclosures are required by this Item 4(f).
(g) The aggregate non-audit fees paid to the principal accountant for services rendered by the principal accountant to the registrant and the registrant’s investment adviser and any entity controlling, controlled by or under common
control with the investment adviser that provides ongoing services to the registrant were $258,717 for the fiscal year ended July 31, 2017 and $447,989 for the fiscal year ended July 31, 2016.
(h) The registrant’s audit committee of the board has considered whether the provision of non-audit services that were rendered to the registrant’s investment adviser (not including any sub-adviser whose role is primarily portfolio management and is subcontracted with or overseen by another investment adviser), and any entity controlling, controlled by, or under common control with the investment adviser that provides ongoing services to the registrant that were not pre-approved pursuant to paragraph (c)(7)(ii) of Rule 2-01 of Regulation S-X is compatible with maintaining the principal accountant’s independence.
| | | | |
| Item 5. | | Audit Committee of Listed Registrants. | | N/A |
| | |
| Item 6. | | Schedule of Investments. | | N/A |
| | |
| Item 7. | | Disclosure of Proxy Voting Policies and Procedures for Closed-End Management Investment Companies. | | N/A |
| | |
| Item 8. | | Portfolio Managers of Closed-End Management Investment Companies. | | N/A |
| | |
| Item 9. | | Purchases of Equity Securities by Closed-End Management Investment Company and Affiliated Purchasers. | | N/A |
| | |
| Item 10. | | Submission of Matters to a Vote of Security Holders. | | |
There have been no changes to the procedures by which shareholders may recommend nominees to the Registrant’s Board of Trustees that would require disclosure herein.
| Item 11. | Controls and Procedures. |
(a) Evaluation of Disclosure Controls and Procedures. The Registrant maintains disclosure controls and procedures that are designed to ensure that information required to be disclosed in the Registrant’s filings under the Securities Exchange Act of 1934 and the Investment Company Act of 1940 is recorded, processed, summarized and reported within the periods specified in the rules and forms of the Securities and Exchange Commission. Such information is accumulated and communicated to the Registrant’s management, including its principal executive officer and principal financial officer, as appropriate, to allow timely decisions regarding required disclosure. The Registrant’s management, including the principal executive officer and the principal financial officer, recognizes that any set of controls and procedures, no matter how well designed and operated, can provide only reasonable assurance of achieving the desired control objectives.
Within 90 days prior to the filing date of this Shareholder Report on Form N-CSR, the Registrant had carried out an evaluation, under the supervision and with the participation of the Registrant’s management, including the
Registrant’s principal executive officer and the Registrant’s principal financial officer, of the effectiveness of the design and operation of the Registrant’s disclosure controls and procedures. Based on such evaluation, the Registrant’s principal executive officer and principal financial officer concluded that the Registrant’s disclosure controls and procedures are effective.
(b) Changes in Internal Controls. There have been no changes in the Registrant’s internal controls or in other factors that could materially affect the internal controls over financial reporting subsequent to the date of their evaluation in connection with the preparation of this Shareholder Report on Form N-CSR.
(a) (1) Code of Ethics
(a) (2) Certifications pursuant to Section 302 of the Sarbanes-Oxley Act of 2002 of Matthew T. Hinkle, Chief Executive Officer—Finance and Administration, and Gaston Gardey, Chief Financial Officer and Chief Accounting Officer
(b) Certifications pursuant to Section 906 of the Sarbanes-Oxley Act of 2002 of Matthew T. Hinkle , Chief Executive Officer—Finance and Administration, and Gaston Gardey, Chief Financial Officer and Chief Accounting Officer
SIGNATURES
Pursuant to the requirements of the Securities Exchange Act of 1934 and the Investment Company Act of 1940, the registrant has duly caused this report to be signed on its behalf by the undersigned, thereunto duly authorized.
FRANKLIN GLOBAL TRUST
| | | | |
| By | | | | /s/ Matthew T. Hinkle |
| | | | Matthew T. Hinkle |
| | | | Chief Executive Officer—Finance and Administration |
| Date | | September 26, 2017 |
Pursuant to the requirements of the Securities Exchange Act of 1934 and the Investment Company Act of 1940, this report has been signed below by the following persons on behalf of the registrant and in the capacities and on the dates indicated.
| | | | |
| By | | | | /s/ Matthew T. Hinkle |
| | | | Matthew T. Hinkle |
| | | | Chief Executive Officer—Finance and Administration |
| Date | | September 26, 2017 |
| | | | |
| By | | | | /s/ Gaston Gardey |
| | | | Gaston Gardey |
| | | | Chief Financial Officer and Chief Accounting Officer |
| Date | | September 26, 2017 |