UNITED STATES
SECURITIES AND EXCHANGE COMMISSION
Washington, DC 20549
FORMN-CSR
CERTIFIED SHAREHOLDER REPORT OF REGISTERED
MANAGEMENT INVESTMENT COMPANIES
Investment Company Act file number811-10157
Franklin Global Trust
(Exact name of registrant as specified in charter)
One Franklin Parkway, San Mateo, CA 94403-1906
(Address of principal executive offices) (Zip code)
Craig S. Tyle, One Franklin Parkway, San Mateo, CA 94403-1906
(Name and address of agent for service)
Registrant’s telephone number, including area code: 650312-2000
Date of fiscal year end: 7/31
Date of reporting period: 7/31/19
| Item 1. | Reports to Stockholders. |
| | |
Franklin International Growth Fund | | Franklin International Small Cap Fund Formerly, Franklin International Small Cap Growth Fund |
Sign up for electronic delivery at franklintempleton.com/edelivery
Internet Delivery of Fund Reports Unless You Request Paper Copies:Effective January 1, 2021, as permitted by the SEC, paper copies of the Fund’s shareholder reports will no longer be sent by mail, unless you specifically request them from the Fund or your financial intermediary. Instead, the reports will be made available on a website, and you will be notified by mail each time a report is posted and provided with a website link to access the report.
If you already elected to receive shareholder reports electronically, you will not be affected by this change and you need not take any action. If you have not signed up for electronic delivery, we would encourage you to join fellow shareholders who have. You may elect to receive shareholder reports and other communications electronically from the Fund by calling (800)632-2301 or by contacting your financial intermediary.
You may elect to continue to receive paper copies of all your future shareholder reports free of charge by contacting your financial intermediary or, if you invest directly with a Fund, calling (800)632-2301 to let the Fund know of your request. Your election to receive reports in paper will apply to all funds held in your account.
FRANKLIN TEMPLETON
Successful investing begins with ambition. And achievement only comes when you reach for it. That’s why we continually strive to deliver better outcomes for investors. No matter what your goals are, our deep, global investment expertise allows us to offer solutions that can help.
During our more than 70 years of experience, we’ve managed through all kinds of markets—up, down and those in between. We’re always preparing for what may come next. It’s because of this, combined with our strength as one of the world’s largest asset managers that we’ve earned the trust of millions of investors around the world.
Dear Shareholder:
During the 12 months ended July 31, 2019, the global economy generally expanded amid positive economic data in certain regions, healthy corporate earnings, and the U.S. Federal Reserve’s (Fed’s) patient monetary policy stance. The European Central Bank left its benchmark interest rate unchanged and announced it would not raise rates in the next year due to risks including Brexit and global trade tensions. The Fed raised its target range for the federal funds rate by 0.25% at its September and December 2018 meetings, to 2.25%–2.50%. However, at its July 2019 meeting, the Fed lowered its target range to 2.00%–2.25%, citing muted inflation and the implications of global developments for the U.S. economy. Global markets were pressured by trade tensions between the U.S. and its trading partners and other geopolitical risks. In this environment, stocks in global developed markets excluding the U.S. and Canada ended the period with negative returns, as measured by the MSCI Europe, Australasia and Far East Index.
We are committed to ourlong-term perspective and disciplined investment approach as we conduct a rigorous, fundamental analysis of securities with a regular emphasis on investment risk management.
We believe active, professional investment management serves investors well. We also recognize the important role of financial advisors in today’s markets and encourage investors to continue to seek their advice. Amid changing markets and economic conditions, we are confident investors
with awell-diversified portfolio and a patient,long-term outlook should be well positioned for the years ahead.
Franklin Global Trust’s annual report includes more detail about prevailing conditions and discussions about investment decisions during the period. Please remember all securities markets fluctuate, as do mutual fund share prices.
We thank you for investing with Franklin Templeton, welcome your questions and comments, and look forward to serving your future investment needs.
Sincerely,

Edward Perks, CFA
President and Chief Executive Officer –
Investment Management
Franklin Global Trust
This letter reflects our analysis and opinions as of July 31, 2019, unless otherwise indicated. The information is not a complete analysis of every aspect of any market, country, industry, security or fund. Statements of fact are from sources considered reliable.
CFA® is a trademark owned by CFA Institute.
| | |
| | Not FDIC Insured | May Lose Value | No Bank Guarantee |
| | | | |
| | | |
| franklintempleton.com | | Not part of the annual report | | 1 |
Contents
|
| Visitfranklintempleton.comfor fund updates, to access your account, or to find helpful financial planning tools. |
| | | | |
| | | |
2 | | Annual Report | | franklintempleton.com |
ANNUAL REPORT
Economic and Market Overview
The U.S. economy grew during the 12 months ended July 31, 2019. After moderating for two consecutive quarters, the economy grew significantly faster in 2019’s first quarter. However, the economy moderated again in the second quarter, due to weakness in inventory investment, exports, business investment and housing investment. The unemployment rate decreased from 3.9% in July 2018 to 3.7% atperiod-end.1 The annual inflation rate, as measured by the Consumer Price Index, decreased from 2.9% in July 2018 to 1.9% atperiod-end.1
The U.S. Federal Reserve (Fed) raised its target range for the federal funds rate by 0.25% at its September and December 2018 meetings, to 2.25%–2.50%. However, at its July 2019 meeting, the Fed lowered the federal funds target rate for the first time since December 2008, to 2.00%–2.25%, citing muted inflation pressures and the potential effects of global trade tensions on economic growth. Furthermore, the Fed ended its balance sheet normalization program two months earlier than previously indicated. The broad U.S. stock market, as measured by the Standard & Poor’s® 500 Index, posted a +8.52% total return for the 12 months under review.2
The global economy expanded during the period, despite weakness in certain regions. Global developed and emerging market stocks were aided by upbeat economic data in some regions, encouraging corporate earnings reports and periods of optimism about a potential U.S.-China trade deal. The Fed’s patient approach to its monetary policy in early 2019, recent rate cut and indications it will act appropriately to sustain U.S. economic expansion and achieve its inflation objective aided market sentiment.
However, markets reflected concerns about the Fed’s interest-rate hikes and the European Central Bank’s (ECB’s) unwinding of its bond purchase program in 2018, political uncertainties in the U.S. and the European Union, and the impact of U.S. trade disputes with China and other trading partners on global growth and corporate earnings. In this environment, global developed and emerging market stocks, as measured by the MSCI All Country World Index, posted a +3.52% total return for the12-month period.2
In Europe, the U.K.’s quarterly gross domestic product (GDP) growth accelerated in 2018’s third quarter,
moderated in the fourth quarter and reaccelerated in 2019’s first quarter. However, GDP contracted in the second quarter compared with the first quarter, as Brexit uncertainties weighed on business sentiment. The Bank of England raised its key policy rate once during the period. The eurozone’s quarterly GDP growth moderated in 2018’s third quarter and accelerated in the next two quarters, before moderating again in 2019’s second quarter. The bloc’s annual inflation rate decreased during the period. The ECB concluded its bond purchase program at the end of 2018 and kept its benchmark interest rate unchanged. In June, the ECB mentioned it would leave interest rates unchanged through the first half of 2020 and provided details of its new stimulus. However, the ECB signaled in July the potential for a rate cut, while indicating support for additional stimulus to bolster economic expansion.
In Asia, Japan’s quarterly GDP growth contracted in 2018’s third quarter, accelerated in the next two quarters and moderated in 2019’s second quarter. The Bank of Japan (BOJ) left its benchmark interest rate unchanged and continued its stimulus measures during the period. In July, the BOJ expressed its openness to increase stimulus to sustain economic growth and achieve its inflation goal. China’s annual GDP growth rate moderated in 2018’s third and fourth quarters, held steady in 2019’s first quarter and moderated in the second quarter to its lowest level since 1992, amid trade tensions with the U.S. and weak global demand. The People’s Bank of China left its benchmark interest rate unchanged, but it took measures to improve financial liquidity to mitigate the effects of the U.S.-China trade dispute and support economic growth.
The foregoing information reflects our analysis and opinions as of July 31, 2019. The information is not a complete analysis of every aspect of any market, country, industry, security or fund. Statements of fact are from sources considered reliable.
1. Source: U.S. Bureau of Labor Statistics.
2. Source: Morningstar.
See www.franklintempletondatasources.com for additional data provider information.
| | | | |
| | | |
| franklintempleton.com | | Annual Report | | 3 |
Franklin International Growth Fund
This annual report for Franklin International Growth Fund covers the fiscal year ended July 31, 2019.
Your Fund’s Goal and Main Investments
The Fund seeks long-term capital appreciation by investing predominantly in equity securities ofmid- and large-capitalization companies, generally those with market capitalizations greater than $2 billion, located outside of the U.S., including developing or emerging market countries. The Fund considers international companies to be those organized under the laws of a country outside of the U.S. or having a principal office in a country outside of the U.S., or whose securities are listed or traded principally on a recognized stock exchange orover-the-counter market outside of the U.S.
Performance Overview
For the 12 months ended July 31, 2019, the Fund’s Class A shares posted a-2.62% cumulative total return. In comparison, the Fund’s benchmark, the MSCI Europe, Australasia and Far East (EAFE) (Net Dividends) Index, posted a-2.60% total return.1 Also for comparison, the Fund’s secondary benchmark, the MSCI EAFE Index, posted a-2.09% total return.1 Both indexes measure global developed stock market performance excluding the U.S. and Canada, taking into account the impact of foreign withholding taxes for the net index. You can find the Fund’s long-term performance data in the Performance Summary beginning on page 8.
Performance data represent past performance, which does not guarantee future results. Investment return and principal value will fluctuate, and you may have a gain or loss when you sell your shares. Current performance may differ from figures shown. For most recentmonth-end performance, go tofranklintempleton.comor call(800)342-5236.
Investment Strategy
In choosing individual equity investments, we employ a disciplined,bottom-up approach to identify attractive investment opportunities that have higher expected revenue and earnings growth than their peers. We use a growth
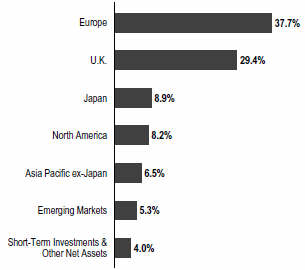
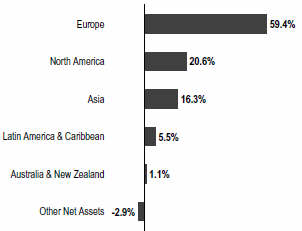
Geographic Composition
Based on Total Net Assets as of 7/31/19
investment style andin-depth, fundamental research to identify high-quality companies, across all industry groups, with sustainable business models that offer the most attractive combination of growth, quality and valuation. The investment manager’s process generally includes an assessment of the potential impacts of any material environmental, social and governance (ESG) factors on the long-term risk and return profile of a company.
Manager’s Discussion
During the12-month period under review, stock selection in the health care, communication services and materials sectors detracted from the Fund’s relative performance.2
In health care,off-benchmark positions in Ireland-based biopharmaceutical company Alkermes and U.S.-listed medical device maker LivaNova hurt relative performance. In April, LivaNova announced disappointing first quarter earnings due to short-term weakness in its neuromodulation business caused by competitive pressures and salesforce turnover. We believe the company’s strong market positions
1. Source: Morningstar.
The index is unmanaged and includes reinvestment of any income or distributions (after the deduction of certain withholding taxes for the Net Dividends Index). It does not reflect any fees, expenses or sales charges. One cannot invest directly in an index, and an index is not representative of the Fund’s portfolio.
2. The health care sector comprises biotechnology, health care equipment and supplies, and pharmaceuticals in the SOI. The communication services sector comprises media in the SOI. The materials sector comprises chemicals in the SOI.
The dollar value, number of shares or principal amount, and names of all portfolio holdings are listed in the Fund’s Statement of Investments (SOI).
The SOI begins on page 25.
| | | | |
| | | |
4 | | Annual Report | | franklintempleton.com |
FRANKLIN INTERNATIONAL GROWTH FUND
in both cardiac surgery and neurostimulation products along with a robust product pipeline should support longer-term growth.
In communication services, Japan-based media and gaming company CyberAgent was a major relative detractor. Despite this, we remain optimistic and expect CyberAgent’s gaming and advertising businesses to continue to grow, which would allow the company to use those profits to invest in its media businesses to drive future growth.
Top 10 Countries
7/31/19
| | |
| | | % of Total
Net Assets |
U.K. | | 29.4% |
Germany | | 14.4% |
Japan | | 8.9% |
Netherlands | | 7.8% |
Australia | | 6.5% |
Denmark | | 5.5% |
Belgium | | 5.1% |
Canada | | 4.9% |
U.S. | | 3.3% |
Argentina | | 2.7% |
In materials, Belgium-based clean technology materials firm Umicore detracted from relative returns due to ongoing concerns about near-term weakness in sales, partly due to China’s ongoing reduction of electric vehicle subsidies. During the second quarter of 2019, the company acquired a cobalt refinery in Finland and secured a long-term supply agreement for the metal, which is used in electric car batteries. We believe Umicore should benefit from the ongoing global growth of electric car sales and continued demand for cleaner emissions technology over the longer term.
In other sectors, relative detractors included Zozo, a Japanese online apparel retailer, and Dollarama, a Canada-based discount retailer. Despite recent weakness, we expect Zozo to benefit as more Japanese consumers purchase clothing online. Other detractors included John Wood Group, a U.K.-based oilfield services firm, and Weir Group (not held atperiod-end), a U.K.- based engineering equipment company.
Top 10 Sectors/Industries
7/31/19
| | |
| | | % of Total
Net Assets |
Internet & Direct Marketing Retail | | 11.5% |
IT Services | | 10.5% |
Health Care Equipment & Supplies | | 9.2% |
Software | | 9.0% |
Chemicals | | 8.3% |
Media | | 6.2% |
Pharmaceuticals | | 5.1% |
Aerospace & Defense | | 4.8% |
Banks | | 4.6% |
Energy Equipment & Services | | 3.4% |
Turning to contributors, stock selection and an overweight in information technology (IT) and stock selection in industrials supported relative performance.3 Stock selection and an underweight in financials also helped relative results.4
Several IT stocks contributed to relative performance following strong sector-wide earnings reports in the first half of 2019. Shopify (not part of the index), a Canada-based provider of software for the retail industry, continued to grow as more merchants used its products and its international operations further expanded. The company also announced plans to offer logistic services to its customers. Other contributors included Dutch data center operator InterXion (not part of the index) and British business software firm The Sage Group.
In industrials, U.K.-based consumer credit information provider Experian boosted relative performance. Investor confidence increased after the company issued solid financial guidance for its upcoming fiscal year based on new product launches and growth in its consumer services business. MTU Aero Engines, a German aircraft engine manufacturer, benefited from solid demand for its new engines and the continued need for maintenance of older engines. Danish logistics firm DSV also bolstered relative results following the announcement of its acquisition of a Swiss rival in April 2019 and strong first-quarter volume growth across its business in the face of a challenging macroeconomic environment.
3. The IT sector comprises IT services, semiconductors and semiconductor equipment, and software in the SOI. The industrials sector comprises aerospace and defense, professional services, road and rail, and trading companies and distributors in the SOI.
4. The financials sector comprises banks and capital markets in the SOI.
See www.franklintempletondatasources.com for additional data provider information.
| | | | |
| | | |
| franklintempleton.com | | Annual Report | | 5 |
FRANKLIN INTERNATIONAL GROWTH FUND
In the consumer discretionary sector, Latin American online marketplace operator MercadoLibre (not part of the index) contributed to relative performance. MercadoLibre reported robust revenue growth and improving margins in the past few quarters, with strength in both its payment services division and marketplace platform. U.K.-based online fashion brand boohoo Group (not part of the index) bolstered relative performance due to robust sales, as marketing efforts helped boost sales of its main brands.
Regionally, stock selection in Latin America and North America benefited relative results, while stock selection in Asia hurt performance.
It is important to recognize the effect of currency movements on the Fund’s performance. In general, if the value of the U.S. dollar goes up compared with a foreign currency, an investment traded in that foreign currency will go down in value because it will be worth fewer U.S. dollars. This can have a negative effect on Fund performance. Conversely, when the U.S. dollar weakens in relation to a foreign currency, an investment traded in that foreign currency will increase in value, which can contribute to Fund performance. For the 12 months ended July 31, 2019, the U.S. dollar rose in value relative to most currencies. As a result, the Fund’s performance was negatively affected by the portfolio’s investment predominantly in securities withnon-U.S. currency exposure.
Top 10 Holdings
7/31/19
| | |
Company Sector/Industry, Country | | % of Total
Net Assets |
Cochlear Ltd. Health Care Equipment & Supplies, Australia | | 3.5% |
John Wood Group PLC Energy Equipment & Services, U.K. | | 3.4% |
Infineon Technologies AG Semiconductors & Semiconductor Equipment, Germany | | 3.3% |
CyberAgent Inc. Media, Japan | | 3.3% |
Sophos Group PLC Software, U.K. | | 3.2% |
InterXion Holding NV IT Services, Netherlands | | 3.2% |
Shopify Inc., A IT Services, Canada | | 3.2% |
LivaNova PLC Health Care Equipment & Supplies, U.K. | | 3.2% |
Zozo Inc. Internet & Direct Marketing Retail, Japan | | 3.2% |
MTU Aero Engines AG Aerospace & Defense, Germany | | 3.1% |
Thank you for your continued participation in Franklin International Growth Fund. We look forward to serving your future investment needs.
| | |
 | | 
Donald G. Huber, CFA |
| | |
 | | 
John Remmert |
| | Portfolio Management Team |
| | | | |
| | | |
6 | | Annual Report | | franklintempleton.com |
FRANKLIN INTERNATIONAL GROWTH FUND
The foregoing information reflects our analysis, opinions and portfolio holdings as of July 31, 2019, the end of the reporting period. The way we implement our main investment strategies and the resulting portfolio holdings may change depending on factors such as market and economic conditions. These opinions may not be relied upon as investment advice or an offer for a particular security. The information is not a complete analysis of every aspect of any market, country, industry, security or the Fund. Statements of fact are from sources considered reliable, but the investment manager makes no representation or warranty as to their completeness or accuracy. Although historical performance is no guarantee of future results, these insights may help you understand our investment management philosophy.
| | | | |
| | | |
| franklintempleton.com | | Annual Report | | 7 |
FRANKLIN INTERNATIONAL GROWTH FUND
Performance Summary as of July 31, 2019
The performance table and graphs do not reflect any taxes that a shareholder would pay on Fund dividends, capital gain distributions, if any, or any realized gains on the sale of Fund shares. Total return reflects reinvestment of the Fund’s dividends and capital gain distributions, if any, and any unrealized gains or losses. Your dividend income will vary depending on dividends or interest paid by securities in the Fund’s portfolio, adjusted for operating expenses of each class. Capital gain distributions are net profits realized from the sale of portfolio securities.
Performance as of 7/31/191
Cumulative total return excludes sales charges. Average annual total return includes maximum sales charges. Sales charges will vary depending on the size of the investment and the class of share purchased. The maximum is 5.50% and the minimum is 0%.Class A:5.50% maximum initial sales charge;Advisor Class:no sales charges. For other share classes, visitfranklintempleton.com.
| | | | | | |
| Share Class | | Cumulative Total Return2 | | | | Average Annual Total Return3 |
A4 | | | | | | |
1-Year | | -2.62% | | | | -7.97% |
5-Year | | +34.60% | | | | +4.94% |
10-Year | | +114.53% | | | | +7.33% |
| | | |
Advisor | | | | | | |
1-Year | | -2.45% | | | | -2.45% |
5-Year | | +36.26% | | | | +6.38% |
10-Year | | +119.92% | | | | +8.20% |
Performance data represent past performance, which does not guarantee future results. Investment return and principal value will fluctuate, and you may have a gain or loss when you sell your shares. Current performance may differ from figures shown. For most recentmonth-end performance, go tofranklintempleton.comor call(800)342-5236.
See page 10 for Performance Summary footnotes.
| | | | |
| | | |
8 | | Annual Report | | franklintempleton.com |
FRANKLIN INTERNATIONAL GROWTH FUND
PERFORMANCE SUMMARY
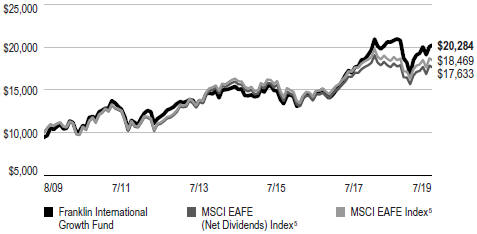
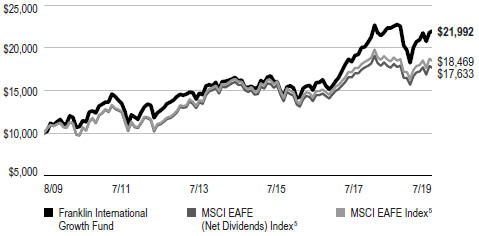
Total Return Index Comparison for a Hypothetical $10,000 Investment1
Total return represents the change in value of an investment over the periods shown. It includes any applicable maximum sales charge, Fund expenses, account fees and reinvested distributions. The unmanaged index includes reinvestment of any income or distributions. It differs from the Fund in composition and does not pay management fees or expenses. One cannot invest directly in an index.
Class A(8/1/09–7/31/19)
Advisor Class(8/1/09–7/31/19)
See page 10 for Performance Summary footnotes.
| | | | |
| | | |
| franklintempleton.com | | Annual Report | | 9 |
FRANKLIN INTERNATIONAL GROWTH FUND
PERFORMANCE SUMMARY
Distributions(8/1/18–7/31/19)
| | | | | | | | | | | | | | | | | | | | | | | | | | | | |
| Share Class | | Net Investment
Income | | | | | | Short-Term
Capital Gain | | | | | | Long-Term
Capital Gain | | | | | | Total | |
| A | | | $0.0338 | | | | | | | | $0.0314 | | | | | | | | $0.1700 | | | | | | | | $0.2352 | |
| C | | | $ — | | | | | | | | $0.0314 | | | | | | | | $0.1700 | | | | | | | | $0.2014 | |
| R | | | $0.0283 | | | | | | | | $0.0314 | | | | | | | | $0.1700 | | | | | | | | $0.2297 | |
| R6 | | | $0.0542 | | | | | | | | $0.0314 | | | | | | | | $0.1700 | | | | | | | | $0.2556 | |
| Advisor | | | $0.0471 | | | | | | | | $0.0314 | | | | | | | | $0.1700 | | | | | | | | $0.2485 | |
Total Annual Operating Expenses6
| | | | | | |
| Share Class | | With Fee
Waiver | | | | Without Fee
Waiver |
| A | | 1.12% | | | | 1.26% |
| Advisor | | 0.87% | | | | 1.01% |
Each class of shares is available to certain eligible investors and has different annual fees and expenses, as described in the prospectus.
All investments involve risks, including possible loss of principal. Special risks are associated with foreign investing, including currency fluctuations, economic instability and political developments. Investments in emerging markets involve heightened risks related to the same factors, in addition to those associated with these markets’ smaller size and lesser liquidity. The Fund is actively managed but there is no guarantee that the manager’s investment decisions will produce the desired results. The Fund’s prospectus also includes a description of the main investment risks.
1. The Fund has an expense reduction and a fee waiver associated with any investments it makes in a Franklin Templeton money fund and/or other Franklin Templeton fund, contractually guaranteed through 11/30/19. Fund investment results reflect the expense reduction and fee waiver, without these reductions, the result would have been lower.
2. Cumulative total return represents the change in value of an investment over the periods indicated.
3. Average annual total return represents the average annual change in value of an investment over the periods indicated. Return for less than one year, if any, has not been annualized.
4. Prior to 9/10/18 these shares were offered at a higher initial sales charge of 5.75%, thus actual returns (with sales charges) would have differed. Average annual total returns (with sales charges) have been restated to reflect the current maximum initial sales charge of 5.50%.
5. Source: Morningstar. The MSCI EAFE Index is a free float-adjusted, market capitalization weighted index designed to measure equity market performance in global developed markets excluding the U.S. and Canada. The Net Dividends Index reflects the deduction of withholding taxes on reinvested dividends.
6. Figures are as stated in the Fund’s current prospectus and may differ from the expense ratios disclosed in the Your Fund’s Expenses and Financial Highlights sections in this report. In periods of market volatility, assets may decline significantly, causing total annual Fund operating expenses to become higher than the figures shown.
See www.franklintempletondatasources.com for additional data provider information.
| | | | |
| | | |
10 | | Annual Report | | franklintempleton.com |
FRANKLIN INTERNATIONAL GROWTH FUND
Your Fund’s Expenses
As a Fund shareholder, you can incur two types of costs: (1) transaction costs, including sales charges (loads) on Fund purchases and redemptions; and (2) ongoing Fund costs, including management fees, distribution and service(12b-1) fees, and other Fund expenses. All mutual funds have ongoing costs, sometimes referred to as operating expenses. The table below shows ongoing costs of investing in the Fund and can help you understand these costs and compare them with those of other mutual funds. The table assumes a $1,000 investment held for the six months indicated.
Actual Fund Expenses
The table below provides information about actual account values and actual expenses in the columns under the heading “Actual.” In these columns the Fund’s actual return, which includes the effect of Fund expenses, is used to calculate the “Ending Account Value” for each class of shares. You can estimate the expenses you paid during the period by following these steps (ofcourse, your account value and expenses will differ from those in this illustration):Divide your account value by $1,000 (ifyour account had an $8,600 value, then $8,600÷ $1,000 = 8.6). Then multiply the result by the number in the row for your class of shares under the headings “Actual” and “Expenses Paid During Period” (ifActual Expenses Paid During Period were $7.50, then 8.6 x $7.50 = $64.50). In this illustration, the actual expenses paid this period are $64.50.
Hypothetical Example for Comparison with Other Funds
Under the heading “Hypothetical” in the table, information is provided about hypothetical account values and hypothetical expenses based on the Fund’s actual expense ratio and an assumed rate of return of 5% per year before expenses, which is not the Fund’s actual return. This information may not be used to estimate the actual ending account balance or expenses you paid for the period, but it can help you compare ongoing costs of investing in the Fund with those of other funds. To do so, compare this 5% hypothetical example for the class of shares you hold with the 5% hypothetical examples that appear in the shareholder reports of other funds.
Please note that expenses shown in the table are meant to highlight ongoing costs and do not reflect any transactional costs. Therefore, information under the heading “Hypothetical” is useful in comparing ongoing costs only, and will not help you compare total costs of owning different funds. In addition, if transactional costs were included, your total costs would have been higher.
| | | | | | | | | | | | | | | | | | |
| | | | | | | Actual (actual return after expenses) | | | | Hypothetical (5% annual return before expenses) | | | | |
| | | | | | | | | Expenses | | | | | | Expenses | | | | Net |
| | | Beginning | | | | Ending | | Paid During | | | | Ending | | Paid During | | | | Annualized |
| Share | | Account | | | | Account | | Period | | | | Account | | Period | | | | Expense |
| Class | | Value 2/1/19 | | | | Value 7/31/19 | | 2/1/19–7/31/191, 2 | | | | Value 7/31/19 | | 2/1/19–7/31/191, 2 | | | | Ratio2 |
| | | | | | | | | | | | |
| A | | $1,000 | | | | $1,095.90 | | $5.61 | | | | $1,019.44 | | $5.41 | | | | 1.08% |
| C | | $1,000 | | | | $1,092.00 | | $9.49 | | | | $1,015.72 | | $9.15 | | | | 1.83% |
| R | | $1,000 | | | | $1,094.30 | | $6.80 | | | | $1,018.30 | | $6.56 | | | | 1.31% |
| R6 | | $1,000 | | | | $1,097.90 | | $3.49 | | | | $1,021.47 | | $3.36 | | | | 0.67% |
| Advisor | | $1,000 | | | | $1,096.50 | | $4.31 | | | | $1,020.68 | | $4.16 | | | | 0.83% |
1. Expenses are equal to the annualized expense ratio for thesix-month period as indicated above—in the far right column—multiplied by the simple average account value over the period indicated, and then multiplied by 181/365 to reflect theone-half year period.
2. Reflects expenses after fee waivers and expense reimbursements. Does not include acquired fund fees and expenses.
| | | | |
| | | |
| franklintempleton.com | | Annual Report | | 11 |
Franklin International Small Cap Fund
Formerly, Franklin International Small Cap Growth Fund
This annual report for Franklin International Small Cap Fund covers the fiscal year ended July 31, 2019. Effective June 3, 2013, the Fund closed to new investors, with limited exceptions. As previously communicated, effective March 1, 2019, the Fund changed its name from Franklin International Small Cap Growth Fund to Franklin International Small Cap Fund.
Your Fund’s Goal and Main Investments
The Fund seeks long-term capital appreciation by investing at least 80% of its net assets in a diversified portfolio of marketable equity and equity-related securities of smaller international companies with market capitalizations not exceeding $5 billion (or the equivalent in local currencies), or the highest market capitalization of the MSCI Europe, Australasia and Far East (EAFE) Small Cap Index, whichever is greater, at the time of purchase. The Fund considers international companies to be those organized under the laws of a country outside of the U.S. or having a principal office in a country outside of the U.S., or whose securities are listed or traded principally on a recognized stock exchange orover-the-counter market outside of the U.S.
Performance Overview
For the 12 months ended July 31, 2019, the Fund’s Class A shares posted a-13.49% cumulative total return. In comparison, the Fund’s benchmark, the MSCI Europe, Australasia and Far East (EAFE) Small Cap (Net Dividends) Index, posted a-7.61% total return.1 Also for comparison, the Fund’s secondary benchmark, the MSCI EAFE Small Cap Index, posted a-7.24% total return.1 Both indexes track small cap equity performance in global developed markets excluding the U.S. and Canada, taking into account the impact of foreign withholding taxes for the net index. You can find the Fund’s long-term performance data in the Performance Summary beginning on page 16.
Performance data represent past performance, which does not guarantee future results. Investment return and principal value will fluctuate, and you may have a gain or loss when you sell your shares. Current performance may differ from
Geographic Composition
Based on Total Net Assets as of 7/31/19
figures shown. For most recentmonth-end performance, go tofranklintempleton.comor call(800)342-5236.
Investment Strategy
In choosing individual equity investments, we use a fundamental,bottom-up approach involvingin-depth analysis of individual equity securities. We employ a quantitative and qualitative approach to identify smaller international companies that we believe have the potential to generate attractive returns with lower downside risk. Such companies tend to have proprietary products and services, which can sustain a longer-term competitive advantage, and they tend to have a higher probability of maintaining a strong balance sheet and/or generating cash flow. After we identify a company, we conduct a thorough analysis to establish its earnings prospects and determine its value. Overall, we seek to invest in growth companies with attractive valuations. The investment manager’s process generally includes an assessment of the potential impacts of any material environmental, social and governance (ESG) factors on the long-term risk and return profile of a company.
We do not select investments for the Fund that are merely representative of the small cap asset class but instead aim to produce a portfolio of securities of exceptional companies operating in sectors that offer attractive growth potential.
1. Source: Morningstar.
The index is unmanaged and includes reinvestment of any income or distributions (after the deduction of certain withholding taxes for the Net Dividends Index). It does not reflect any fees, expenses or sales charges. One cannot invest directly in an index, and an index is not representative of the Fund’s portfolio.
The dollar value, number of shares or principal amount, and names of all portfolio holdings are listed in the Fund’s Statement of Investments (SOI).
The SOI begins on page 32.
| | | | |
| | | |
12 | | Annual Report | | franklintempleton.com |
FRANKLIN INTERNATIONAL SMALL CAP FUND
Although we seek to outperform the MSCI EAFE Small Cap (Net Dividends) Index, the Fund may take positions that are not represented in the index.
Manager’s Discussion
During the12-month review period, stock selection and an overweighted allocation in consumer staples as well as stock selection and underweighted allocation in real estate detracted from relative results.2 Stock selection and an overweighting in energy also curbed relative performance.3
In consumer staples, Ireland-based fresh produce provider Total Produce (not part of the index) detracted from relative performance due to a challenging market environment brought on by uncertainty surrounding international trade. However, its Dole business has been performing well as that brand recovers from recent food safety concerns. Over the longer term, we expect Total Produce to grow through increased demand for fresh fruits and vegetables as well as acquisitions. Denmark-based cigar maker Scandinavian Tobacco Group also detracted due to concerns about temporarily weaker sales in some markets.
Top 10 Countries
7/31/19
| | |
| | | % of Total |
| | | Net Assets |
U.K. | | 19.6% |
Canada | | 10.6% |
Spain | | 10.2% |
U.S. | | 10.0% |
France | | 8.7% |
Denmark | | 6.9% |
Sweden | | 6.4% |
Singapore | | 5.6% |
Chile | | 5.5% |
Hong Kong | | 4.7% |
In real estate, Spanish real estate investment trust (REIT) Lar Espana Real Estate Socimi was a relative detractor. We expect the REIT to benefit from the ongoing recovery in the Spanish commercial property market over time.
Top 10 Sectors/Industries
7/31/19
| | |
| | | % of Total |
| | | Net Assets |
Commercial Services & Supplies | | 13.7% |
Insurance | | 10.3% |
Marine | | 9.1% |
Energy Equipment & Services | | 7.2% |
Capital Markets | | 6.4% |
Media | | 5.5% |
Hotels, Restaurants & Leisure | | 4.9% |
Real Estate Management & Development | | 4.7% |
Machinery | | 4.6% |
Food Products | | 4.6% |
In the energy sector, Norway-based drilling services firm Borr Drilling was hurt by concerns about the capital spending environment in the broader oil and gas industry. However, we are beginning to see improving demand for self-elevating rigs as major oil companies look to replace depleted reserves. Borr Drilling also announced approval for a syndicated loan (a loan provided by a group of lenders) that could allow it to fully finance thebuild-out of several new rigs, as well as fund the activation costs for additional rigs. Anoff-benchmark position in U.K.-based oilfield services firm John Wood Group also hampered relative performance. The company was hurt by continued concerns about its efforts to reduce debt and the uncertain capital spending environment in the industry. We believe growth should return over the longer term, as we expect more large oil companies to boost their budgets to replace oil reserves.
In other sectors, Fairfax India (not part of the index), a Canada-based investment firm focused on India, curbed relative performance. Over the longer term, we expect the company’s investments, such as Bangalore Airport, to appreciate.
In contrast, stock selection in the financials, materials and consumer discretionary sectors bolstered relative performance.4
In financials,off-benchmark positions in Bermuda-based reinsurers Arch Capital Group and RenaissanceRe supported relative performance, helped by strong earnings
2. The consumer staples sector comprises food and staples retailing, food products and tobacco in the SOI. The real estate sector comprises equity real estate investment trusts and real estate management and development in the SOI.
3. The energy sector comprises energy equipment in the SOI.
4. The financials sector comprises capital markets and insurance in the SOI. The materials sector comprises metals and mining in the SOI. The consumer discretionary sector comprises distributors; hotels, restaurants and leisure; and internet and direct marketing retail in the SOI.
See www.franklintempletondatasources.com for additional data provider information.
| | | | |
| | | |
| franklintempleton.com | | Annual Report | | 13 |
FRANKLIN INTERNATIONAL SMALL CAP FUND
results and optimism about rising premiums in the broader insurance industry. Arch Capital has also continued to see robust growth in its mortgage insurance business in recent quarters.
In the materials sector, Singapore-based mining and real estate company Straits Trading (not part of the index) supported relative performance. The company announced plans to buy back its shares and continues to shed its less profitable mining businesses to make investments in higher returning real estate assets. U.K.-based plastic packaging manufacturer RPC Group (not held atperiod-end) contributed after receiving a takeover offer from a U.S.-based rival, and Switzerland-based industrials firm Panalpina Welttransport (not held atperiod-end) contributed following a takeover offer from a Denmark-based rival.
Top 10 Holdings
7/31/19
| | |
| Company | | % of Total |
| Sector/Industry, Country | | Net Assets |
Fairfax India Holdings Corp. Capital Markets, Canada | | 6.4% |
Liberty Latin America Ltd. Media, Chile | | 5.5% |
Clarkson PLC Marine, U.K. | | 5.1% |
Elior Group SA Hotels, Restaurants & Leisure, France | | 4.9% |
John Wood Group PLC Energy Equipment & Services, U.K. | | 4.9% |
Hang Lung Group Ltd. Real Estate Management & Development, Hong Kong | | 4.7% |
Zardoya Otis SA Machinery, Spain | | 4.6% |
Biffa PLC Commercial Services & Supplies, U.K. | | 4.2% |
Fairfax Financial Holdings Ltd. Insurance, Canada | | 4.2% |
58.com Inc. Interactive Media & Services, China | | 4.1% |
Consumer discretionary stock Bandai Namco (not held atperiod-end), a Japan-based toy and game maker, bolstered relative performance. The company continues to see strong growth in the Japanese market and is looking to increase its presence in other parts of Asia, particularly China, to support future growth.
Regionally, stock selection in Europe and an underweighting in Australia and New Zealand hurt relative results, while
stock selection in Asia and North America bolstered relative performance.
It is important to recognize the effect of currency movements on the Fund’s performance. In general, if the value of the U.S. dollar goes up compared with a foreign currency, an investment traded in that foreign currency will go down in value because it will be worth fewer U.S. dollars. This can have a negative effect on Fund performance. Conversely, when the U.S. dollar weakens in relation to a foreign currency, an investment traded in that foreign currency will increase in value, which can contribute to Fund performance. For the 12 months ended July 31, 2019, the U.S. dollar rose in value relative to most currencies. As a result, the Fund’s performance was negatively affected by the portfolio’s investment predominantly in securities withnon-U.S. currency exposure.
Thank you for your continued participation in Franklin International Small Cap Fund. We look forward to serving your future investment needs.
| | | | |
| | | |
14 | | Annual Report | | franklintempleton.com |
FRANKLIN INTERNATIONAL SMALL CAP FUND
The foregoing information reflects our analysis, opinions and portfolio holdings as of July 31, 2019, the end of the reporting period. The way we implement our main investment strategies and the resulting portfolio holdings may change depending on factors such as market and economic conditions. These opinions may not be relied upon as investment advice or an offer for a particular security. The information is not a complete analysis of every aspect of any market, country, industry, security or the Fund. Statements of fact are from sources considered reliable, but the investment manager makes no representation or warranty as to their completeness or accuracy. Although historical performance is no guarantee of future results, these insights may help you understand our investment management philosophy.
| | | | |
| | | |
| franklintempleton.com | | Annual Report | | 15 |
FRANKLIN INTERNATIONAL SMALL CAP FUND
Performance Summary as of July 31, 2019
The performance table and graphs do not reflect any taxes that a shareholder would pay on Fund dividends, capital gain distributions, if any, or any realized gains on the sale of Fund shares. Total return reflects reinvestment of the Fund’s dividends and capital gain distributions, if any, and any unrealized gains or losses. Your dividend income will vary depending on dividends or interest paid by securities in the Fund’s portfolio, adjusted for operating expenses of each class. Capital gain distributions are net profits realized from the sale of portfolio securities.
Performance as of 7/31/191
Cumulative total return excludes sales charges. Average annual total return includes maximum sales charges. Sales charges will vary depending on the size of the investment and the class of share purchased. The maximum is 5.50% and the minimum is 0%.Class A:5.50% maximum initial sales charge;Advisor Class:no sales charges. For other share classes, visitfranklintempleton.com.
| | | | | | |
| Share Class | | Cumulative Total Return1 | | | | Average Annual Total Return2 |
A3 | | | | | | |
1-Year | | -13.49% | | | | -18.25% |
5-Year | | +5.28% | | | | -0.10% |
10-Year | | +116.25% | | | | +7.41% |
| | | |
Advisor | | | | | | |
1-Year | | -13.22% | | | | -13.22% |
5-Year | | +6.60% | | | | +1.29% |
10-Year | | +122.09% | | | | +8.31% |
Performance data represent past performance, which does not guarantee future results. Investment return and principal value will fluctuate, and you may have a gain or loss when you sell your shares. Current performance may differ from figures shown. For most recentmonth-end performance, go tofranklintempleton.comor call(800)342-5236.
| | | | |
| | | |
16 | | Annual Report | | franklintempleton.com |
FRANKLIN INTERNATIONAL SMALL CAP FUND
PERFORMANCE SUMMARY
Total Return Index Comparison for a Hypothetical $10,000 Investment
Total return represents the change in value of an investment over the periods shown. It includes any applicable maximum sales charge, Fund expenses, account fees and reinvested distributions. The unmanaged index includes reinvestment of any income or distributions. It differs from the Fund in composition and does not pay management fees or expenses. One cannot invest directly in an index.
Class A(8/1/09–7/31/19)
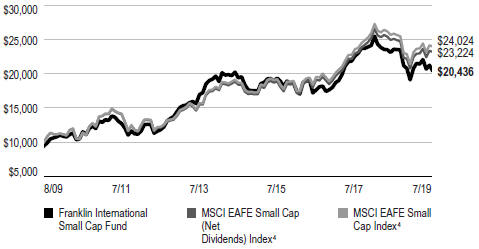
Advisor Class(8/1/09–7/31/19)

See page 18 for Performance Summary footnotes.
| | | | |
| | | |
| franklintempleton.com | | Annual Report | | 17 |
FRANKLIN INTERNATIONAL SMALL CAP FUND
PERFORMANCE SUMMARY
Distributions(8/1/18–7/31/19)
| | | | | | | | | | | | | | | | | | | | |
| Share Class | | Net Investment
Income | | | | | | Short-Term
Capital Gain | | | | | | Total | |
| A | | | $0.2690 | | | | | | | | $0.2608 | | | | | | | | $0.5298 | |
| C | | | $0.1528 | | | | | | | | $0.2608 | | | | | | | | $0.4136 | |
| R | | | $0.2394 | | | | | | | | $0.2608 | | | | | | | | $0.5002 | |
| R6 | | | $0.3198 | | | | | | | | $0.2608 | | | | | | | | $0.5806 | |
| Advisor | | | $0.3023 | | | | | | | | $0.2608 | | | | | | | | $0.5631 | |
Total Annual Operating Expenses5
| | | | |
| Share Class | | | |
| A | | | 1.38 | % |
| Advisor | | | 1.13 | % |
Each class of shares is available to certain eligible investors and has different annual fees and expenses, as described in the prospectus.
All investments involve risks, including possible loss of principal. The Fund is intended for long-term investors who are comfortable with fluctuation in the value of their investment, especially over the short term. Smaller, relatively new and/or unseasoned companies can be particularly sensitive to changing economic conditions, and their prospects for growth are less certain than those of larger, more established companies. Foreign investing involves additional risks such as currency and market volatility, as well as political and social instability. Investments in emerging markets involve heightened risks relating to the same factors. The Fund is actively managed but there is no guarantee that the manager’s investment decisions will produce the desired results. The Fund’s prospectus also includes a description of the main investment risks.
1. Cumulative total return represents the change in value of an investment over the periods indicated.
2. Average annual total return represents the average annual change in value of an investment over the periods indicated. Return for less than one year, if any, has not been annualized.
3. Prior to 9/10/18 these shares were offered at a higher initial sales charge of 5.75%, thus actual returns (with sales charges) would have differed. Average annual total returns (with sales charges) have been restated to reflect the current maximum initial sales charge of 5.50%.
4. Source: Morningstar. The MSCI EAFE Small Cap Index is a free float-adjusted, market capitalization-weighted index designed to measure the performance of small cap equity securities of global developed markets excluding the U.S. and Canada. The Net Dividends Index reflects the deduction of withholding taxes on reinvested dividends.
5. Figures are as stated in the Fund’s current prospectus and may differ from the expense ratios disclosed in the Your Fund’s Expenses and Financial Highlights sections in this report. In periods of market volatility, assets may decline significantly, causing total annual Fund operating expenses to become higher than the figures shown.
See www.franklintempletondatasources.com for additional data provider information.
| | | | |
| | | |
18 | | Annual Report | | franklintempleton.com |
FRANKLIN INTERNATIONAL SMALL CAP FUND
Your Fund’s Expenses
As a Fund shareholder, you can incur two types of costs: (1) transaction costs, including sales charges (loads) on Fund purchases and redemptions; and (2) ongoing Fund costs, including management fees, distribution and service(12b-1) fees, and other Fund expenses. All mutual funds have ongoing costs, sometimes referred to as operating expenses. The table below shows ongoing costs of investing in the Fund and can help you understand these costs and compare them with those of other mutual funds. The table assumes a $1,000 investment held for the six months indicated.
Actual Fund Expenses
The table below provides information about actual account values and actual expenses in the columns under the heading “Actual.” In these columns the Fund’s actual return, which includes the effect of Fund expenses, is used to calculate the “Ending Account Value” for each class of shares. You can estimate the expenses you paid during the period by following these steps (ofcourse, your account value and expenses will differ from those in this illustration):Divide your account value by $1,000 (ifyour account had an $8,600 value, then $8,600÷ $1,000 = 8.6). Then multiply the result by the number in the row for your class of shares under the headings “Actual” and “Expenses Paid During Period” (ifActual Expenses Paid During Period were $7.50, then 8.6 x $7.50 = $64.50). In this illustration, the actual expenses paid this period are $64.50.
Hypothetical Example for Comparison with Other Funds
Under the heading “Hypothetical” in the table, information is provided about hypothetical account values and hypothetical expenses based on the Fund’s actual expense ratio and an assumed rate of return of 5% per year before expenses, which is not the Fund’s actual return. This information may not be used to estimate the actual ending account balance or expenses you paid for the period, but it can help you compare ongoing costs of investing in the Fund with those of other funds. To do so, compare this 5% hypothetical example for the class of shares you hold with the 5% hypothetical examples that appear in the shareholder reports of other funds.
Please note that expenses shown in the table are meant to highlight ongoing costs and do not reflect any transactional costs. Therefore, information under the heading “Hypothetical” is useful in comparing ongoing costs only, and will not help you compare total costs of owning different funds. In addition, if transactional costs were included, your total costs would have been higher.
| | | | | | | | | | | | | | | | | | |
| | | | | | | Actual | | | | Hypothetical | | | | |
| | | | | | | (actual return after expenses) | | | | (5% annual return before expenses) | | | | |
| | | | | | | | | Expenses | | | | | | Expenses | | | | Net |
| | | Beginning | | | | Ending | | Paid During | | | | Ending | | Paid During | | | | Annualized |
| Share | | Account | | | | Account | | Period | | | | Account | | Period | | | | Expense |
| Class | | Value 2/1/19 | | | | Value 7/31/19 | | 2/1/19–7/31/191,2 | | | | Value 7/31/19 | | 2/1/19–7/31/191,2 | | | | Ratio2 |
| | | | | | | | | | | | |
| A | | $1,000 | | | | $983.30 | | $ 7.13 | | | | $1,017.60 | | $ 7.25 | | | | 1.45% |
| C | | $1,000 | | | | $980.10 | | $10.80 | | | | $1,013.88 | | $10.99 | | | | 2.20% |
| R | | $1,000 | | | | $982.10 | | $ 8.35 | | | | $1,016.36 | | $ 8.50 | | | | 1.70% |
| R6 | | $1,000 | | | | $985.70 | | $ 5.07 | | | | $1,019.69 | | $ 5.16 | | | | 1.03% |
| Advisor | | $1,000 | | | | $984.50 | | $ 5.90 | | | | $1,018.84 | | $ 6.01 | | | | 1.20% |
1. Expenses are equal to the annualized expense ratio for thesix-month period as indicated above—in the far right column—multiplied by the simple average account value over the period indicated, and then multiplied by 181/365 to reflect theone-half year period.
2. Reflects expenses after fee waivers and expense reimbursements, for Class R6.
| | | | |
| | | |
| franklintempleton.com | | Annual Report | | 19 |
FRANKLIN GLOBAL TRUST
Financial Highlights
Franklin International Growth Fund
| | | | | | | | | | | | | | | | | | | | |
| | | | | | Year Ended July 31, | | | | |
| | | 2019 | | | 2018 | | | 2017 | | | 2016 | | | 2015 | |
| | | | | |
Class A | | | | | | | | | | | | | | | | | | | | |
| | | | | |
Per share operating performance | | | | | | | | | | | | | | | | | | | | |
(for a share outstanding throughout the year) | | | | | | | | | | | | | | | | | | | | |
| | | | | |
Net asset value, beginning of year | | | $15.31 | | | | $13.18 | | | | $11.07 | | | | $11.16 | | | | $11.40 | |
| | | | | |
Income from investment operationsa: | | | | | | | | | | | | | | | | | | | | |
| | | | | |
Net investment incomeb | | | 0.04 | | | | 0.06 | | | | 0.05 | | | | 0.03 | | | | 0.06 | |
| | | | | |
Net realized and unrealized gains (losses) | | | (0.50 | ) | | | 2.26 | | | | 2.12 | | | | (0.12 | ) | | | (0.20 | ) |
| | | | | |
Total from investment operations | | | (0.46 | ) | | | 2.32 | | | | 2.17 | | | | (0.09 | ) | | | (0.14 | ) |
| | | | | |
Less distributions from: | | | | | | | | | | | | | | | | | | | | |
| | | | | |
Net investment income | | | (0.03 | ) | | | — | | | | (0.06 | ) | | | (— | )c | | | (0.03 | ) |
| | | | | |
Net realized gains | | | (0.20 | ) | | | (0.19 | ) | | | — | | | | — | | | | (0.07 | ) |
| | | | | |
Total distributions | | | (0.23 | ) | | | (0.19 | ) | | | (0.06 | ) | | | (— | )c | | | (0.10 | ) |
| | | | | |
Net asset value, end of year | | | $14.62 | | | | $15.31 | | | | $13.18 | | | | $11.07 | | | | $11.16 | |
| | | | | |
Total returnd | | | (2.62)% | | | | 17.73% | | | | 19.70% | | | | (0.80)% | | | | (1.13)% | |
| | | | | |
Ratios to average net assets | | | | | | | | | | | | | | | | | | | | |
| | | | | |
Expenses before waiver and payments by affiliates | | | 1.19% | | | | 1.27% | | | | 1.54% | | | | 1.65% | | | | 1.72% | |
| | | | | |
Expenses net of waiver and payments by affiliates | | | 1.05% | e | | | 1.15% | e | | | 1.31% | e | | | 1.44% | e | | | 1.49% | |
| | | | | |
Net investment income | | | 0.32% | | | | 0.43% | | | | 0.37% | | | | 0.25% | | | | 0.61% | |
| | | | | |
Supplemental data | | | | | | | | | | | | | | | | | | | | |
| | | | | |
Net assets, end of year (000’s) | | | $289,944 | | | | $161,607 | | | | $185,680 | | | | $169,994 | | | | $182,825 | |
| | | | | |
Portfolio turnover rate | | | 18.11% | | | | 58.36% | | | | 28.66% | | | | 27.27% | | | | 47.52% | |
aThe amount shown for a share outstanding throughout the period may not correlate with the Statement of Operations for the period due to the timing of sales and repurchases of the Fund’s shares in relation to income earned and/or fluctuating fair value of the investments of the Fund.
bBased on average daily shares outstanding.
cAmount rounds to less than $0.01 per share.
dTotal return does not reflect sales commissions or contingent deferred sales charges, if applicable.
eBenefit of expense reduction rounds to less than 0.01%.
| | | | |
| | | |
20 | | Annual Report | The accompanying notes are an integral part of these financial statements. | | franklintempleton.com |
FRANKLIN GLOBAL TRUST
FINANCIAL HIGHLIGHTS
Franklin International Growth Fund(continued)
| | | | | | | | | | | | | | | | | | | | |
| | | | | | Year Ended July 31, | | | | |
| | | 2019 | | | 2018 | | | 2017 | | | 2016 | | | 2015 | |
| | | | | |
Class C | | | | | | | | | | | | | | | | | | | | |
| | | | | |
Per share operating performance | | | | | | | | | | | | | | | | | | | | |
(for a share outstanding throughout the year) | | | | | | | | | | | | | | | | | | | | |
| | | | | |
Net asset value, beginning of year | | | $14.74 | | | | $12.80 | | | | $10.77 | | | | $10.94 | | | | $11.22 | |
| | | | | |
Income from investment operationsa: | | | | | | | | | | | | | | | | | | | | |
| | | | | |
Net investment income (loss)b | | | (0.06 | ) | | | (0.03 | ) | | | (0.04 | ) | | | (0.05 | ) | | | (0.01 | ) |
| | | | | |
Net realized and unrealized gains (losses) | | | (0.48 | ) | | | 2.16 | | | | 2.07 | | | | (0.12 | ) | | | (0.20 | ) |
| | | | | |
Total from investment operations | | | (0.54 | ) | | | 2.13 | | | | 2.03 | | | | (0.17 | ) | | | (0.21 | ) |
| | | | | |
Less distributions from: | | | | | | | | | | | | | | | | | | | | |
| | | | | |
Net realized gains | | | (0.20 | ) | | | (0.19 | ) | | | — | | | | — | | | | (0.07 | ) |
| | | | | |
Net asset value, end of year | | | $14.00 | | | | $14.74 | | | | $12.80 | | | | $10.77 | | | | $10.94 | |
| | | | | |
Total returnc | | | (3.34)% | | | | 16.76% | | | | 18.85% | | | | (1.55)% | | | | (1.84)% | |
| | | | | |
Ratios to average net assets | | | | | | | | | | | | | | | | | | | | |
| | | | | |
Expenses before waiver and payments by affiliates | | | 1.94% | | | | 2.02% | | | | 2.29% | | | | 2.40% | | | | 2.42% | |
| | | | | |
Expenses net of waiver and payments by affiliates | | | 1.80% | d | | | 1.90% | d | | | 2.06% | d | | | 2.19% | d | | | 2.19% | |
| | | | | |
Net investment income (loss) | | | (0.43)% | | | | (0.32)% | | | | (0.38)% | | | | (0.50)% | | | | (0.09)% | |
| | | | | |
Supplemental data | | | | | | | | | | | | | | | | | | | | |
| | | | | |
Net assets, end of year (000’s) | | | $27,397 | | | | $22,542 | | | | $8,702 | | | | $6,773 | | | | $7,179 | |
| | | | | |
Portfolio turnover rate | | | 18.11% | | | | 58.36% | | | | 28.66% | | | | 27.27% | | | | 47.52% | |
aThe amount shown for a share outstanding throughout the period may not correlate with the Statement of Operations for the period due to the timing of sales and repurchases of the Fund’s shares in relation to income earned and/or fluctuating fair value of the investments of the Fund.
bBased on average daily shares outstanding.
cTotal return does not reflect sales commissions or contingent deferred sales charges, if applicable.
dBenefit of expense reduction rounds to less than 0.01%.
| | | | |
| | | |
| franklintempleton.com | | The accompanying notes are an integral part of these financial statements. | Annual Report | | 21 |
FRANKLIN GLOBAL TRUST
FINANCIAL HIGHLIGHTS
Franklin International Growth Fund(continued)
| | | | | | | | | | | | | | | | | | | | |
| | | | | | Year Ended July 31, | | | | |
| | | 2019 | | | 2018 | | | 2017 | | | 2016 | | | 2015 | |
| | | | | |
Class R | | | | | | | | | | | | | | | | | | | | |
| | | | | |
Per share operating performance | | | | | | | | | | | | | | | | | | | | |
(for a share outstanding throughout the year) | | | | | | | | | | | | | | | | | | | | |
| | | | | |
Net asset value, beginning of year | | | $15.21 | | | | $13.16 | | | | $11.02 | | | | $11.15 | | | | $11.38 | |
| | | | | |
Income from investment operationsa: | | | | | | | | | | | | | | | | | | | | |
| | | | | |
Net investment income (loss)b | | | — | c | | | 0.04 | | | | 0.02 | | | | (— | )c | | | 0.04 | |
| | | | | |
Net realized and unrealized gains (losses) | | | (0.48 | ) | | | 2.22 | | | | 2.13 | | | | (0.12 | ) | | | (0.19 | ) |
| | | | | |
Total from investment operations | | | (0.48 | ) | | | 2.26 | | | | 2.15 | | | | (0.12 | ) | | | (0.15 | ) |
| | | | | |
Less distributions from: | | | | | | | | | | | | | | | | | | | | |
| | | | | |
Net investment income | | | (0.03 | ) | | | (0.02 | ) | | | (0.01 | ) | | | (0.01 | ) | | | (0.01 | ) |
| | | | | |
Net realized gains | | | (0.20 | ) | | | (0.19 | ) | | | — | | | | — | | | | (0.07 | ) |
| | | | | |
Total distributions | | | (0.23 | ) | | | (0.21 | ) | | | (0.01 | ) | | | (0.01 | ) | | | (0.08 | ) |
| | | | | |
Net asset value, end of year | | | $14.50 | | | | $15.21 | | | | $13.16 | | | | $11.02 | | | | $11.15 | |
| | | | | |
Total return | | | (2.88)% | | | | 17.34% | | | | 19.54% | | | | (1.10)% | | | | (1.31)% | |
| | | | | |
Ratios to average net assets | | | | | | | | | | | | | | | | | | | | |
| | | | | |
Expenses before waiver and payments by affiliates | | | 1.43% | | | | 1.49% | | | | 1.76% | | | | 1.90% | | | | 1.92% | |
| | | | | |
Expenses net of waiver and payments by affiliates | | | 1.29% | d | | | 1.37% | d | | | 1.53% | d | | | 1.69% | d | | | 1.69% | |
| | | | | |
Net investment income | | | 0.08% | | | | 0.21% | | | | 0.15% | | | | (—)% | e | | | 0.41% | |
| | | | | |
Supplemental data | | | | | | | | | | | | | | | | | | | | |
| | | | | |
Net assets, end of year (000’s) | | | $1,848 | | | | $1,086 | | | | $371 | | | | $295 | | | | $363 | |
| | | | | |
Portfolio turnover rate | | | 18.11% | | | | 58.36% | | | | 28.66% | | | | 27.27% | | | | 47.52% | |
aThe amount shown for a share outstanding throughout the period may not correlate with the Statement of Operations for the period due to the timing of sales and repurchases of the Fund’s shares in relation to income earned and/or fluctuating fair value of the investments of the Fund.
bBased on average daily shares outstanding.
cAmount rounds to less than $0.01 per share.
dBenefit of expense reduction rounds to less than 0.01%.
eRounds to less than 0.01%.
| | | | |
| | | |
22 | | Annual Report | The accompanying notes are an integral part of these financial statements. | | franklintempleton.com |
FRANKLIN GLOBAL TRUST
FINANCIAL HIGHLIGHTS
Franklin International Growth Fund(continued)
| | | | | | | | | | | | | | | | | | | | |
| | | | | | Year Ended July 31, | | | | |
| | | 2019 | | | 2018 | | | 2017 | | | 2016 | | | 2015 | |
| | | | | |
Class R6 | | | | | | | | | | | | | | | | | | | | |
| | | | | |
Per share operating performance | | | | | | | | | | | | | | | | | | | | |
(for a share outstanding throughout the year) | | | | | | | | | | | | | | | | | | | | |
| | | | | |
Net asset value, beginning of year | | | $15.34 | | | | $13.25 | | | | $11.15 | | | | $11.25 | | | | $11.48 | |
| | | | | |
Income from investment operationsa: | | | | | | | | | | | | | | | | | | | | |
| | | | | |
Net investment incomeb | | | 0.08 | | | | 0.12 | | | | 0.08 | | | | 0.07 | | | | 0.15 | |
| | | | | |
Net realized and unrealized gains (losses) | | | (0.48 | ) | | | 2.26 | | | | 2.15 | | | | (0.12 | ) | | | (0.23 | ) |
| | | | | |
Total from investment operations | | | (0.40 | ) | | | 2.38 | | | | 2.23 | | | | (0.05 | ) | | | (0.08 | ) |
| | | | | |
Less distributions from: | | | | | | | | | | | | | | | | | | | | |
| | | | | |
Net investment income | | | (0.05 | ) | | | (0.10 | ) | | | (0.13 | ) | | | (0.05 | ) | | | (0.08 | ) |
| | | | | |
Net realized gains | | | (0.20 | ) | | | (0.19 | ) | | | — | | | | — | | | | (0.07 | ) |
| | | | | |
Total distributions | | | (0.25 | ) | | | (0.29 | ) | | | (0.13 | ) | | | (0.05 | ) | | | (0.15 | ) |
| | | | | |
Net asset value, end of year | | | $14.69 | | | | $15.34 | | | | $13.25 | | | | $11.15 | | | | $11.25 | |
| | | | | |
Total return | | | (2.26)% | | | | 18.15% | | | | 20.26% | | | | (0.39)% | | | | (0.62)% | |
| | | | | |
Ratios to average net assets | | | | | | | | | | | | | | | | | | | | |
| | | | | |
Expenses before waiver and payments by affiliates | | | 0.84% | | | | 0.85% | | | | 0.90% | | | | 1.01% | | | | 1.02% | |
| | | | | |
Expenses net of waiver and payments by affiliates | | | 0.66% | c | | | 0.71% | c | | | 0.88% | c | | | 1.00% | c | | | 1.02% | d |
| | | | | |
Net investment income | | | 0.71% | | | | 0.87% | | | | 0.80% | | | | 0.69% | | | | 1.08% | |
| | | | | |
Supplemental data | | | | | | | | | | | | | | | | | | | | |
| | | | | |
Net assets, end of year (000’s) | | | $344,257 | | | | $83,292 | | | | $54,347 | | | | $122,862 | | | | $137,950 | |
| | | | | |
Portfolio turnover rate | | | 18.11% | | | | 58.36% | | | | 28.66% | | | | 27.27% | | | | 47.52% | |
aThe amount shown for a share outstanding throughout the period may not correlate with the Statement of Operations for the period due to the timing of sales and repurchases of the Fund’s shares in relation to income earned and/or fluctuating fair value of the investments of the Fund.
bBased on average daily shares outstanding.
cBenefit of expense reduction rounds to less than 0.01%.
dBenefit of waiver and payments by affiliates rounds to less than 0.01%.
| | | | |
| | | |
| franklintempleton.com | | The accompanying notes are an integral part of these financial statements. | Annual Report | | 23 |
FRANKLIN GLOBAL TRUST
FINANCIAL HIGHLIGHTS
Franklin International Growth Fund(continued)
| | | | | | | | | | | | | | | | | | | | |
| | | | | | Year Ended July 31, | | | | |
| | | 2019 | | | 2018 | | | 2017 | | | 2016 | | | 2015 | |
| | | | | |
Advisor Class | | | | | | | | | | | | | | | | | | | | |
| | | | | |
Per share operating performance | | | | | | | | | | | | | | | | | | | | |
(for a share outstanding throughout the year) | | | | | | | | | | | | | | | | | | | | |
| | | | | |
Net asset value, beginning of year | | | $15.33 | | | | $13.24 | | | | $11.13 | | | | $11.24 | | | | $11.47 | |
| | | | | |
Income from investment operationsa: | | | | | | | | | | | | | | | | | | | | |
| | | | | |
Net investment incomeb | | | 0.09 | | | | 0.10 | | | | 0.08 | | | | 0.05 | | | | 0.10 | |
| | | | | |
Net realized and unrealized gains (losses) | | | (0.51 | ) | | | 2.26 | | | | 2.13 | | | | (0.12 | ) | | | (0.20 | ) |
| | | | | |
Total from investment operations | | | (0.42 | ) | | | 2.36 | | | | 2.21 | | | | (0.07 | ) | | | (0.10 | ) |
| | | | | |
Less distributions from: | | | | | | | | | | | | | | | | | | | | |
| | | | | |
Net investment income | | | (0.05 | ) | | | (0.08 | ) | | | (0.10 | ) | | | (0.04 | ) | | | (0.06 | ) |
| | | | | |
Net realized gains | | | (0.20 | ) | | | (0.19 | ) | | | — | | | | — | | | | (0.07 | ) |
| | | | | |
Total distributions | | | (0.25 | ) | | | (0.27 | ) | | | (0.10 | ) | | | (0.04 | ) | | | (0.13 | ) |
| | | | | |
Net asset value, end of year | | | $14.66 | | | | $15.33 | | | | $13.24 | | | | $11.13 | | | | $11.24 | |
| | | | | |
Total return | | | (2.45)% | | | | 17.98% | | | | 20.04% | | | | (0.62)% | | | | (0.76)% | |
| | | | | |
Ratios to average net assets | | | | | | | | | | | | | | | | | | | | |
| | | | | |
Expenses before waiver and payments by affiliates | | | 0.94% | | | | 1.02% | | | | 1.29% | | | | 1.40% | | | | 1.42% | |
| | | | | |
Expenses net of waiver and payments by affiliates | | | 0.80% | c | | | 0.90% | c | | | 1.06% | c | | | 1.19% | c | | | 1.19% | |
| | | | | |
Net investment income | | | 0.57% | | | | 0.68% | | | | 0.62% | | | | 0.50% | | | | 0.91% | |
| | | | | |
Supplemental data | | | | | | | | | | | | | | | | | | | | |
| | | | | |
Net assets, end of year (000’s) | | | $863,973 | | | | $294,254 | | | | $147,926 | | | | $110,441 | | | | $126,130 | |
| | | | | |
Portfolio turnover rate | | | 18.11% | | | | 58.36% | | | | 28.66% | | | | 27.27% | | | | 47.52% | |
aThe amount shown for a share outstanding throughout the period may not correlate with the Statement of Operations for the period due to the timing of sales and repurchases of the Fund’s shares in relation to income earned and/or fluctuating fair value of the investments of the Fund.
bBased on average daily shares outstanding.
cBenefit of expense reduction rounds to less than 0.01%.
| | | | |
| | | |
24 | | Annual Report | The accompanying notes are an integral part of these financial statements. | | franklintempleton.com |
FRANKLIN GLOBAL TRUST
Statement of Investments, July 31, 2019
Franklin International Growth Fund
| | | | | | | | | | | | |
| | | Country | | | Shares | | | Value | |
| | | |
Common Stocks 96.0% | | | | | | | | | | | | |
| | | |
Aerospace & Defense 4.8% | | | | | | | | | | | | |
CAE Inc. | | | Canada | | | | 926,000 | | | $ | 24,971,654 | |
MTU Aero Engines AG | | | Germany | | | | 190,000 | | | | 47,618,225 | |
| | | | | | | | | | | | |
| | | |
| | | | | | | | | | | 72,589,879 | |
| | | | | | | | | | | | |
| | | |
Auto Components 2.9% | | | | | | | | | | | | |
Aptiv PLC | | | United States | | | | 500,000 | | | | 43,825,000 | |
| | | | | | | | | | | | |
| | | |
Banks 4.6% | | | | | | | | | | | | |
FinecoBank Banca Fineco SpA | | | Italy | | | | 3,656,000 | | | | 36,375,912 | |
a,bIrish Bank Resolution Corp. Ltd. | | | Ireland | | | | 11,500 | | | | — | |
KBC Groep NV | | | Belgium | | | | 532,000 | | | | 34,306,987 | |
| | | | | | | | | | | | |
| | | |
| | | | | | | | | | | 70,682,899 | |
| | | | | | | | | | | | |
| | | |
Biotechnology 3.4% | | | | | | | | | | | | |
aAlkermes PLC | | | United States | | | | 240,000 | | | | 5,558,400 | |
CSL Ltd. | | | Australia | | | | 292,000 | | | | 45,838,076 | |
| | | | | | | | | | | | |
| | | |
| | | | | | | | | | | 51,396,476 | |
| | | | | | | | | | | | |
| | | |
Capital Markets 2.7% | | | | | | | | | | | | |
Deutsche Boerse AG | | | Germany | | | | 298,000 | | | | 41,645,781 | |
| | | | | | | | | | | | |
| | | |
Chemicals 8.3% | | | | | | | | | | | | |
Koninklijke DSM NV | | | Netherlands | | | | 370,000 | | | | 46,180,882 | |
Symrise AG | | | Germany | | | | 402,000 | | | | 37,204,158 | |
Umicore SA | | | Belgium | | | | 1,380,000 | | | | 43,427,025 | |
| | | | | | | | | | | | |
| | | |
| | | | | | | | | | | 126,812,065 | |
| | | | | | | | | | | | |
| | | |
Diversified Consumer Services 2.6% | | | | | | | | | | | | |
aTAL Education Group, ADR | | | China | | | | 1,250,000 | | | | 40,250,000 | |
| | | | | | | | | | | | |
| | | |
Energy Equipment & Services 3.4% | | | | | | | | | | | | |
John Wood Group PLC | | | United Kingdom | | | | 8,150,000 | | | | 52,574,455 | |
| | | | | | | | | | | | |
| | | |
Health Care Equipment & Supplies 9.2% | | | | | | | | | | | | |
Cochlear Ltd. | | | Australia | | | | 355,000 | | | | 53,478,008 | |
GN Store Nord AS | | | Denmark | | | | 809,000 | | | | 38,490,132 | |
aLivaNova PLC | | | United Kingdom | | | | 629,000 | | | | 48,464,450 | |
| | | | | | | | | | | | |
| | | |
| | | | | | | | | | | 140,432,590 | |
| | | | | | | | | | | | |
| | | |
Internet & Direct Marketing Retail 11.5% | | | | | | | | | | | | |
aboohoo Group PLC | | | United Kingdom | | | | 16,200,000 | | | | 47,134,965 | |
aJust Eat PLC | | | United Kingdom | | | | 4,220,100 | | | | 39,035,367 | |
aMercadoLibre Inc. | | | Argentina | | | | 66,400 | | | | 41,262,288 | |
Zozo Inc. | | | Japan | | | | 2,550,000 | | | | 48,340,455 | |
| | | | | | | | | | | | |
| | | |
| | | | | | | | | | | 175,773,075 | |
| | | | | | | | | | | | |
IT Services 10.5% | | | | | | | | | | | | |
aAdyen NV | | | Netherlands | | | | 33,600 | | | | 25,541,560 | |
aInterXion Holding NV | | | Netherlands | | | | 651,000 | | | | 49,020,300 | |
Keywords Studios PLC | | | Ireland | | | | 1,870,000 | | | | 37,779,526 | |
aShopify Inc., A | | | Canada | | | | 153,000 | | | | 48,635,640 | |
| | | | | | | | | | | | |
| | | |
| | | | | | | | | | | 160,977,026 | |
| | | | | | | | | | | | |
| | | | |
| | | |
| franklintempleton.com | | Annual Report | | 25 |
FRANKLIN GLOBAL TRUST
STATEMENT OF INVESTMENTS
Franklin International Growth Fund(continued)
| | | | | | | | | | | | |
| | | Country | | | Shares | | | Value | |
| | | |
Common Stocks(continued) | | | | | | | | | | | | |
Media 6.2% | | | | | | | | | | | | |
Ascential PLC | | | United Kingdom | | | | 8,980,000 | | | $ | 43,441,043 | |
CyberAgent Inc. | | | Japan | | | | 1,245,000 | | | | 50,566,506 | |
| | | | | | | | | | | | |
| | | |
| | | | | | | | | | | 94,007,549 | |
| | | | | | | | | | | | |
| | | |
Pharmaceuticals 5.1% | | | | | | | | | | | | |
Hikma Pharmaceuticals PLC | | | United Kingdom | | | | 1,850,000 | | | | 41,364,731 | |
Santen Pharmaceutical Co. Ltd. | | | Japan | | | | 2,288,000 | | | | 37,024,287 | |
| | | | | | | | | | | | |
| | | |
| | | | | | | | | | | 78,389,018 | |
| | | | | | | | | | | | |
| | | |
Professional Services 2.8% | | | | | | | | | | | | |
Experian PLC | | | United Kingdom | | | | 1,400,000 | | | | 42,519,749 | |
| | | | | | | | | | | | |
| | | |
Road & Rail 3.0% | | | | | | | | | | | | |
DSV AS | | | Denmark | | | | 477,000 | | | | 45,586,754 | |
| | | | | | | | | | | | |
| | | |
Semiconductors & Semiconductor Equipment 3.3% | | | | | | | | | | | | |
Infineon Technologies AG | | | Germany | | | | 2,697,000 | | | | 50,791,601 | |
| | | | | | | | | | | | |
| | | |
Software 9.0% | | | | | | | | | | | | |
The Sage Group PLC | | | United Kingdom | | | | 5,000,000 | | | | 43,734,599 | |
SAP SE | | | Germany | | | | 352,000 | | | | 43,513,598 | |
Sophos Group PLC | | | United Kingdom | | | | 9,350,000 | | | | 49,410,986 | |
| | | | | | | | | | | | |
| | | |
| | | | | | | | | | | 136,659,183 | |
| | | | | | | | | | | | |
Trading Companies & Distributors 2.7% | | | | | | | | | | | | |
Ferguson PLC | | | United Kingdom | | | | 555,000 | | | | 41,560,261 | |
| | | | | | | | | | | | |
| | | |
Total Common Stocks (Cost $1,294,017,689) | | | | | | | | | | | 1,466,473,361 | |
| | | | | | | | | | | | |
| | | |
Short Term Investments (Cost $58,630,699) 3.8% | | | | | | | | | | | | |
| | | | | | | | | | | | |
Money Market Funds 3.8% | | | | | | | | | | | | |
c,dInstitutional Fiduciary Trust Money Market Portfolio, 2.00% | | | United States | | | | 58,630,699 | | | | 58,630,699 | |
| | | | | | | | | | | | |
| | | |
Total Investments (Cost $1,352,648,388) 99.8% | | | | | | | | | | | 1,525,104,060 | |
Other Assets, less Liabilities 0.2% | | | | | | | | | | | 2,315,497 | |
| | | | | | | | | | | | |
| | | |
Net Assets 100.0% | | | | | | | | | | $ | 1,527,419,557 | |
| | | | | | | | | | | | |
See Abbreviations on page 50.
aNon-income producing.
bFair valued using significant unobservable inputs. See Note 10 regarding fair value measurements.
cSee Note 3(f) regarding investments in affiliated management investment companies.
dThe rate shown is the annualizedseven-day effective yield at period end.
| | | | |
| | | |
26 | | Annual Report | The accompanying notes are an integral part of these financial statements. | | franklintempleton.com |
FRANKLIN GLOBAL TRUST
Financial Highlights
Franklin International Small Cap Fund
| | | | | | | | | | | | | | | | | | | | |
| | | | | | Year Ended July 31, | | | | |
| | | 2019 | | | 2018 | | | 2017 | | | 2016 | | | 2015 | |
| | | | | |
Class A | | | | | | | | | | | | | | | | | | | | |
| | | | | |
Per share operating performance | | | | | | | | | | | | | | | | | | | | |
(for a share outstanding throughout the year) | | | | | | | | | | | | | | | | | | | | |
| | | | | |
Net asset value, beginning of year | | | $19.68 | | | | $20.61 | | | | $17.55 | | | | $19.92 | | | | $22.23 | |
| | | | | |
Income from investment operationsa: | | | | | | | | | | | | | | | | | | | | |
| | | | | |
Net investment incomeb | | | 0.20 | | | | 0.47 | | | | 0.19 | | | | 0.22 | | | | 0.19 | |
| | | | | |
Net realized and unrealized gains (losses) | | | (2.87 | ) | | | 0.41 | | | | 4.37 | | | | (1.98 | ) | | | (0.48 | ) |
| | | | | |
Total from investment operations | | | (2.67 | ) | | | 0.88 | | | | 4.56 | | | | (1.76 | ) | | | (0.29 | ) |
| | | | | |
Less distributions from: | | | | | | | | | | | | | | | | | | | | |
| | | | | |
Net investment income | | | (0.27 | ) | | | (1.23 | ) | | | (0.18 | ) | | | (0.24 | ) | | | (0.29 | ) |
| | | | | |
Net realized gains | | | (0.26 | ) | | | (0.58 | ) | | | (1.32 | ) | | | (0.37 | ) | | | (1.73 | ) |
| | | | | |
Total distributions | | | (0.53 | ) | | | (1.81 | ) | | | (1.50 | ) | | | (0.61 | ) | | | (2.02 | ) |
| | | | | |
Net asset value, end of year | | | $16.48 | | | | $19.68 | | | | $20.61 | | | | $17.55 | | | | $19.92 | |
| | | | | |
Total returnc | | | (13.49)% | | | | 4.32% | | | | 28.31% | | | | (8.93)% | | | | (0.17)% | |
| | | | | |
Ratios to average net assets | | | | | | | | | | | | | | | | | | | | |
| | | | | |
Expensesd | | | 1.41% | | | | 1.38% | | | | 1.38% | | | | 1.38% | | | | 1.36% | |
| | | | | |
Net investment income | | | 1.11% | | | | 2.32% | | | | 1.05% | | | | 1.14% | | | | 0.98% | |
| | | | | |
Supplemental data | | | | | | | | | | | | | | | | | | | | |
| | | | | |
Net assets, end of year (000’s) | | | $95,528 | | | | $142,505 | | | | $161,355 | | | | $169,943 | | | | $212,890 | |
| | | | | |
Portfolio turnover rate | | | 11.86% | | | | 26.98% | | | | 21.71% | | | | 21.93% | | | | 24.20% | |
aThe amount shown for a share outstanding throughout the period may not correlate with the Statement of Operations for the period due to the timing of sales and repurchases of the Fund’s shares in relation to income earned and/or fluctuating fair value of the investments of the Fund.
bBased on average daily shares outstanding.
cTotal return does not reflect sales commissions or contingent deferred sales charges, if applicable.
dBenefit of expense reduction rounds to less than 0.01%.
| | | | |
| | | |
| franklintempleton.com | | The accompanying notes are an integral part of these financial statements. | Annual Report | | 27 |
FRANKLIN GLOBAL TRUST
FINANCIAL HIGHLIGHTS
Franklin International Small Cap Fund(continued)
| | | | | | | | | | | | | | | | | | | | |
| | | | | | Year Ended July 31, | | | | |
| | | 2019 | | | 2018 | | | 2017 | | | 2016 | | | 2015 | |
| | | | | |
Class C | | | | | | | | | | | | | | | | | | | | |
| | | | | |
Per share operating performance (for a share outstanding throughout the year) | | | | | | | | | | | | | | | | | | | | |
| | | | | |
Net asset value, beginning of year | | | $19.42 | | | | $20.36 | | | | $17.32 | | | | $19.60 | | | | $21.94 | |
| | | | | |
Income from investment operationsa: | | | | | | | | | | | | | | | | | | | | |
| | | | | |
Net investment incomeb | | | 0.06 | | | | 0.32 | | | | 0.05 | | | | 0.07 | | | | 0.05 | |
| | | | | |
Net realized and unrealized gains (losses) | | | (2.82 | ) | | | 0.39 | | | | 4.33 | | | | (1.95 | ) | | | (0.47 | ) |
| | | | | |
Total from investment operations | | | (2.76 | ) | | | 0.71 | | | | 4.38 | | | | (1.88 | ) | | | (0.42 | ) |
| | | | | |
Less distributions from: | | | | | | | | | | | | | | | | | | | | |
| | | | | |
Net investment income | | | (0.15 | ) | | | (1.07 | ) | | | (0.02 | ) | | | (0.03 | ) | | | (0.19 | ) |
| | | | | |
Net realized gains | | | (0.26 | ) | | | (0.58 | ) | | | (1.32 | ) | | | (0.37 | ) | | | (1.73 | ) |
| | | | | |
Total distributions | | | (0.41 | ) | | | (1.65 | ) | | | (1.34 | ) | | | (0.40 | ) | | | (1.92 | ) |
| | | | | |
Net asset value, end of year | | | $16.25 | | | | $19.42 | | | | $20.36 | | | | $17.32 | | | | $19.60 | |
| | | | | |
Total returnc | | | (14.10)% | | | | 3.50% | | | | 27.39% | | | | (9.66)% | | | | (0.86)% | |
| | | | | |
Ratios to average net assets | | | | | | | | | | | | | | | | | | | | |
| | | | | |
Expensesd | | | 2.16% | | | | 2.14% | | | | 2.13% | | | | 2.15% | | | | 2.08% | |
| | | | | |
Net investment income | | | 0.36% | | | | 1.56% | | | | 0.30% | | | | 0.37% | | | | 0.26% | |
| | | | | |
Supplemental data | | | | | | | | | | | | | | | | | | | | |
| | | | | |
Net assets, end of year (000’s) | | | $10,942 | | | | $19,184 | | | | $22,191 | | | | $22,699 | | | | $30,067 | |
| | | | | |
Portfolio turnover rate | | | 11.86% | | | | 26.98% | | | | 21.71% | | | | 21.93% | | | | 24.20% | |
aThe amount shown for a share outstanding throughout the period may not correlate with the Statement of Operations for the period due to the timing of sales and repurchases of the Fund’s shares in relation to income earned and/or fluctuating fair value of the investments of the Fund.
bBased on average daily shares outstanding.
cTotal return does not reflect sales commissions or contingent deferred sales charges, if applicable.
dBenefit of expense reduction rounds to less than 0.01%.
| | | | |
| | | |
28 | | Annual Report | The accompanying notes are an integral part of these financial statements. | | franklintempleton.com |
FRANKLIN GLOBAL TRUST
FINANCIAL HIGHLIGHTS
Franklin International Small Cap Fund(continued)
| | | | | | | | | | | | | | | | | | | | |
| | | | | | Year Ended July 31, | | | | |
| | | 2019 | | | 2018 | | | 2017 | | | 2016 | | | 2015 | |
| | | | | |
Class R | | | | | | | | | | | | | | | | | | | | |
| | | | | |
Per share operating performance | | | | | | | | | | | | | | | | | | | | |
(for a share outstanding throughout the year) | | | | | | | | | | | | | | | | | | | | |
| | | | | |
Net asset value, beginning of year | | | $19.72 | | | | $20.66 | | | | $17.56 | | | | $19.88 | | | | $22.19 | |
| | | | | |
Income from investment operationsa: | | | | | | | | | | | | | | | | | | | | |
| | | | | |
Net investment incomeb | | | 0.17 | | | | 0.42 | | | | 0.13 | | | | 0.17 | | | | 0.15 | |
| | | | | |
Net realized and unrealized gains (losses) | | | (2.89 | ) | | | 0.40 | | | | 4.41 | | | | (1.98 | ) | | | (0.48 | ) |
| | | | | |
Total from investment operations | | | (2.72 | ) | | | 0.82 | | | | 4.54 | | | | (1.81 | ) | | | (0.33 | ) |
| | | | | |
Less distributions from: | | | | | | | | | | | | | | | | | | | | |
| | | | | |
Net investment income | | | (0.24 | ) | | | (1.18 | ) | | | (0.12 | ) | | | (0.14 | ) | | | (0.25 | ) |
| | | | | |
Net realized gains | | | (0.26 | ) | | | (0.58 | ) | | | (1.32 | ) | | | (0.37 | ) | | | (1.73 | ) |
| | | | | |
Total distributions | | | (0.50 | ) | | | (1.76 | ) | | | (1.44 | ) | | | (0.51 | ) | | | (1.98 | ) |
| | | | | |
Net asset value, end of year | | | $16.50 | | | | $19.72 | | | | $20.66 | | | | $17.56 | | | | $19.88 | |
| | | | | |
Total return | | | (13.67)% | | | | 3.97% | | | | 28.07% | | | | (9.20)% | | | | (0.41)% | |
| | | | | |
Ratios to average net assets | | | | | | | | | | | | | | | | | | | | |
| | | | | |
Expensesc | | | 1.66% | | | | 1.64% | | | | 1.64% | | | | 1.64% | | | | 1.62% | |
| | | | | |
Net investment income | | | 0.86% | | | | 2.06% | | | | 0.79% | | | | 0.88% | | | | 0.72% | |
| | | | | |
Supplemental data | | | | | | | | | | | | | | | | | | | | |
| | | | | |
Net assets, end of year (000’s) | | | $2,482 | | | | $3,450 | | | | $3,592 | | | | $4,735 | | | | $6,193 | |
| | | | | |
Portfolio turnover rate | | | 11.86% | | | | 26.98% | | | | 21.71% | | | | 21.93% | | | | 24.20% | |
aThe amount shown for a share outstanding throughout the period may not correlate with the Statement of Operations for the period due to the timing of sales and repurchases of the Fund’s shares in relation to income earned and/or fluctuating fair value of the investments of the Fund.
bBased on average daily shares outstanding.
cBenefit of expense reduction rounds to less than 0.01%.
| | | | |
| | | |
| franklintempleton.com | | The accompanying notes are an integral part of these financial statements. | Annual Report | | 29 |
FRANKLIN GLOBAL TRUST
FINANCIAL HIGHLIGHTS
Franklin International Small Cap Fund(continued)
| | | | | | | | | | | | | | | | | | | | |
| | | | | | Year Ended July 31, | | | | |
| | | 2019 | | | 2018 | | | 2017 | | | 2016 | | | 2015 | |
| | | | | |
Class R6 | | | | | | | | | | | | | | | | | | | | |
| | | | | |
Per share operating performance | | | | | | | | | | | | | | | | | | | | |
(for a share outstanding throughout the year) | | | | | | | | | | | | | | | | | | | | |
| | | | | |
Net asset value, beginning of year | | | $19.74 | | | | $20.67 | | | | $17.61 | | | | $20.03 | | | | $22.32 | |
| | | | | |
Income from investment operationsa: | | | | | | | | | | | | | | | | | | | | |
| | | | | |
Net investment incomeb | | | 0.29 | | | | 0.56 | | | | 0.27 | | | | 0.30 | | | | 0.27 | |
| | | | | |
Net realized and unrealized gains (losses) | | | (2.91 | ) | | | 0.40 | | | | 4.37 | | | | (2.00 | ) | | | (0.48 | ) |
| | | | | |
Total from investment operations | | | (2.62 | ) | | | 0.96 | | | | 4.64 | | | | (1.70 | ) | | | (0.21 | ) |
| | | | | |
Less distributions from: | | | | | | | | | | | | | | | | | | | | |
| | | | | |
Net investment income | | | (0.32 | ) | | | (1.31 | ) | | | (0.26 | ) | | | (0.35 | ) | | | (0.35 | ) |
| | | | | |
Net realized gains | | | (0.26 | ) | | | (0.58 | ) | | | (1.32 | ) | | | (0.37 | ) | | | (1.73 | ) |
| | | | | |
Total distributions | | | (0.58 | ) | | | (1.89 | ) | | | (1.58 | ) | | | (0.72 | ) | | | (2.08 | ) |
| | | | | |
Net asset value, end of year | | | $16.54 | | | | $19.74 | | | | $20.67 | | | | $17.61 | | | | $20.03 | |
| | | | | |
Total return | | | (13.12)% | | | | 4.70% | | | | 28.87% | | | | (8.61)% | | | | 0.22% | |
| | | | | |
Ratios to average net assets | | | | | | | | | | | | | | | | | | | | |
| | | | | |
Expensesc | | | 1.02% | d | | | 1.01% | | | | 0.99% | | | | 0.99% | | | | 0.99% | |
| | | | | |
Net investment income | | | 1.50% | | | | 2.69% | | | | 1.44% | | | | 1.53% | | | | 1.35% | |
| | | | | |
Supplemental data | | | | | | | | | | | | | | | | | | | | |
| | | | | |
Net assets, end of year (000’s) | | | $125,218 | | | | $450,645 | | | | $492,010 | | | | $383,411 | | | | $387,070 | |
| | | | | |
Portfolio turnover rate | | | 11.86% | | | | 26.98% | | | | 21.71% | | | | 21.93% | | | | 24.20% | |
aThe amount shown for a share outstanding throughout the period may not correlate with the Statement of Operations for the period due to the timing of sales and repurchases of the Fund’s shares in relation to income earned and/or fluctuating fair value of the investments of the Fund.
bBased on average daily shares outstanding.
cBenefit of expense reduction rounds to less than 0.01%.
dBenefit of waiver and payments by affiliates rounds to less than 0.01%.
| | | | |
| | | |
30 | | Annual Report | The accompanying notes are an integral part of these financial statements. | | franklintempleton.com |
FRANKLIN GLOBAL TRUST
FINANCIAL HIGHLIGHTS
Franklin International Small Cap Fund(continued)
| | | | | | | | | | | | | | | | | | | | |
| | | | | | Year Ended July 31, | | | | |
| | | 2019 | | | 2018 | | | 2017 | | | 2016 | | | 2015 | |
| | | | | |
Advisor Class | | | | | | | | | | | | | | | | | | | | |
| | | | | |
Per share operating performance | | | | | | | | | | | | | | | | | | | | |
(for a share outstanding throughout the year) | | | | | | | | | | | | | | | | | | | | |
| | | | | |
Net asset value, beginning of year | | | $19.73 | | | | $20.67 | | | | $17.59 | | | | $20.00 | | | | $22.30 | |
| | | | | |
Income from investment operationsa: | | | | | | | | | | | | | | | | | | | | |
| | | | | |
Net investment incomeb | | | 0.23 | | | | 0.52 | | | | 0.23 | | | | 0.25 | | | | 0.24 | |
| | | | | |
Net realized and unrealized gains (losses) | | | (2.87 | ) | | | 0.40 | | | | 4.39 | | | | (1.97 | ) | | | (0.48 | ) |
| | | | | |
Total from investment operations | | | (2.64 | ) | | | 0.92 | | | | 4.62 | | | | (1.72 | ) | | | (0.24 | ) |
| | | | | |
Less distributions from: | | | | | | | | | | | | | | | | | | | | |
| | | | | |
Net investment income | | | (0.30 | ) | | | (1.28 | ) | | | (0.22 | ) | | | (0.32 | ) | | | (0.33 | ) |
| | | | | |
Net realized gains | | | (0.26 | ) | | | (0.58 | ) | | | (1.32 | ) | | | (0.37 | ) | | | (1.73 | ) |
| | | | | |
Total distributions | | | (0.56 | ) | | | (1.86 | ) | | | (1.54 | ) | | | (0.69 | ) | | | (2.06 | ) |
| | | | | |
Net asset value, end of year | | | $16.53 | | | | $19.73 | | | | $20.67 | | | | $17.59 | | | | $20.00 | |
| | | | | |
Total return | | | (13.22)% | | | | 4.51% | | | | 28.68% | | | | (8.74)% | | | | 0.09% | |
| | | | | |
Ratios to average net assets | | | | | | | | | | | | | | | | | | | | |
| | | | | |
Expensesc | | | 1.16% | | | | 1.14% | | | | 1.14% | | | | 1.14% | | | | 1.12% | |
| | | | | |
Net investment income | | | 1.36% | | | | 2.56% | | | | 1.29% | | | | 1.38% | | | | 1.22% | |
| | | | | |
Supplemental data | | | | | | | | | | | | | | | | | | | | |
| | | | | |
Net assets, end of year (000’s) | | | $439,650 | | | | $763,309 | | | | $749,573 | | | | $827,351 | | | | $1,300,759 | |
| | | | | |
Portfolio turnover rate | | | 11.86% | | | | 26.98% | | | | 21.71% | | | | 21.93% | | | | 24.20% | |
aThe amount shown for a share outstanding throughout the period may not correlate with the Statement of Operations for the period due to the timing of sales and repurchases of the Fund’s shares in relation to income earned and/or fluctuating fair value of the investments of the Fund.
bBased on average daily shares outstanding.
cBenefit of expense reduction rounds to less than 0.01%.
| | | | |
| | | |
| franklintempleton.com | | The accompanying notes are an integral part of these financial statements. | Annual Report | | 31 |
FRANKLIN GLOBAL TRUST
Statement of Investments, July 31, 2019
Franklin International Small Cap Fund
| | | | | | | | | | | | |
| | | Country | | | Shares | | | Value | |
| | | |
Common Stocks 102.9% | | | | | | | | | | | | |
Capital Markets 6.4% | | | | | | | | | | | | |
aFairfax India Holdings Corp. | | | Canada | | | | 3,400,600 | | | $ | 43,357,650 | |
| | | | | | | | | | | | |
| | | |
Commercial Services & Supplies 13.7% | | | | | | | | | | | | |
Biffa PLC | | | United Kingdom | | | | 10,532,000 | | | | 28,084,586 | |
Elis SA | | | France | | | | 1,397,160 | | | | 25,941,167 | |
ISS AS | | | Denmark | | | | 829,425 | | | | 23,270,355 | |
aProsegur Cash SA | | | Spain | | | | 7,427,255 | | | | 15,121,593 | |
| | | | | | | | | | | | |
| | | |
| | | | | | | | | | | 92,417,701 | |
| | | | | | | | | | | | |
| | | |
Distributors 3.6% | | | | | | | | | | | | |
bHeadlam Group PLC | | | United Kingdom | | | | 4,571,588 | | | | 24,464,461 | |
| | | | | | | | | | | | |
| | | |
Energy Equipment & Services 7.2% | | | | | | | | | | | | |
aBorr Drilling Ltd. | | | Norway | | | | 1,646,855 | | | | 15,803,595 | |
John Wood Group PLC | | | United Kingdom | | | | 5,080,577 | | | | 32,774,058 | |
| | | | | | | | | | | | |
| | | |
| | | | | | | | | | | 48,577,653 | |
| | | | | | | | | | | | |
| | | |
Equity Real Estate Investment Trusts (REITs) 3.4% | | | | | | | | | | | | |
Lar Espana Real Estate Socimi SA | | | Spain | | | | 3,003,610 | | | | 23,164,755 | |
| | | | | | | | | | | | |
| | | |
Food & Staples Retailing 4.1% | | | | | | | | | | | | |
Total Produce PLC | | | Ireland | | | | 18,009,900 | | | | 27,899,135 | |
| | | | | | | | | | | | |
| | | |
Food Products 4.6% | | | | | | | | | | | | |
Cloetta AB, B | | | Sweden | | | | 8,761,293 | | | | 26,073,280 | |
Devro PLC | | | United Kingdom | | | | 1,896,900 | | | | 4,724,120 | |
| | | | | | | | | | | | |
| | | |
| | | | | | | | | | | 30,797,400 | |
| | | | | | | | | | | | |
| | | |
Health Care Providers & Services 1.9% | | | | | | | | | | | | |
BML Inc. | | | Japan | | | | 454,300 | | | | 12,523,777 | |
| | | | | | | | | | | | |
| | | |
Hotels, Restaurants & Leisure 4.9% | | | | | | | | | | | | |
Elior Group SA | | | France | | | | 2,521,688 | | | | 33,008,630 | |
| | | | | | | | | | | | |
| | | |
Insurance 10.3% | | | | | | | | | | | | |
aArch Capital Group Ltd. | | | United States | | | | 594,721 | | | | 23,009,756 | |
Fairfax Financial Holdings Ltd. | | | Canada | | | | 60,500 | | | | 28,030,100 | |
RenaissanceRe Holdings Ltd. | | | United States | | | | 102,500 | | | | 18,567,875 | |
| | | | | | | | | | | | |
| | | |
| | | | | | | | | | | 69,607,731 | |
| | | | | | | | | | | | |
| | | |
Interactive Media & Services 4.1% | | | | | | | | | | | | |
a58.com Inc., ADR | | | China | | | | 495,200 | | | | 27,919,376 | |
| | | | | | | | | | | | |
| | | |
Internet & Direct Marketing Retail 2.5% | | | | | | | | | | | | |
Dustin Group AB | | | Sweden | | | | 1,939,271 | | | | 16,775,805 | |
| | | | | | | | | | | | |
| | | |
Machinery 4.6% | | | | | | | | | | | | |
Zardoya Otis SA | | | Spain | | | | 4,499,008 | | | | 30,864,543 | |
| | | | | | | | | | | | |
| | | |
Marine 9.1% | | | | | | | | | | | | |
Clarkson PLC | | | United Kingdom | | | | 1,110,315 | | | | 34,733,304 | |
a,bDiana Shipping Inc. | | | United States | | | | 8,027,750 | | | | 26,571,852 | |
| | | | | | | | | | | | |
| | | |
| | | | | | | | | | | 61,305,156 | |
| | | | | | | | | | | | |
| | | | |
| | | |
32 | | Annual Report | | franklintempleton.com |
FRANKLIN GLOBAL TRUST
STATEMENT OF INVESTMENTS
Franklin International Small Cap Fund(continued)
| | | | | | | | | | | | |
| | | Country | | | Shares | | | Value | |
| | | |
Common Stocks(continued) | | | | | | | | | | | | |
Media 5.5% | | | | | | | | | | | | |
aLiberty Latin America Ltd. | | | Chile | | | | 861,400 | | | $ | 14,126,960 | |
aLiberty Latin America Ltd., A | | | Chile | | | | 1,409,897 | | | | 23,108,212 | |
| | | | | | | | | | | | |
| | | |
| | | | | | | | | | | 37,235,172 | |
| | | | | | | | | | | | |
| | | |
Metals & Mining 4.1% | | | | | | | | | | | | |
Straits Trading Co. Ltd. | | | Singapore | | | | 16,461,200 | | | | 27,427,349 | |
| | | | | | | | | | | | |
| | | |
Pharmaceuticals 1.5% | | | | | | | | | | | | |
Haw Par Corp. Ltd. | | | Singapore | | | | 1,002,100 | | | | 10,163,907 | |
| | | | | | | | | | | | |
| | | |
Professional Services 1.0% | | | | | | | | | | | | |
PageGroup PLC | | | United Kingdom | | | | 1,252,401 | | | | 6,828,399 | |
| | | | | | | | | | | | |
| | | |
Real Estate Management & Development 4.7% | | | | | | | | | | | | |
Hang Lung Group Ltd. | | | Hong Kong | | | | 12,230,300 | | | | 31,559,444 | |
| | | | | | | | | | | | |
| | | |
Software 1.1% | | | | | | | | | | | | |
Hansen Technologies Ltd. | | | Australia | | | | 2,730,470 | | | | 7,186,740 | |
| | | | | | | | | | | | |
| | | |
Tobacco 3.4% | | | | | | | | | | | | |
Scandinavian Tobacco Group AS | | | Denmark | | | | 2,147,373 | | | | 22,622,347 | |
| | | | | | | | | | | | |
| | | |
Trading Companies & Distributors 1.2% | | | | | | | | | | | | |
Brenntag AG | | | Germany | | | | 159,500 | | | | 7,834,247 | |
| | | | | | | | | | | | |
| | | |
Total Common Stocks (Cost $747,260,116) | | | | | | | | | | | 693,541,378 | |
Other Assets, less Liabilities (2.9)% | | | | | | | | | | | (19,721,606 | ) |
| | | | | | | | | | | | |
| | | |
Net Assets 100.0% | | | | | | | | | | $ | 673,819,772 | |
| | | | | | | | | | | | |
See Abbreviations on page 50.
aNon-income producing.
bSee Note 8 regarding holdings of 5% voting securities.
| | | | |
| | | |
| franklintempleton.com | | The accompanying notes are an integral part of these financial statements. | Annual Report | | 33 |
FRANKLIN GLOBAL TRUST
FINANCIAL STATEMENTS
Statements of Assets and Liabilities
July 31, 2019
| | | | | | | | |
| | | Franklin
International
Growth Fund | | | Franklin
International
Small Cap Fund | |
| | |
Assets: | | | | | | | | |
Investments in securities: | | | | | | | | |
Cost - Unaffiliated issuers | | $ | 1,294,017,689 | | | $ | 684,664,694 | |
Cost -Non-controlled affiliates (Note 3f and 8) | | | 58,630,699 | | | | 62,595,422 | |
| | |
Value - Unaffiliated issuers | | $ | 1,466,473,361 | | | $ | 642,505,065 | |
Value -Non-controlled affiliates (Note 3f and 8) | | | 58,630,699 | | | | 51,036,313 | |
Receivables: | | | | | | | | |
Investment securities sold | | | 2,664,050 | | | | 35,746,857 | |
Capital shares sold | | | 8,084,104 | | | | 337,307 | |
Dividends | | | 774,771 | | | | 2,645,793 | |
European Union tax reclaims | | | 43,106 | | | | 1,468,284 | |
Other assets | | | 560 | | | | 565 | |
| | |
Total assets | | | 1,536,670,651 | | | | 733,740,184 | |
| | |
Liabilities: | | | | | | | | |
Payables: | | | | | | | | |
Investment securities purchased | | | 2,816,750 | | | | 3,705,467 | |
Capital shares redeemed | | | 5,394,156 | | | | 376,541 | |
Management fees | | | 724,108 | | | | 626,867 | |
Distribution fees | | | 84,759 | | | | 32,129 | |
Transfer agent fees | | | 134,375 | | | | 156,550 | |
Funds advanced by custodian | | | — | | | | 54,893,671 | |
Accrued expenses and other liabilities | | | 96,946 | | | | 129,187 | |
| | |
Total liabilities | | | 9,251,094 | | | | 59,920,412 | |
| | |
Net assets, at value | | $ | 1,527,419,557 | | | $ | 673,819,772 | |
| | |
Net assets consist of: | | | | | | | | |
Paid-in capital | | $ | 1,376,369,495 | | | $ | 728,780,131 | |
Total distributable earnings (loss) | | | 151,050,062 | | | | (54,960,359 | ) |
Net assets, at value | | $ | 1,527,419,557 | | | $ | 673,819,772 | |
| | | | |
| | | |
34 | | Annual Report | The accompanying notes are an integral part of these financial statements. | | franklintempleton.com |
FRANKLIN GLOBAL TRUST
FINANCIAL STATEMENTS
Statements of Assets and Liabilities(continued)
July 31, 2019
| | | | | | | | |
| | | Franklin
International
Growth Fund | | | Franklin
International
Small Cap Fund | |
| | |
Class A: | | | | | | | | |
Net assets, at value | | | $289,944,380 | | | | $ 95,528,030 | |
Shares outstanding | | | 19,828,187 | | | | 5,797,945 | |
Net asset value per sharea | | | $14.62 | | | | $16.48 | |
Maximum offering price per share (net asset value per share ÷ 94.50%) | | | $15.47 | | | | $17.44 | |
Class C: | | | | | | | | |
Net assets, at value | | | $ 27,396,758 | | | | $ 10,942,324 | |
Shares outstanding | | | 1,956,392 | | | | 673,428 | |
Net asset value and maximum offering price per sharea | | | $14.00 | | | | $16.25 | |
Class R: | | | | | | | | |
Net assets, at value | | | $ 1,848,314 | | | | $ 2,481,804 | |
Shares outstanding | | | 127,496 | | | | 150,386 | |
Net asset value and maximum offering price per share | | | $14.50 | | | | $16.50 | |
Class R6: | | | | | | | | |
Net assets, at value | | | $344,256,618 | | | | $125,217,687 | |
Shares outstanding | | | 23,438,638 | | | | 7,569,580 | |
Net asset value and maximum offering price per share | | | $14.69 | | | | $16.54 | |
Advisor Class: | | | | | | | | |
Net assets, at value | | | $863,973,487 | | | | $439,649,927 | |
Shares outstanding | | | 58,929,707 | | | | 26,592,667 | |
Net asset value and maximum offering price per share | | | $14.66 | | | | $16.53 | |
aRedemption price is equal to net asset value less contingent deferred sales charges, if applicable.
| | | | |
| | | |
| franklintempleton.com | | The accompanying notes are an integral part of these financial statements. | Annual Report | | 35 |
FRANKLIN GLOBAL TRUST
FINANCIAL STATEMENTS
Statements of Operations
for the year ended July 31, 2019
| | | | | | | | |
| | | Franklin
International
Growth Fund | | | Franklin
International
Small Cap Fund | |
| | |
Investment income: | | | | | | | | |
Dividends: (net of foreign taxes)* | | | | | | | | |
Unaffiliated issuers | | $ | 12,647,909 | | | $ | 22,211,584 | |
Non-controlled affiliates (Note 3f and 8) | | | 895,787 | | | | 2,214,029 | |
Interest: | | | | | | | | |
Unaffiliated issuers | | | — | | | | 364,384 | |
Other income (Note 1c) | | | — | | | | 540,541 | |
| | |
Total investment income | | | 13,543,696 | | | | 25,330,538 | |
| | |
Expenses: | | | | | | | | |
Management fees (Note 3a) | | | 7,351,166 | | | | 9,549,807 | |
Distribution fees: (Note 3c) | | | | | | | | |
Class A | | | 557,432 | | | | 295,086 | |
Class C | | | 242,051 | | | | 139,946 | |
Class R | | | 7,162 | | | | 14,670 | |
Transfer agent fees: (Note 3e) | | | | | | | | |
Class A | | | 302,513 | | | | 185,846 | |
Class C | | | 32,846 | | | | 22,454 | |
Class R | | | 1,964 | | | | 4,702 | |
Class R6 | | | 64,021 | | | | 69,848 | |
Advisor Class | | | 795,395 | | | | 906,677 | |
Custodian fees (Note 4) | | | 103,004 | | | | 197,030 | |
Reports to shareholders | | | 93,562 | | | | 35,347 | |
Registration and filing fees | | | 251,999 | | | | 110,917 | |
Professional fees | | | 86,509 | | | | 95,305 | |
Trustees’ fees and expenses | | | 32,529 | | | | 53,830 | |
Other | | | 24,832 | | | | 34,169 | |
| | |
Total expenses | | | 9,946,985 | | | | 11,715,634 | |
Expense reductions (Note 4) | | | (80 | ) | | | (2,102 | ) |
Expenses waived/paid by affiliates (Note 3f and 3g) | | | (1,462,060 | ) | | | (8,641 | ) |
| | |
Net expenses | | | 8,484,845 | | | | 11,704,891 | |
| | |
Net investment income | | | 5,058,851 | | | | 13,625,647 | |
| | |
Realized and unrealized gains (losses): | | | | | | | | |
Net realized gain (loss) from: | | | | | | | | |
Investments: | | | | | | | | |
Unaffiliated issuers | | | (23,888,987 | ) | | | 41,898,661 | |
Non-controlled affiliates (Note 3f and 8) | | | — | | | | (6,581,943 | ) |
Foreign currency transactions | | | (336,743 | ) | | | (839,403 | ) |
| | |
Net realized gain (loss) | | | (24,225,730 | ) | | | 34,477,315 | |
| | |
Net change in unrealized appreciation (depreciation) on: | | | | | | | | |
Investments: | | | | | | | | |
Unaffiliated issuers | | | 57,109,335 | | | | (198,768,085 | ) |
Non-controlled affiliates (Note 3f and 8) | | | — | | | | (11,464,717 | ) |
Translation of other assets and liabilities denominated in foreign currencies | | | 12,473 | | | | (208,374 | ) |
| | |
Net change in unrealized appreciation (depreciation) | | | 57,121,808 | | | | (210,441,176 | ) |
| | |
Net realized and unrealized gain (loss) | | | 32,896,078 | | | | (175,963,861 | ) |
| | |
Net increase (decrease) in net assets resulting from operations | | $ | 37,954,929 | | | $ | (162,338,214 | ) |
| | |
*Foreign taxes withheld on dividends | | $ | 1,196,164 | | | $ | 2,003,067 | |
| | | | |
| | | |
36 | | Annual Report | The accompanying notes are an integral part of these financial statements. | | franklintempleton.com |
FRANKLIN GLOBAL TRUST
FINANCIAL STATEMENTS
Statements of Changes in Net Assets
| | | | | | | | | | | | | | | | |
| | | Franklin International Growth Fund | | | Franklin International Small Cap Fund | |
| | | | |
| | | Year Ended July 31, | | | Year Ended July 31, | |
| | | | |
| | | 2019 | | | 2018 | | | 2019 | | | 2018 | |
| |
| | | | |
Increase (decrease) in net assets: | | | | | | | | | | | | | | | | |
Operations: | | | | | | | | | | | | | | | | |
Net investment income | | $ | 5,058,851 | | | $ | 2,397,810 | | | $ | 13,625,647 | | | $ | 36,693,227 | |
Net realized gain (loss) | | | (24,225,730 | ) | | | 35,522,927 | | | | 34,477,315 | | | | 39,552,848 | |
Net change in unrealized appreciation (depreciation) | | | 57,121,808 | | | | 20,943,148 | | | | (210,441,176 | ) | | | (10,831,517 | ) |
| | | | |
| | | | |
Net increase (decrease) in net assets resulting from operations | | | 37,954,929 | | | | 58,863,885 | | | | (162,338,214 | ) | | | 65,414,558 | |
| | | | |
| | | | |
Distributions to shareholders: (Note 1d) | | | | | | | | | | | | | | | | |
Class A | | | (3,419,430 | ) | | | (1,015,218 | ) | | | (3,615,239 | ) | | | (13,772,561 | ) |
Class C | | | (341,396 | ) | | | (152,224 | ) | | | (337,683 | ) | | | (1,699,238 | ) |
Class R | | | (24,774 | ) | | | (6,699 | ) | | | (82,207 | ) | | | (294,158 | ) |
Class R6 | | | (2,237,447 | ) | | | (1,140,595 | ) | | | (9,249,294 | ) | | | (43,560,775 | ) |
Advisor Class | | | (7,947,860 | ) | | | (3,071,235 | ) | | | (18,744,843 | ) | | | (65,916,823 | ) |
| | | | |
| | | | |
Total distributions to shareholders | | | (13,970,907 | ) | | | (5,385,971 | ) | | | (32,029,266 | ) | | | (125,243,555 | ) |
| | | | |
| | | | |
Capital share transactions: (Note 2) | | | | | | | | | | | | | | | | |
Class A | | | 128,841,303 | | | | (42,310,630 | ) | | | (25,249,304 | ) | | | (11,766,717 | ) |
Class C | | | 5,920,180 | | | | 12,201,180 | | | | (5,476,260 | ) | | | (2,131,185 | ) |
Class R | | | 763,393 | | | | 651,154 | | | | (431,678 | ) | | | 6,437 | |
Class R6 | | | 257,160,944 | | | | 20,447,819 | | | | (274,102,642 | ) | | | (21,574,001 | ) |
Advisor Class | | | 547,968,186 | | | | 121,288,828 | | | | (205,644,420 | ) | | | 45,664,816 | |
| | | | |
| | | | |
Total capital share transactions | | | 940,654,006 | | | | 112,278,351 | | | | (510,904,304 | ) | | | 10,199,350 | |
| | | | |
| | | | |
Net increase (decrease) in net assets | | | 964,638,028 | | | | 165,756,265 | | | | (705,271,784 | ) | | | (49,629,647 | ) |
Net assets: | | | | | | | | | | | | | | | | |
Beginning of year | | | 562,781,529 | | | | 397,025,264 | | | | 1,379,091,556 | | | | 1,428,721,203 | |
| | | | |
| | | | |
End of year (Note 1d) | | $ | 1,527,419,557 | | | $ | 562,781,529 | | | $ | 673,819,772 | | | $ | 1,379,091,556 | |
| | | | |
| | | | |
| | | |
| franklintempleton.com | | The accompanying notes are an integral part of these financial statements. | Annual Report | | 37 |
FRANKLIN GLOBAL TRUST
Notes to Financial Statements
1. Organization and Significant Accounting Policies
Franklin Global Trust (Trust) is registered under the Investment Company Act of 1940 (1940 Act) as anopen-end management investment company, consisting of four separate funds, two of which are included in this report (Funds) and applies the specialized accounting and reporting guidance in U.S. Generally Accepted Accounting Principles (U.S. GAAP). The Funds offer five classes of shares: Class A, Class C, Class R, Class R6 and Advisor Class. Beginning on October 19, 2018, Class C shares automatically convert to Class A shares after they have been held for 10 years. Each class of shares may differ by its initial sales load, contingent deferred sales charges, voting rights on matters affecting a single class, its exchange privilege and fees due to differing arrangements for distribution and transfer agent fees. Franklin International Small Cap Fund was closed to new investors with limited exceptions effective June 3, 2013.
Effective March 1, 2019, Franklin International Small Cap Growth Fund was renamed Franklin International Small Cap Fund.
The following summarizes the Funds’ significant accounting policies.
a. Financial Instrument Valuation
The Funds’ investments in financial instruments are carried at fair value daily. Fair value is the price that would be received to sell an asset or paid to transfer a liability in an orderly transaction between market participants on the measurement date. The Funds calculate the net asset value (NAV) per share each business day as of 4 p.m. Eastern time or the regularly scheduled close of the New York Stock Exchange (NYSE), whichever is earlier. Under compliance policies and procedures approved by the Trust’s Board of Trustees (the Board), the Funds’ administrator has responsibility for oversight of valuation, including leading the cross-functional Valuation Committee (VC). The Funds may utilize independent pricing services, quotations from securities and financial instrument dealers, and other market sources to determine fair value.
Equity securities listed on an exchange or on the NASDAQ National Market System are valued at the last quoted sale price or the official closing price of the day, respectively. Foreign equity securities are valued as of the close of trading on the foreign stock exchange on which the security is primarily traded, or as of 4 p.m. Eastern time. The value is
then converted into its U.S. dollar equivalent at the foreign exchange rate in effect at 4 p.m. Eastern time on the day that the value of the security is determined.Over-the-counter (OTC) securities are valued within the range of the most recent quoted bid and ask prices. Securities that trade in multiple markets or on multiple exchanges are valued according to the broadest and most representative market. Certain equity securities are valued based upon fundamental characteristics or relationships to similar securities.
Investments inopen-end mutual funds are valued at the closing NAV. Investments in time deposits are valued at cost, which approximates fair value.
The Funds have procedures to determine the fair value of financial instruments for which market prices are not reliable or readily available. Under these procedures, the Funds primarily employ a market-based approach which may use related or comparable assets or liabilities, recent transactions, market multiples, book values, and other relevant information for the investment to determine the fair value of the investment. An income-based valuation approach may also be used in which the anticipated future cash flows of the investment are discounted to calculate fair value. Discounts may also be applied due to the nature or duration of any restrictions on the disposition of the investments. Due to the inherent uncertainty of valuations of such investments, the fair values may differ significantly from the values that would have been used had an active market existed.
Trading in securities on foreign securities stock exchanges and OTC markets may be completed before 4 p.m. Eastern time. In addition, trading in certain foreign markets may not take place on every Funds’ business day. Occasionally, events occur between the time at which trading in a foreign security is completed and 4 p.m. Eastern time that might call into question the reliability of the value of a portfolio security held by the Fund. As a result, differences may arise between the value of the Funds’ portfolio securities as determined at the foreign market close and the latest indications of value at 4 p.m. Eastern time. In order to minimize the potential for these differences, the VC monitors price movements following the close of trading in foreign stock markets through a series of country specific market proxies (such as baskets of American Depositary Receipts, futures contracts and exchange traded funds). These price movements are measured against established trigger thresholds for each specific market proxy to assist in determining if an event has occurred that may call into question the reliability of the
| | | | |
| | | |
38 | | Annual Report | | franklintempleton.com |
FRANKLIN GLOBAL TRUST
NOTES TO FINANCIAL STATEMENTS
values of the foreign securities held by the Funds. If such an event occurs, the securities may be valued using fair value procedures, which may include the use of independent pricing services.
When the last day of the reporting period is anon-business day, certain foreign markets may be open on those days that the Funds’ NAV is not calculated, which could result in differences between the value of the Funds’ portfolio securities on the last business day and the last calendar day of the reporting period. Any significant security valuation changes due to an open foreign market are adjusted and reflected by the Funds for financial reporting purposes.
b. Foreign Currency Translation
Portfolio securities and other assets and liabilities denominated in foreign currencies are translated into U.S. dollars based on the exchange rate of such currencies against U.S. dollars on the date of valuation. The Funds may enter into foreign currency exchange contracts to facilitate transactions denominated in a foreign currency. Purchases and sales of securities, income and expense items denominated in foreign currencies are translated into U.S. dollars at the exchange rate in effect on the transaction date. Portfolio securities and assets and liabilities denominated in foreign currencies contain risks that those currencies will decline in value relative to the U.S. dollar. Occasionally, events may impact the availability or reliability of foreign exchange rates used to convert the U.S. dollar equivalent value. If such an event occurs, the foreign exchange rate will be valued at fair value using procedures established and approved by the Board.
The Funds do not separately report the effect of changes in foreign exchange rates from changes in market prices on securities held. Such changes are included in net realized and unrealized gain or loss from investments in the Statements of Operations.
Realized foreign exchange gains or losses arise from sales of foreign currencies, currency gains or losses realized between the trade and settlement dates on securities transactions and the difference between the recorded amounts of dividends, interest, and foreign withholding taxes and the U.S. dollar equivalent of the amounts actually received or paid. Net unrealized foreign exchange gains and losses arise from changes in foreign exchange rates on foreign denominated assets and liabilities other than investments in securities held at the end of the reporting period.
c. Income and Deferred Taxes
It is each Fund’s policy to qualify as a regulated investment company under the Internal Revenue Code. Each Fund intends to distribute to shareholders substantially all of its taxable income and net realized gains to relieve it from federal income and excise taxes. As a result, no provision for U.S. federal income taxes is required.
The Funds may be subject to foreign taxation related to income received, capital gains on the sale of securities and certain foreign currency transactions in the foreign jurisdictions in which the Funds invest. Foreign taxes, if any, are recorded based on the tax regulations and rates that exist in the foreign markets in which the Funds invest. When a capital gain tax is determined to apply, certain or all Funds record an estimated deferred tax liability in an amount that would be payable if the securities were disposed of on the valuation date.
As a result of several court cases, in certain countries across the European Union, certain or all Funds filed additional tax reclaims for previously withheld taxes on dividends earned in those countries (EU reclaims). These additional filings are subject to various administrative proceedings by the local jurisdictions’ tax authorities within the European Union, as well as a number of related judicial proceedings. Income recognized, if any, for EU reclaims is reflected as other income in the Statements of Operations and any related receivable, if any, is reflected as European Union tax reclaims in the Statements of Assets and Liabilities. When uncertainty exists as to the ultimate resolution of these proceedings, the likelihood of receipt of these EU reclaims, and the potential timing of payment, no amounts are reflected in the financial statements. For U.S. income tax purposes, EU reclaims received by the Funds, if any, reduce the amounts of foreign taxes Fund shareholders can use as tax credits in their individual income tax returns.
Each Fund may recognize an income tax liability related to its uncertain tax positions under U.S. GAAP when the uncertain tax position has a less than 50% probability that it will be sustained upon examination by the tax authorities based on its technical merits. As of July 31, 2019, each Fund has determined that no tax liability is required in its financial statements related to uncertain tax positions for any open tax years (or expected to be taken in future tax years). Open tax years are those that remain subject to examination and are based on the statute of limitations in each jurisdiction in which the Fund invests.
| | | | |
| | | |
| franklintempleton.com | | Annual Report | | 39 |
FRANKLIN GLOBAL TRUST
NOTES TO FINANCIAL STATEMENTS
1. Organization and Significant Accounting Policies(continued)
d. Security Transactions, Investment Income, Expenses and Distributions
Security transactions are accounted for on trade date. Realized gains and losses on security transactions are determined on a specific identification basis. Interest income and estimated expenses are accrued daily. Dividend income is recorded on theex-dividend date except for certain dividends from securities where the dividend rate is not available. In such cases, the dividend is recorded as soon as the information is received by the Funds. Distributions to shareholders are recorded on theex-dividend date. Distributable earnings are determined according to income tax regulations (tax basis) and may differ from earnings recorded in accordance with U.S. GAAP. These differences may be permanent or temporary. Permanent differences are reclassified among capital accounts to reflect their tax character. These reclassifications have no impact on net assets or the results of operations. Temporary differences are not reclassified, as they may reverse in subsequent periods.*
Common expenses incurred by the Trust are allocated among the Funds based on the ratio of net assets of each Fund to the combined net assets of the Trust or based on the ratio of number of shareholders of each Fund to the combined number of shareholders of the Trust. Fund specific expenses are charged directly to the Fund that incurred the expense.
Realized and unrealized gains and losses and net investment income, excluding class specific expenses, are allocated daily to each class of shares based upon the relative proportion of net assets of each class. Differences in per share distributions by class are generally due to differences in class specific expenses.
e. Accounting Estimates
The preparation of financial statements in accordance with U.S. GAAP requires management to make estimates and assumptions that affect the reported amounts of assets and liabilities at the date of the financial statements and the amounts of income and expenses during the reporting period. Actual results could differ from those estimates.
f. Guarantees and Indemnifications
Under the Trust’s organizational documents, its officers and trustees are indemnified by the Trust against certain liabilities arising out of the performance of their duties to the Trust. Additionally, in the normal course of business, the Trust, on behalf of the Funds, enters into contracts with service providers that contain general indemnification clauses. The Trust’s maximum exposure under these arrangements is unknown as this would involve future claims that may be made against the Trust that have not yet occurred. Currently, the Trust expects the risk of loss to be remote.
| | | | |
| | | |
40 | | Annual Report | | franklintempleton.com |
FRANKLIN GLOBAL TRUST
NOTES TO FINANCIAL STATEMENTS
*Effective during the current reporting period, it is no longer required to present certain line items in the Statements of Changes in Net Assets. The below prior period amounts affected by this change are shown as they were in the prior year Statements of Changes in Net Assets.
For the year ended July 31, 2018, distributions to shareholders were as follows:
| | | | | | | | |
| | | Franklin
International
Growth Fund | | | Franklin
International
Small Cap
Fund | |
| | |
Distributions from net investment income: | | | | | | | | |
Class A | | $ | — | | | $ | (9,363,942 | ) |
Class C | | | — | | | | (1,102,389 | ) |
Class R | | | (735 | ) | | | (196,983 | ) |
Class R6 | | | (390,120 | ) | | | (30,175,573 | ) |
Advisor Class | | | (887,066 | ) | | | (45,382,451 | ) |
Distributions from net realized gains: | | | | | | | | |
Class A | | | (1,015,218 | ) | | | (4,408,619 | ) |
Class C | | | (152,224 | ) | | | (596,849 | ) |
Class R | | | (5,964 | ) | | | (97,175 | ) |
Class R6 | | | (750,475 | ) | | | (13,385,202 | ) |
Advisor Class | | | (2,184,169 | ) | | | (20,534,372 | ) |
For the year ended July 31, 2018, undistributed net investment income and distributions in excess of net investment income included in net assets were as follows:
| | | | | | | | |
| Fund | | Undistributed net
investment income | | | Distributions in
excess of net investment
income | |
| | |
Franklin International Growth Fund | | | $2,522,510 | | | | $ — | |
Franklin International Small Cap Fund | | | $ — | | | | $(27,974,475) | |
| | | | |
| | | |
| franklintempleton.com | | Annual Report | | 41 |
FRANKLIN GLOBAL TRUST
NOTES TO FINANCIAL STATEMENTS
2. Shares of Beneficial Interest
At July 31, 2019, there were an unlimited number of shares authorized (without par value). Transactions in the Funds’ shares were as follows:
| | | | | | | | | | | | | | | | |
| | | Franklin International
Growth Fund | | | Franklin International
Small Cap Fund | |
| | | Shares | | | Amount | | | Shares | | | Amount | |
| | | | |
Class A Shares: | | | | | | | | | | | | | | | | |
Year ended July 31, 2019 | | | | | | | | | | | | | | | | |
Shares solda | | | 13,452,761 | | | $ | 186,851,311 | | | | 454,186 | | | $ | 7,950,234 | |
Shares issued in reinvestment of distributions | | | 275,313 | | | | 3,402,876 | | | | 226,177 | | | | 3,555,510 | |
Shares redeemed | | | (4,456,618 | ) | | | (61,412,884 | ) | | | (2,124,199 | ) | | | (36,755,048 | ) |
| | | | |
Net increase (decrease) | | | 9,271,456 | | | $ | 128,841,303 | | | | (1,443,836 | ) | | $ | (25,249,304 | ) |
| | | | |
Year ended July 31, 2018 | | | | | | | | | | | | | | | | |
Shares sold | | | 9,784,621 | | | $ | 143,206,376 | | | | 955,860 | | | $ | 19,705,489 | |
Shares issued in reinvestment of distributions | | | 72,096 | | | | 1,010,060 | | | | 684,632 | | | | 13,405,092 | |
Shares redeemed | | | (13,385,509 | ) | | | (186,527,066 | ) | | | (2,226,384 | ) | | | (44,877,298 | ) |
| | | | |
Net increase (decrease) | | | (3,528,792 | ) | | $ | (42,310,630 | ) | | | (585,892 | ) | | $ | (11,766,717 | ) |
| | | | |
Class C Shares: | | | | | | | | | | | | | | | | |
Year ended July 31, 2019 | | | | | | | | | | | | | | | | |
Shares sold | | | 1,234,966 | | | $ | 16,656,114 | | | | 24,420 | | | $ | 424,524 | |
Shares issued in reinvestment of distributions | | | 28,660 | | | | 340,765 | | | | 20,614 | | | | 321,162 | |
Shares redeemeda | | | (836,352 | ) | | | (11,076,699 | ) | | | (359,485 | ) | | | (6,221,946 | ) |
| | | | |
Net increase (decrease) | | | 427,274 | | | $ | 5,920,180 | | | | (314,451 | ) | | $ | (5,476,260 | ) |
| | | | |
Year ended July 31, 2018 | | | | | | | | | | | | | | | | |
Shares sold | | | 1,057,682 | | | $ | 15,193,412 | | | | 47,765 | | | $ | 973,590 | |
Shares issued in reinvestment of distributions | | | 11,234 | | | | 152,224 | | | | 83,881 | | | | 1,628,141 | |
Shares redeemed | | | (219,449 | ) | | | (3,144,456 | ) | | | (233,854 | ) | | | (4,732,916 | ) |
| | | | |
Net increase (decrease) | | | 849,467 | | | $ | 12,201,180 | | | | (102,208 | ) | | $ | (2,131,185 | ) |
| | | | |
Class R Shares: | | | | | | | | | | | | | | | | |
Year ended July 31, 2019 | | | | | | | | | | | | | | | | |
Shares sold | | | 82,357 | | | $ | 1,121,235 | | | | 27,845 | | | $ | 491,911 | |
Shares issued in reinvestment of distributions | | | 2,019 | | | | 24,774 | | | | 5,213 | | | | 82,207 | |
Shares redeemed | | | (28,249 | ) | | | (382,616 | ) | | | (57,568 | ) | | | (1,005,796 | ) |
| | | | |
Net increase (decrease) | | | 56,127 | | | $ | 763,393 | | | | (24,510 | ) | | $ | (431,678 | ) |
| | | | |
Year ended July 31, 2018 | | | | | | | | | | | | | | | | |
Shares sold | | | 58,200 | | | $ | 877,018 | | | | 43,438 | | | $ | 897,263 | |
Shares issued in reinvestment of distributions | | | 481 | | | | 6,699 | | | | 14,962 | | | | 294,158 | |
Shares redeemed | | | (15,492 | ) | | | (232,563 | ) | | | (57,420 | ) | | | (1,184,984 | ) |
| | | | |
Net increase (decrease) | | | 43,189 | | | $ | 651,154 | | | | 980 | | | $ | 6,437 | |
| | | | |
| | | |
42 | | Annual Report | | franklintempleton.com |
FRANKLIN GLOBAL TRUST
NOTES TO FINANCIAL STATEMENTS
| | | | | | | | | | | | | | | | |
| | | Franklin International Growth Fund | | | Franklin International Small Cap Fund | |
| | | Shares | | | Amount | | | Shares | | | Amount | |
| | | | |
Class R6 Shares: | | | | | | | | | | | | | | | | |
Year ended July 31, 2019 | | | | | | | | | | | | | | | | |
Shares sold | | | 21,178,748 | | | $ | 302,629,777 | | | | 2,008,931 | | | $ | 34,310,291 | |
Shares issued in reinvestment of distributions | | | 155,508 | | | | 1,925,193 | | | | 582,814 | | | | 9,173,488 | |
Shares redeemed | | | (3,324,427 | ) | | | (47,394,026 | ) | | | (17,855,740 | ) | | | (317,586,421 | ) |
| | | | |
Net increase (decrease) | | | 18,009,829 | | | $ | 257,160,944 | | | | (15,263,995 | ) | | $ | (274,102,642 | ) |
| | | | |
Year ended July 31, 2018 | | | | | | | | | | | | | | | | |
Shares sold | | | 1,805,337 | | | $ | 27,141,141 | | | | 1,684,517 | | | $ | 34,660,190 | |
Shares issued in reinvestment of distributions | | | 69,962 | | | | 979,475 | | | | 2,208,458 | | | | 43,263,696 | |
Shares redeemed | | | (546,938 | ) | | | (7,672,797 | ) | | | (4,864,253 | ) | | | (99,497,887 | ) |
| | | | |
Net increase (decrease) | | | 1,328,361 | | | $ | 20,447,819 | | | | (971,278 | ) | | $ | (21,574,001 | ) |
| | | | |
Advisor Class Shares: | | | | | | | | | | | | | | | | |
Year ended July 31, 2019 | | | | | | | | | | | | | | | | |
Shares sold | | | 56,198,590 | | | $ | 774,168,536 | | | | 11,136,216 | | | $ | 192,279,888 | |
Shares issued in reinvestment of distributions | | | 556,996 | | | | 6,890,035 | | | | 1,090,756 | | | | 17,179,406 | |
Shares redeemed | | | (17,025,787 | ) | | | (233,090,385 | ) | | | (24,313,451 | ) | | | (415,103,714 | ) |
| | | | |
Net increase (decrease) | | | 39,729,799 | | | $ | 547,968,186 | | | | (12,086,479 | ) | | $ | (205,644,420 | ) |
| | | | |
Year ended July 31, 2018 | | | | | | | | | | | | | | | | |
Shares sold | | | 8,845,618 | | | $ | 133,146,839 | | | | 6,661,969 | | | $ | 135,690,295 | |
Shares issued in reinvestment of distributions | | | 151,034 | | | | 2,114,473 | | | | 3,054,312 | | | | 59,895,053 | |
Shares redeemed | | | (966,561 | ) | | | (13,972,484 | ) | | | (7,304,205 | ) | | | (149,920,532 | ) |
| | | | |
Net increase (decrease) | | | 8,030,091 | | | $ | 121,288,828 | | | | 2,412,076 | | | $ | 45,664,816 | |
aMay include a portion of Class C shares that were automatically converted to Class A.
3. Transactions with Affiliates
Franklin Resources, Inc. is the holding company for various subsidiaries that together are referred to as Franklin Templeton. Certain officers and trustees of the Trust are also officers and/or directors of the following subsidiaries:
| | | | |
| Subsidiary | | Affiliation | | |
| Franklin Advisers, Inc. (Advisers) | | Investment manager | | |
| Franklin Templeton Institutional, LLC (FT Institutional) | | Investment manager | | |
| Franklin Templeton Services, LLC (FT Services) | | Administrative manager | | |
| Franklin Templeton Distributors, Inc. (Distributors) | | Principal underwriter | | |
| Franklin Templeton Investor Services, LLC (Investor Services) | | Transfer agent | | |
| | | | |
| | | |
| franklintempleton.com | | Annual Report | | 43 |
FRANKLIN GLOBAL TRUST
NOTES TO FINANCIAL STATEMENTS
3. Transactions with Affiliates(continued)
a. Management Fees
Franklin International Growth Fund pays an investment management fee to FT Institutional based on the average daily net assets of the Fund as follows:
| | | | |
| Annualized Fee Rate | | Net Assets | | |
0.760% | | Up to and including $500 million |
0.740% | | Over $500 million, up to and including $1 billion |
0.720% | | Over $1 billion, up to and including $1.5 billion |
0.700% | | Over $1.5 billion, up to and including $6.5 billion |
0.675% | | Over $6.5 billion, up to and including $11.5 billion |
0.655% | | Over $11.5 billion, up to and including $16.5 billion |
0.635% | | Over $16.5 billion, up to and including $19 billion |
0.615% | | Over $19 billion, up to and including $21.5 billion |
0.600% | | In excess of $21.5 billion |
For the year ended July 31, 2019, the gross effective investment management fee rate was 0.745% of the Fund’s average daily net assets.
Franklin International Small Cap Fund pays an investment management fee to Advisers of 0.950% per year of the average daily net assets of the Fund.
Under a subadvisory agreement, FT Institutional, an affiliate of Advisers, provides subadvisory services to Franklin International Small Cap Fund. The subadvisory fee is paid by Advisers based on the Fund’s average daily net assets, and is not an additional expense of the Fund.
b. Administrative Fees
Under an agreement with FT Institutional and Advisers, FT Services provides administrative services to the Funds. The fee is paid by FT Institutional and Advisers based on each of the Fund’s average daily net assets, and is not an additional expense of the Funds.
c. Distribution Fees
The Board has adopted distribution plans for each share class with the exception of Class R6 and Advisor Class shares, pursuant to Rule12b-1 under the 1940 Act. Under the Funds’ Class A reimbursement distribution plans, the Funds reimburse Distributors for costs incurred in connection with the servicing, sale and distribution of each Fund’s shares up to the maximum annual plan rate for each class. Under the Class A reimbursement distribution plans, costs exceeding the maximum for the current plan year cannot be reimbursed in subsequent periods. In addition, under the Funds’ Class C and R compensation distribution plans, the Funds pay Distributors for costs incurred in connection with the servicing, sale and distribution of each Fund’s shares up to the maximum annual plan rate for each class. The plan year, for purposes of monitoring compliance with the maximum annual plan rates, is February 1 through January 31 for each Fund.
| | | | |
| | | |
44 | | Annual Report | | franklintempleton.com |
FRANKLIN GLOBAL TRUST
NOTES TO FINANCIAL STATEMENTS
The maximum annual plan rates, based on the average daily net assets, for each class, are as follows:
| | | | | | | | |
| | | Franklin
International
Growth Fund | | | Franklin
International
Small Cap
Fund | |
| | |
Reimbursement Plans: | | | | | | | | |
Class A | | | 0.35% | | | | 0.35% | |
Compensation Plans: | | | | | | | | |
Class C | | | 1.00% | | | | 1.00% | |
Class R | | | 0.50% | | | | 0.50% | |
The Board has set the current rate at 0.25% per year for Class A shares, until further notice and approval by the Board.
d. Sales Charges/Underwriting Agreements
Front-end sales charges and contingent deferred sales charges (CDSC) do not represent expenses of the Funds. These charges are deducted from the proceeds of sales of fund shares prior to investment or from redemption proceeds prior to remittance, as applicable. Distributors has advised the Funds of the following commission transactions related to the sales and redemptions of the Funds’ shares for the year:
| | | | | | | | |
| | | Franklin
International
Growth Fund | | | Franklin
International
Small Cap
Fund | |
| | |
Sales charges retained net of commissions paid to unaffiliated brokers/dealers | | | $162,137 | | | | $4,428 | |
CDSC retained | | | $ 8,615 | | | | $ 123 | |
Effective September 10, 2018, the Board approved changes to certainfront-end sales charges and dealer commissions on Class A shares. Further details are disclosed in the Funds’ Prospectus.
e. Transfer Agent Fees
Each class of shares pays transfer agent fees to Investor Services for its performance of shareholder servicing obligations. The fees are based on an annualized asset based fee of 0.02% plus a transaction based fee. In addition, each class reimburses Investor Services for out of pocket expenses incurred and, except for Class R6, reimburses shareholder servicing fees paid to third parties. These fees are allocated daily based upon their relative proportion of such classes’ aggregate net assets. Class R6 pays Investor Services transfer agent fees specific to that class.
For the year ended July 31, 2019, the Funds paid transfer agent fees as noted in the Statements of Operations of which the following amounts were retained by Investor Services:
| | | | | | | | |
| | | Franklin
International
Growth Fund | | | Franklin
International
Small Cap
Fund | |
| | |
Transfer agent fees | | | $656,900 | | | | $593,731 | |
| | | | |
| | | |
| franklintempleton.com | | Annual Report | | 45 |
FRANKLIN GLOBAL TRUST
NOTES TO FINANCIAL STATEMENTS
3. Transactions with Affiliates(continued)
f. Investments in Affiliated Management Investment Companies
Certain or all Funds invest in one or more affiliated management investment companies for purposes other than exercising a controlling influence over the management or policies. Management fees paid by the Funds are waived on assets invested in the affiliated management investment companies, as noted in the Statements of Operations, in an amount not to exceed the management and administrative fees paid directly or indirectly by each affiliate. During the year ended July 31, 2019, investments in affiliated management investment companies were as follows:
| | | | | | | | | | | | | | | | | | | | | | | | | | | | | | | | |
| | | | | | | | | | | | | | | Net Change in | | | | | | Number of | | | | |
| | | Value at | | | | | | | | | | | | Unrealized | | | Value at | | | Shares | | | | |
| | | Beginning | | | | | | | | | Realized | | | Appreciation | | | End of | | | Held at End | | | Dividend | |
| | | of Year | | | Purchases | | | Sales | | | Gain (Loss) | | | (Depreciation) | | | Year | | | of Year | | | Income | |
| | | | | | | | |
Franklin International Growth Fund | | | | | | | | | | | | | | | | | | | | | | | | | | | | | | | | |
Non-Controlled Affiliates | | | | | | | | | | | | | | | | | | | | | | | | | | | | | | | | |
Institutional Fiduciary Trust Money Market Portfolio, 2.00% | | $ | 31,353,762 | | | $ | 707,892,752 | | | $ | (680,615,815 | ) | | | $ — | | | | $ — | | | $ | 58,630,699 | | | | 58,630,699 | | | $ | 895,787 | |
| | | | | | | | | | | | |
g. Waiver and Expense Reimbursements
FT Institutional and Investor Services have contractually agreed in advance to waive or limit their respective fees and to assume as their own expense certain expenses otherwise payable by Franklin International Growth Fund so that the expenses (excluding distribution fees, acquired fund fees and expenses, and certainnon-routine expenses or costs, including those relating to litigation, indemnification, reorganizations, and liquidations) for Class A, Class C, Class R and Advisor Class of the Fund do not exceed 0.86% and for Class R6 do not exceed 0.69% based on the average net assets of each class until November 30, 2019.
Prior to December 1, 2018, expenses (excluding certain fees and expenses as previously disclosed) for Class R6 were limited to 0.63% based on the average net assets of each class. Total expenses waived or paid are not subject to recapture subsequent to the Funds’ fiscal year end.
For Franklin International Small Cap Fund, Investor Services has voluntarily agreed in advance to waive or limit its fees so that the Class R6 transfer agent fees do not exceed 0.02% based on the average net assets of the class. Investor Services may discontinue this waiver in the future.
h. Other Affiliated Transactions
At July 31, 2019, one or more of the funds in Franklin Fund Allocator Series owned a percentage of the following Funds’ outstanding shares:
| | | | | | |
Franklin
International
Growth Fund | | | Franklin
International
Small Cap
Fund | |
| |
| | 7.5% | | | | 11.9% | |
i. Interfund Transactions
Franklin International Small Cap Fund engaged in purchases and sales of investments with funds or other accounts that have common investment managers (or affiliated investment managers), directors, trustees or officers. During the year ended July 31, 2019, these purchase and sale transactions aggregated $0 and $401,203, respectively.
| | | | |
| | | |
46 | | Annual Report | | franklintempleton.com |
FRANKLIN GLOBAL TRUST
NOTES TO FINANCIAL STATEMENTS
4. Expense Offset Arrangement
The Funds have entered into an arrangement with their custodian whereby credits realized as a result of uninvested cash balances are used to reduce a portion of the Funds’ custodian expenses. During the year ended July 31, 2019, the custodian fees were reduced as noted in the Statements of Operations.
5. Income Taxes
For tax purposes, capital losses may be carried over to offset future capital gains.
At July 31, 2019, the capital loss carryforwards were as follows:
| | | | |
| | | Franklin | |
| | | International | |
| | | Growth Fund | |
| |
Capital loss carryforwards not subject to expiration: | | | | |
Short term | | | $14,943,828 | |
Long term | | | 7,741,612 | |
| | | | |
| |
Total capital loss carryforwards | | | $22,685,440 | |
| | | | |
For tax purposes, the Funds may elect to defer any portion of a post-October capital loss or late-year ordinary loss to the first day of the following fiscal year. At July 31, 2019, Franklin International Small Cap Fund deferred late-year ordinary losses of $2,515,506.
The tax character of distributions paid during the years ended July 31, 2019 and 2018, was as follows:
| | | | | | | | | | | | | | | | |
| | | Franklin International | | | Franklin International | |
| | | Growth Fund | | | Small Cap Fund | |
| | | | |
| | | 2019 | | | 2018 | | | 2019 | | | 2018 | |
| |
| | | | |
Distributions paid from: | | | | | | | | | | | | | | | | |
Ordinary income | | $ | 4,271,560 | | | $ | 1,277,910 | | | $ | 32,020,604 | | | $ | 93,732,341 | |
Long term capital gain | | | 9,699,347 | | | | 4,108,061 | | | | 8,662 | | | | 31,511,214 | |
| | | | |
| | | | |
| | $ | 13,970,907 | | | $ | 5,385,971 | | | $ | 32,029,266 | | | $ | 125,243,555 | |
| | | | |
| | | | |
| | | |
| franklintempleton.com | | Annual Report | | 47 |
FRANKLIN GLOBAL TRUST
NOTES TO FINANCIAL STATEMENTS
5. Income Taxes(continued)
At July 31, 2019, the cost of investments, net unrealized appreciation (depreciation), undistributed ordinary income and undistributed long term capital gains for income tax purposes were as follows:
| | | | | | | | |
| | | | | | Franklin | |
| | | Franklin | | | International | |
| | | International | | | Small Cap | |
| | | Growth Fund | | | Fund | |
| | |
Cost of investments | | $ | 1,356,132,761 | | | $ | 770,334,374 | |
| | |
Unrealized appreciation | | $ | 214,572,660 | | | $ | 66,276,923 | |
Unrealized depreciation | | | (45,601,361 | ) | | | (143,069,919 | ) |
| | |
Net unrealized appreciation (depreciation) | | $ | 168,971,299 | | | $ | (76,792,996 | ) |
| | |
Distributable earnings: | | | | | | | | |
Undistributed ordinary income | | $ | 4,713,921 | | | $ | — | |
Undistributed long term capital gains | | | — | | | | 23,046,817 | |
| | |
Total distributable earnings | | $ | 4,713,921 | | | $ | 23,046,817 | |
Differences between income and/or capital gains as determined on a book basis and a tax basis are primarily due to differing treatments of passive foreign investment company shares and wash sales.
Franklin International Small Cap Fund utilized a tax accounting practice to treat a portion of the proceeds from capital shares redeemed as a distribution from realized capital gains.
6. Investment Transactions
Purchases and sales of investments (excluding short term securities) for the year ended July 31, 2019, were as follows:
| | | | | | | | |
| | | | | | Franklin | |
| | | Franklin | | | International | |
| | | International | | | Small Cap | |
| | | Growth Fund | | | Fund | |
| | |
Purchases | | $ | 1,062,116,913 | | | $ | 117,944,611 | |
Sales | | $ | 170,344,196 | | | $ | 614,017,896 | |
7. Concentration of Risk
Investing in foreign securities may include certain risks and considerations not typically associated with investing in U.S. securities, such as fluctuating currency values and changing local and regional economic, political and social conditions, which may result in greater market volatility. Current political and financial uncertainty surrounding the European Union may increase market volatility and the economic risk of investing in securities in Europe. In addition, certain foreign securities may not be as liquid as U.S. securities.
| | | | |
| | | |
48 | | Annual Report | | franklintempleton.com |
FRANKLIN GLOBAL TRUST
NOTES TO FINANCIAL STATEMENTS
8. Holdings of 5% Voting Securities of Portfolio Companies
The 1940 Act defines “affiliated companies” to include investments in portfolio companies in which a fund owns 5% or more of the outstanding voting securities. During the year ended July 31, 2019, investments in “affiliated companies” were as follows:
| | | | | | | | | | | | | | | | | | | | | | | | | | | | | | | | |
| Name of Issuer | | Value at
Beginning of Year | | | Purchases | | | Sales | | | Realized
Gain (Loss) | | | Net Change in
Unrealized
Appreciation
(Depreciation) | | | Value at
End of Year | | | Number of
Shares Held
at End of Year | | | Dividend
Income | |
| | | | | | | | |
Franklin International Small Cap Fund | | | | | | | | | | | | | | | | | | | | | | | | | | | | | | | | |
Non-Controlled Affiliates | | | | | | | | | | | | | | | | | | | | | | | | | | | | | | | | |
Clarkson PLC | | $ | 60,202,821 | | | | $ — | | | | $(10,939,727 | ) | | | $(5,127,870 | ) | | | $ — | a | | | $ — | a | | | — | a | | | $ 557,163 | |
Diana Shipping Inc. | | | 36,124,875 | | | | — | | | | — | | | | — | | | | (9,553,023 | ) | | | 26,571,852 | | | | 8,027,750 | | | | — | |
Headlam Group PLC | | | 32,307,618 | | | | — | | | | (4,477,390 | ) | | | (1,454,073 | ) | | | (1,911,694 | ) | | | 24,464,461 | | | | 4,571,588 | | | | 1,656,866 | |
| | | | | | | | | | | | |
| | | | | | | | |
Total Affiliated Securities(Value is 7.6% of Net Assets) | | $ | 128,635,314 | | | | $ — | | | | $(15,417,117 | ) | | | $(6,581,943 | ) | | | $(11,464,717 | ) | | | $51,036,313 | | | | | | | | $2,214,029 | |
| | | | | | | | | | | | |
aAs of July 31, 2019, no longer an affiliate.
9. Credit Facility
The Funds, together with other U.S. registered and foreign investment funds (collectively, Borrowers), managed by Franklin Templeton, are borrowers in a joint syndicated senior unsecured credit facility totaling $2 billion (Global Credit Facility) which matures on February 7, 2020. This Global Credit Facility provides a source of funds to the Borrowers for temporary and emergency purposes, including the ability to meet future unanticipated or unusually large redemption requests.
Under the terms of the Global Credit Facility, the Funds shall, in addition to interest charged on any borrowings made by the Funds and other costs incurred by the Funds, pay their share of fees and expenses incurred in connection with the implementation and maintenance of the Global Credit Facility, based upon their relative share of the aggregate net assets of all of the Borrowers, including an annual commitment fee of 0.15% based upon the unused portion of the Global Credit Facility. These fees are reflected in other expenses in the Statements of Operations. During the year ended July 31, 2019, the Funds did not use the Global Credit Facility.
10. Fair Value Measurements
The Funds follow a fair value hierarchy that distinguishes between market data obtained from independent sources (observable inputs) and the Funds’ own market assumptions (unobservable inputs). These inputs are used in determining the value of the Funds’ financial instruments and are summarized in the following fair value hierarchy:
| | • | | Level 1 – quoted prices in active markets for identical financial instruments |
| | • | | Level 2 – other significant observable inputs (including quoted prices for similar financial instruments, interest rates, prepayment speed, credit risk, etc.) |
| | • | | Level 3 – significant unobservable inputs (including the Funds’ own assumptions in determining the fair value of financial instruments) |
The input levels are not necessarily an indication of the risk or liquidity associated with financial instruments at that level.
| | | | |
| | | |
| franklintempleton.com | | Annual Report | | 49 |
FRANKLIN GLOBAL TRUST
NOTES TO FINANCIAL STATEMENTS
10. Fair Value Measurements(continued)
A summary of inputs used as of July 31, 2019, in valuing the Funds’ assets carried at fair value, is as follows:
| | | | | | | | | | | | | | | | |
| | | Level 1 | | | Level 2 | | | Level 3 | | | Total | |
| | | | |
Franklin International Growth Fund | | | | | | | | | | | | | | | | |
Assets: | | | | | | | | | | | | | | | | |
Investments in Securities:a | | | | | | | | | | | | | | | | |
Equity Investments | | $ | 1,466,473,361 | | | $ | — | | | $ | — | b | | $ | 1,466,473,361 | |
Short Term Investments | | | 58,630,699 | | | | — | | | | — | | | | 58,630,699 | |
| | | | |
| | | | |
Total Investments in Securities | | $ | 1,525,104,060 | | | $ | — | | | $ | — | | | $ | 1,525,104,060 | |
| | | | |
| | | | |
Franklin International Small Cap Fund | | | | | | | | | | | | | | | | |
Assets: | | | | | | | | | | | | | | | | |
Investments in Securities:a | | | | | | | | | | | | | | | | |
Equity Investments | | $ | 693,541,378 | | | $ | — | | | $ | — | | | $ | 693,541,378 | |
| | | | |
aFor detailed categories, see the accompanying Statement of Investments.
bIncludes securities determined to have no value at July 31, 2019.
A reconciliation of assets in which Level 3 inputs are used in determining fair value is presented when there are significant Level 3 financial instruments at the beginning and/or end of the year.
11. Subsequent Events
The Funds have evaluated subsequent events through the issuance of the financial statements and determined that no events have occurred that require disclosure.
Abbreviations
| | | | |
Selected Portfolio | | | | |
ADR American Depositary Receipt | | | | |
| | | | |
| | | |
50 | | Annual Report | | franklintempleton.com |
FRANKLIN GLOBAL TRUST
Report of Independent Registered Public Accounting Firm
To the Board of Trustees of Franklin Global Trust and Shareholders of Franklin International Growth Fund and Franklin International Small Cap Fund
Opinions on the Financial Statements
We have audited the accompanying statements of assets and liabilities, including the statements of investments, of Franklin International Growth Fund and Franklin International Small Cap Fund (the “Funds”) as of July 31, 2019, the related statements of operations for the year ended July 31, 2019, the statements of changes in net assets for each of the two years in the period ended July 31, 2019, including the related notes, and the financial highlights for each of the five years in the period ended July 31, 2019 (collectively referred to as the “financial statements”). In our opinion, the financial statements present fairly, in all material respects, the financial position of each of the Funds as of July 31, 2019, the results of each of their operations for the year then ended, the changes in each of their net assets for each of the two years in the period ended July 31, 2019 and each of the financial highlights for each of the five years in the period ended July 31, 2019 in conformity with accounting principles generally accepted in the United States of America.
Basis for Opinions
These financial statements are the responsibility of the Funds’ management. Our responsibility is to express an opinion on the Funds’ financial statements based on our audits. We are a public accounting firm registered with the Public Company Accounting Oversight Board (United States) (PCAOB) and are required to be independent with respect to the Funds in accordance with the U.S. federal securities laws and the applicable rules and regulations of the Securities and Exchange Commission and the PCAOB.
We conducted our audits of these financial statements in accordance with the standards of the PCAOB. Those standards require that we plan and perform the audit to obtain reasonable assurance about whether the financial statements are free of material misstatement, whether due to error or fraud.
Our audits included performing procedures to assess the risks of material misstatement of the financial statements, whether due to error or fraud, and performing procedures that respond to those risks. Such procedures included examining, on a test basis, evidence regarding the amounts and disclosures in the financial statements. Our audits also included evaluating the accounting principles used and significant estimates made by management, as well as evaluating the overall presentation of the financial statements. Our procedures included confirmation of securities owned as of July 31, 2019 by correspondence with the custodian, transfer agent and brokers; when replies were not received from brokers, we performed other auditing procedures. We believe that our audits provide a reasonable basis for our opinions.
PricewaterhouseCoopers LLP
San Francisco, California
September 17, 2019
We have served as the auditor of one or more investment companies in the Franklin Templeton Group of Funds since 1948.
| | | | |
| | | |
| franklintempleton.com | | Annual Report | | 51 |
FRANKLIN GLOBAL TRUST
Tax Information (unaudited)
Under Section 852(b)(3)(C) of the Internal Revenue Code, the Funds hereby report the maximum amount allowable but no less than the following amounts as long term capital gain dividends for the fiscal year ended July 31, 2019:
| | | | | | |
Franklin International Growth Fund | | | | Franklin
International
Small Cap
Fund | |
| | |
| $9,699,347 | | | | | $7,544,642 | |
Under Section 871(k)(2)(C) of the Internal Revenue Code, the Funds hereby report the maximum amount allowable but no less than the following amounts as short term capital gain dividends for purposes of the tax imposed under Section 871(a)(1)(A) of the Internal Revenue Code for the fiscal year ended July 31, 2019:
| | | | | | |
Franklin International Growth Fund | | | | Franklin
International
Small Cap
Fund | |
| | |
| $1,790,453 | | | | | $14,867,731 | |
Under Section 854(b)(1)(B) of the Internal Revenue Code, the Funds hereby report the maximum amount allowable but no less than the following amounts as qualified dividends for purposes of the maximum rate under Section 1(h)(11) of the Internal Revenue Code for the fiscal year ended July 31, 2019:
| | | | | | |
Franklin International Growth Fund | | | | Franklin
International
Small Cap
Fund | |
| | |
| $12,370,610 | | | | | $19,153,978 | |
Distributions, including qualified dividend income, paid during calendar year 2019 will be reported to shareholders on Form1099-DIV bymid-February 2020. Shareholders are advised to check with their tax advisors for information on the treatment of these amounts on their individual income tax returns.
At July 31, 2019, more than 50% of the Fund’s total assets were invested in securities of foreign issuers. In most instances, foreign taxes were withheld from income paid to the Fund on these investments. The Fund elects to treat foreign taxes paid as allowed under Section 853 of the Internal Revenue Code. This election will allow shareholders of record as of the 2019 distribution date, to treat their proportionate share of foreign taxes paid by the Fund as having been paid directly by them. The shareholder shall consider these amounts as foreign taxes paid in the tax year in which they receive the Fund distribution.
| | | | |
| | | |
52 | | Annual Report | | franklintempleton.com |
FRANKLIN GLOBAL TRUST
Board Members and Officers
The name, year of birth and address of the officers and board members, as well as their affiliations, positions held with the Trust, principal occupations during at least the past five years and number of U.S. registered portfolios overseen in the Franklin Templeton fund complex, are shown below. Generally, each board member serves until that person’s successor is elected and qualified.
Independent Board Members
| | | | | | | | |
Name, Year of Birth and Address | | Position | | Length of Time Served | | Number of Portfolios in Fund Complex Overseen by Board Member* | | Other Directorships Held During at Least the Past 5 Years |
| | | | |
| Harris J. Ashton (1932) | | Trustee | | Since 2000 | | 137 | | Bar-S Foods (meat packing company) (1981-2010). |
| One Franklin Parkway | | | | | | | | |
| San Mateo, CA 94403-1906 | | | | | | | | |
| | |
| Principal Occupation During at Least the Past 5 Years: | | | | |
Director of various companies; andformerly, Director, RBC Holdings, Inc. (bank holding company) (until 2002); and President, Chief Executive Officer and Chairman of the Board, General Host Corporation (nursery and craft centers) (until 1998). |
| | | | |
Terrence J. Checki (1945) One Franklin Parkway San Mateo, CA 94403-1906 | | Trustee | | Since 2017 | | 113 | | Hess Corporation (exploration of oil and gas) (2014-present). |
| | | | | | | | |
| | |
| Principal Occupation During at Least the Past 5 Years: | | | | |
Member of the Council on Foreign Relations (1996-present); Member of the National Committee on U.S.-China Relations (1999-present); member of the Board of Trustees of the Economic Club of New York (2013-present); member of the Board of Trustees of the Foreign Policy Association (2005-present) and member of various other boards of trustees and advisory boards; andformerly, Executive Vice President of the Federal Reserve Bank of New York and Head of its Emerging Markets and Internal Affairs Group and Member of Management Committee (1995-2014); and Visiting Fellow at the Council on Foreign Relations (2014). |
| | | | |
Mary C. Choksi (1950) One Franklin Parkway San Mateo, CA 94403-1906 | | Trustee | | Since 2014 | | 137 | | Avis Budget Group Inc. (car rental) (2007-present), Omnicom Group Inc. (advertising and marketing communications services) (2011-present) and White Mountains Insurance Group, Ltd. (holding company) (2017-present). |
|
| Principal Occupation During at Least the Past 5 Years: |
Director of various companies; andformerly, Founder and Senior Advisor, Strategic Investment Group (investment management group) (2015-2017); Founding Partner and Senior Managing Director, Strategic Investment Group (1987-2015); Founding Partner and Managing Director, Emerging Markets Management LLC (investment management firm) (1987-2011); and Loan Officer/Senior Loan Officer/Senior Pension Investment Officer, World Bank Group (international financial institution) (1977-1987). |
| | | | |
Edith E. Holiday (1952) One Franklin Parkway San Mateo, CA 94403-1906 | | Lead Independent Trustee | | Trustee since 2000 and Lead Independent Trustee since March 2019 | | 137 | | Hess Corporation (exploration of oil and gas) (1993-present), Canadian National Railway (railroad) (2001-present), White Mountains Insurance Group, Ltd. (holding company) (2004-present), Santander Consumer USA Holdings, Inc. (consumer finance) (2016-present), RTI International Metals, Inc. (manufacture and distribution of titanium) (1999-2015) and H.J. Heinz Company (processed foods and allied products) (1994-2013). |
Principal Occupation During at Least the Past 5 Years:
Director or Trustee of various companies and trusts; andformerly,Assistant to the President of the United States and Secretary of the Cabinet (1990-1993); General Counsel to the United States Treasury Department (1989-1990); and Counselor to the Secretary and Assistant Secretary for Public Affairs and Public Liaison–United States Treasury Department (1988-1989).
| | | | |
| | | |
| franklintempleton.com | | Annual Report | | 53 |
FRANKLIN GLOBAL TRUST
Independent Board Members(continued)
| | | | | | | | |
Name, Year of Birth and Address | | Position | | Length of Time Served | | Number of Portfolios in Fund Complex Overseen by Board Member* | | Other Directorships Held During at Least the Past 5 Years |
| | | | |
J. Michael Luttig (1954) One Franklin Parkway San Mateo, CA 94403-1906 | | Trustee | | Since 2009 | | 137 | | Boeing Capital Corporation (aircraft financing) (2006-2013). |
| | |
| Principal Occupation During at Least the Past 5 Years: | | | | |
Executive Vice President, Counselor and Senior Advisor to Boeing Chairman and Board of Directors, The Boeing Company (aerospace company) (May 2019); andformerly, General Counsel and member of the Executive Council, The Boeing Company (2006-2019) and Federal Appeals Court Judge, U.S. Court of Appeals for the Fourth Circuit (1991-2006). |
| | | | |
Larry D. Thompson (1945) One Franklin Parkway San Mateo, CA 94403-1906 | | Trustee | | Since 2007 | | 137 | | The Southern Company (energy company) (2014-present; previously 2010-2012), Graham Holdings Company (education and media organization) (2011-present) and Cbeyond, Inc. (business communications provider) (2010-2012). |
| | |
| Principal Occupation During at Least the Past 5 Years: | | | | |
Director of various companies; Counsel, Finch McCranie, LLP (law firm) (2015-present); Independent Compliance Monitor and Auditor, Volkswagen AG (manufacturer of automobiles and commercial vehicles) (2017-present); John A. Sibley Professor of Corporate and Business Law, University of Georgia School of Law (2015-present; previously 2011-2012); andformerly, Executive Vice President – Government Affairs, General Counsel and Corporate Secretary, PepsiCo, Inc. (consumer products) (2012-2014); Senior Vice President – Government Affairs, General Counsel and Secretary, PepsiCo, Inc. (2004-2011); Senior Fellow of The Brookings Institution (2003-2004); Visiting Professor, University of Georgia School of Law (2004); and Deputy Attorney General, U.S. Department of Justice (2001-2003). |
Interested Board Members and Officers |
Name, Year of Birth and Address | | Position | | Length of Time Served | | Number of Portfolios in Fund Complex Overseen by Board Member* | | Other Directorships Held During at Least the Past 5 Years |
| | | | |
| **Gregory E. Johnson (1961) | | Trustee | | Since 2007 | | 151 | | None |
| One Franklin Parkway | | | | | | | | |
| San Mateo, CA 94403-1906 | | | | | | | | |
| | |
| Principal Occupation During at Least the Past 5 Years: | | | | |
Chairman of the Board, Member – Office of the Chairman, Director and Chief Executive Officer, Franklin Resources, Inc.; officer and/or director or trustee, as the case may be, of some of the other subsidiaries of Franklin Resources, Inc. and of 42 of the investment companies in Franklin Templeton; Vice Chairman, Investment Company Institute; andformerly, President, Franklin Resources, Inc. (1994-2015). |
| | | | |
| **Rupert H. Johnson, Jr. (1940) | | Chairman of | | Since 2013 | | 137 | | None |
| One Franklin Parkway | | the Board and | | | | | | |
| San Mateo, CA 94403-1906 | | Trustee | | | | | | |
| | |
| Principal Occupation During at Least the Past 5 Years: | | | | |
Vice Chairman, Member – Office of the Chairman and Director, Franklin Resources, Inc.; Director, Franklin Advisers, Inc.; and officer and/or director or trustee, as the case may be, of some of the other subsidiaries of Franklin Resources, Inc. and of 40 of the investment companies in Franklin Templeton. |
| | | | |
| Alison E. Baur (1964) | | Vice President | | Since 2012 | | Not Applicable | | Not Applicable |
| One Franklin Parkway | | | | | | | | |
| San Mateo, CA 94403-1906 | | | | | | | | |
| | |
| Principal Occupation During at Least the Past 5 Years: | | | | |
Deputy General Counsel, Franklin Templeton; and officer of some of the other subsidiaries of Franklin Resources, Inc. and of 44 of the investment companies in Franklin Templeton. |
| | | | |
| | | |
54 | | Annual Report | | franklintempleton.com |
FRANKLIN GLOBAL TRUST
Interested Board Members and Officers(continued)
| | | | | | | | |
Name, Year of Birth and Address | | Position | | Length of Time Served | | Number of Portfolios in Fund Complex Overseen by Board Member* | | Other Directorships Held During at Least the Past 5 Years |
| | | | |
| Sonal Desai, Ph.D. (1963) | | Vice President | | Since December | | Not Applicable | | Not Applicable |
| One Franklin Parkway | | | | 2018 | | | | |
| San Mateo, CA 94403-1906 | | | | | | | | |
| | |
| Principal Occupation During at Least the Past 5 Years: | | | | |
Director and Executive Vice President, Franklin Advisers, Inc.; Executive Vice President, Franklin Templeton Institutional, LLC; and officer of 18 of the investment companies in Franklin Templeton. |
| | | | |
Gaston Gardey (1967) One Franklin Parkway San Mateo, CA 94403-1906 | | Treasurer, Chief Financial Officer and Chief Accounting Officer | | Since 2009 | | Not Applicable | | Not Applicable |
| | |
| Principal Occupation During at Least the Past 5 Years: | | | | |
Treasurer, U.S. Fund Administration & Reporting, Franklin Templeton; and officer of 26 of the investment companies in Franklin Templeton. |
| | | | |
| Aliya S. Gordon (1973) | | Vice President | | Since 2009 | | Not Applicable | | Not Applicable |
| One Franklin Parkway | | | | | | | | |
| San Mateo, CA 94403-1906 | | | | | | | | |
| | |
| Principal Occupation During at Least the Past 5 Years: | | | | |
Senior Associate General Counsel, Franklin Templeton; Vice President and Secretary, Franklin Resources, Inc.; and officer of 44 of the investment companies in Franklin Templeton. |
| | | | |
| Steven J. Gray (1955) | | Vice President | | Vice President | | Not Applicable | | Not Applicable |
| One Franklin Parkway | | and Co- | | since 2009 and | | | | |
| San Mateo, CA 94403-1906 | | Secretary | | Co-Secretary | | | | |
| | | | since | | | | |
| | | | January 2019 | | | | |
| | |
| Principal Occupation During at Least the Past 5 Years: | | | | |
Senior Associate General Counsel, Franklin Templeton; Vice President, Franklin Templeton Distributors, Inc. and FASA, LLC; and officer of 44 of the investment companies in Franklin Templeton. |
| | | | |
| Matthew T. Hinkle (1971) | | Chief Executive | | Since 2017 | | Not Applicable | | Not Applicable |
| One Franklin Parkway | | Officer – | | | | | | |
| San Mateo, CA 94403-1906 | | Finance and | | | | | | |
| | Administration | | | | | | |
| | |
| Principal Occupation During at Least the Past 5 Years: | | | | |
Senior Vice President, Franklin Templeton Services, LLC; officer of 44 of the investment companies in Franklin Templeton; andformerly, Vice President, Global Tax (2012-April 2017) and Treasurer/Assistant Treasurer, Franklin Templeton (2009-2017). |
| | | | |
| Robert Lim (1948) | | Vice President | | Since 2016 | | Not Applicable | | Not Applicable |
| One Franklin Parkway | | – AML | | | | | | |
| San Mateo, CA 94403-1906 | | Compliance | | | | | | |
| | |
| Principal Occupation During at Least the Past 5 Years: | | | | |
Vice President, Franklin Templeton Companies, LLC; Chief Compliance Officer, Franklin Templeton Distributors, Inc. and Franklin Templeton Investor Services, LLC; and officer of 44 of the investment companies in Franklin Templeton. |
| | | | |
| Kimberly H. Novotny (1972) | | Vice President | | Since 2013 | | Not Applicable | | Not Applicable |
| 300 S.E. 2nd Street | | | | | | | | |
| Fort Lauderdale, FL 33301-1923 | | | | | | | | |
| | |
| Principal Occupation During at Least the Past 5 Years: | | | | |
Senior Associate General Counsel, Franklin Templeton; Vice President and Corporate Secretary, Fiduciary Trust International of the South; Vice President, Templeton Investment Counsel, LLC; Assistant Secretary, Franklin Resources, Inc.; and officer of 44 of the investment companies in Franklin Templeton. |
| | | | |
| | | |
| franklintempleton.com | | Annual Report | | 55 |
FRANKLIN GLOBAL TRUST
Interested Board Members and Officers (continued)
| | | | | | | | |
Name, Year of Birth and Address | | Position | | Length of Time Served | | Number of Portfolios in Fund Complex Overseen by Board Member* | | Other Directorships Held During at Least the Past 5 Years |
| | | | |
| Edward D. Perks (1970) | | President and | | Since December | | Not Applicable | | Not Applicable |
| One Franklin Parkway | | Chief Executive | | 2018 | | | | |
| San Mateo, CA 94403-1906 | | Officer – Investment Management | | | | | | |
|
| Principal Occupation During at Least the Past 5 Years: |
President and Director, Franklin Advisers, Inc.; and officer of nine of the investment companies in Franklin Templeton (since December 2018). |
| | | | |
| Robert C. Rosselot (1960) | | Chief | | Since 2013 | | Not Applicable | | Not Applicable |
| 300 S.E. 2nd Street | | Compliance | | | | | | |
| Fort Lauderdale, FL 33301-1923 | | Officer | | | | | | |
|
| Principal Occupation During at Least the Past 5 Years: |
Director, Global Compliance, Franklin Templeton; Vice President, Franklin Templeton Companies, LLC; officer of 44 of the investment companies in Franklin Templeton; andformerly, Senior Associate General Counsel, Franklin Templeton (2007-2013); and Secretary and Vice President, Templeton Group of Funds (2004-2013). |
| | | | |
| Navid J. Tofigh (1972) | | Vice President | | Since 2015 | | Not Applicable | | Not Applicable |
| One Franklin Parkway | | | | | | | | |
| San Mateo, CA 94403-1906 | | | | | | | | |
|
| Principal Occupation During at Least the Past 5 Years: |
Associate General Counsel and officer of 44 of the investment companies in Franklin Templeton. | | |
| | | | |
| Craig S. Tyle (1960) | | Vice President | | Since 2005 | | Not Applicable | | Not Applicable |
| One Franklin Parkway | | | | | | | | |
| San Mateo, CA 94403-1906 | | | | | | | | |
|
| Principal Occupation During at Least the Past 5 Years: |
General Counsel and Executive Vice President, Franklin Resources, Inc.; and officer of some of the other subsidiaries of Franklin Resources, Inc. and of 44 of the investment companies in Franklin Templeton. |
| | | | |
| Lori A. Weber (1964) | | Vice President | | Vice President | | Not Applicable | | Not Applicable |
| 300 S.E. 2nd Street | | and | | since 2011 and | | | | |
| Fort Lauderdale, FL 33301-1923 | | Co-Secretary | | Co-Secretary | | | | |
| | | | since January | | | | |
| | | | 2019 | | | | |
|
| Principal Occupation During at Least the Past 5 Years: |
Senior Associate General Counsel, Franklin Templeton; Assistant Secretary, Franklin Resources, Inc.; Vice President and Secretary, Templeton Investment Counsel, LLC; and officer of 44 of the investment companies in Franklin Templeton. |
| | | | |
| | | |
56 | | Annual Report | | franklintempleton.com |
FRANKLIN GLOBAL TRUST
*We base the number of portfolios on each separate series of the U.S. registered investment companies within the Franklin Templeton Investments fund complex. These portfolios have a common investment manager or affiliated investment managers.
**Gregory E. Johnson is considered to be an interested person of the Fund under the federal securities laws due to his position as an officer and director of Franklin Resources, Inc. (Resources), which is the parent company of the Fund’s investment manager and distributor. Rupert H. Johnson, Jr. is considered to be an interested person of the Fund under the federal securities laws due to his position as an officer and director and major shareholder of Resources.
Note 1: Rupert H. Johnson, Jr. is the uncle of Gregory E. Johnson.
Note 2: Effective March 12, 2019, John B. Wilson ceased to be a trustee of the Trust.
Note 3: Officer information is current as of the date of this report. It is possible that after this date, information about officers may change.
The Sarbanes-Oxley Act of 2002 and Rules adopted by the Securities and Exchange Commission require the Fund to disclose whether the Fund’s Audit Committee includes at least one member who is an audit committee financial expert within the meaning of such Act and Rules. The Fund’s Board has determined that there is at least one such financial expert on the Audit Committee and has designated Mary C. Choksi as its audit committee financial expert. The Board believes that Ms. Choksi qualifies as such an expert in view of her extensive business background and experience. She currently serves as a director of Avis Budget Group, Inc. (2007-present) and formerly, Founder and Senior Advisor, Strategic Investment Group (1987 to 2017). Ms. Choksi has been a Member of the Fund’s Audit Committee since 2014. As a result of such background and experience, the Board believes that Ms. Choksi has acquired an understanding of generally accepted accounting principles and financial statements, the general application of such principles in connection with the accounting estimates, accruals and reserves, and analyzing and evaluating financial statements that present a breadth and level of complexity of accounting issues generally comparable to those of the Fund, as well as an understanding of internal controls and procedures for financial reporting and an understanding of audit committee functions. Ms. Choksi is an independent Board member as that term is defined under the relevant Securities and Exchange Commission Rules and Releases.
The Statement of Additional Information (SAI) includes additional information about the board members and is available, without charge, upon request. Shareholders may call (800) DIALBEN/342-5236 to request the SAI.
| | | | |
| | | |
| franklintempleton.com | | Annual Report | | 57 |
FRANKLIN GLOBAL TRUST
Shareholder Information
Board Approval of Investment Management Agreements
FRANKLIN GLOBAL TRUST
Franklin International Growth Fund
Franklin International Small Cap Growth Fund
(to be renamed Franklin International Small Cap Fund, effective March 1, 2019)
(each a Fund)
At anin-person meeting held on February 26, 2019 (Meeting), the Board of Trustees (Board) of Franklin Global Trust (Trust), including a majority of the trustees who are not “interested persons” as defined in the Investment Company Act of 1940 (Independent Trustees), reviewed and approved the continuance of the investment management agreement between Franklin Templeton Institutional, LLC (FTI LLC) and the Trust, on behalf of the Franklin International Growth Fund, the investment management agreement between Franklin Advisers, Inc. (FAI) and the Trust, on behalf of the Franklin International Small Cap Growth Fund and the investmentsub-advisory agreement between FAI and FTI LLC on behalf of the Franklin International Small Cap Growth Fund (each a Management Agreement) for an additionalone-year period. The Independent Trustees received advice from and met separately with Independent Trustee counsel in considering whether to approve the continuation of each Management Agreement. Although the Management Agreements for the Funds were considered at the same Board meeting, the Board considered the information provided to it about the Funds together and with respect to each Fund separately as the Board deemed appropriate. FTI LLC and FAI are each referred to herein as a Manager.
In considering the continuation of each Management Agreement, the Board reviewed and considered information provided by each Manager at the Meeting and throughout the year at meetings of the Board and its committees. The Board also reviewed and considered information provided in response to a detailed set of requests for information submitted to each Manager by Independent Trustee counsel on behalf of the Independent Trustees in connection with the annual contract renewal process. In addition, prior to the Meeting, the Independent Trustees held a telephonic contract renewal meeting at which the Independent Trustees conferred amongst themselves and Independent Trustee counsel about contract renewal matters. The Board reviewed and considered all of the factors it deemed relevant in approving the continuance of each Management Agreement,
including, but not limited to: (i) the nature, extent and quality of the services provided by each Manager; (ii) the investment performance of each Fund; (iii) the costs of the services provided and profits realized by each Manager and its affiliates from the relationship with each Fund; (iv) the extent to which economies of scale are realized as each Fund grows; and (v) whether fee levels reflect these economies of scale for the benefit of Fund investors.
In approving the continuance of each Management Agreement, the Board, including a majority of the Independent Trustees, determined that the terms of the Management Agreement are fair and reasonable and that the continuance of such Management Agreement is in the interests of the applicable Fund and its shareholders. While attention was given to all information furnished, the following discusses some primary factors relevant to the Board’s determination.
Nature, Extent and Quality of Services
The Board reviewed and considered information regarding the nature, extent and quality of investment management services provided by each Manager and its affiliates to the Funds and their shareholders. This information included, among other things, the qualifications, background and experience of the senior management and investment personnel of each Manager; the structure of investment personnel compensation; oversight of third-party service providers; investment performance reports and related financial information for each Fund; reports on expenses, shareholder services, marketing support payments made to financial intermediaries and third party servicing arrangements; legal and compliance matters; risk controls; pricing and other services provided by each Manager and its affiliates; and management fees charged by each Manager and its affiliates to US funds and other accounts, including management’s explanation of differences among accounts where relevant. The Board also reviewed and considered an annual report on payments made by Franklin Templeton Investments (FTI) or the Funds to financial intermediaries, as well as a memorandum relating to third-party servicing arrangements in response to a guidance update in 2016 from the US Securities and Exchange Commission (SEC) relating to mutual fund distribution andsub-accounting fees. The Board noted management’s continuing efforts and expenditures in establishing effective business continuity plans and developing strategies to address areas of heightened concern in the mutual fund industry, such as cybersecurity and liquidity risk management. The Board also recognized management’s commitment to facilitating Board
| | | | |
| | | |
58 | | Annual Report | | franklintempleton.com |
FRANKLIN GLOBAL TRUST
SHAREHOLDER INFORMATION
oversight of liquidity through the designation of a liquidity/risk administrator and the development of reports that highlight the amount of illiquid investments for each Fund.
The Board also reviewed and considered the benefits provided to Fund shareholders of investing in a fund that is part of the Franklin Templeton family of funds. The Board noted the financial position of Franklin Resources, Inc. (FRI), the Managers’ parent, and its commitment to the mutual fund business as evidenced by its continued introduction of new funds, reassessment of the fund offerings in response to the market environment and project initiatives and capital investments relating to the services provided to the Funds by the FTI organization.
Following consideration of such information, the Board was satisfied with the nature, extent and quality of services provided by each Manager and its affiliates to the Funds and their shareholders.
Fund Performance
The Board reviewed and considered the performance results of each Fund over various time periods ended December 31, 2018. The Board considered the performance returns for each Fund in comparison to the performance returns of mutual funds deemed comparable to the Fund included in a universe (Performance Universe) selected by Broadridge Financial Solutions, Inc. (Broadridge), an independent provider of investment company data. The Board received a description of the methodology used by Broadridge to select the mutual funds included in a Performance Universe. The Board also reviewed and considered Fund performance reports provided and discussions that occurred with portfolio managers at Board meetings throughout the year. A summary of each Fund’s performance results is below.
Franklin International Growth Fund- The Performance Universe for this Fund included the Fund and all retail and institutional internationalmulti-cap growth funds. The Board noted that the Fund’s annualized total return for theone-, three-, five- and10-year periods was above the median of its Performance Universe. The Board concluded that the Fund’s performance was satisfactory.
Franklin International Small Cap Growth Fund- The Performance Universe for this Fund included the Fund and all retail and institutional internationalsmall-/mid-cap growth funds. The Board noted that the Fund’s annualized total return for theone-, three- and five-year periods was below the median of its Performance Universe, but for the10-year
period was above the median of its Performance Universe. The Board discussed the Fund’s underperformance with management and noted management’s explanations of the reasons for the Fund’s underperformance, which included, in part, stock selection arising out of the Fund’sbottom-up driven investment approach which has resulted in investment exposures that are materially different from the Fund’s benchmark index and Performance Universe. The Board also noted management’s recent enhancements to its investment process, the Fund’s name change, effective March 1, 2019, to the Franklin International Small Cap Fund and that the Fund is currently closed to new investors. The Board concluded that the Fund’s Management Agreement should be continued for an additionalone-year period, and the investment process enhancements monitored.
Comparative Fees and Expenses
The Board reviewed and considered information regarding each Fund’s actual total expense ratio and its various components, including, as applicable, management fees; transfer agent expenses; underlying fund expenses; Rule12b-1 andnon-Rule12b-1 service fees; and othernon-management fees. The Board also noted the quarterly and annual reports it receives on all marketing support payments made by FTI to financial intermediaries. The Board considered the actual total expense ratio and, separately, the contractual management fee rate, without the effect of fee waivers, if any (Management Rate) of each Fund in comparison to the median expense ratio and median Management Rate, respectively, of other mutual funds deemed comparable to and with a similar expense structure to the Fund selected by Broadridge (Expense Group). Broadridge fee and expense data is based upon information taken from each fund’s most recent annual report, which reflects historical asset levels that may be quite different from those currently existing, particularly in a period of market volatility. While recognizing such inherent limitation and the fact that expense ratios and Management Rates generally increase as assets decline and decrease as assets grow, the Board believed the independent analysis conducted by Broadridge to be an appropriate measure of comparative fees and expenses. The Broadridge Management Rate includes administrative charges, and the actual total expense ratio, for comparative consistency, was shown for: (i) Class A shares for the Franklin International Growth Fund and for Class A shares and Investor Class shares for certain other funds in the Expense Group with multiple classes of shares, and (ii) Advisor Class shares for the Franklin International Small Cap Growth Fund and for Advisor Class shares, Investor Class shares, Institutional
| | | | |
| | | |
| franklintempleton.com | | Annual Report | | 59 |
FRANKLIN GLOBAL TRUST
SHAREHOLDER INFORMATION
Class shares, Class I shares and Class Y shares for certain other funds in the Expense Group with multiple classes of shares. The Board received a description of the methodology used by Broadridge to select the mutual funds included in an Expense Group.
Franklin International Growth Fund - The Expense Group for this Fund included the Fund and 12 other internationalmulti-cap growth funds. The Board noted that the Management Rate and actual total expense ratio for the Fund were below the medians of its Expense Group. The Board concluded that the Management Rate charged to the Fund is reasonable. In doing so, the Board noted that the Fund’s actual total expense ratio reflected a fee waiver from management.
Franklin International Small Cap Growth Fund - The Expense Group for this Fund included the Fund and 13 other internationalsmall-/mid-cap growth funds. The Board noted that the Management Rate for the Fund was below the median of its Expense Group, but its actual total expense ratio was slightly above the median of its Expense Group. The Board concluded that the Management Rate charged to the Fund is reasonable. In doing so, the Board noted that FTI LLC, assub-adviser to the Fund, is paid by FAI out of the management fee FAI receives from the Fund.
Profitability
The Board reviewed and considered information regarding the profits realized by each Manager and its affiliates in connection with the operation of each Fund. In this respect, the Board considered the Fund profitability analysis that addresses the overall profitability of FTI’s US fund business, as well as its profits in providing investment management and other services to each of the individual funds during the12-month period ended September 30, 2018, being the most recent fiscalyear-end for FRI. The Board noted that although management continually makes refinements to its methodologies used in calculating profitability in response to organizational and product-related changes, the overall methodology has remained consistent with that used in the Funds’ profitability report presentations from prior years. Additionally, PricewaterhouseCoopers LLP, auditor to FRI and certain Franklin Templeton funds, has been engaged to periodically review and assess the allocation methodologies to be used solely by the Funds’ Board with respect to the profitability analysis.
The Board noted management’s belief that costs incurred in establishing the infrastructure necessary for the type of mutual fund operations conducted by each Manager and its
affiliates may not be fully reflected in the expenses allocated to each Fund in determining its profitability, as well as the fact that the level of profits, to a certain extent, reflected operational cost savings and efficiencies initiated by management. The Board also noted management’s expenditures in improving shareholder services provided to the Funds, as well as the need to implement systems and meet additional regulatory and compliance requirements resulting from recent SEC and other regulatory requirements.
The Board also considered the extent to which each Manager and its affiliates might derive ancillary benefits from fund operations, including revenues generated from transfer agent services, potential benefits resulting from personnel and systems enhancements necessitated by fund growth, as well as increased leverage with service providers and counterparties. Based upon its consideration of all these factors, the Board concluded that the level of profits realized by each Manager and its affiliates from providing services to each Fund was not excessive in view of the nature, extent and quality of services provided to each Fund.
Economies of Scale
The Board reviewed and considered the extent to which each Manager may realize economies of scale, if any, as each Fund grows larger and whether each Fund’s management fee structure reflects any economies of scale for the benefit of shareholders. With respect to possible economies of scale, the Board noted the existence of management fee breakpoints for the Franklin International Growth Fund, which operate generally to share any economies of scale with a Fund’s shareholders by reducing the Fund’s effective management fees as the Fund grows in size. The Board considered the Managers’ view that any analyses of potential economies of scale in managing a particular fund are inherently limited in light of the joint and common costs and investments the Managers incur across the Franklin Templeton family of funds as a whole. The Board concluded that to the extent economies of scale may be realized by a Manager and its affiliates, each Fund’s management fee structure provided a sharing of benefits with the Fund and its shareholders as the Fund grows.
Conclusion
Based on its review, consideration and evaluation of all factors it believed relevant, including the above-described factors and conclusions, the Board unanimously approved the continuation of each Management Agreement for an additionalone-year period.
| | | | |
| | | |
60 | | Annual Report | | franklintempleton.com |
FRANKLIN GLOBAL TRUST
SHAREHOLDER INFORMATION
Proxy Voting Policies and Procedures
The Trust’s investment manager has established Proxy Voting Policies and Procedures (Policies) that the Trust uses to determine how to vote proxies relating to portfolio securities. Shareholders may view the Trust’s complete Policies online at franklintempleton.com. Alternatively, shareholders may request copies of the Policies free of charge by calling the Proxy Group collect at (954)527-7678 or by sending a written request to: Franklin Templeton Companies, LLC, 300 S.E. 2nd Street, Fort Lauderdale, FL 33301, Attention: Proxy Group. Copies of the Trust’s proxy voting records are also made available online at franklintempleton.com and posted on the U.S. Securities and Exchange Commission’s website at sec.gov and reflect the most recent12-month period ended June 30.
Quarterly Statement of Investments
The Trust files a complete statement of investments with the U.S. Securities and Exchange Commission for the first and third quarters for each fiscal year as an exhibit to its report on FormN-PORT. Shareholders may view the filed FormN-PORT by visiting the Commission’s website at sec.gov. The filed form may also be viewed and copied at the Commission’s Public Reference Room in Washington, DC. Information regarding the operations of the Public Reference Room may be obtained by calling(800) SEC-0330.
Householding of Reports and
Prospectuses
You will receive each Fund’s financial reports every six months as well as an annual updated summary prospectus (prospectus available upon request). To reduce Fund expenses, we try to identify related shareholders in a household and send only one copy of the financial reports and summary prospectus. This process, called “householding,” will continue indefinitely unless you instruct us otherwise. If you prefer not to have these documents householded, please call us at (800)632-2301. At any time you may view current prospectuses/summary prospectuses and financial reports on our website. If you choose, you may receive these documents through electronic delivery.
| | | | |
| | | |
| franklintempleton.com | | Annual Report | | 61 |
This page intentionally left blank.
This page intentionally left blank.
This page intentionally left blank.
Authorized for distribution only when accompanied or preceded by a summary prospectus and/or prospectus. Investors should carefully consider a fund’s investment goals, risks, charges and expenses before investing. A prospectus contains this and other information; please read it carefully before investing.
To help ensure we provide you with quality service, all calls to and from our service areas are monitored and/or recorded.
| | | | | | | | | | |
 | | | | Annual Report and Shareholder Letter Franklin Global Trust | | | | |
| | | | | | |
| | | | | Investment Managers Franklin Advisers, Inc. Franklin Templeton Institutional, LLC | | Subadvisor Franklin Templeton Institutional, LLC | | Distributor Franklin Templeton
Distributors, Inc. (800) DIAL BEN®/ 342-5236 franklintempleton.com | | Shareholder Services (800)632-2301 |
| © 2019 Franklin Templeton Investments. All rights reserved. | | | | | | FGT3 A 09/19 |

ANNUAL REPORT FRANKLIN EMERGING MARKET DEBT OPPORTUNITIES FUND A Series of Franklin Global Trust July 31, 2019 FRANKLIN TEMPLETON
Internet Delivery of Fund Reports Unless You Request Paper Copies:Effective January 1, 2021, as permitted by the SEC, paper copies of the Fund’s shareholder reports will no longer be sent by mail, unless you specifically request them from the Fund or your financial intermediary. Instead, the reports will be made available on a website, and you will be notified by mail each time a report is posted and provided with a website link to access the report.
If you already elected to receive shareholder reports electronically, you will not be affected by this change and you need not take any action. If you have not signed up for electronic delivery, we would encourage you to join fellow shareholders who have. You may elect to receive shareholder reports and other communications electronically from the Fund by calling (800)321-8563 or by contacting your financial intermediary.
You may elect to continue to receive paper copies of all your future shareholder reports free of charge by contacting your financial intermediary or, if you invest directly with a Fund, calling (800)321-8563 to let the Fund know of your request. Your election to receive reports in paper will apply to all funds held in your account.
FRANKLIN TEMPLETON
Successful investing begins with ambition. And achievement only comes when you reach for it. That’s why we continually strive to deliver better outcomes for investors. No matter what your goals are, our deep, global investment expertise allows us to offer solutions that can help.
During our more than 70 years of experience, we’ve managed through all kinds of markets—up, down and those in between. We’re always preparing for what may come next. It’s because of this, combined with our strength as one of the world’s largest asset managers that we’ve earned the trust of millions of investors around the world.
|
| Visitftinstitutional.comfor fund updates, to access your account, or to find investment insights. |
| | |
| | Not FDIC Insured | May Lose Value | No Bank Guarantee |
| | | | |
| | | |
| ftinstitutional.com | | Not part of the annual report | | 1 |
ANNUAL REPORT
Franklin Emerging Market Debt Opportunities Fund
This annual report for Franklin Emerging Market Debt Opportunities Fund covers the fiscal year ended July 31, 2019.
Your Fund’s Goal and Main Investments
The Fund seeks high total return through investing at least 80% of its net assets in debt securities of emerging market countries—mainly securities issued by sovereign and subsovereign government entities, but also including securities issued by corporate entities that are controlled by a sovereign entity, and corporate emerging markets debt.
Performance Overview
The Fund posted a +8.04% cumulative total return for the 12 months under review. In comparison, the Fund’s first benchmark, the J.P. Morgan (JPM) Emerging Markets Bond Index (EMBI) Global Diversified Index, which tracks total returns for U.S. dollar-denominated debt instruments issued by emerging market sovereign and quasi-sovereign entities, posted a total return of +10.98%.1 The Fund’s second benchmark, the JPM Government Bond Index-Emerging Markets(GBI-EM) Broad Diversified Index (US$ Unhedged), which tracks local currency bonds issued in emerging markets, posted a +8.56% total return.2 Also for comparison, the Fund’s third benchmark, the ICE Bank of America Merrill Lynch (BofAML) Emerging Markets Corporate Plus Index (EMCB) (100% US$ Hedged), which tracks the performance of U.S. dollar-denominated and euro-denominated emerging marketnon-sovereign debt publicly issued within the major domestic and Eurobond markets, posted a +9.65% total return.1 You can find more of the Fund’s performance data in the Performance Summary beginning on page 7.
Performance data represent past performance, which does not guarantee future results. Investment return and principal value will fluctuate, and you may have a gain or loss when you sell your shares. Current performance may differ from figures shown. For most recentmonth-end performance, go toftinstitutional.comor call a Franklin Templeton Institutional Services representative at (800)321-8563.

*Figures reflect certain derivatives held in the portfolio (or their underlying reference assets) and may not total 100% or may be negative due to rounding, use of derivatives, unsettled trades or other factors.
**Includes securities determined to have no value at 7/31/19.
***Rounds to less than 0.1%.
Economic and Market Overview
At the start of the 12 months under review, the U.S. Federal Reserve (Fed) was continuing the rate hikes it had started in 2015. It raised its Fed funds target to 2.25% in September 2018 and to 2.50% in December. Just afteryear-end, however, the Fed pivoted to more dovish language. It held off on further action until July 2019, when it cut its target rate back to 2.25%.
The Fed had never before cut rates with unemployment below 4.00%. But inflation was undershooting its 2% target and there were what we considered troubling signs of an economic slowdown abroad. President Trump’s intermittent comments about trade were an important reason for these concerns about the world economy.
1. Source: Morningstar.
2. Source: J.P. Morgan.
The indexes are unmanaged and include reinvested interest. They do not reflect any fees, expenses or sales charges. One cannot invest directly in an index and an index is not representative of the Fund’s portfolio.
See www.franklintempletondatasources.com for additional data provider information.
The dollar value, number of shares or principal amount, and names of all portfolio holdings are listed in the Fund’s Consolidated Statement of Investments (SOI). The Consolidated SOI begins on page 12.
| | | | |
| | | |
2 | | Annual Report | | ftinstitutional.com |
FRANKLIN EMERGING MARKET DEBT OPPORTUNITIES FUND
The review period started with what we considered good news on trade, as the U.S., Canada and Mexico agreed on a new North American Free Trade Agreement. But a bigger trade dispute, between the U.S. and China, rumbled on.
Beginning in September 2018, the U.S. started applying a 10% tariff on US$200 billion worth of Chinese imports, and China reciprocated with a 10% tariff on US$60 billion of U.S. imports. After hopes of an agreement faded in April 2019, the U.S. raised tariffs to 25% in May 2019 and restricted U.S. technology exports to China, notably targeting Chinese telecommunications firm Huawei. China retaliated by raising its tariffs, too.
The prospect of a prolonged,tit-for-tat trade conflict led observers to warn that world growth might taper off. The World Bank, for example, lowered its earlier prediction of 3.0% world economic growth in 2019 to a more modest 2.6%. Also, the International Monetary Fund (IMF) pointed out that slower world trade might hit emerging markets particularly hard.
Prices for Brent crude oil rose to more than US$80 per barrel in September 2018. This increase was a response to the prospect of renewed U.S. sanctions on Iranian oil exports and lower supplies from Venezuela. As fears for world growth heightened, however, oil prices fell to around US$50 per barrel in December, partly due to significant waivers of sanctions on Iran.
Byperiod-end, prices stabilized at approximately US$60 to US$70 per barrel, mainly because of production cuts involving the Organization of the Petroleum Exporting Countries and Russia. At these price levels, we believe mostoil-producing countries can balance their budgets.
Country-specific problems continued to generate negative headlines during the period. Venezuela’s government remained in power without resolving the country’s default. Political pressure on Turkey’s central bank continued to weigh on the Turkish lira. Argentina’s economy continued to weaken, even after the IMF increased its support package to US$57 billion. Contrary to 2018, however, there was little fear among investors that these troubles might affect other countries in a systemic way.
World economic growth may have tapered off over the12-month period under review, but emerging-market (EM) economies continue to grow more quickly than their advanced peers. EM bonds, meanwhile, posted what we considered solid returns during the 12 months under review.
Hard currency-denominated EM sovereign bonds posted a +10.98% total return during the review period, as measured
Geographic Composition*
7/31/19
| | | | |
| Country | | % of Total
Net Assets | |
| |
Ukraine | | | 8.3% | |
| |
Argentina | | | 6.8% | |
| |
Iraq | | | 5.5% | |
| |
South Africa | | | 5.2% | |
| |
Turkey | | | 4.4% | |
| |
Colombia | | | 4.1% | |
| |
Mexico | | | 4.0% | |
| |
Chad | | | 3.5% | |
| |
Uruguay | | | 3.4% | |
| |
Angola | | | 3.3% | |
| |
Ghana | | | 2.9% | |
| |
El Salvador | | | 2.8% | |
| |
Tunisia | | | 2.8% | |
| |
Georgia | | | 2.4% | |
| |
Azerbaijan | | | 2.2% | |
| |
Dominican Republic | | | 2.0% | |
| |
Grenada | | | 1.9% | |
| |
Nigeria | | | 1.8% | |
| |
Kenya | | | 1.8% | |
| |
Trinidad and Tobago | | | 1.8% | |
| |
Mozambique | | | 1.7% | |
| |
Gabon | | | 1.5% | |
| |
Other | | | 15.5% | |
| |
Short-Term Investments & Other Net Assets** | | | 10.4% | |
| |
*Figures reflect certain derivatives held in the portfolio (or their underlying reference assets) and may not total 100% or may be negative due to rounding, use of any derivatives, unsettled trades or other factors. May differ from the Consolidated SOI due to the underlying currency exposure on pass-thru notes and currency forward contracts, and include the effects of interest receivable balances.
**Short-term securities denomiated in US Dollar.
by the JPM EMBI Global Diversified Index.1 U.S.10-year Treasury yields fell by 95 basis points (bps) over the 12 months under review, to 2.01% at the end of July 2019. The EMBI Global Diversified Index’s spread over U.S. Treasury yields, on ayield-to-worst basis, spiked in the second half of 2019, but ended the 12 months under review eight bps lower overall.
Local-currency sovereign EM bonds posted a-8.56% total return, as measured by the JPMGBI-EM Broad Diversified (US$ Unhedged).2 Local-currency yields fell steeply and EM currencies posted a mixed performance, relative to the U.S. dollar.
| | | | |
| | | |
| ftinstitutional.com | | Annual Report | | 3 |
FRANKLIN EMERGING MARKET DEBT OPPORTUNITIES FUND
U.S. dollar- and euro-denominated EM corporate bonds posted a +9.56% total return as measured by the ICE BofAML EMCB Index (100% US$ Hedged).1
Investment Strategy
Our portfolio construction process can be summarized in three integral steps—country allocation, currency allocation and issue selection. The first stage of our emerging market debt investment process is identifying the countries for which we have a favorable outlook, which we manage with abottom-up, research-driven perspective. Since the portfolio is constructed throughbottom-up, fundamental research and not relative to a benchmark index, there is no requirement to hold issues from any one country. The next decision is whether to take exposure in the form of “hard currency” or local currency instruments. Hard currencies are currencies in which investors have confidence and are typically currencies of economically and politically stable industrialized nations. The last decision concerns security selection. This depends on a number of factors, including the type of the security’s coupon (fixed or floating).
Manager’s Discussion
During the reporting period, a position in defaulted U.S.-dollar notes issued by Ukraine’s City of Kyiv was a major contributor to the Fund’s performance. During 2018, we completed the exchange of defaulted City of Kyiv notes, originally due 2015, into new notes, due 2022. No cut was applied to the principal outstanding as part of the exchange. The new notes carry a 7.5% per annum coupon rate (paid semiannually) with four equal amortizations (in June 2021, December 2021, June 2022 and December 2022). Unpaid interest up until June 2017 was capitalized, while interest payable between June 2017 and June 2018 was reimbursed in cash. In addition to this favorable exchange, the April 2019 landslide election of anti-establishment candidate Volodymyr Zelensky boosted all Ukrainian assets for the remainder of the review period.
The Fund’s position in local currency-denominated Colombian bonds also contributed to returns. Investor sentiment toward Colombia improved after conservative candidate Iván Duque won the presidential election in June 2018. As a result, local-currency Colombian bonds appreciated in value. In addition, quasi-sovereign spreads over sovereign bonds narrowed, and the Fund holds mostly quasi-sovereign bonds such as those issued by the city of Bogotà.
Our position in short-dated Turkish-lira bonds issued by the European Bank for Reconstruction and Development
boosted performance as well. We included these bonds in the Fund in late 2018, when they offered a higher yield than Turkish government bonds. This was partly due to a temporary cheapening in the offshore foreign-currency swap market and partly to compensate investors because these bonds are less liquid. Because of this issuer’s standing and the bonds maturity in July 2019, this holding added little duration or credit risk to the Fund.
Currency Composition*
7/31/19
| | | | |
| | | % of Total
Net Assets | |
| |
U.S. Dollar | | | 70.3% | |
| |
Colombian Peso | | | 4.1% | |
| |
Mexican Peso | | | 3.5% | |
| |
Uruguayan Peso | | | 3.4% | |
| |
South African Rand | | | 3.2% | |
| |
Dominican Peso | | | 2.0% | |
| |
Turkish Lira | | | 1.9% | |
| |
Kenyan Shilling | | | 1.8% | |
| |
Argentine Peso | | | 1.5% | |
| |
Ghanaian Cedi | | | 1.5% | |
| |
Indonesian Rupiah | | | 1.5% | |
| |
Georgian Lari | | | 1.3% | |
| |
Egyptian Pound | | | 1.2% | |
| |
Belarusian Ruble | | | 1.1% | |
| |
Peruvian Nuevo Sol | | | 1.0% | |
| |
Kazakhstani Tenge | | | 0.9% | |
| |
Japanese Yen | | | 0.0% | ** |
| |
Euro | | | -0.2% | |
| |
*Figures reflect certain derivatives held in the portfolio (or their underlying reference assets) and may not total 100% or may be negative due to rounding, use of any derivatives, unsettled trades or other factors. May differ from the Consolidated SOI due to the underlying currency exposure on pass-thru notes and currency forward contracts, and include the effects of interest receivable balances.
**Rounds to less than 0.1%.
By contrast, EM currency exposure was a major detractor from performance, led by exposure to the weaker Uruguayan peso. During the 12 months under review, Uruguay’s currency weakened mainly because of the economic and political turmoil in neighboring Argentina and Brazil, but also becausenon-resident holdings of Uruguayan bonds fell. That weakness, in turn, fueled a rise in domestic inflation in 2019.
At the security level, the Fund suffered mainly from its positions in Venezuelan U.S.-dollar bonds. Venezuela’s economic crisis continued during the 12 months under review. On the political front, the opposition announced itself as the interim government following discredited elections in
| | | | |
| | | |
4 | | Annual Report | | ftinstitutional.com |
FRANKLIN EMERGING MARKET DEBT OPPORTUNITIES FUND
January. Optimism that a regime change was imminent followed as numerous foreign governments, including the U.S., recognized this new government, and this caused Venezuelan bond prices to increase sharply from distressed levels. But President Maduro remained defiant, leading the U.S. to announce further sanctions on the trading in Venezuelan securities in April. In July 2019, index provider J.P. Morgan announced that it was starting to remove Venezuelan government bonds from its hard-currency indexes.
Top 10 Holdings*
7/31/19
| | |
Issue/Issuer Sector, Country | | % of Total
Net Assets |
| |
Societe des Hydrocarbures du Tchad Loan Participations and Assignments, Chad | | 3.5% |
| |
Government of Uruguay Foreign Government and Agency Securities, Uruguay | | 3.4% |
| |
Kyiv Finance PLC Loan Participations and Assignments, Ukraine | | 3.4% |
| |
Development Bank of South Africa (Government of Angola) Loan Participations and Assignments, Angola | | 3.3% |
| |
Government of Iraq** Loan Participations and Assignments, Iraq | | 3.2% |
| |
Government of South Africa Foreign Government and Agency Securities, South Africa | | 3.2% |
| |
Government of El Salvador Foreign Government and Agency Securities, El Salvador | | 2.8% |
| |
Banque Centrale de Tunisie International Bond Foreign Government & Agency Securities, Tunisia | | 2.8% |
| |
Government of Ukraine** Warrants, Ukraine | | 2.5% |
| |
Government of Turkey Foreign Government and Agency Securities, Turkey | | 2.5% |
*May differ from the Consolidated SOI because percentages include the effect of interest receivable balances.
**Includes Foreign Government and Agency Securities.
The Fund’s exposure to the weaker Colombian peso also detracted from returns. In September, the Colombian central bank announced a program to increase the country’s international reserves after the IMF had hinted that its Flexible Credit Line, worth a potential US$11 billion, might not be renewed in May 2020. The program was structured so that it would minimally impact the Colombian peso, but the currency has performed poorly since.
CFA® is a trademark owned by CFA Institute.
As ofperiod-end, the Fund had exposure to 35 emerging markets and two bonds issued by a supranational. The largest single country exposure was to Ukraine (8.3% of total net assets), followed by Argentina (6.8%) and Iraq (5.5%). Securities denominated in G7 currencies constituted 68.1% of total net assets, with 62.4% denominated in the U.S. dollar, 4.7% in the Japanese yen, and 1.0% in the euro. Atperiod-end, the Fund’s exposures to the euro and the Japanese yen were fully hedged back into the U.S. dollar. In addition to the hard-currency exposure described above, 29.8% of total net assets were denominated in 15 local currencies, of which the largest currency exposure was to the Columbian Peso, at 4.1% of total net assets. These figures may differ from the currency composition table because they do not include the Fund’s holdings in currency forward contracts and other hedging instruments.
We thank you for your confidence in Franklin Emerging Market Debt Opportunities Fund and hope to serve your investment needs at the highest level of expectations.
| | |
 | | 
William Ledward Portfolio Manager and Research Analyst of Franklin Templeton Investment Management Limited (FTIML) |
| | |
 | | 
Nicholas Hardingham, CFA Portfolio Manager and Research Analyst of FTIML |
| | Stephanie Ouwendijk, CFA Portfolio Manager and Research Analyst of FTIML Portfolio Management Team |
| | | | |
| | | |
| ftinstitutional.com | | Annual Report | | 5 |
FRANKLIN EMERGING MARKET DEBT OPPORTUNITIES FUND
The foregoing information reflects our analysis, opinions and portfolio holdings as of July 31, 2019, the end of the reporting period. The way we implement our main investment strategies and the resulting portfolio holdings may change depending on factors such as market and economic conditions. These opinions may not be relied upon as investment advice or an offer for a particular security. The information is not a complete analysis of every aspect of any market, country, industry, security or the Fund. Statements of fact are from sources considered reliable, but the investment manager makes no representation or warranty as to their completeness or accuracy. Although historical performance is no guarantee of future results, these insights may help you understand our investment management philosophy.
| | | | |
| | | |
6 | | Annual Report | | ftinstitutional.com |
FRANKLIN EMERGING MARKET DEBT OPPORTUNITIES FUND
Performance Summary as of July 31, 2019
The performance table and graph do not reflect any taxes that a shareholder would pay on Fund dividends, capital gain distributions, if any, or any realized gains on the sale of Fund shares. Total return reflects reinvestment of the Fund’s dividends and capital gain distributions, if any, and any unrealized gains or losses. Your dividend income will vary depending on dividends or interest paid by securities in the Fund’s portfolio, adjusted for operating expenses. Capital gain distributions are net profits realized from the sale of portfolio securities.
Performance as of 7/31/191
| | | | | | |
| | | Cumulative Total Return2 | | | | Average Annual Total Return3 |
1-Year | | +8.04% | | | | +8.04% |
5-Year | | +24.10% | | | | +4.41% |
10-Year | | +108.84% | | | | +7.64% |
Performance data represent past performance, which does not guarantee future results. Investment return and principal value will fluctuate, and you may have a gain or loss when you sell your shares. Current performance may differ from figures shown. For most recentmonth-end performance, go toftinstitutional.comor call a Franklin Templeton Institutional Services representative at(800) 321-8563.
See page 9 for Performance Summary footnotes.
| | | | |
| | | |
| ftinstitutional.com | | Annual Report | | 7 |
FRANKLIN EMERGING MARKET DEBT OPPORTUNITIES FUND
PERFORMANCE SUMMARY
Total Return Index Comparison for a Hypothetical $50,000 Investment1
Total return represents the change in value of an investment over the periods shown. It includes any applicable maximum sales charge, Fund expenses, account fees and reinvested distributions. The unmanaged indexes include reinvestment of any income or distributions. They differ from the Fund in composition and do not pay management fees or expenses. One cannot invest directly in an index.

See page 9 for Performance Summary footnotes.
| | | | |
| | | |
8 | | Annual Report | | ftinstitutional.com |
FRANKLIN EMERGING MARKET DEBT OPPORTUNITIES FUND
PERFORMANCE SUMMARY
Distributions(8/1/18–7/31/19)
|
|
| Net Investment |
| Income |
$0.8612 |
Total Annual Operating Expenses6
| | | | | | |
| | | With Fee | | | Without Fee |
| | | Waiver | | | Waiver |
|
| | | 1.01% | | | 1.10% |
|
All investments involve risks, including possible loss of principal. Special risks are associated with foreign investing including currency volatility, economic instability, and social and political developments of countries where the Fund invests. Investments in emerging markets involve heightened risks related to the same factors, in addition to those associated with these markets’ smaller size, lesser liquidity and lack of established legal, political, business and social frameworks to support securities markets. The risks associated with higher yielding, lower rated securities include higher risk of default and loss of principal. In addition, interest rate movements will affect the Fund’s share price and yield. Prices of debt securities generally move in the opposite direction of interest rates. Thus, as prices of debt securities in the Fund adjust to a rise in interest rates, the Fund’s share price may decline. The Fund is actively managed but there is no guarantee that the manager’s investment decisions will produce the desired results. The Fund’s prospectus also includes a description of the main investment risks.
1. The Fund has an expense reduction, a waiver related to the management fee paid by a Fund subsidiary and a fee waiver associated with any investments it makes in a Franklin Templeton money fund and/or other Franklin Templeton fund, contractually guaranteed through 11/30/19. Fund investment results reflect the expense reduction and fee waivers; without these reductions, the results would have been lower.
2. Cumulative total return represents the change in value of an investment over the periods indicated.
3. Average annual total return represents the average annual change in value of an investment over the periods indicated. Return for less than one year, if any, has not been annualized.
4. Source: Morningstar: The JPM EMBI Global Diversified Index is a uniquely weighted version of the JPM EMBI Global Index, which tracks total returns for U.S. dollar-denominated debt instruments issued by emerging market sovereign and quasi-sovereign entities: Brady bonds, loans and Eurobonds. The index includes all countries except those that have been classified by the World Bank as high income for the past two consecutive years. The diversified index limits the weights of those index countries with larger debt stocks by only including specified portions of these countries’ eligible current face amounts of debt outstanding. The ICE BofAML EMCB (100% US$ Hedged) tracks the performance of U.S. dollar-denominated and euro-denominated emerging marketnon-sovereign debt publicly issued within the major domestic and Eurobond markets.
5. Source: J.P. Morgan. The JPMGBI-EM Broad Diversified Index (US$ Unhedged) tracks local currency bonds issued by emerging markets. Weightings among countries are more evenly distributed within the index than in the global diversified index.
6. Figures are as stated in the Fund’s current prospectus and may differ from the expense ratios disclosed in the Your Fund’s Expenses and Consolidated Financial Highlights sections in this report. In periods of market volatility, assets may decline significantly, causing total annual Fund operating expenses to become higher than the figures shown. See www.franklintempletondatasources.com for additional data provider information.
| | | | |
| | | |
| ftinstitutional.com | | Annual Report | | 9 |
FRANKLIN EMERGING MARKET DEBT OPPORTUNITIES FUND
Your Fund’s Expenses
As a Fund shareholder, you can incur two types of costs: (1) transaction costs, including sales charges (loads) on Fund purchases and redemptions, if applicable; and (2) ongoing Fund costs, including management fees, distribution and service(12b-1) fees, if applicable, and other Fund expenses. All mutual funds have ongoing costs, sometimes referred to as operating expenses. The table below shows ongoing costs of investing in the Fund and can help you understand these costs and compare them with those of other mutual funds. The table assumes a $1,000 investment held for the six months indicated.
Actual Fund Expenses
The table below provides information about actual account values and actual expenses in the columns under the heading “Actual.” In these columns the Fund’s actual return, which includes the effect of Fund expenses, is used to calculate the “Ending Account Value.” You can estimate the expenses you paid during the period by following these steps (ofcourse, your account value and expenses will differ from those in this illustration):Divide your account value by $1,000 (ifyour account had an $8,600 value, then $8,600÷ $1,000 = 8.6).Then multiply the result by the number in the row for your class of shares under the headings “Actual” and “Expenses Paid During Period” (ifActual Expenses Paid During Period were $7.50, then 8.6 x $7.50= $64.50). In this illustration, the actual expenses paid this period are $64.50.
Hypothetical Example for Comparison with Other Funds
Under the heading “Hypothetical” in the table, information is provided about hypothetical account values and hypothetical expenses based on the Fund’s actual expense ratio and an assumed rate of return of 5% per year before expenses, which is not the Fund’s actual return. This information may not be used to estimate the actual ending account balance or expenses you paid for the period, but it can help you compare ongoing costs of investing in the Fund with those of other funds. To do so, compare this 5% hypothetical example for the class of shares you hold with the 5% hypothetical examples that appear in the shareholder reports of other funds.
Please note that expenses shown in the table are meant to highlight ongoing costs and do not reflect any transactional costs. Therefore, information under the heading “Hypothetical” is useful in comparing ongoing costs only, and will not help you compare total costs of owning different funds. In addition, if transactional costs were included, your total costs would have been higher.
| | | | | | | | | | |
| | | Actual | | Hypothetical | | |
| | | (actual return after expenses) | | (5% annual return before expenses) | | |
| | | | | | |
Beginning Account Value 2/1/19 | | Ending
Account
Value 7/31/19 | | Paid During
Period 2/1/19–7/31/191, 2 | | Ending
Account
Value 7/31/19 | | Paid During Period 2/1/19–7/31/191, 2 | | Net
Annualized
Expense
Ratio2 |
| | | | | | |
$1,000 | | $1,058.10 | | $5.10 | | $1,019.84 | | $5.01 | | 1.00% |
1. Expenses are equal to the annualized expense ratio for thesix-month period as indicated above—in the far right column—multiplied by the simple average account value over the period indicated, and then multiplied by 181/365 to reflect theone-half year period.
2. Reflects expenses after fee waivers and expense reimbursements. Does not include acquired fund fees and expenses.
| | | | |
| | | |
10 | | Annual Report | | ftinstitutional.com |
FRANKLIN GLOBAL TRUST
Consolidated Financial Highlights
Franklin Emerging Market Debt Opportunities Fund
| | | | | | | | | | | | | | | | | | | | |
| | | Year Ended July 31, |
| | | | | |
| | | 2019 | | 2018 | | 2017 | | 2016 | | 2015 | |
| | | | | |
Per share operating performance | | | | | | | | | | | | | | | | | | | | |
(for a share outstanding throughout the year) | | | | | | | | | | | | | | | | | | | | |
| | | | | |
Net asset value, beginning of year | | | $11.68 | | | | $11.68 | | | | $10.76 | | | | $10.72 | | | | $12.35 | |
| | | | | |
Income from investment operationsa: | | | | | | | | | | | | | | | | | | | | |
| | | | | |
Net investment incomeb | | | 0.97 | | | | 0.86 | | | | 0.83 | | | | 0.89 | | | | 0.87 | |
| | | | | |
Net realized and unrealized gains (losses) | | | (0.13 | ) | | | (0.36 | ) | | | 0.17 | | | | (0.26 | ) | | | (1.53 | ) |
| | | | | |
Total from investment operations | | | 0.84 | | | | 0.50 | | | | 1.00 | | | | 0.63 | | | | (0.66 | ) |
| | | | | |
Less distributions from: | | | | | | | | | | | | | | | | | | | | |
| | | | | |
Net investment income and net foreign currency gains | | | (0.86 | ) | | | (0.47 | ) | | | — | | | | (0.59 | ) | | | (0.91 | ) |
| | | | | |
Net realized gains | | | — | | | | (0.03 | ) | | | (0.08 | ) | | | — | | | | (0.06 | ) |
| | | | | |
Total distributions | | | (0.86 | ) | | | (0.50 | ) | | | (0.08 | ) | | | (0.59 | ) | | | (0.97 | ) |
| | | | | |
Net asset value, end of year | | | $11.66 | | | | $11.68 | | | | $11.68 | | | | $10.76 | | | | $10.72 | |
| | | | | |
Total return | | | 8.04% | | | | 4.04% | | | | 9.40% | | | | 6.41% | | | | (5.16)% | |
| | | | | |
Ratios to average net assets | | | | | | | | | | | | | | | | | | | | |
| | | | | |
Expenses before waiver and payments by affiliates | | | 1.11% | | | | 1.09% | | | | 1.07% | | | | 1.06% | | | | 1.05% | |
| | | | | |
Expenses net of waiver and payments by affiliatesc | | | 1.00% | | | | 1.00% | | | | 1.00% | | | | 1.00% | | | | 1.00% | |
| | | | | |
Net investment income | | | 8.58% | | | | 7.31% | | | | 7.43% | | | | 8.70% | | | | 7.78% | |
| | | | | |
Supplemental data | | | | | | | | | | | | | | | | | | | | |
| | | | | |
Net assets, end of year (000’s) | | | $387,888 | | | | $518,344 | | | | $514,406 | | | | $552,835 | | | | $713,575 | |
| | | | | |
Portfolio turnover rate | | | 14.29% | | | | 33.70% | | | | 29.45% | | | | 21.61% | | | | 17.56% | |
aThe amount shown for a share outstanding throughout the period may not correlate with the Consolidated Statement of Operations for the period due to the timing of sales and repurchases of the Fund’s shares in relation to income earned and/or fluctuating fair value of the investments of the Fund.
bBased on average daily shares outstanding.
cBenefit of expense reduction rounds to less than 0.01%.
| | | | |
| | | |
| ftinstitutional.com | | The accompanying notes are an integral part of these consolidated financial statements. | Annual Report | | 11 |
FRANKLIN GLOBAL TRUST
Consolidated Statement of Investments, July 31, 2019
Franklin Emerging Market Debt Opportunities Fund
| | | | | | | | | | | | | | | | | | | | |
| | | Country/
Organization | | Warrants | | | | Value |
| | | | |
Warrants 2.5% | | | | | | | | | | | | | | | | | | | | |
a,b,cCentral Bank of Nigeria, Reg S, wts., 11/15/20 | | | | Nigeria | | | | | 64,000 | | | | | | | | | $ | 2,656,000 | |
c,d,eGovernment of Ukraine, senior bond, Reg S, VRI, GDP Linked Security, 5/31/40 | | | | Ukraine | | | | | 6,000,000 | | | | | | | | | | 5,124,540 | |
a,dGovernment of Venezuela, Oil Value Recovery wts., 4/15/20 | | | | Venezuela | | | | | 925,920 | | | | | | | | | | 1,851,840 | |
| | | | | | | | | | | | | | | | | | | | |
| | | | |
Total Warrants (Cost $31,287,790) | | | | | | | | | | | | | | | | | | | 9,632,380 | |
| | | | | | | | | | | | | | | | | | | | |
| | | | |
| | | | | | | |
| Principal
Amount |
* | | | | | | | | | | |
| | | | | | | | | | | | | | | | | | | | |
| | | | |
Quasi-Sovereign and Corporate Bonds 26.7% | | | | | | | | | | | | | | | | | | | | |
| | | | |
Banks 5.6% | | | | | | | | | | | | | | | | | | | | |
fAkbank T.A.S., sub.bond, 144A, 6.797% to 4/27/23 FRN thereafter, 4/27/28 | | | | Turkey | | | | | 4,500,000 | | | | | | | | | | 3,858,750 | |
fBank of Georgia JSC, senior note, 144A, 11.00%, 6/01/20 | | | | Georgia | | | | | 15,050,000 | | | | | GEL | | | | | 5,083,806 | |
fFidelity Bank, senior note, 144A, 10.50%, 10/16/22 | | | | Nigeria | | | | | 3,800,000 | | | | | | | | | | 4,288,813 | |
b,c,gInternational Bank of Azerbaijan OJSC, senior note, Reg S, 5.625%, 6/11/19 | | | | Azerbaijan | | | | | 10,500,000 | | | | | | | | | | 8,386,875 | |
b,g,h,iSphynx Capital Markets PCC (National Investment Bank of Ghana), PTN, Reg S, zero cpn., 2/05/09 | | | | Ghana | | | | | 8,000,000 | | | | | | | | | | — | |
| | | | | | | | | | | | | | | | | | | | |
| | | | |
| | | | | | | | | | | | | | | | | | | 21,618,244 | |
| | | | | | | | | | | | | | | | | | | | |
| | | | |
Capital Markets 0.9% | | | | | | | | | | | | | | | | | | | | |
cDevelopment Bank of Kazakhstan JSC, senior note, Reg S, 9.50%, 12/14/20 | | | | Kazakhstan | | | | | 1,300,000,000 | | | | | KZT | | | | | 3,381,630 | |
| | | | | | | | | | | | | | | | | | | | |
| | | | |
Commercial Services & Supplies 1.2% | | | | | | | | | | | | | | | | | | | | |
cRed de Carreteras de Occidente Sapib de CV, senior secured bond, Reg S, 9.00%, 6/10/28 | | | | Mexico | | | | | 90,000,000 | | | | | MXN | | | | | 4,685,478 | |
| | | | | | | | | | | | | | | | | | | | |
| | | | |
Diversified Financial Services 2.9% | | | | | | | | | | | | | | | | | | | | |
b,hAstana Finance JSC, secured note, 144A, zero cpn., 12/22/24 | | | | Kazakhstan | | | | | 136,566 | | | | | | | | | | 1,366 | |
f,jFideicomiso PA Costera, senior secured bond, B, 144A, Index Linked, 6.25%, 1/15/34 | | | | Colombia | | | | | 11,038,656,609 | | | | | COP | | | | | 3,729,494 | |
fGeorgia Capital JSC, senior note, 144A, 6.125%, 3/09/24 | | | | Georgia | | | | | 4,092,000 | | | | | | | | | | 3,899,430 | |
fRio Oil Finance Trust, senior secured bond, 144A, 9.25%, 7/06/24 | | | | Brazil | | | | | 3,099,978 | | | | | | | | | | 3,483,600 | |
| | | | | | | | | | | | | | | | | | | | |
| | | | |
| | | | | | | | | | | | | | | | | | | 11,113,890 | |
| | | | | | | | | | | | | | | | | | | | |
| | | | |
Diversified Telecommunication Services 3.0% | | | | | | | | | | | | | | | | | | | | |
cEmpresa de Telecommunicaciones de Bogota SA, senior note, Reg S, 7.00%, 1/17/23 | | | | Colombia | | | | | 27,200,000,000 | | | | | COP | | | | | 7,742,135 | |
fMTN (Mauritius) Investments Ltd., senior bond, 144A, 4.755%, 11/11/24 | | | | South Africa | | | | | 3,000,000 | | | | | | | | | | 3,048,390 | |
kOi SA, senior note, PIK, 10.00%, 7/27/25 | | | | Brazil | | | | | 791,000 | | | | | | | | | | 801,599 | |
| | | | | | | | | | | | | | | | | | | | |
| | | | |
| | | | | | | | | | | | | | | | | | | 11,592,124 | |
| | | | | | | | | | | | | | | | | | | | |
| | | | |
Food Products 1.0% | | | | | | | | | | | | | | | | | | | | |
fMHP Lux SA, senior note, 144A, 6.95%, 4/03/26 | | | | Ukraine | | | | | 3,710,000 | | | | | | | | | | 3,818,722 | |
| | | | | | | | | | | | | | | | | | | | |
| | | | |
Industrial Conglomerates 0.9% | | | | | | | | | | | | | | | | | | | | |
fYasar Holdings SA, senior note, 144A, 8.875%, 5/06/20 | | | | Turkey | | | | | 4,400,000 | | | | | | | | | | 3,693,448 | |
| | | | | | | | | | | | | | | | | | | | |
| | | | |
| | | |
12 | | Annual Report | | ftinstitutional.com |
FRANKLIN GLOBAL TRUST
CONSOLIDATED STATEMENT OF INVESTMENTS
Franklin Emerging Market Debt Opportunities Fund(continued)
| | | | | | | | | | | | | | | | | | | | |
| | | |
| Country/
Organization |
| | |
| Principal
Amount |
* | | | | | | | | | Value | |
| | | |
Quasi-Sovereign and Corporate Bonds(continued) | | | | | | | | | | | | | | | | |
| | | | |
Metals & Mining 1.2% | | | | | | | | | | | | | | | | | | | | |
fPetra Diamonds U.S. Treasury PLC, secured note, second lien, 144A, 7.25%, 5/01/22 | | | | South Africa | | | | | 5,100,000 | | | | | | | | | $ | 4,794,000 | |
| | | | | | | | | | | | | | | | | | | | |
| | | | |
Multiline Retail 0.0%† | | | | | | | | | | | | | | | | | | | | |
b,h,kK2016470219 South Africa Ltd., senior secured note, 144A, PIK, 3.00%, 12/31/22 | | | | South Africa | | | | | 4,429,003 | | | | | | | | | | 5,523 | |
b,h,kK2016470260 South Africa Ltd., senior secured note, 144A, PIK, 25.00%, 12/31/22 | | | | South Africa | | | | | 1,052,294 | | | | | | | | | | 10,308 | |
| | | | | | | | | | | | | | | | | | | | |
| | | | |
| | | | | | | | | | | | | | | | | | | 15,831 | |
| | | | | | | | | | | | | | | | | | | | |
| | | | |
Municipal Bonds 4.5% | | | | | | | | | | | | | | | | | | | | |
cBogota Distrito Capital, senior bond, Reg S, 9.75%, 7/26/28 | | | | Colombia | | | | | 12,500,000,000 | | | | | COP | | | | | 4,252,796 | |
Province of Salta Argentina,
fsenior secured note, 144A, 9.50%, 3/16/22 | | | | Argentina | | | | | 1,457,100 | | | | | | | | | | 1,435,244 | |
csenior secured note, Reg S, 9.50%, 3/16/22 | | | | Argentina | | | | | 1,429,253 | | | | | | | | | | 1,407,814 | |
fProvincia de Neuquen Argentina, senior secured bond, 144A, 8.625%, 5/12/28 | | | | Argentina | | | | | 5,000,000 | | | | | | | | | | 5,099,550 | |
fProvincia de Tierra Del Fuego Argentina, senior secured bond, 144A, 8.95%, 4/17/27 | | | | Argentina | | | | | 2,755,000 | | | | | | | | | | 2,672,350 | |
fProvincia del Chubut Argentina, senior secured note, 144A, 7.75%, 7/26/26 | | | | Argentina | | | | | 2,912,000 | | | | | | | | | | 2,524,559 | |
| | | | | | | | | | | | | | | | | | | | |
| | | | |
| | | | | | | | | | | | | | | | | | | 17,392,313 | |
| | | | | | | | | | | | | | | | | | | | |
| | | | |
Oil, Gas & Consumable Fuels 4.0% | | | | | | | | | | | | | | | | | | | | |
f,lCitgo Holding Inc., senior secured note, 144A, 9.25%, 8/01/24 | | | | Venezuela | | | | | 1,000,000 | | | | | | | | | | 1,043,750 | |
fMedco Oak Tree Pte. Ltd., senior note, 144A, 7.375%, 5/14/26 | | | | Indonesia | | | | | 1,000,000 | | | | | | | | | | 1,011,345 | |
cMedco Platinum Road Pte. Ltd., first lien, Reg S, 6.75%, 1/30/25 | | | | Indonesia | | | | | 3,000,000 | | | | | | | | | | 2,996,835 | |
fTrinidad Petroleum Holdings Ltd., senior secured note, first lien, 144A, 9.75%, 6/15/26 | | | | Trinidad and Tobago | | | | | 6,075,000 | | | | | | | | | | 6,785,775 | |
fTullow Oil PLC, senior note, 144A, 7.00%, 3/01/25 | | | | Ghana | | | | | 3,600,000 | | | | | | | | | | 3,640,554 | |
| | | | | | | | | | | | | | | | | | | | |
| | | | |
| | | | | | | | | | | | | | | | | | | 15,478,259 | |
| | | | | | | | | | | | | | | | | | | | |
| | | | |
Real Estate Management & Development 1.0% | | | | | | | | | | | | | | | | | | | | |
fO1 Properties Finance PLC, senior note, 144A, 8.25%, 9/27/21 | | | | Russia | | | | | 5,400,000 | | | | | | | | | | 3,947,400 | |
| | | | | | | | | | | | | | | | | | | | |
| | | | |
Transportation Infrastructure 0.5% | | | | | | | | | | | | | | | | | | | | |
fMexico City Airport Trust, senior secured bond, first lien, 144A, 5.50%, 7/31/47 | | | | Mexico | | | | | 2,000,000 | | | | | | | | | | 1,993,620 | |
| | | | | | | | | | | | | | | | | | | | |
| | | | |
Total Quasi-Sovereign and Corporate Bonds (Cost $124,131,563) | | | | | | | | | | | | | | | | | | | 103,524,959 | |
| | | | | | | | | | | | | | | | | | | | |
| | | | |
mLoan Participations and Assignments 18.1% b,hDeutsche Bank AG (Government of Iraq), 2.571%, 1/01/28 | | | | Iraq | | | | | 707,110,191 | | | | | JPY | | | | | 4,458,105 | |
b,h,nDevelopment Bank of South Africa Ltd. (Government of Angola), | | | | | | | | | | | | | | | | | | | | |
Tranche 2, senior note, FRN, 8.548%,(6-month USD LIBOR + 6.25%), 12/20/23 | | | | Angola | | | | | 6,693,750 | | | | | | | | | | 6,457,058 | |
Tranche 3B, senior note, FRN, 8.548%,(6-month USD LIBOR + 6.25%), 12/20/23 | | | | Angola | | | | | 6,300,000 | | | | | | | | | | 6,077,231 | |
| | | | |
| | | |
| ftinstitutional.com | | Annual Report | | 13 |
FRANKLIN GLOBAL TRUST
CONSOLIDATED STATEMENT OF INVESTMENTS
Franklin Emerging Market Debt Opportunities Fund(continued)
| | | | | | | | | | | | | | | | |
| | |
| Country/
Organization |
| |
| Principal
Amount |
* | | | | | | | Value | |
| | | | |
mLoan Participations and Assignments(continued) | | | | | | | | | | | | | | | | |
fDilijan Finance BV, (Ardshinbank CJSC), senior note, 144A, 12.00%, 7/29/20 | | | Armenia | | | | 3,310,000 | | | | | | | $ | 3,442,400 | |
b,h,nEthiopian Railway Corp. (Government of Ethiopia), FRN, 6.562%,(6-month USD LIBOR + 3.75%), 8/02/21 | | | Ethiopia | | | | 5,166,667 | | | | | | | | 5,081,490 | |
a,b,h,k,oGlobal Distressed Alpha Fund III LP, PIK, 12.00%, Perpetual | | | United States | | | | 594,664 | | | | | | | | 593,928 | |
b,h,nGovernment of Iraq, Tranche A3, Sumitomo Corp. Loan, FRN, 0.563%,(6-month JPY LIBOR + 0.50%), 1/01/28 | | | Iraq | | | | 210,617,398 | | | | JPY | | | | 1,440,642 | |
fKyiv Finance PLC, (City of Kyiv), 144A, 7.50%, 12/15/22 | | | Ukraine | | | | 13,623,000 | | | | | | | | 12,907,792 | |
b,h,nMerrill Lynch & Co. Inc. (Government of Iraq), FRN, 0.563%,(6-month JPY LIBOR + 0.50%), 1/01/28 | | | Iraq | | | | 368,593,204 | | | | JPY | | | | 2,521,211 | |
b,g,hNK Debt Corp., | | | | | | | | | | | | | | | | |
144A, zero cpn., 3/12/20 | | | North Korea | | | | 4,250,000 | | | | DEM | | | | — | |
Reg S, zero cpn., 3/12/20 | | | North Korea | | | | 2,000,000 | | | | CHF | | | | — | |
Reg S, zero cpn., 3/12/20 | | | North Korea | | | | 18,000,000 | | | | DEM | | | | — | |
fOilflow SPV 1 DAC (Kurdistan Regional Government), secured note, 144A, 12.00%, 1/13/22 | | | Iraq | | | | 8,300,000 | | | | | | | | 8,776,918 | |
b,h,nSociete des Hydrocarbures du Tchad, Tranche B, FRN, 6.83%,(3-month USD LIBOR + 4.50%), 12/31/27 | | | Chad | | | | 15,452,591 | | | | | | | | 13,151,715 | |
fSSB No. 1 PLC (OJSC State Savings Bank of Ukraine), senior note, 144A, 9.625%, 3/20/25 | | | Ukraine | | | | 5,100,000 | | | | | | | | 5,382,361 | |
| | | | | | | | | | | | | | | | |
| | | | |
Total Loan Participations and Assignments
(Cost $73,964,188) | | | | | | | | | | | | | | | 70,290,851 | |
| | | | | | | | | | | | | | | | |
| | | | |
Foreign Government and Agency Securities 41.0% | | | | | | | | | | | | | | | | |
Argentina Treasury Bill, | | | | | | | | | | | | | | | | |
Strip, 4/30/20 | | | Argentina | | | | 18,300,000 | | | | ARS | | | | 483,810 | |
Strip, 7/31/20 | | | Argentina | | | | 241,000,000 | | | | ARS | | | | 5,389,061 | |
Banque Centrale de Tunisie International Bond, | | | | | | | | | | | | | | | | |
senior bond, 4.30%, 8/02/30 | | | Tunisia | | | | 610,000,000 | | | | JPY | | | | 4,618,120 | |
senior bond, 4.20%, 3/17/31 | | | Tunisia | | | | 680,000,000 | | | | JPY | | | | 5,106,701 | |
csenior note, Reg S, 5.75%, 1/30/25 | | | Tunisia | | | | 1,000,000 | | | | | | | | 931,680 | |
fDevelopment Bank of the Republic of Belarus JSC, senior note, 144A, 12.00%, 5/15/22 | | | Belarus | | | | 8,900,000 | | | | BYN | | | | 4,380,394 | |
fDominican Republic, senior note, 144A, 8.90%, 2/15/23 | | | Dominican Republic | | | | 185,000,000 | | | | DOP | | | | 3,674,956 | |
European Bank for Reconstruction and Development, | | | | | | | | | | | | | | | | |
senior note, 8.30%, 10/02/20 | | | Supranational | p | | | 8,000,000,000 | | | | IDR | | | | 579,562 | |
senior note, 6.85%, 6/21/21 | | | Supranational | p | | | 72,100,000,000 | | | | IDR | | | | 5,153,758 | |
fGovernment of the Dominican Republic, 144A, 9.75%, 6/05/26 | | | Dominican Republic | | | | 184,000,000 | | | | DOP | | | | 3,754,365 | |
Government of Argentina, | | | | | | | | | | | | | | | | |
senior note, 4.50%, 2/13/20 | | | Argentina | | | | 4,400,000 | | | | | | | | 3,941,850 | |
senior note, 5.875%, 1/11/28 | | | Argentina | | | | 4,000,000 | | | | | | | | 3,160,460 | |
c,nGovernment of Bosnia & Herzegovina, senior bond, B, Reg S, FRN, 0.50%,(6-month EUR LIBOR + 0.813%), 12/20/21 | | | Bosnia and Herzegovina | | | | 7,321,250 | | | | DEM | | | | 3,738,116 | |
fGovernment of Cameroon, senior note, 144A, 9.50%, 11/19/25 | | | Cameroon | | | | 3,500,000 | | | | | | | | 3,808,438 | |
Government of Egypt, | | | | | | | | | | | | | | | | |
16.75%, 9/06/19 | | | Egypt | | | | 47,500,000 | | | | EGP | | | | 2,864,537 | |
18.15%, 6/13/20 | | | Egypt | | | | 21,000,000 | | | | EGP | | | | 1,275,836 | |
| | | | |
| | | |
14 | | Annual Report | | ftinstitutional.com |
FRANKLIN GLOBAL TRUST
CONSOLIDATED STATEMENT OF INVESTMENTS
Franklin Emerging Market Debt Opportunities Fund(continued)
| | | | | | | | | | | | | | | | |
| | |
| Country/
Organization |
| |
| Principal
Amount |
* | | | | | | | Value | |
| | | | |
Foreign Government and Agency Securities(continued) | | | | | | | | | | | | | | | | |
cGovernment of El Salvador, senior bond, Reg S, 7.65%, 6/15/35 | | | El Salvador | | | | 10,000,000 | | | | | | | $ | 10,901,150 | |
fGovernment of Gabon, senior note, 144A, 6.95%, 6/16/25 | | | Gabon | | | | 5,900,000 | | | | | | | | 5,917,611 | |
Government of Ghana, | | | | | | | | | | | | | | | | |
24.75%, 7/19/21 | | | Ghana | | | | 7,300,000 | | | | GHS | | | | 1,491,606 | |
senior note, 18.25%, 7/25/22 | | | Ghana | | | | 20,000,000 | | | | GHS | | | | 3,662,481 | |
cGovernment of Iraq, Reg S, 5.80%, 1/15/28 | | | Iraq | | | | 4,000,000 | | | | | | | | 3,986,720 | |
Government of Mexico, senior note, M, 5.00%, 12/11/19 | | | Mexico | | | | 1,662,000 | q | | | MXN | | | | 8,579,430 | |
Government of South Africa, senior bond, 7.00%, 2/28/31 | | | South Africa | | | | 201,500,000 | | | | ZAR | | | | 11,878,648 | |
fGovernment of Suriname, senior note, 144A, 9.25%, 10/26/26 | | | Suriname | | | | 4,200,000 | | | | | | | | 3,927,097 | |
Government of Turkey, | | | | | | | | | | | | | | | | |
6.875%, 3/17/36 | | | Turkey | | | | 2,100,000 | | | | | | | | 2,062,715 | |
Strip, 9/16/20 | | | Turkey | | | | 49,500,000 | | | | TRY | | | | 7,470,077 | |
fGovernment of Ukraine, senior bond, 144A, 7.375%, 9/25/32 | | | Ukraine | | | | 4,500,000 | | | | | | | | 4,580,505 | |
jGovernment of Uruguay, senior bond, Index Linked, 3.70%, 6/26/37 | | | Uruguay | | | | 423,483,141 | | | | UYU | | | | 13,165,781 | |
c,gGovernment of Venezuela, | | | | | | | | | | | | | | | | |
senior bond, Reg S, 7.65%, 4/21/25 | | | Venezuela | | | | 7,500,000 | | | | | | | | 1,218,750 | |
senior bond, Reg S, 9.25%, 5/07/28 | | | Venezuela | | | | 4,000,000 | | | | | | | | 650,000 | |
Grenada Government International Bond, | | | | | | | | | | | | | | | | |
fsenior bond, 144A, 7.00%, 5/12/30 | | | Grenada | | | | 6,202,136 | | | | | | | | 5,977,309 | |
csenior bond, Reg S, 7.00%, 5/12/30 | | | Grenada | | | | 1,343,958 | | | | | | | | 1,295,240 | |
Kenya Infrastructure Bond, | | | | | | | | | | | | | | | | |
senior bond, 11.00%, 9/15/25 | | | Kenya | | | | 370,000,000 | | | | KES | | | | 3,688,063 | |
senior note, 12.50%, 5/12/25 | | | Kenya | | | | 294,200,000 | | | | KES | | | | 3,106,684 | |
f,gMozambique International Bond, senior note, 144A, 10.50%, 1/18/23 | | | Mozambique | | | | 6,300,000 | | | | | | | | 6,485,818 | |
fPeruvian Government International Bond, senior bond, 144A, 6.35%, 8/12/28 | | | Peru | | | | 11,300,000 | | | | PEN | | | | 3,924,092 | |
cSaderea DAC, senior secured bond, Reg S, 12.50%, 11/30/26 | | | Ghana | | | | 1,940,390 | | | | | | | | 2,151,407 | |
| | | | | | | | | | | | | | | | |
| | | | |
Total Foreign Government and Agency Securities
(Cost $167,332,986) | | | | | | | | | | | | | | | 158,982,828 | |
| | | | | | | | | | | | | | | | |
| | | | |
| | | | | | Shares | | | | | | | |
| | | | | | | | | | | | | | | | |
Common Stocks 0.0%† | | | | | | | | | | | | | | | | |
b,d,hAstana Finance JSC, GDR, 144A | | | Kazakhstan | | | | 193,625 | | | | | | | | — | |
b,d,hK2016470219 South Africa Ltd., A | | | South Africa | | | | 55,882,058 | | | | | | | | 38,890 | |
b,d,hK2016470219 South Africa Ltd., B | | | South Africa | | | | 5,561,052 | | | | | | | | 3,870 | |
| | | | | | | | | | | | | | | | |
| | | | |
Total Common Stocks (Cost $433,379) | | | | | | | | | | | | | | | 42,760 | |
| | | | | | | | | | | | | | | | |
| | | | |
| | | |
| ftinstitutional.com | | Annual Report | | 15 |
FRANKLIN GLOBAL TRUST
CONSOLIDATED STATEMENT OF INVESTMENTS
Franklin Emerging Market Debt Opportunities Fund(continued)
| | | | | | | | | | | | |
| | | Country/
Organization | | | Units | | | Value | |
| | | |
Private Limited Partnership Fund (Cost $4,600,000) 0.0% | | | | | | | | | | | | |
Diversified Financial Services 0.0% | | | | | | | | | | | | |
a,b,d,h,rGlobal Distressed Alpha Fund III LP | | | United States | | | | 4,424,861 | | | $ | — | |
| | | | | | | | | | | | |
| | | |
Total Investments before Short Term Investments (Cost $401,749,906) | | | | | | | | | | | 342,473,778 | |
| | | | | | | | | | | | |
| | | |
| | | | | | Shares | | | | |
Short Term Investments (Cost $32,128,458) 8.3% | | | | | | | | | | | | |
| | | |
Money Market Funds 8.3% | | | | | | | | | | | | |
s,tInstitutional Fiduciary Trust Money Market Portfolio, 2.00% | | | United States | | | | 32,128,458 | | | | 32,128,458 | |
| | | | | | | | | | | | |
Total Investments (Cost $433,878,364) 96.6% | | | | | | | | | | | 374,602,236 | |
Other Assets, less Liabilities 3.4% | | | | | | | | | | | 13,285,845 | |
| | | | | | | | | | | | |
| | | |
Net Assets 100.0% | | | | | | | | | | $ | 387,888,081 | |
| | | | | | | | | | | | |
†Rounds to less than 0.1% of net assets.
*The principal amount is stated in U.S. dollars unless otherwise indicated.
aThe security is owned by Alternative Strategies (FT) Ltd., a wholly-owned subsidiary of the Fund. See Note 1(f).
bFair valued using significant unobservable inputs. See Note 12 regarding fair value measurements.
cSecurity was purchased pursuant to Regulation S under the Securities Act of 1933, which exempts from registration securities offered and sold outside of the United States. Such a security cannot be sold in the United States without either an effective registration statement filed pursuant to the Securities Act of 1933, or pursuant to an exemption from registration. These securities have been deemed liquid under guidelines approved by the Trust’s Board of Trustees. At July 31, 2019, the aggregate value of these securities was $65,507,166, representing 16.9% of net assets.
dNon-income producing.
eThe principal represents the notional amount. See Note 1(d) regarding value recovery instruments.
fSecurity was purchased pursuant to Rule 144A under the Securities Act of 1933 and may be sold in transactions exempt from registration only to qualified institutional buyers or in a public offering registered under the Securities Act of 1933. These securities have been deemed liquid under guidelines approved by the Trust’s Board of Trustees. At July 31, 2019, the aggregate value of these securities was $146,792,656, representing 37.8% of net assets.
gSee Note 7 regarding defaulted securities.
hSee Note 9 regarding restricted securities.
iRepresents claims that have been filed with a Ghanaian court against National Investments Bank of Ghana.
jPrincipal amount of security is adjusted for inflation. See Note 1(h).
kIncome may be received in additional securities and/or cash.
lSecurity purchased on a when-issued basis. See Note 1(c).
mSee Note 1(e) regarding loan participation and assignments.
nThe coupon rate shown represents the rate at period end.
oPerpetual security with no stated maturity date.
pA supranational organization is an entity formed by two or more central governments through international treaties.
qPrincipal amount is stated in 100 Mexican Peso Units.
rThe Global Distressed Alpha Fund III LP is a fund focused on the purchase of and the recovery on private distressed commercial, sovereign and sovereign-related debt claims around the world, principally in Africa and Asia.
sSee Note 3(d) regarding investments in affiliated management investment companies.
tThe rate shown is the annualizedseven-day effective yield at period end.
| | | | |
| | | |
16 | | Annual Report | | ftinstitutional.com |
FRANKLIN GLOBAL TRUST
CONSOLIDATED STATEMENT OF INVESTMENTS
Franklin Emerging Market Debt Opportunities Fund(continued)
At July 31, 2019, the Fund had the following forward exchange contracts outstanding. See Note 1(d).
Forward Exchange Contracts
| | | | | | | | | | | | | | | | | | | | | | | | | | |
Currency | | | Counterparty | a | | Type | | | Quantity | | |
| Contract
Amount |
| |
| Settlement
Date |
| |
| Unrealized
Appreciation |
| |
| Unrealized
Depreciation |
|
OTC Forward Exchange Contracts | | | | | | | | | | | | | | | | | | | | | | | |
Euro | | | CITI | | | Sell | | | 2,200,000 | | | | $2,506,526 | | | | 9/24/19 | | | | $ 61,123 | | | | $ — | |
Euro | | | RBCCM | | | Sell | | | 1,900,000 | | | | 2,161,440 | | | | 9/24/19 | | | | 49,501 | | | | — | |
Japanese Yen | | | CITI | | | Sell | | | 630,000,000 | | | | 5,850,668 | | | | 9/24/19 | | | | 37,063 | | | | — | |
Japanese Yen | | | MSCO | | | Sell | | | 700,000,000 | | | | 6,500,530 | | | | 9/24/19 | | | | 40,968 | | | | — | |
Japanese Yen | | | RBCCM | | | Sell | | | 700,000,000 | | | | 6,499,717 | | | | 9/24/19 | | | | 40,154 | | | | — | |
| | | | | | | | | | | | | | | | | | | | | | |
Total Forward Exchange Contracts | | | | | | | | | | | | | | | | | | $228,809 | | | | $ — | |
| | | | | | | | | | | | | | | | | | | | | | |
Net unrealized appreciation (depreciation) | | | | | | | | | | | | | | | $228,809 | | | | | |
| | | | | | | | | | | | | | | | | | | | | | | | | | |
aMay be comprised of multiple contracts with the same counterparty, currency and settlement date.
See Note 10 regarding other derivative information.
See Abbreviations on page 34.
| | | | |
| | | |
| ftinstitutional.com | | The accompanying notes are an integral part of these consolidated financial statements. | Annual Report | | 17 |
FRANKLIN GLOBAL TRUST
CONSOLIDATED FINANCIAL STATEMENTS
Consolidated Statement of Assets and Liabilities
July 31, 2019
Franklin Emerging Market Debt Opportunities Fund
| | | | |
| |
Assets: | | | | |
| |
Investments in securities: | | | | |
| |
Cost - Unaffiliated issuers | | | $401,749,906 | |
| |
Cost -Non-controlled affiliates (Note 3d) | | | 32,128,458 | |
| | | | |
| |
Value - Unaffiliated issuers | | | $342,473,778 | |
| |
Value -Non-controlled affiliates (Note 3d) | | | 32,128,458 | |
| |
Cash | | | 2,074,307 | |
| |
Foreign currency, at value (cost $930,936) | | | 930,269 | |
| |
Receivables: | | | | |
| |
Capital shares sold | | | 6,715,592 | |
| |
Interest | | | 5,150,052 | |
| |
Unrealized appreciation on OTC forward exchange contracts | | | 228,809 | |
| |
Other assets | | | 240 | |
| | | | |
| |
Total assets | | | 389,701,505 | |
| | | | |
| |
Liabilities: | | | | |
| |
Payables: | | | | |
| |
Investment securities purchased | | | 999,261 | |
| |
Capital shares redeemed | | | 321,221 | |
| |
Management fees | | | 312,626 | |
| |
Transfer agent fees | | | 9,417 | |
| |
Deferred tax | | | 22,655 | |
| |
Accrued expenses and other liabilities | | | 148,244 | |
| | | | |
| |
Total liabilities | | | 1,813,424 | |
| | | | |
| |
Net assets, at value | | | $387,888,081 | |
| | | | |
| |
Net assets consist of: | | | | |
| |
Paid-in capital | | | $457,492,799 | |
| |
Total distributable earnings (loss) | | | (69,604,718 | ) |
| | | | |
| |
Net assets, at value | | | $387,888,081 | |
| | | | |
Shares outstanding | | | 33,262,157 | |
| | | | |
| |
Net asset value and maximum offering price per share | | | $11.66 | |
| | | | |
| | | | |
| | | |
18 | | Annual Report | The accompanying notes are an integral part of these consolidated financial statements. | | ftinstitutional.com |
FRANKLIN GLOBAL TRUST
CONSOLIDATED FINANCIAL STATEMENTS
Consolidated Statement of Operations
for the year ended July 31, 2019
Franklin Emerging Market Debt Opportunities Fund
| | | | |
Investment income: | | | | |
| |
Dividends: | | | | |
| |
Unaffiliated issuers | | $ | 1,920,002 | |
| |
Non-controlled affiliates (Note 3d) | | | 447,094 | |
| |
Interest: (net of foreign taxes)~ | | | | |
| |
Unaffiliated issuers | | | 39,354,095 | |
| | | | |
| |
Total investment income | | | 41,721,191 | |
| | | | |
| |
Expenses: | | | | |
| |
Management fees (Note 3a) | | | 4,353,519 | |
| |
Transfer agent fees (Note 3c) | | | 117,092 | |
| |
Custodian fees (Note 4) | | | 123,978 | |
| |
Reports to shareholders | | | 18,301 | |
| |
Registration and filing fees | | | 45,506 | |
| |
Professional fees | | | 128,999 | |
| |
Trustees’ fees and expenses | | | 22,134 | |
| |
Other | | | 24,969 | |
| | | | |
| |
Total expenses | | | 4,834,498 | |
| |
Expense reductions (Note 4) | | | (1,192 | ) |
| |
Expenses waived/paid by affiliates (Note 3d and 3e) | | | (482,043 | ) |
| | | | |
| |
Net expenses | | | 4,351,263 | |
| | | | |
| |
Net investment income | | | 37,369,928 | |
| | | | |
| |
Realized and unrealized gains (losses): | | | | |
| |
Net realized gain (loss) from: | | | | |
| |
Investments:# | | | | |
| |
Unaffiliated issuers | | | (19,161,919 | ) |
| |
Foreign currency transactions | | | (496,999 | ) |
| |
Forward exchange contracts | | | 697,632 | |
| | | | |
| |
Net realized gain (loss) | | | (18,961,286 | ) |
| | | | |
| |
Net change in unrealized appreciation (depreciation) on: | | | | |
| |
Investments: | | | | |
| |
Unaffiliated issuers | | | 9,680,969 | |
| |
Translation of other assets and liabilities denominated in foreign currencies | | | 30,919 | |
| |
Forward exchange contracts | | | (257,575 | ) |
| |
Change in deferred taxes on unrealized appreciation | | | 1,999 | |
| | | | |
| |
Net change in unrealized appreciation (depreciation) | | | 9,456,312 | |
| | | | |
| |
Net realized and unrealized gain (loss) | | | (9,504,974 | ) |
| | | | |
| |
Net increase (decrease) in net assets resulting from operations | | $ | 27,864,954 | |
| | | | |
| |
~Foreign taxes withheld on interest | | $ | 189,137 | |
| |
#Net of foreign taxes | | $ | 38,378 | |
| | | | |
| | | |
| ftinstitutional.com | | The accompanying notes are an integral part of these consolidated financial statements. | Annual Report | | 19 |
FRANKLIN GLOBAL TRUST
CONSOLIDATED FINANCIAL STATEMENTS
Consolidated Statements of Changes in Net Assets
Franklin Emerging Market Debt Opportunities Fund
| | | | | | | | |
| | | Year Ended July 31, | |
| | | 2019 | | | 2018 | |
Increase (decrease) in net assets: | | | | | | | | |
| | |
Operations: | | | | | | | | |
| | |
Net investment income | | | $ 37,369,928 | | | | $ 38,915,704 | |
Net realized gain (loss) | | | (18,961,286 | ) | | | (3,304,995 | ) |
Net change in unrealized appreciation (depreciation) | | | 9,456,312 | | | | (14,304,162 | ) |
| | | | |
| | |
Net increase (decrease) in net assets resulting from operations | | | 27,864,954 | | | | 21,306,547 | |
| | | | |
| | |
Distributions to shareholders (Note 1h) | | | (38,242,212 | ) | | | (22,037,468 | ) |
| | | | |
| | |
Capital share transactions (Note 2) | | | (120,078,898 | ) | | | 4,669,126 | |
| | | | |
| | |
Net increase (decrease) in net assets | | | (130,456,156 | ) | | | 3,938,205 | |
Net assets: | | | | | | | | |
| | |
Beginning of year | | | 518,344,237 | | | | 514,406,032 | |
| | | | |
| | |
End of year (Note 1h) | | | $ 387,888,081 | | | | $518,344,237 | |
| | | | |
| | | | |
| | | |
20 | | Annual Report | The accompanying notes are an integral part of these consolidated financial statements. | | ftinstitutional.com |
FRANKLIN GLOBAL TRUST
CONSOLIDATED FINANCIAL STATEMENTS
Consolidated Statement of Cash Flows
for the year ended July 31, 2019
Franklin Emerging Market Debt Opportunities Fund
| | | | |
| |
Cash flow from operating activities: | | | | |
| |
Dividends, interest and other income received | | | 36,593,546 | |
| |
Operating expenses paid | | | (4,367,441 | ) |
| |
Purchases of long-term investments | | | (57,454,825 | ) |
| |
Cash on deposit with brokers | | | (300,000 | ) |
| |
Realized gain on foreign currency transactions | | | 200,633 | |
| |
Sales and maturities of long-term investments | | | 195,710,326 | |
| |
Net purchases of short-term investments | | | (11,764,071 | ) |
| |
| | | | |
| |
Cash provided - operating activities | | | 158,618,168 | |
| | | | |
| |
Cash flow from financing activities: | | | | |
| |
Proceeds from shares sold | | | 230,242,055 | |
| |
Payment of shares redeemed | | | (394,265,157 | ) |
| |
Cash distributions to shareholders | | | (418,197 | ) |
| | | | |
| |
Cash used - financing activities | | | (164,441,299 | ) |
| | | | |
| |
Net increase (decrease) in cash | | | (5,823,131 | ) |
| |
Cash, restricted cash and foreign currency at beginning of period | | | 8,823,091 | |
| |
Effect of exchange rate changes on foreign currency | | | 4,616 | |
| | | | |
| |
Cash and foreign currency at end of period | | | 3,004,576 | |
| | | | |
| |
| Reconciliation of Net Increase (Decrease) in Net Assets resulting from Operating Activities to Net Cash Provided by Operating Activities | | | | |
| |
for the year ended July 31, 2019 | | | | |
| |
Net increase (decrease) in net assets resulting from operating activities | | $ | 27,864,954 | |
| |
Adjustments to reconcile net increase (decrease) in net assets resulting from operating activities to net cash provided by operating activities: | | | | |
| |
Net amortization income | | | (4,930,693 | ) |
| |
Reinvested dividends fromnon-controlled affiliates | | | (447,094 | ) |
| |
Interest received in the form of securities | | | (1,559,963 | ) |
| |
Decrease in dividends and interest receivable and other assets | | | 2,700,434 | |
| |
Decrease in payables to affiliates, accrued expenses, and other liabilities | | | (16,178 | ) |
| |
Decrease in payable for investments purchased | | | (34,509 | ) |
| |
Decrease in cost of investments | | | 144,797,529 | |
| |
Decrease in unrealized depreciation | | | (9,456,312 | ) |
| |
Net decrease in deposits with brokers | | | (300,000 | ) |
| | | | |
| |
Net cash provided by operating activities | | $ | 158,618,168 | |
| | | | |
| |
Non cash financing activities - reinvestment of dividends | | $ | 37,824,015 | |
| | | | |
| | | | |
| | | |
| ftinstitutional.com | | The accompanying notes are an integral part of these consolidated financial statements. | Annual Report | | 21 |
FRANKLIN GLOBAL TRUST
Notes to Consolidated Financial Statements
Franklin Emerging Market Debt Opportunities Fund
1. Organization and Significant Accounting Policies
Franklin Global Trust (Trust) is registered under the Investment Company Act of 1940 (1940 Act) as anopen-end management investment company, consisting of four separate funds and applies the specialized accounting and reporting guidance in U.S. Generally Accepted Accounting Principles (U.S. GAAP). Franklin Emerging Market Debt Opportunities Fund (Fund) is included in this report.
The following summarizes the Fund’s significant accounting policies.
a. Financial Instrument Valuation
The Fund’s investments in financial instruments are carried at fair value daily. Fair value is the price that would be received to sell an asset or paid to transfer a liability in an orderly transaction between market participants on the measurement date. The Fund calculates the net asset value (NAV) per share each business day as of 4 p.m. Eastern time or the regularly scheduled close of the New York Stock Exchange (NYSE), whichever is earlier. Under compliance policies and procedures approved by the Trust’s Board of Trustees (the Board), the Fund’s administrator has responsibility for oversight of valuation, including leading the cross-functional Valuation Committee (VC). The Fund may utilize independent pricing services, quotations from securities and financial instrument dealers, and other market sources to determine fair value.
Equity securities listed on an exchange or on the NASDAQ National Market System are valued at the last quoted sale price or the official closing price of the day, respectively. Foreign equity securities are valued as of the close of trading on the foreign stock exchange on which the security is primarily traded, or as of 4 p.m. Eastern time. The value is then converted into its U.S. dollar equivalent at the foreign exchange rate in effect at 4 p.m. Eastern time on the day that the value of the security is determined.Over-the-counter (OTC) securities are valued within the range of the most recent quoted bid and ask prices. Securities that trade in multiple markets or on multiple exchanges are valued according to the broadest and most representative market. Certain equity securities are valued based upon fundamental characteristics or relationships to similar securities.
Debt securities generally trade in the OTC market rather than on a securities exchange. The Fund’s pricing services use multiple valuation techniques to determine fair value. In
instances where sufficient market activity exists, the pricing services may utilize a market-based approach through which quotes from market makers are used to determine fair value. In instances where sufficient market activity may not exist or is limited, the pricing services also utilize proprietary valuation models which may consider market characteristics such as benchmark yield curves, credit spreads, estimated default rates, anticipated market interest rate volatility, coupon rates, anticipated timing of principal repayments, underlying collateral, and other unique security features in order to estimate the relevant cash flows, which are then discounted to calculate the fair value. Securities denominated in a foreign currency are converted into their U.S. dollar equivalent at the foreign exchange rate in effect at 4 p.m. Eastern time on the date that the values of the foreign debt securities are determined.
Investments inopen-end mutual funds are valued at the closing NAV.
Certain derivative financial instruments trade in the OTC market. The Fund’s pricing services use various techniques including industry standard option pricing models and proprietary discounted cash flow models to determine the fair value of those instruments. The Fund’s net benefit or obligation under the derivative contract, as measured by the fair value of the contract, is included in net assets.
The Fund has procedures to determine the fair value of financial instruments for which market prices are not reliable or readily available. Under these procedures, the Fund primarily employs a market-based approach which may use related or comparable assets or liabilities, recent transactions, market multiples, book values, and other relevant information for the investment to determine the fair value of the investment. An income-based valuation approach may also be used in which the anticipated future cash flows of the investment are discounted to calculate fair value. Discounts may also be applied due to the nature or duration of any restrictions on the disposition of the investments. Due to the inherent uncertainty of valuations of such investments, the fair values may differ significantly from the values that would have been used had an active market existed.
Trading in securities on foreign securities stock exchanges and OTC markets may be completed before 4 p.m. Eastern time. In addition, trading in certain foreign markets may not take place on every Fund’s business day. Occasionally, events occur between the time at which trading in a foreign
| | | | |
| | | |
22 | | Annual Report | | ftinstitutional.com |
FRANKLIN GLOBAL TRUST
NOTES TO CONSOLIDATED FINANCIAL STATEMENTS
Franklin Emerging Market Debt Opportunities Fund(continued)
security is completed and 4 p.m. Eastern time that might call into question the reliability of the value of a portfolio security held by the Fund. As a result, differences may arise between the value of the Fund’s portfolio securities as determined at the foreign market close and the latest indications of value at 4 p.m. Eastern time. In order to minimize the potential for these differences, the VC monitors price movements following the close of trading in foreign stock markets through a series of country specific market proxies (such as baskets of American Depositary Receipts, futures contracts and exchange traded funds). These price movements are measured against established trigger thresholds for each specific market proxy to assist in determining if an event has occurred that may call into question the reliability of the values of the foreign securities held by the Fund. If such an event occurs, the securities may be valued using fair value procedures, which may include the use of independent pricing services.
When the last day of the reporting period is anon-business day, certain foreign markets may be open on those days that the Fund’s NAV is not calculated, which could result in differences between the value of the Fund’s portfolio securities on the last business day and the last calendar day of the reporting period. Any significant security valuation changes due to an open foreign market are adjusted and reflected by the Fund for financial reporting purposes.
b. Foreign Currency Translation
Portfolio securities and other assets and liabilities denominated in foreign currencies are translated into U.S. dollars based on the exchange rate of such currencies against U.S. dollars on the date of valuation. The Fund may enter into foreign currency exchange contracts to facilitate transactions denominated in a foreign currency. Purchases and sales of securities, income and expense items denominated in foreign currencies are translated into U.S. dollars at the exchange rate in effect on the transaction date. Portfolio securities and assets and liabilities denominated in foreign currencies contain risks that those currencies will decline in value relative to the U.S. dollar. Occasionally, events may impact the availability or reliability of foreign exchange rates used to convert the U.S. dollar equivalent value. If such an event occurs, the foreign exchange rate will be valued at fair value using procedures established and approved by the Board.
The Fund does not separately report the effect of changes in foreign exchange rates from changes in market prices on securities held. Such changes are included in net realized and unrealized gain or loss from investments in the Consolidated Statement of Operations.
Realized foreign exchange gains or losses arise from sales of foreign currencies, currency gains or losses realized between the trade and settlement dates on securities transactions and the difference between the recorded amounts of dividends, interest, and foreign withholding taxes and the U.S. dollar equivalent of the amounts actually received or paid. Net unrealized foreign exchange gains and losses arise from changes in foreign exchange rates on foreign denominated assets and liabilities other than investments in securities held at the end of the reporting period.
c. Securities Purchased on a When-Issued Basis
The Fund purchases securities on a when-issued basis, with payment and delivery scheduled for a future date. These transactions are subject to market fluctuations and are subject to the risk that the value at delivery may be more or less than the trade date purchase price. Although the Fund will generally purchase these securities with the intention of holding the securities, it may sell the securities before the settlement date. Sufficient assets have been segregated for these securities.
d. Derivative Financial Instruments
The Fund invested in derivative financial instruments in order to manage risk or gain exposure to various other investments or markets. Derivatives are financial contracts based on an underlying or notional amount, require no initial investment or an initial net investment that is smaller than would normally be required to have a similar response to changes in market factors, and require or permit net settlement. Derivatives contain various risks including the potential inability of the counterparty to fulfill their obligations under the terms of the contract, the potential for an illiquid secondary market, and/or the potential for market movements which expose the Fund to gains or losses in excess of the amounts shown in the Consolidated Statement of Assets and Liabilities. Realized gain and loss and unrealized appreciation and depreciation on these contracts for the period are included in the Consolidated Statement of Operations.
| | | | |
| | | |
| ftinstitutional.com | | Annual Report | | 23 |
FRANKLIN GLOBAL TRUST
NOTES TO CONSOLIDATED FINANCIAL STATEMENTS
Franklin Emerging Market Debt Opportunities Fund(continued)
1. Organization and Significant Accounting Policies (continued)
d. Derivative Financial Instruments(continued)
Derivative counterparty credit risk is managed through a formal evaluation of the creditworthiness of all potential counterparties. The Fund attempts to reduce its exposure to counterparty credit risk on OTC derivatives, whenever possible, by entering into International Swaps and Derivatives Association (ISDA) master agreements with certain counterparties. These agreements contain various provisions, including but not limited to collateral requirements, events of default, or early termination. Termination events applicable to the counterparty include certain deteriorations in the credit quality of the counterparty. Termination events applicable to the Fund include failure of the Fund to maintain certain net asset levels and/or limit the decline in net assets over various periods of time. In the event of default or early termination, the ISDA master agreement gives thenon-defaulting party the right to net andclose-out all transactions traded, whether or not arising under the ISDA agreement, to one net amount payable by one counterparty to the other. However, absent an event of default or early termination, OTC derivative assets and liabilities are presented gross and not offset in the Consolidated Statement of Assets and Liabilities. Early termination by the counterparty may result in an immediate payment by the Fund of any net liability owed to that counterparty under the ISDA agreement. At July 31, 2019, the Fund had no OTC derivatives in a net liability position for such contracts.
Collateral requirements differ by type of derivative. Collateral terms are contract specific for OTC derivatives. For OTC derivatives traded under an ISDA master agreement, posting of collateral is required by either the Fund or the applicable counterparty if the total net exposure of all OTC derivatives with the applicable counterparty exceeds the minimum transfer amount, which typically ranges from $100,000 to $250,000, and can vary depending on the counterparty and the type of the agreement. Generally, collateral is determined at the close of Fund business each day and any additional collateral required due to changes in derivative values may be delivered by the Fund or the counterparty the next business day, or within a few business days. Collateral pledged and/or received by the Fund, if any, is held in segregated accounts with the Fund’s custodian/counterparty broker and can be in the form of cash and/or securities. Unrestricted cash may be invested according to the Fund’s investment objectives. To the
extent that the amounts due to the Fund from its counterparties are not subject to collateralization or are not fully collateralized, the Fund bears the risk of loss from counterpartynon-performance.
The Fund entered into OTC forward exchange contracts primarily to manage and/or gain exposure to certain foreign currencies. A forward exchange contract is an agreement between the Fund and a counterparty to buy or sell a foreign currency at a specific exchange rate on a future date.
The Fund invests in value recovery instruments (VRI) primarily to gain exposure to economic growth. Periodic payments from VRI are dependent on established benchmarks for underlying variables. VRI has a notional amount, which is used to calculate amounts of payments to holders. Payments are recorded upon receipt as realized gains in the Consolidated Statement of Operations. The risks of investing in VRI include growth risk, liquidity, and the potential loss of investment.
See Note 10 regarding other derivative information.
e. Loan Participations and Assignments
The Fund may invest in debt instruments which are interests in amounts owed to lenders or lending syndicates by corporate, governmental, or other borrowers. The Fund’s investments in loans may be in the form of participations in loans or assignments of all or portion of loans from third parties. A loan is often administered by a bank or other financial institution (the Lender) that acts as agent for all holders. The agent administers the terms of the loan, as specified in the loan agreement. The Fund may invest in multiple series or tranches of a loan, which may have varying terms and carry different associated risks. When investing in a loan participation, a Fund has the right to receive payments of principal, interest and any fees only from the lender selling the loan and only upon receipt of payments from the borrower. The Fund generally has no right to enforce compliance with the terms of the loan agreement with the borrower. As a result, the Fund may be subject to credit risk of both the borrower and the lender that is selling the loan. When the Fund purchases assignments from lenders it acquires direct rights against the borrower of the loan.
| | | | |
| | | |
24 | | Annual Report | | ftinstitutional.com |
FRANKLIN GLOBAL TRUST
NOTES TO CONSOLIDATED FINANCIAL STATEMENTS
Franklin Emerging Market Debt Opportunities Fund(continued)
f. Investments in Alternative Strategies (FT) Ltd. (FT Subsidiary)
The Fund invests in certain financial instruments, warrants or commodities through its investments in FT Subsidiary. FT Subsidiary is a Cayman Islands exempted company with limited liability, is a wholly-owned subsidiary of the Fund, and is able to invest in certain financial instruments consistent with the investment objective of the Fund. At July 31, 2019, FT Subsidiary’s investments as well as any other assets and liabilities of FT Subsidiary are reflected in the Fund’s Consolidated Statement of Investments and Consolidated Statement of Assets and Liabilities. All intercompany transactions and balances have been eliminated. At July 31, 2019, the net assets of FT Subsidiary were $7,173,129, representing 1.8% of the Fund’s consolidated net assets. The Fund’s investment in FT Subsidiary is limited to 25% of consolidated assets.
g. Income and Deferred Taxes
It is the Fund’s policy to qualify as a regulated investment company under the Internal Revenue Code. The Fund intends to distribute to shareholders substantially all of its taxable income and net realized gains to relieve it from federal income and excise taxes. As a result, no provision for U.S. federal income taxes is required.
The Fund may be subject to foreign taxation related to income received, capital gains on the sale of securities and certain foreign currency transactions in the foreign jurisdictions in which it invests. Foreign taxes, if any, are recorded based on the tax regulations and rates that exist in the foreign markets in which the Fund invests. When a capital gain tax is determined to apply, the Fund records an estimated deferred tax liability in an amount that would be payable if the securities were disposed of on the valuation date.
The Fund may recognize an income tax liability related to its uncertain tax positions under U.S. GAAP when the uncertain tax position has a less than 50% probability that it will be sustained upon examination by the tax authorities based on its technical merits. As of July 31, 2019, the Fund has determined that no tax liability is required in its financial statements related to uncertain tax positions for any open tax years (or expected to be taken in future tax years). Open tax years are those that remain subject to examination and are based on the statute of limitations in each jurisdiction in which the Fund invests.
h. Security Transactions, Investment Income, Expenses and Distributions
Security transactions are accounted for on trade date. Realized gains and losses on security transactions are determined on a specific identification basis. Interest income and estimated expenses are accrued daily. Amortization of premium and accretion of discount on debt securities are included in interest income. Dividend income is recorded on theex-dividend date except for certain dividends from securities where the dividend rate is not available. In such cases, the dividend is recorded as soon as the information is received by the Fund. Distributions to shareholders are recorded on theex-dividend date. Distributable earnings are determined according to income tax regulations (tax basis) and may differ from earnings recorded in accordance with U.S. GAAP. These differences may be permanent or temporary. Permanent differences are reclassified among capital accounts to reflect their tax character. These reclassifications have no impact on net assets or the results of operations. Temporary differences are not reclassified, as they may reverse in subsequent periods.*
Common expenses incurred by the Trust are allocated among the Funds based on the ratio of net assets of each Fund to the combined net assets of the Trust or based on the ratio of number of shareholders of each Fund to the combined number of shareholders of the Trust. Fund specific expenses are charged directly to the Fund that incurred the expense.
Inflation-indexed bonds are adjusted for inflation through periodic increases or decreases in the security’s interest accruals, face amount, or principal redemption value, by amounts corresponding to the rate of inflation as measured by an index. Any increase or decrease in the face amount or principal redemption value will be included as interest income in the Consolidated Statement of Operations.
i. Accounting Estimates
The preparation of financial statements in accordance with U.S. GAAP requires management to make estimates and assumptions that affect the reported amounts of assets and liabilities at the date of the financial statements and the amounts of income and expenses during the reporting period. Actual results could differ from those estimates.
| | | | |
| | | |
| ftinstitutional.com | | Annual Report | | 25 |
FRANKLIN GLOBAL TRUST
NOTES TO CONSOLIDATED FINANCIAL STATEMENTS
Franklin Emerging Market Debt Opportunities Fund(continued)
1. Organization and Significant Accounting
Policies(continued)
j. Guarantees and Indemnifications
Under the Trust’s organizational documents, its officers and trustees are indemnified by the Trust against certain liabilities arising out of the performance of their duties to the Trust.
Additionally, in the normal course of business, the Trust, on behalf of the Fund, enters into contracts with service providers that contain general indemnification clauses. The Trust’s maximum exposure under these arrangements is unknown as this would involve future claims that may be made against the Trust that have not yet occurred. Currently, the Trust expects the risk of loss to be remote.
*Effective during the current reporting period, it is no longer required to present certain line items in the Consolidated Statements of Changes in Net Assets. The below prior period amounts affected by this change are shown as they were in the prior year Consolidated Statements of Changes in Net Assets.
For the year ended July 31, 2018, distributions to shareholders were as follows:
| | | | |
Net investment income | | $ | (20,540,417 | ) |
Net realized gains | | | (1,497,051 | ) |
For the year ended July 31, 2018, undistributed net investment income included in net assets was $12,215,504.
2. Shares of Beneficial Interest
At July 31, 2019, there were an unlimited number of shares authorized (without par value). Transactions in the Fund’s shares were as follows:
| | | | | | | | | | | | | | | | |
| | | Year Ended July 31, | |
| | | | |
| | | 2019 | | | 2018 | |
| | | | |
| | | Shares | | | Amount | | | Shares | | | Amount | |
| |
Shares sold | | | 21,020,588 | | | $ | 236,615,592 | | | | 14,713,920 | | | $ | 174,801,078 | |
Shares issued in reinvestment of distributions | | | 3,531,654 | | | | 37,824,015 | | | | 1,875,571 | | | | 21,794,133 | |
Shares redeemed | | | (35,662,093 | ) | | | (394,518,505 | ) | | | (16,241,776 | ) | | | (191,926,085) | |
| | | | |
| | | | |
Net increase (decrease) | | | (11,109,851 | ) | | $ | (120,078,898 | ) | | | 347,715 | | | $ | 4,669,126 | |
| | | | |
3. Transactions with Affiliates
Franklin Resources, Inc. is the holding company for various subsidiaries that together are referred to as Franklin Templeton. Certain officers and trustees of the Trust are also officers and/or directors of the following subsidiaries:
| | |
| Subsidiary | | Affiliation |
Franklin Templeton Investment Management Limited (FTIML) | | Investment manager |
Franklin Templeton Services, LLC (FT Services) | | Administrative manager |
Franklin Templeton Investor Services, LLC (Investor Services) | | Transfer agent |
| | | | |
| | | |
26 | | Annual Report | | ftinstitutional.com |
FRANKLIN GLOBAL TRUST
NOTES TO CONSOLIDATED FINANCIAL STATEMENTS
Franklin Emerging Market Debt Opportunities Fund(continued)
a. Management Fees
The Fund and FT Subsidiary pay an investment management fee to FTIML based on the average daily net assets of each of the Fund and FT Subsidiary as follows:
| | |
| Annualized Fee Rate | | Net Assets |
1.000% | | Up to and including $500 million |
0.900% | | Over $500 million, up to and including $1 billion |
0.850% | | In excess of $1 billion |
Management fees paid by the Fund are reduced on assets invested in FT Subsidiary, in an amount not to exceed the management fees paid by FT Subsidiary.
b. Administrative Fees
Under an agreement with FTIML, FT Services provides administrative services to the Fund and FT Subsidiary. The fee is paid by FTIML based on each of the Fund’s and FT Subsidiary’s average daily net assets, and is not an additional expense of the Fund or FT Subsidiary.
c. Transfer Agent Fees
The Fund pays transfer agent fees to Investor Services for its performance of shareholder servicing obligations. The fees are based on an annualized asset based fee of 0.02% plus a transaction based fee. In addition, the Fund reimburses Investor Services for out of pocket expenses incurred and reimburses shareholder servicing fees paid to third parties.
For the year ended July 31, 2019, the Fund paid transfer agent fees of $117,092, of which $116,360 was retained by Investor Services.
d. Investments in Affiliated Management Investment Companies
The Fund invests in one or more affiliated management investment companies for purposes other than exercising a controlling influence over the management or policies. Management fees paid by the Fund are waived on assets invested in the affiliated management investment companies, as noted in the Consolidated Statement of Operations, in an amount not to exceed the management and administrative fees paid directly or indirectly by each affiliate. During the year ended July 31, 2019, the Fund held investments in affiliated management investment companies as follows:
| | | | | | | | | | | | | | | | | | | | | | | | | | | | | | | | |
| | | Value at
Beginning
of Year | | | Purchases | | | Sales | | | Realized
Gain (Loss) | | | Net Change in
Unrealized
Appreciation
(Depreciation) | | | Value at End of Year | | | Number of
Shares Held at End
of Year | | | Dividend
Income | |
Non-Controlled Affiliates | | | | | | | | | | | | | | | | | | | | | | | | | | | | | | | | |
| | | | | | | | |
Institutional Fiduciary Trust Money Market Portfolio, 2.00% | | | $11,538,315 | | | | $213,842,960 | | | | $(193,252,817) | | | | $ — | | | | $ — | | | | $32,128,458 | | | | 32,128,458 | | | | $447,094 | |
| | | | | | | | | | | | |
e. Waiver and Expense Reimbursements
FTIML has contractually agreed in advance to waive or limit its fees and to assume as its own expense certain expenses otherwise payable by the Fund so that the expenses (excluding acquired fund fees and expenses) do not exceed 1.00% (other than certainnon-routine expenses or costs, including those relating to litigation, indemnification, reorganizations, and liquidations) until November 30, 2019. Total expenses waived or paid are not subject to recapture subsequent to the Fund’s fiscal year end.
| | | | |
| | | |
| ftinstitutional.com | | Annual Report | | 27 |
FRANKLIN GLOBAL TRUST
NOTES TO CONSOLIDATED FINANCIAL STATEMENTS
Franklin Emerging Market Debt Opportunities Fund(continued)
4. Expense Offset Arrangement
The Fund has entered into an arrangement with its custodian whereby credits realized as a result of uninvested cash balances are used to reduce a portion of the Fund’s custodian expenses. During the year ended July 31, 2019, the custodian fees were reduced as noted in the Consolidated Statement of Operations.
5. Income Taxes
For tax purposes, capital losses may be carried over to offset future capital gains.
At July 31, 2019, the capital loss carryforwards were as follows:
| | | | |
Capital loss carryforwards not subject to expiration: | | | | |
Short term | | $ | 3,417,785 | |
Long term | | | 9,925,148 | |
| | | | |
| |
Total capital loss carryforwards | | $ | 13,342,933 | |
| | | | |
The tax character of distributions paid during the years ended July 31, 2019 and 2018, was as follows:
| | | | | | | | |
| | | 2019 | | | 2018 | |
| | | | |
Distributions paid from: | | | | | | | | |
Ordinary income | | $ | 38,242,212 | | | $ | 20,544,380 | |
Long term capital gain | | | — | | | | 1,493,088 | |
| | | | |
| | $ | 38,242,212 | | | $ | 22,037,468 | |
| | | | |
At July 31, 2019, the cost of investments, net unrealized appreciation (depreciation), and undistributed ordinary income for income tax purposes were as follows:
| | | | |
Cost of investments | | $ | 410,881,882 | |
| | | | |
| |
Unrealized appreciation | | $ | 44,898,361 | |
Unrealized depreciation | | | (80,949,198) | |
| | | | |
| |
Net unrealized appreciation (depreciation) | | $ | (36,050,837) | |
| | | | |
| |
Distributable earnings: | | | | |
Undistributed ordinary income | | $ | 12,608,115 | |
| | | | |
Differences between income and/or capital gains as determined on a book basis and a tax basis are primarily due to differing treatments of defaulted securities, bond discounts and premiums and inflation related adjustments on foreign securities.
6. Investment Transactions
Purchases and sales of investments (excluding short term securities) for the year ended July 31, 2019, aggregated $57,420,316 and $195,710,326, respectively.
| | | | |
| | | |
28 | | Annual Report | | ftinstitutional.com |
FRANKLIN GLOBAL TRUST
NOTES TO CONSOLIDATED FINANCIAL STATEMENTS
Franklin Emerging Market Debt Opportunities Fund(continued)
7. Credit Risk and Defaulted Securities
At July 31, 2019, the Fund had 78.1% of its portfolio invested in high yield securities or other securities rated below investment grade and unrated securities, if any. These securities may be more sensitive to economic conditions causing greater price volatility and are potentially subject to a greater risk of loss due to default than higher rated securities.
The Fund held defaulted securities and/or other securities for which the income has been deemed uncollectible. At July 31, 2019, the aggregate value of these securities was $16,741,443, representing 4.3% of the Fund’s net assets. The Fund discontinues accruing income on securities for which income has been deemed uncollectible and provides an estimate for losses on interest receivable. The securities have been identified in the accompanying Consolidated Statement of Investments.
8. Concentration of Risk
Investing in foreign securities may include certain risks and considerations not typically associated with investing in U.S. securities, such as fluctuating currency values and changing local and regional economic, political and social conditions, which may result in greater market volatility. Current political and financial uncertainty surrounding the European Union may increase market volatility and the economic risk of investing in securities in Europe. In addition, certain foreign securities may not be as liquid as U.S. securities.
9. Restricted Securities
The Fund invests in securities that are restricted under the Securities Act of 1933 (1933 Act). Restricted securities are often purchased in private placement transactions, and cannot be sold without prior registration unless the sale is pursuant to an exemption under the 1933 Act. Disposal of these securities may require greater effort and expense, and prompt sale at an acceptable price may be difficult. The Fund may have registration rights for restricted securities. The issuer generally incurs all registration costs.
At July 31, 2019, investments in restricted securities, excluding securities exempt from registration under the 1933 Act deemed to be liquid, were as follows:
| | | | | | | | | | | | | | | | | | | | |
Principal
Amount*/
Shares/ Units | | | | | | Issuer | | Acquisition Date | | | Cost | | | Value | |
| | 193,625 | | | | | | | Astana Finance JSC, GDR, 144A | | | 5/22/15 | | | $ | — | | | $ | — | |
| | 136,566 | | | | | | | Astana Finance JSC, secured note, 144A, zero cpn., 12/22/24 | | | 5/22/15 | | | | — | | | | 1,366 | |
| | 707,110,191 | | | | JPY | | | Deutsche Bank AG (Government of Iraq), 2.571%, 1/01/28 | | | 1/26/17 | | | | 4,463,118 | | | | 4,458,105 | |
| | 6,693,750 | | | | | | | Development Bank of South Africa Ltd. (Government of Angola), Tranche 2, senior note, FRN, 8.548%,(6-month USD LIBOR + 6.25%), 12/20/23 | | | 12/16/13 | | | | 6,693,750 | | | | 6,457,058 | |
| | 6,300,000 | | | | | | | Development Bank of South Africa Ltd. (Government of Angola), Tranche 3B, senior note, FRN, 8.548%,(6-month USD LIBOR + 6.25%), 12/20/23 | | | 6/06/14 | | | | 6,300,000 | | | | 6,077,231 | |
| | 5,166,667 | | | | | | | Ethiopian Railway Corp. (Government of Ethiopia), FRN, 6.562%,(6-month USD LIBOR + 3.75%), 8/02/21 | | | 8/04/14 -1/15/16 | | | | 5,051,781 | | | | 5,081,490 | |
| | 4,424,861 | | | | | | | Global Distressed Alpha Fund III LP | | | 10/11/12 -1/22/16 | | | | 4,600,000 | | | | — | |
| | 594,664 | | | | | | | Global Distressed Alpha Fund III LP, PIK, 12.00%, Perpetual | | | 12/28/16 -6/30/19 | | | | 594,662 | | | | 593,928 | |
| | | | |
| | | |
| ftinstitutional.com | | Annual Report | | 29 |
FRANKLIN GLOBAL TRUST
NOTES TO CONSOLIDATED FINANCIAL STATEMENTS
Franklin Emerging Market Debt Opportunities Fund(continued)
9. Restricted Securities(continued)
| | | | | | | | | | | | | | | | | | |
Principal
Amount*/
Shares/ Units | | | | | Issuer | | Acquisition Date | | | Cost | | | Value | |
| | | | | |
| | 210,617,398 | | | JPY | | Government of Iraq, Tranche A3, Sumitomo Corp. Loan, FRN, 0.563%,(6-month JPY LIBOR + 0.50%), 1/01/28 | | | 10/16/07 - 1/06/11 | | | $ | 1,313,502 | | | $ | 1,440,642 | |
| | 55,882,058 | | | | | K2016470219 South Africa Ltd., A | | | 2/08/13 - 2/01/17 | | | | 429,250 | | | | 38,890 | |
| | 5,561,052 | | | | | K2016470219 South Africa Ltd., B | | | 2/01/17 | | | | 4,129 | | | | 3,870 | |
| | 4,429,003 | | | | | K2016470219 South Africa Ltd., senior secured note, 144A, PIK, 3.00%, 12/31/22 | | | 2/08/13 - 6/30/19 | | | | 6,116,629 | | | | 5,523 | |
| | 1,052,294 | | | | | K2016470260 South Africa Ltd., senior secured note, 144A, PIK, 25.00%, 12/31/22 | | | 2/01/17 - 6/30/19 | | | | 755,530 | | | | 10,308 | |
| | 368,593,204 | | | JPY | | Merrill Lynch & Co. Inc. (Government of Iraq), FRN, 0.563%,(6-month JPY LIBOR + 0.50%), 1/01/28 | | | 7/19/07 - 1/06/11 | | | | 2,201,076 | | | | 2,521,211 | |
| | 4,250,000 | | | DEM | | NK Debt Corp., 144A, zero cpn., 3/12/20 | | | 6/19/07 - 10/14/08 | | | | 723,263 | | | | — | |
| | 2,000,000 | | | CHF | | NK Debt Corp., Reg S, zero cpn., 3/12/20 | | | 6/17/11 | | | | 388,830 | | | | — | |
| | 18,000,000 | | | DEM | | NK Debt Corp., Reg S, zero cpn., 3/12/20 | | | 1/25/11 - 6/06/11 | | | | 2,023,663 | | | | — | |
| | 15,452,591 | | | | | Societe des Hydrocarbures du Tchad, Tranche B, FRN, 6.83%,(3-month USD LIBOR + 4.50%), 12/31/27 | | | 1/01/18 | | | | 15,452,591 | | | | 13,151,715 | |
| | 8,000,000 | | | | | Sphynx Capital Markets PCC (National Investment Bank of Ghana), PTN, Reg S, zero cpn., 2/05/09 | | | 10/12/09 - 10/13/11 | | | | 3,100,000 | | | | — | |
| | | | | |
| | | | | | Total Restricted Securities(Value is 10.3% of Net Assets) | | | | | | $ | 60,211,774 | | | $ | 39,841,337 | |
*In U.S. dollars unless otherwise indicated.
See Abbreviations on page 31.
10. Other Derivative Information
At July 31, 2019, investments in derivative contracts are reflected in the Consolidated Statement of Assets and Liabilities as follows:
| | | | | | | | | | | | | | | | |
| | | Asset Derivatives | | | | | | Liability Derivatives | |
| | | | | |
Derivative Contracts Not Accounted for as Hedging Instruments | | Consolidated Statement of Assets and Liabilities Location | | Fair Value | | | | | | Consolidated Statement of
Assets and Liabilities
Location | | Fair Value | |
| | | | | |
Foreign exchange contracts | | Unrealized appreciation on OTC
forward exchange contracts | | $ | 228,809 | | | | | | | Unrealized depreciation on OTC forward exchange contracts | | $ | — | |
Value recovery instruments | | Investments in securities, at value | | | 5,124,540 | a | | | | | | | | | | |
| | | | | | | | | | | | | | | | |
Totals | | | | $ | 5,353,349 | | | | | | | | | $ | — | |
| | | | | | | | | | | | | | | | |
aVRI are included in investments in securities, at value in the Consolidated Statement of Assets and Liabilities.
| | | | |
| | | |
30 | | Annual Report | | ftinstitutional.com |
FRANKLIN GLOBAL TRUST
NOTES TO CONSOLIDATED FINANCIAL STATEMENTS
Franklin Emerging Market Debt Opportunities Fund(continued)
For the year ended July 31, 2019, the effect of derivative contracts in the Consolidated Statement of Operations was as follows:
| | | | | | | | | | | | |
Derivative Contracts Not Accounted for as Hedging Instruments | | Consolidated Statement of Operations
Location | | Net Realized
Gain (Loss) for
the Year | | | Consolidated Statement of
Operations Location | | Net Change in
Unrealized
Appreciation
(Depreciation) for the Year | |
| | | | |
| | Net realized gain (loss) from: | | | | | | Net change in unrealized appreciation (depreciation) on: | | | | |
Foreign exchange contracts | | Forward exchange contracts | | $ | 697,632 | | | Forward exchange contracts | | | $(257,575) | |
Value recovery instruments | | Investments | | | 480,335 | a | | Investments | | | 743,477 | a |
| | | | | | | | | | | | |
Totals | | | | $ | 1,177,967 | | | | | | $485,902 | |
| | | | | | | | | | | | |
aVRI are included in net realized gain (loss) from investments and net change in unrealized appreciation (depreciation) on investments in the Consolidated Statement of Operations.
For the year ended July 31, 2019, the average month end contract value for forward exchange contracts and average month end fair value of VRI, was $31,034,875 and $4,180,730, respectively.
See Note 1(d) regarding derivative financial instruments.
See Abbreviations on page 34.
11. Credit Facility
The Fund, together with other U.S. registered and foreign investment funds (collectively, Borrowers), managed by Franklin Templeton, are borrowers in a joint syndicated senior unsecured credit facility totaling $2 billion (Global Credit Facility) which matures on February 7, 2020. This Global Credit Facility provides a source of funds to the Borrowers for temporary and emergency purposes, including the ability to meet future unanticipated or unusually large redemption requests.
Under the terms of the Global Credit Facility, the Fund shall, in addition to interest charged on any borrowings made by the Fund and other costs incurred by the Fund, pay its share of fees and expenses incurred in connection with the implementation and maintenance of the Global Credit Facility, based upon its relative share of the aggregate net assets of all of the Borrowers, including an annual commitment fee of 0.15% based upon the unused portion of the Global Credit Facility. These fees are reflected in other expenses in the Consolidated Statement of Operations. During the year ended July 31, 2019, the Fund did not use the Global Credit Facility.
12. Fair Value Measurements
The Fund follows a fair value hierarchy that distinguishes between market data obtained from independent sources (observable inputs) and the Fund’s own market assumptions (unobservable inputs). These inputs are used in determining the value of the Fund’s financial instruments and are summarized in the following fair value hierarchy:
| | • | | Level 1 – quoted prices in active markets for identical financial instruments |
| | • | | Level 2 – other significant observable inputs (including quoted prices for similar financial instruments, interest rates, prepayment speed, credit risk, etc.) |
| | • | | Level 3 – significant unobservable inputs (including the Fund’s own assumptions in determining the fair value of financial instruments) |
| | | | |
| | | |
| ftinstitutional.com | | Annual Report | | 31 |
FRANKLIN GLOBAL TRUST
NOTES TO CONSOLIDATED FINANCIAL STATEMENTS
Franklin Emerging Market Debt Opportunities Fund(continued)
12. Fair Value Measurements(continued)
The input levels are not necessarily an indication of the risk or liquidity associated with financial instruments at that level.
A summary of inputs used as of July 31, 2019, in valuing the Fund’s assets carried at fair value, is as follows:
| | | | | | | | | | | | | | | | |
| | | Level 1 | | | Level 2 | | | Level 3 | | | Total | |
| |
Assets: | | | | | | | | | | | | | | | | |
Investments in Securities:a | | | | | | | | | | | | | | | | |
Warrants | | $ | — | | | $ | 6,976,380 | | | $ | 2,656,000 | | | $ | 9,632,380 | |
Quasi-Sovereign and Corporate Bonds | | | — | | | | 95,120,887 | | | | 8,404,072 | b | | | 103,524,959 | |
Loan Participations and Assignments | | | — | | | | 30,509,471 | | | | 39,781,380 | b | | | 70,290,851 | |
Foreign Government and Agency Securities | | | — | | | | 158,982,828 | | | | — | | | | 158,982,828 | |
Common Stocks | | | — | | | | — | | | | 42,760 | b | | | 42,760 | |
Private Limited Partnership Fund | | | — | | | | — | | | | — | b | | | — | |
Short Term Investments | | | 32,128,458 | | | | — | | | | — | | | | 32,128,458 | |
| | | | |
| | | | |
Total Investments in Securities | | $ | 32,128,458 | | | $ | 291,589,566 | | | $ | 50,884,212 | | | $ | 374,602,236 | |
| | | | |
| | | | |
Receivables: | | | | | | | | | | | | | | | | |
Interest | | $ | — | | | $ | — | | | $ | 206,215 | | | $ | 206,215 | |
| | | | |
| | | | |
Other Financial Instruments: | | | | | | | | | | | | | | | | |
Forward Exchange Contracts | | $ | — | | | $ | 228,809 | | | $ | — | | | $ | 228,809 | |
| | | | |
aFor detailed categories, see the accompanying Consolidated Statement of Investments.
bIncludes securities determined to have no value at July 31, 2019.
A reconciliation of assets in which Level 3 inputs are used in determining fair value is presented when there are significant Level 3 financial instruments at the beginning and/or end of the year. At July 31, 2019, the reconciliation of assets, is as follows:
| | | | | | | | | | | | | | | | | | | | | | | | | | | | | | | | | | | | | | | | |
| | | Balance at
Beginning of
Year | | | Purchases | | | Sales | | | Transfer Into Level 3a | | | Transfer
Out of
Level 3 | | | Cost Basis
Adjustmentsb | | | Net
Realized
Gain
(Loss) | | | Net
Unrealized
Appreciation
(Depreciation) | | | Balance at End of Year | | | Net Change
in Unrealized
Appreciation
(Depreciation)
on Assets
Held at Year End | |
| | | | | | | | | | |
Assets: | | | | | | | | | | | | | | | | | | | | | | | | | | | | | | | | | | | | | | | | |
Investments in Securities: | | | | | | | | | | | | | | | | | | | | | | | | | | | | | | | | | | | | | | | | |
Warrants | | $ | — | | | | $ — | | | $ | — | | | $ | 3,424,000 | | | | $ — | | | $ | — | | | $ | — | | | $ | (768,000 | ) | | $ | 2,656,000 | | | | $(768,000 | ) |
Quasi-Sovereign and Corporate Bonds | | | 6,726 | c | | | — | | | | — | | | | 8,421,412 | | | | — | | | | (852,102 | ) | | | — | | | | 828,036 | | | | 8,404,072 | c | | | 828,036 | |
Loan Participations and Assignments | | | 46,046,676 | | | | — | | | | (7,373,393 | ) | | | — | | | | — | | | | 892,988 | | | | 73,024 | | | | 142,085 | | | | 39,781,380 | c | | | 295,393 | |
Foreign Government and Agency Securities | | | 1,965,906 | | | | — | | | | (2,009,316 | ) | | | — | | | | — | | | | — | | | | 65,611 | | | | (22,201 | ) | | | — | | | | — | |
Common Stocks | | | 46,572 | c | | | — | | | | — | | | | — | | | | — | | | | — | | | | — | | | | (3,812 | ) | | | 42,760 | c | | | (3,812 | ) |
Private Limited Partnership Fund | | | 227,836 | | | | — | | | | — | | | | — | | | | — | | | | — | | | | — | | | | (227,836 | ) | | | — | c | | | (227,836 | ) |
| | | | |
| | | |
32 | | Annual Report | | ftinstitutional.com |
FRANKLIN GLOBAL TRUST
NOTES TO CONSOLIDATED FINANCIAL STATEMENTS
Franklin Emerging Market Debt Opportunities Fund(continued)
| | | | | | | | | | | | | | | | | | | | | | | | | | | | | | | | | | | | | | | | |
| | | Balance at
Beginning of
Year | | | Purchases | | | Sales | | | Transfer Into Level 3a | | | Transfer
Out of
Level 3 | | | Cost Basis
Adjustmentsb | | | Net
Realized
Gain (Loss) | | | Net
Unrealized
Appreciation
(Depreciation) | | | Balance at End of Year | | | Net Change in
Unrealized
Appreciation
(Depreciation)
on Assets
Held at Year End | |
| |
| | | | | | | | | | |
Short Term Investments | | $ | 5,178,608 | | | | $ — | | | $ | (4,782,401 | ) | | $ | — | | | | $ — | | | $ | 23,505 | | | $ | (794,695 | ) | | | $ 374,983 | | | $ | — | | | | $ — | |
| | | | |
| | | | | | | | | | |
| Total Investments in Securities | | $ | 53,472,324 | | | | $ — | | | $ | (14,165,110 | ) | | $ | 11,845,412 | | | | $ — | | | $ | 64,391 | | | $ | (656,060 | ) | | | $ 323,255 | | | $ | 50,884,212 | | | | $ 123,781 | |
| | | | |
| | | | | | | | | | |
Receivables: | | | | | | | | | | | | | | | | | | | | | | | | | | | | | | | | | | | | | | | | |
| | | | | | | | | | |
Interest | | $ | — | | | | $ — | | | $ | — | | | $ | 206,215 | | | | $ — | | | $ | — | | | $ | — | | | | $ — | | | $ | 206,215 | | | | $ — | |
| | | | |
aThe investments were transferred into Level 3 as a result of the unavailability of a quoted market price in an active market for identical securities and other significant observable valuation inputs.
bMay include accretion, amortization, partnership adjustments, and/or other cost basis adjustments.
cIncludes securities determined to have no value.
Significant unobservable valuation inputs for material Level 3 financial instruments and impact to fair value as a result of changes in unobservable valuation inputs as of July 31, 2019, are as follows:
| | | | | | | | | | | | | | | | | | | | |
| Description | | Fair Value
at End of Year | | | Valuation Technique | | | Unobservable Input | | | Amount/Range
(Weighted
Averagea) | | | Impact to Fair
Value if Input
Increasesb | |
| |
Assets: | | | | | | | | | | | | | | | | | | | | |
Investments in Securities: | | | | | | | | | | | | | | | | | | | | |
Loan Participations and Assignments | | $ | 39,781,380 | | | | Consensus Pricing | | | | Offered quotes | | | | 66.1 - 81.4 (71.7) JPY | | | | Increasec | |
| | | | | | | | |
| | | | | | | Discounted Cash Flow | | | | Free cash flow | | | | $44.6 (mil) | | | | Increasec | |
| | | | | | | | | | | | |
| | | | | | | | | | | Discount rate | | | | 7.5% - 12.4% (9.6%) | | | | Decreasec | |
| |
All Other Investmentsd | | | 11,309,047e | | | | | | | | | | | | | | | | | |
| |
Total | | $ | 51,090,427 | | | | | | | | | | | | | | | | | |
| |
aWeighted based on the relative fair value of the financial instruments.
bRepresents the directional change in the fair value of the Level 3 financial instruments that would result from a significant and reasonable increase in the corresponding input. A significant and reasonable decrease in the input would have the opposite effect. Significant impacts, if any, to fair value and/or net assets have been indicated.
cRepresents a significant impact to fair value and net assets.
dIncludes fair value of immaterial financial instruments and interest receivable developed using various valuation techniques and unobservable inputs. May also include financial instruments with values derived using private transaction prices ornon-public third party pricing information which is unobservable.
eIncludes securities determined to have no value at July 31, 2019.
13. Subsequent Events
The Fund has evaluated subsequent events through the issuance of the consolidated financial statements and determined that no events have occurred that require disclosure.
| | | | |
| | | |
| ftinstitutional.com | | Annual Report | | 33 |
FRANKLIN GLOBAL TRUST
NOTES TO CONSOLIDATED FINANCIAL STATEMENTS
Franklin Emerging Market Debt Opportunities Fund(continued)
Abbreviations
| | | | | | | | | | | | |
| Counterparty | | Currency | | Selected Portfolio | | |
| | |
| | | | | | |
| CITI | | Citibank N.A. | | ARS | | Argentine Peso | | FRN | | Floating Rate Note | | |
| | | | | | |
| MSCO | | Morgan Stanley | | BYN | | Belarusian Ruble | | GDP | | Gross Domestic Product | | |
| | | | | | |
| RBCCM | | Royal Bank of Canada | | CHF | | Swiss Franc | | GDR | | Global Depositary Receipt | | |
| | | | | | |
| | | | COP | | Colombian Peso | | LIBOR | | London InterBank Offered Rate | | |
| | | | | | |
| | | | DEM | | Deutsche Mark | | PIK | | Payment-In-Kind | | |
| | | | | | |
| | | | DOP | | Dominican Peso | | PTN | | Pass-through Note | | |
| | | | | | |
| | | | EGP | | Egyptian Pound | | VRI | | Value Recovery Instrument | | |
| | | | | | |
| | | | EUR | | Euro | | | | | | |
| | | | | | |
| | | | GEL | | Georgian Lari | | | | | | |
| | | | | | |
| | | | GHS | | Ghanaian Cedi | | | | | | |
| | | | | | |
| | | | IDR | | Indonesian Rupiah | | | | | | |
| | | | | | |
| | | | JPY | | Japanese Yen | | | | | | |
| | | | | | |
| | | | KES | | Kenyan Shilling | | | | | | |
| | | | | | |
| | | | KZT | | Kazakhstani Tenge | | | | | | |
| | | | | | |
| | | | MXN | | Mexican Peso | | | | | | |
| | | | | | |
| | | | PEN | | Peruvian Nuevo Sol | | | | | | |
| | | | | | |
| | | | TRY | | Turkish Lira | | | | | | |
| | | | | | |
| | | | USD | | United States Dollar | | | | | | |
| | | | | | |
| | | | UYU | | Uruguayan Peso | | | | | | |
| | | | | | |
| | | | ZAR | | South African Rand | | | | | | |
| | | | |
| | | |
34 | | Annual Report | | ftinstitutional.com |
FRANKLIN GLOBAL TRUST
Report of Independent Registered Public Accounting Firm
To the Board of Trustees of Franklin Global Trust and Shareholders of Franklin Emerging Market Debt Opportunities Fund
Opinion on the Financial Statements
We have audited the accompanying consolidated statement of assets and liabilities, including the consolidated statement of investments, of Franklin Emerging Market Debt Opportunities Fund (the “Fund”) as of July 31, 2019, the related consolidated statements of operations and consolidated cash flows for the year ended July 31, 2019, the consolidated statement of changes in net assets for each of the two years in the period ended July 31, 2019, including the related notes, and the consolidated financial highlights for each of the five years in the period ended July 31, 2019 (collectively referred to as the “consolidated financial statements”). In our opinion, the consolidated financial statements present fairly, in all material respects, the financial position of the Fund as of July 31, 2019, the results of its operations and its cash flows for the year then ended, the changes in its net assets for each of the two years in the period ended July 31, 2019 and the consolidated financial highlights for each of the five years in the period ended July 31, 2019 in conformity with accounting principles generally accepted in the United States of America.
Basis for Opinion
These consolidated financial statements are the responsibility of the Fund’s management. Our responsibility is to express an opinion on the Fund’s consolidated financial statements based on our audits. We are a public accounting firm registered with the Public Company Accounting Oversight Board (United States) (PCAOB) and are required to be independent with respect to the Fund in accordance with the U.S. federal securities laws and the applicable rules and regulations of the Securities and Exchange Commission and the PCAOB.
We conducted our audits of these consolidated financial statements in accordance with the standards of the PCAOB. Those standards require that we plan and perform the audit to obtain reasonable assurance about whether the consolidated financial statements are free of material misstatement, whether due to error or fraud.
Our audits included performing procedures to assess the risks of material misstatement of the consolidated financial statements, whether due to error or fraud, and performing procedures that respond to those risks. Such procedures included examining, on a test basis, evidence regarding the amounts and disclosures in the consolidated financial statements. Our audits also included evaluating the accounting principles used and significant estimates made by management, as well as evaluating the overall presentation of the consolidated financial statements. Our procedures included confirmation of securities owned as of July 31, 2019 by correspondence with the custodian, transfer agent and brokers; when replies were not received from brokers, we performed other auditing procedures. We believe that our audits provide a reasonable basis for our opinion.
PricewaterhouseCoopers LLP
San Francisco, California
September 17, 2019
We have served as the auditor of one or more investment companies in the Franklin Templeton Group of Funds since 1948.
| | | | |
| | | |
| ftinstitutional.com | | Annual Report | | 35 |
FRANKLIN GLOBAL TRUST
Tax Information (unaudited)
Franklin Emerging Market Debt Opportunities Fund
At July 31, 2019, more than 50% of the Fund’s total assets were invested in securities of foreign issuers. In most instances, foreign taxes were withheld from income paid to the Fund on these investments. The Fund elects to treat foreign taxes paid as allowed under Section 853 of the Internal Revenue Code. This election will allow shareholders of record as of the 2019 distribution date, to treat their proportionate share of foreign taxes paid by the Fund as having been paid directly by them. The shareholder shall consider these amounts as foreign taxes paid in the tax year in which they receive the Fund distribution.
| | | | |
| | | |
36 | | Annual Report | | ftinstitutional.com |
FRANKLIN GLOBAL TRUST
Board Members and Officers
The name, year of birth and address of the officers and board members, as well as their affiliations, positions held with the Trust, principal occupations during at least the past five years and number of U.S. registered portfolios overseen in the Franklin Templeton fund complex, are shown below. Generally, each board member serves until that person’s successor is elected and qualified.
Independent Board Members
| | | | | | | | |
Name, Year of Birth and Address | | Position | | Length of Time Served | | Number of Portfolios in
Fund Complex Overseen
by Board Member* | | Other Directorships Held During at Least the Past 5 Years |
| | | | |
Harris J. Ashton (1932) One Franklin Parkway San Mateo, CA 94403-1906 | | Trustee | | Since 2000 | | 137 | | Bar-S Foods (meat packing company) (1981-2010). |
| | |
| Principal Occupation During at Least the Past 5 Years: | | | | |
Director of various companies; andformerly, Director, RBC Holdings, Inc. (bank holding company) (until 2002); and President, Chief Executive Officer and Chairman of the Board, General Host Corporation (nursery and craft centers) (until 1998). |
| | | | |
Terrence J. Checki (1945) One Franklin Parkway | | Trustee | | Since 2017 | | 113 | | Hess Corporation (exploration of oil and gas) (2014-present). |
| San Mateo, CA 94403-1906 | | | | | | | | |
| | |
| Principal Occupation During at Least the Past 5 Years: | | | | |
Member of the Council on Foreign Relations (1996-present); Member of the National Committee on U.S.-China Relations (1999-present); member of the Board of Trustees of the Economic Club of New York (2013-present); member of the Board of Trustees of the Foreign Policy Association (2005-present) and member of various other boards of trustees and advisory boards; andformerly, Executive Vice President of the Federal Reserve Bank of New York and Head of its Emerging Markets and Internal Affairs Group and Member of Management Committee (1995-2014); and Visiting Fellow at the Council on Foreign Relations (2014). |
| | | | |
Mary C. Choksi (1950) One Franklin Parkway San Mateo, CA 94403-1906 | | Trustee | | Since 2014 | | 137 | | Avis Budget Group Inc. (car rental) (2007-present), Omnicom Group Inc. (advertising and marketing communications services) (2011-present) and White Mountains Insurance Group, Ltd. (holding company) (2017-present). |
| Principal Occupation During at Least the Past 5 Years: | | | | |
Director of various companies; andformerly, Founder and Senior Advisor, Strategic Investment Group (investment management group) (2015-2017); Founding Partner and Senior Managing Director, Strategic Investment Group (1987-2015); Founding Partner and Managing Director, Emerging Markets Management LLC (investment management firm) (1987-2011); and Loan Officer/Senior Loan Officer/Senior Pension Investment Officer, World Bank Group (international financial institution) (1977-1987). |
| | | | |
Edith E. Holiday (1952) One Franklin Parkway San Mateo, CA 94403-1906 | | Lead Independent Trustee | | Trustee since 2000 and Lead Independent Trustee since March 2019 | | 137 | | Hess Corporation (exploration of oil and gas) (1993-present), Canadian National Railway (railroad) (2001-present), White Mountains Insurance Group, Ltd. (holding company) (2004-present), Santander Consumer USA Holdings, Inc. (consumer finance) (2016-present), RTI International Metals, Inc. (manufacture and distribution of titanium) (1999-2015) and H.J. Heinz Company (processed foods and allied products) (1994-2013). |
| Principal Occupation During at Least the Past 5 Years: | | | | |
Director or Trustee of various companies and trusts; andformerly, Assistant to the President of the United States and Secretary of the Cabinet (1990-1993); General Counsel to the United States Treasury Department (1989-1990); and Counselor to the Secretary and Assistant Secretary for Public Affairs and Public Liaison–United States Treasury Department (1988-1989). |
| | | | |
| | | |
| ftinstitutional.com | | Annual Report | | 37 |
FRANKLIN GLOBAL TRUST
Independent Board Members(continued)
| | | | | | | | |
Name, Year of Birth
and Address | | Position | | Length of
Time Served | | Number of Portfolios in
Fund Complex Overseen
by Board Member* | | Other Directorships Held
During at Least the Past 5 Years |
J. Michael Luttig (1954)
One Franklin Parkway
San Mateo, CA 94403-1906 | | Trustee | | Since 2009 | | 137 | | Boeing Capital Corporation (aircraft financing) (2006-2013). |
|
Principal Occupation During at Least the Past 5 Years: Executive Vice President, Counselor and Senior Advisor to Boeing Chairman and Board of Directors, The Boeing Company (aerospace company) (May 2019); andformerly, General Counsel and member of the Executive Council, The Boeing Company (2006-2019) and Federal Appeals Court Judge, U.S. Court of Appeals for the Fourth Circuit (1991-2006). |
| | | | |
Larry D. Thompson (1945)
One Franklin Parkway
San Mateo, CA 94403-1906 | | Trustee | | Since 2007 | | 137 | | The Southern Company (energy company) (2014-present; previously 2010-2012), Graham Holdings Company (education and media organization) (2011-present) and Cbeyond, Inc. (business communications provider) (2010-2012). |
Principal Occupation During at Least the Past 5 Years: Director of various companies; Counsel, Finch McCranie, LLP (law firm) (2015-present); Independent Compliance Monitor and Auditor, Volkswagen AG (manufacturer of automobiles and commercial vehicles) (2017-present); John A. Sibley Professor of Corporate and Business Law, University of Georgia School of Law (2015-present; previously 2011-2012); andformerly, Executive Vice President – Government Affairs, General Counsel and Corporate Secretary, PepsiCo, Inc. (consumer products) (2012-2014); Senior Vice President – Government Affairs, General Counsel and Secretary, PepsiCo, Inc. (2004-2011); Senior Fellow of The Brookings Institution (2003-2004); Visiting Professor, University of Georgia School of Law (2004); and Deputy Attorney General, U.S. Department of Justice (2001-2003). |
| | |
| Interested Board Members and Officers | | | | |
| | | | | | | | |
| | | | |
Name, Year of Birth
and Address | | Position | | Length of
Time Served | | Number of Portfolios in
Fund Complex Overseen
by Board Member* | | Other Directorships Held
During at Least the Past 5 Years |
| | | | |
**Gregory E. Johnson (1961)
One Franklin Parkway
San Mateo, CA 94403-1906 | | Trustee | | Since 2007 | | 151 | | None |
|
Principal Occupation During at Least the Past 5 Years: Chairman of the Board, Member – Office of the Chairman, Director and Chief Executive Officer, Franklin Resources, Inc.; officer and/or director or trustee, as the case may be, of some of the other subsidiaries of Franklin Resources, Inc. and of 42 of the investment companies in Franklin Templeton; Vice Chairman, Investment Company Institute; andformerly, President, Franklin Resources, Inc. (1994-2015). |
| | | | |
**Rupert H. Johnson, Jr. (1940)
One Franklin Parkway
San Mateo, CA 94403-1906 | | Chairman of the Board and Trustee | | Since 2013 | | 137 | | None |
|
Principal Occupation During at Least the Past 5 Years: Vice Chairman, Member – Office of the Chairman and Director, Franklin Resources, Inc.; Director, Franklin Advisers, Inc.; and officer and/or director or trustee, as the case may be, of some of the other subsidiaries of Franklin Resources, Inc. and of 40 of the investment companies in Franklin Templeton. |
| | | | |
Alison E. Baur (1964) One Franklin Parkway San Mateo, CA 94403-1906 | | Vice President | | Since 2012 | | Not Applicable | | Not Applicable |
|
Principal Occupation During at Least the Past 5 Years: Deputy General Counsel, Franklin Templeton; and officer of some of the other subsidiaries of Franklin Resources, Inc. and of 44 of the investment companies in Franklin Templeton. |
| | | | |
| | | |
38 | | Annual Report | | ftinstitutional.com |
FRANKLIN GLOBAL TRUST
Interested Board Members and Officers(continued)
| | | | | | | | |
Name, Year of Birth
and Address | | Position | | Length of
Time Served | | Number of Portfolios in
Fund Complex Overseen
by Board Member* | | Other Directorships Held
During at Least the Past 5 Years |
| | | | |
Sonal Desai, Ph.D. (1963) One Franklin Parkway
San Mateo, CA 94403-1906 | | Vice President | | Since December 2018 | | Not Applicable | | Not Applicable |
|
Principal Occupation During at Least the Past 5 Years: Director and Executive Vice President, Franklin Advisers, Inc.; Executive Vice President, Franklin Templeton Institutional, LLC; and officer of 18 of the investment companies in Franklin Templeton. |
| | | | |
Gaston Gardey (1967) One Franklin Parkway
San Mateo, CA 94403-1906 | | Treasurer, Chief
Financial
Officer and
Chief
Accounting
Officer | | Since 2009 | | Not Applicable | | Not Applicable |
|
Principal Occupation During at Least the Past 5 Years: Treasurer, U.S. Fund Administration & Reporting, Franklin Templeton; and officer of 26 of the investment companies in Franklin Templeton. |
| | | | |
Aliya S. Gordon (1973)
One Franklin Parkway
San Mateo, CA 94403-1906 | | Vice President | | Since 2009 | | Not Applicable | | Not Applicable |
|
Principal Occupation During at Least the Past 5 Years: Senior Associate General Counsel, Franklin Templeton; Vice President and Secretary, Franklin Resources, Inc.; and officer of 44 of the investment companies in Franklin Templeton. |
| | | | |
Steven J. Gray (1955)
One Franklin Parkway
San Mateo, CA 94403-1906 | | Vice President
and Co-
Secretary | | Vice President since 2009 andCo-Secretary since January 2019 | | Not Applicable | | Not Applicable |
|
Principal Occupation During at Least the Past 5 Years: Senior Associate General Counsel, Franklin Templeton; Vice President, Franklin Templeton Distributors, Inc. and FASA, LLC; and officer of 44 of the investment companies in Franklin Templeton. |
| | | | |
Matthew T. Hinkle (1971)
One Franklin Parkway
San Mateo, CA 94403-1906 | | Chief Executive
Officer –
Finance and
Administration | | Since 2017 | | Not Applicable | | Not Applicable |
|
Principal Occupation During at Least the Past 5 Years: Senior Vice President, Franklin Templeton Services, LLC; officer of 44 of the investment companies in Franklin Templeton; andformerly, Vice President, Global Tax (2012-April 2017) and Treasurer/Assistant Treasurer, Franklin Templeton (2009-2017). |
| | | | |
Robert Lim (1948)
One Franklin Parkway
San Mateo, CA 94403-1906 | | Vice President
– AML
Compliance | | Since 2016 | | Not Applicable | | Not Applicable |
|
Principal Occupation During at Least the Past 5 Years: Vice President, Franklin Templeton Companies, LLC; Chief Compliance Officer, Franklin Templeton Distributors, Inc. and Franklin Templeton Investor Services, LLC; and officer of 44 of the investment companies in Franklin Templeton. |
| | | | |
Kimberly H. Novotny (1972)
300 S.E. 2nd Street
Fort Lauderdale, FL 33301-1923 | | Vice President | | Since 2013 | | Not Applicable | | Not Applicable |
|
Principal Occupation During at Least the Past 5 Years: Senior Associate General Counsel, Franklin Templeton; Vice President and Corporate Secretary, Fiduciary Trust International of the South; Vice President, Templeton Investment Counsel, LLC; Assistant Secretary, Franklin Resources, Inc.; and officer of 44 of the investment companies in Franklin Templeton. |
| | | | |
| | | |
| ftinstitutional.com | | Annual Report | | 39 |
FRANKLIN GLOBAL TRUST
Interested Board Members and Officers(continued)
| | | | | | | | |
Name, Year of Birth
and Address | | Position | | Length of
Time Served | | Number of Portfolios in
Fund Complex Overseen
by Board Member* | | Other Directorships Held
During at Least the Past 5 Years |
| | | | |
Edward D. Perks (1970) One Franklin Parkway
San Mateo, CA 94403-1906 | | President and
Chief
Executive
Officer –
Investment
Management | | Since December 2018 | | Not Applicable | | Not Applicable |
|
Principal Occupation During at Least the Past 5 Years: President and Director, Franklin Advisers, Inc.; and officer of nine of the investment companies in Franklin Templeton (since December 2018). |
| | | | |
Robert C. Rosselot (1960)
300 S.E. 2nd Street
Fort Lauderdale, FL 33301-1923 | | Chief
Compliance
Officer | | Since 2013 | | Not Applicable | | Not Applicable |
|
Principal Occupation During at Least the Past 5 Years:
Director, Global Compliance, Franklin Templeton; Vice President, Franklin Templeton Companies, LLC; officer of 44 of the investment companies in Franklin Templeton; andformerly, Senior Associate General Counsel, Franklin Templeton (2007-2013); and Secretary and Vice President, Templeton Group of Funds (2004-2013). |
| | | | |
Navid J. Tofigh (1972)
One Franklin Parkway
San Mateo, CA 94403-1906 | | Vice President | | Since 2015 | | Not Applicable | | Not Applicable |
|
Principal Occupation During at Least the Past 5 Years: Associate General Counsel and officer of 44 of the investment companies in Franklin Templeton. |
| | | | |
Craig S. Tyle (1960)
One Franklin Parkway
San Mateo, CA 94403-1906 | | Vice President | | Since 2005 | | Not Applicable | | Not Applicable |
|
Principal Occupation During at Least the Past 5 Years: General Counsel and Executive Vice President, Franklin Resources, Inc.; and officer of some of the other subsidiaries of Franklin Resources, Inc. and of 44 of the investment companies in Franklin Templeton. |
| | | | |
Lori A. Weber (1964)
300 S.E. 2nd Street
Fort Lauderdale, FL 33301-1923 | | Vice President
and
Co-Secretary | | Vice President since 2011 andCo-Secretary since January 2019 | | Not Applicable | | Not Applicable |
|
Principal Occupation During at Least the Past 5 Years: Senior Associate General Counsel, Franklin Templeton; Assistant Secretary, Franklin Resources, Inc.; Vice President and Secretary, Templeton Investment Counsel, LLC; and officer of 44 of the investment companies in Franklin Templeton. |
| | | | |
| | | |
40 | | Annual Report | | ftinstitutional.com |
FRANKLIN GLOBAL TRUST
*We base the number of portfolios on each separate series of the U.S. registered investment companies within the Franklin Templeton Investments fund complex. These portfolios have a common investment manager or affiliated investment managers.
**Gregory E. Johnson is considered to be an interested person of the Fund under the federal securities laws due to his position as an officer and director of Franklin Resources, Inc. (Resources), which is the parent company of the Fund’s investment manager and distributor. Rupert H. Johnson, Jr. is considered to be an interested person of the Fund under the federal securities laws due to his position as an officer and director and major shareholder of Resources.
Note 1: Rupert H. Johnson, Jr. is the uncle of Gregory E. Johnson.
Note 2: Effective March 12, 2019, John B. Wilson ceased to be a trustee of the Trust.
Note 3: Officer information is current as of the date of this report. It is possible that after this date, information about officers may change.
The Sarbanes-Oxley Act of 2002 and Rules adopted by the Securities and Exchange Commission require the Fund to disclose whether the Fund’s Audit Committee includes at least one member who is an audit committee financial expert within the meaning of such Act and Rules. The Fund’s Board has determined that there is at least one such financial expert on the Audit Committee and has designated Mary C. Choksi as its audit committee financial expert. The Board believes that Ms. Choksi qualifies as such an expert in view of her extensive business background and experience. She currently serves as a director of Avis Budget Group, Inc. (2007-present) and formerly, Founder and Senior Advisor, Strategic Investment Group (1987 to 2017). Ms. Choksi has been a Member of the Fund’s Audit Committee since 2014. As a result of such background and experience, the Board believes that Ms. Choksi has acquired an understanding of generally accepted accounting principles and financial statements, the general application of such principles in connection with the accounting estimates, accruals and reserves, and analyzing and evaluating financial statements that present a breadth and level of complexity of accounting issues generally comparable to those of the Fund, as well as an understanding of internal controls and procedures for financial reporting and an understanding of audit committee functions. Ms. Choksi is an independent Board member as that term is defined under the relevant Securities and Exchange Commission Rules and Releases.
The Statement of Additional Information (SAI) includes additional information about the board members and is available, without charge, upon request. Shareholders may call (800) DIALBEN/342-5236 to request the SAI.
| | | | |
| | | |
| ftinstitutional.com | | Annual Report | | 41 |
FRANKLIN GLOBAL TRUST
FRANKLIN EMERGING MARKET DEBT OPPORTUNITIES FUND
Shareholder Information
Board Approval of Investment
Management Agreements
FRANKLIN GLOBAL TRUST
Franklin Emerging Market Debt Opportunities Fund
(Fund)
At anin-person meeting held on February 26, 2019 (Meeting), the Board of Trustees (Board) of Franklin Global Trust (Trust), including a majority of the trustees who are not “interested persons” as defined in the Investment Company Act of 1940 (Independent Trustees), reviewed and approved the continuance of the investment management agreement between Franklin Templeton Investment Management Limited (Manager) and the Trust, on behalf of the Fund (Management Agreement) for an additionalone-year period. The Independent Trustees received advice from and met separately with Independent Trustee counsel in considering whether to approve the continuation of the Management Agreement.
In considering the continuation of the Management Agreement, the Board reviewed and considered information provided by the Manager at the Meeting and throughout the year at meetings of the Board and its committees. The Board also reviewed and considered information provided in response to a detailed set of requests for information submitted to the Manager by Independent Trustee counsel on behalf of the Independent Trustees in connection with the annual contract renewal process. In addition, prior to the Meeting, the Independent Trustees held a telephonic contract renewal meeting at which the Independent Trustees conferred amongst themselves and Independent Trustee counsel about contract renewal matters. The Board reviewed and considered all of the factors it deemed relevant in approving the continuance of the Management Agreement, including, but not limited to: (i) the nature, extent and quality of the services provided by the Manager; (ii) the investment performance of the Fund; (iii) the costs of the services provided and profits realized by the Manager and its affiliates from the relationship with the Fund; (iv) the extent to which economies of scale are realized as the Fund grows; and (v) whether fee levels reflect these economies of scale for the benefit of Fund investors.
In approving the continuance of the Management Agreement, the Board, including a majority of the Independent Trustees, determined that the terms of the Management Agreement are fair and reasonable and that the continuance of such Management Agreement is in the
interests of the Fund and its shareholders. While attention was given to all information furnished, the following discusses some primary factors relevant to the Board’s determination.
Nature, Extent and Quality of Services
The Board reviewed and considered information regarding the nature, extent and quality of investment management services provided by the Manager and its affiliates to the Fund and its shareholders. This information included, among other things, the qualifications, background and experience of the senior management and investment personnel of the Manager; the structure of investment personnel compensation; oversight of third-party service providers; investment performance reports and related financial information for the Fund; reports on expenses, shareholder services, marketing support payments made to financial intermediaries and third party servicing arrangements; legal and compliance matters; risk controls; pricing and other services provided by the Manager and its affiliates; and management fees charged by the Manager and its affiliates to US funds and other accounts, including management’s explanation of differences among accounts where relevant. The Board also reviewed and considered an annual report on payments made by Franklin Templeton Investments (FTI) or the Fund to financial intermediaries, as well as a memorandum relating to third-party servicing arrangements in response to a guidance update in 2016 from the US Securities and Exchange Commission (SEC) relating to mutual fund distribution andsub-accounting fees. The Board noted management’s continuing efforts and expenditures in establishing effective business continuity plans and developing strategies to address areas of heightened concern in the mutual fund industry, such as cybersecurity and liquidity risk management. The Board also recognized management’s commitment to facilitating Board oversight of liquidity through the designation of a liquidity/risk administrator and the development of reports that highlight the amount of illiquid investments for the Fund.
The Board also reviewed and considered the benefits provided to Fund shareholders of investing in a fund that is part of the Franklin Templeton family of funds. The Board noted the financial position of Franklin Resources, Inc. (FRI), the Manager’s parent, and its commitment to the mutual fund business as evidenced by its continued introduction of new funds, reassessment of the fund offerings in response to the market environment and project initiatives and capital investments relating to the services provided to the Fund by the FTI organization.
| | | | |
| | | |
42 | | Annual Report | | ftinstitutional.com |
FRANKLIN GLOBAL TRUST
FRANKLIN EMERGING MARKET DEBT OPPORTUNITIES FUND
SHAREHOLDER INFORMATION
Following consideration of such information, the Board was satisfied with the nature, extent and quality of services provided by the Manager and its affiliates to the Fund and its shareholders.
Fund Performance
The Board reviewed and considered the performance results of the Fund over various time periods ended December 31, 2018. The Board considered the performance returns for the Fund in comparison to the performance returns of mutual funds deemed comparable to the Fund included in a universe (Performance Universe) selected by Broadridge Financial Solutions, Inc. (Broadridge), an independent provider of investment company data. The Board received a description of the methodology used by Broadridge to select the mutual funds included in a Performance Universe. The Board also reviewed and considered Fund performance reports provided and discussions that occurred with portfolio managers at Board meetings throughout the year. A summary of the Fund’s performance results is below.
The Performance Universe for the Fund included the Fund and all retail and institutional emerging markets hard currency debt funds. The Board noted that the Fund’s annualized total return for theone-, three-, five- and10-year periods was above the median of its Performance Universe. The Board concluded that the Fund’s performance was satisfactory.
Comparative Fees and Expenses
The Board reviewed and considered information regarding the Fund’s actual total expense ratio and its various components, including, as applicable, management fees; transfer agent expenses; underlying fund expenses; Rule12b-1 andnon-Rule12b-1 service fees; and othernon-management fees. The Board also noted the quarterly and annual reports it receives on all marketing support payments made by FTI to financial intermediaries. The Board considered the actual total expense ratio and, separately, the contractual management fee rate, without the effect of fee waivers, if any (Management Rate) of the Fund in comparison to the median expense ratio and median Management Rate, respectively, of other mutual funds deemed comparable to and with a similar expense structure to the Fund selected by Broadridge (Expense Group). Broadridge fee and expense data is based upon information taken from each fund’s most recent annual report, which reflects historical asset levels that may be quite different from those currently existing, particularly in a period of market volatility. While recognizing such inherent limitation
and the fact that expense ratios and Management Rates generally increase as assets decline and decrease as assets grow, the Board believed the independent analysis conducted by Broadridge to be an appropriate measure of comparative fees and expenses. The Broadridge Management Rate includes administrative charges, and the actual total expense ratio, for comparative consistency, was shown for Advisor Class, Class F3, Institutional Class and Class I shares for funds in the Expense Group with multiple classes of shares. The Board received a description of the methodology used by Broadridge to select the mutual funds included in an Expense Group.
The Expense Group for the Fund included the Fund and 10 other emerging markets hard currency debt funds. The Board noted that the Management Rate and actual total expense ratio for the Fund were above the medians of its Expense Group. The Board acknowledged management’s explanation that there are additional complexities and expenses associated with the management of the specialized portfolio. The Board concluded that the Management Rate charged to the Fund is reasonable in light of management’s explanation, the Fund’s first quintile (best) performance for theone-, three- and10-year periods and the fee waiver from management on the Fund’s actual total expense ratio.
Profitability
The Board reviewed and considered information regarding the profits realized by the Manager and its affiliates in connection with the operation of the Fund. In this respect, the Board considered the Fund profitability analysis provided by the Manager that addresses the overall profitability of FTI’s US fund business, as well as its profits in providing investment management and other services to each of the individual funds during the12-month period ended September 30, 2018, being the most recent fiscalyear-end for FRI. The Board noted that although management continually makes refinements to its methodologies used in calculating profitability in response to organizational and product-related changes, the overall methodology has remained consistent with that used in the Fund’s profitability report presentations from prior years. Additionally, PricewaterhouseCoopers LLP, auditor to FRI and certain Franklin Templeton funds, has been engaged by the Manager to periodically review and assess the allocation methodologies to be used solely by the Fund’s Board with respect to the profitability analysis.
| | | | |
| | | |
| ftinstitutional.com | | Annual Report | | 43 |
FRANKLIN GLOBAL TRUST
FRANKLIN EMERGING MARKET DEBT OPPORTUNITIES FUND
SHAREHOLDER INFORMATION
The Board noted management’s belief that costs incurred in establishing the infrastructure necessary for the type of mutual fund operations conducted by the Manager and its affiliates may not be fully reflected in the expenses allocated to the Fund in determining its profitability, as well as the fact that the level of profits, to a certain extent, reflected operational cost savings and efficiencies initiated by management. The Board also noted management’s expenditures in improving shareholder services provided to the Fund, as well as the need to implement systems and meet additional regulatory and compliance requirements resulting from recent SEC and other regulatory requirements.
The Board also considered the extent to which the Manager and its affiliates might derive ancillary benefits from fund operations, including revenues generated from transfer agent services, potential benefits resulting from personnel and systems enhancements necessitated by fund growth, as well as increased leverage with service providers and counterparties. Based upon its consideration of all these factors, the Board concluded that the level of profits realized by the Manager and its affiliates from providing services to the Fund was not excessive in view of the nature, extent and quality of services provided to the Fund.
Economies of Scale
The Board reviewed and considered the extent to which the Manager may realize economies of scale, if any, as the Fund grows larger and whether the Fund’s management fee structure reflects any economies of scale for the benefit of shareholders. With respect to possible economies of scale, the Board noted the existence of management fee breakpoints, which operate generally to share any economies of scale with the Fund’s shareholders by reducing the Fund’s effective management fees as the Fund grows in size. The Board considered the Manager’s view that any analyses of potential economies of scale in managing a particular fund are inherently limited in light of the joint and common costs and investments the Manager incurs across the Franklin Templeton family of funds as a whole. The Board noted that the Fund had experienced a decrease in assets and would not be expected to demonstrate additional economies of scale in the near term.
Conclusion
Based on its review, consideration and evaluation of all factors it believed relevant, including the above-described factors and conclusions, the Board unanimously approved
the continuation of the Management Agreement for an additionalone-year period.
Proxy Voting Policies and Procedures
The Fund’s investment manager has established Proxy Voting Policies and Procedures (Policies) that the Fund uses to determine how to vote proxies relating to portfolio securities. Shareholders may view the Fund’s complete Policies online at franklintempleton.com. Alternatively, shareholders may request copies of the Policies free of charge by calling the Proxy Group collect at (954)527-7678 or by sending a written request to: Franklin Templeton Companies, LLC, 300 S.E. 2nd Street, Fort Lauderdale, FL 33301, Attention: Proxy Group. Copies of the Fund’s proxy voting records are also made available online at franklintempleton.com and posted on the U.S. Securities and Exchange Commission’s website at sec.gov and reflect the most recent12-month period ended June 30.
Quarterly Consolidated Statement of Investments
The Trust, on behalf of the Fund, files a complete consolidated statement of investments with the U.S. Securities and Exchange Commission for the first and third quarters for each fiscal year as an exhibit to its report on FormN-PORT. Shareholders may view the filed FormN-PORT by visiting the Commission’s website at sec.gov. The filed form may also be viewed and copied at the Commission’s Public Reference Room in Washington, DC. Information regarding the operations of the Public Reference Room may be obtained by calling(800) SEC-0330.
Householding of Reports and Prospectuses
You will receive the Fund’s financial reports every six months as well as an annual updated summary prospectus (prospectus available upon request). To reduce Fund expenses, we try to identify related shareholders in a household and send only one copy of the financial reports and summary prospectus. This process, called “householding,” will continue indefinitely unless you instruct us otherwise. If you prefer not to have these documents householded, please call us at (800)632-2301. At any time you may view current prospectuses/summary prospectuses and financial reports on our website. If you choose, you may receive these documents through electronic delivery.
| | | | |
| | | |
44 | | Annual Report | | ftinstitutional.com |
Authorized for distribution only when accompanied or preceded by a summary prospectus and/or prospectus. Investors should carefully consider a fund’s investment goals, risks, charges and expenses before investing. A prospectus contains this and other information; please read it carefully before investing.
To help ensure we provide you with quality service, all calls to and from our service areas are monitored and/or recorded.
| | | | | | |
 | | Annual Report Franklin Emerging Market Debt Opportunities Fund | | |
| | | | |
| | Investment Manager | | Distributor | | Franklin Templeton |
| | Franklin Templeton | | Franklin Templeton Distributors, Inc. | | Institutional Services |
| | Investment Management | | | | (800)321-8563 |
| | Limited | | | | ftinstitutional.com |
| | |
| © 2019 Franklin Templeton Investments. All rights reserved. | | 699 A 09/19 |
Sign up for electronic delivery at franklintempleton.com/edelivery
Internet Delivery of Fund Reports Unless You Request Paper Copies:Effective January 1, 2021, as permitted by the SEC, paper copies of the Fund’s shareholder reports will no longer be sent by mail, unless you specifically request them from the Fund or your financial intermediary. Instead, the reports will be made available on a website, and you will be notified by mail each time a report is posted and provided with a website link to access the report.
If you already elected to receive shareholder reports electronically, you will not be affected by this change and you need not take any action. If you have not signed up for electronic delivery, we would encourage you to join fellow shareholders who have. You may elect to receive shareholder reports and other communications electronically from the Fund by calling (800)632-2301 or by contacting your financial intermediary.
You may elect to continue to receive paper copies of all your future shareholder reports free of charge by contacting your financial intermediary or, if you invest directly with a Fund, calling (800)632-2301 to let the Fund know of your request. Your election to receive reports in paper will apply to all funds held in your account.
FRANKLIN TEMPLETON
Successful investing begins with ambition. And achievement only comes when you reach for it. That’s why we continually strive to deliver better outcomes for investors. No matter what your goals are, our deep, global investment expertise allows us to offer solutions that can help.
During our more than 70 years of experience, we’ve managed through all kinds of markets—up, down and those in between. We’re always preparing for what may come next. It’s because of this, combined with our strength as one of the world’s largest asset managers that we’ve earned the trust of millions of investors around the world.
Dear Shareholder:
During the 12 months ended July 31, 2019, the global economy generally expanded amid positive economic data in certain regions, healthy corporate earnings, and the U.S. Federal Reserve’s (Fed’s) patient monetary policy stance. The European Central Bank left its benchmark interest rate unchanged and announced it would not raise rates in the next year due to risks including Brexit and global trade tensions. The Fed raised its target range for the federal funds rate by 0.25% at its September and December 2018 meetings, to 2.25%–2.50%. However, at its July 2019 meeting, the Fed lowered its target range to 2.00%–2.25%, citing muted inflation and the implications of global developments for the U.S. economy. Global markets were pressured by trade tensions between the U.S. and its trading partners and other geopolitical risks. In this environment, U.S. stocks, as measured by the Standard & Poor’s® 500 Index, and global developed market stocks, as measured by the MSCI World Index, ended the period with positive returns.
We are committed to our long-term perspective and disciplined investment approach as we conduct a rigorous, fundamental analysis of securities with a regular emphasis on investment risk management.
We believe active, professional investment management serves investors well. We also recognize the important role of financial advisors in today’s markets and encourage investors to continue to seek their advice. Amid changing markets and economic conditions, we are confident investors
with a well-diversified portfolio and a patient, long-term outlook should be well positioned for the years ahead.
Franklin Global Listed Infrastructure Fund’s annual report includes more detail about prevailing conditions and discussions about investment decisions during the period. Please remember all securities markets fluctuate, as do mutual fund share prices.
We thank you for investing with Franklin Templeton, welcome your questions and comments, and look forward to serving your future investment needs.
Sincerely,

Edward Perks, CFA
President and Chief Executive Officer –
Investment Management
Franklin Global Trust
This letter reflects our analysis and opinions as of July 31, 2019, unless otherwise indicated. The information is not a complete analysis of every aspect of any market, country, industry, security or fund. Statements of fact are from sources considered reliable.
CFA® is a trademark owned by CFA Institute.
|
Not FDIC Insured | May Lose Value | No Bank Guarantee |
| | | | |
| | | |
| franklintempleton.com | | Not part of the annual report | | 1 |
| | |
| Visitfranklintempleton.comfor fund updates, to access your account, or to find helpful financial planning tools. |
| | | | |
| | | |
2 | | Annual Report | | franklintempleton.com |
ANNUAL REPORT
Franklin Global Listed Infrastructure Fund
This annual report for Franklin Global Listed Infrastructure Fund covers the fiscal year ended July 31, 2019. As previously communicated, the Fund is anticipated to be liquidated on or about November 6, 2019 (Liquidation Date), but may be delayed if unforeseen circumstances arise. Effective at the close of market on August 19, 2019, the Fund closed to all new investors, with limited exceptions. The Fund will not accept any additional purchases after the close of market on or about November 4, 2019. The Fund reserves the right to change this policy at any time. Shareholders of the Fund on the Liquidation Date will have their accounts liquidated and the proceeds will be delivered to them.
Your Fund’s Goal and Main Investments
The Fund seeks total investment return consisting of income and capital appreciation by investing, under normal market conditions, at least 80% of its net assets in infrastructure-related companies globally, as defined in the Fund’s prospectus.
Performance Overview
For the period under review, the Fund’s Class A shares posted a +9.26% cumulative total return. In comparison, the Standard & Poor’s (S&P®) Global Infrastructure Index, which tracks performance of stocks of large infrastructure companies around the world, posted a +8.01% cumulative total return.1 You can find more of the Fund’s performance data in the Performance Summary beginning on page 8.
Performance data represent past performance, which does not guarantee future results. Investment return and principal value will fluctuate, and you may have a gain or loss when you sell your shares. Current performance may differ from figures shown. For most recentmonth-end performance, go tofranklintempleton.comor call(800)342-5236.
Economic and Market Overview
The U.S. economy grew during the 12 months ended July 31, 2019. After moderating for two consecutive quarters, the economy grew significantly faster in 2019’s first quarter.
Portfolio Composition
Based on Total Net Assets as of 7/31/19

However, the economy moderated again in the second quarter, due to weakness in inventory investment, exports, business investment and housing investment. The unemployment rate decreased from 3.9% in July 2018 to 3.7% atperiod-end.2 The annual inflation rate, as measured by the Consumer Price Index, decreased from 2.9% in July 2018 to 1.9% atperiod-end.2
The U.S. Federal Reserve (Fed) raised its target range for the federal funds rate by 0.25% at its September and December 2018 meetings, to 2.25%–2.50%. However, at its July 2019 meeting, the Fed lowered the federal funds target
1. Source: Morningstar.
The index is unmanaged and includes reinvestment of any income or distributions. It does not reflect any fees, expenses or sales charges. One cannot invest directly in an index, and an index is not representative of the Fund’s portfolio.
2. Source: U.S. Bureau of Labor Statistics.
The dollar value, number of shares or principal amount, and names of all portfolio holdings are listed in the Fund’s Statement of Investments (SOI).
The SOI begins on page 17.
| | | | |
| | | |
| franklintempleton.com | | Annual Report | | 3 |
FRANKLIN GLOBAL LISTED INFRASTRUCTURE FUND
rate for the first time since December 2008, to 2.00%–2.25%, citing muted inflation pressures and the potential effects of global trade tensions on economic growth. Furthermore, the Fed ended its balance sheet normalization program two months earlier than previously indicated. The broad U.S. stock market, as measured by the Standard & Poor’s® 500 Index, posted a +8.52% total return for the 12 months under review.1
The global economy expanded during the period, despite weakness in certain regions. Global developed and emerging market stocks were aided by upbeat economic data in some regions, encouraging corporate earnings reports and periods of optimism about a potential U.S.-China trade deal. The Fed’s patient approach to its monetary policy in early 2019, recent rate cut and indications it will act appropriately to sustain U.S. economic expansion and achieve its inflation objective aided market sentiment.
However, markets reflected concerns about the Fed’s interest-rate hikes and the European Central Bank’s (ECB’s) unwinding of its bond purchase program in 2018, political uncertainties in the U.S. and the European Union, and the impact of U.S. trade disputes with China and other trading partners on global growth and corporate earnings. In this environment, global developed and emerging market stocks, as measured by the MSCI All Country World Index, posted a +3.52% total return for the12-month period.1
In Europe, the U.K.’s quarterly gross domestic product (GDP) growth accelerated in 2018’s third quarter, moderated in the fourth quarter and reaccelerated in 2019’s first quarter. However, GDP contracted in the second quarter compared with the first quarter, as Brexit uncertainties weighed on business sentiment. The Bank of England raised its key policy rate once during the period. The eurozone’s quarterly GDP growth moderated in 2018’s third quarter and accelerated in the next two quarters, before moderating again in 2019’s second quarter. The bloc’s annual inflation rate decreased during the period. The ECB concluded its bond purchase program at the end of 2018 and kept its benchmark interest rate unchanged. In June, the ECB mentioned it would leave interest rates unchanged through the first half of 2020 and provided details of its new stimulus. However, the ECB signaled in July the potential for a rate cut, while indicating support for additional stimulus to bolster economic expansion.
In Asia, Japan’s quarterly GDP growth contracted in 2018’s third quarter, accelerated in the next two quarters and moderated in 2019’s second quarter. The Bank of Japan (BOJ) left its benchmark interest rate unchanged and continued its stimulus measures during the period. In July,
the BOJ expressed its openness to increase stimulus to sustain economic growth and achieve its inflation goal. China’s annual GDP growth rate moderated in 2018’s third and fourth quarters, held steady in 2019’s first quarter and moderated in the second quarter to its lowest level since 1992, amid trade tensions with the U.S. and weak global demand. The People’s Bank of China left its benchmark interest rate unchanged, but it took measures to improve financial liquidity to mitigate the effects of the U.S.-China trade dispute and support economic growth.
Investment Strategy
When selecting investments for the Fund’s portfolio, we use abottom-up stock selection process that incorporates macro-level views in the evaluation process. Our portfolio construction process combinesbottom-up analysis of individual stock and infrastructure market fundamentals withtop-down macro overlays to provide country/regional, infrastructure sector and company size perspectives in identifying international/local cyclical and thematic trends that highlight investment opportunities. Under normal market conditions, the Fund invests at least 80% of its net assets in securities listed on a domestic or foreign exchange of companies that are located around the world (including emerging markets) and whose principal business is the ownership, management, construction, operation, use or financing of infrastructure assets. Under normal market conditions, the Fund expects to invest at least 40% of its net assets in foreign securities. We may invest up to 20% of net assets in emerging markets and may invest in infrastructure-related companies of any market capitalization size. We may use derivative instruments, including currency forward and futures contracts, from time to time to help manage currency risks and manage local currency exposure.
What is a currency forward contract?
A currency forward contract is an agreement between the Fund and a counterparty to buy or sell a foreign currency in exchange for another currency at a specific exchange rate on a future date. Currency forward contracts are privately traded in the interbank market, not on a centralized exchange.
What is a futures contract?
A futures contract is an agreement between the Fund and a counterparty made through a U.S. or foreign futures exchange to buy or sell an underlying instrument or asset at a specific price on a future date.
| | | | |
| | | |
4 | | Annual Report | | franklintempleton.com |
FRANKLIN GLOBAL LISTED INFRASTRUCTURE FUND
Geographic Composition
Based on Total Net Assets as of 7/31/19
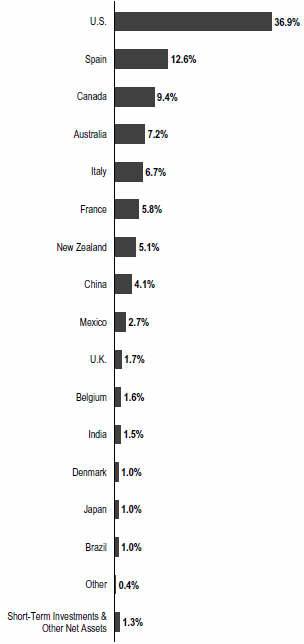
Manager’s Discussion
During the 12 months under review, stock selection and an overweighting in the utilities sector contributed to relative performance versus the S&P Global Infrastructure Index with
anoff-benchmark investment in American Water Works proving especially beneficial.3 Shares of the New Jersey-based water utility with operations in 47 states and Canada rose steadily and significantly following the company’s investor day in December 2018. Company management unveiled its five-year $8 billion capital investment plan and disclosed its expectation thatper-share earnings would continue to grow through 2022. In April 2019, American Water announced a dividend increase, providing investors with additional confidence that the company was on track to deliver on its growth strategy.
Anoff-benchmark allocation to the communication services sector also enhanced results.4 Shares of Spanish telecommunications infrastructure firm Cellnex Telecom, Europe’s largest independent tower operator, advanced over the period. Investors were encouraged by the company’s aggressive plans to accommodate carriers’ expansion into 5G wireless services. The company’s stock price has also continued to benefit from investor optimism regarding the company’s aggressive acquisition strategy. In May 2019, shares of Cellnex surged on the announcement of the company’s purchase of over 10,000 communications towers across Europe from regional telecommunication firms Iliad and Salt Mobile (not Fund holdings). The deal significantly increased Cellnex’s European tower portfolio.
Other individual contributors included Auckland International Airport. The company provides airport facilities, supporting infrastructure, and aeronautical services in Auckland, New Zealand. Consistent with the past few years, the company reported strong passenger traffic growth during the period. In September 2018, it announced a successful retail bond offering, and in November 2018, investors were also encouraged by the company’s development and leasing of significant new industrial and warehousing facilities close to the airport, likely signaling a potential increase in logistics and freight traffic through the airport due to the continuing growth ofe-commerce. The company’s shares rose in value after it reported an increase in total passenger traffic for the fiscal year 2018 versus the same period in the prior year.
Conversely, security selection in the industrials sector detracted from relative Fund performance over the12-month reporting period.5 Shares of Atlantia, an Italian toll road and airport operator, declined to a four-year low during August 2018, in the wake of the Genoa Bridge (operated by an Atlantia subsidiary) collapse that killed 43 people.
3. The utilities sector comprises electric utilities, gas utilities, multi-utilities and water utilities in the SOI.
4. The communication services sector comprises integrated telecommunication services in the SOI.
5. The industrials sector comprises marine ports and services, railroads, airport services, environmental and facilities services and highways and railtracks in the SOI.
| | | | |
| | | |
| franklintempleton.com | | Annual Report | | 5 |
FRANKLIN GLOBAL LISTED INFRASTRUCTURE FUND
Immediately following the tragedy, the Italian government began the process to revoke the company’s operating concessions. Given the uncertainty surrounding the political and reputational risk to Atlantia, we reduced the position to an underweight allocation relative to the benchmark. As a result of a more rational investigation into causality of the bridge collapse and the potential costs related to any possible revocation of long-term contractual concessions, the shares rebounded from the August 2018 lows.
The Fund’s positioning in the energy sector also hampered results.6 Shares of U.S.-based Cheniere Energy were pressured at times during the period but ended with a moderate gain for the 12 months. The company’s only business consists of its majority limited partner interest in Cheniere Energy Partners (not a Fund holding), a U.S.-based company primarily engaged in exporting liquefied natural gas (LNG). The Fund holds a significant overweight position in Cheniere relative to its benchmark and the shares underperformed the benchmark return during the period. Concerns that Chinese tariffs could adversely affect demand from the world’s second-largest global importer of liquified natural gas (behind Japan) at times led to investor uncertainty. Although the tariff was smaller than originally expected, the timing of the tariffs coincides with the initiation of several new export terminals originally built to service expected demand from China. More recently, investor sentiment has become increasingly negative regarding U.S.-China trade and there are some concerns regarding 2019 guidance given weak spot market prices.
Other individual detractors included Infraestructura Energetica Nova (IENOVA), which is a subsidiary of U.S.-based Sempra Energy, and is a Mexico-based developer and operator of pipelines and other energy infrastructure assets. Two of the company’s pipelines, one previously operational and one nearly completed development joint venture, have been subject to contractual disputes with the CFE (Comision Federal de Electricidad, the state-owned electric utility of Mexico) over separate force majeure issues. While contractual disputes between the parties appear specific and resolvable, investors remain concerned that a court has not yet permitted repairs on one pipeline and that the Sur de Texas marine pipeline has not yet been granted an operating permit by the government.
It is important to recognize the effect of currency movements on the Fund’s performance. In general, if the value of the U.S. dollar goes up compared with a foreign currency, an
Top 10 Holdings
7/31/19
| | |
Company Sector/Industry, Country | | % of Total
Net Assets |
| |
TC Energy Corp. Oil & Gas Storage & Transportation, Canada | | 5.1% |
| |
Auckland International Airport Ltd. Airport Services, New Zealand | | 5.1% |
| |
Sempra Energy Multi-Utilities, U.S. | | 4.8% |
| |
Xcel Energy Inc. Electric Utilities, U.S. | | 4.1% |
| |
Atlantia SpA Highways & Railtracks, Italy | | 4.0% |
| |
American Electric Power Co. Inc. Electric Utilities, U.S. | | 4.0% |
| |
Cellnex Telecom SA Integrated Telecommunication Services, Spain | | 4.0% |
| |
Transurban Group Highways & Railtracks, Australia | | 3.9% |
| |
Cheniere Energy Inc. Oil & Gas Storage & Transportation, U.S. | | 3.5% |
| |
NextEra Energy Inc. Electric Utilities, U.S. | | 3.5% |
investment traded in that foreign currency will go down in value because it will be worth fewer U.S. dollars. This can have a negative effect on Fund performance. Conversely, when the U.S. dollar weakens in relation to a foreign currency, an investment traded in that foreign currency will increase in value, which can contribute to Fund performance. For the 12 months ended July 31, 2019, the U.S. dollar rose in value relative to most currencies. As a result, the Fund’s performance was negatively affected by the portfolio’s substantial investment in securities withnon-U.S. currency exposure.
On August 1, 2019, just afterperiod-end, Ketul Sakhpara (Portfolio Manager) stepped off the Fund. His responsibilities have been allocated to others in the portfolio management team.
6. The energy sector comprises oil and gas storage and transportation in the SOI.
See www.franklintempletondatasources.com for additional data provider information.
| | | | |
| | | |
6 | | Annual Report | | franklintempleton.com |
FRANKLIN GLOBAL LISTED INFRASTRUCTURE FUND
Thank you for your continued participation in Franklin Global Listed Infrastructure Fund. We look forward to serving your future investment needs.
| | |
 | |  Wilson Magee |
| | |
 | |  Ketul Sakhpara, CFA |
| |
| | Portfolio Management Team |
The foregoing information reflects our analysis, opinions and portfolio holdings as of July 31, 2019, the end of the reporting period. The way we implement our main investment strategies and the resulting portfolio holdings may change depending on factors such as market and economic conditions. These opinions may not be relied upon as investment advice or an offer for a particular security. The information is not a complete analysis of every aspect of any market, country, industry, security or the Fund. Statements of fact are from sources considered reliable, but the investment manager makes no representation or warranty as to their completeness or accuracy. Although historical performance is no guarantee of future results, these insights may help you understand our investment management philosophy.
| | | | |
| | | |
| franklintempleton.com | | Annual Report | | 7 |
FRANKLIN GLOBAL LISTED INFRASTRUCTURE FUND
Performance Summary as of July 31, 2019
The performance table and graphs do not reflect any taxes that a shareholder would pay on Fund dividends, capital gain distributions, if any, or any realized gains on the sale of Fund shares. Total return reflects reinvestment of the Fund’s dividends and capital gain distributions, if any, and any unrealized gains or losses. Your dividend income will vary depending on dividends or interest paid by securities in the Fund’s portfolio, adjusted for operating expenses of each class. Capital gain distributions are net profits realized from the sale of portfolio securities.
Performance as of 7/31/191
Cumulative total return excludes sales charges. Average annual total return includes maximum sales charges. Sales charges will vary depending on the size of the investment and the class of share purchased. The maximum is 5.50% and the minimum is 0%.Class A:5.50% maximum initial sales charge;Advisor Class:no sales charges. For other share classes, visitfranklintempleton.com.
| | | | |
| Share Class | | Cumulative Total Return2 | | Average Annual Total Return3 |
| | |
A4 | | | | |
| | |
1-Year | | +9.26% | | +3.28% |
| | |
5-Year | | +31.42% | | +4.42% |
| | |
Since Inception (9/6/13) | | +64.01% | | +7.72% |
| | |
Advisor | | | | |
| | |
1-Year | | +9.59% | | +9.59% |
| | |
5-Year | | +33.12% | | +5.89% |
| | |
Since Inception (9/6/13) | | +66.57% | | +9.04% |
Performance data represent past performance, which does not guarantee future results. Investment return and principal value will fluctuate, and you may have a gain or loss when you sell your shares. Current performance may differ from figures shown. For most recentmonth-end performance, go tofranklintempleton.comor call(800)342-5236.
See page 10 for Performance Summary footnotes.
| | | | |
| | | |
8 | | Annual Report | | franklintempleton.com |
FRANKLIN GLOBAL LISTED INFRASTRUCTURE FUND
PERFORMANCE SUMMARY
Total Return Index Comparison for a Hypothetical $10,000 Investment1
Total return represents the change in value of an investment over the periods shown. It includes any applicable maximum sales charge, Fund expenses, account fees and reinvested distributions. The unmanaged index includes reinvestment of any income or distributions. It differs from the Fund in composition and does not pay management fees or expenses. One cannot invest directly in an index.
Class A(9/6/13–7/31/19)
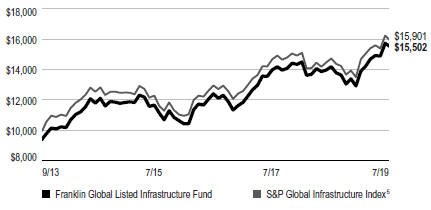
Advisor Class(9/6/13–7/31/19)
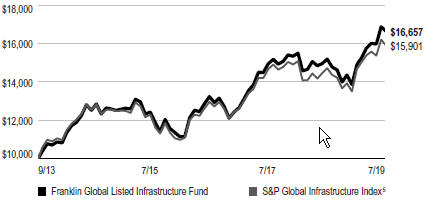
See page 10 for Performance Summary footnotes.
| | | | |
| | | |
| franklintempleton.com | | Annual Report | | 9 |
FRANKLIN GLOBAL LISTED INFRASTRUCTURE FUND
PERFORMANCE SUMMARY
Distributions(8/1/18–7/31/19)
| | | | |
Share Class | | Net Investment
Income | |
| A | | | $0.2263 | |
| C | | | $0.1171 | |
| R | | | $0.1940 | |
| R6 | | | $0.2846 | |
| Advisor | | | $0.2593 | |
Total Annual Operating Expenses6
| | | | | | |
Share Class | | With Fee Waiver | | | Without Fee Waiver |
A | | | 1.24% | | | 1.75% |
Advisor | | | 0.99% | | | 1.50% |
Each class of shares is available to certain eligible investors and has different annual fees and expenses, as described in the prospectus.
All investments involve risks, including possible loss of principal. Investments in infrastructure-related securities involve special risks, such as high interest costs, high leverage and increased susceptibility to adverse economic or regulatory developments affecting the sector. Special risks are associated with foreign investing, including currency-rate fluctuations, economic instability and political developments. Because the Fund may invest at least a significant portion of its assets in companies in a specific region, including Europe, the Fund is subject to greater risks of adverse developments in that region and/or the surrounding regions than a fund that is more broadly diversified geographically. Investments in utility company securities, if purchased for dividend yield, involve additional interest-rate risks. When interest rates have risen, the stock prices of these companies have tended to fall. Thus, as the prices of utility company stocks in the Fund adjust to a rise in interest rates, the Fund’s share price may decline. By focusing on an industry or group of industries, the Fund carries much greater risk of adverse developments and price movements in such industries than a fund that invests in a wider variety of industries. The Fund is actively managed but there is no guarantee that the manager’s investment decisions will produce the desired results. The Fund’s prospectus also includes a description of the main investment risks.
1. The Fund has an expense reduction contractually guaranteed through 11/30/19. Fund investment results reflect the expense reduction; without this reduction, the results would have been lower.
2. Cumulative total return represents the change in value of an investment over the periods indicated.
3. Average annual total return represents the average annual change in value of an investment over the periods indicated. Return for less than one year, if any, has not been annualized.
4. Prior to 9/10/18, these shares were offered at a higher initial sales charge of 5.75%, thus actual returns (with sales charges) would have differed. Average annual total returns (with sales charges) have been restated to reflect the current maximum initial sales charge of 5.50%.
5. Source: Morningstar. The S&P Global Infrastructure Index tracks performance of stocks of large infrastructure companies around the world. The index includes companies involved in utilities, energy and transportation infrastructure, such as management or ownership of oil and gas storage and transportation; airport services; highways and rail tracks; marine ports and services; and electric, gas and water utilities.
6. Figures are as stated in the Fund’s current prospectus and may differ from the expense ratios disclosed in the Your Fund’s Expenses and Financial Highlights sections in this report. In periods of market volatility, assets may decline significantly, causing total annual Fund operating expenses to become higher than the figures shown.
See www.franklintempletondatasources.com for additional data provider information.
| | | | |
| | | |
10 | | Annual Report | | franklintempleton.com |
FRANKLIN GLOBAL LISTED INFRASTRUCTURE FUND
Your Fund’s Expenses
As a Fund shareholder, you can incur two types of costs: (1) transaction costs, including sales charges (loads) on Fund purchases and redemptions; and (2) ongoing Fund costs, including management fees, distribution and service(12b-1) fees, and other Fund expenses. All mutual funds have ongoing costs, sometimes referred to as operating expenses. The table below shows ongoing costs of investing in the Fund and can help you understand these costs and compare them with those of other mutual funds. The table assumes a $1,000 investment held for the six months indicated.
Actual Fund Expenses
The table below provides information about actual account values and actual expenses in the columns under the heading “Actual.” In these columns the Fund’s actual return, which includes the effect of Fund expenses, is used to calculate the “Ending Account Value” for each class of shares. You can estimate the expenses you paid during the period by following these steps (ofcourse, your account value and expenses will differ from those in this illustration):Divide your account value by $1,000 (ifyour account had an $8,600 value, then $8,600÷ $1,000 = 8.6). Then multiply the result by the number in the row for your class of shares under the headings “Actual” and “Expenses Paid During Period” (ifActual Expenses Paid During Period were $7.50, then 8.6 x $7.50 = $64.50). In this illustration, the actual expenses paid this period are $64.50.
Hypothetical Example for Comparison with Other Funds
Under the heading “Hypothetical” in the table, information is provided about hypothetical account values and hypothetical expenses based on the Fund’s actual expense ratio and an assumed rate of return of 5% per year before expenses, which is not the Fund’s actual return. This information may not be used to estimate the actual ending account balance or expenses you paid for the period, but it can help you compare ongoing costs of investing in the Fund with those of other funds. To do so, compare this 5% hypothetical example for the class of shares you hold with the 5% hypothetical examples that appear in the shareholder reports of other funds.
Please note that expenses shown in the table are meant to highlight ongoing costs and do not reflect any transactional costs. Therefore, information under the heading “Hypothetical” is useful in comparing ongoing costs only, and will not help you compare total costs of owning different funds. In addition, if transactional costs were included, your total costs would have been higher.
| | | | | | | | | | | | |
| | | | | Actual | | Hypothetical | | |
| | | | | (actual return after expenses) | | (5% annual return before expenses) | | |
Share
Class | | Beginning
Account
Value 2/1/19 | | Ending
Account
Value 7/31/19 | | Expenses Paid During
Period 2/1/19–7/31/191, 2 | | Ending
Account
Value 7/31/19 | | Expenses Paid During Period 2/1/19–7/31/191,2 | | Net
Annualized
Expense
Ratio2 |
| | | | | | |
| A | | $1,000 | | $1,115.10 | | $6.29 | | $1,018.84 | | $6.01 | | 1.20% |
| C | | $1,000 | | $1,111.70 | | $10.16 | | $1,015.17 | | $9.69 | | 1.94% |
| R | | $1,000 | | $1,113.40 | | $7.60 | | $1,017.60 | | $7.25 | | 1.45% |
| R6 | | $1,000 | | $1,117.40 | | $4.30 | | $1,020.73 | | $4.11 | | 0.82% |
| Advisor | | $1,000 | | $1,116.70 | | $4.99 | | $1,020.08 | | $4.76 | | 0.95% |
1. Expenses are equal to the annualized expense ratio for thesix-month period as indicated above—in the far right column—multiplied by the simple average account value over the period indicated, and then multiplied by 181/365 to reflect theone-half year period.
2. Reflects expenses after fee waivers and expense reimbursements. Does not include acquired fund fees and expenses.
| | | | |
| | | |
| franklintempleton.com | | Annual Report | | 11 |
FRANKLIN GLOBAL TRUST
Financial Highlights
Franklin Global Listed Infrastructure Fund
| | | | | | | | | | | | | | | | | | | | |
| | | Year Ended July 31, | |
| | | 2019 | | | 2018 | | | 2017 | | | 2016 | | | 2015 | |
| | | | | |
Class A | | | | | | | | | | | | | | | | | | | | |
| | | | | |
Per share operating performance | | | | | | | | | | | | | | | | | | | | |
(for a share outstanding throughout the year) | | | | | | | | | | | | | | | | | | | | |
| | | | | |
Net asset value, beginning of year | | | $13.62 | | | | $13.66 | | | | $12.35 | | | | $11.81 | | | | $12.35 | |
| | | | | |
Income from investment operationsa: | | | | | | | | | | | | | | | | | | | | |
| | | | | |
Net investment incomeb | | | 0.25 | | | | 0.29 | | | | 0.26 | | | | 0.22 | | | | 0.19 | |
| | | | | |
Net realized and unrealized gains (losses) | | | 1.00 | | | | (0.10 | ) | | | 1.27 | | | | 0.51 | | | | (0.34 | ) |
| | | | | |
Total from investment operations | | | 1.25 | | | | 0.19 | | | | 1.53 | | | | 0.73 | | | | (0.15 | ) |
| | | | | |
Less distributions from: | | | | | | | | | | | | | | | | | | | | |
| | | | | |
Net investment income | | | (0.23 | ) | | | (0.23 | ) | | | (0.22 | ) | | | (0.18 | ) | | | (0.19 | ) |
| | | | | |
Net realized gains | | | — | | | | — | | | | — | | | | (0.01 | ) | | | (0.20 | ) |
| | | | | |
Total distributions | | | (0.23 | ) | | | (0.23 | ) | | | (0.22 | ) | | | (0.19 | ) | | | (0.39 | ) |
| | | | | |
Net asset value, end of year | | | $14.64 | | | | $13.62 | | | | $13.66 | | | | $12.35 | | | | $11.81 | |
| | | | | |
Total returnc | | | 9.26% | | | | 1.46% | | | | 12.68% | | | | 6.35% | | | | (1.08)% | |
| | | | | |
Ratios to average net assets | | | | | | | | | | | | | | | | | | | | |
| | | | | |
Expenses before waiver and payments by affiliates | | | 1.79% | | | | 1.79% | | | | 1.99% | | | | 2.24% | | | | 2.21% | |
| | | | | |
Expenses net of waiver and payments by affiliatesd | | | 1.21% | | | | 1.32% | | | | 1.38% | | | | 1.40% | | | | 1.45% | |
| | | | | |
Net investment income | | | 1.88% | | | | 2.12% | | | | 2.10% | | | | 1.93% | | | | 1.62% | |
| | | | | |
Supplemental data | | | | | | | | | | | | | | | | | | | | |
| | | | | |
Net assets, end of year (000’s) | | | $46,281 | | | | $52,551 | | | | $39,991 | | | | $24,889 | | | | $28,568 | |
| | | | | |
Portfolio turnover rate | | | 74.26% | | | | 97.40% | | | | 71.81% | | | | 63.57% | | | | 50.75% | |
aThe amount shown for a share outstanding throughout the period may not correlate with the Statement of Operations for the period due to the timing of sales and repurchases of the Fund’s shares in relation to income earned and/or fluctuating fair value of the investments of the Fund.
bBased on average daily shares outstanding.
cTotal return does not reflect sales commissions or contingent deferred sales charges, if applicable.
dBenefit of expense reduction rounds to less than 0.01%.
| | | | |
| | | |
12 | | Annual Report | The accompanying notes are an integral part of these financial statements. | | franklintempleton.com |
FRANKLIN GLOBAL TRUST
FINANCIAL HIGHLIGHTS
Franklin Global Listed Infrastructure Fund(continued)
| | | | | | | | | | | | | | | | | | | | |
| | | Year Ended July 31, | |
| | | 2019 | | | 2018 | | | 2017 | | | 2016 | | | 2015 | |
| | | | | |
Class C | | | | | | | | | | | | | | | | | | | | |
| | | | | |
Per share operating performance | | | | | | | | | | | | | | | | | | | | |
(for a share outstanding throughout the year) | | | | | | | | | | | | | | | | | | | | |
| | | | | |
Net asset value, beginning of year | | | $13.53 | | | | $13.57 | | | | $12.28 | | | | $11.74 | | | | $12.28 | |
| | | | | |
Income from investment operationsa: | | | | | | | | | | | | | | | | | | | | |
| | | | | |
Net investment incomeb | | | 0.15 | | | | 0.18 | | | | 0.17 | | | | 0.13 | | | | 0.11 | |
| | | | | |
Net realized and unrealized gains (losses) | | | 0.99 | | | | (0.09 | ) | | | 1.26 | | | | 0.51 | | | | (0.33 | ) |
| | | | | |
Total from investment operations | | | 1.14 | | | | 0.09 | | | | 1.43 | | | | 0.64 | | | | (0.22 | ) |
| | | | | |
Less distributions from: | | | | | | | | | | | | | | | | | | | | |
| | | | | |
Net investment income | | | (0.12 | ) | | | (0.13 | ) | | | (0.14 | ) | | | (0.09 | ) | | | (0.12 | ) |
| | | | | |
Net realized gains | | | — | | | | — | | | | — | | | | (0.01 | ) | | | (0.20 | ) |
| | | | | |
Total distributions | | | (0.12 | ) | | | (0.13 | ) | | | (0.14 | ) | | | (0.10 | ) | | | (0.32 | ) |
| | | | | |
Net asset value, end of year | | | $14.55 | | | | $13.53 | | | | $13.57 | | | | $12.28 | | | | $11.74 | |
| | | | | |
Total returnc | | | 8.51% | | | | 0.65% | | | | 11.86% | | | | 5.58% | | | | (1.78)% | |
| | | | | |
Ratios to average net assets | | | | | | | | | | | | | | | | | | | | |
| | | | | |
Expenses before waiver and payments by affiliates | | | 2.53% | | | | 2.54% | | | | 2.74% | | | | 2.99% | | | | 2.91% | |
| | | | | |
Expenses net of waiver and payments by affiliatesd | | | 1.95% | | | | 2.07% | | | | 2.13% | | | | 2.15% | | | | 2.15% | |
| | | | | |
Net investment income | | | 1.14% | | | | 1.37% | | | | 1.35% | | | | 1.18% | | | | 0.92% | |
| | | | | |
Supplemental data | | | | | | | | | | | | | | | | | | | | |
| | | | | |
Net assets, end of year (000’s) | | | $7,088 | | | | $9,598 | | | | $8,299 | | | | $4,515 | | | | $4,855 | |
| | | | | |
Portfolio turnover rate | | | 74.26% | | | | 97.40% | | | | 71.81% | | | | 63.57% | | | | 50.75% | |
aThe amount shown for a share outstanding throughout the period may not correlate with the Statement of Operations for the period due to the timing of sales and repurchases of the Fund’s shares in relation to income earned and/or fluctuating fair value of the investments of the Fund.
bBased on average daily shares outstanding.
cTotal return does not reflect sales commissions or contingent deferred sales charges, if applicable.
dBenefit of expense reduction rounds to less than 0.01%.
| | | | |
| | | |
| franklintempleton.com | | The accompanying notes are an integral part of these financial statements. | Annual Report | | 13 |
FRANKLIN GLOBAL TRUST
FINANCIAL HIGHLIGHTS
Franklin Global Listed Infrastructure Fund(continued)
| | | | | | | | | | | | | | | | | | | | |
| | | Year Ended July 31, | |
| | | 2019 | | | 2018 | | | 2017 | | | 2016 | | | 2015 | |
| | | | | |
Class R | | | | | | | | | | | | | | | | | | | | |
| | | | | |
Per share operating performance | | | | | | | | | | | | | | | | | | | | |
(for a share outstanding throughout the year) | | | | | | | | | | | | | | | | | | | | |
| | | | | |
Net asset value, beginning of year | | | $13.61 | | | | $13.64 | | | | $12.34 | | | | $11.80 | | | | $12.32 | |
| | | | | |
Income from investment operationsa: | | | | | | | | | | | | | | | | | | | | |
| | | | | |
Net investment incomeb | | | 0.22 | | | | 0.24 | | | | 0.24 | | | | 0.19 | | | | 0.16 | |
| | | | | |
Net realized and unrealized gains (losses) | | | 0.98 | | | | (0.09 | ) | | | 1.27 | | | | 0.51 | | | | (0.33 | ) |
| | | | | |
Total from investment operations | | | 1.20 | | | | 0.15 | | | | 1.51 | | | | 0.70 | | | | (0.17 | ) |
| | | | | |
Less distributions from: | | | | | | | | | | | | | | | | | | | | |
| | | | | |
Net investment income | | | (0.19 | ) | | | (0.18 | ) | | | (0.21 | ) | | | (0.15 | ) | | | (0.15 | ) |
| | | | | |
Net realized gains | | | — | | | | — | | | | — | | | | (0.01 | ) | | | (0.20 | ) |
| | | | | |
Total distributions | | | (0.19 | ) | | | (0.18 | ) | | | (0.21 | ) | | | (0.16 | ) | | | (0.35 | ) |
| | | | | |
Net asset value, end of year | | | $14.62 | | | | $13.61 | | | | $13.64 | | | | $12.34 | | | | $11.80 | |
| | | | | |
Total return | | | 9.01% | | | | 1.12% | | | | 12.48% | | | | 6.08% | | | | (1.29)% | |
| | | | | |
Ratios to average net assets | | | | | | | | | | | | | | | | | | | | |
| | | | | |
Expenses before waiver and payments by affiliates | | | 2.04% | | | | 2.06% | | | | 2.19% | | | | 2.47% | | | | 2.41% | |
| | | | | |
Expenses net of waiver and payments by affiliatesc | | | 1.46% | | | | 1.59% | | | | 1.58% | | | | 1.63% | | | | 1.65% | |
| | | | | |
Net investment income | | | 1.63% | | | | 1.85% | | | | 1.90% | | | | 1.70% | | | | 1.42% | |
| | | | | |
Supplemental data | | | | | | | | | | | | | | | | | | | | |
| | | | | |
Net assets, end of year (000’s) | | | $88 | | | | $85 | | | | $96 | | | | $63 | | | | $62 | |
| | | | | |
Portfolio turnover rate | | | 74.26% | | | | 97.40% | | | | 71.81% | | | | 63.57% | | | | 50.75% | |
aThe amount shown for a share outstanding throughout the period may not correlate with the Statement of Operations for the period due to the timing of sales and repurchases of the Fund’s shares in relation to income earned and/or fluctuating fair value of the investments of the Fund.
bBased on average daily shares outstanding.
cBenefit of expense reduction rounds to less than 0.01%.
| | | | |
| | | |
14 | | Annual Report | The accompanying notes are an integral part of these financial statements. | | franklintempleton.com |
FRANKLIN GLOBAL TRUST
FINANCIAL HIGHLIGHTS
Franklin Global Listed Infrastructure Fund(continued)
| | | | | | | | | | | | | | | | | | | | |
| | | Year Ended July 31, | |
| | | 2019 | | | 2018 | | | 2017 | | | 2016 | | | 2015 | |
| | | | | |
Class R6 | | | | | | | | | | | | | | | | | | | | |
| | | | | |
Per share operating performance | | | | | | | | | | | | | | | | | | | | |
(for a share outstanding throughout the year) | | | | | | | | | | | | | | | | | | | | |
| | | | | |
Net asset value, beginning of year | | | $13.67 | | | | $13.70 | | | | $12.37 | | | | $11.83 | | | | $12.36 | |
| | | | | |
Income from investment operationsa: | | | | | | | | | | | | | | | | | | | | |
| | | | | |
Net investment incomeb | | | 0.31 | | | | 0.38 | | | | 0.30 | | | | 0.27 | | | | 0.23 | |
| | | | | |
Net realized and unrealized gains (losses) | | | 0.98 | | | | (0.13 | ) | | | 1.30 | | | | 0.50 | | | | (0.33 | ) |
| | | | | |
Total from investment operations | | | 1.29 | | | | 0.25 | | | | 1.60 | | | | 0.77 | | | | (0.10 | ) |
| | | | | |
Less distributions from: | | | | | | | | | | | | | | | | | | | | |
| | | | | |
Net investment income | | | (0.28 | ) | | | (0.28 | ) | | | (0.27 | ) | | | (0.22 | ) | | | (0.23 | ) |
| | | | | |
Net realized gains | | | — | | | | — | | | | — | | | | (0.01 | ) | | | (0.20 | ) |
| | | | | |
Total distributions | | | (0.28 | ) | | | (0.28 | ) | | | (0.27 | ) | | | (0.23 | ) | | | (0.43 | ) |
| | | | | |
Net asset value, end of year | | | $14.68 | | | | $13.67 | | | | $13.70 | | | | $12.37 | | | | $11.83 | |
| | | | | |
Total return | | | 9.71% | | | | 1.87% | | | | 13.27% | | | | 6.78% | | | | (0.75)% | |
| | | | | |
Ratios to average net assets | | | | | | | | | | | | | | | | | | | | |
| | | | | |
Expenses before waiver and payments by affiliates | | | 1.47% | | | | 1.39% | | | | 2.31% | | | | 2.26% | | | | 2.17% | |
| | | | | |
Expenses net of waiver and payments by affiliatesc | | | 0.82% | | | | 0.88% | | | | 0.94% | | | | 1.00% | | | | 1.07% | |
| | | | | |
Net investment income | | | 2.27% | | | | 2.57% | | | | 2.54% | | | | 2.33% | | | | 2.00% | |
| | | | | |
Supplemental data | | | | | | | | | | | | | | | | | | | | |
| | | | | |
Net assets, end of year (000’s) | | | $1,532 | | | | $1,737 | | | | $14 | | | | $12 | | | | $12 | |
| | | | | |
Portfolio turnover rate | | | 74.26% | | | | 97.40% | | | | 71.81% | | | | 63.57% | | | | 50.75% | |
aThe amount shown for a share outstanding throughout the period may not correlate with the Statement of Operations for the period due to the timing of sales and repurchases of the Fund’s shares in relation to income earned and/or fluctuating fair value of the investments of the Fund.
bBased on average daily shares outstanding.
cBenefit of expense reduction rounds to less than 0.01%.
| | | | |
| | | |
| franklintempleton.com | | The accompanying notes are an integral part of these financial statements. | Annual Report | | 15 |
FRANKLIN GLOBAL TRUST
FINANCIAL HIGHLIGHTS
Franklin Global Listed Infrastructure Fund(continued)
| | | | | | | | | | | | | | | | | | | | |
| | | Year Ended July 31, | |
| | | 2019 | | | 2018 | | | 2017 | | | 2016 | | | 2015 | |
| | | | | |
Advisor Class | | | | | | | | | | | | | | | | | | | | |
| | | | | |
Per share operating performance | | | | | | | | | | | | | | | | | | | | |
(for a share outstanding throughout the year) | | | | | | | | | | | | | | | | | | | | |
| | | | | |
Net asset value, beginning of year | | | $13.65 | | | | $13.69 | | | | $12.37 | | | | $11.83 | | | | $12.36 | |
| | | | | |
Income from investment operationsa: | | | | | | | | | | | | | | | | | | | | |
| | | | | |
Net investment incomeb | | | 0.29 | | | | 0.33 | | | | 0.32 | | | | 0.25 | | | | 0.20 | |
| | | | | |
Net realized and unrealized gains (losses) | | | 0.99 | | | | (0.11 | ) | | | 1.26 | | | | 0.51 | | | | (0.31 | ) |
| | | | | |
Total from investment operations | | | 1.28 | | | | 0.22 | | | | 1.58 | | | | 0.76 | | | | (0.11 | ) |
| | | | | |
Less distributions from: | | | | | | | | | | | | | | | | | | | | |
| | | | | |
Net investment income | | | (0.26 | ) | | | (0.26 | ) | | | (0.26 | ) | | | (0.21 | ) | | | (0.22 | ) |
| | | | | |
Net realized gains | | | — | | | | — | | | | — | | | | (0.01 | ) | | | (0.20 | ) |
| | | | | |
Total distributions | | | (0.26 | ) | | | (0.26 | ) | | | (0.26 | ) | | | (0.22 | ) | | | (0.42 | ) |
| | | | | |
Net asset value, end of year | | | $14.67 | | | | $13.65 | | | | $13.69 | | | | $12.37 | | | | $11.83 | |
| | | | | |
Total return | | | 9.59% | | | | 1.62% | | | | 13.05% | | | | 6.53% | | | | (0.74)% | |
| | | | | |
Ratios to average net assets | | | | | | | | | | | | | | | | | | | | |
| | | | | |
Expenses before waiver and payments by affiliates | | | 1.54% | | | | 1.54% | | | | 1.74% | | | | 1.99% | | | | 1.91% | |
| | | | | |
Expenses net of waiver and payments by affiliatesc | | | 0.96% | | | | 1.07% | | | | 1.13% | | | | 1.15% | | | | 1.15% | |
| | | | | |
Net investment income | | | 2.13% | | | | 2.37% | | | | 2.35% | | | | 2.18% | | | | 1.92% | |
| | | | | |
Supplemental data | | | | | | | | | | | | | | | | | | | | |
| | | | | |
Net assets, end of year (000’s) | | | $6,553 | | | | $9,250 | | | | $5,220 | | | | $957 | | | | $556 | |
| | | | | |
Portfolio turnover rate | | | 74.26% | | | | 97.40% | | | | 71.81% | | | | 63.57% | | | | 50.75% | |
aThe amount shown for a share outstanding throughout the period may not correlate with the Statement of Operations for the period due to the timing of sales and repurchases of the Fund’s shares in relation to income earned and/or fluctuating fair value of the investments of the Fund.
bBased on average daily shares outstanding.
cBenefit of expense reduction rounds to less than 0.01%.
| | | | |
| | | |
16 | | Annual Report | The accompanying notes are an integral part of these financial statements. | | franklintempleton.com |
FRANKLIN GLOBAL TRUST
Statement of Investments, July 31, 2019
Franklin Global Listed Infrastructure Fund
| | | | | | | | | | | | |
| | | Country | | | Shares/
Units | | | Value | |
| | | |
Common Stocks and Other Equity Interests 98.7% | | | | | | | | | | | | |
Airport Services 16.6% | | | | | | | | | | | | |
Aena SME SA | | | Spain | | | | 11,091 | | | $ | 2,013,867 | |
Aeroports de Paris SA | | | France | | | | 8,882 | | | | 1,530,209 | |
Auckland International Airport Ltd. | | | New Zealand | | | | 511,301 | | | | 3,119,357 | |
Beijing Capital International Airport Co. Ltd. | | | China | | | | 626,000 | | | | 495,800 | |
Enav SpA | | | Italy | | | | 93,150 | | | | 513,703 | |
Grupo Aeroportuario del Pacifico SAB de CV, ADR | | | Mexico | | | | 12,551 | | | | 1,256,230 | |
Japan Airport Terminal Co. Ltd. | | | Japan | | | | 14,900 | | | | 620,234 | |
Sydney Airport | | | Australia | | | | 119,037 | | | | 680,334 | |
| | | |
| | | | | | | | | | | 10,229,734 | |
| | | |
Construction & Engineering 3.3% | | | | | | | | | | | | |
aFerrovial SA | | | Spain | | | | 54,326 | | | | 1,415,631 | |
Sadbhav Engineering Ltd. | | | India | | | | 61,853 | | | | 126,176 | |
Vinci SA | | | France | | | | 4,670 | | | | 481,804 | |
| | | |
| | | | | | | | | | | 2,023,611 | |
| | | |
Electric Utilities 24.1% | | | | | | | | | | | | |
Alliant Energy Corp. | | | United States | | | | 32,900 | | | | 1,629,866 | |
American Electric Power Co. Inc. | | | United States | | | | 28,270 | | | | 2,482,389 | |
Elia System Operator SA/NV | | | Belgium | | | | 12,800 | | | | 974,428 | |
Enel Chile SA | | | Chile | | | | 2,647,836 | | | | 240,185 | |
FirstEnergy Corp. | | | United States | | | | 25,800 | | | | 1,134,426 | |
aIberdrola SA | | | Spain | | | | 197,239 | | | | 1,870,359 | |
NextEra Energy Inc. | | | United States | | | | 10,340 | | | | 2,142,138 | |
Orsted AS | | | Denmark | | | | 6,823 | | | | 622,956 | |
Terna Rete Elettrica Nazionale SpA | | | Italy | | | | 196,234 | | | | 1,195,100 | |
Xcel Energy Inc. | | | United States | | | | 42,900 | | | | 2,557,269 | |
| | | |
| | | | | | | | | | | 14,849,116 | |
| | | |
Environmental & Facilities Services 1.1% | | | | | | | | | | | | |
Cleanaway Waste Management Ltd. | | | Australia | | | | 420,439 | | | | 695,588 | |
Gas Utilities 5.3% | | | | | | | | | | | | |
AltaGas Canada Inc. | | | Canada | | | | 30,200 | | | | 590,385 | |
Atmos Energy Corp. | | | United States | | | | 7,400 | | | | 806,896 | |
ENN Energy Holdings Ltd. | | | China | | | | 57,800 | | | | 599,918 | |
Gujarat State Petronet Ltd. | | | India | | | | 255,550 | | | | 786,408 | |
Infraestructura Energetica Nova SAB de CV | | | Mexico | | | | 121,100 | | | | 466,914 | |
| | | |
| | | | | | | | | | | 3,250,521 | |
| | | |
Highways & Railtracks 11.5% | | | | | | | | | | | | |
Atlantia SpA | | | Italy | | | | 96,734 | | | | 2,489,661 | |
Atlas Arteria Ltd. | | | Australia | | | | 124,104 | | | | 694,870 | |
Getlink SE | | | France | | | | 106,877 | | | | 1,543,285 | |
Transurban Group | | | Australia | | | | 224,635 | | | | 2,388,040 | |
| | | |
| | | | | | | | | | | 7,115,856 | |
| | | | |
| | | |
| franklintempleton.com | | Annual Report | | 17 |
FRANKLIN GLOBAL TRUST
STATEMENT OF INVESTMENTS
Franklin Global Listed Infrastructure Fund(continued)
| | | | | | | | | | | | |
| | | Country | | | Shares/
Units | | | Value | |
| | | |
Common Stocks and Other Equity Interests (continued) | | | | | | | | | | | | |
Integrated Telecommunication Services 5.3% | | | | | | | | | | | | |
Cellnex Telecom SA | | | Spain | | | | 65,584 | | | $ | 2,459,353 | |
b,cChina Tower Corp. Ltd., H, 144A, Reg S | | | China | | | | 3,106,900 | | | | 809,652 | |
| | | |
| | | | | | | | | | | 3,269,005 | |
| | | |
Marine Ports & Services 0.7% | | | | | | | | | | | | |
COSCO SHIPPING Ports Ltd. | | | China | | | | 468,000 | | | | 410,120 | |
| | | |
Multi-Utilities 8.1% | | | | | | | | | | | | |
CMS Energy Corp. | | | United States | | | | 29,400 | | | | 1,711,668 | |
Dominion Energy Inc. | | | United States | | | | 4,500 | | | | 334,305 | |
Sempra Energy | | | United States | | | | 21,660 | | | | 2,933,414 | |
| | | |
| | | | | | | | | | | 4,979,387 | |
| | | |
Oil & Gas Storage & Transportation 16.8% | | | | | | | | | | | | |
aCheniere Energy Inc. | | | United States | | | | 33,350 | | | | 2,172,753 | |
Enbridge Inc. | | | Canada | | | | 20,344 | | | | 679,495 | |
Energy Transfer LP | | | United States | | | | 55,487 | | | | 797,903 | |
ONEOK Inc. | | | United States | | | | 26,800 | | | | 1,878,144 | |
Pembina Pipeline Corp. | | | Canada | | | | 37,229 | | | | 1,350,935 | |
Targa Resources Corp. | | | United States | | | | 8,320 | | | | 323,731 | |
TC Energy Corp. | | | Canada | | | | 63,807 | | | | 3,124,234 | |
| | | |
| | | | | | | | | | | 10,327,195 | |
| | | |
Railroads 1.0% | | | | | | | | | | | | |
aRumo SA | | | Brazil | | | | 103,900 | | | | 597,108 | |
| | | |
Water Utilities 4.9% | | | | | | | | | | | | |
American Water Works Co. Inc. | | | United States | | | | 8,220 | | | | 943,491 | |
Aqua America Inc. | | | United States | | | | 20,400 | | | | 855,780 | |
Guangdong Investment Ltd. | | | China | | | | 96,000 | | | | 202,347 | |
Pennon Group PLC | | | United Kingdom | | | | 73,493 | | | | 640,337 | |
Severn Trent PLC | | | United Kingdom | | | | 14,546 | | | | 356,075 | |
| | | |
| | | | | | | | | | | 2,998,030 | |
| | | |
Total Common Stocks and Other Equity Interests
(Cost $49,429,945) | | | | | | | | | | | 60,745,271 | |
| | | |
Short Term Investments (Cost $1,050) 0.0%† | | | | | | | | | | | | |
| | | |
Money Market Funds 0.0%† | | | | | | | | | | | | |
d,eInstitutional Fiduciary Trust Money Market Portfolio, 2.00% | | | United States | | | | 1,050 | | | | 1,050 | |
Total Investments (Cost $49,430,995) 98.7% | | | | | | | | | | | 60,746,321 | |
Other Assets, less Liabilities 1.3% | | | | | | | | | | | 795,637 | |
| | | |
Net Assets 100.0% | | | | | | | | | | $ | 61,541,958 | |
| | | | |
| | | |
18 | | Annual Report | | franklintempleton.com |
FRANKLIN GLOBAL TRUST
STATEMENT OF INVESTMENTS
Franklin Global Listed Infrastructure Fund(continued)
See Abbreviations on page 31.
†Rounds to less than 0.1% of net assets.
aNon-income producing.
bSecurity was purchased pursuant to Rule 144A under the Securities Act of 1933 and may be sold in transactions exempt from registration only to qualified institutional buyers or in a public offering registered under the Securities Act of 1933. This security has been deemed liquid under guidelines approved by the Trust’s Board of Trustees. At July 31, 2019, the value of this security was $809,652, representing 1.3% of net assets.
cSecurity was purchased pursuant to Regulation S under the Securities Act of 1933, which exempts from registration securities offered and sold outside of the United States. Such a security cannot be sold in the United States without either an effective registration statement filed pursuant to the Securities Act of 1933, or pursuant to an exemption from registration. This security has been deemed liquid under guidelines approved by the Trust’s Board of Trustees. At July 31, 2019, the value of this security was $809,652, representing 1.3% of net assets.
dSee Note 3(f) regarding investments in affiliated management investment companies.
eThe rate shown is the annualizedseven-day effective yield at period end.
| | | | |
| | | |
| franklintempleton.com | | The accompanying notes are an integral part of these financial statements. | Annual Report | | 19 |
FRANKLIN GLOBAL TRUST
FINANCIAL STATEMENTS
Statement of Assets and Liabilities
July 31, 2019
Franklin Global Listed Infrastructure Fund
| | | | |
Assets: | | | | |
Investments in securities: | | | | |
Cost - Unaffiliated issuers | | | $49,429,945 | |
Cost -Non-controlled affiliates (Note 3f) | | | 1,050 | |
| | | | |
Value - Unaffiliated issuers | | | $60,745,271 | |
Value -Non-controlled affiliates (Note 3f) | | | 1,050 | |
Foreign currency, at value (cost $18,351) | | | 18,341 | |
Receivables: | | | | |
Investment securities sold | | | 1,269,743 | |
Capital shares sold | | | 36,972 | |
Dividends | | | 139,958 | |
Other assets | | | 38 | |
| | | | |
| |
Total assets | | | 62,211,373 | |
| | | | |
| |
Liabilities: | | | | |
Payables: | | | | |
Capital shares redeemed | | | 112,540 | |
Management fees | | | 48,750 | |
Distribution fees | | | 16,976 | |
Transfer agent fees | | | 12,873 | |
Professional fees | | | 51,676 | |
Funds advanced by custodian | | | 409,086 | |
Deferred tax | | | 1,018 | |
Accrued expenses and other liabilities | | | 16,496 | |
| | | | |
| |
Total liabilities | | | 669,415 | |
| | | | |
| |
Net assets, at value | | | $61,541,958 | |
| | | | |
| |
Net assets consist of: | | | | |
Paid-in capital | | | $51,563,955 | |
Total distributable earnings (loss) | | | 9,978,003 | |
| | | | |
| |
Net assets, at value | | | $61,541,958 | |
| | | | |
| | | | |
| | | |
20 | | Annual Report | The accompanying notes are an integral part of these financial statements. | | franklintempleton.com |
FRANKLIN GLOBAL TRUST
FINANCIAL STATEMENTS
Statement of Assets and Liabilities(continued)
July 31, 2019
Franklin Global Listed Infrastructure Fund
| | | | |
Class A: | | | | |
Net assets, at value | | | $46,281,157 | |
| | | | |
Shares outstanding | | | 3,161,264 | |
| | | | |
Net asset value per sharea | | | $14.64 | |
| | | | |
Maximum offering price per share (net asset value per share ÷ 94.50%) | | | $15.49 | |
| | | | |
Class C: | | | | |
Net assets, at value | | | $ 7,087,662 | |
| | | | |
Shares outstanding | | | 487,201 | |
| | | | |
Net asset value and maximum offering price per sharea | | | $14.55 | |
| | | | |
Class R: | | | | |
Net assets, at value | | | $ 88,413 | |
| | | | |
Shares outstanding | | | 6,046 | |
| | | | |
Net asset value and maximum offering price per share | | | $14.62 | |
| | | | |
Class R6: | | | | |
Net assets, at value | | | $1,532,190 | |
| | | | |
Shares outstanding | | | 104,378 | |
| | | | |
Net asset value and maximum offering price per share | | | $14.68 | |
| | | | |
Advisor Class: | | | | |
Net assets, at value | | | $ 6,552,536 | |
| | | | |
Shares outstanding | | | 446,592 | |
| | | | |
Net asset value and maximum offering price per share | | | $14.67 | |
| | | | |
aRedemption price is equal to net asset value less contingent deferred sales charges, if applicable.
| | | | |
| | | |
| franklintempleton.com | | The accompanying notes are an integral part of these financial statements. | Annual Report | | 21 |
FRANKLIN GLOBAL TRUST
FINANCIAL STATEMENTS
Statement of Operations
for the year ended July 31, 2019
Franklin Global Listed Infrastructure Fund
| | | | |
Investment income: | | | | |
Dividends: (net of foreign taxes)* | | | | |
Unaffiliated issuers | | | $1,952,391 | |
Non-controlled affiliates (Note 3f) | | | 6,984 | |
| | | | |
Total investment income | | | 1,959,375 | |
| | | | |
| |
Expenses: | | | | |
Management fees (Note 3a) | | | 634,863 | |
Distribution fees: (Note 3c) | | | | |
Class A | | | 118,805 | |
Class C | | | 73,138 | |
Class R | | | 405 | |
Transfer agent fees: (Note 3e) | | | | |
Class A | | | 82,933 | |
Class C | | | 12,901 | |
Class R | | | 140 | |
Class R6 | | | 1,387 | |
Advisor Class | | | 12,251 | |
Custodian fees (Note 4) | | | 9,576 | |
Reports to shareholders | | | 27,787 | |
Registration and filing fees | | | 60,728 | |
Professional fees | | | 117,720 | |
Trustees’ fees and expenses | | | 3,059 | |
Other | | | 13,215 | |
| | | | |
Total expenses | | | 1,168,908 | |
Expense reductions (Note 4) | | | (23 | ) |
Expenses waived/paid by affiliates (Note 3f and 3g) | | | (366,927 | ) |
| | | | |
| |
Net expenses | | | 801,958 | |
| | | | |
| |
Net investment income | | | 1,157,417 | |
| | | | |
| |
Realized and unrealized gains (losses): | | | | |
Net realized gain (loss) from: | | | | |
Investments:# | | | | |
Unaffiliated issuers | | | 495,733 | |
Foreign currency transactions | | | 21,731 | |
| | | | |
| |
Net realized gain (loss) | | | 517,464 | |
| | | | |
Net change in unrealized appreciation (depreciation) on: | | | | |
Investments: | | | | |
Unaffiliated issuers | | | 3,444,182 | |
Translation of other assets and liabilities denominated in foreign currencies | | | (6,629 | ) |
Change in deferred taxes on unrealized appreciation | | | (1,018 | ) |
| | | | |
| |
Net change in unrealized appreciation (depreciation) | | | 3,436,535 | |
| | | | |
| |
Net realized and unrealized gain (loss) | | | 3,953,999 | |
| | | | |
| |
Net increase (decrease) in net assets resulting from operations | | | $5,111,416 | |
| | | | |
| |
| | | | |
*Foreign taxes withheld on dividends | | | $ 149,187 | |
#Net of foreign taxes | | | $ 45 | |
| | | | |
| | | |
22 | | Annual Report | The accompanying notes are an integral part of these financial statements. | | franklintempleton.com |
FRANKLIN GLOBAL TRUST
FINANCIAL STATEMENTS
Statements of Changes in Net Assets
Franklin Global Listed Infrastructure Fund
| | | | | | | | |
| | | Year Ended July 31, | |
| | | | |
| | | 2019 | | | 2018 | |
| | |
Increase (decrease) in net assets: | | | | | | | | |
Operations: | | | | | | | | |
Net investment income | | | $ 1,157,417 | | | | $ 1,433,895 | |
Net realized gain (loss) | | | 517,464 | | | | 514,486 | |
Net change in unrealized appreciation (depreciation) | | | 3,436,535 | | | | (1,323,828 | ) |
| | |
Net increase (decrease) in net assets resulting from operations | | | 5,111,416 | | | | 624,553 | |
| | |
Distributions to shareholders: (Note 1d) | | | | | | | | |
Class A | | | (806,019 | ) | | | (804,999 | ) |
Class C | | | (71,551 | ) | | | (86,434 | ) |
Class R | | | (1,154 | ) | | | (1,229 | ) |
Class R6 | | | (30,690 | ) | | | (25,039 | ) |
Advisor Class | | | (141,775 | ) | | | (146,403 | ) |
| | |
Total distributions to shareholders | | | (1,051,189 | ) | | | (1,064,104 | ) |
| | |
Capital share transactions: (Note 2) | | | | | | | | |
Class A | | | (9,495,621 | ) | | | 12,877,725 | |
Class C | | | (2,886,765 | ) | | | 1,343,368 | |
Class R | | | (2,984 | ) | | | (9,991 | ) |
Class R6 | | | (279,099 | ) | | | 1,756,159 | |
Advisor Class | | | (3,074,467 | ) | | | 4,073,885 | |
| | |
Total capital share transactions | | | (15,738,936 | ) | | | 20,041,146 | |
| | |
Net increase (decrease) in net assets | | | (11,678,709 | ) | | | 19,601,595 | |
Net assets: | | | | | | | | |
Beginning of year | | | 73,220,667 | | | | 53,619,072 | |
End of year (Note 1d) | | $ | 61,541,958 | | | $ | 73,220,667 | |
| | | | |
| | | |
| franklintempleton.com | | The accompanying notes are an integral part of these financial statements. | Annual Report | | 23 |
FRANKLIN GLOBAL TRUST
Notes to Financial Statements
Franklin Global Listed Infrastructure Fund
1. Organization and Significant Accounting Policies
Franklin Global Trust (Trust) is registered under the Investment Company Act of 1940 (1940 Act) as anopen-end management investment company, consisting of four separate funds and applies the specialized accounting and reporting guidance in U.S. Generally Accepted Accounting Principles (U.S. GAAP). Franklin Global Listed Infrastructure Fund (Fund) is included in this report. The Fund offers five classes of shares: Class A, Class C, Class R, Class R6 and Advisor Class. Beginning on October 19, 2018, Class C shares automatically convert to Class A shares after they have been held for 10 years. Each class of shares may differ by its initial sales load, contingent deferred sales charges, voting rights on matters affecting a single class, its exchange privilege and fees due to differing arrangements for distribution and transfer agent fees.
The following summarizes the Fund’s significant accounting policies.
a. Financial Instrument Valuation
The Fund’s investments in financial instruments are carried at fair value daily. Fair value is the price that would be received to sell an asset or paid to transfer a liability in an orderly transaction between market participants on the measurement date. The Fund calculates the net asset value (NAV) per share each business day as of 4 p.m. Eastern time or the regularly scheduled close of the New York Stock Exchange (NYSE), whichever is earlier. Under compliance policies and procedures approved by the Trust’s Board of Trustees (the Board), the Fund’s administrator has responsibility for oversight of valuation, including leading the cross-functional Valuation Committee (VC). The Fund may utilize independent pricing services, quotations from securities and financial instrument dealers, and other market sources to determine fair value.
Equity securities listed on an exchange or on the NASDAQ National Market System are valued at the last quoted sale price or the official closing price of the day, respectively. Foreign equity securities are valued as of the close of trading on the foreign stock exchange on which the security is primarily traded, or as of 4 p.m. Eastern time. The value is then converted into its U.S. dollar equivalent at the foreign exchange rate in effect at 4 p.m. Eastern time on the day that the value of the security is determined.Over-the-counter (OTC) securities are valued within the range of the most recent quoted bid and ask prices. Securities that trade in
multiple markets or on multiple exchanges are valued according to the broadest and most representative market. Certain equity securities are valued based upon fundamental characteristics or relationships to similar securities.
Investments inopen-end mutual funds are valued at the closing NAV.
The Fund has procedures to determine the fair value of financial instruments for which market prices are not reliable or readily available. Under these procedures, the Fund primarily employs a market-based approach which may use related or comparable assets or liabilities, recent transactions, market multiples, book values, and other relevant information for the investment to determine the fair value of the investment. An income-based valuation approach may also be used in which the anticipated future cash flows of the investment are discounted to calculate fair value. Discounts may also be applied due to the nature or duration of any restrictions on the disposition of the investments. Due to the inherent uncertainty of valuations of such investments, the fair values may differ significantly from the values that would have been used had an active market existed.
Trading in securities on foreign securities stock exchanges and OTC markets may be completed before 4 p.m. Eastern time. In addition, trading in certain foreign markets may not take place on every Fund’s business day. Occasionally, events occur between the time at which trading in a foreign security is completed and 4 p.m. Eastern time that might call into question the reliability of the value of a portfolio security held by the Fund. As a result, differences may arise between the value of the Fund’s portfolio securities as determined at the foreign market close and the latest indications of value at 4 p.m. Eastern time. In order to minimize the potential for these differences, the VC monitors price movements following the close of trading in foreign stock markets through a series of country specific market proxies (such as baskets of American Depositary Receipts, futures contracts and exchange traded funds). These price movements are measured against established trigger thresholds for each specific market proxy to assist in determining if an event has occurred that may call into question the reliability of the values of the foreign securities held by the Fund. If such an event occurs, the securities may be valued using fair value procedures, which may include the use of independent pricing services.
| | | | |
| | | |
24 | | Annual Report | | franklintempleton.com |
FRANKLIN GLOBAL TRUST
NOTES TO FINANCIAL STATEMENTS
Franklin Global Listed Infrastructure Fund(continued)
When the last day of the reporting period is anon-business day, certain foreign markets may be open on those days that the Fund’s NAV is not calculated, which could result in differences between the value of the Fund’s portfolio securities on the last business day and the last calendar day of the reporting period. Any significant security valuation changes due to an open foreign market are adjusted and reflected by the Fund for financial reporting purposes.
b. Foreign Currency Translation
Portfolio securities and other assets and liabilities denominated in foreign currencies are translated into U.S. dollars based on the exchange rate of such currencies against U.S. dollars on the date of valuation. The Fund may enter into foreign currency exchange contracts to facilitate transactions denominated in a foreign currency. Purchases and sales of securities, income and expense items denominated in foreign currencies are translated into U.S. dollars at the exchange rate in effect on the transaction date. Portfolio securities and assets and liabilities denominated in foreign currencies contain risks that those currencies will decline in value relative to the U.S. dollar. Occasionally, events may impact the availability or reliability of foreign exchange rates used to convert the U.S. dollar equivalent value. If such an event occurs, the foreign exchange rate will be valued at fair value using procedures established and approved by the Board.
The Fund does not separately report the effect of changes in foreign exchange rates from changes in market prices on securities held. Such changes are included in net realized and unrealized gain or loss from investments in the Statement of Operations.
Realized foreign exchange gains or losses arise from sales of foreign currencies, currency gains or losses realized between the trade and settlement dates on securities transactions and the difference between the recorded amounts of dividends, interest, and foreign withholding taxes and the U.S. dollar equivalent of the amounts actually received or paid. Net unrealized foreign exchange gains and losses arise from changes in foreign exchange rates on foreign denominated assets and liabilities other than investments in securities held at the end of the reporting period.
c. Income and Deferred Taxes
It is the Fund’s policy to qualify as a regulated investment company under the Internal Revenue Code. The Fund intends to distribute to shareholders substantially all of its taxable income and net realized gains to relieve it from federal income and if applicable, excise taxes. As a result, no provision for U.S. federal income taxes is required.
The Fund may be subject to foreign taxation related to income received, capital gains on the sale of securities and certain foreign currency transactions in the foreign jurisdictions in which it invests. Foreign taxes, if any, are recorded based on the tax regulations and rates that exist in the foreign markets in which the Fund invests. When a capital gain tax is determined to apply, the Fund records an estimated deferred tax liability in an amount that would be payable if the securities were disposed of on the valuation date.
The Fund may recognize an income tax liability related to its uncertain tax positions under U.S. GAAP when the uncertain tax position has a less than 50% probability that it will be sustained upon examination by the tax authorities based on its technical merits. As of July 31, 2019, the Fund has determined that no tax liability is required in its financial statements related to uncertain tax positions for any open tax years (or expected to be taken in future tax years). Open tax years are those that remain subject to examination and are based on the statute of limitations in each jurisdiction in which the Fund invests.
d. Security Transactions, Investment Income, Expenses and Distributions
Security transactions are accounted for on trade date. Realized gains and losses on security transactions are determined on a specific identification basis. Estimated expenses are accrued daily. Dividend income is recorded on theex-dividend date except for certain dividends from securities where the dividend rate is not available. In such cases, the dividend is recorded as soon as the information is received by the Fund. Distributions to shareholders are recorded on theex-dividend date. Distributable earnings are determined according to income tax regulations (tax basis) and may differ from earnings recorded in accordance with U.S. GAAP. These differences may be permanent or temporary. Permanent differences are reclassified among capital accounts to reflect their tax character. These
| | | | |
| | | |
| franklintempleton.com | | Annual Report | | 25 |
FRANKLIN GLOBAL TRUST
NOTES TO FINANCIAL STATEMENTS
Franklin Global Listed Infrastructure Fund(continued)
1. Organization and Significant Accounting
Policies(continued)
d. Security Transactions, Investment Income, Expenses and Distributions(continued)
reclassifications have no impact on net assets or the results of operations. Temporary differences are not reclassified, as they may reverse in subsequent periods.*
Common expenses incurred by the Trust are allocated among the Funds based on the ratio of net assets of each Fund to the combined net assets of the Trust or based on the ratio of number of shareholders of each Fund to the combined number of shareholders of the Trust. Fund specific expenses are charged directly to the Fund that incurred the expense.
Realized and unrealized gains and losses and net investment income, excluding class specific expenses, are allocated daily to each class of shares based upon the relative proportion of net assets of each class. Differences in per share distributions by class are generally due to differences in class specific expenses.
e. Accounting Estimates
The preparation of financial statements in accordance with U.S. GAAP requires management to make estimates and assumptions that affect the reported amounts of assets and liabilities at the date of the financial statements and the amounts of income and expenses during the reporting period. Actual results could differ from those estimates.
f. Guarantees and Indemnifications
Under the Trust’s organizational documents, its officers and trustees are indemnified by the Trust against certain liabilities arising out of the performance of their duties to the Trust. Additionally, in the normal course of business, the Trust, on behalf of the Fund, enters into contracts with service providers that contain general indemnification clauses. The Trust’s maximum exposure under these arrangements is unknown as this would involve future claims that may be made against the Trust that have not yet occurred. Currently, the Trust expects the risk of loss to be remote.
*Effective during the current reporting period, it is no longer required to present certain line items in the Statements of Changes in Net Assets. The below prior period amounts affected by this change are shown as they were in the prior year Statements of Changes in Net Assets.
For the year ended July 31, 2018, distributions to shareholders were as follows:
| | | | |
Distributions from net investment income: | | | | |
Class A | | $ | (804,999 | ) |
Class C | | | (86,434 | ) |
Class R | | | (1,229 | ) |
Class R6 | | | (25,039 | ) |
Advisor Class | | | (146,403 | ) |
For the year ended July 31, 2018, undistributed net investment income included in net assets was $434,788.
| | | | |
| | | |
26 | | Annual Report | | franklintempleton.com |
FRANKLIN GLOBAL TRUST
NOTES TO FINANCIAL STATEMENTS
Franklin Global Listed Infrastructure Fund(continued)
2. Shares of Beneficial Interest
At July 31, 2019, there were an unlimited number of shares authorized (without par value). Transactions in the Fund’s shares were as follows:
| | | | | | | | | | | | | | | | |
| | | Year Ended July 31, | |
| | | 2019 | | | 2018 | |
| | | Shares | | | Amount | | | Shares | | | Amount | |
| | | | |
Class A Shares: | | | | | | | | | | | | | | | | |
Shares solda | | | 535,124 | | | $ | 7,222,031 | | | | 1,901,223 | | | $ | 26,037,978 | |
Shares issued in reinvestment of distributions | | | 60,684 | | | | 800,718 | | | | 58,708 | | | | 799,297 | |
Shares redeemed | | | (1,291,603 | ) | | | (17,518,370 | ) | | | (1,029,794 | ) | | | (13,959,550) | |
| | | | |
Net increase (decrease) | | | (695,795 | ) | | $ | (9,495,621 | ) | | | 930,137 | | | $ | 12,877,725 | |
| | | | |
Class C Shares: | | | | | | | | | | | | | | | | |
Shares sold | | | 66,999 | | | $ | 930,285 | | | | 291,686 | | | $ | 3,949,510 | |
Shares issued in reinvestment of distributions | | | 5,445 | | | | 70,673 | | | | 6,336 | | | | 85,984 | |
Shares redeemeda | | | (294,604 | ) | | | (3,887,723 | ) | | | (200,285 | ) | | | (2,692,126) | |
| | | | |
Net increase (decrease) | | | (222,160 | ) | | $ | (2,886,765 | ) | | | 97,737 | | | $ | 1,343,368 | |
| | | | |
Class R Shares: | | | | | | | | | | | | | | | | |
Shares sold | | | 86 | | | $ | 1,165 | | | | 131 | | | $ | 1,797 | |
Shares issued in reinvestment of distributions | | | 88 | | | | 1,154 | | | | 90 | | | | 1,229 | |
Shares redeemed | | | (389 | ) | | | (5,303 | ) | | | (962 | ) | | | (13,017) | |
| | | | |
Net increase (decrease) | | | (215 | ) | | $ | (2,984 | ) | | | (741 | ) | | $ | (9,991) | |
| | | | |
Class R6 Shares: | | | | | | | | | | | | | | | | |
Shares sold | | | 32,487 | | | $ | 458,717 | | | | 172,071 | | | $ | 2,384,860 | |
Shares issued in reinvestment of distributions | | | 2,305 | | | | 30,592 | | | | 1,824 | | | | 24,755 | |
Shares redeemed | | | (57,497 | ) | | | (768,408 | ) | | | (47,812 | ) | | | (653,456) | |
| | | | |
Net increase (decrease) | | | (22,705 | ) | | $ | (279,099 | ) | | | 126,083 | | | $ | 1,756,159 | |
| | | | |
Advisor Class Shares: | | | | | | | | | | | | | | | | |
Shares sold | | | 168,885 | | | $ | 2,265,426 | | | | 886,769 | | | $ | 12,099,465 | |
Shares issued in reinvestment of distributions | | | 10,364 | | | | 136,756 | | | | 10,529 | | | | 143,158 | |
Shares redeemed | | | (410,106 | ) | | | (5,476,649 | ) | | | (601,113 | ) | | | (8,168,738) | |
| | | | |
Net increase (decrease) | | | (230,857 | ) | | $ | (3,074,467 | ) | | | 296,185 | | | $ | 4,073,885 | |
aMay include a portion of Class C shares that were automatically converted to Class A.
3. Transactions with Affiliates
Franklin Resources, Inc. is the holding company for various subsidiaries that together are referred to as Franklin Templeton. Certain officers and trustees of the Trust are also officers and/or directors of the following subsidiaries:
| | |
| Subsidiary | | Affiliation |
Franklin Templeton Institutional, LLC (FT Institutional) | | Investment manager |
Franklin Templeton Services, LLC (FT Services) | | Administrative manager |
Franklin Templeton Distributors, Inc. (Distributors) | | Principal underwriter |
Franklin Templeton Investor Services, LLC (Investor Services) | | Transfer agent |
| | | | |
| | | |
| franklintempleton.com | | Annual Report | | 27 |
FRANKLIN GLOBAL TRUST
NOTES TO FINANCIAL STATEMENTS
Franklin Global Listed Infrastructure Fund(continued)
3. Transactions with Affiliates(continued)
a. Management Fees
The Fund pays an investment management fee to FT Institutional based on the average daily net assets of the Fund as follows:
| | |
| Annualized Fee Rate | | Net Assets |
| 1.000% | | Up to and including $500 million |
| 0.900% | | Over $500 million, up to and including $1 billion |
| 0.850% | | Over $1 billion, up to and including $1.5 billion |
| 0.800% | | Over $1.5 billion, up to and including $6.5 billion |
| 0.780% | | Over $6.5 billion, up to and including $11.5 billion |
| 0.760% | | Over $11.5 billion, up to and including $16.5 billion |
| 0.740% | | Over $16.5 billion, up to and including $19 billion |
| 0.730% | | Over $19 billion, up to and including $21.5 billion |
| 0.720% | | In excess of $21.5 billion |
b. Administrative Fees
Under an agreement with FT Institutional, FT Services provides administrative services to the Fund. The fee is paid by FT Institutional based on the Fund’s average daily net assets, and is not an additional expense of the Fund.
c. Distribution Fees
The Board has adopted distribution plans for each share class, with the exception of Class R6 and Advisor Class shares, pursuant to Rule12b-1 under the 1940 Act. Under the Fund’s Class A reimbursement distribution plan, the Fund reimburses Distributors for costs incurred in connection with the servicing, sale and distribution of the Fund’s shares up to the maximum annual plan rate. Under the Class A reimbursement distribution plan, costs exceeding the maximum for the current plan year cannot be reimbursed in subsequent periods. In addition, under the Fund’s Class C and R compensation distribution plans, the Fund pays Distributors for costs incurred in connection with the servicing, sale and distribution of the Fund’s shares up to the maximum annual plan rate for each class. The plan year, for purposes of monitoring compliance with the maximum annual plan rates, is February 1 through January 31.
The maximum annual plan rates, based on the average daily net assets, for each class, are as follows:
| | | | | | |
| | Class A | | | 0.35 | % |
| | Class C | | | 1.00 | % |
| | Class R | | | 0.50 | % |
The Board has set the current rate at 0.25% per year for Class A shares until further notice and approval by the Board.
| | | | |
| | | |
28 | | Annual Report | | franklintempleton.com |
FRANKLIN GLOBAL TRUST
NOTES TO FINANCIAL STATEMENTS
Franklin Global Listed Infrastructure Fund(continued)
d. Sales Charges/Underwriting Agreements
Front-end sales charges and contingent deferred sales charges (CDSC) do not represent expenses of the Fund. These charges are deducted from the proceeds of sales of Fund shares prior to investment or from redemption proceeds prior to remittance, as applicable. Distributors has advised the Fund of the following commission transactions related to the sales and redemptions of the Fund’s shares for the year:
| | | | |
Sales charges retained net of commissions paid to
unaffiliated brokers/dealers | | $ | 14,080 | |
| |
CDSC retained | | $ | 1,356 | |
Effective September 10, 2018, the Board approved changes to certainfront-end sales charges and dealer commissions on Class A shares. Further details are disclosed in the Fund’s Prospectus.
e. Transfer Agent Fees
Each class of shares pays transfer agent fees to Investor Services for its performance of shareholder servicing obligations. The fees are based on an annualized asset based fee of 0.02% plus a transaction based fee. In addition, each class reimburses Investor Services for out of pocket expenses incurred and, except for Class R6, reimburses shareholder servicing fees paid to third parties. These fees are allocated daily based upon their relative proportion of such classes’ aggregate net assets. Class R6 pays Investor Services transfer agent fees specific to that class.
For the year ended July 31, 2019, the Fund paid transfer agent fees of $109,612 of which $54,611 was retained by Investor Services.
f. Investments in Affiliated Management Investment Companies
The Fund invests in one or more affiliated management investment companies for purposes other than exercising a controlling influence over the management or policies. Management fees paid by the Fund are waived on assets invested in the affiliated management investment companies, as noted in the Statement of Operations, in an amount not to exceed the management and administrative fees paid directly or indirectly by each affiliate. During the year ended July 31, 2019, the Fund held investments in affiliated management investment companies as follows:
| | | | | | | | | | | | | | | | | | | | | | | | | | | | | | | | |
| | | Value at Beginning of Year | | | Purchases | | | Sales | | | Realized Gain (Loss) | | | Net Change in Unrealized Appreciation (Depreciation) | | | Value at End of Year | | | Number of Shares Held at End of Year | | | Dividend Income | |
| | | | | | | | |
Non-Controlled Affiliates | | | | | | | | | | | | | | | | | | | | | | | | | | | | | | | | |
Institutional Fiduciary Trust Money Market Portfolio, 2.00% | | | $27,666 | | | | $14,811,682 | | | | $(14,838,298) | | | | $ — | | | | $ — | | | | $1,050 | | | | 1,050 | | | | $6,984 | |
g. Waiver and Expense Reimbursements
FT Institutional and Investor Services have contractually agreed in advance to waive or limit their respective fees and to assume as their own expense certain expenses otherwise payable by the Fund so that the expenses (excluding distribution fees, acquired fund fees and expenses and certainnon-routine expenses or costs, including those relating to litigation, indemnification, reorganizations, and liquidations) for Class A, Class C, Class R and Advisor Class of the Fund do not exceed 0.99%, and for Class R6 do not exceed 0.82%, based on the average net assets of each class until November 30, 2019. Total expenses waived or paid are not subject to recapture subsequent to the Fund’s fiscal year end.
| | | | |
| | | |
| franklintempleton.com | | Annual Report | | 29 |
FRANKLIN GLOBAL TRUST
NOTES TO FINANCIAL STATEMENTS
Franklin Global Listed Infrastructure Fund(continued)
4. Expense Offset Arrangement
The Fund has entered into an arrangement with its custodian whereby credits realized as a result of uninvested cash balances are used to reduce a portion of the Fund’s custodian expenses. During the year ended July 31, 2019, the custodian fees were reduced as noted in the Statement of Operations.
5. Income Taxes
For tax purposes, capital losses may be carried over to offset future capital gains. At July 31, 2019, the capital loss carryforwards were as follows:
| | | | |
Capital loss carryforwards not subject to expiration: | | | | |
Short term | | $ | 1,093,669 | |
During the year ended July 31, 2019, the Fund utilized $372,750 of capital loss carryforwards.
The tax character of distributions paid during the years ended July 31, 2019 and 2018, was as follows:
| | | | | | | | |
| | | 2019 | | | 2018 | |
Distributions paid from ordinary income | | $ | 1,051,189 | | | $ | 1,064,104 | |
At July 31, 2019, the cost of investments, net unrealized appreciation (depreciation), undistributed ordinary income and undistributed long term capital gains for income tax purposes were as follows:
| | | | |
Cost of investments | | | $50,281,259 | |
| |
Unrealized appreciation | | | $12,117,544 | |
Unrealized depreciation | | | (1,652,482) | |
| |
Net unrealized appreciation (depreciation) | | | $10,465,062 | |
| |
Distributable earnings: | | | | |
Undistributed ordinary income | | | $ 613,258 | |
Differences between income and/or capital gains as determined on a book basis and a tax basis are primarily due to differing treatment of wash sales.
6. Investment Transactions
Purchases and sales of investments (excluding short term securities) for the year ended July 31, 2019, aggregated $46,845,352 and $63,105,769, respectively.
7. Concentration of Risk
Investing in foreign securities may include certain risks and considerations not typically associated with investing in U.S. securities, such as fluctuating currency values and changing local and regional economic, political and social conditions, which may result in greater market volatility. Current political and financial uncertainty surrounding the European Union may increase market volatility and the economic risk of investing in securities in Europe. In addition, certain foreign securities may not be as liquid as U.S. securities.
| | | | |
| | | |
30 | | Annual Report | | franklintempleton.com |
FRANKLIN GLOBAL TRUST
NOTES TO FINANCIAL STATEMENTS
Franklin Global Listed Infrastructure Fund(continued)
8. Upcoming Liquidation
On July 19, 2019, the Board for the Fund approved a proposal to liquidate the Fund. The Fund is scheduled to liquidate on or about November 6, 2019.
9. Credit Facility
The Fund, together with other U.S. registered and foreign investment funds (collectively, Borrowers), managed by Franklin Templeton, are borrowers in a joint syndicated senior unsecured credit facility totaling $2 billion (Global Credit Facility) which matures on February 7, 2020. This Global Credit Facility provides a source of funds to the Borrowers for temporary and emergency purposes, including the ability to meet future unanticipated or unusually large redemption requests.
Under the terms of the Global Credit Facility, the Fund shall, in addition to interest charged on any borrowings made by the Fund and other costs incurred by the Fund, pay its share of fees and expenses incurred in connection with the implementation and maintenance of the Global Credit Facility, based upon its relative share of the aggregate net assets of all of the Borrowers, including an annual commitment fee of 0.15% based upon the unused portion of the Global Credit Facility. These fees are reflected in other expenses in the Statement of Operations. During the year ended July 31, 2019, the Fund did not use the Global Credit Facility.
10. Fair Value Measurements
The Fund follows a fair value hierarchy that distinguishes between market data obtained from independent sources (observable inputs) and the Fund’s own market assumptions (unobservable inputs). These inputs are used in determining the value of the Fund’s financial instruments and are summarized in the following fair value hierarchy:
| | • | | Level 1 – quoted prices in active markets for identical financial instruments |
| | • | | Level 2 – other significant observable inputs (including quoted prices for similar financial instruments, interest rates, prepayment speed, credit risk, etc.) |
| | • | | Level 3 – significant unobservable inputs (including the Fund’s own assumptions in determining the fair value of financial instruments) |
The input levels are not necessarily an indication of the risk or liquidity associated with financial instruments at that level.
At July 31, 2019, all of the Fund’s investments in financial instruments carried at fair value were valued using Level 1 inputs. For detailed categories, see the accompanying Statement of Investments.
11. Subsequent Events
The Fund has evaluated subsequent events through the issuance of the financial statements and determined that no events have occurred that require disclosure other than those already disclosed in the financial statements.
| | |
| Abbreviations | | |
| |
Selected Portfolio | | |
ADR American Depositary Receipt | | |
| | | | |
| | | |
| franklintempleton.com | | Annual Report | | 31 |
FRANKLIN GLOBAL TRUST
Report of Independent Registered Public Accounting Firm
To the Board of Trustees of Franklin Global Trust and Shareholders of Franklin Global Listed Infrastructure Fund
Opinion on the Financial Statements
We have audited the accompanying statement of assets and liabilities, including the statement of investments, of Franklin Global Listed Infrastructure Fund (the “Fund”) as of July 31, 2019, the related statement of operations for the year ended July 31, 2019, the statement of changes in net assets for each of the two years in the period ended July 31, 2019, including the related notes, and the financial highlights for each of the five years in the period ended July 31, 2019 (collectively referred to as the “financial statements”). In our opinion, the financial statements present fairly, in all material respects, the financial position of the Fund as of July 31, 2019, the results of its operations for the year then ended, the changes in its net assets for each of the two years in the period ended July 31, 2019 and the financial highlights for each of the five years in the period ended July 31, 2019 in conformity with accounting principles generally accepted in the United States of America.
Basis for Opinion
These financial statements are the responsibility of the Fund’s management. Our responsibility is to express an opinion on the Fund’s financial statements based on our audits. We are a public accounting firm registered with the Public Company Accounting Oversight Board (United States) (PCAOB) and are required to be independent with respect to the Fund in accordance with the U.S. federal securities laws and the applicable rules and regulations of the Securities and Exchange Commission and the PCAOB.
We conducted our audits of these financial statements in accordance with the standards of the PCAOB. Those standards require that we plan and perform the audit to obtain reasonable assurance about whether the financial statements are free of material misstatement, whether due to error or fraud.
Our audits included performing procedures to assess the risks of material misstatement of the financial statements, whether due to error or fraud, and performing procedures that respond to those risks. Such procedures included examining, on a test basis, evidence regarding the amounts and disclosures in the financial statements. Our audits also included evaluating the accounting principles used and significant estimates made by management, as well as evaluating the overall presentation of the financial statements. Our procedures included confirmation of securities owned as of July 31, 2019 by correspondence with the custodian and transfer agent. We believe that our audits provide a reasonable basis for our opinion.
PricewaterhouseCoopers LLP
San Francisco, California
September 17, 2019
We have served as the auditor of one or more investment companies in the Franklin Templeton Group of Funds since 1948.
| | | | |
| | | |
32 | | Annual Report | | franklintempleton.com |
FRANKLIN GLOBAL TRUST
Tax Information (unaudited)
Franklin Global Listed Infrastructure Fund
Under Section 854(b)(1)(A) of the Internal Revenue Code, the Fund hereby reports 51.45% of the ordinary income dividends as income qualifying for the dividends received deduction for the fiscal year ended July 31, 2019.
Under Section 854(b)(1)(B) of the Internal Revenue Code, the Fund hereby reports the maximum amount allowable but no less than $1,819,033 as qualified dividends for purposes of the maximum rate under Section 1(h)(11) of the Internal Revenue Code for the fiscal year ended July 31, 2019. Distributions, including qualified dividend income, paid during calendar year 2019 will be reported to shareholders on Form1099-DIV bymid-February 2020. Shareholders are advised to check with their tax advisors for information on the treatment of these amounts on their individual income tax returns.
At July 31, 2019, more than 50% of the Fund’s total assets were invested in securities of foreign issuers. In most instances, foreign taxes were withheld from income paid to the Fund on these investments. The Fund elects to treat foreign taxes paid as allowed under Section 853 of the Internal Revenue Code. This election will allow shareholders of record as of the 2019 distribution date, to treat their proportionate share of foreign taxes paid by the Fund as having been paid directly by them. The shareholder shall consider these amounts as foreign taxes paid in the tax year in which they receive the Fund distribution.
| | | | |
| | | |
| franklintempleton.com | | Annual Report | | 33 |
FRANKLIN GLOBAL TRUST
Board Members and Officers
The name, year of birth and address of the officers and board members, as well as their affiliations, positions held with the Trust, principal occupations during at least the past five years and number of U.S. registered portfolios overseen in the Franklin Templeton fund complex, are shown below. Generally, each board member serves until that person’s successor is elected and qualified.
Independent Board Members
| | | | | | | | |
Name, Year of Birth and Address | | Position | | Length of Time Served | | Number of Portfolios in Fund Complex Overseen by Board Member* | | Other Directorships Held During at Least the Past 5 Years |
| | | | |
Harris J. Ashton (1932) One Franklin ParkwaySan Mateo, CA 94403-1906 | | Trustee | | Since 2000 | | 137 | | Bar-S Foods (meat packing company) (1981-2010). |
|
Principal Occupation During at Least the Past 5 Years: Director of various companies; andformerly, Director, RBC Holdings, Inc. (bank holding company) (until 2002); and President, Chief Executive Officer and Chairman of the Board, General Host Corporation (nursery and craft centers) (until 1998). |
| | | | | |
Terrence J. Checki (1945) One Franklin Parkway San Mateo, CA 94403-1906 | | Trustee | | Since 2017 | | 113 | | Hess Corporation (exploration of oil and gas) (2014-present). |
|
Principal Occupation During at Least the Past 5 Years: Member of the Council on Foreign Relations (1996-present); Member of the National Committee on U.S.-China Relations (1999-present); member of the Board of Trustees of the Economic Club of New York (2013-present); member of the Board of Trustees of the Foreign Policy Association (2005-present) and member of various other boards of trustees and advisory boards; andformerly, Executive Vice President of the Federal Reserve Bank of New York and Head of its Emerging Markets and Internal Affairs Group and Member of Management Committee (1995-2014); and Visiting Fellow at the Council on Foreign Relations (2014). |
| | | | | |
Mary C. Choksi (1950) One Franklin ParkwaySan Mateo, CA 94403-1906 | | Trustee | | Since 2014 | | 137 | | Avis Budget Group Inc. (car rental) (2007-present), Omnicom Group Inc. (advertising and marketing communications services) (2011-present) and White Mountains Insurance Group, Ltd. (holding company) (2017-present). |
|
Principal Occupation During at Least the Past 5 Years: Director of various companies; andformerly, Founder and Senior Advisor, Strategic Investment Group (investment management group) (2015-2017); Founding Partner and Senior Managing Director, Strategic Investment Group (1987-2015); Founding Partner and Managing Director, Emerging Markets Management LLC (investment management firm) (1987-2011); and Loan Officer/Senior Loan Officer/Senior Pension Investment Officer, World Bank Group (international financial institution) (1977-1987). |
| | | | | |
Edith E. Holiday (1952) One Franklin ParkwaySan Mateo, CA 94403-1906 | | Lead Independent Trustee | | Trustee since 2000 and Lead Independent Trustee since March 2019 | | 137 | | Hess Corporation (exploration of oil and gas) (1993-present), Canadian National Railway (railroad) (2001-present), White Mountains Insurance Group, Ltd. (holding company) (2004-present), Santander Consumer USA Holdings, Inc. (consumer finance) (2016-present), RTI International Metals, Inc. (manufacture and distribution of titanium) (1999-2015) and H.J. Heinz Company (processed foods and allied products) (1994-2013). |
|
Principal Occupation During at Least the Past 5 Years: Director or Trustee of various companies and trusts; andformerly, Assistant to the President of the United States and Secretary of the Cabinet (1990-1993); General Counsel to the United States Treasury Department (1989-1990); and Counselor to the Secretary and Assistant Secretary for Public Affairs and Public Liaison–United States Treasury Department (1988-1989). |
| | | | |
| | | |
34 | | Annual Report | | franklintempleton.com |
FRANKLIN GLOBAL TRUST
Independent Board Members(continued)
| | | | | | | | |
Name, Year of Birth and Address | | Position | | Length of Time Served | | Number of Portfolios in Fund Complex Overseen by Board Member* | | Other Directorships Held During at Least the Past 5 Years |
| | | | |
J. Michael Luttig (1954) One Franklin Parkway San Mateo, CA 94403-1906 | | Trustee | | Since 2009 | | 137 | | Boeing Capital Corporation (aircraft financing) (2006-2013). |
|
Principal Occupation During at Least the Past 5 Years: Executive Vice President, Counselor and Senior Advisor to Boeing Chairman and Board of Directors, The Boeing Company (aerospace company) (May 2019); andformerly, General Counsel and member of the Executive Council, The Boeing Company (2006-2019) and Federal Appeals Court Judge, U.S. Court of Appeals for the Fourth Circuit (1991-2006). |
| | | | | |
Larry D. Thompson (1945) One Franklin ParkwaySan Mateo, CA 94403-1906 | | Trustee | | Since 2007 | | 137 | | The Southern Company (energy company) (2014-present; previously 2010-2012), Graham Holdings Company (education and media organization) (2011-present) and Cbeyond, Inc. (business communications provider) (2010-2012). |
|
Principal Occupation During at Least the Past 5 Years: Director of various companies; Counsel, Finch McCranie, LLP (law firm) (2015-present); Independent Compliance Monitor and Auditor, Volkswagen AG (manufacturer of automobiles and commercial vehicles) (2017-present); John A. Sibley Professor of Corporate and Business Law, University of Georgia School of Law (2015-present; previously 2011-2012); andformerly, Executive Vice President – Government Affairs, General Counsel and Corporate Secretary, PepsiCo, Inc. (consumer products) (2012-2014); Senior Vice President – Government Affairs, General Counsel and Secretary, PepsiCo, Inc. (2004-2011); Senior Fellow of The Brookings Institution (2003-2004); Visiting Professor, University of Georgia School of Law (2004); and Deputy Attorney General, U.S. Department of Justice (2001-2003). |
| |
| Interested Board Members and Officers |
| | | | |
Name, Year of Birth and Address | | Position | | Length of Time Served | | Number of Portfolios in Fund Complex Overseen by Board Member* | | Other Directorships Held During at Least the Past 5 Years |
| | | | |
**Gregory E. Johnson (1961) One Franklin Parkway San Mateo, CA 94403-1906 | | Trustee | | Since 2007 | | 151 | | None |
|
Principal Occupation During at Least the Past 5 Years: Chairman of the Board, Member – Office of the Chairman, Director and Chief Executive Officer, Franklin Resources, Inc.; officer and/or director or trustee, as the case may be, of some of the other subsidiaries of Franklin Resources, Inc. and of 42 of the investment companies in Franklin Templeton; Vice Chairman, Investment Company Institute; andformerly, President, Franklin Resources, Inc. (1994-2015). |
| | | | | |
**Rupert H. Johnson, Jr. (1940) One Franklin ParkwaySan Mateo, CA 94403-1906 | | Chairman of the Board and Trustee | | Since 2013 | | 137 | | None |
|
Principal Occupation During at Least the Past 5 Years: Vice Chairman, Member – Office of the Chairman and Director, Franklin Resources, Inc.; Director, Franklin Advisers, Inc.; and officer and/or director or trustee, as the case may be, of some of the other subsidiaries of Franklin Resources, Inc. and of 40 of the investment companies in Franklin Templeton. |
| | | | | |
Alison E. Baur (1964) One Franklin Parkway San Mateo, CA 94403-1906 | | Vice President | | Since 2012 | | Not Applicable | | Not Applicable |
|
Principal Occupation During at Least the Past 5 Years: Deputy General Counsel, Franklin Templeton; and officer of some of the other subsidiaries of Franklin Resources, Inc. and of 44 of the investment companies in Franklin Templeton. |
| | | | |
| | | |
| franklintempleton.com | | Annual Report | | 35 |
FRANKLIN GLOBAL TRUST
Interested Board Members and Officers (continued)
| | | | | | | | |
| | | | |
Name, Year of Birth and Address | | Position | | Length of Time Served | | Number of Portfolios in Fund Complex Overseen by Board Member* | | Other Directorships Held During at Least the Past 5 Years |
| | | | |
Sonal Desai, Ph.D. (1963) One Franklin Parkway San Mateo, CA 94403-1906 | | Vice President | | Since December 2018 | | Not Applicable | | Not Applicable |
|
Principal Occupation During at Least the Past 5 Years: Director and Executive Vice President, Franklin Advisers, Inc.; Executive Vice President, Franklin Templeton Institutional, LLC; and officer of 18 of the investment companies in Franklin Templeton. |
| | | | | |
Gaston Gardey (1967) One Franklin Parkway San Mateo, CA 94403-1906 | | Treasurer, Chief Financial Officer and Chief Accounting Officer | | Since 2009 | | Not Applicable | | Not Applicable |
|
Principal Occupation During at Least the Past 5 Years: Treasurer, U.S. Fund Administration & Reporting, Franklin Templeton; and officer of 26 of the investment companies in Franklin Templeton. |
| | | | | |
Aliya S. Gordon (1973) One Franklin Parkway San Mateo, CA 94403-1906 | | Vice President | | Since 2009 | | Not Applicable | | Not Applicable |
|
Principal Occupation During at Least the Past 5 Years: Senior Associate General Counsel, Franklin Templeton; Vice President and Secretary, Franklin Resources, Inc.; and officer of 44 of the investment companies in Franklin Templeton. |
| | | | | |
Steven J. Gray (1955) One Franklin Parkway San Mateo, CA 94403-1906 | | Vice President and Co- Secretary | | Vice President since 2009 andCo-Secretary since January 2019 | | Not Applicable | | Not Applicable |
|
Principal Occupation During at Least the Past 5 Years: Senior Associate General Counsel, Franklin Templeton; Vice President, Franklin Templeton Distributors, Inc. and FASA, LLC; and officer of 44 of the investment companies in Franklin Templeton. |
| | | | | |
Matthew T. Hinkle (1971) One Franklin Parkway San Mateo, CA 94403-1906 | | Chief Executive Officer – Finance and Administration | | Since 2017 | | Not Applicable | | Not Applicable |
|
Principal Occupation During at Least the Past 5 Years: Senior Vice President, Franklin Templeton Services, LLC; officer of 44 of the investment companies in Franklin Templeton; andformerly, Vice President, Global Tax (2012-April 2017) and Treasurer/Assistant Treasurer, Franklin Templeton (2009-2017). |
| | | | |
Robert Lim (1948) One Franklin Parkway San Mateo, CA 94403-1906 | | Vice President – AML Compliance | | Since 2016 | | Not Applicable | | Not Applicable |
|
Principal Occupation During at Least the Past 5 Years: Vice President, Franklin Templeton Companies, LLC; Chief Compliance Officer, Franklin Templeton Distributors, Inc. and Franklin Templeton Investor Services, LLC; and officer of 44 of the investment companies in Franklin Templeton. |
| | | | | |
Kimberly H. Novotny (1972) 300 S.E. 2nd Street Fort Lauderdale, FL 33301-1923 | | Vice President | | Since 2013 | | Not Applicable | | Not Applicable |
|
Principal Occupation During at Least the Past 5 Years: Senior Associate General Counsel, Franklin Templeton; Vice President and Corporate Secretary, Fiduciary Trust International of the South; Vice President, Templeton Investment Counsel, LLC; Assistant Secretary, Franklin Resources, Inc.; and officer of 44 of the investment companies in Franklin Templeton. |
| | | | |
| | | |
36 | | Annual Report | | franklintempleton.com |
FRANKLIN GLOBAL TRUST
Interested Board Members and Officers (continued)
| | | | | | | | |
| | | | |
Name, Year of Birth and Address | | Position | | Length of Time Served | | Number of Portfolios in Fund Complex Overseen by Board Member* | | Other Directorships Held During at Least the Past 5 Years |
| | | | | |
Edward D. Perks (1970) One Franklin Parkway San Mateo, CA 94403-1906 | | President and Chief Executive Officer – Investment Management | | Since December 2018 | | Not Applicable | | Not Applicable |
|
Principal Occupation During at Least the Past 5 Years: President and Director, Franklin Advisers, Inc.; and officer of nine of the investment companies in Franklin Templeton (since December 2018). |
| | | | | |
Robert C. Rosselot (1960) 300 S.E. 2nd Street Fort Lauderdale, FL 33301-1923 | | Chief Compliance Officer | | Since 2013 | | Not Applicable | | Not Applicable |
|
Principal Occupation During at Least the Past 5 Years: Director, Global Compliance, Franklin Templeton; Vice President, Franklin Templeton Companies, LLC; officer of 44 of the investment companies in Franklin Templeton; andformerly, Senior Associate General Counsel, Franklin Templeton (2007-2013); and Secretary and Vice President, Templeton Group of Funds (2004-2013). |
| | | | | |
Navid J. Tofigh (1972) One Franklin Parkway San Mateo, CA 94403-1906 | | Vice President | | Since 2015 | | Not Applicable | | Not Applicable |
|
Principal Occupation During at Least the Past 5 Years: Associate General Counsel and officer of 44 of the investment companies in Franklin Templeton. |
| | | | | |
Craig S. Tyle (1960) One Franklin Parkway San Mateo, CA 94403-1906 | | Vice President | | Since 2005 | | Not Applicable | | Not Applicable |
|
Principal Occupation During at Least the Past 5 Years: General Counsel and Executive Vice President, Franklin Resources, Inc.; and officer of some of the other subsidiaries of Franklin Resources, Inc. and of 44 of the investment companies in Franklin Templeton. |
| | | | | |
Lori A. Weber (1964) 300 S.E. 2nd StreetFort Lauderdale, FL 33301-1923 | | Vice President andCo-Secretary | | Vice President since 2011 andCo-Secretary since January 2019 | | Not Applicable | | Not Applicable |
|
Principal Occupation During at Least the Past 5 Years: Senior Associate General Counsel, Franklin Templeton; Assistant Secretary, Franklin Resources, Inc.; Vice President and Secretary, Templeton Investment Counsel, LLC; and officer of 44 of the investment companies in Franklin Templeton. |
| | | | |
| | | |
| franklintempleton.com | | Annual Report | | 37 |
FRANKLIN GLOBAL TRUST
*We base the number of portfolios on each separate series of the U.S. registered investment companies within the Franklin Templeton fund complex. These portfolios have a common investment manager or affiliated investment managers.
**Gregory E. Johnson is considered to be an interested person of the Fund under the federal securities laws due to his position as an officer and director of Franklin Resources, Inc. (Resources), which is the parent company of the Fund’s investment manager and distributor. Rupert H. Johnson, Jr. is considered to be an interested person of the Fund under the federal securities laws due to his position as an officer and director and major shareholder of Resources.
Note 1: Rupert H. Johnson, Jr. is the uncle of Gregory E. Johnson.
Note 2: Effective March 12, 2019, John B. Wilson ceased to be a trustee of the Trust.
Note 3: Officer information is current as of the date of this report. It is possible that after this date, information about officers may change.
The Sarbanes-Oxley Act of 2002 and Rules adopted by the Securities and Exchange Commission require the Fund to disclose whether the Fund’s Audit Committee includes at least one member who is an audit committee financial expert within the meaning of such Act and Rules. The Fund’s Board has determined that there is at least one such financial expert on the Audit Committee and has designated Mary C. Choksi as its audit committee financial expert. The Board believes that Ms. Choksi qualifies as such an expert in view of her extensive business background and experience. She currently serves as a director of Avis Budget Group, Inc. (2007-present) and formerly, Founder and Senior Advisor, Strategic Investment Group (1987 to 2017). Ms. Choksi has been a Member of the Fund’s Audit Committee since 2014. As a result of such background and experience, the Board believes that Ms. Choksi has acquired an understanding of generally accepted accounting principles and financial statements, the general application of such principles in connection with the accounting estimates, accruals and reserves, and analyzing and evaluating financial statements that present a breadth and level of complexity of accounting issues generally comparable to those of the Fund, as well as an understanding of internal controls and procedures for financial reporting and an understanding of audit committee functions. Ms. Choksi is an independent Board member as that term is defined under the relevant Securities and Exchange Commission Rules and Releases.
The Statement of Additional Information (SAI) includes additional information about the board members and is available, without charge, upon request. Shareholders may call (800) DIALBEN/342-5236 to request the SAI.
| | | | |
| | | |
38 | | Annual Report | | franklintempleton.com |
FRANKLIN GLOBAL TRUST
FRANKLIN GLOBAL LISTED INFRASTRUCTURE FUND
Shareholder Information
Board Review of Investment Management Agreements
FRANKLIN GLOBAL TRUST
Franklin Global Listed Infrastructure Fund
(Fund)
At anin-person meeting held on February 26, 2019 (Meeting), the Board of Trustees (Board) of Franklin Global Trust (Trust), including a majority of the trustees who are not “interested persons” as defined in the Investment Company Act of 1940 (Independent Trustees), reviewed and approved the continuance of the investment management agreement between Franklin Templeton Institutional, LLC (Manager) and the Trust, on behalf of the Fund (Management Agreement) for an additionalone-year period. The Independent Trustees received advice from and met separately with Independent Trustee counsel in considering whether to approve the continuation of the Management Agreement.
In considering the continuation of the Management Agreement, the Board reviewed and considered information provided by the Manager at the Meeting and throughout the year at meetings of the Board and its committees. The Board also reviewed and considered information provided in response to a detailed set of requests for information submitted to the Manager by Independent Trustee counsel on behalf of the Independent Trustees in connection with the annual contract renewal process. In addition, prior to the Meeting, the Independent Trustees held a telephonic contract renewal meeting at which the Independent Trustees conferred amongst themselves and Independent Trustee counsel about contract renewal matters. The Board reviewed and considered all of the factors it deemed relevant in approving the continuance of the Management Agreement, including, but not limited to: (i) the nature, extent and quality of the services provided by the Manager; (ii) the investment performance of the Fund; (iii) the costs of the services provided and profits realized by the Manager and its affiliates from the relationship with the Fund; (iv) the extent to which economies of scale are realized as the Fund grows; and (v) whether fee levels reflect these economies of scale for the benefit of Fund investors.
In approving the continuance of the Management Agreement, the Board, including a majority of the Independent Trustees, determined that the terms of the Management Agreement are fair and reasonable and that the continuance of such Management Agreement is in the interests of the Fund and its shareholders. While attention
was given to all information furnished, the following discusses some primary factors relevant to the Board’s determination.
Nature, Extent and Quality of Services
The Board reviewed and considered information regarding the nature, extent and quality of investment management services provided by the Manager and its affiliates to the Fund and its shareholders. This information included, among other things, the qualifications, background and experience of the senior management and investment personnel of the Manager; the structure of investment personnel compensation; oversight of third-party service providers; investment performance reports and related financial information for the Fund; reports on expenses, shareholder services, marketing support payments made to financial intermediaries and third party servicing arrangements; legal and compliance matters; risk controls; pricing and other services provided by the Manager and its affiliates; and management fees charged by the Manager and its affiliates to US funds and other accounts, including management’s explanation of differences among accounts where relevant. The Board also reviewed and considered an annual report on payments made by Franklin Templeton Investments (FTI) or the Fund to financial intermediaries, as well as a memorandum relating to third-party servicing arrangements in response to a guidance update in 2016 from the US Securities and Exchange Commission (SEC) relating to mutual fund distribution andsub-accounting fees. The Board noted management’s continuing efforts and expenditures in establishing effective business continuity plans and developing strategies to address areas of heightened concern in the mutual fund industry, such as cybersecurity and liquidity risk management. The Board also recognized management’s commitment to facilitating Board oversight of liquidity through the designation of a liquidity/risk administrator and the development of reports that highlight the amount of illiquid investments for the Fund.
The Board also reviewed and considered the benefits provided to Fund shareholders of investing in a fund that is part of the Franklin Templeton family of funds. The Board noted the financial position of Franklin Resources, Inc. (FRI), the Manager’s parent, and its commitment to the mutual fund business as evidenced by its continued introduction of new funds, reassessment of the fund offerings in response to the market environment and project initiatives and capital investments relating to the services provided to the Fund by the FTI organization.
| | | | |
| | | |
| franklintempleton.com | | Annual Report | | 39 |
FRANKLIN GLOBAL TRUST
FRANKLIN GLOBAL LISTED INFRASTRUCTURE FUND
SHAREHOLDER INFORMATION
Following consideration of such information, the Board was satisfied with the nature, extent and quality of services provided by the Manager and its affiliates to the Fund and its shareholders.
Fund Performance
The Board reviewed and considered the performance results of the Fund over various time periods ended December 31, 2018. The Board considered the performance returns for the Fund in comparison to the performance returns of mutual funds deemed comparable to the Fund included in a universe (Performance Universe) selected by Broadridge Financial Solutions, Inc. (Broadridge), an independent provider of investment company data. The Board received a description of the methodology used by Broadridge to select the mutual funds included in a Performance Universe. The Board also reviewed and considered Fund performance reports provided and discussions that occurred with portfolio managers at Board meetings throughout the year. A summary of the Fund’s performance results is below.
The Performance Universe for the Fund included the Fund and all retail and institutional global infrastructure funds. The Board noted that the Fund’s annualized total return for theone-year period was below the median of its Performance Universe, but for the three- and five-year periods was above the median of its Performance Universe. The Board concluded that the Fund’s performance was acceptable.
Comparative Fees and Expenses
The Board reviewed and considered information regarding the Fund’s actual total expense ratio and its various components, including, as applicable, management fees; transfer agent expenses; underlying fund expenses; Rule12b-1 andnon-Rule12b-1 service fees; and othernon-management fees. The Board also noted the quarterly and annual reports it receives on all marketing support payments made by FTI to financial intermediaries. The Board considered the actual total expense ratio and, separately, the contractual management fee rate, without the effect of fee waivers, if any (Management Rate) of the Fund in comparison to the median expense ratio and median Management Rate, respectively, of other mutual funds deemed comparable to and with a similar expense structure to the Fund selected by Broadridge (Expense Group). Broadridge fee and expense data is based upon information taken from each fund’s most recent annual report, which reflects historical asset levels that may be quite different from those currently existing, particularly in a period of market volatility. While recognizing such inherent limitation
and the fact that expense ratios and Management Rates generally increase as assets decline and decrease as assets grow, the Board believed the independent analysis conducted by Broadridge to be an appropriate measure of comparative fees and expenses. The Broadridge Management Rate includes administrative charges, and the actual total expense ratio, for comparative consistency, was shown for Class A shares for funds with multiple classes of shares. The Board received a description of the methodology used by Broadridge to select the mutual funds included in an Expense Group.
The Expense Group for the Fund included the Fund and seven other global infrastructure funds. The Board noted that the Management Rate for the Fund was slightly above the median of its Expense Group, and its actual total expense ratio was below the median of its Expense Group. The Board concluded that the Management Rate charged to the Fund is reasonable.
Profitability
The Board reviewed and considered information regarding the profits realized by the Manager and its affiliates in connection with the operation of the Fund. In this respect, the Board considered the Fund profitability analysis provided by the Manager that addresses the overall profitability of FTI’s US fund business, as well as its profits in providing investment management and other services to each of the individual funds during the12-month period ended September 30, 2018, being the most recent fiscalyear-end for FRI. The Board noted that although management continually makes refinements to its methodologies used in calculating profitability in response to organizational and product-related changes, the overall methodology has remained consistent with that used in the Fund’s profitability report presentations from prior years. Additionally, PricewaterhouseCoopers LLP, auditor to FRI and certain Franklin Templeton funds, has been engaged by the Manager to periodically review and assess the allocation methodologies to be used solely by the Fund’s Board with respect to the profitability analysis.
The Board noted management’s belief that costs incurred in establishing the infrastructure necessary for the type of mutual fund operations conducted by the Manager and its affiliates may not be fully reflected in the expenses allocated to the Fund in determining its profitability, as well as the fact that the level of profits, to a certain extent, reflected operational cost savings and efficiencies initiated by management. The Board also noted management’s
| | | | |
| | | |
40 | | Annual Report | | franklintempleton.com |
FRANKLIN GLOBAL TRUST
FRANKLIN GLOBAL LISTED INFRASTRUCTURE FUND
SHAREHOLDER INFORMATION
expenditures in improving shareholder services provided to the Fund, as well as the need to implement systems and meet additional regulatory and compliance requirements resulting from recent SEC and other regulatory requirements.
The Board also considered the extent to which the Manager and its affiliates might derive ancillary benefits from fund operations, including revenues generated from transfer agent services, potential benefits resulting from personnel and systems enhancements necessitated by fund growth, as well as increased leverage with service providers and counterparties. Based upon its consideration of all these factors, the Board concluded that the level of profits realized by the Manager and its affiliates from providing services to the Fund was not excessive in view of the nature, extent and quality of services provided to the Fund.
Economies of Scale
The Board reviewed and considered the extent to which the Manager may realize economies of scale, if any, as the Fund grows larger and whether the Fund’s management fee structure reflects any economies of scale for the benefit of shareholders. With respect to possible economies of scale, the Board noted the existence of management fee breakpoints, which operate generally to share any economies of scale with the Fund’s shareholders by reducing the Fund’s effective management fees as the Fund grows in size. The Board considered the Manager’s view that any analyses of potential economies of scale in managing a particular fund are inherently limited in light of the joint and common costs and investments the Manager incurs across the Franklin Templeton family of funds as a whole. The Board noted that the Fund has not yet reached an asset size that would likely enable the Fund to achieve economies of scale, but concluded that to the extent economies of scale may be realized by the Manager and its affiliates, the Fund’s management fee structure provided a sharing of benefits with the Fund and its shareholders as the Fund grows.
Conclusion
Based on its review, consideration and evaluation of all factors it believed relevant, including the above-described factors and conclusions, the Board unanimously approved the continuation of the Management Agreement for an additionalone-year period.
Proxy Voting Policies and Procedures
The Fund’s investment manager has established Proxy Voting Policies and Procedures (Policies) that the Fund uses to determine how to vote proxies relating to portfolio securities. Shareholders may view the Fund’s complete Policies online at franklintempleton.com. Alternatively, shareholders may request copies of the Policies free of charge by calling the Proxy Group collect at (954)527-7678 or by sending a written request to: Franklin Templeton Companies, LLC, 300 S.E. 2nd Street, Fort Lauderdale, FL 33301, Attention: Proxy Group. Copies of the Fund’s proxy voting records are also made available online at franklintempleton.com and posted on the U.S. Securities and Exchange Commission’s website at sec.gov and reflect the most recent12-month period ended June 30.
Quarterly Statement of Investments
The Trust, on behalf of the Fund, files a complete statement of investments with the U.S. Securities and Exchange Commission for the first and third quarters for each fiscal year as an exhibit to its report on FormN-PORT. Shareholders may view the filed FormN-PORT by visiting the Commission’s website at sec.gov. The filed form may also be viewed and copied at the Commission’s Public Reference Room in Washington, DC. Information regarding the operations of the Public Reference Room may be obtained by calling(800) SEC-0330.
Householding of Reports and
Prospectuses
You will receive the Fund’s financial reports every six months as well as an annual updated summary prospectus (prospectus available upon request). To reduce Fund expenses, we try to identify related shareholders in a household and send only one copy of the financial reports and summary prospectus. This process, called “householding,” will continue indefinitely unless you instruct us otherwise. If you prefer not to have these documents householded, please call us at (800)632-2301. At any time you may view current prospectuses/summary prospectuses and financial reports on our website. If you choose, you may receive these documents through electronic delivery.
| | | | |
| | | |
| franklintempleton.com | | Annual Report | | 41 |
This page intentionally left blank.
This page intentionally left blank.
This page intentionally left blank.
Authorized for distribution only when accompanied or preceded by a summary prospectus and/or prospectus. Investors should carefully consider a fund’s investment goals, risks, charges and expenses before investing. A prospectus contains this and other information; please read it carefully before investing.
To help ensure we provide you with quality service, all calls to and from our service areas are monitored and/or recorded.
| | | | | | | | |

| | | | Annual Report and Shareholder Letter Franklin Global Listed Infrastructure Fund | | |
| | | | |
| | | | | Investment Manager Franklin Templeton
Institutional, LLC | | Distributor Franklin Templeton Distributors, Inc. (800) DIAL BEN®/342-5236 franklintempleton.com | | Shareholder Services (800)632-2301 |
| | |
| © 2019 Franklin Templeton Investments. All rights reserved. | | | | 997 A 09/19 |
(a) The Registrant has adopted a code of ethics that applies to its principal executive officers and principal financial and accounting officer.
(c) N/A
(d) N/A
(f) Pursuant to Item 13(a)(1), the Registrant is attaching as an exhibit a copy of its code of ethics that applies to its principal executive officers and principal financial and accounting officer.
| Item 3. | Audit Committee Financial Expert. |
(a)(1) The Registrant has an audit committee financial expert serving on its audit committee.
(2) The audit committee financial expert is Mary C. Choksi and she is “independent” as defined under the relevant Securities and Exchange Commission Rules and Releases.
Item 4. Principal Accountant Fees and Services.
(a) Audit Fees
The aggregate fees paid to the principal accountant for professional services rendered by the principal accountant for the audit of the registrant’s annual financial statements or for services that are normally provided by the principal accountant in connection with statutory and regulatory filings or engagements were $196,960 for the fiscal year ended July 31, 2019 and $199,170 for the fiscal year ended July 31, 2018.
(b) Audit-Related Fees
There were no fees paid to the principal accountant for assurance and related services rendered by the principal accountant to the registrant that are reasonably related to the performance of the audit of the registrant’s financial statements and are not reported under paragraph (a) of Item 4.
There were no fees paid to the principal accountant for assurance and related services rendered by the principal accountant to the registrant’s investment adviser and any entity controlling, controlled by or under common control with the investment adviser that provides ongoing services to the registrant that are reasonably related to the performance of the audit of their financial statements.
(c) Tax Fees
There were no fees paid to the principal accountant for professional services rendered by the principal accountant to the registrant for tax compliance, tax advice and tax planning.
The aggregate fees paid to the principal accountant for professional services rendered by the principal accountant to the registrant’s investment adviser and any entity controlling, controlled by or under common control with the investment adviser that provides ongoing services to the registrant for tax compliance, tax advice and tax planning were $251,750 for the fiscal year ended July 31, 2019 and $116,000 for the fiscal year ended July 31, 2018. The services for which these fees were paid included tax compliance services related to year end, and tax consulting services related to the operating agreement and term sheet for the launch of a new fund.
(d) All Other Fees
The aggregate fees paid to the principal accountant for products and services rendered by the principal accountant to the registrant not reported in paragraphs (a)-(c) of Item 4 were $0 for the fiscal year ended July 31, 2019 and $926 for the fiscal year ended July 31, 2018. The services for which these fees were paid included review of materials provided to the fund Board in connection with the investment management contract renewal process.
The aggregate fees paid to the principal accountant for products and services rendered by the principal accountant to the registrant’s investment adviser and any entity controlling, controlled by or under common control with the investment adviser that provides ongoing services to the registrant not reported in paragraphs (a)-(c) of Item 4 were $14,500 for the fiscal year ended July 31, 2019 and $109,225 for the fiscal year ended July 31, 2018. The services for which these fees were paid included benchmarking services in connection with the ICI TA survey, account maintenance project, the issuance of an Auditors’ Certificate for South Korean regulatory shareholder disclosures, assets under management certification, compliance examination for Investment Advisor Act rule204-2 and206-4(2), and training on partnership tax accounting and capital account maintenance.
(e) (1) The registrant’s audit committee is directly responsible for approving the services to be provided by the auditors, including:
(i)pre-approval of all audit and audit related services;
(ii)pre-approval of allnon-audit related services to be provided to the Fund by the auditors;
(iii)pre-approval of allnon-audit related services to be provided to the registrant by the auditors to the registrant’s investment adviser or to any entity that controls, is controlled by or is under common control with the registrant’s investment adviser and that provides ongoing services to the registrant where thenon-audit services relate directly to the operations or financial reporting of the registrant; and
(iv) establishment by the audit committee, if deemed necessary or appropriate, as an alternative to committeepre-approval of services to be provided by the auditors, as required by paragraphs (ii) and (iii) above, of policies and procedures to permit such services to bepre-approved by other means, such as through establishment of guidelines or by action of a designated member or members of the committee; provided the policies and procedures are detailed as to the particular service and the committee is informed of each service and such policies and procedures do not include delegation of audit committee responsibilities, as contemplated under the Securities Exchange Act of 1934, to management; subject, in the case of (ii) through (iv), to any waivers, exceptions or exemptions that may be available under applicable law or rules.
(e) (2) None of the services provided to the registrant described in paragraphs (b)-(d) of Item 4 were approved by the audit committee pursuant to paragraph (c)(7)(i)(C) of Rule2-01 of regulationS-X.
(f) No disclosures are required by this Item 4(f).
(g) The aggregatenon-audit fees paid to the principal accountant for services rendered by the principal accountant to the registrant and the registrant’s investment adviser and any entity controlling, controlled by or under common control with the investment adviser that provides ongoing services to the registrant were $286,250 for the fiscal year ended July 31, 2019 and $226,151 for the fiscal year ended July 31, 2018.
(h) The registrant’s audit committee of the board has considered whether the provision ofnon-audit services that were rendered to the registrant’s investment adviser (not including anysub-adviser whose role is primarily portfolio management and is subcontracted with or overseen by another investment adviser), and any entity controlling, controlled by, or under common control with the investment adviser that provides ongoing services to the registrant that were notpre-approved pursuant to paragraph (c)(7)(ii) of Rule2-01 of RegulationS-X is compatible with maintaining the principal accountant’s independence.
| Item 5. | Audit Committee of Listed Registrants. N/A |
| Item 6. | Schedule of Investments. N/A |
| Item 7. | Disclosure of Proxy Voting Policies and Procedures forClosed-End Management Investment Companies. N/A |
| Item 8. | Portfolio Managers ofClosed-End Management Investment Companies. N/A |
| Item 9. | Purchases of Equity Securities byClosed-End Management Investment Company and Affiliated Purchasers. N/A |
| Item 10. | Submission of Matters to a Vote of Security Holders. |
There have been no changes to the procedures by which shareholders may recommend nominees to the Registrant’s Board of Trustees that would require disclosure herein.
| Item 11. | Controls and Procedures. |
(a) Evaluation of Disclosure Controls and Procedures. The Registrant maintains disclosure controls and procedures that are designed to provide reasonable assurance that information required to be disclosed in the Registrant’s filings under the Securities Exchange Act of 1934, as amended, and the Investment Company Act of 1940 is recorded, processed, summarized and reported within the periods specified in the rules and forms of the Securities and Exchange Commission. Such information is accumulated and communicated to the Registrant’s management, including its principal executive officer and principal financial officer, as appropriate, to allow timely decisions regarding required disclosure. The Registrant’s management, including the principal executive officer and the principal financial officer, recognizes that any set of controls and procedures, no matter how well designed and operated, can provide only reasonable assurance of achieving the desired control objectives.
Within 90 days prior to the filing date of this Shareholder Report on FormN-CSR, the Registrant had carried out an evaluation, under the supervision and with the participation of the Registrant’s management, including the Registrant’s principal executive officer and the Registrant’s principal financial officer, of the effectiveness of the design and operation of the Registrant’s disclosure controls and procedures. Based on such evaluation, the Registrant’s principal executive officer and principal financial officer concluded that the Registrant’s disclosure controls and procedures are effective.
(b) Changes in Internal Controls.Effective November 1, 2018, the Registrant’s controls were enhanced through the implementation of a daily secondary review of market events following the close of trading on foreign stock markets to ensure the appropriate application of market level fair value.
| Item 12. | Disclosure of Securities Lending Activities forClosed-End Management Investment Company. N/A |
(a) (1) Code of Ethics
(a) (2) Certifications pursuant to Section 302 of the Sarbanes-Oxley Act of 2002 of Matthew T. Hinkle, Chief Executive Officer—Finance and Administration, and Gaston Gardey, Chief Financial Officer and Chief Accounting Officer
(b) Certifications pursuant to Section 906 of the Sarbanes-Oxley Act of 2002 of Matthew T. Hinkle, Chief Executive Officer—Finance and Administration, and Gaston Gardey, Chief Financial Officer and Chief Accounting Officer
SIGNATURES
Pursuant to the requirements of the Securities Exchange Act of 1934 and the Investment Company Act of 1940, the registrant has duly caused this report to be signed on its behalf by the undersigned, thereunto duly authorized.
FRANKLIN GLOBAL TRUST
| | |
| By | | S\ MATTHEW T. HINKLE |
| | Matthew T. Hinkle |
| | Chief Executive Officer - Finance and Administration |
Date September 30, 2019
Pursuant to the requirements of the Securities Exchange Act of 1934 and the Investment Company Act of 1940, this report has been signed below by the following persons on behalf of the registrant and in the capacities and on the dates indicated.
| | |
| By | | S\ MATTHEW T. HINKLE |
| | Matthew T. Hinkle |
| | Chief Executive Officer - Finance and Administration |
Date September 30, 2019
| | |
| By | | S\ GASTON GARDEY |
| | Gaston Gardey |
| | Chief Financial Officer and Chief Accounting Officer |
Date September 30, 2019