|
| OMB APPROVAL | ||
|
| OMB Number: | 3235-0570 | |
|
| Expires: | October 31, 2006 | |
| UNITED STATES | Estimated average burden hours per response. . . . . . . . . . . . . . . . .19.3 | ||
| SECURITIES AND EXCHANGE COMMISSION |
| ||
| Washington, D.C. 20549 |
| ||
FORM N-CSR
CERTIFIED SHAREHOLDER REPORT OF REGISTERED
MANAGEMENT INVESTMENT COMPANIES
Investment Company Act file number | 811-10223 | ||||||||
| |||||||||
ING Senior Income Fund | |||||||||
(Exact name of registrant as specified in charter) | |||||||||
| |||||||||
7337 E. Doubletree Ranch Rd., Scottsdale, AZ |
| 85258 | |||||||
(Address of principal executive offices) |
| (Zip code) | |||||||
| |||||||||
The Corporation Trust Company, 1209 Orange Street, Wilmington, DE 19801 | |||||||||
(Name and address of agent for service) | |||||||||
| |||||||||
Registrant’s telephone number, including area code: | 1-800-992-0180 |
| |||||||
| |||||||||
Date of fiscal year end: | February 28 |
| |||||||
| |||||||||
Date of reporting period: | August 31, 2005 |
| |||||||
ITEM 1. REPORTS TO STOCKHOLDERS.
The following is a copy of the report transmitted to stockholders pursuant to Rule 30e-1 under the Act (17 CFR 270.30e-1):

| Semi-Annual Report | |
|
| |
| August 31, 2005 | |
|
| |
|
| |
|
| |
| ING Senior Income Fund | |
|
| |
|
| |
|
| |
|
| |
| ||
This report is submitted for general information to shareholders of the ING Funds. It is not authorized for distribution to prospective shareholders unless accompanied or preceded by a prospectus which includes details regarding the funds’ investment objectives, risks, charges, expenses and other information. This information should be read carefully. |
| |
| ||
| ||
ING Senior Income Fund | ||
| ||
| ||
SEMI-ANNUAL REPORT | ||
August 31, 2005 | ||
| ||
|
| |
Table of Contents | ||
|
| |
| ||
|
|
|
| ||
|
|
|
| ||
|
|
|
| ||
|
|
|
| ||
|
|
|
| ||
|
|
|
| ||
|
|
|
| ||
|
|
|
| ||
|
|
|
| ||
|
| |
|
| |
|
| |
|
| |
| Go Paperless with E-Delivery! |
|
Sign up now for on-line prospectuses, fund reports, and proxy statements. In less than five minutes, you can help reduce paper mail and lower fund costs. | ||
Just go to www.ingfunds.com, click on the E-Delivery icon from the home page, follow the directions and complete the quick 5 Steps to Enroll. | ||
You will be notified by e-mail when these communications become available on the internet. Documents that are not available on the internet will continue to be sent by mail. | ||
(THIS PAGE INTENTIONALLY LEFT BLANK)
ING Senior Income Fund
Dear Shareholders:
ING Senior Income Fund (the “Fund”) is a diversified, closed-end management investment company that seeks to provide investors with a high level of monthly income. The Fund seeks to achieve this objective by investing in a professionally managed portfolio comprised primarily of senior loans.
| PORTFOLIO CHARACTERISTICS |
| ||
| Net Assets |
| $2,047,781,542 |
|
| Total Assets |
| $2,389,528,841 |
|
| Assets Invested in Senior Loans |
| $2,344,265,260 |
|
| Senior Loans Represented |
| 495 |
|
| Average Amount Outstanding per Loan |
| $4,735,889 |
|
| Industries Represented |
| 39 |
|
| Average Loan Amount per Industry |
| $60,109,366 |
|
| Portfolio Turnover Rate (YTD) |
| 35% |
|
| Weighted Average Days to Interest Rate Reset |
| 40 |
|
| Average Loan Final Maturity |
| 65 months |
|
| Total Leverage as a Percentage of Total Assets |
| 10.5% |
|
|
|
|
|
|
PERFORMANCE SUMMARY
During the six months ended August 31, 2005, the Fund’s Class A and Q shares each distributed total dividends from income of $0.36, resulting in an average annualized distribution rate of 5.02%(1) and 5.04%(1), respectively. During the same period, the Fund’s Class B and Class C shares each distributed total dividends from income of $0.32, resulting in an average annualized distribution rate of 4.53%(1) for Class B shares and 4.52%(1) for Class C shares.
The Fund’s total return for the six months ended August 31, 2005, for each of the share classes, excluding sales charges, ranged from 2.23% on Class A, 1.96% on Class B and Class C and 2.22% on Class Q. The Fund ran slightly behind the S&P/LSTA Leveraged Loan Index, which returned 2.52%.
MARKET OVERVIEW
Following a modest correction earlier in the year, the non-investment grade (“leveraged”, or “senior”) loan market during the most recent quarter regained virtually all ground lost during the previous period. Downside volatility that developed in the wake of the General Motors and Ford downgrades in May was quickly supplanted by the resurgence of demand for floating rate assets as the Federal Reserve marches forward in its quest to find the so-called “equilibrium” Fed Funds rate (i.e., the point at which prevailing short-term interest rates neither stimulate nor dampen economic growth). As buying interest reignited, secondary loan prices ended the quarter near their year-to-date highs and new issue credit spreads tightened in response. In short, the market during the most recent quarter looked remarkably like it did six months ago. One important catalyst to the continuing demand for senior loans remains a still relatively upbeat outlook for the U.S. economy at large, and non-investment grade credit conditions, specifically. At the end of August, the lagging twelve-month default (by number of loans) rate stood at 1.51%, up from the cyclical trough of 0.92% (May 2004), but still comfortably below the historical average. While the longer-term impact on growth attributable to the devastation brought on by hurricanes Katrina and Rita remains to be seen, the underlying strength of the economy continues to surprise even the most skeptical observer. According to Standard & Poor’s, the U.S. economy should continue to expand for the balance of 2005 and 2006, albeit at a moderately slower pace as a result of dislocations stemming from the storms. Continued economic growth, combined with measured increases in short-term interest rates, bodes well for credit conditions and loan valuations going forward.
(1) The distribution rate is calculated by annualizing dividends declared during the period and dividing the resulting annualized dividend by the Fund’s average month-end net asset value (in the case of NAV) or the average month-end NYSE Composite closing price (in the case of Market). The distribution rate is based solely on the actual dividends and distributions, which are made at the discretion of management. The distribution rate may or may not include all investment income and ordinarily will not include capital gains or losses, if any.
3
ING Senior Income Fund
PORTFOLIO MANAGERS’ REPORT (continued)
PORTFOLIO OVERVIEW
Individual loan positioning was the most significant contributor to results for the quarter. The Fund held positions in four of the top five individual contributors during the quarter (three of which resided in the Fund’s top five), and held only one of the lowest contributors (due to repricing activity, not credit deterioration). Sector positioning had a more moderate impact, but still proved positive. One notable change in sector rankings during the period under review was an increase in oil and gas (to 5.5% of total assets, from 3.0% at prior year-end). We remain constructive on this sector given supply demand dynamics and the generally predictable revenue and cash flow profile of companies that operate in this industry. Sectors the Fund continues to underweight and/or avoid include automotive suppliers and steel producers (the latter not material as a percentage of total assets). The auto sector (3.6% of total assets at quarter end, but significantly less if only traditional parts suppliers are included) remains plagued by declining unit volumes and excess capacity, lack of pricing power, and what could prove to be a losing battle with legacy liabilities such as pension costs. Generally speaking, we intend to steer clear of these industries until we see some visibility as to the resolution of some of these key issues.
TOP TEN SENIOR LOAN ISSUERS |
| |||||||
AS OF AUGUST 31, 2005 |
| |||||||
AS A PERCENTAGE OF: |
| |||||||
|
|
| TOTAL |
| NET |
| ||
|
|
| ASSETS |
| ASSETS |
| ||
| Charter Communications Operating, LLC |
| 2.6% |
|
| 3.0% |
|
|
| General Growth Properties, Inc. |
| 2.0% |
|
| 2.3% |
|
|
| Metro-Goldwyn-Mayer Studios, Inc. |
| 1.6% |
|
| 1.9% |
|
|
| Sungard Data Systems, Inc. |
| 1.4% |
|
| 1.6% |
|
|
| Community Health Systems, Inc. |
| 1.4% |
|
| 1.6% |
|
|
| Olympus Cable Holdings, LLC |
| 1.2% |
|
| 1.5% |
|
|
| Davita, Inc. |
| 1.2% |
|
| 1.4% |
|
|
| El Paso Corporation |
| 1.1% |
|
| 1.3% |
|
|
| Reliant Energy Resources Corporation |
| 1.1% |
|
| 1.3% |
|
|
| Fidelity National InformationSolutions, Inc. |
| 1.1% |
|
| 1.3% |
|
|
|
| |||||||
Portfolio holdings are subject to change daily. |
| |||||||
|
| |||||||
TOP TEN INDUSTRY SECTORS AS OF |
| |||||||
AUGUST 31, 2005 AS A |
| |||||||
PERCENTAGE OF: |
| |||||||
|
| TOTAL |
| NET |
| |||
|
| ASSETS |
| ASSETS |
| |||
| North American Cable |
| 9.0% |
|
| 10.5% |
|
|
| Healthcare, Education and Childcare |
| 8.5% |
|
| 10.0% |
|
|
| Buildings and Real Estate |
| 6.1% |
|
| 7.2% |
|
|
| Chemicals, Plastics and Rubber |
| 5.9% |
|
| 6.9% |
|
|
| Oil and Gas |
| 5.5% |
|
| 6.4% |
|
|
| Printing and Publishing |
| 5.3% |
|
| 6.2% |
|
|
| Utilities |
| 4.6% |
|
| 5.4% |
|
|
| Leisure, Amusement, Entertainment |
| 4.2% |
|
| 4.9% |
|
|
| Containers, Packaging and Glass |
| 4.1% |
|
| 4.8% |
|
|
| Automobile |
| 3.6% |
|
| 4.2% |
|
|
|
| |||||||
Portfolio holdings are subject to change daily. |
| |||||||
|
| |||||||
The Fund remains well diversified. As of August 31, 2005, the average individual loan position represented approximately 0.20% of total assets, while the average industry sector accounted for roughly 2.52%. Both measures are slightly below their respective levels at the end of the last quarter.
USE OF LEVERAGE
The Fund seeks to prudently utilize financial leverage in order to increase the yield to shareholders. As of August 31, 2005, the Fund had $252 million outstanding under a $750 million revolving credit facility.
4
ING Senior Income Fund
PORTFOLIO MANAGERS’ REPORT (continued)
OUTLOOK
While several unknowns cloud the near-term horizon, we expect the loan market to finish out the year in solid fashion. On a macro scale, only with the passage of time will we know if the fallout from the gulf storms, particularly the impact of higher energy prices on consumer behavior and input prices, will override the constructive effects of what is expected to be a rebuilding endeavor of historic proportions. The stimulus provided by such a reconstruction effort could propel economic growth well into the foreseeable future. Specific to the loan market, investor sentiment remains decidedly positive, buoyed by a favorable near-term default outlook and the consensus view that short-term rates will continue to grind higher, at least over the near-term. While we share these views, we also remain concerned about increasingly aggressive loan structures and the potential for further erosion in credit spreads brought on by unmet demand for floating rate loans. As such, we continue to avoid transactions that are simply not priced in accordance with the underlying risk. Our strategy remains centered on delivering strong long-term risk-adjusted returns.
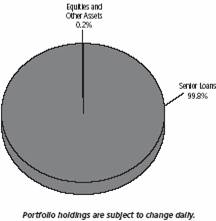
Investment Types
as of August 31, 2005
(as a percent of total investments)
|
|
|
|
|
Jeffrey A. Bakalar |
| Daniel A. Norman |
|
|
Senior Vice President |
| Senior Vice President |
|
|
Senior Portfolio Manager |
| Senior Portfolio Manager |
|
|
ING Investment Management Co. |
| ING Investment Management Co. |
|
|
|
|
|
|
|
|
|
|
|
|


5
ING Senior Income Fund
PORTFOLIO MANAGERS’ REPORT (continued)
|
| Average Annual Total Returns for the |
| |||||||
|
| 1 Year |
| 3 Year |
| April 2, 2001 |
| December 15, 2000 |
| |
Including Sales Charge: |
|
|
|
|
|
|
|
|
|
|
Class A(1) |
| (0.01)% |
| 4.80 | % |
| 5.07% |
| — |
|
Class B(2) |
| 1.45% |
| 5.35 | % |
| 4.92% |
| — |
|
Class C(3) |
| 3.44% |
| 5.96 | % |
| 5.13% |
| — |
|
Class Q |
| 4.91% |
| 6.44 | % |
| — |
| 5.57% |
|
Excluding Sales Charge: |
|
|
|
|
|
|
|
|
|
|
Class A |
| 4.97% |
| 6.52 | % |
| 5.67% |
| — |
|
Class B |
| 4.45% |
| 5.94 | % |
| 5.11% |
| — |
|
Class C |
| 4.44% |
| 5.96 | % |
| 5.13% |
| — |
|
Class Q |
| 4.91% |
| 6.44 | % |
| — |
| 5.57% |
|
S&P/LSTA Leveraged Loan Index(4) |
| 5.27% |
| 6.67 | % |
| 5.06% |
| 5.27% |
|
The table above illustrates the total return of ING Senior Income Fund against the S&P/LSTA Leveraged Loan Index. The Index has no cash in its portfolio, imposes no sales charges and incurs no operating expenses. An investor cannot invest directly in an index. The Fund’s performance is shown both with and without the imposition of sales charges.
Total returns reflect that the Investment Manager may have waived or recouped fees and expenses otherwise payable by the Fund.
Performance data represents past performance and is no assurance of future results. Investment return and principal value of an investment in the Fund will fluctuate. Shares, when sold, may be worth more or less than their original cost. The Fund’s performance may be lower or higher than the performance data shown. Please log on to www.ingfunds.com or call (800) 992-0180 to get performance through the most recent month-end.
This report contains statements that may be “forward-looking” statements. Actual results may differ materially from those projected in the “forward-looking” statements.
The views expressed in this report reflect those of the portfolio managers, only through the end of the period as stated on the cover. The portfolio managers’ views are subject to change at any time based on market and other conditions.
Fund holdings are subject to change daily.
(1) Reflects deduction of the maximum Class A sales charge of 2.50%. There is no front-end sales charge if you purchase Class A Common Shares in an amount of $1 million or more. However, the shares will be subject to a 1.00% EWC if they are repurchased by the Fund within one year of purchase.
(2) Class B maximum Early Withdrawal Charge (“EWC”) is 3% in the first year, declining to 1% in the fifth year and eliminated thereafter.
(3) Class C maximum EWC is 1% for the first year.
(4) Source: S&P/Loan Syndication Trading Association. The S&P/LSTA Leveraged Loan Index (“LLI”) is an unmanaged total return index that captures accrued interest, repayments, and market value changes. It represents a broad cross section of leveraged loans syndicated in the United States, including dollar-denominated loans to overseas issuers. Standard & Poor’s and the Loan Syndications & Trading Association (“LSTA”) conceived the LLI to establish a performance benchmark for the syndicated leveraged loan industry. An investor cannot invest directly in an index. Since inception performance for the index is shown from March 31, 2001 for Class A, B and C and from December 31, 2000 for Class Q.
6
ING Senior Income Fund
PORTFOLIO MANAGERS’ REPORT (continued)
YIELDS AND DISTRIBUTIONS RATES | ||||||||||||||||||
|
|
|
|
|
|
|
|
|
|
|
|
|
|
|
|
|
|
|
|
|
| 30-Day SEC Yields(1) |
| Average Annualized Distribution Rates(2) |
| ||||||||||||
|
|
| Class A |
| Class B |
| Class C |
| Class Q |
| Class A |
| Class B |
| Class C |
| Class Q |
|
|
|
|
|
|
|
|
|
|
|
|
|
|
|
|
|
|
|
|
| August 31, 2005 |
| 4.70% |
| 4.32% |
| 4.31% |
| 4.79% |
| 5.02% |
| 4.53% |
| 4.52% |
| 5.04% |
|
| February 28, 2005 |
| 3.97% |
| 3.57% |
| 3.57% |
| 4.08% |
| 3.88% |
| 3.39% |
| 3.39% |
| 3.90% |
|
|
|
|
|
|
|
|
|
|
|
|
|
|
|
|
|
|
|
|
(1) Yield is calculated by dividing the Fund’s net investment income per share for the most recent thirty days by the net asset value. Yield calculations do not include any commissions or sales charges, and are compounded for six months and annualized for a twelve-month period to derive the Fund’s yield consistent with the SEC standardized yield formula for open-end investment companies.
(2) Distribution Rates are calculated by annualizing dividends declared during the period (i.e., divide the monthly dividend amount by the number of days in the month and multiply by the number of days in the fiscal year) and then dividing the resulting annualized dividend by the month-ending NAV.
Risk is inherent in all investing. The following are the principal risks associated with investing in the Fund. This is not, and is not intended to be, a description of all risks of investing in the Fund. A more detailed description of the risks of investing in the Fund is contained in the Fund’s current prospectus.
Credit Risk: The Fund invests a substantial portion of its assets in below investment grade senior loans and other below investment grade assets. Below investment grade loans involve a greater risk that borrowers may not make timely payment of the interest and principal due on their loans. They also involve a greater risk that the value of such loans could decline significantly. If borrowers do not make timely payments of the interest due on their loans, the yield on the Fund will decrease. If borrowers do not make timely payment of the principal due on their loans, or if the value of such loans decreases, the value of the Fund will decrease.
Interest Rate Risk: Changes in short-term market interest rates will directly affect the yield on the Fund. If short-term market interest rates fall, the yield on the Fund will also fall. To the extent that the interest rate spreads on loans in the Fund experience a general decline, the yield on the Fund will fall and the value of the Fund’s assets may decrease, which will cause the Fund’s value to decrease. Conversely, when short-term market interest rates rise, because of the lag between changes in such short-term rates and the resetting of the floating rates on assets in the Fund, the impact of rising rates will be delayed to the extent of such lag.
Leverage Risk: The Fund borrows money for investment purposes. Borrowing increases both investment opportunity and investment risk. In the event of a general market decline in the value of assets such as those in which the Fund invests, the effect of that decline will be magnified in the Fund because of the additional assets purchased with the proceeds of the borrowings.
7
ING Senior Income Fund
ASSETS: |
|
|
|
Investments in securities at value (Cost $2,323,343,350) |
| $2,349,635,804 |
|
Cash |
| 9,878,702 |
|
Receivables: |
|
|
|
Investment securities sold |
| 1,000,000 |
|
Fund shares sold |
| 13,125,179 |
|
Interest |
| 15,705,094 |
|
Other |
| 59,869 |
|
Prepaid expenses |
| 103,810 |
|
Prepaid arrangement fees on notes payable |
| 20,383 |
|
Total assets |
| 2,389,528,841 |
|
LIABILITIES: |
|
|
|
Payable for investment securities purchased |
| 82,193,252 |
|
Notes payable |
| 252,000,000 |
|
Accrued interest payable |
| 849,854 |
|
Deferred arrangement fees on senior loans |
| 854,457 |
|
Payable to affilates |
| 2,820,790 |
|
Income distribution payable |
| 2,619,091 |
|
Accrued trustees fees |
| 16,083 |
|
Other accrued expenses and liabilities |
| 393,772 |
|
Total liabilities |
| 341,747,299 |
|
NET ASSETS |
| $2,047,781,542 |
|
NET ASSETS CONSIST OF: |
|
|
|
Paid-in capital |
| $2,025,790,743 |
|
Distributions in excess of net investment income |
| (1,945,665 | ) |
Accumulated net realized loss on investments |
| (2,355,990 | ) |
Net unrealized appreciation on investments |
| 26,292,454 |
|
NET ASSETS |
| $2,047,781,542 |
|
See Accompanying Notes to Financial Statements
8
ING Senior Income Fund
STATEMENT OF ASSETS AND LIABILITIES as of August 31, 2005 (Unaudited) (continued)
Class A: |
|
|
| |
Net assets |
| $ | 827,759,899 |
|
Shares authorized |
| unlimited |
| |
Par value |
| $ | 0.01 |
|
Shares outstanding |
| 53,148,041 |
| |
Net asset value and redemption price per share |
| $ | 15.57 |
|
Maximum offering price per share (2.50%)(1) |
| $ | 15.97 |
|
Class B: |
|
|
| |
Net assets |
| $ | 121,102,773 |
|
Shares authorized |
| unlimited |
| |
Par value |
| $ | 0.01 |
|
Shares outstanding |
| 7,789,648 |
| |
Net asset value and redemption price per share(2) |
| $ | 15.55 |
|
Class C: |
|
|
| |
Net assets |
| $ | 915,389,952 |
|
Shares authorized |
| unlimited |
| |
Par value |
| $ | 0.01 |
|
Shares outstanding |
| 58,826,562 |
| |
Net asset value and redemption price per share(2) |
| $ | 15.56 |
|
Class Q: |
|
|
| |
Net assets |
| $ | 183,528,918 |
|
Shares authorized |
| unlimited |
| |
Par value |
| $ | 0.01 |
|
Shares outstanding |
| 11,837,440 |
| |
Net asset value and redemption price per share |
| $ | 15.50 |
|
(1) Maximum offering price is computed ar 100/97.50 of net asset value. On purchases of $100,000 or more, the offering price is reduced.
(2) Redemption price per share may be reduced for any applicable contingent deferred sales charge.
See Accompanying Notes to Financial Statements
9
ING Senior Income Fund
INVESTMENT INCOME: |
|
|
| |
Dividends |
| $ | 37,778 |
|
Interest |
| 63,467,527 |
| |
Arrangement fees earned |
| 436,213 |
| |
Other |
| 1,138,588 |
| |
Total investment income |
| 65,080,106 |
| |
EXPENSES: |
|
|
| |
Investment management fees |
| 9,096,472 |
| |
Administration fees |
| 1,137,059 |
| |
Distribution and service fees: |
|
|
| |
Class A |
| 995,997 |
| |
Class B |
| 615,101 |
| |
Class C |
| 3,322,381 |
| |
Class Q |
| 223,694 |
| |
Transfer agent fees: |
|
|
| |
Class A |
| 148,261 |
| |
Class B |
| 22,808 |
| |
Class C |
| 164,838 |
| |
Class Q |
| 33,258 |
| |
Shareholder reporting expense |
| 167,800 |
| |
Interest expense |
| 5,482,993 |
| |
Custodian fees |
| 411,861 |
| |
Credit facility fees |
| 13,816 |
| |
Professional fees |
| 140,392 |
| |
Trustee fees |
| 39,852 |
| |
SEC registration fees |
| 224,077 |
| |
Postage expense |
| 278,758 |
| |
Miscellaneous expense |
| 46,698 |
| |
Total expenses |
| 22,566,116 |
| |
Recouped fees |
| 170,767 |
| |
Net expenses |
| 22,736,883 |
| |
Net investment income |
| 42,343,223 |
| |
REALIZED AND UNREALIZED GAIN (LOSS) ON INVESTMENTS: |
|
|
| |
Net realized loss on investments |
| (2,644,283 | ) | |
Net change in unrealized appreciation on investments |
| 1,935,113 |
| |
Net realized and unrealized loss on investments |
| (709,170 | ) | |
Net increase in net assets resulting from operations |
| $ | 41,634,053 |
|
See Accompanying Notes to Financial Statements
10
ING Senior Income Fund
|
| Six Months |
| Year |
| ||
INCREASE IN NET ASSETS FROM OPERATIONS: |
|
|
|
|
| ||
Net investment income |
| $ | 42,343,223 |
| $ | 41,435,388 |
|
Net realized income (loss) on investments |
| (2,644,283 | ) | 4,274,502 |
| ||
Net change in unrealized appreciation or |
| 1,935,113 |
| 13,321,736 |
| ||
Net increase in net assets resulting from |
| 41,634,053 |
| 59,031,626 |
| ||
DISTRIBUTIONS TO SHAREHOLDERS: |
|
|
|
|
| ||
Net investment income: |
|
|
|
|
| ||
Class A |
| (18,203,319 | ) | (15,392,853 | ) | ||
Class B |
| (2,524,588 | ) | (3,140,818 | ) | ||
Class C |
| (18,143,832 | ) | (17,474,122 | ) | ||
Class Q |
| (4,119,084 | ) | (6,835,055 | ) | ||
Net realized gain on investments: |
|
|
|
|
| ||
Class A |
| — |
| (1,943,784 | ) | ||
Class B |
| — |
| (416,134 | ) | ||
Class C |
| — |
| (2,526,261 | ) | ||
Class Q |
| — |
| (743,837 | ) | ||
Total distributions |
| (42,990,823 | ) | (48,472,864 | ) | ||
CAPITAL SHARE TRANSACTIONS: |
|
|
|
|
| ||
Net proceeds from sale of shares |
| 506,218,643 |
| 1,640,693,467 |
| ||
Dividends reinvested |
| 28,592,863 |
| 32,670,018 |
| ||
|
| 534,811,506 |
| 1,673,363,485 |
| ||
Cost of shares repurchased |
| (361,214,643 | ) | (477,107,687 | ) | ||
Net increase in net assets resulting from |
| 173,596,863 |
| 1,196,255,798 |
| ||
Net increase in net assets |
| 172,240,093 |
| 1,206,814,560 |
| ||
NET ASSETS: |
|
|
|
|
| ||
Beginning of period |
| 1,875,541,449 |
| 668,726,889 |
| ||
End of period |
| $ | 2,047,781,542 |
| $ | 1,875,541,449 |
|
Distribution in excess of net investment income |
| $ | (1,945,665 | ) | $ | (1,298,065 | ) |
See Accompanying Notes to Financial Statements
11
ING Senior Income Fund
INCREASE (DECREASE) IN CASH |
|
|
| |
Cash Flows From Operating Activities: |
|
|
| |
Interest received |
| $ | 58,636,597 |
|
Facility fees paid |
| (34,126 | ) | |
Arrangement fee paid |
| 131,326 |
| |
Other income received |
| 1,165,579 |
| |
Interest paid |
| (4,977,475 | ) | |
Other operating expenses paid |
| (15,410,680 | ) | |
Purchases of investments |
| (1,657,764,911 | ) | |
Proceeds from disposition of investments |
| 1,401,054,483 |
| |
Net cash used for operating activities |
| (217,199,207 | ) | |
Cash Flows From Financing Activities: |
|
|
| |
Distributions paid to common shareholders |
| (14,397,960 | ) | |
Proceeds from capital shares sold |
| 512,803,896 |
| |
Disbursements for capital shares repurchased |
| (361,214,643 | ) | |
Net issuance of notes payable |
| 89,000,000 |
| |
Net cash flows provided by financing activities |
| 226,191,293 |
| |
Net increase in cash |
| 8,992,086 |
| |
Cash at beginning of period |
| 886,616 |
| |
Cash at end of period |
| $ | 9,878,702 |
|
Reconciliation of Net Increase In Net Assets Resulting From |
|
|
| |
Net increase in net assets resulting from operations |
| $ | 41,634,053 |
|
Adjustments to reconcile net increase in net assets resulting |
|
|
| |
Change in unrealized appreciation on investments |
| (1,935,113 | ) | |
Net accretion/amortization of discounts on investments |
| 155,948 |
| |
Realized gain on sale of investments |
| 2,644,283 |
| |
Purchases of investments |
| (1,657,764,912 | ) | |
Proceeds on sale of investments |
| 1,401,054,483 |
| |
Increase in interest receivable |
| (5,024,654 | ) | |
Decrease in other receivable |
| 26,991 |
| |
Increase in prepaid arrangement fees on notes payable |
| (20,310 | ) | |
Decrease in prepaid expenses |
| 192,071 |
| |
Decrease in deferred arrangement fees on senior loans |
| (304,887 | ) | |
Increase in accrued interest payable |
| 505,518 |
| |
Increase in payable to affiliate |
| 698,098 |
| |
Increase in accrued trustee fees |
| 10,919 |
| |
Increase in income distribution payable |
| 997,186 |
| |
Decrease in accrued expenses |
| (68,881 | ) | |
Total adjustments |
| (258,833,260 | ) | |
Net cash used for operating activities |
| $ | (217,199,207 | ) |
Non Cash Financing Activities |
|
|
| |
Receivable for shares sold |
| $ | 13,125,179 |
|
Reinvestment of dividends |
| $ | 28,592,863 |
|
See Accompanying Notes to Financial Statements
12
ING SENIOR INCOME FUND (UNAUDITED) |
|
Selected data for a share of beneficial interest outstanding throughout each period.
|
| Class A |
| ||||||||||
|
| Six Months |
|
|
|
|
|
|
| April 2, |
| ||
|
| Ended |
| Year Ended |
| 2001(1) to |
| ||||||
|
| August 31, |
| February 28 or 29, |
| February 28, |
| ||||||
|
| 2005 |
| 2005 |
| 2004 |
| 2003 |
| 2002 |
| ||
Per Share Operating Performance: |
|
|
|
|
|
|
|
|
|
|
| ||
Net asset value, beginning of period | $ | 15.59 |
| 15.47 |
| 14.83 |
| 14.92 |
| 15.00 |
|
| |
Income (loss) from investment operations: |
|
|
|
|
|
|
|
|
|
|
|
| |
Net investment income | $ | 0.36 |
| 0.55 |
| 0.61 |
| 0.69 |
| 0.81 |
|
| |
Net realized and unrealized gain (loss) on investments | $ | (0.02 | ) | 0.18 |
| 0.69 |
| (0.09 | ) | (0.09 | ) |
| |
Total income from investment operations | $ | 0.34 |
| 0.73 |
| 1.30 |
| 0.60 |
| 0.72 |
|
| |
Less distributions from: |
|
|
|
|
|
|
|
|
|
|
|
| |
Net investment income | $ | 0.36 |
| 0.56 |
| 0.64 |
| 0.69 |
| 0.80 |
|
| |
Net realized gain on investments | $ | — |
| 0.05 |
| 0.02 |
| — |
| — |
|
| |
Total distributions | $ | 0.36 |
| 0.61 |
| 0.66 |
| 0.69 |
| 0.80 |
|
| |
Net asset value, end of period | $ | 15.57 |
| 15.59 |
| 15.47 |
| 14.83 |
| 14.92 |
|
| |
Total Investment Return(2) | % | 2.23 |
| 4.80 |
| 8.93 |
| 4.15 |
| 4.92 |
|
| |
Ratios/Supplemental Data: |
|
|
|
|
|
|
|
|
|
|
|
| |
Net assets, end of period (000’s) | $ | 827,760 |
| 736,740 |
| 172,975 |
| 11,106 |
| 2,411 |
|
| |
Average borrowings (000’s)(3) | $ | 287,005 |
| 34,767 |
| 20,771 |
| 17,655 |
| 19,797 |
|
| |
Asset coverage per $100 of debt | $ | 913 |
| 1,251 |
| — | * | 689 |
| 3,220 |
|
| |
Ratios to average net assets after reimbursement/recoupment: |
|
|
|
|
|
|
|
|
|
|
|
| |
Expenses (before interest and other fees related to revolving credit facility)(4)(5) | % | 1.48 |
| 1.34 |
| 1.36 |
| 1.42 |
| 1.47 |
|
| |
Expenses (with interest and other fees related to revolving credit facility)(4)(5) | % | 2.04 |
| 1.45 |
| 1.43 |
| 1.63 |
| 1.73 |
|
| |
Net investment income(4)(5) | % | 4.52 |
| 3.49 |
| 3.84 |
| 4.88 |
| 5.58 |
|
| |
Ratios to average net assets before reimbursement/recoupment: |
|
|
|
|
|
|
|
|
|
|
|
| |
Expenses (before interest and other fees related to revolving credit facility)(4)(5) | % | 1.45 |
| 1.35 |
| 1.46 |
| 1.57 |
| 1.82 |
|
| |
Expenses (with interest and other fees related to revolving credit facility)(4)(5) | % | 2.01 |
| 1.46 |
| 1.53 |
| 1.78 |
| 2.07 |
|
| |
Net investment income(4)(5) | % | 4.56 |
| 3.48 |
| 3.74 |
| 4.73 |
| 5.26 |
|
| |
Portfolio turnover rate | % | 35 |
| 82 |
| 72 |
| 60 |
| 65 |
|
| |
Shares outstanding at end of period (000’s) |
| 53,148 |
| 47,252 |
| 11,180 |
| 749 |
| 162 |
|
| |
|
|
|
| ||||||||||
|
| Class B |
| ||||||||||
|
| Six Months |
|
|
|
|
|
|
| April 2, |
| ||
|
| Ended |
| Year Ended |
| 2001(1) to |
| ||||||
|
| August 31, |
| February 28 or 29, |
| February 28, |
| ||||||
|
| 2005 |
| 2005 |
| 2004 |
| 2003 |
| 2002 |
| ||
Per Share Operating Performance: |
|
|
|
|
|
|
|
|
|
|
| ||
Net asset value, beginning of period | $ | 15.57 |
| 15.45 |
| 14.82 |
| 14.92 |
| 15.00 |
|
| |
Income (loss) from investment operations: |
|
|
|
|
|
|
|
|
|
|
|
| |
Net investment income | $ | 0.29 |
| 0.47 | ** | 0.53 |
| 0.62 |
| 0.75 |
|
| |
Net realized and unrealized gain (loss) on investments | $ | 0.01 |
| 0.18 | ** | 0.69 |
| (0.10 | ) | (0.10 | ) |
| |
Total income from investment operations | $ | 0.30 |
| 0.65 |
| 1.22 |
| 0.52 |
| 0.65 |
|
| |
Less distributions from: |
|
|
|
|
|
|
|
|
|
|
|
| |
Net investment income | $ | 0.32 |
| 0.48 |
| 0.57 |
| 0.62 |
| 0.73 |
|
| |
Net realized gain on investments | $ | — |
| 0.05 |
| 0.02 |
| — |
| — |
|
| |
Total distributions | $ | 0.32 |
| 0.53 |
| 0.59 |
| 0.62 |
| 0.73 |
|
| |
Net asset value, end of period | $ | 15.55 |
| 15.57 |
| 15.45 |
| 14.82 |
| 14.92 |
|
| |
Total Investment Return(2) | % | 1.96 |
| 4.28 |
| 8.33 |
| 3.57 |
| 4.45 |
|
| |
Ratios/Supplemental Data: |
|
|
|
|
|
|
|
|
|
|
|
| |
Net assets, end of period (000’s) | $ | 121,103 |
| 125,200 |
| 62,852 |
| 17,648 |
| 12,776 |
|
| |
Average borrowings (000’s)(3) | $ | 287,005 |
| 34,767 |
| 20,771 |
| 17,655 |
| 19,797 |
|
| |
Asset coverage per $100 of debt | $ | 913 |
| 1,251 |
| — | * | 689 |
| 3,220 |
|
| |
Ratios to average net assets after reimbursement/recoupment: |
|
|
|
|
|
|
|
|
|
|
|
| |
Expenses (before interest and other fees related to revolving credit facility)(4)(5) | % | 1.98 |
| 1.87 |
| 1.87 |
| 1.91 |
| 1.96 |
|
| |
Expenses (with interest and other fees related to revolving credit facility)(4)(5) | % | 2.54 |
| 1.94 |
| 1.97 |
| 2.09 |
| 2.23 |
|
| |
Net investment income(4)(5) | % | 4.01 |
| 2.93 |
| 3.47 |
| 4.12 |
| 5.19 |
|
| |
Ratios to average net assets before reimbursement/recoupment: |
|
|
|
|
|
|
|
|
|
|
|
| |
Expenses (before interest and other fees related to revolving credit facility)(4)(5) | % | 2.20 |
| 2.13 |
| 2.22 |
| 2.31 |
| 2.29 |
|
| |
Expenses (with interest and other fees related to revolving credit facility)(4)(5) | % | 2.76 |
| 2.19 |
| 2.31 |
| 2.49 |
| 2.54 |
|
| |
Net investment income(4)(5) | % | 3.80 |
| 2.67 |
| 3.13 |
| 3.72 |
| 4.89 |
|
| |
Portfolio turnover rate | % | 35 |
| 82 |
| 72 |
| 60 |
| 65 |
|
| |
Shares outstanding at end of period (000’s) |
| 7,790 |
| 8,043 |
| 4,068 |
| 1,191 |
| 856 |
|
| |
(1) Commencement of operations.
(2) Total investment returns are not annualized for periods of less than one year and do not include sales load.
(3) Based on the active days of borrowing.
(4) Annualized for periods less than one year.
(5) The Investment Manager has agreed to limit expenses excluding interest, taxes, brokerage commissions, leverage expenses, other investment related costs and extraordinary expenses, subject to possible recoupment by the Investment Manager within three years.
* There were no loans outstanding at period end.
** Per share numbers have been calculated using the monthly average share method, which more appropriately represents the per share data for the period.
See Accompanying Notes to Financial Statements
13
ING SENIOR INCOME FUND (UNAUDITED) (CONTINUED) |
| FINANCIAL HIGHLIGHTS |
Selected data for a share of beneficial interest outstanding throughout each period.
|
| Class C |
| |||||||||||||||||
|
| Six Months |
|
|
|
|
|
|
| April 2, |
| |||||||||
|
| Ended |
| Year Ended |
| 2001(1) to |
| |||||||||||||
|
| August 31, |
| February 28 or 29, |
| February 28, |
| |||||||||||||
|
| 2005 |
| 2005 |
| 2004 |
| 2003 |
| 2002 |
| |||||||||
Per Share Operating Performance: |
|
|
|
|
|
|
|
|
|
|
| |||||||||
Net asset value, beginning of period | $ | 15.58 |
| 15.46 |
| 14.82 |
| 14.92 |
| 15.00 |
|
| ||||||||
Income (loss) from investment operations: |
|
|
|
|
|
|
|
|
|
|
|
| ||||||||
Net investment income | $ | 0.32 |
| 0.47 |
| 0.53 |
| 0.62 |
| 0.75 |
|
| ||||||||
Net realized and unrealized gain (loss) on investments | $ | (0.02 | ) | 0.18 |
| 0.70 |
| (0.10 | ) | (0.10 | ) |
| ||||||||
Total income from investment operations | $ | 0.30 |
| 0.65 |
| 1.23 |
| 0.52 |
| 0.65 |
|
| ||||||||
Less distributions from: |
|
|
|
|
|
|
|
|
|
|
|
| ||||||||
Net investment income | $ | 0.32 |
| 0.48 |
| 0.57 |
| 0.62 |
| 0.73 |
|
| ||||||||
Net realized gain on investments | $ | — |
| 0.05 |
| 0.02 |
| — |
| — |
|
| ||||||||
Total distributions | $ | 0.32 |
| 0.53 |
| 0.59 |
| 0.62 |
| 0.73 |
|
| ||||||||
Net asset value, end of period | $ | 15.56 |
| 15.58 |
| 15.46 |
| 14.82 |
| 14.92 |
|
| ||||||||
Total Investment Return(2) | % | 1.96 |
| 4.28 |
| 8.40 |
| 3.57 |
| 4.45 |
|
| ||||||||
Ratios/Supplemental Data: |
|
|
|
|
|
|
|
|
|
|
|
| ||||||||
Net assets, end of period (000’s) | $ | 915,390 |
| 830,584 |
| 275,849 |
| 32,647 |
| 19,391 |
|
| ||||||||
Average borrowings (000’s)(3) | $ | 287,005 |
| 34,767 |
| 20,771 |
| 17,655 |
| 19,797 |
|
| ||||||||
Asset coverage per $100 of debt | $ | 913 |
| 1,251 |
| — | * | 689 |
| 3,220 |
|
| ||||||||
Ratios to average net assets after reimbursement/recoupment: |
|
|
|
|
|
|
|
|
|
|
|
| ||||||||
Expenses (before interest and other fees related to revolving credit facility)(4)(5) | % | 1.98 |
| 1.83 |
| 1.86 |
| 1.91 |
| 1.96 |
|
| ||||||||
Expenses (with interest and other fees related to revolving credit facility)(4)(5) | % | 2.54 |
| 1.94 |
| 1.94 |
| 2.09 |
| 2.23 |
|
| ||||||||
Net investment income(4)(5) | % | 4.02 |
| 2.88 |
| 3.38 |
| 4.19 |
| 5.20 |
|
| ||||||||
Ratios to average net assets before reimbursement/recoupment: |
|
|
|
|
|
|
|
|
|
|
|
| ||||||||
Expenses (before interest and other fees related to revolving credit facility)(4)(5) | % | 1.95 |
| 1.83 |
| 1.96 |
| 2.06 |
| 2.29 |
|
| ||||||||
Expenses (with interest and other fees related to revolving credit facility)(4)(5) | % | 2.51 |
| 1.95 |
| 2.04 |
| 2.24 |
| 2.54 |
|
| ||||||||
Net investment income(4)(5) | % | 4.05 |
| 2.87 |
| 3.28 |
| 4.04 |
| 4.89 |
|
| ||||||||
Portfolio turnover rate | % | 35 |
| 82 |
| 72 |
| 60 |
| 65 |
|
| ||||||||
Shares outstanding at end of period (000’s) |
| 58,827 |
| 53,316 |
| 17,841 |
| 2,202 |
| 1,300 |
|
| ||||||||
|
|
|
| |||||||||||||||||
|
| Class Q |
| |||||||||||||||||
|
| Six Months |
|
|
|
|
|
|
| April 2, |
| |||||||||
|
| Ended |
| Year Ended |
| 2001(1) to |
| |||||||||||||
|
| August 31, |
| February 28 or 29, |
| February 28, |
| |||||||||||||
|
| 2005 |
| 2005 |
| 2004 | 2003 | 2002(6) |
| 2001 |
| |||||||||
Per Share Operating Performance: |
|
|
|
|
|
|
|
|
|
|
|
|
| |||||||
Net asset value, beginning of period | $ | 15.52 |
| 15.41 |
| 14.79 |
| 14.89 |
| 15.30 |
| 15.02 |
|
| ||||||
Income (loss) from investment operations: |
|
|
|
|
|
|
|
|
|
|
|
|
|
| ||||||
Net investment income | $ | 0.36 |
| 0.52 |
| 0.63 |
| 0.69 |
| 0.81 |
| 0.14 |
|
| ||||||
Net realized and unrealized gain (loss) on investments | $ | (0.02 | ) | 0.20 |
| 0.65 |
| (0.10 | ) | (0.32 | ) | 0.14 |
|
| ||||||
Total income from investment operations | $ | 0.34 |
| 0.72 |
| 1.28 |
| 0.59 |
| 0.49 |
| 0.28 |
|
| ||||||
Less distributions from: |
|
|
|
|
|
|
|
|
|
|
|
|
|
| ||||||
Net investment income | $ | 0.36 |
| 0.56 |
| 0.64 |
| 0.69 |
| 0.90 |
| — |
|
| ||||||
Net realized gain on investments | $ | — |
| 0.05 |
| 0.02 |
| — |
| — |
| — |
|
| ||||||
Total distributions | $ | 0.36 |
| 0.61 |
| 0.66 |
| 0.69 |
| 0.90 |
| — |
|
| ||||||
Net asset value, end of period | $ | 15.50 |
| 15.52 |
| 15.41 |
| 14.79 |
| 14.89 |
| 15.30 |
|
| ||||||
Total Investment Return(2) | % | 2.22 |
| 4.75 |
| 8.82 |
| 4.09 |
| 3.73 |
| 1.80 |
|
| ||||||
Ratios/Supplemental Data: |
|
|
|
|
|
|
|
|
|
|
|
|
|
| ||||||
Net assets, end of period (000’s) | $ | 183,529 |
| 183,017 |
| 157,051 |
| 215,341 |
| 215,029 |
| 94,096 |
|
| ||||||
Average borrowings (000’s)(3) | $ | 287,005 |
| 34,767 |
| 20,771 |
| 17,655 |
| 19,797 |
| — |
|
| ||||||
Asset coverage per $100 of debt | $ | 913 |
| 1,251 |
| — | * | 689 |
| 3,220 |
| — | * |
| ||||||
Ratios to average net assets after reimbursement/recoupment: |
|
|
|
|
|
|
|
|
|
|
|
|
|
| ||||||
Expenses (before interest and other fees related to revolving credit facility)(4)(5) | % | 1.48 |
| 1.34 |
| 1.40 |
| 1.41 |
| 1.43 |
| — |
|
| ||||||
Expenses (with interest and other fees related to revolving credit facility)(4)(5) | % | 2.04 |
| 1.45 |
| 1.54 |
| 1.59 |
| 1.63 |
| 1.85 |
|
| ||||||
Net investment income(4)(5) | % | 4.51 |
| 3.39 |
| 4.17 |
| 4.69 |
| 5.94 |
| 7.00 |
|
| ||||||
Ratios to average net assets before reimbursement/recoupment: |
|
|
|
|
|
|
|
|
|
|
|
|
|
| ||||||
Expenses (before interest and other fees related to revolving credit facility)(4)(5) | % | 1.45 |
| 1.34 |
| 1.48 |
| 1.56 |
| 1.70 |
| — |
|
| ||||||
Expenses (with interest and other fees related to revolving credit facility)(4)(5) | % | 2.01 |
| 1.45 |
| 1.62 |
| 1.74 |
| 1.90 |
| 1.85 |
|
| ||||||
Net investment income(4)(5) | % | 4.55 |
| 3.38 |
| 4.09 |
| 4.54 |
| 5.67 |
| 7.00 |
|
| ||||||
Portfolio turnover rate | % | 35 |
| 82 |
| 72 |
| 60 |
| 65 |
| 11 |
|
| ||||||
Shares outstanding at end of period (000’s) |
| 11,837 |
| 11,789 |
| 10,188 |
| 14,559 |
| 14,439 |
| 6,152 |
|
| ||||||
(1) Commencement of operations.
(2) Total investment returns are not annualized for periods of less than one year and do not include sales load.
(3) Based on the active days of borrowing.
(4) Annualized for periods less than one year.
(5) The Investment Manager has agreed to limit expenses excluding interest, taxes, brokerage commissions, leverage expenses, other investment related costs and extraordinary expenses, subject to possible recoupment by the Investment Manager within three years.
(6) Effective March 30, 2001, the Management of the Fund effectuated a reverse stock split of 0.6656 of a Share for one Share. Prior period amounts have been restated to reflect the reverse stock split.
* There were no loans outstanding at period end.
See Accompanying Notes to Financial Statements
14
ING Senior Income Fund
NOTE 1 — ORGANIZATION
ING Senior Income Fund (the “Fund”), a Delaware statutory trust, is registered under the Investment Company Act of 1940 as amended, (the “1940 Act”), as a continuously-offered, diversified, closed-end, management investment company. The Fund invests at least 80% of its assets in senior loans which are exempt from registration under the Securities Act of 1933 as amended (the “‘33 Act”), but contain certain restrictions on resale and cannot be sold publicly. These loans bear interest (unless otherwise noted) at rates that float periodically at a margin above the London Inter-Bank Offered Rate (“LIBOR”) and other short-term rates. During the period December 15, 2000 through March 30, 2001, the Fund issued 19,933,953 Class Q shares to an affiliate of the Fund’s manager, ING Investments, LLC (the “Investment Manager”) in exchange for $200,000,000. Effective April 2, 2001, the Fund commenced the offering of Class A, Class B, Class C and Class Q shares to the public.
The Fund currently has four classes of shares; A, B, C and Q. Class A shares are subject to a sales charge of up to 2.50%. Class A shares purchased in excess of $1,000,000 are subject to an Early Withdrawal Charge (“EWC”) of up to 1% within one year of purchase. Class A shares are issued upon conversion of Class B shares eight years after purchase or through an exchange of Class A shares of certain ING Funds. Class B common shares are subject to an EWC of up to 3% over the five-year period after purchase and Class C common shares are subject to an EWC of 1% during the first year after purchase.
To maintain a measure of liquidity, the Fund offers to repurchase between 5% and 25% of its outstanding common shares on a monthly basis. This is a fundamental policy that can not be changed without shareholder approval. The Fund currently anticipates offerings to repurchase 5% of its outstanding common shares each month. The Fund may not repurchase more than 25% in any calendar quarter. Other than these monthly repurchases, no market for the Fund’s common shares is expected to exist. The separate classes of shares differ principally in the distribution fees and shareholder servicing fees. All shareholders bear the common expenses of the Fund and earn income and realized gains/losses from the portfolio pro rata on the average daily net assets of each class, without distinction between share classes. Differences in the per share dividend rates generally result from differences in separate class expenses, including distribution fees and shareholder servicing fees.
Effective January 31, 2005, Class B common shares of the Fund are closed to new investment, provided that (1) Class B common shares of SIF may be purchased through the reinvestment of dividends issued by SIF; and (2) subject to the terms and conditions of relevant exchange privileges and as permitted under their respective prospectuses, Class B common shares of SIF may be acquired through exchange of Class B shares of other funds in the ING mutual funds complex for SIF’s Class B common shares.
NOTE 2 — SIGNIFICANT ACCOUNTING POLICIES
The following is a summary of the significant accounting policies consistently followed by the Fund in the preparation of its financial statements. The policies are in conformity with generally accepted accounting principles in the United States of America.
A. Senior Loan and Other Security Valuation. Senior loans held by the Fund are normally valued at the mean of the means of one or more bid and asked quotations obtained from a pricing service or other sources determined by the Board of Trustees to be independent and believed to be reliable. Loans for which reliable market value quotations are not readily available may be valued with reference to another loan or a group of loans for which quotations are more readily available and whose characteristics are comparable to the loan being valued. Under this approach, the comparable loan or loans serve as a proxy for changes in value of the loan being valued.
The Fund has engaged an independent pricing service to provide quotations from dealers in loans and to calculate values under the proxy procedure described above. It is expected that
15
ING Senior Income Fund
NOTES TO FINANCIAL STATEMENTS as of August 31, 2005 (Unaudited) (continued)
NOTE 2 — SIGNIFICANT ACCOUNTING POLICIES (continued)
most of the loans held by the Fund will be valued with reference to quotations from the independent pricing service or with reference to the proxy procedure described above. As of August 31, 2005, 99.96% of total investments were valued based on these procedures.
Prices from a pricing service may not be available for all loans and the Investment Manager may believe that the price for a loan derived from market quotations or the proxy procedure described above is not reliable or accurate. Among other reasons, this may be the result of information about a particular loan or borrower known to the Investment Manager that the Investment Manager believes may not be known to the pricing service or reflected in a price quote. In this event, the loan is valued at fair value as determined in good faith under procedures established by the Fund’s Board of Trustees and in accordance with the provisions of the 1940 Act. Under these procedures, fair value is determined by the Investment Manager and monitored by the Fund’s Board of Trustees through its Valuation, Proxy and Brokerage Committee (formerly, Valuation and Proxy Committee). In fair valuing a loan, consideration is given to several factors, which may include, among others, the following: (i) the characteristics of and fundamental analytical data relating to the loan, including the cost, size, current interest rate, period until the next interest rate reset, maturity and base lending rate of the loan, the terms and conditions of the loan and any related agreements, and the position of the loan in the borrower’s debt structure; (ii) the nature, adequacy and value of the collateral, including the Fund’s rights, remedies and interests with respect to the collateral; (iii) the creditworthiness of the borrower and the cash flow coverage of outstanding principal and interest, based on an evaluation of its financial condition, financial statements and information about the borrower’s business, cash flows, capital structure and future prospects; (iv) information relating to the market for the loan, including price quotations for, and trading in, the loan and interests in similar loans and the market environment and investor attitudes towards the loan and interests in similar loans; (v) the reputation and financial condition of the agent for the loan and any intermediate participants in the loan; (vi) the borrower’s management; and (vii) the general economic and market conditions affecting the fair value of the loan. Securities other than senior loans for which reliable market value quotations are not readily available and all other assets will be valued at their respective fair values as determined in good faith by, and under procedures established by, the Board of Trustees of the Fund. Investments in securities maturing in 60 days or less from the date of valuation are valued at amortized cost, which, when combined with accrued interest, approximates market value. To the extent the Fund invests in other registered companies, the Fund’s NAV is calculated based on the current NAV of the registered investment company in which the Fund invests. The prospectuses for those investment companies explain the circumstances under which they will use fair value pricing and the effects of using fair value pricing.
B. Distributions to Shareholders. The Fund declares and goes ex-dividend daily and pays dividends monthly from net investment income. Distributions from capital gains, if any, are declared and paid annually. The Fund may make additional distributions to comply with the distribution requirements of the Internal Revenue Code. The character and amounts of income and gains to be distributed are determined in accordance with federal income tax regulations, which may differ from accounting principles generally accepted in the United States of America for investment companies. Dividends paid by the Fund from net investment income and distributions of net realized short-term capital gains are, for federal income tax purposes, taxable as ordinary income to shareholders. The Fund records distributions to its shareholders on the ex-dividend date.
C. Security Transactions and Revenue Recognition. Revolver and delayed draw loans are booked on a settlement date basis. Security transactions and senior loans are accounted for on trade date (date the order to buy or sell is executed). Realized gains or losses are reported on the basis of identified cost of securities sold. Interest income is recorded on an accrual basis at the then-current loan rate. The accrual of interest on loans is discontinued when, in the opinion of management, there is an indication that the borrower may be unable to meet payments as they become due. Upon such discontinuance, all unpaid accrued interest is reversed. Cash collections on non-accrual loans are
16
ING Senior Income Fund
NOTES TO FINANCIAL STATEMENTS as of August 31, 2005 (Unaudited) (continued)
NOTE 2 — SIGNIFICANT ACCOUNTING POLICIES (continued)
generally applied as a reduction to the recorded investment of the loan. Loans are generally returned to accrual status only after all past due amounts have been received and the borrower has demonstrated sustained performance. Premium amortization and discount accretion are determined by the effective yield method over the shorter of four years or the actual term of the loan. Arrangement fees received on revolving credit facilities, which represent non-refundable fees or purchase discounts associated with the acquisition of loans, are deferred and recognized using the effective yield method over the shorter of four years or the actual term of the loan. No such fees are recognized on loans which have been placed on non-accrual status. Arrangement fees associated with all other loans, except revolving credit facilities, are treated as discounts and are accreted as described above. Dividend income is recorded on the ex-dividend date.
D. Federal Income Taxes. It is the Fund’s policy to comply with subchapter M of the Internal Revenue Code and related excise tax provisions applicable to regulated investment companies and to distribute substantially all of its net investment income and net realized capital gains to its shareholders. Therefore, no federal income tax provision is required. No capital gain distributions shall be made until any capital loss carryforwards have been fully utilized or expire.
E. Use of Estimates. Management of the Fund has made certain estimates and assumptions relating to the reporting of assets, liabilities, revenues, expenses and contingencies to prepare these financial statements in conformity with accounting principles generally accepted in the United States of America for investment companies. Actual results could differ from these estimates.
NOTE 3 — INVESTMENTS
For the six months ended August 31, 2005, the cost of purchases and the proceeds from principal repayment and sales of investments, excluding short-term investments, totaled $1,091,557,351 and $797,058,293, respectively. At August 31, 2005, the Fund held senior loans valued at $2,344,265,260 representing 99.8% of its total investments (excluding short-term investments). The market value of these assets is established as set forth in Note 2.
The senior loans acquired by the Fund may take the form of a direct lending relationship with the borrower or an assignment of a lender’s interest in a loan. The lead lender in a typical corporate loan syndicate administers the loan and monitors collateral. In the event that the lead lender becomes insolvent, enters FDIC receivership or, if not FDIC insured, enters into bankruptcy, the Fund may incur certain costs and delays in realizing payment, or may suffer a loss of principal and/or interest.
Warrants and shares of common stock held in the portfolio were acquired in conjunction with loans held by the Fund. Certain of these shares and warrants are restricted and may not be publicly sold without registration under the ‘33 Act, or without an exemption under the ‘33 Act. In some cases, these restrictions expire after a designated period of time after the issuance of the stock.
Dates of acquisition and cost or assigned basis of restricted securities are as follows:
|
|
| Date of |
|
|
| Cost or |
|
| |||
|
|
| Acquisition |
|
|
| Assigned Basis |
|
| |||
|
|
|
|
|
| |||||||
Decision One Corporation — Common Shares |
| 06/03/05 |
|
| $ | 295,535 |
|
| ||||
Galey & Lord, Inc. — Common Shares |
| 03/31/04 |
|
| — |
|
| |||||
Murray’s Discount Auto Stores, Inc. — Escrow |
| 08/11/03 |
|
| 21,891 |
|
| |||||
Neoplan USA Corporation — Common Shares |
| 08/31/04 |
|
| — |
|
| |||||
Neoplan USA Corporation — Preferred B Shares |
| 08/29/03 |
|
| — |
|
| |||||
Neoplan USA Corporation — Preferred C Shares |
| 08/29/03 |
|
| 40,207 |
|
| |||||
Neoplan USA Corporation — Preferred D Shares |
| 08/29/03 |
|
| 330,600 |
|
| |||||
New World Restaurant Group, Inc. — Warrants |
| 02/20/02 |
|
| 20 |
|
| |||||
Norwood Promotional Products, Inc. — Common Shares |
| 08/23/04 |
|
| 10,046 |
|
| |||||
Safelite Glass Corporation — Common Shares |
| 06/21/01 |
|
| — |
|
| |||||
Safelite Realty Corporation — Common Shares |
| 06/21/01 |
|
| — |
|
| |||||
Targus Group, Inc. — Warrants |
| 03/11/03 |
|
| — |
|
| |||||
Total restricted securities excluding senior loans (market value |
|
|
|
| $ | 698,299 |
|
| ||||
17
ING Senior Income Fund
NOTES TO FINANCIAL STATEMENTS as of August 31, 2005 (Unaudited) (continued)
NOTE 4 — MANAGEMENT AND ADMINISTRATION AGREEMENTS
The Fund has entered into an Investment Management Agreement with the Investment Manager to provide advisory and management services. The Investment Management Agreement compensates the Investment Manager with a fee, computed daily and payable monthly, at an annual rate of 0.80% of the Fund’s average daily gross asset value, minus the sum of the Fund’s accrued liabilities (other than liabilities for the principal amount of any borrowings incurred, commercial paper or notes issued by the Fund) (“Managed Assets”). The Fund is sub-advised by ING Investment Management Co. (“ING IM”). Under the Sub-Advisory Agreement, ING IM is responsible for managing the assets of the Fund in accordance with its investment objective and policies, subject to oversight by the Investment Manager. Both ING IM and the Investment Manager are indirect, wholly-owned subsidiaries of ING Groep N.V. and affiliates of each other.
The Fund has also entered into an Administration Agreement with ING Funds Services, LLC (the “Administrator”), an indirect, wholly-owned subsidiary of ING Groep N.V., to provide administrative services. The Administrator is compensated with a fee, computed daily and payable monthly, at an annual rate of 0.10% of the Fund’s Managed Assets.
NOTE 5 — DISTRIBUTION AND SERVICE FEES
Each share class of the Fund has adopted a Plan pursuant to Rule 12b-1 under the 1940 Act (the “12b-1 Plans”), whereby ING Funds Distributor, LLC (the “Distributor”) is reimbursed or compensated (depending on the class of shares) by the Fund for expenses incurred in the distribution of the Fund’s shares (“Distribution Fees”). Pursuant to the 12b-1 Plans, the Distributor is entitled to a payment each month for actual expenses incurred in the distribution and promotion of the Fund’s shares, including expenses incurred in printing prospectuses and reports used for sales purposes, expenses incurred in preparing and printing sales literature and other such distribution related expenses, including any distribution or Shareholder Servicing Fees (“Service Fees”) paid to securities dealers who executed a distribution agreement with the Distributor. Under the 12b-1 plans, each class of shares of the Fund pays the Distributor a combined Distribution and Service Fee based on average daily net assets at the following annual rates:
Class A |
| Class B |
| Class C |
| Class Q |
|
0.25% |
| 1.00% |
| 0.75% |
| 0.25% |
|
During the six months ended August 31, 2005, the Distributor waived 0.25% of the Service Fee on Class B shares only.
NOTE 6 — EXPENSE LIMITATIONS
The Investment Manager has voluntarily agreed to limit expenses, excluding interest, taxes, brokerage commissions, leverage expenses, other investment-related costs and extraordinary expenses, to the following:
Class A | — | 0.90% of Managed Assets plus 0.45% of average daily net assets |
Class B | — | 0.90% of Managed Assets plus 1.20% of average daily net assets |
Class C | — | 0.90% of Managed Assets plus 0.95% of average daily net assets |
Class Q | — | 0.90% of Managed Assets plus 0.45% of average daily net assets |
As of August 31, 2005, the amounts of waived and reimbursed fees that are subject to possible recoupment by the Investment Manager, and the related expiration dates are as follows:
August 31, |
|
|
| ||||
2006 |
| 2007 |
| 2008 |
| Total |
|
$197,132 |
| $433,947 |
| $ — |
| $631,079 |
|
18
ING Senior Income Fund
NOTES TO FINANCIAL STATEMENTS as of August 31, 2005 (Unaudited) (continued)
NOTE 7 — COMMITMENTS
The Fund has entered into a one-year revolving credit agreement, collateralized by assets of the Fund, to borrow up to $750 million maturing April 30, 2006. Borrowing rates under this agreement are based on a commercial paper pass through rate plus 0.25% on the funded portion. A facility fee of 0.15% is charged on the entire facility. There was $252 million of borrowings outstanding at August 31, 2005 at a rate of 3.54%, excluding other fees related to the entire facility. Average borrowings for the six months ended August 31, 2005 was $287,983,696 and the average annualized interest rate was 3.38%, excluding other fees related to the entire facility.
NOTE 8 — SENIOR LOAN COMMITMENTS
At August 31, 2005, the Fund had unfunded loan commitments pursuant to the terms of the following loan agreements:
Aftermarket Technology Corporation |
| $ | 1,750,000 |
|
Baker & Taylor, Inc. |
| 1,200,000 |
| |
Builders Firstsource, Inc. |
| 1,500,000 |
| |
CCM Merger, Inc. |
| 1,000,000 |
| |
Concentra Operating Corporation |
| 4,000,000 |
| |
Federal-Mogul Corporation |
| 1,810,000 |
| |
Hanley-Wood, LLC |
| 300,220 |
| |
Interstate Bakeries Corporation |
| 2,500,000 |
| |
Kerasotes Theatres, Inc. |
| 1,500,000 |
| |
Key Energy Services, Inc. |
| 4,500,000 |
| |
La Paloma Generating Company |
| 120,492 |
| |
Motorsport Aftermarket Group, Inc. |
| 288,676 |
| |
NCI Building Systems, Inc. |
| $ | 133,000 |
|
Pinnacle Entertainment, Inc. |
| 294,323 |
| |
Primedia, Inc. |
| 2,996,240 |
| |
Rural Cellular Corporation |
| 2,000,000 |
| |
Syniverse Holding, LLC |
| 1,500,000 |
| |
Trump Entertainment Resorts |
| 1,750,000 |
| |
United States Shipping, LLC |
| 576,922 |
| |
Vanguard Health Systems, Inc. |
| 3,500,000 |
| |
Warner Chilcott Corporation |
| 1,722,396 |
| |
Western Refining Company, L.P. |
| 1,250,000 |
| |
|
| $ | 36,192,269 |
|
NOTE 9 — TRANSACTIONS WITH AFFILIATES AND RELATED PARTIES
At August 31, 2005, the Fund had the following amounts recorded in payable to affiliates on the accompanying Statement of Assets and Liabilities (see Notes 4 and 5):
Accrued Investment |
| Accrued |
| Accrued Distribution |
| Total |
|
$1,768,227 |
| $190,461 |
| $862,102 |
| $2,820,790 |
|
The Fund has adopted a Retirement Policy covering all independent trustees of the Fund who will have served as an independent trustee for at least five years at the time of retirement. Benefits under this plan are based on an annual rate as defined in the plan agreement, as amended.
NOTE 10 — CUSTODIAL AGREEMENT
State Street Bank and Trust Company (“SSB”) serves as the Fund’s custodian and recordkeeper. Custody fees paid to SSB may be reduced by earnings credits based on the cash balances held by SSB for the Fund. There were no earning credits for the six months ended August 31, 2005.
NOTE 11 — SUBORDINATED LOANS AND UNSECURED LOANS
The primary risk arising from investing in subordinated loans or in unsecured loans is the potential loss in the event of default by the issuer of the loans. The Fund may invest up to 10% of its total assets, measured at the time of investment, in subordinated loans and up to 10% of its total assets, measured at the time of investment, in unsecured loans. As of August 31, 2005, the Fund held 0.00% of its total assets in subordinated loans and unsecured loans.
19
ING Senior Income Fund
NOTES TO FINANCIAL STATEMENTS as of August 31, 2005 (Unaudited) (continued)
NOTE 12 — CAPITAL SHARES
Transactions in capital shares and dollars were as follows:
|
| Class A Shares |
| Class B |
| |||||||||
|
| Six Months |
| Year |
| Six Months |
| Year |
| |||||
Number of Shares |
|
|
|
|
|
|
|
|
| |||||
Shares sold |
| 15,751,096 |
| 45,019,222 |
| 624,716 |
| 4,821,925 |
|
| ||||
Dividends reinvested |
| 840,865 |
| 788,747 |
| 110,398 |
| 156,144 |
|
| ||||
Shares redeemed |
| (10,695,723 | ) | (9,735,823 | ) | (988,848 | ) | (1,002,526 | ) |
| ||||
Net increase (decrease) in shares outstanding |
| 5,896,238 |
| 36,072,146 |
| (253,734 | ) | 3,975,543 |
|
| ||||
Dollar Amount ($) |
|
|
|
|
|
|
|
|
|
| ||||
Shares sold |
| $ | 244,957,116 |
| $ | 698,962,403 |
| $ | 9,699,061 |
| $ | 74,699,998 |
|
|
Dividends reinvested |
| 12,814,765 |
| 12,229,952 |
| 1,689,106 |
| 2,420,379 |
|
| ||||
Shares redeemed |
| (166,335,619 | ) | (151,275,068 | ) | (15,361,741 | ) | (15,545,425 | ) |
| ||||
Net increase (decrease) |
| $ | 91,436,262 |
| $ | 559,917,287 |
| $ | (3,973,574 | ) | $ | 61,574,952 |
|
|
|
| Class C |
| Class Q |
| |||||||||
|
| Six Months |
| Year |
| Six Months |
| Year |
| |||||
Number of Shares |
|
|
|
|
|
|
|
|
| |||||
Shares sold |
| 12,721,151 |
| 40,188,013 |
| 3,480,470 |
| 15,769,611 |
|
| ||||
Dividends reinvested |
| 849,964 |
| 960,495 |
| 72,267 |
| 202,240 |
|
| ||||
Shares redeemed |
| (8,060,961 | ) | (5,673,352 | ) | (3,504,227 | ) | (14,371,320 | ) |
| ||||
Net increase in shares outstanding |
| 5,510,154 |
| 35,475,156 |
| 48,510 |
| 1,600,531 |
|
| ||||
Dollar Amount ($) |
|
|
|
|
|
|
|
|
|
| ||||
Shares sold |
| $ | 197,669,443 |
| $ | 623,309,712 |
| $ | 53,893,023 |
| $ | 243,721,354 |
|
|
Dividends reinvested |
| 13,018,866 |
| 14,895,319 |
| 1,070,126 |
| 3,124,368 |
|
| ||||
Shares redeemed |
| (125,201,038 | ) | (88,054,810 | ) | (54,316,245 | ) | (222,232,384 | ) |
| ||||
Net increase |
| $ | 85,487,271 |
| $ | 550,150,221 |
| $ | 646,904 |
| $ | 24,613,338 |
|
|
NOTE 13 — FEDERAL INCOME TAXES
The amount of distributions from net investment income and net realized capital gains are determined in accordance with federal income tax regulations, which may differ from accounting principles generally accepted in the United States of America for investment companies. These book/tax differences may be either temporary or permanent. Permanent differences are reclassified within the capital accounts based on their federal tax-basis treatment; temporary differences are not reclassified. Key differences include the treatment of short-term capital gains, organizational and offering expenses, and wash sale deferrals. Distributions in excess of net investment income and/or net realized capital gains for tax purposes are reported as distributions of paid-in capital.
Dividends paid by the Fund from net investment income and distributions of net realized short-term capital gains are, for federal income tax purposes, taxable as ordinary income to shareholders.
The tax composition of dividends and distributions to shareholders was as follows:
Six months ended August 31, 2005 |
| Year ended February 28, 2005 |
| ||
Ordinary Income |
| Ordinary Income |
| Long-Term |
|
$42,990,823 |
| $47,736,711 |
| $736,153 |
|
20
ING Senior Income Fund
NOTES TO FINANCIAL STATEMENTS as of August 31, 2005 (Unaudited) (continued)
NOTE 13 — FEDERAL INCOME TAXES (continued)
The tax-basis components of distributable earnings and the expiration dates of the capital loss carryforwards which may be used to offset future realized capital gains for federal income tax purposes as of February 28, 2005 were:
Undistributed |
| Undistributed |
| Unrealized |
| Post-October |
| Capital |
| Expiration |
|
$737,583 |
| $117,123 |
| $24,117,769 |
| $0 |
| $0 |
| — |
|
NOTE 14 — INFORMATION REGARDING TRADING OF ING’S U.S. MUTUAL FUNDS
ING Investments has reported to the Boards of Directors/Trustees (the “Boards”) of the ING Funds that, like many U.S. financial services companies, ING Investments and certain of its U.S. affiliates have received informal and formal requests for information since September 2003 from various governmental and self-regulatory agencies in connection with investigations related to mutual funds and variable insurance products. ING Investments has advised the Boards that it and its affiliates have cooperated fully with each request.
In addition to responding to regulatory and governmental requests, ING Investments reported that management of U.S. affiliates of ING Groep N.V., including ING Investments (collectively, “ING”), on their own initiative, have conducted, through independent special counsel and a national accounting firm, an extensive internal review of trading in ING insurance, retirement, and mutual fund products. The goal of this review was to identify any instances of inappropriate trading in those products by third parties or by ING investment professionals and other ING personnel. ING’s internal review related to mutual fund trading is now substantially completed. ING has reported that, of the millions of customer relationships that ING maintains, the internal review identified several isolated arrangements allowing third parties to engage in frequent trading of mutual funds within ING’s variable insurance and mutual fund products, and identified other circumstances where frequent trading occurred, despite measures taken by ING intended to combat market timing. ING further reported that each of these arrangements has been terminated and fully disclosed to regulators. The results of the internal review were also reported to the independent members of the Board.
ING Investments has advised the Board that most of the identified arrangements were initiated prior to ING’s acquisition of the businesses in question in the U.S. ING Investments further reported that the companies in question did not receive special benefits in return for any of these arrangements, which have all been terminated.
Based on the internal review, ING investments has advised the Board that the identified arrangements do not represent a systemic problem in any of the companies that were involved.
In September 2005, ING Fund Distributor, LLC (“IFD”), the distributor of certain ING Funds, settled an administrative proceeding with the NASD regarding three arrangements, dating from 1995, 1996 and 1998, under which the administrator to the then-Pilgrim Funds, which subsequently became part of the ING Funds, entered into formal and informal arrangements that permitted frequent trading. Under the terms of the Letter Of Acceptance, Waiver and Consent (“AWC”) with the NASD, under which IFD neither admitted nor denied the allegations or findings, IFD consented to the following sanctions: (i) a censure; (ii) a fine of $1.5 million; (iii) restitution of approximately $1.44 million to certain ING Funds for losses attributable to excessive trading described in the AWC; and (iv) agreement to make certification to NASD regarding the review and establishment of certain procedures.
21
ING Senior Income Fund
NOTES TO FINANCIAL STATEMENTS as of August 31, 2005 (Unaudited) (continued)
NOTE 14 — INFORMATION REGARDING TRADING OF ING’S U.S. MUTUAL FUNDS (continued)
In addition to the arrangements discussed above, ING Investments reported to the Board that, at this time, these instances include the following, in addition to the arrangements subject to the AWC discussed above:
• Aeltus Investment Management, Inc. (a predecessor entity to ING Investment Management Co.) has identified two investment professionals who engaged in extensive frequent trading in certain ING Funds. One was subsequently terminated for cause and incurred substantial financial penalties in connection with this conduct and the second has been disciplined.
• ReliaStar Life Insurance Company (“ReliaStar”) entered into agreements seven years ago permitting the owner of policies issued by the insurer to engage in frequent trading and to submit orders until 4pm Central Time. In 2001 ReliaStar also entered into a selling agreement with a broker-dealer that engaged in frequent trading. Employees of ING affiliates were terminated and/or disciplined in connection with these matters.
• In 1998, Golden American Life Insurance Company entered into arrangements permitting a broker-dealer to frequently trade up to certain specific limits in a fund available in an ING variable annuity product. No employee responsible for this arrangement remains at the company.
For additional information regarding these matters, you may consult the Form 8-K and Form 8-K/A for each of four life insurance companies, ING USA Annuity and Life Insurance Company, ING Life Insurance and Annuity Company, ING Insurance Company of America, and ReliaStar Life Insurance Company of New York, each filed with the Securities and Exchange Commission (the “SEC”) on October 29, 2004 and September 8, 2004. These Forms 8-K and Forms 8-K/A can be accessed through the SEC’s Web site at http://www.sec.gov. Despite the extensive internal review conducted through independent special counsel and a national accounting firm, there can be no assurance that the instances of inappropriate trading reported to the Board are the only instances of such trading respecting the ING Funds.
ING Investments reported to the Board that ING is committed to conducting its business with the highest standards of ethical conduct with zero tolerance for noncompliance. Accordingly, ING Investments advised the Board that ING management was disappointed that its voluntary internal review identified these situations. Viewed in the context of the breadth and magnitude of its U.S. business as a whole, ING management does not believe that ING’s acquired companies had systemic ethical or compliance issues in these areas. Nonetheless, Investments reported that given ING’s refusal to tolerate any lapses, it has taken the steps noted below, and will continue to seek opportunities to further strengthen the internal controls of its affiliates.
• ING has agreed with the ING Funds to indemnify and hold harmless the ING Funds from all damages resulting from wrongful conduct by ING or its employees or from ING’s internal investigation, any investigations conducted by any governmental or self-regulatory agencies, litigation or other formal proceedings, including any proceedings by the Securities and Exchange Commission. ING Investments reported to the Board that ING management believes that the total amount of any indemnification obligations will not be material to ING or its U.S. business.
• ING updated its Code of Conduct for employees reinforcing its employees’ obligation to conduct personal trading activity consistent with the law, disclosed limits, and other requirements.
22
ING Senior Income Fund
NOTES TO FINANCIAL STATEMENTS as of August 31, 2005 (Unaudited) (continued)
NOTE 14 — INFORMATION REGARDING TRADING OF ING’S U.S. MUTUAL FUNDS (continued)
• The ING Funds, upon a recommendation from ING, updated their respective Codes of Ethics applicable to investment professionals with ING entities and certain other fund personnel, requiring such personnel to pre-clear any purchases or sales of ING Funds that are not systematic in nature (i.e., dividend reinvestment), and imposing minimum holding periods for shares of ING Funds.
• ING instituted excessive trading policies for all customers in its variable insurance and retirement products and for shareholders of the ING Funds sold to the public through financial intermediaries. ING does not make exceptions to these policies.
• �� ING reorganized and expanded its U.S. Compliance Department, and created an Enterprise Compliance team to enhance controls and consistency in regulatory compliance.
As has been widely reported in the media, the New York Attorney General’s office (“NYAG”) is conducting broad investigations regarding insurance quoting and brokerage practices. ING U.S. has been subpoenaed in this regard, and is cooperating fully with these NYAG requests for information.
ING U.S. believes that its practices are consistent with our business principles and our commitment to our customers.
At this time, in light of the current regulatory factors, ING U.S. is actively engaged in reviewing whether any modifications in our practices are appropriate for the future.
There can be no assurance that these matters, or the adverse publicity associated with them, will not result in increased fund redemptions, reduced sale of fund shares, or other adverse consequences to ING Funds.
NOTE 15 — SUBSEQUENT EVENTS
DIVIDENDS DECLARED
Subsequent to August 31, 2005, the Fund declared the following dividends:
Per Share Amount |
| Type |
| Declaration Date |
| Record Date |
| Payable Date |
|
$0.06639(A) |
| NII |
| Daily |
| Daily |
| October 1, 2005 |
|
$0.05979(B) |
| NII |
| Daily |
| Daily |
| October 1, 2005 |
|
NII — Net Investment Income
(A) For Class A and Q shares.
(B) For Class B and C shares.
23
ING Senior Income Fund
PROXY VOTING INFORMATION
A description of the policies and procedures that the Registrant uses to determine how to vote proxies related to portfolio securities is available (1) without charge, upon request, by calling Shareholder Services toll-free at 800-992-0180; (2) on the Registrant’s website at www.ingfunds.com and (3) on the SEC’s website at www.sec.gov. Information regarding how the Registrant voted proxies related to portfolio securities during the most recent 12-month period ended June 30 is available without charge on the Registrant’s website at www.ingfunds.com and on the SEC’s website at www.sec.gov.
QUARTERLY PORTFOLIO HOLDINGS
The Registrant files its complete schedule of portfolio holdings with the Commission for the first and third quarters of each fiscal year on Form N-Q. The Registrant’s Forms N-Q are available on the SEC’s website at www.sec.gov. The Registrant’s Forms N-Q may be reviewed and copied at the Commissions Public Reference Room in Washington, DC, and information on the operation of the Public Reference Room may be obtained by calling 1-800-SEC-0330; and is available upon request from the Registrant by calling Shareholder Services toll-free at 800-992-0180.
24
ING Senior Income Fund
Senior Loans*: 114.5% |
| Bank Loan |
|
|
| |||||
Principal Amount |
| Borrower/Tranche Description |
| Moody’s |
| S&P |
| Value |
| |
Aerospace & Defense: 1.4% |
|
|
|
|
|
|
| |||
|
| American Airlines, Inc. |
| B2 |
| B+ |
|
|
| |
$ 2,375,000 |
| Revolver, 8.250%-8.560%, maturing |
|
|
|
|
|
|
| |
|
| June 30, 2009 |
|
|
|
|
| $ | 2,375,000 |
|
|
| Arinc, Inc. |
| Ba3 |
| BB |
|
|
| |
987,500 |
| Term Loan, 5.230%, maturing |
|
|
|
|
|
|
| |
|
| March 10, 2011 |
|
|
|
|
| 1,002,930 |
| |
|
| Ceradyne, Inc. |
| Ba3 |
| BB- |
|
|
| |
2,481,250 |
| Term Loan, 5.625%, maturing |
|
|
|
|
|
|
| |
|
| August 18, 2011 |
|
|
|
|
| 2,518,469 |
| |
|
| Dyncorp, Inc. |
| B2 |
| B+ |
|
|
| |
3,991,667 |
| Term Loan, 6.063%, maturing |
|
|
|
|
|
|
| |
|
| February 11, 2011 |
|
|
|
|
| 4,047,382 |
| |
|
| Hexcel Corporation |
| B2 |
| B+ |
|
|
| |
1,233,333 |
| Term Loan, 5.250%-5.563%, maturing |
|
|
|
|
|
|
| |
|
| March 01, 2012 |
|
|
|
|
| 1,249,006 |
| |
|
| K&F Industries, Inc. |
| B2 |
| B+ |
|
|
| |
4,750,000 |
| Term Loan, 6.150%-6.170%, maturing |
|
|
|
|
|
|
| |
|
| November 16, 2012 |
|
|
|
|
| 4,834,312 |
| |
|
| Spirit AeroSystems, Inc. |
| B1 |
| BB- |
|
|
| |
1,666,667 |
| Term Loan, 5.961%, maturing |
|
|
|
|
|
|
| |
|
| December 31, 2011 |
|
|
|
|
| 1,695,000 |
| |
|
| Standard Aero Holdings, Inc. |
| B2 |
| B+ |
|
|
| |
4,361,538 |
| Term Loan, 5.720%-5.919%, maturing |
|
|
|
|
|
|
| |
|
| August 20, 2012 |
|
|
|
|
| 4,424,236 |
| |
|
| Transdigm, Inc. |
| B1 |
| B+ |
|
|
| |
3,452,547 |
| Term Loan, 5.800%, maturing |
|
|
|
|
|
|
| |
|
| July 22, 2010 |
|
|
|
|
| 3,508,651 |
| |
| (2) | United Air Lines, Inc. |
| Ba2 |
| BB |
|
|
| |
1,980,875 |
| Debtor in Possession Term Loan, 10.000%, |
|
|
|
|
|
|
| |
|
| maturing December 30, 2005 |
|
|
|
|
| 2,003,160 |
| |
|
| Wyle Holdings, Inc. |
| NR |
| B+ |
|
|
| |
1,995,000 |
| Term Loan, 6.290%-6.460%, maturing |
|
|
|
|
|
|
| |
|
| January 28, 2011 |
|
|
|
|
| 2,028,043 |
| |
|
|
|
|
|
|
|
| 29,686,189 |
| |
Automobile: 4.2% |
|
|
|
|
|
|
| |||
|
| Accuride Corporation |
| B1 |
| BB+ |
|
|
| |
6,467,273 |
| Term Loan, 5.500%-5.688%, maturing |
|
|
|
|
|
|
| |
|
| January 31, 2012 |
|
|
|
|
| 6,531,945 |
| |
|
| Affinia Group, Inc. |
| B2 |
| BB- |
|
|
| |
2,982,506 |
| Term Loan, 6.400%, maturing |
|
|
|
|
|
|
| |
|
| November 30, 2011 |
|
|
|
|
| 2,998,352 |
| |
|
| Aftermarket Technology Corporation |
| Ba3 |
| BB- |
|
|
| |
558,035 |
| Term Loan, 5.430%, maturing |
|
|
|
|
|
|
| |
|
| January 08, 2007 |
|
|
|
|
| 560,127 |
| |
805,057 |
| Term Loan, 6.390%-6.480%, maturing |
|
|
|
|
|
|
| |
|
| February 08, 2008 |
|
|
|
|
| 812,354 |
| |
1,199,870 |
| Term Loan, 6.390%-6.450%, maturing |
|
|
|
|
|
|
| |
|
| February 08, 2008 |
|
|
|
|
| 1,210,744 |
| |
See Accompanying Notes to Financial Statements
25
ING Senior Income Fund
PORTFOLIO OF INVESTMENTS as of August 31, 2005 (Unaudited) (continued)
|
| Bank Loan |
|
|
| |||||
Principal Amount |
| Borrower/Tranche Description |
| Moody’s |
| S&P |
| Value |
| |
Automobile: (continued) |
|
|
|
|
|
|
| |||
|
| Carey International, Inc. |
| NR |
| B- |
|
|
| |
$ 2,493,750 |
| Term Loan, 7.690%, maturing |
|
|
|
|
|
|
| |
|
| May 11, 2012 |
|
|
|
|
| $ | 2,369,063 |
|
| (2) | Collins & Aikman Products Company |
| NR |
| NR |
|
|
| |
1,000,000 |
| Debtor in Possession Term Loan, maturing |
|
|
|
|
|
|
| |
|
| May 17, 2007 |
|
|
|
|
| 1,007,083 |
| |
|
| Dayco Products, LLC |
| B1 |
| B+ |
|
|
| |
466,746 |
| Term Loan, 6.370%-6.66%, maturing |
|
|
|
|
|
|
| |
|
| June 23, 2011 |
|
|
|
|
| 472,143 |
| |
|
| Dura Operating Corporation |
| B2 |
| B+ |
|
|
| |
4,000,000 |
| Term Loan, 7.070%, maturing May 03, 2011 |
|
|
|
|
| 4,050,000 |
| |
|
| Federal-Mogul Corporation |
| NR |
| NR |
|
|
| |
3,190,000 |
| Revolver, 5.625%-6.000%, maturing |
|
|
|
|
|
|
| |
|
| November 01, 2009 |
|
|
|
|
| 3,201,963 |
| |
|
| Goodyear Tire & Rubber Company |
| Ba3 |
| BB |
|
|
| |
5,500,000 |
| Term Loan, 5.000%, maturing April 30, 2010 |
|
|
|
|
| 5,575,625 |
| |
|
| Goodyear Tire & Rubber Company |
| B2 |
| B+ |
|
|
| |
10,500,000 |
| Term Loan, 6.320%, maturing April 30, 2010 |
|
|
|
|
| 10,642,496 |
| |
|
| HLI Operating Company, Inc. |
| B1 |
| BB- |
|
|
| |
906,424 |
| Term Loan, 6.620%-7.310%, maturing |
|
|
|
|
|
|
| |
|
| June 03, 2009 |
|
|
|
|
| 918,699 |
| |
|
| Key Plastics, LLC |
| B1 |
| BB- |
|
|
| |
2,180,191 |
| Term Loan, 6.540-8.250%, maturing |
|
|
|
|
|
|
| |
|
| June 29, 2010 |
|
|
|
|
| 2,196,542 |
| |
|
| Keystone Automotive Industries, Inc. |
| B1 |
| B+ |
|
|
| |
830,435 |
| Term Loan, 5.628-6.026%, maturing |
|
|
|
|
|
|
| |
|
| October 30, 2009 |
|
|
|
|
| 837,701 |
| |
|
| Motorsport Aftermarket Group, Inc. |
| B2 |
| B |
|
|
| |
433,013 |
| Term Loan, 6.740%, maturing |
|
|
|
|
|
|
| |
|
| December 15, 2011 |
|
|
|
|
| 435,719 |
| |
1,267,162 |
| Term Loan, 6.740%, maturing |
|
|
|
|
|
|
| |
|
| December 15, 2011 |
|
|
|
|
| 1,275,082 |
| |
| (2) | RJ Tower Corporation |
| Ba3 |
| BBB |
|
|
| |
9,000,000 |
| Debtor in Possession Term Loan, 6.625%, |
|
|
|
|
|
|
| |
|
| maturing February 02, 2007 |
|
|
|
|
| 9,132,192 |
| |
|
| Safelite Glass Corporation |
| B3 |
| B+ |
|
|
| |
5,666,570 |
| Term Loan, 8.500%, maturing |
|
|
|
|
|
|
| |
|
| September 30, 2007 |
|
|
|
|
| 5,524,906 |
| |
12,505,418 |
| Term Loan, 9.000%, maturing |
|
|
|
|
|
|
| |
|
| September 30, 2007 |
|
|
|
|
| 12,192,782 |
| |
|
| Tenneco Automotive, Inc. |
| B1 |
| B+ |
|
|
| |
535,967 |
| Term Loan, 5.760%, maturing |
|
|
|
|
|
|
| |
|
| December 12, 2010 |
|
|
|
|
| 545,347 |
| |
1,129,257 |
| Term Loan, 6.080%, maturing |
|
|
|
|
|
|
| |
|
| December 12, 2010 |
|
|
|
|
| 1,149,019 |
| |
|
| TRW Automotive Acquisitions Corporation |
| Ba2 |
| BB+ |
|
|
| |
7,462,500 |
| Term Loan, 4.938%, maturing |
|
|
|
|
|
|
| |
|
| October 29, 2010 |
|
|
|
|
| 7,537,125 |
| |
2,982,506 |
| Term Loan, 5.250%, maturing June 30, 2012 |
|
|
|
|
| 3,017,303 |
| |
See Accompanying Notes to Financial Statements
26
ING Senior Income Fund
PORTFOLIO OF INVESTMENTS as of August 31, 2005 (Unaudited) (continued)
|
| Bank Loan |
|
|
| |||||
Principal Amount |
| Borrower/Tranche Description |
| Moody’s |
| S&P |
| Value |
| |
Automobile: (continued) |
|
|
|
|
|
|
| |||
|
| United Components, Inc. |
| B1 |
| BB- |
|
|
| |
$ 1,808,333 |
| Term Loan, 6.260%, maturing June 30, 2010 |
|
|
|
|
| $ | 1,839,415 |
|
|
|
|
|
|
|
|
| 86,033,727 |
| |
Banking: 0.1% |
|
|
|
|
|
|
|
|
| |
|
| Outsourcing Solutions, Inc. |
| B2 |
| B- |
|
|
| |
2,500,000 |
| Term Loan, 7.921%, maturing |
|
|
|
|
|
|
| |
|
| September 30, 2010 |
|
|
|
|
| 2,518,750 |
| |
|
|
|
|
|
|
|
| 2,518,750 |
| |
Beverage, Food & Tobacco: 2.8% |
|
|
|
|
|
|
| |||
|
| Alliance One International, Inc. |
| B1 |
| BB- |
|
|
| |
3,990,000 |
| Term Loan, 6.730%, maturing May 13, 2010 |
|
|
|
|
| 4,049,850 |
| |
|
| Birds Eye Foods, Inc. |
| B1 |
| B+ |
|
|
| |
4,622,396 |
| Term Loan, 6.420%, maturing June 30, 2008 |
|
|
|
|
| 4,684,992 |
| |
|
| Commonwealth Brands, Inc. |
| B1 |
| B+ |
|
|
| |
2,269,090 |
| Term Loan, 7.000%, maturing |
|
|
|
|
|
|
| |
|
| August 28, 2007 |
|
|
|
|
| 2,311,636 |
| |
|
| Constellation Brands, Inc. |
| Ba2 |
| BB |
|
|
| |
13,597,639 |
| Term Loan, 4.750%-5.688%, maturing |
|
|
|
|
|
|
| |
|
| November 30, 2011 |
|
|
|
|
| 13,827,099 |
| |
|
| Dr. Pepper Bottling Company of Texas, Inc. |
| B1 |
| BB- |
|
|
| |
4,373,312 |
| Term Loan, 5.339%-5.609%, maturing |
|
|
|
|
|
|
| |
|
| December 19, 2010 |
|
|
|
|
| 4,442,191 |
| |
|
| Golden State Foods Corporation |
| B1 |
| B+ |
|
|
| |
4,443,750 |
| Term Loan, 5.430%, maturing |
|
|
|
|
|
|
| |
|
| February 28, 2011 |
|
|
|
|
| 4,499,297 |
| |
|
| Keystone Foods Holdings, LLC |
| Ba3 |
| B+ |
|
|
| |
4,136,394 |
| Term Loan, 5.125-5.438%, maturing |
|
|
|
|
|
|
| |
|
| June 16, 2011 |
|
|
|
|
| 4,190,684 |
| |
|
| Michael Foods, Inc. |
| B1 |
| B+ |
|
|
| |
2,738,255 |
| Term Loan, 5.090%-5.859%, maturing |
|
|
|
|
|
|
| |
|
| November 21, 2010 |
|
|
|
|
| 2,786,174 |
| |
|
| Pierre Foods, Inc. |
| B1 |
| B+ |
|
|
| |
6,025,833 |
| Term Loan, 5.690%, maturing June 30, 2010 |
|
|
|
|
| 6,119,987 |
| |
|
| Southern Wine & Spirits of America, Inc. |
| Ba3 |
| BB+ |
|
|
| |
6,483,750 |
| Term Loan, 4.990%, maturing May 31, 2012 |
|
|
|
|
| 6,552,640 |
| |
|
| Sturm Foods, Inc. |
|
|
|
|
|
|
| |
1,500,000 |
| Term Loan, 6.250%, maturing May 26, 2011 |
| B2 |
| B+ |
| 1,511,250 |
| |
|
| Sturm Foods, Inc. |
|
|
|
|
|
|
| |
500,000 |
| Term Loan, 10.688%, maturing |
|
|
|
|
|
|
| |
|
| May 26, 2012 |
| B3 |
| B |
| 507,500 |
| |
|
| Vitaquest International, LLC |
| B2 |
| B |
|
|
| |
2,493,750 |
| Term Loan, 7.070%-8.500%, maturing |
|
|
|
|
|
|
| |
|
| March 17, 2011 |
|
|
|
|
| 2,495,309 |
| |
|
|
|
|
|
|
|
| 57,978,609 |
| |
Buildings & Real Estate: 7.2% |
|
|
|
|
|
|
| |||
|
| Associated Materials, Inc. |
| B2 |
| B |
|
|
| |
1,750,000 |
| Term Loan, 5.830%-5.900%, maturing |
|
|
|
|
|
|
| |
|
| August 29, 2010 |
|
|
|
|
| 1,765,312 |
| |
See Accompanying Notes to Financial Statements
27
ING Senior Income Fund
PORTFOLIO OF INVESTMENTS as of August 31, 2005 (Unaudited) (continued)
|
| Bank Loan |
|
|
| |||||
Principal Amount |
| Borrower/Tranche Description |
| Moody’s |
| S&P |
| Value |
| |
Buildings & Real Estate: (continued) |
|
|
|
|
|
|
| |||
|
| Atrium Companies, Inc. |
| B2 |
| CCC+ |
|
|
| |
$ 3,878,621 |
| Term Loan, 6.250%-6.360%, maturing |
|
|
|
|
|
|
| |
|
| December 28, 2011 |
|
|
|
|
| $ | 3,870,542 |
|
|
| Builders Firstsource, Inc. |
| B1 |
| BB- |
|
|
| |
1,555,556 |
| Term Loan, 5.823%-6.190%, maturing |
|
|
|
|
|
|
| |
|
| August 11, 2011 |
|
|
|
|
| 1,572,407 |
| |
|
| Building Materials Holding Corporation |
| B2 |
| BB |
|
|
| |
2,940,000 |
| Term Loan, 5.000%, maturing June 30, 2010 |
|
|
|
|
| 2,962,050 |
| |
|
| Contech Construction Products, Inc. |
| Ba3 |
| BB- |
|
|
| |
2,912,420 |
| Term Loan, 5.840%-6.080%, maturing |
|
|
|
|
|
|
| |
|
| December 07, 2010 |
|
|
|
|
| 2,961,567 |
| |
|
| Crescent Real Estate Equities, L.P. |
| B1 |
| BB- |
|
|
| |
3,995,697 |
| Term Loan, 5.760%, maturing |
|
|
|
|
|
|
| |
|
| January 12, 2006 |
|
|
|
|
| 4,034,407 |
| |
|
| Custom Building Products, Inc. |
| B1 |
| B+ |
|
|
| |
5,239,375 |
| Term Loan, 5.740%, maturing |
|
|
|
|
|
|
| |
|
| October 31, 2011 |
|
|
|
|
| 5,281,945 |
| |
|
| DMB Newco, LLC |
| NR |
| NR |
|
|
| |
1,424,283 |
| Term Loan, 6.050%-6.060%, maturing |
|
|
|
|
|
|
| |
|
| February 28, 2009 |
|
|
|
|
| 1,427,844 |
| |
|
| Euramax International, Inc. |
| B2 |
| B+ |
|
|
| |
1,333,333 |
| Term Loan, 6.125%, maturing June 29, 2012 |
|
|
|
|
| 1,343,610 |
| |
|
| General Growth Properties, Inc. |
| Ba2 |
| BB+ |
|
|
| |
31,307,628 |
| Term Loan, 5.760%, maturing |
|
|
|
|
|
|
| |
|
| November 12, 2007 |
|
|
|
|
| 31,560,688 |
| |
15,924,199 |
| Term Loan, 5.670%, maturing |
|
|
|
|
|
|
| |
|
| November 12, 2008 |
|
|
|
|
| 16,130,544 |
| |
|
| Headwaters, Inc. |
| B1 |
| B+ |
|
|
| |
5,983,003 |
| Term Loan, 5.870%-7.750% maturing |
|
|
|
|
|
|
| |
|
| April 30, 2011 |
|
|
|
|
| 6,067,764 |
| |
|
| Macerich Partnership, L.P. |
| NR |
| BB+ |
|
|
| |
3,500,000 |
| Term Loan, 5.240%, maturing April 25, 2006 |
|
|
|
|
| 3,504,375 |
| |
2,500,000 |
| Term Loan, 5.169%, maturing April 25, 2010 |
|
|
|
|
| 2,509,375 |
| |
|
| Maguire Properties, Inc. |
| Ba2 |
| BB |
|
|
| |
3,688,889 |
| Term Loan, 5.300%, maturing |
|
|
|
|
|
|
| |
|
| March 15, 2010 |
|
|
|
|
| 3,737,306 |
| |
|
| Masonite International Corporation |
| B2 |
| BB- |
|
|
| |
7,474,883 |
| Term Loan, 5.490%-5.660%, maturing |
|
|
|
|
|
|
| |
|
| April 16, 2013 |
|
|
|
|
| 7,502,914 |
| |
7,487,617 |
| Term Loan, 5.490%-5.660%, maturing |
|
|
|
|
|
|
| |
|
| April 16, 2013 |
|
|
|
|
| 7,515,696 |
| |
|
| NCI Building Systems, Inc. |
| Ba2 |
| BB |
|
|
| |
3,667,000 |
| Term Loan, 5.420%-5.670%, maturing |
|
|
|
|
|
|
| |
|
| September 15, 2008 |
|
|
|
|
| 3,710,546 |
| |
|
| Newkirk Master, L.P. |
| Ba2 |
| BB+ |
|
|
| |
1,911,038 |
| Term Loan, 5.571%, maturing |
|
|
|
|
|
|
| |
|
| August 11, 2008 |
|
|
|
|
| 1,943,287 |
| |
See Accompanying Notes to Financial Statements
28
ING Senior Income Fund
PORTFOLIO OF INVESTMENTS as of August 31, 2005 (Unaudited) (continued)
|
| Bank Loan |
|
|
| |||||
Principal Amount |
| Borrower/Tranche Description |
| Moody’s |
| S&P |
| Value |
| |
Buildings & Real Estate: (continued) |
|
|
|
|
|
|
| |||
$ 1,088,962 |
| Term Loan, 5.571%, maturing |
|
|
|
|
|
|
| |
|
| August 11, 2008 |
|
|
|
|
| $ | 1,107,338 |
|
|
| Nortek, Inc. |
| B2 |
| B |
|
|
| |
10,891,365 |
| Term Loan, 5.910%-7.750%, maturing |
|
|
|
|
|
|
| |
|
| August 27, 2011 |
|
|
|
|
| 11,036,579 |
| |
|
| PGT Industries, Inc. |
| B1 |
| B |
|
|
| |
2,272,046 |
| Term Loan, 6.580%-6.760%, maturing |
|
|
|
|
|
|
| |
|
| January 29, 2010 |
|
|
|
|
| 2,311,807 |
| |
|
| Pivotal Promontory, LLC |
| B1 |
| B+ |
|
|
| |
2,250,000 | (4) | Term Loan, maturing |
|
|
|
|
|
|
| |
|
| August 18, 2010 |
|
|
|
|
| 2,272,500 |
| |
|
| Ply Gem Industries, Inc. |
| B1 |
| B+ |
|
|
| |
677,535 |
| Term Loan, 5.990%-6.160%, maturing |
|
|
|
|
|
|
| |
|
| March 15, 2010 |
|
|
|
|
| 682,616 |
| |
1,498,134 |
| Term Loan, 5.600%, maturing |
|
|
|
|
|
|
| |
|
| February 12, 2011 |
|
|
|
|
| 1,509,370 |
| |
4,610,819 |
| Term Loan, 5.990%-6.160%, maturing |
|
|
|
|
|
|
| |
|
| October 01, 2011 |
|
|
|
|
| 4,645,400 |
| |
|
| Spanish Peaks, LLC |
| B1 |
| B+ |
|
|
| |
900,000 | (4) | Term Loan, maturing August 9, 2011 |
|
|
|
|
| 911,250 |
| |
1,400,000 | (4) | Term Loan, maturing August 9, 2011 |
|
|
|
|
| 1,417,500 |
| |
|
| St. Marys Cement, Inc. |
| B1 |
| BB- |
|
|
| |
5,424,925 |
| Term Loan, 5.490%, maturing |
|
|
|
|
|
|
| |
|
| December 04, 2009 |
|
|
|
|
| 5,496,127 |
| |
|
| Trustreet Properties, Inc. |
| Ba3 |
| BB |
|
|
| |
5,000,000 |
| Term Loan, 5.510%, maturing |
|
|
|
|
|
|
| |
|
| March 31, 2010 |
|
|
|
|
| 5,046,875 |
| |
|
| Werner Holdings Company, Inc. |
| B3 |
| B- |
|
|
| |
500,000 |
| Term Loan, 7.480%-7.570%, maturing |
|
|
|
|
|
|
| |
|
| June 11, 2009 |
|
|
|
|
| 498,333 |
| |
|
|
|
|
|
|
|
| 146,337,874 |
| |
Cargo Transport: 1.1% |
|
|
|
|
|
|
| |||
|
| Atlantic Express Transportation Corporation |
| Caa2 |
| CCC+ |
|
|
| |
2,000,000 |
| Floating Rate Note, 12.610%, maturing |
|
|
|
|
|
|
| |
|
| April 15, 2008 |
|
|
|
|
| 1,920,000 |
| |
|
| Baker Tanks, Inc. |
| B2 |
| B |
|
|
| |
5,315,008 |
| Term Loan, 5.960%-6.430%, maturing |
|
|
|
|
|
|
| |
|
| January 30, 2011 |
|
|
|
|
| 5,381,446 |
| |
|
| Helm Holding Corporation |
| B2 |
| B+ |
|
|
| |
1,000,000 |
| Term Loan, 6.160%-6.247%, maturing |
|
|
|
|
|
|
| |
|
| July 08, 2011 |
|
|
|
|
| 1,018,333 |
| |
|
| Horizon Lines, LLC |
| B2 |
| B |
|
|
| |
2,475,000 |
| Term Loan, 5.990%, maturing July 07, 2011 |
|
|
|
|
| 2,513,157 |
| |
|
| Kansas City Southern Railway Company |
| B1 |
| BB+ |
|
|
| |
1,502,450 |
| Term Loan, 5.080%-5.240%, maturing |
|
|
|
|
|
|
| |
|
| March 30, 2008 |
|
|
|
|
| 1,525,769 |
| |
See Accompanying Notes to Financial Statements
29
ING Senior Income Fund
PORTFOLIO OF INVESTMENTS as of August 31, 2005 (Unaudited) (continued)
|
| Bank Loan |
|
|
| |||||
Principal Amount |
| Borrower/Tranche Description |
| Moody’s |
| S&P |
| Value |
| |
Cargo Transport: (continued) |
|
|
|
|
|
|
| |||
|
| Neoplan USA Corporation |
| NR |
| NR |
|
|
| |
$ 500,290 |
| Term Loan, 8.838%, maturing June 30, 2006 |
|
|
|
|
| $ | 500,290 |
|
|
| Pacer International, Inc. |
| B1 |
| BB |
|
|
| |
1,633,334 |
| Term Loan, 5.375%-7.500%, maturing |
|
|
|
|
|
|
| |
|
| June 10, 2010 |
|
|
|
|
| 1,655,792 |
| |
|
| Railamerica, Inc. |
| Ba3 |
| BB |
|
|
| |
392,418 |
| Term Loan, 5.875%, maturing |
|
|
|
|
|
|
| |
|
| September 29, 2011 |
|
|
|
|
| 399,612 |
| |
3,319,642 |
| Term Loan, 5.875%, maturing |
|
|
|
|
|
|
| |
|
| September 29, 2011 |
|
|
|
|
| 3,380,501 |
| |
|
| Sirva Worldwide, Inc. |
| B2 |
| B+ |
|
|
| |
702,353 |
| Term Loan, 6.020%-6.560%, maturing |
|
|
|
|
|
|
| |
|
| December 01, 2010 |
|
|
|
|
| 675,430 |
| |
|
| Transport Industries, L.P. |
| B2 |
| B+ |
|
|
| |
2,479,234 |
| Term Loan, 7.500%, maturing June 13, 2010 |
|
|
|
|
| 2,488,531 |
| |
|
| United States Shipping, LLC |
| Ba3 |
| BB- |
|
|
| |
1,901,442 |
| Term Loan, 5.490%, maturing April 30, 2010 |
|
|
|
|
| 1,921,052 |
| |
|
|
|
|
|
|
|
| 23,379,913 |
| |
Cellular: 2.9% |
|
|
|
|
|
|
|
|
| |
|
| Cellular South, Inc. |
| Ba3 |
| B+ |
|
|
| |
4,096,125 |
| Term Loan, 5.241%-7.000%, maturing |
|
|
|
|
|
|
| |
|
| May 04, 2011 |
|
|
|
|
| 4,134,526 |
| |
|
| Centennial Cellular Operating Company |
| B1 |
| B- |
|
|
| |
16,742,519 |
| Term Loan, 5.630%-6.110%, maturing |
|
|
|
|
|
|
| |
|
| February 09, 2011 |
|
|
|
|
| 17,029,536 |
| |
|
| Cricket Communications, Inc. |
| B1 |
| B- |
|
|
| |
11,442,500 |
| Term Loan, 5.990%, maturing |
|
|
|
|
|
|
| |
|
| January 10, 2011 |
|
|
|
|
| 11,595,543 |
| |
| (2) | IWO Escrow Company |
| B3 |
| CCC+ |
|
|
| |
3,175,000 |
| Floating Rate Note, 7.349%, maturing |
|
|
|
|
|
|
| |
|
| January 15, 2012 |
|
|
|
|
| 3,333,750 |
| |
|
| Nextel Partners Operating Corporation |
| Ba2 |
| BBB- |
|
|
| |
6,500,000 |
| Term Loan, 4.830%, maturing May 31, 2012 |
|
|
|
|
| 6,563,375 |
| |
|
| Ntelos, Inc. |
|
|
|
|
|
|
| |
4,477,500 |
| Term Loan, 6.170%, maturing |
|
|
|
|
|
|
| |
|
| August 25, 2011 |
| B2 |
| B |
| 4,522,835 |
| |
|
| Ntelos, Inc. |
|
|
|
|
|
|
| |
1,000,000 |
| Term Loan, 8.670%, maturing |
|
|
|
|
|
|
| |
|
| February 25, 2012 |
| B3 |
| CCC+ |
| 1,002,500 |
| |
|
| Rogers Wireless, Inc. |
| Ba3 |
| BB |
|
|
| |
2,500,000 |
| Floating Rate Note, 6.535%, maturing |
|
|
|
|
|
|
| |
|
| December 15, 2010 |
|
|
|
|
| 2,606,250 |
| |
|
| Rural Cellular Corporation |
| B2 |
| B- |
|
|
| |
1,500,000 |
| Floating Rate Note, 7.910%, maturing |
|
|
|
|
|
|
| |
|
| March 15, 2010 |
|
|
|
|
| 1,552,500 |
| |
|
| Triton PCS, Inc. |
| B2 |
| B- |
|
|
| |
4,482,500 |
| Term Loan, 6.920%, maturing |
|
|
|
|
|
|
| |
|
| November 18, 2009 |
|
|
|
|
| 4,521,722 |
| |
See Accompanying Notes to Financial Statements
30
ING Senior Income Fund
PORTFOLIO OF INVESTMENTS as of August 31, 2005 (Unaudited) (continued)
|
| Bank Loan |
|
|
| |||||
Principal Amount |
| Borrower/Tranche Description |
| Moody’s |
| S&P |
| Value |
| |
Cellular: (continued) |
|
|
|
|
|
|
| |||
|
| US Unwired, Inc. |
| B2 |
| CCC+ |
|
|
| |
$ 1,750,000 |
| Floating Rate Note, 7.660%, maturing |
|
|
|
|
|
|
| |
|
| June 15, 2010 |
|
|
|
|
| $ | 1,820,000 |
|
|
|
|
|
|
|
|
| 58,682,537 |
| |
Chemicals, Plastics & Rubber: 6.9% |
|
|
|
|
|
|
| |||
|
| Brenntag AG |
| B1 |
| BB- |
|
|
| |
3,000,000 |
| Term Loan, 6.810%, maturing |
|
|
|
|
|
|
| |
|
| February 27, 2012 |
|
|
|
|
| 3,038,001 |
| |
|
| Celanese AG |
| B1 |
| B+ |
|
|
| |
6,500,000 |
| Term Loan, 3.559%, maturing |
|
|
|
|
|
|
| |
|
| April 06, 2009 |
|
|
|
|
| 6,620,861 |
| |
14,185,593 |
| Term Loan, 5.740%, maturing April 06, 2011 |
|
|
|
|
| 14,460,439 |
| |
|
| Hawkeye Renewables, LLC |
| B2 |
| B |
|
|
| |
5,500,000 |
| Term Loan, 6.925%, maturing |
|
|
|
|
|
|
| |
|
| January 31, 2012 |
|
|
|
|
| 5,438,125 |
| |
6,472,863 |
| Term Loan, 5.240%-5.310%, maturing |
| Ba1 |
| BB |
|
|
| |
|
| October 08, 2010 |
|
|
|
|
| 6,566,720 |
| |
|
| Hexion Specialty Chemicals, Inc. |
| B1 |
| BB- |
|
|
| |
545,455 |
| Term Loan, 6.188%, maturing May 31, 2012 |
|
|
|
|
| 554,318 |
| |
2,290,909 |
| Term Loan, 6.375%, maturing May 31, 2012 |
|
|
|
|
| 2,328,136 |
| |
3,163,636 |
| Term Loan, 6.375%, maturing May 31, 2012 |
|
|
|
|
| 3,215,045 |
| |
|
| Huntsman International, LLC |
| Ba3 |
| BB- |
|
|
| |
23,000,000 |
| Term Loan, 5.323%, maturing |
|
|
|
|
|
|
| |
|
| August 16, 2012 |
|
|
|
|
| 23,337,824 |
| |
|
| Ineos Group Holdings PLC |
| Ba2 |
| BB+ |
|
|
| |
4,143,499 |
| Term Loan, 7.261%, maturing April 26, 2009 |
|
|
|
|
| 4,165,770 |
| |
|
| Innophos, Inc. |
| B2 |
| B |
|
|
| |
3,330,216 |
| Term Loan, 5.550%-5.970%, maturing |
|
|
|
|
|
|
| |
|
| August 13, 2010 |
|
|
|
|
| 3,369,070 |
| |
|
| Invista B.V. |
| Ba3 |
| BB |
|
|
| |
10,429,676 |
| Term Loan, 5.750%, maturing April 29, 2011 |
|
|
|
|
| 10,605,677 |
| |
4,525,088 |
| Term Loan, 5.750%, maturing April 29, 2011 |
|
|
|
|
| 4,601,449 |
| |
|
| JohnsonDiversey, Inc. |
| B1 |
| BB- |
|
|
| |
2,333,018 |
| Term Loan, 5.460%, maturing |
|
|
|
|
|
|
| |
|
| November 03, 2009 |
|
|
|
|
| 2,359,265 |
| |
5,583,271 |
| Term Loan, 5.284%-5.460%, maturing |
|
|
|
|
|
|
| |
|
| November 03, 2009 |
|
|
|
|
| 5,653,933 |
| |
|
| Kraton Polymers, LLC |
| B1 |
| B+ |
|
|
| |
2,185,694 |
| Term Loan, 6.125%-6.500%, maturing |
|
|
|
|
|
|
| |
|
| December 23, 2010 |
|
|
|
|
| 2,223,262 |
| |
|
| Nalco Company |
| B1 |
| BB- |
|
|
| |
8,387,880 |
| Term Loan, 5.450%-5.870%, maturing |
|
|
|
|
|
|
| |
|
| November 04, 2010 |
|
|
|
|
| 8,532,705 |
| |
|
| Polypore, Inc. |
| B1 |
| B |
|
|
| |
6,415,000 |
| Term Loan, 5.920%, maturing |
|
|
|
|
|
|
| |
|
| November 12, 2011 |
|
|
|
|
| 6,452,419 |
| |
See Accompanying Notes to Financial Statements
31
ING Senior Income Fund
PORTFOLIO OF INVESTMENTS as of August 31, 2005 (Unaudited) (continued)
|
| Bank Loan |
|
|
| |||||
Principal Amount |
| Borrower/Tranche Description |
| Moody’s |
| S&P |
| Value |
| |
Chemicals, Plastics & Rubber: (continued) |
|
|
|
|
|
|
| |||
|
| PQ Corporation |
| B1 |
| B+ |
|
|
| |
$ 2,493,750 |
| Term Loan, 5.500%, maturing |
|
|
|
|
|
|
| |
|
| February 11, 2012 |
|
|
|
|
| $ | 2,526,480 |
|
|
| Rockwood Specialties Group, Inc. |
| B1 |
| B+ |
|
|
| |
18,531,875 |
| Term Loan, 5.930%, maturing July 30, 2012 |
|
|
|
|
| 18,875,493 |
| |
|
| Supresta, LLC |
| B1 |
| B+ |
|
|
| |
5,692,500 |
| Term Loan, 6.490%, maturing July 30, 2012 |
|
|
|
|
| 5,792,119 |
| |
|
| Westlake Chemical Corporation |
| Ba1 |
| BB+ |
|
|
| |
293,714 |
| Term Loan, 5.919%-7.750%, maturing |
|
|
|
|
|
|
| |
|
| July 30, 2010 |
|
|
|
|
| 296,651 |
| |
|
|
|
|
|
|
|
| 141,013,762 |
| |
Containers, Packaging & Glass: 4.8% |
|
|
|
|
|
|
| |||
|
| Appleton Papers, Inc. |
| Ba3 |
| BB |
|
|
| |
2,390,000 |
| Term Loan, 5.500%-5.730%, maturing |
|
|
|
|
|
|
| |
|
| June 11, 2010 |
|
|
|
|
| 2,418,381 |
| |
|
| Berry Plastics Corporation |
| B1 |
| B+ |
|
|
| |
1,688,180 |
| Term Loan, 5.600%-5.766%, maturing |
|
|
|
|
|
|
| |
|
| July 22, 2010 |
|
|
|
|
| 1,716,879 |
| |
4,311,820 |
| Term Loan, 5.600%-5.766%, maturing |
|
|
|
|
|
|
| |
|
| December 02, 2011 |
|
|
|
|
| 4,385,121 |
| |
|
| Boise Cascade Corporation |
| Ba3 |
| BB |
|
|
| |
9,588,586 |
| Term Loan, 5.250%-5.438%, maturing |
|
|
|
|
|
|
| |
|
| October 29, 2011 |
|
|
|
|
| 9,745,005 |
| |
|
| BWAY Corporation |
| B1 |
| B+ |
|
|
| |
1,302,000 |
| Term Loan, 5.875%-6.000%, maturing |
|
|
|
|
|
|
| |
|
| June 30, 2011 |
|
|
|
|
| 1,322,547 |
| |
|
| Graham Packaging Company, L.P. |
| B2 |
| B |
|
|
| |
17,417,500 |
| Term Loan, 5.938%-6.063%, maturing |
|
|
|
|
|
|
| |
|
| October 07, 2011 |
|
|
|
|
| 17,718,683 |
| |
|
| Graphic Packaging International, Inc. |
| B1 |
| B+ |
|
|
| |
18,660,621 |
| Term Loan, 5.880%-6.190%, maturing |
|
|
|
|
|
|
| |
|
| June 30, 2010 |
|
|
|
|
| 18,987,182 |
| |
|
| Intertape Polymer Group, Inc. |
| Ba3 |
| B+ |
|
|
| |
2,729,375 |
| Term Loan, 5.650%-5.742%, maturing |
|
|
|
|
|
|
| |
|
| July 28, 2011 |
|
|
|
|
| 2,781,689 |
| |
|
| Koch Cellulose, LLC |
| Ba3 |
| BB |
|
|
| |
1,201,378 |
| Term Loan, 5.240%, maturing May 07, 2011 |
|
|
|
|
| 1,217,647 |
| |
|
| Owens-Illinois Group, Inc. |
| B1 |
| BB- |
|
|
| |
1,443,491 |
| Term Loan, 5.330%, maturing April 01, 2007 |
|
|
|
|
| 1,456,121 |
| |
3,450,711 |
| Term Loan, 5.370%, maturing April 01, 2008 |
|
|
|
|
| 3,488,093 |
| |
|
| Pro Mach, Inc. |
|
|
|
|
|
|
| |
2,487,500 |
| Term Loan, 6.350%, maturing |
| B1 |
| B |
|
|
| |
|
| December 01, 2011 |
|
|
|
|
| 2,524,813 |
| |
|
| Smurfit-Stone Container Corporation |
| Ba3 |
| BB- |
|
|
| |
10,416,519 |
| Term Loan, 5.375%-5.563%, maturing |
|
|
|
|
|
|
| |
|
| November 01, 2011 |
|
|
|
|
| 10,570,600 |
| |
3,205,082 |
| Term Loan, 5.375%-5.563%, maturing |
|
|
|
|
|
|
| |
|
| November 01, 2011 |
|
|
|
|
| 3,252,492 |
| |
See Accompanying Notes to Financial Statements
32
ING Senior Income Fund
PORTFOLIO OF INVESTMENTS as of August 31, 2005 (Unaudited) (continued)
|
| Bank Loan |
|
|
| |||||
Principal Amount |
| Borrower/Tranche Description |
| Moody’s |
| S&P |
| Value |
| |
Containers, Packaging & Glass: (continued) |
|
|
|
|
|
|
| |||
|
| Solo Cup, Inc. |
| B1 |
| B+ |
|
|
| |
$ 9,851,247 |
| Term Loan, 5.490%-5.860%, maturing |
|
|
|
|
|
|
| |
|
| February 27, 2011 |
|
|
|
|
| $ | 9,968,230 |
|
|
| U.S. Can Company |
| B3 |
| B |
|
|
| |
4,453,675 |
| Term Loan, 7.320%-7.650%, maturing |
|
|
|
|
|
|
| |
|
| January 15, 2010 |
|
|
|
|
| 4,475,943 |
| |
|
| Xerium Technologies, Inc. |
| B1 |
| BB- |
|
|
| |
2,500,000 |
| Term Loan, 5.490%, maturing May 18, 2012 |
|
|
|
|
| 2,536,720 |
| |
|
|
|
|
|
|
|
| 98,566,146 |
| |
Data and Internet Services: 2.1% |
|
|
|
|
|
|
| |||
|
| Clientlogic Corporation |
| B3 |
| B |
|
|
| |
997,500 |
| Term Loan, 7.750%-8.063%, maturing |
|
|
|
|
|
|
| |
|
| February 28, 2012 |
|
|
|
|
| 998,435 |
| |
|
| Sungard Data Systems, Inc. |
| B1 |
| B+ |
|
|
| |
32,000,000 |
| Term Loan, 6.280%, maturing |
|
|
|
|
|
|
| |
|
| February 11, 2013 |
|
|
|
|
| 32,476,000 |
| |
|
| Transaction Network Services, Inc. |
| Ba3 |
| BB- |
|
|
| |
3,493,750 |
| Term Loan, 5.410%-7.410%, maturing |
|
|
|
|
|
|
| |
|
| May 04, 2012 |
|
|
|
|
| 3,537,422 |
| |
|
| Worldspan, L.P. |
| B2 |
| B |
|
|
| |
6,608,562 |
| Term Loan, 6.313%-6.625%, maturing |
|
|
|
|
|
|
| |
|
| February 16, 2010 |
|
|
|
|
| 6,558,998 |
| |
|
|
|
|
|
|
|
| 43,570,855 |
| |
Diversified / Conglomerate Manufacturing: 2.2% |
|
|
|
|
|
|
| |||
|
| Axia, Inc. |
|
|
|
|
|
|
| |
1,753,133 |
| Term Loan, 7.570%-7.670%, maturing |
| B2 |
| B |
|
|
| |
|
| November 30, 2010 |
|
|
|
|
| 1,780,526 |
| |
|
| Brand Services, Inc. |
| B2 |
| B |
|
|
| |
785,318 |
| Term Loan, 6.309%-6.670%, maturing |
|
|
|
|
|
|
| |
|
| January 15, 2012 |
|
|
|
|
| 797,588 |
| |
|
| Cinram International, Inc. |
| Ba3 |
| BB |
|
|
| |
6,253,006 |
| Term Loan, 5.580%, maturing |
|
|
|
|
|
|
| |
|
| September 30, 2009 |
|
|
|
|
| 6,321,790 |
| |
|
| Dresser Rand, Inc. |
| B1 |
| B+ |
|
|
| |
1,370,572 |
| Term Loan, 5.438%-5.490%, maturing |
|
|
|
|
|
|
| |
|
| October 01, 2010 |
|
|
|
|
| 1,395,842 |
| |
|
| Dresser, Inc. |
| Ba3 |
| B+ |
|
|
| |
3,294,543 |
| Term Loan, 5.990%, maturing |
|
|
|
|
|
|
| |
|
| April 10, 2009 |
|
|
|
|
| 3,330,233 |
| |
|
| Flowserve Corporation |
| Ba3 |
| BB- |
|
|
| |
4,000,000 |
| Term Loan, 5.375%-5.813%, maturing |
|
|
|
|
|
|
| |
|
| August 10, 2012 |
|
|
|
|
| 4,056,500 |
| |
|
| Gentek, Inc. |
| B2 |
| B+ |
|
|
| |
2,461,835 |
| Term Loan, 6.010%-6.540%, maturing |
|
|
|
|
|
|
| |
|
| February 25, 2011 |
|
|
|
|
| 2,485,530 |
| |
|
| Goodman Global Holdings, Inc. |
| B2 |
| B+ |
|
|
| |
2,985,000 |
| Term Loan, 5.875%, maturing |
|
|
|
|
|
|
| |
|
| December 23, 2011 |
|
|
|
|
| 3,030,709 |
| |
See Accompanying Notes to Financial Statements
33
ING Senior Income Fund
PORTFOLIO OF INVESTMENTS as of August 31, 2005 (Unaudited) (continued)
|
| Bank Loan |
|
|
| |||||
Principal Amount |
| Borrower/Tranche Description |
| Moody’s |
| S&P |
| Value |
| |
Diversified / Conglomerate Manufacturing: (continued) |
|
|
|
|
|
|
| |||
|
| Mueller Group, Inc. |
| B2 |
| B+ |
|
|
| |
$ 8,423,667 |
| Term Loan, 6.240%-6.610%, maturing |
|
|
|
|
|
|
| |
|
| April 23, 2011 |
|
|
|
|
| $ | 8,497,374 |
|
|
| Norcross Safety Products, LLC |
| B1 |
| BB- |
|
|
| |
2,940,103 |
| Term Loan, 5.951%-7.500%, maturing |
|
|
|
|
|
|
| |
|
| June 30, 2012 |
|
|
|
|
| 2,958,478 |
| |
|
| RLC Industries Company |
| Ba3 |
| BBB- |
|
|
| |
1,352,621 |
| Term Loan, 4.990%, maturing |
|
|
|
|
|
|
| |
|
| February 26, 2009 |
|
|
|
|
| 1,361,920 |
| |
|
| Sensus Metering Systems, Inc. |
| B2 |
| B+ |
|
|
| |
1,695,652 |
| Term Loan, 6.230%-6.540%, maturing |
|
|
|
|
|
|
| |
|
| December 17, 2010 |
|
|
|
|
| 1,716,141 |
| |
254,348 |
| Term Loan, 6.230%-6.540%, maturing |
|
|
|
|
|
|
| |
|
| December 17, 2010 |
|
|
|
|
| 257,421 |
| |
|
| Trimas Corporation |
| B1 |
| B |
|
|
| |
857,122 |
| Term Loan, 6.900%, maturing |
|
|
|
|
|
|
| |
|
| December 31, 2009 |
|
|
|
|
| 866,407 |
| |
|
| Universal Compression, Inc. |
| Ba2 |
| BB |
|
|
| |
6,982,500 |
| Term Loan, 5.240%, maturing |
|
|
|
|
|
|
| |
|
| February 15, 2012 |
|
|
|
|
| 7,078,509 |
| |
|
|
|
|
|
|
|
| 45,934,968 |
| |
Diversified / Conglomerate Service: 2.0% |
|
|
|
|
|
|
| |||
|
| Fidelity National Information Solutions, Inc. |
| Ba3 |
| BB |
|
|
| |
26,090,650 |
| Term Loan, 5.321%, maturing |
|
|
|
|
|
|
| |
|
| March 09, 2013 |
|
|
|
|
| 26,155,877 |
| |
|
| Geo Group, Inc. |
| Ba3 |
| BB- |
|
|
| |
1,297,203 | (4) | Term Loan, maturing September 14, 2011 |
|
|
|
|
| 1,313,418 |
| |
|
| Iron Mountain, Inc. |
| B2 |
| BB- |
|
|
| |
5,955,000 |
| Term Loan, 5.344%, maturing April 02, 2011 |
|
|
|
|
| 6,012,692 |
| |
5,266,667 |
| Term Loan, 5.625%, maturing April 02, 2011 |
|
|
|
|
| 5,325,095 |
| |
|
| Relizon Company |
| B1 |
| BB- |
|
|
| |
1,300,533 |
| Term Loan, 6.820%, maturing |
|
|
|
|
|
|
| |
|
| February 20, 2011 |
|
|
|
|
| 1,306,223 |
| |
|
|
|
|
|
|
|
| 40,113,305 |
| |
Ecological: 1.6% |
|
|
|
|
|
|
|
|
| |
|
| Allied Waste North America, Inc. |
| B1 |
| BB |
|
|
| |
14,756,414 |
| Term Loan, 5.370%-5.670%, maturing |
|
|
|
|
|
|
| |
|
| January 15, 2012 |
|
|
|
|
| 14,905,660 |
| |
5,948,934 |
| Term Loan, 5.100%, maturing |
|
|
|
|
|
|
| |
|
| January 15, 2012 |
|
|
|
|
| 6,009,661 |
| |
|
| Envirosolutions, Inc. |
| B2 |
| B- |
|
|
| |
2,750,000 |
| Term Loan, 9.000%, maturing July 07, 2012 |
|
|
|
|
| 2,789,531 |
| |
|
| Great Lakes Dredge & Dock Corporation |
| B3 |
| CCC+ |
|
|
| |
2,292,703 |
| Term Loan, 7.100%-7.900%, maturing |
|
|
|
|
|
|
| |
|
| December 22, 2010 |
|
|
|
|
| 2,307,033 |
| |
|
| IESI Corporation |
| B1 |
| BB |
|
|
| |
1,800,000 |
| Term Loan, 5.620%-5.820%, maturing |
|
|
|
|
|
|
| |
|
| January 14, 2012 |
|
|
|
|
| 1,828,125 |
| |
See Accompanying Notes to Financial Statements
34
ING Senior Income Fund
PORTFOLIO OF INVESTMENTS as of August 31, 2005 (Unaudited) (continued)
|
| Bank Loan |
|
|
| |||||
Principal Amount |
| Borrower/Tranche Description |
| Moody’s |
| S&P |
| Value |
| |
Ecological: (continued) |
|
|
|
|
|
|
| |||
|
| Wastequip, Inc. |
|
|
|
|
|
|
| |
$ 750,000 |
| Term Loan, 6.170%, maturing July 15, 2011 |
| B2 |
| B+ |
| $ | 761,250 |
|
|
| Wastequip, Inc. |
|
|
|
|
|
|
| |
500,000 |
| Term Loan, 9.670%, maturing July 15, 2012 |
| B3 |
| B- |
| 507,500 |
| |
|
| WCA Waste Systems, Inc. |
| B3 |
| B |
|
|
| |
3,491,250 |
| Term Loan, 6.550%, maturing April 28, 2011 |
|
|
|
|
| 3,495,614 |
| |
|
|
|
|
|
|
|
| 32,604,374 |
| |
Electronics: 0.7% |
|
|
|
|
|
|
|
|
| |
|
| Decision One Corporation |
| NR |
| NR |
|
|
| |
434,054 | (3) | Term Loan, 12.000%, maturing |
|
|
|
|
|
|
| |
|
| April 15, 2010 |
|
|
|
|
| 434,054 |
| |
|
| Invensys International Holdings, Ltd. |
| Ba3 |
| B+ |
|
|
| |
823,868 |
| Term Loan, 6.881%, maturing |
|
|
|
|
|
|
| |
|
| September 05, 2009 |
|
|
|
|
| 835,197 |
| |
|
| Knowles Electronics, Inc. |
| B3 |
| B- |
|
|
| |
3,343,710 |
| Term Loan, 8.400%, maturing June 29, 2007 |
|
|
|
|
| 3,410,584 |
| |
|
| ON Semiconductor Corporation |
| B3 |
| B+ |
|
|
| |
6,477,475 |
| Term Loan, 6.500%, maturing |
|
|
|
|
|
|
| |
|
| December 15, 2011 |
|
|
|
|
| 6,570,589 |
| |
|
| Seagate Technology Holdings, Inc. |
| Ba1 |
| BB+ |
|
|
| |
1,940,000 |
| Term Loan, 5.688%, maturing May 13, 2007 |
|
|
|
|
| 1,973,546 |
| |
|
| SI International, Inc. |
| B1 |
| B+ |
|
|
| |
1,745,625 |
| Term Loan, 5.780%-5.990%, maturing |
|
|
|
|
|
|
| |
|
| February 09, 2011 |
|
|
|
|
| 1,776,173 |
| |
|
|
|
|
|
|
|
| 15,000,143 |
| |
Farming & Agriculture: 0.4% |
|
|
|
|
|
|
| |||
|
| AGCO Corporation |
| Ba1 |
| BB+ |
|
|
| |
4,565,833 |
| Term Loan, 5.420%, maturing |
|
|
|
|
|
|
| |
|
| March 31, 2008 |
|
|
|
|
| 4,630,043 |
| |
|
| Butler Animal Health Supply, LLC |
| B2 |
| B |
|
|
| |
1,000,000 |
| Term Loan, 6.266%-6.460%, maturing |
|
|
|
|
|
|
| |
|
| June 30, 2011 |
|
|
|
|
| 1,011,250 |
| |
|
| Vicar Operating, Inc. |
| Ba3 |
| BB- |
|
|
| |
2,771,447 |
| Term Loan, 5.188%, maturing May 16, 2011 |
|
|
|
|
| 2,804,358 |
| |
|
|
|
|
|
|
|
| 8,445,651 |
| |
Finance: 0.3% |
|
|
|
|
|
|
|
|
| |
|
| Refco Finance Holdings, LLC |
| B1 |
| BB- |
|
|
| |
3,018,692 |
| Term Loan, 5.669%, maturing |
|
|
|
|
|
|
| |
|
| August 05, 2011 |
|
|
|
|
| 3,056,048 |
| |
|
| Rent-A-Center, Inc. |
| Ba2 |
| BB+ |
|
|
| |
3,960,000 |
| Term Loan, 5.170%-5.380%, maturing |
|
|
|
|
|
|
| |
|
| June 30, 2010 |
|
|
|
|
| 4,006,035 |
| |
|
|
|
|
|
|
|
| 7,062,083 |
| |
Foreign Cable, Foreign TV, Radio and Equipment: 0.4% |
|
|
|
|
|
|
| |||
|
| NTL Investment Holding, Ltd. |
| B1 |
| BB- |
|
|
| |
4,600,000 |
| Term Loan, 6.410%, maturing May 19, 2012 |
|
|
|
|
| 4,639,482 |
| |
See Accompanying Notes to Financial Statements
35
ING Senior Income Fund
PORTFOLIO OF INVESTMENTS as of August 31, 2005 (Unaudited) (continued)
|
| Bank Loan |
|
|
| |||||
Principal Amount |
| Borrower/Tranche Description |
| Moody’s |
| S&P |
| Value |
| |
Foreign Cable, Foreign TV, Radio and Equipment: (continued) |
|
|
|
|
|
|
| |||
|
| Telewest Communications, PLC |
| B1 |
| BB |
|
|
| |
$ 1,700,000 |
| Term Loan, 5.850%, maturing |
|
|
|
|
|
|
| |
|
| December 22, 2012 |
|
|
|
|
| $ | 1,712,750 |
|
1,300,000 |
| Term Loan, 6.350%, maturing |
|
|
|
|
|
|
| |
|
| December 22, 2013 |
|
|
|
|
| 1,306,211 |
| |
|
|
|
|
|
|
|
| 7,658,443 |
| |
Gaming: 2.9% |
|
|
|
|
|
|
|
|
| |
|
| Ameristar Casinos, Inc. |
| Ba3 |
| BB |
|
|
| |
2,317,002 |
| Term Loan, 5.500%, maturing |
|
|
|
|
|
|
| |
|
| December 20, 2006 |
|
|
|
|
| 2,328,587 |
| |
1,457,170 |
| Term Loan, 5.500%, maturing |
|
|
|
|
|
|
| |
|
| December 20, 2006 |
|
|
|
|
| 1,464,455 |
| |
|
| Argosy Gaming Company |
| Ba2 |
| BB |
|
|
| |
1,985,000 |
| Term Loan, 7.000%, maturing July 31, 2008 |
|
|
|
|
| 1,991,616 |
| |
|
| Boyd Gaming Corporation |
| Ba2 |
| BB |
|
|
| |
4,950,000 |
| Term Loan, 4.880%-4.990%, maturing |
|
|
|
|
|
|
| |
|
| June 30, 2011 |
|
|
|
|
| 5,007,237 |
| |
|
| CCM Merger, Inc. |
| B1 |
| B+ |
|
|
| |
4,000,000 |
| Term Loan, 5.641%-5.841%, maturing |
|
|
|
|
|
|
| |
|
| April 25, 2012 |
|
|
|
|
| 4,051,668 |
| |
|
| Global Cash Access, LLC |
| B2 |
| B+ |
|
|
| |
2,411,121 |
| Term Loan, 5.740%, maturing |
|
|
|
|
|
|
| |
|
| March 10, 2010 |
|
|
|
|
| 2,449,549 |
| |
|
| Green Valley Ranch Gaming, LLC |
| NR |
| NR |
|
|
| |
987,537 |
| Term Loan, 5.490%, maturing |
|
|
|
|
|
|
| |
|
| December 17, 2011 |
|
|
|
|
| 1,000,499 |
| |
|
| Herbst Gaming, Inc. |
| B3 |
| B+ |
|
|
| |
2,992,500 |
| Term Loan, 5.380%-5.490%, maturing |
|
|
|
|
|
|
| |
|
| January 31, 2011 |
|
|
|
|
| 3,038,324 |
| |
|
| Isle of Capri Casinos, Inc. |
| Ba2 |
| BB- |
|
|
| |
1,000,000 |
| Term Loan, 3.740%, maturing |
|
|
|
|
|
|
| |
|
| February 04, 2011 |
|
|
|
|
| 1,006,250 |
| |
1,492,500 |
| Term Loan, 5.100%-5.483%, maturing |
|
|
|
|
|
|
| |
|
| February 04, 2011 |
|
|
|
|
| 1,510,691 |
| |
|
| Marina District Finance Company, Inc. |
| NR |
| NR |
|
|
| |
1,990,000 |
| Term Loan, 5.130%-5.240%, maturing |
|
|
|
|
|
|
| |
|
| October 20, 2011 |
|
|
|
|
| 2,009,070 |
| |
|
| Opbiz, LLC |
| B3 |
| B- |
|
|
| |
4,988,230 |
| Term Loan, 6.504%, maturing |
|
|
|
|
|
|
| |
|
| August 31, 2010 |
|
|
|
|
| 5,011,091 |
| |
12,116 |
| Term Loan, 7.504%, maturing |
|
|
|
|
|
|
| |
|
| August 31, 2010 |
|
|
|
|
| 12,172 |
| |
|
| Pinnacle Entertainment, Inc. |
| B1 |
| BB- |
|
|
| |
980,817 |
| Term Loan, 6.670%, maturing |
|
|
|
|
|
|
| |
|
| August 27, 2010 |
|
|
|
|
| 984,495 |
| |
500,000 |
| Term Loan, 6.670%, maturing |
|
|
|
|
|
|
| |
|
| August 27, 2010 |
|
|
|
|
| 505,938 |
| |
See Accompanying Notes to Financial Statements
36
ING Senior Income Fund
PORTFOLIO OF INVESTMENTS as of August 31, 2005 (Unaudited) (continued)
|
| Bank Loan |
|
|
| |||||
Principal Amount |
| Borrower/Tranche Description |
| Moody’s |
| S&P |
| Value |
| |
Gaming: (continued) |
|
|
|
|
|
|
| |||
|
| Resorts International Hotel and Casino, Inc. |
|
|
|
|
|
|
| |
$ 4,908,957 |
| Term Loan, 6.200%, maturing April 26, 2012 |
| B2 |
| B+ |
| $ | 4,971,546 |
|
|
| Resorts International Hotel and Casino, Inc. |
|
|
|
|
|
|
| |
1,500,000 |
| Term Loan, 9.420%, maturing April 26, 2013 |
| B3 |
| B- |
| 1,506,095 |
| |
|
| Ruffin Gaming, LLC |
| NR |
| NR |
|
|
| |
1,500,000 |
| Term Loan, 5.813%, maturing June 28, 2008 |
|
|
|
|
| 1,512,187 |
| |
|
| The Mississippi Band of Choctaw Indians |
| Ba3 |
| BB |
|
|
| |
2,439,130 |
| Term Loan, 5.630%-5.910%, maturing |
|
|
|
|
|
|
| |
|
| November 14, 2011 |
|
|
|
|
| 2,468,095 |
| |
|
| Trump Entertainment Resorts Holdings, L.P. |
| B2 |
| BB- |
|
|
| |
1,750,000 |
| Term Loan, 5.930%-6.140%, maturing |
|
|
|
|
|
|
| |
|
| May 20, 2012 |
|
|
|
|
| 1,780,625 |
| |
|
| Venetian Casino Resorts, LLC |
| B1 |
| BB- |
|
|
| |
2,393,163 |
| Term Loan, 5.462%, maturing June 15, 2011 |
|
|
|
|
| 2,423,637 |
| |
11,606,837 |
| Term Loan, 5.240%, maturing June 15, 2011 |
|
|
|
|
| 11,754,639 |
| |
|
|
|
|
|
|
|
| 58,788,466 |
| |
Grocery: 0.2% |
|
|
|
|
|
|
|
|
| |
|
| Giant Eagle, Inc. |
| Ba2 |
| BB+ |
|
|
| |
982,079 |
| Term Loan, 5.747%, maturing |
|
|
|
|
|
|
| |
|
| August 06, 2009 |
|
|
|
|
| 995,582 |
| |
3,847,035 |
| Term Loan, 5.504%-5.747%, maturing |
|
|
|
|
|
|
| |
|
| August 06, 2009 |
|
|
|
|
| 3,899,932 |
| |
|
|
|
|
|
|
|
| 4,895,514 |
| |
Healthcare, Education and Childcare: 10.0% |
|
|
|
|
|
|
| |||
|
| Accellent Corporation |
| B2 |
| B+ |
|
|
| |
1,732,500 |
| Term Loan, 5.740%, maturing June 30, 2010 |
|
|
|
|
| 1,746,036 |
| |
|
| Alliance Imaging, Inc. |
| B1 |
| B+ |
|
|
| |
2,825,218 |
| Term Loan, 5.750%-6.125%, maturing |
|
|
|
|
|
|
| |
|
| December 29, 2011 |
|
|
|
|
| 2,864,652 |
| |
|
| AMR HoldCo, Inc./EmCare HoldCo, Inc. |
| B2 |
| B+ |
|
|
| |
4,975,000 |
| Term Loan, 5.660%-6.010%, maturing |
|
|
|
|
|
|
| |
|
| February 15, 2012 |
|
|
|
|
| 5,057,401 |
| |
|
| Beverly Enterprises, Inc. |
| Ba3 |
| BB |
|
|
| |
3,436,281 |
| Term Loan, 5.880%-6.390%, maturing |
|
|
|
|
|
|
| |
|
| October 22, 2008 |
|
|
|
|
| 3,447,020 |
| |
|
| Colgate Medical, Ltd. |
| Ba2 |
| BB- |
|
|
| |
2,223,252 |
| Term Loan, 5.480%-5.490%, maturing |
|
|
|
|
|
|
| |
|
| December 30, 2008 |
|
|
|
|
| 2,246,874 |
| |
|
| Community Health Systems, Inc. |
| Ba3 |
| BB- |
|
|
| |
31,933,877 |
| Term Loan, 5.420%-5.610%, maturing |
|
|
|
|
|
|
| |
|
| August 19, 2011 |
|
|
|
|
| 32,416,206 |
| |
|
| Concentra Operating Corporation |
| B1 |
| B+ |
|
|
| |
5,011,411 |
| Term Loan, 6.020%-6.230%, maturing |
|
|
|
|
|
|
| |
|
| June 30, 2010 |
|
|
|
|
| 5,083,450 |
| |
|
| Cooper Companies |
|
|
|
|
|
|
| |
2,000,000 |
| Term Loan, 5.438%-5.500%, maturing |
| Ba3 |
| BB |
|
|
| |
|
| January 06, 2012 |
|
|
|
|
| 2,016,666 |
| |
See Accompanying Notes to Financial Statements
37
ING Senior Income Fund
PORTFOLIO OF INVESTMENTS as of August 31, 2005 (Unaudited) (continued)
|
| Bank Loan |
|
|
| |||||
Principal Amount |
| Borrower/Tranche Description |
| Moody’s |
| S&P |
| Value |
| |
Healthcare, Education and Childcare: (continued) |
|
|
|
|
|
|
| |||
|
| CRC Health Corporation |
| B2 |
| B+ |
|
|
| |
$ 1,500,000 |
| Term Loan, 6.240%, maturing May 05, 2011 |
|
|
|
|
| $ | 1,515,000 |
|
|
| Davita, Inc. |
| B1 |
| BB- |
|
|
| |
28,000,000 | (4) | Term Loan, maturing June 30, 2012 |
|
|
|
|
| 28,435,568 |
| |
|
| Encore Medical IHC, Inc. |
| B1 |
| B |
|
|
| |
2,439,144 |
| Term Loan, 6.430%-6.560%, maturing |
|
|
|
|
|
|
| |
|
| October 04, 2010 |
|
|
|
|
| 2,475,731 |
| |
|
| Fisher Scientific International, Inc. |
| Ba2 |
| BBB |
|
|
| |
3,465,000 |
| Term Loan, 4.990%, maturing |
|
|
|
|
|
|
| |
|
| August 02, 2011 |
|
|
|
|
| 3,500,371 |
| |
|
| Healthcare Partners, LLC |
| B1 |
| BB |
|
|
| |
2,962,500 |
| Term Loan, 5.820%, maturing |
|
|
|
|
|
|
| |
|
| February 04, 2011 |
|
|
|
|
| 2,987,497 |
| |
|
| Healthsouth Corporation |
| NR |
| NR |
|
|
| |
3,150,000 |
| Term Loan, 6.150%, maturing June 14, 2007 |
|
|
|
|
| 3,182,486 |
| |
850,000 |
| Term Loan, 3.062%, maturing |
|
|
|
|
|
|
| |
|
| February 28, 2010 |
|
|
|
|
| 858,766 |
| |
|
| Iasis Healthcare Corporation |
| B1 |
| B+ |
|
|
| |
13,389,874 |
| Term Loan, 5.766%, maturing June 30, 2011 |
|
|
|
|
| 13,601,488 |
| |
|
| Insight Health Services Corporation |
| B1 |
| B |
|
|
| |
547,229 |
| Term Loan, 7.490%, maturing |
|
|
|
|
|
|
| |
|
| October 17, 2008 |
|
|
|
|
| 549,281 |
| |
169,830 |
| Term Loan, 7.490%, maturing |
|
|
|
|
|
|
| |
|
| October 17, 2008 |
|
|
|
|
| 170,467 |
| |
84,915 |
| Term Loan, 7.490%, maturing |
|
|
|
|
|
|
| |
|
| October 17, 2008 |
|
|
|
|
| 85,233 |
| |
|
| Kinetic Concepts, Inc. |
| Ba3 |
| BB |
|
|
| |
3,587,886 |
| Term Loan, 5.240%, maturing |
|
|
|
|
|
|
| |
|
| August 11, 2010 |
|
|
|
|
| 3,634,977 |
| |
|
| Lifecare Holdings, Inc. |
| B2 |
| B |
|
|
| |
2,666,667 |
| Term Loan, 5.820%, maturing |
|
|
|
|
|
|
| |
|
| August 11, 2012 |
|
|
|
|
| 2,680,000 |
| |
|
| Lifepoint Hospitals |
| Ba3 |
| BB |
|
|
| |
23,937,500 |
| Term Loan, 5.196%, maturing April 15, 2012 |
|
|
|
|
| 24,211,082 |
| |
|
| Magellan Health Services, Inc. |
| B1 |
| B+ |
|
|
| |
614,583 |
| Term Loan, 5.660%-5.871%, maturing |
|
|
|
|
|
|
| |
|
| August 15, 2008 |
|
|
|
|
| 621,497 |
| |
|
| MMM Holdings, Inc. |
| B2 |
| B- |
|
|
| |
2,500,000 | (4) | Term Loan, maturing August 16, 2011 |
|
|
|
|
| 2,528,125 |
| |
|
| Mylan Laboratories, Inc. |
| Ba1 |
| BBB- |
|
|
| |
1,000,000 |
| Term Loan, 5.400%, maturing June 30, 2010 |
|
|
|
|
| 1,014,167 |
| |
|
| Pacificare Health Systems, Inc. |
| Ba2 |
| BBB- |
|
|
| |
8,410,386 |
| Term Loan, 4.938%-5.188%, maturing |
|
|
|
|
|
|
| |
|
| December 13, 2010 |
|
|
|
|
| 8,443,674 |
| |
|
| Psychiatric Solutions, Inc. |
| B1 |
| B+ |
|
|
| |
1,500,000 |
| Term Loan, 5.730%, maturing July 01, 2012 |
|
|
|
|
| 1,524,375 |
| |
See Accompanying Notes to Financial Statements
38
ING Senior Income Fund
PORTFOLIO OF INVESTMENTS as of August 31, 2005 (Unaudited) (continued)
|
| Bank Loan |
|
|
| |||||
Principal Amount |
| Borrower/Tranche Description |
| Moody’s |
| S&P |
| Value |
| |
Healthcare, Education and Childcare: (continued) |
|
|
|
|
|
|
| |||
|
| Rural/Metro Operating Company, LLC |
| B2 |
| B |
|
|
| |
$ 519,127 |
| Term Loan, 6.670%, maturing |
|
|
|
|
|
|
| |
|
| March 04, 2011 |
|
|
|
|
| $ | 526,914 |
|
1,505,881 |
| Term Loan, 5.838%, maturing |
|
|
|
|
|
|
| |
|
| March 04, 2011 |
|
|
|
|
| 1,528,469 |
| |
|
| Select Medical Corporation |
| B1 |
| BB- |
|
|
| |
2,493,750 |
| Term Loan, 5.360%-7.250%, maturing |
|
|
|
|
|
|
| |
|
| February 24, 2012 |
|
|
|
|
| 2,505,179 |
| |
|
| Sterigenics International, Inc. |
| B2 |
| B+ |
|
|
| |
2,460,038 |
| Term Loan, 6.410%, maturing June 14, 2011 |
|
|
|
|
| 2,490,788 |
| |
|
| Vanguard Health Systems, Inc. |
| B2 |
| B |
|
|
| |
19,850,000 |
| Term Loan, 6.740%, maturing |
|
|
|
|
|
|
| |
|
| September 23, 2011 |
|
|
|
|
| 20,118,809 |
| |
1,990,000 |
| Term Loan, 6.440%-6.838%, maturing |
|
|
|
|
|
|
| |
|
| September 23, 2011 |
|
|
|
|
| 2,014,875 |
| |
|
| VWR International, Inc. |
| B2 |
| B+ |
|
|
| |
4,473,701 |
| Term Loan, 6.140%, maturing April 07, 2011 |
|
|
|
|
| 4,540,806 |
| |
|
| Warner Chilcott Corporation |
| B2 |
| B |
|
|
| |
8,334,502 |
| Term Loan, 6.359%-6.460%, maturing |
|
|
|
|
|
|
| |
|
| January 18, 2012 |
|
|
|
|
| 8,431,241 |
| |
3,358,397 |
| Term Loan, 6.359%, maturing |
|
|
|
|
|
|
| |
|
| January 18, 2012 |
|
|
|
|
| 3,397,378 |
| |
1,551,485 |
| Term Loan, 6.359%, maturing |
|
|
|
|
|
|
| |
|
| January 18, 2012 |
|
|
|
|
| 1,569,493 |
| |
|
|
|
|
|
|
|
| 204,022,042 |
| |
Home & Office Furnishings: 1.8% |
|
|
|
|
|
|
| |||
|
| ACCO Brands Corporation |
| Ba3 |
| BB- |
|
|
| |
666,667 |
| Term Loan, 5.330%, maturing |
|
|
|
|
|
|
| |
|
| August 17, 2012 |
|
|
|
|
| 676,667 |
| |
|
| Buhrmann U.S., Inc. |
| Ba3 |
| BB- |
|
|
| |
9,474,300 |
| Term Loan, 5.921%-6.210%, maturing |
|
|
|
|
|
|
| |
|
| December 31, 2010 |
|
|
|
|
| 9,657,865 |
| |
|
| Global Imaging Systems, Inc. |
| Ba2 |
| BB- |
|
|
| |
2,208,224 |
| Term Loan, 4.930%-5.280%, maturing |
|
|
|
|
|
|
| |
|
| May 10, 2010 |
|
|
|
|
| 2,225,477 |
| |
|
| Maax Corporation |
| B2 |
| B |
|
|
| |
2,713,149 |
| Term Loan, 6.100%-6.470%, maturing |
|
|
|
|
|
|
| |
|
| June 04, 2011 |
|
|
|
|
| 2,719,931 |
| |
|
| Sealy Mattress Company |
| B1 |
| B+ |
|
|
| |
11,283,18 |
| Term Loan, 5.080%-5.359%, maturing |
|
|
|
|
|
|
| |
|
| April 06, 2012 |
|
|
|
|
| 11,436,569 |
| |
|
| Simmons Company |
| B2 |
| B+ |
|
|
| |
8,283,755 |
| Term Loan, 5.750%-7.750%, maturing |
|
|
|
|
|
|
| |
|
| December 19, 2011 |
|
|
|
|
| 8,411,465 |
| |
|
| Xerox Corporation |
| Ba1 |
| BB- |
|
|
| |
2,000,000 |
| Term Loan, 5.430%, maturing |
|
|
|
|
|
|
| |
|
| September 30, 2008 |
|
|
|
|
| 2,018,750 |
| |
|
|
|
|
|
|
|
| 37,146,724 |
| |
See Accompanying Notes to Financial Statements
39
ING Senior Income Fund
PORTFOLIO OF INVESTMENTS as of August 31, 2005 (Unaudited) (continued)
|
| Bank Loan |
|
|
| |||||
Principal Amount |
| Borrower/Tranche Description |
| Moody’s |
| S&P |
| Value |
| |
Insurance: 0.7% |
|
|
|
|
|
|
|
|
| |
|
| CCC information Services, Inc. |
|
|
|
|
|
|
| |
$ 3,864,081 |
| Term Loan, 6.420%, maturing |
| B1 |
| B+ |
|
|
| |
|
| August 20, 2010 |
|
|
|
|
| $ | 3,922,042 |
|
|
| Conseco, Inc. |
| B2 |
| BB- |
|
|
| |
6,117,123 |
| Term Loan, 5.570%, maturing June 22, 2010 |
|
|
|
|
| 6,195,502 |
| |
|
| Mitchell International, Inc. |
| B1 |
| B+ |
|
|
| |
1,306,923 |
| First Lien Term Loan, 6.240%, maturing |
|
|
|
|
| 1,328,161 |
| |
|
| Vertafore, Inc. |
|
|
|
|
|
|
| |
2,400,962 |
| Term Loan, 6.391%-6.580%, maturing |
|
|
|
|
|
|
| |
|
| December 22, 2010 |
| B2 |
| B |
| 2,427,972 |
| |
|
| Vertafore, Inc. |
|
|
|
|
|
|
| |
500,000 |
| Term Loan, 9.510%, maturing |
|
|
|
|
|
|
| |
|
| December 22, 2011 |
| B3 |
| NR |
| 511,250 |
| |
|
|
|
|
|
|
|
| 14,384,927 |
| |
Leisure, Amusement, Entertainment: 4.9% |
|
|
|
|
|
|
| |||
|
| 24 Hour Fitness Worldwide, Inc. |
| B2 |
| B |
|
|
| |
3,250,000 |
| Term Loan, 6.780%, maturing June 08, 2012 |
|
|
|
|
| 3,305,861 |
| |
|
| AMF Bowling Worldwide, Inc. |
| B2 |
| B |
|
|
| |
872,930 |
| Term Loan, 6.091%-7.053%, maturing |
|
|
|
|
|
|
| |
|
| August 27, 2009 |
|
|
|
|
| 881,387 |
| |
|
| Kerasotes Theatres, Inc. |
| B1 |
| B |
|
|
| |
7,462,500 |
| Term Loan, 5.950%, maturing |
|
|
|
|
|
|
| |
|
| October 31, 2011 |
|
|
|
|
| 7,543,341 |
| |
|
| Lodgenet Entertainment Corporation |
| Ba3 |
| B+ |
|
|
| |
3,519,867 |
| Term Loan, 5.740%, maturing |
|
|
|
|
|
|
| |
|
| August 29, 2008 |
|
|
|
|
| 3,558,734 |
| |
|
| Loews Cineplex Entertainment Corporation |
| B1 |
| B |
|
|
| |
7,386,011 |
| Term Loan, 5.800-5.970%, maturing |
|
|
|
|
|
|
| |
|
| July 31, 2011 |
|
|
|
|
| 7,450,063 |
| |
|
| Metro-Goldwyn-Mayer Studios, Inc. |
| Ba3 |
| B+ |
|
|
| |
4,000,000 |
| Term Loan, 5.740%, maturing April 08, 2011 |
|
|
|
|
| 4,047,500 |
| |
33,500,000 |
| Term Loan, 5.740%, maturing April 08, 2012 |
|
|
|
|
| 33,960,625 |
| |
|
| Pure Fishing, Inc. |
| B1 |
| B+ |
|
|
| |
2,733,259 |
| Term Loan, 6.480%-6.770%, maturing |
|
|
|
|
|
|
| |
|
| September 30, 2010 |
|
|
|
|
| 2,779,382 |
| |
|
| Regal Cinemas, Inc. |
| Ba3 |
| BB- |
|
|
| |
9,642,393 |
| Term Loan, 5.240%-5.490%, maturing |
|
|
|
|
|
|
| |
|
| November 10, 2010 |
|
|
|
|
| 9,762,923 |
| |
|
| Riddell Bell Holding, Inc. |
| B1 |
| BB- |
|
|
| |
1,488,750 |
| Term Loan, 6.160%, maturing |
|
|
|
|
|
|
| |
|
| September 28, 2011 |
|
|
|
|
| 1,514,493 |
| |
|
| Six Flags Theme Parks, Inc. |
| B1 |
| B- |
|
|
| |
4,240,431 |
| Term Loan, 6.280%-6.500%, maturing |
|
|
|
|
|
|
| |
|
| June 30, 2009 |
|
|
|
|
| 4,290,345 |
| |
|
| Universal City Development Partners, L.P. |
| Ba3 |
| BB- |
|
|
| |
4,975,000 |
| Term Loan, 5.490%-5.810%, maturing |
|
|
|
|
|
|
| |
|
| June 09, 2011 |
|
|
|
|
| 5,051,700 |
| |
See Accompanying Notes to Financial Statements
40
ING Senior Income Fund
PORTFOLIO OF INVESTMENTS as of August 31, 2005 (Unaudited) (continued)
|
| Bank Loan |
|
|
| |||||
Principal Amount |
| Borrower/Tranche Description |
| Moody’s |
| S&P |
| Value |
| |
Leisure, Amusement, Entertainment: (continued) |
|
|
|
|
|
|
| |||
|
| WMG Acquisition Corporation |
| B1 |
| B+ |
|
|
| |
$ 16,403,751 |
| Term Loan, 5.520%-5.860%, maturing |
|
|
|
|
|
|
| |
|
| February 28, 2011 |
|
|
|
|
| $ | 16,597,085 |
|
|
|
|
|
|
|
|
| 100,743,439 |
| |
Lodging: 0.4% |
|
|
|
|
|
|
|
|
| |
|
| CNL Hotel Del Senior Mezz Partners, L.P. |
| NR |
| NR |
|
|
| |
7,500,000 |
| Term Loan, 5.640%, maturing |
|
|
|
|
|
|
| |
|
| February 09, 2008 |
|
|
|
|
| 7,518,750 |
| |
|
|
|
|
|
|
|
| 7,518,750 |
| |
Machinery: 1.8% |
|
|
|
|
|
|
|
|
| |
|
| Alliance Laundry Holdings, LLC |
| B1 |
| B |
|
|
| |
5,947,500 |
| Term Loan, 5.800%, maturing |
|
|
|
|
|
|
| |
|
| January 27, 2012 |
|
|
|
|
| 6,046,009 |
| |
|
| Blount, Inc. |
| B1 |
| BB- |
|
|
| |
3,952,068 |
| Term Loan, 6.004%-7.250%, maturing |
|
|
|
|
|
|
| |
|
| August 09, 2010 |
|
|
|
|
| 4,021,229 |
| |
|
| Enersys, Inc. |
| Ba3 |
| BB |
|
|
| |
3,292,999 |
| Term Loan, 5.296%-5.820%, maturing |
|
|
|
|
|
|
| |
|
| March 17, 2011 |
|
|
|
|
| 3,315,639 |
| |
|
| Maxim Crane Works, L.P. |
|
|
|
|
|
|
| |
2,078,125 |
| Term Loan, 6.188%-6.375%, maturing |
|
|
|
|
|
|
| |
|
| January 25, 2010 |
| B2 |
| BB- |
| 2,114,492 |
| |
|
| Maxim Crane Works, L.P. |
|
|
|
|
|
|
| |
1,500,000 |
| Term Loan, 8.938%, maturing |
|
|
|
|
|
|
| |
|
| January 30, 2012 |
| B3 |
| B+ |
| 1,552,500 |
| |
|
| Rexnord Corporation |
| B1 |
| B+ |
|
|
| |
7,570,190 |
| Term Loan, 5.750%-7.250%, maturing |
|
|
|
|
|
|
| |
|
| December 31, 2011 |
|
|
|
|
| 7,688,474 |
| |
|
| Terex Corporation |
| B1 |
| BB- |
|
|
| |
1,744,219 |
| Term Loan, 5.680%, maturing July 03, 2009 |
|
|
|
|
| 1,769,292 |
| |
|
| United Rentals (North America), Inc. |
| B1 |
| BB |
|
|
| |
157,078 |
| Term Loan, 3.340%, maturing |
|
|
|
|
|
|
| |
|
| February 14, 2011 |
|
|
|
|
| 158,943 |
| |
10,790,907 |
| Term Loan, 5.920%, maturing |
|
|
|
|
|
|
| |
|
| February 14, 2011 |
|
|
|
|
| 10,919,049 |
| |
|
|
|
|
|
|
|
| 37,585,627 |
| |
Mining, Steel, Iron & Nonprecious Metals: 1.4% |
|
|
|
|
|
|
| |||
|
| Carmeuse Lime, Inc. |
| NR |
| NR |
|
|
| |
2,962,500 |
| Term Loan, 5.500%, maturing May 02, 2011 |
|
|
|
|
| 2,984,719 |
| |
|
| Foundation Coal Corporation |
| Ba3 |
| BB- |
|
|
| |
3,688,830 |
| Term Loan, 5.380%-5.660%, maturing |
|
|
|
|
|
|
| |
|
| July 30, 2011 |
|
|
|
|
| 3,756,457 |
| |
|
| International Coal Group, LLC |
| B2 |
| B- |
|
|
| |
600,000 | (4) | Term Loan, maturing October 01, 2010 |
|
|
|
|
| 603,000 |
| |
1,488,750 |
| Term Loan, 6.430%, maturing |
|
|
|
|
|
|
| |
|
| October 01, 2010 |
|
|
|
|
| 1,496,194 |
| |
See Accompanying Notes to Financial Statements
41
ING Senior Income Fund
PORTFOLIO OF INVESTMENTS as of August 31, 2005 (Unaudited) (continued)
|
| Bank Loan |
|
|
| |||||
Principal Amount |
| Borrower/Tranche Description |
| Moody’s |
| S&P |
| Value |
| |
Mining, Steel, Iron & Nonprecious Metals: (continued) |
|
|
|
|
|
|
| |||
|
| Longyear Holdings, Inc. |
| B1 |
| B+ |
|
|
| |
$ 333,333 |
| Term Loan, 6.170%, maturing July 28, 2012 |
|
|
|
|
| $ | 339,167 |
|
1,333,333 |
| Term Loan, 6.170%, maturing July 28, 2012 |
|
|
|
|
| 1,356,666 |
| |
|
| Novelis, Inc. |
| Ba2 |
| BB- |
|
|
| |
4,742,973 |
| Term Loan, 5.460%, maturing |
|
|
|
|
|
|
| |
|
| January 06, 2012 |
|
|
|
|
| 4,810,413 |
| |
8,237,796 |
| Term Loan, 5.460%, maturing |
|
|
|
|
|
|
| |
|
| January 06, 2012 |
|
|
|
|
| 8,354,929 |
| |
|
| Trout Coal Holdings, LLC |
| B3 |
| B |
|
|
| |
4,488,750 |
| Term Loan, 6.000%-6.170%, maturing |
|
|
|
|
|
|
| |
|
| March 18, 2010 |
|
|
|
|
| 4,499,972 |
| |
|
|
|
|
|
|
|
| 28,201,517 |
| |
North American Cable: 10.5% |
|
|
|
|
|
|
| |||
| (2) | Adelphia Communications Corporation |
| NR |
| BBB |
|
|
| |
11,000,000 |
| Debtor in Possession Term Loan, 6.313%, |
|
|
|
|
| 11,027,500 |
| |
|
| Maturing March 31, 2006 |
|
|
|
|
|
|
| |
|
| Atlantic Broadband Finance, LLC |
| B2 |
| B |
|
|
| |
4,000,000 |
| Term Loan, 6.110%, maturing |
|
|
|
|
|
|
| |
|
| August 04, 2012 |
|
|
|
|
| 4,075,000 |
| |
|
| Bragg Communications, Inc. |
| B1 |
| NR |
|
|
| |
4,455,000 |
| Term Loan, 6.360%, maturing |
|
|
|
|
|
|
| |
|
| August 31, 2011 |
|
|
|
|
| 4,507,903 |
| |
|
| Bresnan Communications, LLC |
| B1 |
| BB- |
|
|
| |
7,000,000 |
| Term Loan, 7.060%-7.170%, maturing |
|
|
|
|
|
|
| |
|
| December 31, 2007 |
|
|
|
|
| 7,126,000 |
| |
|
| Cebridge Connections, Inc. |
| NR |
| NR |
|
|
| |
1,481,250 |
| Term Loan, 6.400%-8.750%, maturing |
|
|
|
|
|
|
| |
|
| February 23, 2009 |
|
|
|
|
| 1,490,508 |
| |
2,461,288 |
| Term Loan, 9.490%-9.774%, maturing |
|
|
|
|
|
|
| |
|
| February 23, 2010 |
|
|
|
|
| 2,485,901 |
| |
| (2) | Century Cable Holdings, LLC |
| Caa1 |
| NR |
|
|
| |
820,000 |
| Revolver, 7.500%, maturing March 31, 2009 |
|
|
|
|
| 808,469 |
| |
13,000,000 |
| Term Loan, 8.500%, maturing June 30, 2009 |
|
|
|
|
| 12,926,875 |
| |
6,750,000 |
| Term Loan, 8.500%, maturing |
|
|
|
|
|
|
| |
|
| December 31, 2009 |
|
|
|
|
| 6,708,656 |
| |
|
| Charter Communications Operating, LLC |
| B2 |
| B |
|
|
| |
30,086,689 |
| Term Loan, 6.680%, maturing April 27, 2010 |
|
|
|
|
| 29,975,218 |
| |
31,208,685 |
| Term Loan, 6.830%-6.930%, maturing |
|
|
|
|
|
|
| |
|
| April 27, 2011 |
|
|
|
|
| 31,349,404 |
| |
| (2) | Hilton Head Communications, L.P. |
| Caa1 |
| NR |
|
|
| |
3,000,000 |
| Revolver, 6.500%, maturing |
|
|
|
|
|
|
| |
|
| September 30, 2007 |
|
|
|
|
| 2,940,939 |
| |
14,000,000 |
| Term Loan, 7.750%, maturing |
|
|
|
|
|
|
| |
|
| March 31, 2008 |
|
|
|
|
| 13,816,250 |
| |
|
| Insight Midwest Holdings, LLC |
| Ba3 |
| BB- |
|
|
| |
1,987,500 |
| Term Loan, 5.125%, maturing June 30, 2009 |
|
|
|
|
| 1,994,263 |
| |
11,327,500 |
| Term Loan, 5.625%, maturing |
|
|
|
|
|
|
| |
|
| December 31, 2009 |
|
|
|
|
| 11,495,294 |
| |
See Accompanying Notes to Financial Statements
42
ING Senior Income Fund
PORTFOLIO OF INVESTMENTS as of August 31, 2005 (Unaudited) (continued)
|
| Bank Loan |
|
|
| |||||
Principal Amount |
| Borrower/Tranche Description |
| Moody’s |
| S&P |
| Value |
| |
North American Cable: (continued) |
|
|
|
|
|
|
| |||
|
| Knology, Inc. |
|
|
|
|
|
|
| |
$ 2,250,000 |
| Term Loan, 9.080%-9.180%, maturing |
| B3 |
| NR |
|
|
| |
|
| June 29, 2010 |
|
|
|
|
| $ | 2,283,750 |
|
|
| Mediacom Communications Corporation |
| Ba3 |
| BB- |
|
|
| |
4,882,500 |
| Term Loan, 4.600%-4.810%, maturing |
|
|
|
|
|
|
| |
|
| March 31, 2010 |
|
|
|
|
| 4,867,242 |
| |
15,760,500 |
| Term Loan, 5.350%-5.510%, maturing |
|
|
|
|
|
|
| |
|
| February 01, 2014 |
|
|
|
|
| 15,993,220 |
| |
|
| Mediacom Illinois, LLC |
| Ba3 |
| BB- |
|
|
| |
8,623,333 |
| Term Loan, 5.470%-6.060%, maturing |
|
|
|
|
|
|
| |
|
| March 31, 2013 |
|
|
|
|
| 8,762,117 |
| |
| (2) | Olympus Cable Holdings, LLC |
| B2 |
| NR |
|
|
| |
23,568,240 |
| Term Loan, 7.750%, maturing June 30, 2010 |
|
|
|
|
| 23,378,846 |
| |
6,500,000 |
| Term Loan, 8.500%, maturing |
|
|
|
|
|
|
| |
|
| September 30, 2010 |
|
|
|
|
| 6,464,601 |
| |
|
| Patriot Media and Communications, LLC |
|
|
|
|
|
|
| |
3,666,667 | (4) | Term Loan, maturing April 4, 2013 |
| B1 |
| B+ |
| 3,721,667 |
| |
|
| Patriot Communications, Inc. |
|
|
|
|
|
|
| |
1,000,000 | (4) | Term Loan, maturing October 4, 2013 |
| B3 |
| B- |
| 1,021,875 |
| |
|
| Persona Communication, Inc. |
| B2 |
| B+ |
|
|
| |
3,465,000 |
| Term Loan, 6.490%, maturing |
|
|
|
|
|
|
| |
|
| August 01, 2011 |
|
|
|
|
| 3,518,060 |
| |
|
| Puerto Rico Cable Acquisition Company |
| NR |
| NR |
|
|
| |
1,500,000 |
| Term Loan, 8.750%, maturing July 28, 2011 |
|
|
|
|
| 1,521,562 |
| |
|
|
|
|
|
|
|
| 214,261,120 |
| |
Oil & Gas: 6.4% |
|
|
|
|
|
|
|
|
| |
|
| Coffeyville Resources, LLC |
| B1 |
| BB- |
|
|
| |
1,000,000 |
| Term Loan, 6.063%, maturing June 24, 2012 |
|
|
|
|
| 1,017,708 |
| |
1,500,000 |
| Term Loan, 6.063%, maturing June 24, 2012 |
|
|
|
|
| 1,526,562 |
| |
|
| Complete Production Services, Inc. |
| B2 |
| B |
|
|
| |
4,000,000 | (4) | Term Loan, maturing September 12, 2012 |
|
|
|
|
| 4,047,500 |
| |
|
| El Paso Corporation |
| B3 |
| B |
|
|
| |
2,000,000 |
| Term Loan, 5.670%, maturing |
|
|
|
|
|
|
| |
|
| November 30, 2007 |
|
|
|
|
| 2,032,222 |
| |
24,848,985 |
| Term Loan, 6.438%, maturing |
|
|
|
|
|
|
| |
|
| November 23, 2009 |
|
|
|
|
| 25,249,327 |
| |
|
| EPCO Holdings, Inc. |
| Ba3 |
| B+ |
|
|
| |
13,250,000 |
| Term Loan, 5.840%, maturing |
|
|
|
|
|
|
| |
|
| August 18, 2010 |
|
|
|
|
| 13,483,942 |
| |
|
| Getty Petroleum Marketing, Inc. |
| B1 |
| BB- |
|
|
| |
6,048,112 |
| Term Loan, 6.920%, maturing May 19, 2010 |
|
|
|
|
| 6,063,232 |
| |
|
| Kerr-McGee Corporation |
| Ba3 |
| BB+ |
|
|
| |
23,000,000 |
| Term Loan, 6.140%, maturing May 24, 2011 |
|
|
|
|
| 23,150,949 |
| |
|
| LB Pacific, L.P. |
| B1 |
| B- |
|
|
| |
3,990,000 |
| Term Loan, 6.130%-6.610%, maturing |
|
|
|
|
|
|
| |
|
| February 15, 2012 |
|
|
|
|
| 4,059,825 |
| |
See Accompanying Notes to Financial Statements
43
ING Senior Income Fund
PORTFOLIO OF INVESTMENTS as of August 31, 2005 (Unaudited) (continued)
|
|
|
| Bank Loan |
|
|
| |||
Principal Amount |
| Borrower/Tranche Description |
| Moody’s |
| S&P |
| Value |
| |
Oil & Gas: (continued) |
|
|
|
|
|
|
|
|
| |
|
| Lyondell-Citgo Refining, L.P. |
| Ba3 |
| BB |
|
|
| |
$ 7,352,996 |
| Term Loan, 5.510%-5.670%, maturing |
|
|
|
|
|
|
| |
|
| May 21, 2007 |
|
|
|
|
| $ | 7,467,886 |
|
|
| Magellan Midstream Holdings, L.P. |
| Ba3 |
| BB- |
|
|
| |
2,750,000 |
| Term Loan, 5.785%, maturing June 30, 2012 |
|
|
|
|
| 2,794,688 |
| |
|
| Mainline, L.P. |
| Ba3 |
| BB- |
|
|
| |
7,339,583 |
| Term Loan, 5.819%, maturing |
|
|
|
|
|
|
| |
|
| December 17, 2011 |
|
|
|
|
| 7,376,281 |
| |
|
| Regency Gas Services, LLC |
|
|
|
|
|
|
| |
1,492,500 |
| Term Loan, 6.240%-6.330%, maturing |
|
|
|
|
|
|
| |
|
| June 01, 2010 |
| B1 |
| B+ |
| 1,499,963 |
| |
|
| Regency Gas Services, LLC |
|
|
|
|
|
|
| |
500,000 |
| Term Loan, 9.490%, maturing |
|
|
|
|
|
|
| |
|
| November 30, 2010 |
| B3 |
| B- |
| 502,500 |
| |
|
| Semcrude, L.P. |
| Ba3 |
| NR |
|
|
| |
5,263,731 |
| Term Loan, 5.990%, maturing |
|
|
|
|
|
|
| |
|
| March 16, 2011 |
|
|
|
|
| 5,319,658 |
| |
10,019,462 |
| Term Loan, 6.071%-7.500%, maturing |
|
|
|
|
|
|
| |
|
| March 16, 2011 |
|
|
|
|
| 10,157,229 |
| |
|
| Vulcan Energy Corporation |
| Ba2 |
| BB |
|
|
| |
6,491,714 |
| Term Loan, 5.836%-5.860%, maturing |
|
|
|
|
|
|
| |
|
| August 12, 2011 |
|
|
|
|
| 6,593,147 |
| |
|
| Western Refining Company, L.P. |
| B2 |
| BB- |
|
|
| |
3,750,000 |
| Term Loan, 6.170%, maturing July 27, 2012 |
|
|
|
|
| 3,773,438 |
| |
|
| Williams Production RMT Company |
| Ba3 |
| BB |
|
|
| |
4,911,466 |
| Term Loan, 5.830%, maturing May 30, 2008 |
|
|
|
|
| 4,985,137 |
| |
|
|
|
|
|
|
|
| 131,101,194 |
| |
Other Broadcasting and Entertainment: 1.7% |
|
|
|
|
|
|
| |||
|
| Alliance Atlantis Communications, Inc. |
| Ba2 |
| BB |
|
|
| |
2,318,585 |
| Term Loan, 5.410%, maturing |
|
|
|
|
|
|
| |
|
| December 20, 2011 |
|
|
|
|
| 2,353,364 |
| |
|
| DirecTV Holdings, LLC |
| Ba1 |
| BB |
|
|
| |
10,000,000 |
| Term Loan, 5.088%, maturing April 13, 2013 |
|
|
|
|
| 10,117,860 |
| |
|
| Echostar DBS Corporation |
| Ba3 |
| BB- |
|
|
| |
5,000,000 |
| Floating Rate Note, 6.754%, maturing |
|
|
|
|
|
|
| |
|
| October 01, 2008 |
|
|
|
|
| 5,106,250 |
| |
|
| HIT Entertainment, Ltd. |
| B1 |
| B |
|
|
| |
1,666,667 | (4) | Term Loan, maturing March 20, 2012 |
|
|
|
|
| 1,693,750 |
| |
|
| Liberty Media Corporation |
| Ba1 |
| BB+ |
|
|
| |
3,500,000 |
| Floating Rate Note, 4.910%, maturing |
|
|
|
|
|
|
| |
|
| September 17, 2006 |
|
|
|
|
| 3,524,325 |
| |
|
| Rainbow National Services, LLC |
| B1 |
| BB+ |
|
|
| |
10,224,375 |
| Term Loan, 6.438%, maturing |
|
|
|
|
|
|
| |
|
| March 31, 2012 |
|
|
|
|
| 10,317,038 |
| |
|
| Yankees Holdings, L.P. |
| NR |
| NR |
|
|
| |
942,857 |
| Term Loan, 5.830%-6.130%, maturing |
|
|
|
|
|
|
| |
|
| June 25, 2007 |
|
|
|
|
| 952,286 |
| |
|
|
|
|
|
|
|
| 34,064,873 |
| |
See Accompanying Notes to Financial Statements
44
ING Senior Income Fund
PORTFOLIO OF INVESTMENTS as of August 31, 2005 (Unaudited) (continued)
|
|
|
| Bank Loan |
|
|
| |||
Principal Amount |
| Borrower/Tranche Description |
| Moody’s |
| S&P |
| Value |
| |
Other Telecommunications: 2.6% |
|
|
|
|
|
|
| |||
|
| Cincinnati Bell, Inc. |
| Ba3 |
| B+ |
|
|
| |
$ 3,500,000 | (4) | Term Loan, maturing August 31, 2012 |
|
|
|
|
| $ | 3,521,875 |
|
|
| Consolidated Communications, Inc. |
| B1 |
| BB- |
|
|
| |
4,440,381 |
| Term Loan, 5.815%-6.052%, maturing |
|
|
|
|
|
|
| |
|
| October 14, 2011 |
|
|
|
|
| 4,512,537 |
| |
|
| D&E Communications, Inc. |
| Ba3 |
| BB- |
|
|
| |
1,969,736 |
| Term Loan, 5.350%-7.500%, maturing |
|
|
|
|
|
|
| |
|
| December 31, 2011 |
|
|
|
|
| 1,986,971 |
| |
|
| Fairpoint Communications, Inc. |
| B1 |
| BB- |
|
|
| |
3,500,000 |
| Term Loan, 5.438%-5.563%, maturing |
|
|
|
|
|
|
| |
|
| February 08, 2012 |
|
|
|
|
| 3,542,658 |
| |
|
| GCI Holdings, Inc. |
| Ba2 |
| BB+ |
|
|
| |
1,394,858 |
| Term Loan, 7.250%, maturing |
|
|
|
|
|
|
| |
|
| October 31, 2007 |
|
|
|
|
| 1,406,191 |
| |
|
| Hawaiian Telcom Communications, Inc. |
| B1 |
| B+ |
|
|
| |
3,500,000 |
| Term Loan, 5.730%, maturing |
|
|
|
|
|
|
| |
|
| October 31, 2012 |
|
|
|
|
| 3,549,767 |
| |
|
| Iowa Telecommunications Services, Inc. |
| Ba3 |
| BB- |
|
|
| |
5,750,000 |
| Term Loan, 5.490%-5.540%, maturing |
|
|
|
|
|
|
| |
|
| November 30, 2011 |
|
|
|
|
| 5,819,477 |
| |
|
| Madison River Capital, LLC |
| B1 |
| B+ |
|
|
| |
1,666,667 |
| Term Loan, 6.040%, maturing July 29, 2012 |
|
|
|
|
| 1,696,875 |
| |
|
| Qwest Communications International, Inc. |
| B3 |
| B |
|
|
| |
8,000,000 |
| Floating Rate Note, 7.290%, maturing |
|
|
|
|
|
|
| |
|
| February 15, 2009 |
|
|
|
|
| 7,960,000 |
| |
|
| Qwest Corporation |
| B2 |
| BB- |
|
|
| |
1,000,000 |
| Term Loan, 8.530%, maturing June 30, 2007 |
|
|
|
|
| 1,033,542 |
| |
|
| Time Warner Telecom Holdings, Inc. |
| B1 |
| B |
|
|
| |
2,000,000 |
| Floating Rate Note, 7.790%, maturing |
|
|
|
|
| 2,050,000 |
| |
|
| Valor Telecommunication Enterprises Ii, LLC |
| Ba3 |
| BB- |
|
|
| |
8,680,272 |
| Term Loan, 5.240%-5.811%, maturing |
|
|
|
|
|
|
| |
|
| February 14, 2012 |
|
|
|
|
| 8,800,398 |
| |
|
| Wiltel Communications Group, LLC |
|
|
|
|
|
|
| |
6,709,799 |
| Term Loan, 6.990%, maturing October 01, 2009 |
| B2 |
| B- |
| 6,807,648 |
| |
|
| Wiltel Communications Group, LLC |
|
|
|
|
|
|
| |
750,000 |
| Term Loan, 9.240%, maturing |
|
|
|
|
|
|
| |
|
| January 01, 2010 |
| Caa1 |
| CCC+ |
| 744,375 |
| |
|
|
|
|
|
|
|
| 53,432,314 |
| |
Personal & Nondurable Consumer Products: 3.5% |
|
|
|
|
|
|
| |||
|
| Amscan Holdings, Inc. |
| B1 |
| B+ |
|
|
| |
1,980,000 |
| Term Loan, 6.321%-6.560%, maturing |
|
|
|
|
|
|
| |
|
| April 30, 2012 |
|
|
|
|
| 2,002,275 |
| |
|
| Arbonne International, Inc. |
| B2 |
| B |
|
|
| |
1,666,667 |
| Term Loan, 8.750%, maturing |
|
|
|
|
|
|
| |
|
| August 16, 2011 |
|
|
|
|
| 1,682,292 |
| |
See Accompanying Notes to Financial Statements
45
ING Senior Income Fund
PORTFOLIO OF INVESTMENTS as of August 31, 2005 (Unaudited) (continued)
|
|
|
| Bank Loan |
|
|
| |||
Principal Amount |
| Borrower/Tranche Description |
| Moody’s |
| S&P |
| Value |
| |
Personal & Nondurable Consumer Products: (continued) |
|
|
|
|
|
|
| |||
|
| Bushnell Performance Optics |
| B1 |
| B+ |
|
|
| |
$ 1,750,000 |
| Term Loan, 6.641%, maturing |
|
|
|
|
| $ | 1,774,062 |
|
|
| August 19, 2011 |
|
|
|
|
|
|
| |
|
| Church & Dwight Company, Inc. |
| Ba2 |
| BB |
|
|
| |
4,395,591 |
| Term Loan, 5.390%, maturing May 30, 2011 |
|
|
|
|
| 4,446,875 |
| |
|
| Fender Musical Instruments Corporation |
|
|
|
|
|
|
| |
2,493,750 |
| Term Loan, 5.850%, maturing |
| B1 |
| B+ |
|
|
| |
|
| March 30, 2012 |
|
|
|
|
| 2,531,156 |
| |
|
| Fender Musical Instruments Corporation |
|
|
|
|
|
|
| |
2,500,000 |
| Term Loan, 8.100%, maturing |
| B3 |
| B- |
|
|
| |
|
| September 30, 2012 |
|
|
|
|
| 2,550,000 |
| |
|
| Hillman Group, Inc. |
| B2 |
| B |
|
|
| |
1,975,000 |
| Term Loan, 6.688%-6.750%, maturing |
|
|
|
|
|
|
| |
|
| March 30, 2011 |
|
|
|
|
| 2,002,775 |
| |
|
| Hunter Fan Company |
| B1 |
| B |
|
|
| |
2,992,500 |
| Term Loan, 5.910%-6.180%, maturing |
|
|
|
|
|
|
| |
|
| March 24, 2012 |
|
|
|
|
| 2,985,019 |
| |
|
| Jarden Corporation |
| B1 |
| B+ |
|
|
| |
14,840,847 |
| Term Loan, 5.490%-5.635%, maturing |
|
|
|
|
|
|
| |
|
| August 15, 2011 |
|
|
|
|
| 14,946,588 |
| |
4,325,257 |
| Term Loan, 5.270%, maturing |
|
|
|
|
|
|
| |
|
| January 24, 2012 |
|
|
|
|
| 4,356,075 |
| |
|
| Norwood Promotional Products Holdings, Inc. |
| NR |
| NR |
|
|
| |
6,712,197 | (4) | Term Loan, maturing August 16, 2011 |
|
|
|
|
| 2,349,269 |
| |
|
| Norwood Promotional Products, Inc. |
| NR |
| NR |
|
|
| |
8,866,729 |
| Term Loan, 9.750%, maturing |
|
|
|
|
|
|
| |
|
| August 16, 2009 |
|
|
|
|
| 8,733,728 |
| |
|
| Oreck Corporation |
| B1 |
| B+ |
|
|
| |
3,977,506 |
| Term Loan, 6.240%, maturing |
|
|
|
|
|
|
| |
|
| January 27, 2012 |
|
|
|
|
| 4,017,281 |
| |
|
| Prestige Brands Holdings, Inc. |
| B1 |
| B+ |
|
|
| |
2,179,254 |
| Term Loan, 6.311%-7.750%, maturing |
|
|
|
|
|
|
| |
|
| April 06, 2011 |
|
|
|
|
| 2,200,138 |
| |
|
| Reddy Ice Group, Inc. |
| B1 |
| B+ |
|
|
| |
3,000,000 |
| Term Loan, 5.321%, maturing |
|
|
|
|
|
|
| |
|
| August 09, 2012 |
|
|
|
|
| 3,030,939 |
| |
|
| Spectrum Brands, Inc. |
| B1 |
| B+ |
|
|
| |
12,069,750 |
| Term Loan, 5.480%-5.790%, maturing |
|
|
|
|
|
|
| |
|
| February 06, 2012 |
|
|
|
|
| 12,250,796 |
| |
|
|
|
|
|
|
|
| 71,859,268 |
| |
Personal, Food & Miscellaneous: 2.6% |
|
|
|
|
|
|
| |||
|
| AFC Enterprises, Inc. |
| B1 |
| B+ |
|
|
| |
2,500,000 |
| Term Loan, 5.750%, maturing |
|
|
|
|
| 2,531,250 |
| |
|
| May 11, 2011 |
|
|
|
|
|
|
| |
|
| Alderwoods Group, Inc. |
| B1 |
| BB- |
|
|
| |
1,766,361 |
| Term Loan, 5.296%-5.840%, maturing |
|
|
|
|
|
|
| |
|
| September 29, 2009 |
|
|
|
|
| 1,792,856 |
| |
|
| Arby’s Restaurant Group, Inc. |
| B1 |
| B+ |
|
|
| |
4,000,000 |
| Term Loan, 5.919%-6.110%, maturing |
|
|
|
|
|
|
| |
|
| July 25, 2012 |
|
|
|
|
| 4,051,252 |
| |
See Accompanying Notes to Financial Statements
46
ING Senior Income Fund
PORTFOLIO OF INVESTMENTS as of August 31, 2005 (Unaudited) (continued)
|
|
|
| Bank Loan |
|
|
| |||
Principal Amount |
| Borrower/Tranche Description |
| Moody’s |
| S&P |
| Value |
| |
Personal, Food & Miscellaneous: (continued) |
|
|
|
|
|
|
| |||
|
| Brickman Group Holdings, Inc. |
| Ba3 |
| BB- |
|
|
| |
$ 1,617,614 |
| Term Loan, 6.380%-6.660%, maturing |
|
|
|
|
|
|
| |
|
| December 19, 2008 |
|
|
|
|
| $ | 1,613,570 |
|
|
| Burger King Corporation |
| Ba2 |
| B+ |
|
|
| |
4,500,000 |
| Term Loan, 5.375%, maturing |
|
|
|
|
| 4,575,537 |
| |
|
| June 30, 2012 |
| B2 |
| B |
|
|
| |
|
| Burt’s Bees, Inc. |
|
|
|
|
|
|
| |
3,241,875 |
| Term Loan, 6.134%-6.410%, maturing |
|
|
|
|
|
|
| |
|
| March 24, 2011 |
|
|
|
|
| 3,282,398 |
| |
|
| Carrols Corporation |
| B1 |
| B+ |
|
|
| |
4,479,994 |
| Term Loan, 6.000%, maturing |
|
|
|
|
|
|
| |
|
| December 31, 2010 |
|
|
|
|
| 4,553,725 |
| |
|
| Central Garden & Pet Company |
| Ba2 |
| BB+ |
|
|
| |
2,448,916 |
| Term Loan, 5.321%-5.419%, maturing |
|
|
|
|
|
|
| |
|
| May 15, 2009 |
|
|
|
|
| 2,484,119 |
| |
|
| Coinmach Corporation |
| B2 |
| B |
|
|
| |
3,698,948 |
| Term Loan, 6.563%-6.688%, maturing |
|
|
|
|
|
|
| |
|
| July 25, 2009 |
|
|
|
|
| 3,750,966 |
| |
|
| Coinstar, Inc. |
| Ba3 |
| BB- |
|
|
| |
2,688,508 |
| Term Loan, 5.550%, maturing |
|
|
|
|
|
|
| |
|
| July 07, 2011 |
|
|
|
|
| 2,728,835 |
| |
|
| Culligan International Company |
| B1 |
| B+ |
|
|
| |
2,500,000 |
| Term Loan, 6.071%, maturing |
|
|
|
|
|
|
| |
|
| September 30, 2011 |
|
|
|
|
| 2,539,063 |
| |
|
| Domino’s, Inc. |
| Ba3 |
| B+ |
|
|
| |
5,227,671 |
| Term Loan, 5.250%, maturing |
|
|
|
|
|
|
| |
|
| June 25, 2010 |
|
|
|
|
| 5,316,975 |
| |
|
| Jack in the Box, Inc. |
| Ba2 |
| BB |
|
|
| |
5,424,925 |
| Term Loan, 5.080%-5.810%, maturing |
|
|
|
|
|
|
| |
|
| January 09, 2011 |
|
|
|
|
| 5,496,127 |
| |
|
| Landry’s Restaurants, Inc. |
| Ba2 |
| BB- |
|
|
| |
3,980,000 |
| Term Loan, 5.240%, maturing |
|
|
|
|
|
|
| |
|
| December 28, 2010 |
|
|
|
|
| 4,033,483 |
| |
|
| MD Beauty, Inc. |
| B2 |
| B |
|
|
| |
1,974,194 |
| Term Loan, 6.600%-6.700%, maturing |
|
|
|
|
|
|
| |
|
| February 18, 2012 |
|
|
|
|
| 1,993,936 |
| |
|
| N.E.W. Holdings I, LLC |
| B1 |
| B+ |
|
|
| |
2,229,545 |
| Term Loan, 6.875%-7.063%, maturing |
|
|
|
|
|
|
| |
|
| July 08, 2011 |
|
|
|
|
| 2,264,382 |
| |
|
| Ruths Chris Steak House, Inc. |
| NR |
| NR |
|
|
| |
507,143 |
| Term Loan, 8.500%, maturing |
|
|
|
|
|
|
| |
|
| March 11, 2011 |
|
|
|
|
| 508,411 |
| |
|
|
|
|
|
|
|
| 53,516,885 |
| |
Printing & Publishing: 6.2% |
|
|
|
|
|
|
| |||
|
| Adams Outdoor Advertising, L.P. |
| B1 |
| B+ |
|
|
| |
7,168,996 |
| Term Loan, 5.540%-5.640%, maturing |
|
|
|
|
|
|
| |
|
| October 18, 2012 |
|
|
|
|
| 7,269,061 |
| |
See Accompanying Notes to Financial Statements
47
ING Senior Income Fund
PORTFOLIO OF INVESTMENTS as of August 31, 2005 (Unaudited) (continued)
|
|
|
| Bank Loan |
|
|
| |||||
Principal Amount |
| Borrower/Tranche Description |
| Moody’s |
| S&P |
| Value |
| |||
Printing & Publishing: (continued) |
|
|
|
|
|
|
| |||||
|
| American Achievement Corporation |
| B1 |
| B+ |
|
|
| |||
$ 1,790,558 |
| Term Loan, 5.850%-8.000%, maturing |
|
|
|
|
|
|
| |||
|
| March 25, 2011 |
|
|
|
|
| $ | 1,816,297 |
| ||
|
| American Media Operations, Inc. |
| B1 |
| B |
|
|
| |||
13,453 |
| Term Loan, 6.254%, maturing April 01, 2006 |
|
|
|
|
| 13,588 |
| |||
6,723,854 |
| Term Loan, 6.254%, maturing April 01, 2007 |
|
|
|
|
| 6,817,706 |
| |||
1,335,412 |
| Term Loan, 6.254%, maturing April 01, 2007 |
|
|
|
|
| 1,354,052 |
| |||
|
| American Reprographics Company |
|
|
|
|
|
|
| |||
3,490,183 |
| Term Loan, 10.235%, maturing |
|
|
|
|
|
|
| |||
|
| June 18, 2009 |
| Ba2 |
| BB |
| 3,516,359 |
| |||
|
| American Reprographics Company |
|
|
|
|
|
|
| |||
700,000 |
| Term Loan, 5.310%-5.524%, maturing |
|
|
|
|
|
|
| |||
|
| December 18, 2009 |
| B1 |
| B |
| 728,000 |
| |||
|
| Ascend Media Holdings, LLC |
| B3 |
| B |
|
|
| |||
1,750,000 |
| First Lien Term Loan, 6.180%-6.460%, maturing |
|
|
|
|
|
|
| |||
|
| January 31, 2012 |
|
|
|
|
| 1,755,469 |
| |||
|
| Canwest Mesdia, Inc. |
| Ba3 |
| B+ |
|
|
| |||
4,978,305 |
| Term Loan, 5.823%, maturing |
|
|
|
|
|
|
| |||
|
| August 15, 2009 |
|
|
|
|
| 5,048,832 |
| |||
|
| Dex Media East, LLC |
| Ba2 |
| BB |
|
|
| |||
1,601,073 |
| Term Loan, 4.810%-5.000%, maturing |
|
|
|
|
|
|
| |||
|
| November 08, 2008 |
|
|
|
|
| 1,608,579 |
| |||
5,232,162 |
| Term Loan, 5.050%-5.500%, maturing |
|
|
|
|
|
|
| |||
|
| May 08, 2009 |
|
|
|
|
| 5,306,066 |
| |||
|
| Dex Media West, LLC |
| Ba2 |
| BB |
|
|
| |||
745,692 |
| Term Loan, 4.680%-4.900%, maturing |
|
|
|
|
|
|
| |||
|
| September 09, 2009 |
|
|
|
|
| 749,537 |
| |||
8,871,628 |
| Term Loan, 5.050%-5.400%, maturing |
|
|
|
|
|
|
| |||
|
| March 09, 2010 |
|
|
|
|
| 8,999,663 |
| |||
|
| Enterprise Newsmedia, LLC |
| B2 |
| B |
|
|
| |||
3,500,000 |
| Term Loan, 6.510%, maturing June 30, 2012 |
|
|
|
|
| 3,545,937 |
| |||
|
| F&W Publications, Inc. |
| B2 |
| B |
|
|
| |||
1,000,000 |
| Term Loan, 6.030%, maturing |
|
|
|
|
|
|
| |||
|
| August 05, 2012 |
|
|
|
|
| 1,015,625 |
| |||
|
| Freedom Communications, Inc. |
| Ba2 |
| BB |
|
|
| |||
2,374,843 |
| Term Loan, 4.830%, maturing May 01, 2013 |
|
|
|
|
| 2,406,013 |
| |||
|
| Hanley-Wood, LLC |
| B2 |
| B |
|
|
| |||
2,533,113 |
| Term Loan, 5.784%, maturing |
|
|
|
|
|
|
| |||
|
| August 01, 2012 |
|
|
|
|
| 2,548,945 |
| |||
|
| IWCO Direct, Inc. |
| B1 |
| B |
|
|
| |||
1,496,250 |
| Term Loan, 6.740%-6.810%, maturing |
|
|
|
|
|
|
| |||
|
| January 31, 2011 |
|
|
|
|
| 1,518,694 |
| |||
|
| Journal Register Company |
| Ba2 |
| BB |
|
|
| |||
5,000,000 |
| Term Loan, 5.010%-5.180%, maturing |
|
|
|
|
|
|
| |||
|
| September 29, 2006 |
|
|
|
|
| 5,047,655 |
| |||
|
| Lamar Media Corporation |
| Ba2 |
| BB |
|
|
| |||
3,848,196 |
| Term Loan, 5.313%-5.375%, maturing |
|
|
|
|
|
|
| |||
|
| June 30, 2010 |
|
|
|
|
| 3,874,172 |
| |||
See Accompanying Notes to Financial Statements
48
ING Senior Income Fund
PORTFOLIO OF INVESTMENTS as of August 31, 2005 (Unaudited) (continued)
|
|
|
| Bank Loan |
|
|
| ||||
Principal Amount |
| Borrower/Tranche Description |
| Moody’s |
| S&P |
| Value |
| ||
Printing & Publishing: (continued) |
|
|
|
|
|
|
| ||||
|
| Liberty Group Publishing |
| B1 |
| B+ |
|
|
| ||
$ 4,925,156 |
| Term Loan, 5.813%, maturing |
|
|
|
|
|
|
|
| |
|
| February 28, 2012 |
|
|
|
|
| $ | 4,979,540 |
| |
|
| MC Communications, LLC |
| B2 |
| B |
|
|
| ||
3,406,667 |
| Term Loan, 6.540%, maturing |
|
|
|
|
|
|
| ||
|
| December 31, 2010 |
|
|
|
|
| 3,436,475 |
| ||
|
| Merrill Communications, LLC |
| B1 |
| B+ |
|
|
| ||
3,558,750 |
| Term Loan, 6.169%, maturing July 30, 2009 |
|
|
|
|
| 3,606,572 |
| ||
1,392,188 |
| Term Loan, 6.169%, maturing July 30, 2009 |
|
|
|
|
| 1,410,896 |
| ||
|
| Primedia, Inc. |
| B2 |
| B |
|
|
| ||
1,170,960 |
| Revolver, 5.750%, maturing June 30, 2008 |
|
|
|
|
| 1,147,541 |
| ||
4,260,619 |
| Term Loan, 6.438%, maturing June 30, 2009 |
|
|
|
|
| 4,269,941 |
| ||
1,485,000 |
| Term Loan, 8.000%, maturing |
|
|
|
|
|
|
| ||
|
| December 31, 2009 |
|
|
|
|
| 1,491,034 |
| ||
|
| R.H. Donnelley, Inc. |
| Ba3 |
| BB |
|
|
| ||
4,430,450 |
| Term Loan, 5.490%-5.760%, maturing |
|
|
|
|
|
|
| ||
|
| December 31, 2009 |
|
|
|
|
| 4,478,560 |
| ||
758,126 |
| Term Loan, 5.240%-5.510%, maturing |
|
|
|
|
|
|
| ||
|
| December 31, 2009 |
|
|
|
|
| 766,358 |
| ||
11,739,890 |
| Term Loan, 5.110%-5.300%, maturing |
|
|
|
|
|
|
| ||
|
| June 30, 2011 |
|
|
|
|
| 11,915,424 |
| ||
|
| Source Media, Inc. |
| B1 |
| B |
|
|
| ||
4,470,588 |
| Term Loan, 5.740%, maturing |
|
|
|
|
|
|
| ||
|
| November 08, 2011 |
|
|
|
|
| 4,537,647 |
| ||
|
| Visant Holding Corporation |
| B1 |
| B+ |
|
|
| ||
18,050,000 |
| Term Loan, 5.754%-5.940%, maturing |
|
|
|
|
|
|
| ||
|
| October 04, 2011 |
|
|
|
|
| 18,352,338 |
| ||
|
| Ziff Davis Media, Inc. |
| B3 |
| CCC+ |
|
|
| ||
1,500,000 |
| Floating Rate Note, 9.693%, maturing |
|
|
|
|
|
|
| ||
|
| May 01, 2012 |
|
|
|
|
| 1,455,000 |
| ||
|
|
|
|
|
|
|
| 126,787,576 |
| ||
Radio and TV Broadcasting: 3.0% |
|
|
|
|
|
|
| ||||
|
| Emmis Operating Company |
| Ba2 |
| B+ |
|
|
| ||
10,917,500 |
| Term Loan, 5.321%, maturing |
|
|
|
|
|
|
| ||
|
| November 10, 2011 |
|
|
|
|
| 11,015,757 |
| ||
|
| Entravision Communications Corporation |
| B1 |
| B+ |
|
|
| ||
750,000 |
| Term Loan, 5.240%, maturing |
|
|
|
|
|
|
| ||
|
| February 24, 2012 |
|
|
|
|
| 753,281 |
| ||
2,500,000 |
| Term Loan, 5.240%, maturing |
|
|
|
|
|
|
| ||
|
| February 24, 2012 |
|
|
|
|
| 2,510,938 |
| ||
|
| Mission Broadcasting, Inc. |
| Ba3 |
| B |
|
|
| ||
4,864,789 |
| Term Loan, 5.240%, maturing |
|
|
|
|
|
|
| ||
|
| August 14, 2012 |
|
|
|
|
| 4,910,396 |
| ||
|
| NEP Supershooters, L.P. |
| B1 |
| B |
|
|
| ||
2,977,500 |
| Term Loan, 7.490%-7.710%, maturing |
|
|
|
|
|
|
| ||
|
| February 03, 2011 |
|
|
|
|
| 3,034,260 |
| ||
1,990,000 |
| Term Loan, 6.990%, maturing |
|
|
|
|
|
|
| ||
|
| February 03, 2011 |
|
|
|
|
| 2,027,935 |
| ||
See Accompanying Notes to Financial Statements
49
ING Senior Income Fund
PORTFOLIO OF INVESTMENTS as of August 31, 2005 (Unaudited) (continued)
|
|
|
| Bank Loan |
|
|
| ||||
Principal Amount |
| Borrower/Tranche Description |
| Moody’s |
| S&P |
| Value |
| ||
Radio and TV Broadcasting: (continued) |
|
|
|
|
|
|
| ||||
|
| Nexstar Broadcasting, Inc. |
| Ba3 |
| B |
|
|
| ||
$ 5,135,211 |
| Term Loan, 5.240%, maturing |
|
|
|
|
|
|
|
| |
|
| August 14, 2012 |
|
|
|
|
| $ | 5,183,354 |
| |
|
| Paxson Communications Corporation |
| B1 |
| B- |
|
|
| ||
6,500,000 |
| Floating Rate Note, 6.349%, maturing |
|
|
|
|
|
|
| ||
|
| January 15, 2010 |
|
|
|
|
| 6,500,000 |
| ||
|
| Raycom Media, Inc. |
| NR |
| NR |
|
|
| ||
4,750,000 |
| Term Loan, 5.500%, maturing |
|
|
|
|
|
|
| ||
|
| March 31, 2012 |
|
|
|
|
| 4,797,500 |
| ||
|
| Spanish Broadcasting Systems, Inc. |
|
|
|
|
|
|
| ||
3,990,000 |
| Term Loan, 5.490%, maturing June 10, 2012 |
| B1 |
| B+ |
| 4,052,344 |
| ||
|
| Spanish Broadcasting Systems, Inc. |
|
|
|
|
|
|
| ||
1,500,000 |
| Term Loan, 7.510%, maturing June 10, 2013 |
| B2 |
| CCC+ |
| 1,522,500 |
| ||
|
| Susquehanna Media Company |
| Ba2 |
| BB- |
|
|
| ||
8,977,500 |
| Term Loan, 5.250%-5.670%, maturing |
|
|
|
|
|
|
| ||
|
| March 31, 2012 |
|
|
|
|
| 9,095,330 |
| ||
|
| Young Broadcasting, Inc. |
| B1 |
| B |
|
|
| ||
5,000,000 |
| Term Loan, 5.688%-6.000%, maturing |
|
|
|
|
|
|
| ||
|
| November 03, 2012 |
|
|
|
|
| 5,054,165 |
| ||
|
|
|
|
|
|
|
| 60,457,760 |
| ||
Retail Stores: 3.8% |
|
|
|
|
|
|
|
|
| ||
|
| Advance Stores Company, Inc. |
| Ba2 |
| BB+ |
|
|
| ||
1,730,350 |
| Term Loan, 5.250%- 5.438%, maturing |
|
|
|
|
|
|
| ||
|
| September 30, 2010 |
|
|
|
|
| 1,756,305 |
| ||
2,926,887 |
| Term Loan, 4.938%-5.625%, maturing |
|
|
|
|
|
|
| ||
|
| September 30, 2010 |
|
|
|
|
| 2,970,790 |
| ||
|
| Alimentation Couche-Tard, Inc. |
| Ba2 |
| BB |
|
|
| ||
603,061 |
| Term Loan, 5.375%, maturing |
|
|
|
|
|
|
| ||
|
| December 17, 2010 |
|
|
|
|
| 610,599 |
| ||
|
| Baker & Taylor, Inc. |
|
|
|
|
|
|
| ||
1,300,000 |
| Revolver, 5.229%-5.338%, maturing |
| Ba3 |
| B+ |
|
|
| ||
|
| August 11, 2010 |
|
|
|
|
| 1,293,500 |
| ||
|
| Baker & Taylor, Inc. |
|
|
|
|
|
|
| ||
2,000,000 |
| Term Loan, 10.160%, maturing May 06, 2011 |
| B1 |
| B |
| 2,025,000 |
| ||
|
| Blockbuster Entertainment Corporation |
| B3 |
| B |
|
|
| ||
9,000,000 |
| Term Loan, 6.990%-7.540%, maturing |
|
|
|
|
|
|
| ||
|
| August 20, 2011 |
|
|
|
|
| 8,820,432 |
| ||
|
| Dollarama Group, L.P. |
| B1 |
| B+ |
|
|
| ||
5,472,500 |
| Term Loan, 5.930%, maturing |
|
|
|
|
|
|
| ||
|
| November 18, 2011 |
|
|
|
|
| 5,554,587 |
| ||
|
| Harbor Freight Tools, Inc. |
| B1 |
| B+ |
|
|
| ||
9,934,977 |
| Term Loan, 5.914%-8.000%, maturing |
|
|
|
|
|
|
| ||
|
| July 15, 2010 |
|
|
|
|
| 10,066,616 |
| ||
|
| Jean Coutu Group, Inc. |
| B1 |
| BB |
|
|
| ||
8,914,962 |
| Term Loan, 5.938%, maturing July 30, 2011 |
|
|
|
|
| 9,062,621 |
| ||
|
| Mapco Express, Inc. |
| B2 |
| B+ |
|
|
| ||
2,500,000 |
| Term Loan, 6.210%, maturing April 28, 2011 |
|
|
|
|
| 2,539,063 |
| ||
|
| Movie Gallery, Inc. |
| B1 |
| B+ |
|
|
| ||
6,500,000 |
| Term Loan, 6.490%, maturing April 27, 2011 |
|
|
|
|
| 6,537,726 |
| ||
See Accompanying Notes to Financial Statements
50
ING Senior Income Fund
PORTFOLIO OF INVESTMENTS as of August 31, 2005 (Unaudited) (continued)
|
|
|
| Bank Loan |
|
|
| |||
Principal Amount |
| Borrower/Tranche Description |
| Moody’s |
| S&P |
| Value |
| |
Retail Stores: (continued) |
|
|
|
|
|
|
|
|
| |
|
| Nebraska Book Company, Inc. |
| B2 |
| B |
|
|
| |
$ 3,456,250 |
| Term Loan, 5.880%, maturing March 04, 2011 |
|
|
|
|
| $ | 3,490,813 |
|
|
|
|
|
|
|
|
|
|
|
|
|
| Oriental Trading Company, Inc. |
|
|
|
|
|
|
| |
2,734,064 |
| Term Loan, 5.750%, maturing August 06, 2010 |
| B1 |
| B+ |
| 2,751,152 |
| |
|
|
|
|
|
|
|
|
|
| |
|
| Oriental Trading Company |
|
|
|
|
|
|
| |
1,750,000 |
| Term Loan, 8.250%, maturing January 08, 2011 |
| B3 |
| B- |
| 1,760,938 |
| |
|
|
|
|
|
|
|
|
|
| |
|
| Pantry, Inc. |
| B1 |
| B+ |
|
|
| |
4,862,319 |
| Term Loan, 5.920%, maturing March 12, 2011 |
|
|
|
|
| 4,938,293 |
| |
|
|
|
|
|
|
|
|
|
| |
|
| Rite Aid Corporation |
| NR |
| NR |
|
|
| |
3,960,000 |
| Term Loan, 5.310%-5.420%, maturing |
|
|
|
|
|
|
| |
|
| August 31, 2009 |
|
|
|
|
| 3,996,301 |
| |
|
| Tire Rack, Inc. |
| B1 |
| BB- |
|
|
| |
1,000,000 |
| Term Loan, 5.730%-5.900%, maturing |
|
|
|
|
|
|
| |
|
| June 24, 2012 |
|
|
|
|
| 1,017,500 |
| |
|
| Travelcenters of America, Inc. |
| B1 |
| BB |
|
|
| |
9,000,000 |
| Term Loan, 5.260%, maturing |
|
|
|
|
|
|
| |
|
| December 01, 2011 |
|
|
|
|
| 9,119,529 |
| |
|
|
|
|
|
|
|
| 78,311,765 |
| |
Satellite: 1.4% |
|
|
|
|
|
|
|
|
| |
|
| Intelsat Zeus, Ltd. |
| B1 |
| BB+ |
|
|
| |
4,975,000 |
| Term Loan, 5.250%, maturing July 28, 2011 |
|
|
|
|
| 5,023,198 |
| |
|
| New Skies Satellites, BV |
| B1 |
| BB- |
|
|
| |
2,981,217 |
| Term Loan, 5.875%, maturing May 02, 2011 |
|
|
|
|
| 3,023,539 |
| |
|
| Panamsat Corporation |
| Ba3 |
| BB+ |
|
|
| |
866,478 |
| Term Loan, 5.359%, maturing |
|
|
|
|
|
|
| |
|
| August 20, 2009 |
|
|
|
|
| 875,389 |
| |
453,056 |
| Term Loan, 5.359%, maturing |
|
|
|
|
|
|
| |
|
| August 20, 2009 |
|
|
|
|
| 457,715 |
| |
18,694,964 |
| Term Loan, 5.650%, maturing |
|
|
|
|
|
|
| |
|
| August 20, 2011 |
|
|
|
|
| 18,935,661 |
| |
|
|
|
|
|
|
|
| 28,315,502 |
| |
Telecommunications Equipment: 1.6% |
|
|
|
|
|
|
| |||
|
| AAT Communications Corporation |
|
|
|
|
|
|
| |
3,000,000 |
| Term Loan, 5.610%, maturing July 27, 2012 |
| B1 |
| BB+ |
| 3,042,189 |
| |
|
| AAT Communications Corporation |
|
|
|
|
|
|
| |
1,000,000 |
| Term Loan, 6.610%, maturing July 27, 2013 |
| B2 |
| BB |
| 1,019,375 |
| |
|
| American Tower, L.P. |
| Ba3 |
| BBB |
|
|
| |
6,000,000 |
| Term Loan, 4.980%-5.150%, maturing |
|
|
|
|
|
|
| |
|
| February 28, 2011 |
|
|
|
|
| 6,039,378 |
| |
2,493,750 |
| Term Loan, 4.900%-7.000%, maturing |
|
|
|
|
|
|
| |
|
| August 31, 2011 |
|
|
|
|
| 2,520,765 |
| |
|
| SBA Senior Finance, Inc. |
| B1 |
| BB |
|
|
| |
8,162,525 |
| Term Loan, 5.540%-5.920%, maturing |
|
|
|
|
|
|
| |
|
| October 31, 2008 |
|
|
|
|
| 8,242,452 |
| |
|
| Spectrasite Communications, Inc. |
| Ba3 |
| BBB |
|
|
| |
7,960,000 |
| Term Loan, 4.910%, maturing May 19, 2012 |
|
|
|
|
| 8,051,206 |
| |
See Accompanying Notes to Financial Statements
51
ING Senior Income Fund
PORTFOLIO OF INVESTMENTS as of August 31, 2005 (Unaudited) (continued)
|
|
|
| Bank Loan |
|
|
| ||||||
Principal Amount |
| Borrower/Tranche Description |
| Moody’s |
| S&P |
| Value |
| ||||
Telecommunications Equipment: (continued) |
|
|
|
|
|
|
| ||||||
|
| Syniverse Holding, LLC |
| Ba3 |
| BB- |
|
|
| ||||
$ 3,045,000 |
| Term Loan, 5.670%-7.500%, maturing |
|
|
|
|
|
|
| ||||
|
| February 15, 2012 |
|
|
|
|
| $ | 3,079,256 |
| |||
|
|
|
|
|
|
|
| 31,994,621 |
| ||||
Textiles & Leather: 0.6% |
|
|
|
|
|
|
|
|
| ||||
| (2) | Galey & Lord, Inc. |
| NR |
| NR |
|
|
| ||||
646,115 | (3) | Term Loan, maturing |
|
|
|
|
|
|
| ||||
|
| September 05, 2009 |
|
|
|
|
| 133,531 |
| ||||
|
| Polymer Group, Inc. |
| B2 |
| B+ |
|
|
| ||||
1,866,667 |
| Term Loan, 6.730%, maturing April 27, 2010 |
|
|
|
|
| 1,903,222 |
| ||||
|
| Propex Fabrics, Inc. |
| B3 |
| B+ |
|
|
| ||||
1,937,658 |
| Term Loan, 5.740%, maturing |
|
|
|
|
|
|
| ||||
|
| November 30, 2011 |
|
|
|
|
| 1,942,502 |
| ||||
|
| Springs Industries, Inc. |
| Ba3 |
| BB- |
|
|
| ||||
985,000 |
| Term Loan, 6.250%, maturing |
|
|
|
|
|
|
| ||||
|
| December 24, 2010 |
|
|
|
|
| 984,693 |
| ||||
|
| St. John Knits International, Inc. |
| B1 |
| B+ |
|
|
| ||||
2,992,500 |
| Term Loan, 6.000%, maturing |
|
|
|
|
|
|
| ||||
|
| March 18, 2012 |
|
|
|
|
| 3,029,906 |
| ||||
|
| William Carter Company |
| B1 |
| BB |
|
|
| ||||
4,000,000 |
| Term Loan, 5.330%-5.811%, maturing |
|
|
|
|
|
|
| ||||
|
| July 14, 2012 |
|
|
|
|
| 4,060,000 |
| ||||
|
|
|
|
|
|
|
| 12,053,854 |
| ||||
Utilities: 5.4% |
|
|
|
|
|
|
|
|
| ||||
|
| Allegheny Energy Supply Company |
| Ba2 |
| BB |
|
|
| ||||
13,537,128 |
| Term Loan, 5.340%-5.359%, maturing |
|
|
|
|
|
|
| ||||
|
| March 08, 2011 |
|
|
|
|
| 13,733,417 |
| ||||
|
| Calpine Corporation |
| B3 |
| B- |
|
|
| ||||
982,406 |
| Term Loan, 9.349%, maturing July 16, 2007 |
|
|
|
|
| 804,099 |
| ||||
|
| Cogentrix Delaware Holdings, Inc. |
| Ba2 |
| BB+ |
|
|
| ||||
6,532,743 |
| Term Loan, 5.240%, maturing April 14, 2012 |
|
|
|
|
| 6,617,126 |
| ||||
|
| Coleto Creek Power |
|
|
|
|
|
|
| ||||
939,783 |
| Term Loan, 5.680%, maturing June 30, 2011 |
| Ba3 |
| BB |
| 957,404 |
| ||||
|
| Coleto Creek Power |
|
|
|
|
|
|
| ||||
1,000,000 |
| Term Loan, 6.997%, maturing June 30, 2012 |
| B1 |
| BB- |
| 1,022,500 |
| ||||
|
| Dynegy Holdings, Inc. |
| B2 |
| BB- |
|
|
| ||||
7,425,000 |
| Term Loan, 7.540%, maturing May 27, 2010 |
|
|
|
|
| 7,472,951 |
| ||||
|
| Kgen LLC |
| B2 |
| B |
|
|
| ||||
6,982,500 |
| Term Loan, 6.115%, maturing |
|
|
|
|
|
|
| ||||
|
| August 01, 2011 |
|
|
|
|
| 6,965,044 |
| ||||
|
| La Paloma Generating Company |
|
|
|
|
|
|
| ||||
437,158 |
| Term Loan, 3.509%, maturing |
| Ba3 |
| BB- |
|
|
| ||||
|
| August 16, 2012 |
|
|
|
|
| 444,399 |
| ||||
1,400,000 |
| Term Loan, 5.462%, maturing |
| Ba3 |
| BB- |
|
|
| ||||
|
| August 16, 2012 |
|
|
|
|
| 1,423,188 |
| ||||
|
| La Paloma Generating Company |
|
|
|
|
|
|
| ||||
1,000,000 |
| Term Loan, 7.212%, maturing August 16, 2013 |
| B2 |
| B |
| 1,023,750 |
| ||||
See Accompanying Notes to Financial Statements
52
ING Senior Income Fund
PORTFOLIO OF INVESTMENTS as of August 31, 2005 (Unaudited) (continued)
|
|
|
| Bank Loan |
|
|
| ||||
Principal Amount |
| Borrower/Tranche Description |
| Moody’s |
| S&P |
| Value |
| ||
Utilities: (continued) |
|
|
|
|
|
|
|
|
| ||
|
| NRG Energy, Inc. |
| Ba3 |
| BB |
|
|
| ||
$ 3,609,375 |
| Term Loan, 5.265%, maturing |
|
|
|
|
|
|
| ||
|
| December 24, 2011 |
|
|
|
|
| $ | 3,655,997 |
| |
5,114,922 |
| Term Loan, 5.255%-5.365%, maturing |
|
|
|
|
|
|
| ||
|
| December 24, 2011 |
|
|
|
|
| 5,180,991 |
| ||
|
| Pike Electric, Inc. |
| B1 |
| BB- |
|
|
| ||
2,734,302 |
| Term Loan, 5.813%, maturing |
|
|
|
|
|
|
| ||
|
| July 01, 2012 |
|
|
|
|
| 2,768,480 |
| ||
1,642,918 |
| Term Loan, 5.875%, maturing |
|
|
|
|
|
|
| ||
|
| December 10, 2012 |
|
|
|
|
| 1,663,454 |
| ||
|
| Primary Energy Finance, LLC |
| Ba2 |
| BB- |
|
|
| ||
2,750,000 |
| Term Loan, 5.641%, maturing |
|
|
|
|
|
|
| ||
|
| August 23, 2012 |
|
|
|
|
| 2,782,656 |
| ||
|
| Reliant Energy Resources Corporation |
| B1 |
| B+ |
|
|
| ||
26,875,000 |
| Term Loan, 6.016%-6.089%, maturing |
|
|
|
|
|
|
| ||
|
| April 30, 2010 |
|
|
|
|
| 27,150,039 |
| ||
|
| Riverside Energy Center, LLC |
| Ba3 |
| BB- |
|
|
| ||
403,552 |
| Term Loan, 7.930%, maturing June 24, 2010 |
|
|
|
|
| 417,677 |
| ||
5,102,469 |
| Term Loan, 7.930%, maturing June 24, 2011 |
|
|
|
|
| 5,281,055 |
| ||
3,531,036 |
| Term Loan, 7.930%, maturing June 24, 2011 |
|
|
|
|
| 3,654,622 |
| ||
|
| Texas Genco, LLC |
| Ba2 |
| BB |
|
|
| ||
5,217,693 |
| Term Loan, 5.410%-5.490%, maturing |
|
|
|
|
|
|
| ||
|
| December 14, 2011 |
|
|
|
|
| 5,305,335 |
| ||
11,713,261 |
| Term Loan, 5.410%-5.669%, maturing |
|
|
|
|
|
|
| ||
|
| December 14, 2011 |
|
|
|
|
| 11,910,009 |
| ||
|
|
|
|
|
|
|
| 110,234,193 |
| ||
|
| Total Senior Loans |
|
|
|
|
| 2,344,265,260 |
| ||
|
|
|
|
|
|
|
| ||||
Equities and Other Assets: 0.2% |
|
|
|
|
|
|
| ||||
|
| Description |
|
|
| Value |
| |
| (@), (R) |
| Decision One Corporation (371,025 Common Shares) |
|
|
| 295,535 |
|
| (@), (R) |
| Galey & Lord, Inc. (49,843 Common Shares) |
|
|
| — |
|
| (@) |
| Maxim Crane Works (39,321 Common Shares) |
|
|
| 983,035 |
|
| (@), (R) |
| Murray’s Discount Auto Stores, Inc. (Escrow Interest) |
|
|
| 21,891 |
|
| (@), (R) |
| Neoplan USA Corporation (1,627 Common Shares) |
|
|
| — |
|
| (@), (R) |
| Neoplan USA Corporation (170,180 Series B Preferred Shares) |
|
|
| — |
|
| (@), (R) |
| Neoplan USA Corporation (101,690 Series C Preferred Shares) |
|
|
| — |
|
| (@), (R) |
| Neoplan USA Corporation (330,600 Series D Preferred Shares) |
|
|
| — |
|
See Accompanying Notes to Financial Statements
53
ING Senior Income Fund
PORTFOLIO OF INVESTMENTS as of August 31, 2005 (Unaudited) (continued)
|
| Description |
|
|
| Value |
| |
(@), (R) |
| New World Restaurant Group, Inc. (Warrants for 2,244 |
|
|
| $ | 30,788 |
|
(@), (R) |
| Norwood Promotional Products, Inc. (48,177 Common Shares) |
|
|
| — |
| |
(@), (R) |
| Safelite Glass Corporation (395,186 Common Shares) |
|
|
| 3,892,582 |
| |
(@), (R) |
| Safelite Realty Corporation (26,675 Common Shares) |
|
|
| 146,713 |
| |
(@), (R) |
| Targus Group, Inc. (Warrants for 47,931 Common Shares, Expires December 6, 2012) |
|
|
| — |
| |
|
| Total for Equities and Other Assets |
|
|
| 5,370,544 |
| |
|
| Total Investments |
| 114.7 | % | $ | 2,349,635,804 |
|
|
| Other Assets and Liabilities — Net |
| (14.7 | ) | (301,854,262 | ) | |
|
| Net Assets |
| 100.0 | % | $ | 2,047,781,542 |
|
* |
| Senior loans, while exempt from registration under the Securities Act of 1933, as amended, contain certain restrictions on resale and cannot be sold publicly. These senior loans bear interest (unless otherwise noted) at rates that float periodically at a margin above the London Inter-Bank Offered Rate (“LIBOR”) and other short-term rates. |
† |
| Bank Loans rated below Baa by considered to be below investment grade. |
NR |
| Not Rated |
(2) |
| The borrower filed for protection under Chapter 11 of the U.S. Federal Bankruptcy code. |
(3) |
| Loan is on non-accrual basis. |
(4) |
| Trade pending settlement. Contract rates do not take effect until settlement date. |
(@) |
| Non-income producing security. |
(R) |
| Restricted security. |
** |
| For Federal Income Tax purposes cost of investments is $2,323,738,188. Appreciation consists of the following: |
|
| Gross Unrealized Appreciation |
| $28,275,401 |
|
|
|
|
|
|
| Gross Unrealized Depreciation |
| (2,377,785 | ) |
|
|
|
|
|
| Net Unrealized Appreciation |
| $25,897,616 |
|
|
|
|
|
See Accompanying Notes to Financial Statements
54
ING Senior Income Fund
The Board considered and approved the annual renewal of the terms of Senior Income Fund’s Investment Management and Sub-Advisory Agreements in August 2004 for the period September 1, 2004 through August 31, 2005.
In order to align the Fund’s annual renewal period with those of other Funds in the ING Funds line-up, the Fund’s Board of Trustees (the “Board”) renewed the terms of these agreements for an “interim” period commencing on September 1, 2005 and ending on November 30, 2005. The Board based its determination of whether to approve renewing the terms of the Fund’s Agreements for the interim period on information provided throughout the year, beginning in August 2004 in anticipation of the 2004 15(c) contract renewal and continuing at periodic meetings thereafter, as well as updated information provided in July 2005. In determining that this information was sufficient to support the interim renewal, the Board took into consideration that it would meet again, at a meeting to be held in November 2005, and that the Board’s Contracts Committee would meet in October 2005, to consider whether to approve the Investment Management Agreement and Sub-Advisory Agreement for the Fund for a 12-month period beginning on December 1, 2005 and ending November 30, 2005. The interim and subsequent November renewals place the Fund on a December 1 renewal cycle, and result in all of the Funds under the purview of the Board being placed on the same annual renewal cycle on a going-forward basis.
In considering whether to approve the Investment Management Agreement and Sub-Advisory Agreement for the Fund for the period ended August 31, 2005 and the interim period ending November 30, 2005, the Board considered a number of factors they believed, in light of the legal advice furnished to them by their independent legal counsel, and their own business judgment, to be relevant.
In connection with their deliberations on August 31, 2004 relating to the Fund’s current Investment Management Agreement and Sub-Advisory Agreement, the Board, including the Independent Trustees, considered information that had been provided by the Investment Manager and ING IM to the Fund throughout the year at regular Board Meetings, as well as information furnished for the August 2004 Board Meeting, which was held to specifically consider annual renewal of the Investment Management and Sub-Advisory Agreements. This information included the following items: (1) FACT sheets for the Fund that provide information about the performance and expenses of the Fund and its peer group (“Selected Peer Group”), as well as information about the Fund’s investment portfolio, objective and strategies; (2) 15(c) Methodology Guide that describes how the FACT sheets were prepared, including how benchmarks and peer groups were selected and how profitability was determined; (3) responses to questions from legal counsel to the Independent Trustees; (4) copies of the forms of Investment Management Agreement and Sub-Advisory Agreement applicable to the Fund; (5) copies of the respective Forms ADV for the Fund’s Investment Manager and ING IM; (6) financial statements for the Fund’s Investment Manager and ING IM; and (7) other information relevant to their evaluations.
In connection with their deliberations on July 21, 2005 relating to the Fund’s current Investment Management Agreement and Sub-Advisory Agreement, the Board, including the Independent Trustees, further considered information that had been provided by the Fund’s Investment Manager and ING IM throughout the year at regular Board Meetings, as well as information furnished for the July 2005 Board Meeting, which was held to specifically consider such renewals for the interim period ending November 30, 2005. This information included the following items: (1) updated performance information through May 31, 2005 with respect to the Fund; (2) responses to questions from legal counsel to the Independent Trustees; (3) copies of the forms of Investment Management Agreement and Sub-Advisory Agreement applicable to the Fund; (4) management’s representations that there were no changes in the management fee rate and expense ratio borne by the Fund since the August approval; and (5) other information relevant to their evaluations.
55
ING Senior Income Fund
ADVISORY CONTRACT APPROVAL DISCUSSION (Unaudited)
The Board was also provided, in August 2004, with narrative summaries addressing key factors the Board customarily considers in evaluating the renewal of Investment Management and Sub-Advisory Agreements, including an analysis for the Fund of how performance and fees compare to its Selected Peer Group and designated benchmark.
The following paragraphs outline certain of the specific factors that the Board considered, and the conclusions reached, in relation to renewing the Fund’s current Investment Management Agreement and Sub-Advisory Agreement.
In its renewal deliberations for the Fund in August 2004, the Board considered that: (1) the management fee for the Fund is below the median and the average management fees of the funds in its Selected Peer Group, (2) the expense ratio for the Fund is equal to the median and below the average expense ratios of the funds in its Selected Peer Group, and (3) the portfolio managers have been consistent in their investment approach maintaining their fundamental credit discipline and focusing on higher quality securities that allow them to provide superior risk-adjusted returns.
In considering whether to approve the Fund’s interim period renewal, in July 2005 the Board further considered that, based on performance data for the periods ended May 31, 2005: (1) the Fund outperformed its primary benchmark for the three-year period ended May 31, 2005, but underperformed for the one-year, year-to-date, three-month and one-month periods; (2) the Fund underperformed the Lipper Category median for the three-year and one-year periods ended May 31, 2005, and outperformed for year-to-date, three-month and one-month periods; and (3) the Fund underperformed the Morningstar Category average for the one-month period ended May 31, 2005, and outperformed it for the three-year, one-year, year-to-date and three-month periods. The Board also noted that there would be further opportunity for review of performance and other relevant factors in the course of deliberations for the next annual renewal in November 2005.
After deliberations based on the above-listed factors, among others (including the Selected Peer Group data considered by the Board in August 2004 and representations that there had been no changes in the management fee rate and expense ratio borne by the Fund since the August approval), the Board renewed the Investment Management Agreement and Sub-Advisory Agreement for the Fund, for the period ended August 31, 2005 and the interim period ending November 30, 2005, because, among other conclusions: (1) the management fee of the Fund is competitive with that of its Selected Peer Group, (2) the expense ratio for the Fund is competitive with that of its Selected Peer Group, and (3) the Fund’s long-term relative performance has been reasonable.
56
Investment Manager |
| Distributor |
ING Investments, LLC |
| ING Funds Distributor, LLC |
7337 East Doubletree Ranch Road |
| 7337 East Doubletree Ranch Road |
Scottsdale, Arizona 85258 |
| Scottsdale, Arizona 85258 |
|
| 1-800-334-3444 |
Sub-Adviser |
|
|
ING Investment Management Co. |
| Transfer Agent |
230 Park Avenue |
| DST Systems, Inc. |
New York, New York 10169 |
| P.O. Box 219368 |
|
| Kansas City, Missouri 64141 |
Administrator |
|
|
ING Funds Services, LLC |
| Custodian |
7337 East Doubletree Ranch Road |
| State Street Bank and Trust Company |
Scottsdale, Arizona 85258 |
| 801 Pennsylvania Avenue |
1-800-992-0180 |
| Kansas City, Missouri 64105 |
|
|
|
Institutional Investors and Analysts |
| Legal Counsel |
Call ING Senior Income Fund |
| Dechert LLP |
1-800-336-3436 |
| 1775 I Street, N.W. |
|
| Washington, D.C. 20006 |
Written Requests |
|
|
Please mail all account inquiries and other comments to: |
|
|
ING Senior Income Fund |
|
|
c/o ING Funds Services, LLC |
|
|
7337 East Doubletree Ranch Road |
|
|
Scottsdale, Arizona 85258 |
|
|
Toll-Free Shareholder Information
Call us from 9:00 a.m. to 7:00 p.m. Eastern time on any business day for account or other information, at (800) 992-0180
For more complete information, or to obtain a prospectus on any ING fund, please call your Investment Professional or ING Funds Distributor, LLC at (800) 992-0180 or log on to www.ingfunds.com. The prospectus should be read carefully before investing. Consider the fund’s investment objectives, risks, charges and expenses carefully before investing. The prospectus contains this information and other information about the fund.
|
| PRSAR-USIF |
| (0805-102805) |

ITEM 2. CODE OF ETHICS.
Not required for semi-annual filing.
ITEM 3. AUDIT COMMITTEE FINANCIAL EXPERT.
Not required for semi-annual filing.
ITEM 4. PRINCIPAL ACCOUNTANT FEES AND SERVICES.
Not required for semi-annual filing.
ITEM 5. AUDIT COMMITTEE OF LISTED REGISTRANTS.
Not required for semi-annual filing.
ITEM 6. SCHEDULE OF INVESTMENTS.
Schedule is included as part of the report to shareholders filed under Item 1 of
this Form.
ITEM 7. DISCLOSURE OF PROXY VOTING POLICIES AND PROCEDURES FOR CLOSED-END MANAGEMENT INVESTMENT COMPANIES.
Not required for semi-annual filing.
ITEM 8. PORTFOLIO MANAGERS OF CLOSED-END MANAGEMENT INVESTMENT COMPANIES.
Not applicable.
ITEM 9. PURCHASES OF EQUITY SECURITIES BY CLOSED-END MANAGEMENT INVESTMENT COMPANY AND AFFILIATED PURCHASERS.
Not applicable.
ITEM 10. SUBMISSION OF MATTERS TO A VOTE OF SECURITY HOLDERS.
The Board has a Nominating Committee for the purpose of considering and presenting to the Board candidates it proposes for nomination to fill Independent Trustee vacancies on the Board. The Committee currently consists of all Independent Trustees of the Board (6 individuals). The Nominating Committee operates pursuant to a Charter approved by the Board. The primary purpose of the Nominating Committee is to consider and present to the Board the candidates it proposes for nomination to fill vacancies on the Board. In evaluating candidates, the Nominating Committee may consider a variety of factors, but it has not at this time set any specific minimum qualifications that must be met. Specific qualifications of candidates for Board membership will be based on the needs of the Board at the time of nomination.
The Nominating Committee is willing to consider nominations received from shareholders and shall assess shareholder nominees in the same manner as it reviews its own nominees. A shareholder nominee for director should be submitted in writing to the Fund’s Secretary. Any such shareholder nomination should include at a minimum the following information as to each individual proposed for nomination as trustee: such individual’s written consent to be named in the proxy statement as a nominee (if nominated) and to serve as a trustee (if elected), and all information relating to such individual that is required to be disclosed in the solicitation of proxies for election of trustees, or is otherwise required, in each case under applicable federal securities laws, rules and regulations.
The Secretary shall submit all nominations received in a timely manner to the Nominating Committee. To be timely, any such submission must be delivered to the Fund’s Secretary not earlier than the 90th day prior to such meeting and not later than the close of business on the later of the 60th day prior to such meeting or the 10th day following the day on which public announcement of the date of the meeting is first made, by either disclosure in a press release or in a document publicly filed by the Fund with the Securities and Exchange Commission.
ITEM 11. CONTROLS AND PROCEDURES.
(a) Based on our evaluation conducted within 90 days of the filing date, hereof, the design and operation of the registrant’s disclosure controls and procedures are effective to ensure that material information relating to the registrant is made known to the certifying officers by others within the appropriate entities, particularly during the period in which Forms N-CSR are being prepared, and the registrant’s disclosure controls and procedures allow timely preparation and review of the information for the registrant’s Form N-CSR and the officer certifications of such Form N-CSR.
(b) There were no significant changes in the registrant’s internal controls that occurred during the second fiscal quarter of the period covered by this report that has materially affected, or is reasonably likely to materially affect, the registrant’s internal control over financial reporting.
ITEM 12. EXHIBITS.
(a)(1) The Code of Ethics is not required for the semi-annual filing.
(a)(2) A separate certification for each principal executive officer and principal financial officer of the registrant as required by Rule 30a-2 under the Act (17 CFR 270.30a-2) is attached hereto as EX-99.CERT.
(a)(3) Not required for semi-annual filing.
(b) The officer certifications required by Section 906 of the Sarbanes-Oxley Act of 2002 are attached hereto as EX-99.906CERT
SIGNATURES
Pursuant to the requirements of the Securities Exchange Act of 1934 and the Investment Company Act of 1940, the registrant has duly caused this report to be signed on its behalf by the undersigned, thereunto duly authorized.
(Registrant): ING Senior Income Fund
By | /s/ | James M. Hennessy |
| |
|
| James M. Hennessy | ||
|
| President and Chief Executive Officer | ||
|
| |||
|
| |||
Date: | November 3, 2005 |
| ||
Pursuant to the requirements of the Securities Exchange Act of 1934 and the Investment Company Act of 1940, this report has been signed below by the following persons on behalf of the registrant and in the capacities and on the dates indicated.
By | /s/ | James M. Hennessy |
| ||
|
| James M. Hennessy | |||
|
| President and Chief Executive Officer | |||
|
| ||||
Date: | November 3, 2005 |
| |||
|
| ||||
|
| ||||
By | /s/ | Todd Modic |
| ||
|
| Todd Modic | |||
|
| Senior Vice President and Chief Financial Officer | |||
|
| ||||
|
| ||||
Date: | November 3, 2005 |
| |||