OMB APPROVAL
OMB Number: 3235-0570
Expires: August 31, 2010
Estimated average burden hours per response: 18.9
UNITED STATES
SECURITIES AND EXCHANGE COMMISSION
Washington, D.C. 20549
FORM N-CSR
CERTIFIED SHAREHOLDER REPORT OF
REGISTERED MANAGEMENT INVESTMENT COMPANIES
Investment Company Act file number: 811-10223
ING Senior Income Fund
(Exact name of registrant as specified in charter)
7337 E. Doubletree Ranch Rd., Scottsdale, AZ | | 85258 |
(Address of principal executive offices) | | (Zip code) |
The Corporation Trust Company, 1209 Orange
Street, Wilmington, DE 19801
(Name and address of agent for service)
Registrant’s telephone number, including area code: 1-800-992-0180
Date of fiscal year end: | February 28 |
| |
Date of reporting period: | August 31, 2007 |
Item 1. Reports to Stockholders.
The following is a copy of the report transmitted to stockholders pursuant to Rule 30e-1 under the Act (17 CFR 270.30e-1):

Funds
Semi-Annual Report
August 31, 2007
ING Senior Income Fund
 E-Delivery Sign-up – details inside
This report is submitted for general information to shareholders of the ING Funds. It is not authorized for distribution to prospective shareholders unless accompanied or preceded by a prospectus which includes details regarding the funds' investment objectives, risks, charges, expenses and other information. This information should be read carefully.

ING Senior Income Fund
SEMI-ANNUAL REPORT
August 31, 2007
Table of Contents
| Portfolio Managers' Report | | | 3 | | |
|
| Statement of Assets and Liabilities | | | 8 | | |
|
| Statement of Operations | | | 10 | | |
|
| Statements of Changes in Net Assets | | | 11 | | |
|
| Statement of Cash Flows | | | 12 | | |
|
| Financial Highlights | | | 13 | | |
|
| Notes to Financial Statements | | | 15 | | |
|
| Additional Information | | | 24 | | |
|
| Portfolio of Investments | | | 25 | | |
|
 Go Paperless with E-Delivery!
Sign up now for on-line prospectuses, fund reports, and proxy statements. In less than five minutes, you can help reduce paper mail and lower fund costs.
Just go to www.ingfunds.com, click on the E-Delivery icon from the home page, follow the directions and complete the quick 5 Steps to Enroll.
You will be notified by e-mail when these communications become available on the internet. Documents that are not available on the internet will continue to be sent by mail.
(THIS PAGE INTENTIONALLY LEFT BLANK)
ING Senior Income Fund
PORTFOLIO MANAGERS' REPORT
Dear Shareholders:
ING Senior Income Fund (the "Fund") is a continuously offered, diversified, closed-end management investment company that seeks to provide investors with a high level of monthly income. The Fund seeks to achieve this objective by investing in a professionally managed portfolio comprised primarily of senior loans.
PORTFOLIO CHARACTERISTICS
AS OF AUGUST 31, 2007 | |
| Net Assets | | $ | 1,998,773,510 | | |
| Total Assets | | $ | 2,489,989,304 | | |
| Assets Invested in Senior Loans | | $ | 2,415,645,072 | | |
| Senior Loans Represented | | | 675 | | |
| Average Amount Outstanding per Loan | | $ | 3,578,733 | | |
| Industries Represented | | | 38 | | |
| Average Loan Amount per Industry | | $ | 63,569,607 | | |
| Portfolio Turnover Rate | | | 41 | % | |
| Weighted Average Days to Interest Rate Reset | | | 42 | | |
| Average Loan Final Maturity | | | 66 months | | |
| Total Leverage as a Percentage of Total Assets | | | 16.9 | % | |
PERFORMANCE SUMMARY
During the six months ended August 31, 2007, the Fund's Class A and Q shares each distributed total dividends from income of $0.52, resulting in an average annualized distribution rate of 6.82%(1) and 6.85%(1), respectively. During the same period, the Fund's Class B and Class C shares each distributed total dividends from income of $0.49, resulting in an average annualized distribution rate of 6.33%(1) and 6.32%(1), respectively.
The Fund's total return for the six months ended August 31, 2007, for each of the share classes, excluding sales charges, was (1.71)% on Class A, (1.96)% on Class B, (1.96)% on Class C and (1.71)% on Class Q. The Fund's net returns were slightly less than the returns of the S&P/LSTA Leveraged Loan Index ("LLI"), which had a gross return of (1.35)%.
MARKET REVIEW
The global senior loan market experienced its most severe technical correction on record during the Fund's fiscal half-year, driven by a rapid drop in liquidity as credit market investors grappled with uncertainty created by the sub-prime mortgage implosion. We should emphasize that the Fund does not own, nor has it ever invested significantly in, residential or commercial mortgage-backed or asset-backed securities. The Fund's investment strategy continues to concentrate on traditional, secured floating rate senior loans to corporate issuers.
The overall tone and performance of the senior loan market has improved since the liquidity squeeze, enough to push the year-to-date total return of the S&P/LSTA Leveraged Loan index into positive territory. There were many factors at play in the improved sentiment, including a sense that the overhang of underwritten and unsold loans ultimately will be absorbed by the market,
(1) The distribution rate is calculated by annualizing dividends declared during the period and dividing the resulting annualized dividend by the Fund's average month-end net asset value (in the case of net asset value) or the average month-end New York Stock Exchange Composite closing price (in the case of Market). The distribution rate is based solely on the actual dividends and distributions, which are made at the discretion of management. The distribution rate may or may not include all investment income and ordinarily will not include capital gains or losses, if any.
3
ING Senior Income Fund
PORTFOLIO MANAGERS' REPORT (continued)
and a better tone in the high yield bond and equity markets due in part to the widely held assumption that the Federal Reserve Board ("Fed") would stand by to ensure the liquidity of U.S. capital markets.
Although loan prices were highly volatile due to these unprecedented technical developments, the fundamental credit condition of the loan market (as measured by trailing default rates) remained solid. While up fractionally as compared to the previous quarter, the S&P trailing 12-month default rate (by issuer) closed August at 0.42%, well below the historical average.
USE OF LEVERAGE
The Fund seeks to prudently utilize financial leverage in order to increase the yield to shareholders. As of August 31, 2007, the Fund had $420 million outstanding under a $750 million revolving credit facility. The use of leverage for investment purposes increases both investment opportunity and investment risk.
OUTLOOK
While uncertainty still looms over the capital markets, the Fed's resolve and less-frequent bad news have bolstered confidence. We believe the near-term direction of the loan market will be dictated by a few key developments: the direction of the credit markets overall (certainly, to be influenced by Fed decisions) and, within the senior loan market, the continued ability of banks to manage the supply of new loans coming to market. The latter is critical to maintaining a healthy supply/demand balance; so far, the supply has been amazingly well controlled. Longer term, the general health of the major global economies, and its effects on non-investment grade issuers, will play a central role in loan market performance.
TOP TEN SENIOR LOAN ISSUERS
AS OF AUGUST 31, 2007
AS A PERCENTAGE OF: | |
| | | TOTAL
ASSETS | | NET
ASSETS | |
| Charter Communications Operating, LLC | | | 2.6 | % | | | 3.3 | % | |
| Metro-Goldwyn-Mayer, Inc. | | | 1.9 | % | | | 2.4 | % | |
| Georgia Pacific Corporation | | | 1.8 | % | | | 2.3 | % | |
| Cequel Communications, LLC | | | 1.8 | % | | | 2.2 | % | |
| CHS/Community Health Systems, Inc. | | | 1.8 | % | | | 2.2 | % | |
| CSC Holdings, Inc. | | | 1.5 | % | | | 1.8 | % | |
| Idearc, Inc. | | | 1.4 | % | | | 1.7 | % | |
| HCA, Inc. | | | 1.3 | % | | | 1.6 | % | |
| ARAMARK Corporation | | | 1.2 | % | | | 1.5 | % | |
| Univision Communications, Inc. | | | 1.2 | % | | | 1.5 | % | |
TOP TEN INDUSTRY SECTORS
AS OF AUGUST 31, 2007
AS A PERCENTAGE OF: | |
| | | TOTAL
ASSETS | | NET
ASSETS | |
| North American Cable | | | 10.8 | % | | | 13.4 | % | |
| Healthcare, Education and Childcare | | | 10.1 | % | | | 12.6 | % | |
| Printing & Publishing | | | 6.5 | % | | | 8.1 | % | |
| Chemicals, Plastics & Rubber | | | 5.9 | % | | | 7.4 | % | |
| Oil & Gas | | | 4.9 | % | | | 6.1 | % | |
| Utilities | | | 4.7 | % | | | 5.9 | % | |
| Retail Stores | | | 4.7 | % | | | 5.9 | % | |
| Leisure, Amusement, Entertainment | | | 4.0 | % | | | 5.0 | % | |
| Data and Internet Services | | | 4.0 | % | | | 4.9 | % | |
| Containers, Packaging & Glass | | | 3.0 | % | | | 3.7 | % | |
4
ING Senior Income Fund
PORTFOLIO MANAGERS' REPORT (continued)
Our investment process remains squarely focused on seeking to provide attractive risk-adjusted returns over a full credit cycle through systematic, thorough credit underwriting, a high level of issuer and industry diversification and rigorous, ongoing monitoring. We continue to closely scrutinize both the underlying performance of our portfolio companies and the relevant economic data for signs of any meaningful shift in the strength of the global economy. Although headwinds are present, we are confident that growth will be strong enough to allow leveraged issuers to remain fundamentally sound from a credit perspective. Should that happen, we believe demand will remain strong as investors recognize the value proposition of loans trading at current levels.
 | |  | |
|
Jeffrey A. Bakalar
Senior Vice President
Senior Portfolio Manager
ING Investment Management Co. | | Daniel A. Norman
Senior Vice President
Senior Portfolio Manager
ING Investment Management Co. | |
|
 | |  | |
|
ING Senior Income Fund
October 12, 2007
5
ING Senior Income Fund
PORTFOLIO MANAGERS' REPORT (continued)
| | | Average Annual Total Net Returns for the
Periods Ended August 31, 2007 | |
| | | 1 Year | | 3 Years | | 5 Years | | April 2, 2001 | |
| Including Sales Charge: | |
| Class A(1) | | | (0.06 | )% | | | 2.55 | % | | | 4.42 | % | | | 5.10 | % | |
| Class B(2) | | | (0.85 | )% | | | 3.07 | % | | | 4.70 | % | | | 4.53 | % | |
| Class C(3) | | | 1.07 | % | | | 3.68 | % | | | 4.89 | % | | | 4.55 | % | |
| Class Q | | | 2.55 | % | | | 4.19 | % | | | 5.39 | % | | | 5.03 | % | |
| Excluding Sales Charge: | |
| Class A | | | 2.53 | % | | | 4.22 | % | | | 5.44 | % | | | 5.10 | % | |
| Class B | | | 2.03 | % | | | 3.66 | % | | | 4.87 | % | | | 4.53 | % | |
| Class C | | | 2.03 | % | | | 3.68 | % | | | 4.89 | % | | | 4.55 | % | |
| Class Q | | | 2.55 | % | | | 4.19 | % | | | 5.39 | % | | | 5.03 | % | |
| S&P/LSTA Leveraged Loan Index(4) | | | 2.66 | % | | | 4.60 | % | | | 5.70 | % | | | 4.83 | % | |
Total net returns reflect that ING Investments, LLC (the Fund's Investment Adviser) may have waived, reimbursed or recouped fees and expenses otherwise payable by the Fund.
Performance data represents past performance and is no assurance of future results. Investment return and principal value of an investment in the Fund will fluctuate. Shares, when sold, may be worth more or less than their original cost. The Fund's future performance may be lower or higher than the performance data shown. Please log on to www.ingfunds.com or call (800) 992-0180 to get performance through the most recent month-end.
This report contains statements that may be "forward-looking" statements. Actual results may differ materially from those projected in the "forward-looking" statements.
The views expressed in this report reflect those of the portfolio managers, only through the end of the period as stated on the cover. The portfolio managers' views are subject to change at any time based on market and other conditions.
Fund holdings are subject to change daily.
(1) Return calculations for the period beginning April 2, 2001 through June 30, 2002, reflect no deduction of a front-end sales charge. Return calculations for the period beginning July 1, 2002 through October 10, 2004, reflect deduction of the maximum Class A sales charge of 4.75%. Return calculations with a starting date after October 11, 2004 are based on a 2.50% sales charge. There is no front-end sales charge if you purchase Class A common shares in an amount of $1 million or more. However, the shares will be subject to a 1.00% Early Withdrawal Charge ("EWC") if they are repurchased by the Fund within one year of purchase.
(2) Class B maximum EWC is 3% in the first year, declining to 1% in the fifth year and eliminated thereafter.
(3) Class C maximum EWC is 1% for the first year.
(4) Source: S&P/Loan Syndications and Trading Association. The LLI Index ("LLI") is an unmanaged total return index that captures accrued interest, repayments, and market value changes. It represents a broad cross section of leveraged loans syndicated in the United States, including dollar-denominated loans to overseas issuers. Standard & Poor's and the Loan Syndications and Trading Association ("LSTA") conceived the LLI to establish a performance benchmark for the syndicated leveraged loan industry. An investor cannot invest directly in an index. Since inception performance for the index is shown from March 31, 2001 for Class A, B, C and Class Q common shares.
6
ING Senior Income Fund
PORTFOLIO MANAGERS' REPORT (continued)
YIELDS AND DISTRIBUTIONS RATES
| | | 30-Day SEC Yields(1) | | Average Annualized Distribution Rates(2) | |
| | | Class A | | Class B | | Class C | | Class Q | | Class A | | Class B | | Class C | | Class Q | |
| August 31, 2007 | | | 6.64 | % | | | 6.31 | % | | | 6.31 | % | | | 6.78 | % | | | 6.82 | % | | | 6.33 | % | | | 6.32 | % | | | 6.85 | % | |
| February 28, 2007 | | | 6.46 | % | | | 6.08 | % | | | 6.08 | % | | | 6.59 | % | | | 6.57 | % | | | 6.09 | % | | | 6.08 | % | | | 6.60 | % | |
(1) Yield is calculated by dividing the Fund's net investment income per share for the most recent thirty days by the net asset value. Yield calculations do not include any commissions or sales charges, and are compounded for six months and annualized for a twelve-month period to derive the Fund's yield consistent with the Securities Exchange Commission standardized yield formula for open-end investment companies.
(2) Distribution Rates are calculated by annualizing dividends declared during the period (i.e., by dividing the monthly dividend amount by the number of days in the month and multiplying by the number of days in the fiscal year) and then dividing the resulting annualized dividend by the month-ending NAV.
Risk is inherent in all investing. The following are the principal risks associated with investing in the Fund. This is not, and is not intended to be, a description of all risks of investing in the Fund. A more detailed description of the risks of investing in the Fund is contained in the Fund's current prospectus.
Credit Risk: The Fund invests a substantial portion of its assets in below investment grade senior loans and other below investment grade assets. Below investment grade loans involve a greater risk that borrowers may not make timely payment of the interest and principal due on their loans. They also involve a greater risk that the value of such loans could decline significantly. If borrowers do not make timely payments of the interest due on their loans, the yield on the Fund's common shares will decrease. If borrowers do not make timely payment of the principal due on their loans, or if the value of such loans decreases, the value of the Fund's NAV will decrease.
Interest Rate Risk: Changes in short-term market interest rates will directly affect the yield on the Fund's common shares. If short-term market interest rates fall, the yield on the Fund will also fall. To the extent that the interest rate spreads on loans in the Fund experience a general decline, the yield on the Fund will fall and the value of the Fund's assets may decrease, which will cause the Fund's value to decrease. Conversely, when short-term market interest rates rise, because of the lag between changes in such short-term rates and the resetting of the floating rates on assets in the Fund's portfolio, the impact of rising rates will be delayed to the extent of such lag.
Leverage Risk: The Fund's use of leverage through borrowings or the issuance of preferred shares can adversely affect the yield on the Fund's Common Shares. To the extent that the Fund is unable to invest the proceeds from the use of leverage in assets which pay interest at a rate which exceeds the rate paid on the leverage, the yield on the Fund's Common Shares will decrease. In addition, in the event of a general market decline in the value of assets such as those in which the Fund invests, the effect of that decline will be magnified in the Fund because of the additional assets purchased with the proceeds of the leverage.
No Daily Redemptions: The Fund does not redeem its shares on a daily basis and there is no market for its shares. Shareholders can only redeem their shares once a month, and if redemption requests from all shareholders exceed 5% of the Fund's total assets in a particular month, the Fund may reduce such requests pro rata and redeem only an amount equal to 5% of its total assets.
7
ING Senior Income Fund
STATEMENT OF ASSETS AND LIABILITIES as of August 31, 2007 (Unaudited)
| ASSETS: | |
| Investments in securities at value (Cost $2,502,891,063) | | $ | 2,420,098,284 | | |
| Cash | | | 7,284,696 | | |
| Foreign currencies at value (Cost $6,733,899) | | | 6,814,391 | | |
| Receivables: | |
| Investment securities sold | | | 25,277,433 | | |
| Fund shares sold | | | 4,098,006 | | |
| Interest | | | 25,472,072 | | |
| Other | | | 53,529 | | |
| Unrealized appreciation on foreign currency contracts | | | 836,836 | | |
| Prepaid expenses | | | 53,542 | | |
| Prepaid arrangement fees on notes payable | | | 515 | | |
| Total assets | | | 2,489,989,304 | | |
| LIABILITIES: | |
| Payable for investment securities purchased | | | 61,550,824 | | |
| Notes payable | | | 420,000,000 | | |
| Accrued interest payable | | | 1,818,044 | | |
| Deferred arrangement fees on senior loans | | | 327,855 | | |
| Payable to affilates | | | 2,686,093 | | |
| Income distribution payable | | | 3,882,804 | | |
| Unrealized depreciation on foreign currency contracts | | | 564,707 | | |
| Accrued trustees fees | | | 65,566 | | |
| Other accrued expenses and liabilities | | | 319,901 | | |
| Total liabilities | | | 491,215,794 | | |
| NET ASSETS | | $ | 1,998,773,510 | | |
| NET ASSETS CONSIST OF: | |
| Paid-in capital | | $ | 2,085,062,531 | | |
| Distributions in excess of net investment income | | | (5,455,989 | ) | |
| Accumulated net realized gain on investments | | | 1,537,748 | | |
Net unrealized depreciation on investments
and foreign currency related transactions | | | (82,370,780 | ) | |
| NET ASSETS | | $ | 1,998,773,510 | | |
See Accompanying Notes to Financial Statements
8
ING Senior Income Fund
STATEMENT OF ASSETS AND LIABILITIES as of August 31, 2007 (Unaudited) (continued)
| Class A: | |
| Net assets | | $ | 926,909,601 | | |
| Shares authorized | | | unlimited | | |
| Par value | | $ | 0.01 | | |
| Shares outstanding | | | 62,672,238 | | |
| Net asset value and redemption price per share | | $ | 14.79 | | |
| Maximum offering price per share (2.50%)(1) | | $ | 15.17 | | |
| Class B: | |
| Net assets | | $ | 99,358,827 | | |
| Shares authorized | | | unlimited | | |
| Par value | | $ | 0.01 | | |
| Shares outstanding | | | 6,734,446 | | |
| Net asset value and redemption price per share(2) | | $ | 14.75 | | |
| Class C: | |
| Net assets | | $ | 866,888,011 | | |
| Shares authorized | | | unlimited | | |
| Par value | | $ | 0.01 | | |
| Shares outstanding | | | 58,680,853 | | |
| Net asset value and redemption price per share(2) | | $ | 14.77 | | |
| Class Q: | |
| Net assets | | $ | 105,617,071 | | |
| Shares authorized | | | unlimited | | |
| Par value | | $ | 0.01 | | |
| Shares outstanding | | | 7,179,661 | | |
| Net asset value and redemption price per share | | $ | 14.71 | | |
(1) Maximum offering price is computed ar 100/97.50 of net asset value. On purchases of $100,000 or more, the offering price is reduced.
(2) Redemption price per share may be reduced for any applicable contingent deferred sales charge.
See Accompanying Notes to Financial Statements
9
ING Senior Income Fund
STATEMENT OF OPERATIONS for the Six Months Ended August 31, 2007 (Unaudited)
| INVESTMENT INCOME: | |
| Interest | | $ | 94,143,217 | | |
| Arrangement fees earned | | | 326,117 | | |
| Other | | | 1,467,076 | | |
| Total investment income | | | 95,936,410 | | |
| EXPENSES: | |
| Investment management fees | | | 9,675,042 | | |
| Administration fees | | | 1,209,380 | | |
| Distribution and service fees: | |
| Class A | | | 1,244,644 | | |
| Class B | | | 541,851 | | |
| Class C | | | 3,483,364 | | |
| Class Q | | | 165,911 | | |
| Transfer agent fees: | |
| Class A | | | 156,792 | | |
| Class B | | | 17,052 | | |
| Class C | | | 146,253 | | |
| Class Q | | | 20,855 | | |
| Shareholder reporting expense | | | 147,200 | | |
| Interest expense | | | 7,791,409 | | |
| Custodian fees | | | 527,789 | | |
| Credit facility fees | | | 15,778 | | |
| Professional fees | | | 97,680 | | |
| Trustees' fees | | | 66,800 | | |
| Registration fees | | | 107,683 | | |
| Postage expense | | | 294,400 | | |
| Insurance expense | | | 14,122 | | |
| Miscellaneous expense | | | 46,717 | | |
| Total expenses | | | 25,770,722 | | |
| Less: | |
| Net waived and reimbursed fees | | | (135,463 | ) | |
| Net expenses | | | 25,635,259 | | |
| Net investment income | | | 70,301,151 | | |
REALIZED AND UNREALIZED GAIN (LOSS) ON INVESTMENTS AND
FOREIGN CURRENCY RELATED TRANSACTIONS: | | | | | |
| Net realized gain (loss) on: | |
| Investments | | | 9,437,536 | | |
| Foreign currency related transactions | | | (3,804,479 | ) | |
| Net realized gain on investments and foreign currency related transactions | | | 5,633,057 | | |
| Net change in unrealized appreciation or depreciation on: | |
| Investments | | | (115,607,268 | ) | |
| Foreign currency related transactions | | | 1,002,424 | | |
Net change in unrealized appreciation or depreciation on investments and
foreign currency related transactions | | | (114,604,844 | ) | |
Net realized and unrealized gain (loss) on investments
and foreign currency related transactions | | | (108,971,787 | ) | |
| Net decrease in net assets resulting from operations | | $ | (38,670,636 | ) | |
See Accompanying Notes to Financial Statements
10
ING Senior Income Fund
STATEMENTS OF CHANGES IN NET ASSETS (Unaudited)
| | | Six Months Ended | | Year Ended | |
| | | August 31, | | February 28, | |
| | | 2007 | | 2007 | |
| INCREASE IN NET ASSETS FROM OPERATIONS: | |
| Net investment income | | $ | 70,301,151 | | | $ | 136,929,195 | | |
Net realized gain (loss) on investments and foreign
currency related transactions | | | 5,633,057 | | | | (1,310,799 | ) | |
Net change in unrealized appreciation or
depreciation on investments and foreign currency
related transactions | | | (114,604,844 | ) | | | 4,713,875 | | |
Net increase (decrease) in net assets resulting
from operations | | | (38,670,636 | ) | | | 140,332,271 | | |
| DISTRIBUTIONS TO SHAREHOLDERS: | |
| From net investment income | |
| Class A | | | (33,670,227 | ) | | | (64,626,473 | ) | |
| Class B | | | (3,407,564 | ) | | | (7,057,368 | ) | |
| Class C | | | (29,140,780 | ) | | | (56,290,853 | ) | |
| Class Q | | | (4,512,818 | ) | | | (10,499,863 | ) | |
| Decrease in net assets from distributions to shareholders | | | (70,731,389 | ) | | | (138,474,557 | ) | |
| CAPITAL SHARE TRANSACTIONS: | |
| Net proceeds from sale of shares | | | 335,308,059 | | | | 915,801,787 | | |
| Dividends reinvested | | | 47,512,243 | | | | 91,655,109 | | |
| | | | 382,820,302 | | | | 1,007,456,896 | | |
| Cost of shares repurchased | | | (448,158,846 | ) | | | (982,810,449 | ) | |
Net increase (decrease) in net assets resulting from
capital share transactions | | | (65,338,544 | ) | | | 24,646,447 | | |
| Net increase (decrease) in net assets | | | (174,740,569 | ) | | | 26,504,161 | | |
| NET ASSETS: | |
| Beginning of period | | | 2,173,514,079 | | | | 2,147,009,918 | | |
| End of period | | $ | 1,998,773,510 | | | $ | 2,173,514,079 | | |
Distributions in excess of net investment income
at end of period | | $ | (5,455,989 | ) | | $ | (5,025,751 | ) | |
See Accompanying Notes to Financial Statements
11
ING Senior Income Fund
STATEMENT OF CASH FLOWS for the Six Months Ended August 31, 2007 (Unaudited)
INCREASE (DECREASE) IN CASH
Cash Flows From Operating Activities: | |
| Interest received | | $ | 87,691,703 | | |
| Arrangement fee received | | | 171,632 | | |
| Other income received | | | 1,467,076 | | |
| Interest paid | | | (7,328,480 | ) | |
| Other operating expenses paid | | | (17,777,625 | ) | |
| Purchases of securities | | | (1,124,297,811 | ) | |
| Proceeds from sale of securities | | | 982,048,947 | | |
| Net cash used in operating activities | | | (78,024,558 | ) | |
| Cash Flows From Financing Activities: | |
| Distributions paid to common shareholders | | | (22,731,702 | ) | |
| Proceeds from capital shares sold | | | 341,785,615 | | |
| Disbursements for capital shares repurchased | | | (448,158,846 | ) | |
| Net issuance of notes payable | | | 183,000,000 | | |
| Net cash flows provided by financing activities | | | 53,895,067 | | |
| Net decrease in cash | | | (24,129,491 | ) | |
| Cash at beginning of period | | | 31,414,187 | | |
| Cash at end of period | | $ | 7,284,696 | | |
Reconciliation of Net Decrease in Net Assets Resulting from
Operations to Net Cash Used in Operating Activities: | | | | | |
| Net decrease in net assets resulting from operations | | $ | (38,670,636 | ) | |
Adjustments to reconcile net decrease in net assets resulting
from operations to net cash used in operating activities: | | | | | |
| Change in unrealized appreciation or depreciation on investments | | | 115,607,268 | | |
| Change in unrealized appreciation on foreign currencies | | | (142,596 | ) | |
| Change in unrealized appreciation or depreciation on forward currency contracts | | | (859,828 | ) | |
| Net accretion/amortization of discounts on investments | | | (2,995,565 | ) | |
| Realized gain on sale of investments and foreign currency related transactions | | | (5,633,057 | ) | |
| Purchases of securities | | | (1,124,297,811 | ) | |
| Proceeds from sale of securities | | | 982,048,947 | | |
| Increase in other assets | | | (3,026 | ) | |
| Increase in interest receivable | | | (3,455,949 | ) | |
| Decrease in prepaid arrangement fees on notes payable | | | 15,778 | | |
| Decrease in prepaid expenses | | | 80,993 | | |
| Decrease in deferred arrangement fees on senior loans | | | (154,485 | ) | |
| Increase in accrued interest payable | | | 462,929 | | |
| Increase in payable to affiliate | | | 177,282 | | |
| Increase in accrued trustee fees | | | 22,055 | | |
| Decrease in accrued expenses | | | (226,857 | ) | |
| Total adjustments | | | (39,353,922 | ) | |
| Net cash used in operating activities | | $ | (78,024,558 | ) | |
| Non Cash Financing Activities | |
| Receivable for shares sold | | $ | 4,098,006 | | |
| Reinvestment of dividends | | $ | 47,512,243 | | |
See Accompanying Notes to Financial Statements
12
ING SENIOR INCOME FUND (UNAUDITED) FINANCIAL HIGHLIGHTS
Selected data for a share of beneficial interest outstanding for each period.
| | | Class A | |
| | | Six Months
Ended
August 31, | | Year Ended
February 28 or 29, | |
| | | 2007 | | 2007 | | 2006 | | 2005 | | 2004 | | 2003 | |
| Per Share Operating Performance: | |
| Net asset value, beginning of period | | $ | 15.57 | | | | 15.56 | | | | 15.59 | | | | 15.47 | | | | 14.83 | | | | 14.92 | | |
| Income (loss) from investment operations: | |
| Net investment income | | $ | 0.52 | | | | 1.01 | | | | 0.78 | | | | 0.55 | | | | 0.61 | | | | 0.69 | | |
| Net realized and unrealized gain (loss) on investments | | $ | (0.78 | ) | | | 0.02 | | | | (0.03 | ) | | | 0.18 | | | | 0.69 | | | | (0.09 | ) | |
| Total income (loss) from investment operations | | $ | (0.26 | ) | | | 1.03 | | | | 0.75 | | | | 0.73 | | | | 1.30 | | | | 0.60 | | |
| Less distributions from: | |
| Net investment income | | $ | 0.52 | | | | 1.02 | | | | 0.78 | | | | 0.56 | | | | 0.64 | | | | 0.69 | | |
| Net realized gain on investments | | $ | — | | | | — | | | | — | | | | 0.05 | | | | 0.02 | | | | — | | |
| Total distributions | | $ | 0.52 | | | | 1.02 | | | | 0.78 | | | | 0.61 | | | | 0.66 | | | | 0.69 | | |
| Net asset value, end of period | | $ | 14.79 | | | | 15.57 | | | | 15.56 | | | | 15.59 | | | | 15.47 | | | | 14.83 | | |
| Total Investment Return(1) | | % | (1.71 | ) | | | 6.84 | | | | 4.96 | | | | 4.80 | | | | 8.93 | | | | 4.15 | | |
| Ratios/Supplemental Data: | |
| Net assets, end of period (000's) | | $ | 926,910 | | | | 998,140 | | | | 918,621 | | | | 736,740 | | | | 172,975 | | | | 11,106 | | |
| Average borrowings (000's)(2) | | $ | 251,674 | | | | 404,137 | | | | 325,044 | | | | 34,767 | | | | 20,771 | | | | 17,655 | | |
| Asset coverage per $1,000 of debt | | $ | 5,759 | | | | 10,171 | | | | 6,519 | | | | 1,251 | | | | — | * | | | 689 | | |
| Ratios to average net assets after reimbursement/recoupment: | |
| Expenses (before interest and other fees related to revolving credit facility)(3)(4) | | % | 1.41 | | | | 1.50 | | | | 1.50 | | | | 1.34 | | | | 1.36 | | | | 1.42 | | |
| Expenses (with interest and other fees related to revolving credit facility)(3)(4) | | % | 2.13 | | | | 2.56 | | | | 2.20 | | | | 1.45 | | | | 1.43 | | | | 1.63 | | |
| Net investment income(3)(4) | | % | 6.74 | | | | 6.42 | | | | 4.98 | | | | 3.49 | | | | 3.84 | | | | 4.88 | | |
| Ratios to average net assets before reimbursement/recoupment: | |
| Expenses (before interest and other fees related to revolving credit facility)(3)(4) | | % | 1.41 | | | | 1.48 | | | | 1.48 | | | | 1.35 | | | | 1.46 | | | | 1.57 | | |
| Expenses (with interest and other fees related to revolving credit facility)(3)(4) | | % | 2.13 | | | | 2.54 | | | | 2.18 | | | | 1.46 | | | | 1.53 | | | | 1.78 | | |
| Net investment income(3)(4) | | % | 6.74 | | | | 6.44 | | | | 5.00 | | | | 3.48 | | | | 3.74 | | | | 4.73 | | |
| Portfolio turnover rate | | % | 41 | | | | 57 | | | | 82 | | | | 82 | | | | 72 | | | | 60 | | |
| Shares outstanding at end of period (000's) | | | 62,672 | | | | 64,122 | | | | 59,029 | | | | 47,252 | | | | 11,180 | | | | 749 | | |
| | | Class B | |
| | | Six Months
Ended
August 31, | | Year Ended
February 28 or 29, | |
| | | 2007 | | 2007 | | 2006 | | 2005 | | 2004 | | 2003 | |
| Per Share Operating Performance: | |
| Net asset value, beginning of period | | $ | 15.53 | | | | 15.53 | | | | 15.57 | | | | 15.45 | | | | 14.82 | | | | 14.92 | | |
| Income (loss) from investment operations: | |
| Net investment income | | $ | 0.48 | | | | 0.92 | | | | 0.70 | | | | 0.47 | ** | | | 0.53 | | | | 0.62 | | |
| Net realized and unrealized gain (loss) on investments | | $ | (0.77 | ) | | | 0.02 | | | | (0.04 | ) | | | 0.18 | ** | | | 0.69 | | | | (0.10 | ) | |
| Total income (loss) from investment operations | | $ | (0.29 | ) | | | 0.94 | | | | 0.66 | | | | 0.65 | | | | 1.22 | | | | 0.52 | | |
| Less distributions from: | |
| Net investment income | | $ | 0.49 | | | | 0.94 | | | | 0.70 | | | | 0.48 | | | | 0.57 | | | | 0.62 | | |
| Net realized gain on investments | | $ | — | | | | — | | | | — | | | | 0.05 | | | | 0.02 | | | | — | | |
| Total distributions | | $ | 0.49 | | | | 0.94 | | | | 0.70 | | | | 0.53 | | | | 0.59 | | | | 0.62 | | |
| Net asset value, end of period | | $ | 14.75 | | | | 15.53 | | | | 15.53 | | | | 15.57 | | | | 15.45 | | | | 14.82 | | |
| Total Investment Return(1) | | % | (1.96 | ) | | | 6.26 | | | | 4.37 | | | | 4.28 | | | | 8.33 | | | | 3.57 | | |
| Ratios/Supplemental Data: | |
| Net assets, end of period (000's) | | $ | 99,359 | | | | 111,749 | | | | 120,254 | | | | 125,200 | | | | 62,852 | | | | 17,648 | | |
| Average borrowings (000's)(2) | | $ | 251,674 | | | | 404,137 | | | | 325,044 | | | | 34,767 | | | | 20,771 | | | | 17,655 | | |
| Asset coverage per $1,000 of debt | | $ | 5,759 | | | | 10,171 | | | | 6,519 | | | | 1,251 | | | | — | * | | | 689 | | |
| Ratios to average net assets after reimbursement/recoupment: | |
| Expenses (before interest and other fees related to revolving credit facility)(3)(4) | | % | 1.91 | | | | 2.00 | | | | 1.99 | | | | 1.87 | | | | 1.87 | | | | 1.91 | | |
| Expenses (with interest and other fees related to revolving credit facility)(3)(4) | | % | 2.63 | | | | 3.06 | | | | 2.69 | | | | 1.94 | | | | 1.97 | | | | 2.09 | | |
| Net investment income(3)(4) | | % | 6.22 | | | | 5.91 | | | | 4.45 | | | | 2.93 | | | | 3.47 | | | | 4.12 | | |
| Ratios to average net assets before reimbursement/recoupment: | |
| Expenses (before interest and other fees related to revolving credit facility)(3)(4) | | % | 2.16 | | | | 2.23 | | | | 1.97 | | | | 2.13 | | | | 2.22 | | | | 2.31 | | |
| Expenses (with interest and other fees related to revolving credit facility)(3)(4) | | % | 2.88 | | | | 3.29 | | | | 2.67 | | | | 2.19 | | | | 2.31 | | | | 2.49 | | |
| Net investment income(3)(4) | | % | 5.97 | | | | 5.68 | | | | 4.47 | | | | 2.67 | | | | 3.13 | | | | 3.72 | | |
| Portfolio turnover rate | | % | 41 | | | | 57 | | | | 82 | | | | 82 | | | | 72 | | | | 60 | | |
| Shares outstanding at end of period (000's) | | | 6,734 | | | | 7,195 | | | | 7,742 | | | | 8,043 | | | | 4,068 | | | | 1,191 | | |
(1) Total investment returns do not include sales load.
(2) Based on the active days of borrowing.
(3) The Investment Adviser has agreed to limit expenses excluding interest, taxes, brokerage commissions, leverage expenses, other investment related costs and extraordinary expenses, subject to possible recoupment by the Investment Adviser within three years to the following:
Class A – 0.90% of Managed Assets plus 0.45% of average daily net assets
Class B – 0.90% of Managed Assets plus 1.20% of average daily net assets
Class C – 0.90% of Managed Assets plus 0.95% of average daily net assets
Class Q – 0.90% of Managed Assets plus 0.45% of average daily net assets
(4) Annualized for periods less than one year.
* There were no loans outstanding at period end.
** Per share numbers have been calculated using average number of shares outstanding throughout the period.
See Accompanying Notes to Financial Statements
13
ING SENIOR INCOME FUND (UNAUDITED) (CONTINUED) FINANCIAL HIGHLIGHTS
Selected data for a share of beneficial interest outstanding for each period.
| | | Class C | |
| | | Six Months
Ended
August 31, | | Year Ended
February 28 or 29, | |
| | | 2007 | | 2007 | | 2006 | | 2005 | | 2004 | | 2003 | |
| Per Share Operating Performance: | |
| Net asset value, beginning of period | | $ | 15.55 | | | | 15.55 | | | | 15.58 | | | | 15.46 | | | | 14.82 | | | | 14.92 | | |
| Income (loss) from investment operations: | |
| Net investment income | | $ | 0.48 | | | | 0.93 | | | | 0.70 | | | | 0.47 | | | | 0.53 | | | | 0.62 | | |
| Net realized and unrealized gain (loss) on investments | | $ | (0.77 | ) | | | 0.01 | | | | (0.03 | ) | | | 0.18 | | | | 0.70 | | | | (0.10 | ) | |
| Total income (loss) from investment operations | | $ | (0.29 | ) | | | 0.94 | | | | 0.67 | | | | 0.65 | | | | 1.23 | | | | 0.52 | | |
| Less distributions from: | |
| Net investment income | | $ | 0.49 | | | | 0.94 | | | | 0.70 | | | | 0.48 | | | | 0.57 | | | | 0.62 | | |
| Net realized gain on investments | | $ | — | | | | — | | | | — | | | | 0.05 | | | | 0.02 | | | | — | | |
| Total distributions | | $ | 0.49 | | | | 0.94 | | | | 0.70 | | | | 0.53 | | | | 0.59 | | | | 0.62 | | |
| Net asset value, end of period | | $ | 14.77 | | | | 15.55 | | | | 15.55 | | | | 15.58 | | | | 15.46 | | | | 14.82 | | |
| Total Investment Return(1) | | % | (1.96 | ) | | | 6.25 | | | | 4.44 | | | | 4.28 | | | | 8.40 | | | | 3.57 | | |
| Ratios/Supplemental Data: | |
| Net assets, end of period (000's) | | $ | 866,888 | | | | 927,950 | | | | 923,549 | | | | 830,584 | | | | 275,849 | | | | 32,647 | | |
| Average borrowings (000's)(2) | | $ | 251,674 | | | | 404,137 | | | | 325,044 | | | | 34,767 | | | | 20,771 | | | | 17,655 | | |
| Asset coverage per $1,000 of debt | | $ | 5,759 | | | | 10,171 | | | | 6,519 | | | | 1,251 | | | | — | * | | | 689 | | |
| Ratios to average net assets after reimbursement/recoupment: | |
| Expenses (before interest and other fees related to revolving credit facility)(3)(4) | | % | 1.91 | | | | 2.00 | | | | 1.99 | | | | 1.83 | | | | 1.86 | | | | 1.91 | | |
| Expenses (with interest and other fees related to revolving credit facility)(3)(4) | | % | 2.63 | | | | 3.06 | | | | 2.69 | | | | 1.94 | | | | 1.94 | | | | 2.09 | | |
| Net investment income(3)(4) | | % | 6.23 | | | | 5.92 | | | | 4.46 | | | | 2.88 | | | | 3.38 | | | | 4.19 | | |
| Ratios to average net assets before reimbursement/recoupment: | |
| Expenses (before interest and other fees related to revolving credit facility)(3)(4) | | % | 1.91 | | | | 1.98 | | | | 1.97 | | | | 1.83 | | | | 1.96 | | | | 2.06 | | |
| Expenses (with interest and other fees related to revolving credit facility)(3)(4) | | % | 2.63 | | | | 3.04 | | | | 2.67 | | | | 1.95 | | | | 2.04 | | | | 2.24 | | |
| Net investment income(3)(4) | | % | 6.23 | | | | 5.93 | | | | 4.48 | | | | 2.87 | | | | 3.28 | | | | 4.04 | | |
| Portfolio turnover rate | | % | 41 | | | | 57 | | | | 82 | | | | 82 | | | | 72 | | | | 60 | | |
| Shares outstanding at end of period (000's) | | | 58,681 | | | | 59,679 | | | | 59,402 | | | | 53,316 | | | | 17,841 | | | | 2,202 | | |
| | | Class Q | |
| | | Six Months
Ended
August 31, | | Year Ended
February 28 or 29, | |
| | | 2007 | | 2007 | | 2006 | | 2005 | | 2004 | | 2003 | |
| Per Share Operating Performance: | |
| Net asset value, beginning of period | | $ | 15.49 | | | | 15.49 | | | | 15.52 | | | | 15.41 | | | | 14.79 | | | | 14.89 | | |
| Income (loss) from investment operations: | |
| Net investment income | | $ | 0.51 | | | | 0.99 | | | | 0.78 | | | | 0.52 | | | | 0.63 | | | | 0.69 | | |
| Net realized and unrealized gain (loss) on investments | | $ | (0.77 | ) | | | 0.03 | | | | (0.03 | ) | | | 0.20 | | | | 0.65 | | | | (0.10 | ) | |
| Total income (loss) from investment operations | | $ | (0.26 | ) | | | 1.02 | | | | 0.75 | | | | 0.72 | | | | 1.28 | | | | 0.59 | | |
| Less distributions from: | |
| Net investment income | | $ | 0.52 | | | | 1.02 | | | | 0.78 | | | | 0.56 | | | | 0.64 | | | | 0.69 | | |
| Net realized gain on investments | | $ | — | | | | — | | | | — | | | | 0.05 | | | | 0.02 | | | | — | | |
| Total distributions | | $ | 0.52 | | | | 1.02 | | | | 0.78 | | | | 0.61 | | | | 0.66 | | | | 0.69 | | |
| Net asset value, end of period | | $ | 14.71 | | | | 15.49 | | | | 15.49 | | | | 15.52 | | | | 15.41 | | | | 14.79 | | |
| Total Investment Return(1) | | % | (1.71 | ) | | | 6.81 | | | | 4.97 | | | | 4.75 | | | | 8.82 | | | | 4.09 | | |
| Ratios/Supplemental Data: | |
| Net assets, end of period (000's) | | $ | 105,617 | | | | 135,675 | | | | 184,586 | | | | 183,017 | | | | 157,051 | | | | 215,341 | | |
| Average borrowings (000's)(2) | | $ | 251,674 | | | | 404,137 | | | | 325,044 | | | | 34,767 | | | | 20,771 | | | | 17,655 | | |
| Asset coverage per $1,000 of debt | | $ | 5,759 | | | | 10,171 | | | | 6,519 | | | | 1,251 | | | | — | * | | | 689 | | |
| Ratios to average net assets after reimbursement/recoupment: | |
| Expenses (before interest and other fees related to revolving credit facility)(3)(4) | | % | 1.41 | | | | 1.50 | | | | 1.49 | | | | 1.34 | �� | | | 1.40 | | | | 1.41 | | |
| Expenses (with interest and other fees related to revolving credit facility)(3)(4) | | % | 2.13 | | | | 2.56 | | | | 2.19 | | | | 1.45 | | | | 1.54 | | | | 1.59 | | |
| Net investment income(3)(4) | | % | 6.71 | | | | 6.39 | | | | 4.96 | | | | 3.39 | | | | 4.17 | | | | 4.69 | | |
| Ratios to average net assets before reimbursement/recoupment: | |
| Expenses (before interest and other fees related to revolving credit facility)(3)(4) | | % | 1.41 | | | | 1.48 | | | | 1.47 | | | | 1.34 | | | | 1.48 | | | | 1.56 | | |
| Expenses (with interest and other fees related to revolving credit facility)(3)(4) | | % | 2.13 | | | | 2.54 | | | | 2.17 | | | | 1.45 | | | | 1.62 | | | | 1.74 | | |
| Net investment income(3)(4) | | % | 6.71 | | | | 6.41 | | | | 4.98 | | | | 3.38 | | | | 4.09 | | | | 4.54 | | |
| Portfolio turnover rate | | % | 41 | | | | 57 | | | | 82 | | | | 82 | | | | 72 | | | | 60 | | |
| Shares outstanding at end of period (000's) | | | 7,180 | | | | 8,761 | | | | 11,918 | | | | 11,789 | | | | 10,188 | | | | 14,559 | | |
(1) Total investment returns do not include sales load.
(2) Based on the active days of borrowing.
(3) The Investment Adviser has agreed to limit expenses excluding interest, taxes, brokerage commissions, leverage expenses, other investment related costs and extraordinary expenses, subject to possible recoupment by the Investment Adviser within three years to the following:
Class A – 0.90% of Managed Assets plus 0.45% of average daily net assets
Class B – 0.90% of Managed Assets plus 1.20% of average daily net assets
Class C – 0.90% of Managed Assets plus 0.95% of average daily net assets
Class Q – 0.90% of Managed Assets plus 0.45% of average daily net assets
(4) Annualized for periods less than one year.
* There were no loans outstanding at period end.
See Accompanying Notes to Financial Statements
14
ING Senior Income Fund
NOTES TO FINANCIAL STATEMENTS as of August 31, 2007 (Unaudited)
NOTE 1 — ORGANIZATION
ING Senior Income Fund (the "Fund"), a Delaware statutory trust, is registered under the Investment Company Act of 1940 as amended, (the "1940 Act"), as a continuously-offered, diversified, closed-end, management investment company. The Fund invests at least 80% of its net assets plus the amount of any borrowings, for investment purposes, in U.S. dollar denominated, floating rate secured senior loans, which generally are not registered under the Securities Act of 1933 as amended (the "'33 Act"), and contain certain restrictions on resale and cannot be sold publicly. These loans bear interest (unless otherwise noted) at rates that float periodically at a margin above the London Inter-Bank Offered Rate ("LIBOR") and other short-term rates. During the period December 15, 2000 through March 30, 2001, the Fund issued 19,933,953 Class Q shares to an affiliate of the Fund's manager, ING Investments, LLC (the "Investment Manager") in exchange for $2 00,000,000. Effective April 2, 2001, the Fund commenced the offering of Class A, Class B, Class C and Class Q shares to the public.
The Fund currently has four classes of shares; A, B, C and Q. Class A shares are subject to a sales charge of up to 2.50%. Class A shares purchased in excess of $1,000,000 are not subject to a sales charge but are subject to an Early Withdrawal Charge ("EWC") of 1% within one year of purchase. Class A shares are issued upon conversion of Class B shares eight years after purchase or through an exchange of Class A shares of certain ING Funds. Class B shares are subject to an EWC of up to 3% over the five-year period after purchase and Class C shares are subject to an EWC of 1% during the first year after purchase.
To maintain a measure of liquidity, the Fund offers to repurchase between 5% and 25% of its outstanding common shares on a monthly basis. This is a fundamental policy that cannot be changed without shareholder approval. The Fund may not repurchase more than 25% in any calendar quarter. Other than these monthly repurchases, no market for the Fund's common shares is expected to exist. The separate classes of shares differ principally in their distribution fees and shareholder servicing fees. All shareholders bear the common expenses of the Fund and earn income and realized gains/losses from the portfolio pro rata on the average daily net assets of each class, without distinction between share classes. Differences in the per share dividend rates generally result from differences in separate class expenses, including distribution fees and shareholder servicing fees.
Effective January 31, 2005, Class B common shares of the Fund became closed to new investment, provided that: (1) Class B common shares of the Fund may be purchased through the reinvestment of dividends issued by the Fund; and (2) subject to the terms and conditions of relevant exchange privileges and as permitted under their respective prospectuses, Class B common shares of the Fund may be acquired through exchange of Class B shares of other funds in the ING mutual funds complex for the Fund's Class B common shares.
NOTE 2 — SIGNIFICANT ACCOUNTING POLICIES
The following is a summary of the significant accounting policies consistently followed by the Fund in the preparation of its financial statements. The policies are in conformity with U.S. generally accepted accounting principles.
A. Senior Loan and Other Security Valuation. Senior loans held by the Fund are normally valued at the average of the means of one or more bid and asked quotations obtained from a pricing service or other sources determined by the Board of Trustees to be independent and believed to be reliable. Loans for which reliable market value quotations are not readily available may be valued with reference to another loan or a group of loans for which quotations are more readily available and whose characteristics are comparable to the loan being valued. Under this approach, the comparable loan or loans serve as a proxy for changes in value of the loan being valued. The Fund has engaged an independent pricing service to provide quotations from dealers in loans and to calculate values under the proxy procedure described above.
15
ING Senior Income Fund
NOTES TO FINANCIAL STATEMENTS as of August 31, 2007 (Unaudited) (continued)
NOTE 2 — SIGNIFICANT ACCOUNTING POLICIES (continued)
It is expected that most of the loans held by the Fund will be valued with reference to quotations from the independent pricing service or with reference to the proxy procedure described above. As of August 31, 2007, 99.13% of total loans were valued based on these procedures.
Prices from a pricing service may not be available for all loans and the Investment Manager may believe that the price for a loan derived from market quotations or the proxy procedure described above is not reliable or accurate. Among other reasons, this may be the result of information about a particular loan or borrower known to the Investment Manager that the Investment Manager believes may not be known to the pricing service or reflected in a price quote. In this event, the loan is valued at fair value as determined in good faith under procedures established by the Fund's Board of Trustees and in accordance with the provisions of the 1940 Act. Under these procedures, fair value is determined by the Investment Manager and monitored by the Fund's Board of Trustees through its Valuation, Proxy and Brokerage Committee (formerly, Valuation and Proxy Committee).
In fair valuing a loan, consideration is given to several factors, which may include, among others, the following: (i) the characteristics of and fundamental analytical data relating to the loan, including the cost, size, current interest rate, period until the next interest rate reset, maturity and base lending rate of the loan, the terms and conditions of the loan and any related agreements, and the position of the loan in the borrower's debt structure; (ii) the nature, adequacy and value of the collateral, including the Fund's rights, remedies and interests with respect to the collateral; (iii) the creditworthiness of the borrower and the cash flow coverage of outstanding principal and interest, based on an evaluation of its financial condition, financial statements and information about the borrower's business, cash flows, capital structure and future prospects; (iv) information relating to the market for the loan, including price quotat ions for, and trading in, the loan and interests in similar loans and the market environment and investor attitudes towards the loan and interests in similar loans; (v) the reputation and financial condition of the agent for the loan and any intermediate participants in the loan; (vi) the borrower's management; and (vii) the general economic and market conditions affecting the fair value of the loan. Securities other than senior loans for which reliable market value quotations are not readily available and all other assets will be valued at their respective fair values as determined in good faith by, and under procedures established by, the Board of Trustees of the Fund. Investments in securities maturing in 60 days or less from the date of valuation are valued at amortized cost, which, when combined with accrued interest, approximates market value. To the extent the Fund invests in other registered companies, the Fund's NAV is calculated based on the current NAV of the registered investment company in which the Fund invests. The prospectuses for those investment companies explain the circumstances under which they will use fair value pricing and the effects of using fair value pricing.
B. Distributions to Shareholders. The Fund declares and goes ex-dividend daily and pays dividends monthly from net investment income. Distributions from capital gains, if any, are declared and paid annually. The Fund may make additional distributions to comply with the distribution requirements of the Internal Revenue Code. The character and amounts of income and gains to be distributed are determined in accordance with federal income tax regulations, which may differ from U.S. generally accepted accounting principles for investment companies. The Fund records distributions to its shareholders on the ex-dividend date.
C. Security Transactions and Revenue Recognition. Revolver and delayed draw loans are booked on a settlement date basis. Security transactions and senior loans are accounted for on trade date (date the order to buy or sell is executed). Realized gains or losses are reported on the basis of identified cost of securities sold. Interest income is recorded on an accrual basis at the then-current loan rate. The accrual of interest on loans is partially or fully discontinued when, in the opinion of management, there is an indication that the borrower may be unable to meet payments as they become due. If determined to be uncollectible, unpaid accrued interest is also written off. Cash collections on non-accrual senior loans are generally applied as a reduction to the recorded investment of the loan. Loans are generally returned to accrual status only after all past due amounts have been received and the borrower has demonstrated sustained performance. Premium
16
ING Senior Income Fund
NOTES TO FINANCIAL STATEMENTS as of August 31, 2007 (Unaudited) (continued)
NOTE 2 — SIGNIFICANT ACCOUNTING POLICIES (continued)
amortization and discount accretion are determined by the effective yield method over the shorter of four years or the actual term of the loan. Arrangement fees received on revolving credit facilities, which represent non-refundable fees or purchase discounts associated with the acquisition of loans, are deferred and recognized using the effective yield method over the shorter of four years or the actual term of the loan. No such fees are recognized on loans which have been placed on non-accrual status. Arrangement fees associated with all other loans, except revolving credit facilities, are treated as discounts and are accreted as described above. Dividend income is recorded on the ex-dividend date.
D. Federal Income Taxes. It is the Fund's policy to comply with subchapter M of the Internal Revenue Code and related excise tax provisions applicable to regulated investment companies and to distribute substantially all of its net investment income and net realized capital gains to its shareholders. Therefore, no federal income tax provision is required. No capital gain distributions shall be made until any capital loss carryforwards have been fully utilized or expire.
E. Use of Estimates. The preparation of financial statements in conformity with U.S. generally accepted accounting principles requires management to make estimates and assumptions that affect the reported amounts of assets and liabilities and disclosure of contingent assets and liabilities at the date of the financial statements and the reported amounts of increases and decreases in net assets from operations during the reporting period. Actual results could differ from those estimates.
F. Forward Foreign Currency Contracts. The Fund may enter into forward foreign currency contracts primarily to hedge against foreign currency exchange rate risks on its non-U.S. dollar denominated investment securities. When entering into a currency forward contract, the Fund agrees to receive or deliver a fixed quantity of foreign currency for an agreed-upon price on an agreed future date. These contracts are valued daily and the Fund's net equity therein, representing unrealized gain or loss on the contracts as measured by the difference between the forward foreign exchange rates at the dates of entry into the contracts and the forward rates at the reporting date, is included in the Statement of Assets and Liabilities. Realized and unrealized gains and losses are included in the S tatement of Operations. These instruments involve market and/or credit risk in excess of the amount recognized in the Statement of Assets and Liabilities. Risks arise from the possible inability of counterparties to meet the terms of their contracts and from movement in currency and securities values and interest rates. Open forward foreign currency contracts are presented following the respective Portfolio of Investments.
NOTE 3 — INVESTMENTS
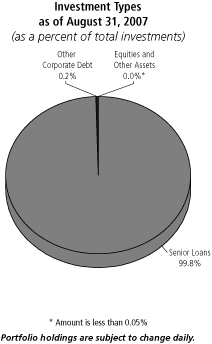
For the six months ended August 31, 2007, the cost of purchases and the proceeds from principal repayment and sales of investments, excluding short-term investments, totaled $1,138,245,379 and $1,001,433,852, respectively. At August 31, 2007, the Fund held senior loans valued at $2,415,645,072 representing 99.8% of its total investments. The market value of these assets is established as set forth in Note 2.
The senior loans acquired by the Fund typically take the form of a direct lending relationship with the borrower acquired through an assignment of another lender's interest in a loan. The lead lender in a typical corporate loan syndicate administers the loan and monitors collateral. In the event that the lead lender becomes insolvent, enters FDIC receivership or, if not FDIC insured, enters into bankruptcy, the Fund may incur certain costs and delays in realizing payment, or may suffer a loss of principal and/or interest.
Warrants and shares of common stock held in the portfolio were acquired in conjunction with loans held by the Fund. Certain of these shares and warrants are restricted and may not be publicly sold without registration under the '33 Act, or without an exemption under the 1933 Act. In some cases, these restrictions expire after a designated period of time after the issuance of the shares or warrants.
17
ING Senior Income Fund
NOTES TO FINANCIAL STATEMENTS as of August 31, 2007 (Unaudited) (continued)
NOTE 3 — INVESTMENTS (continued)
Dates of acquisition and cost or assigned basis of restricted securities are as follows:
| | | Date of
Acquisition | | Cost or
Assigned Basis | |
| Decision One Corporation (463,664 Common Shares) | | 06/03/05 | | $ | 295,535 | | |
| Neoplan USA Corporation (1,627 Common Shares) | | 08/31/04 | | | — | | |
| Neoplan USA Corporation (170 Series B Preferred Shares) | | 08/29/03 | | | — | | |
| Neoplan USA Corporation (102 Series C Preferred Shares) | | 08/29/03 | | | 40,207 | | |
| Neoplan USA Corporation (331 Series D Preferred Shares) | | 08/29/03 | | | 330,600 | | |
| Norwood Promotional Products, Inc. (80,087 Common Shares) | | 08/23/04 | | | 10,046 | | |
| Safelite Realty Corporation (30,003 Common Shares) | | 06/21/01 | | | — | | |
Total restricted securities excluding senior loans (market value
of $545,337 was 0.0% of net assets at August 31, 2007). | | | | $ | 676,388 | | |
NOTE 4 — MANAGEMENT AND ADMINISTRATION AGREEMENTS
The Fund has entered into an investment management agreement ("Management Agreement") with the Investment Adviser to provide advisory and management services. The Management Agreement compensates the Investment Adviser with a fee, computed daily and payable monthly, at an annual rate of 0.80% of the Fund's average daily gross asset value, minus the sum of the Fund's accrued and unpaid dividends on any outstanding preferred shares and accrued liabilities (other than liabilities for the principal amount of any borrowings incurred, commercial paper or notes issued by the Fund and the liquidation preference of any outstanding preferred shares) ("Managed Assets"). The Fund is sub-advised by ING Investment Management Co. ("ING IM"). Under the sub-advisory agreement, ING IM is responsible for managing the assets of the Fund in accordance with its investment objective and policies, subject to oversight by the Investment Adviser. Both ING IM and the Investment Adviser are indirect, wholly-owned subsidiaries of ING Groep N.V. ("ING Groep") and affiliates of each other.
The Fund has also entered into an Administration Agreement with ING Funds Services, LLC (the "Administrator"), an indirect, wholly-owned subsidiary of ING Groep N.V., to provide administrative services. The Administrator is compensated with a fee, computed daily and payable monthly, at an annual rate of 0.10% of the Fund's Managed Assets.
NOTE 5 — DISTRIBUTION AND SERVICE FEES
Each share class of the Fund has adopted a Plan pursuant to Rule 12b-1 under the 1940 Act (the "12b-1 Plans"), whereby ING Funds Distributor, LLC (the "Distributor") is compensated by the Fund for expenses incurred in the distribution of the Fund's shares ("Distribution Fees"). Pursuant to the 12b-1 Plans, the Distributor is entitled to a payment each month for actual expenses incurred in the distribution and promotion of the Fund's shares, including expenses incurred in printing prospectuses and reports used for sales purposes, expenses incurred in preparing and printing sales literature and other such distribution related expenses, including any distribution or Shareholder Servicing Fees ("Service Fees") paid to securities dealers who executed a distribution agreement with the Distributor. Under the 12b-1 plans, each class of shares of the Fund pays the Distributor a combined Distribution and/or Service Fee based on average daily net asset s at the following annual rates:
| Class A | | Class B | | Class C | | Class Q | |
| | 0.25 | % | | | 1.00 | % | | | 0.75 | % | | | 0.25 | % | |
During the six months ended August 31, 2007, the Distributor waived 0.25% of the Service Fee on Class B shares only.
18
ING Senior Income Fund
NOTES TO FINANCIAL STATEMENTS as of August 31, 2007 (Unaudited) (continued)
NOTE 6 — EXPENSE LIMITATIONS
The Investment Adviser has voluntarily agreed to limit expenses, excluding interest, taxes, brokerage commissions, leverage expenses, other investment-related costs and extraordinary expenses, to the following:
| Class A — 0.90% of Managed Assets plus 0.45% of average daily net assets | |
|
| Class B — 0.90% of Managed Assets plus 1.20% of average daily net assets | |
|
| Class C — 0.90% of Managed Assets plus 0.95% of average daily net assets | |
|
| Class Q — 0.90% of Managed Assets plus 0.45% of average daily net assets | |
|
NOTE 7 — COMMITMENTS
The Fund has entered into a revolving credit agreement, collateralized by assets of the Fund, to borrow up to $750 million maturing June 12, 2008. On September 10th, 2007, the amount of the credit agreement was increased to $840 million. Borrowing rates under this agreement are based on a commercial paper pass through rate plus 0.25% on the funded portion. A facility fee of 0.15% is charged on the entire facility. There was $420 million of borrowings outstanding at August 31, 2007 at a rate of 5.75%, excluding other fees related to the entire facility. Average borrowings for the six months ended August 31, 2007 were $251,673,913 and the average annualized interest rate was 6.16%, excluding other fees related to the entire facility.
NOTE 8 — SENIOR LOAN COMMITMENTS
As of August 31, 2007, the Fund had unfunded loan commitments pursuant to the terms of the following loan agreements:
| Advance Food Co. | | $ | 309,524 | | |
| Builders Firstsource, Inc. | | | 1,500,000 | | |
| Calpine Corp. | | | 2,700,000 | | |
| Cannery Casino Resorts | | | 1,228,347 | | |
| Cellular South, Inc. | | | 750,000 | | |
| Coach America Holdings, Inc. | | | 262,712 | | |
| Coleto Creek Power | | | 5,000,000 | | |
| Community Health Systems, Inc. | | | 3,031,709 | | |
| EPD, Inc. | | | 562,500 | | |
| FCH KFT - Term Loan B | | | 28,939 | | |
| FCH KFT - Term Loan C | | | 28,939 | | |
| Fender Musical Instruments Corp. | | | 1,166,667 | | |
Fleetcor Technologies
Operating Co., LLC | | | 133,333 | | |
| Fontainebleau Resorts, LLC | | | 1,333,333 | | |
| Golden Nugget, Inc. | | | 636,364 | | |
| Hearthstone Housing Partners II, LLC | | | 1,764,706 | | |
| Hub International Holdings, Inc. | | | 313,726 | | |
| Iasis Healthcare Corporation | | | 325,517 | | |
| Inventiv Health, Inc. | | | 85,714 | | |
| Isle of Capri Casinos, Inc. | | | 882,353 | | |
| Kerasotes Theatres, Inc. | | | 966,930 | | |
| Las Vegas Sands, LLC | | $ | 1,200,000 | | |
Levana Holding 4 GmbH -
Term Loan B | | | 175,404 | | |
Levana Holding 4 GmbH -
Term Loan C | | | 175,405 | | |
| Longview Power, LLC | | | 1,016,667 | | |
| Lucite International U.S. Finco Ltd. | | | 362,119 | | |
| MEG Energy Corp. | | | 4,200,000 | | |
| NRG Energy, Inc. | | | 6,250,862 | | |
| Seminole Tribe of Florida | | | 142,510 | | |
| Sturm Foods, Inc. | | | 500,000 | | |
| Sun Healthcare Group, Inc. | | | 87,356 | | |
Trump Entertainment Resorts
Holdings, L.P. | | | 4,353 | | |
United Surgical Partners
International, Inc. | | | 147,177 | | |
| Univision Communications, Inc. | | | 2,115,793 | | |
| UPC Broadband Holding | | | 1,741,434 | | |
| Valassis Communications, Inc. | | | 320,000 | | |
| Wastequip, Inc. | | | 186,765 | | |
| | | $ | 41,637,158 | | |
NOTE 9 — TRANSACTIONS WITH AFFILIATES AND RELATED PARTIES
At August 31, 2007, the Fund had the following amounts recorded in payable to affiliates on the accompanying Statement of Assets and Liabilities (see Notes 4 and 5):
Accrued Investment
Management Fees | | Accrued
Administrative Fees | | Accrued Distribution
and Service Fees | | Total | |
| $ | 1,630,587 | | | $ | 203,823 | | | $ | 851,683 | | | $ | 2,686,093 | | |
The Fund has adopted a Retirement Policy ("Policy") covering all independent trustees of the Fund who will have served as an independent trustee for at least five years at the time of retirement. Benefits under this Policy are based on an annual rate as defined in the Policy agreement, as amended.
19
ING Senior Income Fund
NOTES TO FINANCIAL STATEMENTS as of August 31, 2007 (Unaudited) (continued)
NOTE 10 — CUSTODIAL AGREEMENT
State Street Bank and Trust Company ("SSB") serves as the Fund's custodian and recordkeeper. Custody fees paid to SSB may be reduced by earnings credits based on the cash balances held by SSB for the Fund.
There were no earnings credits for the six months ended August 31, 2007.
NOTE 11 — SUBORDINATED LOANS AND UNSECURED LOANS
The primary risk arising from investing in subordinated loans or in unsecured loans is the potential loss in the event of default by the issuer of the loans. The Fund may invest up to 10% of its total assets, measured at the time of investment, in subordinated loans and up to 10% of its total assets, measured at the time of investment, in unsecured loans. As of August 31, 2007, the Fund held 0.2% of its total assets in subordinated loans and unsecured loans.
NOTE 12 — CAPITAL SHARES
Transactions in capital shares and dollars were as follows:
| | | Class A Shares | | Class B Shares | |
| | | Six Months
Ended
August 31,
2007 | | Year
Ended
February 28,
2007 | | Six Months
Ended
August 31,
2007 | | Year
Ended
February 28,
2007 | |
| Number of Shares | |
| Shares sold | | | 12,341,640 | | | | 32,168,921 | | | | 212,437 | | | | 887,201 | | |
| Dividends reinvested | | | 1,504,669 | | | | 2,946,341 | | | | 151,678 | | | | 312,109 | | |
| Shares redeemed | | | (15,295,853 | ) | | | (30,022,776 | ) | | | (825,035 | ) | | | (1,746,090 | ) | |
| Net increase (decrease) in shares outstanding | | | (1,449,544 | ) | | | 5,092,486 | | | | (460,920 | ) | | | (546,780 | ) | |
| Dollar Amount ($) | |
| Shares sold | | $ | 190,630,809 | | | $ | 498,004,945 | | | $ | 3,276,609 | | | $ | 13,712,848 | | |
| Dividends reinvested | | | 22,997,526 | | | | 44,687,774 | | | | 2,313,657 | | | | 4,755,391 | | |
| Shares redeemed | | | (234,128,941 | ) | | | (464,618,771 | ) | | | (12,647,073 | ) | | | (26,983,867 | ) | |
| Net increase (decrease) | | $ | (20,500,606 | ) | | $ | 78,073,948 | | | $ | (7,056,807 | ) | | $ | (8,515,628 | ) | |
| | | Class C Shares | | Class Q Shares | |
| | | Six Months
Ended
August 31,
2007 | | Year
Ended
February 28,
2007 | | Six Months
Ended
August 31,
2007 | | Year
Ended
February 28,
2007 | |
| Number of Shares | |
| Shares sold | | | 7,979,404 | | | | 19,971,910 | | | | 1,190,862 | | | | 6,177,228 | | |
| Dividends reinvested | | | 1,352,520 | | | | 2,633,036 | | | | 101,682 | | | | 145,573 | | |
| Shares redeemed | | | (10,330,137 | ) | | | (22,327,696 | ) | | | (2,873,875 | ) | | | (9,479,659 | ) | |
| Net increase (decrease) in shares outstanding | | | (998,213 | ) | | | 277,250 | | | | (1,581,331 | ) | | | (3,156,858 | ) | |
| Dollar Amount ($) | |
| Shares sold | | $ | 123,116,875 | | | $ | 308,955,952 | | | $ | 18,283,766 | | | $ | 95,128,042 | | |
| Dividends reinvested | | | 20,652,511 | | | | 39,969,119 | | | | 1,548,549 | | | | 2,242,825 | | |
| Shares redeemed | | | (157,980,804 | ) | | | (345,190,055 | ) | | | (43,402,028 | ) | | | (146,017,756 | ) | |
| Net increase (decrease) | | $ | (14,211,418 | ) | | $ | 3,735,016 | | | $ | (23,569,713 | ) | | $ | (48,646,889 | ) | |
NOTE 13 — FEDERAL INCOME TAXES
The amount of distributions from net investment income and net realized capital gains are determined in accordance with federal income tax regulations, which may differ from U.S. generally accepted accounting principles for investment companies. These book/tax differences may be either temporary or permanent. Permanent differences are reclassified within the capital accounts based on their federal tax-basis treatment; temporary differences are not reclassified. Key differences include the treatment of short-term capital gains, foreign currency transactions, and wash sale deferrals. Distributions in excess of net investment income and/or net realized capital gains for tax purposes are reported as distributions of paid-in capital.
20
ING Senior Income Fund
NOTES TO FINANCIAL STATEMENTS as of August 31, 2007 (Unaudited) (continued)
NOTE 13 — FEDERAL INCOME TAXES (continued)
Dividends paid by the Fund from net investment income and distributions of net realized short-term capital gains are, for federal income tax purposes, taxable as ordinary income to shareholders.
The tax composition of dividends and distributions to shareholders was as follows:
| | Six Months Ended August 31, 2007 | | Year Ended February 28, 2007 | |
| | Ordinary Income | | Ordinary Income | |
| | $ | 70,731,389 | | | $ | 138,474,557 | | |
The tax-basis components of distributable earnings and the expiration dates of the capital loss carryforwards which may be used to offset future realized capital gains for federal income tax purposes as of February 28, 2007 were:
Unrealized
Appreciation/
Depreciation | | Post-October
Currency
Losses
Deferred | | Capital Loss
Carryforwards | | Expiration
Dates | |
| $ | 32,328,406 | | | $ | (2,222,078 | ) | | $ | (2,774,928 | ) | | | 2014 | | |
| | | | | | (823,036 | ) | | | 2015 | | |
| | | | | $ | (3,597,964 | ) | | | |
NOTE 14 — OTHER ACCOUNTING PRONOUNCEMENTS
In June 2006, the Financial Accounting Standards Board ("FASB") issued FASB Interpretation No. 48 ("FIN 48"), "Accounting for Uncertainty in Income Taxes." This standard defines the threshold for recognizing the benefits of tax-return positions in the financial statements as "more-likely-than-not" to be sustained upon challenge by the taxing authority and requires measurement of a tax position meeting the more-likely-than-not criterion, based on the largest benefit that is more than 50 percent likely to be realized. FIN 48 was effective for fiscal years beginning after December 15, 2006, with early application permitted if no interim financial statements have been issued. However, acknowledging the unique issues that FIN 48 presents for investment companies that calculate NAVs, the U.S. Securities and Exchange Commission (the "SEC") has indicated that they would not object if a fund implements FIN 48 in its NAV calculation as late as its las t NAV calculation in the first required financial statement reporting period for its fiscal year beginning after December 15, 2006. For the February year-end closed-end funds, the August 31, 2007 NAV and this semi-annual report are required to reflect the effects of FIN 48. At adoption, companies must adjust their financial statements to reflect only those tax positions that are more likely-than-not to be sustained as of the adoption date. Management of the Fund has analyzed the tax positions of the Fund. Upon adoption of FIN 48, we identified no uncertain tax positions that have not met the more likely-than-not standard.
On September 15, 2006, the FASB issued Statement of Financial Accounting Standards No. 157 ("SFAS No. 157"), "Fair Value Measurements." The new accounting statement defines fair value, establishes a framework for measuring fair value in generally accepted accounting principles ("GAAP"), and expands disclosures about fair value measurements. SFAS No. 157 defines fair value as the price that would be received to sell an asset or paid to transfer a liability in an orderly transaction between market participants at the measurement date (an exit price). SFAS No. 157 also stipulates that, as a market-based measurement, fair value measurement should be determined based on the assumptions that market participants would use in pricing the asset or liability, and establishes a fair value hierarchy that distinguishes between (a) market participant assumptions developed based on market data obtained from sources independent of the reporting entity (obse rvable inputs) and (b) the reporting entity's own assumptions about market participant assumptions developed based on the best information available in the circumstances (unobservable inputs). SFAS No. 157 is effective for financial statements issued for fiscal years beginning after
21
ING Senior Income Fund
NOTES TO FINANCIAL STATEMENTS as of August 31, 2007 (Unaudited) (continued)
NOTE 14 — OTHER ACCOUNTING PRONOUNCEMENTS (continued)
November 15, 2007. As of August 31, 2007, management of the Fund is currently assessing the impact, if any, that will result from adopting SFAS No. 157.
NOTE 15 — INFORMATION REGARDING TRADING OF ING'S US MUTUAL FUNDS
As discussed in earlier supplements, ING Investments, LLC ("Investments"), the adviser to the ING Funds, has reported to the Boards of Directors/Trustees (the "Boards") of the ING Funds that, like many U.S. financial services companies, Investments and certain of its U.S. affiliates have received informal and formal requests for information since September 2003 from various governmental and self-regulatory agencies in connection with investigations related to mutual funds and variable insurance products. Investments has advised the Boards that it and its affiliates have cooperated fully with each request.
In addition to responding to regulatory and governmental requests, Investments reported that management of U.S. affiliates of ING Groep N.V., including Investments (collectively, "ING"), on their own initiative, have conducted, through independent special counsel and a national accounting firm, an extensive internal review of trading in ING insurance, retirement, and mutual fund products. The goal of this review was to identify any instances of inappropriate trading in those products by third parties or by ING investment professionals and other ING personnel. ING's internal review related to mutual fund trading is now substantially completed. ING has reported that, of the millions of customer relationships that ING maintains, the internal review identified several isolated arrangements allowing third parties to engage in frequent trading of mutual funds within ING's variable insurance and mutual fund products, and identified other circumstan ces where frequent trading occurred, despite measures taken by ING intended to combat market timing. ING further reported that each of these arrangements has been terminated and fully disclosed to regulators. The results of the internal review were also reported to the independent members of the Boards.
Investments has advised the Boards that most of the identified arrangements were initiated prior to ING's acquisition of the businesses in question in the U.S. Investments further reported that the companies in question did not receive special benefits in return for any of these arrangements, which have all been terminated.
Based on the internal review, Investments has advised the Boards that the identified arrangements do not represent a systemic problem in any of the companies that were involved.
Despite the extensive internal review conducted through independent special counsel and a national accounting firm, there can be no assurance that the instances of inappropriate trading reported to the Boards are the only instances of such trading respecting the ING Funds.
Investments reported to the Boards that ING is committed to conducting its business with the highest standards of ethical conduct with zero tolerance for noncompliance. Accordingly, Investments advised the Boards that ING management was disappointed that its voluntary internal review identified these situations. Viewed in the context of the breadth and magnitude of its U.S. business as a whole, ING management does not believe that ING's acquired companies had systemic ethical or compliance issues in these areas. Nonetheless, Investments reported that given ING's refusal to tolerate any lapses, it has taken the steps noted below, and will continue to seek opportunities to further strengthen the internal controls of its affiliates.
• ING has agreed with the ING Funds to indemnify and hold harmless the ING Funds from all damages resulting from wrongful conduct by ING or its employees or from ING's internal investigation, any investigations conducted by any governmental or self-regulatory
22
ING Senior Income Fund
NOTES TO FINANCIAL STATEMENTS as of August 31, 2007 (Unaudited) (continued)
NOTE 15 — INFORMATION REGARDING TRADING OF ING'S U.S. MUTUAL FUNDS (continued)
agencies, litigation or other formal proceedings, including any proceedings by the SEC. Investments reported to the Boards that ING management believes that the total amount of any indemnification obligations will not be material to ING or its U.S. business.
• ING updated its Code of Conduct for employees reinforcing its employees' obligation to conduct personal trading activity consistent with the law, disclosed limits, and other requirements.
Other Regulatory Matters
The New York Attorney General (the "NYAG") and other federal and state regulators are also conducting broad inquiries and investigations involving the insurance industry. These initiatives currently focus on, among other things, compensation and other sales incentives; potential conflicts of interest; potential anti-competitive activity; reinsurance; marketing practices (including suitability); specific product types (including group annuities and indexed annuities); fund selection for investment products and brokerage sales; and disclosure. It is likely that the scope of these industry investigations will further broaden before they conclude. ING has received formal and informal requests in connection with such investigations, and is cooperating fully with each request. In connection with one such investigation, affiliates of Investments were named in a petition for relief and cease and desist order filed by the New Hampshire Bureau of Secu rities Regulation (the "NH Bureau") concerning their administration of the New Hampshire state employees deferred compensation plan.
Other federal and state regulators could initiate similar actions in this or other areas of ING's businesses. These regulatory initiatives may result in new legislation and regulation that could significantly affect the financial services industry, including businesses in which ING is engaged. In light of these and other developments, ING continuously reviews whether modifications to its business practices are appropriate. At this time, in light of the current regulatory factors, ING U.S. is actively engaged in reviewing whether any modifications in our practices are appropriate for the future.
There can be no assurance that these matters, or the adverse publicity associated with them, will not result in increased fund redemptions, reduced sale of fund shares, or other adverse consequences to ING Funds.
NOTE 16 — SUBSEQUENT EVENTS
DIVIDENDS DECLARED
Subsequent to August 31, 2007, the Fund declared the following dividends:
| Per Share Amount | | Type | | Declaration Date | | Record Date | | Payable Date | |
| $ | 0.08543 | (A) | | NII | | Daily | | Daily | | October 1, 2007 | |
| $ | 0.07910 | (B) | | NII | | Daily | | Daily | | October 1, 2007 | |
NII — Net Investment Income
(A) For Class A and Q shares.
(B) For Class B and C shares.
23
ING Senior Income Fund
ADDITIONAL INFORMATION
PROXY VOTING INFORMATION
A description of the policies and procedures that the Registrant uses to determine how to vote proxies related to portfolio securities is available (1) without charge, upon request, by calling Shareholder Services toll-free at (800) 992-0180; (2) on the Registrant's website at www.ingfunds.com; and (3) on the SEC's website at www.sec.gov. Information regarding how the Registrant voted proxies related to portfolio securities during the most recent 12-month period ended June 30 is available without charge on the Registrant's website at www.ingfunds.com and on the SEC's website at www.sec.gov.
QUARTERLY PORTFOLIO HOLDINGS
The Registrant files its complete schedule of portfolio holdings with the Commission for the first and third quarters of each fiscal year on Form N-Q. The Registrant's Forms N-Q are available on the SEC's website at www.sec.gov. The Registrant's Forms N-Q may be reviewed and copied at the Commissions Public Reference Room in Washington, DC, and information on the operation of the Public Reference Room may be obtained by calling (800) SEC-0330; and is available upon request from the Registrant by calling Shareholder Services toll-free at (800) 992-0180.
24
ING Senior Income Fund
PORTFOLIO OF INVESTMENTS as of August 31, 2007 (Unaudited)
| Senior Loans*: 120.9% | | | | | | Bank Loan
Ratings† | | Market | |
| Principal Amount | | | | Borrower/Tranche Description | | Moody's | | S&P | | Value | |
| Aerospace & Defense: 2.2% | | | |
| | | | | | | Avio Group | | NR | | NR | | | | | |
| EUR | 708,333 | | | | | Term Loan, 6.222%,
maturing December 13, 2014 | | | | | | $ | 938,430 | | |
| $ | 590,346 | | | | | Term Loan, 7.814%,
maturing December 13, 2014 | | | | | | | 565,994 | | |
| EUR | 708,333 | | | | | Term Loan, 6.597%,
maturing December 13, 2015 | | | | | | | 943,255 | | |
| $ | 590,346 | | | | | Term Loan, 8.125%,
maturing December 13, 2015 | | | | | | | 568,946 | | |
| | | | | | | Delta Air Lines, Inc. | | Ba2 | | BB- | | | | | |
| | 2,835,000 | | | | | Term Loan, 7.360%,
maturing April 30, 2012 | | | | | | | 2,707,425 | | |
| | | | | | | Delta Air Lines, Inc. | | B2 | | B | | | | | |
| | 3,000,000 | | | | | Second Lien Term Loan, 8.610%,
maturing April 30, 2012 | | | | | | | 2,898,000 | | |
| | | | | | | Dyncorp International, LLC | | Ba2 | | BB- | | | | | |
| | 2,174,750 | | | | | Term Loan, 7.625%,
maturing February 11, 2011 | | | | | | | 2,076,886 | | |
| | | | | | | Forgings International, Ltd. | | NR | | NR | | | | | |
| | 1,272,986 | | | | | Term Loan, 7.610%,
maturing August 11, 2014 | | | | | | | 1,210,928 | | |
| GBP | 223,269 | | | | | Term Loan, 8.091%,
maturing August 11, 2014 | | | | | | | 428,262 | | |
| $ | 1,369,696 | | | | | Term Loan, 7.860%,
maturing August 11, 2015 | | | | | | | 1,309,772 | | |
| GBP | 241,073 | | | | | Term Loan, 8.341%,
maturing August 11, 2015 | | | | | | | 464,844 | | |
| | | | | | | Hawker Beechcraft Acquisition Company, LLC | | Ba3 | | BB- | | | | | |
| $ | 931,136 | | | | | Term Loan, 7.350%,
maturing March 26, 2014 | | | | | | | 890,399 | | |
| | 9,091,843 | | | | | Term Loan, 7.371%,
maturing March 26, 2014 | | | | | | | 8,694,075 | | |
| | | | | | | Hexcel Corporation | | Ba1 | | BB | | | | | |
| | 806,698 | | | | | Term Loan, 7.139%,
maturing March 01, 2012 | | | | | | | 786,531 | | |
| | | | | | | McKechnie Aerospace DE, Inc. | | Ba3 | | B+ | | | | | |
| | 1,250,000 | | | | | Term Loan, 7.360%,
maturing May 11, 2014 | | | | | | | 1,187,500 | | |
| | | | | | | Spirit Aerosystems, Inc. | | Ba3 | | BB+ | | | | | |
| | 978,026 | | | | | Term Loan, 7.110%,
maturing September 30, 2013 | | | | | | | 968,246 | | |
| | | | | | | Transdigm, Inc. | | Ba3 | | B+ | | | | | |
| | 3,500,000 | | | | | Term Loan, 7.360%,
maturing June 23, 2013 | | | | | | | 3,377,500 | | |
| | | | | | | United Airlines, Inc. | | B1 | | BB- | | | | | |
| | 2,985,000 | | | | | Term Loan, 7.625%,
maturing February 01, 2014 | | | | | | | 2,816,162 | | |
| | | | | | | US Airways Group, Inc. | | B2 | | B+ | | | | | |
| | 8,000,000 | | | | | Term Loan, 7.860%,
maturing March 24, 2014 | | | | | | | 7,569,168 | | |
See Accompanying Notes to Financial Statements
25
ING Senior Income Fund
PORTFOLIO OF INVESTMENTS as of August 31, 2007 (Unaudited) (continued)
| | | | | | | Bank Loan
Ratings† | | Market | |
| Principal Amount | | | | Borrower/Tranche Description | | Moody's | | S&P | | Value | |
| Aerospace & Defense: (continued) | | | |
| | | | | | | Wesco Aircraft Hardware Corporation | | B1 | | BB- | | | | | |
| $ | 1,472,500 | | | | | Term Loan, 7.610%,
maturing September 29, 2013 | | | | | | $ | 1,428,325 | | |
| | | | | | | Wyle Holdings, Inc. | | NR | | BB- | | | | | |
| | 1,750,418 | | | | | Term Loan, 8.110%,
maturing January 28, 2011 | | | | | | | 1,671,649 | | |
| | | | 43,502,297 | | |
| Automobile: 2.1% | | | |
| | | | | | | Dollar Thrifty Automotive Group, Inc. | | B1 | | BB | | | | | |
| | 1,000,000 | | | | | Term Loan, 7.340%,
maturing June 15, 2014 | | | | | | | 974,167 | | |
| | | | | | (1 | ) | | Federal-Mogul Corporation | | NR | | BBB+ | | | | | |
| | 1,500,000 | | | | | Debtor In Possession Term Loan, 7.250%,
maturing December 31, 2007 | | | | | | | 1,488,125 | | |
| | | | | | | Ford Motor Company | | Ba3 | | B+ | | | | | |
| | 2,227,500 | | | | | Term Loan, 8.360%,
maturing December 15, 2013 | | | | | | | 2,096,982 | | |
| | | | | | | Hertz Corporation | | Ba1 | | BB+ | | | | | |
| | 6,615,622 | | | | | Term Loan, 7.097%,
maturing December 21, 2012 | | | | | | | 6,437,238 | | |
| | 1,500,000 | | | | | Term Loan, 7.110%,
maturing December 21, 2012 | | | | | | | 1,459,554 | | |
| | | | | | | KAR Holdings, Inc. | | Ba3 | | B | | | | | |
| | 5,000,000 | | | | | Term Loan, 7.610%,
maturing October 20, 2013 | | | | | | | 4,709,375 | | |
| | | | | | | Navistar International Corporation | | NR | | NR | | | | | |
| | 1,200,000 | | | | | Revolver, 8.584%,
maturing January 19, 2012 | | | | | | | 1,156,500 | | |
| | | | | | | Oshkosh Truck Corporation | | Ba3 | | BBB- | | | | | |
| | 20,895,000 | | | | | Term Loan, 7.110%,
maturing December 06, 2013 | | | | | | | 20,170,215 | | |
| | | | | | | SAF-Holland Group GmbH | | NR | | NR | | | | | |
| | 1,420,523 | | | | | Term Loan, 7.715%,
maturing November 30, 2014 | | | | | | | 1,385,010 | | |
| | 1,346,400 | | | | | Term Loan, 8.215%,
maturing November 30, 2015 | | | | | | | 1,326,204 | | |
| | | | 41,203,370 | | |
| Beverage, Food & Tobacco: 2.9% | | | |
| | | | | | | Advance Food Company | | B1 | | BB- | | | | | |
| | 874,391 | | | | | Term Loan, 7.110%,
maturing March 16, 2014 | | | | | | | 826,299 | | |
| | | | | | | ARAMARK Corporation | | Ba3 | | BB- | | | | | |
| | 2,583,246 | | | | | Term Loan, 7.360%,
maturing January 26, 2014 | | | | | | | 2,497,353 | | |
| | 24,912,869 | | | | | Term Loan, 7.360%,
maturing January 26, 2014 | | | | | | | 24,084,516 | | |
| | 3,980,000 | | | | | Term Loan, 7.360%,
maturing January 26, 2014 | | | | | | | 3,847,665 | | |
| | | | | | | B&G Foods, Inc. | | Ba2 | | BB- | | | | | |
| | 847,826 | | | | | Term Loan, 7.510%,
maturing February 23, 2013 | | | | | | | 835,109 | | |
See Accompanying Notes to Financial Statements
26
ING Senior Income Fund
PORTFOLIO OF INVESTMENTS as of August 31, 2007 (Unaudited) (continued)
| | | | | | | Bank Loan
Ratings† | | Market | |
| Principal Amount | | | | Borrower/Tranche Description | | Moody's | | S&P | | Value | |
| Beverage, Food & Tobacco: (continued) | | | |
| | | | | | | Birds Eye Foods, Inc. | | B1 | | B+ | | | | | |
| $ | 864,167 | | | | | Term Loan, 7.110%,
maturing March 22, 2013 | | | | | | $ | 844,723 | | |
| | | | | | | Bolthouse Farms, Inc. | | B1 | | B+ | | | | | |
| | 1,940,227 | | | | | Term Loan, 7.625%,
maturing December 16, 2012 | | | | | | | 1,874,744 | | |
| | | | | | | Bumble Bee Foods, LLC | | B1 | | B+ | | | | | |
| | 1,800,000 | | | | | Term Loan, 7.107%,
maturing May 02, 2012 | | | | | | | 1,728,000 | | |
| | | | | | | Golden State Foods | | B1 | | B+ | | | | | |
| | 4,353,750 | | | | | Term Loan, 7.108%,
maturing February 28, 2011 | | | | | | | 4,288,444 | | |
| | | | | | | Iglo Birds Eye | | NR | | NR | | | | | |
| EUR | 568,424 | | | | | Term Loan, 6.550%,
maturing October 27, 2014 | | | | | | | 756,447 | | |
| EUR | 380,330 | | | | | Term Loan, 6.550%,
maturing October 27, 2014 | | | | | | | 506,135 | | |
| EUR | 380,330 | | | | | Term Loan, 6.925%,
maturing October 27, 2015 | | | | | | | 506,135 | | |
| EUR | 568,424 | | | | | Term Loan, 6.925%,
maturing October 27, 2015 | | | | | | | 759,835 | | |
| EUR | 51,247 | | | | | Term Loan, 6.605%,
maturing November 30, 2014 | | | | | | | 68,198 | | |
| EUR | 51,247 | | | | | Term Loan, 6.980%,
maturing November 30, 2015 | | | | | | | 68,503 | | |
| | | | | | | Michael Foods | | Ba3 | | BB- | | | | | |
| $ | 663,967 | | | | | Term Loan, 7.361%,
maturing November 21, 2010 | | | | | | | 641,143 | | |
| | | | | | | Pinnacle Foods Holding Corporation | | B2 | | B | | | | | |
| | 7,700,000 | | | | | Term Loan, 8.110%,
maturing April 02, 2014 | | | | | | | 7,379,164 | | |
| | | | | | | Sturm Foods, Inc. | | B1 | | B | | | | | |
| | 2,992,500 | | | | | Term Loan, 7.937%,
maturing January 31, 2014 | | | | | | | 2,797,988 | | |
| | | | | | | United Biscuits | | NR | | NR | | | | | |
| EUR | 775,940 | | | | | Term Loan, 6.879%,
maturing December 31, 2014 | | | | | | | 1,022,858 | | |
| GBP | 1,000,000 | | | | | Term Loan, 8.694%,
maturing December 31, 2014 | | | | | | | 1,950,916 | | |
| | | | | | | Van Houtte, Inc. | | B1 | | BB- | | | | | |
| $ | 150,000 | | | | | Term Loan, 7.860%,
maturing January 19, 2015 | | | | | | | 147,000 | | |
| | 1,100,000 | | | | | Term Loan, 7.860%,
maturing July 19, 2014 | | | | | | | 1,067,000 | | |
| | | | 58,498,175 | | |
| Buildings & Real Estate: 2.0% | | | |
| | | | | | | Armstrong World Industries, Inc. | | Ba2 | | BBB- | | | | | |
| | 862,750 | | | | | Term Loan, 7.288%,
maturing October 02, 2013 | | | | | | | 848,191 | | |
See Accompanying Notes to Financial Statements
27
ING Senior Income Fund
PORTFOLIO OF INVESTMENTS as of August 31, 2007 (Unaudited) (continued)
| | | | | | | Bank Loan
Ratings† | | Market | |
| Principal Amount | | | | Borrower/Tranche Description | | Moody's | | S&P | | Value | |
| Buildings & Real Estate: (continued) | | | |
| | | | | | | Capital Automotive, L.P. | | Ba1 | | BB+ | | | | | |
| $ | 9,994,732 | | | | | Term Loan, 7.070%,
maturing December 16, 2010 | | | | | | $ | 9,752,360 | | |
| | | | | | | Contech Construction Products, Inc. | | Ba3 | | BB | | | | | |
| | 2,710,278 | | | | | Term Loan, 7.395%,
maturing January 31, 2013 | | | | | | | 2,608,642 | | |
| | | | | | | Custom Building Products, Inc. | | B1 | | B+ | | | | | |
| | 4,901,962 | | | | | Term Loan, 7.758%,
maturing October 29, 2011 | | | | | | | 4,607,844 | | |
| | | | | | | Frans Bonhomme | | NR | | NR | | | | | |
| EUR | 500,000 | | | | | Term Loan, 6.625%,
maturing January 31, 2015 | | | | | | | 647,528 | | |
| EUR | 500,000 | | | | | Term Loan, 6.875%,
maturing January 31, 2016 | | | | | | | 650,735 | | |
| | | | | | | Headwaters, Inc. | | Ba2 | | BB+ | | | | | |
| $ | 3,547,856 | | | | | Term Loan, 7.360%,
maturing April 30, 2011 | | | | | | | 3,476,899 | | |
| | | | | | | Hearthstone Housing Partners II, LLC | | NR | | NR | | | | | |
| | 4,411,765 | | | | | Revolver, 5.434%,
maturing December 01, 2007 | | | | | | | 4,301,471 | | |
| | | | | | | John Maneely Company | | B3 | | B+ | | | | | |
| | 4,687,970 | | | | | Term Loan, 8.610%,
maturing December 08, 2013 | | | | | | | 4,234,798 | | |
| | | | | | | KCPC Acquisition, Inc. | | Ba2 | | B | | | | | |
| | 189,655 | | | | | Term Loan, 7.625%,
maturing May 22, 2014 | | | | | | | 179,224 | | |
| | 810,345 | | | | | Term Loan, 8.407%,
maturing May 22, 2014 | | | | | | | 765,776 | | |
| | | | | | | Lafarge Roofing | | NR | | NR | | | | | |
| EUR | 441,573 | | | | | Term Loan, 6.425%,
maturing March 31, 2015 | | | | | | | 573,817 | | |
| EUR | 180,337 | | | | | Term Loan, 6.425%,
maturing March 31, 2015 | | | | | | | 234,345 | | |
| $ | 169,425 | | | | | Term Loan, 7.500%,
maturing March 31, 2015 | | | | | | | 161,589 | | |
| EUR | 409,551 | | | | | Term Loan, 6.675%,
maturing March 31, 2016 | | | | | | | 534,995 | | |
| EUR | 210,674 | | | | | Term Loan, 6.675%,
maturing March 31, 2016 | | | | | | | 275,203 | | |
| $ | 171,654 | | | | | Term Loan, 7.750%,
maturing March 31, 2016 | | | | | | | 164,573 | | |
| | | | | | | Maguire Properties, Inc. | | Ba3 | | BB- | | | | | |
| | 386,683 | | | | | Term Loan, 7.565%,
maturing April 24, 2012 | | | | | | | 382,816 | | |
| | | | | | | Nortek, Inc. | | Ba2 | | B+ | | | | | |
| | 3,226,376 | | | | | Term Loan, 7.610%,
maturing August 27, 2011 | | | | | | | 3,093,288 | | |
| | | | | | | Shea Capital I, LLC | | Ba3 | | BB- | | | | | |
| | 992,500 | | | | | Term Loan, 7.360%,
maturing October 27, 2011 | | | | | | | 903,175 | | |
See Accompanying Notes to Financial Statements
28
ING Senior Income Fund
PORTFOLIO OF INVESTMENTS as of August 31, 2007 (Unaudited) (continued)
| | | | | | | Bank Loan
Ratings† | | Market | |
| Principal Amount | | | | Borrower/Tranche Description | | Moody's | | S&P | | Value | |
| Buildings & Real Estate: (continued) | | | |
| | | | | | | Tishman Speyer | | Ba2 | | BB- | | | | | |
| $ | 2,000,000 | | | | | Term Loan, 7.080%,
maturing December 27, 2012 | | | | | | $ | 1,940,000 | | |
| | | | 40,337,269 | | |
| Cargo Transport: 1.3% | | | |
| | | | | | | Baker Tanks, Inc. | | B1 | | B | | | | | |
| | 3,491,250 | | | | | Term Loan, 7.691%,
maturing May 08, 2014 | | | | | | | 3,399,605 | | |
| | | | | | | Dockwise Transport, N.V. | | NR | | NR | | | | | |
| | 1,000,000 | | | | | Term Loan, 8.235%,
maturing March 31, 2016 | | | | | | | 974,375 | | |
| | 1,368,524 | | | | | Term Loan, 7.735%,
maturing April 20, 2015 | | | | | | | 1,326,613 | | |
| | 1,000,000 | | | | | Term Loan, 7.735%,
maturing April 20, 2015 | | | | | | | 969,375 | | |
| | 1,368,524 | | | | | Term Loan, 8.235%,
maturing April 20, 2016 | | | | | | | 1,333,456 | | |
| | | | | | | Dockwise Transport, N.V. | | NR | | NR | | | | | |
| | 700,000 | | | | | Second Lien Term Loan, 9.860%,
maturing October 20, 2016 | | | | | | | 691,250 | | |
| | 750,000 | | | | | Second Lien Term Loan, 9.860%,
maturing September 30, 2016 | | | | | | | 740,625 | | |
| | | | | | | Gainey Corporation | | B2 | | BB | | | | | |
| | 1,188,000 | | | | | Term Loan, 8.097%,
maturing April 20, 2012 | | | | | | | 1,045,440 | | |
| | | | | | | Greatwide Logistics Services, Inc. | | B1 | | B | | | | | |
| | 3,233,750 | | | | | Term Loan, 8.860%,
maturing December 19, 2013 | | | | | | | 2,878,038 | | |
| | | | | | | Helm Holding Corporation | | B2 | | B+ | | | | | |
| | 973,805 | | | | | Term Loan, 7.607%,
maturing July 08, 2011 | | | | | | | 949,460 | | |
| | | | | | | Inmar, Inc. | | B1 | | B | | | | | |
| | 723,188 | | | | | Term Loan, 7.860%,
maturing April 30, 2013 | | | | | | | 706,916 | | |
| | | | | | | Kenan Advantage Group, Inc. | | B3 | | B+ | | | | | |
| | 985,007 | | | | | Term Loan, 8.360%,
maturing December 16, 2011 | | | | | | | 955,457 | | |
| | | | | | (2 | ) | | Neoplan USA Corporation | | NR | | NR | | | | | |
| | 497,738 | | | | (3 | ) | | Term Loan, 11.008%,
maturing June 30, 2006 | | | | | | | 418,100 | | |
| | | | | | | Railamerica Transportation Corporation | | NR | | NR | | | | | |
| | 5,100,000 | | | | | Term Loan, 7.810%,
maturing August 14, 2008 | | | | | | | 4,978,875 | | |
| | | | | | | TNT Logistics | | Ba2 | | BB- | | | | | |
| | 723,070 | | | | | Term Loan, 7.860%,
maturing November 04, 2013 | | | | | | | 707,931 | | |
| | 1,917,746 | | | | | Term Loan, 8.565%,
maturing November 04, 2013 | | | | | | | 1,898,568 | | |
| | | | | | | US Shipping Partners, L.P. | | B1 | | BB- | | | | | |
| | 836,578 | | | | | Term Loan, 8.845%,
maturing March 31, 2012 | | | | | | | 819,846 | | |
See Accompanying Notes to Financial Statements
29
ING Senior Income Fund
PORTFOLIO OF INVESTMENTS as of August 31, 2007 (Unaudited) (continued)
| | | | | | | Bank Loan
Ratings† | | Market | |
| Principal Amount | | | | Borrower/Tranche Description | | Moody's | | S&P | | Value | |
| Cargo Transport: (continued) | | | |
| $ | 1,980,000 | | | | | Term Loan, 8.850%,
maturing March 31, 2012 | | | | | | $ | 1,940,400 | | |
| | | | 26,734,330 | | |
| Cellular: 1.5% | | | |
| | | | | | | American Cellular Corporation | | B1 | | B- | | | | | |
| | 2,184,500 | | | | | Term Loan, 7.360%,
maturing March 15, 2014 | | | | | | | 2,167,570 | | |
| | | | | | | Centennial Communications Corporation | | Ba2 | | BB- | | | | | |
| | 15,581,024 | | | | | Term Loan, 7.373%,
maturing February 09, 2011 | | | | | | | 15,214,870 | | |
| | | | | | | Cricket Communications, Inc. | | Ba2 | | B+ | | | | | |
| | 5,940,000 | | | | | Term Loan, 7.360%,
maturing June 16, 2013 | | | | | | | 5,792,985 | | |
| | | | | | | NTELOS, Inc. | | Ba3 | | BB- | | | | | |
| | 5,344,410 | | | | | Term Loan, 7.820%,
maturing August 24, 2011 | | | | | | | 5,219,709 | | |
| | | | | | | Telepak, Inc. / Cellular South | | Ba3 | | B+ | | | | | |
| | 2,250,000 | | | | | Term Loan, 7.113%,
maturing May 29, 2014 | | | | | | | 2,190,938 | | |
| | | | 30,586,072 | | |
| Chemicals, Plastics & Rubber: 7.4% | | | |
| | | | | | | AZ Chem US, Inc. | | B1 | | BB- | | | | | |
| EUR | 759,590 | | | | | Term Loan, 6.360%,
maturing February 28, 2014 | | | | | | | 1,001,305 | | |
| | | | | | | AZ Chem US, Inc. | | Caa1 | | CCC+ | | | | | |
| $ | 333,333 | | | | | Second Lien Term Loan, 11.010%,
maturing February 28, 2014 | | | | | | | 312,222 | | |
| | | | | | | Borsodchem Nyrt. | | NR | | NR | | | | | |
| EUR | 804,394 | | | | | Term Loan, 6.495%,
maturing April 15, 2015 | | | | | | | 1,054,888 | | |
| EUR | 804,394 | | | | | Term Loan, 7.218%,
maturing April 15, 2016 | | | | | | | 1,060,368 | | |
| | | | | | | Brenntag Holding GmbH & Co. KG | | B1 | | B+ | | | | | |
| $ | 5,432,727 | | | | | Term Loan, 7.387%,
maturing January 17, 2014 | | | | | | | 5,245,977 | | |
| | 1,767,273 | | | | | Term Loan, 7.387%,
maturing January 17, 2014 | | | | | | | 1,706,523 | | |
| EUR | 500,000 | | | | | Term Loan, 6.367%,
maturing June 23, 2014 | | | | | | | 652,510 | | |
| GBP | 1,000,000 | | | | | Term Loan, 8.854%,
maturing September 21, 2014 | | | | | | | 1,925,710 | | |
| | | | | | | Celanese | | Ba3 | | BB | | | | | |
| $ | 5,900,000 | | | | | Term Loan, 5.320%,
maturing April 02, 2014 | | | | | | | 5,713,784 | | |
| | 13,067,250 | | | | | Term Loan, 7.110%,
maturing April 02, 2014 | | | | | | | 12,654,821 | | |
| | | | | | | Cristal Inorganic Chemicals, Inc. | | Ba3 | | B+ | | | | | |
| | 3,700,000 | | | | | Term Loan, 7.610%,
maturing May 15, 2014 | | | | | | | 3,542,750 | | |
See Accompanying Notes to Financial Statements
30
ING Senior Income Fund
PORTFOLIO OF INVESTMENTS as of August 31, 2007 (Unaudited) (continued)
| | | | | | | Bank Loan
Ratings† | | Market | |
| Principal Amount | | | | Borrower/Tranche Description | | Moody's | | S&P | | Value | |
| Chemicals, Plastics & Rubber: (continued) | | | |
| | | | | | | Cristal Inorganic Chemicals, Inc. | | B3 | | CCC+ | | | | | |
| $ | 1,150,000 | | | | | Second Lien Term Loan, 11.110%,
maturing November 21, 2014 | | | | | | $ | 1,101,125 | | |
| | | | | | | Flint Group | | NR | | NR | | | | | |
| | 2,333,333 | | | | | Term Loan, 7.620%,
maturing November 09, 2014 | | | | | | | 2,230,667 | | |
| | 936,821 | | | | | Term Loan, 7.824%,
maturing December 31, 2012 | | | | | | | 895,601 | | |
| | 1,290,100 | | | | | Term Loan, 8.324%,
maturing December 31, 2013 | | | | | | | 1,234,868 | | |
| EUR | 666,667 | | | | | Term Loan, 6.417%,
maturing December 31, 2014 | | | | | | | 868,934 | | |
| $ | 353,279 | | | | | Term Loan, 7.824%,
maturing December 31, 2014 | | | | | | | 337,735 | | |
| | | | | | | Hawkeye Renewables, LLC | | B3 | | NR | | | | | |
| | 3,712,500 | | | | | Term Loan, 9.370%,
maturing June 30, 2012 | | | | | | | 3,308,766 | | |
| | | | | | | HC Starck | | NR | | NR | | | | | |
| EUR | 83,333 | | | | | Term Loan, 6.675%,
maturing March 15, 2015 | | | | | | | 109,426 | | |
| $ | 323,225 | | | | | Term Loan, 7.750%,
maturing March 15, 2015 | | | | | | | 308,949 | | |
| EUR | 83,333 | | | | | Term Loan, 7.050%,
maturing March 15, 2016 | | | | | | | 109,993 | | |
| $ | 323,225 | | | | | Term Loan, 8.125%,
maturing March 15, 2016 | | | | | | | 310,565 | | |
| | | | | | | Hexion Specialty Chemicals, Inc. | | Ba3 | | B+ | | | | | |
| | 1,764,000 | | | | | Term Loan, 7.570%,
maturing May 05, 2013 | | | | | | | 1,724,940 | | |
| | 9,642,688 | | | | | Term Loan, 7.625%,
maturing May 05, 2013 | | | | | | | 9,429,170 | | |
| | 2,093,796 | | | | | Term Loan, 7.625%,
maturing May 05, 2013 | | | | | | | 2,047,433 | | |
| | 992,500 | | | | | Term Loan, 7.625%,
maturing May 05, 2013 | | | | | | | 970,523 | | |
| | | | | | | Huntsman International, LLC | | Ba1 | | BB+ | | | | | |
| | 9,976,617 | | | | | Term Loan, 7.250%,
maturing August 16, 2012 | | | | | | | 9,808,262 | | |
| | | | | | | Ineos US Finance, LLC | | Ba3 | | BB- | | | | | |
| | 3,474,070 | | | | | Term Loan, 7.580%,
maturing December 16, 2012 | | | | | | | 3,384,613 | | |
| | 4,455,000 | | | | | Term Loan, 7.580%,
maturing December 16, 2013 | | | | | | | 4,353,649 | | |
| EUR | 841,288 | | | | | Term Loan, 6.524%,
maturing December 23, 2013 | | | | | | | 1,120,177 | | |
| EUR | 841,288 | | | | | Term Loan, 7.024%,
maturing December 23, 2013 | | | | | | | 1,120,177 | | |
| $ | 4,455,000 | | | | | Term Loan, 8.080%,
maturing December 23, 2014 | | | | | | | 4,353,649 | | |
| EUR | 148,712 | | | | | Term Loan, 6.524%,
maturing February 21, 2014 | | | | | | | 198,011 | | |
See Accompanying Notes to Financial Statements
31
ING Senior Income Fund
PORTFOLIO OF INVESTMENTS as of August 31, 2007 (Unaudited) (continued)
| | | | | | | Bank Loan
Ratings† | | Market | |
| Principal Amount | | | | Borrower/Tranche Description | | Moody's | | S&P | | Value | |
| Chemicals, Plastics & Rubber: (continued) | | | |
| EUR | 148,712 | | | | | Term Loan, 7.024%,
maturing February 21, 2015 | | | | | | $ | 198,011 | | |
| | | | | | | Innophos, Inc. | | Ba1 | | BB- | | | | | |
| $ | 2,238,734 | | | | | Term Loan, 7.820%,
maturing August 13, 2010 | | | | | | | 2,193,959 | | |
| | | | | | | Invista | | Ba1 | | BBB- | | | | | |
| | 7,252,157 | | | | | Term Loan, 6.860%,
maturing April 29, 2011 | | | | | | | 7,052,722 | | |
| | 3,844,180 | | | | | Term Loan, 6.860%,
maturing April 29, 2011 | | | | | | | 3,738,465 | | |
| | | | | | | ISP Chemco, Inc. | | Ba3 | | BB- | | | | | |
| | 5,000,000 | | | | | Term Loan, 7.267%,
maturing June 04, 2014 | | | | | | | 4,820,835 | | |
| | | | | | | JohnsonDiversey, Inc. | | Ba2 | | BB- | | | | | |
| | 506,123 | | | | | Term Loan, 7.360%,
maturing December 16, 2010 | | | | | | | 495,157 | | |
| | 3,708,010 | | | | | Term Loan, 7.360%,
maturing December 16, 2011 | | | | | | | 3,627,669 | | |
| | | | | | | Kraton Polymers, LLC | | Ba3 | | B+ | | | | | |
| | 2,666,250 | | | | | Term Loan, 7.375%,
maturing May 12, 2013 | | | | | | | 2,544,048 | | |
| | | | | | | Lucite International US Finco, Ltd. | | Ba3 | | BB- | | | | | |
| EUR | 675,845 | | | | | Term Loan, 4.410%,
maturing July 07, 2013 | | | | | | | 901,271 | | |
| $ | 1,038,168 | | | | | Term Loan, 7.610%,
maturing July 07, 2013 | | | | | | | 1,016,107 | | |
| | 704,714 | | | | | Term Loan, 7.610%,
maturing July 07, 2013 | | | | | | | 689,739 | | |
| | | | | | | Lyondell Chemical Company | | Ba2 | | BB+ | | | | | |
| | 3,465,000 | | | | | Term Loan, 6.820%,
maturing August 16, 2013 | | | | | | | 3,434,681 | | |
| | | | | | | MacDermid, Inc. | | B1 | | BB- | | | | | |
| | 1,795,500 | | | | | Term Loan, 7.360%,
maturing April 12, 2014 | | | | | | | 1,710,214 | | |
| EUR | 1,197,000 | | | | | Term Loan, 6.414%,
maturing April 09, 2014 | | | | | | | 1,606,449 | | |
| | | | | | | Nalco Company | | Ba2 | | BB | | | | | |
| $ | 12,896,817 | | | | | Term Loan, 7.109%,
maturing November 04, 2010 | | | | | | | 12,637,088 | | |
| | | | | | | Northeast Biofuels, LLC | | B1 | | B+ | | | | | |
| | 1,268,293 | | | | | Term Loan, 8.610%,
maturing June 30, 2013 | | | | | | | 1,223,903 | | |
| | | | | | | Polypore, Inc. | | Ba3 | | BB- | | | | | |
| | 3,333,333 | | | | | Term Loan, 7.920%,
maturing July 03, 2014 | | | | | | | 3,175,000 | | |
| | | | | | | Rockwood Specialties Group, Inc. | | Ba2 | | BB | | | | | |
| | 9,745,669 | | | | | Term Loan, 7.108%,
maturing December 13, 2013 | | | | | | | 9,477,663 | | |
| | | | | | | Vertellus Specialties, Inc. | | B3 | | B+ | | | | | |
| | 2,351,250 | | | | | Term Loan, 8.610%,
maturing March 31, 2013 | | | | | | | 2,280,713 | | |
| | | | 147,021,785 | | |
See Accompanying Notes to Financial Statements
32
ING Senior Income Fund
PORTFOLIO OF INVESTMENTS as of August 31, 2007 (Unaudited) (continued)
| | | | | | | Bank Loan
Ratings† | | Market | |
| Principal Amount | | | | Borrower/Tranche Description | | Moody's | | S&P | | Value | |
| Containers, Packaging & Glass: 3.7% | | | |
| | | | | | | Berry Plastics Corporation | | Ba3 | | BB- | | | | | |
| $ | 11,938,875 | | | | | Term Loan, 7.359%,
maturing April 03, 2015 | | | | | | $ | 11,469,844 | | |
| | | | | | | Graham Packaging Company | | B1 | | B+ | | | | | |
| | 21,246,750 | | | | | Term Loan, 7.625%,
maturing October 07, 2011 | | | | | | | 20,759,838 | | |
| | | | | | | Graphic Packaging International, Inc. | | Ba2 | | BB- | | | | | |
| | 14,029,500 | | | | | Term Loan, 7.443%,
maturing May 16, 2014 | | | | | | | 13,865,818 | | |
| | | | | | | Klockner Pentaplast | | NR | | NR | | | | | |
| EUR | 2,250,000 | | | | | Term Loan, 6.704%,
maturing November 30, 2015 | | | | | | | 2,881,687 | | |
| $ | 2,499,375 | | | | | Term Loan, 7.830%,
maturing November 30, 2015 | | | | | | | 2,480,630 | | |
| | | | | | | Mauser AG | | NR | | NR | | | | | |
| EUR | 875,000 | | | | | Term Loan, 6.790%,
maturing June 13, 2013 | | | | | | | 1,132,578 | | |
| EUR | 875,000 | | | | | Term Loan, 7.040%,
maturing June 13, 2014 | | | | | | | 1,138,539 | | |
| $ | 1,179,779 | | | | | Term Loan, 7.884%,
maturing June 13, 2015 | | | | | | | 1,120,790 | | |
| | 1,179,779 | | | | | Term Loan, 8.134%,
maturing June 13, 2016 | | | | | | | 1,126,688 | | |
| | | | | | | Owens-Illinois | | Ba2 | | BB | | | | | |
| EUR | 2,199,375 | | | | | Term Loan, 5.642%,
maturing April 01, 2008 | | | | | | | 2,859,303 | | |
| | | | | | | Pro Mach, Inc. | | B1 | | B | | | | | |
| $ | 2,468,750 | | | | | Term Loan, 7.610%,
maturing December 01, 2011 | | | | | | | 2,431,719 | | |
| | | | | | | Smurfit-Stone Container Corporation | | Ba2 | | BB- | | | | | |
| | 5,554,831 | | | | | Term Loan, 7.375%,
maturing November 01, 2011 | | | | | | | 5,463,699 | | |
| | 3,201,438 | | | | | Term Loan, 7.375%,
maturing November 01, 2011 | | | | | | | 3,148,915 | | |
| | | | | | | Tegrant Holding Company | | NR | | NR | | | | | |
| | 498,750 | | | | | Term Loan, 8.110%,
maturing March 08, 2014 | | | | | | | 473,813 | | |
| | | | | | | Tegrant Holding Company | | NR | | NR | | | | | |
| | 500,000 | | | | | Second Lien Term Loan, 10.860%,
maturing March 08, 2015 | | | | | | | 475,000 | | |
| | | | | | | Xerium Technologies, Inc. | | B2 | | B+ | | | | | |
| | 3,589,779 | | | | | Term Loan, 8.110%,
maturing May 18, 2012 | | | | | | | 3,381,123 | | |
| | | | 74,209,984 | | |
| Data and Internet Services: 4.9% | | | |
| | | | | | | Activant Solutions, Inc. | | B1 | | B+ | | | | | |
| | 2,327,244 | | | | | Term Loan, 7.375%,
maturing May 02, 2013 | | | | | | | 2,181,791 | | |
| | | | | | | Acxiom Corporation | | Ba2 | | BB | | | | | |
| | 1,818,333 | | | | | Term Loan, 7.339%,
maturing September 15, 2012 | | | | | | | 1,777,421 | | |
See Accompanying Notes to Financial Statements
33
ING Senior Income Fund
PORTFOLIO OF INVESTMENTS as of August 31, 2007 (Unaudited) (continued)
| | | | | | | Bank Loan
Ratings† | | Market | |
| Principal Amount | | | | Borrower/Tranche Description | | Moody's | | S&P | | Value | |
| Data and Internet Services: (continued) | | | |
| | | | | | | Amadeus IT Group S.A. | | NR | | NR | | | | | |
| EUR | 768,581 | | | | | Term Loan, 6.567%,
maturing July 13, 2013 | | | | | | $ | 996,359 | | |
| EUR | 768,581 | | | | | Term Loan, 6.817%,
maturing July 31, 2013 | | | | | | | 1,000,770 | | |
| | | | | | | Audatex | | B1 | | B+ | | | | | |
| $ | 3,241,875 | | | | | Term Loan, 7.375%,
maturing May 16, 2014 | | | | | | | 3,075,729 | | |
| | | | | | | Carlson Wagonlit Holdings, B.V. | | Ba2 | | BB- | | | | | |
| | 2,750,000 | | | | | Term Loan, 7.610%,
maturing August 03, 2012 | | | | | | | 2,560,938 | | |
| | | | | | | IPayment, Inc. | | B1 | | B | | | | | |
| | 2,199,432 | | | | | Term Loan, 7.405%,
maturing May 10, 2013 | | | | | | | 2,078,463 | | |
| | | | | | | Open Text Corporation | | Ba3 | | BB | | | | | |
| | 2,060,483 | | | | | Term Loan, 8.008%,
maturing October 02, 2013 | | | | | | | 2,008,971 | | |
| | | | | | | Orbitz | | B1 | | BB- | | | | | |
| | 13,000,000 | | | | | Term Loan, 8.340%,
maturing July 24, 2014 | | | | | | | 12,675,000 | | |
| | | | | | | Reynolds & Reynolds Company | | Ba2 | | BB | | | | | |
| | 10,515,061 | | | | | Term Loan, 7.360%,
maturing October 26, 2012 | | | | | | | 10,114,174 | | |
| | | | | | | Reynolds & Reynolds Company | | B3 | | B | | | | | |
| | 2,125,000 | | | | | Second Lien Term Loan, 10.860%,
maturing October 26, 2013 | | | | | | | 2,114,375 | | |
| | | | | | | Sabre, Inc. | | B1 | | B+ | | | | | |
| | 18,867,064 | | | | | Term Loan, 7.608%,
maturing September 30, 2014 | | | | | | | 17,536,936 | | |
| | | | | | | Sitel, LLC | | B2 | | BB- | | | | | |
| | 4,380,572 | | | | | Term Loan, 7.912%,
maturing January 30, 2014 | | | | | | | 4,227,252 | | |
| | | | | | | Sungard Data Systems, Inc. | | Ba3 | | BB | | | | | |
| | 29,819,242 | | | | | Term Loan, 7.356%,
maturing February 28, 2014 | | | | | | | 28,982,276 | | |
| | | | | | | Transaction Network Services, Inc. | | B1 | | BB- | | | | | |
| | 2,674,312 | | | | | Term Loan, 7.541%,
maturing March 28, 2014 | | | | | | | 2,620,826 | | |
| | | | | | | Transfirst Holdings, Inc. | | B2 | | B | | | | | |
| | 875,000 | | | | | Term Loan, 8.110%,
maturing June 15, 2014 | | | | | | | 855,313 | | |
| | | | | | | Travelport, Inc. | | Ba3 | | BB- | | | | | |
| | 1,000,000 | | | | | Term Loan, 7.753%,
maturing August 22, 2013 | | | | | | | 963,750 | | |
| | 312,277 | | | | | Term Loan, 7.610%,
maturing August 23, 2013 | | | | | | | 300,410 | | |
| | 1,556,322 | | | | | Term Loan, 7.753%,
maturing August 23, 2013 | | | | | | | 1,497,182 | | |
| | | | | | | Verifone, Inc. | | B1 | | BB | | | | | |
| | 1,068,750 | | | | | Term Loan, 7.110%,
maturing October 31, 2013 | | | | | | | 1,031,344 | | |
| | | | 98,599,280 | | |
See Accompanying Notes to Financial Statements
34
ING Senior Income Fund
PORTFOLIO OF INVESTMENTS as of August 31, 2007 (Unaudited) (continued)
| | | | | | | Bank Loan
Ratings† | | Market | |
| Principal Amount | | | | Borrower/Tranche Description | | Moody's | | S&P | | Value | |
| Diversified / Conglomerate Manufacturing: 3.2% | | | |
| | | | | | | Aearo Technologies, Inc. | | B1 | | B | | | | | |
| $ | 2,400,000 | | | | | Term Loan, 7.610%,
maturing June 01, 2014 | | | | | | $ | 2,292,000 | | |
| | | | | | | Aearo Technologies, Inc. | | Caa1 | | B- | | | | | |
| | 1,800,000 | | | | | Term Loan, 10.860%,
maturing September 24, 2013 | | | | | | | 1,714,500 | | |
| | | | | | | Axia, Inc. | | B2 | | B | | | | | |
| | 2,462,500 | | | | | Term Loan, 10.110%,
maturing December 21, 2012 | | | | | | | 2,154,688 | | |
| | | | | | | Baldor Electric Company | | Ba3 | | BB+ | | | | | |
| | 3,869,551 | | | | | Term Loan, 7.125%,
maturing March 31, 2014 | | | | | | | 3,797,965 | | |
| | | | | | | BOC Edwards | | B1 | | BB- | | | | | |
| | 2,250,000 | | | | | Term Loan, 7.541%,
maturing May 31, 2014 | | | | | | | 2,098,125 | | |
| | | | | | | Brand Services, Inc. | | B1 | | B | | | | | |
| | 2,096,000 | | | | | Term Loan, 7.642%,
maturing February 07, 2014 | | | | | | | 2,001,680 | | |
| | | | | | | Brand Services, Inc. | | Caa1 | | CCC+ | | | | | |
| | 1,600,000 | | | | | Second Lien Term Loan, 11.450%,
maturing February 07, 2015 | | | | | | | 1,561,333 | | |
| | | | | | | Chart Industries, Inc. | | Ba2 | | BB | | | | | |
| | 1,333,334 | | | | | Term Loan, 7.387%,
maturing October 17, 2012 | | | | | | | 1,310,000 | | |
| | | | | | | Cinram International, Inc. | | B1 | | BB- | | | | | |
| | 2,775,770 | | | | | Term Loan, 7.360%,
maturing May 05, 2011 | | | | | | | 2,609,224 | | |
| | | | | | | Dresser, Inc. | | B2 | | B+ | | | | | |
| | 5,000,000 | | | | | Term Loan, 8.011%,
maturing May 04, 2014 | | | | | | | 4,831,250 | | |
| | | | | | | EPD, Inc. | | B1 | | B+ | | | | | |
| | 3,937,500 | | | | | Term Loan, 7.858%,
maturing July 31, 2014 | | | | | | | 3,799,688 | | |
| | | | | | | Ferretti S.P.A | | NR | | NR | | | | | |
| EUR | 900,000 | | | | | Term Loan, 4.084%,
maturing March 31, 2015 | | | | | | | 1,177,638 | | |
| EUR | 900,000 | | | | | Term Loan, 4.084%,
maturing March 31, 2016 | | | | | | | 1,184,644 | | |
| | | | | | | Generac Power Systems, Inc. | | B1 | | B | | | | | |
| $ | 4,455,000 | | | | | Term Loan, 7.860%,
maturing November 09, 2013 | | | | | | | 3,990,406 | | |
| | | | | | | Gentek Holding Corporation | | Ba3 | | BB- | | | | | |
| | 2,171,322 | | | | | Term Loan, 7.383%,
maturing February 28, 2011 | | | | | | | 2,122,467 | | |
| | 389,242 | | | | | Term Loan, 7.610%,
maturing February 28, 2011 | | | | | | | 380,484 | | |
| | | | | | | Goodman Global Holdings, Inc. | | Ba2 | | BB | | | | | |
| | 2,202,857 | | | | | Term Loan, 7.188%,
maturing December 23, 2011 | | | | | | | 2,147,786 | | |
| | | | | | | Itron, Inc. | | Ba3 | | B+ | | | | | |
| | 997,500 | | | | | Term Loan, 7.360%,
maturing April 18, 2014 | | | | | | | 980,044 | | |
See Accompanying Notes to Financial Statements
35
ING Senior Income Fund
PORTFOLIO OF INVESTMENTS as of August 31, 2007 (Unaudited) (continued)
| | | | | | | Bank Loan
Ratings† | | Market | |
| Principal Amount | | | | Borrower/Tranche Description | | Moody's | | S&P | | Value | |
| Diversified / Conglomerate Manufacturing: (continued) | | | |
| | | | | | | Mueller Group, Inc. | | Ba3 | | BB+ | | | | | |
| $ | 4,484,269 | | | | | Term Loan, 7.187%,
maturing May 24, 2014 | | | | | | $ | 4,374,965 | | |
| | | | | | | Norcross Safety Products, LLC | | Ba1 | | BB | | | | | |
| | 3,732,897 | | | | | Term Loan, 7.330%,
maturing June 30, 2012 | | | | | | | 3,658,239 | | |
| | | | | | | Rexnord Corporation / RBS Global, Inc. | | Ba2 | | BB- | | | | | |
| | 987,500 | | | | | Term Loan, 7.642%,
maturing July 19, 2013 | | | | | | | 959,109 | | |
| | 2,219,262 | | | | | Term Loan, 7.860%,
maturing July 19, 2013 | | | | | | | 2,155,459 | | |
| | | | | | | Sensata Technologies | | Ba3 | | BB | | | | | |
| EUR | 1,980,009 | | | | | Term Loan, 6.239%,
maturing April 27, 2013 | | | | | | | 2,589,852 | | |
| $ | 5,222,126 | | | | | Term Loan, 7.110%,
maturing April 27, 2013 | | | | | | | 5,000,185 | | |
| | | | | | | Sensus Metering Systems, Inc. | | Ba3 | | B+ | | | | | |
| | 219,105 | | | | | Term Loan, 7.374%,
maturing December 17, 2010 | | | | | | | 214,723 | | |
| | 2,329,894 | | | | | Term Loan, 7.405%,
maturing December 17, 2010 | | | | | | | 2,283,296 | | |
| | | | | | | Springs Window Fashions, LLC | | B1 | | B+ | | | | | |
| | 500,000 | | | | | Term Loan, 8.125%,
maturing December 30, 2012 | | | | | | | 478,750 | | |
| | 941,746 | | | | | Term Loan, 8.125%,
maturing December 31, 2012 | | | | | | | 901,722 | | |
| | | | | | | Textron Fastening Systems | | B2 | | B+ | | | | | |
| | 496,250 | | | | | Term Loan, 8.860%,
maturing August 11, 2013 | | | | | | | 483,844 | | |
| | | | 63,254,066 | | |
| Diversified / Conglomerate Service: 2.3% | | | |
| | | | | | | Affinion Group | | Ba2 | | BB | | | | | |
| | 4,087,961 | | | | | Term Loan, 8.000%,
maturing October 17, 2012 | | | | | | | 3,968,727 | | |
| | | | | | | AlixPartners, LLP | | B1 | | BB- | | | | | |
| | 2,661,625 | | | | | Term Loan, 7.610%,
maturing October 12, 2013 | | | | | | | 2,621,701 | | |
| | | | | | | Brickman Group | | Ba3 | | BB- | | | | | |
| | 2,493,750 | | | | | Term Loan, 7.340%,
maturing January 23, 2014 | | | | | | | 2,375,297 | | |
| | | | | | | Brock Holdings, Inc. | | B1 | | B | | | | | |
| | 1,790,513 | | | | | Term Loan, 7.360%,
maturing February 26, 2014 | | | | | | | 1,723,368 | | |
| | | | | | | CCC Information Services Group, Inc. | | B1 | | B | | | | | |
| | 864,074 | | | | | Term Loan, 7.860%,
maturing February 10, 2013 | | | | | | | 838,152 | | |
| | | | | | | Coach America Holdings, Inc. | | B1 | | B+ | | | | | |
| | 262,712 | | | | | Term Loan, 5.260%,
maturing April 20, 2014 | | | | | | | 252,860 | | |
| | 1,022,015 | | | | | Term Loan, 6.554%,
maturing April 20, 2014 | | | | | | | 983,689 | | |
See Accompanying Notes to Financial Statements
36
ING Senior Income Fund
PORTFOLIO OF INVESTMENTS as of August 31, 2007 (Unaudited) (continued)
| | | | | | | Bank Loan
Ratings† | | Market | |
| Principal Amount | | | | Borrower/Tranche Description | | Moody's | | S&P | | Value | |
| Diversified / Conglomerate Service: (continued) | | | |
| | | | | | | Fleetcor Technologies
Operating Company, LLC | | Ba3 | | B+ | | | | | |
| $ | 665,000 | | | | | Term Loan, 7.586%,
maturing April 30, 2013 | | | | | | $ | 641,725 | | |
| | | | | | | Intergraph Corporation | | B1 | | B+ | | | | | |
| | 2,873,972 | | | | | Term Loan, 7.453%,
maturing May 29, 2014 | | | | | | | 2,769,790 | | |
| | | | | | | ISS Global A/S | | NR | | NR | | | | | |
| EUR | 122,807 | | | | | Term Loan, 6.157%,
maturing December 31, 2013 | | | | | | | 160,273 | | |
| EUR | 877,193 | | | | | Term Loan, 6.157%,
maturing December 31, 2013 | | | | | | | 1,144,807 | | |
| | | | | | | ISTA International GmbH | | NR | | NR | | | | | |
| EUR | 2,502,783 | | | | | Term Loan, 6.344%,
maturing June 30, 2015 | | | | | | | 3,150,026 | | |
| EUR | 497,217 | | | | | Term Loan, 6.344%,
maturing June 30, 2015 | | | | | | | 625,802 | | |
| | | | | | | Mitchell International, Inc. | | Ba3 | | B+ | | | | | |
| $ | 798,000 | | | | | Term Loan, 7.375%,
maturing March 28, 2014 | | | | | | | 773,063 | | |
| | | | | | | Mitchell International, Inc. | | Caa1 | | CCC+ | | | | | |
| | 250,000 | | | | | Second Lien Term Loan, 10.625%,
maturing March 28, 2015 | | | | | | | 240,000 | | |
| | | | | | | Ohmstede | | B1 | | B | | | | | |
| | 2,195,652 | | | | | Term Loan, 7.875%,
maturing August 09, 2013 | | | | | | | 2,179,185 | | |
| | | | | | | Valley National Gases, Inc. | | Ba3 | | BB- | | | | | |
| | 1,630,000 | | | | | Term Loan, 7.640%,
maturing February 28, 2014 | | | | | | | 1,515,900 | | |
| | | | | | | Valley National Gases, Inc. | | B3 | | CCC+ | | | | | |
| | 500,000 | | | | | Second Lien Term Loan, 11.360%,
maturing August 28, 2014 | | | | | | | 492,500 | | |
| | | | | | | Valleycrest Companies, LLC | | B1 | | B+ | | | | | |
| | 1,991,883 | | | | | Term Loan, 7.360%,
maturing October 04, 2013 | | | | | | | 1,942,086 | | |
| | | | | | | Vertafore, Inc. | | B1 | | B+ | | | | | |
| | 4,089,750 | | | | | Term Loan, 8.005%,
maturing January 31, 2012 | | | | | | | 3,946,609 | | |
| | | | | | | West Corporation | | B1 | | BB- | | | | | |
| | 14,454,485 | | | | | Term Loan, 7.825%,
maturing October 24, 2013 | | | | | | | 14,038,918 | | |
| | | | 46,384,478 | �� | |
| Diversified Natural Resources, Precious Metals & Minerals: 2.3% | | | |
| | | | | | | Georgia Pacific Corporation | | Ba2 | | BB+ | | | | | |
| | 47,871,000 | | | | | Term Loan, 7.125%,
maturing December 20, 2012 | | | | | | | 45,965,351 | | |
| | | | 45,965,351 | | |
| Ecological: 0.6% | | | |
| | | | | | | Allied Waste North America, Inc. | | Ba3 | | BBB- | | | | | |
| | 3,686,346 | | | | | Term Loan, 6.783%,
maturing January 15, 2012 | | | | | | | 3,593,111 | | |
See Accompanying Notes to Financial Statements
37
ING Senior Income Fund
PORTFOLIO OF INVESTMENTS as of August 31, 2007 (Unaudited) (continued)
| | | | | | | Bank Loan
Ratings† | | Market | |
| Principal Amount | | | | Borrower/Tranche Description | | Moody's | | S&P | | Value | |
| Ecological: (continued) | | | |
| $ | 2,291,271 | | | | | Term Loan, 6.820%,
maturing January 15, 2012 | | | | | | $ | 2,233,320 | | |
| | | | | | | IESI Corporation | | B1 | | BB+ | | | | | |
| | 1,800,000 | | | | | Term Loan, 7.258%,
maturing January 21, 2012 | | | | | | | 1,770,750 | | |
| | | | | | | Synagro Technologies, Inc. | | Ba3 | | BB- | | | | | |
| | 1,100,000 | | | | | Term Loan, 7.500%,
maturing April 02, 2014 | | | | | | | 1,069,750 | | |
| | | | | | | Synagro Technologies, Inc. | | Caa1 | | B- | | | | | |
| | 590,000 | | | | | Second Lien Term Loan, 10.250%,
maturing October 02, 2014 | | | | | | | 569,350 | | |
| | | | | | | Wastequip, Inc. | | Ba3 | | BB- | | | | | |
| | 2,561,354 | | | | | Term Loan, 7.161%,
maturing February 05, 2013 | | | | | | | 2,458,900 | | |
| | 1,165,298 | | | | | Term Loan, 7.610%,
maturing February 05, 2013 | | | | | | | 1,118,686 | | |
| | | | 12,813,867 | | |
| Electronics: 0.9% | | | |
| | | | | | | Audio Visual Services Corporation | | Ba3 | | B+ | | | | | |
| | 1,500,000 | | | | | Term Loan, 7.610%,
maturing February 28, 2014 | | | | | | | 1,425,000 | | |
| | | | | | | Decision One | | NR | | NR | | | | | |
| | 434,324 | | | | | New Term Loan, 12.000%,
maturing April 15, 2010 | | | | | | | 390,892 | | |
| | | | | | | Euronet Worldwide, Inc. | | Ba2 | | BB | | | | | |
| | 873,684 | | | | | Term Loan, 7.380%,
maturing April 14, 2014 | | | | | | | 849,658 | | |
| | | | | | | Freescale Semiconductor, Inc. | | Baa3 | | BB+ | | | | | |
| | 2,638,889 | | | | | Term Loan, 7.110%,
maturing December 01, 2013 | | | | | | | 2,476,658 | | |
| | | | | | | Infor Global Solutions | | B1 | | B+ | | | | | |
| EUR | 995,000 | | | | | Term Loan, 7.164%,
maturing July 28, 2012 | | | | | | | 1,298,071 | | |
| $ | 500,000 | | | | | Term Loan, 8.110%,
maturing July 28, 2012 | | | | | | | 476,250 | | |
| | | | | | | Infor Global Solutions | | Caa2 | | CCC+ | | | | | |
| EUR | 500,000 | | | | | Second Lien Term Loan, 10.414%,
maturing March 02, 2014 | | | | | | | 652,297 | | |
| | | | | | | Kronos, Inc. | | Ba3 | | B+ | | | | | |
| $ | 3,000,000 | | | | | Term Loan, 7.610%,
maturing June 11, 2014 | | | | | | | 2,782,500 | | |
| | | | | | | NXP B.V. | | Ba2 | | BB | | | | | |
| | 1,750,000 | | | | | Floating Rate Note, 8.110%,
maturing October 15, 2013 | | | | | | | 1,585,938 | | |
| EUR | 1,500,000 | | | | | Floating Rate Note, 6.959%,
maturing October 15, 2013 | | | | | | | 1,808,719 | | |
| | | | | | | ON Semiconductor | | Ba1 | | BB | | | | | |
| $ | 2,686,396 | | | | | Term Loan, 7.110%,
maturing September 03, 2013 | | | | | | | 2,578,941 | | |
See Accompanying Notes to Financial Statements
38
ING Senior Income Fund
PORTFOLIO OF INVESTMENTS as of August 31, 2007 (Unaudited) (continued)
| | | | | | | Bank Loan
Ratings† | | Market | |
| Principal Amount | | | | Borrower/Tranche Description | | Moody's | | S&P | | Value | |
| Electronics: (continued) | | | |
| | | | | | | SI International, Inc. | | Ba3 | | B+ | | | | | |
| $ | 2,282,717 | | | | | Term Loan, 8.018%,
maturing February 09, 2011 | | | | | | $ | 2,248,476 | | |
| | | | 18,573,400 | | |
| Finance: 1.1% | | | |
| | | | | | | LPL Holdings, Inc. | | B1 | | B | | | | | |
| | 7,487,500 | | | | | Term Loan, 7.360%,
maturing June 28, 2013 | | | | | | | 7,188,000 | | |
| | | | | | | Nasdaq Stock Market, Inc. | | Ba3 | | BBB- | | | | | |
| | 3,996,455 | | | | | Term Loan, 7.315%,
maturing April 18, 2012 | | | | | | | 3,955,659 | | |
| | 2,316,652 | | | | | Term Loan, 7.315%,
maturing April 18, 2012 | | | | | | | 2,293,004 | | |
| | | | | | | Rent-A-Center, Inc. | | Ba2 | | BB+ | | | | | |
| | 2,496,642 | | | | | Term Loan, 7.155%,
maturing June 30, 2012 | | | | | | | 2,413,422 | | |
| | | | | | | Riskmetrics | | Ba3 | | BB- | | | | | |
| | 1,795,500 | | | | | Term Loan, 7.610%,
maturing January 11, 2014 | | | | | | | 1,755,101 | | |
| | | | | | | TD Ameritrade Holding Corporation | | Ba1 | | BB | | | | | |
| | 3,832,139 | | | | | Term Loan, 7.070%,
maturing December 31, 2012 | | | | | | | 3,742,563 | | |
| | | | 21,347,749 | | |
| Foreign Cable, Foreign TV, Radio and Equipment: 3.6% | | | |
| | | | | | | Casema Bidco | | NR | | NR | | | | | |
| EUR | 284,889 | | | | | Term Loan, 6.605%,
maturing November 14, 2014 | | | | | | | 378,019 | | |
| EUR | 583,333 | | | | | Term Loan, 6.605%,
maturing November 14, 2014 | | | | | | | 774,024 | | |
| EUR | 548,444 | | | | | Term Loan, 6.605%,
maturing November 14, 2014 | | | | | | | 727,729 | | |
| EUR | 583,333 | | | | | Term Loan, 7.105%,
maturing November 14, 2015 | | | | | | | 777,998 | | |
| EUR | 833,333 | | | | | Term Loan, 7.105%,
maturing November 14, 2015 | | | | | | | 1,111,425 | | |
| | | | | | | Com Hem | | NR | | NR | | | | | |
| SEK | 8,666,667 | | | | | Term Loan, 8.488%,
maturing April 30, 2015 | | | | | | | 1,246,998 | | |
| SEK | 8,000,000 | | | | | Term Loan, 8.738%,
maturing April 30, 2015 | | | | | | | 1,156,874 | | |
| | | | | | | Levana Holding 4 GmbH | | NR | | NR | | | | | |
| EUR | 1,122,227 | | | | | Term Loan, 6.119%,
maturing June 30, 2015 | | | | | | | 1,387,122 | | |
| EUR | 1,122,227 | | | | | Term Loan, 6.335%,
maturing June 30, 2016 | | | | | | | 1,398,589 | | |
| | | | | | | Numericable | | NR | | NR | | | | | |
| EUR | 2,480,685 | | | | | Term Loan, 6.780%,
maturing July 30, 2014 | | | | | | | 3,226,298 | | |
| EUR | 1,561,975 | | | | | Term Loan, 6.780%,
maturing July 30, 2014 | | | | | | | 2,031,454 | | |
See Accompanying Notes to Financial Statements
39
ING Senior Income Fund
PORTFOLIO OF INVESTMENTS as of August 31, 2007 (Unaudited) (continued)
| | | | | | | Bank Loan
Ratings† | | Market | |
| Principal Amount | | | | Borrower/Tranche Description | | Moody's | | S&P | | Value | |
| Foreign Cable, Foreign TV, Radio and Equipment: (continued) | | | |
| EUR | 957,340 | | | | | Term Loan, 6.780%,
maturing July 30, 2014 | | | | | | $ | 1,245,085 | | |
| EUR | 1,305,125 | | | | | Term Loan, 7.030%,
maturing July 30, 2014 | | | | | | | 1,709,993 | | |
| EUR | 694,875 | | | | | Term Loan, 7.030%,
maturing July 30, 2014 | | | | | | | 910,435 | | |
| | | | | | | ProSiebenSat.1 Media AG | | NR | | NR | | | | | |
| EUR | 146,593 | | | | | Term Loan, 6.551%,
maturing May 09, 2015 | | | | | | | 182,693 | | |
| EUR | 3,258,145 | | | | | Term Loan, 6.551%,
maturing May 09, 2015 | | | | | | | 4,135,415 | | |
| | | | | | | TDF SA | | NR | | NR | | | | | |
| EUR | 1,500,000 | | | | | Term Loan, 6.373%,
maturing January 31, 2015 | | | | | | | 1,947,031 | | |
| EUR | 1,500,000 | | | | | Term Loan, 6.625%,
maturing January 31, 2016 | | | | | | | 1,955,548 | | |
| | | | | | | UPC Financing Partnership | | Ba3 | | B | | | | | |
| EUR | 4,535,928 | | | | | Term Loan, 6.302%,
maturing December 31, 2014 | | | | | | | 5,860,889 | | |
| EUR | 6,215,000 | | | | | Term Loan, 6.302%,
maturing December 31, 2014 | | | | | | | 7,999,177 | | |
| EUR | 3,722,638 | | | | | Term Loan, 6.302%,
maturing December 31, 2014 | | | | | | | 4,805,809 | | |
| $ | 7,000,000 | | | | | Term Loan, 7.130%,
maturing December 31, 2014 | | | | | | | 6,568,331 | | |
| | | | | | | Virgin Media Investment Holdings, Ltd. | | Ba2 | | BB | | | | | |
| GBP | 1,325,843 | | | | | Term Loan, 8.286%,
maturing December 31, 2012 | | | | | | | 2,578,557 | | |
| GBP | 674,157 | | | | | Term Loan, 8.286%,
maturing December 31, 2012 | | | | | | | 1,311,131 | | |
| GBP | 4,034,412 | | | | | Term Loan, 8.283%,
maturing September 03, 2012 | | | | | | | 7,846,302 | | |
| GBP | 4,715,588 | | | | | Term Loan, 8.283%,
maturing September 03, 2012 | | | | | | | 9,171,083 | | |
| | | | 72,444,009 | | |
| Gaming: 2.7% | | | |
| | | | | | | Cannery Casino Resorts, LLC | | B2 | | BB | | | | | |
| $ | 118,110 | | | | | Term Loan, 2.720%,
maturing May 18, 2013 | | | | | | | 111,909 | | |
| | 1,653,543 | | | | | Term Loan, 7.760%,
maturing May 18, 2013 | | | | | | | 1,566,732 | | |
| | | | | | | CCM Merger, Inc. | | Ba3 | | BB- | | | | | |
| | 3,585,610 | | | | | Term Loan, 7.388%,
maturing July 13, 2012 | | | | | | | 3,487,006 | | |
| | | | | | | Fontainebleau Las Vegas, LLC | | B1 | | B+ | | | | | |
| | 2,666,667 | | | | | Term Loan, 8.610%,
maturing June 06, 2014 | | | | | | | 2,514,445 | | |
| | | | | | | Golden Nugget, Inc. | | B1 | | BB- | | | | | |
| | 1,113,636 | | | | | Term Loan, 7.552%,
maturing June 30, 2014 | | | | | | | 1,060,739 | | |
See Accompanying Notes to Financial Statements
40
ING Senior Income Fund
PORTFOLIO OF INVESTMENTS as of August 31, 2007 (Unaudited) (continued)
| | | | | | | Bank Loan
Ratings† | | Market | |
| Principal Amount | | | | Borrower/Tranche Description | | Moody's | | S&P | | Value | |
| Gaming: (continued) | | | |
| | | | | | | Green Valley Ranch Gaming, LLC | | B1 | | BB- | | | | | |
| $ | 961,136 | | | | | Term Loan, 7.542%,
maturing February 16, 2014 | | | | | | $ | 917,885 | | |
| | | | | | | Green Valley Ranch Gaming, LLC | | Caa1 | | CCC+ | | | | | |
| | 500,000 | | | | | Second Lien Term Loan, 8.791%,
maturing August 16, 2014 | | | | | | | 475,000 | | |
| | | | | | | Greenwood Racing, Inc. | | B2 | | BB- | | | | | |
| | 1,492,500 | | | | | Term Loan, 7.800%,
maturing November 28, 2011 | | | | | | | 1,436,531 | | |
| | | | | | | Isle Of Capri Casinos, Inc. | | Ba3 | | BB+ | | | | | |
| | 1,176,471 | | | | | Term Loan, 7.250%,
maturing November 25, 2013 | | | | | | | 1,129,412 | | |
| | 2,941,176 | | | | | Term Loan, 7.255%,
maturing November 25, 2013 | | | | | | | 2,823,529 | | |
| | | | | | | Las Vegas Sands, LLC | | Ba3 | | BB | | | | | |
| | 6,400,000 | | | | | Term Loan, 7.110%,
maturing May 23, 2014 | | | | | | | 6,104,800 | | |
| | | | | | | Mississippi Band Of Choctaw Indians | | Ba2 | | BB+ | | | | | |
| | 1,923,913 | | | | | Term Loan, 7.074%,
maturing November 14, 2011 | | | | | | | 1,890,245 | | |
| | | | | | | New World Gaming Partners, Ltd. | | Ba3 | | BB- | | | | | |
| | 3,750,000 | | | | (3 | ) | | Term Loan,
maturing June 06, 2014 | | | | | | | 3,618,750 | | |
| | | | | | | Penn National Gaming, Inc. | | Ba2 | | BBB- | | | | | |
| | 7,126,744 | | | | | Term Loan, 7.110%,
maturing October 03, 2012 | | | | | | | 7,043,596 | | |
| | | | | | | Riviera Holdings Corporation | | B2 | | BB- | | | | | |
| | 500,000 | | | | | Term Loan, 7.360%,
maturing June 08, 2014 | | | | | | | 487,500 | | |
| | | | | | | Seminole Tribe Of Florida | | Ba1 | | BBB- | | | | | |
| | 427,530 | | | | | Term Loan, 5.410%,
maturing March 05, 2014 | | | | | | | 417,376 | | |
| | 1,923,887 | | | | | Term Loan, 6.875%,
maturing March 05, 2014 | | | | | | | 1,878,194 | | |
| | 1,906,073 | | | | | Term Loan, 6.875%,
maturing March 05, 2014 | | | | | | | 1,860,804 | | |
| | | | | | | Tropicana Entertainment - Landco | | B2 | | BB- | | | | | |
| | 3,000,000 | | | | | Term Loan, 7.610%,
maturing July 03, 2008 | | | | | | | 2,947,500 | | |
| | | | | | | Trump Entertainment Resorts Holdings, L.P. | | Ba3 | | BB- | | | | | |
| | 1,715,000 | | | | | Term Loan, 7.847%,
maturing May 20, 2012 | | | | | | | 1,687,131 | | |
| | 1,715,000 | | | | | Term Loan, 7.900%,
maturing May 20, 2012 | | | | | | | 1,687,131 | | |
| | | | | | | VML US Finance, LLC | | B1 | | BB- | | | | | |
| | 5,800,000 | | | | | Term Loan, 7.610%,
maturing May 25, 2013 | | | | | | | 5,635,321 | | |
| | 2,400,000 | | | | | Term Loan, 7.741%,
maturing May 26, 2012 | | | | | | | 2,331,857 | | |
| | | | 53,113,393 | | |
See Accompanying Notes to Financial Statements
41
ING Senior Income Fund
PORTFOLIO OF INVESTMENTS as of August 31, 2007 (Unaudited) (continued)
| | | | | | | Bank Loan
Ratings† | | Market | |
| Principal Amount | | | | Borrower/Tranche Description | | Moody's | | S&P | | Value | |
| Grocery: 0.2% | | | |
| | | | | | | Roundys Supermarkets, Inc. | | Ba3 | | B+ | | | | | |
| $ | 4,412,825 | | | | | Term Loan, 8.110%,
maturing November 03, 2011 | | | | | | $ | 4,363,181 | | |
| | | | 4,363,181 | | |
| Healthcare, Education and Childcare: 12.6% | | | |
| | | | | | | Accellent, Inc. | | B1 | | BB- | | | | | |
| | 2,955,000 | | | | | Term Loan, 8.010%,
maturing November 22, 2012 | | | | | | | 2,814,638 | | |
| | | | | | | Advanced Medical Optics, Inc. | | Ba1 | | BB- | | | | | |
| | 997,500 | | | | | Term Loan, 7.115%,
maturing April 02, 2014 | | | | | | | 940,767 | | |
| | | | | | | AGA Medical Corporation | | B1 | | BB- | | | | | |
| | 3,722,471 | | | | | Term Loan, 7.360%,
maturing April 28, 2013 | | | | | | | 3,629,409 | | |
| | | | | | | Amn Healthcare, Inc. | | Ba2 | | BB- | | | | | |
| | 711,742 | | | | | Term Loan, 7.110%,
maturing November 02, 2011 | | | | | | | 691,279 | | |
| | | | | | | Biomet, Inc. | | B1 | | BB- | | | | | |
| | 20,500,000 | | | | (3 | ) | | Term Loan,
maturing January 15, 2015 | | | | | | | 19,731,250 | | |
| | | | | | | Capella Healthcare, Inc. | | B1 | | B+ | | | | | |
| | 5,715,778 | | | | | Term Loan, 7.860%,
maturing November 30, 2012 | | | | | | | 5,472,857 | | |
| | | | | | | Catalent Pharma Solutions | | Ba3 | | B+ | | | | | |
| | 5,755,555 | | | | | Term Loan, 7.610%,
maturing April 10, 2014 | | | | | | | 5,304,705 | | |
| | | | | | | CHG Medical Staffing, Inc. | | Ba3 | | B+ | | | | | |
| | 1,592,000 | | | | | Term Loan, 7.855%,
maturing December 20, 2012 | | | | | | | 1,528,320 | | |
| | 400,000 | | | | | Term Loan, 7.860%,
maturing June 20, 2012 | | | | | | | 384,000 | | |
| | | | | | | CHS/Community Health Systems, Inc. | | Ba3 | | BB | | | | | |
| | 45,968,291 | | | | | Term Loan, 7.756%,
maturing July 25, 2014 | | | | | | | 44,330,670 | | |
| | | | | | | Concentra Operating Corporation | | Ba2 | | B+ | | | | | |
| | 2,800,000 | | | | | Term Loan, 7.610%,
maturing June 25, 2014 | | | | | | | 2,618,000 | | |
| | | | | | | CRC Health Corporation | | Ba3 | | BB- | | | | | |
| | 1,825,842 | | | | | Term Loan, 7.610%,
maturing February 06, 2013 | | | | | | | 1,782,478 | | |
| | 1,479,470 | | | | | Term Loan, 7.610%,
maturing February 06, 2013 | | | | | | | 1,444,332 | | |
| | | | | | | Davita, Inc. | | Ba1 | | BB+ | | | | | |
| | 9,999,007 | | | | | Term Loan, 6.877%,
maturing October 05, 2012 | | | | | | | 9,729,034 | | |
| | | | | | | Education Management Corporation | | B2 | | B+ | | | | | |
| | 8,440,586 | | | | | Term Loan, 7.125%,
maturing June 01, 2013 | | | | | | | 8,054,311 | | |
| | | | | | | Emdeon Business Services, LLC | | B1 | | BB- | | | | | |
| | 2,925,397 | | | | | Term Loan, 7.610%,
maturing November 16, 2013 | | | | | | | 2,808,381 | | |
See Accompanying Notes to Financial Statements
42
ING Senior Income Fund
PORTFOLIO OF INVESTMENTS as of August 31, 2007 (Unaudited) (continued)
| | | | | | | Bank Loan
Ratings† | | Market | |
| Principal Amount | | | | Borrower/Tranche Description | | Moody's | | S&P | | Value | |
| Healthcare, Education and Childcare: (continued) | | | |
| | | | | | | EMSC, L.P. | | Ba2 | | B+ | | | | | |
| $ | 3,218,852 | | | | | Term Loan, 7.355%,
maturing February 10, 2012 | | | | | | $ | 3,142,404 | | |
| | | | | | | Gambro | | NR | | NR | | | | | |
| SEK | 2,479,288 | | | | | Term Loan, 6.110%,
maturing June 05, 2014 | | | | | | | 347,386 | | |
| SEK | 2,520,712 | | | | | Term Loan, 6.110%,
maturing June 05, 2014 | | | | | | | 353,190 | | |
| $ | 750,000 | | | | | Term Loan, 7.870%,
maturing June 05, 2014 | | | | | | | 724,875 | | |
| SEK | 2,479,288 | | | | | Term Loan, 6.610%,
maturing June 05, 2015 | | | | | | | 348,823 | | |
| SEK | 2,520,712 | | | | | Term Loan, 6.610%,
maturing June 05, 2015 | | | | | | | 354,652 | | |
| $ | 750,000 | | | | | Term Loan, 8.370%,
maturing June 05, 2015 | | | | | | | 727,875 | | |
| | | | | | | Gentiva Health Services, Inc. | | Ba3 | | BB- | | | | | |
| | 3,459,459 | | | | | Term Loan, 7.346%,
maturing March 31, 2013 | | | | | | | 3,381,622 | | |
| | | | | | | Golden Gate National Senior
Care Holdings, LLC | | Ba3 | | BB- | | | | | |
| | 1,643,786 | | | | | Term Loan, 8.258%,
maturing March 14, 2011 | | | | | | | 1,594,472 | | |
| | | | | | | Harlan Sprague Dawley, Inc. | | B2 | | BB- | | | | | |
| | 3,616,667 | | | | | Term Loan, 7.860%,
maturing July 11, 2014 | | | | | | | 3,472,000 | | |
| | | | | | | Harrington Holdings, Inc. | | B1 | | BB- | | | | | |
| | 2,660,000 | | | | | Term Loan, 7.360%,
maturing December 31, 2013 | | | | | | | 2,553,600 | | |
| | | | | | | HCA, Inc. | | Ba3 | | BB | | | | | |
| | 33,890,000 | | | | | Term Loan, 7.610%,
maturing November 17, 2013 | | | | | | | 32,743,569 | | |
| | | | | | | Health Management Associates, Inc. | | Ba2 | | BB- | | | | | |
| | 8,977,500 | | | | | Term Loan, 7.110%,
maturing February 28, 2014 | | | | | | | 8,471,115 | | |
| | | | | | | Healthsouth Corporation | | B2 | | BB- | | | | | |
| | 2,448,144 | | | | | Term Loan, 7.860%,
maturing March 10, 2013 | | | | | | | 2,364,295 | | |
| | | | | | | Iasis Healthcare, LLC | | Ba2 | | B+ | | | | | |
| | 926,471 | | | | | Term Loan, 5.573%,
maturing March 15, 2014 | | | | | | | 871,462 | | |
| | 3,654,989 | | | | | Term Loan, 7.360%,
maturing March 15, 2014 | | | | | | | 3,437,974 | | |
| | 333,863 | | | | | Term Loan, 7.619%,
maturing March 15, 2014 | | | | | | | 314,040 | | |
| | | | | | | IM US Holdings, LLC | | B1 | | BB | | | | | |
| | 5,000,000 | | | | | Term Loan, 7.340%,
maturing June 26, 2014 | | | | | | | 4,806,250 | | |
| | | | | | | IM US Holdings, LLC | | Caa1 | | B- | | | | | |
| | 750,000 | | | | | Second Lien Term Loan, 9.590%,
maturing June 26, 2015 | | | | | | | 742,500 | | |
See Accompanying Notes to Financial Statements
43
ING Senior Income Fund
PORTFOLIO OF INVESTMENTS as of August 31, 2007 (Unaudited) (continued)
| | | | | | | Bank Loan
Ratings† | | Market | |
| Principal Amount | | | | Borrower/Tranche Description | | Moody's | | S&P | | Value | |
| Healthcare, Education and Childcare: (continued) | | | |
| | | | | | | inVentiv Health, Inc. | | Ba3 | | BB- | | | | | |
| $ | 1,414,286 | | | | | Term Loan, 7.110%,
maturing July 15, 2014 | | | | | | $ | 1,357,714 | | |
| | | | | | | Lifepoint Hospitals, Inc. | | Ba2 | | BB | | | | | |
| | 2,567,536 | | | | | Term Loan, 6.985%,
maturing April 15, 2012 | | | | | | | 2,488,638 | | |
| | | | | | | Multiplan, Inc. | | B1 | | B+ | | | | | |
| | 2,072,471 | | | | | Term Loan, 8.065%,
maturing April 12, 2013 | | | | | | | 2,009,001 | | |
| | | | | | | National Mentor, Inc. | | B1 | | B+ | | | | | |
| | 76,667 | | | | | Term Loan, 7.320%,
maturing June 29, 2013 | | | | | | | 72,067 | | |
| | 1,244,100 | | | | | Term Loan, 7.432%,
maturing June 29, 2013 | | | | | | | 1,169,454 | | |
| | | | | | | Nycomed | | NR | | NR | | | | | |
| EUR | 543,619 | | | | | Term Loan, 6.664%,
maturing December 10, 2014 | | | | | | | 700,962 | | |
| EUR | 1,418,795 | | | | | Term Loan, 6.664%,
maturing December 10, 2014 | | | | | | | 1,829,445 | | |
| EUR | 87,538 | | | | | Term Loan, 6.664%,
maturing December 10, 2014 | | | | | | | 112,874 | | |
| EUR | 55,762 | | | | | Term Loan, 6.664%,
maturing December 10, 2014 | | | | | | | 71,902 | | |
| EUR | 394,286 | | | | | Term Loan, 6.664%,
maturing December 10, 2014 | | | | | | | 508,406 | | |
| EUR | 543,619 | | | | | Term Loan, 7.164%,
maturing December 10, 2014 | | | | | | | 700,962 | | |
| EUR | 394,286 | | | | | Term Loan, 7.164%,
maturing December 10, 2014 | | | | | | | 508,406 | | |
| EUR | 55,762 | | | | | Term Loan, 7.164%,
maturing December 10, 2014 | | | | | | | 71,902 | | |
| EUR | 87,538 | | | | | Term Loan, 7.164%,
maturing December 10, 2014 | | | | | | | 112,874 | | |
| EUR | 1,418,795 | | | | | Term Loan, 7.164%,
maturing December 10, 2014 | | | | | | | 1,829,445 | | |
| | | | | | | Orthofix International | | Ba3 | | BB+ | | | | | |
| $ | 1,875,909 | | | | | Term Loan, 7.110%,
maturing September 22, 2013 | | | | | | | 1,814,942 | | |
| | | | | | | Quintiles Transnational Corporation | | B1 | | BB | | | | | |
| | 5,283,125 | | | | | Term Loan, 7.360%,
maturing March 31, 2013 | | | | | | | 5,045,384 | | |
| | | | | | | ReAble Therapeutics Finance, LLC | | Ba3 | | B+ | | | | | |
| | 1,736,875 | | | | | Term Loan, 7.837%,
maturing November 03, 2013 | | | | | | | 1,702,138 | | |
| | | | | | | Renal Advantage, Inc. | | NR | | B+ | | | | | |
| | 4,662,069 | | | | | Term Loan, 7.860%,
maturing October 06, 2012 | | | | | | | 4,481,414 | | |
| | | | | | | Rural/Metro Operating Company, LLC | | Ba2 | | BB- | | | | | |
| | 519,127 | | | | | Revolver, 5.190%,
maturing March 04, 2011 | | | | | | | 497,064 | | |
See Accompanying Notes to Financial Statements
44
ING Senior Income Fund
PORTFOLIO OF INVESTMENTS as of August 31, 2007 (Unaudited) (continued)
| | | | | | | Bank Loan
Ratings† | | Market | |
| Principal Amount | | | | Borrower/Tranche Description | | Moody's | | S&P | | Value | |
| Healthcare, Education and Childcare: (continued) | | | |
| $ | 1,094,117 | | | | | Term Loan, 7.747%,
maturing March 04, 2011 | | | | | | $ | 1,047,617 | | |
| | | | | | | Select Medical Corporation | | Ba2 | | BB- | | | | | |
| | 2,443,750 | | | | | Term Loan, 7.363%,
maturing February 24, 2012 | | | | | | | 2,325,636 | | |
| | | | | | | Sterigenics International, Inc. | | B2 | | BB- | | | | | |
| | 2,481,250 | | | | | Term Loan, 7.610%,
maturing November 21, 2013 | | | | | | | 2,394,406 | | |
| | | | | | | Stiefel Laboratories, Inc. | | Ba3 | | BB- | | | | | |
| | 2,114,175 | | | | | Term Loan, 7.610%,
maturing December 28, 2013 | | | | | | | 2,053,393 | | |
| | 1,617,075 | | | | | Term Loan, 7.610%,
maturing December 28, 2013 | | | | | | | 1,570,584 | | |
| | | | | | | Sun Healthcare Group, Inc. | | Ba2 | | B+ | | | | | |
| | 152,874 | | | | | Term Loan, 4.702%,
maturing April 12, 2014 | | | | | | | 148,288 | | |
| | 305,747 | | | | | Term Loan, 7.360%,
maturing April 12, 2014 | | | | | | | 296,575 | | |
| | 1,198,745 | | | | | Term Loan, 7.367%,
maturing April 12, 2014 | | | | | | | 1,162,783 | | |
| | | | | | | Surgical Care Affiliates, LLC | | Ba3 | | B | | | | | |
| | 3,000,000 | | | | | Term Loan, 7.815%,
maturing December 29, 2014 | | | | | | | 2,730,000 | | |
| | | | | | | Team Health, Inc. | | B1 | | BB- | | | | | |
| | 2,737,038 | | | | | Term Loan, 7.348%,
maturing November 23, 2012 | | | | | | | 2,586,501 | | |
| | | | | | | United Surgical Partners International, Inc. | | Ba3 | | B | | | | | |
| | 256,048 | | | | | Term Loan, 5.156%,
maturing April 19, 2014 | | | | | | | 240,365 | | |
| | 2,091,532 | | | | | Term Loan, 7.381%,
maturing April 19, 2014 | | | | | | | 1,963,426 | | |
| | | | | | | Vanguard Health Holdings Company II, LLC | | Ba3 | | B+ | | | | | |
| | 10,999,656 | | | | | Term Loan, 7.610%,
maturing September 23, 2011 | | | | | | | 10,573,419 | | |
| | | | | | | Viant Holdings, Inc. | | Ba3 | | B+ | | | | | |
| | 1,000,000 | | | | | Term Loan, 7.610%,
maturing June 25, 2014 | | | | | | | 940,000 | | |
| | | | | | | VWR International, Inc. | | B1 | | B+ | | | | | |
| EUR | 2,500,000 | | | | | Term Loan, 6.664%,
maturing June 29, 2014 | | | | | | | 3,270,000 | | |
| $ | 4,500,000 | | | | | Term Loan, 7.860%,
maturing June 29, 2014 | | | | | | | 4,190,625 | | |
| | | | | | | Warner Chilcott Holdings Company III, Ltd. | | B1 | | BB- | | | | | |
| | 4,801,635 | | | | | Term Loan, 7.360%,
maturing January 18, 2012 | | | | | | | 4,645,582 | | |
| | 1,322,807 | | | | | Term Loan, 7.360%,
maturing January 18, 2012 | | | | | | | 1,279,816 | | |
| | | | 252,520,545 | | |
See Accompanying Notes to Financial Statements
45
ING Senior Income Fund
PORTFOLIO OF INVESTMENTS as of August 31, 2007 (Unaudited) (continued)
| | | | | | | Bank Loan
Ratings† | | Market | |
| Principal Amount | | | | Borrower/Tranche Description | | Moody's | | S&P | | Value | |
| Home & Office Furnishings: 1.1% | | | |
| | | | | | | Buhrmann US, Inc. | | Ba2 | | BB+ | | | | | |
| $ | 4,295,754 | | | | | Term Loan, 7.344%,
maturing December 23, 2010 | | | | | | $ | 4,193,729 | | |
| | | | | | | Global Garden Products Italy S.P.A. | | NR | | NR | | | | | |
| EUR | 1,250,000 | | | | | Term Loan, 6.539%,
maturing May 14, 2015 | | | | | | | 1,661,611 | | |
| EUR | 1,250,000 | | | | | Term Loan, 7.039%,
maturing May 14, 2016 | | | | | | | 1,670,127 | | |
| | | | | | | Hilding Anders | | NR | | NR | | | | | |
| SEK | 20,428,571 | | | | | Term Loan, 5.960%,
maturing December 15, 2014 | | | | | | | 2,902,333 | | |
| EUR | 371,429 | | | | | Term Loan, 6.414%,
maturing December 15, 2014 | | | | | | | 493,040 | | |
| | | | | | | National Bedding Company | | B1 | | BB- | | | | | |
| $ | 4,170,231 | | | | | Term Loan, 7.431%,
maturing August 31, 2011 | | | | | | | 3,947,821 | | |
| | | | | | | Simmons Company | | Ba2 | | B+ | | | | | |
| | 7,217,057 | | | | | Term Loan, 7.405%,
maturing December 19, 2011 | | | | | | | 7,036,630 | | |
| | | | 21,905,291 | | |
| Insurance: 1.1% | | | |
| | | | | | | AmWINS Group, Inc. | | B2 | | B- | | | | | |
| | 2,500,000 | | | | | Second Lien Term Loan, 7.951%,
maturing June 04, 2014 | | | | | | | 2,300,000 | | |
| | | | | | | Applied Systems, Inc. | | B1 | | B- | | | | | |
| | 1,985,000 | | | | | Term Loan, 7.860%,
maturing September 26, 2013 | | | | | | | 1,945,300 | | |
| | | | | | | Conseco, Inc. | | NR | | NR | | | | | |
| | 7,451,250 | | | | | Term Loan, 7.508%,
maturing October 10, 2013 | | | | | | | 7,008,832 | | |
| | | | | | | Crawford & Company | | B1 | | BB- | | | | | |
| | 2,916,101 | | | | | Term Loan, 7.610%,
maturing October 30, 2013 | | | | | | | 2,865,069 | | |
| | | | | | | Hub International, Ltd. | | B2 | | B | | | | | |
| | 143,791 | | | | | Term Loan, 3.460%,
maturing June 13, 2014 | | | | | | | 138,489 | | |
| | 2,042,484 | | | | | Term Loan, 7.860%,
maturing June 13, 2014 | | | | | | | 1,967,167 | | |
| | | | | | | Swett & Crawford | | B2 | | B | | | | | |
| | 3,192,000 | | | | | Term Loan, 7.610%,
maturing April 03, 2014 | | | | | | | 2,984,520 | | |
| | | | | | | USI Holdings Corporation | | B2 | | B- | | | | | |
| | 2,250,000 | | | | | Term Loan, 8.110%,
maturing May 05, 2014 | | | | | | | 2,126,250 | | |
| | | | 21,335,627 | | |
| Leisure, Amusement, Entertainment: 5.0% | | | |
| | | | | | | 24 Hour Fitness Worldwide, Inc. | | NR | | B+ | | | | | |
| | 4,196,875 | | | | | Term Loan, 7.870%,
maturing June 08, 2012 | | | | | | | 4,144,414 | | |
| | | | | | | Alpha D2, Ltd. | | NR | | NR | | | | | |
| | 2,285,714 | | | | | Term Loan, 8.125%,
maturing December 31, 2013 | | | | | | | 2,185,714 | | |
See Accompanying Notes to Financial Statements
46
ING Senior Income Fund
PORTFOLIO OF INVESTMENTS as of August 31, 2007 (Unaudited) (continued)
| | | | | | | Bank Loan
Ratings† | | Market | |
| Principal Amount | | | | Borrower/Tranche Description | | Moody's | | S&P | | Value | |
| Leisure, Amusement, Entertainment: (continued) | | | |
| $ | 1,714,286 | | | | | Term Loan, 8.125%,
maturing December 31, 2013 | | | | | | $ | 1,639,286 | | |
| | | | | | | AMF Bowling Worldwide, Inc. | | B1 | | B+ | | | | | |
| | 3,125,000 | | | | | Term Loan, 7.850%,
maturing June 10, 2013 | | | | | | | 3,000,000 | | |
| | | | | | | Cedar Fair, L.P. | | Ba3 | | BB | | | | | |
| | 7,917,519 | | | | | Term Loan, 7.565%,
maturing August 30, 2012 | | | | | | | 7,711,885 | | |
| | | | | | | Cinemark USA, Inc. | | Ba3 | | B | | | | | |
| | 3,688,682 | | | | | Term Loan, 7.233%,
maturing October 05, 2013 | | | | | | | 3,541,135 | | |
| | | | | | | HIT Entertainment, Inc. | | Ba3 | | B+ | | | | | |
| | 4,558,253 | | | | | Term Loan, 7.340%,
maturing March 20, 2012 | | | | | | | 4,284,758 | | |
| | | | | | | Kerasotes Showplace Theater, LLC | | B1 | | B- | | | | | |
| | 150,000 | | | | | Revolver, 1.541%,
maturing October 31, 2010 | | | | | | | 141,750 | | |
| | 995,000 | | | | | Term Loan, 7.875%,
maturing October 31, 2011 | | | | | | | 987,538 | | |
| | | | | | | London Arena & Waterfront Finance, LLC | | Ba3 | | B | | | | | |
| | 1,185,000 | | | | | Term Loan, 7.860%,
maturing March 08, 2012 | | | | | | | 1,161,300 | | |
| | | | | | | Metro-Goldwyn-Mayer, Inc. | | Ba3 | | B+ | | | | | |
| | 17,118,051 | | | | | Term Loan, 8.610%,
maturing April 08, 2012 | | | | | | | 16,238,800 | | |
| | 33,081,250 | | | | | Term Loan, 8.610%,
maturing April 08, 2012 | | | | | | | 31,382,065 | | |
| | | | | | | NEP II, Inc. | | B1 | | B | | | | | |
| | 4,486,249 | | | | | Term Loan, 7.610%,
maturing February 16, 2014 | | | | | | | 4,306,799 | | |
| | | | | | | Universal City Development Partners | | Ba1 | | BB | | | | | |
| | 4,627,273 | | | | | Term Loan, 7.419%,
maturing June 09, 2011 | | | | | | | 4,511,591 | | |
| | | | | | | Warner Music Group | | Ba2 | | BB- | | | | | |
| | 15,022,357 | | | | | Term Loan, 7.484%,
maturing February 28, 2011 | | | | | | | 14,738,345 | | |
| | | | 99,975,380 | | |
| Lodging: 1.2% | | | |
| | | | | | | Hotel Del Coronado | | NR | | NR | | | | | |
| | 24,600,000 | | | | | Term Loan, 7.362%,
maturing January 09, 2008 | | | | | | | 24,600,000 | | |
| | | | 24,600,000 | | |
| Machinery: 1.1% | | | |
| | | | | | | Alliance Laundry Systems, LLC | | Ba3 | | BB- | | | | | |
| | 4,996,808 | | | | | Term Loan, 7.609%,
maturing January 27, 2012 | | | | | | | 4,921,856 | | |
| | | | | | | Enersys Capital, Inc. | | Ba2 | | BB | | | | | |
| | 3,226,890 | | | | | Term Loan, 7.121%,
maturing March 17, 2011 | | | | | | | 3,150,251 | | |
See Accompanying Notes to Financial Statements
47
ING Senior Income Fund
PORTFOLIO OF INVESTMENTS as of August 31, 2007 (Unaudited) (continued)
| | | | | | | Bank Loan
Ratings† | | Market | |
| Principal Amount | | | | Borrower/Tranche Description | | Moody's | | S&P | | Value | |
| Machinery: (continued) | | | |
| | | | | | | Kion Group | | NR | | NR | | | | | |
| EUR | 1,250,000 | | | | | Term Loan, 6.308%,
maturing February 28, 2015 | | | | | | $ | 1,640,109 | | |
| EUR | 1,250,000 | | | | | Term Loan, 6.558%,
maturing February 28, 2016 | | | | | | | 1,649,476 | | |
| | | | | | | LN Acquisition Corporation | | B1 | | BB- | | | | | |
| $ | 363,636 | | | | | Term Loan, 8.050%,
maturing July 11, 2014 | | | | | | | 358,182 | | |
| | 136,364 | | | | | Term Loan, 8.583%,
maturing July 11, 2014 | | | | | | | 134,318 | | |
| | | | | | | Maxim Crane Works, L.P. | | B1 | | BB- | | | | | |
| | 3,500,000 | | | | | Term Loan, 7.360%,
maturing July 31, 2014 | | | | | | | 3,255,000 | | |
| | | | | | | NACCO Materials Handling Group, Inc. | | NR | | NR | | | | | |
| | 990,000 | | | | | Term Loan, 7.468%,
maturing March 21, 2013 | | | | | | | 950,400 | | |
| | | | | | | United Rentals, Inc. | | Ba1 | | BB- | | | | | |
| | 4,789,187 | | | | | Term Loan, 7.320%,
maturing February 14, 2011 | | | | | | | 4,742,794 | | |
| | 657,178 | | | | | Term Loan, 7.570%,
maturing February 14, 2011 | | | | | | | 650,812 | | |
| | | | 21,453,198 | | |
| Mining, Steel, Iron & Nonprecious Metals: 0.7% | | | |
| | | | | | | Alpha Natural Resources | | B1 | | BB | | | | | |
| | 656,667 | | | | | Term Loan, 7.110%,
maturing October 26, 2012 | | | | | | | 647,638 | | |
| | | | | | | Continental Alloys & Services, Inc. | | B2 | | B | | | | | |
| | 500,000 | | | | | Term Loan, 7.860%,
maturing June 15, 2012 | | | | | | | 492,500 | | |
| | | | | | | Noranda Aluminum Acquisition Corporation | | Ba2 | | BB- | | | | | |
| | 892,500 | | | | | Term Loan, 7.510%,
maturing May 18, 2014 | | | | | | | 869,630 | | |
| | | | | | | Novelis | | Ba2 | | BB | | | ` | | |
| | 3,437,500 | | | | | Term Loan, 7.360%,
maturing July 06, 2014 | | | | | | | 3,342,969 | | |
| | 1,562,500 | | | | | Term Loan, 7.360%,
maturing July 06, 2014 | | | | | | | 1,519,531 | | |
| | | | | | | Oglebay Norton Company | | B1 | | BB- | | | | | |
| | 1,526,614 | | | | | Term Loan, 7.610%,
maturing July 31, 2011 | | | | | | | 1,496,082 | | |
| | | | | | | Oxbow Carbon and Minerals Holdings, LLC | | B1 | | BB- | | | | | |
| | 3,668,658 | | | | | Term Loan, 7.366%,
maturing May 08, 2014 | | | | | | | 3,399,624 | | |
| | 322,148 | | | | | Term Loan, 7.508%,
maturing May 08, 2014 | | | | | | | 298,524 | | |
| | | | | | | Tube City IMS Corporation | | Ba3 | | BB | | | | | |
| | 162,162 | | | | | Term Loan, 7.610%,
maturing January 25, 2013 | | | | | | | 155,676 | | |
| | 1,334,493 | | | | | Term Loan, 7.610%,
maturing January 25, 2013 | | | | | | | 1,281,114 | | |
| | | | 13,503,288 | | |
See Accompanying Notes to Financial Statements
48
ING Senior Income Fund
PORTFOLIO OF INVESTMENTS as of August 31, 2007 (Unaudited) (continued)
| | | | | | | Bank Loan
Ratings† | | Market | |
| Principal Amount | | | | Borrower/Tranche Description | | Moody's | | S&P | | Value | |
| North American Cable: 13.4% | | | |
| | | | | | | Atlantic Broadband | | B1 | | B | | | | | |
| $ | 3,960,083 | | | | | Term Loan, 7.610%,
maturing August 10, 2012 | | | | | | $ | 3,883,356 | | |
| | | | | | | Bragg Communications, Inc. | | NR | | NR | | | | | |
| | 6,345,870 | | | | | Term Loan, 7.110%,
maturing August 31, 2011 | | | | | | | 6,345,870 | | |
| | | | | | | Bresnan Communications, LLC | | B2 | | BB- | | | | | |
| | 1,953,061 | | | | | Term Loan, 7.360%,
maturing April 30, 2014 | | | | | | | 1,889,587 | | |
| | 10,003,061 | | | | | Term Loan, 7.360%,
maturing September 29, 2013 | | | | | | | 9,677,962 | | |
| | | | | | | Cequel Communications, LLC | | B1 | | BB- | | | | | |
| | 46,349,593 | | | | | Term Loan, 7.378%,
maturing November 05, 2013 | | | | | | | 43,922,682 | | |
| | | | | | | Cequel Communications, LLC | | Caa1 | | B- | | | | | |
| | 975,000 | | | | | Second Lien Term Loan, 9.856%,
maturing May 05, 2014 | | | | | | | 949,406 | | |
| | | | | | | Charter Communications Operating, LLC | | B1 | | B+ | | | | | |
| | 64,723,652 | | | | | Term Loan, 7.360%,
maturing March 06, 2014 | | | | | | | 61,429,652 | | |
| | 4,411,765 | | | | | Term Loan, 7.360%,
maturing March 06, 2014 | | | | | | | 4,187,237 | | |
| | | | | | | CSC Holdings, Inc. | | Ba2 | | BB | | | | | |
| | 38,337,456 | | | | | Term Loan, 7.070%,
maturing March 29, 2013 | | | | | | | 36,880,978 | | |
| | | | | | | Insight Midwest Holdings, LLC | | Ba3 | | BB- | | | | | |
| | 19,500,000 | | | | | Term Loan, 7.360%,
maturing April 06, 2014 | | | | | | | 19,052,105 | | |
| | | | | | | Knology, Inc. | | B2 | | B | | | | | |
| | 3,000,000 | | | | | Term Loan, 7.610%,
maturing June 30, 2012 | | | | | | | 2,910,000 | | |
| | | | | | | Mediacom Broadband, LLC | | Ba3 | | BB | | | | | |
| | 15,563,790 | | | | | Term Loan, 7.320%,
maturing January 31, 2015 | | | | | | | 14,724,450 | | |
| | 3,438,750 | | | | | Term Loan, 7.045%,
maturing March 31, 2010 | | | | | | | 3,232,425 | | |
| | | | | | | Mediacom LLC Group | | Ba3 | | BB | | | | | |
| | 8,515,542 | | | | | Term Loan, 7.320%,
maturing January 31, 2015 | | | | | | | 8,077,596 | | |
| | | | | | | Nextmedia Operating, Inc. | | B1 | | B+ | | | | | |
| | 2,088,665 | | | | | Term Loan, 7.330%,
maturing November 15, 2012 | | | | | | | 1,979,010 | | |
| | 4,699,496 | | | | | Term Loan, 7.569%,
maturing November 15, 2012 | | | | | | | 4,452,773 | | |
| | | | | | | Quebecor Media, Inc. | | B1 | | B | | | | | |
| | 3,940,000 | | | | | Term Loan, 7.360%,
maturing January 17, 2013 | | | | | | | 3,831,650 | | |
| | | | | | | San Juan Cable, LLC | | B1 | | BB | | | | | |
| | 3,942,503 | | | | | Term Loan, 7.360%,
maturing October 31, 2012 | | | | | | | 3,798,357 | | |
See Accompanying Notes to Financial Statements
49
ING Senior Income Fund
PORTFOLIO OF INVESTMENTS as of August 31, 2007 (Unaudited) (continued)
| | | | | | | Bank Loan
Ratings† | | Market | |
| Principal Amount | | | | Borrower/Tranche Description | | Moody's | | S&P | | Value | |
| North American Cable: (continued) | | | |
| | | | | | | Univision Communications, Inc. | | Ba3 | | B+ | | | | | |
| $ | 28,397,889 | | | | | Term Loan, 7.610%,
maturing September 29, 2014 | | | | | | $ | 26,350,884 | | |
| | | | | | | Univision Communications, Inc. | | B3 | | CCC+ | | | | | |
| | 2,850,000 | | | | | Second Lien Term Loan, 8.008%,
maturing March 29, 2009 | | | | | | | 2,801,550 | | |
| | | | | | | US Cable of Coastal-Texas, L.P. | | B2 | | B- | | | | | |
| | 2,493,750 | | | | | Term Loan, 8.186%,
maturing April 19, 2014 | | | | | | | 2,456,344 | | |
| | | | | | | Wideopenwest Finance, LLC | | B2 | | B- | | | | | |
| | 5,833,333 | | | | | Term Loan, 7.932%,
maturing June 22, 2014 | | | | | | | 5,444,443 | | |
| | | | 268,278,317 | | |
| Oil & Gas: 6.1% | | | |
| | | | | | | Alon USA | | B1 | | BB | | | | | |
| | 1,760,000 | | | | | Term Loan, 7.612%,
maturing June 22, 2013 | | | | | | | 1,689,600 | | |
| | 220,000 | | | | | Term Loan, 7.761%,
maturing June 22, 2013 | | | | | | | 211,200 | | |
| | | | | | | Atlas Pipeline Partners, L.P. | | NR | | BB- | | | | | |
| | 10,000,000 | | | | | Term Loan, 8.144%,
maturing July 27, 2014 | | | | | | | 9,975,000 | | |
| | | | | | | Coffeyville Resources, LLC | | Caa1 | | B- | | | | | |
| | 2,198,990 | | | | | Term Loan, 8.610%,
maturing December 28, 2013 | | | | | | | 2,126,837 | | |
| | 1,203,165 | | | | | Term Loan, 8.260%,
maturing December 29, 2010 | | | | | | | 1,163,687 | | |
| | | | | | | CR Gas Storage | | Ba3 | | BB- | | | | | |
| | 824,163 | | | | | Term Loan, 7.110%,
maturing May 12, 2013 | | | | | | | 804,933 | | |
| | 5,066,573 | | | | | Term Loan, 7.110%,
maturing May 12, 2013 | | | | | | | 4,948,355 | | |
| | 558,280 | | | | | Term Loan, 7.325%,
maturing May 12, 2013 | | | | | | | 545,254 | | |
| | 937,709 | | | | | Term Loan, 7.280%,
maturing May 13, 2011 | | | | | | | 915,829 | | |
| | | | | | | El Paso Corporation | | Ba1 | | BB | | | | | |
| | 6,250,000 | | | | | Term Loan, 7.420%,
maturing August 01, 2011 | | | | | | | 6,152,344 | | |
| | | | | | | Energy Transfer Company, L.P. | | Ba2 | | NR | | | | | |
| | 13,750,000 | | | | | Term Loan, 7.106%,
maturing February 08, 2012 | | | | | | | 13,391,923 | | |
| | | | | | | Helix Energy Solutions Group, Inc. | | B1 | | BB+ | | | | | |
| | 7,721,533 | | | | | Term Loan, 7.411%,
maturing July 01, 2013 | | | | | | | 7,497,130 | | |
| | | | | | | Hercules Offshore, LLC | | Ba3 | | BB | | | | | |
| | 3,500,000 | | | | | Term Loan, 7.110%,
maturing July 11, 2013 | | | | | | | 3,430,000 | | |
| | | | | | | IFM Holdco | | Ba3 | | BBB | | | | | |
| | 498,750 | | | | | Term Loan, 7.510%,
maturing February 27, 2012 | | | | | | | 491,269 | | |
See Accompanying Notes to Financial Statements
50
ING Senior Income Fund
PORTFOLIO OF INVESTMENTS as of August 31, 2007 (Unaudited) (continued)
| | | | | | | Bank Loan
Ratings† | | Market | |
| Principal Amount | | | | Borrower/Tranche Description | | Moody's | | S&P | | Value | |
| Oil & Gas: (continued) | | | |
| | | | | | | Key Energy | | NR | | NR | | | | | |
| $ | 4,432,500 | | | | | Term Loan, 7.933%,
maturing June 30, 2012 | | | | | | $ | 4,354,931 | | |
| | | | | | | Kinder Morgan, Inc. | | Ba2 | | BB- | | | | | |
| | 3,587,879 | | | | | Term Loan, 7.071%,
maturing May 30, 2014 | | | | | | | 3,421,939 | | |
| | | | | | | McJunkin Corporation | | B2 | | B+ | | | | | |
| | 3,980,000 | | | | | Term Loan, 7.815%,
maturing January 31, 2013 | | | | | | | 3,890,450 | | |
| | | | | | | MEG Energy | | Ba3 | | BB | | | | | |
| | 4,147,500 | | | | | Term Loan, 7.360%,
maturing April 03, 2013 | | | | | | | 4,036,899 | | |
| | | | | | | Pine Prairie Energy Center | | B1 | | B+ | | | | | |
| | 793,466 | | | | | Term Loan, 7.830%,
maturing December 31, 2013 | | | | | | | 781,564 | | |
| | | | | | | Semcrude, L.P. | | Ba2 | | NR | | | | | |
| | 6,725,000 | | | | | Term Loan, 7.110%,
maturing May 15, 2014 | | | | | | | 6,598,906 | | |
| | | | | | | SG Resources Mississippi, LLC | | B1 | | BB- | | | | | |
| | 3,200,000 | | | | | Term Loan, 7.205%,
maturing March 31, 2014 | | | | | | | 3,148,000 | | |
| | | | | | | Targa Resources, Inc. | | Ba3 | | B+ | | | | | |
| | 5,275,758 | | | | | Term Loan, 7.360%,
maturing October 31, 2012 | | | | | | | 5,126,280 | | |
| | 16,170,112 | | | | | Term Loan, 7.537%,
maturing October 31, 2012 | | | | | | | 15,711,965 | | |
| | | | | | | Venoco, Inc. | | Caa1 | | B | | | | | |
| | 3,000,000 | | | | | Second Lien Term Loan, 9.360%,
maturing September 20, 2011 | | | | | | | 2,966,250 | | |
| | | | | | | Volnay Acquisition Co. I | | Ba2 | | BB- | | | | | |
| | 2,864,000 | | | | | Term Loan, 7.360%,
maturing January 12, 2014 | | | | | | | 2,742,280 | | |
| | | | | | | Vulcan Energy Corporation | | Ba2 | | BB | | | ` | | |
| | 5,419,383 | | | | | Term Loan, 6.945%,
maturing August 12, 2011 | | | | | | | 5,283,898 | | |
| | | | | | | Western Refining, Inc. | | B1 | | BB+ | | | | | |
| | 10,837,143 | | | | | Term Loan, 7.070%,
maturing May 30, 2014 | | | | | | | 10,339,317 | | |
| | | | 121,746,040 | | |
| Other Broadcasting and Entertainment: 1.3% | | | |
| | | | | | | Deluxe Entertainment Services Group, Inc. | | B1 | | B | | | | | |
| | 137,795 | | | | | Term Loan, 5.260%,
maturing May 11, 2013 | | | | | | | 132,283 | | |
| | 275,591 | | | | | Term Loan, 7.610%,
maturing May 11, 2013 | | | | | | | 264,567 | | |
| | 3,086,614 | | | | | Term Loan, 7.610%,
maturing May 11, 2013 | | | | | | | 2,963,150 | | |
| | | | | | | DirecTV Holdings, LLC | | Baa3 | | BBB- | | | | | |
| | 3,821,514 | | | | | Term Loan, 7.000%,
maturing April 13, 2013 | | | | | | | 3,766,282 | | |
See Accompanying Notes to Financial Statements
51
ING Senior Income Fund
PORTFOLIO OF INVESTMENTS as of August 31, 2007 (Unaudited) (continued)
| | | | | | | Bank Loan
Ratings† | | Market | |
| Principal Amount | | | | Borrower/Tranche Description | | Moody's | | S&P | | Value | |
| Other Broadcasting and Entertainment: (continued) | | | |
| | | | | | | VNU | | Ba3 | | B+ | | | | | |
| $ | 19,937,525 | | | | | Term Loan, 7.360%,
maturing August 09, 2013 | | | | | | $ | 19,239,712 | | |
| | | | 26,365,994 | | |
| Other Telecommunications: 2.7% | | | |
| | | | | | | Asurion Corporation | | B2 | | B- | | | | | |
| | 15,250,000 | | | | | Term Loan, 8.360%,
maturing July 03, 2014 | | | | | | | 14,373,125 | | |
| | | | | | | BCM Ireland Holdings, Ltd. | | Ba3 | | BB | | | | | |
| EUR | 2,083,333 | | | | | Term Loan, 5.903%,
maturing September 30, 2014 | | | | | | | 2,697,503 | | |
| EUR | 2,083,333 | | | | | Term Loan, 6.153%,
maturing September 30, 2015 | | | | | | | 2,725,000 | | |
| | | | | | | Cavalier Telephone | | B2 | | B- | | | | | |
| $ | 4,179,000 | | | | | Term Loan, 10.110%,
maturing December 31, 2012 | | | | | | | 4,116,315 | | |
| | | | | | | Consolidated Communications | | Ba3 | | BB | | | | | |
| | 2,440,381 | | | | | Term Loan, 7.110%,
maturing October 14, 2011 | | | | | | | 2,385,472 | | |
| | | | | | | Fairpoint Communications, Inc. | | B1 | | BB- | | | | | |
| | 2,500,000 | | | | | Term Loan, 7.125%,
maturing February 08, 2012 | | | | | | | 2,434,375 | | |
| | | | | | | Gabriel Communications | | B2 | | CCC+ | | | | | |
| | 500,000 | | | | | Term Loan, 8.620%,
maturing May 31, 2014 | | | | | | | 485,625 | | |
| | | | | | | Hargray Communications Group, Inc. | | B1 | | B | | | | | |
| | 750,000 | | | | | Term Loan, 7.596%,
maturing June 29, 2014 | | | | | | | 735,000 | | |
| | | | | | | Hawaiian Telcom Communications, Inc. | | Ba3 | | B- | | | | | |
| | 5,000,000 | | | | | Term Loan, 7.610%,
maturing June 01, 2014 | | | | | | | 4,762,500 | | |
| | | | | | | Iowa Telecommunications Services, Inc | | Ba3 | | BB- | | | | | |
| | 5,000,000 | | | | | Term Loan, 7.110%,
maturing November 23, 2011 | | | | | | | 4,862,500 | | |
| | | | | | | Kentucky Data Link, Inc. | | B1 | | B | | | | | |
| | 4,235,066 | | | | | Term Loan, 7.815%,
maturing February 26, 2014 | | | | | | | 4,097,426 | | |
| | | | | | | One Communications | | B1 | | B- | | | | | |
| | 3,000,000 | | | | | Term Loan, 8.875%,
maturing June 30, 2012 | | | | | | | 2,910,000 | | |
| | | | | | | PAETEC Holding Corporation | | Ba3 | | B- | | | | | |
| | 807,393 | | | | | Term Loan, 8.065%,
maturing February 28, 2013 | | | | | | | 796,964 | | |
| | | | | | | Time Warner Telecom Holdings, Inc. | | Ba2 | | B | | | | | |
| | 3,203,900 | | | | | Term Loan, 7.360%,
maturing January 07, 2013 | | | | | | | 3,135,817 | | |
| | | | | | | U.S. Telepacific Corporation | | B1 | | CCC+ | | | | | |
| | 992,502 | | | | | Term Loan, 9.444%,
maturing August 04, 2011 | | | | | | | 998,705 | | |
See Accompanying Notes to Financial Statements
52
ING Senior Income Fund
PORTFOLIO OF INVESTMENTS as of August 31, 2007 (Unaudited) (continued)
| | | | | | | Bank Loan
Ratings† | | Market | |
| Principal Amount | | | | Borrower/Tranche Description | | Moody's | | S&P | | Value | |
| Other Telecommunications: (continued) | | | |
| | | | | | | | | Windstream Corporation | | Baa3 | | BBB- | | | | | |
| $ | 2,053,571 | | | | | | | Term Loan, 6.860%,
maturing July 17, 2013 | | | | | | $ | 2,004,286 | | |
| | | | 53,520,613 | | |
| Personal & Nondurable Consumer Products: 2.9% | | | |
| | | | | | | | | Advantage Sales and Marketing | | B2 | | B- | | | | | |
| | 3,836,787 | | | | | | | Term Loan, 7.459%,
maturing March 29, 2013 | | | | | | | 3,668,928 | | |
| | | | | | | | | Chattem, Inc. | | NR | | BB- | | | | | |
| | 487,500 | | | | | | | Term Loan, 7.110%,
maturing January 02, 2013 | | | | | | | 478,969 | | |
| | | | | | | | | Fender Musical Instruments Corporation | | B2 | | B+ | | | | | |
| | 2,333,333 | | | | | | | Term Loan, 7.650%,
maturing June 09, 2014 | | | | | | | 2,193,333 | | |
| | | | | | | | | Gibson Guitar Corporation | | Ba3 | | B | | | | | |
| | 746,250 | | | | | | | Term Loan, 7.860%,
maturing December 29, 2013 | | | | | | | 735,056 | | |
| | | | | | | | | Huish Detergents, Inc. | | B1 | | B+ | | | | | |
| | 3,300,000 | | | | | | | Term Loan, 7.510%,
maturing April 26, 2014 | | | | | | | 3,060,750 | | |
| | | | | | | | | Information Resources, Inc. | | Ba2 | | B+ | | | | | |
| | 500,000 | | | | | | | Term Loan, 7.225%,
maturing May 16, 2014 | | | | | | | 481,875 | | |
| | | | | | | | | Jarden Corporation | | Ba3 | | BB- | | | | | |
| | 1,190,355 | | | | | | | Term Loan, 7.110%,
maturing January 24, 2012 | | | | | | | 1,146,992 | | |
| | 12,355,482 | | | | | | | Term Loan, 7.110%,
maturing January 24, 2012 | | | | | | | 11,905,385 | | |
| | 1,000,000 | | | | | | | Term Loan, 7.843%,
maturing January 24, 2012 | | | | | | | 983,125 | | |
| | | | | | | | | KIK Custom Products, Inc. | | B1 | | B | | | | | |
| | 73,171 | | | | | | | Term Loan, 7.610%,
maturing May 31, 2014 | | | | | | | 67,317 | | |
| | 426,829 | | | | | | | Term Loan, 7.610%,
maturing May 31, 2014 | | | | | | | 392,683 | | |
| | | | | | | | | Mega Bloks, Inc. | | Ba3 | | B+ | | | | | |
| | 980,000 | | | | | | | Term Loan, 7.625%,
maturing July 26, 2012 | | | | | | | 945,700 | | |
| | | | | | | | | Natural Products Group, LLC | | B1 | | B+ | | | | | |
| | 2,097,399 | | | | | | | Term Loan, 7.656%,
maturing March 08, 2014 | | | | | | | 1,548,579 | | |
| | | | | | (2 | ) | | Norwood Promotional Products | | NR | | NR | | | | | |
| | | | | | 3,700,000 | | | Revolver, 10.750%,
maturing December 31, 2008 | | | | | | | 3,700,000 | | |
| | 611,532 | | | | | | | Term Loan, 11.750%,
maturing August 17, 2009 | | | | | | | 611,532 | | |
| | | | | | 16,081,521 | | | Term Loan, 6.000%,
maturing August 17, 2011 | | | | | | | 14,794,999 | | |
| | | | | | | | | Norwood Promotional Products | | NR | | NR | | | | | |
| | 1,090,736 | | | | | | | Second Lien Term Loan, 24.508%,
maturing February 15, 2008 | | | | | | | 1,090,736 | | |
See Accompanying Notes to Financial Statements
53
ING Senior Income Fund
PORTFOLIO OF INVESTMENTS as of August 31, 2007 (Unaudited) (continued)
| | | | | | | Bank Loan
Ratings† | | Market | |
| Principal Amount | | | | Borrower/Tranche Description | | Moody's | | S&P | | Value | |
| Personal & Nondurable Consumer Products: (continued) | | | |
| | | | | | | Spectrum Brands, Inc. | | B2 | | B- | | | | | |
| $ | 56,383 | | | | | Term Loan, 9.320%,
maturing March 30, 2013 | | | | | | $ | 54,997 | | |
| | 1,140,636 | | | | | Term Loan, 9.353%,
maturing March 30, 2013 | | | | | | | 1,112,596 | | |
| | 202,980 | | | | | Term Loan, 9.565%,
maturing March 30, 2013 | | | | | | | 192,831 | | |
| | | | | | | Totes Isotoner Corporation | | B2 | | B | | | | | |
| | 415,625 | | | | | Term Loan, 7.844%,
maturing January 31, 2013 | | | | | | | 403,156 | | |
| | | | | | | Tupperware | | Ba1 | | BBB- | | | | | |
| | 3,236,339 | | | | | Term Loan, 6.860%,
maturing December 05, 2012 | | | | | | | 3,182,399 | | |
| | | | | | | Yankee Candle Company, Inc. | | Ba3 | | BB- | | | | | |
| | 4,987,500 | | | | | Term Loan, 7.360%,
maturing February 06, 2014 | | | | | | | 4,806,703 | | |
| | | | 57,558,641 | | |
| Personal, Food & Miscellaneous: 2.4% | | | |
| | | | | | | Acosta, Inc. | | B1 | | B- | | | | | |
| | 4,455,000 | | | | | Term Loan, 7.820%,
maturing July 28, 2013 | | | | | | | 4,300,933 | | |
| | | | | | | Allied Security Holdings, LLC | | Ba3 | | BB- | | | | | |
| | 486,364 | | | | | Term Loan, 8.360%,
maturing June 30, 2010 | | | | | | | 479,068 | | |
| | | | | | | Arbys Restaurant Group, Inc. | | Ba3 | | BB | | | | | |
| | 6,432,637 | | | | | Term Loan, 7.678%,
maturing July 25, 2012 | | | | | | | 6,287,903 | | |
| | | | | | | Coinmach Corporation | | B2 | | B+ | | | | | |
| | 7,952,081 | | | | | Term Loan, 7.968%,
maturing December 19, 2012 | | | | | | | 7,812,920 | | |
| | | | | | | Coinstar, Inc. | | Ba2 | | BB+ | | | | | |
| | 2,417,918 | | | | | Term Loan, 7.360%,
maturing July 07, 2011 | | | | | | | 2,381,649 | | |
| | | | | | | Culligan International Company | | Ba2 | | B+ | | | | | |
| | 1,500,000 | | | | | Term Loan, 7.699%,
maturing November 24, 2012 | | | | | | | 1,378,125 | | |
| | | | | | | Dennys, Inc. | | Ba2 | | BB- | | | | | |
| | 1,437,036 | | | | | Term Loan, 7.376%,
maturing March 31, 2012 | | | | | | | 1,415,481 | | |
| | 866,667 | | | | | Term Loan, 7.377%,
maturing March 31, 2012 | | | | | | | 853,667 | | |
| | | | | | | Krispy Kreme Doughnut Corporation | | NR | | NR | | | | | |
| | 648,825 | | | | | Term Loan, 8.358%,
maturing February 15, 2014 | | | | | | | 626,116 | | |
| | | | | | | MD Beauty, Inc. | | B1 | | BB- | | | | | |
| | 2,769,582 | | | | | Term Loan, 7.800%,
maturing February 18, 2012 | | | | | | | 2,728,038 | | |
| | | | | | | N.E.W. Customer Services Companies, Inc. | | B1 | | B | | | | | |
| | 4,664,286 | | | | | Term Loan, 7.864%,
maturing May 22, 2014 | | | | | | | 4,322,240 | | |
See Accompanying Notes to Financial Statements
54
ING Senior Income Fund
PORTFOLIO OF INVESTMENTS as of August 31, 2007 (Unaudited) (continued)
| | | | | | | Bank Loan
Ratings† | | Market | |
| Principal Amount | | | | Borrower/Tranche Description | | Moody's | | S&P | | Value | |
| Personal, Food & Miscellaneous: (continued) | | | |
| | | | | | | NPC International | | Ba3 | | BB- | | | | | |
| $ | 1,200,000 | | | | | Term Loan, 7.124%,
maturing May 03, 2013 | | | | | | $ | 1,162,500 | | |
| | | | | | | OSI Restaurant Partners, Inc. | | B1 | | BB- | | | | | |
| | 378,313 | | | | | Term Loan, 7.430%,
maturing June 14, 2013 | | | | | | | 359,988 | | |
| | 4,621,813 | | | | | Term Loan, 7.625%,
maturing June 14, 2014 | | | | | | | 4,397,946 | | |
| | | | | | | QCE, LLC | | B2 | | B | | | | | |
| | 3,729,000 | | | | | Term Loan, 7.610%,
maturing May 05, 2013 | | | | | | | 3,575,697 | | |
| | | | | | | Reddy Ice Group, Inc. | | Ba3 | | BB- | | | | | |
| | 3,000,000 | | | | | Term Loan, 7.110%,
maturing August 09, 2012 | | | | | | | 2,955,000 | | |
| | | | | | | Sagittarius Brands, Inc. | | B1 | | B+ | | | | | |
| | 1,481,250 | | | | | Term Loan, 7.610%,
maturing March 29, 2013 | | | | | | | 1,396,078 | | |
| | | | | | | Sbarro, Inc. | | Ba3 | | B+ | | | | | |
| | 498,750 | | | | | Term Loan, 7.880%,
maturing January 31, 2014 | | | | | | | 477,553 | | |
| | | | | | | Seminole Hard Rock Entertainment | | B1 | | BB | | | | | |
| | 1,000,000 | | | | | Term Loan, 7.860%,
maturing March 15, 2014 | | | | | | | 970,000 | | |
| | | | | | | U.S. Security Holdings, Inc. | | B1 | | B+ | | | | | |
| | 617,188 | | | | | Term Loan, 7.870%,
maturing May 08, 2013 | | | | | | | 614,102 | | |
| | | | 48,495,004 | | |
| Printing & Publishing: 8.1% | | | |
| | | | | | | American Achievement Corporation | | Ba2 | | BB- | | | | | |
| | 1,120,669 | | | | | Term Loan, 7.720%,
maturing March 25, 2011 | | | | | | | 1,092,653 | | |
| | | | | | | American Reprographics Company | | Ba2 | | BB | | | | | |
| | 4,425,745 | | | | | Term Loan, 7.221%,
maturing June 18, 2009 | | | | | | | 4,315,102 | | |
| | | | | | | Ascend Media Holdings, LLC | | B3 | | B | | | | | |
| | 1,536,048 | | | | | Term Loan, 8.758%,
maturing January 31, 2012 | | | | | | | 1,344,042 | | |
| | | | | | | Black Press, Ltd. | | Ba3 | | BB- | | | | | |
| | 748,000 | | | | | Term Loan, 7.541%,
maturing August 02, 2013 | | | | | | | 733,507 | | |
| | 1,232,000 | | | | | Term Loan, 7.541%,
maturing August 02, 2013 | | | | | | | 1,208,130 | | |
| | | | | | | Canwest Media, Inc. | | Ba1 | | BB- | | | | | |
| | 2,743,125 | | | | | Term Loan, 7.541%,
maturing July 18, 2014 | | | | | | | 2,660,831 | | |
| | | | | | | Caribe Information Investments, Inc. | | B1 | | B+ | | | | | |
| | 2,710,887 | | | | | Term Loan, 7.623%,
maturing March 31, 2013 | | | | | | | 2,629,560 | | |
See Accompanying Notes to Financial Statements
55
ING Senior Income Fund
PORTFOLIO OF INVESTMENTS as of August 31, 2007 (Unaudited) (continued)
| | | | | | | Bank Loan
Ratings† | | Market | |
| Principal Amount | | | | Borrower/Tranche Description | | Moody's | | S&P | | Value | |
| Printing & Publishing: (continued) | | | |
| | | | | | | Cenveo Corporation | | Ba3 | | BB- | | | | | |
| $ | 3,867,171 | | | | | Term Loan, 7.110%,
maturing June 21, 2013 | | | | | | $ | 3,702,816 | | |
| | 78,906 | | | | | Term Loan, 7.110%,
maturing June 21, 2013 | | | | | | | 75,552 | | |
| | | | | | | Dex Media West, LLC | | Ba1 | | BB+ | | | | | |
| | 5,471,400 | | | | | Term Loan, 6.930%,
maturing March 09, 2010 | | | | | | | 5,356,846 | | |
| | 3,338,657 | | | | | Term Loan, 7.081%,
maturing March 09, 2010 | | | | | | | 3,268,756 | | |
| | 378,974 | | | | | Term Loan, 6.737%,
maturing September 09, 2009 | | | | | | | 369,026 | | |
| | | | | | | Hanley Wood, LLC | | B2 | | B | | | | | |
| | 2,729,335 | | | | | Term Loan, 7.604%,
maturing March 08, 2014 | | | | | | | 2,488,245 | | |
| | | | | | | Idearc, Inc. | | Ba2 | | BBB- | | | | | |
| | 35,447,000 | | | | | Term Loan, 7.360%,
maturing November 17, 2014 | | | | | | | 34,431,940 | | |
| | | | | | | Intermedia Outdoor, Inc. | | NR | | NR | | | | | |
| | 1,990,000 | | | | | Term Loan, 8.360%,
maturing January 31, 2013 | | | | | | | 1,950,200 | | |
| | | | | | | Jostens IH Corporation | | Ba1 | | BB | | | | | |
| | 6,912,069 | | | | | Term Loan, 7.330%,
maturing December 21, 2011 | | | | | | | 6,773,828 | | |
| | | | | | | Medimedia USA, Inc. | | Ba3 | | BB- | | | | | |
| | 1,240,625 | | | | | Term Loan, 7.595%,
maturing October 05, 2013 | | | | | | | 1,203,406 | | |
| | | | | | | Merrill Communications, LLC | | Ba3 | | BB- | | | | | |
| | 5,837,510 | | | | | Term Loan, 7.689%,
maturing May 15, 2011 | | | | | | | 5,713,463 | | |
| | | | | | | Nelson Canada | | Ba3 | | BB- | | | | | |
| | 5,000,000 | | | | | Term Loan, 7.828%,
maturing June 30, 2014 | | | | | | | 4,687,500 | | |
| | | | | | | PagesJaunes Groupe S.A. | | NR | | NR | | | | | |
| EUR | 1,100,000 | | | | | Term Loan, 5.890%,
maturing February 28, 2014 | | | | | | | 1,423,812 | | |
| | | | | | | PagesJaunes Groupe S.A. | | NR | | NR | | | | | |
| EUR | 825,000 | | | | | Second Lien Term Loan, 6.390%,
maturing February 28, 2014 | | | | | | | 1,069,792 | | |
| EUR | 825,000 | | | | | Second Lien Term Loan, 6.890%,
maturing February 28, 2014 | | | | | | | 1,075,412 | | |
| | | | | | | PBL Media | | B1 | | NR | | | | | |
| AUD | 24,869,635 | | | | | Term Loan, 9.032%,
maturing May 01, 2013 | | | | | | | 19,816,588 | | |
| | | | | | | Prism Business Media Holdings | | B1 | | BB- | | | | | |
| $ | 2,194,500 | | | | | Term Loan, 7.610%,
maturing February 01, 2013 | | | | | | | 2,088,890 | | |
See Accompanying Notes to Financial Statements
56
ING Senior Income Fund
PORTFOLIO OF INVESTMENTS as of August 31, 2007 (Unaudited) (continued)
| | | | | | | Bank Loan
Ratings† | | Market | |
| Principal Amount | | | | Borrower/Tranche Description | | Moody's | | S&P | | Value | |
| Printing & Publishing: (continued) | | | |
| | | | | | | R.H. Donnelley Corporation | | Ba1 | | BB+ | | | | | |
| $ | 1,445,813 | | | | | Term Loan, 6.726%,
maturing December 31, 2009 | | | | | | $ | 1,390,391 | | |
| | 3,446,970 | | | | | Term Loan, 6.860%,
maturing June 30, 2011 | | | | | | | 3,334,943 | | |
| | 10,519,420 | | | | | Term Loan, 6.881%,
maturing June 30, 2011 | | | | | | | 10,219,174 | | |
| | | | | | | Readers Digest | | B1 | | B+ | | | | | |
| EUR | 755,338 | | | | | Term Loan, 6.013%,
maturing March 02, 2014 | | | | | | | 957,108 | | |
| $ | 4,364,063 | | | | | Term Loan, 7.347%,
maturing March 02, 2014 | | | | | | | 4,047,668 | | |
| | | | | | | Source Media, Inc. | | B1 | | B | | | | | |
| | 3,722,218 | | | | | Term Loan, 7.610%,
maturing November 08, 2011 | | | | | | | 3,629,162 | | |
| | | | | | | Thomas Nelson Publishers | | B1 | | B | | | | | |
| | 2,310,000 | | | | | Term Loan, 7.632%,
maturing June 12, 2012 | | | | | | | 2,200,275 | | |
| | | | | | | Thomson Learning | | B1 | | B+ | | | | | |
| | 20,000,000 | | | | | Term Loan, 8.100%,
maturing July 05, 2014 | | | | | | | 18,983,340 | | |
| | | | | | | Tribune Company | | Ba2 | | BB | | | | | |
| | 1,500,000 | | | | | Term Loan, 8.360%,
maturing May 19, 2014 | | | | | | | 1,367,579 | | |
| | | | | | | Valassis Communications, Inc. | | Ba2 | | BB | | | | | |
| | 1,077,050 | | | | | Term Loan, 7.110%,
maturing March 02, 2014 | | | | | | | 999,861 | | |
| | | | | | | Wenner Media, LLC | | Ba3 | | BB- | | | | | |
| | 857,250 | | | | | Term Loan, 7.110%,
maturing October 02, 2013 | | | | | | | 831,533 | | |
| | | | | | | Yell Group PLC | | Ba3 | | BB- | | | | | |
| | 2,000,000 | | | | | Term Loan, 7.565%,
maturing February 10, 2013 | | | | | | | 2,003,750 | | |
| EUR | 2,000,000 | | | | | Term Loan, 6.421%,
maturing February 27, 2013 | | | | | | | 2,650,820 | | |
| | | | 162,095,501 | | |
| Radio and TV Broadcasting: 2.5% | | | |
| | | | | | | Block Communications, Inc. | | Ba1 | | BB | | | | | |
| $ | 1,231,250 | | | | | Term Loan, 7.360%,
maturing December 22, 2012 | | | | | | | 1,188,156 | | |
| | | | | | | Citadel Broadcasting Corporation | | Ba3 | | BB- | | | | | |
| | 8,500,000 | | | | | Term Loan, 6.985%,
maturing June 12, 2014 | | | | | | | 7,876,670 | | |
| | | | | | | CMP KC, LLC | | Caa1 | | CCC+ | | | | | |
| | 2,055,244 | | | | | Term Loan, 9.375%,
maturing May 03, 2011 | | | | | | | 1,942,206 | | |
| | | | | | | CMP Susquehanna Corporation | | B1 | | B- | | | | | |
| | 7,443,429 | | | | | Term Loan, 7.503%,
maturing May 05, 2013 | | | | | | | 7,101,031 | | |
See Accompanying Notes to Financial Statements
57
ING Senior Income Fund
PORTFOLIO OF INVESTMENTS as of August 31, 2007 (Unaudited) (continued)
| | | | | | | Bank Loan
Ratings† | | Market | |
| Principal Amount | | | | Borrower/Tranche Description | | Moody's | | S&P | | Value | |
| Radio and TV Broadcasting: (continued) | | | |
| | | | | | | Cumulus Media, Inc. | | Ba3 | | B | | | | | |
| $ | 2,861,333 | | | | | Term Loan, 7.253%,
maturing June 11, 2014 | | | | | | $ | 2,796,953 | | |
| | | | | | | Emmis Communication | | B1 | | B+ | | | | | |
| | 1,211,250 | | | | | Term Loan, 7.360%,
maturing November 01, 2013 | | | | | | | 1,171,884 | | |
| | | | | | | Local TV Finance, LLC | | Ba3 | | B+ | | | | | |
| | 3,400,000 | | | | | Term Loan, 7.310%,
maturing May 07, 2013 | | | | | | | 3,230,000 | | |
| | | | | | | Montecito Broadcast Group, LLC | | B1 | | B | | | | | |
| | 1,970,000 | | | | | Term Loan, 7.859%,
maturing January 27, 2013 | | | | | | | 1,935,525 | | |
| | | | | | | Nexstar Broadcasting Group | | Ba3 | | BB- | | | | | |
| | 4,527,423 | | | | | Term Loan, 7.110%,
maturing October 01, 2012 | | | | | | | 4,335,007 | | |
| | 4,779,655 | | | | | Term Loan, 7.110%,
maturing October 01, 2012 | | | | | | | 4,576,520 | | |
| | | | | | | Paxson Communications | | B1 | | CCC+ | | | | | |
| | 6,500,000 | | | | | Term Loan, 8.610%,
maturing January 15, 2012 | | | | | | | 6,337,500 | | |
| | | | | | | Regent Communications | | B1 | | B+ | | | | | |
| | 2,238,750 | | | | | Term Loan, 7.610%,
maturing November 21, 2013 | | | | | | | 2,182,781 | | |
| | | | | | | Spanish Broadcasting Systems | | B1 | | B- | | | | | |
| | 4,397,525 | | | | | Term Loan, 7.110%,
maturing June 11, 2012 | | | | | | | 4,177,649 | | |
| | | | 48,851,882 | | |
| Retail Stores: 5.9% | | | |
| | | | | | | Amscan Holdings, Inc. | | Ba3 | | B | | | | | |
| | 1,995,000 | | | | | Term Loan, 7.631%,
maturing May 25, 2013 | | | | | | | 1,865,325 | | |
| | | | | | | Burlington Coat Factory | | B2 | | B- | | | | | |
| | 4,860,000 | | | | | Term Loan, 7.760%,
maturing May 28, 2013 | | | | | | | 4,577,080 | | |
| | | | | | | CBR Fashion Holding | | NR | | NR | | | | | |
| EUR | 750,000 | | | | | Term Loan, 6.305%,
maturing June 14, 2015 | | | | | | | 971,675 | | |
| EUR | 750,000 | | | | | Term Loan, 6.555%,
maturing June 14, 2016 | | | | | | | 977,040 | | |
| | | | | | | Claires Stores, Inc. | | B1 | | B | | | | | |
| $ | 5,000,000 | | | | | Term Loan, 8.110%,
maturing May 29, 2014 | | | | | | | 4,613,540 | | |
| | | | | | | Dollar General Corporation | | B2 | | B+ | | | | | |
| | 10,500,000 | | | | | Term Loan, 8.108%,
maturing July 06, 2014 | | | | | | | 9,725,625 | | |
| | | | | | | Dollar General Corporation | | Caa1 | | CCC+ | | | | | |
| | 3,500,000 | | | | | Term Loan, 8.205%,
maturing July 06, 2014 | | | | | | | 3,135,416 | | |
| | | | | | | Dollarama Group, L.P | | Ba1 | | BB- | | | | | |
| | 5,363,359 | | | | | Term Loan, 7.108%,
maturing November 18, 2011 | | | | | | | 5,256,092 | | |
See Accompanying Notes to Financial Statements
58
ING Senior Income Fund
PORTFOLIO OF INVESTMENTS as of August 31, 2007 (Unaudited) (continued)
| | | | | | | Bank Loan
Ratings† | | Market | |
| Principal Amount | | | | Borrower/Tranche Description | | Moody's | | S&P | | Value | |
| Retail Stores: (continued) | | | |
| | | | | | | General Nutrition Centers, Inc. | | B1 | | B- | | | | | |
| $ | 4,788,000 | | | | | Term Loan, 7.610%,
maturing September 16, 2013 | | | | | | $ | 4,492,738 | | |
| | | | | | | Harbor Freight Tools USA, Inc. | | B1 | | B+ | | | | | |
| | 8,111,817 | | | | | Term Loan, 7.610%,
maturing July 15, 2010 | | | | | | | 7,800,867 | | |
| | | | | | | Mapco Express, Inc. | | B2 | | BB- | | | | | |
| | 2,217,272 | | | | | Term Loan, 8.110%,
maturing April 28, 2011 | | | | | | | 2,161,840 | | |
| | | | | | | Mattress Firm | | B1 | | B | | | | | |
| | 997,500 | | | | | Term Loan, 7.610%,
maturing January 18, 2014 | | | | | | | 942,638 | | |
| | | | | | | Michaels Stores, Inc. | | B2 | | B | | | | | |
| | 13,715,452 | | | | | Term Loan, 7.625%,
maturing October 31, 2013 | | | | | | | 12,992,936 | | |
| | | | | | | Nebraska Book Company, Inc. | | Ba2 | | B | | | | | |
| | 3,361,228 | | | | | Term Loan, 7.830%,
maturing March 04, 2011 | | | | | | | 3,277,198 | | |
| | | | | | | Neiman Marcus Group, Inc. | | Ba3 | | B+ | | | | | |
| | 19,489,030 | | | | | Term Loan, 7.110%,
maturing April 06, 2013 | | | | | | | 18,991,358 | | |
| | | | | | | Oriental Trading Company, Inc. | | B1 | | BB- | | | | | |
| | 2,475,000 | | | | | Term Loan, 7.610%,
maturing July 31, 2013 | | | | | | | 2,320,313 | | |
| | | | | | | Pep Boys | | Ba3 | | B+ | | | | | |
| | 493,772 | | | | | Term Loan, 7.540%,
maturing January 27, 2011 | | | | | | | 485,131 | | |
| | | | | | | Petco Animal Supplies, Inc. | | Ba3 | | BB- | | | | | |
| | 5,099,375 | | | | | Term Loan, 7.609%,
maturing October 26, 2013 | | | | | | | 4,946,394 | | |
| | | | | | | Phones 4U Group, Ltd. | | NR | | NR | | | | | |
| GBP | 2,126,866 | | | | | Term Loan, 8.520%,
maturing September 22, 2014 | | | | | | | 4,022,312 | | |
| GBP | 2,034,161 | | | | | Term Loan, 9.020%,
maturing September 22, 2015 | | | | | | | 3,863,734 | | |
| | | | | | | Rite Aid | | Ba3 | | BB- | | | | | |
| $ | 3,000,000 | | | | | Term Loan, 7.183%,
maturing June 04, 2014 | | | | | | | 2,936,250 | | |
| | | | | | | Sally Holding, LLC | | B2 | | BB- | | | | | |
| | 3,721,875 | | | | | Term Loan, 8.006%,
maturing November 16, 2013 | | | | | | | 3,614,000 | | |
| | | | | | | Samsonite Corporation | | Ba3 | | BB- | | | | | |
| | 1,990,000 | | | | | Term Loan, 7.610%,
maturing December 30, 2013 | | | | | | | 1,972,588 | | |
| | | | | | | Sports Authority | | B2 | | B | | | | | |
| | 2,970,000 | | | | | Term Loan, 7.610%,
maturing May 03, 2013 | | | | | | | 2,828,925 | | |
| | | | | | | Tire Rack, Inc. | | B1 | | BB- | | | | | |
| | 805,472 | | | | | Term Loan, 7.115%,
maturing June 24, 2012 | | | | | | | 793,390 | | |
See Accompanying Notes to Financial Statements
59
ING Senior Income Fund
PORTFOLIO OF INVESTMENTS as of August 31, 2007 (Unaudited) (continued)
| | | | | | | Bank Loan
Ratings† | | Market | |
| Principal Amount | | | | Borrower/Tranche Description | | Moody's | | S&P | | Value | |
| Retail Stores: (continued) | | | |
| | | | | | | Toys "R" Us, Inc. | | Ba3 | | B | | | | | |
| $ | 1,375,000 | | | | | Term Loan, 9.760%,
maturing July 19, 2012 | | | | | | $ | 1,363,399 | | |
| | | | | | | Vivarte | | NR | | NR | | | | | |
| EUR | 2,500,000 | | | | | Term Loan, 6.113%,
maturing March 08, 2015 | | | | | | | 3,142,875 | | |
| EUR | 2,500,000 | | | | | Term Loan, 6.613%,
maturing March 08, 2016 | | | | | | | 3,155,039 | | |
| | | | 117,225,718 | | |
| Satellite: 0.5% | | | |
| | | | | | | Aeroflex, Inc. | | NR | | B+ | | | | | |
| $ | 1,000,000 | | | | | Term Loan, 8.875%,
maturing August 15, 2014 | | | | | | | 960,000 | | |
| | | | | | | Intelsat (Bermuda), Ltd. | | B2 | | B | | | | | |
| | 3,200,000 | | | | | Term Loan, 7.859%,
maturing February 01, 2014 | | | | | | | 3,118,000 | | |
| | | | | | | Intelsat Corporation | | Ba2 | | BB | | | | | |
| | 4,216,259 | | | | | Term Loan, 7.360%,
maturing January 03, 2012 | | | | | | | 4,093,988 | | |
| | | | | | | Intelsat Subsidiary Holding Company, Ltd. | | Ba2 | | BB+ | | | | | |
| | 2,619,488 | | | | | Term Loan, 7.360%,
maturing July 07, 2013 | | | | | | | 2,557,275 | | |
| | | | 10,729,263 | | |
| Telecommunications Equipment: 0.8% | | | |
| | | | | | | Macquarie UK Broadcast Ventures, Ltd. | | NR | | NR | | | | | |
| GBP | 5,500,000 | | | | | Term Loan, 8.632%,
maturing December 01, 2014 | | | | | | | 11,062,750 | | |
| | | | | | | Sorenson Communications, Inc. | | B1 | | B | | | | | |
| $ | 5,137,164 | | | | | Term Loan, 8.000%,
maturing August 16, 2014 | | | | | | | 4,931,678 | | |
| | | | 15,994,428 | | |
| Textiles & Leather: 0.7% | | | |
| | | | | | | Hanesbrands, Inc. | | Ba2 | | BB | | | | | |
| | 2,315,179 | | | | | Term Loan, 7.132%,
maturing September 05, 2013 | | | | | | | 2,259,832 | | |
| | | | | | | Iconix Brand Group, Inc. | | Ba2 | | BB- | | | | | |
| | 2,543,625 | | | | | Term Loan, 7.610%,
maturing May 02, 2013 | | | | | | | 2,441,880 | | |
| | | | | | | Polymer Group, Inc. | | B1 | | BB | | | | | |
| | 6,402,500 | | | | | Term Loan, 7.610%,
maturing November 22, 2012 | | | | | | | 6,306,463 | | |
| | | | | | | St. John Knits International, Inc. | | B1 | | BB | | | | | |
| | 509,247 | | | | | Term Loan, 8.360%,
maturing March 21, 2012 | | | | | | | 501,608 | | |
| | | | | | | Targus Group, Inc. | | B2 | | B | | | | | |
| | 1,953,657 | | | | | Term Loan, 8.870%,
maturing November 22, 2012 | | | | | | | 1,771,316 | | |
| | | | 13,281,099 | | |
See Accompanying Notes to Financial Statements
60
ING Senior Income Fund
PORTFOLIO OF INVESTMENTS as of August 31, 2007 (Unaudited) (continued)
| | | | | | | Bank Loan
Ratings† | | Market | |
| Principal Amount | | | | Borrower/Tranche Description | | Moody's | | S&P | | Value | |
| Utilities: 5.9% | | | |
| | | | | | | Astoria Generating
Company Acquisitions, LLC | | B1 | | BB- | | | | | |
| $ | 3,183,426 | | | | | Term Loan, 7.500%,
maturing February 23, 2013 | | | | | | $ | 3,118,621 | | |
| | | | | | | AWG PLC | | NR | | NR | | | | | |
| GBP | 1,000,000 | | | | | Term Loan, 7.961%,
maturing October 01, 2011 | | | | | | | 1,981,162 | | |
| | | | | | | Boston Generating, LLC | | B1 | | BB- | | | | | |
| $ | 1,062,345 | | | | | Revolver, 7.610%,
maturing December 20, 2013 | | | | | | | 1,029,147 | | |
| | 1,794,089 | | | | | Term Loan, 7.610%,
maturing December 20, 2013 | | | | | | | 1,738,023 | | |
| | 5,372,284 | | | | | Term Loan, 7.610%,
maturing December 20, 2013 | | | | | | | 5,204,400 | | |
| | | | | | | Calpine Corporation | | B1 | | BB- | | | | | |
| | 18,354,000 | | | | | Term Loan, 7.610%,
maturing March 29, 2009 | | | | | | | 17,816,485 | | |
| | | | | | | Cellnet Technology, Inc. | | Ba2 | | NR | | | | | |
| | 1,549,545 | | | | | Term Loan, 7.360%,
maturing July 22, 2011 | | | | | | | 1,514,681 | | |
| | | | | | | Cellnet Technology, Inc. | | B2 | | NR | | | | | |
| | 333,333 | | | | | Second Lien Term Loan, 9.620%,
maturing October 22, 2011 | | | | | | | 325,000 | | |
| | | | | | | Coleto Creek WLE, LP | | B1 | | BB- | | | | | |
| | 764,331 | | | | | Term Loan, 8.010%,
maturing June 28, 2013 | | | | | | | 741,401 | | |
| | 5,307,062 | | | | | Term Loan, 8.110%,
maturing June 28, 2013 | | | | | | | 5,147,850 | | |
| | | | | | | Infrastrux Group, Inc. | | B2 | | B+ | | | | | |
| | 5,111,375 | | | | | Term Loan, 8.815%,
maturing November 03, 2012 | | | | | | | 4,779,136 | | |
| | | | | | | KGEN, LLC | | Ba3 | | BB | | | | | |
| | 937,500 | | | | | Term Loan, 7.125%,
maturing February 05, 2014 | | | | | | | 897,656 | | |
| | 1,554,688 | | | | | Term Loan, 7.125%,
maturing February 05, 2014 | | | | | | | 1,488,613 | | |
| | | | | | | Longview Power, LLC | | Ba3 | | BB | | | | | |
| | 150,000 | | | | | Term Loan, 1.658%,
maturing February 28, 2014 | | | | | | | 140,688 | | |
| | 1,000,000 | | | | | Term Loan, 7.625%,
maturing February 28, 2014 | | | | | | | 937,917 | | |
| | 333,333 | | | | | Term Loan, 7.625%,
maturing February 28, 2014 | | | | | | | 312,639 | | |
| | | | | | | MACH Gen, LLC | | B2 | | B+ | | | | | |
| | 453,125 | | | | | Term Loan, 7.360%,
maturing February 22, 2013 | | | | | | | 434,056 | | |
| | 4,358,307 | | | | | Term Loan, 7.500%,
maturing February 22, 2014 | | | | | | | 4,174,897 | | |
See Accompanying Notes to Financial Statements
61
ING Senior Income Fund
PORTFOLIO OF INVESTMENTS as of August 31, 2007 (Unaudited) (continued)
| | | | | | | Bank Loan
Ratings† | | Market | |
| Principal Amount | | | | Borrower/Tranche Description | | Moody's | | S&P | | Value | |
| Utilities: (continued) | | | |
| | | | | | | NE Energy, Inc. | | B1 | | B+ | | | | | |
| $ | 792,683 | | | | | Term Loan, 7.860%,
maturing November 01, 2013 | | | | | | $ | 774,848 | | |
| | 1,875,600 | | | | | Term Loan, 7.860%,
maturing November 01, 2013 | | | | | | | 1,833,399 | | |
| | | | | | | NE Energy, Inc. | | B3 | | B- | | | | | |
| | 1,675,000 | | | | | Second Lien Term Loan, 9.875%,
maturing May 01, 2014 | | | | | | | 1,633,125 | | |
| | | | | | | NRG Energy, Inc. | | Ba1 | | BB | | | | | |
| | 17,238,608 | | | | | Term Loan, 7.110%,
maturing February 01, 2013 | | | | | | | 16,641,411 | | |
| | 12,482,787 | | | | | Term Loan, 7.110%,
maturing February 01, 2013 | | | | | | | 12,050,346 | | |
| | | | | | | NSG Holdings, LLC | | Ba2 | | BB | | | | | |
| | 244,898 | | | | | Term Loan, 6.860%,
maturing June 15, 2014 | | | | | | | 237,551 | | |
| | 2,123,356 | | | | | Term Loan, 6.860%,
maturing June 15, 2014 | | | | | | | 2,059,655 | | |
| | | | | | | Riverside Energy Center, LLC | | B1 | | B | | | | | |
| | 265,185 | | | | | Term Loan, 9.670%,
maturing June 24, 2010 | | | | | | | 264,301 | | |
| | 1,996,411 | | | | | Term Loan, 9.815%,
maturing June 24, 2011 | | | | | | | 1,989,757 | | |
| | 3,250,747 | | | | | Term Loan, 9.815%,
maturing June 24, 2011 | | | | | | | 3,239,913 | | |
| | | | | | | Thermal North America, Inc. | | B1 | | BB | | | | | |
| | 2,000,000 | | | | | Term Loan, 8.110%,
maturing October 24, 2008 | | | | | | | 1,987,500 | | |
| | | | | | | TPF Generation Holdings, LLC | | Ba3 | | BB- | | | | | |
| | 1,415,762 | | | | | Revolver, 7.460%,
maturing December 15, 2013 | | | | | | | 1,358,424 | | |
| | 6,016,579 | | | | | Term Loan, 7.360%,
maturing December 15, 2013 | | | | | | | 5,772,908 | | |
| | 1,916,282 | | | | | Term Loan, 7.460%,
maturing December 15, 2013 | | | | | | | 1,838,672 | | |
| | | | | | | TPF Generation Holdings, LLC | | B3 | | B- | | | | | |
| | 2,000,000 | | | | | Second Lien Term Loan, 9.610%,
maturing December 15, 2014 | | | | | | | 1,924,000 | | |
| | | | | | | Viridian Group PLC | | NR | | NR | | | | | |
| GBP | 1,320,000 | | | | | Second Lien Term Loan, 10.358%,
maturing March 31, 2013 | | | | | | | 2,609,811 | | |
| EUR | 1,310,694 | | | | | Second Lien Term Loan, 8.234%,
maturing March 31, 2013 | | | | | | | 1,743,407 | | |
See Accompanying Notes to Financial Statements
62
ING Senior Income Fund
PORTFOLIO OF INVESTMENTS as of August 31, 2007 (Unaudited) (continued)
| | | | | | | Bank Loan
Ratings† | | Market | |
| Principal Amount | | | | Borrower/Tranche Description | | Moody's | | S&P | | Value | |
| Utilities: (continued) | | | |
| | | | | | | Wolf Hollow I, L.P. | | B1 | | BB- | | | | | |
| $ | 850,000 | | | | | Revolver, 7.750%,
maturing June 22, 2012 | | | | | | $ | 773,500 | | |
| | 4,009,107 | | | | | Term Loan, 7.610%,
maturing June 22, 2012 | | | | | | | 3,648,287 | | |
| | 3,400,000 | | | | | Term Loan, 7.750%,
maturing June 22, 2012 | | | | | | | 3,094,000 | | |
| | | | 117,257,187 | | |
| | | Total Senior Loans
(Cost $2,498,164,675) | | | | | | | 2,415,645,072 | | |
| Other Corporate Debt: 0.2% | | | |
| Automobile: 0.2% | | | |
| | | | | | | Avis Budget Car Rental | | Ba1 | | BB- | | | | | |
| | 750,000 | | | | | Floating Rate Note, 8.058%,
maturing May 15, 2014 | | | | | | | 727,500 | | |
| | | | | | | Navistar International Corporation | | NR | | NR | | | | | |
| | 3,300,000 | | | | | Unsecured Term Loan, 8.610%,
maturing January 19, 2012 | | | | | | | 3,180,375 | | |
| | | Total Other Corporate Debt
(Cost $4,050,000) | | | | | | | 3,907,875 | | |
See Accompanying Notes to Financial Statements
63
ING Senior Income Fund
PORTFOLIO OF INVESTMENTS as of August 31, 2007 (Unaudited) (continued)
| Equities and Other Assets: 0.0% | |
| | Description | | | | Market
Value | |
| (@), (R) | | Decision One Corporation (463,664 Common Shares) | | | | | | $ | 38,587 | | |
| (@), (R) | | Neoplan USA Corporation (1,627 Common Shares) | | | | | | | — | | |
| (@), (R) | | Neoplan USA Corporation (170 Series B Preferred Shares) | | | | | | | — | | |
| (@), (R) | | Neoplan USA Corporation (102 Series C Preferred Shares) | | | | | | | — | | |
| (@), (R) | | Neoplan USA Corporation (331 Series D Preferred Shares) | | | | | | | — | | |
| (@), (R) | | Norwood Promotional Products, Inc. (80,087
Common Shares) | | | | | | | — | | |
| (@), (R) | | Safelite Realty Corporation (30,003 Common Shares) | | | | | | | 506,750 | | |
| | | Total for Equities and Other Assets
(Cost $676,388) | | | | | | | 545,337 | | |
| | | Total Investments
(Cost $2,502,891,063)** | | | 121.1 | % | | $ | 2,420,098,284 | | |
| | | Other Assets and Liabilities — Net | | | (21.1 | ) | | | (421,324,774 | ) | |
| | | Net Assets | | | 100.0 | % | | $ | 1,998,773,510 | | |
* Senior loans, while exempt from registration under the Securities Act of 1933, as amended, contain certain restrictions on resale and cannot be sold publicly. These senior loans bear interest (unless otherwise noted) at rates that float periodically at a margin above the London Inter-Bank Offered Rate ("LIBOR") and other short-term rates.
† Bank Loans rated below Baa by considered to be below investment grade.
NR Not Rated
(1) The borrower filed for protection under Chapter 7 of the U.S. Federal Bankruptcy code.
(2) The borrower filed for protection under Chapter 11 of the U.S. Federal Bankruptcy code.
(3) Loan is on non-accrual basis.
(@) Non-income producing security.
(R) Restricted security.
** For Federal Income Tax purposes cost of investments is $2,503,313,157.
Net unrealized depreciation consists of the following:
| Gross Unrealized Appreciation | | $ | 5,870,753 | | |
| Gross Unrealized Depreciation | | | (89,085,626 | ) | |
| Net Unrealized Depreciation | | $ | (83,214,873 | ) | |
See Accompanying Notes to Financial Statements
64
ING Senior Income Fund
PORTFOLIO OF INVESTMENTS as of August 31, 2007 (Unaudited) (continued)
At August 31, 2007 the following forward foreign currency contracts were outstanding for ING Senior Income Fund:
| Currency | | Buy/Sell | | Settlement
Date | | In Exchange
For | | Unrealized
Value | | Appreciation/
(Depreciation) | |
| Australian Dollar | | | | | | | | | |
| AUD 12,300,000 | | Sell | | 10/15/07 | | $ | 10,316,453 | | | $ | 10,039,349 | | | $ | 277,104 | | |
Australian Dollar
AUD 7,380,000 | | Sell | | 11/15/07 | | | 6,265,915 | | | | 6,017,269 | | | | 248,646 | | |
Australian Dollar
AUD 4,920,000 | | Sell | | 12/14/07 | | | 4,003,650 | | | | 4,006,610 | | | | (2,960 | ) | |
Euro
EUR 49,350,000 | | Sell | | 10/15/07 | | | 66,991,563 | | | | 67,367,096 | | | | (375,533 | ) | |
Euro
EUR 29,610,000 | | Sell | | 11/15/07 | | | 40,621,807 | | | | 40,458,133 | | | | 163,674 | | |
Euro
EUR 19,740,000 | | Sell | | 12/14/07 | | | 26,968,196 | | | | 26,986,973 | | | | (18,777 | ) | |
British Pound Sterling
GBP 12,700,000 | | Sell | | 10/15/07 | | | 25,447,616 | | | | 25,587,119 | | | | (139,503 | ) | |
British Pound Sterling
GBP 7,620,000 | | Sell | | 11/15/07 | | | 15,419,756 | | | | 15,341,254 | | | | 78,502 | | |
British Pound Sterling
GBP 5,080,000 | | Sell | | 12/14/07 | | | 10,191,140 | | | | 10,219,074 | | | | (27,934 | ) | |
Sweden Kronor
SEK 23,595,000 | | Sell | | 10/15/07 | | | 3,450,002 | | | | 3,428,777 | | | | 21,225 | | |
Sweden Kronor
SEK 14,157,000 | | Sell | | 11/15/07 | | | 2,105,036 | | | | 2,059,927 | | | | 45,109 | | |
Sweden Kronor
SEK 9,438,000 | | Sell | | 12/14/07 | | | 1,377,080 | | | | 1,374,504 | | | | 2,576 | | |
| | | $ | 213,158,214 | | | $ | 212,886,085 | | | $ | 272,129 | | |
See Accompanying Notes to Financial Statements
65
Investment Manager
ING Investments, LLC
7337 East Doubletree Ranch Road
Scottsdale, Arizona 85258
Sub-Adviser
ING Investment Management Co.
230 Park Avenue
New York, New York 10169
Administrator
ING Funds Services, LLC
7337 East Doubletree Ranch Road
Scottsdale, Arizona 85258
1-800-992-0180
Institutional Investors and Analysts
Call ING Senior Income Fund
1-800-336-3436
Written Requests
Please mail all account inquiries and other comments to:
ING Senior Income Fund
c/o ING Funds Services, LLC
7337 East Doubletree Ranch Road
Scottsdale, Arizona 85258
Distributor
ING Funds Distributor, LLC
7337 East Doubletree Ranch Road
Scottsdale, Arizona 85258
1-800-334-3444
Transfer Agent
DST Systems, Inc.
P.O. Box 219368
Kansas City, Missouri 64141
Custodian
State Street Bank and Trust Company
801 Pennsylvania Avenue
Kansas City, Missouri 64105
Legal Counsel
Dechert LLP
1775 I Street, N.W.
Washington, D.C. 20006
Toll-Free Shareholder Information
Call us from 9:00 a.m. to 7:00 p.m. Eastern time on any business day for account or other information, at (800) 992-0180
For more complete information, or to obtain a prospectus on any ING fund, please call your Investment Professional or ING Funds Distributor, LLC at (800) 992-0180 or log on to www.ingfunds.com. The prospectus should be read carefully before investing. Consider the fund's investment objectives, risks, charges and expenses carefully before investing. The prospectus contains this information and other information about the fund.

PRSAR-USIF
(0807-102407)
ITEM 2. CODE OF ETHICS.
Not required for semi-annual filing.
ITEM 3. AUDIT COMMITTEE FINANCIAL EXPERT.
Not required for semi-annual filing.
ITEM 4. PRINCIPAL ACCOUNTANT FEES AND SERVICES.
Not required for semi-annual filing.
ITEM 5. AUDIT COMMITTEE OF LISTED REGISTRANTS.
Not required for semi-annual filing.
ITEM 6. SCHEDULE OF INVESTMENTS.
Schedule is included as part of the report to shareholders filed under Item 1 of this Form.
ITEM 7. DISCLOSURE OF PROXY VOTING POLICIES AND PROCEDURES FOR CLOSED-END MANAGEMENT INVESTMENT COMPANIES.
Not required for semi-annual filing.
ITEM 8. PORTFOLIO MANAGERS OF CLOSED-END MANAGEMENT INVESTMENT COMPANIES.
Not applicable.
ITEM 9. PURCHASES OF EQUITY SECURITIES BY CLOSED-END MANAGEMENT INVESTMENT COMPANY AND AFFILIATED PURCHASERS.
None.
ITEM 10. SUBMISSION OF MATTERS TO A VOTE OF SECURITY HOLDERS.
The Board has a Nominating Committee for the purpose of considering and presenting to the Board candidates it proposes for nomination to fill Independent Trustee vacancies on the Board. The Committee currently consists of all Independent Trustees of the Board (6 individuals). The Nominating Committee operates pursuant to a Charter approved by the Board. The primary purpose of the Nominating Committee is to consider and present to the Board the candidates it proposes for nomination to fill vacancies on the Board. In evaluating candidates, the Nominating Committee may consider a variety of factors, but it has not at this time set any specific minimum qualifications that must be met. Specific qualifications of candidates for Board membership will be based on the needs of the Board at the time of nomination.
The Nominating Committee is willing to consider nominations received from shareholders and shall assess shareholder nominees in the same manner as it reviews its own nominees. A shareholder nominee for director should be submitted in writing to the Fund’s Secretary. Any such shareholder nomination should include at a minimum the following information as to each individual proposed for nomination as trustee: such individual’s written consent to be named in the proxy statement as a nominee (if nominated) and to serve as a trustee (if elected), and all information relating to such individual that is required to be disclosed in the solicitation of proxies for election of trustees, or is otherwise required, in each case under applicable federal securities laws, rules and regulations.
The Secretary shall submit all nominations received in a timely manner to the Nominating Committee. To be timely, any such submission must be delivered to the Fund’s Secretary not earlier than the 90th day prior to such meeting and not later than the close of business on the later of the 60th day prior to such meeting or the 10th day following the day on which public announcement of the date of the meeting is first made, by either disclosure in a press release or in a document publicly filed by the Fund with the Securities and Exchange Commission.
ITEM 11. CONTROLS AND PROCEDURES.
(a) Based on our evaluation conducted within 90 days of the filing date, hereof, the design and operation of the registrant’s disclosure controls and procedures are effective to ensure that material information relating to the registrant is made known to the certifying officers by others within the appropriate entities, particularly during the period in which Forms N-CSR are being prepared, and the registrant’s disclosure controls and procedures allow timely preparation and review of the information for the registrant’s Form N-CSR and the officer certifications of such Form N-CSR.
(b) There were no significant changes in the registrant’s internal controls that occurred during the second fiscal quarter of the period covered by this report that has materially affected, or is reasonably likely to materially affect, the registrant’s internal control over financial reporting.
ITEM 12. EXHIBITS.
(a)(1) The Code of Ethics is not required for the semi-annual filing.
(a)(2) A separate certification for each principal executive officer and principal financial officer of the registrant as required by Rule 30a-2 under the Act (17 CFR 270.30a-2) is attached hereto as EX-99.CERT.
(a)(3) Not required for semi-annual filing.
(b) The officer certifications required by Section 906 of the Sarbanes-Oxley Act of 2002 are attached hereto as EX-99.906CERT
SIGNATURES
Pursuant to the requirements of the Securities Exchange Act of 1934 and the Investment Company Act of 1940, the registrant has duly caused this report to be signed on its behalf by the undersigned, thereunto duly authorized.
(Registrant): ING Senior Income Fund
By | /s/ | Shaun P. Mathews | |
| | Shaun P. Mathews |
| | President and Chief Executive Officer |
| |
| |
Date: | November 2, 2007 | |
Pursuant to the requirements of the Securities Exchange Act of 1934 and the Investment Company Act of 1940, this report has been signed below by the following persons on behalf of the registrant and in the capacities and on the dates indicated.
By | /s/ | Shaun P. Mathews | |
| | Shaun P. Mathews |
| | President and Chief Executive Officer |
| |
Date: | November 2, 2007 | |
| |
| |
By | /s/ | Todd Modic | |
| | Todd Modic |
| | Senior Vice President and Chief Financial Officer |
| |
| |
Date: | November 2, 2007 | |