UNITED STATES
SECURITIES AND EXCHANGE COMMISSION
Washington, D.C. 20549
FORM 10-K
x ANNUAL REPORT PURSUANT TO SECTION 13 OR 15(d)
OF THE SECURITIES EXCHANGE ACT OF 1934
For the Fiscal Year Ended January 31, 2008
or
¨ TRANSITION REPORT PURSUANT TO SECTION 13 OR 15(d)
OF THE SECURITIES EXCHANGE ACT OF 1934
Commission File Number 000-31989
CONVERA CORPORATION
(Exact name of registrant as specified in its charter)
Delaware | | 54-1987541 |
| (State or other jurisdiction of | | (I.R.S. Employer |
| incorporation or organization) | | Identification No.) |
| | 1921 Gallows Road, Suite 200, Vienna, Virginia | 22182 |
| | (Address of principal executive offices) | (Zip Code) |
Registrant's telephone number, including area code: (703) 761 - 3700
Securities registered pursuant to Section 12(b) of the Act: None
Securities registered pursuant to Section 12(g) of the Act: Common Stock
Indicate by check mark if the registrant is a well-known seasoned issuer, as defined in Rule 405 of the Securities Act. Yes No ü
Indicate by check mark if the registrant is not required to file reports pursuant to Section 13 or Section 15(d) of the Act. Yes No ü
Indicate by check mark whether the registrant (1) has filed all reports required to be filed by Section 13 or 15(d) of the Securities Exchange Act of 1934 during the preceding 12 months (or for such shorter period that the registrant was required to file such reports) and (2) has been subject to the filing requirements for the past 90 days. Yes ü No __
Indicate by check mark if disclosure of delinquent filers pursuant to Item 405 of Regulation S-K is not contained herein and will not be contained, to the best of registrant's knowledge, in definitive proxy or information statements incorporated by reference in Part III of this Form 10-K or any amendment to this Form 10-K. __
Indicate by check mark whether the registrant is a large accelerated filer, accelerated filer, a non-accelerated filer, or a smaller reporting company. See the definitions of “large accelerated filer,” “accelerated filer” and “smaller reporting company” in Rule 12b-2 of the Exchange Act.
Large Accelerated Filer Accelerated Filer ü Non-Accelerated Filer Smaller reporting company__
Indicate by check mark whether the registrant is a shell company (as defined in Rule 12b-2 of the Exchange Act). Yes No ü
The aggregate market value of the voting stock held by non-affiliates of the registrant as of July 31, 2007 (based on the closing sales price as reported on the NASDAQ National Market System) was $101,792,183.
The number of shares outstanding of the registrant's Class A common stock as of March 12, 2008 was 53,291,194.
DOCUMENTS INCORPORATED BY REFERENCE
Portions of the Registrant’s Proxy Statement for the 2008 Annual Meeting of Shareholders are incorporated by reference into Part III.
ANNUAL REPORT ON FORM 10-K
FOR THE FISCAL YEAR ENDED JANUARY 31, 2008
TABLE OF CONTENTS
| | | Page |
| | PART I | |
| Item 1. | | 1 |
| Item 1A. | | 6 |
| Items 1B. | | 12 |
| Item 2. | | 12 |
| Item 3. | | 12 |
| Item 4. | | 12 |
| | PART II | |
| Item 5. | | 13 |
| Item 6. | | 15 |
| Item 7. | | 16 |
| Item 7A. | | 25 |
| Item 8. | | 25 |
| Item 9 | | 25 |
| Item 9A. | | 25 |
| Item 9B. | | 28 |
| | PART III | |
| Item 10. | | 28 |
| Item 11. | | 28 |
| Item 12 | | 28 |
| Item 13. | | 28 |
| Item 14. | | 28 |
| | PART IV | |
| Item 15. | | 29 |
FORWARD-LOOKING STATEMENTS
The statements contained in this annual report on 10-K that are not purely historical are “forward-looking statements” within the meaning of Section 27A of the Securities Act of 1933 and Section 21E of the Securities Exchange Act of 1934 (“Exchange Act”), including without limitation statements about the expectations, beliefs, intentions or strategies regarding the future of Convera Corporation (hereinafter referred to as “Convera,” “we,” “us” and “our” through this document). Words such as “expects,” “intends,” “plans,” “projects,” “believes,” “estimates,” and similar expressions are used to identify these forward-looking statements. These include, among others, statements regarding our future expectations, performance, plans and prospects as well as assumptions about future events. All forward-looking statements included in this annual report are based on information available to us on the date hereof, and we assume no obligation to update any such forward-looking statements. The forward-looking statements contained herein involve risks and uncertainties discussed under the heading “Risk Factors” below. Our actual results could differ materially from those anticipated in these forward-looking statements as a result of such factors, including those set forth in this annual report.
OVERVIEW
Convera provides vertical search services to trade publishers. Our technology and services help publishers to build a loyal online community and increase their internet advertising revenues. With the use of our vertical search services, our customers can create search engines customized to meet the specialized information needs of their audience by combining publisher proprietary content with an authoritative subset of the World Wide Web (“the Web”.) The result is a more relevant and comprehensive search experience for the user designed to drive traffic to the publishers’ websites. We generate our revenues by receiving a percentage of publishers’ advertising revenues earned by the search sites and by charging minimum fees for our vertical search services. Many of our contracts with publishers contain minimum fees that we are entitled to receive until website advertising revenue generated by the publishers’ search sites exceeds these minimum amounts. We can also generate revenues from hosting publisher websites and from providing technical staff training. We offer professional services to customize publisher websites and optimize search engines, as well as website monetization consulting.
The first publisher search site using our vertical search services was launched in November 2006. With the sale of our RetrievalWare Enterprise Search business (“Enterprise Search”) completed, we are now focused exclusively on executing our vertical search services (previously entitled our Excalibur web hosting product) business strategy. Our sales and marketing efforts are targeting the top 50 business-to-business (“B2B”) publishers in both the United States and United Kingdom, with the goal of building the largest collection of search-based professional user websites on the internet.
On March 31, 2007, we agreed to sell the assets of our Enterprise Search business to Fast Search & Transfer (“FAST”) for $23.0 million. The transaction closed on August 9, 2007, with FAST assuming certain obligations of the business and retaining certain employees serving our Enterprise Search customers. More information about the transaction can be found in Note 2, “Discontinued Operations” of our Consolidated Financial Statements.
Convera was formed through the merger of the former Excalibur Technologies and the Intel Interactive Media Services Division on December 21, 2000. Convera is traded on the NASDAQ stock market (CNVR) and is headquartered at 1921 Gallows Road, Vienna, VA 22182. Our main corporate telephone number is (703) 761-3700.
As of January 31, 2008 and 2007, Allen Holding, Inc., together with Allen & Company Incorporated, Herbert A Allen and certain related parties (collectively “Allen & Company”) beneficially owned approximately 42% of the voting power of Convera and hold three seats on the Board of Directors, and would therefore be able to influence the outcome of matters requiring a stockholder vote.
BUSINESS STRATEGY
The information needs of business, professional and enthusiast communities are typically serviced by specialist publishers. The B2B publisher market has thousands of printed periodicals that are distributed to industry professionals. As these communities migrate online, the publishing industry will need to transition its revenues away from a primary dependence on print advertising and subscriptions to online advertising revenue. Our vertical search and advertising services are designed to help publishers attract and build a loyal user base for the publisher’s online vertical community and generate additional advertising revenues, thereby assisting them with this transition.
A more relevant and precise search alternative to the general consumer search engines, our vertical search services address the unique vocabulary and authoritative content requirements of vertical audiences, such as professional, medical, scientific and technical communities. We work with the editorial team of a publication to develop a whitelist of authoritative websites that are highly relevant to each vertical market. These can include public, private, government, trade association, social, community and subscription sites. Our Web Search Platform deeply mines all the sites and adjusts the crawl strategies to keep content updated as required by the publisher. The content is then enhanced with taxonomies and other navigation tools that are seamlessly integrated into the publisher’s website. These features allow the Web search results using our vertical search services to be extremely focused, relevant search results for topics of significant interest to the target audience of each publication. Professional users of these sites are consequently able to become more efficient and effective in performing their work.
As B2B publishers transition from traditional media to online media, so will advertising spending. Ad agencies and planners need to be able to reach high-value, unique users within an online professional community, particularly as consumer search engines are transforming media advertising revenues to commodity levels. Our vertical search services enhance a publisher’s advertising proposition by delivering to advertisers a highly specific target audience. In addition, the advertising services incorporated into our vertical search offering allow publishers to directly manage and pursue search-based advertising revenues for their websites.
Our revenue strategy is to execute vertical search services agreements wherein we receive a percentage of customer search-related advertising revenue (typically between 20% and 50% of net advertising revenues). Our new and renewal publisher contracts will typically contain a monthly minimum fee for each vertical market served that we will be entitled to receive until our share of the website’s advertising revenues surpasses the minimum fee. We can also generate professional services fees from delivering consulting and training to our customers, and from website hosting services.
PRODUCTS AND SERVICES
We provide publishers with our vertical search technology on a “software as a service” basis. Our vertical search service is designed to help publishers deliver unique value to their online community by customizing the search experience to meet the specialized information needs of the publisher’s audience. The targeted search solution enables publishers to further engage their audiences and increase online advertising revenue. We provide the technical infrastructure, search expertise and best practice advice required to build vertical search applications. The publisher provides the insight into the information needs of the target community, which is used to customize the look, feel and functionality of the search experience to the needs of that community. The result is a search application that yields a blended result to a user query - incorporating information from the Web at large, as well as from an authoritative subset of Web content and multiple proprietary sources. End users are presented with more relevant search results in a comprehensive, consolidated manner, regardless of the repository source or location. Search results can be presented to the user through an intuitive and dynamic page layout that is designed, controlled and branded by the publisher. Our vertical search offering can be integrated into one or more of the publisher’s existing websites or used to establish a new brand or product. As an option, we can host the search results but still present the results under the publisher’s brand. Our advertising server capabilities, which are built into our Web Search Platform, allow us to serve any type of ad and measure all key analytics.
We offer the following services:
Vertical Search Service
Our vertical search service is an integrated suite of the following components:
Convera Web Search Platform
Leveraging our fifteen years of search customization experience in the secure government sector, our Web Search Platform was built using semantic processing technologies to enhance the search experience. It incorporates a large set of commercially recognized taxonomies in addition to privately compiled taxonomies and thesauri to create a large and very granular Web index. This core design feature allows the platform to draw dynamic connections between topically or contextually related content, resulting in a better understanding of the nature of the query along with the relevancy of the content. Our platform is capable of supporting hundreds of simultaneous vertical search applications provided under 24X7 service level agreements. The plan is to extend our vertical search capabilities across multiple lingual content including Spanish, French, German, Dutch, Portuguese, Chinese, Japanese, and Korean. This is facilitated through a large-scale translation operation that translates concepts and terminology into their cross-lingual equivalents. This means that the millions of categories and related semantic resources applied to understanding content in one language are reproduced and consistently applied to understanding the content of other languages - uniformly and reliably delivering authoritative results across multiple languages. Our Web Search Platform incorporates multimedia search of Adobe Systems Portable Document Format (PDF), image files and other data formats. Our multimedia image crawler also identifies images and associated descriptive information (meta data) to enable highly relevant search results across various media types available on the Web. This insures that the crawler retrieves and displays relevant information from news or video archives, as well as other multimedia repositories.
Publisher Control Panel (PCP)
Our Publisher Control Panel is a self-service application that provides the publisher with the ability to control and tailor the Convera Web Search Platform and the Convera Ad Service for each vertical search site from a single interface. Each publisher’s initial vertical search site is readied for launch by the publisher team using the PCP. Each initial vertical application launch is managed and mentored by a member of our implementation team. The publisher receives hands-on training from the Convera implementation team on the use, management and customization of the vertical search site using the PCP tools. This hands-on training allows a publisher to easily set-up additional vertical search sites and administer a combined website and best-of-Web search experience designed to meet the specific information needs of the publisher’s audience.
Using the PCP, publishers can customize search categories, manage the look and feel of their vertical search sites, manage whitelists containing the index of websites to search, customize relevance ranking schemes and the presentation of search results each employing the easy to use tools and interfaces. The publisher also uses the PCP to insert advertisements into the vertical search sites using the Convera Ad Service. The PCP also serves as a dashboard for each vertical site, containing search analytics and content analytics tools. It provides the publisher with various usage and other reports to help them steer each online vertical community to optimize the publisher’s goal for its online community supported by the vertical site.
Convera Ad Service (CAS)
Our Convera Ad Service allows publishers to directly manage and pursue search-based advertising revenues for their vertical search websites. CAS connects the publisher websites directly with the providers of advertising inventory, enhancing publishers’ abilities to increase their web advertising revenues, supporting the insertion, tracking and billing of a variety of ad pricing models including banner ads, tenancy ads, search term ads and click-through advertisements.
Professional Services
We offer a range of professional services aimed at ensuring the publisher’s vertical search application is a success in terms of increasing website traffic and generating online advertising revenue. The services include website customization; search engine optimization, marketing services and training; and advertising sales kit development and training.
MARKETING AND DISTRIBUTION
Our vertical search offering is sold as a hosted service through a direct sales force located in the United States and United Kingdom. We are also exploring the prospect of strategic partners such as large advertising agencies or resellers who may provide increased distribution capabilities, access to incremental human resources and possible hosting facility alternatives. As previously disclosed above, our sales efforts are focused principally on the top 50 B2B publishers in the United States and United Kingdom. The top 50 publishers have an estimated 2,000-plus relevant magazine titles that could be converted to search-based sites and subscribers totaling more than two million professionals.
Our marketing efforts focus on building brand awareness and establishing demand for our vertical search services through public relations campaigns, trade association memberships and electronic marketing campaigns. As our customer references and reputation in the vertical search market increase, we expect word-of-mouth to accelerate our growth. Our website, www.convera.com, is an integral part of our marketing and sales efforts, but information on our website is not a part of this Form 10-K. Through the website, prospective customers can learn about our vertical search services and be connected to the websites of current customers utilizing our services.
RESEARCH AND DEVELOPMENT
Our research and development program focuses on enhancing and expanding the capabilities of our vertical search services to address emerging markets and customer requirements. Certain elements of our developed technologies are provided to us pursuant to license agreements with other independent software vendors. The technologies acquired by the Company in this manner include a language processor, spell checker and FAST Ad Momentum advertising platform. These license agreements have varying terms for which we have made a prepaid royalty payment or purchased a perpetual license.
Our research and development expenses were $4.7 million, $11.0 million, and $3.2 million for the years ended January 31, 2008, 2007, and 2006, respectively.
INTELLECTUAL PROPERTY AND PROPRIETARY TECHNOLOGY
We regard our software as proprietary and rely primarily on a combination of patents, copyright, trademark and trade secret laws of general applicability, employee confidentiality and invention assignment agreements, and other intellectual property protection methods to safeguard our technology. We hold one patent related to our current business strategy. This patent, which concerns multimedia document retrieval, expires on August 24, 2018. We are actively engaged in seeking additional patents specifically related to our vertical search offering. We have undertaken to protect all significant marks used to identify our core services. We own U.S. trademark registrations or pending applications for our material trademarks, including CONVERA and THE VERTICAL SEARCH COMPANY. Renewals are due at various dates between July 2008 and August 2013. In addition, we own numerous foreign applications and registrations for our material trademarks.
COMPETITION
Our business environment is characterized by rapid change and intense competition. We compete primarily within the internet search market. Within this market, there are current competitors who are larger and more established than we are and have significantly greater financial, technical, marketing and other resources. These competitors include established significant technology providers focused on search advertising like Google (CSE) and Yahoo! and those that are moving from a strong industry presence elsewhere into search like Microsoft Live Search. We also face competition from enterprise search software and enterprise search appliance vendors selling their solutions to publishers who are determined to build their own online solution. There are also potential and emerging competitors entering the market with increasingly differentiated technologies.
We believe relevance of search results and implementation ease to be the principal evaluation criteria of potential publisher customers. We consider our principal competitive advantages to be that our vertical search service provides more accurate results due to an extensive semantic network contained in our Web Platform and offers the ability to produce authoritative results through exhaustive ingestion of content sources. Additionally, our Publishers Control Panel offers an easy-to-use, self-service solution to publishers. Virtually no technical expertise is required of the customer. We believe we are currently the only company that offers a complete suite of vertical search capabilities that includes hosting, semantic vertical search, traffic building tools and professional services. There can be no assurance that we will be able to compete successfully against current or future competitors and that competition will not have a material adverse effect on our operating results and financial condition in the future.
SEGMENT AND GEOGRAPHIC AREA FINANCIAL INFORMATION
We have one reportable segment. Prior to our agreement on March 31, 2007 to sell the assets of the Enterprise Search business to FAST, we operated under two reportable segments: the Enterprise Search segment and the vertical search segment (previously entitled our Excalibur web hosting product). Financial information is located in the financial statements beginning on page F-2. The assets and liabilities of the Enterprise Search business have been reported as “assets held for sale” and “liabilities held for sale” on the Consolidated Balance Sheets. Revenue, expenses and cash flows related to the Enterprise Search business have been reflected as discontinued operations in the Consolidated Statements of Operations and of Cash Flows.
All of our revenues are from third-party customers. In the fiscal year ended January 31, 2008, one customer, CMP Information Ltd., accounted for 82% of our revenues. In the fiscal year ended January 31, 2007, three customers accounted for 53%, 29%, and 17% of total revenues, respectively. A single customer accounted for 100% of revenues in fiscal year 2006.
To date, our revenues have been earned principally from customers located in the United Kingdom. For geographic area revenues and long-lived assets information, see Note 12, “Segment Reporting” in the Notes to Consolidated Financial Statements.
EMPLOYEES
We had 76 employees at January 31, 2008. See Item 1A. “Risk Factors” for a discussion of some of the risks we face related to our employees.
AVAILABLE INFORMATION
Our website address is www.convera.com. Through our website, we make available free of charge our annual reports on Form 10-K, quarterly reports on Form 10-Q, current reports on Form 8-K, and amendments to those reports filed or furnished pursuant to Section 13(a) or 15(d) of the Exchange Act as soon as reasonably practicable after such material is filed with, or furnished to, the U.S. Securities and Exchange Commission (“SEC”). The contents of our website are not part of, or incorporated into, this document. The SEC also maintains a website (http://www.sec.gov) that contains reports, proxy and information statements and other information regarding issuers that file electronically with the SEC.
An investment in our common stock involves substantial risks and uncertainties and our actual results and future trends may differ materially from our past performance due to a variety of factors, including, without limitation, the risk factors identified below. The risks and uncertainties described below are not the only risks and uncertainties we face. Additional risks and uncertainties not presently known to us or that we currently deem immaterial also may impair our business operations. If any of the following risks actually occur, our business, results of operations and financial condition would suffer. In that event, the trading price of our common stock could decline, and our stockholders may lose part or all of their investment in our common stock. The discussion below and elsewhere in this report also includes forward-looking statements, and our actual results may differ substantially from those discussed in these forward-looking statements as a result of the risks discussed below.
We have had a history of operating losses and will likely incur future losses; if our losses continue and we are unable to achieve profitability, our stock price will likely suffer.
As of January 31, 2008, we had an accumulated deficit of approximately $1.1 billion. We have operated at a loss for each of the past three fiscal years. For the fiscal years ended January 31, 2008, 2007 and 2006, our net losses were approximately $9.1 million, $44.8 million, and $14.3 million, respectively. These financial results include revenues and expenses associated with the Enterprise Search business, the sale of which was completed on August 9, 2007. The loss from continuing operations for the fiscal years ended January 31, 2008, 2007 and 2006 was $27.0 million, $45.3 million and $19.0 million, respectively. We expect that the Company will continue the trend of significant operating losses and uses of cash at least for the short term until the revenue base for our vertical search services grows to sufficient levels to support its expenses. We have a short operating history in the vertical search business; the first Convera supported vertical search site was launched into production in November 2006. Previously, our market strength had been in the government sector, whereas we now compete solely within the commercial sector. In addition, our revenue contracts generally stipulate that we will receive a percentage of website advertising revenues, and online advertising is an immature and rapidly evolving industry. Accordingly, we cannot assure you that we will generate the revenues required to achieve or maintain profitability in the future. You should assess our business in light of the risks, difficulties, uncertainties, and expenses associated with managing and growing a relatively new business in a rapidly evolving market. Our failure to achieve and sustain our profitability will negatively impact the market price of our common stock.
Our ability to achieve profitability is dependent on our vertical search business and if it fails to achieve market acceptance we will be unable to grow our business and achieve profitability.
Our future profitability will depend on our ability to successfully market and achieve market acceptance for our vertical search services offering. The degree of market acceptance will depend upon a number of factors, including:
| · | the advantages of our vertical search services over competing products; |
| · | our ability to innovate and develop new features for our vertical search offering; |
| · | customer needs for search products; |
| · | the price and cost-effectiveness of our vertical search offering; and |
| · | the strength of sales, marketing and distribution support. |
We are aware of a significant number of competing well-established search products offered by companies with significantly greater financial and marketing resources than us. Even if our vertical search services achieve market acceptance, we may not be able to maintain that market acceptance over time if competing products or services are introduced that are viewed as more effective or are more favorably received. If our vertical search services do not achieve and maintain market acceptance, we will not be able to generate sufficient revenue to attain profitability.
While we believe we will have sufficient funds for our operations for at least the next twelve months, it is possible that we will need additional capital during or after that time. If such additional capital is not available to us on acceptable terms or at all, it could harm our financial condition and future prospects.
As of January 31, 2008, our balances of cash and cash equivalents were approximately $36.7 million. We believe our current balance of cash and cash equivalents will be sufficient to meet our working capital and capital expenditure requirements for at least the next twelve months based upon our estimates of funds required to operate our business during such period. However, during or after that time, we may need to raise additional funds for the following purposes:
| | · | to fund our operations, including sales, marketing and research and development programs; |
| | · | to fund any growth we may experience; |
| | · | to enhance and/or expand the range of products and services we offer; |
| | · | to increase our promotional and marketing activities; or |
| | · | to respond to competitive pressures and/or perceived opportunities, such as investment, acquisition and international expansion activities. |
We cannot reassure our investors that if we need additional capital that it will be available, and if so, on terms beneficial to us. Historically, we have obtained external financing primarily from sales of our common stock. To the extent we raise additional capital by issuing equity securities, our stockholders may experience substantial dilution. If we are unable to obtain additional capital, we may then attempt to preserve our available resources by various methods including deferring the creation or satisfaction of commitments, reducing expenditures on our research and development programs or otherwise scaling back our operations. If we were unable to raise such additional capital or defer certain costs as described above, that inability would have an adverse effect on our financial position, results of operations and prospects.
We experience quarterly fluctuations in our operating results, which may adversely affect our stock price.
Our quarterly operating results have varied substantially in the past and will likely continue to vary. With the completion of the FAST transaction and resulting exit of the enterprise search market, our business is evolving as we focus all of our financial and management resources on the vertical search business. Historical operating results may not be useful in predicting our future operating results. The vertical search business has yet to generate revenues in excess of its expenses and is not anticipated to do so for at least the near term. We expect that expenditures will continue to be significant. Our quarterly operating results are likely to continue to vary substantially from quarter to quarter in the future due to a variety of factors including the following:
| · | the ability of our vertical search services to achieve market acceptance; |
| · | the mix in our revenues between subscription fees and contractual minimum revenue amounts and revenues generated as a percentage of publisher website advertising revenues; |
| · | the level of customer demand for our hosting and professional services; |
| · | an increase in competition in the internet search industry; |
| · | the size and timing of individual transactions; |
| · | changes in operating expenses and personnel; |
| · | changes in accounting principles; |
| · | changes in general economic and geo-political conditions and specific economic conditions in the internet search industry; |
| · | fluctuations in the internet advertising budgets of advertisers; and |
| · | seasonality in the spending of internet advertisers. |
We are in an extremely competitive market, and if we fail to compete effectively or respond to rapid technological change, our revenues and market share will be adversely affected.
Our business environment and the search industry in general are characterized by intense competition, rapid technological changes, changes in customer requirements and emerging new market segments. Our competitors include many companies that are larger and more established and have substantially more resources than us and may include start-ups as well. Current and potential competitors have established or may establish cooperative relationships among themselves or with third parties to increase the ability of their products to address the needs of the markets which we serve. Accordingly, it is possible that new competitors or alliances among competitors may emerge and rapidly acquire significant market share.
In order for our strategy to succeed and to remain competitive, we must provide vertical search services that meet the needs of the B2B and specialized publishing companies. We will need to invest significant resources in research and development to provide the publishers with leading-edge search technology to help them deliver unique value to their online community and increase online advertising revenues. To effectively compete we will need to continually improve our current service offerings and innovate by introducing new services that are responsive to the needs of our users. The development efforts required for this are expensive, and we plan to fund these developments with our existing capital resources, and other sources, such as equity issuances and borrowings, which may be available to us. If these developments do not generate substantial revenues, our business and results of operations will be adversely affected. We cannot assure you that we will successfully develop any new products or services, complete them on a timely basis or at all, achieve market acceptance or generate significant revenues with them.
We depend on international sales, particularly in the United Kingdom, and any economic downturn, changes in laws, changes in currency exchange rates or political unrest in the United Kingdom or in other countries could have a material adverse effect on our business.
To date, the majority of revenues related to our business have been derived from publishers in the United Kingdom. For the year ended January 31, 2008, total revenue derived from international sales was approximately $1.0 million, representing approximately 88% of total revenue. For the year ended January 31, 2007, revenue derived from international sales was approximately $0.1 million, representing approximately 53% of total revenue. Our international operations have historically exposed us to longer accounts receivable and payment cycles and fluctuations in currency exchange rates. International sales are made mostly from our U.K. subsidiary and are denominated in British pounds or Euros. As of January 31, 2008, approximately 97% of our total consolidated accounts receivable were denominated in British pounds. Additionally, our exposure to foreign exchange rate fluctuations arises in part from intercompany accounts in which royalties on our foreign subsidiary’s sales are charged to our foreign subsidiary and recorded as intercompany receivables on our books. We are also exposed to foreign exchange rate fluctuations as the financial results of our foreign subsidiary are translated into U.S. dollars in consolidation. Since exchange rates vary, those results when translated may vary from expectations and adversely impact overall expected profitability.
Our international operations expose us to a variety of other risks that could seriously impede our financial condition and growth. These risks include the following:
| | · | potentially adverse tax consequences; |
| | · | difficulties in complying with regulatory requirements and standards; |
| | · | trade restrictions and changes in tariffs; |
| | · | import and export license requirements and restrictions; and |
| | · | uncertainty of the effective protection of our intellectual property rights in certain foreign countries. |
If any of these risks described above materialize, our international sales could decrease and our foreign operations could suffer.
Our vertical search offering relies on a third party hosting facility, and any failure or interruption in the services provided by this third party could harm our ability to operate our business and damage our reputation.
We rely on AT&T to host our vertical search offering. We do not control the operation of the AT&T facility, which may be subject to damage or interruption from earthquakes, floods, fires, power loss, telecommunications failures or similar events. The facility may also be subject to break-ins, sabotage, intentional acts of vandalism or similar misconduct. Despite precautions taken at the facility, the occurrence of a natural disaster, cessation of operations by our third-party web hosting provider or its decision to close the facility without adequate notice or other unanticipated problems at the facility could result in lengthy interruptions in our service. In addition, the failure by the facility to provide our required data communications capacity could result in interruptions in our service. Interruptions in our service may cause us to lose revenue, cause us to issue credits or refunds and cause customers to terminate their contracts with us. Our business and reputation will be adversely affected if our customers and potential customers believe our vertical search service is unreliable.
Because of the technical nature of our business, our intellectual property is extremely important to our business, and adverse changes to our intellectual property could harm our ability to compete.
We believe that our success depends, in part, on our ability to protect our proprietary rights and technology. Historically, we have relied on a combination of copyright, patents, trademark and trade secret laws, employee confidentiality and invention assignment agreements, and other methods to safeguard our technology and software products and services. Risks associated with our intellectual property include the following:
| | · | pending patent applications may not be issued; |
| | · | intellectual property laws may not protect our intellectual property rights; |
| | · | third parties may challenge, invalidate, or circumvent any patent issued to us; |
| | · | rights granted under patents issued to us may not provide competitive advantages to us; |
| | · | unauthorized parties may attempt to obtain and use information that we regard as proprietary despite our efforts to protect our proprietary rights; |
| | · | others may independently develop similar technology or design around any patents issued to us; and |
| | · | effective protection of intellectual property rights may be limited or unavailable in some foreign countries in which we operate. |
We may in the future be subject to intellectual property rights claims, which are costly to defend and could require us to pay damages and could limit our ability to use certain technologies in the future.
Companies in the internet, search and technology industries own large numbers of patents, copyrights, trademarks and trade secrets and frequently enter into litigation based on allegations of infringement or other violations of intellectual property rights. We face the possibility of intellectual property rights claims against us. Our technologies may not be able to withstand any third-party claims or rights against their use. Any intellectual property claims, with or without merit, could be time-consuming, expensive to litigate or settle and could divert management resources and attention.
With respect to any intellectual property rights claim, we may have to pay damages or stop using technology if it is ultimately found by a court to be in violation of a third party’s rights. We may have to seek a license for the technology, which may not be available on reasonable terms and may significantly increase our operating expenses. The technology also may not be available for license to us at all. As a result, we may also be required to develop alternative non-infringing technology, which could require significant effort and expense. If we cannot license or develop technology for the infringing aspects of our business, we may be forced to limit our product and service offerings and may be unable to compete effectively. Any of these results could harm our operating results.
We depend on highly skilled personnel, the loss of whom would adversely affect our ability to effectively grow our business and we may have difficulty attracting and retaining skilled employees.
Our success depends to a significant degree upon the continued contributions of our key management and other highly skilled individuals. We generally do not utilize employment agreements for our key employees. The loss of the services of one or more key employees could have a material adverse effect on our ability to grow our business. We also believe that our future success will depend in large part upon our ability to attract and retain additional highly skilled personnel for all areas of our business. Competition for personnel within the internet and search industries is intense. There can be no assurance that we will be successful in attracting and retaining such personnel.
Our stock price may fluctuate which may make it difficult to resell shares of our stock.
The market price of our common stock has been highly volatile. For example, in the fiscal year ended January 31, 2008, the market price per share of our common stock ranged from $2.00 to $4.75. This volatility may adversely affect the price of our common stock, and our stockholders may not be able to resell their shares of common stock following periods of volatility because of the market's adverse reaction to this volatility. We anticipate that this volatility, which frequently affects the stock of technology companies, will continue. Our stock price may fluctuate and you may not be able to resell shares of our stock for a profit as a result of a number of factors including:
| | · | future announcements concerning us or our competitors; |
| | · | quarterly variations in our operating results; |
| | · | actual or anticipated announcements of technical innovations or new product or service developments by us or our competitors; |
| | · | general conditions in our industry; |
· concentrated holdings of our common stock;
· sales of stock by us or by our stockholders;
| · | the low trading volume of our common stock, which means that small changes in the volume of trades may have a disproportionate impact on our stock price; |
| | · | developments concerning litigation; and |
| | · | worldwide economic and financial conditions. |
On occasion, the equity markets, and in particular the markets for technology companies, have experienced significant price and volume fluctuations. These fluctuations have affected the market price for many companies' securities and may be unrelated to the companies' operating performance.
We may not be able to use net operating loss carryforwards.
As of January 31, 2008, we had net operating loss carryforwards of approximately $208 million. The deferred tax assets representing the benefits of these carryforwards have been offset completely by a valuation allowance due to our lack of an earnings history. The realization of the benefits of these carryforwards depends on sufficient taxable income in future years. Lack of future earnings could adversely affect our ability to utilize these carryforwards. Additionally, past or future changes in our ownership and control could limit the ability to utilize these carryforwards. Despite the carryforwards, we may have income tax liability in future years due to the application of the alternative minimum tax rules of the United States Internal Revenue Code.
Our amended and restated certificate of incorporation, bylaws, ownership and Delaware law contain provisions that could discourage a third party from acquiring us and consequently decrease the market value of an investment in our stock.
Some provisions of our amended and restated certificate of incorporation and bylaws, and of Delaware law, as well as our ownership structure, could delay or prevent a change of control or changes in our management that a stockholder might consider favorable. Any delay or prevention of a change of control or change in management could cause the market price of our common stock to decline. These provisions include:
| · | Our Board of Directors has the authority to issue up to 5,000,000 shares of preferred stock and to determine the price, rights, preferences, privileges and restrictions, including voting rights, of those shares without any further vote or action by the stockholders. The issuance of preferred stock may delay, defer or prevent a change in control, as the terms of the preferred stock that might be issued could potentially prohibit our consummation of any merger, reorganization, sale of substantially all of our assets, liquidation or other extraordinary corporate transaction without the approval of the holders of the outstanding shares of preferred stock. |
| · | Our Board of Directors may alter our bylaws without obtaining stockholder approval. |
| · | We are subject to the provisions of Section 203 of the Delaware General Corporation Law which prohibits a Delaware corporation from engaging in certain business combinations with any interested stockholder for a period of three years, unless specific conditions are met. |
Allen Holding Inc. and related parties exercise voting control over a significant percentage of our outstanding shares, and our other stockholders may not have an effective say in any matters upon which our stockholders vote.
As of January 31, 2008, Allen & Company beneficially owned approximately 42% of our voting power and held three seats on the Board of Directors, and would therefore be able to influence the outcome of matters requiring a stockholder vote. These matters could include offers to acquire us and elections of directors. Allen & Company may have interests which are different than the interests of our other stockholders.
Legislative actions and potential new accounting pronouncements are likely to impact our future financial position or results of operations.
Future changes in financial accounting standards may cause adverse, unexpected revenue fluctuations and affect our financial position or results of operations. New pronouncements and varying interpretations of pronouncements have occurred with frequency in the past and may occur again in the future and as a result we may be required to make changes in our accounting policies. For example, the recent requirement to expense stock options in accordance with SFAS No. 123(R) resulted in recording $1.2 million and $4.1 million of stock-based compensation expense in continuing operations for the fiscal years ended January 31, 2008 and 2007, respectively. Compliance with new regulations regarding corporate governance and public disclosure may result in additional expenses. As a result, we intend to invest all reasonably necessary resources to comply with evolving standards, and this investment may result in increased general and administrative expenses and a diversion of management time and attention from science and business activities to compliance activities. For example, we have incurred and expect to continue to incur substantial costs and expend significant resources to comply with the regulations promulgated under Section 404 of the Sarbanes-Oxley Act of 2002.
Our internal controls may not be sufficient to achieve all stated goals and objectives.
Our internal controls and procedures were developed through a process in which our management applied its judgment in assessing the costs and benefits of such controls and procedures, which, by their nature, can provide only reasonable assurance regarding the control objectives. The design of any system of internal controls and procedures is based in part upon various assumptions about the likelihood of future events, and there can be no assurance that any design will succeed in achieving its stated goals under all potential future conditions, regardless of how remote.
We may be subject to regulatory scrutiny and sustain a loss of public confidence if we are unable to satisfy regulatory requirements relating to our internal controls over financial reporting and/or we have internal control weaknesses which result in material financial reporting errors.
Section 404 of the Sarbanes-Oxley Act of 2002 requires us to perform an evaluation of our internal controls over financial reporting and have our independent registered public accounting firm attest to such evaluation on an annual basis. Compliance with these requirements can be expensive and time-consuming. While we believe that we will be able to meet the required deadlines, no assurance can be given that we will meet the required deadlines in future years. If we fail to timely complete this evaluation, or if our auditors cannot timely attest to our evaluation, we may be subject to regulatory scrutiny and a loss of public confidence in our internal controls.
The Sarbanes-Oxley Act of 2002 ensures that companies are reporting accurate revenue numbers and revenue recognition policies have been under particular scrutiny. Any weaknesses in our internal controls on our financial reporting of revenue could cause prospective revenue adjustments or changes in our future revenue recognition policies. Either result could cause unexpected changes to current and/or anticipated future operating results and have a material adverse effect on our financial condition and stock price.
As of January 31, 2007, we identified material weaknesses in internal controls over our accounting close and reporting and revenue recognition processes. We determined that we lacked a sufficient number of trained accounting and finance personnel with knowledge of our accounting close and financial reporting processes and adequate technical expertise in the application of U.S. generally accepted accounting principles. This inadequate level of skilled resources resulted in accounting processes which were completed neither effectively nor on a timely basis. Subsequent to January 31, 2007, we took several steps to remediate the material weaknesses and we have concluded that we maintained effective internal control over financial reporting as of January 31, 2008, based on the criteria established in the Committee of Sponsoring Organizations of the Treadway Commission’s Internal Control - Integrated Framework. Because of its inherent limitations, internal control over financial reporting may not prevent or detect misstatements. Projections of any evaluation of effectiveness to future periods are subject to risks that controls may become inadequate because of changes in conditions, or that the degree of compliance with the policies or procedures may deteriorate.
There are no material unresolved SEC staff comments as of the date of this report.
We occupy our corporate headquarters under an extended lease agreement that expires on August 31, 2009 for a total of approximately 14,186 square feet of space in an office building in Vienna, Virginia.
We also lease offices in Carlsbad, California, and Bracknell, United Kingdom. We have subleased space to tenants at our former offices in Columbia, Maryland and Montreal, Canada. We utilize a hosting facility located in Dallas, Texas operated under a master hosting arrangement with AT&T that expires in July 2009.
None.
None.
PART II
Our Class A common stock is listed on the NASDAQ Global Market under the symbol “CNVR.”
The following table sets forth the high and low sale prices for our Class A common stock on the NASDAQ Global Market for the period from February 1, 2006 through January 31, 2008. The number of stockholders of record of our Class A common stock as of January 31, 2008 was 917. There were no shares of our Class B common stock issued or outstanding at January 31, 2008. We have never declared or paid dividends on our common stock and do not expect to do so for the foreseeable future.
| | | High | | Low | |
| Fiscal 2008 (February 1, 2007 - January 31, 2008) | | | | | | | |
| | | | | | | | |
First Quarter | | $ | 3.98 | | $ | 2.50 | |
Second Quarter | | | 4.75 | | | 3.08 | |
Third Quarter | | | 3.98 | | | 2.72 | |
Fourth Quarter | | | 3.89 | | | 2.00 | |
| | | | | | | | |
| Fiscal 2007 (February 1, 2006 - January 31, 2007) | | | | | | | |
| | | | | | | | |
First Quarter | | $ | 10.25 | | $ | 7.40 | |
Second Quarter | | | 8.50 | | | 5.40 | |
Third Quarter | | | 6.80 | | | 4.56 | |
Fourth Quarter | | | 5.57 | | | 3.50 | |
The following table sets forth, as of January 31, 2008, information with respect to our equity compensation plans:
Plan Category | Number of Securities to be Issued Upon Exercise of Outstanding Options, Warrants and Rights (a) | | Weighted-Average Exercise Price of Outstanding Options, Warrants and Rights (1) (b) | | Number of Securities Remaining Available for Future Issuance Under Equity Compensation Plans (Excluding Securities Reflected in Column (a)) (c) |
| Equity compensation plans approved by security holders: | | | | | |
| Convera Employee Stock Purchase Plan | 5,354,756 | | $4.79 | | 11,307,962 |
| Equity compensation plans not approved by security holders: | None | | N/A | | N/A |
(1) For purposes of calculating the weighted-average exercise price, deferred shares have been excluded because there is no exercise price.
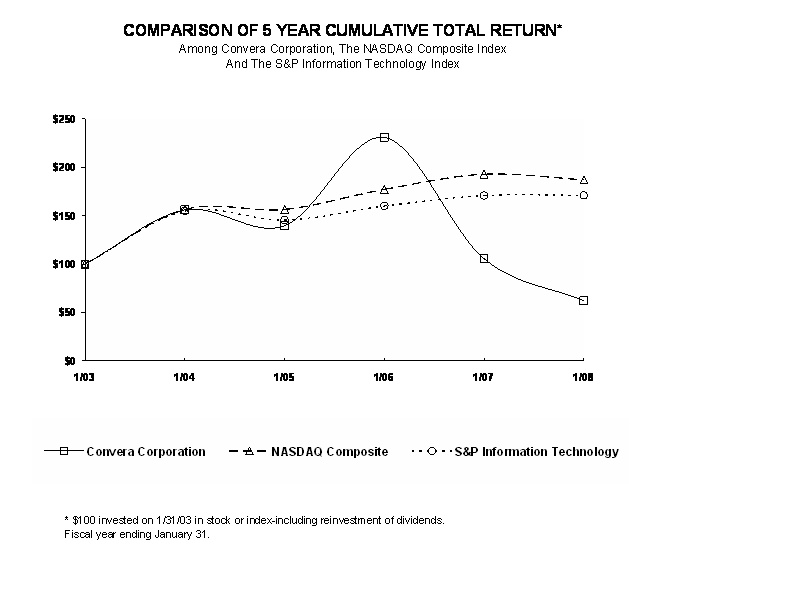
Performance Graph
The following graph is a comparison of the cumulative total return to stockholders of our Class A common stock at January 31, 2008 since January 31, 2003 to the cumulative total return over such period of (i) the NASDAQ Stock Market-U.S., and (ii) the Standard & Poor's Information Technology Index, assuming an investment in each of $100 on January 31, 2003 and the reinvestment of dividends.
Recent Sales of Unregistered Securities; Uses of Proceeds from Registered Securities
None.
The selected financial data presented below have been derived from our consolidated financial statements. The balance sheet data as of January 31, 2008 and 2007, and the statement of operations data for the fiscal years ended January 31, 2008, 2007, and 2006 should be read in conjunction with the consolidated financial statements and notes thereto included elsewhere in this Annual Report on Form 10-K.
| | | Fiscal Years Ended January 31, | |
| | | 2008 | | 2007 | | 2006 | | 2005 | | 2004 | |
| Statement of Operations Data: | | | |
| | | | | | | | | | | | |
Continuing Operations(1): | | | | | | | | | | | |
| Revenues | | $ | 1,118 | | $ | 269 | | $ | 20 | | $ | - | | $ | - | |
| | | | | | | | | | | | | | | | | |
| Operating expenses: | | | | | | | | | | | | | | | | |
| Cost of revenues | | | 9,660 | | | 8,138 | | | 1,797 | | | - | | | - | |
| Sales and marketing | | | 3,880 | | | 4,386 | | | 2,804 | | | - | | | - | |
| Research and product development | | | 4,652 | | | 11,010 | | | 3,198 | | | 4,164 | | | - | |
| General and administrative | | | 11,179 | | | 14,833 | | | 10,860 | | | - | | | - | |
| Amortization of capitalized research and development costs | | | - | | | 3,045 | | | 1,012 | | | - | | | - | |
| Impairment of long-lived assets | | | 603 | | | 6,407 | | | - | | | - | | | - | |
| | | | 29,974 | | | 47,819 | | | 19,671 | | | 4,164 | | | - | |
| Operating loss | | | (28,856 | ) | | (47,550 | ) | | (19,651 | ) | | (4,164 | ) | | - | |
| Other income, net | | | 1,815 | | | 2,267 | | | 602 | | | 175 | | | - | |
| Loss from continuing operations | | $ | (27,041 | ) | $ | (45,283 | ) | $ | (19,049 | ) | $ | (3,989 | ) | $ | - | |
| | | | | | | | | | | | | | | | | |
Discontinued Operations: | | | | | | | | | | | | | | | | |
| Income (loss) from discontinued operations | | | 20 | | | 456 | | | 4,788 | | | (15,831 | ) | | (18,059 | ) |
| Gain on sale of discontinued operations | | | 17,925 | | | - | | | - | | | - | | | - | |
| Income (loss) from discontinued operations | | | 17,945 | | | 456 | | | 4,788 | | | (15,831 | ) | | (18,059 | ) |
| | | | | | | | | | | | | | | | | |
| Net loss | | $ | (9,096 | ) | $ | (44,827 | ) | $ | (14,261 | ) | $ | (19,820 | ) | $ | (18,059 | ) |
| Net income (loss) per common share - basic and diluted: | | | | | | | | | | | | | | | | |
| Continuing Operations | | $ | (0.51 | ) | $ | (0.87 | ) | $ | (0.44 | ) | $ | (0.11 | ) | $ | 0.00 | |
| Discontinued Operations | | | 0.34 | | | 0.01 | | | 0.11 | | | (0.45 | ) | | (0.57 | ) |
| Net loss per common share - basic and diluted | | $ | (0.17 | ) | $ | (0.86 | ) | $ | (0.33 | ) | $ | (0.56 | ) | $ | (0.57 | ) |
| Weighted-average number of common shares outstanding - basic and diluted | | | 53,146 | | | 52,222 | | | 43,089 | | | 35,433 | | | 31,486 | |
| | | | | | | | | | | | | | | | | |
| Balance Sheet Data (at end of period) | | | | | | | | | | | | | | | | |
| Cash and cash equivalents | | $ | 36,641 | | $ | 47,433 | | $ | 37,741 | | $ | 17,766 | | $ | 30,530 | |
| Total assets | | | 46,367 | | | 59,281 | | | 64,217 | | | 36,294 | | | 45,695 | |
| Long-term obligations | | | - | | | - | | | 3,717 | | | - | | | - | |
| Accumulated deficit | | | (1,124,629 | ) | | (1,115,533 | ) | | (1,070,706 | ) | | (1,056,445 | ) | | (1,036,625 | ) |
| Total shareholders’ equity (2) | | | 42,735 | | | 51,097 | | | 50,841 | | | 25,149 | | | 31,368 | |
| | | | | | | | | | | | | | | | | |
(1) Research and development for our current business began in fiscal 2005 and accordingly is included in Continuing Operations in this presentation of selected financial data. Prior to fiscal 2005, all of our financial information is considered Discontinued Operations.
(2) No dividends have been declared or paid on our common stock.
Forward Looking Statements
The statements contained in the following discussion that are not purely historical are “forward-looking statements” within the meaning of Section 27A of the Securities Act of 1933 and Section 21E of the Securities Exchange Act of 1934, including without limitation statements about the expectations, beliefs, intentions or strategies regarding the future of our business. Words such as “expects,” “intends,” “plans,” “projects,” “believes,” “estimates,” and similar expressions are used to identify these forward-looking statements. These include, among others, statements regarding our future expectations, performance, plans and prospects as well as assumptions about future events. All forward-looking statements included in this annual report are based on information available to us on the date hereof, and we assume no obligation to update any such forward-looking statements. The forward-looking statements contained herein involve risks and uncertainties discussed in Item 1A. “Risk Factors” of this annual report. Our actual results could differ materially from those anticipated in these forward-looking statements as a result of such factors, including those set forth in this annual report.
The following discussion should be read in conjunction with our Consolidated Financial Statements and the Notes to those statements included elsewhere in the Annual Report on Form 10-K.
Overview
We provide vertical search services to trade publishers. Our technology and services help publishers to build a loyal online community and increase their internet advertising revenues. With the use of our vertical search services, our customers can create search engines customized to meet the specialized information needs of their audience by combining publisher proprietary content with an authoritative subset of the Web. On March 31, 2007, we agreed to sell the assets of our Enterprise Search business for $23.0 million in cash to FAST. This transaction closed on August 9, 2007 with FAST assuming certain obligations of the business and retaining certain employees serving its Enterprise Search customers. Accordingly, revenues and expenses and cash flows related to the Enterprise Search business have been reflected as discontinued operations in the accompanying Consolidated Statements of Operations and of Cash Flows. The assets and liabilities of the Enterprise Search business are reported as “assets held for sale” and “liabilities held for sale” on the accompanying Consolidated Balance Sheet. See further discussion in Note 2, “Discontinued Operations” in the Notes to Consolidated Financial Statements.
Our principal source of revenue is provided through sales of our vertical search services to the websites of publishers of trade business and specialist publications. Our vertical search technology is a hosted application sold as a service to the publishers. We generate our revenues by receiving a percentage of publishers’ advertising revenues earned by the search sites and by charging minimum fees for our vertical search and advertising services. Many of our contracts with publishers contain monthly minimum fees that we are entitled to receive until website advertising revenue generated by the publishers’ search sites exceeds these monthly minimum amounts. We can also generate revenues from hosting publisher web sites and from providing technical staff training. We offer professional services to customize publisher web sites and optimize search engines, as well as web site monetization consulting.
We use an AT&T facility to host our vertical search offering. This facility, located in Dallas, TX, is operated under a master hosting arrangement that expires in July 2009. We also maintained a hosting facility in San Diego, CA, which was vacated on January 31, 2008 in an effort to appropriately scale our hosting infrastructure. We believe that our hosting center environment has sufficient equipment capacity and redundancy to host vertical search websites for 200 trade publications each with an average community of 40,000 users at competitive search performance levels, which is enough capacity to meet our current needs.
Trends
As of January 31, 2008, a total of 39 Convera supported websites were in production and a total of 37 vertical search websites were in development awaiting launch. This represents a steady increase from November 2006 when the first site was launched into production. In fiscal year 2009, our strategy is to continue to target the top 50 B2B publishers in the United States and United Kingdom, which have an estimated 2,000 plus relevant magazine titles that could be converted to search-based websites. For both newly signed and current customers, our expectation is that the publishers will launch vertical search-based websites in a much shorter period of time than was typical in fiscal 2008 due to the release of version 2 of our Publisher Control Panel. The Publisher Control Panel shortens the time required to launch a site from six months to less than a month, which should translate into our receiving advertising based revenues sooner. The majority of the revenues earned for fiscal year 2008 represented contract minimum amounts for hosted services. We expect continued growth in hosted service fee revenues, as our new and renewal contracts with publishers will typically contain a minimum service fee for our vertical search services. We expect advertising share based revenue growth as new and existing websites build traffic and subsequently increase their advertising sales. We also have launched the Convera Ad Service (“CAS”) as an integral part of our vertical search services, which should result in additional advertising share revenues for us. CAS will enable publishers to better manage the monetization of their professional communities’ search experiences and increase the effectiveness of search-based revenues on their websites. CAS can also connect the publisher websites directly with the providers of advertising inventory, increasing the opportunities for the websites to grow their advertising revenues.
As a result of restructuring actions taken throughout fiscal 2008, we have reduced our quarterly expense run rate and expect the full impact of these actions to become apparent in the first quarter of fiscal year 2009. The combined reduction in expenses and increase in revenues should result in a decrease in the net loss from continuing operations in fiscal 2009.
Critical Accounting Policies
Our consolidated financial statements have been prepared in accordance with accounting principles generally accepted in the United States. For a comprehensive discussion of our significant accounting policies, see Note 1 in the accompanying consolidated financial statements included in this Form 10-K. We do not have any material ownership interest in any entities that are not wholly owned and consolidated subsidiaries. The preparation of these financial statements requires us to make estimates and assumptions that affect the reported amounts of assets and liabilities and disclosure of contingent assets and liabilities at the date of the financial statements and the reported amounts of revenues and expenses during the reporting period. We base those estimates on historical experience and other factors that are believed to be reasonable under the circumstances, the results of which form the basis for making judgments about the carrying value of assets, liabilities and equity that are not readily apparent from other sources. Actual results may differ from these estimates under different assumptions or conditions.
We believe the following accounting policies reflect the more significant judgments and estimates used in the preparation of this discussion of our financial condition and results of operations.
Revenue Recognition
Revenue from our vertical search service offering can consist of hosted services, professional services and advertising revenue shares. Our vertical search services revenues are recognized in accordance with SEC Staff Accounting Bulletin No. 104 (SAB 104) “Revenue Recognition”. We evaluate vertical search services arrangements that have multiple deliverables, in accordance with Emerging Issues Task Force (“EITF”) Abstract Issue No. 00-21 “Revenue Arrangements with Multiple Deliverables.” Judgment is required in interpreting a revenue contract to determine the appropriate accounting for the transaction. Multiple deliverable arrangements that contain elements that do not qualify as separate units of accounting are recognized ratably over the term of the hosting arrangement. Our vertical search service contracts typically include advertising share revenue agreements, and may include monthly contract minimum service fees. Monthly contract minimums and other hosting fees or set-up fees are recognized ratably over the term of the hosting agreement. Advertising share revenues are recognized when earned under the provisions of the hosting agreement. Revenue from training and professional services is recognized when the services are performed. In addition, in all cases, to recognize revenue we need to assess whether the price is fixed and determinable, whether persuasive evidence of an arrangement exists, whether the service has been delivered and whether collection of the receivable is reasonably assured.
Provision for Doubtful Accounts
A considerable amount of judgment is required in assessing the ultimate realization of individual accounts receivable balances and determining whether a provision for doubtful accounts is warranted. Our determination is based on an analysis of our historical collection experience and our portfolio of customers taking into consideration the general economic environment as well as the industry in which we operate. To the extent we do not recognize deterioration in our customers’ financial condition in the period it occurs, or to the extent we do not accurately estimate our customers’ ability to pay, the amount of bad debt expense recognized in a given reporting period will be impacted. Our vertical search services have yet to achieve significant revenues and consequently as of January 31, 2008 we do not maintain a provision for estimated losses resulting from the inability of our customers to make required payments. As revenues increase, we will periodically review whether a provision is required.
Impairment of Long-Lived Assets
We evaluate all of our long-lived assets for impairment in accordance with the provisions of SFAS No. 144, “Accounting for the Impairment or Disposal of Long-Lived Assets.” SFAS No. 144 requires that we review our long-lived assets for impairment whenever events or changes in circumstances indicate that the carrying value of an asset may not be recoverable based on expected undiscounted cash flows attributable to that asset. This review requires significant judgments both in assessing events and circumstances as well as estimating future cash flows. Should events indicate that any of our assets are impaired, the amount of such impairment will be measured as the difference between the carrying value and the fair value of the impaired asset and the impairment will be recorded in earnings during the period of such impairment. The determination of fair value is inherently an estimate and requires significant judgment. See Note 3, “Impairment of Long-Lived Assets” in the accompanying consolidated financial statements included in this Form 10-K for information about the impairment charges we have taken.
Research and Product Development Costs
We follow Statement of Financial Accounting Standards No. 86, “Accounting for the Cost of Computer Software to be Sold, Leased or Otherwise Marketed.” Our software development costs are included in research and product development and are expensed as incurred. Our judgment is required in determining the point at which our software development projects enter the stage at which costs should be capitalized, determining the estimated useful lives over which the capitalized costs should be amortized and assessing the recoverability of the capitalized software development costs. Previously, we capitalized software development costs related to our Excalibur web hosting product beginning in the first quarter of fiscal year 2006. We continued to do so until such time as “commercial availability” was determined. Amortization of the previously capitalized software development costs began in the third quarter of fiscal year 2006 and was to continue over a twenty-four month period. In the third quarter of fiscal 2007, we recorded an impairment charge for the unamortized balance of the capitalized research and development costs. For more information regarding the impairment determination, see Note 3, “Impairment of Long-Lived Assets” in the accompanying consolidated financial statements included in this Form 10-K.
Accounting for Income Taxes
We follow Statement of Financial Accounting Standards No. 109, "Accounting for Income Taxes" ("SFAS 109"). Under the asset and liability method of SFAS 109, deferred tax assets and liabilities are recognized for the future tax consequences attributable to differences between the financial statement carrying amounts of existing assets and liabilities and their respective tax bases. Deferred tax assets and liabilities are measured using enacted tax laws and tax rates in each jurisdiction where we operate, and applied to taxable income in the years in which those temporary differences are expected to be recovered or settled. The effect on deferred tax assets and liabilities due to a change in tax rates is recognized in income in the period that includes the enactment date. In addition, the amounts of any future tax benefits are reduced by a valuation allowance to the extent such benefits are not expected to be realized on a more-likely-than-not basis. We calculate estimated income taxes in each of the jurisdictions in which we operate. This process involves estimating actual current tax expense along with assessing temporary differences resulting from differing treatment of items for both book and tax purposes.
We record a valuation allowance to reduce our deferred tax assets to the amount that is more likely than not to be realized. Realization of the deferred tax assets is principally dependent upon the achievement of projected future taxable income. If the estimates and related assumptions change in the future we may be required to adjust our valuation allowance against our deferred tax assets, resulting in a benefit or a charge to income in the period such determination is made. As of January 31, 2008, we have recorded a full valuation allowance against the net deferred tax asset.
We adopted the provisions of the Financial Accounting Standards Board (“FASB”) Interpretation No. 48, "Accounting for Uncertainty in Income Taxes" (“FIN 48”), on February 1, 2007. FIN 48 clarifies the accounting for uncertainty in income taxes recognized in an enterprise’s financial statements in accordance with SFAS No. 109. FIN 48 also prescribes a recognition threshold and measurement standard for the financial statement recognition and measurement of an income tax position taken or expected to be taken in a tax return. FIN 48 also provides guidance on de-recognition, classification, interest and penalties, accounting in interim periods, disclosures and transitions. We previously recognized income tax positions based on management’s estimate of whether it was reasonably possible that a liability had been incurred for unrecognized tax benefits by applying SFAS No. 5, Accounting for Contingencies. The provisions of FIN 48 became effective for the Company on February 1, 2007.
Significant judgment is required in evaluation of our uncertain tax positions and determining the valuation allowance applied to deferred tax assets. We have concluded that there are no uncertain tax positions requiring recognition in our consolidated financial statements.
Stock-Based Compensation
On February 1, 2006, we adopted the provisions of and accounted for stock-based compensation in accordance with Statement of Financial Accounting Standards No. 123 (Revised 2004), Share-Based Payment (“SFAS 123(R)”), that addresses the accounting for stock-based compensation. SFAS 123(R) requires that stock based compensation be accounted for using a fair value based method. We use the Black-Scholes-Merton (“Black-Scholes”) option pricing model to determine the fair value of stock-based awards under SFAS 123(R). We are required to make significant judgments and estimates in the application of SFAS 123(R), in particular with regards to forfeiture rates, volatility and expected life assumptions. If any of the assumptions used in the Black-Scholes model change, stock based compensation expense could differ materially in the future from that recorded in the current period.
Results of Operations
For the fiscal year ended January 31. 2008, total revenues from continuing operations were $1.1 million, as compared to revenues of $0.3 million in fiscal year 2007. The loss from continuing operations for fiscal 2008 was $27.0 million, or $(0.51) per common share, compared to a loss from continuing operations of $45.3 million, or $(0.87) per common share, in fiscal 2007. Income from discontinued operations, including the gain from the sale of discontinued operations of $17.9 million, was $17.9 million, or $0.34 per share in fiscal 2008. Income from discontinued operations was $0.5 million, or $0.01 per common share in fiscal 2007. The net loss for fiscal 2008 was $9.1million or $(0.17) per common share as compared to a net loss of $44.8 million or $(0.86) per common share in fiscal 2007.
For the fiscal year ended January 31, 2006, total revenues from continuing operations were $20 thousand. The loss from continuing operations was $19.0 million, or $(0.44) per common share, in fiscal year 2006. Income from discontinued operations was $4.8 million or $0.11 per share in fiscal 2006. The net loss was $14.3 million, or $(0.33) per common share in fiscal 2006.
Throughout fiscal 2008, we undertook actions to restructure and realign the cost structure of our business to focus resources on our strategy to expand our presence in the online B2B publishing market. These restructurings reduced headcount by approximately 54 individuals, principally in research and product development, and closed facilities in Montreal, Canada and Lyon, France. These reductions were made in order to more appropriately align the number of our personnel to our business plan. In the fourth quarter of fiscal 2008, we terminated our hosting agreement with AT&T for our San Diego data center in order to appropriately scale our hosting capabilities. In addition, we recorded an impairment charge on the hosting assets that were formerly located in the San Diego facility and became idle with the termination of the hosting agreement. For the year ended January 31, 2008, we incurred total expenses of approximately $2.0 million related to these restructuring actions, including severance costs of $1.0 million, estimated facility related closing costs of $0.2 million, and AT&T contract termination costs of $0.8 million. The impairment charge recorded on the hosting assets was $0.6 million. During the second quarter of fiscal 2008, we entered into a sublease agreement for the Montreal, Canada facility and subsequently reduced the restructuring liability related to this facility by approximately $0.2 million. The total expenses reported above include this credit.
The following charts summarize the components of revenues and the categories of expenses, including the amounts expressed as a percentage of total revenues, for each of the three fiscal years in the period ended January 31, 2008 (dollars in thousands):
| | | Components of Revenue and Expenses | | | | Increase (Decrease) | |
| | | Fiscal years ended January 31, | | | | From 2007 | | | From 2006 |
| | | 2008 | | | 2007 | | | 2006 | | | to 2008 | | | to 2007 |
| | | $ | | % | | | $ | | % | | | $ | | % | | | % | | | % |
Continuing Operations: | | | | | | | | | | | | | | | | | | | | | | | | | | | | | | | | | | | | | |
Revenue | | $ | 1,118 | | | 100 | % | | | | $ | 269 | | | 100 | % | | | | $ | 20 | | | 100 | % | | | | | 316 | % | | | | | 1245 | % |
| | | | | | | | | | | | | | | | | | | | | | | | | | | | | | | | | | | | | | |
Expenses: | | | | | | | | | | | | | | | | | | | | | | | | | | | | | | | | | | | | | |
Cost of revenues | | | 9,660 | | | 864 | % | | | | | 8,138 | | | 3025 | % | | | | | 1,797 | | | 8985 | % | | | | | 19 | % | | | | | 353 | % |
Sales and marketing | | | 3,880 | | | 347 | % | | | | | 4,386 | | | 1630 | % | | | | | 2,804 | | | 14020 | % | | | | | -12 | % | | | | | 56 | % |
Research and product development | | | 4,652 | | | 416 | % | | | | | 11,010 | | | 4093 | % | | | | | 3,198 | | | 15990 | % | | | | | -58 | % | | | | | 244 | % |
General and administrative | | | 11,179 | | | 1000 | % | | | | | 14,833 | | | 5514 | % | | | | | 10,860 | | | 54300 | % | | | | | -25 | % | | | | | 37 | % |
Amortization of capitalized research & development costs | | | - | | | 0 | % | | | | | 3,045 | | | 1132 | % | | | | | 1,012 | | | 5060 | % | | | | | -100 | % | | | | | 201 | % |
Impairment of long-lived assets | | | 603 | | | 54 | % | | | | | 6,407 | | | 2382 | % | | | | | - | | | 0 | % | | | | | -91 | % | | | | | 0 | % |
Total operating expenses | | | 29,974 | | | 2681 | % | | | | | 47,819 | | | 17776 | % | | | | | 19,671 | | | 98355 | % | | | | | -37 | % | | | | | 144 | % |
Operating income / (loss) | | | (28,856 | ) | | | | | | | | (47,550 | ) | | | | | | | | (19,651 | ) | | | | | | | | | | | | | | | |
Other income, net | | | 1,815 | | | | | | | | | 2,267 | | | | | | | | | 602 | | | | | | | | | -20 | % | | | | | 277 | % |
Loss before taxes | | | (27,041 | ) | | | | | | | | (45,283 | ) | | | | | | | | (19,049 | ) | | | | | | | | -41 | % | | | | | 138 | % |
Income tax benefit | | | - | | | | | | | | | - | | | | | | | | | - | | | | | | | | | 0 | % | | | | | 0 | % |
Loss (income) from continuing Operations | | | (27,041 | ) | | | | | | | | (45,283 | ) | | | | | | | | (19,049 | ) | | | | | | | | -41 | % | | | | | 138 | % |
| | | | | | | | | | | | | | | | | | | | | | | | | | | | | | | | | | | | | | |
Discontinued Operations: | | | | | | | | | | | | | | | | | | | | | | | | | | | | | | | | | | | | | |
Income from discontinued operations | | | 20 | | | | | | | | | 456 | | | | | | | | | 4,788 | | | | | | | | | -96 | % | | | | | -90 | % |
Gain on sale on disposal of discontinued operations | | | 17,925 | | | | | | | | | - | | | | | | | | | - | | | | | | | | | 0 | % | | | | | 0 | % |
Income from discontinued operations | | | 17,945 | | | | | | | | | 456 | | | | | | | | | 4,788 | | | | | | | | | 3835 | % | | | | | -90 | % |
Net loss | | $ | (9,096 | ) | | | | | | | $ | (44,827 | ) | | | | | | | $ | (14,261 | ) | | | | | | | | -80 | % | | | | | 214 | % |
Continuing Operations:
Revenues
Hosted services revenue from our vertical search services offering for the fiscal year ended January 31, 2008 increased to $1.1 million from $0.3 million in fiscal 2007 due to an overall increase in the number of vertical search sites in production. As of January 31, 2008, there were a total of 39 Convera supported websites in production from 24 publishers compared to three Convera supported websites in production from a single B2B publisher at January 31, 2007. Hosted services revenue for fiscal 2006, all of which was generated in the fourth quarter of the fiscal year, was approximately $20 thousand. Our vertical search services were not commercially available prior to the third quarter of fiscal year 2006. The first Convera supported site was launched into production in the fourth quarter of fiscal 2007.
Revenue from international operations is generated from publishers located primarily in the United Kingdom. Our international sales operation, Convera Technologies International, Ltd. (“CTIL”), is headquartered in the United Kingdom. International revenues were $1.0 million in fiscal year 2008 compared to $0.1 million in fiscal 2007. In fiscal 2006, no international revenues were generated.
One customer, CMP Information Ltd., accounted for 82% of total revenue for the fiscal year ended January 31, 2008; three customers accounted for 53%, 29% and 17%, respectively of total revenue for fiscal year ended January 31, 2007; and a single customer accounted for 100% of the revenue for the fiscal year ended January 31, 2006.
Operating Expenses:
Cost of Revenues
Our hosted services cost of revenue increased 19% to $9.7 million for the year ended January 31, 2008 from $8.1 million in fiscal year 2007. This increase is attributed to higher personnel-related costs resulting from the formation of the publisher services implementation team. Hosted services cost of revenue increased 353% to $8.1 million for the year ended January 31, 2007 from $1.8 million in fiscal year 2006. This increase is attributed to a full year of costs in fiscal 2007 as compared to only three months of such costs in fiscal year 2006 that began upon the commercial availability of Excalibur in November 2005. Primary components of this increase were higher compensation costs due to staffing the operations team in early fiscal 2007 and increased depreciation, hosting costs and royalties paid on third-party software embedded in the product.
Sales & Marketing
Sales and marketing expense decreased 12% to $3.9 million for the year ended January 31, 2008 from $4.4 million in fiscal year 2007. The decrease in sales and marketing expense for fiscal year 2008 is attributed to lower marketing program costs. Sales and marketing expense increased 56% to $4.4 million for the year ended January 31, 2007 from $2.8 million in fiscal year 2006. The increase in sales and marketing expense for fiscal year 2007 is attributed to higher personnel-related costs resulting from a higher average headcount and stock option expenses from the adoption of FAS 123(R), increased marketing program costs and third-party consulting costs, and market development activities for the vertical search business.
Research and Development
Research and product development costs decreased 58% to $4.7 million for the year ended January 31, 2008 from $11.0 million in fiscal 2007. The decrease in research and development costs for fiscal year 2008 is attributed to a decline in personnel-related costs resulting from the restructuring actions taken throughout fiscal 2008. Additionally, consultant and depreciation costs were lower in fiscal year 2008. Research and product development costs increased 244% to $11.0 million for the year ended January 31, 2007 from $3.2 million in fiscal 2006. This was due to the capitalization in fiscal 2006 of $8.1 million of research and development costs. Absent the capitalization of these development costs, gross research and development costs of $11.0 in fiscal year 2007 million were fairly consistent with research and product development costs of $10.8 million in fiscal year 2006.
General and Administrative
General and administrative expense decreased by 25% to $11.2 million for the year ended January 31, 2008 from $14.8 million in fiscal year 2007. The decrease in fiscal year 2008 is due to lower personnel-related costs stemming from the restructuring actions taken in fiscal 2008, as well as reduced executive staffing levels in 2008. Accounting services and corporate insurance costs were also lower in fiscal 2008 compared to fiscal 2007. General and administrative expense grew by 37% to $14.8 million for the year ended January 31, 2007 from $10.9 million in fiscal year 2006. The increase in fiscal year 2007 is due to higher stock option expense due to the adoption of FAS 123(R), higher personnel-related expense as a result of increased average headcount, and increased legal fees.
Amortization of capitalized software development costs
As a result of the impairment charge in the third quarter of fiscal year 2007 that reduced the recorded value of capitalized software development costs to zero, there was no amortization of capitalized software development costs recorded for the year ended January 31, 2008. During fiscal year 2007, $3.0 million of amortization of capitalized software development costs was recorded in accordance with SFAS No. 86 as compared to $1.0 million of amortization of capitalized software development costs in fiscal 2006. We commenced amortizing the capitalized software development costs upon achieving commercial availability in November 2005.
Impairment of capitalized software development costs, fixed assets and prepaid expenses:
For the fiscal year ended January 31, 2008, we recorded a $0.6 million impairment charge in accordance with SFAS No. 144 for assets that were rendered idle as a consequence of vacating the AT&T hosting facility in San Diego. In fiscal year 2007, an analysis of the recoverability of the Excalibur capitalized software development costs, as well as fixed assets and prepaids related to the Excalibur web product solution, concluded that such assets were impaired. As a result, an aggregate impairment charge of $6.4 million was recorded in fiscal 2007, comprised of a $4.1 million impairment charge for capitalized software development costs in accordance with SFAS No. 86 and a $2.3 million impairment charge for the fixed assets and prepaids, in accordance with SFAS No. 144.
Other income
Other income, which consists primarily of interest income, decreased 20% to $1.8 million in fiscal year 2008, from $2.3 million in fiscal year 2007. This decrease was due to a lower average cash balance and declining interest rates. Other income increased to $2.3 million in fiscal year 2007 from $0.6 million in fiscal year 2006 due to a higher average quarterly cash balance and higher interest yields.
Discontinued operations:
Income from discontinued operations for the fiscal year ended January 31, 2008 was $17.9 million, as compared to income from discontinued operations of $0.5 million in fiscal year 2007. The increase in income includes the gain from the completion of the sale of the Enterprise Search business of $17.9 million. Income from discontinued operations for the fiscal year ended January 31, 2006 was $4.7 million. The $4.2 million decrease in income from discontinued operations from fiscal 2006 to fiscal 2007 was primarily due to a decline in Enterprise Search revenues.
Contractual Obligations
We are obligated under certain contractual arrangements to make future payments for goods and services. These contractual obligations secure the future rights to various assets and services to be used in the normal course of operations. For example, we are contractually committed to make certain minimum lease payments for the use of property under operating lease agreements. In accordance with applicable accounting rules, the future rights and obligations pertaining to firm commitments such as operating lease obligations and certain purchase obligations under contracts are not reflected as assets or liabilities on the accompanying consolidated balance sheets.
As of January 31, 2008, we had the following contractual obligations associated with our lease commitments, and other contractual obligations for the periods indicated below:
Contractual Obligations | | Payments Due By Fiscal Period (in thousands) | |
| | | Total | | 2009 | | 2010 | | 2011-2012 | | 2013 and thereafter | |
| Operating leases | | $ | 2,957 | | $ | 1,693 | | $ | 1,153 | | $ | 111 | | | - | |
| Other contractual obligations | | | 1,600 | | | 1,316 | | | 284 | | | - | | | - | |
| Total | | $ | 4,557 | | $ | 3,009 | | $ | 1,437 | | $ | 111 | | | - | |
| · | Operating lease obligations — represents the minimum lease rental payments under non-cancelable leases, primarily for our office space and operating equipment in various locations around the world. |
| · | Other contractual obligations — represents the principal amounts due on outstanding contractual obligations relating to our hosting agreements with AT&T for our vertical search product. In January 2008, we exercised our right to terminate the contract for the San Diego hosting facility (see further discussion in Note 3 of the consolidated financial statements). The Other contractual obligations balance includes the termination obligation due for the San Diego hosting facility of approximately $0.8 million, as well as 100% of the contractual obligation for the Dallas hosting facility, although that agreement is cancelable for a payment of 50% of the remaining balance at the time of cancellation. |
Liquidity and Capital Resources
Our combined balance of cash, cash equivalents and restricted cash at January 31, 2008 as compared to January 31, 2007 is summarized below (in thousands).
| | | January 31, 2008 | | January 31, 2007 | | Change | |
| Cash and cash equivalents | | $ | 36,641 | | $ | 47,433 | | $ | (10,792 | ) |
| Restricted cash | | | - | | | 71 | | | (71 | ) |
| Total | | $ | 36,641 | | $ | 47,504 | | $ | (10,863 | ) |
At January 31, 2008, our principal source of liquidity was cash and cash equivalents of $36.6 million.
Operating activities of continuing operations consumed $24.7 million in cash in fiscal 2008. The primary use of cash from operating activities was the net loss from continuing operations of $27.0 million. The net loss was reduced for non-cash expenses represented by depreciation and amortization expense of $2.6 million, stock-based compensation of $0.4 million and an impairment charge of $0.6 million. The $4.1 million decrease in depreciation and amortization expense between fiscal 2008 and 2007 is the result of the impairment charge on the Excalibur Web offering assets recorded in the third quarter of fiscal 2007 totaling $6.4 million. The $5.5 million decrease in stock-based compensation expense between fiscal 2008 and 2007 is principally due to the reduction of headcount from our action to restructure and realign our cost structure in the first quarter of fiscal 2008. The $0.6 million impairment charge recognized in fiscal 2008 is related to hosting equipment that was rendered idle as a consequence of our decision to terminate our hosting arrangement for the San Diego facility. We recorded a $6.4 million impairment charge on the capitalized software development costs and hosting assets in the third quarter of fiscal 2007. A decrease in accounts payable and accrued expenses used $1.2 million in cash in fiscal 2008. The reduction in accounts payable and accrued expense is a consequence of the reduction of headcount stemming from the restructuring and realignment actions taken in the first quarter of fiscal 2008. Net cash of $1.7 million was provided by discontinued operations in fiscal 2008.
Our investing activities from continuing operations provided $12.1 million in cash in fiscal 2008. The sale of the Enterprise Search business provided $16.4 million, net of expense directly related to the transaction. This was offset by $4.4 million used in purchases of equipment and leasehold improvements. Investing activities of discontinued operations used $4,000.
Cash flow from financing activities was all provided by continuing operations. The issuance of common stock relating to the exercise of employee stock options provided approximately $0.8 million in cash in fiscal 2008. Cash used for the repurchase of common shares was approximately $0.2 million in fiscal 2008.
In fiscal 2007, $16.4 million, or 98.4% of our revenues totaling $16.7 million was derived from the Enterprise Search business. The closing of the sale of the Enterprise Search business will reduce our revenue base in the short term and continue our trend of operating losses and uses of cash until the revenue base for the vertical search business grows sufficiently to support the underlying expense base. We believe that we have sufficient resources to fund operations for at least the next twelve months.
Other Factors
Inflation
We believe that inflation has not had a material effect on the results of our operations to date.
Recent Pronouncements
In September 2006, the FASB issued Statement of Financial Accounting Standards No. 157 (“SFAS 157”), Fair Value Measurements. SFAS 157 provides guidance for measuring the fair value of assets and liabilities. It requires additional disclosures related to the extent to which companies measure assets and liabilities at fair value, the information used to measure fair value, and the effect of fair value measurements on earnings. It does not require any new fair value measurements. SFAS 157 is effective for fiscal years beginning after November 15, 2007. We will adopt SFAS 157 for our fiscal year 2009 beginning February 1, 2008. We do not expect the adoption to have a material impact on our consolidated results of operations and financial condition.
In February 2007, the FASB issued SFAS No. 159, “The Fair Value Option for Financial Assets and Financial Liabilities - including an Amendment of SFAS No. 115” (“SFAS 159”), which permits an entity to measure many financial assets and financial liabilities at fair value that are not currently required to be measured at fair value. Entities that elect the fair value option will report unrealized gains and losses in earnings at each subsequent reporting date. The fair value option may be elected on an instrument-by-instrument basis, with few exceptions. SFAS 159 amends previous guidance to extend the use of the fair value option to available-for-sale and held-to-maturity securities. SFAS 159 also establishes presentation and disclosure requirements to help financial statement users understand the effect of the election. SFAS 159 is effective as of the beginning of the first fiscal year beginning after November 15, 2007. We will adopt SFAS 159 for our fiscal year 2009 beginning February 1, 2008. We do not expect the adoption to have a material impact on our consolidated results of operations and financial condition.
In December 2007, the FASB issued a revision to SFAS No. 141, “Business Combinations” (“SFAS 141R”). The objective of this Statement is to improve the relevance, representational faithfulness, and comparability of the information that a reporting entity provides in its financial reports about a business combination and its effects. This Statement will apply prospectively to any business combinations we may enter into for which the acquisition date is on or after the beginning of our first annual reporting period beginning after December 15, 2008.
Our market risk is principally confined to changes in foreign currency exchange rates and potentially adverse effects of differing tax structures. International revenues from CTIL, our foreign sales subsidiary located in the United Kingdom, were approximately 88% of total revenues in fiscal year 2008. International sales are made predominantly from our foreign subsidiary and are typically denominated in British pounds, EUROs or U.S. Dollars. As of January 31, 2008, approximately 97% of total consolidated accounts receivable was denominated in British pounds. The majority of these receivables are due within 90 days of the end of fiscal year 2008, and all receivables are due within one year. Additionally, we are exposed to potential foreign currency gains or losses resulting from intercompany accounts that are not of a long-term nature. We are also exposed to foreign exchange rate fluctuations as the financial results of CTIL are translated into U.S. dollars in consolidation. As exchange rates vary, those results when translated may vary from expectations and adversely impact overall expected profitability.
As of January 31, 2008, less than one percent of our cash and cash equivalents were denominated in British pounds, EUROs and Canadian dollars, respectively. Cash equivalents consist of funds deposited in money market accounts with original maturities of three months or less. We also have certificates of deposit of $76,000 and $450,000 included in Other assets which are pledged to collateralize letters of credit required for leased facilities. Given the relatively short maturity periods of these cash equivalents, the cost of these investments approximates their fair values and our exposure to fluctuations in interest rates is limited.
Financial statements and supplementary data are submitted as a separate section of this Form 10-K.
None.
| (a) | Management's Report on Internal Control Over Financial Reporting |
Our management is responsible for establishing and maintaining adequate internal control over financial reporting, as defined in Rule 13a-15(f) under the Exchange Act, as amended, and for assessing the effectiveness of internal control over financial reporting. Our management, with the participation of our Chief Executive Officer, who is our principal executive officer and our Chief Financial Officer, who is our principal accounting officer, conducted an evaluation of the effectiveness of our internal control over financial reporting as of January 31, 2008. In making this assessment, our management used the criteria established in Internal Control -- Integrated Framework, issued by the Committee of Sponsoring Organizations of the Treadway Commission ("COSO"). Management has concluded that we maintained effective internal control over financial reporting as of January 31, 2008, based on the criteria established in COSO's Internal Control - Integrated Framework.
Ernst & Young LLP, the independent registered public accounting firm that audited the Consolidated Financial Statements in Part II, Item 8 of this report, has issued an audit report on our internal control over financial reporting as of January 31, 2008.
| (b) | Changes in Internal Control Over Financial Reporting |
Other than the improvements in internal control over financial reporting implemented to remediate the material weaknesses in our internal control over financial reporting identified as of January 31, 2007, there was no change in our internal control over financial reporting (as such term is defined in Rules 13a-15(f) and 15d-15(f) under the Exchange Act) during the quarter ended January 31, 2008 that has materially affected, or is reasonably likely to materially affect, our internal control over financial reporting.
Subsequent to January 31, 2007, we took several steps to remediate the material weaknesses identified as of January 31, 2007, which arose from the combined effect of the following control deficiencies in the calculation of impairment of our web hosting assets and the balances for prepaid expenses, accruals and general and administrative expenses and properly interpreting and recording revenues before all appropriate revenue recognition criteria had been met:
| · | lack of sufficiently trained accounting and finance personnel with knowledge of our accounting close and financial reporting processes and adequate technical expertise in the application of U.S. generally accepted accounting principles; |
| · | inadequate management review of transactions and related account analyses and reconciliations; and |
| · | insufficient control monitoring processes to ensure key controls identify accounting errors on a timely basis. |
We implemented internal control improvements in the following areas:
| · | engaged an outside consultant to perform a thorough review of our accounting close and financial reporting process, including revenue recognition, and enhanced our close procedures to ensure completeness and a thorough review of supporting documentation and underlying accounting and reporting guidance, by appropriately trained and qualified personnel, is performed; |
| · | hired an additional staff person with the appropriate level of internal control training and experience to further improve and monitor the quality of existing processes and controls; |
| · | added a supplemental review procedure for the CFO to review all significant contracts during each period, prior to approving the entries to recognize revenue; and |
| · | Provided training to the sales and contracts staff to increase awareness and allow for earlier identification of contract structures and issues that could impact revenue recognition. |
(c) Evaluation of Disclosure Controls and Procedures
Our management, with the participation of our Chief Executive Officer and Chief Financial Officer, evaluated the effectiveness of the design and operation of our disclosure controls and procedures (as defined in Rules 13a-15(e) and 15d-15(e) under the Exchange Act) and determined that our disclosure controls and procedures were effective as of January 31, 2008. The evaluation considered the procedures designed to ensure that information required to be disclosed by us in reports filed or submitted under the Exchange Act is recorded, processed, summarized and reported within the time periods specified in the SEC’s rules and forms and communicated to our management as appropriate to allow timely decisions regarding required disclosure.
(d) Inherent Limitations of Disclosure Controls and Internal Control Over Financial Reporting
Because of its inherent limitations, internal control over financial reporting may not prevent or detect misstatements. Projections of any evaluation of effectiveness to future periods are subject to risks that controls may become inadequate because of changes in conditions, or that the degree of compliance with the policies or procedures may deteriorate.
Report of Independent Registered Public Accounting Firm
The Board of Directors and Shareholders of Convera Corporation
We have audited Convera Corporation’s (the Company) internal control over financial reporting as of January 31, 2008, based on criteria established in Internal Control—Integrated Framework issued by the Committee of Sponsoring Organizations of the Treadway Commission (the COSO criteria). Convera Corporation’s management is responsible for maintaining effective internal control over financial reporting, and for its assessment of the effectiveness of internal control over financial reporting included in the accompanying Management’s Report on Internal Control over Financial Reporting. Our responsibility is to express an opinion on the Company’s internal control over financial reporting based on our audit.
We conducted our audit in accordance with the standards of the Public Company Accounting Oversight Board (United States). Those standards require that we plan and perform the audit to obtain reasonable assurance about whether effective internal control over financial reporting was maintained in all material respects. Our audit included obtaining an understanding of internal control over financial reporting, assessing the risk that a material weakness exists, testing and evaluating the design and operating effectiveness of internal control based on the assessed risk, and performing such other procedures as we considered necessary in the circumstances. We believe that our audit provides a reasonable basis for our opinion.
A company’s internal control over financial reporting is a process designed to provide reasonable assurance regarding the reliability of financial reporting and the preparation of financial statements for external purposes in accordance with generally accepted accounting principles. A company’s internal control over financial reporting includes those policies and procedures that (1) pertain to the maintenance of records that, in reasonable detail, accurately and fairly reflect the transactions and dispositions of the assets of the company; (2) provide reasonable assurance that transactions are recorded as necessary to permit preparation of financial statements in accordance with generally accepted accounting principles, and that receipts and expenditures of the company are being made only in accordance with authorizations of management and directors of the company; and (3) provide reasonable assurance regarding prevention or timely detection of unauthorized acquisition, use, or disposition of the company’s assets that could have a material effect on the financial statements.
Because of its inherent limitations, internal control over financial reporting may not prevent or detect misstatements. Also, projections of any evaluation of effectiveness to future periods are subject to the risk that controls may become inadequate because of changes in conditions, or that the degree of compliance with the policies or procedures may deteriorate.
In our opinion, Convera Corporation maintained, in all material respects, effective internal control over financial reporting as of January 31, 2008, based on the COSO criteria.
We also have audited, in accordance with the standards of the Public Company Accounting Oversight Board (United States), the consolidated balance sheets as of January 31, 2008 and 2007, and the related consolidated statements of operations and comprehensive loss, changes in shareholders’ equity, and cash flows for each of the three years in the period ended January 31, 2008 of Convera Corporation and our report dated March 27, 2008 expressed an unqualified opinion thereon.
/s/ Ernst & Young LLP
McLean, Virginia
March 27, 2008
Not applicable.
PART III
The information required for this Item will be included in our definitive Proxy Statement for the 2008 Annual Meeting of Shareholders to be filed with the Securities and Exchange Commission no later than 120 days after January 31, 2008, which information is incorporated in this report by reference.
The information required for this Item will be included in our definitive Proxy Statement for the 2008 Annual Meeting of Shareholders to be filed with the Securities and Exchange Commission no later than 120 days after January 31, 2008, which information is incorporated in this report by reference.
The information required for this Item will be included in our definitive Proxy Statement for the 2008 Annual Meeting of Shareholders to be filed with the Securities and Exchange Commission no later than 120 days after January 31, 2008, which information is incorporated in this report by reference.
The information required for this Item will be included in our definitive Proxy Statement for the 2008 Annual Meeting of Shareholders to be filed with the Securities and Exchange Commission no later than 120 days after January 31, 2008, which information is incorporated in this report by reference.
The information required for this Item will be included in our definitive Proxy Statement for the 2008 Annual Meeting of Shareholders to be filed with the Securities and Exchange Commission no later than 120 days after January 31, 2008, which information is incorporated in this report by reference.
PART IV
(a) Documents filed as part of Form 10-K
1. Financial Statements:
| | The following financial statements of Convera Corporation are submitted in a separate section pursuant to the requirements of Form 10-K, Part I, Item 8 and Part IV, Items [14(a)] and [14(d)]: |
Index to Consolidated Financial Statements
Report of Independent Registered Public Accounting Firm
Consolidated Balance Sheets
Consolidated Statements of Operations and Comprehensive Loss
Consolidated Statements of Shareholders' Equity
Consolidated Statements of Cash Flows
Notes to Consolidated Financial Statements
2. Schedules Supporting Financial Statements:
All schedules are omitted because they are not required, are inapplicable, or the information is otherwise shown in the consolidated financial statements or notes to the consolidated financial statements.
3. Exhibits:
See Exhibit Index on the following page.
Exhibit No. | Exhibit Title | | Incorporated by Reference from the Following Documents |
| 3.1 | Amended and Restated Certificate of Incorporation of Convera | | Form S-4 (Registration No. 333-50172), November 17, 2000 |
| 3.2 | | | Form 10-K, April 30, 2003 |
| 3.3 | | | Form 10-K, March 31, 2006 |
| 10.1 | 1995 Incentive Plan, dated November 1995 | | Proxy Statement dated October 16, 1995 for Annual Meeting of shareholders |
| 10.2 | Convera Stock Option Plan | | Form 8-K, May 3, 2000 |
| 10.3 | | | Form 10-K, April 30, 2002 |
| 10.4 | | | Definitive Form 14C, December 18, 2001 |
| 10.5 | | | Form 10-K, April 1, 2005 |
| 10.6 | | | Form 10-K, March 31, 2006 |
| 10.7 | | | Form 10-K, March 31, 2006 |
| 10.8 | | | Form 10-K, March 31, 2006 |
| 10.9 | | | Form 10-Q, September 11, 2006 |
| 10.10 | | | Form 10-K, May 1, 2007 |
| 10.11 | | | Form 10-K, May 1, 2007 |
| 10.12 | | | Form 10-K, May 1, 2007 |
| 10.13 | | | Form 8-K, August 15, 2007 |
| 10.14 | | | Filed Herewith |
| 10.15 | | | Filed Herewith |
| 21.1 | | | Form 10-K, April 30, 2004 |
| 23.1 | | | Filed Herewith |
| 31.1 | | | Filed Herewith |
| 31.2 | | | Filed Herewith |
| 32.1 | | | Filed Herewith |
| 32.2 | | | Filed Herewith |
SIGNATURES
Pursuant to the requirements of Section 13 or 15(d) of the Securities Exchange Act of 1934, the registrant has duly caused this Report to be signed on its behalf by the undersigned, thereunto duly authorized.
CONVERA CORPORATION
By: /s/ Patrick C. Condo
Patrick C. Condo
President and Chief Executive Officer
Pursuant to the requirements of the Securities Exchange Act of 1934, this report has been signed below by the following persons on behalf of the registrant and in the capacities and on the dates indicated.
| Signature | Title | Date |
| | | |
| /s/Patrick C. Condo | President, Chief Executive Officer | March 31, 2008 |
| Patrick C. Condo | and Director (Principal Executive Officer) | |
| | | |
| /s/ Matthew G. Jones | Vice President, Chief Financial Officer | March 31, 2008 |
| Matthew G. Jones | (Principal Financial and Accounting Officer) | |
| | | |
| /s/ Ronald J. Whittier | Director | March 31, 2008 |
| Ronald J. Whittier | | |
| | | |
| /s/ Herbert A. Allen | Director | March 31, 2008 |
| Herbert A. Allen | | |
| | | |
| /s/ Herbert A. Allen, III | Director | March 31, 2008 |
| Herbert A. Allen, III | | |
| | | |
| /s/ John C. Botts | Director | March 31, 2008 |
| John C. Botts | | |
| | | |
| /s/ Eli S. Jacobs | Director | March 31, 2008 |
| Eli S. Jacobs | | |
| | | |
| /s/ Donald R. Keough | Director | March 31, 2008 |
| Donald R. Keough | | |
| | | |
| /s/ Ajay Menon | Director | March 31, 2008 |
| Ajay Menon | | |
| | | |
| /s/ Sydney Pollack | Director | March 31, 2008 |
| Sydney Pollack | | |
| | | |
| /s/ Carl J. Rickertson | Director | March 31, 2008 |
| Carl J. Rickertson | | |
| | | |
| /s/ Jeffrey White | Director | March 31, 2008 |
| Jeffrey White | | |
| | | |
| /s/ Alexander F. Parker | Director | March 31, 2008 |
| Alexander F. Parker | | |
Index to Consolidated Financial Statements | Page |
| F-1 |
| F-2 |
| F-3 |
| F-4 |
| F-5 |
| F-6 |
To the Board of Directors and Shareholders of
Convera Corporation
We have audited the accompanying consolidated balance sheets of Convera Corporation (the Company) as of January 31, 2008 and 2007, and the related consolidated statements of operations and comprehensive loss, changes in shareholders’ equity, and cash flows for each of the three years in the period ended January 31, 2008. These financial statements are the responsibility of the Company’s management. Our responsibility is to express an opinion on these financial statements based on our audits.
We conducted our audits in accordance with the standards of the Public Company Accounting Oversight Board (United States). Those standards require that we plan and perform the audit to obtain reasonable assurance about whether the financial statements are free of material misstatement. An audit includes examining, on a test basis, evidence supporting the amounts and disclosures in the financial statements. An audit also includes assessing the accounting principles used and significant estimates made by management, as well as evaluating the overall financial statement presentation. We believe that our audits provide a reasonable basis for our opinion.
In our opinion, the financial statements referred to above present fairly, in all material respects, the consolidated financial position of Convera Corporation at January 31, 2008 and 2007, and the consolidated results of its operations and its cash flows for each of the three years in the period ended January 31, 2008, in conformity with U.S. generally accepted accounting principles.
As discussed in Note 2 to the consolidated financial statements, on February 1, 2006 the Company adopted the provisions of Statement of Financial Accounting Standards No. 123(R) Share Based Payment and changed its method of accounting for share based payments using the modified prospective transition method.
We also have audited, in accordance with the standards of the Public Company Accounting Oversight Board (United States), the Company's internal control over financial reporting as of January 31, 2008, based on criteria established in Internal Control-Integrated Framework issued by the Committee of Sponsoring Organizations of the Treadway Commission and our report dated March 27, 2008 expressed an unqualified opinion thereon.
/s/ Ernst & Young LLP
McLean, Virginia
March 27, 2008
CONSOLIDATED BALANCE SHEETS
(in thousands, except per share data)
| ASSETS | | | | | |
| | | January 31, 2008 | | January 31, 2007 | |
| Current Assets: | | | | | | | |
| Cash and cash equivalents | | $ | 36,641 | | $ | 47,433 | |
| Restricted cash | | | - | | | 71 | |
| Accounts receivable, net of allowance for doubtful accounts of $0 and $0, respectively | | | 182 | | | 170 | |
| Escrow, prepaid expenses and other | | | 4,002 | | | 1,022 | |
| Assets held for sale | | | - | | | 6,281 | |
| Total current assets | | | 40,825 | | | 54,977 | |
| | | | | | | | |
| Equipment and leasehold improvements, net of accumulated depreciation of $11,535 and $9,705, respectively | | | 4,913 | | | 3,714 | |
| Other assets | | | 629 | | | 590 | |
| Total assets | | $ | 46,367 | | $ | 59,281 | |
| | | | | | | | |
| LIABILITIES AND SHAREHOLDERS’ EQUITY | | | | | | | |
| | | | | | | | |
| Current Liabilities: | | | | | | | |
| Accounts payable | | $ | 699 | | $ | 1,796 | |
| Accrued expenses | | | 2,282 | | | 2,232 | |
| Deferred revenues | | | 651 | | | 725 | |
| Liabilities held for sale | | | - | | | 3,431 | |
| Total liabilities | | | 3,632 | | | 8,184 | |
| | | | | | | | |
| Commitments and Contingencies | | | - | | | - | |
| | | | | | | | |
| Shareholders' Equity: | | | | | | | |
Common stock Class A, $0.01 par value, 100,000,000 shares authorized; 53,947,749 and 53,469,299 shares issued, respectively; 53,291,194 and 52,812,744 shares outstanding, respectively | | | 538 | | | 534 | |
| Treasury stock at cost, 656,555 and 656,555 shares, respectively | | | (1,517 | ) | | (1,517 | ) |
| Additional paid-in-capital | | | 1,170,128 | | | 1,168,908 | |
| Accumulated deficit | | | (1,124,629 | ) | | (1,115,533 | ) |
| Accumulated other comprehensive loss | | | (1,785 | ) | | (1,295 | ) |
| Total shareholders' equity | | | 42,735 | | | 51,097 | |
| Total liabilities and shareholders' equity | | $ | 46,367 | | $ | 59,281 | |
| | | | | | | | |
See accompanying notes.
CONSOLIDATED STATEMENTS OF OPERATIONS AND COMPREHENSIVE LOSS
(in thousands, except share and per share data)
| | | For the Fiscal Years Ended January 31, | |
| | | 2008 | | 2007 | | 2006 | |
| Revenues: | | | | | | | | | | |
| Hosted services | | $ | 1,118 | | $ | 269 | | $ | 20 | |
| | | | | | | | | | | |
| Expenses: | | | | | | | | | | |
| Cost of revenues | | | 9,660 | | | 8,138 | | | 1,797 | |
| Sales and marketing | | | 3,880 | | | 4,386 | | | 2,804 | |
Research and product development | | | 4,652 | | | 11,010 | | | 3,198 | |
General and administrative | | | 11,179 | | | 14,833 | | | 10,860 | |
Amortization of capitalized research and product development costs | | | - | | | 3,045 | | | 1,012 | |
Impairment of capitalized research and development costs, equipment and other prepaid expenses | | | 603 | | | 6,407 | | | - | |
Total operating expenses | | | 29,974 | | | 47,819 | | | 19,671 | |
| | | | | | | | | | | |
Operating loss | | | (28,856 | ) | | (47,550 | ) | | (19,651 | ) |
| | | | | | | | | | | |
| Other income, net | | | 1,815 | | | 2,267 | | | 602 | |
Loss from continuing operations | | | (27,041 | ) | | (45,283 | ) | | (19,049 | ) |
Income (loss) from discontinued operations, net of tax benefit of $241, 0 and 0, respectively | | | 20 | | | 456 | | | 4,788 | |
Gain from sale of discontinued RetrievalWare operations | | | 17,925 | | | - | | | - | |
| Income from discontinued operations | | | 17,945 | | | 456 | | | 4,788 | |
| Net loss | | $ | (9,096 | ) | $ | (44,827 | ) | $ | (14,261 | ) |
| Basic and diluted net income (loss) per common share: | | | | | | | | | | |
Continuing operations | | $ | (0.51 | ) | $ | (0.87 | ) | $ | (0.44 | ) |
Discontinued operations | | | 0.34 | | | 0.01 | | | 0.11 | |
| Basic and diluted net loss per common share | | $ | (0.17 | ) | $ | (0.86 | ) | $ | (0.33 | ) |
| | | | | | | | | | | |
| Weighted-average number of common shares outstanding - Basic and diluted | | | 53,145,955 | | | 52,221,644 | | | 43,088,677 | |
| Comprehensive loss: | | | | | | | | | | |
| Net loss | | $ | (9,096 | ) | $ | (44,827 | ) | $ | (14,261 | ) |
| Foreign currency translation adjustment | | | (490 | ) | | 145 | | | (56 | ) |
| Comprehensive loss | | $ | (9,586 | ) | $ | (44,682 | ) | $ | (14,317 | ) |
See accompanying notes
CONSOLIDATED STATEMENTS OF SHAREHOLDERS’ EQUITY
(in thousands, except share data)
| | | Common Stock | | Treasury Stock | | | | Accumulated | | Accumulated Other Compre-hensive | | | |
| | | Shares | | Amount | | Shares | | Amount | | | | Deficit | | | | Total | |
| Balance, January 31, 2005 | | | 38,740,215 | | $ | 387 | | | (726,408 | ) | $ | (1,678 | ) | $ | 1,084,269 | | $ | (1,056,445 | ) | $ | (1,384 | ) | $ | 25,149 | |
| Private placement | | | 6,555,556 | | | 65 | | | - | | | - | | | 28,700 | | | - | | | - | | | 28,765 | |
| Issuance of common stock upon exercise of options | | | 2,406,090 | | | 24 | | | - | | | - | | | 9,646 | | | - | | | - | | | 9,670 | |
| Issuance of treasury stock for Employee Stock Purchase Plan | | | - | | | - | | | 52,055 | | | 120 | | | 95 | | | - | | | - | | | 215 | |
| Stock-based compensation | | | 101,325 | | | 1 | | | - | | | - | | | 1,358 | | | - | | | - | | | 1,359 | |
| Foreign currency translation adjustment | | | - | | | - | | | - | | | - | | | - | | | - | | | (56 | ) | | (56 | ) |
| Net loss | | | - | | | - | | | - | | | - | | | - | | | (14,261 | ) | | - | | | (14,261 | ) |
| Balance, January 31, 2006 | | | 47,803,186 | | | 477 | | | (674,353 | ) | | (1,558 | ) | | 1,124,068 | | | (1,070,706 | ) | | (1,440 | ) | | 50,841 | |
| | | | | | | | | | | | | | | | | | | | | | | | | | |
| Private placement | | | 5,103,333 | | | 51 | | | - | | | - | | | 36,693 | | | - | | | - | | | 36,744 | |
| Issuance of common stock upon exercise of options | | | 461,455 | | | 5 | | | - | | | - | | | 1,645 | | | - | | | - | | | 1,650 | |
| Issuance of treasury stock for Employee Stock Purchase Plan | | | - | | | - | | | 17,798 | | | 41 | | | 71 | | | - | | | - | | | 112 | |
| Stock-based compensation | | | 101,325 | | | 1 | | | - | | | - | | | 6,431 | | | - | | | - | | | 6,432 | |
| Foreign currency translation adjustment | | | - | | | - | | | - | | | - | | | - | | | - | | | 145 | | | 145 | |
| Net loss | | | - | | | - | | | - | | | - | | | - | | | (44,827 | ) | | - | | | (44,827 | ) |
| Balance, January 31, 2007 | | | 53,469,299 | | | 534 | | | (656,555 | ) | | (1,517 | ) | | 1,168,908 | | | (1,115,533 | ) | | (1,295 | ) | | 51,097 | |
| | | | | | | | | | | | | | | | | | | | | | | | | | |
| Issuance of common stock upon exercise of options | | | 337,125 | | | 3 | | | - | | | - | | | 817 | | | - | | | - | | | 820 | |
| Stock-based compensation | | | 141,325 | | | 1 | | | - | | | - | | | 403 | | | - | | | - | | | 404 | |
| Foreign currency translation adjustment | | | - | | | - | | | - | | | - | | | - | | | - | | | (490 | ) | | (490 | ) |
| Net loss | | | - | | | - | | | - | | | - | | | - | | | (9,096 | ) | | - | | | (9,096 | ) |
| Balance, January 31, 2008 | | | 53,947,749 | | $ | 538 | | | (656,555 | ) | $ | (1,517 | ) | $ | 1,170,128 | | $ | (1,124,629 | ) | $ | (1,785 | ) | $ | 42,735 | |
| | | | | | | | | | | | | | | | | | | | | | | | | | |
See accompanying notes
CONSOLIDATED STATEMENTS OF CASH FLOWS
(in thousands)
| | | For the year ended January 31, | |
| | | 2008 | | 2007 | | 2006 | |
Cash Flows from Operating Activities: | | | | | | | | | | |
Loss from continuing operations | | $ | (27,041 | ) | $ | (45,283 | ) | $ | (19,049 | ) |
Adjustments to reconcile loss from continuing operations to net cash used in operating activities from continuing operations: | | | | | | | | | | |
| Depreciation and amortization | | | 2,611 | | | 6,685 | | | 3,710 | |
| Stock-based compensation | | | 425 | | | 5,967 | | | 1,584 | |
Impairment of capitalized research and development costs, equipment and prepaid expenses | | | 603 | | | 6,407 | | | - | |
| Changes in operating assets and liabilities: | | | | | | | | | | |
| Restricted cash | | | 71 | | | - | | | - | |
| Accounts receivable | | | (9 | ) | | (170 | ) | | - | |
| Prepaid expenses and other assets | | | (141 | ) | | 569 | | | 189 | |
| Accounts payable and accrued expenses | | | (1,166 | ) | | 814 | | | (1,627 | ) |
| Deferred revenues | | | (10 | ) | | 609 | | | 79 | |
Net cash used in operating activities from continuing operations | | | (24,657 | ) | | (24,402 | ) | | (15,114 | ) |
Net cash provided by operating activities from discontinued operations | | | 1,672 | | | 1,323 | | | 6,684 | |
Net cash used in operating activities | | | (22,985 | ) | | (23,079 | ) | | (8,430 | ) |
| | | | | | | | | | | |
Cash Flows from Investing Activities: | | | | | | | | | | |
Proceeds from the sale of RetrievalWare business, net of direct costs | | | 16,419 | | | - | | | - | |
Capitalized research and development costs | | | - | | | - | | | (6,616 | ) |
Purchases of equipment and leasehold improvements | | | (4,347 | ) | | (136 | ) | | (8,095 | ) |
Net cash provided by (used in) investing activities from continuing operations | | | 12,072 | | | (136 | ) | | (14,711 | ) |
Net cash used in investing activities from discontinued operations | | | (4 | ) | | (306 | ) | | (299 | ) |
Net cash provided by (used in) investing activities | | | 12,068 | | | (442 | ) | | (15,010 | ) |
| | | | | | | | | | | |
Cash Flows from Financing Activities: | | | | | | | | | | |
Proceeds from the private placement of stock, net | | | - | | | 36,744 | | | 28,765 | |
Proceeds from the exercise of stock options | | | 820 | | | 1,650 | | | 9,670 | |
Proceeds from the borrowings of long-term debt | | | - | | | - | | | 5,000 | |
Proceeds from the issuance of common stock, net | | | (197 | ) | | (253 | ) | | (10 | ) |
Repayment of long-term debt | | | - | | | (5,000 | ) | | - | |
| Net cash provided by financing activities from continuing operations | | | 623 | | | 33,141 | | | 43,425 | |
| Net cash provided by financing activities from discontinued operations | | | - | | | - | | | - | |
Net cash provided by financing activities | | | 623 | | | 33,141 | | | 43,425 | |
Effect of Exchange Rate Changes on Cash | | | (498 | ) | | 72 | | | (10 | ) |
Net (Decrease) Increase in Cash and Cash Equivalents | | | (10,792 | ) | | 9,692 | | | 19,975 | |
Cash and Cash Equivalents, beginning of period | | | 47,433 | | | 37,741 | | | 17,766 | |
Cash and Cash Equivalents, end of period | | $ | 36,641 | | $ | 47,433 | | $ | 37,741 | |
See accompanying notes.
NOTES TO CONSOLIDATED FINANCIAL STATEMENTS
(tabular amounts expressed in thousands, except share and per share data)
(1) CONVERA CORPORATION AND SUMMARY OF SIGNIFICANT ACCOUNTING POLICIES
Nature of Operations
Convera Corporation (“Convera,” “us,” “our” or “we”) provides vertical search services to the websites of trade publishers. We also offer web site hosting and vertical search related professional services and training to publishers. Convera was established through the combination on December 21, 2000 of the former Excalibur Technologies Corporation (“Excalibur”) and Intel Corporation’s (“Intel”) Interactive Media Services (“IMS”) division (the “Combination”).
In the third quarter of fiscal 2008, we completed the sale of our RetrievalWare Enterprise Search Business (“Enterprise Search”) to Fast Search & Transfer (“FAST”). FAST acquired the assets of the Enterprise Search business, assumed certain obligations of the business and retained certain of the employees serving its Enterprise Search customers. Prior to the FAST transaction, we were operating under two reportable segments: Enterprise Search and vertical search (previously entitled our Excalibur web hosting product). Concurrent with the completion of the FAST Transaction, the remaining vertical search business is reported as a single segment. The assets and liabilities of the Enterprise Search business have been reported as “assets held for sale” and “liabilities held for sale” on the accompanying Consolidated Balance Sheets as of January 31, 2007. The operations of the Enterprise Search business have been reflected as discontinued operations in the accompanying Consolidated Statements of Operations and of Cash Flows. See further discussion in Note 2, “Discontinued Operations”.
As of January 31, 2008 and January 31, 2007, Allen Holding, Inc., together with Allen & Company Incorporated, Herbert A. Allen and certain related parties (collectively “Allen & Company”) beneficially owned approximately 42% of the voting power of Convera and held three seats on the Board of Directors.
Principles of Consolidation
The consolidated financial statements include the accounts of Convera Corporation and its wholly owned subsidiaries. All significant intercompany transactions and accounts have been eliminated.
Use of Estimates
The preparation of financial statements in conformity with accounting principles generally accepted in the United States requires us to make estimates and assumptions that affect the reported amounts of assets and liabilities, revenues, expenses and contingent assets and liabilities. We base those estimates on historical experience and other factors that are believed to be reasonable under the circumstances, the results of which form the basis for making judgments about the carrying value of assets, liabilities and equity that are not readily apparent from other sources. Actual results could differ from those estimates.
Reclassifications
Certain amounts presented in the prior year’s financial statements have been reclassified to conform to the fiscal year 2008 presentation.
Revenue Recognition
Revenue from our vertical search service offering can consist of hosted services, professional services and advertising revenue shares.
Our vertical search services revenues are recognized in accordance with SEC Staff Accounting Bulletin No. 104 (SAB 104) “Revenue Recognition.” We evaluate vertical search services arrangements that have multiple deliverables, in accordance with as Emerging Issues Task Force (“EITF”) Abstract Issue No. 00-21 “Revenue Arrangements with Multiple Deliverables.” Revenue is recognized when the services have been performed, the price is fixed and determinable, persuasive evidence of an arrangement exists and collection of the resulting receivable is reasonably assured. Multiple deliverable arrangements that contain elements that do not qualify as separate units of accounting are recognized ratably over the term of the hosting arrangement.
Our contracts with publishers typically entitle us to receive a percentage of customer search-related advertising revenue earned (typically between 20% and 50% of net advertising revenues). Many of our contracts with publishers also contain monthly minimum service fees that we continue to receive until monthly website advertising revenue generated by the publishers’ search sites exceeds these monthly minimum amounts. Contract minimums and other hosting fees or set-up fees are recognized ratably over the term of the vertical search service agreement. Advertising share revenues are recognized when earned under the provisions of the vertical search services agreement.
Revenues from training and professional services are recognized when the services are performed, provided they qualify as separate units of accounting.
Deferred revenue is recorded when payments are received in advance of our performance in the underlying agreements.
Stock-based Compensation
On February 1, 2006, we adopted the provisions of and accounted for stock-based compensation in accordance with Statement of Financial Accounting Standards No. 123 (Revised 2004), Share-Based Payment (“SFAS 123(R)”), that addresses the accounting for share-based payment transactions in which an enterprise receives employee services in exchange for either: (a) equity instruments of the enterprise or (b) liabilities that are based on the fair value of the enterprise’s equity instruments or that may be settled by the issuance of such equity instruments. In January 2005, the Securities and Exchange Commission issued Staff Accounting Bulletin (SAB) No. 107, which provides supplemental implementation guidance for SFAS 123(R). SFAS 123(R) eliminates the ability to account for stock-based compensation transactions using the intrinsic method under Accounting Principal Board Opinion No. 25 (“APB25”) Accounting for Stock Issued to Employees, and instead requires that such transactions be accounted for using a fair value based method.
We use the Black-Scholes-Merton (“Black-Scholes”) option pricing model to determine the fair value of stock-based awards under SFAS 123(R) which is consistent with that used for pro forma disclosures under SFAS 123 Accounting for Stock-Based Compensation. We elected the modified-prospective transition method as permitted by SFAS 123(R). The consolidated financial statements for fiscal year 2006 has not been restated to reflect, and does not include the impact of the adoption of SFAS 123(R). In accordance with the modified -prospective transition method, stock-based compensation expense was recorded for all new grants and to the unvested portion of grants that were outstanding and unvested and ultimately expected to vest as the requisite service is rendered beginning of February 1, 2006, the first day of our fiscal year 2007. Stock-based compensation expense for awards granted prior to February 1, 2006 is based on the grant date fair value as determined under the pro forma provisions of SFAS 123.
Prior to the adoption of SFAS 123 (R), we measured compensation expense for our employee stock-based compensation plans using the intrinsic method prescribed by APB No. 25. We applied the disclosure provisions of SFAS 123 as amended by SFAS No. 148, Accounting for Stock -Based Compensation- Transition and Disclosure, as if the fair-value based method had been applied in measuring compensation expense. Under APB No. 25, when the exercise price of our stock options was equal to the market price of the underlying stock on the date of grant, no compensation expense was recognized.
Research and Product Development Costs
Our software development costs are included in research and product development and are expensed as incurred, in accordance with Statement of Financial Accounting Standards (“SFAS”) No. 86, “Accounting for the Cost of Computer Software to be Sold, Leased or Otherwise Marketed.”
SFAS requires the capitalization of certain software developments costs once technological feasibility is established and capitalization ceases when the products are available for general lease to customers. Amortization of the capitalized costs begins on a straight-line basis over the estimated product life, or on the ratio of current revenues to total projected product revenues, whichever is greater. Previously, we capitalized software development costs related to our Excalibur web hosting product beginning in the first quarter of fiscal year 2006. We continued to do so until such time as “commercial availability” was determined. Total costs capitalized in connection with the web hosting product were $8.1 million. Amortization of previously capitalized software development costs for this offering commenced in the third quarter of fiscal year 2006 and was scheduled to continue over a twenty-four-month period. For the years ended January 31, 2006 and 2007, we recognized amortization expense of capitalized research and development costs of $1.0 million and $3.0 million, respectively, which is included in continuing operations on the consolidated statements of operations and comprehensive loss. In the third quarter of fiscal year 2007, we recorded an impairment charge for the unamortized balance of the capitalized research and development costs. See Note 3, “Impairment of Long-Lived Assets” for additional information related to the impairment charge.
Advertising
Our advertising costs, which were immaterial for the fiscal years ended January 31, 2008, 2007 and 2006, are expensed as incurred and included with sales and marketing in the consolidated statements of operations.
Other Income
For the fiscal year ended January 31, 2008, other income primarily consisted of $1.8 million of interest income. For the fiscal year ended January 31, 2007 other income consisted of $2.4 million of net interest income offset by interest expense of $0.2 million. For fiscal year 2006, other income consisted of $0.9 million of net interest income offset by interest expense of $0.3 million.
Income Taxes
We follow Statement of Financial Accounting Standards No. 109, "Accounting for Income Taxes" ("SFAS 109"). Under the asset and liability method of SFAS 109, deferred tax assets and liabilities are recognized for the future tax consequences attributable to differences between the financial statement carrying amounts of existing assets and liabilities and their respective tax bases. Deferred tax assets and liabilities are measured using enacted tax laws and tax rates in each jurisdiction where we operate, and applied to taxable income in the years in which those temporary differences are expected to be recovered or settled. The effect on deferred tax assets and liabilities due to a change in tax rates is recognized in income in the period that includes the enactment date. In addition, the amounts of any future tax benefits are reduced by a valuation allowance to the extent such benefits are not expected to be realized on a more-likely-than-not basis. We calculate estimated income taxes in each of the jurisdictions in which we operate. This process involves estimating actual current tax expense along with assessing temporary differences resulting from differing treatment of items for both book and tax purposes.
We record a valuation allowance to reduce our deferred tax assets to the amount that is more likely than not to be realized. Realization of the deferred tax assets is principally dependent upon the achievement of projected future taxable income. If the estimates and related assumptions change in the future we may be required to adjust our valuation allowance against our deferred tax assets, resulting in a benefit or a charge to income in the period such determination is made. As of January 31, 2008, we have recorded a full valuation allowance against the net deferred tax asset.
We adopted the provisions of the Financial Accounting Standards Board (“FASB”) Interpretation No. 48, "Accounting for Uncertainty in Income Taxes" (“FIN 48”) on February 1, 2007. FIN 48 clarifies the accounting for uncertainty in income taxes recognized in an enterprise’s financial statements in accordance with SFAS No. 109. FIN 48 also prescribes a recognition threshold and measurement standard for the financial statement recognition and measurement of an income tax position taken or expected to be taken in a tax return. FIN 48 also provides guidance on de-recognition, classification, interest and penalties, accounting in interim periods, disclosures and transitions. We previously recognized income tax positions based on management’s estimate of whether it was reasonably possible that a liability had been incurred for unrecognized tax benefits by applying SFAS No. 5, Accounting for Contingencies.
Significant judgment is required in evaluation our uncertain tax positions and determining the valuation allowance applied to deferred tax assets. We have concluded that there are no uncertain tax positions requiring recognition in our consolidated financial statements.
Net Loss Per Common Share
We follow SFAS No. 128, “Earnings Per Share,” for computing and presenting net loss per share information. Basic loss per common share is computed by dividing net loss available to common stockholders by the weighted average number of common shares outstanding for the period. Diluted loss per common share excludes common stock equivalent shares and unexercised stock options as the computation would be anti-dilutive. When discontinued operations are present, income (loss) before discontinued operations on a per share basis represents the “control number” in determining whether potential common shares are dilutive or anti-dilutive. A reconciliation of the net loss available to common stockholders and the number of shares used in computing basic and diluted net loss per share is in Note 9.
Foreign Currency
The functional currency of our foreign subsidiaries is their local currency. Accordingly, assets and liabilities of our foreign subsidiaries are translated into U.S. dollars at exchange rates in effect at the balance sheet date. Income and non-monetary assets and liabilities are remeasured at historical rates. Revenues and expenses are translated at average rates for the period. In accordance with Statement of Financial Accounting Standards No. 52, foreign currency translation adjustments are accumulated in a separate component of shareholders’ equity. Foreign currency transaction gains and losses arise from the remeasurement of certain transactions denominated in a nonfunctional currency to the functional currency and are a component of operating expenses. Foreign currency transaction gains (losses) were approximately $477,000, $(336,000), and $39,000, for the years ended January 31, 2008, 2007, and 2006, respectively.
Fair Value of Financial Instruments
The carrying value of our financial instruments, including cash and cash equivalents, accounts receivable, accounts payable and accrued expenses, approximates their fair value.
Cash and Cash Equivalents
We consider all highly liquid investments purchased with an original maturity of three months or less to be cash equivalents. Cash equivalents consist of funds deposited in money market accounts primarily backed by short-term U.S. Government securities. Consequently, the carrying amount of cash and cash equivalents approximates this fair value. Substantially all cash and cash equivalents are on deposit with two major financial institutions.
Restricted Cash
As of January 31, 2008 the Company has certificates of deposit of $76,000 and $450,000, which are pledged to collateralize letters of credit required for leased facilities. The certificate of deposit for $76,000 is pledged as collateral for a lease expiring in December 2009. The certificate of deposit for $450,000 is pledged to a lease commitment through February 2010. Both certificates of deposit are included with Other assets on the consolidated balance sheet.
Concentrations of Credit Risk
Financial instruments that potentially subject us to concentrations of credit risk consist primarily of cash equivalents and accounts receivable. We believe that our investment policy limits our exposure to concentrations of credit risk. Our customers are primarily large publishing companies, many of which are located outside the United States. For the years ended January 31, 2008 and 2007, total revenues derived from international sales were approximately $1.0 million and $0.1 million, representing approximately 88% and 53% of total revenues, respectively. There was no international revenue for the year ended January 31, 2006. Most of our international sales are in the United Kingdom. Our international operations have historically exposed us to longer accounts receivable and payment cycles and fluctuations. We extend credit to our customers based on an evaluation of the customer’s financial condition, typically without requiring a deposit or collateral. Exposure to losses on receivables is principally dependent on each customer’s financial condition. Currently, we do not maintain an allowance for anticipated losses. We perform ongoing evaluations of our exposure for credit losses, examining our historical collection experience and our portfolio of customers, taking into consideration the general economic environment as well as the industry in which we operate. As our customer base grows, we will periodically review whether a provision is required. One customer accounted for 82% of total revenues for the year ended January 31, 2008. For the year ended January 31, 2007, three customers accounted for 53%, 29%, and 17% of total revenues, respectively. A single customer accounted for 100% of total revenues in fiscal year 2006.
Long-lived Assets
Equipment and Leasehold Improvements
Office furniture and computer equipment are recorded at cost. Depreciation of office furniture and equipment is provided on a straight-line basis over the estimated useful lives of the assets, generally three to five years. Amortization of leasehold improvements and leased assets are provided on a straight-line basis over the shorter of the term of the applicable lease or the useful life of the asset. Expenditures for normal repairs and maintenance are charged to operations as incurred. The cost of property and equipment retired or otherwise disposed of and the related accumulated depreciation or amortization are removed from the accounts and any resulting gain or loss is reflected in current operations.
We evaluate all of our long-lived assets for impairment in accordance with the provisions of Statement of Financial Accounting Standard No. 144, “Accounting for the Impairment or Disposal of Long-Lived Assets (“SFAS No. 144”). SFAS No. 144 requires that long-lived assets, including property and equipment, be evaluated for impairment whenever events or changes in circumstances indicate that the carrying value of an asset may not be recoverable based on expected undiscounted cash flows attributable to that asset. Should events indicate that any of our assets are impaired, the amount of such impairment will be measured as the difference between the carrying value and the fair value of the impaired asset and the impairment will be recorded in earnings during the period of such impairment.
Exit and Disposal Activities
We recognized these costs in accordance with SFAS 146, “Accounting for Costs Associated with Exit or Disposal Activities”. SFAS 146 generally requires the recognition of an expense and related liability for one-time employee termination benefits at the communication date and contract termination costs at the cease-use date. The expense and liability are measured at fair value, which is generally determined by estimating the future cash flows to be used in settling the liability.
Recent Pronouncements
In September 2006, the FASB issued Statement of Financial Accounting Standards No. 157 (“SFAS 157”), Fair Value Measurements. SFAS 157 provides guidance for measuring the fair value of assets and liabilities. It requires additional disclosures related to the extent to which companies measure assets and liabilities at fair value, the information used to measure fair value, and the effect of fair value measurements on earnings. It does not require any new fair value measurements. SFAS 157 is effective for fiscal years beginning after November 15, 2007. We will adopt SFAS 157 for our fiscal year 2009 beginning February 1, 2008. We do not expect the adoption to have a material impact on our consolidated results of operations and financial condition.
In February 2007, the FASB issued SFAS No. 159, “The Fair Value Option for Financial Assets and Financial Liabilities - including an Amendment of SFAS No. 115” (“SFAS 159”), which permits an entity to measure many financial assets and financial liabilities at fair value that are not currently required to be measured at fair value. Entities that elect the fair value option will report unrealized gains and losses in earnings at each subsequent reporting date. The fair value option may be elected on an instrument-by-instrument basis, with few exceptions. SFAS 159 amends previous guidance to extend the use of the fair value option to available-for-sale and held-to-maturity securities. SFAS 159 also establishes presentation and disclosure requirements to help financial statement users understand the effect of the election. SFAS 159 is effective as of the beginning of the first fiscal year beginning after November 15, 2007. We will adopt SFAS 159 for our fiscal year 2009 beginning February 1, 2008. We do not expect the adoption to have a material impact on our consolidated results of operations and financial condition.
In December 2007, the FASB issued a revision to SFAS No. 141, “Business Combinations” (“SFAS 141R”). The objective of this Statement is to improve the relevance, representational faithfulness, and comparability of the information that a reporting entity provides in its financial reports about a business combination and its effects. This Statement will apply prospectively to any business combinations we may enter into for which the acquisition date is on or after the beginning of our first annual reporting period beginning after December 15, 2008.
(2) DISCONTINUED OPERATIONS
On August 9, 2007, we completed the sale of Enterprise Search to FAST for $23.0 million, including $22.1 million of cash, of which $4.0 million is held in escrow for one year, and the assumption of approximately $0.9 million in employee-related liabilities to FAST. FAST acquired the assets of the RetrievalWare business, assumed certain obligations of the business and retained certain employees serving its Enterprise Search customers. The escrow balance of $4.0 million is offset by a purchase price reduction of $1.0 million related to working capital adjustments and contingent claims against the Enterprise Search business for which we have provided FAST indemnification.
For the year ended January 31, 2008, we recorded a net gain on the sale of approximately $17.9 million, which is net of approximately: $0.8 million of net assets transferred to FAST, a purchase price adjustment of $1.0 million and transaction fees and other costs. Allen & Company LLC, a company affiliated with the majority shareholder, acted as financial advisor for the transaction and was paid a fee of 1.5% of the consideration plus expenses, which totaled approximately $0.4 million. Due to our accumulated net operating loss carryforwards, no federal or state income taxes for the gain on the sale of this business have been provided or are otherwise required at January 31, 2008.
The assets and liabilities of the Enterprise Search business have been accounted for as “assets held for sale” and “liabilities held for sale” for all periods presented in accordance with the criterion established in SFAS No. 144. We entered into a transition services agreement under which we are reimbursed for services rendered and expenses incurred related to the transfer of finance, accounting and contracts functions of the Enterprise Searach business to FAST. These transition services will not be material to Enterprise Search cash flows. Therefore, in accordance with SFAS No. 144, the accompanying Consolidated Statements of Operations and Consolidated Statements of Cash Flows report the operations and cash flows of the Enterprise Search business as discontinued operations.
Revenue from the RetrievalWare product line generally consisted of software licenses, training, professional services and software maintenance. We recognized revenue for our RetrievalWare product in accordance with American Institute of Certified Public Accountants’ Statement of Position (“SOP”) 97-2, Software Revenue Recognition, as amended by Statement of Position 98-9, Software Revenue Recognition, with respect to certain transactions. Software licenses were sold to customers as a permanent license (“Perpetual License”) or as a license for a definitive period of time (“Term License”). Provided that the fee was fixed and determinable, persuasive evidence of an arrangement existed and collection of the resulting receivable was considered probable, revenue from the sale of Perpetual Licenses and Term Licenses was recognized upon shipment of product if VSOE existed using the residual method. When VSOE could not be established, Term License revenue was recorded ratably over the term of the license. We utilized the residual methodology as described in paragraph 12 of SOP 97-2 as amended by SOP 98-9 for recognizing revenue related to multi-element software agreements.
The following table presents the summarized financial information for the discontinued operations presented in the Consolidated Statements of Operations (amounts in thousands):
| | | For the Year Ended January 31, | |
| | | 2008 | | 2007 | | 2006 | |
Revenue | | $ | 5,729 | | $ | 16,402 | | $ | 20,988 | |
| | | | | | | | | | | |
Expenses | | | | | | | | | | |
| Cost of revenues | | | 2,019 | | | 4,452 | | | 5,467 | |
| Sales and marketing | | | 1,423 | | | 7,120 | | | 5,386 | |
| Research and product development | | | 2,000 | | | 4,035 | | | 5,148 | |
| General and administrative | | | 267 | | | 339 | | | 199 | |
| Total expenses | | | 5,709 | | | 15,946 | | | 16,200 | |
| | | | | | | | | | | |
| Gain on sale of discontinued operations | | | 17,925 | | | - | | | - | |
Income from discontinued operations | | $ | 17,945 | | $ | 456 | | $ | 4,788 | |
| | | | | | | | | | | |
(3) IMPAIRMENT OF LONG-LIVED ASSETS
In the fourth quarter of fiscal 2008, we terminated our hosting agreement with AT&T for our San Diego data center in order to appropriately scale our hosting capabilities to our business plan. As a result of the data center closing, the assets consisting of servers and related hosting equipment that were previously employed at the facility, were no longer of use to our operations. The assets were relocated to storage in our Carlsbad, CA facility and remain classified as “held and used” for financial statement reporting purposes. We made the determination that the asset group was clearly impaired since the equipment became idle as a consequence of the data center closing and was expected to remain idle for the foreseeable future, generating no future cash flows. The estimated fair value of the equipment, determined using a third-party appraisal, was deemed to be the orderly liquidation value of $0.4 million. We recorded an impairment charge of $0.6 million related to the equipment.
During the year ended January 31, 2007, we made the determination that, due to the lack of revenues generated to date and the loss of a significant potential contract, the asset group related to our Excalibur web hosting product was impaired. The asset group included capitalized software development costs and computer equipment used to host the Excalibur product as well as prepaid royalties and prepaid maintenance contracts supporting the web hosting product. Based on our recoverability analysis, we recorded an impairment loss of $6.4 million for the year ended January 31, 2007.
(4) OPERATIONAL RESTRUCTURINGS
Throughout the year ended January 31, 2008, we implemented actions to restructure our expenses. These restructuring actions were not performed pursuant to a formal plan to restructure this business; rather, they occurred throughout the year to focus our resources on the strategy to expand our presence in the online publishing market. In connection with this effort we reduced our workforce by 54 employees worldwide, closed facilities in Montreal, Canada and Lyon, France and terminated our hosting agreement with AT&T for our San Diego data center in order to appropriately scale our hosting capabilities. Total costs recognized in connection with these efforts were approximately $2.0 million, consisting of severance costs of $1.0 million, facility closing costs of $0.2 million and contract termination costs of $0.8 million. During the year ended January 31, 2008, we paid $1.1 million against these accruals.
Expenses related to the fiscal year 2008 operational restructuring effort appear in the accompanying Consolidated Statements of Operations and Comprehensive Loss as follows (amounts in thousands):
| | | Year Ended January 31, 2008 | |
| Continuing Operations | | | | |
| Cost of revenues | | $ | 70 | |
| Sales and marketing | | | 29 | |
| Research and product development | | | 739 | |
| General and administrative | | | 948 | |
| Continuing Operations Total | | $ | 1,786 | |
| Discontinued Operations | | | 207 | |
| Total | | $ | 1,993 | |
(5) EQUIPMENT AND LEASEHOLD IMPROVEMENTS
Equipment and leasehold improvements at January 31, 2008 and 2007 consisted of the following (in thousands):
| | | 2008 | | 2007 | |
| Computer equipment | | $ | 13,106 | | $ | 9,873 | |
| Office furniture | | | 2,812 | | | 2,949 | |
| Leasehold improvements | | | 530 | | | 597 | |
| | | | 16,448 | | | 13,419 | |
| Less accumulated depreciation | | | (11,535 | ) | | (9,705 | ) |
| | | $ | 4,913 | | $ | 3,714 | |
Equipment and leasehold improvements are recorded at cost. Depreciation is calculated on the straight-line method over three years for computer equipment, five years for office furniture and over the shorter of the depreciable life or the life of the related lease for leasehold improvements. Depreciation expense for fiscal years 2008, 2007, and 2006 was $2.6 million, $3.7 million and $2.9 million, respectively.
(6) ACCRUED EXPENSES
Accrued expenses at January 31, 2008 and 2007 consisted of the following (in thousands):
| | | 2008 | | 2007 | |
| Accrued payroll and bonuses | | $ | 719 | | $ | 1,194 | |
| Accrued audit and accounting fees | | | 462 | | | 556 | |
| Restructuring reserve | | | 878 | | | - | |
| Other | | | 223 | | | 482 | |
| | | $ | 2,282 | | $ | 2,232 | |
(7) INCOME TAXES
The items accounting for the difference between income taxes computed at the federal statutory rate and the provision for income taxes consisted of (in thousands):
| | | For the Fiscal Years Ended January 31, |
| | | 2008 | | | 2007 | | | 2006 |
| Federal benefit at statutory rate | | $ | (3,184 | ) | | (35 | )% | | | | $ | (15,690 | ) | | (35 | )% | | | | $ | (4,993 | ) | | (35 | )% |
| Effect of: | | | | | | | | | | | | | | | | | | | | | | | | | |
| State benefits, net of federal benefits | | | (355 | ) | | (4 | ) | | | | | (1,748 | ) | | (4 | ) | | | | | (556 | ) | | (4 | ) |
| Lower effective foreign tax rate | | | 867 | | | 9 | | | | | | (130 | ) | | 0 | | | | | | 241 | | | 2 | |
| Expiration/use of NOL carryforward | | | 4,892 | | | 54 | | | | | | 1,871 | | | 4 | | | | | | 1,168 | | | 8 | |
| Effect of stock options | | | 279 | | | 3 | | | | | | 438 | | | 1 | | | | | | (4,582 | ) | | (32 | ) |
| Other | | | 1,791 | | | 20 | | | | | | 129 | | | 0 | | | | | | 70 | | | 0 | |
| Valuation allowance | | | (4,290 | ) | | (47 | ) | | | | | 15,130 | | | 34 | | | | | | 8,652 | | | 61 | |
| Net deferred tax assets | | $ | - | | | 0 | % | | | | $ | - | | | 0 | % | | | | $ | - | | | 0 | % |
Deferred income taxes reflect the net tax effects of temporary differences between the carrying amount of assets and liabilities for financial reporting purposes and the amounts used for income tax purposes.
Our net deferred tax assets at January 31, 2008 and 2007 were as follows:
| | | 2008 | | 2007 | |
| Deferred tax assets: | | | | | |
| Net operating loss carryforwards, not yet utilized | | $ | 78,850 | | $ | 77,694 | |
| Capitalized research & development costs | | | 19,441 | | | 20,866 | |
| Stock Compensation | | | (344 | ) | | 2,101 | |
| Deferred revenue | | | 255 | | | 1,173 | |
| Restructuring Reserve | | | 308 | | | - | |
| Other | | | (87 | ) | | 192 | |
| Total deferred tax assets | | | 98,423 | | | 102,026 | |
| Valuation allowance | | | (98,423 | ) | | (102,026 | ) |
| Net deferred tax assets | | $ | - | | $ | - | |
On August 9, 2007, we completed the sale of our Enterprise Search business and recognized income from discontinued operations of $17.9 million for the year ended January 31, 2008 and a total net loss for the year of $9.1 million. No federal or state income taxes were provided on the income generated from discontinued operations due to the substantial net operating loss carryforwards available for federal and state income taxes. We offset the deferred tax provision triggered by the gain recognized on the sale of the Enterprise Search business by the reversal of a portion of the previously recorded valuation allowance on the net deferred tax assets.
Our Canadian Subsidiary received a tax refund of $241 from a scientific research and experimental development tax credit during fiscal 2008. This tax benefit was triggered through the use of previously recorded net operating loss carryforwards generated by the Canadian subsidiary. This tax benefit is recorded as a component of discontinued operations, as we closed this operation in the operational restructuring actions undertaken during fiscal 2008 as discussed further in Note 4
We adopted the provisions of FASB Interpretation No. 48, “Accounting for Uncertainty in Income Taxes” (“FIN 48”) on February 1, 2007. The adoption of FIN 48 did not impact our financial position or results of operations. We concluded that there are no uncertain tax positions requiring recognition in our consolidated financial statements. Our policy is to recognize interest and penalties in the period in which they occur in the income tax provision (benefit). We file income tax returns in the U.S. federal jurisdiction, various states and local jurisdictions and in foreign jurisdictions, primarily the UK and Canada. Tax years that remain subject to examination include: US federal and state tax returns from fiscal 2005 to present; Tax returns in the UK from fiscal 2006 to present and Canadian tax returns from fiscal 2005 to present. We are not currently under audit for income taxes in any jurisdiction.
At January 31, 2008, the Company had net operating loss carryforwards (“NOLs”) of approximately $208 million that are expiring now and continue at various dates through fiscal year 2027. The use of these NOLS may be limited by Section 382 of the Internal Revenue Code as a result of the Combination or other equity transactions. Approximately $28.3 million of the NOLs relate to stock option exercises, and $20.3 million relate to UK operations. The tax benefit associated with the stock option exercises will be credited to equity when and if realized.
As of January 31, 2008, our deferred tax assets exceeded the deferred tax liabilities. As we have not generated earnings and no assurance can be made of future earnings needed to utilize these assets, a valuation allowance in the amount of the net deferred tax assets has been recorded.
(8) CAPITALIZATION
Our authorized capital stock consists of 100 million shares of Class A voting common stock, par value $0.01 per share, 40 million shares of Class B non-voting common stock, par value $0.01 per share, and five million shares of cumulative convertible preferred stock, par value $0.01 per share.
In the first quarter of fiscal year 2007, we completed a private placement of 5,103,333 newly-issued shares of common stock to a group of institutional investors resulting in net proceeds of approximately $36.7 million. The shares were sold at a price of $7.50 per share, which represented a 6.58% discount to Convera’s trailing 10-day average closing price preceding the date of Board approval. Allen & Company LLC, a company affiliated with the majority shareholder, acted as placement agent for the private placement and was paid a commission of $1.5 million, or 4%. Concurrent with this private placement, we retired the Silicon Valley Bank term loan facility. The remaining balance of the private placement proceeds, which totaled approximately $31.6 million are to be used for general corporate purposes.
In the second quarter of fiscal year 2006, we completed a private placement of 6,555,556 newly issued shares of our Class A common stock to two investors. We sold 5,555,556 shares directly to the Legg Mason Opportunity Trust at a purchase price of $4.50 per share. The remaining 1 million shares were purchased by an affiliate of Herbert A. Allen, a significant stockholder and a member of our board of directors, at a purchase price of $4.84 per share. Net proceeds to us of approximately $28.8 million were used for general corporate purposes. Allen & Company LLC, a company affiliated with the majority shareholder, acted as placement agent for the private placement and was paid a commission of 4% on the shares purchased directly by the Legg Mason Opportunity Trust.
No shares of the Company’s Class B common stock are issued or outstanding at January 31, 2008.
(9) NET LOSS PER COMMON SHARE
We follow SFAS No. 128, “Earnings Per Share,” for computing and presenting net loss per share information. Basic income or loss per common share for continuing and discontinued operations is computed by dividing net income or (loss) available to common stockholders by the weighted average number of common shares outstanding for the period. Diluted loss per common share excludes common stock equivalent shares and unexercised stock options as the computation would be anti-dilutive. When discontinued operations are present, income (loss) before discontinued operations on a per share basis represents the “control number” in determining whether potential common shares are dilutive or anti-dilutive. Since there is a loss from continuing operations, potential common shares have also been excluded from the denominator used to calculate diluted income per common share from discontinued operations.
The following table sets forth the computation of basic and diluted net loss per common share for continuing and discontinued operations: (in thousands except per share data):
| | | For the Fiscal Year Ended January 31, | |
| | | 2008 | | 2007 | | 2006 | |
| Continuing Operations Numerator: | | | | | | | | | | |
| Loss from continuing operations | | $ | (27,041 | ) | $ | (45,283 | ) | $ | (19,049 | ) |
| | | | | | | | | | | |
| Discontinued Operations Numerator: | | | | | | | | | | |
| Income from discontinued operations | | $ | 17,945 | | $ | 456 | | $ | 4,788 | |
| | | | | | | | | | | |
| Net loss numerator: | | $ | (9,096 | ) | $ | (44,827 | ) | $ | (14,261 | ) |
| | | | | | | | | | | |
| Denominator Continuing and Discontinued | | | | | | | | | | |
| Operations: | | | | | | | | | | |
| Weighted average number of common shares outstanding - basic and diluted | | | 53,145,955 | | | 52,221,644 | | | 43,088,677 | |
| | | | | | | | | | | |
| Basic and diluted net loss per common share from continuing operations | | $ | (0.51 | ) | $ | (0.87 | ) | $ | (0.44 | ) |
| | | | | | | | | | | |
| Basic and diluted net income per common share from discontinued operations | | $ | 0.34 | | $ | 0.01 | | $ | 0.11 | |
| | | | | | | | | | | |
| Basic and diluted net loss per share | | $ | (0.17 | ) | $ | (0.86 | ) | $ | (0.33 | ) |
Using the treasury stock method the following equity instruments were not included in the computation of diluted net loss per common share because their effect would be anti-dilutive:
| | For the Fiscal Years Ended January 31, |
| | 2008 | | 2007 | | 2006 |
Stock options | - | | 463,564 | | 3,761,226 |
Deferred stock | 203,843 | | 731,525 | | 616,613 |
(10) EMPLOYEE BENEFIT PLANS
Our Stock Option Plans authorize the granting of stock options and other forms of incentive compensation to purchase up to 14.25 million shares of our Class A common stock in order to attract, retain and reward key employees. Of the total number of shares authorized for stock based compensation, options to purchase 5,054,756 shares and 300,000 deferred shares were outstanding as of January 31, 2008. We had a total of 5,953,236 shares of Class A common stock reserved for the issuance of warrants, deferred shares and options under the plans as of January 31, 2008.
Each qualified incentive stock option has an exercise price as determined by a committee appointed by the Board of Directors, but not less than 100% of the fair market value of the underlying common stock at the date of grant, a ten-year term and typically a four-year vesting period.
A non-qualified option granted pursuant to the plans may contain an exercise price that is below the fair market value of the common stock at the date of grant and/or may be immediately exercisable. The term of non-qualified options is usually five or ten years.
The following table summarizes our activity for all of our stock option awards:
| | | Number of Options | | Weighted-Average Exercise Price | | Weighted-Average Remaining Contractual Term (Years) | | Aggregate Intrinsic Value (In thousands) | |
| Outstanding, January 31, 2007 | | | 9,222,546 | | $ | 5.23 | | | | | | | |
| Granted | | | 332,750 | | | 3.77 | | | | | | | |
| Exercised | | | (337,125 | ) | | 2.43 | | | | | | | |
| Forfeited | | | (2,432,482 | ) | | 5.86 | | | | | | | |
| Expired | | | (1,730,933 | ) | | 5.90 | | | | | | | |
| Outstanding, January 31, 2008 | | | 5,054,756 | | $ | 4.79 | | | 5.43 | | $ | - | |
| Vested or expected to vest | | | 4,818,085 | | $ | 4.78 | | | 5.27 | | $ | - | |
| Exercisable, January 31, 2008 | | | 3,834,617 | | $ | 4.77 | | | 4.56 | | $ | - | |
The total intrinsic value of options exercised during the years ended January 31, 2008, 2007, and 2006 was $0.4 million, $1.7 million, and $11.8 million, respectively.
Cash received from option exercises under all share-based arrangements for the years ended January 31, 2008, 2007, and 2006 was $0.8 million, $1.7 million, and $9.7 million, respectively. We have a policy of issuing new shares to satisfy share option exercises.
The following table summarizes additional information about stock options outstanding at January 31, 2008:
| | | Options Outstanding | | Options Exercisable | |
Range of Exercise Prices | | Number of Options | | Weighted-Average Remaining Contractual Life | | Weighted-Average Exercise Price | | Number Exercisable | | Weighted-Average Exercise Price | |
| $ 2.24 to $ 4.25 | | | 624,032 | | | 6.76 years | | $ | 3.21 | | | 399,965 | | $ | 3.22 | |
| $ 4.38 to $ 4.38 | | | 2,022,487 | | | 2.82 | | | 4.38 | | | 2,022,487 | | | 4.38 | |
| $ 4.40 to $ 4.71 | | | 1,742,709 | | | 7.41 | | | 4.66 | | | 1,042,632 | | | 4.69 | |
| $ 4.75 to $ 16.09 | | | 632,678 | | | 7.15 | | | 6.69 | | | 336,683 | | | 6.77 | |
| $ 20.52 to $ 46.06 | | | 32,850 | | | 2.16 | | | 29.62 | | | 32,850 | | | 29.62 | |
| | | | 5,054,756 | | | 5.43 years | | $ | 4.79 | | | 3,834,617 | | $ | 4.77 | |
SFAS No. 123(R) requires the use of a valuation model to calculate the fair value of stock-based awards. We have elected to use the Black-Scholes option-pricing model, which incorporates various assumptions including volatility, expected life, risk free interest rates and dividend yields. The expected volatility is based on term-matching historical volatility. The expected life of an award is computed using a combination of historical holding periods combined with hypothetical holding periods on a weighted average basis.
During the third quarter of the fiscal year ended January 31, 2008, we evaluated various grouping schemes for all option holders based on holding periods and exercise behavior. Based on this evaluation, we determined that the grouping of Directors and non-Directors displayed significantly different exercise behavior. The FASB has stated that where such diversity exists, the options should be valued separately with different assumptions. As such, we established two groups for option valuation: Group 1 is comprised of Directors; Group 2 includes all other employees. As SFAS No.123(R) requires that stock-based compensation expense be based on awards that are ultimately expected to vest, stock-based compensation expense for the year ended January 31, 2008 has been reduced for estimated forfeitures. In the third quarter of fiscal year 2008, we reevaluated our forfeiture rate as a result of the current year restructuring actions, the sale of the Enterprise Search business to FAST and the current quarter regrouping of option holders to address the impact that these actions have on the ultimate vesting of stock options. As a result, we set the forfeiture rate to be used in the computation of stock option expense for the remainder of the year ended January 31, 2008 to 1.2% for Class 1 and to 15% for Class 2.
The following table shows the assumptions used for the grants that occurred in each fiscal year:
For the year ended January 31, | 2008 | | 2007 | | 2006 |
| Expected term of stock options | 3.16 years | | 6.14 years | | 5 years |
| Expected volatility | 68% | | 62% | | 80% |
| Risk free interest rates | 4.0% to 5.0% | | 4.6% to 5.0% | | 3.9% to 4.4% |
| Dividend yield | None | | None | | None |
| | | | | | |
| Weighted average grant date fair value of options granted during the period | $1.38 | | $3.29 | | $4.40 |
As of January 31, 2008, no stock-based compensation costs related to stock options were capitalized as part of the cost of an asset. As of January 31, 2008 a total of $9.9 million of unrecognized compensation cost related to stock options is expected to be recognized over a weighted average period of 1.9 years.
Our Employee Stock Purchase Plan, or “ESPP,” was discontinued as of July 31, 2006. The ESPP allowed eligible employees to purchase shares at 85% of the lower of the fair value of the common stock at the beginning of the offering period or the fair value on the purchase date. Our ESPP was deemed to be compensatory, and therefore, ESPP expenses under SFAS 123R have been included in our Consolidated Statements of Operations for the year ended January 31, 2007.
Deferred Stock Compensation Plan
Beginning in fiscal year 2004, pursuant to our 2000 Stock Option Plan, several of our senior officers have been awarded shares of deferred stock with varying vesting provisions. Nonvested shares of stock granted under the stock option plan are measured at fair value on the date of grant based on the number of shares granted and the quoted price of our common stock. Such value is recognized as compensation expense over the corresponding service period. Deferred stock compensation is subject to the provisions of FAS 123(R) and as such is adjusted for estimated forfeitures. During the first quarter of the fiscal year ended January 31, 2008, the employment of two officers in the plan was terminated prior to vesting their awards. The forfeiture of these shares represented a large percentage of the total plan and as a result increased the forfeiture rate related to this plan significantly. The cumulative effect of this adjustment to the forfeiture rate resulted in a net compensation expense credit of $1.1 million, or $0.02 per common share, recorded in the first quarter of fiscal year 2008. As of January 31, 2008, an aggregate of 300,000 shares of deferred stock was outstanding.
The following table summarizes the deferred stock compensation plans as of January 31, 2008:
Deferred Stock Plan Shares | | Shares | | Weighted-Average Grant-Date Fair Value | |
| Nonvested at February 1, 2007 | | | 890,000 | | $ | 5.64 | |
| Granted | | | - | | | - | |
| Vested | | | (190,000 | ) | | 6.14 | |
| Forfeited | | | (400,000 | ) | | 5.50 | |
| Nonvested at January 31, 2008 | | | 300,000 | | $ | 5.50 | |
As of January 31, 2008, there was $0.3 million of total unrecognized compensation cost related to nonvested share-based compensation arrangements granted under the Deferred Stock Plan. That cost is expected to be recognized over a weighted-average period of 1.0 year. The total fair value of shares vested during the years ended January 31, 2008, 2007 and 2006 was $1.2 million, $0.7 million and $0.7 million, respectively.
The impact on our results of operations of recording stock-based compensation related to stock options, the ESPP and deferred stock for the years ended January 31, 2008, 2007 and 2006 was as follows (in thousands):
| | | Fiscal Year Ended January 31, | |
| | | 2008 | | 2007 | | 2006 | |
| Continuing Operations | | | | | | | | | | |
| Cost of revenues | | $ | 269 | | $ | 216 | | $ | - | |
| Sales and marketing | | | 200 | | | 248 | | | - | |
| Research and product development | | | (795 | ) | | 1,684 | | | 440 | |
| General and administrative | | | 751 | | | 3,819 | | | 979 | |
Continuing Operations Total1 | | | 425 | | | 5,967 | | | 1,419 | |
| Discontinued Operations | | | 176 | | | 830 | | | - | |
| Total | | $ | 601 | | $ | 6,797 | | $ | 1,419 | |
(1) During fiscal year 2006 stock-based compensation of $165 was included in capitalized research and product development costs and is not reflected in the totals reported above.
Had compensation cost for our stock-based compensation plans been determined based on the fair value at the grant dates for awards made under the respective plans in fiscal years 2006 consistent with the method of SFAS No. 123, our net loss and basic and diluted net loss per common share would have been increased to the pro forma amounts indicated below.
Fiscal Year Ended January 31, 2006 | | | |
| Net loss, as reported | | $ | (14,261 | ) |
| Stock-based compensation, as reported | | | 1,419 | |
| Total stock-based compensation determined under fair value based method for all awards | | | (5,539 | ) |
| Pro forma net loss | | $ | (18,381 | ) |
| | | | | |
| Basic and diluted net loss per common share, as reported | | | ($0.33 | ) |
| Basic and diluted net loss per common share, pro forma | | | ($0.43 | ) |
The pro forma net loss after applying the provisions of SFAS No. 123 is not necessarily representative of the effects on reported net loss for future years due to, among other things, vesting period of the stock options and the fair value of additional options in future years.
Employee Savings Plan
We have an employee savings plan that qualifies under Section 401(k) of the Internal Revenue Code. Under the plan, participating eligible employees in the United States may defer up to 100 percent of their pre-tax salary, but not more than statutory limits. The plan was amended in the fiscal year ended January 31, 2001 to allow us to match $0.50 on every dollar up to the maximum of 8% of the employee’s contribution on total compensation.
For the fiscal years ended January 31, 2008, 2007and 2006, we contributed approximately $0.3 million, $0.4 million, and $0.4 million, respectively, to the employee savings plan.
(11) COMMITMENTS AND CONTINGENCIES
Lease Commitments
We conduct our operations using leased facilities. The leases terminate at various dates through fiscal year 2011 with options to renew. Certain leases provide for scheduled rent increases and require us to pay shared portions of the operating expenses such as taxes, maintenance and repair costs. We also have operating leases for equipment that are included in the figures below. Future minimum rental payments under non-cancelable operating leases as of January 31, 2008 along with sublease rental receipts are as follows (in thousands):
Year Ending January 31, | | Operating Leases | | Sublease Rental Receipts | |
2009 | | $ | 1,693 | | $ | 283 | |
2010 | | | 1,153 | | | 121 | |
2011 | | | 111 | | | - | |
2012 | | | - | | | - | |
2013 and beyond | | | - | | | - | |
| | | $ | 2,957 | | $ | 404 | |
Total rental expense under operating leases was approximately $1.5 million (net of sublease rental receipts of $0.2 million) for fiscal year 2008 and $1.6 million and $1.8 million for fiscal years 2007 and 2006, respectively.
Contingencies
From time to time, we may be a party to various legal proceedings, claims, disputes and litigation arising in the ordinary course of business. We believe that the ultimate outcome of these matters, individually and in the aggregate, will not have a material adverse affect on its financial position, operations or cash flow. However, because of the nature and inherent uncertainties of litigation, should the outcome of these actions or future actions be unfavorable, our financial position, operations and cash flows could be materially adversely affected.
(12) SEGMENT REPORTING
We have one reportable segment. Prior to our agreement on March 31, 2007 to sell the assets of the Enterprise Search (RetrievalWare) business to FAST, we operated under two reportable segments: the Enterprise Search segment and the vertical search segment (previously called our Excalibur web hosting product). Financial information is located in the financial statements beginning on page F-2. The assets and liabilities of the Enterprise Search business have been reported as “assets held for sale” and “liabilities held for sale” on the Consolidated Balance Sheets. Revenue, expenses and cash flows related to the Enterprise Search business have been reflected as discontinued operations in the Consolidated Statements of Operations and of Cash Flows.
Operations by Geographic Area
The following table presents information about our operations by geographical area (in thousands):
| | | Fiscal Years Ended January 31, | |
| Sales to customers: | | 2008 | | 2007 | | 2006 | |
United States | | $ | 139 | | $ | 126 | | $ | 20 | |
United Kingdom | | | 979 | | | 143 | | | - | |
| | | $ | 1,118 | | $ | 269 | | $ | 20 | |
| Long-lived assets: | | | | | | | | | | |
United States | | $ | 5,459 | | $ | 4,158 | | $ | 15,665 | |
All Other | | | 83 | | | 146 | | | 661 | |
| | | $ | 5,542 | | $ | 4,304 | | $ | 16,326 | |
Major Customers
One customer accounted for 82% of total revenue for the fiscal year ended January 31, 2008, three customers accounted for 53%, 29% and 17%, respectively of total revenue for fiscal year ended January 31, 2007; and one customer accounted for 100% of the revenue for the fiscal year ended January 31, 2006.
(13) SUPPLEMENTAL DISCLOSURE OF CASH FLOW INFORMATION (in thousands):
| | | For the Fiscal Years Ended January 31, | |
| Supplemental Disclosures of Non-cash Investing and Financing Activities: | | 2008 | | 2007 | | 2006 | |
Stock options exercised under deferred compensation arrangements | | $ | - | | $ | 365 | | $ | 225 | |
Cash paid for interest | | $ | 2 | | $ | 154 | | $ | 306 | |
(14) SELECTED QUARTERLY INFORMATION (UNAUDITED)
(Amounts in thousands except per share data.)
| | | 1st Quarter | | 2nd Quarter | | 3rd Quarter | | 4th Quarter | |
2008 | | | | | | | | | |
| Revenues | | $ | 324 | | $ | 255 | | $ | 259 | | $ | 280 | |
| Operating loss from continuing operations | | | (8,240 | ) | | (6,697 | ) | | (6,400 | ) | | (7,519 | ) |
| Other income | | | 491 | | | 478 | | | 482 | | | 364 | |
| Impairment of long-lived assets | | | - | | | | | | - | | | 603 | |
| Loss from continuing operations | | | (7,749 | ) | | (6,219 | ) | | (5,918 | ) | | (7,155 | ) |
| Gain from sale of discontinued operations | | | - | | | - | | | 17,759 | | | 166 | |
| Income from discontinued operations | | | 206 | | | 4 | | | 17,570 | | | 165 | |
| Net income (loss) | | $ | (7,543 | ) | $ | (6,215 | ) | $ | 11,652 | | $ | (6,990 | ) |
| | | | | | | | | | | | | | |
| Basic and diluted loss per common share - Continuing Operations | | $ | (0.15 | ) | $ | (0.12 | ) | $ | (0.11 | ) | $ | (0.13 | ) |
| Basic and diluted loss per common share - Discontinued Operations | | $ | 0.01 | | $ | 0.00 | | $ | 0.33 | | $ | 0.00 | |
| | | | | | | | | | | | | | |
2007: | | | | | | | | | | | | | |
| Revenues | | $ | 20 | | $ | 68 | | $ | 65 | | $ | 116 | |
| Amortization of capitalized research and product development costs | | | (1,015 | ) | | (1,015 | ) | | (1,015 | ) | | - | |
| Impairment of capitalized research & development costs, equipment and prepaid expenses | | | - | | | - | | | (6,407 | ) | | - | |
| Operating loss from continuing operations | | | (10,983 | ) | | (10,875 | ) | | (16,499 | ) | | (9,193 | ) |
| Other income | | | 373 | | | 649 | | | 643 | | | 602 | |
| Loss from continuing operations | | | (10,610 | ) | | (10,226 | ) | | (15,856 | ) | | (8,591 | ) |
| Income (loss) from discontinued operations | | | 594 | | | (836 | ) | | 1,844 | | | (1,146 | ) |
| Net loss | | $ | (10,016 | ) | $ | (11,062 | ) | $ | (14,012 | ) | $ | (9,737 | ) |
| | | | | | | | | | | | | | |
| Basic and diluted loss per common share - Continuing Operations | | $ | (0.21 | ) | $ | (0.19 | ) | $ | (0.30 | ) | $ | (0.16 | ) |
| Basic and diluted loss per common share - Discontinued Operations | | $ | 0.01 | | $ | (0.02 | ) | $ | 0.03 | | $ | (0.02 | ) |
| | | | | | | | | | | | | | |
The quarterly financial information reported above reflects the reclassification of certain Research and Product Development costs during the second and third quarters of fiscal year 2008. The following table summarizes these reclassifications and their effects on the quarterly financial information.
| | | As reported | | Reclassification of R& D expenses | | As restated | |
2008 - 2nd Quarter | | | | | | | |
| Operating loss from continuing operations | | $ | (6,507 | ) | $ | (190 | ) | $ | (6,697 | ) |
| Loss from continuing operations | | | (6,029 | ) | | (190 | ) | | (6,219 | ) |
| Income (loss) from discontinued operations | | | (186 | ) | | 190 | | | 4 | |
| | | | | | | | | | | |
| Basic and diluted loss per common share - Continuing Operations | | $ | (0.11 | ) | $ | (0.01 | ) | $ | (0.12 | ) |
| Basic and diluted loss per common share - Discontinued Operations | | $ | (0.01 | ) | $ | 0.01 | | $ | 0.00 | |
| | | | | | | | | | | |
2008 - 3rd Quarter | | | | | | | | | | |
| Operating loss from continuing operations | | $ | (6,349 | ) | $ | (51 | ) | $ | (6,400 | ) |
| Loss from continuing operations | | | (5,867 | ) | | (51 | ) | | (5,918 | ) |
| Income from discontinued operations | | $ | 17,519 | | $ | 51 | | $ | 17,570 | |
(15) LONG-TERM DEBT
On March 23, 2005, we secured a $5 million term loan to provide financing for capital purchases including those for our vertical search product. The loan incurred interest at 7% per annum and was secured by a first lien on all corporate assets, excluding intellectual property. We retired the facility in the first quarter of fiscal year 2007. During the fiscal years ended January 31, 2007 and 2006 we recorded interest expense of approximately $0.2 million and $0.3 million, respectively.