UNITED STATES
SECURITIES AND EXCHANGE COMMISSION
Washington, D.C. 20549
FORM N-CSR
CERTIFIED SHAREHOLDER REPORT OF REGISTERED
MANAGEMENT INVESTMENT COMPANIES
Investment Company Act file number: 811-10183
MET INVESTORS SERIES TRUST
(Exact name of registrant as specified in charter)
5 Park Plaza, Suite 1900
Irvine, CA 92614
(Address of principal executive offices)(Zip code)
| | |
| (Name and Address of Agent for Service) | | Copy to: |
| |
Elizabeth M. Forget President Met Investors Series Trust 5 Park Plaza, Suite 1900
Irvine, CA 92614 | | Stacy H. Louizos, Esq.
David C. Mahaffey, Esq. Sullivan & Worcester LLP 1666 K Street, N.W. Washington, D.C. 20006 |
Registrant’s telephone number, including area code: (800) 848-3854
Date of fiscal year end: December 31
Date of reporting period: June 30, 2011
Explanatory Note:
Met Investors Series Trust (the “Registrant”) is filing this amendment to its Form N-CSR for the period ended June 30, 2011, originally filed with the Securities and Exchange Commission on September 6, 2011, to add to or revise certain information in the semiannual reports for each of AllianceBernstein Global Dynamic Allocation Portfolio, American Funds® Balanced Allocation Portfolio, AQR Global Risk Balanced Portfolio, BlackRock Global Tactical Strategies Portfolio, Legg Mason ClearBridge Aggressive Growth Portfolio, Met/Franklin Low Duration Total Return Portfolio, Met/Franklin Mutual Shares Portfolio, MetLife Balanced Plus Portfolio, PIMCO Inflation Protected Bond Portfolio, PIMCO Total Return Portfolio, T. Rowe Price Mid Cap Growth Portfolio and Third Avenue Small Cap Value Portfolio of the Registrant. This amendment does not modify in any way the semiannual reports for any other Portfolio of the Registrant.
| Item 1: | Report to Shareholders. |

Simplify your life…
with MetLife eDelivery® while helping MetLife preserve the planet’s natural resources.
(see details on inside cover)
| | |
Met Investors Series Trust AllianceBernstein Global Dynamic Allocation Portfolio Semiannual Report | | June 30, 2011, as amended December 16, 2011 |
MET INVESTORS SERIES TRUST
| | |
AllianceBernstein Global Dynamic Allocation Portfolio | | |
Managed By AllianceBernstein L.P.
Portfolio Manager Commentary*
Performance
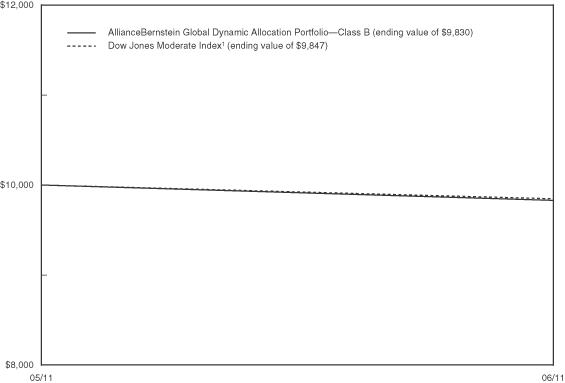
Since its May 2, 2011 inception, the Class B shares of the AllianceBernstein Global Dynamic Allocation Portfolio returned -1.70%, compared to the -1.53% return of its benchmark, the Dow Jones Moderate Index1.
Market Environment/Conditions
Since the inception of the Portfolio in May there have been renewed fears about the sustainability of economic growth. This follows two major shocks from early 2011. First, unrest in the Middle East and North Africa triggered a sharp rise in oil prices. Second, the effects of the earthquake in Japan caused significant disruptions in the global supply chain. These shocks were compounded by other ongoing uncertainties, which include rising default risk on Greek sovereign debt and the end of the US Federal Reserve’s second round of quantitative easing. Equities rallied toward the latter part of June on optimism around the European debt crisis as the Greek Prime Minister survived a confidence vote and the Greek Parliament passed a package of austerity measures.
Global equity markets (US equities, Developed Foreign, and Emerging Markets) were all negative for most of the period under review. In fixed income, both US Treasuries and global sovereigns (ex US) had positive returns and returns for the three month Treasury bill was flat for the period.
Portfolio Review/Current Positioning
The Portfolio underperformed the Dow Jones Global Moderate Index benchmark slightly since inception on May 2. Exposure to developed US and international equities detracted from performance due to renewed fears about the sustainability of economic growth. Global equity markets underperformed for most of the period under review. The allocation to bonds, both domestic and international, contributed positively to performance, while the interest rate swap also added to performance. Interest rates fell over the period, so both bond exposure and the interest rate swap exposure had positive impacts on performance. Contributions were 29 and 40 basis points (bps), respectively. Additionally, performance was also helped by the opportunistic allocation to REITs and currency exposures, which added approximately 20 bps.
The Portfolio’s equity holdings were at a near-neutral position. Volatility rose over the last couple of months of the period, but the rise was still fairly modest. While risks were elevated, strong corporate fundamentals continued to make equity valuations attractive, particularly compared to the low level of bond yields. In addition, we took steps to further diversify equity holdings by reducing positions in US equities and increasing positions in Developed International equities, Emerging Market equities, and Real Estate equities.
Daniel Loewy, CFA
Co-Chief Investment Officer and Research Director—Dynamic Asset Allocation
Seth Masters
Co-Chief Investment Officer—Dynamic Asset Allocation, Chief Investment Officer—Asset Allocation and Bernstein Global Wealth Management
AllianceBernstein L.P.
*This commentary may include statements that constitute “forward-looking statements” under the U.S. securities laws. Forward-looking statements include, among other things, projections, estimates, and information about possible or future results related to the Portfolio, market or regulatory developments. The views expressed above are not guarantees of future performance or economic results and involve certain risks, uncertainties and assumptions that could cause actual outcomes and results to differ materially from the views expressed herein. The views expressed above are subject to change at any time based upon economic, market, or other conditions and the subadvisory firm undertakes no obligation to update the views expressed herein. Any discussions of specific securities should not be considered a recommendation to buy or sell those securities. The views expressed above (including any forward-looking statement) may not be relied upon as investment advice or as an indication of the Portfolio’s trading intent. Information about the Portfolio’s holdings, asset allocation or country diversification is historical and is not an indication of future Portfolio composition, which may vary. Direct investment in any index is not possible. The performance of any index mentioned in this commentary has not been adjusted for ongoing management, distribution and operating expenses, and sales charges applicable to mutual fund investments. In addition, the returns do not reflect additional fees charged by separate accounts or variable insurance contracts that an investor in the Portfolio may pay. If these additional fees were reflected, performance would have been lower.
1
MET INVESTORS SERIES TRUST
| | |
AllianceBernstein Global Dynamic Allocation Portfolio | | |
Portfolio Composition as of June 30, 2011
Top Issuers
| | | | |
| | |
% of
Net Assets | |
U.S. Treasury Notes | | | 11.1 | |
U.S. Treasury Bonds | | | 3.9 | |
Vanguard MSCI Emerging Markets ETF | | | 3.7 | |
Midcap SPDR Trust Series I | | | 2.0 | |
iShares Russell 2000 Index Fund | | | 2.0 | |
Federal Home Loan Mortgage Corp. | | | 1.5 | |
Federal Home Loan Banks | | | 0.9 | |
Federal National Mortgage Association | | | 0.9 | |
Exxon Mobil Corp. | | | 0.3 | |
Nestle S.A. | | | 0.2 | |
Top Equity Sectors
| | | | |
| | | % of
Market Value of
Total Investments | |
Cash & Equivalents | | | 52.5 | |
Investment Company Securities | | | 7.8 | |
Non-Cyclical | | | 4.3 | |
Financials | | | 4.1 | |
Industrials | | | 2.5 | |
Fixed Income Sectors
| | | | |
| | | % of
Market Value of
Total Investments | |
U.S. Treasury & Government Agencies | | | 18.6 | |
2
MET INVESTORS SERIES TRUST
| | |
AllianceBernstein Global Dynamic Allocation Portfolio | | |
AllianceBernstein Global Dynamic Allocation Portfolio managed by
AllianceBernstein L.P. vs. Dow Jones Moderate Index1
| | | | |
| | | Cumulative Return2 (for the period ended June 30, 2011) | |
| | | Since
Inception3 | |
| AllianceBernstein Global Dynamic Allocation Portfolio—Class B | | | -1.70% | |
| Dow Jones Moderate Index1 | | | -1.53% | |
1The Dow Jones Moderate Index is a total returns index designed to provide asset allocation strategists with a target risk benchmark. Each month, the index adjusts its weightings of stocks, bonds, and cash indices (both domestic and foreign) from Barclays and Dow Jones such that the risk of that combination will have 60% of the risk of an all equity portfolio.
2“Cumulative Return” is calculated including reinvestment of all income dividends and capital gain distributions.
3 Inception of the Class B shares is 5/02/11. Index returns are based on an inception date of 5/02/11.
Past performance does not guarantee future results. The investment return and principal value of an investment in the Portfolio will fluctuate, so that shares, on any given day or when redeemed, may be worth more or less than their original cost. Performance numbers are net of all Portfolio expenses but do not include any insurance, sales, or administration charges of variable annuity or life insurance contracts. If these charges were included, the returns would be lower. The Index does not include fees or expenses and is not available for direct investment.
3
MET INVESTORS SERIES TRUST
| | |
AllianceBernstein Global Dynamic Allocation Portfolio | | |
Understanding Your Portfolio’s Expenses
Shareholder Expense Example
As a shareholder of the Portfolio, you incur ongoing costs, including management fees; distribution and service (12b-1) fees; and other Portfolio expenses. This example is intended to help you understand your ongoing costs (in dollars) (referred to as “expenses”) of investing in the Portfolio and compare these costs with the ongoing costs of investing in other mutual funds. The example is based on an investment of $1,000 invested at the beginning of the period and held for the entire period, May 2, 2011 through June 30, 2011.
Actual Expenses
The first line in the table below provides information about actual account values and actual expenses. You may use the information in this line, together with the amount you invested in the Portfolio, to estimate the expenses that you paid over the period. Simply divide your account value by $1,000 (for example, an $8,600 account value divided by $1,000 = 8.6), then multiply the result by the number in the first line under the heading entitled “Expenses Paid During Period” to estimate the expenses you paid on your account during this period.
Hypothetical Example for Comparison Purposes
The second line in the table below provides information about hypothetical account values and hypothetical expenses based on the Portfolio’s actual expense ratio and an assumed rate of return of 5% per year before expenses, which is not the Portfolio’s actual return. The hypothetical account values and expenses may not be used to estimate the actual ending account balance or expenses you paid for the period. You may use this information to compare the ongoing costs of investing in the Portfolio and other funds. To do so, compare this 5% hypothetical example with the 5% hypothetical examples that appear in the shareholder reports of the other funds.
Please note that the expenses shown in the table are meant to highlight your ongoing costs only and do not reflect any fees or charges of your variable insurance product or any additional expenses that participants in certain eligible qualified plans may bear relating to the operations of their plan. Therefore, the second line in the table is useful in comparing ongoing costs only, and will not help you determine the relative total costs of owning different funds. In addition, if these other costs were included, your costs would have been higher.
| | | | | | | | | | | | | | | | |
| | | Annualized
Expense
Ratio | | | Beginning
Account Value
May 2, 2011**
| | | Ending
Account Value
June 30, 2011 | | | Expenses Paid
During Period***
May 2, 2011
to June 30, 2011 | |
| | | | | | | | | | | | | | | | |
| | | | |
| | | | | | | | | | | | | | | | |
Class B(a)(b) | | | | | | | | | | | | | | | | |
Actual | | | 1.06% | | | $ | 1,000.00 | | | $ | 998.30 | | | $ | 1.77 | |
Hypothetical* | | | 1.06% | | | | 1,000.00 | | | | 1,006.58 | | | | 1.78 | |
| | | | | | | | | | | | | | | | |
* Hypothetical assumes a rate of return of 5% per year before expenses.
** Commencement of operations—May 2, 2011.
*** Expenses paid are equal to the Portfolio’s annualized expense ratio for the most recent two month period, as shown above, multiplied by the average account value over the period, multiplied by the number of days (60 days) in the most recent fiscal period, divided by 365 (to reflect the two month period).
(a) The annualized expense ratio shown reflects an expense limitation agreement between MetLife Advisers, LLC and the Portfolio as described in Note 3 of the Notes to Financial Statements.
(b) The annualized expense ratio reflects the impact of the management fee waiver as described in Note 3 to the Financial Statements.
4
MET INVESTORS SERIES TRUST
| | |
AllianceBernstein Global Dynamic Allocation Portfolio | | |
Schedule of Investments as of June 30, 2011 (Unaudited)
Common Stocks—20.7% of Net Assets
| | | | | | | | |
| Security Description | |
Shares | | | Value | |
| | | | | | | | |
|
| Aerospace & Defense—0.3% | |
BAE Systems plc | | | 13,628 | | | $ | 69,743 | |
Boeing Co. (The) | | | 1,995 | | | | 147,490 | |
Cobham plc | | | 4,615 | | | | 15,691 | |
Elbit Systems, Ltd. | | | 94 | | | | 4,455 | |
European Aeronautic Defence and Space Co. N.V. | | | 1,632 | | | | 54,705 | |
Finmeccanica S.p.A. | | | 1,618 | | | | 19,610 | |
General Dynamics Corp. | | | 1,000 | | | | 74,520 | |
Goodrich Corp. | | | 370 | | | | 35,335 | |
Honeywell International, Inc. | | | 2,120 | | | | 126,331 | |
ITT Corp. | | | 500 | | | | 29,465 | |
L-3 Communications Holdings, Inc. | | | 305 | | | | 26,672 | |
Lockheed Martin Corp. | | | 805 | | | | 65,181 | |
Northrop Grumman Corp. | | | 805 | | | | 55,827 | |
Precision Castparts Corp. | | | 425 | | | | 69,976 | |
Raytheon Co. | | | 995 | | | | 49,601 | |
Rockwell Collins, Inc. | | | 435 | | | | 26,835 | |
Rolls-Royce Holdings plc* | | | 7,483 | | | | 77,553 | |
Safran S.A. | | | 667 | | | | 28,529 | |
Singapore Technologies Engineering, Ltd. | | | 6,000 | | | | 14,713 | |
Textron, Inc. | | | 750 | | | | 17,708 | |
Thales S.A. | | | 398 | | | | 17,188 | |
United Technologies Corp. | | | 2,545 | | | | 225,258 | |
| | | | | | | | |
| | | | | | | 1,252,386 | |
| | | | | | | | |
|
| Air Freight & Logistics—0.1% | |
C.H. Robinson Worldwide, Inc. | | | 440 | | | | 34,690 | |
Deutsche Post AG | | | 3,383 | | | | 65,101 | |
Expeditors International of Washington, Inc. | | | 565 | | | | 28,922 | |
FedEx Corp. | | | 870 | | | | 82,520 | |
PostNL N.V. | | | 1,354 | | | | 11,508 | |
TNT Express N.V.* | | | 1,408 | | | | 14,625 | |
Toll Holdings, Ltd. | | | 2,683 | | | | 13,965 | |
United Parcel Service, Inc.—Class B | | | 2,680 | | | | 195,452 | |
Yamato Holdings Co., Ltd. | | | 1,600 | | | | 25,018 | |
| | | | | | | | |
| | | | | | | 471,801 | |
| | | | | | | | |
|
| Airlines—0.0% | |
Air France-KLM* | | | 540 | | | | 8,301 | |
All Nippon Airways Co., Ltd. | | | 3,000 | | | | 9,746 | |
Cathay Pacific Airways, Ltd. | | | 5,000 | | | | 11,553 | |
Deutsche Lufthansa AG | | | 915 | | | | 19,967 | |
International Consolidated Airlines Group S.A.* | | | 3,708 | | | | 15,074 | |
Qantas Airways, Ltd.* | | | 4,436 | | | | 8,759 | |
| | | | | | | | |
|
| Airlines—(Continued) | |
Ryanair Holdings plc, ADR | | | 300 | | | $ | 8,802 | |
Singapore Airlines, Ltd. | | | 2,000 | | | | 23,170 | |
Southwest Airlines Co. | | | 2,125 | | | | 24,268 | |
| | | | | | | | |
| | | | | | | 129,640 | |
| | | | | | | | |
|
| Auto Components—0.1% | |
Aisin Seiki Co., Ltd. | | | 800 | | | | 30,752 | |
Bridgestone Corp. | | | 2,600 | | | | 59,515 | |
Cie Generale des Etablissements Michelin—Class B | | | 706 | | | | 69,150 | |
Continental AG* | | | 320 | | | | 33,671 | |
Denso Corp. | | | 1,900 | | | | 70,256 | |
Goodyear Tire & Rubber Co. (The)* | | | 630 | | | | 10,565 | |
Johnson Controls, Inc. | | | 1,815 | | | | 75,613 | |
Koito Manufacturing Co., Ltd. | | | 1,000 | | | | 17,373 | |
NGK Spark Plug Co., Ltd. | | | 1,000 | | | | 13,727 | |
NHK Spring Co., Ltd. | | | 1,000 | | | | 10,156 | |
NOK Corp. | | | 400 | | | | 6,810 | |
Nokian Renkaat OYJ | | | 438 | | | | 22,010 | |
Pirelli & C S.p.A. | | | 951 | | | | 10,290 | |
Stanley Electric Co., Ltd. | | | 600 | | | | 10,453 | |
Sumitomo Rubber Industries, Ltd. | | | 700 | | | | 8,420 | |
Toyoda Gosei Co., Ltd. | | | 200 | | | | 4,516 | |
Toyota Boshoku Corp. | | | 300 | | | | 4,951 | |
Toyota Industries Corp. | | | 700 | | | | 22,959 | |
| | | | | | | | |
| | | | | | | 481,187 | |
| | | | | | | | |
|
| Automobiles—0.4% | |
Bayerische Motoren Werke (BMW) AG | | | 1,323 | | | | 132,216 | |
Daihatsu Motor Co., Ltd. | | | 1,000 | | | | 16,914 | |
Daimler AG | | | 3,620 | | | | 272,865 | |
Fiat S.p.A. | | | 3,056 | | | | 33,599 | |
Ford Motor Co.* | | | 10,335 | | | | 142,520 | |
Fuji Heavy Industries, Ltd. | | | 2,000 | | | | 15,426 | |
Harley-Davidson, Inc. | | | 625 | | | | 25,606 | |
Honda Motor Co., Ltd. | | | 6,500 | | | | 248,651 | |
Isuzu Motors, Ltd. | | | 5,000 | | | | 23,498 | |
Mazda Motor Corp.* | | | 6,000 | | | | 15,698 | |
Mitsubishi Motors Corp.* | | | 15,000 | | | | 18,228 | |
Nissan Motor Co., Ltd. | | | 9,900 | | | | 103,364 | |
Peugeot S.A. | | | 608 | | | | 27,259 | |
Renault S.A. | | | 768 | | | | 45,603 | |
Suzuki Motor Corp. | | | 1,300 | | | | 29,097 | |
Toyota Motor Corp. | | | 11,000 | | | | 450,121 | |
Volkswagen AG | | | 118 | | | | 21,713 | |
Yamaha Motor Co., Ltd.* | | | 1,100 | | | | 20,078 | |
| | | | | | | | |
| | | | | | | 1,642,456 | |
| | | | | | | | |
See accompanying notes to financial statements.
5
MET INVESTORS SERIES TRUST
| | |
AllianceBernstein Global Dynamic Allocation Portfolio | | |
Schedule of Investments as of June 30, 2011 (Unaudited)
Common Stocks—(Continued)
| | | | | | | | |
| Security Description | |
Shares | | | Value | |
| | | | | | | | |
|
| Beverages—0.5% | |
Anheuser-Busch InBev N.V. | | | 3,208 | | | $ | 186,366 | |
Asahi Group Holdings, Ltd. | | | 1,500 | | | | 30,039 | |
Brown-Forman Corp.—Class B | | | 305 | | | | 22,780 | |
Carlsberg A.S.—Class B | | | 428 | | | | 46,629 | |
Coca Cola Hellenic Bottling Co. S.A.* | | | 732 | | | | 19,689 | |
Coca-Cola Amatil, Ltd. | | | 2,266 | | | | 27,771 | |
Coca-Cola Co. (The) | | | 6,285 | | | | 422,918 | |
Coca-Cola Enterprises, Inc. | | | 880 | | | | 25,678 | |
Coca-Cola West Co., Ltd. | | | 200 | | | | 3,819 | |
Constellation Brands, Inc.—Class A* | | | 445 | | | | 9,265 | |
Diageo plc | | | 10,009 | | | | 204,730 | |
Dr Pepper Snapple Group, Inc. | | | 620 | | | | 25,996 | |
Foster’s Group, Ltd. | | | 7,736 | | | | 42,755 | |
Heineken Holding N.V. | | | 461 | | | | 23,621 | |
Heineken N.V. | | | 1,036 | | | | 62,397 | |
Kirin Holdings Co., Ltd. | | | 3,000 | | | | 41,627 | |
Molson Coors Brewing Co.—Class B | | | 435 | | | | 19,462 | |
PepsiCo, Inc. | | | 4,355 | | | | 306,723 | |
Pernod Ricard S.A. | | | 792 | | | | 78,183 | |
SABMiller plc | | | 3,805 | | | | 138,877 | |
| | | | | | | | |
| | | | | | | 1,739,325 | |
| | | | | | | | |
|
| Biotechnology—0.1% | |
Actelion, Ltd.* | | | 440 | | | | 21,656 | |
Amgen, Inc.* | | | 2,550 | | | | 148,792 | |
Biogen Idec, Inc.* | | | 680 | | | | 72,706 | |
Celgene Corp.* | | | 1,250 | | | | 75,400 | |
Cephalon, Inc.* | | | 190 | | | | 15,181 | |
CSL, Ltd. | | | 2,164 | | | | 76,775 | |
Gilead Sciences, Inc.* | | | 2,175 | | | | 90,067 | |
Grifols S.A.* | | | 553 | | | | 11,116 | |
| | | | | | | | |
| | | | | | | 511,693 | |
| | | | | | | | |
| | |
| Building Products—0.1% | | | | | | | | |
Asahi Glass Co., Ltd. | | | 4,000 | | | | 46,426 | |
Assa Abloy AB—Class B | | | 1,250 | | | | 33,717 | |
Cie de St-Gobain | | | 1,591 | | | | 103,184 | |
Daikin Industries, Ltd. | | | 900 | | | | 31,672 | |
Geberit AG* | | | 156 | | | | 36,935 | |
JS Group Corp. | | | 1,100 | | | | 28,208 | |
Masco Corp. | | | 945 | | | | 11,368 | |
Nippon Sheet Glass Co., Ltd. | | | 3,000 | | | | 9,263 | |
TOTO, Ltd. | | | 1,000 | | | | 7,725 | |
| | | | | | | | |
| | | | | | | 308,498 | |
| | | | | | | | |
| | |
| Capital Markets—0.5% | | | | | | | | |
3i Group plc | | | 3,880 | | | | 17,525 | |
| | | | | | | | |
| | |
| Capital Markets—(Continued) | | | | | | | | |
Ameriprise Financial, Inc. | | | 685 | | | $ | 39,511 | |
Bank of New York Mellon Corp. | | | 3,365 | | | | 86,211 | |
BlackRock, Inc. | | | 300 | | | | 57,543 | |
Charles Schwab Corp. (The) | | | 2,685 | | | | 44,168 | |
Credit Suisse Group AG* | | | 4,504 | | | | 175,053 | |
Daiwa Securities Group, Inc. | | | 7,000 | | | | 30,640 | |
Deutsche Bank AG | | | 3,715 | | | | 219,866 | |
E*Trade Financial Corp.* | | | 685 | | | | 9,453 | |
Federated Investors, Inc.—Class B | | | 250 | | | | 5,960 | |
Franklin Resources, Inc. | | | 427 | | | | 56,061 | |
GAM Holding AG* | | | 955 | | | | 15,664 | |
Goldman Sachs Group, Inc. (The) | | | 1,430 | | | | 190,319 | |
ICAP plc | | | 2,243 | | | | 17,047 | |
Invesco, Ltd. | | | 1,250 | | | | 29,250 | |
Investec plc | | | 1,932 | | | | 15,661 | |
Janus Capital Group, Inc. | | | 500 | | | | 4,720 | |
Julius Baer Group, Ltd.* | | | 826 | | | | 34,096 | |
Legg Mason, Inc. | | | 380 | | | | 12,449 | |
Macquarie Group, Ltd. | | | 1,386 | | | | 46,481 | |
Man Group plc | | | 7,511 | | | | 28,603 | |
Mizuho Securities Co., Ltd.* | | | 2,000 | | | | 4,786 | |
Morgan Stanley | | | 4,180 | | | | 96,182 | |
Nomura Holdings, Inc. | | | 14,100 | | | | 69,237 | |
Northern Trust Corp. | | | 680 | | | | 31,253 | |
Ratos AB—B Shares | | | 766 | | | | 14,767 | |
SBI Holdings, Inc. | | | 80 | | | | 7,371 | |
Schroders plc | | | 452 | | | | 11,235 | |
State Street Corp. | | | 1,370 | | | | 61,773 | |
T Rowe Price Group, Inc. | | | 690 | | | | 41,635 | |
UBS AG* | | | 14,546 | | | | 265,039 | |
| | | | | | | | |
| | | | | | | 1,739,559 | |
| | | | | | | | |
| | |
| Chemicals—0.6% | | | | | | | | |
Air Liquide S.A. | | | 1,136 | | | | 163,073 | |
Air Products & Chemicals, Inc. | | | 615 | | | | 58,782 | |
Air Water, Inc. | | | 1,000 | | | | 11,991 | |
Airgas, Inc. | | | 190 | | | | 13,308 | |
Akzo Nobel N.V. | | | 926 | | | | 58,502 | |
Arkema S.A. | | | 221 | | | | 22,786 | |
Asahi Kasei Corp. | | | 5,000 | | | | 33,480 | |
BASF SE | | | 3,671 | | | | 360,255 | |
CF Industries Holdings, Inc. | | | 190 | | | | 26,917 | |
Daicel Chemical Industries, Ltd. | | | 1,000 | | | | 6,572 | |
Denki Kagaku Kogyo KK | | | 2,000 | | | | 9,573 | |
Dow Chemical Co. (The) | | | 3,180 | | | | 114,480 | |
E.I. du Pont de Nemours & Co. | | | 2,495 | | | | 134,855 | |
See accompanying notes to financial statements.
6
MET INVESTORS SERIES TRUST
| | |
AllianceBernstein Global Dynamic Allocation Portfolio | | |
Schedule of Investments as of June 30, 2011 (Unaudited)
Common Stocks—(Continued)
| | | | | | | | |
| Security Description | |
Shares | | | Value | |
| | | | | | | | |
| | |
| Chemicals—(Continued) | | | | | | | | |
Eastman Chemical Co. | | | 190 | | | $ | 19,393 | |
Ecolab, Inc. | | | 625 | | | | 35,237 | |
FMC Corp. | | | 190 | | | | 16,344 | |
Givaudan S.A.* | | | 33 | | | | 34,888 | |
Hitachi Chemical Co., Ltd. | | | 400 | | | | 7,891 | |
Incitec Pivot, Ltd. | | | 6,510 | | | | 26,967 | |
International Flavors & Fragrances, Inc. | | | 245 | | | | 15,739 | |
Israel Chemicals, Ltd. | | | 1,776 | | | | 28,199 | |
Israel Corp., Ltd. (The) | | | 9 | | | | 9,791 | |
Johnson Matthey plc | | | 858 | | | | 27,104 | |
JSR Corp. | | | 700 | | | | 13,471 | |
K+S AG | | | 688 | | | | 52,958 | |
Kaneka Corp. | | | 1,000 | | | | 6,535 | |
Kansai Paint Co., Ltd. | | | 1,000 | | | | 9,064 | |
Koninklijke DSM N.V. | | | 616 | | | | 40,040 | |
Kuraray Co., Ltd. | | | 1,500 | | | | 21,855 | |
Lanxess AG | | | 333 | | | | 27,374 | |
Linde AG | | | 676 | | | | 118,698 | |
Makhteshim-Agan Industries, Ltd.* | | | 918 | | | | 5,128 | |
Mitsubishi Chemical Holdings Corp. | | | 5,500 | | | | 38,738 | |
Mitsubishi Gas Chemical Co., Inc. | | | 1,000 | | | | 7,279 | |
Mitsui Chemicals, Inc. | | | 3,000 | | | | 10,862 | |
Monsanto Co. | | | 1,490 | | | | 108,085 | |
Nitto Denko Corp. | | | 600 | | | | 30,244 | |
Novozymes A.S.—B Shares | | | 185 | | | | 30,152 | |
Orica, Ltd. | | | 1,452 | | | | 41,978 | |
PPG Industries, Inc. | | | 435 | | | | 39,494 | |
Praxair, Inc. | | | 815 | | | | 88,338 | |
Sherwin-Williams Co. (The) | | | 250 | | | | 20,967 | |
Shin-Etsu Chemical Co., Ltd. | | | 1,600 | | | | 85,213 | |
Showa Denko KK | | | 6,000 | | | | 12,350 | |
Sigma-Aldrich Corp. | | | 315 | | | | 23,115 | |
Sika AG | | | 8 | | | | 19,274 | |
Solvay S.A. | | | 237 | | | | 36,675 | |
Sumitomo Chemical Co., Ltd. | | | 6,000 | | | | 29,760 | |
Syngenta AG* | | | 378 | | | | 127,505 | |
Taiyo Nippon Sanso Corp. | | | 1,000 | | | | 7,924 | |
Teijin, Ltd. | | | 4,000 | | | | 17,509 | |
Toray Industries, Inc. | | | 6,000 | | | | 44,045 | |
Tosoh Corp. | | | 2,000 | | | | 7,986 | |
Ube Industries, Ltd. | | | 4,000 | | | | 11,954 | |
Umicore S.A. | | | 456 | | | | 24,908 | |
Wacker Chemie AG | | | 63 | | | | 13,642 | |
Yara International ASA | | | 758 | | | | 42,827 | |
| | | | | | | | |
| | | | | | | 2,452,074 | |
| | | | | | | | |
| | | | | | | | |
| | |
| Commercial Banks—1.7% | | | | | | | | |
Alpha Bank AE* | | | 2,029 | | | $ | 10,225 | |
Aozora Bank, Ltd. | | | 2,000 | | | | 4,613 | |
Australia & New Zealand Banking Group, Ltd. | | | 10,377 | | | | 244,994 | |
Banca Carige S.p.A. | | | 2,584 | | | | 5,866 | |
Banca Monte dei Paschi di Siena S.p.A. | | | 9,975 | | | | 7,569 | |
Banco Bilbao Vizcaya Argentaria S.A. | | | 17,053 | | | | 200,364 | |
Banco Comercial Portugues S.A.* | | | 12,964 | | | | 7,720 | |
Banco de Sabadell S.A. | | | 4,445 | | | | 18,399 | |
Banco Espirito Santo S.A. | | | 2,098 | | | | 7,831 | |
Banco Popolare SC | | | 7,049 | | | | 16,267 | |
Banco Popular Espanol S.A. | | | 3,848 | | | | 21,689 | |
Banco Santander S.A. | | | 33,736 | | | | 390,159 | |
Bank Hapoalim BM | | | 4,239 | | | | 21,089 | |
Bank Leumi Le-Israel BM | | | 4,712 | | | | 22,168 | |
Bank of Cyprus plc | | | 3,398 | | | | 10,018 | |
Bank of East Asia, Ltd. | | | 6,200 | | | | 25,536 | |
Bank of Kyoto, Ltd. (The) | | | 1,000 | | | | 9,164 | |
Bank of Yokohama, Ltd. (The) | | | 5,000 | | | | 24,862 | |
Bankinter S.A. | | | 851 | | | | 5,788 | |
Barclays plc | | | 46,262 | | | | 190,629 | |
BB&T Corp. | | | 1,875 | | | | 50,325 | |
Bendigo and Adelaide Bank, Ltd. | | | 1,458 | | | | 13,863 | |
BNP Paribas S.A. | | | 3,833 | | | | 296,324 | |
BOC Hong Kong Holdings, Ltd. | | | 15,000 | | | | 43,468 | |
Chiba Bank, Ltd. (The) | | | 3,000 | | | | 18,674 | |
Chugoku Bank, Ltd. (The) | | | 1,000 | | | | 12,313 | |
Comerica, Inc. | | | 445 | | | | 15,384 | |
Commerzbank AG* | | | 14,303 | | | | 61,675 | |
Commonwealth Bank of Australia | | | 6,191 | | | | 347,474 | |
Credit Agricole S.A. | | | 3,840 | | | | 57,834 | |
Danske Bank A.S.* | | | 2,607 | | | | 48,353 | |
DBS Group Holdings, Ltd. | | | 7,000 | | | | 83,604 | |
Dexia S.A.* | | | 2,337 | | | | 7,287 | |
DnB NOR ASA | | | 3,906 | | | | 54,646 | |
EFG Eurobank Ergasias S.A.* | | | 1,292 | | | | 6,061 | |
Erste Group Bank AG | | | 756 | | | | 39,692 | |
Fifth Third Bancorp. | | | 2,495 | | | | 31,811 | |
First Horizon National Corp. | | | 690 | | | | 6,583 | |
Fukuoka Financial Group, Inc. | | | 3,000 | | | | 12,462 | |
Gunma Bank, Ltd. (The) | | | 1,000 | | | | 5,258 | |
Hachijuni Bank, Ltd. (The) | | | 2,000 | | | | 11,185 | |
Hang Seng Bank, Ltd. | | | 3,100 | | | | 49,518 | |
Hiroshima Bank, Ltd. (The) | | | 2,000 | | | | 8,680 | |
Hokuhoku Financial Group, Inc. | | | 5,000 | | | | 9,858 | |
See accompanying notes to financial statements.
7
MET INVESTORS SERIES TRUST
| | |
AllianceBernstein Global Dynamic Allocation Portfolio | | |
Schedule of Investments as of June 30, 2011 (Unaudited)
Common Stocks—(Continued)
| | | | | | | | |
| Security Description | |
Shares | | | Value | |
| | | | | | | | |
|
| Commercial Banks—(Continued) | |
HSBC Holdings plc | | | 70,774 | | | $ | 703,242 | |
Huntington Bancshares, Inc. | | | 2,315 | | | | 15,186 | |
Intesa Sanpaolo S.p.A. | | | 40,273 | | | | 107,388 | |
Intesa Sanpaolo S.p.A.—RSP | | | 3,727 | | | | 8,060 | |
Israel Discount Bank, Ltd.—Class A* | | | 3,160 | | | | 6,207 | |
Iyo Bank, Ltd. (The) | | | 1,000 | | | | 9,164 | |
Joyo Bank, Ltd. (The) | | | 2,000 | | | | 8,358 | |
KBC Grope N.V. | | | 644 | | | | 25,347 | |
KeyCorp. | | | 2,560 | | | | 21,325 | |
Lloyds TSB Group plc* | | | 163,256 | | | | 128,537 | |
M&T Bank Corp. | | | 365 | | | | 32,102 | |
Marshall & Ilsley Corp. | | | 1,435 | | | | 11,437 | |
Mitsubishi UFJ Financial Group, Inc. | | | 50,900 | | | | 246,153 | |
Mizrahi Tefahot Bank, Ltd. | | | 492 | | | | 5,209 | |
Mizuho Financial Group, Inc. | | | 82,000 | | | | 134,218 | |
Mizuho Trust & Banking Co., Ltd. | | | 6,000 | | | | 5,282 | |
National Australia Bank, Ltd. | | | 8,672 | | | | 238,429 | |
National Bank of Greece S.A.* | | | 3,821 | | | | 27,359 | |
Natixis | | | 3,487 | | | | 17,523 | |
Nishi-Nippon City Bank, Ltd. (The) | | | 3,000 | | | | 8,816 | |
Nordea Bank AB | | | 10,503 | | | | 113,322 | |
Oversea-Chinese Banking Corp., Ltd. | | | 10,000 | | | | 76,256 | |
PNC Financial Services Group, Inc. | | | 1,435 | | | | 85,540 | |
Raiffeisen Bank International AG | | | 195 | | | | 10,064 | |
Regions Financial Corp. | | | 3,425 | | | | 21,235 | |
Resona Holdings, Inc. | | | 7,500 | | | | 35,154 | |
Royal Bank of Scotland Group plc* | | | 70,159 | | | | 43,356 | |
Seven Bank, Ltd. | | | 2 | | | | 3,985 | |
Shinsei Bank, Ltd. | | | 5,000 | | | | 4,960 | |
Shizuoka Bank, Ltd. (The) | | | 2,000 | | | | 18,302 | |
Skandinaviska Enskilda Banken AB—Class A | | | 5,638 | | | | 46,249 | |
Societe Generale S.A. | | | 2,536 | | | | 150,715 | |
Standard Chartered plc | | | 9,386 | | | | 247,034 | |
Sumitomo Mitsui Financial Group, Inc. | | | 5,400 | | | | 165,258 | |
Sumitomo Mitsui Trust Holdings, Inc. | | | 12,000 | | | | 41,515 | |
SunTrust Banks, Inc. | | | 1,440 | | | | 37,152 | |
Suruga Bank, Ltd. | | | 1,000 | | | | 8,668 | |
Svenska Handelsbanken AB—A Shares | | | 1,956 | | | | 60,550 | |
Swedbank AB—A Shares | | | 3,235 | | | | 54,563 | |
U.S. Bancorp. | | | 5,235 | | | | 133,545 | |
UniCredit S.p.A. | | | 53,925 | | | | 114,344 | |
Unione di Banche Italiane SCPA | | | 3,175 | | | | 17,901 | |
United Overseas Bank, Ltd. | | | 5,000 | | | | 80,166 | |
| | | | | | | | |
|
| Commercial Banks—(Continued) | |
Wells Fargo & Co. | | | 14,380 | | | $ | 403,503 | |
Westpac Banking Corp. | | | 12,026 | | | | 287,281 | |
Wing Hang Bank, Ltd. | | | 500 | | | | 5,478 | |
Yamaguchi Financial Group, Inc. | | | 1,000 | | | | 9,288 | |
Zions Bancorporation | | | 500 | | | | 12,005 | |
| | | | | | | | |
| | | | | | | 6,584,013 | |
| | | | | | | | |
|
| Commercial Services & Supplies—0.1% | |
Aggreko plc* | | | 1,097 | | | | 34,002 | |
Avery Dennison Corp. | | | 260 | | | | 10,044 | |
Babcock International Group plc | | | 1,434 | | | | 16,406 | |
Brambles, Ltd. | | | 5,798 | | | | 44,924 | |
Cintas Corp. | | | 320 | | | | 10,570 | |
Dai Nippon Printing Co., Ltd. | | | 2,000 | | | | 22,394 | |
Edenred | | | 632 | | | | 19,312 | |
G4S plc | | | 5,638 | | | | 25,347 | |
Iron Mountain, Inc. | | | 510 | | | | 17,386 | |
Pitney Bowes, Inc. | | | 510 | | | | 11,725 | |
Republic Services, Inc. | | | 815 | | | | 25,143 | |
RR Donnelley & Sons Co. | | | 510 | | | | 10,001 | |
Secom Co., Ltd. | | | 800 | | | | 38,142 | |
Securitas AB—B Shares | | | 1,252 | | | | 13,300 | |
Serco Group plc | | | 1,972 | | | | 17,507 | |
Societe BIC S.A. | | | 115 | | | | 11,130 | |
Stericycle, Inc.* | | | 245 | | | | 21,834 | |
Suez Environnement Co. | | | 1,077 | | | | 21,515 | |
Toppan Printing Co., Ltd. | | | 2,000 | | | | 15,426 | |
Waste Management, Inc. | | | 1,305 | | | | 48,637 | |
| | | | | | | | |
| | | | | | | 434,745 | |
| | | | | | | | |
|
| Communications Equipment—0.3% | |
Alcatel-Lucent* | | | 9,266 | | | | 53,669 | |
Cisco Systems, Inc. | | | 15,070 | | | | 235,243 | |
F5 Networks, Inc.* | | | 245 | | | | 27,011 | |
Harris Corp. | | | 320 | | | | 14,419 | |
JDS Uniphase Corp.* | | | 570 | | | | 9,496 | |
Juniper Networks, Inc.* | | | 1,440 | | | | 45,360 | |
Motorola Mobility Holdings, Inc.* | | | 760 | | | | 16,750 | |
Motorola Solutions, Inc.* | | | 930 | | | | 42,817 | |
Nokia OYJ | | | 14,969 | | | | 97,179 | |
QUALCOMM, Inc. | | | 4,485 | | | | 254,703 | |
Telefonaktiebolaget LM Ericsson—B Shares | | | 12,037 | | | | 174,182 | |
Tellabs, Inc. | | | 945 | | | | 4,357 | |
| | | | | | | | |
| | | | | | | 975,186 | |
| | | | | | | | |
See accompanying notes to financial statements.
8
MET INVESTORS SERIES TRUST
| | |
AllianceBernstein Global Dynamic Allocation Portfolio | | |
Schedule of Investments as of June 30, 2011 (Unaudited)
Common Stocks—(Continued)
| | | | | | | | |
| Security Description | |
Shares | | | Value | |
| | | | | | | | |
|
| Computers & Peripherals—0.4% | |
Apple, Inc.* | | | 2,545 | | | $ | 854,280 | |
Dell, Inc.* | | | 4,555 | | | | 75,932 | |
EMC Corp.* | | | 5,610 | | | | 154,555 | |
Fujitsu, Ltd. | | | 7,000 | | | | 39,754 | |
Hewlett-Packard Co. | | | 5,920 | | | | 215,488 | |
Lexmark International, Inc.—Class A* | | | 190 | | | | 5,559 | |
NEC Corp.* | | | 10,000 | | | | 22,692 | |
NetApp, Inc.* | | | 1,000 | | | | 52,780 | |
SanDisk Corp.* | | | 625 | | | | 25,938 | |
Seiko Epson Corp. | | | 500 | | | | 8,606 | |
Toshiba Corp. | | | 16,000 | | | | 83,725 | |
Western Digital Corp.* | | | 625 | | | | 22,738 | |
| | | | | | | | |
| | | | | | | 1,562,047 | |
| | | | | | | | |
|
| Construction & Engineering—0.1% | |
ACS Actividades de Construccion y Servicios S.A. | | | 566 | | | | 26,732 | |
Balfour Beatty plc | | | 2,744 | | | | 13,602 | |
Bouygues S.A. | | | 950 | | | | 41,826 | |
Chiyoda Corp. | | | 1,000 | | | | 11,445 | |
Eiffage S.A. | | | 162 | | | | 10,736 | |
Ferrovial S.A. | | | 1,466 | | | | 18,558 | |
Fluor Corp. | | | 495 | | | | 32,007 | |
Fomento de Construcciones y Contratas S.A. | | | 203 | | | | 6,199 | |
Hochtief AG | | | 169 | | | | 14,138 | |
Jacobs Engineering Group, Inc.* | | | 320 | | | | 13,840 | |
JGC Corp. | | | 1,000 | | | | 27,218 | |
Kajima Corp. | | | 3,000 | | | | 8,556 | |
Kinden Corp. | | | 1,000 | | | | 8,519 | |
Koninklijke Boskalis Westminster N.V. | | | 283 | | | | 13,401 | |
Leighton Holdings, Ltd. | | | 604 | | | | 13,515 | |
Obayashi Corp. | | | 2,000 | | | | 8,680 | |
Quanta Services, Inc.* | | | 565 | | | | 11,413 | |
Shimizu Corp. | | | 2,000 | | | | 8,283 | |
Skanska AB—B Shares | | | 1,598 | | | | 28,702 | |
Taisei Corp. | | | 4,000 | | | | 9,126 | |
Vinci S.A. | | | 1,777 | | | | 113,995 | |
| | | | | | | | |
| | | | | | | 440,491 | |
| | | | | | | | |
|
| Construction Materials—0.1% | |
Boral, Ltd. | | | 2,896 | | | | 13,674 | |
Cimpor Cimentos de Portugal SGPS S.A. | | | 806 | | | | 6,168 | |
CRH plc | | | 2,835 | | | | 63,141 | |
Fletcher Building, Ltd. | | | 2,712 | | | | 19,365 | |
| | | | | | | | |
|
| Construction Materials—(Continued) | |
HeidelbergCement AG | | | 562 | | | $ | 35,934 | |
Holcim, Ltd.* | | | 981 | | | | 73,982 | |
Imerys S.A. | | | 136 | | | | 9,598 | |
James Hardie Industries SE* | | | 1,744 | | | | 10,967 | |
Lafarge S.A. | | | 801 | | | | 51,123 | |
Vulcan Materials Co. | | | 320 | | | | 12,330 | |
| | | | | | | | |
| | | | | | | 296,282 | |
| | | | | | | | |
|
| Consumer Finance—0.1% | |
Aeon Credit Service Co., Ltd. | | | 300 | | | | 4,085 | |
American Express Co. | | | 2,860 | | | | 147,862 | |
Capital One Financial Corp. | | | 1,245 | | | | 64,329 | |
Credit Saison Co., Ltd. | | | 600 | | | | 10,022 | |
Discover Financial Services | | | 1,445 | | | | 38,654 | |
SLM Corp. | | | 1,435 | | | | 24,122 | |
| | | | | | | | |
| | | | | | | 289,074 | |
| | | | | | | | |
|
| Containers & Packaging—0.0% | |
Amcor, Ltd. | | | 4,898 | | | | 37,845 | |
Ball Corp. | | | 440 | | | | 16,922 | |
Bemis Co., Inc. | | | 260 | | | | 8,783 | |
Owens-Illinois, Inc.* | | | 440 | | | | 11,356 | |
Rexam plc | | | 3,505 | | | | 21,559 | |
Sealed Air Corp. | | | 435 | | | | 10,349 | |
Toyo Seikan Kaisha, Ltd. | | | 600 | | | | 10,022 | |
| | | | | | | | |
| | | | | | | 116,836 | |
| | | | | | | | |
|
| Distributors—0.0% | |
Genuine Parts Co. | | | 415 | | | | 22,576 | |
Jardine Cycle & Carriage, Ltd. | | | 1,000 | | | | 35,032 | |
Li & Fung, Ltd. | | | 22,000 | | | | 43,821 | |
| | | | | | | | |
| | | | | | | 101,429 | |
| | | | | | | | |
|
| Diversified Consumer Services—0.0% | |
Apollo Group, Inc.—Class A* | | | 315 | | | | 13,759 | |
Benesse Holdings, Inc. | | | 300 | | | | 12,853 | |
DeVry, Inc. | | | 185 | | | | 10,939 | |
H&R Block, Inc. | | | 815 | | | | 13,072 | |
| | | | | | | | |
| | | | | | | 50,623 | |
| | | | | | | | |
|
| Diversified Financial Services—0.5% | |
ASX, Ltd. | | | 700 | | | | 22,874 | |
Bank of America Corp. | | | 27,640 | | | | 302,934 | |
CaixaBank | | | 3,360 | | | | 23,487 | |
Citigroup, Inc. | | | 7,910 | | | | 329,372 | |
CME Group, Inc. | | | 185 | | | | 53,944 | |
Deutsche Boerse AG | | | 779 | | | | 59,284 | |
See accompanying notes to financial statements.
9
MET INVESTORS SERIES TRUST
| | |
AllianceBernstein Global Dynamic Allocation Portfolio | | |
Schedule of Investments as of June 30, 2011 (Unaudited)
Common Stocks—(Continued)
| | | | | | | | |
| Security Description | |
Shares | | | Value | |
| | | | | | | | |
|
| Diversified Financial Services—(Continued) | |
Eurazeo | | | 122 | | | $ | 8,927 | |
Exor S.p.A. | | | 256 | | | | 8,012 | |
Groupe Bruxelles Lambert S.A. | | | 322 | | | | 28,681 | |
Hong Kong Exchanges and Clearing, Ltd. | | | 4,100 | | | | 85,988 | |
Industrivarden AB—C Shares | | | 471 | | | | 7,825 | |
ING Groep N.V.* | | | 15,309 | | | | 188,745 | |
IntercontinentalExchange, Inc.* | | | 190 | | | | 23,695 | |
Investor AB—B Shares | | | 1,821 | | | | 41,896 | |
JPMorgan Chase & Co. | | | 10,890 | | | | 445,837 | |
Kinnevik Investment AB—Class B | | | 822 | | | | 18,325 | |
Leucadia National Corp. | | | 505 | | | | 17,221 | |
London Stock Exchange Group plc | | | 596 | | | | 10,161 | |
Mitsubishi UFJ Lease & Finance Co., Ltd. | | | 230 | | | | 8,841 | |
Moody’s Corp. | | | 555 | | | | 21,284 | |
NASDAQ OMX Group, Inc. (The)* | | | 380 | | | | 9,614 | |
NYSE Euronext | | | 690 | | | | 23,646 | |
ORIX Corp. | | | 420 | | | | 40,570 | |
Pargesa Holding S.A. | | | 210 | | | | 19,444 | |
Pohjola Bank plc—A Shares | | | 552 | | | | 7,151 | |
Singapore Exchange, Ltd. | | | 3,000 | | | | 18,404 | |
| | | | | | | | |
| | | | | | | 1,826,162 | |
| | | | | | | | |
|
| Diversified Telecommunication Services—0.7% | |
AT&T, Inc. | | | 16,125 | | | | 506,486 | |
Belgacom S.A. | | | 608 | | | | 21,718 | |
Bezeq The Israeli Telecommunication Corp., Ltd. | | | 6,971 | | | | 17,574 | |
BT Group plc | | | 31,027 | | | | 100,456 | |
CenturyLink, Inc. | | | 1,620 | | | | 65,497 | |
Deutsche Telekom AG | | | 11,227 | | | | 176,344 | |
Elisa OYJ | | | 565 | | | | 12,186 | |
France Telecom S.A. | | | 7,411 | | | | 157,845 | |
Frontier Communications Corp. | | | 2,685 | | | | 21,668 | |
Hellenic Telecommunications Organization S.A. | | | 979 | | | | 9,142 | |
Iliad S.A. | | | 76 | | | | 10,213 | |
Inmarsat plc | | | 1,841 | | | | 16,447 | |
Koninklijke KPN N.V. | | | 6,286 | | | | 91,569 | |
Nippon Telegraph & Telephone Corp. | | | 1,900 | | | | 91,060 | |
PCCW, Ltd. | | | 16,000 | | | | 6,909 | |
Portugal Telecom SGPS S.A. | | | 2,687 | | | | 26,681 | |
Singapore Telecommunications, Ltd. | | | 32,000 | | | | 82,121 | |
Swisscom AG | | | 93 | | | | 42,612 | |
TDC A.S.* | | | 1,484 | | | | 13,564 | |
Tele2 AB—B Shares | | | 1,267 | | | | 25,129 | |
| | | | | | | | |
|
| Diversified Telecommunication Services—(Continued) | |
Telecom Corp. of New Zealand, Ltd. | | | 7,693 | | | $ | 15,644 | |
Telecom Italia S.p.A. | | | 37,514 | | | | 52,277 | |
Telecom Italia S.p.A.—RSP | | | 24,086 | | | | 28,073 | |
Telefonica S.A. | | | 16,418 | | | | 402,021 | |
Telekom Austria AG | | | 1,328 | | | | 16,973 | |
Telenor ASA | | | 2,982 | | | | 49,014 | |
TeliaSonera AB | | | 8,654 | | | | 63,713 | |
Telstra Corp., Ltd. | | | 17,407 | | | | 53,986 | |
Verizon Communications, Inc. | | | 7,720 | | | | 287,416 | |
Windstream Corp. | | | 1,370 | | | | 17,755 | |
| | | | | | | | |
| | | | | | | 2,482,093 | |
| | | | | | | | |
|
| Electric Utilities—0.5% | |
Acciona S.A. | | | 102 | | | | 10,842 | |
American Electric Power Co., Inc. | | | 1,310 | | | | 49,361 | |
Cheung Kong Infrastructure Holdings, Ltd. | | | 2,000 | | | | 10,358 | |
Chubu Electric Power Co., Inc. | | | 2,700 | | | | 52,564 | |
Chugoku Electric Power Co., Inc. (The) | | | 1,200 | | | | 20,713 | |
CLP Holdings, Ltd. | | | 7,500 | | | | 66,503 | |
Contact Energy, Ltd.* | | | 1,395 | | | | 6,194 | |
Duke Energy Corp. | | | 3,615 | | | | 68,070 | |
E.On AG | | | 7,198 | | | | 204,742 | |
EDF S.A. | | | 961 | | | | 37,831 | |
Edison International | | | 875 | | | | 33,906 | |
EDP—Energias de Portugal S.A. | | | 7,628 | | | | 27,131 | |
Enel S.p.A. | | | 26,310 | | | | 172,104 | |
Entergy Corp. | | | 495 | | | | 33,799 | |
Exelon Corp. | | | 1,805 | | | | 77,326 | |
FirstEnergy Corp. | | | 1,125 | | | | 49,669 | |
Fortum OYJ | | | 1,775 | | | | 51,481 | |
Hokkaido Electric Power Co., Inc. | | | 700 | | | | 11,605 | |
Hokuriku Electric Power Co. | | | 700 | | | | 13,315 | |
Iberdrola S.A. | | | 15,126 | | | | 134,819 | |
Kansai Electric Power Co., Inc. (The) | | | 3,000 | | | | 59,520 | |
Kyushu Electric Power Co., Inc. | | | 1,600 | | | | 28,709 | |
NextEra Energy, Inc. | | | 1,175 | | | | 67,515 | |
Northeast Utilities | | | 445 | | | | 15,651 | |
Pepco Holdings, Inc. | | | 570 | | | | 11,189 | |
Pinnacle West Capital Corp. | | | 310 | | | | 13,820 | |
Power Assets Holdings, Ltd. | | | 5,500 | | | | 41,454 | |
PPL Corp. | | | 1,505 | | | | 41,884 | |
Progress Energy, Inc. | | | 810 | | | | 38,888 | |
Public Power Corp. S.A. | | | 464 | | | | 6,658 | |
Red Electrica Corp. S.A. | | | 432 | | | | 26,116 | |
Scottish & Southern Energy plc | | | 3,724 | | | | 83,353 | |
See accompanying notes to financial statements.
10
MET INVESTORS SERIES TRUST
| | |
AllianceBernstein Global Dynamic Allocation Portfolio | | |
Schedule of Investments as of June 30, 2011 (Unaudited)
Common Stocks—(Continued)
| | | | | | | | |
| Security Description | |
Shares | | | Value | |
| | | | | | | | |
|
| Electric Utilities—(Continued) | |
Shikoku Electric Power Co., Inc | | | 700 | | | $ | 15,841 | |
Southern Co. | | | 2,305 | | | | 93,076 | |
SP AusNet | | | 5,586 | | | | 5,665 | |
Terna Rete Elettrica Nazionale S.p.A. | | | 4,807 | | | | 22,382 | |
Tohoku Electric Power Co., Inc | | | 1,800 | | | | 25,914 | |
Tokyo Electric Power Co., Inc (The) | | | 5,800 | | | | 23,446 | |
Verbund AG | | | 272 | | | | 11,851 | |
| | | | | | | | |
| | | | | | | 1,765,265 | |
| | | | | | | | |
|
| Electrical Equipment—0.2% | |
ABB, Ltd.* | | | 8,762 | | | | 227,030 | |
Alstom S.A. | | | 823 | | | | 50,824 | |
Bekaert S.A. | | | 155 | | | | 11,819 | |
Emerson Electric Co. | | | 2,055 | | | | 115,594 | |
Fuji Electric Co., Ltd. | | | 2,000 | | | | 6,200 | |
Furukawa Electric Co., Ltd. | | | 2,000 | | | | 8,283 | |
GS Yuasa Corp. | | | 1,000 | | | | 6,634 | |
Legrand S.A. | | | 789 | | | | 33,283 | |
Mabuchi Motor Co., Ltd. | | | 100 | | | | 5,022 | |
Mitsubishi Electric Corp. | | | 8,000 | | | | 92,256 | |
Nidec Corp. | | | 400 | | | | 36,902 | |
Prysmian S.p.A. | | | 815 | | | | 16,417 | |
Rockwell Automation, Inc. | | | 375 | | | | 32,535 | |
Roper Industries, Inc. | | | 250 | | | | 20,825 | |
Schneider Electric S.A. | | | 978 | | | | 163,630 | |
Sumitomo Electric Industries, Ltd. | | | 3,000 | | | | 43,412 | |
Ushio, Inc. | | | 400 | | | | 7,852 | |
Vestas Wind Systems A.S.* | | | 814 | | | | 18,941 | |
| | | | | | | | |
| | | | | | | 897,459 | |
| | | | | | | | |
|
| Electronic Equipment, Instruments & Components—0.2% | |
Amphenol Corp.—Class A | | | 495 | | | | 26,725 | |
Citizen Holdings Co., Ltd. | | | 1,000 | | | | 5,939 | |
Corning, Inc. | | | 4,240 | | | | 76,956 | |
FLIR Systems, Inc. | | | 435 | | | | 14,664 | |
Foxconn International Holdings, Ltd.* | | | 9,000 | | | | 3,967 | |
FUJIFILM Holdings Corp. | | | 1,800 | | | | 55,778 | |
Hamamatsu Photonics KK | | | 300 | | | | 12,890 | |
Hirose Electric Co., Ltd. | | | 100 | | | | 10,193 | |
Hitachi High-Technologies Corp. | | | 200 | | | | 4,355 | |
Hitachi, Ltd. | | | 18,000 | | | | 105,574 | |
Hoya Corp. | | | 1,700 | | | | 37,396 | |
Ibiden Co., Ltd. | | | 500 | | | | 15,531 | |
Jabil Circuit, Inc. | | | 505 | | | | 10,201 | |
Keyence Corp. | | | 200 | | | | 56,395 | |
Kyocera Corp. | | | 600 | | | | 60,636 | |
Molex, Inc. | | | 375 | | | | 9,664 | |
| | | | | | | | |
|
| Electronic Equipment, Instruments & Components—(Continued) | |
Murata Manufacturing Co., Ltd. | | | 800 | | | $ | 53,072 | |
Nippon Electric Glass Co., Ltd. | | | 1,000 | | | | 12,722 | |
Omron Corp. | | | 800 | | | | 22,102 | |
Shimadzu Corp. | | | 1,000 | | | | 9,102 | |
TDK Corp. | | | 500 | | | | 27,342 | |
Yaskawa Electric Corp. | | | 1,000 | | | | 11,135 | |
Yokogawa Electric Corp.* | | | 800 | | | | 6,775 | |
| | | | | | | | |
| | | | | | | 649,114 | |
| | | | | | | | |
|
| Energy Equipment & Services—0.3% | |
Aker Solutions ASA | | | 657 | | | | 13,201 | |
AMEC plc | | | 1,329 | | | | 23,233 | |
Baker Hughes, Inc. | | | 1,185 | | | | 85,984 | |
Cameron International Corp.* | | | 680 | | | | 34,197 | |
Cie Generale de Geophysique—Veritas* | | | 575 | | | | 21,212 | |
Diamond Offshore Drilling, Inc. | | | 185 | | | | 13,026 | |
FMC Technologies, Inc.* | | | 630 | | | | 28,218 | |
Fugro N.V. | | | 273 | | | | 19,713 | |
Halliburton Co. | | | 2,490 | | | | 126,990 | |
Helmerich & Payne, Inc. | | | 305 | | | | 20,167 | |
Nabors Industries, Ltd.* | | | 755 | | | | 18,603 | |
National Oilwell Varco, Inc. | | | 1,175 | | | | 91,897 | |
Noble Corp. | | | 685 | | | | 26,996 | |
Petrofac, Ltd. | | | 1,036 | | | | 25,203 | |
Rowan Cos., Inc.* | | | 320 | | | | 12,419 | |
Saipem S.p.A. | | | 1,058 | | | | 54,702 | |
SBM Offshore N.V. | | | 674 | | | | 17,855 | |
Schlumberger, Ltd. | | | 3,730 | | | | 322,272 | |
Seadrill, Ltd. | | | 1,240 | | | | 43,808 | |
Subsea 7 SA* | | | 1,125 | | | | 28,883 | |
Technip S.A. | | | 393 | | | | 42,197 | |
Tenaris S.A. | | | 1,887 | | | | 43,164 | |
Transocean, Ltd. | | | 1,275 | | | | 82,893 | |
WorleyParsons, Ltd. | | | 769 | | | | 23,305 | |
| | | | | | | | |
| | | | | | | 1,220,138 | |
| | | | | | | | |
|
| Food & Staples Retailing—0.5% | |
Aeon Co., Ltd. | | | 2,400 | | | | 28,808 | |
Carrefour S.A. | | | 2,308 | | | | 94,929 | |
Casino Guichard Perrachon S.A. | | | 221 | | | | 20,863 | |
Colruyt S.A. | | | 303 | | | | 15,182 | |
Costco Wholesale Corp. | | | 1,185 | | | | 96,269 | |
CVS Caremark Corp. | | | 3,735 | | | | 140,361 | |
Delhaize Group S.A. | | | 406 | | | | 30,485 | |
FamilyMart Co., Ltd. | | | 200 | | | | 7,316 | |
J Sainsbury plc | | | 4,848 | | | | 25,659 | |
See accompanying notes to financial statements.
11
MET INVESTORS SERIES TRUST
| | |
AllianceBernstein Global Dynamic Allocation Portfolio | | |
Schedule of Investments as of June 30, 2011 (Unaudited)
Common Stocks—(Continued)
| | | | | | | | |
| Security Description | |
Shares | | | Value | |
| | | | | | | | |
|
| Food & Staples Retailing—(Continued) | |
Jeronimo Martins SGPS S.A. | | | 880 | | | $ | 16,922 | |
Kesko OYJ | | | 267 | | | | 12,440 | |
Koninklijke Ahold N.V. | | | 4,764 | | | | 64,111 | |
Kroger Co. (The) | | | 1,690 | | | | 41,912 | |
Lawson Inc | | | 200 | | | | 10,453 | |
Metcash, Ltd. | | | 3,073 | | | | 13,686 | |
Metro AG | | | 518 | | | | 31,439 | |
Olam International, Ltd. | | | 5,000 | | | | 11,080 | |
Safeway, Inc. | | | 1,000 | | | | 23,370 | |
Seven & I Holdings Co., Ltd. | | | 3,000 | | | | 80,241 | |
SUPERVALU, Inc. | | | 565 | | | | 5,317 | |
Sysco Corp. | | | 1,565 | | | | 48,797 | |
Tesco plc | | | 32,162 | | | | 207,745 | |
Wal-Mart Stores, Inc. | | | 5,355 | | | | 284,565 | |
Walgreen Co. | | �� | 2,495 | | | | 105,938 | |
Wesfarmers, Ltd. | | | 4,018 | | | | 137,335 | |
Wesfarmers, Ltd.—PPS | | | 607 | | | | 21,008 | |
Whole Foods Market, Inc. | | | 380 | | | | 24,111 | |
WM Morrison Supermarkets plc | | | 9,030 | | | | 43,194 | |
Woolworths, Ltd. | | | 4,848 | | | | 144,373 | |
| | | | | | | | |
| | | | | | | 1,787,909 | |
| | | | | | | | |
| | |
| Food Products—0.6% | | | | | | | | |
Ajinomoto Co., Inc. | | | 3,000 | | | | 35,452 | |
Archer-Daniels-Midland Co. | | | 1,845 | | | | 55,627 | |
Aryzta AG | | | 178 | | | | 9,531 | |
Associated British Foods plc | | | 1,424 | | | | 24,780 | |
Campbell Soup Co. | | | 500 | | | | 17,275 | |
ConAgra Foods Inc | | | 1,070 | | | | 27,617 | |
Danone | | | 2,331 | | | | 174,180 | |
Dean Foods Co.* | | | 500 | | | | 6,135 | |
General Mills, Inc. | | | 1,740 | | | | 64,763 | |
Golden Agri-Resources, Ltd. | | | 27,000 | | | | 14,958 | |
H.J. Heinz Co. | | | 875 | | | | 46,620 | |
Hershey Co. (The) | | | 435 | | | | 24,730 | |
Hormel Foods Corp. | | | 375 | | | | 11,179 | |
J.M. Smucker Co. (The) | | | 315 | | | | 24,079 | |
Kellogg Co. | | | 685 | | | | 37,894 | |
Kerry Group plc—Class A | | | 561 | | | | 23,343 | |
Kikkoman Corp. | | | 1,000 | | | | 10,478 | |
Kraft Foods, Inc.—Class A | | | 4,740 | | | | 166,990 | |
Lindt & Spruengli AG | | | 5 | | | | 15,570 | |
Lindt & Spruengli AG—PC | | | 1 | | | | 36,424 | |
McCormick & Co., Inc. | | | 370 | | | | 18,341 | |
Mead Johnson Nutrition Co. | | | 560 | | | | 37,828 | |
MEIJI Holdings Co., Ltd. | | | 300 | | | | 12,592 | |
Nestle S.A. | | | 13,850 | | | | 860,121 | |
| | | | | | | | |
|
| Food Products—(Continued) | |
Nippon Meat Packers Inc | | | 1,000 | | | $ | 14,260 | |
Nisshin Seifun Group, Inc. | | | 500 | | | | 6,212 | |
Nissin Foods Holdings Co., Ltd. | | | 200 | | | | 7,259 | |
Parmalat S.p.A.* | | | 4,855 | | | | 18,291 | |
Sara Lee Corp. | | | 1,565 | | | | 29,719 | |
Suedzucker AG | | | 265 | | | | 9,431 | |
Toyo Suisan Kaisha, Ltd. | | | 1,000 | | | | 23,560 | |
Tyson Foods, Inc.—Class A | | | 810 | | | | 15,730 | |
Unilever N.V. | | | 6,511 | | | | 213,759 | |
Unilever plc | | | 5,130 | | | | 165,352 | |
Wilmar International, Ltd. | | | 7,439 | | | | 32,848 | |
Yakult Honsha Co., Ltd. | | | 400 | | | | 11,517 | |
Yamazaki Baking Co., Ltd. | | | 1,000 | | | | 13,342 | |
| | | | | | | | |
| | | | | | | 2,317,787 | |
| | | | | | | | |
| | |
| Gas Utilities—0.1% | | | | | | | | |
Enagas S.A. | | | 716 | | | | 17,376 | |
Gas Natural SDG S.A. | | | 1,289 | | | | 27,042 | |
Hong Kong & China Gas Co., Ltd. | | | 19,000 | | | | 43,169 | |
Nicor Inc. | | | 125 | | | | 6,843 | |
ONEOK, Inc. | | | 310 | | | | 22,943 | |
Osaka Gas Co., Ltd. | | | 8,000 | | | | 30,256 | |
Snam Rete Gas S.p.A. | | | 6,423 | | | | 38,097 | |
Toho Gas Co., Ltd. | | | 2,000 | | | | 10,788 | |
Tokyo Gas Co., Ltd. | | | 10,000 | | | | 45,012 | |
| | | | | | | | |
| | | | | | | 241,526 | |
| | | | | | | | |
|
| Health Care Equipment & Supplies—0.3% | |
Baxter International, Inc. | | | 1,560 | | | | 93,116 | |
Becton, Dickinson & Co. | | | 620 | | | | 53,425 | |
Boston Scientific Corp.* | | | 4,120 | | | | 28,469 | |
C.R. Bard, Inc. | | | 245 | | | | 26,916 | |
CareFusion Corp.* | | | 570 | | | | 15,487 | |
Cie Generale d’Optique Essilor International S.A. | | | 804 | | | | 65,309 | |
Cochlear, Ltd. | | | 227 | | | | 17,540 | |
Coloplast A.S.—Class B | | | 91 | | | | 13,839 | |
Covidien plc | | | 1,365 | | | | 72,659 | |
DENTSPLY International, Inc. | | | 375 | | | | 14,280 | |
Edwards Lifesciences Corp.* | | | 310 | | | | 27,026 | |
Getinge AB—B Shares | | | 800 | | | | 21,554 | |
Intuitive Surgical, Inc.* | | | 120 | | | | 44,653 | |
Medtronic, Inc. | | | 2,925 | | | | 112,700 | |
Olympus Corp. | | | 900 | | | | 30,143 | |
Smith & Nephew plc | | | 3,566 | | | | 38,104 | |
Sonova Holding AG* | | | 196 | | | | 18,287 | |
St. Jude Medical, Inc. | | | 875 | | | | 41,720 | |
See accompanying notes to financial statements.
12
MET INVESTORS SERIES TRUST
| | |
AllianceBernstein Global Dynamic Allocation Portfolio | | |
Schedule of Investments as of June 30, 2011 (Unaudited)
Common Stocks—(Continued)
| | | | | | | | |
| Security Description | |
Shares | | | Value | |
| | | | | | | | |
|
| Health Care Equipment & Supplies—(Continued) | |
Straumann Holding AG | | | 37 | | | $ | 8,905 | |
Stryker Corp. | | | 930 | | | | 54,582 | |
Synthes, Inc. | | | 261 | | | | 45,881 | |
Sysmex Corp. | | | 300 | | | | 11,234 | |
Terumo Corp. | | | 700 | | | | 37,628 | |
Varian Medical Systems, Inc.* | | | 315 | | | | 22,056 | |
William Demant Holding A.S.* | | | 94 | | | | 8,497 | |
Zimmer Holdings, Inc.* | | | 505 | | | | 31,916 | |
| | | | | | | | |
| | | | | | | 955,926 | |
| | | | | | | | |
|
| Health Care Providers & Services—0.2% | |
Aetna, Inc. | | | 1,055 | | | | 46,515 | |
Alfresa Holdings Corp. | | | 100 | | | | 3,869 | |
AmerisourceBergen Corp. | | | 745 | | | | 30,843 | |
Cardinal Health, Inc. | | | 940 | | | | 42,695 | |
Celesio AG | | | 340 | | | | 6,790 | |
CIGNA Corp. | | | 745 | | | | 38,315 | |
Coventry Health Care, Inc.* | | | 380 | | | | 13,859 | |
DaVita, Inc.* | | | 250 | | | | 21,653 | |
Express Scripts, Inc.* | | | 1,435 | | | | 77,461 | |
Fresenius Medical Care AG & Co. KGaA | | | 785 | | | | 58,772 | |
Fresenius SE & Co. KGaA | | | 454 | | | | 47,461 | |
Humana, Inc. | | | 490 | | | | 39,465 | |
Laboratory Corp. of America Holdings* | | | 305 | | | | 29,521 | |
McKesson Corp. | | | 685 | | | | 57,300 | |
Medco Health Solutions, Inc.* | | | 1,115 | | | | 63,020 | |
Medipal Holdings Corp. | | | 600 | | | | 5,297 | |
Miraca Holdings, Inc. | | | 200 | | | | 8,072 | |
Patterson Cos., Inc. | | | 250 | | | | 8,223 | |
Quest Diagnostics, Inc. | | | 435 | | | | 25,708 | |
Ramsay Health Care, Ltd. | | | 525 | | | | 10,243 | |
Sonic Healthcare, Ltd. | | | 1,475 | | | | 20,372 | |
Suzuken Co., Ltd. | | | 300 | | | | 6,893 | |
Tenet Healthcare Corp.* | | | 1,310 | | | | 8,174 | |
UnitedHealth Group, Inc. | | | 2,990 | | | | 154,224 | |
WellPoint, Inc. | | | 1,050 | | | | 82,708 | |
| | | | | | | | |
| | | | | | | 907,453 | |
| | | | | | | | |
|
| Health Care Technology—0.0% | |
Cerner Corp.* | | | 380 | | | | 23,222 | |
| | | | | | | | |
|
| Hotels, Restaurants & Leisure—0.3% | |
Accor S.A. | | | 589 | | | | 26,377 | |
Autogrill S.p.A. | | | 458 | | | | 6,020 | |
Carnival Corp. | | | 1,180 | | | | 44,403 | |
| | | | | | | | |
|
| Hotels, Restaurants & Leisure—(Continued) | |
Carnival plc | | | 731 | | | $ | 28,342 | |
Chipotle Mexican Grill, Inc.* | | | 115 | | | | 35,442 | |
Compass Group plc | | | 7,560 | | | | 73,006 | |
Crown, Ltd. | | | 1,808 | | | | 17,326 | |
Darden Restaurants, Inc. | | | 375 | | | | 18,660 | |
Echo Entertainment Group, Ltd.* | | | 2,738 | | | | 12,076 | |
Galaxy Entertainment Group, Ltd.* | | | 4,900 | | | | 10,428 | |
Genting Singapore plc* | | | 24,000 | | | | 37,737 | |
Intercontinental Hotels Group plc | | | 1,159 | | | | 23,744 | |
International Game Technology | | | 810 | | | | 14,240 | |
Marriott International, Inc.—Class A | | | 755 | | | | 26,795 | |
McDonald’s Corp. | | | 2,860 | | | | 241,155 | |
McDonald’s Holdings Co. Japan, Ltd. | | | 300 | | | | 7,618 | |
OPAP S.A. | | | 892 | | | | 13,927 | |
Oriental Land Co., Ltd. | | | 200 | | | | 16,914 | |
Sands China, Ltd.* | | | 9,600 | | | | 25,784 | |
Shangri-La Asia, Ltd. | | | 6,000 | | | | 14,712 | |
SJM Holdings, Ltd. | | | 6,600 | | | | 15,674 | |
Sky City Entertainment Group, Ltd. | | | 2,299 | | | | 6,894 | |
Sodexo | | | 377 | | | | 29,600 | |
Starbucks Corp. | | | 2,000 | | | | 78,980 | |
Starwood Hotels & Resorts Worldwide, Inc. | | | 505 | | | | 28,300 | |
TABCORP. Holdings, Ltd. | | | 2,738 | | | | 9,667 | |
Tatts Group, Ltd. | | | 5,200 | | | | 13,393 | |
TUI AG* | | | 604 | | | | 6,562 | |
TUI Travel plc | | | 2,011 | | | | 7,251 | |
Whitbread plc | | | 708 | | | | 18,372 | |
Wyndham Worldwide Corp. | | | 445 | | | | 14,974 | |
Wynn Macau, Ltd. | | | 6,200 | | | | 20,237 | |
Wynn Resorts, Ltd. | | | 240 | | | | 34,450 | |
Yum! Brands, Inc. | | | 1,300 | | | | 71,812 | |
| | | | | | | | |
| | | | | | | 1,050,872 | |
| | | | | | | | |
|
| Household Durables—0.1% | |
Casio Computer Co., Ltd. | | | 900 | | | | 6,305 | |
D.R. Horton, Inc. | | | 750 | | | | 8,640 | |
Electrolux AB—Series B | | | 959 | | | | 22,961 | |
Fortune Brands, Inc. | | | 435 | | | | 27,740 | |
Harman International Industries, Inc. | | | 190 | | | | 8,658 | |
Husqvarna AB—B Shares | | | 1,768 | | | | 11,751 | |
Leggett & Platt, Inc. | | | 380 | | | | 9,264 | |
Lennar Corp.—Class A | | | 435 | | | | 7,895 | |
Newell Rubbermaid, Inc. | | | 755 | | | | 11,914 | |
Panasonic Corp. | | | 8,800 | | | | 106,938 | |
PulteGroup, Inc.* | | | 880 | | | | 6,741 | |
Rinnai Corp. | | | 100 | | | | 7,192 | |
See accompanying notes to financial statements.
13
MET INVESTORS SERIES TRUST
| | |
AllianceBernstein Global Dynamic Allocation Portfolio | | |
Schedule of Investments as of June 30, 2011 (Unaudited)
Common Stocks—(Continued)
| | | | | | | | |
| Security Description | |
Shares | | | Value | |
| | | | | | | | |
|
| Household Durables—(Continued) | |
Sekisui Chemical Co., Ltd. | | | 2,000 | | | $ | 16,988 | |
Sekisui House, Ltd. | | | 2,000 | | | | 18,501 | |
Sharp Corp. | | | 4,000 | | | | 36,258 | |
Sony Corp. | | | 4,000 | | | | 105,004 | |
Stanley Black & Decker, Inc. | | | 440 | | | | 31,702 | |
Whirlpool Corp. | | | 190 | | | | 15,451 | |
| | | | | | | | |
| | | | | | | 459,903 | |
| | | | | | | | |
|
| Household Products—0.2% | |
Clorox Co. (The) | | | 375 | | | | 25,290 | |
Colgate-Palmolive Co. | | | 1,365 | | | | 119,315 | |
Henkel AG & Co. KGaA | | | 519 | | | | 29,793 | |
Kimberly-Clark Corp. | | | 1,115 | | | | 74,214 | |
Procter & Gamble Co. (The) | | | 7,655 | | | | 486,628 | |
Reckitt Benckiser Group plc | | | 2,467 | | | | 136,361 | |
Unicharm Corp. | | | 400 | | | | 17,410 | |
| | | | | | | | |
| | | | | | | 889,011 | |
| | | | | | | | |
|
| Independent Power Producers & Energy Traders—0.0% | |
AES Corp. (The)* | | | 1,805 | | | | 22,996 | |
Constellation Energy Group, Inc. | | | 510 | | | | 19,360 | |
EDP Renovaveis S.A.* | | | 872 | | | | 5,761 | |
Electric Power Development Co., Ltd. | | | 500 | | | | 13,485 | |
Enel Green Power S.p.A. | | | 6,995 | | | | 19,323 | |
Iberdrola Renovables S.A. | | | 3,377 | | | | 14,939 | |
International Power plc | | | 6,106 | | | | 31,562 | |
NRG Energy, Inc.* | | | 635 | | | | 15,608 | |
| | | | | | | | |
| | | | | | | 143,034 | |
| | | | | | | | |
|
| Industrial Conglomerates—0.4% | |
3M Co. | | | 1,935 | | | | 183,535 | |
Delek Group, Ltd. | | | 18 | | | | 4,030 | |
Fraser and Neave, Ltd. | | | 3,000 | | | | 14,151 | |
General Electric Co. | | | 29,005 | | | | 547,034 | |
Hutchison Whampoa, Ltd. | | | 8,000 | | | | 86,358 | |
Keppel Corp., Ltd. | | | 5,000 | | | | 45,134 | |
Koninklijke Philips Electronics N.V. | | | 3,941 | | | | 101,367 | |
NWS Holdings, Ltd. | | | 5,000 | | | | 6,695 | |
Orkla A.S.A. | | | 3,084 | | | | 29,433 | |
SembCorp. Industries, Ltd. | | | 4,000 | | | | 16,261 | |
Siemens AG | | | 3,289 | | | | 452,361 | |
Smiths Group plc | | | 1,567 | | | | 30,240 | |
Tyco International, Ltd. | | | 1,305 | | | | 64,506 | |
Wendel S.A. | | | 131 | | | | 16,132 | |
| | | | | | | | |
| | | | | | | 1,597,237 | |
| | | | | | | | |
| | | | | | | | |
|
| Insurance—0.8% | |
ACE, Ltd. | | | 930 | | | $ | 61,213 | |
Admiral Group plc | | | 805 | | | | 21,485 | |
Aegon N.V.* | | | 6,870 | | | | 46,935 | |
Aflac, Inc. | | | 1,255 | | | | 58,583 | |
Ageas | | | 8,843 | | | | 24,029 | |
AIA Group, Ltd.* | | | 31,300 | | | | 108,602 | |
Allianz SE | | | 1,814 | | | | 253,788 | |
Allstate Corp. (The) | | | 1,435 | | | | 43,811 | |
American International Group, Inc.* | | | 1,185 | | | | 34,744 | |
AMP, Ltd. | | | 11,258 | | | | 59,079 | |
Aon Corp. | | | 930 | | | | 47,709 | |
Assicurazioni Generali S.p.A. | | | 4,667 | | | | 98,622 | |
Assurant, Inc. | | | 255 | | | | 9,249 | |
Aviva plc | | | 11,272 | | | | 79,511 | |
AXA S.A. | | | 7,120 | | | | 162,039 | |
Baloise Holding AG | | | 190 | | | | 19,591 | |
Berkshire Hathaway, Inc.—Class B* | | | 4,730 | | | | 366,055 | |
Chubb Corp. (The) | | | 810 | | | | 50,714 | |
Cincinnati Financial Corp. | | | 440 | | | | 12,839 | |
CNP Assurances | | | 594 | | | | 12,971 | |
Dai-ichi Life Insurance Co., Ltd. (The) | | | 36 | | | | 50,131 | |
Delta Lloyd N.V. | | | 402 | | | | 9,569 | |
Genworth Financial, Inc.—Class A* | | | 1,315 | | | | 13,518 | |
Gjensidige Forsikring ASA | | | 799 | | | | 9,885 | |
Hannover Rueckversicherung AG | | | 241 | | | | 12,588 | |
Hartford Financial Services Group, Inc. (The) | | | 1,190 | | | | 31,380 | |
Insurance Australia Group, Ltd. | | | 8,310 | | | | 30,321 | |
Legal & General Group plc | | | 23,450 | | | | 44,537 | |
Lincoln National Corp. | | | 820 | | | | 23,362 | |
Loews Corp. | | | 870 | | | | 36,618 | |
Mapfre S.A. | | | 3,010 | | | | 11,191 | |
Marsh & McLennan Cos., Inc. | | | 1,440 | | | | 44,914 | |
MetLife, Inc. | | | 565 | | | | 24,787 | |
MS&AD Insurance Group Holdings | | | 2,300 | | | | 53,504 | |
Muenchener Rueckversicherungs AG | | | 753 | | | | 115,322 | |
NKSJ Holdings, Inc. | | | 6,000 | | | | 39,358 | |
Old Mutual plc | | | 21,806 | | | | 46,740 | |
Principal Financial Group, Inc. | | | 875 | | | | 26,617 | |
Progressive Corp. (The) | | | 1,755 | | | | 37,522 | |
Prudential Financial, Inc. | | | 1,310 | | | | 83,303 | |
Prudential plc | | | 10,175 | | | | 117,714 | |
QBE Insurance Group, Ltd. | | | 4,204 | | | | 77,824 | |
Resolution, Ltd. | | | 5,806 | | | | 27,427 | |
RSA Insurance Group plc | | | 13,981 | | | | 30,305 | |
Sampo OYJ—A Shares | | | 1,679 | | | | 54,305 | |
See accompanying notes to financial statements.
14
MET INVESTORS SERIES TRUST
| | |
AllianceBernstein Global Dynamic Allocation Portfolio | | |
Schedule of Investments as of June 30, 2011 (Unaudited)
Common Stocks—(Continued)
| | | | | | | | |
| Security Description | |
Shares | | | Value | |
| | | | | | | | |
|
| Insurance—(Continued) | |
SCOR SE | | | 675 | | | $ | 19,215 | �� |
Sony Financial Holdings, Inc. | | | 695 | | | | 12,487 | |
Standard Life plc | | | 9,126 | | | | 30,867 | |
Suncorp. Group, Ltd. | | | 5,122 | | | | 44,743 | |
Swiss Life Holding AG* | | | 122 | | | | 19,996 | |
Swiss Re, Ltd.* | | | 1,408 | | | | 79,006 | |
T&D Holdings, Inc. | | | 1,150 | | | | 27,165 | |
Tokio Marine Holdings, Inc. | | | 2,900 | | | | 80,730 | |
Torchmark Corp. | | | 240 | | | | 15,394 | |
Travelers Cos., Inc. (The) | | | 1,180 | | | | 68,888 | |
Tryg A.S. | | | 102 | | | | 5,893 | |
Unum Group | | | 815 | | | | 20,766 | |
Vienna Insurance Group AG Wiener Versicherung Gruppe | | | 154 | | | | 8,477 | |
XL Group plc | | | 815 | | | | 17,914 | |
Zurich Financial Services AG* | | | 582 | | | | 147,065 | |
| | | | | | | | |
| | | | | | | 3,222,917 | |
| | | | | | | | |
| | |
| Internet & Catalog Retail—0.1% | | | | | | | | |
Amazon.com, Inc.* | | | 970 | | | | 198,355 | |
Dena Co., Ltd. | | | 392 | | | | 16,794 | |
Expedia, Inc. | | | 530 | | | | 15,365 | |
Home Retail Group plc | | | 3,251 | | | | 8,551 | |
Netflix, Inc.* | | | 143 | | | | 37,565 | |
Priceline.com, Inc.* | | | 145 | | | | 74,230 | |
Rakuten Inc | | | 29 | | | | 29,883 | |
| | | | | | | | |
| | | | | | | 380,743 | |
| | | | | | | | |
| | |
| Internet Software & Services—0.1% | | | | | | | | |
Akamai Technologies, Inc.* | | | 500 | | | | 15,735 | |
eBay, Inc.* | | | 3,115 | | | | 100,521 | |
Google, Inc.—Class A* | | | 685 | | | | 346,870 | |
Gree, Inc. | | | 366 | | | | 7,947 | |
Monster Worldwide, Inc.* | | | 320 | | | | 4,691 | |
United Internet AG | | | 450 | | | | 9,473 | |
VeriSign, Inc. | | | 445 | | | | 14,890 | |
Yahoo Japan Corp. | | | 58 | | | | 19,850 | |
Yahoo!, Inc.* | | | 3,555 | | | | 53,467 | |
| | | | | | | | |
| | | | | | | 573,444 | |
| | | | | | | | |
| | |
| IT Services—0.3% | | | | | | | | |
Amadeus IT Holding S.A.—A Shares* | | | 984 | | | | 20,451 | |
Atos | | | 196 | | | | 11,090 | |
Automatic Data Processing, Inc. | | | 1,365 | | | | 71,908 | |
Cap Gemini S.A. | | | 591 | | | | 34,677 | |
Cognizant Technology Solutions Corp.—Class A* | | | 815 | | | | 59,772 | |
| | | | | | | | |
| | |
| IT Services—(Continued) | | | | | | | | |
Computer Sciences Corp. | | | 435 | | | $ | 16,513 | |
Computershare, Ltd. | | | 1,777 | | | | 16,915 | |
Fidelity National Information Services, Inc. | | | 695 | | | | 21,399 | |
Fiserv, Inc.* | | | 380 | | | | 23,799 | |
Indra Sistemas S.A. | | | 394 | | | | 8,143 | |
International Business Machines Corp. | | | 3,355 | | | | 575,550 | |
Itochu Techno-Solutions Corp. | | | 100 | | | | 3,530 | |
Mastercard, Inc.—Class A | | | 300 | | | | 90,402 | |
Nomura Research Institute, Ltd. | | | 400 | | | | 8,705 | |
NTT Data Corp. | | | 5 | | | | 16,498 | |
Otsuka Corp. | | | 100 | | | | 6,194 | |
Paychex, Inc. | | | 875 | | | | 26,880 | |
SAIC, Inc.* | | | 760 | | | | 12,783 | |
Teradata Corp.* | | | 440 | | | | 26,488 | |
Total System Services, Inc. | | | 435 | | | | 8,082 | |
Visa, Inc.—Class A | | | 1,310 | | | | 110,381 | |
Western Union Co. | | | 1,750 | | | | 35,053 | |
| | | | | | | | |
| | | | | | | 1,205,213 | |
| | | | | | | | |
|
| Leisure Equipment & Products—0.0% | |
Hasbro, Inc. | | | 375 | | | | 16,474 | |
Mattel, Inc. | | | 935 | | | | 25,703 | |
Namco Bandai Holdings, Inc. | | | 800 | | | | 9,583 | |
Nikon Corp. | | | 1,400 | | | | 32,793 | |
Sankyo Co., Ltd. | | | 200 | | | | 10,279 | |
Sega Sammy Holdings, Inc. | | | 800 | | | | 15,366 | |
Shimano, Inc. | | | 300 | | | | 16,424 | |
Yamaha Corp. | | | 600 | | | | 6,793 | |
| | | | | | | | |
| | | | | | | 133,415 | |
| | | | | | | | |
|
| Life Sciences Tools & Services—0.1% | |
Agilent Technologies, Inc.* | | | 935 | | | | 47,788 | |
Life Technologies Corp.* | | | 495 | | | | 25,775 | |
Lonza Group AG* | | | 234 | | | | 18,301 | |
PerkinElmer, Inc. | | | 260 | | | | 6,997 | |
QIAGEN N.V.* | | | 932 | | | | 17,894 | |
Thermo Fisher Scientific, Inc.* | | | 1,060 | | | | 68,253 | |
Waters Corp.* | | | 250 | | | | 23,935 | |
| | | | | | | | |
| | | | | | | 208,943 | |
| | | | | | | | |
| | |
| Machinery—0.6% | | | | | | | | |
Alfa Laval AB | | | 1,349 | | | | 29,174 | |
Amada Co., Ltd. | | | 1,000 | | | | 7,638 | |
Atlas Copco A.B.—A Shares | | | 2,684 | | | | 70,907 | |
Atlas Copco A.B.—B Shares | | | 1,560 | | | | 36,856 | |
See accompanying notes to financial statements.
15
MET INVESTORS SERIES TRUST
| | |
AllianceBernstein Global Dynamic Allocation Portfolio | | |
Schedule of Investments as of June 30, 2011 (Unaudited)
Common Stocks—(Continued)
| | | | | | | | |
| Security Description | |
Shares | | | Value | |
| | | | | | | | |
| | |
| Machinery—(Continued) | | | | | | | | |
Caterpillar, Inc. | | | 1,745 | | | $ | 185,773 | |
Cosco Corp. Singapore, Ltd. | | | 4,000 | | | | 6,355 | |
Cummins, Inc. | | | 555 | | | | 57,437 | |
Danaher Corp. | | | 1,490 | | | | 78,955 | |
Deere & Co. | | | 1,175 | | | | 96,879 | |
Dover Corp. | | | 500 | | | | 33,900 | |
Eaton Corp. | | | 935 | | | | 48,106 | |
FANUC Corp. | | | 800 | | | | 132,730 | |
Fiat Industrial S.p.A.* | | | 3,056 | | | | 39,502 | |
Flowserve Corp. | | | 180 | | | | 19,780 | |
GEA Group AG | | | 698 | | | | 25,024 | |
Hexagon AB—B Shares | | | 1,013 | | | | 25,042 | |
Hino Motors, Ltd. | | | 1,000 | | | | 5,791 | |
Hitachi Construction Machinery Co., Ltd. | | | 400 | | | | 8,898 | |
IHI Corp. | | | 5,000 | | | | 12,834 | |
Illinois Tool Works, Inc. | | | 1,370 | | | | 77,391 | |
Ingersoll-Rand plc | | | 875 | | | | 39,734 | |
Invensys plc | | | 3,236 | | | | 16,737 | |
Japan Steel Works, Ltd. (The) | | | 1,000 | | | | 6,808 | |
Joy Global, Inc. | | | 305 | | | | 29,048 | |
JTEKT Corp. | | | 900 | | | | 13,158 | |
Kawasaki Heavy Industries, Ltd. | | | 6,000 | | | | 23,734 | |
Komatsu, Ltd. | | | 3,800 | | | | 117,659 | |
Kone OYJ—Class B | | | 622 | | | | 39,143 | |
Kubota Corp. | | | 5,000 | | | | 43,958 | |
Kurita Water Industries, Ltd. | | | 400 | | | | 11,864 | |
Makita Corp. | | | 400 | | | | 18,501 | |
MAN SE | | | 423 | | | | 56,495 | |
Metso OYJ | | | 511 | | | | 29,070 | |
Minebea Co., Ltd. | | | 1,000 | | | | 5,295 | |
Mitsubishi Heavy Industries, Ltd. | | | 12,000 | | | | 56,098 | |
Mitsui Engineering & Shipbuilding Co., Ltd. | | | 3,000 | | | | 6,510 | |
Nabtesco Corp. | | | 1,000 | | | | 24,031 | |
NGK Insulators, Ltd. | | | 1,000 | | | | 18,501 | |
NSK, Ltd. | | | 2,000 | | | | 19,815 | |
NTN Corp. | | | 2,000 | | | | 11,309 | |
PACCAR, Inc. | | | 995 | | | | 50,835 | |
Pall Corp. | | | 310 | | | | 17,431 | |
Parker Hannifin Corp. | | | 435 | | | | 39,037 | |
Sandvik AB | | | 4,030 | | | | 70,913 | |
Scania AB—B Shares | | | 1,279 | | | | 29,771 | |
Schindler Holding AG | | | 159 | | | | 19,295 | |
Schindler Holding AG—PC | | | 194 | | | | 23,565 | |
SembCorp. Marine, Ltd. | | | 3,000 | | | | 12,954 | |
| | | | | | | | |
| | |
| Machinery—(Continued) | | | | | | | | |
SKF AB—B Shares | | | 1,558 | | | $ | 45,239 | |
SMC Corp. | | | 200 | | | | 35,811 | |
Snap-On, Inc. | | | 180 | | | | 11,246 | |
Sulzer AG | | | 58 | | | | 9,431 | |
Sumitomo Heavy Industries, Ltd. | | | 2,000 | | | | 13,838 | |
THK Co., Ltd. | | | 500 | | | | 12,648 | |
Vallourec S.A. | | | 448 | | | | 54,648 | |
Volvo AB | | | 5,509 | | | | 96,588 | |
Wartsila OYJ | | | 670 | | | | 22,663 | |
Weir Group plc (The) | | | 842 | | | | 28,777 | |
Yangzijiang Shipbuilding Holdings, Ltd. | | | 7,700 | | | | 9,159 | |
Zardoya Otis S.A. | | | 559 | | | | 8,248 | |
| | | | | | | | |
| | | | | | | 2,198,537 | |
| | | | | | | | |
| | |
| Marine—0.0% | | | | | | | | |
A.P. Moller-Maersk A.S.—Class A | | | 2 | | | | 16,575 | |
A.P. Moller-Maersk A.S.—Class B | | | 5 | | | | 43,190 | |
Kawasaki Kisen Kaisha, Ltd. | | | 3,000 | | | | 10,416 | |
Kuehne & Nagel International AG | | | 216 | | | | 32,759 | |
Mitsui OSK Lines, Ltd. | | | 4,000 | | | | 21,378 | |
Neptune Orient Lines, Ltd. | | | 3,000 | | | | 3,739 | |
Nippon Yusen KK | | | 6,000 | | | | 22,171 | |
Orient Overseas International, Ltd. | | | 1,000 | | | | 6,457 | |
| | | | | | | | |
| | | | | | | 156,685 | |
| | | | | | | | |
| | |
| Media—0.5% | | | | | | | | |
Axel Springer AG | | | 158 | | | | 7,816 | |
British Sky Broadcasting Group plc | | | 4,554 | | | | 61,942 | |
Cablevision Systems Corp.—Class A | | | 625 | | | | 22,631 | |
CBS Corp.—Class B | | | 1,810 | | | | 51,567 | |
Comcast Corp.—Class A | | | 7,540 | | | | 191,064 | |
Dentsu, Inc. | | | 700 | | | | 20,572 | |
DIRECTV—Class A* | | | 2,175 | | | | 110,533 | |
Discovery Communications, Inc.—Class A* | | | 750 | | | | 30,720 | |
Eutelsat Communications S.A. | | | 396 | | | | 17,829 | |
Gannett Co., Inc. | | | 630 | | | | 9,022 | |
Hakuhodo DY Holdings, Inc. | | | 90 | | | | 4,776 | |
Interpublic Group of Cos., Inc. (The) | | | 1,315 | | | | 16,438 | |
ITV plc* | | | 14,768 | | | | 16,966 | |
JCDecaux S.A.* | | | 266 | | | | 8,540 | |
Jupiter Telecommunications Co., Ltd. | | | 7 | | | | 7,812 | |
Kabel Deutschland Holding AG* | | | 288 | | | | 17,735 | |
Lagardere SCA | | | 472 | | | | 19,972 | |
McGraw-Hill Cos., Inc. (The) | | | 815 | | | | 34,157 | |
Mediaset Espana Comunicacion S.A. | | | 650 | | | | 5,656 | |
See accompanying notes to financial statements.
16
MET INVESTORS SERIES TRUST
| | |
AllianceBernstein Global Dynamic Allocation Portfolio | | |
Schedule of Investments as of June 30, 2011 (Unaudited)
Common Stocks—(Continued)
| | | | | | | | |
| Security Description | |
Shares | | | Value | |
| | | | | | | | |
|
| Media—(Continued) | |
Mediaset S.p.A. | | | 2,833 | | | $ | 13,339 | |
Metropole Television S.A. | | | 232 | | | | 5,376 | |
Modern Times Group AB—B Shares | | | 191 | | | | 12,659 | |
News Corp.—Class A | | | 6,225 | | | | 110,182 | |
Omnicom Group, Inc. | | | 755 | | | | 36,361 | |
Pearson plc | | | 3,250 | | | | 61,412 | |
Publicis Groupe S.A. | | | 498 | | | | 27,810 | |
Reed Elsevier N.V. | | | 2,749 | | | | 36,951 | |
Reed Elsevier plc | | | 4,859 | | | | 44,190 | |
Sanoma OYJ | | | 325 | | | | 6,032 | |
Scripps Networks Interactive—
Class A | | | 250 | | | | 12,220 | |
SES S.A. | | | 1,198 | | | | 33,676 | |
Singapore Press Holdings, Ltd. | | | 6,000 | | | | 19,064 | |
Societe Television Francaise S.A. | | | 469 | | | | 8,542 | |
Time Warner Cable, Inc. | | | 935 | | | | 72,967 | |
Time Warner, Inc. | | | 2,985 | | | | 108,564 | |
Toho Co., Ltd. | | | 400 | | | | 6,612 | |
Viacom, Inc.—Class B | | | 1,620 | | | | 82,620 | |
Vivendi S.A. | | | 4,946 | | | | 137,740 | |
Walt Disney Co. (The) | | | 5,170 | | | | 201,837 | |
Washington Post Co. (The)—Class B | | | 53 | | | | 22,204 | |
Wolters Kluwer N.V. | | | 1,194 | | | | 26,497 | |
WPP plc | | | 5,049 | | | | 63,279 | |
| | | | | | | | |
| | | | | | | 1,805,882 | |
| | | | | | | | |
| | |
| Metals & Mining—0.9% | | | | | | | | |
Acerinox S.A. | | | 399 | | | | 7,290 | |
AK Steel Holding Corp. | | | 260 | | | | 4,098 | |
Alcoa, Inc. | | | 2,870 | | | | 45,518 | |
Allegheny Technologies, Inc. | | | 305 | | | | 19,358 | |
Alumina, Ltd. | | | 9,753 | | | | 22,084 | |
Anglo American plc | | | 5,277 | | | | 261,792 | |
Antofagasta plc | | | 1,576 | | | | 35,301 | |
ArcelorMittal | | | 3,431 | | | | 119,568 | |
BHP Billiton plc | | | 8,722 | | | | 343,636 | |
BHP Billiton, Ltd. | | | 12,836 | | | | 603,343 | |
BlueScope Steel, Ltd. | | | 7,363 | | | | 9,522 | |
Boliden AB | | | 1,093 | | | | 20,256 | |
Cliffs Natural Resources, Inc. | | | 425 | | | | 39,291 | |
Daido Steel Co., Ltd. | | | 1,000 | | | | 6,646 | |
Eramet | | | 21 | | | | 6,966 | |
Eurasian Natural Resources Corp. plc | | | 1,029 | | | | 12,921 | |
Fortescue Metals Group, Ltd. | | | 4,977 | | | | 33,916 | |
Freeport-McMoRan Copper & Gold, Inc. | | | 2,560 | | | | 135,424 | |
Fresnillo plc | | | 717 | | | | 16,152 | |
| | | | | | | | |
| | |
| Metals & Mining—(Continued) | | | | | | | | |
Glencore International plc | | | 3,320 | | | $ | 26,193 | |
Hitachi Metals, Ltd. | | | 1,000 | | | | 14,049 | |
Iluka Resources, Ltd. | | | 1,673 | | | | 30,127 | |
JFE Holdings, Inc. | | | 1,800 | | | | 49,193 | |
Kazakhmys plc | | | 856 | | | | 18,981 | |
Kobe Steel, Ltd. | | | 10,000 | | | | 22,568 | |
Lonmin plc | | | 647 | | | | 15,105 | |
Lynas Corp., Ltd.* (a) | | | 6,756 | | | | 13,380 | |
MacArthur Coal, Ltd. | | | 658 | | | | 7,732 | |
Maruichi Steel Tube, Ltd. | | | 200 | | | | 4,935 | |
Mitsubishi Materials Corp. | | | 4,000 | | | | 12,499 | |
Newcrest Mining, Ltd. | | | 3,058 | | | | 123,753 | |
Newmont Mining Corp. | | | 1,365 | | | | 73,669 | |
Nippon Steel Corp. | | | 20,000 | | | | 64,480 | |
Nisshin Steel Co., Ltd. | | | 3,000 | | | | 5,692 | |
Norsk Hydro ASA | | | 3,721 | | | | 28,597 | |
Nucor Corp. | | | 870 | | | | 35,861 | |
OneSteel, Ltd. | | | 5,335 | | | | 10,592 | |
Outokumpu OYJ | | | 512 | | | | 6,793 | |
OZ Minerals, Ltd. | | | 1,294 | | | | 18,330 | |
Randgold Resources, Ltd. | | | 364 | | | | 30,735 | |
Rautaruukki OYJ | | | 337 | | | | 7,626 | |
Rio Tinto plc | | | 5,782 | | | | 417,191 | |
Rio Tinto, Ltd. | | | 1,742 | | | | 155,144 | |
Salzgitter AG | | | 156 | | | | 11,915 | |
Sims Metal Management, Ltd. | | | 655 | | | | 12,406 | |
SSAB AB—A Shares | | | 626 | | | | 9,391 | |
Sumitomo Metal Industries, Ltd. | | | 13,000 | | | | 29,016 | |
Sumitomo Metal Mining Co., Ltd. | | | 2,000 | | | | 32,612 | |
ThyssenKrupp AG | | | 1,337 | | | | 69,584 | |
Titanium Metals Corp. | | | 200 | | | | 3,664 | |
United States Steel Corp. | | | 375 | | | | 17,265 | |
Vedanta Resources plc | | | 478 | | | | 16,083 | |
Voestalpine AG | | | 439 | | | | 24,270 | |
Xstrata plc | | | 8,295 | | | | 182,799 | |
Yamato Kogyo Co., Ltd. | | | 200 | | | | 6,185 | |
| | | | | | | | |
| | | | | | | 3,351,497 | |
| | | | | | | | |
| | |
| Multi-Utilities—0.3% | | | | | | | | |
A2A S.p.A. | | | 4,383 | | | | 6,837 | |
AGL Energy, Ltd. | | | 1,831 | | | | 28,786 | |
Ameren Corp. | | | 630 | | | | 18,169 | |
CenterPoint Energy, Inc. | | | 1,130 | | | | 21,865 | |
Centrica plc | | | 20,601 | | | | 107,018 | |
CMS Energy Corp. | | | 685 | | | | 13,488 | |
Consolidated Edison, Inc. | | | 805 | | | | 42,858 | |
See accompanying notes to financial statements.
17
MET INVESTORS SERIES TRUST
| | |
AllianceBernstein Global Dynamic Allocation Portfolio | | |
Schedule of Investments as of June 30, 2011 (Unaudited)
Common Stocks—(Continued)
| | | | | | | | |
| Security Description | |
Shares | | | Value | |
| | | | | | | | |
| | |
| Multi-Utilities—(Continued) | | | | | | | | |
Dominion Resources, Inc. | | | 1,560 | | | $ | 75,301 | |
DTE Energy Co. | | | 440 | | | | 22,009 | |
GDF Suez | | | 4,947 | | | | 181,308 | |
Integrys Energy Group, Inc. | | | 190 | | | | 9,850 | |
National Grid plc | | | 14,022 | | | | 138,000 | |
NiSource, Inc. | | | 750 | | | | 15,187 | |
PG&E Corp. | | | 1,065 | | | | 44,762 | |
Public Service Enterprise Group, Inc. | | | 1,370 | | | | 44,717 | |
RWE AG | | | 1,674 | | | | 92,958 | |
SCANA Corp. | | | 310 | | | | 12,205 | |
Sempra Energy | | | 680 | | | | 35,958 | |
TECO Energy, Inc. | | | 565 | | | | 10,673 | |
United Utilities Group plc | | | 2,724 | | | | 26,218 | |
Veolia Environnement S.A. | | | 1,396 | | | | 39,434 | |
Wisconsin Energy Corp. | | | 625 | | | | 19,594 | |
Xcel Energy, Inc. | | | 1,310 | | | | 31,833 | |
| | | | | | | | |
| | | | | | | 1,039,028 | |
| | | | | | | | |
| | |
| Multiline Retail—0.1% | | | | | | | | |
Big Lots, Inc.* | | | 190 | | | | 6,299 | |
Family Dollar Stores, Inc. | | | 340 | | | | 17,870 | |
Harvey Norman Holdings, Ltd. | | | 2,123 | | | | 5,673 | |
Isetan Mitsukoshi Holdings, Ltd. | | | 1,500 | | | | 14,601 | |
J Front Retailing Co., Ltd. | | | 2,000 | | | | 8,779 | |
JC Penney Co., Inc. | | | 575 | | | | 19,861 | |
Kohl’s Corp. | | | 785 | | | | 39,258 | |
Lifestyle International Holdings, Ltd. | | | 2,500 | | | | 7,357 | |
Macy’s, Inc. | | | 1,130 | | | | 33,041 | |
Marks & Spencer Group plc | | | 6,334 | | | | 36,781 | |
Marui Group Co., Ltd. | | | 900 | | | | 6,785 | |
Next plc | | | 720 | | | | 26,898 | |
Nordstrom, Inc. | | | 450 | | | | 21,123 | |
PPR | | | 304 | | | | 54,218 | |
Sears Holdings Corp.* | | | 115 | | | | 8,216 | |
Takashimaya Co., Ltd. | | | 1,000 | | | | 6,857 | |
Target Corp. | | | 1,940 | | | | 91,005 | |
| | | | | | | | |
| | | | | | | 404,622 | |
| | | | | | | | |
| | |
| Office Electronics—0.1% | | | | | | | | |
Brother Industries, Ltd. | | | 900 | | | | 13,225 | |
Canon, Inc. | | | 4,500 | | | | 212,598 | |
Konica Minolta Holdings, Inc. | | | 2,000 | | | | 16,591 | |
Neopost S.A. | | | 129 | | | | 11,099 | |
Ricoh Co., Ltd. | | | 3,000 | | | | 33,071 | |
Xerox Corp. | | | 3,800 | | | | 39,558 | |
| | | | | | | | |
| | | | | | | 326,142 | |
| | | | | | | | |
| | | | | | | | |
| | |
| Oil, Gas & Consumable Fuels—1.8% | | | | | | | | |
Alpha Natural Resources, Inc.* | | | 622 | | | $ | 28,235 | |
Anadarko Petroleum Corp. | | | 1,365 | | | | 104,777 | |
Apache Corp. | | | 1,055 | | | | 130,176 | |
BG Group plc | | | 13,542 | | | | 307,676 | |
BP plc | | | 75,139 | | | | 553,744 | |
Cabot Oil & Gas Corp. | | | 305 | | | | 20,225 | |
Cairn Energy plc* | | | 5,597 | | | | 37,304 | |
Caltex Australia, Ltd. | | | 540 | | | | 6,815 | |
Chesapeake Energy Corp. | | | 1,755 | | | | 52,106 | |
Chevron Corp. | | | 5,480 | | | | 563,563 | |
ConocoPhillips Co. | | | 3,920 | | | | 294,745 | |
CONSOL Energy, Inc. | | | 620 | | | | 30,058 | |
Cosmo Oil Co., Ltd. | | | 2,000 | | | | 5,654 | |
Denbury Resources, Inc.* | | | 1,065 | | | | 21,300 | |
Devon Energy Corp. | | | 1,180 | | | | 92,996 | |
El Paso Corp. | | | 2,060 | | | | 41,612 | |
ENI S.p.A. | | | 9,606 | | | | 227,545 | |
EOG Resources, Inc. | | | 745 | | | | 77,890 | |
EQT Corp. | | | 380 | | | | 19,958 | |
Essar Energy plc* | | | 1,303 | | | | 8,565 | |
Exxon Mobil Corp. | | | 13,565 | | | | 1,103,920 | |
Galp Energia SGPS S.A.—B Shares | | | 925 | | | | 22,099 | |
Hess Corp. | | | 810 | | | | 60,556 | |
Idemitsu Kosan Co., Ltd. | | | 100 | | | | 10,614 | |
Inpex Corp. | | | 9 | | | | 66,067 | |
Japan Petroleum Exploration Co. | | | 100 | | | | 4,669 | |
JX Holdings, Inc. | | | 9,000 | | | | 60,153 | |
Marathon Oil Corp. | | | 1,930 | | | | 101,672 | |
Murphy Oil Corp. | | | 555 | | | | 36,441 | |
Neste Oil OYJ | | | 513 | | | | 8,054 | |
Newfield Exploration Co.* | | | 370 | | | | 25,167 | |
Noble Energy, Inc. | | | 495 | | | | 44,367 | |
Occidental Petroleum Corp. | | | 2,235 | | | | 232,529 | |
OMV AG | | | 654 | | | | 28,614 | |
Origin Energy, Ltd. | | | 4,246 | | | | 71,949 | |
Paladin Energy, Ltd.* | | | 2,642 | | | | 7,145 | |
Peabody Energy Corp. | | | 745 | | | | 43,888 | |
Pioneer Natural Resources Co. | | | 315 | | | | 28,215 | |
QEP Resources, Inc. | | | 495 | | | | 20,706 | |
Range Resources Corp. | | | 435 | | | | 24,143 | |
Repsol YPF S.A. | | | 3,172 | | | | 110,288 | |
Royal Dutch Shell plc—A Shares | | | 14,245 | | | | 507,675 | |
Royal Dutch Shell plc—B Shares | | | 10,775 | | | | 385,047 | |
Santos, Ltd. | | | 3,499 | | | | 50,842 | |
Showa Shell Sekiyu KK | | | 700 | | | | 6,458 | |
Southwestern Energy Co.* | | | 935 | | | | 40,093 | |
See accompanying notes to financial statements.
18
MET INVESTORS SERIES TRUST
| | |
AllianceBernstein Global Dynamic Allocation Portfolio | | |
Schedule of Investments as of June 30, 2011 (Unaudited)
Common Stocks—(Continued)
| | | | | | | | |
| Security Description | |
Shares | | | Value | |
| | | | | | | | |
|
| Oil, Gas & Consumable Fuels—(Continued) | |
Spectra Energy Corp. | | | 1,750 | | | $ | 47,968 | |
Statoil ASA | | | 4,461 | | | | 113,367 | |
Sunoco, Inc. | | | 315 | | | | 13,139 | |
Tesoro Corp.* | | | 375 | | | | 8,591 | |
TonenGeneral Sekiyu KK | | | 1,000 | | | | 12,251 | |
Total S.A. | | | 8,452 | | | | 489,538 | |
Tullow Oil plc | | | 3,551 | | | | 70,751 | |
Valero Energy Corp. | | | 1,555 | | | | 39,761 | |
Williams Cos., Inc. (The) | | | 1,565 | | | | 47,341 | |
Woodside Petroleum, Ltd. | | | 2,495 | | | | 109,778 | |
| | | | | | | | |
| | | | | | | 6,678,800 | |
| | | | | | | | |
| | |
| Paper & Forest Products—0.0% | | | | | | | | |
Holmen AB—B Shares | | | 211 | | | | 6,602 | |
International Paper Co. | | | 1,185 | | | | 35,337 | |
MeadWestvaco Corp. | | | 440 | | | | 14,656 | |
Nippon Paper Group, Inc. | | | 400 | | | | 8,839 | |
OJI Paper Co., Ltd. | | | 3,000 | | | | 14,322 | |
Stora Enso OYJ—R Shares | | | 2,325 | | | | 24,430 | |
Svenska Cellulosa AB—B Shares | | | 2,292 | | | | 32,385 | |
UPM-Kymmene OYJ | | | 2,078 | | | | 38,057 | |
| | | | | | | | |
| | | | | | | 174,628 | |
| | | | | | | | |
| | |
| Personal Products—0.1% | | | | | | | | |
Avon Products, Inc. | | | 1,130 | | | | 31,640 | |
Beiersdorf AG | | | 403 | | | | 26,192 | |
Estee Lauder Cos., Inc. (The)—
Class A | | | 310 | | | | 32,609 | |
Kao Corp. | | | 2,100 | | | | 54,945 | |
L’Oreal S.A. | | | 958 | | | | 124,609 | |
Shiseido Co., Ltd. | | | 1,400 | | | | 26,023 | |
| | | | | | | | |
| | | | | | | 296,018 | |
| | | | | | | | |
| | |
| Pharmaceuticals—1.4% | | | | | | | | |
Abbott Laboratories | | | 4,230 | | | | 222,583 | |
Allergan, Inc. | | | 865 | | | | 72,011 | |
Astellas Pharma, Inc. | | | 1,800 | | | | 69,527 | |
AstraZeneca plc | | | 5,561 | | | | 277,713 | |
Bayer AG | | | 3,305 | | | | 266,113 | |
Bristol-Myers Squibb Co. | | | 4,615 | | | | 133,650 | |
Chugai Pharmaceutical Co., Ltd. | | | 900 | | | | 14,687 | |
Daiichi Sankyo Co., Ltd. | | | 2,700 | | | | 52,530 | |
Dainippon Sumitomo Pharma Co., Ltd. | | | 600 | | | | 5,677 | |
Eisai Co., Ltd. | | | 1,000 | | | | 38,874 | |
Elan Corp. plc* | | | 1,993 | | | | 23,151 | |
Eli Lilly & Co. | | | 2,750 | | | | 103,208 | |
| | | | | | | | |
|
| Pharmaceuticals—(Continued) | |
Forest Laboratories, Inc.* | | | 755 | | | $ | 29,702 | |
GlaxoSmithKline plc | | | 20,732 | | | | 444,384 | |
Hisamitsu Pharmaceutical Co., Inc. | | | 200 | | | | 8,494 | |
Hospira, Inc.* | | | 440 | | | | 24,930 | |
Johnson & Johnson | | | 7,470 | | | | 496,904 | |
Kyowa Hakko Kirin Co., Ltd. | | | 1,000 | | | | 9,486 | |
Merck & Co., Inc. | | | 8,405 | | | | 296,612 | |
Merck KGaA | | | 258 | | | | 28,081 | |
Mitsubishi Tanabe Pharma Corp. | | | 1,000 | | | | 16,678 | |
Mylan, Inc.* | | | 1,185 | | | | 29,234 | |
Novartis AG | | | 9,328 | | | | 570,978 | |
Novo Nordisk A.S.—Class B | | | 1,674 | | | | 210,411 | |
Ono Pharmaceutical Co., Ltd. | | | 300 | | | | 15,996 | |
Orion OYJ—Class B | | | 375 | | | | 9,678 | |
Otsuka Holdings Co., Ltd. | | | 1,003 | | | | 26,491 | |
Pfizer, Inc. | | | 21,845 | | | | 450,007 | |
Roche Holding AG | | | 2,808 | | | | 469,585 | |
Sanofi | | | 4,454 | | | | 358,629 | |
Santen Pharmaceutical Co., Ltd. | | | 300 | | | | 12,127 | |
Shionogi & Co., Ltd. | | | 1,200 | | | | 19,567 | |
Shire plc | | | 2,247 | | | | 70,224 | |
Taisho Pharmaceutical Co., Ltd. | | | 1,000 | | | | 22,444 | |
Takeda Pharmaceutical Co., Ltd. | | | 3,100 | | | | 142,805 | |
Teva Pharmaceutical Industries, Ltd. | | | 3,756 | | | | 180,677 | |
Tsumura & Co. | | | 200 | | | | 6,374 | |
UCB S.A. | | | 403 | | | | 18,135 | |
Watson Pharmaceuticals, Inc.* | | | 370 | | | | 25,430 | |
| | | | | | | | |
| | | | | | | 5,273,787 | |
| | | | | | | | |
|
| Professional Services—0.1% | |
Adecco S.A.* | | | 530 | | | | 33,954 | |
Bureau Veritas S.A. | | | 218 | | | | 18,440 | |
Capita Group plc (The) | | | 2,449 | | | | 28,155 | |
Dun & Bradstreet Corp. | | | 125 | | | | 9,442 | |
Equifax, Inc. | | | 315 | | | | 10,937 | |
Experian plc | | | 3,995 | | | | 50,936 | |
Intertek Group plc | | | 638 | | | | 20,226 | |
Randstad Holding N.V. | | | 476 | | | | 22,036 | |
Robert Half International, Inc. | | | 380 | | | | 10,271 | |
SGS S.A. | | | 22 | | | | 41,733 | |
| | | | | | | | |
| | | | | | | 246,130 | |
| | | | | | | | |
|
| Real Estate Investment Trusts—0.3% | |
Apartment Investment & Management Co.—Class A | | | 315 | | | | 8,042 | |
Ascendas Real Estate Investment Trust | | | 7,000 | | | | 11,634 | |
AvalonBay Communities, Inc. | | | 245 | | | | 31,458 | |
See accompanying notes to financial statements.
19
MET INVESTORS SERIES TRUST
| | |
AllianceBernstein Global Dynamic Allocation Portfolio | | |
Schedule of Investments as of June 30, 2011 (Unaudited)
Common Stocks—(Continued)
| | | | | | | | |
| Security Description | |
Shares | | | Value | |
| | | | | | | | |
|
| Real Estate Investment Trusts—(Continued) | |
Boston Properties, Inc. | | | 425 | | | $ | 45,118 | |
British Land Co. plc | | | 3,363 | | | | 32,908 | |
Capital Shopping Centres Group plc | | | 2,232 | | | | 14,328 | |
CapitaMall Trust | | | 7,000 | | | | 10,664 | |
CFS Retail Property Trust | | | 7,377 | | | | 14,369 | |
Corio N.V. | | | 236 | | | | 15,664 | |
Dexus Property Group | | | 19,342 | | | | 18,266 | |
Equity Residential | | | 810 | | | | 48,600 | |
Fonciere Des Regions | | | 110 | | | | 11,670 | |
Gecina S.A. | | | 88 | | | | 12,317 | |
Goodman Group | | | 27,551 | | | | 20,844 | |
GPT Group | | | 7,046 | | | | 23,894 | |
Hammerson plc | | | 2,825 | | | | 21,852 | |
HCP, Inc. | | | 1,065 | | | | 39,075 | |
Health Care REIT, Inc. | | | 495 | | | | 25,953 | |
Host Hotels & Resorts, Inc. | | | 1,815 | | | | 30,764 | |
ICADE | | | 93 | | | | 11,485 | |
Japan Prime Realty Investment Corp. | | | 3 | | | | 7,924 | |
Japan Real Estate Investment Corp. | | | 2 | | | | 19,617 | |
Japan Retail Fund Investment Corp. | | | 6 | | | | 9,211 | |
Kimco Realty Corp. | | | 1,070 | | | | 19,945 | |
Klepierre | | | 417 | | | | 17,239 | |
Land Securities Group plc | | | 3,078 | | | | 42,162 | |
Link REIT (The) | | | 9,000 | | | | 30,765 | |
Mirvac Group | | | 13,653 | | | | 18,315 | |
Nippon Building Fund, Inc. | | | 2 | | | | 19,493 | |
Nomura Real Estate Office Fund, Inc. | | | 1 | | | | 6,597 | |
Plum Creek Timber Co., Inc. | | | 435 | | | | 17,635 | |
ProLogis, Inc. | | | 1,130 | | | | 40,505 | |
Public Storage | | | 375 | | | | 42,754 | |
Segro plc | | | 2,964 | | | | 14,873 | |
Simon Property Group, Inc. | | | 810 | | | | 94,146 | |
Stockland | | | 9,525 | | | | 34,856 | |
Unibail-Rodamco SE | | | 367 | | | | 84,989 | |
Ventas, Inc. | | | 440 | | | | 23,192 | |
Vornado Realty Trust | | | 440 | | | | 40,999 | |
Westfield Group | | | 8,768 | | | | 81,485 | |
Westfield Retail Trust | | | 11,597 | | | | 33,727 | |
Weyerhaeuser Co. | | | 1,440 | | | | 31,478 | |
| | | | | | | | |
| | | | | | | 1,180,812 | |
| | | | | | | | |
|
| Real Estate Management & Development—0.2% | |
Aeon Mall Co., Ltd. | | | 300 | | | | 7,224 | |
CapitaLand, Ltd. | | | 10,000 | | | | 23,708 | |
CapitaMalls Asia, Ltd. | | | 5,400 | | | | 6,467 | |
CB Richard Ellis Group, Inc.—Class A* | | | 755 | | | | 18,958 | |
Cheung Kong Holdings, Ltd. | | | 6,000 | | | | 87,745 | |
City Developments, Ltd. | | | 2,000 | | | | 16,946 | |
Daito Trust Construction Co., Ltd. | | | 300 | | | | 25,333 | |
| | | | | | | | |
|
| Real Estate Management & Development—(Continued) | |
Daiwa House Industry Co., Ltd. | | | 2,000 | | | $ | 25,073 | |
Global Logistic Properties, Ltd.* | | | 7,300 | | | | 12,251 | |
Hang Lung Group, Ltd. | | | 3,000 | | | | 19,006 | |
Hang Lung Properties, Ltd. | | | 10,000 | | | | 41,123 | |
Henderson Land Development Co., Ltd. | | | 4,000 | | | | 25,856 | |
Hopewell Holdings, Ltd. | | | 2,500 | | | | 7,919 | |
Hysan Development Co., Ltd. | | | 2,000 | | | | 9,921 | |
IMMOFINANZ AG* | | | 3,756 | | | | 16,038 | |
Keppel Land, Ltd. | | | 3,000 | | | | 8,848 | |
Kerry Properties, Ltd. | | | 3,000 | | | | 14,476 | |
Lend Lease Group | | | 2,147 | | | | 20,667 | |
Mitsubishi Estate Co., Ltd. | | | 5,000 | | | | 87,172 | |
Mitsui Fudosan Co., Ltd. | | | 3,000 | | | | 51,262 | |
New World Development, Ltd. | | | 9,000 | | | | 13,601 | |
Nomura Real Estate Holdings, Inc. | | | 400 | | | | 6,622 | |
NTT Urban Development Corp. | | | 4 | | | | 3,412 | |
Sino Land Co., Ltd. | | | 10,000 | | | | 16,064 | |
Sumitomo Realty & Development Co., Ltd. | | | 1,000 | | | | 22,184 | |
Sun Hung Kai Properties, Ltd. | | | 6,000 | | | | 87,129 | |
Swire Pacific, Ltd.—Class A | | | 3,000 | | | | 44,143 | |
Tokyu Land Corp. | | | 2,000 | | | | 8,432 | |
UOL Group, Ltd. | | | 2,000 | | | | 8,114 | |
Wharf Holdings, Ltd. | | | 6,000 | | | | 41,675 | |
Wheelock & Co., Ltd. | | | 4,000 | | | | 16,089 | |
| | | | | | | | |
| | | | | | | 793,458 | |
| | | | | | | | |
|
| Road & Rail—0.2% | |
Asciano, Ltd. | | | 11,696 | | | | 20,585 | |
Central Japan Railway Co. | | | 6 | | | | 47,021 | |
ComfortDelGro Corp., Ltd. | | | 7,000 | | | | 8,326 | |
CSX Corp. | | | 3,000 | | | | 78,660 | |
DSV A.S. | | | 836 | | | | 20,072 | |
East Japan Railway Co. | | | 1,300 | | | | 74,152 | |
Keikyu Corp. | | | 2,000 | | | | 14,384 | |
Keio Corp. | | | 2,000 | | | | 10,986 | |
Keisei Electric Railway Co., Ltd. | | | 1,000 | | | | 5,890 | |
Kintetsu Corp. | | | 6,000 | | | | 19,195 | |
MTR Corp. | | | 5,500 | | | | 19,508 | |
Nippon Express Co., Ltd. | | | 3,000 | | | | 12,090 | |
Norfolk Southern Corp. | | | 990 | | | | 74,181 | |
Odakyu Electric Railway Co., Ltd. | | | 2,000 | | | | 15,822 | |
QR National, Ltd.* | | | 6,827 | | | | 24,763 | |
Ryder System, Inc. | | | 130 | | | | 7,391 | |
Tobu Railway Co., Ltd. | | | 4,000 | | | | 16,765 | |
Tokyu Corp. | | | 4,000 | | | | 16,566 | |
Union Pacific Corp. | | | 1,365 | | | | 142,506 | |
See accompanying notes to financial statements.
20
MET INVESTORS SERIES TRUST
| | |
AllianceBernstein Global Dynamic Allocation Portfolio | | |
Schedule of Investments as of June 30, 2011 (Unaudited)
Common Stocks—(Continued)
| | | | | | | | |
| Security Description | |
Shares | | | Value | |
| | | | | | | | |
|
| Road & Rail—(Continued) | |
West Japan Railway Co. | | | 700 | | | $ | 27,255 | |
| | | | | | | | |
| | | | | | | 656,118 | |
| | | | | | | | |
|
| Semiconductors & Semiconductor Equipment—0.3% | |
Advanced Micro Devices, Inc.* | | | 1,560 | | | | 10,904 | |
Advantest Corp. | | | 600 | | | | 10,952 | |
Altera Corp. | | | 870 | | | | 40,325 | |
Analog Devices, Inc. | | | 810 | | | | 31,703 | |
Applied Materials, Inc. | | | 3,560 | | | | 46,316 | |
ARM Holdings plc | | | 5,376 | | | | 50,792 | |
ASM Pacific Technology, Ltd. | | | 800 | | | | 10,959 | |
ASML Holding N.V. | | | 1,724 | | | | 63,598 | |
Broadcom Corp.—Class A* | | | 1,305 | | | | 43,900 | |
Elpida Memory, Inc.* | | | 800 | | | | 9,325 | |
First Solar, Inc.* | | | 180 | | | | 23,809 | |
Infineon Technologies AG | | | 4,344 | | | | 48,908 | |
Intel Corp. | | | 15,000 | | | | 332,400 | |
KLA-Tencor Corp. | | | 440 | | | | 17,811 | |
Linear Technology Corp. | | | 620 | | | | 20,472 | |
LSI Corp.* | | | 1,680 | | | | 11,962 | |
MEMC Electronic Materials, Inc.* | | | 625 | | | | 5,331 | |
Microchip Technology, Inc. | | | 500 | | | | 18,955 | |
Micron Technology, Inc.* | | | 2,310 | | | | 17,279 | |
National Semiconductor Corp. | | | 630 | | | | 15,504 | |
Novellus Systems, Inc.* | | | 250 | | | | 9,035 | |
NVIDIA Corp.* | | | 1,560 | | | | 24,859 | |
Renewable Energy Corp. ASA* | | | 1,993 | | | | 3,439 | |
Rohm Co., Ltd. | | | 400 | | | | 22,791 | |
STMicroelectronics N.V. | | | 2,547 | | | | 25,417 | |
Sumco Corp.* | | | 500 | | | | 8,382 | |
Teradyne, Inc.* | | | 500 | | | | 7,400 | |
Texas Instruments, Inc. | | | 3,180 | | | | 104,399 | |
Tokyo Electron, Ltd. | | | 700 | | | | 37,932 | |
Xilinx, Inc. | | | 690 | | | | 25,164 | |
| | | | | | | | |
| | | | | | | 1,100,023 | |
| | | | | | | | |
| | |
| Software—0.4% | | | | | | | | |
Adobe Systems, Inc.* | | | 1,370 | | | | 43,086 | |
Autodesk, Inc.* | | | 625 | | | | 24,125 | |
Autonomy Corp. plc* | | | 922 | | | | 25,289 | |
BMC Software, Inc.* | | | 495 | | | | 27,077 | |
CA, Inc. | | | 1,005 | | | | 22,954 | |
Citrix Systems, Inc.* | | | 500 | | | | 40,000 | |
Compuware Corp.* | | | 570 | | | | 5,563 | |
Dassault Systemes S.A. | | | 237 | | | | 20,208 | |
Electronic Arts, Inc.* | | | 880 | | | | 20,768 | |
Intuit, Inc.* | | | 745 | | | | 38,636 | |
| | | | | | | | |
| | |
| Software—(Continued) | | | | | | | | |
Konami Corp. | | | 400 | | | $ | 9,404 | |
Microsoft Corp. | | | 20,175 | | | | 524,550 | |
NICE Systems, Ltd.* | | | 242 | | | | 8,717 | |
Nintendo Co., Ltd. | | | 400 | | | | 74,747 | |
Oracle Corp. | | | 10,590 | | | | 348,517 | |
Oracle Corp. Japan | | | 100 | | | | 4,340 | |
Red Hat, Inc.* | | | 505 | | | | 23,180 | |
Sage Group plc (The) | | | 5,280 | | | | 24,510 | |
Salesforce.com, Inc.* | | | 315 | | | | 46,929 | |
SAP AG | | | 3,678 | | | | 223,018 | |
Square Enix Holdings Co., Ltd. | | | 200 | | | | 3,581 | |
Symantec Corp.* | | | 2,060 | | | | 40,623 | |
Trend Micro, Inc. | | | 400 | | | | 12,345 | |
| | | | | | | | |
| | | | | | | 1,612,167 | |
| | | | | | | | |
| | |
| Specialty Retail—0.3% | | | | | | | | |
ABC-Mart, Inc. | | | 100 | | | | 4,042 | |
Abercrombie & Fitch Co.—Class A | | | 255 | | | | 17,065 | |
AutoNation, Inc.* | | | 155 | | | | 5,674 | |
AutoZone, Inc.* | | | 75 | | | | 22,114 | |
Bed Bath & Beyond, Inc.* | | | 705 | | | | 41,151 | |
Best Buy Co., Inc. | | | 865 | | | | 27,170 | |
CarMax, Inc.* | | | 600 | | | | 19,842 | |
Esprit Holdings, Ltd. | | | 4,900 | | | | 15,238 | |
Fast Retailing Co., Ltd. | | | 200 | | | | 32,166 | |
GameStop Corp.—Class A* | | | 375 | | | | 10,001 | |
Gap, Inc. (The) | | | 1,120 | | | | 20,272 | |
Hennes & Mauritz AB—B Shares | | | 4,087 | | | | 141,433 | |
Home Depot, Inc. (The) | | | 4,480 | | | | 162,266 | |
Inditex S.A. | | | 872 | | | | 79,584 | |
Kingfisher plc | | | 9,448 | | | | 40,564 | |
Limited Brands, Inc. | | | 710 | | | | 27,299 | |
Lowe’s Cos., Inc. | | | 3,770 | | | | 87,879 | |
Nitori Holdings Co., Ltd. | | | 150 | | | | 14,192 | |
O’Reilly Automotive, Inc.* | | | 375 | | | | 24,566 | |
Ross Stores, Inc. | | | 335 | | | | 26,840 | |
Shimamura Co., Ltd. | | | 100 | | | | 9,498 | |
Staples, Inc. | | | 1,945 | | | | 30,731 | |
Tiffany & Co. | | | 340 | | | | 26,697 | |
TJX Cos., Inc. (The) | | | 1,085 | | | | 56,995 | |
Urban Outfitters, Inc.* | | | 340 | | | | 9,571 | |
USS Co., Ltd. | | | 90 | | | | 6,953 | |
Yamada Denki Co., Ltd. | | | 330 | | | | 26,721 | |
| | | | | | | | |
| | | | | | | 986,524 | |
| | | | | | | | |
|
| Textiles, Apparel & Luxury Goods—0.2% | |
Adidas AG | | | 836 | | | | 66,415 | |
See accompanying notes to financial statements.
21
MET INVESTORS SERIES TRUST
| | |
AllianceBernstein Global Dynamic Allocation Portfolio | | |
Schedule of Investments as of June 30, 2011 (Unaudited)
Common Stocks—(Continued)
| | | | | | | | |
| Security Description | |
Shares | | | Value | |
| | | | | | | | |
|
| Textiles, Apparel & Luxury Goods—(Continued) | |
Asics Corp. | | | 1,000 | | | $ | 14,843 | |
Burberry Group plc | | | 1,742 | | | | 40,586 | |
Christian Dior S.A. | | | 218 | | | | 34,352 | |
Coach, Inc. | | | 810 | | | | 51,783 | |
Compagnie Financiere Richemont S.A.—Class A | | | 2,086 | | | | 136,488 | |
Luxottica Group S.p.A. | | | 466 | | | | 14,971 | |
LVMH Moet Hennessy Louis Vuitton S.A. | | | 981 | | | | 176,812 | |
NIKE, Inc.—Class B | | | 1,055 | | | | 94,929 | |
Pandora A.S. | | | 234 | | | | 7,363 | |
Polo Ralph Lauren Corp. | | | 185 | | | | 24,533 | |
Swatch Group AG (The) | | | 307 | | | | 78,469 | |
VF Corp. | | | 245 | | | | 26,597 | |
Yue Yuen Industrial Holdings, Ltd. | | | 3,000 | | | | 9,523 | |
| | | | | | | | |
| | | | | | | 777,664 | |
| | | | | | | | |
| | |
| Thrifts & Mortgage Finance—0.0% | | | | | | | | |
Hudson City Bancorp., Inc. | | | 1,435 | | | | 11,752 | |
People’s United Financial, Inc. | | | 945 | | | | 12,701 | |
| | | | | | | | |
| | | | | | | 24,453 | |
| | | | | | | | |
| | |
| Tobacco—0.3% | | | | | | | | |
Altria Group, Inc. | | | 5,675 | | | | 149,877 | |
British American Tobacco plc | | | 7,981 | | | | 350,220 | |
Imperial Tobacco Group plc | | | 4,070 | | | | 135,437 | |
Japan Tobacco, Inc. | | | 18 | | | | 69,080 | |
Lorillard, Inc. | | | 430 | | | | 46,814 | |
Philip Morris International, Inc. | | | 4,915 | | | | 328,175 | |
Reynolds American, Inc. | | | 930 | | | | 34,456 | |
Swedish Match AB | | | 877 | | | | 29,514 | |
| | | | | | | | |
| | | | | | | 1,143,573 | |
| | | | | | | | |
|
| Trading Companies & Distributors—0.2% | |
Brenntag AG | | | 134 | | | | 15,601 | |
Bunzl plc | | | 1,320 | | | | 16,544 | |
Fastenal Co. | | | 810 | | | | 29,152 | |
ITOCHU Corp. | | | 6,000 | | | | 61,976 | |
Marubeni Corp. | | | 6,000 | | | | 39,581 | |
Mitsubishi Corp. | | | 5,400 | | | | 133,920 | |
Mitsui & Co., Ltd. | | | 6,900 | | | | 118,415 | |
Noble Group, Ltd. | | | 15,000 | | | | 24,074 | |
Sojitz Corp. | | | 5,000 | | | | 9,300 | |
Sumitomo Corp. | | | 4,500 | | | | 60,766 | |
Toyota Tsusho Corp. | | | 800 | | | | 13,620 | |
W.W. Grainger, Inc. | | | 180 | | | | 27,657 | |
| | | | | | | | |
|
| Trading Companies & Distributors—(Continued) | |
Wolseley plc | | | 1,137 | | | $ | 37,123 | |
| | | | | | | | |
| | | | | | | 587,729 | |
| | | | | | | | |
|
| Transportation Infrastructure—0.1% | |
Abertis Infraestructuras S.A. | | | 1,477 | | | | 33,046 | |
Aeroports de Paris | | | 138 | | | | 13,002 | |
Atlantia S.p.A. | | | 1,260 | | | | 26,864 | |
Auckland International Airport, Ltd. | | | 3,688 | | | | 6,797 | |
Fraport AG Frankfurt Airport Services Worldwide | | | 147 | | | | 11,838 | |
Groupe Eurotunnel S.A. | | | 2,101 | | | | 23,526 | |
Hutchison Port Holdings Trust* | | | 20,900 | | | | 17,661 | |
Kamigumi Co., Ltd. | | | 1,000 | | | | 9,312 | |
Koninklijke Vopak N.V. | | | 281 | | | | 13,790 | |
MAp Group | | | 1,488 | | | | 5,334 | |
Mitsubishi Logistics Corp. | | | 1,000 | | | | 11,172 | |
Transurban Group | | | 5,193 | | | | 29,146 | |
| | | | | | | | |
| | | | | | | 201,488 | |
| | | | | | | | |
|
| Water Utilities—0.0% | |
Severn Trent plc | | | 948 | | | | 22,422 | |
| | | | | | | | |
|
| Wireless Telecommunication Services—0.3% | |
American Tower Corp.—Class A* | | | 1,065 | | | | 55,731 | |
Cellcom Israel, Ltd. | | | 219 | | | | 6,085 | |
KDDI Corp. | | | 12 | | | | 85,858 | |
MetroPCS Communications, Inc.* | | | 690 | | | | 11,875 | |
Millicom International Cellular S.A. | | | 304 | | | | 31,835 | |
Mobistar S.A. | | | 120 | | | | 9,129 | |
NTT DoCoMo, Inc. | | | 61 | | | | 108,165 | |
Partner Communications Co., Ltd. | | | 342 | | | | 5,159 | |
SOFTBANK Corp. | | | 3,500 | | | | 131,502 | |
Sprint Nextel Corp.* | | | 8,155 | | | | 43,955 | |
StarHub, Ltd. | | | 2,000 | | | | 4,546 | |
Vodafone Group plc | | | 206,959 | | | | 549,692 | |
| | | | | | | | |
| | | | | | | 1,043,532 | |
| | | | | | | | |
Total Common Stocks
(Cost $77,021,195) | | | | | | | 78,599,850 | |
| | | | | | | | |
|
| Investment Company Securities—7.7% | |
iShares Russell 2000 Index Fund | | | 92,300 | | | | 7,642,440 | |
Midcap SPDR Trust Series I | | | 43,100 | | | | 7,645,940 | |
Vanguard MSCI Emerging Markets ETF | | | 287,300 | | | | 13,968,526 | |
| | | | | | | | |
Total Investment Company Securities
(Cost $28,723,036) | | | | | | | 29,256,906 | |
| | | | | | | | |
See accompanying notes to financial statements.
22
MET INVESTORS SERIES TRUST
| | |
AllianceBernstein Global Dynamic Allocation Portfolio | | |
Schedule of Investments as of June 30, 2011 (Unaudited)
U.S. Treasury & Government Agencies—18.3%
| | | | | | | | |
| Security Description | | Par
Amount | | | Value | |
| | | | | | | | |
|
| Federal Agencies—3.3% | |
Federal Home Loan Banks
1.750%, 12/14/12 | | $ | 10,000 | | | $ | 10,191 | |
4.750%, 12/16/16 | | | 245,000 | | | | 278,338 | |
2.500%, 06/13/14 | | | 3,160,000 | | | | 3,306,400 | |
0.875%, 08/22/12 | | | 10,000 | | | | 10,062 | |
Freddie Mac
5.000%, 07/15/14 | | | 4,970,000 | | | | 5,559,586 | |
4.375%, 07/17/15 | | | 35,000 | | | | 38,853 | |
Fannie Mae
4.750%, 02/21/13 | | | 10,000 | | | | 10,702 | |
1.750%, 05/07/13 | | | 50,000 | | | | 51,147 | |
4.625%, 10/15/13 | | | 10,000 | | | | 10,911 | |
2.375%, 04/11/16 | | | 966,000 | | | | 987,218 | |
2.750%, 03/13/14 | | | 10,000 | | | | 10,526 | |
7.250%, 05/15/30 | | | 541,000 | | | | 731,126 | |
5.375%, 06/12/17 | | | 756,000 | | | | 881,029 | |
3.875%, 07/12/13 | | | 799,000 | | | | 854,239 | |
5.250%, 09/15/16 | | | 10,000 | | | | 11,546 | |
| | | | | | | | |
| | | | | | | 12,751,874 | |
| | | | | | | | |
|
| U.S. Treasury—15.0% | |
U.S. Treasury Bonds
6.250%, 08/15/23 | | | 2,005,000 | | | | 2,543,844 | |
8.875%, 02/15/19 | | | 683,000 | | | | 984,480 | |
7.250%, 05/15/16 | | | 3,825,000 | | | | 4,829,659 | |
6.000%, 02/15/26 | | | 517,000 | | | | 643,584 | |
5.375%, 02/15/31 | | | 935,000 | | | | 1,095,049 | |
3.500%, 02/15/39 | | | 3,899,000 | | | | 3,348,875 | |
4.375%, 05/15/40 | | | 1,255,000 | | | | 1,254,418 | |
U.S. Treasury Notes
4.625%, 07/31/12 | | | 1,190,000 | | | | 1,246,386 | |
4.000%, 11/15/12 | | | 3,449,000 | | | | 3,622,799 | |
3.625%, 05/15/13 | | | 2,011,000 | | | | 2,130,560 | |
0.750%, 08/15/13 | | | 8,315,000 | | | | 8,329,759 | |
2.000%, 11/30/13 | | | 3,259,000 | | | | 3,367,974 | |
2.625%, 07/31/14 | | | 1,650,000 | | | | 1,739,590 | |
2.000%, 04/30/16 | | | 4,002,000 | | | | 4,063,299 | |
3.125%, 10/31/16 | | | 10,195,000 | | | | 10,838,559 | |
2.750%, 02/15/19 | | | 2,763,000 | | | | 2,789,983 | |
2.625%, 11/15/20 | | | 2,009,000 | | | | 1,935,232 | |
3.625%, 02/15/21 | | | 2,060,000 | | | | 2,148,355 | |
| | | | | | | | |
| | | | | | | 56,912,405 | |
| | | | | | | | |
Total U.S. Treasury & Government Agencies
(Cost $70,014,346) | | | | | | | 69,664,279 | |
| | | | | | | | |
| Preferred Stocks—0.1% | |
| Security Description | | Shares/Par
Amount | | | Value | |
| | | | | | | | |
|
| Automobiles—0.1% | |
Bayerische Motoren Werke (BMW) AG | | | 209 | | | $ | 13,306 | |
Porsche Automobil Holding SE | | | 612 | | | | 48,619 | |
Volkswagen AG | | | 578 | | | | 119,497 | |
| | | | | | | | |
| | | | | | | 181,422 | |
| | | | | | | | |
|
| Household Products—0.0% | |
Henkel AG & Co. KGaA | | | 712 | | | | 49,501 | |
| | | | | | | | |
|
| Media—0.0% | |
ProSiebenSat.1 Media AG* | | | 306 | | | | 8,689 | |
| | | | | | | | |
|
| Multi-Utilities—0.0% | |
RWE AG | | | 156 | | | | 7,974 | |
| | | | | | | | |
Total Preferred Stocks
(Cost $223,441) | | | | | | | 247,586 | |
| | | | | | | | |
|
| Rights—0.0% | |
|
| Commercial Banks—0.0% | |
Banco Popular Espanol S.A.* | | | 3,848 | | | | 279 | |
CaixaBank* | | | 3,360 | | | | 254 | |
| | | | | | | | |
| | | | | | | 533 | |
| | | | | | | | |
Total Rights
(Cost $521) | | | | | | | 533 | |
| | | | | | | | |
|
| Short-Term Investments—51.7% | |
| | |
| Repurchase Agreement—51.7% | | | | | | | | |
Fixed Income Clearing Corp. Repurchase Agreement dated 06/30/11 at 0.010% to be repurchased at $196,342,055 on 07/01/11 collateralized by $198,535,000 Fannie Mae at 1.080% due 03/30/12 with a value of $200,272,181.
(Cost—$196,342,000) | | $ | 196,342,000 | | | | 196,342,000 | |
| | | | | | | | |
Total Short-Term Investments
(Cost $196,342,000) | | | | | | | 196,342,000 | |
| | | | | | | | |
Total Investments—98.5%
(Cost $372,324,539#) | | | | | | | 374,111,154 | |
Other Assets and Liabilities
(net)—1.5% | | | | | | | 5,605,754 | |
| | | | | | | | |
| Net Assets—100.0% | | | | | | $ | 379,716,908 | |
| | | | | | | | |
See accompanying notes to financial statements.
23
MET INVESTORS SERIES TRUST
| | |
AllianceBernstein Global Dynamic Allocation Portfolio | | |
Schedule of Investments as of June 30, 2011 (Unaudited)
| * | Non-income producing security. |
| # | As of June 30, 2011, the aggregate cost of investments for federal income tax purposes was $372,324,539. The aggregate unrealized appreciation and depreciation of investments were $2,636,055 and $(849,440), respectively, resulting in net unrealized appreciation of $1,786,615 for federal income tax purposes. |
| (a) | Security was valued in good faith under procedures approved by the Board of Trustees. |
| ADR— | An American Depositary Receipt is a certificate issued by a custodian bank representing the right to receive securities of the foreign issuer described. Trading on exchanges not located in the United States or Canada significantly influences the value of ADRs. |
| PC— | Participation Certificate |
| PPS— | Price Protected Shares |
| RSP— | Risparmio (Convertible Savings Shares) |
See accompanying notes to financial statements.
24
MET INVESTORS SERIES TRUST
| | |
AllianceBernstein Global Dynamic Allocation Portfolio | | |
Schedule of Investments as of June 30, 2011 (Unaudited)
FAIR VALUE HIERARCHY
Accounting principles generally accepted in the United States of America (“GAAP”) defines fair market value as the price that the Portfolio would receive to sell an asset or pay to transfer a liability in an orderly transaction between market participants at the measurement date. It establishes a fair value hierarchy that prioritizes inputs to valuation methods and requires disclosure of the fair value hierarchy that segregates fair value measurements into three levels. Levels 1, 2 and 3 of the fair value hierarchy are defined as follows:
Level 1 - unadjusted quoted prices in active markets for identical investments
Level 2 - other significant observable inputs (including, but not limited to, unadjusted quoted prices for similar investments in markets that are either active or inactive; inputs other than quoted prices that are observable such as interest rates, yield curves, volatilities, prepayment speeds, loss severities, credit risks, default rates, etc.)
Level 3 - significant unobservable inputs based on the best information available in the circumstances, to the extent observable inputs are unavailable (including the Portfolio’s own assumptions in determining the fair value of investments)
The inputs or methodologies used for valuing investments are not necessarily an indication of the risk associated with investing in them. For a change in the methodology used, transfers between levels will be recognized as of the beginning of the reporting period. Information on transfers between Level 1 and Level 2 deemed significant, if any, will be disclosed following the valuation table below. For the period from May 2, 2011 (commencement of operations) through June 30, 2011, there were no transfers between Levels 1 and 2. A reconciliation of Level 3 securities, if any, will also be disclosed following the valuation table. For more information about the Portfolio’s policy regarding the valuation of investments, please refer to the Notes to Financial Statements.
The following table summarizes the fair value hierarchy of the Portfolio’s investments as of June 30, 2011:
| | | | | | | | | | | | | | | | |
| Description | | Level 1 | | | Level 2 | | | Level 3 | | | Total | |
Common Stocks | | | | | | | | | | | | | | | | |
Aerospace & Defense | | $ | 950,199 | | | $ | 302,187 | | | $ | — | | | $ | 1,252,386 | |
Air Freight & Logistics | | | 341,584 | | | | 130,217 | | | | — | | | | 471,801 | |
Airlines | | | 33,070 | | | | 96,570 | | | | — | | | | 129,640 | |
Auto Components | | | 86,178 | | | | 395,009 | | | | — | | | | 481,187 | |
Automobiles | | | 168,126 | | | | 1,474,330 | | | | — | | | | 1,642,456 | |
Beverages | | | 832,822 | | | | 906,503 | | | | — | | | | 1,739,325 | |
Biotechnology | | | 402,146 | | | | 109,547 | | | | — | | | | 511,693 | |
Building Products | | | 11,368 | | | | 297,130 | | | | — | | | | 308,498 | |
Capital Markets | | | 766,488 | | | | 973,071 | | | | — | | | | 1,739,559 | |
Chemicals | | | 715,054 | | | | 1,737,020 | | | | — | | | | 2,452,074 | |
Commercial Banks | | | 877,133 | | | | 5,706,880 | | | | — | | | | 6,584,013 | |
Commercial Services & Supplies | | | 155,340 | | | | 279,405 | | | | — | | | | 434,745 | |
Communications Equipment | | | 650,156 | | | | 325,030 | | | | — | | | | 975,186 | |
Computers & Peripherals | | | 1,407,270 | | | | 154,777 | | | | — | | | | 1,562,047 | |
Construction & Engineering | | | 57,260 | | | | 383,231 | | | | — | | | | 440,491 | |
Construction Materials | | | 31,695 | | | | 264,587 | | | | — | | | | 296,282 | |
Consumer Finance | | | 274,967 | | | | 14,107 | | | | — | | | | 289,074 | |
Containers & Packaging | | | 47,410 | | | | 69,426 | | | | — | | | | 116,836 | |
Distributors | | | 22,576 | | | | 78,853 | | | | — | | | | 101,429 | |
Diversified Consumer Services | | | 37,770 | | | | 12,853 | | | | — | | | | 50,623 | |
Diversified Financial Services | | | 1,227,547 | | | | 598,615 | | | | — | | | | 1,826,162 | |
Diversified Telecommunication Services | | | 914,466 | | | | 1,567,627 | | | | — | | | | 2,482,093 | |
Electric Utilities | | | 600,348 | | | | 1,164,917 | | | | — | | | | 1,765,265 | |
Electrical Equipment | | | 168,954 | | | | 728,505 | | | | — | | | | 897,459 | |
Electronic Equipment, Instruments & Components | | | 138,210 | | | | 510,904 | | | | — | | | | 649,114 | |
Energy Equipment & Services | | | 780,769 | | | | 439,369 | | | | — | | | | 1,220,138 | |
Food & Staples Retailing | | | 770,640 | | | | 1,017,269 | | | | — | | | | 1,787,909 | |
Food Products | | | 584,527 | | | | 1,733,260 | | | | — | | | | 2,317,787 | |
Gas Utilities | | | 29,786 | | | | 211,740 | | | | — | | | | 241,526 | |
Health Care Equipment & Supplies | | | 639,005 | | | | 316,921 | | | | — | | | | 955,926 | |
See accompanying notes to financial statements.
25
MET INVESTORS SERIES TRUST
| | |
AllianceBernstein Global Dynamic Allocation Portfolio | | |
Schedule of Investments as of June 30, 2011 (Unaudited)
FAIR VALUE HIERARCHY—(Continued)
| | | | | | | | | | | | | | | | |
| Description | | Level 1 | | | Level 2 | | | Level 3 | | | Total | |
Health Care Providers & Services | | $ | 739,684 | | | $ | 167,769 | | | $ | — | | | $ | 907,453 | |
Health Care Technology | | | 23,222 | | | | — | | | | — | | | | 23,222 | |
Hotels, Restaurants & Leisure | | | 616,105 | | | | 434,767 | | | | — | | | | 1,050,872 | |
Household Durables | | | 128,005 | | | | 331,898 | | | | — | | | | 459,903 | |
Household Products | | | 705,447 | | | | 183,564 | | | | — | | | | 889,011 | |
Independent Power Producers & Energy Traders | | | 57,964 | | | | 85,070 | | | | — | | | | 143,034 | |
Industrial Conglomerates | | | 795,075 | | | | 802,162 | | | | — | | | | 1,597,237 | |
Insurance | | | 1,129,900 | | | | 2,093,017 | | | | — | | | | 3,222,917 | |
Internet & Catalog Retail | | | 325,515 | | | | 55,228 | | | | — | | | | 380,743 | |
Internet Software & Services | | | 536,174 | | | | 37,270 | | | | — | | | | 573,444 | |
IT Services | | | 1,079,010 | | | | 126,203 | | | | — | | | | 1,205,213 | |
Leisure Equipment & Products | | | 42,177 | | | | 91,238 | | | | — | | | | 133,415 | |
Life Sciences Tools & Services | | | 172,748 | | | | 36,195 | | | | — | | | | 208,943 | |
Machinery | | | 785,552 | | | | 1,412,985 | | | | — | | | | 2,198,537 | |
Marine | | | — | | | | 156,685 | | | | — | | | | 156,685 | |
Media | | | 1,113,087 | | | | 692,795 | | | | — | | | | 1,805,882 | |
Metals & Mining | | | 374,148 | | | | 2,963,969 | | | | 13,380 | | | | 3,351,497 | |
Multi-Utilities | | | 418,469 | | | | 620,559 | | | | — | | | | 1,039,028 | |
Multiline Retail | | | 236,673 | | | | 167,949 | | | | — | | | | 404,622 | |
Office Electronics | | | 39,558 | | | | 286,584 | | | | — | | | | 326,142 | |
Oil, Gas & Consumable Fuels | | | 3,396,138 | | | | 3,282,662 | | | | — | | | | 6,678,800 | |
Paper & Forest Products | | | 49,993 | | | | 124,635 | | | | — | | | | 174,628 | |
Personal Products | | | 64,249 | | | | 231,769 | | | | — | | | | 296,018 | |
Pharmaceuticals | | | 1,884,271 | | | | 3,389,516 | | | | — | | | | 5,273,787 | |
Professional Services | | | 30,650 | | | | 215,480 | | | | — | | | | 246,130 | |
Real Estate Investment Trusts | | | 539,664 | | | | 641,148 | | | | — | | | | 1,180,812 | |
Real Estate Management & Development | | | 18,958 | | | | 774,500 | | | | — | | | | 793,458 | |
Road & Rail | | | 302,738 | | | | 353,380 | | | | — | | | | 656,118 | |
Semiconductors & Semiconductor Equipment | | | 807,528 | | | | 292,495 | | | | — | | | | 1,100,023 | |
Software | | | 1,206,008 | | | | 406,159 | | | | — | | | | 1,612,167 | |
Specialty Retail | | | 616,133 | | | | 370,391 | | | | — | | | | 986,524 | |
Textiles, Apparel & Luxury Goods | | | 197,842 | | | | 579,822 | | | | — | | | | 777,664 | |
Thrifts & Mortgage Finance | | | 24,453 | | | | — | | | | — | | | | 24,453 | |
Tobacco | | | 559,322 | | | | 584,251 | | | | — | | | | 1,143,573 | |
Trading Companies & Distributors | | | 56,809 | | | | 530,920 | | | | — | | | | 587,729 | |
Transportation Infrastructure | | | 24,458 | | | | 177,030 | | | | — | | | | 201,488 | |
Water Utilities | | | — | | | | 22,422 | | | | — | | | | 22,422 | |
Wireless Telecommunication Services | | | 111,561 | | | | 931,971 | | | | — | | | | 1,043,532 | |
Total Common Stocks | | | 32,932,152 | | | | 45,654,318 | | | | 13,380 | | | | 78,599,850 | |
Investment Company Securities | | | 29,256,906 | | | | — | | | | — | | | | 29,256,906 | |
Total U.S. Treasury & Government Agencies* | | | — | | | | 69,664,279 | | | | — | | | | 69,664,279 | |
Total Preferred Stocks* | | | — | | | | 247,586 | | | | — | | | | 247,586 | |
Total Rights* | | | — | | | | 533 | | | | — | | | | 533 | |
Total Short-Term Investments* | | | — | | | | 196,342,000 | | | | — | | | | 196,342,000 | |
Total Investments | | $ | 62,189,058 | | | $ | 311,908,716 | | | $ | 13,380 | | | $ | 374,111,154 | |
| | | | | | | | | | | | | | | | | |
Forwards** | | | | | | | | | | | | | | | | |
Forward Contracts to Buy Appreciation | | $ | — | | | $ | 477,177 | | | $ | — | | | $ | 477,177 | |
Forward Contracts to Buy (Depreciation) | | | — | | | | (45,437 | ) | | | — | | | | (45,437 | ) |
Forward Contracts to Sell (Depreciation) | | | — | | | | (17,992 | ) | | | — | | | | (17,992 | ) |
Total Forwards | | $ | — | | | $ | 413,748 | | | $ | — | | | $ | 413,748 | |
See accompanying notes to financial statements.
26
MET INVESTORS SERIES TRUST
| | |
AllianceBernstein Global Dynamic Allocation Portfolio | | |
Schedule of Investments as of June 30, 2011 (Unaudited)
FAIR VALUE HIERARCHY—(Continued)
| | | | | | | | | | | | | | | | |
| Description | | Level 1 | | | Level 2 | | | Level 3 | | | Total | |
Futures Contracts** | | | | | | | | | | | | | | | | |
Futures Contracts Long Appreciation | | $ | 2,502,165 | | | $ | — | | | $ | — | | | $ | 2,502,165 | |
Futures Contracts Long (Depreciation) | | | (302,779 | ) | | | — | | | | — | | | | (302,779 | ) |
Total Futures Contracts | | $ | 2,199,386 | | | $ | — | | | $ | — | | | $ | 2,199,386 | |
SWAP Contracts** | | | | | | | | | | | | | | | | |
Total Return Swap Buy Protection Appreciation | | $ | — | | | $ | 480,549 | | | $ | — | | | $ | 480,549 | |
Total SWAP Contracts | | $ | — | | | $ | 480,549 | | | $ | — | | | $ | 480,549 | |
| * | | See Schedule of Investments for additional detailed categorizations. |
| ** | | Derivative instruments such as forwards, futures contracts and swap contracts are valued on the unrealized appreciation/depreciation on the instrument. |
Following is a reconciliation of Level 3 assets for which significant unobservable inputs were used to determine fair value:
| | | | | | | | | | | | | | | | | | | | |
| Investments in Securities | | Balance as of
May 2,
2011* | | | Change in
Unrealized
Depreciation | | | Purchases | | | Balance as of
June 30,
2011 | | | Change in
Unrealized
Depreciation
for Investments
still held at
June 30, 2011 | |
Common Stocks | | | | | | | | | | | | | | | | | | | | |
Metals & Mining | | $ | — | | | $ | (1,331 | ) | | $ | 14,711 | | | $ | 13,380 | | | $ | (1,331 | ) |
| | | | | | | | | | | | | | | | | | | | |
Total | | $ | — | | | $ | (1,331 | ) | | $ | 14,711 | | | $ | 13,380 | | | $ | (1,331 | ) |
| | | | | | | | | | | | | | | | | | | | |
| * | | Commencement of operations. |
See accompanying notes to financial statements.
27
MET INVESTORS SERIES TRUST
| | |
AllianceBernstein Global Dynamic Allocation Portfolio | | |
Statement of Assets and Liabilities
June 30, 2011 (Unaudited)
| | | | |
| Assets | | | | |
Investments at value (a) | | $ | 177,769,154 | |
Repurchase Agreement | | | 196,342,000 | |
Cash | | | 1,204 | |
Cash denominated in foreign currencies (b) | | | 63,967 | |
Cash collateral for futures contracts | | | 6,618,549 | |
Receivable for investments sold | | | 176,834,535 | |
Receivable for shares sold | | | 10,044,813 | |
Dividends receivable | | | 59,003 | |
Interest Receivable | | | 568,726 | |
Variation margin on futures contracts | | | 753,103 | |
Swap interest receivable | | | 20,455 | |
Unrealized appreciation on swap contracts | | | 480,549 | |
Unrealized appreciation on forward currency exchange contracts | | | 477,177 | |
| | | | |
Total assets | | | 570,033,235 | |
| | | | |
| Liabilities | | | | |
Payables for: | | | | |
Investments purchased | | | 189,970,754 | |
Shares redeemed | | | 444 | |
Unrealized depreciation on forward currency exchange contracts | | | 63,429 | |
Swap interest | | | 15,624 | |
Accrued Expenses: | | | | |
Management fees | | | 107,057 | |
Distribution and service fees - Class B | | | 47,767 | |
Administration fees | | | 1,468 | |
Custodian and accounting fees | | | 63,694 | |
Other expenses | | | 46,090 | |
| | | | |
Total liabilities | | | 190,316,327 | |
| | | | |
| Net Assets | | $ | 379,716,908 | |
| | | | |
| Net Assets Represented by | | | | |
Paid in surplus | | $ | 377,826,768 | |
Accumulated net realized loss | | | (2,893,232 | ) |
Unrealized appreciation on investments, futures contracts, swap contracts and foreign currency transactions | | | 4,878,901 | |
Undistributed net investment loss | | | (95,529 | ) |
| | | | |
Net Assets | | $ | 379,716,908 | |
| Net Assets | | | | |
Class B | | $ | 379,716,908 | |
| Capital Shares Outstanding* | | | | |
Class B | | | 38,637,457 | |
| Net Asset Value, Offering Price and Redemption Price Per Share | | | | |
Class B | | $ | 9.83 | |
| * | | The Portfolio is authorized to issue an unlimited number of shares. |
| (a) | | Identified cost of investments, excluding repurchase agreement, was $175,982,539. |
| (b) | | Identified cost of cash denominated in foreign currencies was $63,095. |
Statement of Operations
Period Ended June 30, 2011* (Unaudited)
| | | | |
| Investment Income | | | | |
Dividends (a) | | $ | 69,040 | |
| | | | |
Total investment income | | | 69,040 | |
| | | | |
| Expenses | | | | |
Management fees | | | 159,041 | |
Administration fees | | | 1,726 | |
Custodian and accounting fees | | | 63,694 | |
Distribution and service fees - Class B | | | 57,107 | |
Audit and tax services | | | 16,360 | |
Legal | | | 19,585 | |
Trustees’ fees and expenses | | | 4,770 | |
Shareholder reporting | | | 7,249 | |
Insurance | | | 396 | |
Organizational expense | | | 744 | |
Miscellaneous | | | 2,478 | |
| | | | |
Total expenses | | | 333,150 | |
Less management fee waiver | | | (90,512 | ) |
| | | | |
Net expenses | | | 242,638 | |
| | | | |
Net investment loss | | | (173,598 | ) |
| | | | |
| Net Realized and Unrealized Gain (Loss) on Investments, Futures Contracts, Swaps Contracts and Foreign Currency Transactions | | | | |
Net realized gain (loss) on: | | | | |
Investments | | | (1,363,912 | ) |
Futures contracts | | | (792,433 | ) |
Swap contracts | | | (919,606 | ) |
Foreign currency transactions | | | 182,719 | |
| | | | |
Net realized loss on investments, futures contracts, swap contracts and foreign currency transactions | | | (2,893,232 | ) |
| | | | |
Net change in unrealized appreciation (depreciation) on: | | | | |
Investments | | | 1,864,684 | |
Futures contracts | | | 2,197,011 | |
Swap contracts | | | 480,549 | |
Foreign currency transactions | | | 414,726 | |
| | | | |
Net change in unrealized appreciation on investments, futures contracts, swap contracts and foreign currency transactions | | | 4,956,970 | |
| | | | |
Net realized and unrealized gain on investments, futures contracts, swap contracts and foreign currency transactions | | | 1,985,669 | |
| | | | |
| Net Increase in Net Assets from Operations | | $ | 1,890,140 | |
| | | | |
| * | | Commencement of operations—5/2/2011. |
| (a) | | Net of foreign withholding taxes of $3,895. |
See accompanying notes to financial statements.
28
MET INVESTORS SERIES TRUST
| | |
AllianceBernstein Global Dynamic Allocation Portfolio | | |
Statement of Changes in Net Assets
June 30, 2011
| | | | |
| | | Period Ended
June 30, 2011*
(Unaudited) | |
| Increase (Decrease) in Net Assets: | | | | |
| Operations | | | | |
Net investment loss | | $ | (173,598 | ) |
Net realized loss on investments, futures contracts, swap contracts and foreign currency transactions | | | (2,893,232 | ) |
Net change in unrealized appreciation on investments, futures contracts, swap contracts and foreign currency transactions | | | 4,956,970 | |
| | | | |
Net increase in net assets resulting from operations | | | 1,890,140 | |
| | | | |
Net increase in net assets from capital share transactions | | | 377,826,768 | |
| | | | |
| Net Increase in Net Assets | | | 379,716,908 | |
| | | | |
Net assets at end of period | | $ | 379,716,908 | |
| | | | |
Undistributed net investment loss at end of period | | $ | (95,529 | ) |
| | | | |
| | | | | | | | |
| Other Information: | | | | | | | | |
| Capital Shares | | | | | | | | |
| | |
Transactions in capital shares were as follows: | | | | | | | | |
| | | Period Ended
June 30, 2011*
(Unaudited) | |
| | | Shares | | | Value | |
| Class B | | | | | | | | |
Sales | | | 39,155,601 | | | $ | 382,854,767 | |
Redemptions | | | (518,144 | ) | | | (5,027,999 | ) |
| | | | | | | | |
Net increase | | | 38,637,457 | | | $ | 377,826,768 | |
| | | | | | | | |
Increase derived from capital shares transactions | | | | | | $ | 377,826,768 | |
| | | | | | | | |
| * | | Commencement of operations—5/2/2011. |
See accompanying notes to financial statements.
29
MET INVESTORS SERIES TRUST
|
AllianceBernstein Global Dynamic Allocation Portfolio |
Financial Highlights
| | | | |
| Selected per share data | | | |
| | | Class B | |
| | | Period Ended
June 30, 2011(b)
(Unaudited) | |
| Net Asset Value, Beginning of Period | | $ | 10.00 | |
| | | | |
| Income from Investment Operations: | | | | |
Net Investment Loss(a) | | | (0.01 | ) |
Net Realized and Unrealized Loss on Investments | | | (0.16 | ) |
| | | | |
Total From Investment Operations | | | (0.17 | ) |
| | | | |
| Net Asset Value, End of Period | | $ | 9.83 | |
| | | | |
| Total Return (%) | | | (1.70 | ) |
| |
| Ratios/Supplemental Data | | | | |
Ratio of Expenses to Average Net Assets (%) | | | 1.46 | * |
Ratio of Net Expenses to Average Net Assets (%)(c) | | | 1.06 | * |
Ratio of Net Investment Loss to Average Net Assets (%) | | �� | (0.74 | )* |
Portfolio Turnover Rate (%) | | | 42.8 | |
Net Assets, End of Period (in millions) | | $ | 379.7 | |
| (a) | | Per share amounts based on average shares outstanding during the period. |
| (b) | | Commencement of operations—5/2/2011. |
| (c) | | Includes the effects of management fee waivers and expenses reimbursed by the Adviser, if applicable. |
See accompanying notes to financial statements.
30
MET INVESTORS SERIES TRUST
| | |
AllianceBernstein Global Dynamic Allocation Portfolio | | |
Notes to Financial Statements—June 30, 2011 (Unaudited)
1. Organization
Met Investors Series Trust (the “Trust”) is organized as a statutory trust under the laws of Delaware, as an open-end management investment company under the Investment Company Act of 1940, as amended (the “1940 Act”). The Trust currently offers fifty-four Portfolios (the “Portfolios”), each of which operates as a distinct investment vehicle of the Trust. The portfolio included in this report is AllianceBernstein Global Dynamic Allocation Portfolio (the “Portfolio”) (commenced operations on May 2, 2011), which is diversified. Shares in the Portfolio are not offered directly to the general public and are currently available only to separate accounts established by Metropolitan Life Insurance Company (“MetLife”) and other affiliated life insurance companies.
The Portfolio has registered four classes of shares: Class A, B, C and E Shares. Class B Shares are currently offered by the Portfolio.
2. Significant Accounting Policies
The financial statements have been prepared in conformity with accounting principles generally accepted in the United States of America (“GAAP”) which require management to make estimates and assumptions that affect the reported amounts of assets and liabilities at the date of the financial statements and the reported amounts of income and expenses during the reporting period. Actual results could differ from these estimates. In the preparation of these financial statements, management has evaluated events and transactions subsequent to June 30, 2011 through the date that the financial statements were issued.
The following is a summary of significant accounting policies consistently followed by the Portfolio in the preparation of its financial statements.
Investment Valuation and Fair Value Measurements - Debt securities (other than short term obligations with a remaining maturity of sixty days or less) including corporate, convertible and municipal bonds and notes; U.S. government agencies; U.S. treasury obligations; sovereign issues; bank loans; and non-U.S. bonds are generally valued on the basis of evaluated or composite bid quotations obtained by independent pricing services and/or brokers and dealers selected by MetLife Advisers, LLC (“MLA” or the “Adviser”), an affiliate of MetLife, Inc., or the relevant Subadviser pursuant to authorization of the Board of Trustees of the Portfolio (the “Board”). Such quotations use inputs that are observable including, among other things, issuer details, interest rates, yield curves, prepayment speeds, credit risks/spreads, default rates and quoted prices for similar securities. Securities that use similar valuation techniques and inputs as described above are categorized as Level 2 within the fair value hierarchy.
Mortgage and asset-backed securities are usually issued as separate tranches, or classes, of securities within each deal. These securities are also generally valued on the basis of evaluated or composite bid quotations obtained by independent pricing services and/or brokers and dealers selected by the Adviser or relevant Subadviser pursuant to authorization of the Board. The pricing models for these securities usually consider tranche-level attributes, estimated cash flows for each tranche, market-based yield spreads for each tranche and current market data, and incorporate deal collateral performance, as available. Mortgage and asset-backed securities that use similar valuation techniques and inputs as described above are categorized as Level 2 within the fair value hierarchy.
Short term obligations with a remaining maturity of sixty days or less are valued at amortized cost which approximates fair market value and are categorized as Level 2 within the fair value hierarchy.
Equity securities such as common stock, exchange-traded funds and preferred stock that are traded on a national securities exchange or other exchanges are generally valued at their last sale price on the principal trading market. Equity securities traded on a national securities exchange or other exchanges for which there is no reported sale during the day are valued at the last reported bid price. A security that is listed or traded on more than one exchange is valued at the quotation on the exchange determined to be the primary market for that security by the Board or its delegates. If no closing price is available, then such securities are valued at the last reported bid price. Equity securities traded over-the-counter are generally valued at the last reported sales price. To the extent these securities are actively traded and valuation adjustments are not applied, they are categorized as Level 1 within the fair value hierarchy. Other equity securities traded on inactive markets or valued by reference to similar instruments are categorized as Level 2 within the fair value hierarchy.
Equity securities which are listed on foreign stock exchanges normally are valued at the market closing price, the last sale price on the day the securities are valued or, lacking any sales on such day, at the bid price. Valuation adjustments may be applied to certain equity securities that are solely traded on foreign exchanges closing before the U.S. market to account for the market movement between the close of the foreign exchanges and the close of the U.S. market. The Portfolio may use a systematic fair valuation model provided by an independent third party to value securities principally traded in these foreign markets closing before the U.S. market in order to adjust for possible stale pricing that may occur between the close of these foreign exchanges and the time of the Portfolio valuation. Securities using these valuation adjustments are categorized as Level 2 within the fair value hierarchy.
Investments in registered open-end management investment companies are valued at reported net asset value per share and are categorized as Level 1 within the fair value hierarchy.
Investments in exchange traded funds are valued at the closing market quotation for their shares.
31
MET INVESTORS SERIES TRUST
| | |
AllianceBernstein Global Dynamic Allocation Portfolio | | |
Notes to Financial Statements—June 30, 2011 (Unaudited)—(Continued)
2. Significant Accounting Policies - continued
Forward foreign currency exchange contracts are valued based on the mean between closing bid and asked prices of the forward currency rates in the London foreign exchange markets on a daily basis as provided by a reliable bank or dealer. These contracts are categorized as Level 2 within the fair value hierarchy.
Options, whether on securities, indices, futures contracts, or otherwise, are valued at the last sales price available as of the close of business on the day of valuation or, if there is no such sale price available, at the bid price. Options on currencies are valued at the spot price each day. These types of options are categorized as Level 1 within the fair value hierarchy. Other options traded on inactive markets where a broker quotation is received or options valued by an evaluated quote provided by an independent pricing vendor are categorized as Level 2 within the fair value hierarchy.
Futures contracts, which are traded on commodity exchanges, are valued at their closing prices as of the close of such exchanges and are categorized as Level 1 within the fair value hierarchy. Futures contracts traded on inactive markets where a broker quotation is received are categorized as Level 2 within the fair value hierarchy. As a general matter, futures contracts are marked-to-market daily.
Options and futures contracts that are traded over-the-counter are generally valued on the basis of broker dealer quotations or pricing service providers who use a series of techniques, including simulation pricing models, to determine the value of the contracts. The pricing models use inputs that are observed from actively quoted markets such as issuer details, indices, spreads, interest rates, curves and exchange rates. These contracts are categorized as Level 2 within the fair value hierarchy.
If no current market value quotation or other observable inputs are readily available or reliable for a security, the fair value of the security will be determined in accordance with procedures approved by and under the general supervision of the Board. The Board has delegated the determination in good faith of the fair value of securities for which current market quotations are not readily available to a Valuation Committee established by the Board. Market quotes and other observable inputs are considered not readily available in circumstances where there is an absence of current or reliable market-based data. In addition, market quotes would be considered not readily available when, due to extraordinary circumstances, the exchanges or markets on which the securities trade, do not open for trading for the entire day and no other market prices are available. When the Portfolio uses fair value pricing, it may take into account any factors it deems appropriate, including significant unobservable inputs. The value of securities used by the Portfolio to calculate its net asset value may differ from quoted or published prices for the same securities. Fair value pricing involves subjective judgments and the fair value determined for a security may be materially different than the value that could be realized upon the sale of that security. These securities are categorized as Level 3 within the fair value hierarchy.
Investment Transactions and Related Investment Income - Portfolio security transactions are recorded on the trade date. Dividend income is recorded on the ex-dividend date or, for certain foreign securities, when notified. Interest income, which includes amortization of premium and accretion of discount on debt securities, is recorded on the accrual basis. Realized gains and losses on investments and unrealized appreciation and depreciation are determined on the identified cost basis, which is the same basis used for federal income tax purposes. Foreign income and foreign capital gains on some foreign securities may be subject to foreign withholding taxes, which are accrued as applicable.
Income Taxes - It is the Portfolio’s policy to comply with the requirements of the Internal Revenue Code of 1986, as amended (the “Code”), and regulations thereunder, applicable to regulated investment companies and to distribute, with respect to each taxable year, all of its taxable income to shareholders. Therefore, no federal income tax provision is required. The Portfolio files U.S. federal and various state tax returns. No income tax returns are currently under examination. The Portfolio’s federal tax returns will remain subject to examination by the Internal Revenue Service for three fiscal years after the returns are filed.
Dividends and Distributions to Shareholders - The Portfolio records dividends and distributions on the ex-dividend date. Net realized gains from security transactions (if any) are generally distributed annually to shareholders. The timing and characterization of certain income and capital gains distributions are determined in accordance with federal tax regulations that may differ from GAAP. Permanent book and tax basis differences relating to shareholder distributions will result in reclassification between under/over distributed net investment income, accumulated net realized gains/losses and paid in surplus. Book-tax differences are primarily due to futures transactions, foreign currency transactions, swap transactions, options transactions, premium amortization adjustments, paydown transactions, contingent payment debt instrument adjustments, forward transactions, deferred trustees’ compensation, and losses deferred due to wash sales, as applicable. These adjustments have no impact on net assets or the results of operations.
Repurchase Agreements - The Portfolio may enter into repurchase agreements with selected commercial banks and broker-dealers, under which the Portfolio acquires securities as collateral and agrees to resell the securities at an agreed upon time and at an agreed upon price. The Portfolio, through the custodian or a subcustodian, receives delivery of the underlying securities collateralizing repurchase agreements. The Portfolio requires the custodian to take possession, to have legally segregated in the Federal Reserve Book Entry System, or to have segregated within the custodian’s vault, all securities held as collateral for repurchase agreements. It is the Portfolio’s policy that the market value of the collateral be at least equal to 100% of the repurchase price in the case of a repurchase agreement of one-day duration and 102% of the
32
MET INVESTORS SERIES TRUST
| | |
AllianceBernstein Global Dynamic Allocation Portfolio | | |
Notes to Financial Statements—June 30, 2011 (Unaudited)—(Continued)
2. Significant Accounting Policies - continued
repurchase price in the case of all other repurchase agreements. In connection with transactions in repurchase agreements, if the seller defaults and the value of the collateral declines or if the seller enters an insolvency proceeding, realization of the collateral by the Portfolio may be delayed, limited or wholly denied.
Foreign Currency Translation - The books and records of the Portfolio are maintained in U.S. dollars. The values of securities, currencies and other assets and liabilities denominated in currencies other than U.S. dollars are translated into U.S. dollars based upon foreign exchange rates prevailing at the end of the period. Purchases and sales of investment securities, income and expenses are translated on the respective dates of such transactions. Since the values of investment securities are presented at the foreign exchange rates prevailing at the end of the period, it is not practical to isolate that portion of the results of operations arising from changes in exchange rates from that portion of the results of operations reflecting fluctuations arising from changes in market prices of the investment securities. Such fluctuations are included in the net realized and unrealized gain or loss on investments.
Net realized foreign exchange gains or losses arise from activity in forward foreign currency exchange contracts, sales of foreign currency, currency gains or losses realized between the trade and settlement dates on securities transactions, and the difference between the amounts of dividends, interest, and foreign withholding taxes recorded by the Portfolio and the U.S. dollar equivalent of the amounts actually received or paid by the Portfolio. Gains and losses attributable to foreign currency exchange rates on sales of securities are recorded as Net realized gains and losses on investments. Net unrealized foreign exchange gains and losses arise from changes in the value of assets and liabilities, other than investment securities, resulting from changes in foreign exchange rates.
3. Investment Management Agreement and Other Transactions with Affiliates
Investment Management Agreement - The Trust is managed by the Adviser. The Trust has entered into a management agreement with the Adviser (the “Management Agreement”) for investment management services in connection with the investment management of the Portfolio. The Adviser is subject to the supervision and direction of the Board and has overall responsibility for the general management and administration of the Trust. The Adviser has entered into a subadvisory agreement with AllianceBernstein L.P. (the “Subadviser”) for investment subadvisory services in connection with the investment management of the Portfolio.
Subject to the supervision and direction of the Board, the Adviser supervises the Subadviser and has full discretion with respect to the retention or renewal of the subadvisory agreement. The Adviser pays the Subadviser a fee based on the Portfolio’s average daily net assets.
Under the terms of the Portfolio’s Management Agreement, the Portfolio pays the Adviser a monthly fee based upon annual rates applied to the Portfolio’s average daily net assets as follows:
| | | | | | |
Management Fees
earned by the Adviser
for the period ended
June 30, 2011 | | % per annum | | | Average Daily Net Assets |
| | |
| $159,041 | | | 0.700 | % | | First $250 Million |
| | |
| | | 0.650 | % | | $250 Million to $500 Million |
| | |
| | | 0.625 | % | | $500 Million to $1 Billion |
| | |
| | | 0.600 | % | | Over $1 Billion |
Certain officers and trustees of the Trust may also be officers of the Adviser; however, such officers and trustees receive no compensation from the Trust.
Management Fee Waiver - The Subadviser voluntarily agreed to waive its entire subadvisory fee through July 31, 2011. Also through July 31, 2011, the Adviser voluntarily agreed to waive a portion of the management fee in an amount equal to the subadvisory fees waived. Amounts waived for the period ended June 30, 2011 are shown as a management fee waiver in the Statement of Operations.
Transfer Agency Agreement - MetLife serves as the transfer agent for the Trust. MetLife receives no fees for its services to the Trust under the transfer agency agreement.
Expense Limitation Agreement - The Adviser has entered into an expense limitation agreement with the Trust (“Expense Limitation Agreement”) in the interest of limiting expenses of the Portfolio. The Expense Limitation Agreement shall continue in effect with respect to the Portfolio until April 30, 2012. Pursuant to that Expense Limitation Agreement, the Adviser has agreed to waive or limit its fees and to assume other expenses so that the total annual operating expenses of the Portfolio other than interest, taxes, brokerage commissions, other expenditures which are capitalized or expensed in accordance with GAAP, other extraordinary expenses not incurred in the ordinary course of the Portfolio’s business
33
MET INVESTORS SERIES TRUST
| | |
AllianceBernstein Global Dynamic Allocation Portfolio | | |
Notes to Financial Statements—June 30, 2011 (Unaudited)—(Continued)
3. Investment Management Agreement and Other Transactions with Affiliates - continued
and acquired fund fees and expenses but including amounts payable pursuant to a plan adopted in accordance with Rule 12b-1 under the 1940 Act, are limited to the following expense ratio as a percentage of the Portfolio’s average daily net assets:
|
Maximum Expense Ratio under current
Expense Limitation Agreement |
Class B |
|
| 1.20% |
If in any year in which the Management Agreement is still in effect, the estimated aggregate operating expenses of the Portfolio for the fiscal year are less than the Maximum Expense Ratio for that year, subject to approval by the Trust’s Board, the Adviser shall be entitled to reimbursement by the Portfolio to the extent that the charge does not cause the expenses in such subsequent year to exceed the Maximum Expense Ratio as stated above. The Portfolio is not obligated to repay any expense paid by the Adviser more than five years after the end of the fiscal year in which such expense was incurred.
Distribution Agreement and Plan - The Trust has a distribution agreement with MetLife Investors Distribution Company (“MIDC” or the “Distributor”) in which MIDC serves as the Distributor for the Trust’s Class B Shares. MIDC is a wholly-owned subsidiary of MetLife Investors Group, Inc., an affiliate of the Adviser. The Class B distribution plan provides that the Trust, on behalf of the Portfolio, may pay annually up to 0.50% of the average daily net assets of the Portfolio attributable to its Class B Shares with respect to activities primarily intended to result in the sale of Class B Shares. However, under the Class B distribution agreement, payments to the Distributor for activities pursuant to the Class B distribution plan are currently limited to payments at an annual rate equal to 0.25% of average daily net assets of the Portfolio attributable to its Class B Shares. Amounts incurred by the Portfolio for the period ended June 30, 2011 are shown as Distribution and service fees in the Statement of Operations.
Under the terms of the Class B distribution plan and distribution agreement the Portfolio is authorized to make payments monthly to the Distributor that may be used to pay or reimburse entities providing distribution and shareholder servicing with respect to the Class B Shares for such entities’ fees or expenses incurred.
Deferred Trustee Compensation - Each Trustee of the Trust who is not currently an employee of the Adviser or any of its affiliates receives compensation from the Trust for his or her service to the Portfolio. A deferred compensation plan (the “Plan”) is available to the Trustees on a voluntary basis. Deferred amounts remain in the Trust until distributed in accordance with the provisions of the Plan. The value of a participating Trustee’s deferral account is based on theoretical investments of deferred amounts, on the normal payment dates, in certain portfolios of the Trust or Metropolitan Series Fund, Inc. as designated by the participating Trustee. Changes in the value of participants’ deferral accounts are reflected as Trustees’ fees and expenses in the Statement of Operations. The portion of the accrued obligations allocated to the Portfolio, if any, under the Plan are reflected as Deferred trustees’ fees in the Statement of Assets and Liabilities.
4. Investment Transactions
Aggregate cost of purchases and proceeds of sales of investment securities, excluding short-term securities, for the period ended June 30, 2011 were as follows:
| | | | | | | | | | | | |
| Purchases | | | Sales | |
| U.S. Government | | Non U.S. Government | | | U.S. Government | | | Non U.S. Government | |
| | | |
| $70,091,170 | | $ | 161,847,461 | | | $ | — | | | $ | 54,514,807 | |
5. Investments in Derivative Instruments
Investments in Derivative Instruments - Disclosures about derivative instruments are intended to improve financial reporting for derivative instruments by requiring enhanced disclosure that enables investors to understand how and why a Portfolio uses derivatives, how derivatives are accounted for, and how derivative instruments affect the Portfolio’s results of operations and financial position. Summarized below are the specific types of derivative instruments utilized by the Portfolio.
Forward Foreign Currency Exchange Contracts - The Portfolio may enter into forward foreign currency exchange contracts to obtain investment exposure, enhance return or hedge or protect its portfolio holdings against the risk of future movements in certain foreign currency exchange rates. When entering into these contracts, the Portfolio agrees to receive or deliver a fixed quantity of foreign currency for an agreed-upon price on an agreed upon future date. These contracts are valued daily and the Portfolio’s net equity therein, representing unrealized gain or loss on the contracts as measured by the difference between the forward foreign exchange rates at the dates of entry into the contracts and the forward foreign exchange rates at the value date, is included in the Statement of Assets and Liabilities. When a contract is closed, the Portfolio recognizes a realized gain or loss equal to the difference between the value of the contract at the time it was opened and the value at the time it was closed.
34
MET INVESTORS SERIES TRUST
| | |
AllianceBernstein Global Dynamic Allocation Portfolio | | |
Notes to Financial Statements—June 30, 2011 (Unaudited)—(Continued)
5. Investments in Derivative Instruments - continued
Realized and unrealized gains and losses on forward foreign currency exchange contracts are included in the Statement of Operations. These contracts involve market and/or credit risk in excess of the amount recognized in the Statement of Assets and Liabilities.
The use of forward foreign currency exchange contracts does not eliminate fluctuations in the underlying prices of the securities of the Portfolio, but it does establish a rate of exchange that can be achieved in the future. Although forward foreign currency exchange contracts to sell limit the risk of loss due to a decline in the value of the currency holdings, they also limit any potential gain that might result should the value of the currency increase. In addition, the Portfolio could be exposed to risks if the counterparties to the contracts are unable to meet the terms of the contracts.
Futures Contracts - The Portfolio may buy and sell futures contracts (on recognized exchanges) as a hedge, to maintain investment exposure to a target asset class or to enhance return. The Portfolio may be subject to fluctuations in equity prices, interest rates, and foreign currency exchange rates in the normal course of pursuing its investment objective. Futures contracts are standardized agreements to buy or sell a security, or deliver a final cash settlement price in connection with an index, interest rate, currency, or other asset, for a set price in the future. The Portfolio must deposit an amount (“initial margin”) equal to a certain percentage of the face value of the futures contract. The initial margin may be in the form of cash or securities which is returned when the Portfolio’s obligations under the contract have been satisfied. Futures contracts are marked-to-market daily and subsequent payments (“variation margin”) are made or received by the Portfolio depending on the daily fluctuations in the value of the futures contract. These amounts are reflected as receivables or payables on the Statement of Assets and Liabilities. Risks of entering into futures contracts (and related options) include the possibility that the market for these instruments may be illiquid and that a change in the value of the contract or option may not correlate perfectly with changes in the value of the underlying securities. Futures contracts are exchange traded and the exchange’s clearinghouse, as counterparty to all exchange traded futures, guarantees the futures contracts against default.
Swap Agreements - The Portfolio may enter into swap contracts. Swap contracts are derivatives agreements to exchange the return generated by one instrument for the return generated by another instrument. The payment streams are calculated by reference to a specified index and agreed upon notional amount. The term “specified index” includes, but is not limited to, currencies, fixed interest rates, prices and total return on interest rate indices, fixed income indices, stock indices and commodity indices (as well as amounts derived from arithmetic operations on these indices). A Portfolio will usually enter into swaps on a net basis, i.e., the two payment streams are netted out in a cash settlement on the payment date or dates specified in the instrument, with the Portfolio receiving or paying, as the case may be, only the net amount of the two payments. The Portfolio’s obligations under a swap agreement will be accrued daily (offset against any amounts owing to the Portfolio) and any accrued but unpaid net amounts owed to a swap counterparty will be covered by designating the segregation, either on its records or with the Trust’s custodian, of cash or other liquid assets, to avoid any potential leveraging of the Portfolio. The Portfolio may enter into swap transactions with counterparties that are approved by the investment adviser in accordance with guidelines established by the Board. These guidelines provide for a minimum credit rating for each counterparty and various credit enhancement techniques (for example, collateralization of amounts due from counterparties) to limit exposure to counterparties that have lower credit ratings.
The swaps in which the Portfolio may engage may include instruments under which one party pays a single or periodic fixed amount(s) (or premium), and the other party pays periodic amounts based on the movement of a specified index. Swaps do not involve the delivery of securities, other underlying assets, or principal. Accordingly, the risk of loss with respect to swaps is limited to the net amount of payments the Portfolio is contractually obligated to receive. If the other party to a swap defaults, the Portfolio’s risk of loss consists of the net amount of payments that the Portfolio contractually is entitled to receive.
An index swap is an agreement to swap cash flows on a notional amount based on changes in the values of the reference indices.
A currency swap is an agreement to exchange cash flows on a notional amount of two or more currencies based on the relative value differential among them. Such swaps may involve initial and final exchanges that correspond to the agreed upon notional amount. Currency swaps usually involve the delivery of the entire principal value of one designated currency in exchange for the other designated currency. Therefore, the entire principal value of a currency swap is subject to the risk that the other party to the swap will default on its contractual delivery obligations. If there is a default by the counterparty, the Portfolio may have contractual remedies pursuant to the agreements related to the transaction.
Equity swaps are two-party contracts that generally obligate one party to pay the positive return and the other party to pay the negative return on a specified reference security, basket of securities, security index or index component during the period of the swap. Equity swap contracts are marked to market daily based on the value of the underlying security and the change, if any, is recorded as an unrealized gain or loss. Equity swaps normally do not involve the delivery of securities or other underlying assets. If the other party to an equity swap defaults, a Portfolio’s risk of loss consists of the net amount of payments that such Portfolio is contractually entitled to receive, if any. Equity swaps are derivatives and their value can be very volatile.
The use of swaps is a highly specialized activity that involves investment techniques and risks different from those associated with ordinary portfolio securities transactions. If an investment adviser is incorrect in its forecasts of market values, interest rates, and currency exchange rates, the investment performance of the Portfolio would be less favorable than it would have been if this investment technique were not used.
35
MET INVESTORS SERIES TRUST
| | |
AllianceBernstein Global Dynamic Allocation Portfolio | | |
Notes to Financial Statements—June 30, 2011 (Unaudited)—(Continued)
5. Investments in Derivative Instruments - continued
Interest Rate Swaps - The Portfolio may enter into interest rate swaps and the purchase or sale of related caps and floors. The Portfolio may enter into these transactions primarily to manage its exposure to interest rates, to protect against currency fluctuations, or to preserve a return or spread on a particular investment. The Portfolio is subject to interest rate risk exposure in the normal course of pursuing its investment objectives. Because the Portfolio has exposure to fixed income securities, the value of these securities may decrease if interest rates rise. To help hedge against this risk and to maintain its ability to generate income at prevailing market rates, the Portfolio may enter into interest rate swap contracts. Interest rate swaps are arrangements between two parties to exchange cash flows based on a notional principal amount, to manage the Portfolio’s exposure to interest rates. Interest rate swap contracts are marked-to-market daily based upon quotations from market makers and the change, if any, is recorded as unrealized gain or loss. Payments received or made are recorded as realized gains or losses. The Portfolio could be exposed to credit or market risk due to unfavorable changes in the fluctuation of interest rates or if the counterparty defaults on its obligation to perform. Risks may exceed amounts recognized on the Statement of Assets and Liabilities. The purchase of a cap entitles the purchaser, to the extent that a specific index exceeds a predetermined interest rate, to receive payments of interest on a notional principal amount from the party selling such cap. The purchase of a floor entitles the purchaser to receive payments on a notional principal amount from the party selling such floor to the extent that a specified index falls below a predetermined interest rate or amount. The Portfolio’s maximum risk of loss from counterparty credit risk is the discounted net value of the cash flows to be received from/paid to the counterparty over the contract’s remaining life, to the extent that amount is positive. As of June 30, 2011, the net unrealized appreciation on such transactions agreements was $480,549. This risk is mitigated by maintaining a master netting arrangement between the Portfolio and the counterparty and by the posting of collateral by the counterparty to the Portfolio to cover the Portfolio’s exposure to the counterparty.
Swap agreements are marked to market daily. The change in value, if any, is recorded as unrealized gain or loss in the Statement of Operations. A liquidation payment received or made at the termination of the swap is recorded as realized gain or loss in the Statement of Operations. Net periodic payments are included as part of realized gain (loss) on the Statement of Operations.
Total Return Swaps - Total return swap contracts involve commitments to pay interest in exchange for a market-linked return both based on notional amounts. To the extent the total return of the security or index underlying the transactions exceeds or falls short of the offsetting interest rate obligation, the Portfolio will receive a payment from or make a payment to the counterparty.
At June 30, 2011, the Portfolio had the following derivatives, grouped into appropriate risk categories:
| | | | | | | | | | | | |
| | | Asset Derivatives | | | Liability Derivatives | |
Risk Exposure | | Statement of Assets &
Liabilities Location | | Fair Value | | | Statement of Assets &
Liabilities Location | | Fair Value | |
| | | | |
Equity Index | | Unrealized appreciation on futures contracts* | | $ | 2,479,676 | | | Unrealized depreciation on futures contracts* | | $ | 3,275 | |
| | Unrealized appreciation on swap contracts | | | 480,549 | | | Unrealized depreciation on swap contracts | | | — | |
| | | | |
Interest Rate | | Unrealized appreciation on futures contracts* | | | 22,489 | | | Unrealized depreciation on futures contracts* | | | 299,504 | |
Foreign Currency Exchange | | Unrealized appreciation on forward foreign currency exchange contracts | | | 477,177 | | | Unrealized depreciation on forward foreign currency exchange contracts | | | 63,429 | |
| | | | | | | | | | | | |
| | | | |
Total | | | | $ | 3,459,891 | | | | | $ | 366,208 | |
| | | | | | | | | | | | |
| * | | Includes cumulative appreciation/depreciation of futures contracts as reported in the notes to financial statements. Only the current day’s variation margin is reported within the Statement of Assets & Liabilities. |
Transactions in derivative instruments during the period ended June 30, 2011, were as follows:
| | | | | | | | | | | | | | | | |
Statement of Operations Location - Net Realized Gain (Loss) | | Equity
Index | | | Interest Rate | | | Foreign Currency
Exchange | | | Total | |
| | | | |
Futures contracts | | $ | (878,765 | ) | | $ | 86,332 | | | $ | — | | | $ | (792,433 | ) |
| | | | |
Swap contracts | | | (312,281 | ) | | | (607,325 | ) | | | — | | | | (919,606 | ) |
| | | | | | | | | | | | | | | | |
| | | | |
| | $ | (1,191,046 | ) | | $ | (520,993 | ) | | $ | — | | | $ | (1,712,039 | ) |
| | | | | | | | | | | | | | | | |
36
MET INVESTORS SERIES TRUST
| | |
AllianceBernstein Global Dynamic Allocation Portfolio | | |
Notes to Financial Statements—June 30, 2011 (Unaudited)—(Continued)
5. Investments in Derivative Instruments - continued
| | | | | | | | | | | | | | | | |
Statement of Operations Location - Net Change in Unrealized Gain
(Loss) | | Equity
Index | | | Interest Rate | | | Foreign Currency
Exchange | | | Total | |
| | | | |
Foreign currency transactions | | $ | — | | | $ | — | | | $ | 413,748 | | | $ | 413,748 | |
| | | | |
Futures contracts | | | 2,476,401 | | | | (277,015 | ) | | | — | | | | 2,199,386 | |
| | | | |
Swap contracts | | | 480,549 | | | | — | | | | — | | | | 480,549 | |
| | | | | | | | | | | | | | | | |
| | | | |
| | $ | 2,956,950 | | | $ | (277,015 | ) | | $ | 413,748 | | | $ | 3,093,683 | |
| | | | | | | | | | | | | | | | |
For the period ended June 30, 2011, the average amount or number per contract outstanding for each derivative type was as follows:
| | | | | | | | | | | | |
Average Notional or Face Amount(a) | | Equity Index
Risk | | | Foreign Currency
Risk(b) | | | Interest Rate Risk | |
| | | |
Foreign currency transactions | | $ | — | | | $ | 47,186,397 | | | $ | — | |
| | | |
Futures contracts | | | 523,814,424 | | | | — | | | | 957,435,479 | |
| | | |
Swap contracts | | | 467,732 | | | | — | | | | 3,286,875 | |
(a) Averages are based on daily activity levels during 2011.
(b) One month average
6. Forward Foreign Currency Exchange Contracts
Forward Foreign Currency Exchange Contracts to Buy:
| | | | | | | | | | | | | | | | | | | | | | |
Settlement Date | | Counterparty | | Contracts to Buy | | | Value at
June 30, 2011 | | | In Exchange
for U.S.$ | | | Net Unrealized
Appreciation/
(Depreciation) | |
| | | | | | |
| 9/15/2011 | | State Street Corp. | | | 220,000 | | | | AUD | | | $ | 233,962 | | | $ | 232,003 | | | $ | 1,959 | |
| | | | | | |
| 9/15/2011 | | State Street Corp. | | | 4,136,000 | | | | AUD | | | | 4,398,493 | | | | 4,274,349 | | | | 124,144 | |
| | | | | | |
| 9/15/2011 | | State Street Corp. | | | 580,000 | | | | AUD | | | | 616,810 | | | | 605,120 | | | | 11,690 | |
| | | | | | |
| 9/15/2011 | | State Street Corp. | | | 1,164,000 | | | | CHF | | | | 1,384,099 | | | | 1,382,932 | | | | 1,167 | |
| | | | | | |
| 9/15/2011 | | State Street Corp. | | | 418,000 | | | | CHF | | | | 497,039 | | | | 492,077 | | | | 4,962 | |
| | | | | | |
| 9/15/2011 | | State Street Corp. | | | 272,000 | | | | CHF | | | | 323,432 | | | | 318,770 | | | | 4,662 | |
| | | | | | |
| 9/15/2011 | | State Street Corp. | | | 1,735,000 | | | | CHF | | | | 2,063,068 | | | | 2,077,048 | | | | (13,980 | ) |
| | | | | | |
| 9/15/2011 | | State Street Corp. | | | 330,000 | | | | CHF | | | | 392,399 | | | | 396,921 | | | | (4,522 | ) |
| | | | | | |
| 9/15/2011 | | State Street Corp. | | | 423,000 | | | | CHF | | | | 502,984 | | | | 503,805 | | | | (821 | ) |
| | | | | | |
| 9/15/2011 | | State Street Corp. | | | 3,449,000 | | | | EUR | | | | 4,998,859 | | | | 4,947,728 | | | | 51,131 | |
| | | | | | |
| 9/15/2011 | | State Street Corp. | | | 436,000 | | | | EUR | | | | 631,923 | | | | 628,298 | | | | 3,625 | |
| | | | | | |
| 9/15/2011 | | State Street Corp. | | | 959,000 | | | | EUR | | | | 1,389,941 | | | | 1,355,633 | | | | 34,308 | |
| | | | | | |
| 9/15/2011 | | State Street Corp. | | | 6,143,000 | | | | EUR | | | | 8,903,448 | | | | 8,749,475 | | | | 153,973 | |
| | | | | | |
| 9/15/2011 | | State Street Corp. | | | 996,000 | | | | EUR | | | | 1,443,567 | | | | 1,427,288 | | | | 16,279 | |
| | | | | | |
| 9/15/2011 | | State Street Corp. | | | 871,000 | | | | EUR | | | | 1,262,397 | | | | 1,261,983 | | | | 414 | |
| | | | | | |
| 9/15/2011 | | State Street Corp. | | | 432,000 | | | | GBP | | | | 693,520 | | | | 701,818 | | | | (8,298 | ) |
| | | | | | |
| 9/15/2011 | | State Street Corp. | | | 2,776,000 | | | | GBP | | | | 4,456,509 | | | | 4,431,801 | | | | 24,708 | |
| | | | | | |
| 9/15/2011 | | State Street Corp. | | | 427,000 | | | | GBP | | | | 685,493 | | | | 682,286 | | | | 3,207 | |
| | | | | | |
| 9/15/2011 | | State Street Corp. | | | 51,195,000 | | | | JPY | | | | 635,067 | | | | 635,316 | | | | (249 | ) |
| | | | | | |
| 9/15/2011 | | State Street Corp. | | | 35,370,000 | | | | JPY | | | | 438,760 | | | | 436,694 | | | | 2,066 | |
| | | | | | |
| 9/15/2011 | | State Street Corp. | | | 35,746,000 | | | | JPY | | | | 443,424 | | | | 446,106 | | | | (2,682 | ) |
| | | | | | |
| 9/15/2011 | | State Street Corp. | | | 42,944,000 | | | | JPY | | | | 532,714 | | | | 536,867 | | | | (4,153 | ) |
37
MET INVESTORS SERIES TRUST
| | |
AllianceBernstein Global Dynamic Allocation Portfolio | | |
Notes to Financial Statements—June 30, 2011 (Unaudited)—(Continued)
6. Forward Foreign Currency Exchange Contracts - continued
| | | | | | | | | | | | | | | | | | | | | | |
Settlement Date | | Counterparty | | Contracts to Buy | | | Value at
June 30, 2011 | | | In Exchange
for U.S.$ | | | Net Unrealized
Appreciation/
(Depreciation) | |
| | | | | | |
| 9/15/2011 | | State Street Corp. | | | 41,337,000 | | | | JPY | | | $ | 512,779 | | | $ | 516,132 | | | $ | (3,353 | ) |
| | | | | | |
| 9/15/2011 | | State Street Corp. | | | 57,487,000 | | | | JPY | | | | 713,118 | | | | 717,422 | | | | (4,304 | ) |
| | | | | | |
| 9/15/2011 | | State Street Corp. | | | 36,184,000 | | | | JPY | | | | 448,857 | | | | 450,531 | | | | (1,674 | ) |
| | | | | | |
| 9/15/2011 | | State Street Corp. | | | 24,305,000 | | | | JPY | | | | 301,500 | | | | 301,828 | | | | (328 | ) |
| | | | | | |
| 9/15/2011 | | State Street Corp. | | | 33,671,000 | | | | JPY | | | | 417,684 | | | | 418,757 | | | | (1,073 | ) |
| | | | | | |
| 9/15/2011 | | State Street Corp. | | | 31,413,000 | | | | JPY | | | | 389,674 | | | | 388,606 | | | | 1,068 | |
| | | | | | |
| 9/15/2011 | | State Street Corp. | | | 77,428,000 | | | | JPY | | | | 960,483 | | | | 954,852 | | | | 5,631 | |
| | | | | | |
| 9/15/2011 | | State Street Corp. | | | 1,089,000 | | | | NOK | | | | 201,655 | | | | 197,403 | | | | 4,252 | |
| | | | | | |
| 9/15/2011 | | State Street Corp. | | | 1,906,000 | | | | NOK | | | | 352,943 | | | | 352,608 | | | | 335 | |
| | | | | | |
| 9/15/2011 | | State Street Corp. | | | 3,211,000 | | | | SEK | | | | 507,361 | | | | 505,093 | | | | 2,268 | |
| | | | | | |
| 9/15/2011 | | State Street Corp. | | | 1,534,000 | | | | SEK | | | | 242,383 | | | | 235,566 | | | | 6,817 | |
| | | | | | |
| 9/15/2011 | | State Street Corp. | | | 5,445,000 | | | | SEK | | | | 860,349 | | | | 841,838 | | | | 18,511 | |
| | | | | | | | | | | | | | | | | | | | | | |
Net Unrealized Appreciation | | | | | | | | | | | | | | | | | | | $431,740 | |
| | | | | | | | | | | | | | | | | | | | | | |
Forward Foreign Currency Exchange Contracts to Sell:
| | | | | | | | | | | | | | | | | | | | | | |
Settlement Date | | Counterparty | | Contracts to Deliver | | | Value at
June 30, 2011 | | | In Exchange | | | Net Unrealized
(Depreciation) | |
| | | | | | |
| 9/15/2011 | | State Street Corp. | | | 561,000 | | | | CAD | | | $ | 580,755 | | | $ | 572,712 | | | $ | (8,043 | ) |
| | | | | | |
| 9/15/2011 | | State Street Corp. | | | 139,000 | | | | CAD | | | | 143,895 | | | | 141,260 | | | | (2,635 | ) |
| | | | | | |
| 9/15/2011 | | State Street Corp. | | | 326,000 | | | | CAD | | | | 337,480 | | | | 331,099 | | | | (6,381 | ) |
| | | | | | |
| 9/15/2011 | | State Street Corp. | | | 2,328,000 | | | | GBP | | | | 3,737,303 | | | | 3,736,370 | | | | (933 | ) |
| | | | | | | | | | | | | | | | | | | | | | |
| Net Unrealized Depreciation | | | | | | | | | | | | | | | | | | | $(17,992) | |
| | | | | | | | | | | | | | | | | | | | | | |
AUD—Australian Dollar
CHF—Swiss Franc
CAD—Canadian Dollar
EUR—Euro
GBP—British Pound
JPY—Japanese Yen
NOK—Norwegian Krone
SEK—Swedish Krona
7. Futures Contracts
The futures contracts outstanding as of June 30, 2011 and the description and unrealized appreciation (depreciation) were as follows:
| | | | | | | | | | | | | | | | | | | | |
Futures Contracts - Long | | Expiration
Date | | | Number of
Contracts | | | Contract Amount | | | Valuation as of
June 30, 2011 | | | Unrealized
Appreciation/
Depreciation | |
| | | | | |
ASX SPI 200 Index Futures | | | 09/15/2011 | | | | 46 | | | $ | 5,585,724 | | | $ | 5,678,199 | | | $ | 92,475 | |
| | | | | |
Australian Treasury Bond 10 Year Futures | | | 09/15/2011 | | | | 3 | | | | 342,321 | | | | 341,445 | | | | (876 | ) |
| | | | | |
CAC 40 Index Futures | | | 07/15/2011 | | | | 252 | | | | 14,051,043 | | | | 14,564,665 | | | | 513,622 | |
| | | | | |
Canada Government Bond 10 Year Futures | | | 09/21/2011 | | | | 5 | | | | 646,951 | | | | 642,935 | | | | (4,016 | ) |
| | | | | |
DAX Index Futures | | | 09/16/2011 | | | | 51 | | | | 13,345,230 | | | | 13,687,188 | | | | 341,958 | |
38
MET INVESTORS SERIES TRUST
| | |
AllianceBernstein Global Dynamic Allocation Portfolio | | |
Notes to Financial Statements—June 30, 2011 (Unaudited)—(Continued)
7. Futures Contracts - continued
| | | | | | | | | | | | | | | | | | | | |
Futures Contracts - Long | | Expiration
Date | | | Number of
Contracts | | | Contract Amount | | | Valuation as of
June 30, 2011 | | | Unrealized
Appreciation/
Depreciation | |
| | | | | |
FTSE 100 Index Futures | | | 09/16/2011 | | | | 139 | | | $ | 12,821,896 | | | $ | 13,182,950 | | | $ | 361,054 | |
| | | | | |
German Euro Bobl Futures | | | 09/08/2011 | | | | 24 | | | | 4,072,825 | | | | 4,063,561 | | | | (9,264 | ) |
| | | | | |
German Euro Bund Futures | | | 09/08/2011 | | | | 29 | | | | 5,295,858 | | | | 5,284,987 | | | | (10,871 | ) |
| | | | | |
German Euro Buxl Futures | | | 09/08/2011 | | | | 14 | | | | 2,139,453 | | | | 2,093,883 | | | | (45,570 | ) |
| | | | | |
German Euro Schatz Futures | | | 09/08/2011 | | | | 29 | | | | 4,531,871 | | | | 4,530,019 | | | | (1,852 | ) |
| | | | | |
Hang Seng Index Futures | | | 07/28/2011 | | | | 11 | | | | 1,558,599 | | | | 1,585,201 | | | | 26,602 | |
| | | | | |
Hang Seng Index Futures | | | 09/29/2011 | | | | 4 | | | | 576,216 | | | | 572,941 | | | | (3,275 | ) |
| | | | | |
Japan Government Bond 10 Year Mini Futures | | | 09/07/2011 | | | | 107 | | | | 18,702,819 | | | | 18,723,839 | | | | 21,020 | |
| | | | | |
MSCI EAFE E-Mini Index Futures | | | 09/16/2011 | | | | 11 | | | | 896,846 | | | | 943,745 | | | | 46,899 | |
| | | | | |
S&P 500 E-Mini Index Futures | | | 09/16/2011 | | | | 370 | | | | 23,586,257 | | | | 24,336,750 | | | | 750,493 | |
| | | | | |
Topix Index Futures | | | 09/09/2011 | | | | 112 | | | | 11,451,307 | | | | 11,797,880 | | | | 346,573 | |
| | | | | |
U.S. Treasury Note 2 Year Futures | | | 09/30/2011 | | | | 69 | | | | 15,133,250 | | | | 15,134,719 | | | | 1,469 | |
| | | | | |
U.S. Treasury Note 5 Year Futures | | | 09/30/2011 | | | | 19 | | | | 2,265,803 | | | | 2,264,711 | | | | (1,092 | ) |
| | | | | |
U.S. Treasury Note 10 Year Futures | | | 09/21/2011 | | | | 128 | | | | 15,768,657 | | | | 15,658,000 | | | | (110,657 | ) |
| | | | | |
Ultra Long-Term U.S. Treasury Bond Futures | | | 09/21/2011 | | | | 34 | | | | 4,381,648 | | | | 4,292,500 | | | | (89,148 | ) |
| | | | | |
United Kingdom Long Gilt Futures | | | 09/28/2011 | | | | 21 | | | | 4,080,355 | | | | 4,054,197 | | | | (26,158 | ) |
| | | | | | | | | | | | | | | | | | | | |
| | | | | |
Net Unrealized Appreciation | | | | | | | | | | | | | | | | | | $ | 2,199,386 | |
| | | | | | | | | | | | | | | | | | | | |
8. Swap Agreements
Open interest rate swap agreements at June 30, 2011 were as follows:
| | | | | | | | | | | | | | | | | | | | | | | | | | | | | | |
Pay/Receive
Floating
Rate | | Floating
Rate Index | | | Fixed
Rate | | | Maturity
Date | | | Counterparty | | Notional
Amount | | | Market
Value | | | Upfront Premium
Paid/(Received) | | | Unrealized
Appreciation/
(Depreciation) | |
| | | | | | | | |
Pay | | | IRS USD 3ML | | | | 3.2600 | % | | | 7/5/2021 | | | JPMorgan Chase Bank N.A. | | | USD 88,310,000 | | | $ | — | | | $ | — | | | $ | — | |
| | | | | | | | |
Pay | | | IRS USD 3ML | | | | 3.2525 | % | | | 7/5/2021 | | | Bank of America N.A. | | | USD 3,620,000 | | | | — | | | | — | | | | — | |
| | | | | | | | | | | | | | | | | | | | | | | | �� | | | | | | |
| | | | | | | | |
Total | | | | | | | | | | | | | | | | | | | | $ | — | | | $ | — | | | $ | — | |
| | | | | | | | | | | | | | | | | | | | | | | | | | | | | | |
Open equity total return swap agreements at June 30, 2011 were as follows:
| | | | | | | | | | | | | | | | | | | | | | | | | | | | | | | | |
Pay/Receive
Floating
Rate | | Floating
Rate Index | | | Fixed
Rate | | | Maturity
Date | | | Counterparty | | Underlying Reference
Instrument | | Notional
Amount | | | Market
Value | | | Upfront Premium
Paid/(Received) | | | Unrealized
Appreciation/
(Depreciation) | |
| | | | | | | | | |
Pay | | | TRS USD 3ML | | | | 0.4050 | % | | | 5/15/2012 | | | Deutsche Bank AG | | FTSE EPRA/NAREIT Developed
Real Estate Index | | | USD 367,349 | | | $ | 8,569 | | | $ | — | | | $ | 8,569 | |
| | | | | | | | | |
Pay | | | TRS USD 3ML | | | | 0.4050 | % | | | 5/15/2012 | | | Deutsche Bank AG | | FTSE EPRA/NAREIT Developed
Real Estate Index | | | USD 243,896 | | | | 5,689 | | | | — | | | | 5,689 | |
| | | | | | | | | |
Pay | | | TRS USD 3ML | | | | 0.4050 | % | | | 5/15/2012 | | | Deutsche Bank AG | | FTSE EPRA/NAREIT Developed
Real Estate Index | | | USD 222,818 | | | | 5,198 | | | | — | | | | 5,198 | |
| | | | | | | | | |
Pay | | | TRS USD 3ML | | | | 0.4050 | % | | | 5/15/2012 | | | JPMorgan Chase Bank N.A. | | FTSE EPRA/NAREIT Developed
Real Estate Index | | | USD 144,531 | | | | 3,371 | | | | — | | | | 3,371 | |
| | | | | | | | | |
Pay | | | TRS USD 3ML | | | | 0.4050 | % | | | 5/15/2012 | | | JPMorgan Chase Bank N.A. | | FTSE EPRA/NAREIT Developed
Real Estate Index | | | USD 57,210 | | | | 1,334 | | | | — | | | | 1,334 | |
39
MET INVESTORS SERIES TRUST
| | |
AllianceBernstein Global Dynamic Allocation Portfolio | | |
Notes to Financial Statements—June 30, 2011 (Unaudited)—(Continued)
8. Swap Agreements - continued
| | | | | | | | | | | | | | | | | | | | | | | | | | | | | | | | |
Pay/Receive
Floating
Rate | | Floating
Rate Index | | | Fixed
Rate | | | Maturity
Date | | | Counterparty | | Underlying Reference
Instrument | | Notional
Amount | | | Market
Value | | | Upfront Premium
Paid/(Received) | | | Unrealized
Appreciation/
(Depreciation) | |
| | | | | | | | | |
Pay | | | TRS USD 3ML | | | | 0.3850 | % | | | 5/15/2012 | | | JPMorgan Chase
Bank N.A. | | FTSE EPRA/NAREIT Developed Real Estate Index | | | USD 162,597 | | | $ | 3,793 | | | $ | — | | | $ | 3,793 | |
| | | | | | | | | |
Pay | | | TRS USD 3ML | | | | 0.4350 | % | | | 5/15/2012 | | | UBS AG | | FTSE EPRA/NAREIT Developed Real Estate Index | | | USD 313,150 | | | | 7,305 | | | | — | | | | 7,305 | |
| | | | | | | | | |
Pay | | | TRS USD 3ML | | | | 0.4050 | % | | | 5/15/2012 | | | UBS AG | | FTSE EPRA/NAREIT Developed Real Estate Index | | | USD 96,354 | | | | 2,248 | | | | — | | | | 2,248 | |
| | | | | | | | | |
Pay | | | TRS USD 3ML | | | | 0.4050 | % | | | 6/12/2012 | | | JPMorgan Chase
Bank N.A. | | FTSE EPRA/NAREIT Developed Real Estate Index | | | USD 280,029 | | | | 6,532 | | | | — | | | | 6,532 | |
| | | | | | | | | |
Pay | | | TRS USD 3ML | | | | 0.4050 | % | | | 6/15/2012 | | | Deutsche Bank AG | | FTSE EPRA/NAREIT Developed Real Estate Index | | | USD 773,842 | | | | 18,051 | | | | — | | | | 18,051 | |
| | | | | | | | | |
Pay | | | TRS USD 3ML | | | | 0.4050 | % | | | 6/15/2012 | | | Deutsche Bank AG | | FTSE EPRA/NAREIT Developed Real Estate Index | | | USD 677,489 | | | | 15,804 | | | | — | | | | 15,804 | |
| | | | | | | | | |
Pay | | | TRS USD 3ML | | | | 0.4050 | % | | | 6/15/2012 | | | Deutsche Bank AG | | FTSE EPRA/NAREIT Developed Real Estate Index | | | USD 629,312 | | | | 14,680 | | | | — | | | | 14,680 | |
| | | | | | | | | |
Pay | | | TRS USD 3ML | | | | 0.4050 | % | | | 6/15/2012 | | | Deutsche Bank AG | | FTSE EPRA/NAREIT Developed Real Estate Index | | | USD 611,245 | | | | 14,258 | | | | — | | | | 14,258 | |
| | | | | | | | | |
Pay | | | TRS USD 3ML | | | | 0.4050 | % | | | 6/15/2012 | | | Deutsche Bank AG | | FTSE EPRA/NAREIT Developed Real Estate Index | | | USD 608,234 | | | | 14,188 | | | | — | | | | 14,188 | |
| | | | | | | | | |
Pay | | | TRS USD 3ML | | | | 0.4050 | % | | | 6/15/2012 | | | Deutsche Bank AG | | FTSE EPRA/NAREIT Developed Real Estate Index | | | USD 551,024 | | | | 12,854 | | | | — | | | | 12,854 | |
| | | | | | | | | |
Pay | | | TRS USD 3ML | | | | 0.4050 | % | | | 6/15/2012 | | | Deutsche Bank AG | | FTSE EPRA/NAREIT Developed Real Estate Index | | | USD 535,969 | | | | 12,502 | | | | — | | | | 12,502 | |
| | | | | | | | | |
Pay | | | TRS USD 3ML | | | | 0.4050 | % | | | 6/15/2012 | | | Deutsche Bank AG | | FTSE EPRA/NAREIT Developed Real Estate Index | | | USD 466,714 | | | | 10,887 | | | | — | | | | 10,887 | |
| | | | | | | | | |
Pay | | | TRS USD 3ML | | | | 0.4050 | % | | | 6/15/2012 | | | Deutsche Bank AG | | FTSE EPRA/NAREIT Developed Real Estate Index | | | USD 445,637 | | | | 10,395 | | | | — | | | | 10,395 | |
| | | | | | | | | |
Pay | | | TRS USD 3ML | | | | 0.4050 | % | | | 6/15/2012 | | | Deutsche Bank AG | | FTSE EPRA/NAREIT Developed Real Estate Index | | | USD 418,537 | | | | 9,763 | | | | — | | | | 9,763 | |
| | | | | | | | | |
Pay | | | TRS USD 3ML | | | | 0.4050 | % | | | 6/15/2012 | | | Deutsche Bank AG | | FTSE EPRA/NAREIT Developed Real Estate Index | | | USD 264,973 | | | | 6,181 | | | | — | | | | 6,181 | |
| | | | | | | | | |
Pay | | | TRS USD 3ML | | | | 0.4150 | % | | | 6/15/2012 | | | Deutsche Bank AG | | FTSE EPRA/NAREIT Developed Real Estate Index | | | USD 1,238,869 | | | | 15,220 | �� | | | — | | | | 15,220 | |
| | | | | | | | | |
Pay | | | TRS USD 3ML | | | | 0.4050 | % | | | 6/15/2012 | | | Deutsche Bank AG | | FTSE EPRA/NAREIT Developed Real Estate Index | | | USD 1,053,871 | | | | 24,583 | | | | — | | | | 24,583 | |
| | | | | | | | | |
Pay | | | TRS USD 3ML | | | | 0.4050 | % | | | 6/15/2012 | | | Deutsche Bank AG | | FTSE EPRA/NAREIT Developed Real Estate Index | | | USD 566,079 | | | | 13,205 | | | | — | | | | 13,205 | |
| | | | | | | | | |
Pay | | | TRS USD 3ML | | | | 0.4050 | % | | | 6/15/2012 | | | Deutsche Bank AG | | FTSE EPRA/NAREIT Developed Real Estate Index | | | USD 942,462 | | | | 21,984 | | | | — | | | | 21,984 | |
| | | | | | | | | |
Pay | | | TRS USD 3ML | | | | 0.4050 | % | | | 6/15/2012 | | | Deutsche Bank AG | | FTSE EPRA/NAREIT Developed Real Estate Index | | | USD 701,577 | | | | 16,365 | | | | — | | | | 16,365 | |
| | | | | | | | | |
Pay | | | TRS USD 3ML | | | | 0.4050 | % | | | 6/15/2012 | | | Deutsche Bank AG | | FTSE EPRA/NAREIT Developed Real Estate Index | | | USD 686,522 | | | | 16,014 | | | | — | | | | 16,014 | |
| | | | | | | | | |
Pay | | | TRS USD 3ML | | | | 0.4150 | % | | | 6/15/2012 | | | UBS AG | | FTSE EPRA/NAREIT Developed Real Estate Index | | | USD 945,473 | | | | 22,055 | | | | — | | | | 22,055 | |
| | | | | | | | | |
Pay | | | TRS USD 3ML | | | | 0.4150 | % | | | 6/15/2012 | | | UBS AG | | FTSE EPRA/NAREIT Developed Real Estate Index | | | USD 605,223 | | | | 14,118 | | | | — | | | | 14,118 | |
| | | | | | | | | |
Pay | | | TRS USD 3ML | | | | 0.4050 | % | | | 7/16/2012 | | | Deutsche Bank AG | | FTSE EPRA/NAREIT Developed Real Estate Index | | | USD 753,640 | | | | 19,766 | | | | — | | | | 19,766 | |
| | | | | | | | | |
Pay | | | TRS USD 3ML | | | | 0.4050 | % | | | 7/16/2012 | | | Deutsche Bank AG | | FTSE EPRA/NAREIT Developed Real Estate Index | | | USD 598,525 | | | | 14,654 | | | | — | | | | 14,654 | |
| | | | | | | | | |
Pay | | | TRS USD 3ML | | | | 0.4050 | % | | | 7/16/2012 | | | Deutsche Bank AG | | FTSE EPRA/NAREIT Developed Real Estate Index | | | USD 1,079,960 | | | | 20,064 | | | | — | | | | 20,064 | |
40
MET INVESTORS SERIES TRUST
| | |
AllianceBernstein Global Dynamic Allocation Portfolio | | |
Notes to Financial Statements—June 30, 2011 (Unaudited)—(Continued)
8. Swap Agreements - continued
| | | | | | | | | | | | | | | | | | | | | | | | | | | | | | | | |
Pay/Receive
Floating
Rate | | Floating
Rate Index | | | Fixed
Rate | | | Maturity
Date | | | Counterparty | | Underlying Reference
Instrument | | Notional
Amount | | | Market
Value | | | Upfront Premium
Paid/(Received) | | | Unrealized
Appreciation/
(Depreciation) | |
| | | | | | | | | |
Pay | | | TRS USD 3ML | | | | 0.4050 | % | | | 7/16/2012 | | | Deutsche Bank AG | | FTSE EPRA/NAREIT Developed Real Estate Index | | | USD 969,711 | | | $ | 25,549 | | | $ | — | | | $ | 25,549 | |
| | | | | | | | | |
Pay | | | TRS USD 3ML | | | | 0.4050 | % | | | 7/16/2012 | | | Deutsche Bank AG | | FTSE EPRA/NAREIT Developed Real Estate Index | | | USD 690,819 | | | | 17,880 | | | | — | | | | 17,880 | |
| | | | | | | | | |
Pay | | | TRS USD 3ML | | | | 0.4050 | % | | | 7/16/2012 | | | Deutsche Bank AG | | FTSE EPRA/NAREIT Developed Real Estate Index | | | USD 645,554 | | | | 20,006 | | | | — | | | | 20,006 | |
| | | | | | | | | |
Pay | | | TRS USD 3ML | | | | 0.4050 | % | | | 7/16/2012 | | | Deutsche Bank AG | | FTSE EPRA/NAREIT Developed Real Estate Index | | | USD 625,449 | | | | 9,298 | | | | — | | | | 9,298 | |
| | | | | | | | | |
Pay | | | TRS USD 3ML | | | | 0.4050 | % | | | 7/16/2012 | | | Deutsche Bank AG | | FTSE EPRA/NAREIT Developed Real Estate Index | | | USD 610,727 | | | | 8,614 | | | | — | | | | 8,614 | |
| | | | | | | | | |
Pay | | | TRS USD 3ML | | | | 0.4050 | % | | | 7/16/2012 | | | Deutsche Bank AG | | FTSE EPRA/NAREIT Developed Real Estate Index | | | USD 445,647 | | | | 13,467 | | | | — | | | | 13,467 | |
| | | | | | | | | |
Pay | | | TRS USD 3ML | | | | 0.4050 | % | | | 7/16/2012 | | | Deutsche Bank AG | | FTSE EPRA/NAREIT Developed Real Estate Index | | | USD 541,285 | | | | 4,105 | | | | — | | | | 4,105 | |
| | | | | | | | | | | | | | | | | | | | | | | | | | | | | | | | |
| | | | | | | | | |
Total | | | | | | | | | | | | | | | | | | | | | | $ | 480,549 | | | $ | — | | | $ | 480,549 | |
| | | | | | | | | | | | | | | | | | | | | | | | | | | | | | | | |
9. Contractual Obligations
The Trust has a variety of indemnification obligations under contracts with its service providers. The Trust’s maximum exposure under these arrangements is unknown.
10. Market, Credit and Counterparty Risk
In the normal course of business, the Portfolio invests in securities and enters into transactions where risks exist due to fluctuations in the market (market risk) or failure of the other party to a transaction to perform (credit and counterparty risk). The value of securities held by the Portfolio may decline in response to certain events, including those directly involving the companies whose securities are owned by the Portfolio; conditions affecting the general economy; overall market changes; local, regional or global political, social or economic instability; and currency and interest rate and price fluctuations. The Portfolio may be exposed to counterparty risk, or the risk that an entity with which the Portfolio has unsettled or open transactions may default. The potential loss could exceed the value of the financial assets recorded in the financial statements. Financial assets that potentially expose the Portfolio to credit risk consist principally of cash due from counterparties and investments. In order to preserve certain safeguards for derivatives and non-standard settlement trades, the Portfolio restricts its exposure to credit losses by entering into master netting agreements with counterparties (approved brokers) with whom it undertakes a significant volume of transactions. The Portfolio reduces the credit risk associated with favorable contracts by entering into a master netting arrangement to the extent that all amounts with the counterparty are terminated and settled on a net basis if an event of default occurs. The Portfolio’s overall exposure to credit risk on derivative instruments subject to master netting arrangements can change substantially within a short period, as it is affected by each transaction subject to the arrangement.
11. Recent Accounting Pronouncements
In January 2010, the Financial Accounting Standards Board (“FASB”) issued Accounting Standards Update No. 2010-06, “Improving Disclosures About Fair Value Measurements” (“ASU”) which was generally effective for years beginning after December 15, 2009 and was adopted by the Portfolio. The ASU requires enhanced disclosures about purchases, sales, issuances and settlements on a gross basis relating to Level 3 fair value measurements. These enhanced disclosures became effective for fiscal years beginning after December 15, 2010, and for interim periods within those years. Management has evaluated the impact of ASU 2010-06 and has concluded that ASU 2010-06 has no material impact on these financial statements.
In May 2011, FASB issued Accounting Standards Update (ASU) No. 2011-04 “Amendments to Achieve Common Fair Value Measurement and Disclosure Requirements in GAAP and the International Financial Reporting Standards (IFRS).” ASU 2011-04 includes common requirements for measurement of and disclosure about fair value between U.S. GAAP and IFRS. ASU 2011-04 will require reporting entities to categorize within Level 3 of the fair value hierarchy: quantitative information about the unobservable inputs used in the fair value measurement, the valuation processes used by the reporting entity and a narrative description of the sensitivity of the fair value measurement to changes in unobservable inputs and the interrelationships between those unobservable inputs. In addition, ASU 2011-04 will require reporting entities to make disclosures about amounts and reasons for all transfers in and out of Level 1 and Level 2 fair value measurements. The new and revised disclosures are effective for fiscal years beginning after December 15, 2011 and for interim periods within those fiscal years. Management is currently evaluating the implications of ASU 2011-04 and its impact on the financial statements.
41
MET INVESTORS SERIES TRUST
| | |
AllianceBernstein Global Dynamic Allocation Portfolio | | |
Quarterly Portfolio Schedule
The Trust files Form N-Q for the first and third quarters of each fiscal year. The Trust’s Forms N-Q will be available on the Securities and Exchange Commission’s website at http://www.sec.gov. The Trust’s Forms N-Q may be reviewed and copied at the Securities and Exchange Commission’s Public Reference Room in Washington, D.C. and information on the operation of the Public Reference Room may be obtained by calling 1-800-SEC-0330. Once filed, the most recent Form N-Q will be available without charge, upon request, by calling (800) 848-3854.
Proxy Voting Policies and Procedures
A description of the policies and procedures that the Trust uses to determine how to vote proxies relating to portfolio securities is available without charge, upon request, by calling (800) 848-3854 and on the Securities and Exchange Commission’s website at http://www.sec.gov.
Proxy Voting Record
The Trust, on behalf of each of its Portfolios, has filed with the Securities and Exchange Commission its proxy voting record for the 12-month period ending June 30 on Form N-PX. Form N-PX must be filed by the Trust each year by August 31. Once filed, the most recent Form N-PX will be available without charge, upon request, by calling (800) 848-3854 or on the Securities and Exchange Commission’s website at http://www.sec.gov.
42
MET INVESTORS SERIES TRUST
| | |
AllianceBernstein Global Dynamic Allocation Portfolio | | |
Board of Trustees’ Consideration of Advisory and Sub-Advisory Agreements
At an in-person meeting of the Board of Trustees (the “Board”) of the Met Investors Series Trust (the “Trust”) held on February 14-15, 2011, the Board, including a majority of the Trustees who are not considered to be “interested persons” of the Trust (the “Independent Trustees”) under the Investment Company Act of 1940, as amended (the “1940 Act”), initially approved the Trust’s advisory agreement (the “Advisory Agreement”) with MetLife Advisers, LLC (the “Adviser”) and the applicable investment sub-advisory agreements (each a “Sub-Advisory Agreement”, and collectively with the Advisory Agreement, the “Agreements”) between the Adviser and the investment sub-advisers (each a “Subadviser”, and collectively, the “Subadvisers”) for certain new series of the Trust, including the AllianceBernstein Global Dynamic Allocation Portfolio (each a “Portfolio,” and collectively, the “Portfolios”).1
In considering the Agreements, the Board reviewed a variety of materials provided by the Adviser and the Subadvisers relating to each Portfolio, the Adviser and each Subadviser, including comparative fee and expense information for an appropriate peer group of similar mutual funds if available, performance information for relevant benchmark indices, as applicable, and other information regarding the nature, extent and quality of services to be provided by the Adviser and the Subadvisers under their respective Agreements. The Independent Trustees also assessed a report provided by the Board’s independent consultant, who reviewed and provided analyses regarding fees and expenses, and other information provided by, or at the direction of, the Adviser and Subadvisers, as more fully discussed below.
The Independent Trustees were separately advised by independent legal counsel throughout the process. Prior to voting to approve the Agreements at the February meeting, the Independent Trustees also received a memorandum from their independent legal counsel discussing the legal standards for their consideration of the proposed initial approval of the Agreements. The Board also had previously received presentations from the Adviser with respect to the Managed Risk Portfolios at the August 3-4, 2010 and the November 9-10, 2010 Board meetings. The Board also further discussed the Managed Risk Portfolios with the Adviser on January 19, 2011, and received presentations regarding the Managed Risk Portfolios from the Subadvisers on January 26, 2011 and January 28, 2011 during which representatives of the Adviser and the Subadvisers responded to questions from the Independent Trustees. The Independent Trustees also discussed the proposed initial approval of the Agreements in private sessions with their independent legal counsel at which no representatives of management were present.
In considering whether to approve the Agreements, the Board reviewed and analyzed the factors it deemed relevant, including: (1) the nature, extent and quality of the services to be provided to the Portfolios by the Adviser and the Subadvisers; (2) the performance of comparable funds or accounts managed by the Subadvisers as compared to appropriate indices, to the extent available; (3) the Adviser’s and each of the Subadviser’s personnel and operations; (4) the financial condition of the Adviser and of the Subadvisers; (5) the level and method of computing each Portfolio’s proposed advisory and subadvisory fees; (6) the anticipated profitability of the Adviser under the Advisory Agreement and of the Subadvisers under the Sub-Advisory Agreements; (7) any “fall-out” benefits to the Adviser, the Subadvisers and their affiliates (i.e., ancillary benefits realized by the Adviser, the Subadvisers or their affiliates from the Adviser’s or Subadvisers’ relationship with the Trust); (8) the anticipated effect of growth in size on each Portfolio’s performance and expenses; (9) fees paid by comparable institutional and retail accounts; and (10) possible conflicts of interest. The Board also considered the nature, quality, and extent of the services to be provided to the Portfolios by the Adviser’s affiliates, including distribution services.
Nature, extent and quality of services. In considering the nature, extent and quality of the services to be provided by the Adviser to the Portfolios, the Board took into account the extensive responsibilities that the Adviser would have as investment adviser to the Portfolios, including the provision of investment advisory services to the MetLife Balanced Plus Portfolio, the selection of the Subadvisers for the other Portfolios and oversight of the Subadvisers’ compliance with fund policies and objectives, review of brokerage matters including with respect to trade allocation and best execution, oversight of general fund compliance with federal and state laws, its risk management processes, and the implementation of Board directives as they relate to the Portfolios. The Adviser’s role in coordinating the activities of the Portfolios’ other service providers was also considered. The Board also evaluated the expertise and performance of the investment personnel with respect to the MetLife Balanced Plus Portfolio and of the personnel who would be overseeing the Subadvisers of the other Portfolios and compliance with each Portfolio’s investment restrictions, tax and other requirements. The Board also considered that an Investment Committee, consisting of investment professionals from across MetLife, will meet at least quarterly to review the asset allocations of the MetLife Balanced Plus Portfolio. The Board considered information received from the Trust’s Chief Compliance Officer (the “CCO”) regarding the Portfolios’ compliance policies and procedures established pursuant to Rule 38a-1 under the 1940 Act, including the policies and procedures in place relating to proxy voting. Based on the information provided to the Board and its discussions with the CCO, the Board approved the Rule 38a-1 compliance policies and procedures as they relate to each Portfolio. The Board also took into account its familiarity with management through Board meetings, discussions and reports during the preceding year. The Board also took into consideration the quality of services the Adviser provided to other Portfolios of the Trust.
The Board also recognized the Adviser’s reputation and long-standing experience in serving as an investment adviser to the Trust. In addition, the Board reviewed the financial condition of the Adviser and whether it had the financial wherewithal to provide a high level and quality of services to
1 At the February 14-15, 2011 meeting, the Board also approved Agreements with respect to the AQR Global Risk Balanced Portfolio, BlackRock Global Tactical Strategies Portfolio, MetLife Balanced Plus Portfolio, Pyramis® Government Income Portfolio (together with the AllianceBernstein Global Dynamic Allocation Portfolio, the “Managed Risk Portfolios”), Met/Franklin Low Duration Total Return Portfolio and T. Rowe Price Large Cap Value Portfolio.
43
MET INVESTORS SERIES TRUST
| | |
AllianceBernstein Global Dynamic Allocation Portfolio | | |
Board of Trustees’ Consideration of Advisory and Sub-Advisory Agreements—(Continued)
the Portfolios. In its review, the Board also received and took into account information regarding any services and/or payments to be provided to the Adviser by the Subadvisers in connection with marketing activities.
With respect to the services to be provided by the Subadvisers, the Board considered information provided to the Board by each Subadviser, including each Subadviser’s Form ADV, as well as information presented throughout the past year for those Subadvisers currently sub-advising existing Portfolios of the Trust. The Board considered each Subadviser’s current level of staffing and its overall resources, as well as its compensation program. The Board reviewed each Subadviser’s history and investment experience, as well as information regarding the qualifications, background and responsibilities of each Subadviser’s investment and compliance personnel who would be providing services to the Portfolios. The Board also considered, among other things, each Subadviser’s compliance program and its disciplinary history, and its risk assessment and monitoring process. The Board noted each Subadviser’s regulatory history, including whether it was currently involved in any regulatory actions or investigations as well as material litigation, and any settlements and ameliatory actions undertaken, as appropriate. The Board also noted that the CCO and his staff would be conducting regular, periodic compliance reviews with each of the Subadvisers and present reports to the Independent Trustees regarding the same, which would include evaluating the regulatory compliance system of the Subadvisers and procedures reasonably designed by them to assure compliance with the federal securities laws, including issues related to late trading and market timing, best execution, fair value pricing, and proxy voting procedures, among others. The Board also took into account the financial condition of each Subadviser. Based on the information provided to the Board and its discussions with the CCO, the Board approved the Rule 38a-1 compliance policies and procedures as they relate to the Portfolios.
The Board considered each Subadviser’s investment process and philosophy. The Board took into account that each Subadviser’s responsibilities would include the development and maintenance of an investment program for the applicable Portfolio which would be consistent with the Portfolio’s investment objectives, the selection of investment securities and the placement of orders for the purchase and sale of such securities, as well as the implementation of compliance controls related to performance of these services. The Board also reviewed each Subadviser’s brokerage policies and practices, including with respect to best execution and soft dollars.
Based on its consideration and review of the foregoing information, the Board concluded that the nature, extent and quality of services to be provided by the Adviser and by each Subadviser were satisfactory and that there was a reasonable basis on which to conclude that each would provide a high quality of investment services to the Portfolios.
Performance. The Board took into account that the AQR Global Risk Balanced Portfolio, AllianceBernstein Global Dynamic Allocation Portfolio, BlackRock Global Tactical Strategies Portfolio and MetLife Balanced Plus Portfolio utilize relatively unique investment strategies designed to manage volatility and noted the unavailability of comparable performance information for these types of strategies. With respect to the Pyramis® Government Income Portfolio, however, the Board considered the performance of a comparable fund managed by that Subadviser. The Board also considered the performance of other funds or accounts managed by the Subadvisers to the extent such information was relevant.
As discussed above with respect to the AllianceBernstein Global Dynamic Allocation Portfolio, the Board noted that while no comparable performance data was available, the Board considered information that described how the Portfolio is designed to perform under a variety of market conditions.
Fees and expenses. The Board gave substantial consideration to the proposed management fees payable under the Advisory Agreement and the proposed subadvisory fees payable under each of the Sub-Advisory Agreements. In addition, the Independent Trustees reviewed a report prepared by Bobroff Consulting, Inc., an independent consultant (“Bobroff”), which analyzed the proposed fees to be paid by each Portfolio in light of fees paid to other investment managers by other somewhat comparable funds, as applicable, and the method of computing each Portfolio’s proposed fee. In addition, the Board considered each Portfolio’s proposed management fee and total expenses as compared to similarly situated investment companies underlying variable insurance products and retail funds deemed to be comparable to the Portfolio as determined by Bobroff. With respect to the AQR Global Risk Balanced Portfolio, AllianceBernstein Global Dynamic Allocation Portfolio, BlackRock Global Tactical Strategies Portfolio, and MetLife Balanced Plus Portfolio, the Board took into account the limited usefulness of the peer groups in which the Portfolios were included for comparative purposes. In comparing each Portfolio’s proposed management fee to that of comparable funds, the Board noted that such fee includes both advisory and administrative fees.
The Board noted that the subadvisory fees for the Portfolios would be paid by the Adviser, not the Portfolios, out of the management fee. It was further noted that the Adviser negotiated such fee at arm’s length. The Board also considered that the Adviser had agreed to enter into an expense limitation agreement with each Portfolio, pursuant to which the Adviser would agree to waive a portion of its management fee and/or reimburse certain expenses as a means of limiting a Portfolio’s total annual operating expenses.
The Board also compared the proposed subadvisory fee to be paid by the Adviser to the fees charged by each Subadviser to manage other funds and funds not subject to regulation under the 1940 Act, such as separate accounts, as applicable. The Board considered the fee comparisons in light of the differences required to manage different types of accounts.
With respect to the AllianceBernstein Global Dynamic Allocation Portfolio, the Board considered that, according to a report prepared by Bobroff, the Portfolio’s proposed management fee was below the median of the peer group. The Board further considered that the Portfolio’s estimated
44
MET INVESTORS SERIES TRUST
| | |
AllianceBernstein Global Dynamic Allocation Portfolio | | |
Board of Trustees’ Consideration of Advisory and Sub-Advisory Agreements—(Continued)
total expenses (exclusive of 12b-1 fees) were above the median of the peer group. The Board took into account’s management discussion of the Portfolio’s estimated expenses. The Board also noted that the Subadviser had agreed to a reduced fee schedule for the Portfolio’s first year of operations and to waive its subadvisory fee for the Portfolio’s first three months of operations, and that the Adviser had also agreed to waive a portion of its advisory fee equal to the difference between the standard sub-advisory fee schedule and the reduced sub-advisory fee schedule for the Portfolio’s first year of operations and to waive an amount equal to the subadvisory fee waiver for the Portfolio’s first three months of operations. After consideration of all relevant factors, the Board concluded that the proposed management and subadvisory fees were consistent with industry norms and were fair and reasonable in light of the services to be provided.
Profitability. The Board examined the anticipated profitability of the Adviser with respect to each Portfolio. With respect to the MetLife Balanced Plus Portfolio, the Board noted that the advisory fee is in addition to the fees received by the Adviser and its affiliates with regard to the other Portfolios of the Trust or of Metropolitan Series Fund, Inc. (the “Underlying Portfolios”) in which the Portfolio may invest. With respect to the other Portfolios, the Board noted that a major component of profitability of the Adviser would be the margin between the management fee that the Adviser would receive from the Portfolio and the portion of that fee the Adviser would pay to the Subadviser. The Board also took into account the costs borne by the Adviser’s affiliates that support the operations of the Adviser, as well as considered the profitability of the insurance product, the function of which is supported in part by the Adviser’s revenues under the Advisory Agreement. The Board also considered that the Trust’s distributor, MetLife Investors Distribution Company, would receive Rule 12b-1 payments to support the distribution of the product. The Board concluded after extensive discussions with management that the anticipated profitability of the Adviser and its affiliates from their relationship with each Portfolio was reasonable in light of all relevant factors.
In considering the anticipated profitability to the Subadvisers and their affiliates of their relationships with the Portfolios, the Board noted that the proposed subadvisory fees under the Sub-Advisory Agreements would be paid by the Adviser out of the management fee that it would receive under the Advisory Agreement. The Board also relied on the ability of the Adviser to negotiate the Sub-Advisory Agreements and the fees thereunder at arm’s length. However, the Board placed more reliance on the fact that the Sub-Advisory Agreements were negotiated at arm’s length and that the proposed subadvisory fees would be paid by the Adviser than on the Subadvisers’ anticipated profitability.
Economies of scale. The Board also considered the probable effect of the Portfolios’ growth in size on their performance and fees. The Board noted that the proposed management and subadvisory fees each contained breakpoints that would reduce the fee rate above specified asset levels. The Board also took into account that the proposed subadvisory fees would be paid by the Adviser out of the management fees. The Board considered the fact that the Portfolios’ fee levels decline as portfolio assets increase. The Board also noted that if the Portfolios’ assets increase over time, the Portfolios may realize other economies of scale if assets increase proportionally more than certain other fixed expenses. The Board concluded that the proposed advisory fee structure for the Portfolios, including breakpoints, was reasonable and appropriately reflects potential economies of scale.
Other factors. As part of its evaluation of the Adviser’s compensation, the Board considered other benefits that may be realized by the Adviser and its affiliates from their relationship with the Trust. Among them, the Board recognized that an affiliate of the Adviser, MetLife Investors Distribution Company, serves as the distributor for the Trust, and, as such, would receive payments pursuant to Rule 12b-1 from the Portfolios to compensate it for providing shareholder services and selling activities, which could lead to growth in the Trust’s assets and corresponding benefits from such growth, including economies of scale. The Board also considered that affiliates of the Adviser may benefit from certain indirect tax benefits relating to dividend received deductions and foreign tax credits. The Board concluded that anticipated ancillary benefits that may accrue to the Adviser and its affiliates by virtue of the Adviser’s relationship with the Portfolios are fair and reasonable in light of the anticipated costs of providing investment management and other services to the Portfolios and the ongoing commitment of the Adviser to the Portfolios.
The Board considered other benefits that may be realized by each Subadviser and its affiliates from their relationship with the Trust, including the opportunity to provide advisory services to additional portfolios of the Trust and reputational benefits. The Board concluded that the benefits that may accrue to the Subadvisers and their affiliates by virtue of the Subadvisers’ relationships to the Portfolios were fair and reasonable in light of the anticipated costs of providing investment advisory services to the Portfolios and the ongoing commitment of the Subadvisers to the Portfolios.
The Board considered any possible conflicts of interest in the form of material benefits or detriments to the Trust resulting from the nature of the Trust’s and the Adviser’s or the Subadvisers’ affiliations. Here, the Board considered possible conflicts of interest that may arise between the Trust and the Adviser or a Subadviser in connection with the services to be provided to the Trust and the various relationships that they and their affiliates may have with the Trust. The Board considered the procedures for monitoring and managing such potential conflicts.
Conclusion. In considering the initial approval of each of the Agreements, the Board, including the Independent Trustees, did not identify any single factor as controlling, and each Trustee may have attributed different weights to various factors. The Board evaluated all information available to them on a Portfolio-by-Portfolio basis, and their determinations were made separately with respect to each Portfolio. Based on all of the above-mentioned considerations, and the recommendations of management, the Board, including a majority of the Independent Trustees, determined that approval of the Advisory Agreement and the Sub-Advisory Agreements was in the best interests of each Portfolio. After full consideration of these and other factors, the Board, including a majority of the Independent Trustees, with the assistance of independent legal counsel, approved the Advisory Agreement and the Sub-Advisory Agreement with respect to each Portfolio.
45
Simplify your life…
with MetLife eDelivery® while helping
MetLife preserve the planet’s
natural resources.
(see details on inside cover)
| | |
Met Investors Series Trust American Funds® Balanced Allocation Portfolio Semiannual Report | | June 30, 2011, as amended December 16, 2011 |
MET INVESTORS SERIES TRUST
| | |
American Funds® Balanced Allocation Portfolio | | |
Managed by MetLife Advisers, LLC
Portfolio Manager Commentary*
Performance
For the six-month period ended June 30, 2011, the Class B and C shares of the American Funds® Balanced Allocation Portfolio returned 4.29% and 4.09%, respectively, compared to the 4.40% return of its primary index, the Dow Jones Moderate Index1.
Economic and Market Review
The fixed income markets had mixed returns during the first six months of 2011 in response to investors’ shifting outlook for the economy, inflation, and interest rates. During the first four months of the year, yields rose and credit spreads narrowed as the outlook for the economy was generally positive. However, increasing concerns of the strength and longevity of the economic recovery—due in part to the budget impasse in the U.S., the credit crisis in Europe, and persistently sluggish employment growth—led to a decline in interest rates and a widening in the spread between the yields of Treasury securities and credit based bonds in May and June. Overall, the Barclays Capital U.S. Aggregate Bond Index returned 2.72%. Investment grade credit sector bonds such as corporate bonds and mortgage bonds outperformed treasury securities of similar maturity during the period. Below investment grade high-yield bonds, due primarily to their higher coupon return, outperformed the broad bond market with a return of 4.97%. The returns of foreign bonds were boosted by a declining dollar relative to other currencies; a decline in the dollar made non-dollar securities more valuable to U.S. dollar-based investors.
The returns of equities during the first half of 2011 were also mixed. A strong first quarter and a flat second quarter produced a very respectable 6.0% return for the period as measured by the Standard & Poor’s 500 Index. The main driver for the varying performance was again a change in the outlook for the economy in general and corporate earnings in particular. There was little difference between the returns of large cap and small cap stocks, although mid cap stocks continue to outperform both large and small company stocks. Growth style stocks performed slightly better than value style stocks over the period. Among sectors, Energy (+11.4%) and Health Care (+13.9%) were the best performers, while Financial Services (-3.1%) and Information Technology (+2.1%) lagged the broad market.
The total return of foreign stocks to the U.S. dollar based investor was 5.0% from January to June 2011 as measured by the MSCI EAFE Index. Nearly all the positive return of foreign stocks came from the impact of currency, especially the U.S. dollar relative to the Euro, as the MSCI EAFE Index was nearly flat on a local currency basis. By region, Europe was strongly positive, while Japanese stocks struggled as the entire country and its companies tried to recover from the devastation of the March 2011 earthquake and subsequent tsunami. Emerging market stocks trailed developed country stocks as seen by the MSCI Emerging Market Index return of close to 0%.
Portfolio Review/Current Positioning
The American Funds® Balanced Allocation Portfolio invests all of its assets in funds of the American Funds Insurance Series (AFIS). The Portfolio’s broad asset allocation goal of 35% to fixed income and 65% to equities did not change during the period. Although the Portfolio does not have an explicit goal for cash, its underlying portfolios typically hold cash positions of 5% to 10% to give the portfolio counselors the liquidity and flexibility to exploit investment opportunities when they become available. This cash position detracted from performance for most of the period since both stocks and bonds were generally positive.
On an absolute basis, the two domestic equity underlying portfolios contributed positively to the Portfolio’s overall performance, but they had mixed relative performance. The AFIS Growth Fund was generally in line with the broad equity markets, doing slightly better in the first quarter and lagging modestly in the second quarter. Overall, it was helped by good stock selection in the Consumer Discretionary sector. Luluemon Athletica, a Canadian based retailer of yoga inspired athletic clothing was up over 60% over the period. Casino operator Wynn Macau and restaurant chain Chipotle Mexican Grill also contributed to relative performance. Several Energy sector stocks hurt performance, most notably energy producer Pacific Rubiales Energy Corporation, which has operations in Canada and South America. At the same time, the AFIS Growth-Income Fund’s slightly better than market return in the second quarter was not sufficient to overcome its weak, albeit still positive, relative return during the first quarter. Cruise ship operator Royal Caribbean, retailers Best Buy and Kohl’s, search engine rivals Google and Yahoo!, and electronic component developer Flextronics International were the biggest individual detractors from relative performance. Most of these stocks are in some way dependent on a continuing strong economy.
Even with the currency benefit from a weak dollar, foreign securities still lagged the return of domestic stocks over the six-month period. Thus, the Portfolio’s modest overweight to foreign equities—due to the foreign stocks held by the two domestic equity funds—was a slight detractor to relative performance. In contrast to 2010 and 2009 when the Portfolio’s dedicated exposure to foreign small company stocks (AFIS Global Small Capitalization Fund) and stocks from emerging market countries (AFIS New World Fund) boosted performance, this exposure hurt performance during the first half of 2011 relative to the mostly large cap, developed country stocks that make up the MSCI EAFE Index.
Investment Committee
MetLife Advisers, LLC
1
MET INVESTORS SERIES TRUST
| | |
American Funds® Balanced Allocation Portfolio | | |
Managed by MetLife Advisers, LLC
Portfolio Manager Commentary* (continued)
*This commentary may include statements that constitute “forward-looking statements” under the U.S. securities laws. Forward-looking statements include, among other things, projections, estimates, and information about possible or future results related to the Portfolio and market or regulatory developments. The views expressed above are not guarantees of future performance or economic results and involve certain risks, uncertainties and assumptions that could cause actual outcomes and results to differ materially from the views expressed herein. The views expressed above are as June 30, 2011 and are subject to change at any time based upon economic, market, or other conditions. MetLife Advisers undertakes no obligation to update the views expressed herein. Any discussions of specific securities should not be considered a recommendation to buy or sell those securities. The views expressed above (including any forward-looking statements) may not be relied upon as investment advice or as an indication of the Portfolio’s trading intent. Information about the Portfolio’s holdings, asset allocation, or country diversification (or that of the underlying portfolios used in the Portfolio) is historical and is not an indication of future Portfolio composition, which may vary. Direct investment in any index is not possible. The performance of any index mentioned in this commentary has not been adjusted for ongoing management, distribution and operating expenses applicable to mutual fund investments. In addition, the returns do not reflect additional fees charged by separate accounts or variable insurance contracts that an investor in the Portfolio may pay. If these additional fees were reflected, performance would have been lower.
Portfolio Composition as of June 30, 2011
Top Holdings
| | | | |
| | | % of
Net Assets | |
American Funds Growth-Income Fund (Class 1) | | | 35.1 | |
American Funds Growth Fund (Class 1) | | | 20.8 | |
American Funds U.S. Government/AAA—Rated Securities Fund (Class 1) | | | 13.2 | |
American Funds Bond Fund (Class 1) | | | 10.1 | |
American Funds International Fund (Class 1) | | | 7.9 | |
American Funds High-Income Bond Fund (Class 1) | | | 5.0 | |
American Funds New World Fund (Class 1) | | | 3.0 | |
American Funds Global Small Capitalization Fund (Class 1) | | | 2.9 | |
American Funds Global Bond Fund (Class 1) | | | 2.1 | |
2
MET INVESTORS SERIES TRUST
| | |
American Funds® Balanced Allocation Portfolio | | |
American Funds® Balanced Allocation Portfolio managed by
MetLife Advisers, LLC vs. Dow Jones Moderate Index1
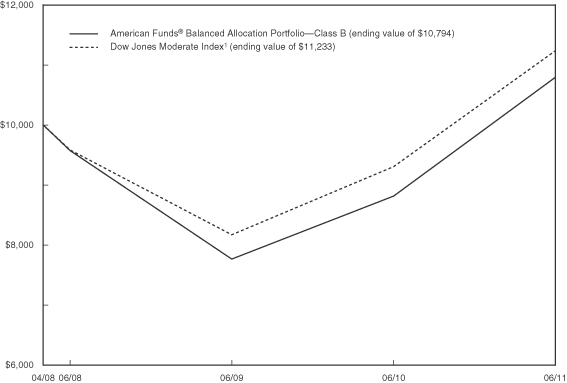
| | | | | | | | | | | | |
| | | Average Annual Return2
(for the six months ended June 30, 2011) | |
| | | 6 Month | | | 1 Year | | | Since
Inception3 | |
American Funds® Balanced Allocation
Portfolio—Class B | | | 4.29% | | | | 22.46% | | | | 2.44% | |
| Class C | | | 4.09% | | | | 22.06% | | | | 2.12% | |
| Dow Jones Moderate Index1 | | | 4.40% | | | | 20.74% | | | | 3.74% | |
The performance of Class B shares, as set forth in the line graph above, will differ from that of the other class because of the difference in expenses paid by policyholders investing in the different share classes.
1 The Dow Jones Moderate Index is a total returns index designed to provide asset allocation strategists with a target risk benchmark. Each month, the Index adjusts its weighting of stocks, bonds, and cash indices (both domestic and foreign) from Barclays and Dow Jones such that the risk combination will have 60% of the risk of an all equity portfolio.
2“Average Annual Return” is calculated including reinvestment of all income dividends and capital gain distributions.
3Inception of the Class B and Class C shares is 4/28/08. Index returns are based on an inception date of 4/28/08.
Past performance does not guarantee future results. The investment return and principal value of an investment in the Portfolio will fluctuate, so that shares, on any given day or when redeemed, may be worth more or less than their original cost. Performance numbers are net of all Portfolio expenses but do not include any insurance, sales, or administration charges of variable annuity or life insurance contracts. If these charges were included, the returns would be lower. The Index does not include fees or expenses and is not available for direct investment.
3
MET INVESTORS SERIES TRUST
| | |
American Funds® Balanced Allocation Portfolio | | |
Understanding Your Portfolio’s Expenses
Shareholder Expense Example
As a shareholder of the Portfolio, you incur ongoing costs, including management fees; distribution and service (12b-1) fees; and other Portfolio expenses. This example is intended to help you understand your ongoing costs (in dollars) (referred to as “expenses”) of investing in the Portfolio and compare these costs with the ongoing costs of investing in other mutual funds. The example is based on an investment of $1,000 invested at the beginning of the period and held for the entire period, January 1, 2011 through June 30, 2011.
Actual Expenses
The first line for each share class of the Portfolio in the table below provides information about actual account values and actual expenses. You may use the information in this line, together with the amount you invested in the particular share class of the Portfolio, to estimate the expenses that you paid over the period. Simply divide your account value by $1,000 (for example, an $8,600 account value divided by $1,000 = 8.6), then multiply the result by the number in the first line under the heading entitled “Expenses Paid During Period” to estimate the expenses you paid on your account during this period.
Hypothetical Example for Comparison Purposes
The second line for each share class of the Portfolio in the table below provides information about hypothetical account values and hypothetical expenses based on the Portfolio’s actual expense ratio and an assumed rate of return of 5% per year before expenses, which is not the Portfolio’s actual return. The hypothetical account values and expenses may not be used to estimate the actual ending account balance or expenses you paid for the period. You may use this information to compare the ongoing costs of investing in the Portfolio and other funds. To do so, compare this 5% hypothetical example with the 5% hypothetical examples that appear in the shareholder reports of the other funds.
Please note that the expenses shown in the table are meant to highlight your ongoing costs only and do not reflect any fees or charges of your variable insurance product or any additional expenses that participants in certain eligible qualified plans may bear relating to the operations of their plan. Therefore, the second line for each share class in the table is useful in comparing ongoing costs only, and will not help you determine the relative total costs of owning different funds. In addition, if these other costs were included, your costs would have been higher.
| | | | | | | | | | | | | | | | |
| | | Annualized
Expense
Ratio | | | Beginning
Account Value
January 1, 2011 | | | Ending
Account Value
June 30, 2011 | | | Expenses Paid
During Period**
January 1, 2011
to June 30, 2011 | |
| | | | | | | | | | | | | | | | |
| | | | |
| | | | | | | | | | | | | | | | |
Class B(a)(b) | | | | | | | | | | | | | | | | |
Actual | | | 0.44% | | | $ | 1,000.00 | | | $ | 1,042.90 | | | $ | 2.22 | |
Hypothetical* | | | 0.44% | | | | 1,000.00 | | | | 1,022.62 | | | | 2.20 | |
| | | | | | | | | | | | | | | | |
| | | | |
| | | | | | | | | | | | | | | | |
Class C(a)(b) | | | | | | | | | | | | | | | | |
Actual | | | 0.74% | | | $ | 1,000.00 | | | $ | 1,040.90 | | | $ | 3.74 | |
Hypothetical* | | | 0.74% | | | | 1,000.00 | | | | 1,021.13 | | | | 3.70 | |
| | | | | | | | | | | | | | | | |
* Hypothetical assumes a rate of return of 5% per year before expenses.
** Expenses paid are equal to the Portfolio’s annualized expense ratio for the most recent six month period, as shown above, multiplied by the average account value over the period, multiplied by the number of days (181 days) in the most recent fiscal half-year, divided by 365 (to reflect the one-half year period).
(a) The annualized expense ratio shown reflects an expense limitation agreement between MetLife Advisers, LLC and the Portfolio as described in Note 3 of the Notes to Financial Statements.
(b) The annualized expense ratio reflects the expenses of both the Portfolio and the Underlying Portfolios in which it invests.
4
MET INVESTORS SERIES TRUST
| | |
American Funds® Balanced Allocation Portfolio | | |
Schedule of Investments as of June 30, 2011 (Unaudited)
Mutual Funds—100.1% of Net Assets
| | | | | | | | |
| Security Description | | Shares | | | Value | |
| |
| Investment Company Securities—100.1% | | | | | |
American Funds Bond Fund (Class 1) (a) | | | 39,871,295 | | | $ | 434,597,115 | |
American Funds Global Bond Fund (Class 1) (a) | | | 7,128,456 | | | | 87,109,739 | |
American Funds Global Small Capitalization Fund (Class 1) (a) | | | 5,828,940 | | | | 125,497,089 | |
American Funds Growth Fund (Class 1) (a) | | | 15,386,336 | | | | 891,330,418 | |
American Funds Growth-Income Fund (Class 1) (a) | | | 41,949,923 | | | | 1,507,680,219 | |
American Funds High-Income Bond Fund (Class 1) (a) | | | 18,563,870 | | | | 214,969,617 | |
American Funds International Fund (Class 1) (a) | | | 18,016,919 | | | | 338,898,239 | |
American Funds New World Fund (Class 1) (a) | | | 5,391,578 | | | | 126,270,759 | |
American Funds U.S. Government /AAA—Rated Securities Fund (Class 1) (a) | | | 45,274,343 | | | | 567,287,523 | |
| | | | | | | | |
Total Mutual Funds
(Cost $3,666,281,900) | | | | | | | 4,293,640,718 | |
| | | | | | | | |
Total Investments—100.1%
(Cost $3,666,281,900#) | | | | | | | 4,293,640,718 | |
| | | | | | | | |
Other Assets And Liabilities
(net)—(0.1)% | | | | | | | (2,185,108 | ) |
| | | | | | | | |
| Net Assets—100.0% | | | | | | $ | 4,291,455,610 | |
| | | | | | | | |
| # | As of June 30, 2011, the aggregate cost of investments for federal income tax purposes was $3,666,281,900. The aggregate unrealized appreciation of investments was $627,358,818, resulting in net unrealized appreciation of $627,358,818 for federal income tax purposes. |
| (a) | A Fund of the American Funds Insurance Series. |
See accompanying notes to financial statements.
5
MET INVESTORS SERIES TRUST
| | |
American Funds® Balanced Allocation Portfolio | | |
Schedule of Investments as of June 30, 2011 (Unaudited)
FAIR VALUE HIERARCHY
Accounting principles generally accepted in the United States of America (“GAAP”) defines fair market value as the price that the Portfolio would receive to sell an asset or pay to transfer a liability in an orderly transaction between market participants at the measurement date. It establishes a fair value hierarchy that prioritizes inputs to valuation methods and requires disclosure of the fair value hierarchy that segregates fair value measurements into three levels. Levels 1, 2 and 3 of the fair value hierarchy are defined as follows:
Level 1 - unadjusted quoted prices in active markets for identical investments
Level 2 - other significant observable inputs (including, but not limited to, unadjusted quoted prices for similar investments in markets that are either active or inactive; inputs other than quoted prices that are observable such as interest rates, yield curves, volatilities, prepayment speeds, loss severities, credit risks, default rates, etc.)
Level 3 - significant unobservable inputs based on the best information available in the circumstances, to the extent observable inputs are unavailable (including the Portfolio's own assumptions in determining the fair value of investments)
The inputs or methodologies used for valuing investments are not necessarily an indication of the risk associated with investing in them. For a change in the methodology used, transfers between levels will be recognized as of the beginning of the reporting period. Information on transfers between Level 1 and Level 2 deemed significant, if any, will be disclosed following the valuation table below. For the six months ended June 30, 2011, there were no transfers between Levels 1 and 2. A reconciliation of Level 3 securities, if any, will also be disclosed following the valuation table. For more information about the Portfolio’s policy regarding the valuation of investments, please refer to the Notes to Financial Statements.
The following table summarizes the fair value hierarchy of the Portfolio's investments as of June 30, 2011:
| | | | | | | | | | | | | | | | |
| Description | | Level 1 | | | Level 2 | | | Level 3 | | | Total | |
Mutual Funds | | | | | | | | | | | | | | | | |
Investment Company Securities | | $ | 4,293,640,718 | | | $ | — | | | $ | — | | | $ | 4,293,640,718 | |
Total Investments | | $ | 4,293,640,718 | | | $ | — | | | $ | — | | | $ | 4,293,640,718 | |
| | | | | | | | | | | | | | | | | |
See accompanying notes to financial statements.
6
MET INVESTORS SERIES TRUST
| | |
American Funds® Balanced Allocation Portfolio | | |
Statement of Assets and Liabilities
June 30, 2011 (Unaudited)
| | | | |
| Assets | | | | |
Investments at value (a) | | $ | 4,293,640,718 | |
Receivable for investments sold | | | 479,229 | |
Receivable for shares sold | | | 1,141,093 | |
| | | | |
Total assets | | | 4,295,261,040 | |
| | | | |
| Liabilities | | | | |
Payables for: | | | | |
Shares redeemed | | | 1,620,322 | |
Accrued Expenses: | | | | |
Management fees | | | 203,264 | |
Distribution and service fees - Class B | | | 373 | |
Distribution and service fees - Class C | | | 1,896,039 | |
Administration fees | | | 1,901 | |
Custodian and accounting fees | | | 4,031 | |
Deferred trustees’ fees | | | 20,516 | |
Other expenses | | | 58,984 | |
| | | | |
Total liabilities | | | 3,805,430 | |
| | | | |
| Net Assets | | $ | 4,291,455,610 | |
| | | | |
| Net Assets Represented by | | | | |
Paid in surplus | | $ | 3,656,565,335 | |
Accumulated net realized gain | | | 1,999,851 | |
Unrealized appreciation on investments | | | 627,358,818 | |
Undistributed net investment income | | | 5,531,606 | |
| | | | |
Net Assets | | $ | 4,291,455,610 | |
| | | | |
| Net Assets | | | | |
Class B | | $ | 1,852,839 | |
Class C | | | 4,289,602,771 | |
| Capital Shares Outstanding* | | | | |
Class B | | | 183,353 | |
Class C | | | 426,902,917 | |
| Net Asset Value, Offering Price and Redemption Price Per Share | | | | |
Class B | | $ | 10.11 | |
Class C | | | 10.05 | |
| * | | The Portfolio is authorized to issue an unlimited number of shares. |
| (a) | | Identified cost of investments was $3,666,281,900. |
Statement of Operations
Six Months Ended June 30, 2011 (Unaudited)
| | | | |
| Investment Income | | | | |
Dividends from Underlying Portfolios | | $ | 17,771,711 | |
| | | | |
Total investment income | | | 17,771,711 | |
| | | | |
| Expenses | | | | |
Management fees | | | 1,177,357 | |
Administration fees | | | 11,901 | |
Custodian and accounting fees | | | 12,298 | |
Distribution and service fees - Class B | | | 2,124 | |
Distribution and service fees - Class C | | | 10,900,703 | |
Audit and tax services | | | 9,750 | |
Legal | | | 20,801 | |
Trustees’ fees and expenses | | | 15,868 | |
Shareholder reporting | | | 30,393 | |
Insurance | | | 31,016 | |
Miscellaneous | | | 11,453 | |
| | | | |
Total expenses | | | 12,223,664 | |
| | | | |
Net investment income | | | 5,548,047 | |
| | | | |
| Net Realized and Unrealized Gain on Investments | | | | |
Net realized gain on: | | | | |
Investments | | | 25,124,301 | |
Capital gain distributions from Underlying Portfolios | | | 13,677,417 | |
| | | | |
Net realized gain on investments and capital gain distributions from Underlying Portfolios | | | 38,801,718 | |
| | | | |
Net change in unrealized appreciation on investments | | | 108,874,209 | |
| | | | |
Net realized and unrealized gain on investments | | | 147,675,927 | |
| | | | |
| Net Increase in Net Assets from Operations | | $ | 153,223,974 | |
| | | | |
See accompanying notes to financial statements.
7
MET INVESTORS SERIES TRUST
| | |
American Funds® Balanced Allocation Portfolio | | |
Statements of Changes in Net Assets
June 30, 2011
| | | | | | | | |
| | | Six Months
Ended
June 30, 2011
(Unaudited) | | | Year Ended
December 31,
2010 | |
| Increase (Decrease) in Net Assets: | | | | | | | | |
| Operations | | | | | | | | |
Net investment income | | $ | 5,548,047 | | | $ | 49,262,614 | |
Net realized gain (loss) on investments and capital gain distributions from Underlying Portfolios | | | 38,801,718 | | | | (9,395,369 | ) |
Net change in unrealized appreciation on investments | | | 108,874,209 | | | | 304,908,419 | |
| | | | | | | | |
Net increase in net assets resulting from operations | | | 153,223,974 | | | | 344,775,664 | |
| | | | | | | | |
| Distributions to Shareholders | | | | | | | | |
From net investment income | | | | | | | | |
Class B | | | (25,798 | ) | | | (10,261 | ) |
Class C | | | (50,842,682 | ) | | | (27,437,163 | ) |
From net realized gains | | | | | | | | |
Class B | | | (962 | ) | | | (381 | ) |
Class C | | | (2,238,552 | ) | | | (1,177,268 | ) |
| | | | | | | | |
Net decrease in net assets resulting from distributions | | | (53,107,994 | ) | | | (28,625,073 | ) |
| | | | | | | | |
Net increase in net assets from capital share transactions | | | 621,176,788 | | | | 1,255,094,945 | |
| | | | | | | | |
| Net Increase in Net Assets | | | 721,292,768 | | | | 1,571,245,536 | |
Net assets at beginning of period | | | 3,570,162,842 | | | | 1,998,917,306 | |
| | | | | | | | |
Net assets at end of period | | $ | 4,291,455,610 | | | $ | 3,570,162,842 | |
| | | | | | | | |
Undistributed net investment income at end of period | | $ | 5,531,606 | | | $ | 50,852,039 | |
| | | | | | | | |
| | | | | | | | | | | | | | | | |
| Other Information: | | | | | | | | | | | | | | | | |
| Capital Shares | | | | | | | | | | | | | | | | |
| | | | |
Transactions in capital shares were as follows: | | | | | | | | | | | | | | | | |
| | | Six Months Ended
June 30, 2011
(Unaudited) | | | Year Ended
December 31, 2010 | |
| | | Shares | | | Value | | | Shares | | | Value | |
| Class B | | | | | | | | | | | | | | | | |
Sales | | | 33,508 | | | $ | 337,336 | | | | 97,927 | | | $ | 899,947 | |
Reinvestments | | | 2,642 | | | | 26,760 | | | | 1,148 | | | | 10,642 | |
Redemptions | | | (4,648 | ) | | | (46,860 | ) | | | (16,028 | ) | | | (143,717 | ) |
| | | | | | | | | | | | | | | | |
Net increase | | | 31,502 | | | $ | 317,236 | | | | 83,047 | | | $ | 766,872 | |
| | | | | | | | | | | | | | | | |
| Class C | | | | | | | | | | | | | | | | |
Sales | | | 66,651,243 | | | $ | 667,795,133 | | | | 152,242,289 | | | $ | 1,375,333,474 | |
Reinvestments | | | 5,265,995 | | | | 53,081,234 | | | | 3,100,155 | | | | 28,614,431 | |
Redemptions | | | (10,004,212 | ) | | | (100,016,815 | ) | | | (16,791,775 | ) | | | (149,619,832 | ) |
| | | | | | | | | | | | | | | | |
Net increase | | | 61,913,026 | | | $ | 620,859,552 | | | | 138,550,669 | | | $ | 1,254,328,073 | |
| | | | | | | | | | | | | | | | |
Increase derived from capital shares transactions | | | | | | $ | 621,176,788 | | | | | | | $ | 1,255,094,945 | |
| | | | | | | | | | | | | | | | |
See accompanying notes to financial statements.
8
MET INVESTORS SERIES TRUST
|
American Funds® Balanced Allocation Portfolio |
Financial Highlights
| | | | | | | | | | | | | | | | |
| Selected per share data | | | | | | | | | | | | |
| | | Class B | |
| | | Six Months Ended
June 30, 2011
(Unaudited) | | | Year Ended
December 31, | |
| | | | 2010 | | | 2009 | | | 2008(b) | |
| Net Asset Value, Beginning of Period | | $ | 9.84 | | | $ | 8.87 | | | $ | 6.82 | | | $ | 10.00 | |
| | | | | | | | | | | | | | | | |
| Income (Loss) from Investment Operations: | | | | | | | | | | | | | | | | |
Net Investment Income(a) | | | 0.03 | | | | 0.22 | | | | 0.24 | | | | 0.08 | |
Net Realized and Unrealized Gain (Loss) on Investments | | | 0.40 | | | | 0.87 | | | | 1.81 | | | | (3.00 | ) |
| | | | | | | | | | | | | | | | |
Total From Investment Operations | | | 0.43 | | | | 1.09 | | | | 2.05 | | | | (2.92 | ) |
| | | | | | | | | | | | | | | | |
| Less Distributions | | | | | | | | | | | | | | | | |
Distributions from Net Investment Income | | | (0.15 | ) | | | (0.12 | ) | | | — | | | | (0.26 | ) |
Distributions from Net Realized Capital Gains | | | (0.01 | ) | | | (0.00 | )+ | | | — | | | | (0.00 | )+ |
| | | | | | | | | | | | | | | | |
Total Distributions | | | (0.16 | ) | | | (0.12 | ) | | | — | | | | (0.26 | ) |
| | | | | | | | | | | | | | | | |
| Net Asset Value, End of Period | | $ | 10.11 | | | $ | 9.84 | | | $ | 8.87 | | | $ | 6.82 | |
| | | | | | | | | | | | | | | | |
| Total Return (%) | | | 4.29 | | | | 12.40 | | | | 30.06 | | | | (29.20 | ) |
| | | | |
| Ratios/Supplemental Data | | | | | | | | | | | | | | | | |
Ratio of Expenses to Average Net Assets (%)(c) | | | 0.32 | * | | | 0.33 | | | | 0.36 | | | | 0.78 | * |
Ratio of Net Expenses to Average Net Assets (%)(d)(e) | | | 0.32 | * | | | 0.33 | | | | 0.35 | | | | 0.35 | * |
Ratio of Net Investment Income to Average Net Assets (%)(f) | | | 0.60 | * | | | 2.38 | | | | 2.99 | | | | 1.32 | * |
Portfolio Turnover Rate (%) | | | 3.9 | | | | 6.4 | | | | 5.9 | | | | 12.1 | |
Net Assets, End of Period (in millions) | | $ | 1.9 | | | $ | 1.5 | | | $ | 0.6 | | | $ | 0.1 | |
| | | | | | | | | | | | | | | | |
| | | Class C | |
| | | Six Months Ended
June 30, 2011
(Unaudited) | | | Year Ended
December 31, | |
| | | | 2010 | | | 2009 | | | 2008(b) | |
| Net Asset Value, Beginning of Period | | $ | 9.78 | | | $ | 8.82 | | | $ | 6.82 | | | $ | 10.00 | |
| | | | | | | | | | | | | | | | |
| Income (Loss) from Investment Operations: | | | | | | | | | | | | | | | | |
Net Investment Income(a) | | | 0.01 | | | | 0.17 | | | | 0.17 | | | | 0.36 | |
Net Realized and Unrealized Gain (Loss) on Investments | | | 0.39 | | | | 0.89 | | | | 1.83 | | | | (3.28 | ) |
| | | | | | | | | | | | | | | | |
Total From Investment Operations | | | 0.40 | | | | 1.06 | | | | 2.00 | | | | (2.92 | ) |
| | | | | | | | | | | | | | | | |
| Less Distributions | | | | | | | | | | | | | | | | |
Distributions from Net Investment Income | | | (0.12 | ) | | | (0.10 | ) | | | — | | | | (0.26 | ) |
Distributions from Net Realized Capital Gains | | | (0.01 | ) | | | (0.00 | )+ | | | — | | | | (0.00 | )+ |
| | | | | | | | | | | | | | | | |
Total Distributions | | | (0.13 | ) | | | (0.10 | ) | | | — | | | | (0.26 | ) |
| | | | | | | | | | | | | | | | |
| Net Asset Value, End of Period | | $ | 10.05 | | | $ | 9.78 | | | $ | 8.82 | | | $ | 6.82 | |
| | | | | | | | | | | | | | | | |
| Total Return (%) | | | 4.09 | | | | 12.16 | | | | 29.33 | | | | (29.20 | ) |
| | | | |
| Ratios/Supplemental Data | | | | | | | | | | | | | | | | |
Ratio of Expenses to Average Net Assets (%)(c) | | | 0.62 | * | | | 0.63 | | | | 0.66 | | | | 0.70 | * |
Ratio of Net Expenses to Average Net Assets (%)(d)(e) | | | 0.62 | * | | | 0.63 | | | | 0.65 | | | | 0.65 | * |
Ratio of Net Investment Income to Average Net Assets (%)(f) | | | 0.28 | * | | | 1.85 | | | | 2.19 | | | | 6.70 | * |
Portfolio Turnover Rate (%) | | | 3.9 | | | | 6.4 | | | | 5.9 | | | | 12.1 | |
Net Assets, End of Period (in millions) | | $ | 4,289.6 | | | $ | 3,568.7 | | | $ | 1,998.3 | | | $ | 545.4 | |
| + | | Distributions from net realized gains were less than $0.01. |
| (a) | | Per share amounts based on average shares outstanding during the period. |
| (b) | | Commencement of operations—04/28/2008. |
| (c) | | See Note 3 of the Notes to Financial Statements. |
| (d) | | The ratio of operating expenses to average net assets does not include expenses of the Underlying Portfolios in which the Portfolio invests. |
| (e) | | Includes the effects of management fee waivers and expenses reimbursed by the Adviser, if applicable. |
| (f) | | Recognition of net investment income by the Portfolio is affected by the timing of the declaration of dividends by the Underlying Portfolios in which it invests. |
See accompanying notes to financial statements.
9
MET INVESTORS SERIES TRUST
| | |
American Funds® Balanced Allocation Portfolio | | |
Notes to Financial Statements—June 30, 2011 (Unaudited)
1. Organization
Met Investors Series Trust (the “Trust”) is organized as a statutory trust under the laws of Delaware, as an open-end management investment company under the Investment Company Act of 1940, as amended (the “1940 Act”). The Trust currently offers fifty-four Portfolios (the “Portfolios”), each of which operates as a distinct investment vehicle of the Trust. The portfolio included in this report is American Funds® Balanced Allocation Portfolio (the “Portfolio”), which is diversified. Shares in the Portfolio are not offered directly to the general public and are currently available only to separate accounts established by Metropolitan Life Insurance Company (“MetLife”) and other affiliated life insurance companies.
The Portfolio has registered four classes of shares: Class A, B, C and E Shares. Class B and C Shares are currently offered by the Portfolio. Shares of each Class of the Portfolio represent an equal pro rata interest in the Portfolio and generally give the shareholder the same voting, dividend, liquidation, and other rights. Investment income, realized and unrealized capital gains and losses, the common expenses of the Portfolio and certain Portfolio-level expense reductions, if any, are allocated on a pro rata basis to each Class based on the relative net assets of each Class to the net assets of the Portfolio. Each Class of shares differs in its respective distribution expenses.
The Portfolio is designed on established principles of asset allocation to achieve a specific risk profile. The Portfolio will invest substantially all of its assets in certain funds of the American Funds Insurance Series (“AFIS”) (“Underlying Portfolios”). AFIS is an open-end diversified investment management company advised by Capital Research and Management Company (“CRMC”), an indirect, wholly owned subsidiary of The Capital Group Companies, Inc.
2. Significant Accounting Policies
The financial statements have been prepared in conformity with accounting principles generally accepted in the United States of America (“GAAP”) which require management to make estimates and assumptions that affect the reported amounts of assets and liabilities at the date of the financial statements and the reported amounts of income and expenses during the reporting period. Actual results could differ from these estimates. In the preparation of these financial statements, management has evaluated events and transactions subsequent to June 30, 2011 through the date that the financial statements were issued.
The following is a summary of significant accounting policies consistently followed by the Portfolio in the preparation of its financial statements.
Valuation - Investments in the Underlying Portfolios are valued at their closing daily net asset value. The net asset value of the Portfolio is calculated based on the net asset values of the Underlying Portfolios in which the Portfolio invests. For information about the use of fair value pricing by the Underlying Portfolios that are funds of AFIS, please refer to the prospectus of the Underlying Portfolios.
Investment Transactions and Related Investment Income - The Portfolio’s security transactions are recorded on the trade date. Dividend income is recorded on the ex-dividend date. Interest income is recorded on the accrual basis. Realized gains and losses on investments and unrealized appreciation and depreciation are determined on the identified cost basis, which is the same basis used for federal income tax purposes.
Income Taxes - It is the Portfolio’s policy to comply with the requirements of the Internal Revenue Code of 1986, as amended (the “Code”), and regulations thereunder, applicable to regulated investment companies and to distribute, with respect to each taxable year, all of its taxable income to shareholders. Therefore, no federal income tax provision is required. The Portfolio files U.S. federal and various state tax returns. No income tax returns are currently under examination. The Portfolio’s federal tax returns for the prior three fiscal years remain subject to examination by the Internal Revenue Service.
Dividends and Distributions to Shareholders - The Portfolio records dividends and distributions on the ex-dividend date. Net realized gains from security transactions (if any) are generally distributed annually to shareholders. The timing and characterization of certain income and capital gains distributions are determined in accordance with federal tax regulations that may differ from GAAP. Permanent book and tax basis differences relating to shareholder distributions will result in reclassification between under/over distributed net investment income, accumulated net realized gains/losses and paid in surplus. Book-tax differences are primarily due to short-term capital gain distributions received from underlying portfolios, deferred trustees’ compensation, and losses deferred due to wash sales, as applicable. These adjustments have no impact on net assets or the results of operations.
3. Investment Management Agreement and Other Transactions with Affiliates
Investment Management Agreement - The Trust is managed by MetLife Advisers, LLC (the “Adviser”), an affiliate of MetLife, Inc. The Trust has entered into a management agreement (the “Management Agreement”) with the Adviser for investment management services in connection with the investment management of the Portfolio. The Adviser is subject to the supervision and direction of the Board of Trustees (the “Board”) and has overall responsibility for the general management and administration of the Trust.
10
MET INVESTORS SERIES TRUST
| | |
American Funds® Balanced Allocation Portfolio | | |
Notes to Financial Statements—June 30, 2011 (Unaudited)—(Continued)
3. Investment Management Agreement and Other Transactions with Affiliates - continued
Under the terms of the Portfolio’s Management Agreement, the Portfolio pays the Adviser a monthly fee based upon annual rates applied to the Portfolio’s average daily net assets as follows:
| | | | | | |
Management Fees
earned by the Adviser
for the six months ended
June 30, 2011 | | % per annum | | | Average Daily Net Assets |
| | |
| $1,177,357 | | | 0.100 | % | | First $500 Million |
| | |
| | | 0.075 | % | | $500 Million to $1 Billion |
| | |
| | | 0.050 | % | | Over $1 Billion |
Certain officers and trustees of the Trust may also be officers of the Adviser; however, such officers and trustees receive no compensation from the Trust.
Transfer Agency Agreement - MetLife serves as the transfer agent for the Trust. MetLife receives no fees for its services to the Trust under the transfer agency agreement.
Expense Limitation Agreement - The Adviser had entered into an expense limitation agreement with the Trust (“Expense Limitation Agreement”) in the interest of limiting expenses of the Portfolio. The Expense Limitation Agreement continued in effect with respect to the Portfolio until April 30, 2011. Pursuant to that Expense Limitation Agreement, the Adviser had agreed to waive or limit its fees and to assume other expenses so that the total annual operating expenses of the Portfolio other than interest, taxes, brokerage commissions, other expenditures which were capitalized or expensed in accordance with GAAP, other extraordinary expenses not incurred in the ordinary course of the Portfolio’s business and Underlying Portfolios’ fees and expenses but including amounts payable pursuant to a plan adopted in accordance with Rule 12b-1 under the 1940 Act, were limited to the following expense ratios as a percentage of the Portfolio’s average daily net assets:
| | | | |
Maximum Expense Ratio under current
Expense Limitation Agreement | |
| Class B | | Class C | |
| |
| 0.35% | | | 0.65 | % |
If in any year in which the Management Agreement is still in effect, the estimated aggregate operating expenses of the Portfolio for the fiscal year are less than the Maximum Expense Ratios for that year, subject to approval by the Trust’s Board, the Adviser shall be entitled to reimbursement by the Portfolio to the extent that the charge does not cause the expenses in such subsequent year to exceed the Maximum Expense Ratios as stated above. The Portfolio is not obligated to repay any expense paid by the Adviser more than five years after the end of the fiscal year in which such expense was incurred.
Effective May 1, 2011, there was no longer an expense cap for the Portfolio.
Distribution Agreements and Plans - The Trust has distribution agreements with MetLife Investors Distribution Company (“MIDC” or the “Distributor”) in which MIDC serves as the Distributor for the Trust’s Class B and Class C Shares. MIDC is a wholly-owned subsidiary of MetLife Investors Group, Inc., an affiliate of the Adviser. The Class B and Class C distribution plans provide that the Trust, on behalf of the Portfolio, may pay annually up to 0.50% and 1.00%, respectively, of the average daily net assets of the Portfolio attributable to its Class B and Class C Shares with respect to activities primarily intended to result in the sale of Class B and Class C Shares. However, under the Class B and Class C distribution agreements, payments to the Distributor for activities pursuant to the Class B and Class C distribution plans are currently limited to payments at an annual rate equal to 0.25% and 0.55% of average daily net assets of the Portfolio attributable to its Class B and Class C Shares, respectively. Amounts incurred by the Portfolio for the six months ended June 30, 2011 are shown as Distribution and service fees in the Statement of Operations.
Under the terms of the Class B and Class C distribution plans and distribution agreements, the Portfolio is authorized to make payments monthly to the Distributor that may be used to pay or reimburse entities providing distribution and shareholder servicing with respect to the Class B and Class C Shares for such entities’ fees or expenses incurred.
Deferred Trustee Compensation - Each Trustee of the Trust who is not currently an employee of the Adviser or any of its affiliates receives compensation from the Trust for his or her service to the Portfolio. A deferred compensation plan (the “Plan”) is available to the Trustees on a voluntary basis. Deferred amounts remain in the Trust until distributed in accordance with the provisions of the Plan. The value of a participating Trustee’s deferral account is based on theoretical investments of deferred amounts, on the normal payment dates, in certain portfolios of the Trust
11
MET INVESTORS SERIES TRUST
| | |
American Funds® Balanced Allocation Portfolio | | |
Notes to Financial Statements—June 30, 2011 (Unaudited)—(Continued)
3. Investment Management Agreement and Other Transactions with Affiliates - continued
or Metropolitan Series Fund, Inc. as designated by the participating Trustee. Changes in the value of participants’ deferral accounts are reflected as Trustees’ fees and expenses in the Statement of Operations. The portion of the accrued obligations allocated to the Portfolio, if any, under the Plan are reflected as Deferred trustees’ fees in the Statement of Assets and Liabilities.
4. Investment Transactions
Aggregate cost of purchases and proceeds of sales of investment securities, excluding short-term securities, for the six months ended June 30, 2011 were as follows:
| | | | | | | | | | | | |
| Purchases | | | Sales | |
| U.S. Government | | Non U.S. Government | | | U.S. Government | | | Non U.S. Government | |
| | | |
| $— | | $ | 743,940,055 | | | $ | — | | | $ | 156,307,594 | |
5. Contractual Obligations
The Trust has a variety of indemnification obligations under contracts with its service providers. The Trust’s maximum exposure under these arrangements is unknown.
6. Market, Credit and Counterparty Risk
In the normal course of business, the Underlying Portfolios invest in securities and enter into transactions where risks exist due to fluctuations in the market (market risk) or failure of the other party to a transaction to perform (credit and counterparty risk). The value of securities held by the Underlying Portfolios may decline in response to certain events, including those directly involving the companies whose securities are owned by the Underlying Portfolios; conditions affecting the general economy; overall market changes; local, regional or global political, social or economic instability; and currency and interest rate and price fluctuations. The Underlying Portfolios may be exposed to counterparty risk, or the risk that an entity with which the Underlying Portfolios have unsettled or open transactions may default. The potential loss could exceed the value of the financial assets recorded in the financial statements. Financial assets that potentially expose the Underlying Portfolios to credit risk consist principally of cash due from counterparties and investments.
7. Transactions in Securities of Underlying Portfolios
The Portfolio does not invest in the Underlying Portfolios for the purpose of exercising management or control; however, investments by the Portfolio within its principal investment strategies may represent a significant portion of the Underlying Portfolio’s net assets. Transactions in the Underlying Portfolios during the six months ended June 30, 2011 were as follows:
| | | | | | | | | | | | | | | | |
Underlying Portfolio (Class 1) | | Number of shares
held at December 31,
2010 | | | Shares purchased | | | Shares sold | | | Number of shares
held at June 30,
2011 | |
| | | | |
American Funds Bond Fund* | | | 25,335,425 | | | | 14,567,628 | | | | (31,758 | ) | | | 39,871,295 | |
| | | | |
American Funds Global Bond Fund* | | | 5,827,554 | | | | 1,306,554 | | | | (5,652 | ) | | | 7,128,456 | |
| | | | |
American Funds Global Small Capitalization Fund* | | | 5,224,176 | | | | 832,287 | | | | (227,523 | ) | | | 5,828,940 | |
| | | | |
American Funds Growth Fund* | | | 14,901,512 | | | | 2,142,899 | | | | (1,658,075 | ) | | | 15,386,336 | |
| | | | |
American Funds Growth-Income Fund* | | | 37,360,737 | | | | 5,665,820 | | | | (1,076,634 | ) | | | 41,949,923 | |
| | | | |
American Funds High-Income Bond Fund* | | | 15,965,927 | | | | 2,619,584 | | | | (21,641 | ) | | | 18,563,870 | |
| | | | |
American Funds International Fund* | | | 16,098,692 | | | | 2,430,002 | | | | (511,775 | ) | | | 18,016,919 | |
| | | | |
American Funds New World Fund* | | | 4,731,497 | | | | 746,614 | | | | (86,533 | ) | | | 5,391,578 | |
| | | | |
American Funds U.S. Government/AAA—Rated Securities Fund* | | | 34,623,726 | | | | 10,685,985 | | | | (35,368 | ) | | | 45,274,343 | |
| * | | The Portfolio had ownership of at least 25% of the outstanding voting securities of the Underlying Portfolio as of June 30, 2011. Once filed, the most recent Annual Report of the Underlying Portfolio will be available without charge, upon request, by calling (800) 848-3854 or on the Securities and Exchange Commission’s website at http:// www.sec.gov. |
12
MET INVESTORS SERIES TRUST
| | |
American Funds® Balanced Allocation Portfolio | | |
Notes to Financial Statements—June 30, 2011 (Unaudited)—(Continued)
7. Transactions in Securities of Underlying Portfolios - continued
| | | | | | | | | | | | | | | | |
Underlying Portfolio (Class 1) | | Net Realized
Gain on sales
of Underlying
Portfolios | | | Capital Gain
Distributions
from Underlying
Portfolios | | | Dividend income
from Underlying
Portfolios | | | Ending Value as
of June 30,
2011 | |
| | | | |
American Funds Bond Fund | | $ | 4,389 | | | $ | — | | | $ | 2,134,107 | | | $ | 434,597,115 | |
| | | | |
American Funds Global Bond Fund | | | 7,573 | | | | 456,776 | | | | 435,693 | | | | 87,109,739 | |
| | | | |
American Funds Global Small Capitalization Fund | | | 2,345,965 | | | | — | | | | 1,558,351 | | | | 125,497,089 | |
| | | | |
American Funds Growth Fund | | | 18,180,074 | | | | — | | | | 2,840,330 | | | | 891,330,418 | |
| | | | |
American Funds Growth-Income Fund | | | 3,248,720 | | | | — | | | | 4,788,766 | | | | 1,507,680,219 | |
| | | | |
American Funds High-Income Bond Fund | | | 69,606 | | | | — | | | | 2,719,758 | | | | 214,969,617 | |
| | | | |
American Funds International Fund | | | 862,826 | | | | — | | | | 1,019,492 | | | | 338,898,239 | |
| | | | |
American Funds New World Fund | | | 374,123 | | | | — | | | | 694,008 | | | | 126,270,759 | |
| | | | |
American Funds U.S. Government/AAA—Rated Securities Fund | | | 31,025 | | | | 13,220,641 | | | | 1,581,206 | | | | 567,287,523 | |
| | | | | | | | | | | | | | | | |
| | | | |
| | $ | 25,124,301 | | | $ | 13,677,417 | | | $ | 17,771,711 | | | $ | 4,293,640,718 | |
| | | | | | | | | | | | | | | | |
8. Income Tax Information
The tax character of distributions paid for the years ended December 31, 2010 and 2009 were as follows:
| | | | | | | | | | | | | | | | | | | | |
| Ordinary Income | | | Long-Term Capital Gains | | | Total | |
| 2010 | | 2009 | | | 2010 | | | 2009 | | | 2010 | | | 2009 | |
| | | | | |
| $27,956,598 | | $ | — | | | $ | 668,475 | | | $ | — | | | $ | 28,625,073 | | | $ | — | |
As of December 31, 2010, the components of distributable earnings (accumulated losses) on a federal income tax basis were as follows:
| | | | | | | | | | | | | | | | |
Undistributed
Ordinary
Income | | Undistributed
Long-Term Capital
Gain | | | Net
Unrealized
Appreciation | | | Loss
Carryforwards | | | Total | |
| | | | |
| $50,868,341 | | $ | 2,239,284 | | | $ | 481,682,971 | | | $ | — | | | $ | 534,790,596 | |
The Regulated Investment Company Modernization Act of 2010 (the “Act”) was signed into law by President Obama on December 22, 2010.
The Act makes a number of changes to the provisions in the Code relating to regulated investment companies (“RICs”) that will generally become effective for taxable years of RICs beginning after December 22, 2010. The Act allows RICs to generally carryover net capital losses indefinitely, effective for losses arising in taxable years beginning after December 22, 2010. Such losses will retain their character as either long-term capital losses or short-term capital losses. Under pre-enactment law, capital losses could be carried forward for eight years and carried forward as short-term capital losses irrespective of the character of the original loss. Loss carryovers from years beginning prior to December 22, 2010 will still expire subject to the eight-year limitation. The Act further provides that losses arising in taxable years after December 22, 2010 (which are carried forward indefinitely) would be utilized prior to loss carryovers arising in taxable years beginning prior to December 22, 2010.
9. Recent Accounting Pronouncements
In January 2010, the Financial Accounting Standards Board (“FASB”) issued Accounting Standards Update No. 2010-06, “Improving Disclosures About Fair Value Measurements” (“ASU”) which was generally effective for years beginning after December 15, 2009 and was adopted by the Portfolio. The ASU requires enhanced disclosures about purchases, sales, issuances and settlements on a gross basis relating to Level 3 fair value measurements. These enhanced disclosures became effective for fiscal years beginning after December 15, 2010, and for interim periods within those years. Management has evaluated the impact of ASU 2010-06 and has concluded that ASU 2010-06 has no material impact on these financial statements.
13
MET INVESTORS SERIES TRUST
| | |
American Funds® Balanced Allocation Portfolio | | |
Notes to Financial Statements—June 30, 2011 (Unaudited)—(Continued)
9. Recent Accounting Pronouncements - continued
In May 2011, FASB issued Accounting Standards Update (ASU) No. 2011-04 “Amendments to Achieve Common Fair Value Measurement and Disclosure Requirements in GAAP and the International Financial Reporting Standards (IFRS).” ASU 2011-04 includes common requirements for measurement of and disclosure about fair value between U.S. GAAP and IFRS. ASU 2011-04 will require reporting entities to categorize within Level 3 of the fair value hierarchy: quantitative information about the unobservable inputs used in the fair value measurement, the valuation processes used by the reporting entity and a narrative description of the sensitivity of the fair value measurement to changes in unobservable inputs and the interrelationships between those unobservable inputs. In addition, ASU 2011-04 will require reporting entities to make disclosures about amounts and reasons for all transfers in and out of Level 1 and Level 2 fair value measurements. The new and revised disclosures are effective for fiscal years beginning after December 15, 2011 and for interim periods within those fiscal years. Management is currently evaluating the implications of ASU 2011-04 and its impact on the financial statements.
14
MET INVESTORS SERIES TRUST
| | |
American Funds® Balanced Allocation Portfolio | | |
Quarterly Portfolio Schedule
The Trust files Form N-Q for the first and third quarters of each fiscal year. The Trust’s Forms N-Q will be available on the Securities and Exchange Commission’s website at http://www.sec.gov. The Trust’s Forms N-Q may be reviewed and copied at the Securities and Exchange Commission’s Public Reference Room in Washington, D.C. and information on the operation of the Public Reference Room may be obtained by calling 1-800-SEC-0330. Once filed, the most recent Form N-Q will be available without charge, upon request, by calling (800) 848-3854.
Proxy Voting Policies and Procedures
A description of the policies and procedures that the Trust uses to determine how to vote proxies relating to portfolio securities is available without charge, upon request, by calling (800) 848-3854 and on the Securities and Exchange Commission’s website at http://www.sec.gov.
Proxy Voting Record
The Trust, on behalf of each of its Portfolios, has filed with the Securities and Exchange Commission its proxy voting record for the 12-month period ending June 30 on Form N-PX. Form N-PX must be filed by the Trust each year by August 31. Once filed, the most recent Form N-PX will be available without charge, upon request, by calling (800) 848-3854 or on the Securities and Exchange Commission’s website at http://www.sec.gov.
15
Simplify your life…
with MetLife eDelivery® while helping MetLife preserve the planet’s natural resources.
(see details on inside cover)
| | |
Met Investors Series Trust AQR Global Risk Balanced Portfolio Semiannual Report | | June 30, 2011, as amended December 16, 2011 |
MET INVESTORS SERIES TRUST
| | |
AQR Global Risk Balanced Portfolio | | |
Managed By AQR Capital Management, LLC
Portfolio Manager Commentary*
Performance
Since its May 2, 2011 effective date with the SEC, the Class B shares of the AQR Global Risk Balanced Portfolio returned -1.54% compared to the -1.53% return of its benchmark, the Dow Jones Moderate Index1.
Market Environment/Conditions
Developed country equity markets experienced a difficult second quarter with limited risk appetite as renewed concerns of sovereign risk in Europe reemerged and disappointing macro data uncovered a weaker than expected outlook for the US economy. Emerging stock markets also experienced headwinds as many developing nations faced accelerating inflation, dealt with appreciating currencies, and were negatively affected by slowing commodity price appreciation.
In fixed income markets, sovereign debt fears continued as concern mounted over Greece’s fiscal solvency, providing a very favorable environment for nominal bonds (the US and Germany in particular benefited from the flight-to-quality demand). The re-pricing of monetary policy expectations in the face of global risks—both sovereign risks and a perceived softening of the global economic recovery—also supported bonds.
In commodity markets, prices rose in April as equity markets and risk trades in general made money. In the first week of May, however, a US Dollar rally prompted a sharp and broad-based commodities sell-off which continued through June. Energies and Metals were particularly hurt.
Portfolio Review/Current Positioning
Since its effective date with the SEC on May 2, 2011 to the end of the quarter on June 30, 2011, the Portfolio lost -1.5%. Returns for two of the three risk categories in the Portfolio were negative, with Inflation Risk assets and Equity Risk assets detracting 1.7% and 1.4% respectively. Nominal Interest Rate Risk assets contributed +1.5% to the Portfolio return.
The Portfolio’s total exposures to all three risk categories decreased slightly to maintain the desired level of risk across the Portfolio. The Portfolio uses a moderate level of leverage to maintain an equal contribution of risk from the three risk categories. As volatility has increased, leverage in the Portfolio has been reduced. The largest exposure decreases were in the Commodities category. Commodity volatility increased in the first weeks of May and remained high resulting in a reduction of Commodity exposures from 22% to 19%, a -14% decrease by the end of the second quarter. The Nominal Interest Rate bucket had the second largest reduction in exposures moving from 140% to 124%, a -11% decrease. The Equity Risk bucket also experienced increased volatility but to a lesser degree. As a result, Equity exposures were reduced from 40% to 38%, a -5% decrease.
The Portfolio’s management process adjusts exposures to each of the three risk categories using a proprietary risk forecasting model. The process seeks to realize a steady risk level in each of the Portfolio’s three categories and for the Portfolio as a whole. The objective is to keep the Portfolio diversified not only across asset classes, but also through time—meaning that no single time period (such as the credit crisis of 2008) should have a disproportionate impact on the Portfolio’s long-term results. Our research suggests that this approach, in addition to broad diversification, has been effective in helping to protect a portfolio in periods of market stress, and improves long term risk adjusted returns. Consistent with this process, the Portfolio’s aggregate exposures decreased slightly since inception, from 260% at the launch of the Portfolio to 241%, as market volatility levels modestly increased.
The Portfolio realized volatility slightly lower than its long-term target in the second quarter. AQR uses conservative correlation assumptions to prevent the portfolio volatility from spiking in difficult markets. As stock and bond correlations have remained negative over the period, the Portfolio underrealized volatility but was well within a normal range.
Brian Hurst, Principal; Michael Mendelson, Principal; Yao Hua Ooi, Vice President
AQR Capital Management, LLC
*This commentary may include statements that constitute “forward-looking statements” under the U.S. securities laws. Forward-looking statements include, among other things, projections, estimates, and information about possible or future results related to the Portfolio, market or regulatory developments. The views expressed above are not guarantees of future performance or economic results and involve certain risks, uncertainties and assumptions that could cause actual outcomes and results to differ materially from the views expressed herein. The views expressed above are subject to change at any time based upon economic, market, or other conditions and the subadvisory firm undertakes no obligation to update the views expressed herein. Any discussions of specific securities should not be considered a recommendation to buy or sell those securities. The views expressed above (including any forward-looking statement) may not be relied upon as investment advice or as an indication of the Portfolio’s trading intent. Information about the Portfolio’s holdings, asset allocation or country diversification is historical and is not an indication of future Portfolio composition, which may vary. Direct investment in any index is not possible. The performance of any index mentioned in this commentary has not been adjusted for ongoing management, distribution and operating expenses, and sales charges applicable to mutual fund investments. In addition, the returns do not reflect additional fees charged by separate accounts or variable insurance contracts that an investor in the Portfolio may pay. If these additional fees were reflected, performance would have been lower.
1
MET INVESTORS SERIES TRUST
| | |
AQR Global Risk Balanced Portfolio | | |
Portfolio Composition as of June 30, 2011
Top Issuers
| | | | |
| | | % of
Net Assets | |
U.S. Treasury Inflation Indexed Bonds | | | 27.0 | |
France Government Bond OAT | | | 26.8 | |
United Kingdom Gilt Inflation Linked | | | 13.5 | |
Exposures by Asset Class*
| | | | |
| | | % of
Net Assets | |
Global Developed Bonds | | | 123.7 | |
Global Inflation-Linked Bonds | | | 60.7 | |
Global Developed Equities | | | 30.1 | |
Commodities—Production Weighted | | | 18.7 | |
Global Emerging Equities | | | 4.5 | |
U.S. Mid Cap Equities | | | 1.8 | |
U.S. Small Cap Equities | | | 1.5 | |
* The percentages noted above are based on the notional amounts by asset class as a percentage of net assets.
2
MET INVESTORS SERIES TRUST
| | |
AQR Global Risk Balanced Portfolio | | |
AQR Global Risk Balanced Portfolio managed by
AQR Capital Management, LLC vs. Dow Jones Moderate Index1

| | | | |
| | | Cumulative Return2 (for the period ended June 30, 2011) | |
| | | Since
Effective Date3 | |
| AQR Global Risk Balanced Portfolio—Class B | | | -1.54% | |
| Dow Jones Moderate Index1 | | | -1.53% | |
1The Dow Jones Moderate Index is a total returns index designed to provide asset allocation strategists with a target risk benchmark. Each month, the index adjusts its weightings of stocks, bonds, and cash indices (both domestic and foreign) from Barclays and Dow Jones such that the risk of that combination will have 60% of the risk of an all equity portfolio.
2“Cumulative Return” is calculated including reinvestment of all income dividends and capital gain distributions.
3 SEC effective date of the Class B shares is 5/2/11. Index returns are based on an effective date of 5/2/11.
Past performance does not guarantee future results. The investment return and principal value of an investment in the Portfolio will fluctuate, so that shares, on any given day or when redeemed, may be worth more or less than their original cost. Performance numbers are net of all Portfolio expenses but do not include any insurance, sales, or administration charges of variable annuity or life insurance contracts. If these charges were included, the returns would be lower. The Index does not include fees or expenses and is not available for direct investment.
3
MET INVESTORS SERIES TRUST
| | |
AQR Global Risk Balanced Portfolio | | |
Understanding Your Portfolio’s Expenses
Shareholder Expense Example
As a shareholder of the Portfolio, you incur ongoing costs, including management fees; distribution and service (12b-1) fees; and other Portfolio expenses. This example is intended to help you understand your ongoing costs (in dollars) (referred to as “expenses”) of investing in the Portfolio and compare these costs with the ongoing costs of investing in other mutual funds. The example is based on an investment of $1,000 invested at the beginning of the period and held for the entire period, April 19, 2011 through June 30, 2011.
Actual Expenses
The first line in the table below provides information about actual account values and actual expenses. You may use the information in this line, together with the amount you invested in the Portfolio, to estimate the expenses that you paid over the period. Simply divide your account value by $1,000 (for example, an $8,600 account value divided by $1,000 = 8.6), then multiply the result by the number in the first line under the heading entitled “Expenses Paid During Period” to estimate the expenses you paid on your account during this period.
Hypothetical Example for Comparison Purposes
The second line in the table below provides information about hypothetical account values and hypothetical expenses based on the Portfolio’s actual expense ratio and an assumed rate of return of 5% per year before expenses, which is not the Portfolio’s actual return. The hypothetical account values and expenses may not be used to estimate the actual ending account balance or expenses you paid for the period. You may use this information to compare the ongoing costs of investing in the Portfolio and other funds. To do so, compare this 5% hypothetical example with the 5% hypothetical examples that appear in the shareholder reports of the other funds.
Please note that the expenses shown in the table are meant to highlight your ongoing costs only and do not reflect any fees or charges of your variable insurance product or any additional expenses that participants in certain eligible qualified plans may bear relating to the operations of their plan. Therefore, the second line in the table is useful in comparing ongoing costs only, and will not help you determine the relative total costs of owning different funds. In addition, if these other costs were included, your costs would have been higher.
| | | | | | | | | | | | | | | | |
| | | Annualized
Expense
Ratio | | | Beginning
Account Value
April 19, 2011 | | | Ending
Account Value
June 30, 2011 | | | Expenses Paid
During Period***
April 19, 2011
to June 30, 2011 | |
| | | | | | | | | | | | | | | | |
Class B(a)(b) | | | | | | | | | | | | | | | | |
Actual | | | 0.96% | | | $ | 1,000.00 | | | $ | 984.60 | | | $ | 1.91 | |
Hypothetical* | | | 0.96% | | | | 1,000.00 | | | | 1,008.08 | | | | 1.93 | |
| | | | | | | | | | | | | | | | |
* Hypothetical assumes a rate of return of 5% per year before expenses.
** Commencement of Operations—April 19, 2011. Shares first became available to investors through certain separate accounts on the SEC effective date which was 5/2/2011.
*** Expenses paid are equal to the Portfolio’s annualized expense ratio for the most recent eleven week period, as shown above, multiplied by the average account value over the period, multiplied by the number of days (72 days) in the most recent fiscal period, divided by 365 (to reflect the eleven week period).
(a) The annualized expense ratio shown reflects an expense limitation agreement between MetLife Advisers, LLC and the Portfolio as described in Note 4 of the Notes to Financial Statements.
(b) The annualized expense ratio reflects the impact of the management fee waiver as described in Note 4 to the Financial Statements.
4
MET INVESTORS SERIES TRUST
| | |
AQR Global Risk Balanced Portfolio | | |
Consolidated^ Schedule of Investments as of June 30, 2011 (Unaudited)
Foreign Bonds & Debt Securities—40.3% of Net Assets
| | | | | | | | |
| Security Description | | Par/Shares
Amount | | | Value | |
| | |
| France—26.8% | | | | | | | | |
France Government Bond OAT
1.600%, 07/25/15 (EUR) | | $ | 46,560,918 | | | $ | 70,320,924 | |
2.250%, 07/25/20 (EUR) | | | 21,352,842 | | | | 33,914,517 | |
| | | | | | | | |
| | | | | | | 104,235,441 | |
| | | | | | | | |
|
| United Kingdom—13.5% | |
United Kingdom Gilt Inflation Linked
1.875%, 11/22/22 (GBP) | | | 28,372,305 | | | | 52,339,838 | |
| | | | | | | | |
Total Foreign Bonds & Debt Securities
(Cost $157,083,282) | | | | | | | 156,575,279 | |
| | | | | | | | |
|
| U.S. Treasury & Government Agencies—27.0% | |
U.S. Treasury Inflation Indexed Bonds
0.500%, 04/15/15 | | | 69,726,048 | | | | 72,765,685 | |
1.250%, 07/15/20 | | | 30,106,952 | | | | 31,875,736 | |
| | | | | | | | |
Total U.S. Treasury & Government Agencies
(Cost $104,997,141) | | | | | | | 104,641,421 | |
| | | | | | | | |
|
| Short-Term Investments—92.6% | |
|
| Mutual Funds—92.6% | |
BlackRock Liquidity Funds TempFund Portfolio, Class I 0.080% (a) | | | 35,901,076 | | | | 35,901,076 | |
Dreyfus Institutional Cash Advantage Fund, Class I 0.150% (a) | | | 53,851,659 | | | | 53,851,659 | |
Dreyfus Treasury Cash Management Fund, Class I 0.010% (a) | | | 89,752,479 | | | | 89,752,479 | |
UBS Money Series—UBS Select Prime Preferred Fund, Class I 0.140% (a) | | | 89,818,600 | | | | 89,818,600 | |
UBS Money Series—UBS Select Treasury Preferred Fund, Class I 0.010% (a) | | | 89,817,979 | | | | 89,817,979 | |
| | | | | | | | |
Total Short-Term Investments
(Cost $359,141,793) | | | | | | | 359,141,793 | |
| | | | | | | | |
Total Investments—159.9%
(Cost $621,222,216#) | | | | | | | 620,358,493 | |
| | | | | | | | |
Other Assets and Liabilities (net)—(59.9)% | | | | | | | (232,468,120 | ) |
| | | | | | | | |
| Net Assets—100.0% | | | | | | $ | 387,890,373 | |
| | | | | | | | |
| # | As of June 30, 2011, the aggregate cost of investments for federal income tax purposes was $621,222,216. The aggregate unrealized appreciation and depreciation of investments were $821,474 and $(1,685,197), respectively, resulting in net unrealized depreciation of $(863,723) for federal income tax purposes. |
| (a) | Represents annualized seven-day yield as of June 30, 2011. |
^See Note 2 of the notes to financial statements.
See accompanying notes to financial statements.
5
MET INVESTORS SERIES TRUST
| | |
AQR Global Risk Balanced Portfolio | | |
Consolidated^ Schedule of Investments as of June 30, 2011 (Unaudited)
FAIR VALUE HIERARCHY
Accounting principles generally accepted in the United States of America (“GAAP”) defines fair market value as the price that the Portfolio would receive to sell an asset or pay to transfer a liability in an orderly transaction between market participants at the measurement date. It establishes a fair value hierarchy that prioritizes inputs to valuation methods and requires disclosure of the fair value hierarchy that segregates fair value measurements into three levels. Levels 1, 2 and 3 of the fair value hierarchy are defined as follows:
Level 1 - unadjusted quoted prices in active markets for identical investments
Level 2 - other significant observable inputs (including, but not limited to, unadjusted quoted prices for similar investments in markets that are either active or inactive; inputs other than quoted prices that are observable such as interest rates, yield curves, volatilities, prepayment speeds, loss severities, credit risks, default rates, etc.)
Level 3 - significant unobservable inputs based on the best information available in the circumstances, to the extent observable inputs are unavailable (including the Portfolio’s own assumptions in determining the fair value of investments)
The inputs or methodologies used for valuing investments are not necessarily an indication of the risk associated with investing in them. For a change in the methodology used, transfers between levels will be recognized as of the beginning of the reporting period. Information on transfers between Level 1 and Level 2 deemed significant, if any, will be disclosed following the valuation table below. For the period from April 19, 2011 (commencement of operations) through June 30, 2011, there were no transfers between Levels 1 and 2. A reconciliation of Level 3 securities, if any, will also be disclosed following the valuation table. For more information about the Portfolio’s policy regarding the valuation of investments, please refer to the Notes to Financial Statements.
The following table summarizes the fair value hierarchy of the Portfolio’s investments as of June 30, 2011:
| | | | | | | | | | | | | | | | |
| Description | | Level 1 | | | Level 2 | | | Level 3 | | | Total | |
Total Foreign Bonds & Debt Securities* | | $ | — | | | $ | 156,575,279 | | | $ | — | | | $ | 156,575,279 | |
U.S. Treasury & Government Agencies | | | — | | | | 104,641,421 | | | | — | | | | 104,641,421 | |
Total Short-Term Investments* | | | 359,141,793 | | | | — | | | | — | | | | 359,141,793 | |
Total Investments | | $ | 359,141,793 | | | $ | 261,216,700 | | | $ | — | | | $ | 620,358,493 | |
| | | | | | | | | | | | | | | | | |
Reverse Repurchase Agreements | | $ | — | | | $ | 261,785,334 | | | $ | — | | | $ | 261,785,334 | |
Forward Contracts** | | | | | | | | | | | | | | | | |
Forward Contracts to Buy Appreciation | | $ | — | | | $ | 6,118 | | | $ | — | | | $ | 6,118 | |
Forward Contracts to Sell Appreciation | | | — | | | | 15,682 | | | | — | | | | 15,682 | |
Forward Contracts to Sell (Depreciation) | | | — | | | | (54,521 | ) | | | — | | | | (54,521 | ) |
Total Forward Contracts | | $ | — | | | $ | (32,721 | ) | | $ | — | | | $ | (32,721 | ) |
Futures Contracts** | | | | | | | | | | | | | | | | |
Futures Contracts Long Appreciation | | $ | 4,524,127 | | | $ | — | | | $ | — | | | $ | 4,524,127 | |
Futures Contracts Long (Depreciation) | | | (3,147,252 | ) | | | — | | | | — | | | | (3,147,252 | ) |
Futures Contracts Short Appreciation | | | 6,561 | | | | — | | | | — | | | | 6,561 | |
Futures Contracts Short (Depreciation) | | | (28,123 | ) | | | — | | | | — | | | | (28,123 | ) |
Total Futures Contracts | | $ | 1,355,313 | | | $ | — | | | $ | — | | | $ | 1,355,313 | |
SWAP Contracts** | | | | | | | | | | | | | | | | |
Swap on Futures Appreciation | | $ | — | | | $ | 175,909 | | | $ | — | | | $ | 175,909 | |
Swap on Futures (Depreciation) | | | — | | | | (32,230 | ) | | | — | | | | (32,230 | ) |
Total SWAP Contracts | | $ | — | | | $ | 143,679 | | | $ | — | | | $ | 143,679 | |
| * | | See Schedule of Investments for additional detailed categorizations. |
| ** | | Derivative instruments such as forwards, futures contracts and swap contracts are valued on the unrealized appreciation/depreciation on the instrument. |
^See Note 2 of the notes to financial statements.
See accompanying notes to financial statements.
6
MET INVESTORS SERIES TRUST
| | |
AQR Global Risk Balanced Portfolio | | |
Consolidated^ Statement of Assets and Liabilities
June 30, 2011 (Unaudited)
| | | | |
| Assets | | | | |
Investments at value (a) | | $ | 620,358,493 | |
Cash (b) | | | 16,637,898 | |
Receivable for investments sold | | | 11,365,068 | |
Receivable for shares sold | | | 9,859,382 | |
Net variation margin on financial futures contracts | | | 1,387,315 | |
Interest receivable | | | 2,023,154 | |
Swap premium paid | | | 3,967,712 | |
Unrealized appreciation on swap contracts | | | 175,909 | |
Unrealized appreciation on forward currency contracts | | | 21,800 | |
| | | | |
Total assets | | | 665,796,731 | |
| | | | |
| Liabilities | | | | |
Due to Adviser | | | 76,918 | |
Due to bank cash denominated in foreign currencies (c) | | | 162,440 | |
Payables for: | | | | |
Investments purchased | | | 11,506,596 | |
Reverse repurchase agreements | | | 261,785,334 | |
Shares redeemed | | | 118 | |
Unrealized depreciation on forward currency contracts | | | 54,521 | |
Unrealized depreciation on swap contracts | | | 32,230 | |
Swap premium received | | | 4,062,295 | |
Interest on reverse repurchase agreements | | | 24,781 | |
Accrued Expenses: | | | | |
Management fees | | | 59,910 | |
Distribution and service fees - Class B | | | 49,925 | |
Administration fees | | | 931 | |
Custodian and accounting fees | | | 29,928 | |
Other expenses | | | 60,431 | |
| | | | |
Total liabilities | | | 277,906,358 | |
| | | | |
| Net Assets | | $ | 387,890,373 | |
| | | | |
| Net Assets Represented by | | | | |
Paid in surplus | | $ | 388,008,831 | |
Accumulated net realized loss | | | (1,492,797 | ) |
Unrealized depreciation on investments, futures contracts, swap contracts and foreign currency transactions | | | (238,042 | ) |
Undistributed net investment income | | | 1,612,381 | |
| | | | |
Net Assets | | $ | 387,890,373 | |
| | | | |
| Net Assets | | | | |
Class B | | $ | 387,890,373 | |
| | | | |
| Capital Shares Outstanding* | | | | |
Class B | | | 38,018,030 | |
Net Asset Value, Offering Price and
Redemption Price Per Share | | | | |
Class B | | $ | 10.20 | |
| * | | The Portfolio is authorized to issue an unlimited number of shares. |
| (a) | | Identified cost of investments was $621,222,216. |
| (b) | | Includes $15,475,898 of restricted cash pledged as collateral for open futures contracts. |
| (c) | | Identified cost of cash denominated in foreign currencies was $(161,135). |
Consolidated^ Statement of Operations
Period Ended June 30, 2011* (Unaudited)
| | | | |
| Investment Income | | | | |
Interest | | $ | 1,849,094 | |
| | | | |
Total investment income | | | 1,849,094 | |
| | | | |
| Expenses | | | | |
Management fees | | | 166,364 | |
Administration fees | | | 1,939 | |
Custodian and accounting fees | | | 29,928 | |
Distribution and service fees - Class B | | | 61,812 | |
Audit and tax services | | | 20,772 | |
Legal | | | 25,218 | |
Trustees’ fees and expenses | | | 5,708 | |
Shareholder reporting | | | 8,675 | |
Insurance | | | 474 | |
Organizational expense | | | 5,045 | |
Miscellaneous | | | 2,967 | |
| | | | |
Total expenses | | | 328,902 | |
Less management fee waiver | | | (92,189 | ) |
| | | | |
Net expenses | | | 236,713 | |
| | | | |
Net investment income | | | 1,612,381 | |
| | | | |
| Net Realized and Unrealized Gain (Loss) on Investments, Futures Contracts, Swaps Contracts and Foreign Currency transactions | | | | |
Net realized gain (loss) on: | | | | |
Investments | | | 436,441 | |
Futures contracts | | | (1,863,131 | ) |
Swap contracts | | | 454,318 | |
Foreign currency transactions | | | (520,425 | ) |
| | | | |
Net realized loss on investments, futures contracts, swap contracts and foreign currency transactions | | | (1,492,797 | ) |
| | | | |
Net change in unrealized appreciation (depreciation) on: | | | | |
Investments | | | (1,722,704 | ) |
Futures contracts | | | 1,355,313 | |
Swap contracts | | | 143,679 | |
Foreign currency transactions | | | (14,330 | ) |
| | | | |
Net change in unrealized depreciation on investments, futures contracts, swap contracts and foreign currency transactions | | | (238,042 | ) |
| | | | |
Net realized and unrealized loss on investments, futures contracts, swap contracts and foreign currency transactions | | | (1,730,839 | ) |
| | | | |
| Net Decrease in Net Assets from Operations | | $ | (118,458 | ) |
| | | | |
| * | | Commencement of operations - 04/19/11. Shares first became available to investors through certain separate accounts on the SEC effective date which was 5/2/2011. |
^See Note 2 of the notes to financial statements.
See accompanying notes to financial statements.
7
MET INVESTORS SERIES TRUST
| | |
AQR Global Risk Balanced Portfolio | | |
Consolidated^ Statement of Changes in Net Assets
June 30, 2011
| | | | |
| | | Period Ended
June 30, 2011*
(Unaudited) | |
| Increase (Decrease) in Net Assets: | | | | |
| Operations | | | | |
Net investment income | | $ | 1,612,381 | |
Net realized loss on investments, futures contracts, swap contracts and foreign currency transactions | | | (1,492,797 | ) |
Net change in unrealized depreciation on investments, futures contracts, swap contracts and foreign currency transactions | | | (238,042 | ) |
| | | | |
Net decrease in net assets resulting from operations | | | (118,458 | ) |
| | | | |
Net increase in net assets from capital share transactions | | | 388,008,831 | |
| | | | |
| Net Increase in Net Assets | | | 387,890,373 | |
Net assets at beginning of period | | | — | |
| | | | |
Net assets at end of period | | $ | 387,890,373 | |
| | | | |
Undistributed net investment income at end of period | | $ | 1,612,381 | |
| | | | |
| | | | | | | | |
| Other Information: | | | | | | | | |
| Capital Shares | | | | | | | | |
| | |
Transactions in capital shares were as follows: | | | | | | | | |
| | | Period Ended
June 30, 2011*
(Unaudited) | |
| | | Shares | | | Value | |
| Class B | | | | | | | | |
Sales | | | 39,028,969 | | | $ | 398,370,463 | |
Redemptions | | | (1,010,939 | ) | | | (10,361,632 | ) |
| | | | | | | | |
Net increase | | | 38,018,030 | | | $ | 388,008,831 | |
| | | | | | | | |
Increase derived from capital shares transactions | | | | | | $ | 388,008,831 | |
| | | | | | | | |
| * | | Commencement of operations - 04/19/11. Shares first became available to investors through certain separate accounts on the SEC effective date which was 5/2/2011. |
^See Note 2 of the notes to financial statements.
See accompanying notes to financial statements.
8
MET INVESTORS SERIES TRUST
| | |
AQR Global Risk Balanced Portfolio | | |
Consolidated^ Statement of Cash Flows
June 30, 2011 (Unaudited)
| | | | |
| Cash flows from operating activities | | | | |
Net decrease in net assets from operations | | $ | (78,924 | ) |
Adjustments to reconcile net increase in net assets from operations to net cash used in operating activities: | | | | |
Purchases of investment securities | | | (262,152,302 | ) |
Proceeds from disposition of investment securities | | | 1,730,029 | |
Sales of short-term investments securities, net | | | (359,141,793 | ) |
Treasury inflation index adjustments | | | (1,658,150 | ) |
Increase in interest receivable | | | (2,023,154 | ) |
Increase in receivables for securities sold | | | (11,365,068 | ) |
Increase in receivable for fund share sold | | | (9,859,382 | ) |
Increase in unrealized appreciation on swap contracts | | | (176,708 | ) |
Increase in swap premium paid | | | (3,967,712 | ) |
Increase in variation margin on financial futures contracts | | | (1,387,315 | ) |
Increase in unrealized appreciation on forward currency exchange contracts | | | (21,800 | ) |
Increase in payable for securities purchased | | | 11,506,596 | |
Increase in payable for fund shares redeemed | | | 118 | |
Increase in due to broker | | | 162,440 | |
Increase in swap premium received | | | 4,062,295 | |
Increase in unrealized depreciation on forward currency exchange contracts | | | 54,521 | |
Increase in unrealized depreciation on swap contracts | | | 33,029 | |
Increase in accrued expenses | | | 238,509 | |
Increase in interest on reverse repurchase agreements | | | 24,781 | |
Net change in unrealized depreciation on investments | | | 863,723 | |
| | | | |
Net cash used in operating activities | | | (633,156,267 | ) |
| | | | |
| |
| Cash flows from financing activities | | | | |
Proceeds from shares sold | | | 398,370,463 | |
Payment for shares redeemed | | | (10,361,632 | ) |
Increase in reverse repurchase agreements | | | 261,785,334 | |
| | | | |
Net cash provided by financing activities | | | 649,794,165 | |
| | | | |
| |
| Net increase in cash | | | 16,637,898 | |
| | | | |
| |
| Cash | | | | |
Beginning balance | | $ | — | |
| | | | |
Ending Balance | | $ | 16,637,898 | |
| | | | |
^See Note 2 of the notes to financial statements.
See accompanying notes to financial statements.
9
MET INVESTORS SERIES TRUST
| | |
AQR Global Risk Balanced Portfolio | | |
Financial Highlights
| | | | |
| Selected Per Share Data for the Period Ended: | | | |
| | | Class B | |
| | | Period Ended
June 30, 2011(a)
(Unaudited) | |
| Net Asset Value, Beginning of Period | | $ | 10.00 | |
| | | | |
| Income from Investment Operations: | | | | |
Net Investment Income(b) | | | 0.50 | |
Net Realized / Unrealized Loss on Investments | | | (0.20 | ) |
| | | | |
Total From Investment Operations | | | 0.30 | |
| | | | |
| Net Asset Value on SEC Effective Date, May 2, 2011 | | $ | 10.30 | |
| | | | |
| Income from Investment Operations: | | | | |
Net Investment Income(b) | | | 0.08 | |
Net Realized / Unrealized Loss on Investments | | | (0.18 | ) |
| | | | |
Total From Investment Operations | | | (0.10 | ) |
| | | | |
| Net Asset Value, End of Period | | $ | 10.20 | |
| | | | |
| Total Return (%) | | | 3.60 | (c) |
| Total Return (%) | | | (1.54 | )(d) |
Ratio of Expenses to Average Net Assets (%) | | | 1.33 | * |
Ratio of Net Expenses to Average Net Assets (%)(e) | | | 0.96 | * |
Ratio of Net investment Income to Average Net Assets (%) | | | 6.52 | * |
Portfolio Turnover Rate (%) | | | 1.5 | |
Net Assets, End of Period (in millions) | | $ | 387.9 | |
| (a) | | Commencement of operations—04/19/11. Shares first became available to investors through certain separate accounts on the SEC effective date which was 5/2/2011. |
| (b) | | Per share amounts based on average shares outstanding during the period. |
| (c) | | Total return for the period 04/19/11 to 05/02/11. |
| (d) | | Total return for the period 05/02/11 to 06/30/11. |
| (e) | | Includes the effects of management fee waivers and expenses reimbursed by the Adviser, if applicable. |
See accompanying notes to financial statements.
10
MET INVESTORS SERIES TRUST
| | |
AQR Global Risk Balanced Portfolio | | |
Notes to Financial Statements—June 30, 2011 (Unaudited)
1. Organization
Met Investors Series Trust (the “Trust”) is organized as a statutory trust under the laws of Delaware, as an open-end management investment company under the Investment Company Act of 1940, as amended (the “1940 Act”). The Trust currently offers fifty-four Portfolios (the “Portfolios”), each of which operates as a distinct investment vehicle of the Trust. The portfolio included in this report is AQR Global Risk Balanced Portfolio (the “Portfolio”) (commenced operations on April 19, 2011), which is non-diversified. The Portfolio’s shares first became available to investors through certain separate accounts on the SEC effective date which was May 2, 2011. Shares in the Portfolio are not offered directly to the general public and are currently available only to separate accounts established by Metropolitan Life Insurance Company (“MetLife”) and other affiliated life insurance companies.
The Portfolio has registered four classes of shares: Class A, B, C and E Shares. Class B Shares are currently offered by the Portfolio.
2. Consolidation of Subsidiary—AQR Global Risk Balanced Portfolio, Ltd.
The Portfolio may invest up to 25% of its total assets in the AQR Global Risk Balanced Portfolio, Ltd., which is a wholly-owned and controlled subsidiary of the Portfolio that is organized under the laws of the Cayman Islands as an exempted company (the “Subsidiary”). The Portfolio invests in the Subsidiary in order to gain exposure to the commodities market within the limitations of the federal tax laws, rules and regulations that apply to registered investment companies. The Portfolio has obtained a private letter ruling from the Internal Revenue Service confirming that the annual net profit, if any, realized by the Subsidiary and imputed for income tax purposes to the Portfolio will constitute “qualifying income” for the purposes of the Portfolio remaining qualified as a regulated investment company for U.S. federal income tax purposes.
Generally, the Subsidiary invests primarily in commodity futures and swaps on commodity futures, but it may also invest in other commodity-related instruments and other investments intended to serve as margin or collateral for the Subsidiary’s derivative positions. Unlike the Portfolio, the Subsidiary may invest without limitation in commodity-linked derivatives; however, the Subsidiary complies with the same 1940 Act asset coverage requirements with respect to its investments in commodity-linked derivatives that are applicable to the Portfolio’s transactions in derivatives. In addition, to the extent applicable to the investment activities of the Subsidiary, the Subsidiary is subject to the same fundamental investment restrictions and follows the same compliance policies and procedures as the Portfolio.
By investing in the Subsidiary, the Portfolio is indirectly exposed to the risks associated with the Subsidiary’s investments. The commodity-related instruments held by the Subsidiary are subject to commodities risk. There can be no assurance that the investment objective of the Subsidiary will be achieved. The Subsidiary is not registered under the 1940 Act and is not subject to all the investor protections of the 1940 Act. The Portfolio, however, wholly owns and controls the Subsidiary, and the Portfolio and Subsidiary are both managed by AQR Capital Management, LLC (the “Subadviser”), making it unlikely that the Subsidiary will take action contrary to the interests of the Portfolio and its shareholders. Changes in the laws of the United States and/or Cayman Islands could result in the inability of the Portfolio and/or the Subsidiary to operate as described in the Portfolio’s prospectus and could adversely affect the Portfolio. For example, the Cayman Islands does not currently impose any income, corporate or capital gains tax, estate duty, inheritance tax, gift tax or withholding tax on the Subsidiary. If Cayman Islands law changes such that the Subsidiary must pay Cayman Island taxes, Portfolio shareholders would likely suffer decreased investment returns.
The consolidated Schedule of Investments, Statement of Assets and Liabilities, Statement of Operations, Statement of Changes in Net Assets, Statement of Cash Flows and the Financial Highlights of the Portfolio includes the account of the Subsidiary. All inter-company accounts and transactions have been eliminated in consolidation for the Portfolio. The Subsidiary has a fiscal year end of December 31st for financial statement consolidation purposes and a nonconforming tax year end of November 30th.
A summary of the Portfolio’s investment in the Subsidiary is as follows:
| | | | | | | | | | | | |
| | | Inception Date
of Subsidiary | | | Subsidiary
Net Assets
at June 30,
2011 | | | % of
Net Assets
at June 30,
2011 | |
| | | |
AQR Global Risk Balanced Portfolio, Ltd. | | | 4/19/2011 | | | $ | 38,311,891 | | | | 9.88 | % |
3. Significant Accounting Policies
The financial statements have been prepared in conformity with accounting principles generally accepted in the United States of America (“GAAP”) which require management to make estimates and assumptions that affect the reported amounts of assets and liabilities at the date of the financial statements and the reported amounts of income and expenses during the reporting period. Actual results could differ from these estimates. In the preparation of these financial statements, management has evaluated events and transactions subsequent to June 30, 2011 through the date that the financial statements were issued.
The following is a summary of significant accounting policies consistently followed by the Portfolio in the preparation of its financial statements.
Investment Valuation and Fair Value Measurements - Debt securities (other than short term obligations with a remaining maturity of sixty days or less) including corporate, convertible and municipal bonds and notes; U.S. government agencies; U.S. treasury obligations; sovereign
11
MET INVESTORS SERIES TRUST
| | |
AQR Global Risk Balanced Portfolio | | |
Notes to Financial Statements—June 30, 2011 (Unaudited)—(Continued)
3. Significant Accounting Policies - continued
issues; bank loans; and non-U.S. bonds are generally valued on the basis of evaluated or composite bid quotations obtained by independent pricing services and/or brokers and dealers selected by MetLife Advisers, LLC (“MLA” or the “Adviser”), an affiliate of MetLife, Inc., or the relevant Subadviser pursuant to authorization of the Board of Trustees of the Portfolio (the “Board”). Such quotations use inputs that are observable including, among other things, issuer details, interest rates, yield curves, prepayment speeds, credit risks/spreads, default rates and quoted prices for similar securities. Securities that use similar valuation techniques and inputs as described above are categorized as Level 2 within the fair value hierarchy.
Mortgage and asset-backed securities are usually issued as separate tranches, or classes, of securities within each deal. These securities are also generally valued on the basis of evaluated or composite bid quotations obtained by independent pricing services and/or brokers and dealers selected by the Adviser or relevant Subadviser pursuant to authorization of the Board. The pricing models for these securities usually consider tranche-level attributes, estimated cash flows for each tranche, market-based yield spreads for each tranche and current market data, and incorporate deal collateral performance, as available. Mortgage and asset-backed securities that use similar valuation techniques and inputs as described above are categorized as Level 2 within the fair value hierarchy.
Short term obligations with a remaining maturity of sixty days or less are valued at amortized cost which approximates fair market value and are categorized as Level 2 within the fair value hierarchy.
Equity securities such as common stock, exchange-traded funds and preferred stock that are traded on a national securities exchange or other exchanges are generally valued at their last sale price on the principal trading market. Equity securities traded on a national securities exchange or other exchanges for which there is no reported sale during the day are valued at the last reported bid price. A security that is listed or traded on more than one exchange is valued at the quotation on the exchange determined to be the primary market for that security by the Board or its delegates. If no closing price is available, then such securities are valued at the last reported bid price. Equity securities traded over-the-counter are generally valued at the last reported sales price. To the extent these securities are actively traded and valuation adjustments are not applied, they are categorized as Level 1 within the fair value hierarchy. Other equity securities traded on inactive markets or valued by reference to similar instruments are categorized as Level 2 within the fair value hierarchy.
Equity securities which are listed on foreign stock exchanges normally are valued at the market closing price, the last sale price on the day the securities are valued or, lacking any sales on such day, at the bid price. Valuation adjustments may be applied to certain equity securities that are solely traded on foreign exchanges closing before the U.S. market to account for the market movement between the close of the foreign exchanges and the close of the U.S. market. The Portfolio may use a systematic fair valuation model provided by an independent third party to value securities principally traded in these foreign markets closing before the U.S. market in order to adjust for possible stale pricing that may occur between the close of these foreign exchanges and the time of the Portfolio valuation. Securities using these valuation adjustments are categorized as Level 2 within the fair value hierarchy.
Investments in registered open-end management investment companies are valued at reported net asset value per share and are categorized as Level 1 within the fair value hierarchy.
Forward foreign currency exchange contracts are valued based on the mean between closing bid and asked prices of the forward currency rates in the London foreign exchange markets on a daily basis as provided by a reliable bank or dealer. These contracts are categorized as Level 2 within the fair value hierarchy.
Options, whether on securities, indices, futures contracts, or otherwise, are valued at the last sales price available as of the close of business on the day of valuation or, if there is no such sale price available, at the bid price. Options on currencies are valued at the spot price each day. These types of options are categorized as Level 1 within the fair value hierarchy. Other options traded on inactive markets where a broker quotation is received or options valued by an evaluated quote provided by an independent pricing vendor are categorized as Level 2 within the fair value hierarchy.
Futures contracts, which are traded on commodity exchanges, are valued at their closing prices as of the close of such exchanges and are categorized as Level 1 within the fair value hierarchy. Futures contracts traded on inactive markets where a broker quotation is received are categorized as Level 2 within the fair value hierarchy. As a general matter, futures contracts are marked-to-market daily.
Options and futures contracts that are traded over-the-counter are generally valued on the basis of broker dealer quotations or pricing service providers who use a series of techniques, including simulation pricing models, to determine the value of the contracts. The pricing models use inputs that are observed from actively quoted markets such as issuer details, indices, spreads, interest rates, curves and exchange rates. These contracts are categorized as Level 2 within the fair value hierarchy.
If no current market value quotation or other observable inputs are readily available or reliable for a security, the fair value of the security will be determined in accordance with procedures approved by and under the general supervision of the Board. The Board has delegated the determination in good faith of the fair value of securities for which current market quotations are not readily available to a Valuation Committee established by the Board. Market quotes and other observable inputs are considered not readily available in circumstances where there is an absence of current or reliable market-based data. In addition, market quotes would be considered not readily available when, due to
12
MET INVESTORS SERIES TRUST
| | |
AQR Global Risk Balanced Portfolio | | |
Notes to Financial Statements—June 30, 2011 (Unaudited)—(Continued)
3. Significant Accounting Policies - continued
extraordinary circumstances, the exchanges or markets on which the securities trade, do not open for trading for the entire day and no other market prices are available. When the Portfolio uses fair value pricing, it may take into account any factors it deems appropriate, including significant unobservable inputs. The value of securities used by the Portfolio to calculate its net asset value may differ from quoted or published prices for the same securities. Fair value pricing involves subjective judgments and the fair value determined for a security may be materially different than the value that could be realized upon the sale of that security. These securities are categorized as Level 3 within the fair value hierarchy.
Investment Transactions and Related Investment Income - Portfolio security transactions are recorded on the trade date. Dividend income is recorded on the ex-dividend date or, for certain foreign securities, when notified. Interest income, which includes amortization of premium and accretion of discount on debt securities, is recorded on the accrual basis. Realized gains and losses on investments and unrealized appreciation and depreciation are determined on the identified cost basis, which is the same basis used for federal income tax purposes. Foreign income and foreign capital gains on some foreign securities may be subject to foreign withholding taxes, which are accrued as applicable.
Income Taxes - It is the Portfolio’s policy to comply with the requirements of the Internal Revenue Code of 1986, as amended (the “Code”), and regulations thereunder, applicable to regulated investment companies and to distribute, with respect to each taxable year, all of its taxable income to shareholders. Therefore, no federal income tax provision is required. The Portfolio files U.S. federal and various state tax returns. No income tax returns are currently under examination. The Portfolio’s federal tax returns will remain subject to examination by the Internal Revenue Service for three fiscal years after the returns are filed.
Dividends and Distributions to Shareholders - The Portfolio records dividends and distributions on the ex-dividend date. Net realized gains from security transactions (if any) are generally distributed annually to shareholders. The timing and characterization of certain income and capital gains distributions are determined in accordance with federal tax regulations that may differ from GAAP. Permanent book and tax basis differences relating to shareholder distributions will result in reclassification between under/over distributed net investment income, accumulated net realized gains/losses and paid in surplus. Book-tax differences are primarily due to futures transactions, foreign currency transactions, swap transactions, options transactions, premium amortization adjustments, paydown transactions, contingent payment debt instrument adjustments, forward transactions, deferred trustees’ compensation, and losses deferred due to wash sales, as applicable. These adjustments have no impact on net assets or the results of operations.
Foreign Currency Translation - The books and records of the Portfolio are maintained in U.S. dollars. The values of securities, currencies and other assets and liabilities denominated in currencies other than U.S. dollars are translated into U.S. dollars based upon foreign exchange rates prevailing at the end of the period. Purchases and sales of investment securities, income and expenses are translated on the respective dates of such transactions. Since the values of investment securities are presented at the foreign exchange rates prevailing at the end of the period, it is not practical to isolate that portion of the results of operations arising from changes in exchange rates from that portion of the results of operations reflecting fluctuations arising from changes in market prices of the investment securities. Such fluctuations are included in the net realized and unrealized gain or loss on investments.
Net realized foreign exchange gains or losses arise from activity in forward foreign currency exchange contracts, sales of foreign currency, currency gains or losses realized between the trade and settlement dates on securities transactions, and the difference between the amounts of dividends, interest, and foreign withholding taxes recorded by the Portfolio and the U.S. dollar equivalent of the amounts actually received or paid by the Portfolio. Gains and losses attributable to foreign currency exchange rates on sales of securities are recorded as Net realized gains and losses on investments. Net unrealized foreign exchange gains and losses arise from changes in the value of assets and liabilities, other than investment securities, resulting from changes in foreign exchange rates.
Forward Commitments and When-Issued and Delayed-Delivery Securities - The Portfolio may purchase securities on a when-issued or delayed delivery basis and may purchase or sell securities on a forward commitment basis. Settlement of such transactions normally occurs within a month or more after the purchase or sale commitment is made. The Portfolio may purchase securities under such conditions only with the intention of actually acquiring them, but may enter into a separate agreement to sell the securities before the settlement date. Since the value of securities purchased may fluctuate prior to settlement, the Portfolio may be required to pay more at settlement than the security is worth. In addition, the purchaser is not entitled to any of the interest earned prior to settlement. Upon making a commitment to purchase a security on a when-issued, delayed delivery or forward commitment basis, the Portfolio will hold liquid assets in a segregated account at the Portfolio’s custodian bank worth at least the equivalent of the amount due. The liquid assets will be monitored on a daily basis and adjusted as necessary to maintain the necessary value.
4. Investment Management Agreement and Other Transactions with Affiliates
Investment Management Agreement - The Trust is managed by the Adviser. The Trust has entered into a management agreement with the Adviser (the “Management Agreement”) for investment management services in connection with the investment management of the Portfolio. The Adviser is subject to the supervision and direction of the Board and has overall responsibility for the general management and administration of the Trust. The Adviser has entered into a subadvisory agreement with AQR Capital Management, LLC (“the Subadviser”) for investment subadvisory services in connection with the investment management of the Portfolio.
13
MET INVESTORS SERIES TRUST
| | |
AQR Global Risk Balanced Portfolio | | |
Notes to Financial Statements—June 30, 2011 (Unaudited)—(Continued)
4. Investment Management Agreement and Other Transactions with Affiliates - continued
Subject to the supervision and direction of the Board, the Adviser supervises the Subadviser and has full discretion with respect to the retention or renewal of the subadvisory agreement. The Adviser pays the Subadviser a fee based on the Portfolio’s average daily net assets.
Under the terms of the Portfolio’s Management Agreement, the Portfolio pays the Adviser a monthly fee based upon annual rates applied to the Portfolio’s average daily net assets as follows:
| | | | | | |
Management Fees
earned by the Adviser
for the period ended
June 30, 2011 | | % per annum | | | Average Daily Net Assets |
| | |
| $166,364 | | | 0.675 | % | | First $250 Million |
| | |
| | | 0.650 | % | | $250 Million to $750 Million |
| | |
| | | 0.625 | % | | $750 Million to $1 Billion |
| | |
| | | 0.600 | % | | Over $1 Billion |
Certain officers and trustees of the Trust may also be officers of the Adviser; however, such officers and trustees receive no compensation from the Trust.
Management Fee Waiver - The Subadviser voluntarily agreed to waive its entire subadvisory fee through July 31, 2011. Also through July 31, 2011, the Adviser voluntarily agreed to waive a portion of the management fee in an amount equal to the subadvisory fees waived. Amounts waived for the period ended June 30, 2011 are shown as a management fee waiver in the Statement of Operations.
Transfer Agency Agreement - MetLife serves as the transfer agent for the Trust. MetLife receives no fees for its services to the Trust under the transfer agency agreement.
Expense Limitation Agreement - The Adviser has entered into an expense limitation agreement with the Trust (“Expense Limitation Agreement”) in the interest of limiting expenses of the Portfolio. The Expense Limitation Agreement shall continue in effect with respect to the Portfolio until April 30, 2012. Pursuant to that Expense Limitation Agreement, the Adviser has agreed to waive or limit its fees and to assume other expenses so that the total annual operating expenses of the Portfolio other than interest, taxes, brokerage commissions, other expenditures which are capitalized or expensed in accordance with GAAP, other extraordinary expenses not incurred in the ordinary course of the Portfolio’s business and acquired fund fees and expenses but including amounts payable pursuant to a plan adopted in accordance with Rule 12b-1 under the 1940 Act, are limited to the following expense ratio as a percentage of the Portfolio’s average daily net assets:
|
Maximum Expense Ratio under current
Expense Limitation Agreement |
Class B |
|
| 1.10% |
If in any year in which the Management Agreement is still in effect, the estimated aggregate operating expenses of the Portfolio for the fiscal year are less than the Maximum Expense Ratio for that year, subject to approval by the Trust’s Board, the Adviser shall be entitled to reimbursement by the Portfolio to the extent that the charge does not cause the expenses in such subsequent year to exceed the Maximum Expense Ratio as stated above. The Portfolio is not obligated to repay any expense paid by the Adviser more than five years after the end of the fiscal year in which such expense was incurred.
Distribution Agreement and Plan - The Trust has a distribution agreement with MetLife Investors Distribution Company (“MIDC” or the “Distributor”) in which MIDC serves as the Distributor for the Trust’s Class B Shares. MIDC is a wholly-owned subsidiary of MetLife Investors Group, Inc., an affiliate of the Adviser. The Class B distribution plan provides that the Trust, on behalf of the Portfolio, may pay annually up to 0.50% of the average daily net assets of the Portfolio attributable to its Class B Shares with respect to activities primarily intended to result in the sale of Class B Shares. However, under the Class B distribution agreement, payments to the Distributor for activities pursuant to the Class B distribution plan are currently limited to payments at an annual rate equal to 0.25% of average daily net assets of the Portfolio attributable to its Class B Shares. Amounts incurred by the Portfolio for the period ended June 30, 2011 are shown as Distribution and service fees in the Statement of Operations.
Under the terms of the Class B distribution plan and distribution agreement the Portfolio is authorized to make payments monthly to the Distributor that may be used to pay or reimburse entities providing distribution and shareholder servicing with respect to the Class B Shares for such entities’ fees or expenses incurred.
14
MET INVESTORS SERIES TRUST
| | |
AQR Global Risk Balanced Portfolio | | |
Notes to Financial Statements—June 30, 2011 (Unaudited)—(Continued)
4. Investment Management Agreement and Other Transactions with Affiliates - continued
Deferred Trustee Compensation - Each Trustee of the Trust who is not currently an employee of the Adviser or any of its affiliates receives compensation from the Trust for his or her service to the Portfolio. A deferred compensation plan (the “Plan”) is available to the Trustees on a voluntary basis. Deferred amounts remain in the Trust until distributed in accordance with the provisions of the Plan. The value of a participating Trustee’s deferral account is based on theoretical investments of deferred amounts, on the normal payment dates, in certain portfolios of the Trust or Metropolitan Series Fund, Inc. as designated by the participating Trustee. Changes in the value of participants’ deferral accounts are reflected as Trustees’ fees and expenses in the Statement of Operations. The portion of the accrued obligations allocated to the Portfolio, if any, under the Plan are reflected as Deferred trustees’ fees in the Statement of Assets and Liabilities.
5. Investment Transactions
Aggregate cost of purchases and proceeds of sales of investment securities, excluding short-term securities, for the period ended June 30, 2011 were as follows:
| | | | | | | | | | | | | | | | | | | | |
| Purchases | | | Sales | |
| Foreign | | | Foreign | |
| U.S. Government | | Government | | | Non Government | | | U.S. Government | | | Government | | | Non Government | |
| | | | | |
| $102,691,264 | | $ | 159,461,037 | | | $ | — | | | $ | 1,730,029 | | | $ | — | | | $ | — | |
6. Investments in Derivative Instruments
Investments in Derivative Instruments - Disclosures about derivative instruments are intended to improve financial reporting for derivative instruments by requiring enhanced disclosure that enables investors to understand how and why a Portfolio uses derivatives, how derivatives are accounted for, and how derivative instruments affect the Portfolio’s results of operations and financial position. Summarized below are the specific types of derivative instruments utilized by the Portfolio.
Forward Foreign Currency Exchange Contracts - The Portfolio may enter into forward foreign currency exchange contracts to obtain investment exposure, enhance return or hedge or protect its portfolio holdings against the risk of future movements in certain foreign currency exchange rates. When entering into these contracts, the Portfolio agrees to receive or deliver a fixed quantity of foreign currency for an agreed-upon price on an agreed upon future date. These contracts are valued daily and the Portfolio’s net equity therein, representing unrealized gain or loss on the contracts as measured by the difference between the forward foreign exchange rates at the dates of entry into the contracts and the forward foreign exchange rates at the value date, is included in the Statement of Assets and Liabilities. When a contract is closed, the Portfolio recognizes a realized gain or loss equal to the difference between the value of the contract at the time it was opened and the value at the time it was closed.
Realized and unrealized gains and losses on forward foreign currency exchange contracts are included in the Statement of Operations. These contracts involve market and/or credit risk in excess of the amount recognized in the Statement of Assets and Liabilities.
The use of forward foreign currency exchange contracts does not eliminate fluctuations in the underlying prices of the securities of the Portfolio, but it does establish a rate of exchange that can be achieved in the future. Although forward foreign currency exchange contracts to sell limit the risk of loss due to a decline in the value of the currency holdings, they also limit any potential gain that might result should the value of the currency increase. In addition, the Portfolio could be exposed to risks if the counterparties to the contracts are unable to meet the terms of the contracts.
Futures Contracts - The Portfolio may buy and sell futures contracts (on recognized exchanges) as a hedge, to maintain investment exposure to a target asset class or to enhance return. The Portfolio may be subject to fluctuations in equity prices, interest rates, and foreign currency exchange rates in the normal course of pursuing its investment objective. Futures contracts are standardized agreements to buy or sell a security, or deliver a final cash settlement price in connection with an index, interest rate, currency, or other asset, for a set price in the future. The Portfolio must deposit an amount (“initial margin”) equal to a certain percentage of the face value of the futures contract. The initial margin may be in the form of cash or securities which is returned when the Portfolio’s obligations under the contract have been satisfied. Futures contracts are marked-to-market daily and subsequent payments (“variation margin”) are made or received by the Portfolio depending on the daily fluctuations in the value of the futures contract. These amounts are reflected as receivables or payables on the Statement of Assets and Liabilities. Risks of entering into futures contracts (and related options) include the possibility that the market for these instruments may be illiquid and that a change in the value of the contract or option may not correlate perfectly with changes in the value of the underlying securities. Futures contracts are exchange traded and the exchange’s clearinghouse, as counterparty to all exchange traded futures, guarantees the futures contracts against default.
15
MET INVESTORS SERIES TRUST
| | |
AQR Global Risk Balanced Portfolio | | |
Notes to Financial Statements—June 30, 2011 (Unaudited)—(Continued)
6. Investments in Derivative Instruments - continued
Commodity Futures Contracts and Swaps on Commodity Futures Contracts - The Subsidiary will invest primarily in commodity futures and swaps on commodity futures. Exposure to the commodities markets may subject the Portfolio to greater volatility than investments in traditional securities. The value of commodity-linked derivative instruments may be affected by changes in overall market movements, commodity index volatility, changes in interest rates, or sectors affecting a particular industry or commodity.
Swap Agreements - The Portfolio may enter into swap contracts. Swap contracts are derivatives agreements to exchange the return generated by one instrument for the return generated by another instrument. The payment streams are calculated by reference to a specified index and agreed upon notional amount. The term “specified index” includes, but is not limited to, currencies, fixed interest rates, prices and total return on interest rate indices, fixed income indices, stock indices and commodity indices (as well as amounts derived from arithmetic operations on these indices). A Portfolio will usually enter into swaps on a net basis, i.e., the two payment streams are netted out in a cash settlement on the payment date or dates specified in the instrument, with the Portfolio receiving or paying, as the case may be, only the net amount of the two payments. The Portfolio’s obligations under a swap agreement will be accrued daily (offset against any amounts owing to the Portfolio) and any accrued but unpaid net amounts owed to a swap counterparty will be covered by designating the segregation, either on its records or with the Trust’s custodian, of cash or other liquid assets, to avoid any potential leveraging of the Portfolio. The Portfolio may enter into swap transactions with counterparties that are approved by the investment adviser in accordance with guidelines established by the Board. These guidelines provide for a minimum credit rating for each counterparty and various credit enhancement techniques (for example, collateralization of amounts due from counterparties) to limit exposure to counterparties that have lower credit ratings.
The swaps in which the Portfolio may engage may include instruments under which one party pays a single or periodic fixed amount(s) (or premium), and the other party pays periodic amounts based on the movement of a specified index. Swaps do not involve the delivery of securities, other underlying assets, or principal. Accordingly, the risk of loss with respect to swaps is limited to the net amount of payments the Portfolio is contractually obligated to receive. If the other party to a swap defaults, the Portfolio’s risk of loss consists of the net amount of payments that the Portfolio contractually is entitled to receive.
An index swap is an agreement to swap cash flows on a notional amount based on changes in the values of the reference indices.
A currency swap is an agreement to exchange cash flows on a notional amount of two or more currencies based on the relative value differential among them. Such swaps may involve initial and final exchanges that correspond to the agreed upon notional amount. Currency swaps usually involve the delivery of the entire principal value of one designated currency in exchange for the other designated currency. Therefore, the entire principal value of a currency swap is subject to the risk that the other party to the swap will default on its contractual delivery obligations. If there is a default by the counterparty, the Portfolio may have contractual remedies pursuant to the agreements related to the transaction.
Equity swaps are two-party contracts that generally obligate one party to pay the positive return and the other party to pay the negative return on a specified reference security, basket of securities, security index or index component during the period of the swap. Equity swap contracts are marked to market daily based on the value of the underlying security and the change, if any, is recorded as an unrealized gain or loss. Equity swaps normally do not involve the delivery of securities or other underlying assets. If the other party to an equity swap defaults, a Portfolio’s risk of loss consists of the net amount of payments that such Portfolio is contractually entitled to receive, if any. Equity swaps are derivatives and their value can be very volatile.
The use of swaps is a highly specialized activity that involves investment techniques and risks different from those associated with ordinary portfolio securities transactions. If an investment adviser is incorrect in its forecasts of market values, interest rates, and currency exchange rates, the investment performance of the Portfolio would be less favorable than it would have been if this investment technique were not used.
Total Return Swaps - Total return swap contracts involve commitments to pay interest in exchange for a market-linked return both based on notional amounts. To the extent the total return of the security or index underlying the transactions exceeds or falls short of the offsetting interest rate obligation the Portfolio will receive a payment from or make a payment to the counterparty.
Reverse Repurchase Agreements - The Portfolio may enter into reverse repurchase agreements with qualified institutions to seek to enhance returns. Reverse repurchase agreements involve sales by the Portfolio of securities concurrently with an agreement by the Portfolio to repurchase the same assets at a later date at a fixed price. During the reverse repurchase agreement period, the Portfolio continues to receive principal and interest payments on these securities. The Portfolio will establish a segregated account with its custodian in which it will maintain liquid assets equal in value to its obligations in respect of reverse repurchase agreements. Reverse repurchase agreements involve the risk that the market value of the securities retained by the Portfolio may decline below the price of the securities the Portfolio has sold but is obligated to repurchase under the agreement. In the event the buyer of securities under a reverse repurchase agreement files for bankruptcy or becomes insolvent, the Portfolio’s use of the proceeds of the agreement may be restricted pending a determination by the other party, or its trustee or receiver, whether to enforce the Portfolio’s obligation to repurchase the securities. For the period ended June 30, 2011, the Portfolio had an outstanding reverse repurchase agreement balance for 44 days. The average amount of borrowings was $11,630,167 and the weighted average interest rate was 0.61%.
16
MET INVESTORS SERIES TRUST
| | |
AQR Global Risk Balanced Portfolio | | |
Notes to Financial Statements—June 30, 2011 (Unaudited)—(Continued)
6. Investments in Derivative Instruments - continued
At June 30, 2011, the Portfolio had the following derivatives, grouped into appropriate risk categories:
| | | | | | | | | | | | |
| | | Asset Derivatives | | | Liability Derivatives | |
Risk Exposure | | Statement of Assets &
Liabilities Location | | Fair Value | | | Statement of Assets &
Liabilities Location | | Fair Value | |
| | | | |
Interest Rate | | Unrealized appreciation on swap contracts | | $ | 152,187 | | | Unrealized depreciation on swap contracts | | $ | — | |
| | | | |
| | Unrealized appreciation on futures contracts* | | | — | | | Unrealized depreciation on futures contracts* | | | 1,466,547 | |
| | | | |
Equity | | Unrealized appreciation on swap contracts | | | 23,722 | | | Unrealized depreciation on swap contracts | | | 12,847 | |
| | | | |
| | Unrealized appreciation on futures contracts* | | | 4,166,882 | | | Unrealized depreciation on futures contracts* | | | — | |
| | | | |
Commodity | | Unrealized appreciation on swap contracts | | | — | | | Unrealized depreciation on swap contracts | | | 19,383 | |
| | | | |
| | Unrealized appreciation on futures contracts* | | | 363,806 | | | Unrealized depreciation on futures contracts* | | | 1,708,828 | |
| | | | |
Foreign Currency Exchange | | Unrealized appreciation on forward foreign currency exchange contracts | | | 21,800 | | | Unrealized depreciation on forward foreign currency exchange contracts | | | 54,521 | |
| | | | | | | | | | | | |
Total | | | | $ | 4,728,397 | | | | | $ | 3,262,126 | |
| | | | | | | | | | | | |
| * | | Includes cumulative appreciation/depreciation of futures contracts as reported in the notes to financial statements. Only the current day’s variation margin is reported within the Statement of Assets & Liabilities. |
Transactions in derivative instruments during the period ended June 30, 2011, were as follows:
| | | | | | | | | | | | | | | | | | | | |
Statement of Operations Location - Net Realized
Gain (Loss) | | Interest
Rate | | | Equity | | | Commodity | | | Foreign Currency
Exchange | | | Total | |
| | | | | |
Foreign currency transactions | | $ | — | | | $ | — | | | $ | — | | | $ | (1,755 | ) | | $ | (1,755 | ) |
| | | | | |
Future contracts | | | 109,934 | | | | (2,064,876 | ) | | | 91,811 | | | | — | | | | (1,863,131 | ) |
| | | | | |
Swap contracts | | | — | | | | 461,033 | | | | (6,715 | ) | | | — | | | | 454,318 | |
| | | | | | | | | | | | | | | | | | | | |
| | $ | 109,934 | | | $ | (1,603,843 | ) | | $ | 85,096 | | | $ | (1,755 | ) | | $ | (1,410,568 | ) |
| | | | | | | | | | | | | | | | | | | | |
| | | | | |
Statement of Operations Location - Net Change in
Unrealized Gain (Loss) | | | | | | | | | | | | | | | |
| | | | | |
Foreign currency transactions | | $ | — | | | $ | — | | | $ | — | | | $ | (32,721 | ) | | $ | (32,721 | ) |
| | | | | |
Future contracts | | | (1,466,547 | ) | | | 4,166,882 | | | | (1,345,022 | ) | | | — | | | | 1,355,313 | |
| | | | | |
Swap contracts | | | 152,187 | | | | 10,875 | | | | (19,383 | ) | | | — | | | | 143,679 | |
| | | | | | | | | | | | | | | | | | | | |
| | $ | (1,314,360 | ) | | $ | 4,177,757 | | | $ | (1,364,405 | ) | | $ | (32,721 | ) | | $ | 1,466,271 | |
| | | | | | | | | | | | | | | | | | | | |
For the period ended June 30, 2011, the average amount or number per contract outstanding for each derivative type was as follows:
| | | | | | | | | | | | | | | | |
Average Notional or Face Amount(a) | | Interest Rate
Risk | | | Equity Risk | | | Commodity Risk | | | Foreign Currency
Risk | |
| | | | |
Foreign currency transactions | | $ | — | | | $ | — | | | $ | — | | | $ | 2,136,809 | |
Future contracts | | | 144,667,554 | | | | 90,926,690 | | | | 46,145,858 | | | | — | |
Swap contracts | | | 177,134,623 | | | | 8,560,879 | | | | 65,625 | | | | — | |
| (a) | | Averages are based on activity levels during 2011. |
17
MET INVESTORS SERIES TRUST
| | |
AQR Global Risk Balanced Portfolio | | |
Notes to Financial Statements—June 30, 2011 (Unaudited)—(Continued)
7. Forward Foreign Currency Exchange Contracts
Forward Foreign Currency Exchange Contracts to Buy:
| | | | | | | | | | | | | | | | | | | | | | |
Settlement Date | | Counterparty | | Contracts to Buy | | | Value at
June 30, 2011 | | | In Exchange
for U.S.$ | | | Net Unrealized
Appreciation | |
| | | | | | |
| 9/21/2011 | | Royal Bank of Scotland plc | | | 360,000 | | | | EUR | | | $ | 521,681 | | | $ | 515,563 | | | $ | 6,118 | |
| | | | | | | | | | | | | | | | | | | | | | |
| | | | | | | | | | | | | | | | | | | | | | |
Forward Foreign Currency Exchange Contracts to Sell:
| | | | | | | | | | | | | | | | | | | | | | |
Settlement Date | | Counterparty | | Contracts to Deliver | | | Value at
June 30, 2011 | | | In Exchange
for U.S.$ | | | Net Unrealized
Appreciation/
(Depreciation) | |
| | | | | | |
| 9/21/2011 | | Royal Bank of Scotland plc | | | 440,000 | | | | EUR | | | $ | 637,610 | | | $ | 626,817 | | | $ | (10,793 | ) |
| | | | | | |
| 9/21/2011 | | Royal Bank of Scotland plc | | | 100,000 | | | | EUR | | | | 144,911 | | | | 143,864 | | | | (1,047 | ) |
| | | | | | |
| 9/21/2011 | | Royal Bank of Scotland plc | | | 190,000 | | | | EUR | | | | 275,332 | | | | 276,600 | | | | 1,268 | |
| | | | | | |
| 9/21/2011 | | Royal Bank of Scotland plc | | | 340,000 | | | | EUR | | | | 492,699 | | | | 485,187 | | | | (7,512 | ) |
| | | | | | |
| 9/21/2011 | | Royal Bank of Scotland plc | | | 640,000 | | | | EUR | | | | 927,433 | | | | 904,302 | | | | (23,131 | ) |
| | | | | | |
| 9/21/2011 | | Royal Bank of Scotland plc | | | 180,000 | | | | GBP | | | | 288,944 | | | | 296,027 | | | | 7,083 | |
| | | | | | |
| 9/21/2011 | | Royal Bank of Scotland plc | | | 20,000 | | | | GBP | | | | 32,105 | | | | 32,964 | | | | 859 | |
| | | | | | |
| 9/21/2011 | | Royal Bank of Scotland plc | | | 200,000 | | | | GBP | | | | 321,049 | | | | 327,521 | | | | 6,472 | |
| | | | | | |
| 9/21/2011 | | Royal Bank of Scotland plc | | | 7,860,000 | | | | RUB | | | | 279,814 | | | | 277,314 | | | | (2,500 | ) |
| | | | | | |
| 9/21/2011 | | Royal Bank of Scotland plc | | | 3,000,000 | | | | RUB | | | | 106,800 | | | | 106,130 | | | | (670 | ) |
| | | | | | |
| 9/21/2011 | | Royal Bank of Scotland plc | | | 9,830,000 | | | | RUB | | | | 349,946 | | | | 347,534 | | | | (2,412 | ) |
| | | | | | |
| 9/21/2011 | | Royal Bank of Scotland plc | | | 12,070,000 | | | | RUB | | | | 429,689 | | | | 423,233 | | | | (6,456 | ) |
| | | | | | | | | | | | | | | | | | | | | | |
Net Unrealized Depreciation | | | | | | | $ | (38,839 | ) |
| | | | | | | | | | | | | | | | | | | | | | |
EUR—Euro
GBP—British Pound
RUB—Russian Ruble
8. Futures Contracts
The futures contracts outstanding as of June 30, 2011, the description and unrealized appreciation/(depreciation) were as follows:
| | | | | | | | | | | | | | | | | | | | |
Futures Contracts - Long | | Expiration
Date | | | Number of
Contracts | | | Contract
Amount | | | Valuation as of
June 30, 2011 | | | Unrealized
Appreciation/
(Depreciation) | |
| | | | | |
10 Year Japanese Government Bond Futures | | | 09/08/2011 | | | | 36 | | | $ | 62,985,285 | | | $ | 62,951,212 | | | $ | (34,073 | ) |
| | | | | |
AEX Index Futures | | | 07/15/2011 | | | | 14 | | | | 1,363,790 | | | | 1,381,599 | | | | 17,809 | |
| | | | | |
Aluminum Futures 3 Months | | | 08/26/2011 | | | | 1 | | | | 64,066 | | | | 63,068 | | | | (998 | ) |
| | | | | |
Aluminum Futures 3 Months | | | 09/09/2011 | | | | 2 | | | | 133,259 | | | | 126,337 | | | | (6,922 | ) |
| | | | | |
Aluminum HG Futures | | | 09/21/2011 | | | | 26 | | | | 1,687,715 | | | | 1,645,060 | | | | (42,655 | ) |
| | | | | |
ASX SPI 200 Index Futures | | | 09/15/2011 | | | | 38 | | | | 4,616,665 | | | | 4,690,615 | | | | 73,950 | |
| | | | | |
Australian 10 Year Treasury Bond Futures | | | 09/15/2011 | | | | 18 | | | | 2,054,929 | | | | 2,048,643 | | | | (6,286 | ) |
| | | | | |
Brent Crude Oil Pent Fin Futures | | | 07/13/2011 | | | | 102 | | | | 11,541,215 | | | | 11,472,855 | | | | (68,360 | ) |
| | | | | |
CAC 40 Index Futures | | | 07/15/2011 | | | | 99 | | | | 5,504,496 | | | | 5,721,756 | | | | 217,260 | |
| | | | | |
Cattle Feeder Futures | | | 08/25/2011 | | | | 4 | | | | 257,137 | | | | 276,138 | | | | 19,001 | |
| | | | | |
Cocoa Futures | | | 09/15/2011 | | | | 6 | | | | 176,022 | | | | 189,034 | | | | 13,012 | |
| | | | | |
Coffee Futures | | | 09/20/2011 | | | | 7 | | | | 687,464 | | | | 697,200 | | | | 9,736 | |
18
MET INVESTORS SERIES TRUST
| | |
AQR Global Risk Balanced Portfolio | | |
Notes to Financial Statements—June 30, 2011 (Unaudited)—(Continued)
8. Futures Contracts - continued
| | | | | | | | | | | | | | | | | | | | |
Futures Contracts - Long | | Expiration
Date | | | Number of
Contracts | | | Contract
Amount | | | Valuation as of
June 30, 2011 | | | Unrealized
Appreciation/
(Depreciation) | |
| | | | | |
Copper Futures 3 Months | | | 08/09/2011 | | | | 1 | | | $ | 223,036 | | | $ | 235,679 | | | $ | 12,643 | |
| | | | | |
Copper Futures 3 Months | | | 09/09/2011 | | | | 1 | | | | 226,320 | | | | 235,754 | | | | 9,434 | |
| | | | | |
Copper Lme Futures | | | 09/21/2011 | | | | 11 | | | | 2,501,147 | | | | 2,593,759 | | | | 92,612 | |
| | | | | |
Corn Futures | | | 09/14/2011 | | | | 93 | | | | 3,370,732 | | | | 3,013,014 | | | | (357,718 | ) |
| | | | | |
Cotton No. 2 Futuers | | | 12/07/2011 | | | | 17 | | | | 1,097,773 | | | | 1,007,982 | | | | (89,791 | ) |
| | | | | |
DAX Index Futures | | | 09/16/2011 | | | | 18 | | | | 4,679,506 | | | | 4,830,754 | | | | 151,248 | |
| | | | | |
European Gas Oil (Ice) Futures | | | 07/11/2011 | | | | 51 | | | | 4,795,383 | | | | 4,725,117 | | | | (70,266 | ) |
| | | | | |
FTSE 100 Index Futures | | | 09/16/2011 | | | | 123 | | | | 11,327,412 | | | | 11,665,400 | | | | 337,988 | |
| | | | | |
FTSE JSE TOP 40 Index Futures | | | 09/15/2011 | | | | 38 | | | | 1,567,039 | | | | 1,604,306 | | | | 37,267 | |
| | | | | |
FTSE MIB Index Futures | | | 09/16/2011 | | | | 10 | | | | 1,455,186 | | | | 1,467,805 | | | | 12,619 | |
| | | | | |
German Euro Bond Futures | | | 09/08/2011 | | | | 379 | | | | 69,350,552 | | | | 69,069,188 | | | | (281,364 | ) |
| | | | | |
Gold 100 oz Futures | | | 08/29/2011 | | | | 13 | | | | 1,981,252 | | | | 1,953,617 | | | | (27,635 | ) |
| | | | | |
Hang Seng China ENT Index Futures | | | 07/28/2011 | | | | 47 | | | | 3,732,200 | | | | 3,805,487 | | | | 73,287 | |
| | | | | |
Hang Seng Index Futures | | | 07/28/2011 | | | | 10 | | | | 1,414,261 | | | | 1,440,907 | | | | 26,646 | |
| | | | | |
Henry Hub Nat Gas Swap Futures | | | 07/27/2011 | | | | 182 | | | | 2,071,687 | | | | 1,990,080 | | | | (81,607 | ) |
| | | | | |
IBEX 35 Index Futures | | | 07/15/2011 | | | | 13 | | | | 1,882,663 | | | | 1,939,576 | | | | 56,913 | |
| | | | | |
Lead Futures | | | 09/21/2011 | | | | 5 | | | | 315,472 | | | | 336,009 | | | | 20,537 | |
| | | | | |
Lead Futures 3 Months | | | 09/09/2011 | | | | 1 | | | | 64,561 | | | | 67,145 | | | | 2,584 | |
| | | | | |
Lean HOGS Futures | | | 08/12/2011 | | | | 29 | | | | 1,073,124 | | | | 1,063,343 | | | | (9,781 | ) |
| | | | | |
Live Cattle Futures | | | 08/31/2011 | | | | 37 | | | | 1,599,849 | | | | 1,640,837 | | | | 40,988 | |
| | | | | |
MSCI Taiwan Index Futures | | | 07/28/2011 | | | | 79 | | | | 2,304,985 | | | | 2,339,832 | | | | 34,847 | |
| | | | | |
Nickel Futures | | | 09/21/2011 | | | | 3 | | | | 406,412 | | | | 421,678 | | | | 15,266 | |
| | | | | |
Nymex Heating Oil Pent Futures | | | 07/28/2011 | | | | 28 | | | | 3,605,944 | | | | 3,464,820 | | | | (141,124 | ) |
| | | | | |
RBOB Gasoline Fin Futures | | | 07/28/2011 | | | | 28 | | | | 3,468,595 | | | | 3,491,750 | | | | 23,155 | |
| | | | | |
Russell 2000 Mini Index Futures | | | 09/16/2011 | | | | 70 | | | | 5,492,533 | | | | 5,777,684 | | | | 285,151 | |
| | | | | |
S&P 500 E Mini Index Futures | | | 09/16/2011 | | | | 918 | | | | 58,411,893 | | | | 60,379,736 | | | | 1,967,843 | |
| | | | | |
S&P Midcap 400 E Mini Index Futures | | | 09/16/2011 | | | | 69 | | | | 6,463,204 | | | | 6,737,721 | | | | 274,517 | |
| | | | | |
S&P TSE 60 Index Futures | | | 09/15/2011 | | | | 41 | | | | 6,313,732 | | | | 6,481,676 | | | | 167,944 | |
| | | | | |
SGX CNX NIFTY Index Futures | | | 07/28/2011 | | | | 141 | | | | 1,571,132 | | | | 1,593,795 | | | | 22,663 | |
| | | | | |
Silver Futures | | | 09/28/2011 | | | | 2 | | | | 355,923 | | | | 348,317 | | | | (7,606 | ) |
| | | | | |
Soybean Futures | | | 11/14/2011 | | | | 25 | | | | 1,699,954 | | | | 1,617,450 | | | | (82,504 | ) |
| | | | | |
Sugar Futures | | | 09/30/2011 | | | | 50 | | | | 1,395,132 | | | | 1,474,943 | | | | 79,811 | |
| | | | | |
TOPIX Indes Futures | | | 09/09/2011 | | | | 105 | | | | 10,640,762 | | | | 11,049,692 | | | | 408,930 | |
| | | | | |
U.S. Treasury Note 10 Year Futures | | | 09/21/2011 | | | | 697 | | | | 86,191,547 | | | | 85,262,147 | | | | (929,400 | ) |
| | | | | |
UK Long Gilt Bond Futures | | | 09/28/2011 | | | | 122 | | | | 23,768,338 | | | | 23,552,914 | | | | (215,424 | ) |
| | | | | |
Wheat Futures | | | 09/14/2011 | | | | 57 | | | | 2,089,807 | | | | 1,750,499 | | | | (339,308 | ) |
| | | | | |
WTI Bullet Swap Financial Futures | | | 07/19/2011 | | | | 229 | | | | 22,205,345 | | | | 21,850,915 | | | | (354,430 | ) |
| | | | | |
Zinc Futures | | | 09/21/2011 | | | | 7 | | | | 395,345 | | | | 413,811 | | | | 18,466 | |
| | | | | | | | | | | | | | | | | | | | |
Net Unrealized Appreciation | | | | | | | | | | | | | | | | | | $ | 1,376,875 | |
| | | | | | | | | | | | | | | | | | | | |
19
MET INVESTORS SERIES TRUST
| | |
AQR Global Risk Balanced Portfolio | | |
Notes to Financial Statements—June 30, 2011 (Unaudited)—(Continued)
8. Futures Contracts - continued
| | | | | | | | | | | | | | | | | | | | |
Futures Contracts - Short | | Expiration
Date | | | Number of
Contracts | | | Contract
Amount | | | Valuation as of
June 30, 2011 | | | Unrealized
Appreciation/
(Depreciation) | |
| | | | | |
Aluminum Futures 3 Months | | | 08/26/2011 | | | | (1 | ) | | $ | (63,499 | ) | | $ | (63,071 | ) | | $ | 428 | |
| | | | | |
Aluminum Futures 3 Months | | | 09/09/2011 | | | | (2 | ) | | | (132,490 | ) | | | (126,357 | ) | | | 6,133 | |
| | | | | |
Copper Futures 3 Months | | | 08/09/2011 | | | | (1 | ) | | | (222,995 | ) | | | (235,689 | ) | | | (12,694 | ) |
| | | | | |
Copper Futures 3 Months | | | 09/09/2011 | | | | (1 | ) | | | (223,495 | ) | | | (235,764 | ) | | | (12,269 | ) |
| | | | | |
Lead Futures 3 Months | | | 09/09/2011 | | | | (1 | ) | | | (63,995 | ) | | | (67,155 | ) | | | (3,160 | ) |
| | | | | | | | | | | | | | | | | | | | |
Net Unrealized Depreciation | | | | | | | | | | | | | | | | | | $ | (21,562 | ) |
| | | | | | | | | | | | | | | | | | | | |
9. Swap Agreements
Open Swap on Futures agreements at June 30, 2011 were as follows:
| | | | | | | | | | | | | | | | | | | | | | | | | | |
Counterparty | | Underlying Reference Instrument | | Maturity
Date | | | Notional
Amount | | | Market
Value | | | Upfront
Premium
Paid/
(Received) | | | Unrealized
Appreciation/
(Depreciation) | |
| | | | | | | |
Merrill Lynch & Co., Inc. | | 10 Year Japanese Government Bond Futures | | | 9/8/2011 | | | | JPY | | | | 43,000,000 | | | $ | 68,009 | | | $ | — | | | $ | 68,009 | |
| | | | | | | |
Merrill Lynch & Co., Inc. | | 10 Year U.S. Treasury Note Futures | | | 9/21/2011 | | | | USD | | | | 582,000 | | | | 9,420 | | | | — | | | | 9,420 | |
| | | | | | | |
Merrill Lynch & Co., Inc. | | Euro Bund Futures | | | 9/8/2011 | | | | EUR | | | | 318,000 | | | | 64,687 | | | | — | | | | 64,687 | |
| | | | | | | |
Merrill Lynch & Co., Inc. | | KOSPI 200 Index Futures | | | 9/8/2011 | | | | KRW | | | | 12,500,000 | | | | 8,903 | | | | — | | | | 8,903 | |
| | | | | | | |
Merrill Lynch & Co., Inc. | | Long Gilt Futures | | | 9/28/2011 | | | | GBP | | | | 100,000 | | | | 10,071 | | | | — | | | | 10,071 | |
| | | | | | | |
Merrill Lynch & Co., Inc. | | Russian Depositary Index—RDXUSD01 1ML | | | 9/21/2011 | | | | USD | | | | 701 | | | | 9,668 | | | | — | | | | 9,668 | |
| | | | | | | |
Merrill Lynch & Co., Inc. | | San Paulo Stock Exchange Index Futures | | | 8/17/2011 | | | | BRL | | | | 87 | | | | (12,847 | ) | | | — | | | | (12,847 | ) |
| | | | | | | |
Merrill Lynch & Co., Inc. | | Swiss Market Index Futures | | | 9/16/2011 | | | | CHF | | | | 630 | | | | 5,151 | | | | — | | | | 5,151 | |
| | | | | | | |
Barclays Bank plc | | Wheat Futures | | | 9/14/2011 | | | | USD | | | | 15,000 | | | | (19,383 | ) | | | | | | | (19,383 | ) |
| | | | | | | | | | | | | | | | | | | | | | | | | | |
| | | | | | | |
Total | | | | | | | | | | | | | | | | $ | 143,679 | | | $ | — | | | $ | 143,679 | |
| | | | | | | | | | | | | | | | | | | | | | | | | | |
BRL—Brazilian Real
CHF—Swiss Franc
EUR—Euro
GBP—British Pound
JPY—Japanese Yen
KRW—South Korean Won
USD—United States Dollar
10. Reverse Repurchase Agreements
| | | | | | | | | | | | | | | | | | | | | | | | |
Counterparty | | Interest
Rate | | | Settlement
Date | | | Maturity
Date | | | Net Closing
Amount | | | Par Value | |
| | | | | | |
Barclays Bank plc | | | 0.16 | % | | | 6/15/2011 | | | | 7/20/2011 | | | $ | 18,244,750 | | | | USD | | | | 18,244,750 | |
| | | | | | |
Barclays Bank plc | | | 0.16 | % | | | 6/16/2011 | | | | 7/20/2011 | | | | 9,925,125 | | | | USD | | | | 9,925,125 | |
| | | | | | |
Barclays Bank plc | | | 0.14 | % | | | 6/30/2011 | | | | 7/20/2011 | | | | 11,956,250 | | | | USD | | | | 11,956,250 | |
| | | | | | |
Barclays Bank plc | | | 1.00 | % | | | 6/13/2011 | | | | 7/20/2011 | | | | 2,324,615 | | | | GBP | | | | 1,446,736 | |
| | | | | | |
Barclays Bank plc | | | 1.00 | % | | | 6/15/2011 | | | | 7/20/2011 | | | | 29,182,465 | | | | GBP | | | | 18,161,853 | |
20
MET INVESTORS SERIES TRUST
| | |
AQR Global Risk Balanced Portfolio | | |
Notes to Financial Statements—June 30, 2011 (Unaudited)—(Continued)
10. Reverse Repurchase Agreements - continued
| | | | | | | | | | | | | | | | | | | | | | | | |
| | | | | |
Counterparty | | Interest
Rate | | | Settlement
Date | | | Maturity
Date | | | Net Closing
Amount | | | Par Value | |
| | | | | | |
Barclays Bank plc | | | 1.00 | % | | | 6/16/2011 | | | | 7/20/2011 | | | $ | 4,675,258 | | | | GBP | | | | 2,909,670 | |
| | | | | | |
Barclays Bank plc | | | 1.00 | % | | | 6/22/2011 | | | | 7/20/2011 | | | | 5,075,581 | | | | GBP | | | | 3,158,813 | |
| | | | | | |
Barclays Bank plc | | | 1.00 | % | | | 6/30/2011 | | | | 7/20/2011 | | | | 6,068,606 | | | | GBP | | | | 3,776,827 | |
| | | | | | |
Barclays Bank plc | | | 1.00 | % | | | 6/15/2011 | | | | 7/20/2011 | | | | 62,794,760 | | | | EUR | | | | 43,236,641 | |
| | | | | | |
Barclays Bank plc | | | 1.00 | % | | | 6/24/2011 | | | | 7/20/2011 | | | | 20,797,712 | | | | EUR | | | | 14,320,036 | |
| | | | | | |
Barclays Bank plc | | | 1.00 | % | | | 7/4/2011 | | | | 7/20/2011 | | | | 11,250,193 | | | | EUR | | | | 7,746,197 | |
| | | | | | |
Greenwich Capital Markets, Inc. | | | 0.15 | % | | | 6/13/2011 | | | | 7/20/2011 | | | | 1,191,094 | | | | USD | | | | 1,191,094 | |
| | | | | | |
Greenwich Capital Markets, Inc. | | | 0.15 | % | | | 6/15/2011 | | | | 7/20/2011 | | | | 36,747,838 | | | | USD | | | | 36,747,838 | |
| | | | | | |
Greenwich Capital Markets, Inc. | | | 0.15 | % | | | 6/22/2011 | | | | 7/20/2011 | | | | 10,486,136 | | | | USD | | | | 10,486,136 | |
| | | | | | |
Greenwich Capital Markets, Inc. | | | 0.09 | % | | | 6/27/2011 | | | | 7/20/2011 | | | | 9,329,159 | | | | USD | | | | 9,329,159 | |
| | | | | | |
HSBC Holdings plc | | | 0.15 | % | | | 6/13/2011 | | | | 7/20/2011 | | | | 6,701,076 | | | | USD | | | | 6,701,076 | |
| | | | | | |
Royal Bank of Scotland Group plc | | | 0.59 | % | | | 6/27/2011 | | | | 7/20/2011 | | | | 5,245,729 | | | | GBP | | | | 3,264,706 | |
| | | | | | |
Royal Bank of Scotland Group plc | | | 1.25 | % | | | 6/29/2011 | | | | 7/20/2011 | | | | 9,788,987 | | | | EUR | | | | 6,740,099 | |
| | | | | | | | | | | | | | | | | | | | | | | | |
| | | | | | |
Total | | | | | | | | | | | | | | | | | | | | | | $ | 209,343,006 | |
| | | | | | | | | | | | | | | | | | | | | | | | |
EUR—Euro
GBP—British Pound
USD—United States Dollar
11. Contractual Obligations
The Trust has a variety of indemnification obligations under contracts with its service providers. The Trust’s maximum exposure under these arrangements is unknown.
12. Market, Credit and Counterparty Risk
In the normal course of business, the Portfolio invests in securities and enters into transactions where risks exist due to fluctuations in the market (market risk) or failure of the other party to a transaction to perform (credit and counterparty risk). The value of securities held by the Portfolio may decline in response to certain events, including those directly involving the companies whose securities are owned by the Portfolio; conditions affecting the general economy; overall market changes; local, regional or global political, social or economic instability; and currency and interest rate and price fluctuations. The Portfolio may be exposed to counterparty risk, or the risk that an entity with which the Portfolio has unsettled or open transactions may default. The potential loss could exceed the value of the financial assets recorded in the financial statements. Financial assets that potentially expose the Portfolio to credit risk consist principally of cash due from counterparties and investments. In order to preserve certain safeguards for derivatives and non-standard settlement trades, the Portfolio restricts its exposure to credit losses by entering into master netting agreements with counterparties (approved brokers) with whom it undertakes a significant volume of transactions. The Portfolio reduces the credit risk associated with favorable contracts by entering into a master netting arrangement to the extent that all amounts with the counterparty are terminated and settled on a net basis if an event of default occurs. The Portfolio’s overall exposure to credit risk on derivative instruments subject to master netting arrangements can change substantially within a short period, as it is affected by each transaction subject to the arrangement.
13. Recent Accounting Pronouncements
In January 2010, the Financial Accounting Standards Board (“FASB”) issued Accounting Standards Update No. 2010-06, “Improving Disclosures About Fair Value Measurements” (“ASU”) which was generally effective for years beginning after December 15, 2009 and was adopted by the Portfolio. The ASU requires enhanced disclosures about purchases, sales, issuances and settlements on a gross basis relating to Level 3 fair value measurements. These enhanced disclosures became effective for fiscal years beginning after December 15, 2010, and for interim periods within those years. Management has evaluated the impact of ASU 2010-06 and has concluded that ASU 2010-06 has no material impact on these financial statements.
21
MET INVESTORS SERIES TRUST
| | |
AQR Global Risk Balanced Portfolio | | |
Notes to Financial Statements—June 30, 2011 (Unaudited)—(Continued)
13. Recent Accounting Pronouncements - continued
In May 2011, FASB issued Accounting Standards Update (ASU) No. 2011-04 “Amendments to Achieve Common Fair Value Measurement and Disclosure Requirements in GAAP and the International Financial Reporting Standards (IFRS).” ASU 2011-04 includes common requirements for measurement of and disclosure about fair value between U.S. GAAP and IFRS. ASU 2011-04 will require reporting entities to categorize within Level 3 of the fair value hierarchy: quantitative information about the unobservable inputs used in the fair value measurement, the valuation processes used by the reporting entity and a narrative description of the sensitivity of the fair value measurement to changes in unobservable inputs and the interrelationships between those unobservable inputs. In addition, ASU 2011-04 will require reporting entities to make disclosures about amounts and reasons for all transfers in and out of Level 1 and Level 2 fair value measurements. The new and revised disclosures are effective for fiscal years beginning after December 15, 2011 and for interim periods within those fiscal years. Management is currently evaluating the implications of ASU 2011-04 and its impact on the financial statements.
22
MET INVESTORS SERIES TRUST
| | |
AQR Global Risk Balanced Portfolio | | |
Quarterly Portfolio Schedule
The Trust files Form N-Q for the first and third quarters of each fiscal year. The Trust’s Forms N-Q will be available on the Securities and Exchange Commission’s website at http://www.sec.gov. The Trust’s Forms N-Q may be reviewed and copied at the Securities and Exchange Commission’s Public Reference Room in Washington, D.C. and information on the operation of the Public Reference Room may be obtained by calling 1-800-SEC-0330. Once filed, the most recent Form N-Q will be available without charge, upon request, by calling (800) 848-3854.
Proxy Voting Policies and Procedures
A description of the policies and procedures that the Trust uses to determine how to vote proxies relating to portfolio securities is available without charge, upon request, by calling (800) 848-3854 and on the Securities and Exchange Commission’s website at http://www.sec.gov.
Proxy Voting Record
The Trust, on behalf of each of its Portfolios, has filed with the Securities and Exchange Commission its proxy voting record for the 12-month period ending June 30 on Form N-PX. Form N-PX must be filed by the Trust each year by August 31. Once filed, the most recent Form N-PX will be available without charge, upon request, by calling (800) 848-3854 or on the Securities and Exchange Commission’s website at http://www.sec.gov.
23
MET INVESTORS SERIES TRUST
| | |
AQR Global Risk Balanced Portfolio | | |
Board of Trustees’ Consideration of Advisory and Sub-advisory Agreements
At an in-person meeting of the Board of Trustees (the “Board”) of the Met Investors Series Trust (the “Trust”) held on February 14-15, 2011, the Board, including a majority of the Trustees who are not considered to be “interested persons” of the Trust (the “Independent Trustees”) under the Investment Company Act of 1940, as amended (the “1940 Act”), initially approved the Trust’s advisory agreement (the “Advisory Agreement”) with MetLife Advisers, LLC (the “Adviser”) and the applicable investment sub-advisory agreements (each a “Sub-Advisory Agreement”, and collectively with the Advisory Agreement, the “Agreements”) between the Adviser and the investment sub-advisers (each a “Subadviser”, and collectively, the “Subadvisers”) for certain new series of the Trust, including the AQR Global Risk Balanced Portfolio (each a “Portfolio,” and collectively, the “Portfolios”).1
In considering the Agreements, the Board reviewed a variety of materials provided by the Adviser and the Subadvisers relating to each Portfolio, the Adviser and each Subadviser, including comparative fee and expense information for an appropriate peer group of similar mutual funds if available, performance information for relevant benchmark indices, as applicable, and other information regarding the nature, extent and quality of services to be provided by the Adviser and the Subadvisers under their respective Agreements. The Independent Trustees also assessed a report provided by the Board’s independent consultant, who reviewed and provided analyses regarding fees and expenses, and other information provided by, or at the direction of, the Adviser and Subadvisers, as more fully discussed below.
The Independent Trustees were separately advised by independent legal counsel throughout the process. Prior to voting to approve the Agreements at the February meeting, the Independent Trustees also received a memorandum from their independent legal counsel discussing the legal standards for their consideration of the proposed initial approval of the Agreements. The Board also had previously received presentations from the Adviser with respect to the Managed Risk Portfolios at the August 3-4, 2010 and the November 9-10, 2010 Board meetings. The Board also further discussed the Managed Risk Portfolios with the Adviser on January 19, 2011, and received presentations regarding the Managed Risk Portfolios from the Subadvisers on January 26, 2011 and January 28, 2011 during which representatives of the Adviser and the Subadvisers responded to questions from the Independent Trustees. The Independent Trustees also discussed the proposed initial approval of the Agreements in private sessions with their independent legal counsel at which no representatives of management were present.
In considering whether to approve the Agreements, the Board reviewed and analyzed the factors it deemed relevant, including: (1) the nature, extent and quality of the services to be provided to the Portfolios by the Adviser and the Subadvisers; (2) the performance of comparable funds or accounts managed by the Subadvisers as compared to appropriate indices, to the extent available; (3) the Adviser’s and each of the Subadviser’s personnel and operations; (4) the financial condition of the Adviser and of the Subadvisers; (5) the level and method of computing each Portfolio’s proposed advisory and subadvisory fees; (6) the anticipated profitability of the Adviser under the Advisory Agreement and of the Subadvisers under the Sub-Advisory Agreements; (7) any “fall-out” benefits to the Adviser, the Subadvisers and their affiliates (i.e., ancillary benefits realized by the Adviser, the Subadvisers or their affiliates from the Adviser’s or Subadvisers’ relationship with the Trust); (8) the anticipated effect of growth in size on each Portfolio’s performance and expenses; (9) fees paid by comparable institutional and retail accounts; and (10) possible conflicts of interest. The Board also considered the nature, quality, and extent of the services to be provided to the Portfolios by the Adviser’s affiliates, including distribution services.
Nature, extent and quality of services. In considering the nature, extent and quality of the services to be provided by the Adviser to the Portfolios, the Board took into account the extensive responsibilities that the Adviser would have as investment adviser to the Portfolios, including the provision of investment advisory services to the MetLife Balanced Plus Portfolio, the selection of the Subadvisers for the other Portfolios and oversight of the Subadvisers’ compliance with fund policies and objectives, review of brokerage matters including with respect to trade allocation and best execution, oversight of general fund compliance with federal and state laws, its risk management processes, and the implementation of Board directives as they relate to the Portfolios. The Adviser’s role in coordinating the activities of the Portfolios’ other service providers was also considered. The Board also evaluated the expertise and performance of the investment personnel with respect to the MetLife Balanced Plus Portfolio and of the personnel who would be overseeing the Subadvisers of the other Portfolios and compliance with each Portfolio’s investment restrictions, tax and other requirements. The Board also considered that an Investment Committee, consisting of investment professionals from across MetLife, will meet at least quarterly to review the asset allocations of the MetLife Balanced Plus Portfolio. The Board considered information received from the Trust’s Chief Compliance Officer (the “CCO”) regarding the Portfolios’ compliance policies and procedures established pursuant to Rule 38a-1 under the 1940 Act, including the policies and procedures in place relating to proxy voting. Based on the information provided to the Board and its discussions with the CCO, the Board approved the Rule 38a-1 compliance policies and procedures as they relate to each Portfolio. The Board also took into account its familiarity with management through Board meetings, discussions and reports during the preceding year. The Board also took into consideration the quality of services the Adviser provided to other Portfolios of the Trust.
The Board also recognized the Adviser’s reputation and long-standing experience in serving as an investment adviser to the Trust. In addition, the Board reviewed the financial condition of the Adviser and whether it had the financial wherewithal to provide a high level and quality of services to
1 At the February 14-15, 2011 meeting, the Board also approved Agreements with respect to the AllianceBernstein Global Dynamic Allocation Portfolio, BlackRock Global Tactical Strategies Portfolio, MetLife Balanced Plus Portfolio, Pyramis® Government Income Portfolio (together with the AQR Global Risk Balanced Portfolio, the “Managed Risk Portfolios”), Met/Franklin Low Duration Total Return Portfolio and T. Rowe Price Large Cap Value Portfolio.
24
MET INVESTORS SERIES TRUST
| | |
AQR Global Risk Balanced Portfolio | | |
Board of Trustees’ Consideration of Advisory and Sub-advisory Agreements—(Continued)
the Portfolios. In its review, the Board also received and took into account information regarding any services and/or payments to be provided to the Adviser by the Subadvisers in connection with marketing activities.
With respect to the services to be provided by the Subadvisers, the Board considered information provided to the Board by each Subadviser, including each Subadviser’s Form ADV, as well as information presented throughout the past year for those Subadvisers currently sub-advising existing Portfolios of the Trust. The Board considered each Subadviser’s current level of staffing and its overall resources, as well as its compensation program. The Board reviewed each Subadviser’s history and investment experience, as well as information regarding the qualifications, background and responsibilities of each Subadviser’s investment and compliance personnel who would be providing services to the Portfolios. The Board also considered, among other things, each Subadviser’s compliance program and its disciplinary history, and its risk assessment and monitoring process. The Board noted each Subadviser’s regulatory history, including whether it was currently involved in any regulatory actions or investigations as well as material litigation, and any settlements and ameliatory actions undertaken, as appropriate. The Board also noted that the CCO and his staff would be conducting regular, periodic compliance reviews with each of the Subadvisers and present reports to the Independent Trustees regarding the same, which would include evaluating the regulatory compliance system of the Subadvisers and procedures reasonably designed by them to assure compliance with the federal securities laws, including issues related to late trading and market timing, best execution, fair value pricing, and proxy voting procedures, among others. The Board also took into account the financial condition of each Subadviser. Based on the information provided to the Board and its discussions with the CCO, the Board approved the Rule 38a-1 compliance policies and procedures as they relate to the Portfolios.
The Board considered each Subadviser’s investment process and philosophy. The Board took into account that each Subadviser’s responsibilities would include the development and maintenance of an investment program for the applicable Portfolio which would be consistent with the Portfolio’s investment objectives, the selection of investment securities and the placement of orders for the purchase and sale of such securities, as well as the implementation of compliance controls related to performance of these services. The Board also reviewed each Subadviser’s brokerage policies and practices, including with respect to best execution and soft dollars.
Based on its consideration and review of the foregoing information, the Board concluded that the nature, extent and quality of services to be provided by the Adviser and by each Subadviser were satisfactory and that there was a reasonable basis on which to conclude that each would provide a high quality of investment services to the Portfolios.
Performance. The Board took into account that the AQR Global Risk Balanced Portfolio, AllianceBernstein Global Dynamic Allocation Portfolio, BlackRock Global Tactical Strategies Portfolio and MetLife Balanced Plus Portfolio utilize relatively unique investment strategies designed to manage volatility and noted the unavailability of comparable performance information for these types of strategies. With respect to the Pyramis® Government Income Portfolio, however, the Board considered the performance of a comparable fund managed by that Subadviser. The Board also considered the performance of other funds or accounts managed by the Subadvisers to the extent such information was relevant.
As discussed above with respect to the AQR Global Risk Balanced Portfolio, the Board noted that while no comparable performance data was available, the Board considered information that described how the Portfolio is designed to perform under a variety of market conditions.
Fees and expenses. The Board gave substantial consideration to the proposed management fees payable under the Advisory Agreement and the proposed subadvisory fees payable under each of the Sub-Advisory Agreements. In addition, the Independent Trustees reviewed a report prepared by Bobroff Consulting, Inc., an independent consultant (“Bobroff”), which analyzed the proposed fees to be paid by each Portfolio in light of fees paid to other investment managers by other somewhat comparable funds, as applicable, and the method of computing each Portfolio’s proposed fee. In addition, the Board considered each Portfolio’s proposed management fee and total expenses as compared to similarly situated investment companies underlying variable insurance products and retail funds deemed to be comparable to the Portfolio as determined by Bobroff. With respect to the AQR Global Risk Balanced Portfolio, AllianceBernstein Global Dynamic Allocation Portfolio, BlackRock Global Tactical Strategies Portfolio, and MetLife Balanced Plus Portfolio, the Board took into account the limited usefulness of the peer groups in which the Portfolios were included for comparative purposes. In comparing each Portfolio’s proposed management fee to that of comparable funds, the Board noted that such fee includes both advisory and administrative fees.
The Board noted that the subadvisory fees for the Portfolios would be paid by the Adviser, not the Portfolios, out of the management fee. It was further noted that the Adviser negotiated such fee at arm’s length. The Board also considered that the Adviser had agreed to enter into an expense limitation agreement with each Portfolio, pursuant to which the Adviser would agree to waive a portion of its management fee and/or reimburse certain expenses as a means of limiting a Portfolio’s total annual operating expenses.
The Board also compared the proposed subadvisory fee to be paid by the Adviser to the fees charged by each Subadviser to manage other funds and funds not subject to regulation under the 1940 Act, such as separate accounts, as applicable. The Board considered the fee comparisons in light of the differences required to manage different types of accounts.
With respect to the AQR Global Risk Balanced Portfolio, the Board considered that, according to a report prepared by Bobroff, the Portfolio’s proposed management fee was below the median of the peer group. The Board further considered that the Portfolio’s estimated total expenses (exclusive of 12b-1 fees) were below the median of the peer group. The Board also noted that the Subadviser had agreed to waive its subadvisory
25
MET INVESTORS SERIES TRUST
| | |
AQR Global Risk Balanced Portfolio | | |
Board of Trustees’ Consideration of Advisory and Sub-advisory Agreements—(Continued)
fee for the Portfolio’s first three months of operations, and that the Adviser had also agreed to waive a portion of its advisory fee equal to the amount of the subadvisory fee waiver for the Portfolio’s first three months of operations. After consideration of all relevant factors, the Board concluded that the proposed management and subadvisory fees were consistent with industry norms and were fair and reasonable in light of the services to be provided.
Profitability. The Board examined the anticipated profitability of the Adviser with respect to each Portfolio. With respect to the MetLife Balanced Plus Portfolio, the Board noted that the advisory fee is in addition to the fees received by the Adviser and its affiliates with regard to the other Portfolios of the Trust or of Metropolitan Series Fund, Inc. (the “Underlying Portfolios”) in which the Portfolio may invest. With respect to the other Portfolios, the Board noted that a major component of profitability of the Adviser would be the margin between the management fee that the Adviser would receive from the Portfolio and the portion of that fee the Adviser would pay to the Subadviser. The Board also took into account the costs borne by the Adviser’s affiliates that support the operations of the Adviser, as well as considered the profitability of the insurance product, the function of which is supported in part by the Adviser’s revenues under the Advisory Agreement. The Board also considered that the Trust’s distributor, MetLife Investors Distribution Company, would receive Rule 12b-1 payments to support the distribution of the product. The Board concluded after extensive discussions with management that the anticipated profitability of the Adviser and its affiliates from their relationship with each Portfolio was reasonable in light of all relevant factors.
In considering the anticipated profitability to the Subadvisers and their affiliates of their relationships with the Portfolios, the Board noted that the proposed subadvisory fees under the Sub-Advisory Agreements would be paid by the Adviser out of the management fee that it would receive under the Advisory Agreement. The Board also relied on the ability of the Adviser to negotiate the Sub-Advisory Agreements and the fees thereunder at arm’s length. However, the Board placed more reliance on the fact that the Sub-Advisory Agreements were negotiated at arm’s length and that the proposed subadvisory fees would be paid by the Adviser than on the Subadvisers’ anticipated profitability.
Economies of scale. The Board also considered the probable effect of the Portfolios’ growth in size on their performance and fees. The Board noted that the proposed management and subadvisory fees each contained breakpoints that would reduce the fee rate above specified asset levels. The Board also took into account that the proposed subadvisory fees would be paid by the Adviser out of the management fees. The Board considered the fact that the Portfolios’ fee levels decline as portfolio assets increase. The Board also noted that if the Portfolios’ assets increase over time, the Portfolios may realize other economies of scale if assets increase proportionally more than certain other fixed expenses. The Board concluded that the proposed advisory fee structure for the Portfolios, including breakpoints, was reasonable and appropriately reflects potential economies of scale.
Other factors. As part of its evaluation of the Adviser’s compensation, the Board considered other benefits that may be realized by the Adviser and its affiliates from their relationship with the Trust. Among them, the Board recognized that an affiliate of the Adviser, MetLife Investors Distribution Company, serves as the distributor for the Trust, and, as such, would receive payments pursuant to Rule 12b-1 from the Portfolios to compensate it for providing shareholder services and selling activities, which could lead to growth in the Trust’s assets and corresponding benefits from such growth, including economies of scale. The Board also considered that affiliates of the Adviser may benefit from certain indirect tax benefits relating to dividend received deductions and foreign tax credits. The Board concluded that anticipated ancillary benefits that may accrue to the Adviser and its affiliates by virtue of the Adviser’s relationship with the Portfolios are fair and reasonable in light of the anticipated costs of providing investment management and other services to the Portfolios and the ongoing commitment of the Adviser to the Portfolios.
The Board considered other benefits that may be realized by each Subadviser and its affiliates from their relationship with the Trust, including the opportunity to provide advisory services to additional portfolios of the Trust and reputational benefits. The Board concluded that the benefits that may accrue to the Subadvisers and their affiliates by virtue of the Subadvisers’ relationships to the Portfolios were fair and reasonable in light of the anticipated costs of providing investment advisory services to the Portfolios and the ongoing commitment of the Subadvisers to the Portfolios.
The Board considered any possible conflicts of interest in the form of material benefits or detriments to the Trust resulting from the nature of the Trust’s and the Adviser’s or the Subadvisers’ affiliations. Here, the Board considered possible conflicts of interest that may arise between the Trust and the Adviser or a Subadviser in connection with the services to be provided to the Trust and the various relationships that they and their affiliates may have with the Trust. The Board considered the procedures for monitoring and managing such potential conflicts.
Conclusion. In considering the initial approval of each of the Agreements, the Board, including the Independent Trustees, did not identify any single factor as controlling, and each Trustee may have attributed different weights to various factors. The Board evaluated all information available to them on a Portfolio-by-Portfolio basis, and their determinations were made separately with respect to each Portfolio. Based on all of the above-mentioned considerations, and the recommendations of management, the Board, including a majority of the Independent Trustees, determined that approval of the Advisory Agreement and the Sub-Advisory Agreements was in the best interests of each Portfolio. After full consideration of these and other factors, the Board, including a majority of the Independent Trustees, with the assistance of independent legal counsel, approved the Advisory Agreement and the Sub-Advisory Agreement with respect to each Portfolio.
26
Simplify your life…
with MetLife eDelivery® while helping MetLife preserve the planet’s natural resources.
(see details on inside cover)
| | |
Met Investors Series Trust BlackRock Global Tactical Strategies Portfolio Semiannual Report | | June 30, 2011, as amended December 16, 2011 |
MET INVESTORS SERIES TRUST
| | |
BlackRock Global Tactical Strategies Portfolio | | |
Managed By BlackRock Financial Management, Inc.
Portfolio Manager Commentary*
Performance
Since its May 2, 2011 inception, the Class B shares of the BlackRock Global Tactical Strategies Portfolio returned -1.00% compared to the -1.53% return of its primary index, the Dow Jones Moderate Index1.
Market Environment/Conditions
Recoveries following financial crises tend to be bumpy and slow, characterized by a “two-steps-forward, one-step-back” process. This recovery has been no exception. Global growth has clearly slowed, especially in the US, where preliminary estimates suggest that Gross Domestic Product (GDP) expanded at a less-than-2% pace in the first half of the year. In normal circumstances, 2% growth would not be so bad, but when employment still remains seven million below its pre-recession peak and the output gap is close to 6% of GDP, it is a difficult outcome. Given the depth of the recession, if this had been a “normal recovery,” growth should have averaged 6% over the past two years. In actuality, it has averaged less than half of that. The US economy now finds itself at a critical juncture. Since 1960, every time year-over-year GDP growth fell below 2%, a recession ensued. Despite the flurry of weak economic data, we do not think a recession is in the cards and believe the foundation for recovery remains in place.
The sovereign debt crisis in peripheral Europe clearly requires careful attention. As was the case last year, it will be critical to watch whether sovereign stress leads to banking stress. Any material increase in bank funding costs, especially in core Europe, would be a serious source of concern since it would suggest that the firewall policymakers have put up around the weaker European members is not holding.
Portfolio Review/Current Positioning
A large sell-off in risk assets began in May, which happened to be the inception of the Portfolio, and continued into June. Bond yields moved lower and bond prices correspondingly rose, as risk aversion returned to markets. In this environment, fixed income exchange traded funds (ETFs) tended to outperform equity ETFs. The Portfolio took a tactical bet on the 7- to-10-year portion of the US Treasury yield curve in the month of May by investing in the iShares Barclays 7-10 Year Treasury Bond Fund, which returned 2.24% in May before the position was liquidated. The Portfolio had broader exposure to US fixed income through its position in the iShares Barclays Aggregate Bond Fund (AGG), which returned 2.19% for the two month period. The strategy also added exposure to investment grade credit in June, buying the iShares iBoxx $ Investment Grade Corporate Bond Fund (LQD) on softness following positive performance in May.
The Portfolio’s international dividend strategy underperformed relative to the MSCI EAFE Index over the May to June period due to its exposure to European and Australian equities. Specifically, the iShares Dow Jones International Select Dividend Index Fund (IDV) lost 3.55% in June and was down 6.66% for the May to June period. Notably, the Portfolio’s US-focused dividend strategy, through its investment in the Vanguard Dividend Appreciation ETF (VIG), although still negative, held up better relative to both IDV and the S&P 500 Index over the same period. The Portfolio’s emerging Europe strategy’s exposure to SPDR S&P Emerging Europe ETF (GUR) returned -10.71% for the May to June period. However, this strategy accounted for less than 1% of total Portfolio assets as of June 30, 2011.
As of June 30, 2011, the Portfolio positioning is balanced, with broadly neutral weightings to both equity (60%) and fixed income (40%). Within equities, the Portfolio has a bias toward US large-cap stocks, with underweight positions in international developed large-caps and US small-caps. The Portfolio was roughly 10% overweight (36.7% vs. a normal weighting of 26.1%) in US large-cap stocks and 5% underweight in international developed large-caps relative to its long-term strategic asset allocation mix. At period end, we favored equities paying high dividends in this slow growth environment. We also saw opportunity in German and Swedish equity markets and have added Portfolio exposures to these markets. With regard to fixed income, the Portfolio remained neutral, with valuations at fair levels and overall steady performance across the risk spectrum. That said, the Portfolio had an overweight position in high yield bonds, with a slight underweight in core bonds.
The interest rate swap component of the Portfolio returned 0.50% to the Portfolio over the performance period. The swap benefited from a decline in the 10 year interest rate from 3.28% at the end of April to 3.16% at the end of June. This movement was largely driven by market concerns over a soft patch in US economic data.
From a regional perspective, the Portfolio was overweight in the US relative to international markets, and also had an allocation outside of the blended benchmark in emerging market equities. The Portfolio remained slightly underweight in both developed Europe and the Asia-Pacific Basin.
The volatility in the Portfolio stayed within the tolerance bands as dictated by our internal proprietary risk model. The volatility trigger was not activated over the May to June period.
Philip Green
Portfolio Manager
BlackRock Financial Management, Inc.
*This commentary may include statements that constitute “forward-looking statements” under the U.S. securities laws. Forward-looking statements include, among other things, projections, estimates, and information about possible or future results related to the Portfolio, market or regulatory developments. The views expressed above are not guarantees of future performance or economic results and involve certain risks, uncertainties and assumptions that could cause actual outcomes and results to differ materially from the views expressed herein. The views expressed above are subject to change at any time based upon economic, market, or other conditions and the subadvisory firm undertakes no obligation to update the views
1
MET INVESTORS SERIES TRUST
| | |
BlackRock Global Tactical Strategies Portfolio | | |
Managed By BlackRock Financial Management, Inc.
Portfolio Manager Commentary* (continued)
expressed herein. Any discussions of specific securities should not be considered a recommendation to buy or sell those securities. The views expressed above (including any forward-looking statement) may not be relied upon as investment advice or as an indication of the Portfolio’s trading intent. Information about the Portfolio’s holdings, asset allocation or country diversification is historical and is not an indication of future Portfolio composition, which may vary. Direct investment in any index is not possible. The performance of any index mentioned in this commentary has not been adjusted for ongoing management, distribution and operating expenses, and sales charges applicable to mutual fund investments. In addition, the returns do not reflect additional fees charged by separate accounts or variable insurance contracts that an investor in the Portfolio may pay. If these additional fees were reflected, performance would have been lower.
Portfolio Composition as of June 30, 2011
Top Holdings
| | | | |
| | | % of
Net Assets | |
iShares Barclays Aggregate Bond Fund | | | 27.3 | |
iShares MSCI EAFE Index Fund | | | 17.0 | |
iShares Russell 3000 Index Fund | | | 14.8 | |
SPDR S&P 500 ETF Trust | | | 14.6 | |
Fixed Income Clearing Corp. | | | 14.5 | |
iShares iBoxx Investment Grade Corporate Bond Fund | | | 4.4 | |
iShares iBoxx $ High Yield Corporate Bond Fund | | | 3.9 | |
Technology Select Sector SPDR Fund | | | 2.0 | |
Vanguard Dividend Appreciation Index Fund | | | 2.0 | |
Vanguard REIT ETF | | | 1.9 | |
2
MET INVESTORS SERIES TRUST
| | |
BlackRock Global Tactical Strategies Portfolio | | |
BlackRock Global Tactical Strategies Portfolio managed by
BlackRock Financial Management, Inc. vs. Dow Jones Moderate Index1
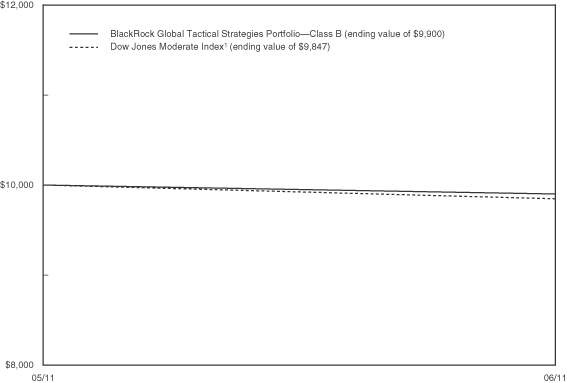
| | | | |
| | | Cumulative Return2 (for the period ended June 30, 2011) | |
| | | Since
Inception3 | |
| BlackRock Global Tactical Strategies Portfolio—Class B | | | -1.00% | |
| Dow Jones Moderate Index1 | | | -1.53% | |
1The Dow Jones Moderate Index is a total returns index designed to provide asset allocation strategists with a target risk benchmark. Each month, the index adjusts its weightings of stocks, bonds, and cash indices (both domestic and foreign) from Barclays and Dow Jones such that the risk of that combination will have 60% of the risk of an all equity portfolio.
2“Cumulative Return” is calculated including reinvestment of all income dividends and capital gain distributions.
3 Inception of the Class B shares is 5/2/11. Index returns are based on an inception date of 5/2/11.
Past performance does not guarantee future results. The investment return and principal value of an investment in the Portfolio will fluctuate, so that shares, on any given day or when redeemed, may be worth more or less than their original cost. Performance numbers are net of all Portfolio expenses but do not include any insurance, sales, or administration charges of variable annuity or life insurance contracts. If these charges were included, the returns would be lower. The Index does not include fees or expenses and is not available for direct investment.
3
MET INVESTORS SERIES TRUST
| | |
BlackRock Global Tactical Strategies Portfolio | | |
Understanding Your Portfolio’s Expenses
Shareholder Expense Example
As a shareholder of the Portfolio, you incur ongoing costs, including management fees; distribution and service (12b-1) fees; and other Portfolio expenses. This example is intended to help you understand your ongoing costs (in dollars) (referred to as “expenses”) of investing in the Portfolio and compare these costs with the ongoing costs of investing in other mutual funds. The example is based on an investment of $1,000 invested at the beginning of the period and held for the entire period, May 2, 2011 through June 30, 2011.
Actual Expenses
The first line in the table below provides information about actual account values and actual expenses. You may use the information in this line, together with the amount you invested in the Portfolio, to estimate the expenses that you paid over the period. Simply divide your account value by $1,000 (for example, an $8,600 account value divided by $1,000 = 8.6), then multiply the result by the number in the first line under the heading entitled “Expenses Paid During Period” to estimate the expenses you paid on your account during this period.
Hypothetical Example for Comparison Purposes
The second line in the table below provides information about hypothetical account values and hypothetical expenses based on the Portfolio’s actual expense ratio and an assumed rate of return of 5% per year before expenses, which is not the Portfolio’s actual return. The hypothetical account values and expenses may not be used to estimate the actual ending account balance or expenses you paid for the period. You may use this information to compare the ongoing costs of investing in the Portfolio and other funds. To do so, compare this 5% hypothetical example with the 5% hypothetical examples that appear in the shareholder reports of the other funds.
Please note that the expenses shown in the table are meant to highlight your ongoing costs only and do not reflect any fees or charges of your variable insurance product or any additional expenses that participants in certain eligible qualified plans may bear relating to the operations of their plan. Therefore, the second line in the table is useful in comparing ongoing costs only, and will not help you determine the relative total costs of owning different funds. In addition, if these other costs were included, your costs would have been higher.
| | | | | | | | | | | | | | | | |
| | | Annualized
Expense
Ratio | | | Beginning
Account Value
May 2, 2011** | | | Ending
Account Value
June 30, 2011 | | | Expenses Paid
During Period***
May 2, 2011
to June 30, 2011 | |
| | | | | | | | | | | | | | | | |
| | | | |
| | | | | | | | | | | | | | | | |
Class B(a)(b) | | | | | | | | | | | | | | | | |
Actual | | | 0.69% | | | $ | 1,000.00 | | | $ | 990.00 | | | $ | 1.15 | |
Hypothetical* | | | 0.69% | | | | 1,000.00 | | | | 1,007.20 | | | | 1.16 | |
| | | | | | | | | | | | | | | | |
* Hypothetical assumes a rate of return of 5% per year before expenses.
** Commencement of operations—May 2, 2011.
*** Expenses paid are equal to the Portfolio’s annualized expense ratio for the most recent two month period, as shown above, multiplied by the average account value over the period, multiplied by the number of days (60 days) in the most recent fiscal period, divided by 365 (to reflect the two month period).
(a) The annualized expense ratio shown reflects an expense limitation agreement between MetLife Advisers, LLC and the Portfolio as described in Note 3 of the Notes to Financial Statements.
(b) The annualized expense ratio reflects the impact of the management fee waiver as described in Note 3 to the Financial Statements.
4
MET INVESTORS SERIES TRUST
| | |
BlackRock Global Tactical Strategies Portfolio | | |
Schedule of Investments as of June 30, 2011 (Unaudited)
Investment Company Securities—93.0% of Net Assets
| | | | | | | | |
| Security Description | | Par
Amount | | | Value | |
| | |
Energy Select Sector SPDR Fund | | $ | 178,122 | | | $ | 13,421,493 | |
iShares Barclays Aggregate Bond Fund (a) | | | 1,748,594 | | | | 186,522,522 | |
iShares Dow Jones EPAC Select Dividend Index Fund (a) | | | 331,358 | | | | 11,799,658 | |
iShares iBoxx $ High Yield Corporate Bond Fund (a) | | | 291,735 | | | | 26,638,323 | |
iShares iBoxx $ Investment Grade Corporate Bond Fund (a) | | | 270,713 | | | | 29,813,623 | |
iShares MSCI EAFE Index Fund (a) | | | 1,930,550 | | | | 116,103,277 | |
iShares MSCI Sweden Index Fund (a) | | | 212,261 | | | | 6,745,655 | |
iShares Russell 3000 Index Fund (a) | | | 934,598 | | | | 74,104,275 | |
iShares S&P 100 Index Fund (a) | | | 204,661 | | | | 12,021,787 | |
Market Vectors Agribusiness ETF | | | 246,857 | | | | 13,278,438 | |
SPDR S&P 500 ETF Trust | | | 753,865 | | | | 99,487,564 | |
SPDR S&P Emerging Europe ETF | | | 103,140 | | | | 5,319,961 | |
Technology Select Sector SPDR Fund | | | 521,156 | | | | 13,393,709 | |
Vanguard Dividend Appreciation Index Fund | | | 238,828 | | | | 13,371,980 | |
Vanguard REIT ETF | | | 220,737 | | | | 13,266,294 | |
| | | | | | | | |
Total Investment Company Securities
(Cost $632,316,221) | | | | | | | 635,288,559 | |
| | | | | | | | |
| Short-Term Investment—14.5% | |
| Security Description | | Par
Amount | | | Value | |
| | |
| Repurchase Agreement—14.5% | | | | | | | | |
Fixed Income Clearing Corp. Repurchase Agreement dated 06/30/11 at 0.010% to be repurchased at $99,396,028 on 07/01/11 collateralized by $99,175,000 Federal Farm Credit Bank at 1.875% due 12/07/12 with a value of $101,386,493.
(Cost—$99,396,000) | | $ | 99,396,000 | | | $ | 99,396,000 | |
| | | | | | | | |
Total Short-Term Investments
(Cost $99,396,000) | | | | | | | 99,396,000 | |
| | | | | | | | |
Total Investments—107.5%
(Cost $731,712,221#) | | | | | | | 734,684,559 | |
Other Assets and Liabilities
(net)—(7.5)% | | | | | | | (51,526,941 | ) |
| | | | | | | | |
| Net Assets—100.0% | | | | | | $ | 683,157,618 | |
| | | | | | | | |
| # | As of June 30, 2011, the aggregate cost of investments for federal income tax purposes was $731,712,221. The aggregate unrealized appreciation and depreciation of investments were $4,383,977 and $(1,411,639), respectively, resulting in net unrealized appreciation of $2,972,338 for federal income tax purposes. |
See accompanying notes to financial statements.
5
MET INVESTORS SERIES TRUST
| | |
BlackRock Global Tactical Strategies Portfolio | | |
Schedule of Investments as of June 30, 2011 (Unaudited)
FAIR VALUE HIERARCHY
Accounting principles generally accepted in the United States of America (“GAAP”) defines fair market value as the price that the Portfolio would receive to sell an asset or pay to transfer a liability in an orderly transaction between market participants at the measurement date. It establishes a fair value hierarchy that prioritizes inputs to valuation methods and requires disclosure of the fair value hierarchy that segregates fair value measurements into three levels. Levels 1, 2 and 3 of the fair value hierarchy are defined as follows:
Level 1 - unadjusted quoted prices in active markets for identical investments
Level 2 - other significant observable inputs (including, but not limited to, unadjusted quoted prices for similar investments in markets that are either active or inactive; inputs other than quoted prices that are observable such as interest rates, yield curves, volatilities, prepayment speeds, loss severities, credit risks, default rates, etc.)
Level 3 - significant unobservable inputs based on the best information available in the circumstances, to the extent observable inputs are unavailable (including the Portfolio’s own assumptions in determining the fair value of investments)
The inputs or methodologies used for valuing investments are not necessarily an indication of the risk associated with investing in them. For a change in the methodology used, transfers between levels will be recognized as of the beginning of the reporting period. Information on transfers between Level 1 and Level 2 deemed significant, if any, will be disclosed following the valuation table below. For the period from May 2, 2011 (commencement of operations) through June 30, 2011, there were no transfers between Levels 1 and 2. A reconciliation of Level 3 securities, if any, will also be disclosed following the valuation table. For more information about the Portfolio’s policy regarding the valuation of investments, please refer to the Notes to Financial Statements.
The following table summarizes the fair value hierarchy of the Portfolio’s investments as of June 30, 2011:
| | | | | | | | | | | | | | | | |
| Description | | Level 1 | | | Level 2 | | | Level 3 | | | Total | |
Investment Company Securities | | $ | 635,288,559 | | | $ | — | | | $ | — | | | $ | 635,288,559 | |
Total Short-Term Investments* | | | — | | | | 99,396,000 | | | | — | | | | 99,396,000 | |
Total Investments | | $ | 635,288,559 | | | $ | 99,396,000 | | | $ | — | | | $ | 734,684,559 | |
| | | | | | | | | | | | | | | | | |
SWAP Contracts** | | | | | | | | | | | | | | | | |
Interest Rate Swap Appreciation | | $ | — | | | $ | 74,925 | | | $ | — | | | $ | 74,925 | |
Interest Rate Swap (Depreciation) | | | — | | | | (1,262,786 | ) | | | — | | | | (1,262,786 | ) |
Total SWAP Contracts | | $ | — | | | $ | (1,187,861 | ) | | $ | — | | | $ | (1,187,861 | ) |
| | | | | | | | | | | | | | | | | |
| * | | See Schedule of Investments for additional detailed categorizations. |
| ** | | Derivative instruments such as forwards, futures contracts and swap contracts are valued on the unrealized appreciation/depreciation on the instrument. |
See accompanying notes to financial statements.
6
MET INVESTORS SERIES TRUST
| | |
BlackRock Global Tactical Strategies Portfolio | | |
Statement of Assets and Liabilities
June 30, 2011 (Unaudited)
| | | | |
| Assets | | | | |
Investments at value (a) | | $ | 635,288,559 | |
Repurchase Agreement | | | 99,396,000 | |
Cash | | | 330 | |
Receivable for shares sold | | | 18,281,865 | |
Dividends receivable | | | 265,573 | |
Interest receivable | | | 28 | |
Swap interest receivable | | | 342,807 | |
Unrealized appreciation on swap contracts | | | 74,925 | |
| | | | |
Total assets | | | 753,650,087 | |
| | | | |
| Liabilities | | | | |
Due to Adviser | | | 21,636 | |
Payables for: | | | | |
Investments purchased | | | 68,937,636 | |
Shares redeemed | | | 269 | |
Unrealized depreciation on swap contracts | | | 1,262,786 | |
Swap interest | | | 27,812 | |
Accrued Expenses: | | | | |
Management fees | | | 102,989 | |
Distribution and service fees - Class B | | | 85,824 | |
Administration fees | | | 2,211 | |
Custodian and accounting fees | | | 5,856 | |
Other expenses | | | 45,450 | |
| | | | |
Total liabilities | | | 70,492,469 | |
| | | | |
| Net Assets | | $ | 683,157,618 | |
| | | | |
| Net Assets Represented by | | | | |
Paid in surplus | | $ | 678,210,548 | |
Accumulated net realized gain | | | 686,822 | |
Unrealized appreciation on investments and swap contracts | | | 1,784,477 | |
Undistributed net investment income | | | 2,475,771 | |
| | | | |
Net Assets | | $ | 683,157,618 | |
| Net Assets | | | | |
Class B | | $ | 683,157,618 | |
| Capital Shares Outstanding* | | | | |
Class B | | | 68,992,263 | |
| Net Asset Value, Offering Price and Redemption Price Per Share | | | | |
Class B | | $ | 9.90 | |
| * | | The Portfolio is authorized to issue an unlimited number of shares. |
| (a) | | Identified cost of investments, excluding repurchase agreement, was $632,316,221. |
Statement of Operations
Period Ended June 30, 2011* (Unaudited)
| | | | |
| Investment Income | | | | |
Dividends from Underlying ETFs | | $ | 2,261,205 | |
Dividends | | | 502,048 | |
Interest | | | 932 | |
| | | | |
Total investment income | | | 2,764,185 | |
| | | | |
| Expenses | | | | |
Management fees | | | 312,837 | |
Administration fees | | | 2,636 | |
Custodian and accounting fees | | | 5,856 | |
Distribution and service fees - Class B | | | 103,790 | |
Audit and tax services | | | 16,360 | |
Legal | | | 19,585 | |
Trustees’ fees and expenses | | | 4,770 | |
Shareholder reporting | | | 7,249 | |
Insurance | | | 396 | |
Organizational expense | | | 1,122 | |
Miscellaneous | | | 2,102 | |
| | | | |
Total expenses | | | 476,703 | |
Less management fee waiver | | | (188,289 | ) |
| | | | |
Net expenses | | | 288,414 | |
| | | | |
Net investment income | | | 2,475,771 | |
| | | | |
| Net Realized and Unrealized Gain (Loss) on Investments and Swap Contracts | | | | |
Net realized gain on: | | | | |
Investments | | | 371,827 | |
Swap contracts | | | 314,995 | |
| | | | |
Net realized gain on investments and swap contracts | | | 686,822 | |
| | | | |
Net change in unrealized appreciation (depreciation) on: | | | | |
Investments | | | 2,972,338 | |
Swap contracts | | | (1,187,861 | ) |
| | | | |
Net change in unrealized appreciation on investments and swap contracts | | | 1,784,477 | |
| | | | |
Net realized and unrealized gain on investments and swap contracts | | | 2,471,299 | |
| | | | |
| Net Increase in Net Assets from Operations | | $ | 4,947,070 | |
| | | | |
| * | | Commencement of operations—5/2/2011. |
See accompanying notes to financial statements.
7
MET INVESTORS SERIES TRUST
| | |
BlackRock Global Tactical Strategies Portfolio | | |
Statement of Changes in Net Assets
June 30, 2011
| | | | |
| | | Period Ended
June 30, 2011*
(Unaudited) | |
| Increase (Decrease) in Net Assets: | | | | |
| Operations | | | | |
Net investment income | | $ | 2,475,771 | |
Net realized gain on investments and swap contracts | | | 686,822 | |
Net change in unrealized appreciation on investments and swap contracts | | | 1,784,477 | |
| | | | |
Net increase in net assets resulting from operations | | | 4,947,070 | |
| | | | |
Net increase in net assets from capital share transactions | | | 678,210,548 | |
| | | | |
| Net Increase in Net Assets | | | 683,157,618 | |
| | | | |
Net assets at end of period | | $ | 683,157,618 | |
| | | | |
Undistributed net investment income at end of period | | $ | 2,475,771 | |
| | | | |
| | | | | | | | |
| Other Information: | | | | | | | | |
| Capital Shares | | | | | | | | |
| | |
Transactions in capital shares were as follows: | | | | | | | | |
| | | Period Ended
June 30, 2011*
(Unaudited) | |
| | | Shares | | | Value | |
| Class B | | | | | | | | |
Sales | | | 70,002,275 | | | $ | 688,058,111 | |
Redemptions | | | (1,010,012 | ) | | | (9,847,563 | ) |
| | | | | | | | |
Net increase | | | 68,992,263 | | | $ | 678,210,548 | |
| | | | | | | | |
Increase derived from capital shares transactions | | | | | | $ | 678,210,548 | |
| | | | | | | | |
| * | | Commencement of operations—5/2/2011. |
See accompanying notes to financial statements.
8
MET INVESTORS SERIES TRUST
|
BlackRock Global Tactical Strategies Portfolio |
Financial Highlights
| | | | |
| Selected per share data | | | |
| | | Class B | |
| | | Period Ended
June 30, 2011(b)
(Unaudited) | |
| Net Asset Value, Beginning of Period | | $ | 10.00 | |
| | | | |
| Income from Investment Operations: | | | | |
Net Investment Income(a) | | | 0.10 | |
Net Realized and Unrealized gain on Investments | | | (0.20 | ) |
| | | | |
Total From Investment Operations | | | (0.10 | ) |
| | | | |
| Net Asset Value, End of Period | | $ | 9.90 | |
| | | | |
| Total Return (%) | | | (1.00 | ) |
| |
| Ratios/Supplemental Data | | | | |
Ratio of Expenses to Average Net Assets (%) | | | 1.15 | * |
Ratio of Net Expenses to Average Net Assets (%)(c)(d) | | | 0.69 | * |
Ratio of Net Investment Income to Average Net Assets (%)(e) | | | 5.96 | * |
Portfolio Turnover Rate (%) | | | 9.0 | |
Net Assets, End of Period (in millions) | | $ | 683.2 | |
| (a) | | Per share amounts based on average shares outstanding during the period. |
| (b) | | Commencement of operations—5/2/2011. |
| (c) | | Includes the effects of management fee waivers and expenses reimbursed by the Adviser, if applicable. |
| (d) | | The ratio of operating expenses to average net assets does not include expenses of the Underlying ETFs in which the Portfolio invests. |
| (e) | | Recognition of net investment income by the Portfolio is affected by the timing of the declaration of dividends by the Underlying ETFs in which it invests. |
See accompanying notes to financial statements.
9
MET INVESTORS SERIES TRUST
| | |
BlackRock Global Tactical Strategies Portfolio | | |
Notes to Financial Statements—June 30, 2011 (Unaudited)
1. Organization
Met Investors Series Trust (the “Trust”) is organized as a statutory trust under the laws of Delaware, as an open-end management investment company under the Investment Company Act of 1940, as amended (the “1940 Act”). The Trust currently offers fifty-four Portfolios (the “Portfolios”), each of which operates as a distinct investment vehicle of the Trust. The portfolio included in this report is BlackRock Global Tactical Strategies Portfolio (the “Portfolio”) (commenced operations on May 2, 2011), which is diversified. Shares in the Portfolio are not offered directly to the general public and are currently available only to separate accounts established by Metropolitan Life Insurance Company (“MetLife”) and other affiliated life insurance companies.
The Portfolio has registered four classes of shares: Class A, B, C and E Shares. Class B Shares are currently offered by the Portfolio.
The Portfolio allocates its assets in a broad range of asset classes, primarily through other investment companies known as exchanged traded funds (“Underlying ETFs”), involving primarily series of the iShares® Trust and iShares®, Inc., but the Portfolio also has the ability to invest in series sponsored by other companies.
2. Significant Accounting Policies
The financial statements have been prepared in conformity with accounting principles generally accepted in the United States of America (“GAAP”) which require management to make estimates and assumptions that affect the reported amounts of assets and liabilities at the date of the financial statements and the reported amounts of income and expenses during the reporting period. Actual results could differ from these estimates. In the preparation of these financial statements, management has evaluated events and transactions subsequent to June 30, 2011 through the date that the financial statements were issued.
The following is a summary of significant accounting policies consistently followed by the Portfolio in the preparation of its financial statements.
Investment Valuation and Fair Value Measurements - Investments in the Underlying ETFs are valued at the closing market quotation for their shares. The net asset value of the Portfolio is calculated based on the market values of the Underlying ETFs in which the Portfolio invests. For more information about the use of fair value pricing by the Underlying ETFs, please refer to the prospectuses for the Underlying ETFs.
Debt securities (other than short term obligations with a remaining maturity of sixty days or less) including corporate, convertible and municipal bonds and notes; U.S. government agencies; U.S. treasury obligations; sovereign issues; bank loans; and non-U.S. bonds are generally valued on the basis of evaluated or composite bid quotations obtained by independent pricing services and/or brokers and dealers selected by MetLife Advisers, LLC (“MLA” or the “Adviser”), an affiliate of MetLife, Inc., or the relevant Subadviser pursuant to authorization of the Board of Trustees of the Portfolio (the “Board”). Such quotations use inputs that are observable including, among other things, issuer details, interest rates, yield curves, prepayment speeds, credit risks/spreads, default rates and quoted prices for similar securities. Securities that use similar valuation techniques and inputs as described above are categorized as Level 2 within the fair value hierarchy.
Mortgage and asset-backed securities are usually issued as separate tranches, or classes, of securities within each deal. These securities are also generally valued on the basis of evaluated or composite bid quotations obtained by independent pricing services and/or brokers and dealers selected by the Adviser or relevant Subadviser pursuant to authorization of the Board. The pricing models for these securities usually consider tranche-level attributes, estimated cash flows for each tranche, market-based yield spreads for each tranche and current market data, and incorporate deal collateral performance, as available. Mortgage and asset-backed securities that use similar valuation techniques and inputs as described above are categorized as Level 2 within the fair value hierarchy.
Short term obligations with a remaining maturity of sixty days or less are valued at amortized cost which approximates fair market value and are categorized as Level 2 within the fair value hierarchy.
Equity securities such as common stock, exchange-traded funds and preferred stock that are traded on a national securities exchange or other exchanges are generally valued at their last sale price on the principal trading market. Equity securities traded on a national securities exchange or other exchanges for which there is no reported sale during the day are valued at the last reported bid price. A security that is listed or traded on more than one exchange is valued at the quotation on the exchange determined to be the primary market for that security by the Board or its delegates. If no closing price is available, then such securities are valued at the last reported bid price. Equity securities traded over-the-counter are generally valued at the last reported sales price. To the extent these securities are actively traded and valuation adjustments are not applied, they are categorized as Level 1 within the fair value hierarchy. Other equity securities traded on inactive markets or valued by reference to similar instruments are categorized as Level 2 within the fair value hierarchy.
Equity securities which are listed on foreign stock exchanges normally are valued at the market closing price, the last sale price on the day the securities are valued or, lacking any sales on such day, at the bid price. Valuation adjustments may be applied to certain equity securities that are solely traded on foreign exchanges closing before the U.S. market to account for the market movement between the close of the foreign exchanges and the close of the U.S. market. The Portfolio may use a systematic fair valuation model provided by an independent third party to value securities principally traded in these foreign markets closing before the U.S. market in order to adjust for possible stale pricing that may occur between the close of these foreign exchanges and the time of the Portfolio valuation. Securities using these valuation adjustments are categorized as Level 2 within the fair value hierarchy.
10
MET INVESTORS SERIES TRUST
| | |
BlackRock Global Tactical Strategies Portfolio | | |
Notes to Financial Statements—June 30, 2011 (Unaudited)—(Continued)
2. Significant Accounting Policies - continued
Investments in registered open-end management investment companies are valued at reported net asset value per share and are categorized as Level 1 within the fair value hierarchy.
Forward foreign currency exchange contracts are valued based on the mean between closing bid and asked prices of the forward currency rates in the London foreign exchange markets on a daily basis as provided by a reliable bank or dealer. These contracts are categorized as Level 2 within the fair value hierarchy.
Options, whether on securities, indices, futures contracts, or otherwise, are valued at the last sales price available as of the close of business on the day of valuation or, if there is no such sale price available, at the bid price. Options on currencies are valued at the spot price each day. These types of options are categorized as Level 1 within the fair value hierarchy. Other options traded on inactive markets where a broker quotation is received or options valued by an evaluated quote provided by an independent pricing vendor are categorized as Level 2 within the fair value hierarchy.
Futures contracts, which are traded on commodity exchanges, are valued at their closing prices as of the close of such exchanges and are categorized as Level 1 within the fair value hierarchy. Futures contracts traded on inactive markets where a broker quotation is received are categorized as Level 2 within the fair value hierarchy. As a general matter, futures contracts are marked-to-market daily.
Options and futures contracts that are traded over-the-counter are generally valued on the basis of broker dealer quotations or pricing service providers who use a series of techniques, including simulation pricing models, to determine the value of the contracts. The pricing models use inputs that are observed from actively quoted markets such as issuer details, indices, spreads, interest rates, curves and exchange rates. These contracts are categorized as Level 2 within the fair value hierarchy.
If no current market value quotation or other observable inputs are readily available or reliable for a security, the fair value of the security will be determined in accordance with procedures approved by and under the general supervision of the Board. The Board has delegated the determination in good faith of the fair value of securities for which current market quotations are not readily available to a Valuation Committee established by the Board. Market quotes and other observable inputs are considered not readily available in circumstances where there is an absence of current or reliable market-based data. In addition, market quotes would be considered not readily available when, due to extraordinary circumstances, the exchanges or markets on which the securities trade, do not open for trading for the entire day and no other market prices are available. When the Portfolio uses fair value pricing, it may take into account any factors it deems appropriate, including significant unobservable inputs. The value of securities used by the Portfolio to calculate its net asset value may differ from quoted or published prices for the same securities. Fair value pricing involves subjective judgments and the fair value determined for a security may be materially different than the value that could be realized upon the sale of that security. These securities are categorized as Level 3 within the fair value hierarchy.
Investment Transactions and Related Investment Income - Portfolio security transactions are recorded on the trade date. Dividend income is recorded on the ex-dividend date or, for certain foreign securities, when notified. Interest income, which includes amortization of premium and accretion of discount on debt securities, is recorded on the accrual basis. Realized gains and losses on investments and unrealized appreciation and depreciation are determined on the identified cost basis, which is the same basis used for federal income tax purposes. Foreign income and foreign capital gains on some foreign securities may be subject to foreign withholding taxes, which are accrued as applicable.
Income Taxes - It is the Portfolio’s policy to comply with the requirements of the Internal Revenue Code of 1986, as amended (the “Code”), and regulations thereunder, applicable to regulated investment companies and to distribute, with respect to each taxable year, all of its taxable income to shareholders. Therefore, no federal income tax provision is required. The Portfolio files U.S. federal and various state tax returns. No income tax returns are currently under examination. The Portfolio’s federal tax returns will remain subject to examination by the Internal Revenue Service for three fiscal years after the returns are filed.
Dividends and Distributions to Shareholders - The Portfolio records dividends and distributions on the ex-dividend date. Net realized gains from security transactions (if any) are generally distributed annually to shareholders. The timing and characterization of certain income and capital gains distributions are determined in accordance with federal tax regulations that may differ from GAAP. Permanent book and tax basis differences relating to shareholder distributions will result in reclassification between under/over distributed net investment income, accumulated net realized gains/losses and paid in surplus. Book-tax differences are primarily due to futures transactions, foreign currency transactions, swap transactions, options transactions, premium amortization adjustments, paydown transactions, contingent payment debt instrument adjustments, forward transactions, deferred trustees’ compensation, and losses deferred due to wash sales, as applicable. These adjustments have no impact on net assets or the results of operations.
Repurchase Agreements - The Portfolio may enter into repurchase agreements with selected commercial banks and broker-dealers, under which the Portfolio acquires securities as collateral and agrees to resell the securities at an agreed upon time and at an agreed upon price. The Portfolio, through the custodian or a subcustodian, receives delivery of the underlying securities collateralizing repurchase agreements. The Portfolio requires the custodian to take possession, to have legally segregated in the Federal Reserve Book Entry System, or to have segregated
11
MET INVESTORS SERIES TRUST
| | |
BlackRock Global Tactical Strategies Portfolio | | |
Notes to Financial Statements—June 30, 2011 (Unaudited)—(Continued)
2. Significant Accounting Policies - continued
within the custodian’s vault, all securities held as collateral for repurchase agreements. It is the Portfolio’s policy that the market value of the collateral be at least equal to 100% of the repurchase price in the case of a repurchase agreement of one-day duration and 102% of the repurchase price in the case of all other repurchase agreements. In connection with transactions in repurchase agreements, if the seller defaults and the value of the collateral declines or if the seller enters an insolvency proceeding, realization of the collateral by the Portfolio may be delayed, limited or wholly denied.
3. Investment Management Agreement and Other Transactions with Affiliates
Investment Management Agreement - The Trust is managed by the Adviser. The Trust has entered into a management agreement with the Adviser (the “Management Agreement”) for investment management services in connection with the investment management of the Portfolio. The Adviser is subject to the supervision and direction of the Board and has overall responsibility for the general management and administration of the Trust. The Adviser has entered into a subadvisory agreement BlackRock Financial Management, Inc. (the “Subadviser”) for investment subadvisory services in connection with the investment management of the Portfolio.
Subject to the supervision and direction of the Board, the Adviser supervises the Subadviser and has full discretion with respect to the retention or renewal of the subadvisory agreement. The Adviser pays the Subadviser a fee based on the Portfolio’s average daily net assets.
Under the terms of the Portfolio’s Management Agreement, the Portfolio pays the Adviser a monthly fee based upon annual rates applied to the Portfolio’s average daily net assets as follows:
| | | | |
Management Fees
earned by the Adviser
for the period ended
June 30, 2011 | | % per annum | | Average Daily Net Assets |
| | |
| $312,837 | | 0.800% | | First $100 Million |
| | |
| | 0.750% | | $100 Million to $300 Million |
| | |
| | 0.700% | | $300 Million to $600 Million |
| | |
| | 0.675% | | $600 Million to $1 Billion |
| | |
| | 0.650% | | Over $1 Billion |
Certain officers and trustees of the Trust may also be officers of the Adviser; however, such officers and trustees receive no compensation from the Trust.
Management Fee Waiver - The Subadviser voluntarily agreed to waive its entire subadvisory fee through July 31, 2011. Also through July 31, 2011, the Adviser voluntarily agreed to waive a portion of the management fee in an amount equal to the subadvisory fees waived. Amounts waived for the period ended June 30, 2011 are shown as a management fee waiver in the Statement of Operations.
Transfer Agency Agreement - MetLife serves as the transfer agent for the Trust. MetLife receives no fees for its services to the Trust under the transfer agency agreement.
Expense Limitation Agreement - The Adviser has entered into an expense limitation agreement with the Trust (“Expense Limitation Agreement”) in the interest of limiting expenses of the Portfolio. The Expense Limitation Agreement shall continue in effect with respect to the Portfolio until April 30, 2012. Pursuant to that Expense Limitation Agreement, the Adviser has agreed to waive or limit its fees and to assume other expenses so that the total annual operating expenses of the Portfolio other than interest, taxes, brokerage commissions, other expenditures which are capitalized or expensed in accordance with GAAP, other extraordinary expenses not incurred in the ordinary course of the Portfolio’s business, and Underlying ETFs fees and expenses but including amounts payable pursuant to a plan adopted in accordance with Rule 12b-1 under the 1940 Act, are limited to the following expense ratio as a percentage of the Portfolio’s average daily net assets:
|
Maximum Expense Ratio under current
Expense Limitation Agreement |
Class B |
|
| 1.15% |
If in any year in which the Management Agreement is still in effect, the estimated aggregate operating expenses of the Portfolio for the fiscal year are less than the Maximum Expense Ratio for that year, subject to approval by the Trust’s Board, the Adviser shall be entitled to reimbursement by the Portfolio to the extent that the charge does not cause the expenses in such subsequent year to exceed the Maximum Expense Ratio as stated above. The Portfolio is not obligated to repay any expense paid by the Adviser more than five years after the end of the fiscal year in which such expense was incurred.
12
MET INVESTORS SERIES TRUST
| | |
BlackRock Global Tactical Strategies Portfolio | | |
Notes to Financial Statements—June 30, 2011 (Unaudited)—(Continued)
3. Investment Management Agreement and Other Transactions with Affiliates - continued
Distribution Agreement and Plan - The Trust has a distribution agreement with MetLife Investors Distribution Company (“MIDC” or the “Distributor”) in which MIDC serves as the Distributor for the Trust’s Class B Shares. MIDC is a wholly-owned subsidiary of MetLife Investors Group, Inc., an affiliate of the Adviser. The Class B distribution plan provides that the Trust, on behalf of the Portfolio, may pay annually up to 0.50% of the average daily net assets of the Portfolio attributable to its Class B Shares with respect to activities primarily intended to result in the sale of Class B Shares. However, under the Class B distribution agreement, payments to the Distributor for activities pursuant to the Class B distribution plan are currently limited to payments at an annual rate equal to 0.25% of average daily net assets of the Portfolio attributable to its Class B Shares. Amounts incurred by the Portfolio for the period ended June 30, 2011 are shown as Distribution and service fees in the Statement of Operations.
Under the terms of the Class B distribution plan and distribution agreement the Portfolio is authorized to make payments monthly to the Distributor that may be used to pay or reimburse entities providing distribution and shareholder servicing with respect to the Class B Shares for such entities’ fees or expenses incurred.
Deferred Trustee Compensation - Each Trustee of the Trust who is not currently an employee of the Adviser or any of its affiliates receives compensation from the Trust for his or her service to the Portfolio. A deferred compensation plan (the “Plan”) is available to the Trustees on a voluntary basis. Deferred amounts remain in the Trust until distributed in accordance with the provisions of the Plan. The value of a participating Trustee’s deferral account is based on theoretical investments of deferred amounts, on the normal payment dates, in certain portfolios of the Trust or Metropolitan Series Fund, Inc. as designated by the participating Trustee. Changes in the value of participants’ deferral accounts are reflected as Trustees’ fees and expenses in the Statement of Operations. The portion of the accrued obligations allocated to the Portfolio, if any, under the Plan are reflected as Deferred trustees’ fees in the Statement of Assets and Liabilities.
4. Investment Transactions
Aggregate cost of purchases and proceeds of sales of investment securities, excluding short-term securities, for the period ended June 30, 2011 were as follows:
| | | | | | | | | | | | | | |
| Purchases | | | Sales | |
| U.S. Government | | | Non U.S. Government | | | U.S. Government | | | Non U.S. Government | |
| | | |
| $ | — | | | $ | 669,996,697 | | | $ | — | | | $ | 38,052,303 | |
5. Investments in Derivative Instruments
Investments in Derivative Instruments - Disclosures about derivative instruments are intended to improve financial reporting for derivative instruments by requiring enhanced disclosure that enables investors to understand how and why a Portfolio uses derivatives, how derivatives are accounted for, and how derivative instruments affect the Portfolio’s results of operations and financial position. Summarized below are the specific types of derivative instruments utilized by the Portfolio.
Swap Agreements - The Portfolio may enter into swap contracts. Swap contracts are derivatives agreements to exchange the return generated by one instrument for the return generated by another instrument. The payment streams are calculated by reference to a specified index and agreed upon notional amount. The term “specified index” includes, but is not limited to, currencies, fixed interest rates, prices and total return on interest rate indices, fixed income indices, stock indices and commodity indices (as well as amounts derived from arithmetic operations on these indices). A Portfolio will usually enter into swaps on a net basis, i.e., the two payment streams are netted out in a cash settlement on the payment date or dates specified in the instrument, with the Portfolio receiving or paying, as the case may be, only the net amount of the two payments. The Portfolio’s obligations under a swap agreement will be accrued daily (offset against any amounts owing to the Portfolio) and any accrued but unpaid net amounts owed to a swap counterparty will be covered by designating the segregation, either on its records or with the Trust’s custodian, of cash or other liquid assets, to avoid any potential leveraging of the Portfolio. The Portfolio may enter into swap transactions with counterparties that are approved by the investment adviser in accordance with guidelines established by the Board. These guidelines provide for a minimum credit rating for each counterparty and various credit enhancement techniques (for example, collateralization of amounts due from counterparties) to limit exposure to counterparties that have lower credit ratings.
The swaps in which the Portfolio may engage may include instruments under which one party pays a single or periodic fixed amount(s) (or premium), and the other party pays periodic amounts based on the movement of a specified index. Swaps do not involve the delivery of securities, other underlying assets, or principal. Accordingly, the risk of loss with respect to swaps is limited to the net amount of payments the Portfolio is contractually obligated to receive. If the other party to a swap defaults, the Portfolio’s risk of loss consists of the net amount of payments that the Portfolio contractually is entitled to receive.
An index swap is an agreement to swap cash flows on a notional amount based on changes in the values of the reference indices.
13
MET INVESTORS SERIES TRUST
| | |
BlackRock Global Tactical Strategies Portfolio | | |
Notes to Financial Statements—June 30, 2011 (Unaudited)—(Continued)
5. Investments in Derivative Instruments - continued
A currency swap is an agreement to exchange cash flows on a notional amount of two or more currencies based on the relative value differential among them. Such swaps may involve initial and final exchanges that correspond to the agreed upon notional amount. Currency swaps usually involve the delivery of the entire principal value of one designated currency in exchange for the other designated currency. Therefore, the entire principal value of a currency swap is subject to the risk that the other party to the swap will default on its contractual delivery obligations. If there is a default by the counterparty, the Portfolio may have contractual remedies pursuant to the agreements related to the transaction.
Equity swaps are two-party contracts that generally obligate one party to pay the positive return and the other party to pay the negative return on a specified reference security, basket of securities, security index or index component during the period of the swap. Equity swap contracts are marked to market daily based on the value of the underlying security and the change, if any, is recorded as an unrealized gain or loss. Equity swaps normally do not involve the delivery of securities or other underlying assets. If the other party to an equity swap defaults, a Portfolio’s risk of loss consists of the net amount of payments that such Portfolio is contractually entitled to receive, if any. Equity swaps are derivatives and their value can be very volatile.
The use of swaps is a highly specialized activity that involves investment techniques and risks different from those associated with ordinary portfolio securities transactions. If an investment adviser is incorrect in its forecasts of market values, interest rates, and currency exchange rates, the investment performance of the Portfolio would be less favorable than it would have been if this investment technique were not used.
Interest Rate Swaps - The Portfolio may enter into interest rate swaps and the purchase or sale of related caps and floors. The Portfolio may enter into these transactions primarily to manage its exposure to interest rates, to protect against currency fluctuations, or to preserve a return or spread on a particular investment. The Portfolio is subject to interest rate risk exposure in the normal course of pursuing its investment objectives. Because the Portfolio has exposure to fixed income securities, the value of these securities may decrease if interest rates rise. To help hedge against this risk and to maintain its ability to generate income at prevailing market rates, the Portfolio may enter into interest rate swap contracts. Interest rate swaps are arrangements between two parties to exchange cash flows based on a notional principal amount, to manage the Portfolio’s exposure to interest rates. Interest rate swap contracts are marked-to-market daily based upon quotations from market makers and the change, if any, is recorded as unrealized gain or loss. Payments received or made are recorded as realized gains or losses. The Portfolio could be exposed to credit or market risk due to unfavorable changes in the fluctuation of interest rates or if the counterparty defaults on its obligation to perform. Risks may exceed amounts recognized on the Statement of Assets and Liabilities. The purchase of a cap entitles the purchaser, to the extent that a specific index exceeds a predetermined interest rate, to receive payments of interest on a notional principal amount from the party selling such cap. The purchase of a floor entitles the purchaser to receive payments on a notional principal amount from the party selling such floor to the extent that a specified index falls below a predetermined interest rate or amount. The Portfolio’s maximum risk of loss from counterparty credit risk is the discounted net value of the cash flows to be received from/paid to the counterparty over the contract’s remaining life, to the extent that amount is positive. This risk is mitigated by maintaining a master netting arrangement between the Portfolio and the counterparty and by the posting of collateral by the counterparty to the Portfolio to cover the Portfolio’s exposure to the counterparty.
Swap agreements are marked to market daily. The change in value, if any, is recorded as unrealized gain or loss in the Statement of Operations. A liquidation payment received or made at the termination of the swap is recorded as realized gain or loss in the Statement of Operations. Net periodic payments are included as part of realized gain (loss) on the Statement of Operations.
At June 30, 2011, the Portfolio had the following derivatives, grouped into appropriate risk categories:
| | | | | | | | | | | | |
| | | Asset Derivatives | | | Liability Derivatives | |
Risk Exposure | | Statement of Assets &
Liabilities Location | | Fair Value | | | Statement of Assets &
Liabilities Location | | Fair Value | |
| | | | |
Interest Rate | | Unrealized appreciation on swap contracts | | $ | 74,925 | | | Unrealized depreciation on swap contracts | | $ | 1,262,786 | |
| | | | | | | | | | | | |
Transactions in derivative instruments during the period ended June 30, 2011, were as follows:
| | | | |
Statement of Operations Location - Net Realized Gain (Loss) | | Interest Rate | |
| |
Swap contracts | | $ | 314,995 | |
| | | | |
Statement of Operations Location - Net Change in Unrealized Gain (Loss) | | | |
| |
Swap contracts | | $ | (1,187,861 | ) |
| | | | |
14
MET INVESTORS SERIES TRUST
| | |
BlackRock Global Tactical Strategies Portfolio | | |
Notes to Financial Statements—June 30, 2011 (Unaudited)—(Continued)
5. Investments in Derivative Instruments - continued
For the period ended June 30, 2011, the average amount or number per contract outstanding for each derivative type was as follows:
| | | | |
Average Notional Amounts or Face Amount(a) | | Interest
Rate Risk | |
| |
Swap contracts | | | 12,126,667 | |
| (a) | | Averages are based on daily activity levels during 2011. |
6. Swap Agreements
Open interest rate swap agreements at June 30, 2011 were as follows:
| | | | | | | | | | | | | | | | | | | | | | | | | | | | | | | | |
Pay/Receive
Floating
Rate | | Floating
Rate Index | | | Fixed
Rate | | | Maturity
Date | | | Counterparty | | | Notional Amount | | | Market
Value | | | Upfront Premium
Paid/(Received) | | | Unrealized
Appreciation/
(Depreciation) | |
| | | | | | | | |
Pay | | | IRS USD 3ML | | | | 3.190 | % | | | 5/19/2021 | | | | Deutsche Bank AG | | | USD | 6,000,000 | | | $ | (25,172 | ) | | $ | — | | | $ | (25,172 | ) |
| | | | | | | | |
Pay | | | IRS USD 3ML | | | | 3.263 | % | | | 5/23/2021 | | | | Deutsche Bank AG | | | USD | 8,000,000 | | | | 15,569 | | | | — | | | | 15,569 | |
| | | | | | | | |
Pay | | | IRS USD 3ML | | | | 3.223 | % | | | 5/25/2021 | | | | Deutsche Bank AG | | | USD | 7,500,000 | | | | (12,202 | ) | | | — | | | | (12,202 | ) |
| | | | | | | | |
Pay | | | IRS USD 3ML | | | | 3.218 | % | | | 5/27/2021 | | | | Deutsche Bank AG | | | USD | 10,400,000 | | | | (21,941 | ) | | | — | | | | (21,941 | ) |
| | | | | | | | |
Pay | | | IRS USD 3ML | | | | 3.158 | % | | | 6/1/2021 | | | | Deutsche Bank AG | | | USD | 10,000,000 | | | | (75,450 | ) | | | — | | | | (75,450 | ) |
| | | | | | | | |
Pay | | | IRS USD 3ML | | | | 3.073 | % | | | 6/3/2021 | | | | Deutsche Bank AG | | | USD | 15,000,000 | | | | (226,499 | ) | | | — | | | | (226,499 | ) |
| | | | | | | | |
Pay | | | IRS USD 3ML | | | | 3.134 | % | | | 6/9/2021 | | | | Deutsche Bank AG | | | USD | 19,000,000 | | | | (188,639 | ) | | | — | | | | (188,639 | ) |
| | | | | | | | |
Pay | | | IRS USD 3ML | | | | 3.361 | % | | | 5/4/2021 | | | | Deutsche Bank AG | | | USD | 3,000,000 | | | | 33,521 | | | | — | | | | 33,521 | |
| | | | | | | | |
Pay | | | IRS USD 3ML | | | | 3.264 | % | | | 5/9/2021 | | | | Deutsche Bank AG | | | USD | 2,000,000 | | | | 5,048 | | | | — | | | | 5,048 | |
| | | | | | | | |
Pay | | | IRS USD 3ML | | | | 3.230 | % | | | 5/11/2021 | | | | Deutsche Bank AG | | | USD | 3,000,000 | | | | (1,281 | ) | | | — | | | | (1,281 | ) |
| | | | | | | | |
Pay | | | IRS USD 3ML | | | | 3.249 | % | | | 5/13/2021 | | | | Deutsche Bank AG | | | USD | 5,000,000 | | | | 5,833 | | | | — | | | | 5,833 | |
| | | | | | | | |
Pay | | | IRS USD 3ML | | | | 3.266 | % | | | 5/17/2021 | | | | Deutsche Bank AG | | | USD | 6,000,000 | | | | 14,954 | | | | — | | | | 14,954 | |
| | | | | | | | |
Pay | | | IRS USD 3ML | | | | 3.198 | % | | | 6/16/2021 | | | | Deutsche Bank AG | | | USD | 25,000,000 | | | | (112,039 | ) | | | — | | | | (112,039 | ) |
| | | | | | | | |
Pay | | | IRS USD 3ML | | | | 3.122 | % | | | 6/23/2021 | | | | Deutsche Bank AG | | | USD | 30,000,000 | | | | (342,907 | ) | | | — | | | | (342,907 | ) |
| | | | | | | | |
Pay | | | IRS USD 3ML | | | | 3.161 | % | | | 6/30/2021 | | | | Deutsche Bank AG | | | USD | 32,000,000 | | | | (256,656 | ) | | | — | | | | (256,656 | ) |
| | | | | | | | | | | | | | | | | | | | | | | | | | | | | | | | |
| | | | | | | | |
Total | | | | | | | | | | | | | | | | | | | | | | $ | (1,187,861 | ) | | $ | — | | | $ | (1,187,861 | ) |
| | | | | | | | | | | | | | | | | | | | | | | | | | | | | | | | |
7. Contractual Obligations
The Trust has a variety of indemnification obligations under contracts with its service providers. The Trust’s maximum exposure under these arrangements is unknown.
8. Transactions in Securities of Affiliated Issuers
The Portfolio does not invest in the Underlying Portfolios for the purpose of exercising management or control; however, investments by the Portfolio within its principal investment strategies may represent a significant portion of the Underlying Portfolio’s net assets. Transactions in the Underlying Portfolios for the period from May 2, 2011 (commencement of operations) through June 30, 2011 were as follows:
| | | | | | | | | | | | | | | | |
Underlying ETF | | Number of shares
held at May 2,
2011* | | | Shares purchased | | | Shares sold | | | Number of shares
held at June 30,
2011 | |
| | | | |
iShares Barclays 7-10 Year Treasury Bond Fund | | | — | | | | 315,459 | | | | (315,459 | ) | | | — | |
| | | | |
iShares Barclays Aggregate Bond Fund | | | — | | | | 1,748,594 | | | | — | | | | 1,748,594 | |
| | | | |
iShares Barclays TIPS Bond Fund | | | — | | | | 67,762 | | | | (67,762 | ) | | | — | |
15
MET INVESTORS SERIES TRUST
| | |
BlackRock Global Tactical Strategies Portfolio | | |
Notes to Financial Statements—June 30, 2011 (Unaudited)—(Continued)
8. Transactions in Securities of Affiliated Issuers - continued
| | | | | | | | | | | | | | | | |
Underlying ETF | | Number of shares
held at May 2,
2011* | | | Shares purchased | | | Shares sold | | | Number of shares
held at June 30,
2011 | |
| | | | |
iShares Dow Jones EPAC Select Dividend Index Fund | | | — | | | | 331,358 | | | | — | | | | 331,358 | |
| | | | |
iShares iBoxx $ High Yield Corporate Bond Fund | | | — | | | | 291,735 | | | | — | | | | 291,735 | |
| | | | |
iShares iBoxx $ Investment Grade Corporate Bond Fund | | | — | | | | 270,713 | | | | — | | | | 270,713 | |
| | | | |
iShares MSCI EAFE Index Fund | | | — | | | | 1,930,550 | | | | — | | | | 1,930,550 | |
| | | | |
iShares MSCI Sweden Index Fund | | | — | | | | 212,261 | | | | — | | | | 212,261 | |
| | | | |
iShares Russell 3000 Index Fund | | | — | | | | 934,598 | | | | — | | | | 934,598 | |
| | | | |
iShares S&P 100 Index Fund | | | — | | | | 204,661 | | | | — | | | | 204,661 | |
| | | | | | | | | | | | | | | | |
Underlying ETF | | Net Realized
Gain/(Loss) on sales
of Underlying
ETFs | | | Capital Gain
Distributions
from Underlying
ETFs | | | Dividend income
from Underlying
ETFs | | | Ending Value as
of June 30,
2011 | |
| | | | |
iShares Barclays 7-10 Year Treasury Bond Fund | | $ | 379,857 | | | $ | — | | | $ | 51,071 | | | $ | — | |
| | | | |
iShares Barclays Aggregate Bond Fund | | | — | | | | — | | | | 149,886 | | | | 186,522,522 | |
| | | | |
iShares Barclays TIPS Bond Fund | | | (8,030 | ) | | | — | | | | 42,271 | | | | — | |
| | | | |
iShares Dow Jones EPAC Select Dividend Index Fund | | | — | | | | — | | | | 194,841 | | | | 11,799,658 | |
| | | | |
iShares iBoxx $ High Yield Corporate Bond Fund | | | — | | | | — | | | | 6,872 | | | | 26,638,323 | |
| | | | |
iShares iBoxx $ Investment Grade Corporate Bond Fund | | | — | | | | — | | | | 25,627 | | | | 29,813,623 | |
| | | | |
iShares MSCI EAFE Index Fund | | | — | | | | — | | | | 1,763,768 | | | | 116,103,277 | |
| | | | |
iShares MSCI Sweden Index Fund | | | — | | | | — | | | | — | | | | 6,745,655 | |
| | | | |
iShares Russell 3000 Index Fund | | | — | | | | — | | | | — | | | | 74,104,275 | |
| | | | |
iShares S&P 100 Index Fund | | | — | | | | — | | | | 26,869 | | | | 12,021,787 | |
| | | | | | | | | | | | | | | | |
| | | | |
| | $ | 371,827 | | | $ | — | | | $ | 2,261,205 | | | $ | 463,749,120 | |
| | | | | | | | | | | | | | | | |
| * | | Commencement of operations. |
9. Market, Credit and Counterparty Risk
In the normal course of business, the Portfolio and the Underlying ETFs invest in securities and enter into transactions where risks exist due to fluctuations in the market (market risk) or failure of the other party to a transaction to perform (credit and counterparty risk). The value of securities held by the Portfolio and the Underlying ETFs may decline in response to certain events, including those directly involving the companies whose securities are owned by the Portfolio or the Underlying ETFs; conditions affecting the general economy; overall market changes; local, regional or global political, social or economic instability; and currency and interest rate and price fluctuations. The Portfolio and the Underlying ETFs may be exposed to counterparty risk, or the risk that an entity with which the Portfolio or the Underlying ETFs have unsettled or open transactions may default. The potential loss could exceed the value of the financial assets recorded in the financial statements. Financial assets that potentially expose the Portfolio and the Underlying ETFs to credit risk consist principally of cash due from counterparties and investments.
16
MET INVESTORS SERIES TRUST
| | |
BlackRock Global Tactical Strategies Portfolio | | |
Notes to Financial Statements—June 30, 2011 (Unaudited)—(Continued)
10. Recent Accounting Pronouncements
In January 2010, the Financial Accounting Standards Board (“FASB”) issued Accounting Standards Update No. 2010-06, “Improving Disclosures About Fair Value Measurements” (“ASU”) which was generally effective for years beginning after December 15, 2009 and was adopted by the Portfolio. The ASU requires enhanced disclosures about purchases, sales, issuances and settlements on a gross basis relating to Level 3 fair value measurements. These enhanced disclosures became effective for fiscal years beginning after December 15, 2010, and for interim periods within those years. Management has evaluated the impact of ASU 2010-06 and has concluded that ASU 2010-06 has no material impact on these financial statements.
In May 2011, FASB issued Accounting Standards Update (ASU) No. 2011-04 “Amendments to Achieve Common Fair Value Measurement and Disclosure Requirements in GAAP and the International Financial Reporting Standards (IFRS).” ASU 2011-04 includes common requirements for measurement of and disclosure about fair value between U.S. GAAP and IFRS. ASU 2011-04 will require reporting entities to categorize within Level 3 of the fair value hierarchy: quantitative information about the unobservable inputs used in the fair value measurement, the valuation processes used by the reporting entity and a narrative description of the sensitivity of the fair value measurement to changes in unobservable inputs and the interrelationships between those unobservable inputs. In addition, ASU 2011-04 will require reporting entities to make disclosures about amounts and reasons for all transfers in and out of Level 1 and Level 2 fair value measurements. The new and revised disclosures are effective for fiscal years beginning after December 15, 2011 and for interim periods within those fiscal years. Management is currently evaluating the implications of ASU 2011-04 and its impact on the financial statements.
17
MET INVESTORS SERIES TRUST
| | |
BlackRock Global Tactical Strategies Portfolio | | |
Quarterly Portfolio Schedule
The Trust files Form N-Q for the first and third quarters of each fiscal year. The Trust’s Forms N-Q will be available on the Securities and Exchange Commission’s website at http://www.sec.gov. The Trust’s Forms N-Q may be reviewed and copied at the Securities and Exchange Commission’s Public Reference Room in Washington, D.C. and information on the operation of the Public Reference Room may be obtained by calling 1-800-SEC-0330. Once filed, the most recent Form N-Q will be available without charge, upon request, by calling (800) 848-3854.
Proxy Voting Policies and Procedures
A description of the policies and procedures that the Trust uses to determine how to vote proxies relating to portfolio securities is available without charge, upon request, by calling (800) 848-3854 and on the Securities and Exchange Commission’s website at http://www.sec.gov.
Proxy Voting Record
The Trust, on behalf of each of its Portfolios, has filed with the Securities and Exchange Commission its proxy voting record for the 12-month period ending June 30 on Form N-PX. Form N-PX must be filed by the Trust each year by August 31. Once filed, the most recent Form N-PX will be available without charge, upon request, by calling (800) 848-3854 or on the Securities and Exchange Commission’s website at http://www.sec.gov.
18
MET INVESTORS SERIES TRUST
| | |
BlackRock Global Tactical Strategies Portfolio | | |
Board of Trustees’ Consideration of Advisory and Sub-Advisory Agreements
At an in-person meeting of the Board of Trustees (the “Board”) of the Met Investors Series Trust (the “Trust”) held on February 14-15, 2011, the Board, including a majority of the Trustees who are not considered to be “interested persons” of the Trust (the “Independent Trustees”) under the Investment Company Act of 1940, as amended (the “1940 Act”), initially approved the Trust’s advisory agreement (the “Advisory Agreement”) with MetLife Advisers, LLC (the “Adviser”) and the applicable investment sub-advisory agreements (each a “Sub-Advisory Agreement”, and collectively with the Advisory Agreement, the “Agreements”) between the Adviser and the investment sub-advisers (each a “Subadviser”, and collectively, the “Subadvisers”) for certain new series of the Trust, including the BlackRock Global Tactical Strategies Portfolio (each a “Portfolio,” and collectively, the “Portfolios”).1
In considering the Agreements, the Board reviewed a variety of materials provided by the Adviser and the Subadvisers relating to each Portfolio, the Adviser and each Subadviser, including comparative fee and expense information for an appropriate peer group of similar mutual funds if available, performance information for relevant benchmark indices, as applicable, and other information regarding the nature, extent and quality of services to be provided by the Adviser and the Subadvisers under their respective Agreements. The Independent Trustees also assessed a report provided by the Board’s independent consultant, who reviewed and provided analyses regarding fees and expenses, and other information provided by, or at the direction of, the Adviser and Subadvisers, as more fully discussed below.
The Independent Trustees were separately advised by independent legal counsel throughout the process. Prior to voting to approve the Agreements at the February meeting, the Independent Trustees also received a memorandum from their independent legal counsel discussing the legal standards for their consideration of the proposed initial approval of the Agreements. The Board also had previously received presentations from the Adviser with respect to the Managed Risk Portfolios at the August 3-4, 2010 and the November 9-10, 2010 Board meetings. The Board also further discussed the Managed Risk Portfolios with the Adviser on January 19, 2011, and received presentations regarding the Managed Risk Portfolios from the Subadvisers on January 26, 2011 and January 28, 2011 during which representatives of the Adviser and the Subadvisers responded to questions from the Independent Trustees. The Independent Trustees also discussed the proposed initial approval of the Agreements in private sessions with their independent legal counsel at which no representatives of management were present.
In considering whether to approve the Agreements, the Board reviewed and analyzed the factors it deemed relevant, including: (1) the nature, extent and quality of the services to be provided to the Portfolios by the Adviser and the Subadvisers; (2) the performance of comparable funds or accounts managed by the Subadvisers as compared to appropriate indices, to the extent available; (3) the Adviser’s and each of the Subadviser’s personnel and operations; (4) the financial condition of the Adviser and of the Subadvisers; (5) the level and method of computing each Portfolio’s proposed advisory and subadvisory fees; (6) the anticipated profitability of the Adviser under the Advisory Agreement and of the Subadvisers under the Sub-Advisory Agreements; (7) any “fall-out” benefits to the Adviser, the Subadvisers and their affiliates (i.e., ancillary benefits realized by the Adviser, the Subadvisers or their affiliates from the Adviser’s or Subadvisers’ relationship with the Trust); (8) the anticipated effect of growth in size on each Portfolio’s performance and expenses; (9) fees paid by comparable institutional and retail accounts; and (10) possible conflicts of interest. The Board also considered the nature, quality, and extent of the services to be provided to the Portfolios by the Adviser’s affiliates, including distribution services.
Nature, extent and quality of services. In considering the nature, extent and quality of the services to be provided by the Adviser to the Portfolios, the Board took into account the extensive responsibilities that the Adviser would have as investment adviser to the Portfolios, including the provision of investment advisory services to the MetLife Balanced Plus Portfolio, the selection of the Subadvisers for the other Portfolios and oversight of the Subadvisers’ compliance with fund policies and objectives, review of brokerage matters including with respect to trade allocation and best execution, oversight of general fund compliance with federal and state laws, its risk management processes, and the implementation of Board directives as they relate to the Portfolios. The Adviser’s role in coordinating the activities of the Portfolios’ other service providers was also considered. The Board also evaluated the expertise and performance of the investment personnel with respect to the MetLife Balanced Plus Portfolio and of the personnel who would be overseeing the Subadvisers of the other Portfolios and compliance with each Portfolio’s investment restrictions, tax and other requirements. The Board also considered that an Investment Committee, consisting of investment professionals from across MetLife, will meet at least quarterly to review the asset allocations of the MetLife Balanced Plus Portfolio.
The Board considered information received from the Trust’s Chief Compliance Officer (the “CCO”) regarding the Portfolios’ compliance policies and procedures established pursuant to Rule 38a-1 under the 1940 Act, including the policies and procedures in place relating to proxy voting. Based on the information provided to the Board and its discussions with the CCO, the Board approved the Rule 38a-1 compliance policies and procedures as they relate to each Portfolio. The Board also took into account its familiarity with management through Board meetings, discussions and reports during the preceding year. The Board also took into consideration the quality of services the Adviser provided to other Portfolios of the Trust.
1 At the February 14-15, 2011 meeting, the Board also approved Agreements with respect to the AQR Global Risk Balanced Portfolio, AllianceBernstein Global Dynamic Allocation Portfolio, MetLife Balanced Plus Portfolio, Pyramis® Government Income Portfolio (together with the BlackRock Global Tactical Strategies Portfolio, the “Managed Risk Portfolios”), Met/Franklin Low Duration Total Return Portfolio and the T. Rowe Price Large Cap Value Portfolio.
19
MET INVESTORS SERIES TRUST
| | |
BlackRock Global Tactical Strategies Portfolio | | |
Board of Trustees’ Consideration of Advisory and Sub-Advisory Agreements—(Continued)
The Board also recognized the Adviser’s reputation and long-standing experience in serving as an investment adviser to the Trust. In addition, the Board reviewed the financial condition of the Adviser and whether it had the financial wherewithal to provide a high level and quality of services to the Portfolios. In its review, the Board also received and took into account information regarding any services and/or payments to be provided to the Adviser by the Subadvisers in connection with marketing activities.
With respect to the services to be provided by the Subadvisers, the Board considered information provided to the Board by each Subadviser, including each Subadviser’s Form ADV, as well as information presented throughout the past year for those Subadvisers currently sub-advising existing Portfolios of the Trust. The Board considered each Subadviser’s current level of staffing and its overall resources, as well as its compensation program. The Board reviewed each Subadviser’s history and investment experience, as well as information regarding the qualifications, background and responsibilities of each Subadviser’s investment and compliance personnel who would be providing services to the Portfolios. The Board also considered, among other things, each Subadviser’s compliance program and its disciplinary history, and its risk assessment and monitoring process. The Board noted each Subadviser’s regulatory history, including whether it was currently involved in any regulatory actions or investigations as well as material litigation, and any settlements and ameliatory actions undertaken, as appropriate. The Board also noted that the CCO and his staff would be conducting regular, periodic compliance reviews with each of the Subadvisers and present reports to the Independent Trustees regarding the same, which would include evaluating the regulatory compliance system of the Subadvisers and procedures reasonably designed by them to assure compliance with the federal securities laws, including issues related to late trading and market timing, best execution, fair value pricing, and proxy voting procedures, among others. The Board also took into account the financial condition of each Subadviser. Based on the information provided to the Board and its discussions with the CCO, the Board approved the Rule 38a-1 compliance policies and procedures as they relate to the Portfolios.
The Board considered each Subadviser’s investment process and philosophy. The Board took into account that each Subadviser’s responsibilities would include the development and maintenance of an investment program for the applicable Portfolio which would be consistent with the Portfolio’s investment objectives, the selection of investment securities and the placement of orders for the purchase and sale of such securities, as well as the implementation of compliance controls related to performance of these services. The Board also reviewed each Subadviser’s brokerage policies and practices, including with respect to best execution and soft dollars.
Based on its consideration and review of the foregoing information, the Board concluded that the nature, extent and quality of services to be provided by the Adviser and by each Subadviser were satisfactory and that there was a reasonable basis on which to conclude that each would provide a high quality of investment services to the Portfolios.
Performance. The Board took into account that the AQR Global Risk Balanced Portfolio, AllianceBernstein Global Dynamic Allocation Portfolio, BlackRock Global Tactical Strategies Portfolio and MetLife Balanced Plus Portfolio utilize relatively unique investment strategies designed to manage volatility and noted the unavailability of comparable performance information for these types of strategies. With respect to the Pyramis® Government Income Portfolio, however, the Board considered the performance of a comparable fund managed by that Subadviser. The Board also considered the performance of other funds or accounts managed by the Subadvisers to the extent such information was relevant.
As discussed above with respect to the BlackRock Global Tactical Strategies Portfolio, the Board noted that while no comparable performance data was available, the Board considered information that described how the Portfolio is designed to perform under a variety of market conditions.
Fees and expenses. The Board gave substantial consideration to the proposed management fees payable under the Advisory Agreement and the proposed subadvisory fees payable under each of the Sub-Advisory Agreements. In addition, the Independent Trustees reviewed a report prepared by Bobroff Consulting, Inc., an independent consultant (“Bobroff”), which analyzed the proposed fees to be paid by each Portfolio in light of fees paid to other investment managers by other somewhat comparable funds, as applicable, and the method of computing each Portfolio’s proposed fee. In addition, the Board considered each Portfolio’s proposed management fee and total expenses as compared to similarly situated investment companies underlying variable insurance products and retail funds deemed to be comparable to the Portfolio as determined by Bobroff. With respect to the AQR Global Risk Balanced Portfolio, AllianceBernstein Global Dynamic Allocation Portfolio, BlackRock Global Tactical Strategies Portfolio, and MetLife Balanced Plus Portfolio, the Board took into account the limited usefulness of the peer groups in which the Portfolios were included for comparative purposes. In comparing each Portfolio’s proposed management fee to that of comparable funds, the Board noted that such fee includes both advisory and administrative fees.
The Board noted that the subadvisory fees for the Portfolios would be paid by the Adviser, not the Portfolios, out of the management fee. It was further noted that the Adviser negotiated such fee at arm’s length. The Board also considered that the Adviser had agreed to enter into an expense limitation agreement with each Portfolio, pursuant to which the Adviser would agree to waive a portion of its management fee and/or reimburse certain expenses as a means of limiting a Portfolio’s total annual operating expenses.
The Board also compared the proposed subadvisory fee to be paid by the Adviser to the fees charged by each Subadviser to manage other funds and funds not subject to regulation under the 1940 Act, such as separate accounts, as applicable. The Board considered the fee comparisons in light of the differences required to manage different types of accounts.
20
MET INVESTORS SERIES TRUST
| | |
BlackRock Global Tactical Strategies Portfolio | | |
Board of Trustees’ Consideration of Advisory and Sub-Advisory Agreements—(Continued)
With respect to the BlackRock Global Tactical Strategies Portfolio, the Board considered that, according to a report prepared by Bobroff, the Portfolio’s proposed management fee was below the median of the peer group. The Board further considered that the Portfolio’s estimated total expenses (exclusive of 12b-1 fees) were above the median of the peer group. The Board took into account’s management discussion of the Portfolio’s estimated expenses. The Board also noted that the Subadviser had agreed to waive its subadvisory fee for the Portfolio’s first three months of operations, and that the Adviser had also agreed to waive a portion of its advisory fee equal to the amount of the subadvisory fee waiver for the Portfolio’s first three months of operations. After consideration of all relevant factors, the Board concluded that the proposed management and subadvisory fees were consistent with industry norms and were fair and reasonable in light of the services to be provided.
Profitability. The Board examined the anticipated profitability of the Adviser with respect to each Portfolio. With respect to the MetLife Balanced Plus Portfolio, the Board noted that the advisory fee is in addition to the fees received by the Adviser and its affiliates with regard to the other Portfolios of the Trust or of Metropolitan Series Fund, Inc. (the “Underlying Portfolios”) in which the Portfolio may invest. With respect to the other Portfolios, the Board noted that a major component of profitability of the Adviser would be the margin between the management fee that the Adviser would receive from the Portfolio and the portion of that fee the Adviser would pay to the Subadviser. The Board also took into account the costs borne by the Adviser’s affiliates that support the operations of the Adviser, as well as considered the profitability of the insurance product, the function of which is supported in part by the Adviser’s revenues under the Advisory Agreement. The Board also considered that the Trust’s distributor, MetLife Investors Distribution Company, would receive Rule 12b-1 payments to support the distribution of the product. The Board concluded after extensive discussions with management that the anticipated profitability of the Adviser and its affiliates from their relationship with each Portfolio was reasonable in light of all relevant factors.
In considering the anticipated profitability to the Subadvisers and their affiliates of their relationships with the Portfolios, the Board noted that the proposed subadvisory fees under the Sub-Advisory Agreements would be paid by the Adviser out of the management fee that it would receive under the Advisory Agreement. The Board also relied on the ability of the Adviser to negotiate the Sub-Advisory Agreements and the fees thereunder at arm’s length. However, the Board placed more reliance on the fact that the Sub-Advisory Agreements were negotiated at arm’s length and that the proposed subadvisory fees would be paid by the Adviser than on the Subadvisers’ anticipated profitability.
Economies of scale. The Board also considered the probable effect of the Portfolios’ growth in size on their performance and fees. The Board noted that the proposed management and subadvisory fees each contained breakpoints that would reduce the fee rate above specified asset levels. The Board also took into account that the proposed subadvisory fees would be paid by the Adviser out of the management fees. The Board considered the fact that the Portfolios’ fee levels decline as portfolio assets increase. The Board also noted that if the Portfolios’ assets increase over time, the Portfolios may realize other economies of scale if assets increase proportionally more than certain other fixed expenses. The Board concluded that the proposed advisory fee structure for the Portfolios, including breakpoints, was reasonable and appropriately reflects potential economies of scale.
Other factors. As part of its evaluation of the Adviser’s compensation, the Board considered other benefits that may be realized by the Adviser and its affiliates from their relationship with the Trust. Among them, the Board recognized that an affiliate of the Adviser, MetLife Investors Distribution Company, serves as the distributor for the Trust, and, as such, would receive payments pursuant to Rule 12b-1 from the Portfolios to compensate it for providing shareholder services and selling activities, which could lead to growth in the Trust’s assets and corresponding benefits from such growth, including economies of scale. The Board also considered that affiliates of the Adviser may benefit from certain indirect tax benefits relating to dividend received deductions and foreign tax credits. The Board concluded that anticipated ancillary benefits that may accrue to the Adviser and its affiliates by virtue of the Adviser’s relationship with the Portfolios are fair and reasonable in light of the anticipated costs of providing investment management and other services to the Portfolios and the ongoing commitment of the Adviser to the Portfolios.
The Board considered other benefits that may be realized by each Subadviser and its affiliates from their relationship with the Trust, including the opportunity to provide advisory services to additional portfolios of the Trust and reputational benefits. The Board concluded that the benefits that may accrue to the Subadvisers and their affiliates by virtue of the Subadvisers’ relationships to the Portfolios were fair and reasonable in light of the anticipated costs of providing investment advisory services to the Portfolios and the ongoing commitment of the Subadvisers to the Portfolios.
The Board considered any possible conflicts of interest in the form of material benefits or detriments to the Trust resulting from the nature of the Trust’s and the Adviser’s or the Subadvisers’ affiliations. Here, the Board considered possible conflicts of interest that may arise between the Trust and the Adviser or a Subadviser in connection with the services to be provided to the Trust and the various relationships that they and their affiliates may have with the Trust. The Board considered the procedures for monitoring and managing such potential conflicts.
In addition, the Board reviewed the advisory fee to be paid to the Adviser for the BlackRock Global Tactical Strategies Portfolio and concluded that the advisory fee to be paid to the Adviser with respect to the Portfolio is based on services to be provided that are in addition to, rather than duplicative of, the services provided pursuant to the advisory agreements for the underlying funds in which the Portfolio invests and that the additional services are necessary because of the differences between the investment policies, strategies and techniques of the Portfolio and those of the underlying funds.
Conclusion. In considering the initial approval of each of the Agreements, the Board, including the Independent Trustees, did not identify any single factor as controlling, and each Trustee may have attributed different weights to various factors. The Board evaluated all information
21
MET INVESTORS SERIES TRUST
| | |
BlackRock Global Tactical Strategies Portfolio | | |
Board of Trustees’ Consideration of Advisory and Sub-Advisory Agreements—(Continued)
available to them on a Portfolio-by-Portfolio basis, and their determinations were made separately with respect to each Portfolio. Based on all of the above-mentioned considerations, and the recommendations of management, the Board, including a majority of the Independent Trustees, determined that approval of the Advisory Agreement and the Sub-Advisory Agreements was in the best interests of each Portfolio. After full consideration of these and other factors, the Board, including a majority of the Independent Trustees, with the assistance of independent legal counsel, approved the Advisory Agreement and the Sub-Advisory Agreement with respect to each Portfolio.
22
Simplify your life…
with MetLife eDelivery® while helping MetLife preserve the planet’s natural resources.
(see details on inside cover)
| | |
Met Investors Series Trust Legg Mason ClearBridge Aggressive Growth Portfolio Semiannual Report | | June 30, 2011, as amended December 16, 2011 |
MET INVESTORS SERIES TRUST
| | |
Legg Mason ClearBridge Aggressive Growth Portfolio | | |
Managed by ClearBridge Advisors, LLC
Portfolio Manager Commentary*
Performance
For the six-month period ended June 30, 2011, the Class A, B, and E shares of the Legg Mason ClearBridge Aggressive Growth Portfolio returned 12.83%, 12.72% and 12.90%, respectively, compared to its benchmark, the Russell 3000 Growth Index1, which returned 6.98%.
Market Environment/Conditions
At the start of the six-month period, the market experienced a relatively minor correction following the turmoil in the Middle East and North Africa and the terrible events in Japan, but we viewed such market pullbacks constructively. We tried to use the volatility to our advantage, building positions where we saw price weakness unrelated to company fundamentals and seizing the opportunity to put cash to work. As in the past, we sought to use the market’s day-to-day activity to build our portfolios for the long term.
At the start of the second quarter, we had a relatively mixed view of the market given generally strong corporate fundamentals and reasonable stock market valuations, which were offset by increasingly bullish sentiment that had grown beyond our comfort levels. While believing that the preconditions for a bear market were not present (i.e., overvalued stocks, sharply contracting monetary policy, market euphoria), we did believe that a health-restoring correction could help to reinvigorate the bull market that had been in place for over two years. Following a rally in April, the market grew more volatile and indeed experienced a short term correction across most segments that we believe helped restore a healthy level of skepticism. Bearish sentiment in general rose as the market was troubled by questions about the durability of the economic recovery, concerns over the events in Greece and the Euro zone, as well as a myriad of other issues including rising oil prices and disruptions caused by the earthquake and tsunami in Japan.
From the start of May until the last two weeks of June, as the market remained focused on the macroeconomic concerns, the S&P 500 Index retreated over 8% before rapidly recovering and producing only a minor net gain for the quarter. For the six months ended June 30, 2011, the broad S&P 500 Index returned 6.02%, while the blue-chip Dow Jones Industrial Average returned 8.59% and the technology-focused Nasdaq Composite Index returned 5.00%.
Portfolio Review/Current Positioning
For the six months ended June 30, 2011, both overall stock selection and overall sector allocation helped the Portfolio’s performance relative to the benchmark. Stock selection in the Health Care, Consumer Discretionary and Industrials sectors helped Portfolio
performance during the six-month period, as did the Portfolio’s overweight positions in the Health Care and Energy sectors and its underweight position in the Information Technology (IT) sector. Stock selection in the Energy, IT and Materials sectors detracted from the Portfolio’s relative performance, as did the Portfolio’s underweight position (no holdings) in the Consumer Staples sector.
In terms of individual holdings, the leading relative contributors to Portfolio performance included Biogen Idec, Inc., UnitedHealth Group, Inc., Valeant Pharmaceuticals International, Inc. (Canada) and Forest Laboratories, Inc. in the Health Care sector and Comcast Corp. in the Consumer Discretionary sector. Leading individual detractors from relative performance included Weatherford International, Ltd. in the Energy sector, and Broadcom Corp., Cree, Inc., SanDisk Corp. and Dolby Laboratories, Inc., all in the IT sector.
During the six month period ended June 30, 2011, the Portfolio added new positions in Human Genome Sciences, Inc. and Immunogen, Inc. in the Health Care sector, and Citrix Systems, Inc., Standard Microsystems Corp. and Advent Software, Inc. in the IT sector. The Portfolio closed out its positions in DSP Group Inc. in the IT sector and Genzyme Corp. in the Health Care sector.
During this period of volatility and below-average economic growth, we find it especially important to identify those businesses that can show solid organic growth in both revenues and earnings. We continue to favor self-financing business models with lots of cash and repetitive and consistent cash flows. We believe that those types of secular growth business models deserve a premium valuation multiple in the market or ultimately will attract interest from third party acquirers. To this end, over the course of the first half of this year our portfolio has seen an acceleration of both corporate merger and acquisition transactions and interest from value-oriented activist shareholders.
While we have repeatedly stated our belief that there is little to no correlation between portfolio turnover rates and investment performance, we find it interesting that much of our recent performance has been driven by stocks that we have held for 5, 10, 15, and in some cases as much as 20 years. We view this as validation of our time-tested investment discipline of a fundamentals-based approach to long-term equity investing.
There were no structural changes to the Portfolio’s discipline or strategy during the reporting period. The Portfolio’s time-tested approach has navigated many volatile markets. We continue to be especially diligent at this time in focusing on the fundamentals of the companies that we hold and reiterating our conviction in continuing to maintain each investment. Our goal continues to be focusing on what we feel are dominant franchises with primarily self-financing business models that are best able to grow earnings/cash flows on a sustainable basis.
Richard Freeman, Senior Portfolio Manager
Evan Bauman, Portfolio Manager
ClearBridge Advisors, LLC
*This commentary may include statements that constitute “forward-looking statements” under the U.S. securities laws. Forward-looking statements include, among other things, projections, estimates, and information about possible or future results related to the Portfolio, market or regulatory developments. The views expressed above are not
1
MET INVESTORS SERIES TRUST
| | |
Legg Mason ClearBridge Aggressive Growth Portfolio | | |
Managed by ClearBridge Advisors, LLC
Portfolio Manager Commentary* (continued)
guarantees of future performance or economic results and involve certain risks, uncertainties and assumptions that could cause actual outcomes and results to differ materially from the views expressed herein. The views expressed above are subject to change at any time based upon economic, market, or other conditions and the subadvisory firm undertakes no obligation to update the views expressed herein. Any discussions of specific securities should not be considered a recommendation to buy or sell those securities. The views expressed above (including any forward-looking statement) may not be relied upon as investment advice or as an indication of the Portfolio’s trading intent. Information about the Portfolio’s holdings, asset allocation or country diversification is historical and is not an indication of future Portfolio composition, which may vary. Direct investment in any index is not possible. The performance of any index mentioned in this commentary has not been adjusted for ongoing management, distribution and operating expenses, and sales charges applicable to mutual fund investments. In addition, the returns do not reflect additional fees charged by separate accounts or variable insurance contracts that an investor in the Portfolio may pay. If these additional fees were reflected, performance would have been lower.
Portfolio Composition as of June 30, 2011
Top Holdings
| | | | |
| | |
% of
Net Assets | |
Biogen Idec, Inc. | | | 9.1 | |
UnitedHealth Group, Inc. | | | 8.5 | |
Anadarko Petroleum Corp. | | | 7.6 | |
Weatherford International, Ltd. | | | 5.2 | |
Comcast Corp. - Special Class A | | | 4.8 | |
Amgen, Inc. | | | 4.7 | |
Cablevision Systems Corp. - Class A | | | 4.7 | |
Forest Laboratories, Inc. | | | 4.1 | |
Core Laboratories N.V. | | | 3.3 | |
Valeant Pharmaceuticals International, Inc. | | | 2.6 | |
Top Sectors
| | | | |
| | | % of
Market Value of
Total Investments | |
Non-Cyclical | | | 35.0 | |
Energy | | | 18.5 | |
Communications | | | 17.4 | |
Industrials | | | 10.1 | |
Technology | | | 10.0 | |
Cash & Equivalent | | | 6.4 | |
Basic Materials | | | 1.6 | |
Cyclical | | | 1.0 | |
2
MET INVESTORS SERIES TRUST
| | |
Legg Mason ClearBridge Aggressive Growth Portfolio | | |
Legg Mason ClearBridge Aggressive Growth Portfolio managed by
ClearBridge Advisors, LLC vs. Russell 3000 Growth Index1
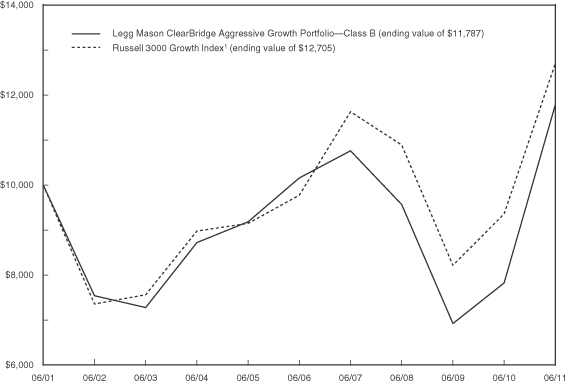
| | | | | | | | | | | | | | | | | | | | |
| | | Average Annual Return2 (for the six months ended June 30, 2011) | |
| | | 6 Month | | | 1 Year | | | 5 Year | | | 10 Year | | | Since
Inception3 | |
| Legg Mason ClearBridge Aggressive Growth Portfolio—Class A | | | 12.83% | | | | 51.04% | | | | 3.27% | | | | — | | | | 3.20% | |
| Class B | | | 12.72% | | | | 50.63% | | | | 3.03% | | | | 1.66% | | | | — | |
| Class E | | | 12.90% | | | | 50.81% | | | | 3.15% | | | | — | | | | 7.03% | |
| Russell 3000 Growth Index1 | | | 6.98% | | | | 35.68% | | | | 5.36% | | | | 2.43% | | | | — | |
The performance of Class B shares, as set forth in the line graph above, will differ from that of the other classes because of the difference in expenses paid by policyholders investing in the different share classes.
1 The Russell 3000 Growth Index is an unmanaged measure of performance of those Russell 3000 Index companies with higher price-to-book ratios and higher forecasted growth values.
2 “Average Annual Return” is calculated including reinvestment of all income dividends and capital gain distributions.
3 Inception of Class A shares is 1/2/02. Inception of Class B shares is 2/12/01. Inception of Class E shares is 4/17/03. Index returns are based on an inception date of 2/12/01.
Past performance does not guarantee future results. The investment return and principal value of an investment in the Portfolio will fluctuate, so that shares, on any given day or when redeemed, may be worth more or less than their original cost. Performance numbers are net of all Portfolio expenses but do not include any insurance, sales, or administration charges of variable annuity or life insurance contracts. If these charges were included, the returns would be lower. The Index does not include fees or expenses and is not available for direct investment.
3
MET INVESTORS SERIES TRUST
| | |
Legg Mason ClearBridge Aggressive Growth Portfolio | | |
Understanding Your Portfolio’s Expenses
Shareholder Expense Example
As a shareholder of the Portfolio, you incur ongoing costs, including management fees; distribution and service (12b-1) fees; and other Portfolio expenses. This example is intended to help you understand your ongoing costs (in dollars) (referred to as “expenses”) of investing in the Portfolio and compare these costs with the ongoing costs of investing in other mutual funds. The example is based on an investment of $1,000 invested at the beginning of the period and held for the entire period, January 1, 2011 through June 30, 2011.
Actual Expenses
The first line for each share class of the Portfolio in the table below provides information about actual account values and actual expenses. You may use the information in this line, together with the amount you invested in the particular share class of the Portfolio, to estimate the expenses that you paid over the period. Simply divide your account value by $1,000 (for example, an $8,600 account value divided by $1,000 = 8.6), then multiply the result by the number in the first line under the heading entitled “Expenses Paid During Period” to estimate the expenses you paid on your account during this period.
Hypothetical Example for Comparison Purposes
The second line for each share class of the Portfolio in the table below provides information about hypothetical account values and hypothetical expenses based on the Portfolio’s actual expense ratio and an assumed rate of return of 5% per year before expenses, which is not the Portfolio’s actual return. The hypothetical account values and expenses may not be used to estimate the actual ending account balance or expenses you paid for the period. You may use this information to compare the ongoing costs of investing in the Portfolio and other funds. To do so, compare this 5% hypothetical example with the 5% hypothetical examples that appear in the shareholder reports of the other funds.
Please note that the expenses shown in the table are meant to highlight your ongoing costs only and do not reflect any fees or charges of your variable insurance product or any additional expenses that participants in certain eligible qualified plans may bear relating to the operations of their plan. Therefore, the second line for each share class in the table is useful in comparing ongoing costs only, and will not help you determine the relative total costs of owning different funds. In addition, if these other costs were included, your costs would have been higher.
| | | | | | | | | | | | | | | | |
| | | Annualized
Expense
Ratio | | | Beginning
Account Value
January 1, 2011 | | | Ending
Account Value
June 30, 2011 | | | Expenses Paid
During Period**
January 1, 2011
to June 30, 2011 | |
| | | | | | | | | | | | | | | | |
| | | | |
| | | | | | | | | | | | | | | | |
Class A | | | | | | | | | | | | | | | | |
Actual | | | 0.65% | | | $ | 1,000.00 | | | $ | 1,128.30 | | | $ | 3.43 | |
Hypothetical* | | | 0.65% | | | | 1,000.00 | | | | 1,021.57 | | | | 3.26 | |
| | | | | | | | | | | | | | | | |
| | | | |
| | | | | | | | | | | | | | | | |
Class B | | | | | | | | | | | | | | | | |
Actual | | | 0.90% | | | $ | 1,000.00 | | | $ | 1,127.20 | | | $ | 4.25 | |
Hypothetical* | | | 0.90% | | | | 1,000.00 | | | | 1,020.33 | | | | 4.51 | |
| | | | | | | | | | | | | | | | |
| | | | |
| | | | | | | | | | | | | | | | |
Class E | | | | | | | | | | | | | | | | |
Actual | | | 0.80% | | | $ | 1,000.00 | | | $ | 1,129.00 | | | $ | 4.22 | |
Hypothetical* | | | 0.80% | | | | 1,000.00 | | | | 1,020.83 | | | | 4.01 | |
| | | | | | | | | | | | | | | | |
* Hypothetical assumes a rate of return of 5% per year before expenses.
** Expenses paid are equal to the Portfolio’s annualized expense ratio for the most recent six month period, as shown above, multiplied by the average account value over the period, multiplied by the number of days (181 days) in the most recent fiscal half-year, divided by 365 (to reflect the one-half year period).
4
MET INVESTORS SERIES TRUST
| | |
Legg Mason ClearBridge Aggressive Growth Portfolio | | |
Schedule of Investments as of June 30, 2011 (Unaudited)
Common Stocks—93.6% of Net Assets
| | | | | | | | |
| Security Description | | Shares | | | Value | |
| | | | | | | | |
| | |
| Aerospace & Defense—2.5% | | | | | | | | |
L-3 Communications Holdings, Inc. (a) | | | 329,800 | | | $ | 28,841,010 | |
| | | | | | | | |
| | |
| Biotechnology—16.6% | | | | | | | | |
Amgen, Inc.* | | | 950,700 | | | | 55,473,345 | |
Biogen Idec, Inc.* | | | 992,700 | | | | 106,139,484 | |
BioMimetic Therapeutics, Inc.* (a) | | | 229,340 | | | | 1,174,221 | |
Human Genome Sciences, Inc.* (a) | | | 390,770 | | | | 9,589,496 | |
ImmunoGen, Inc.* (a) | | | 192,900 | | | | 2,351,451 | |
Isis Pharmaceuticals, Inc.* (a) | | | 188,435 | | | | 1,726,064 | |
Vertex Pharmaceuticals, Inc.* | | | 350,172 | | | | 18,205,442 | |
| | | | | | | | |
| | | | | | | 194,659,503 | |
| | | | | | | | |
| | |
| Communications Equipment—0.5% | | | | | | | | |
Arris Group, Inc.* (a) | | | 122,915 | | | | 1,427,043 | |
Nokia Oyj (ADR) (a) | | | 744,900 | | | | 4,782,258 | |
| | | | | | | | |
| | | | | | | 6,209,301 | |
| | | | | | | | |
| | |
| Computers & Peripherals—3.5% | | | | | | | | |
SanDisk Corp.* | | | 645,090 | | | | 26,771,235 | |
Seagate Technology plc | | | 863,300 | | | | 13,950,928 | |
| | | | | | | | |
| | | | | | | 40,722,163 | |
| | | | | | | | |
| | |
| Construction & Engineering—0.7% | | | | | | | | |
Fluor Corp. | | | 134,910 | | | | 8,723,281 | |
| | | | | | | | |
|
| Electronic Equipment, Instruments & Components—2.3% | |
Dolby Laboratories, Inc.—
Class A* (a) | | | 130,000 | | | | 5,519,800 | |
TE Connectivity, Ltd. | | | 589,325 | | | | 21,663,587 | |
| | | | | | | | |
| | | | | | | 27,183,387 | |
| | | | | | | | |
| |
| Energy Equipment & Services—10.9% | | | | | |
Core Laboratories N.V. | | | 350,000 | | | | 39,039,000 | |
National Oilwell Varco, Inc. | | | 367,778 | | | | 28,763,917 | |
Weatherford International, Ltd.* | | | 3,222,500 | | | | 60,421,875 | |
| | | | | | | | |
| | | | | | | 128,224,792 | |
| | | | | | | | |
| |
| Health Care Equipment & Supplies—2.5% | | | | | |
Covidien plc | | | 549,825 | | | | 29,267,185 | |
| | | | | | | | |
| |
| Health Care Providers & Services—8.5% | | | | | |
UnitedHealth Group, Inc. | | | 1,939,700 | | | | 100,049,726 | |
| | | | | | | | |
| | |
| Industrial Conglomerates—2.5% | | | | | | | | |
Tyco International, Ltd. | | | 589,325 | | | | 29,130,335 | |
| | | | | | | | |
| | | | | | | | |
| | |
| Internet & Catalog Retail—1.2% | | | | | | | | |
Liberty Media Corp.—Interactive—lass A* | | | 854,200 | | | $ | 14,324,934 | |
| | | | | | | | |
| | |
| Machinery—2.1% | | | | | | | | |
Pall Corp. | | | 430,000 | | | | 24,178,900 | |
| | | | | | | | |
| | |
| Media—16.7% | | | | | | | | |
Cablevision Systems Corp.—Class A | | | 1,512,500 | | | | 54,767,625 | |
CBS Corp. | | | 162,600 | | | | 4,632,474 | |
Comcast Corp.—Class A | | | 392,000 | | | | 9,933,280 | |
Comcast Corp.—Special Class A | | | 2,315,600 | | | | 56,106,988 | |
DIRECTV—Class A* | | | 485,575 | | | | 24,676,921 | |
Liberty Global, Inc.—Class A* | | | 139,200 | | | | 6,269,568 | |
Liberty Media Corp.—Capital, Series A* | | | 161,600 | | | | 13,857,200 | |
Liberty Media-Starz, Series A* | | | 70,690 | | | | 5,318,716 | |
Madison Square Garden, Inc. (The)—Class A* (a) | | | 412,850 | | | | 11,365,761 | |
Viacom, Inc.—Class B | | | 159,900 | | | | 8,154,900 | |
| | | | | | | | |
| | | | | | | 195,083,433 | |
| | | | | | | | |
| | |
| Metals & Mining—1.6% | | | | | | | | |
Freeport-McMoRan Copper & Gold, Inc. | | | 248,700 | | | | 13,156,230 | |
Nucor Corp. | | | 126,500 | | | | 5,214,330 | |
| | | | | | | | |
| | | | | | | 18,370,560 | |
| | | | | | | | |
| |
| Oil, Gas & Consumable Fuels—7.6% | | | | | |
Anadarko Petroleum Corp. | | | 1,159,960 | | | | 89,038,530 | |
| | | | | | | | |
| | |
| Pharmaceuticals—7.3% | | | | | | | | |
Forest Laboratories, Inc.* (a) | | | 1,226,200 | | | | 48,238,708 | |
Teva Pharmaceutical Industries, Ltd. (ADR) | | | 144,600 | | | | 6,972,612 | |
Valeant Pharmaceuticals International, Inc. (a) | | | 586,870 | | | | 30,493,765 | |
| | | | | | | | |
| | | | | | | 85,705,085 | |
| | | | | | | | |
|
| Semiconductors & Semiconductor Equipment—4.7% | |
Broadcom Corp.—Class A | | | 772,445 | | | | 25,985,050 | |
Cirrus Logic, Inc.* (a) | | | 171,400 | | | | 2,725,260 | |
Cree, Inc.* (a) | | | 295,400 | | | | 9,922,486 | |
Intel Corp. | | | 579,648 | | | | 12,844,999 | |
Standard Microsystems Corp.* (a) | | | 137,800 | | | | 3,719,222 | |
| | | | | | | | |
| | | | | | | 55,197,017 | |
| | | | | | | | |
See accompanying notes to financial statements.
5
MET INVESTORS SERIES TRUST
| | |
Legg Mason ClearBridge Aggressive Growth Portfolio | | |
Schedule of Investments as of June 30, 2011 (Unaudited)
Common Stock—(Continued)
| | | | | | | | |
| Security Description | | Shares/Par
Amount | | | Value | |
| | | | | | | | |
| | |
| Software—1.8% | | | | | | | | |
Advent Software, Inc.* (a) | | | 8,700 | | | $ | 245,079 | |
Autodesk, Inc.* | | | 307,500 | | | | 11,869,500 | |
Citrix Systems, Inc.* | | | 114,300 | | | | 9,144,000 | |
| | | | | | | | |
| | | | | | | 21,258,579 | |
| | | | | | | | |
| | |
| Specialty Retail—0.1% | | | | | | | | |
Charming Shoppes, Inc.* (a) | | | 177,100 | | | | 736,736 | |
| | | | | | | | |
Total Common Stocks
(Cost $874,094,434) | | | | | | | 1,096,904,457 | |
| | | | | | | | |
|
| Short-Term Investments—13.9% | |
| | |
| Mutual Funds—7.5% | | | | | | | | |
State Street Navigator Securities Lending Prime Portfolio (b) | | | 87,191,639 | | | | 87,191,639 | |
| | | | | | | | |
| | |
| Repurchase Agreement—6.4% | | | | | | | | |
Fixed Income Clearing Corp. Repurchase Agreement dated 06/30/11 at 0.010% to be repurchased at $74,978,021 on 07/01/11 collateralized by $77,455,000 Federal Home Loan Bank at 4.250% due 02/26/29 with a value of $76,477,784. | | $ | 74,978,000 | | | | 74,978,000 | |
| | | | | | | | |
Total Short-Term Investments
(Cost $162,169,639) | | | | | | | 162,169,639 | |
| | | | | | | | |
Total Investments—107.5%
(Cost $1,036,264,073#) | | | | | | | 1,259,074,096 | |
Other Assets and Liabilities (net)—(7.5)% | | | | | | | (87,364,429 | ) |
| | | | | | | | |
| Net Assets—100.0% | | | | | | $ | 1,171,709,667 | |
| | | | | | | | |
| * | Non-income producing security. |
| # | As of June 30, 2011, the aggregate cost of investments for federal income tax purposes was $1,036,264,073. The aggregate unrealized appreciation and depreciation of investments were $249,589,486 and $(26,779,463), respectively, resulting in net unrealized appreciation of $222,810,023 for federal income tax purposes. |
| (a) | All or a portion of the security was on loan. As of June 30, 2011, the market value of securities loaned was $85,321,503 and the collateral received consisted of cash in the amount of $87,191,639 and non-cash collateral with a value of $167,102. The cash collateral is invested in a money market fund managed by an affiliate of the custodian. The non-cash collateral received consists primarily of government securities and bank letters of credit, and are held for the benefit of the Portfolio at the Portfolio’s custodian. The Portfolio cannot repledge or resell this collateral. As such, this collateral is excluded from the Statement of Assets and Liabilities. |
| (b) | Represents investment of cash collateral received from securities lending transactions. |
| ADR— | An American Depositary Receipt is a certificate issued by a custodian bank representing the right to receive securities of the foreign issuer described. Trading on exchanges not located in the United States or Canada significantly influences the value of ADRs. |
See accompanying notes to financial statements.
6
MET INVESTORS SERIES TRUST
| | |
Legg Mason ClearBridge Aggressive Growth Portfolio | | |
Schedule of Investments as of June 30, 2011 (Unaudited)
FAIR VALUE HIERARCHY
Accounting principles generally accepted in the United States of America (“GAAP”) defines fair market value as the price that the Portfolio would receive to sell an asset or pay to transfer a liability in an orderly transaction between market participants at the measurement date. It establishes a fair value hierarchy that prioritizes inputs to valuation methods and requires disclosure of the fair value hierarchy that segregates fair value measurements into three levels. Levels 1, 2 and 3 of the fair value hierarchy are defined as follows:
Level 1 - unadjusted quoted prices in active markets for identical investments
Level 2 - other significant observable inputs (including, but not limited to, unadjusted quoted prices for similar investments in markets that are either active or inactive; inputs other than quoted prices that are observable such as interest rates, yield curves, volatilities, prepayment speeds, loss severities, credit risks, default rates, etc.)
Level 3 - significant unobservable inputs based on the best information available in the circumstances, to the extent observable inputs are unavailable (including the Portfolio’s own assumptions in determining the fair value of investments)
The inputs or methodologies used for valuing investments are not necessarily an indication of the risk associated with investing in them. For a change in the methodology used, transfers between levels will be recognized as of the beginning of the reporting period. Information on transfers between Level 1 and Level 2 deemed significant, if any, will be disclosed following the valuation table below. For the six months ended June 30, 2011, there were no transfers between Levels 1 and 2. A reconciliation of Level 3 securities, if any, will also be disclosed following the valuation table. For more information about the Portfolio’s policy regarding the valuation of investments, please refer to the Notes to Financial Statements.
The following table summarizes the fair value hierarchy of the Portfolio’s investments as of June 30, 2011:
| | | | | | | | | | | | | | | | |
| Description | | Level 1 | | | Level 2 | | | Level 3 | | | Total | |
Total Common Stocks* | | $ | 1,096,904,457 | | | $ | — | | | $ | — | | | $ | 1,096,904,457 | |
Short-Term Investments | | | | | | | | | | | | | | | | |
Mutual Funds | | | 87,191,639 | | | | — | | | | — | | | | 87,191,639 | |
Repurchase Agreement | | | — | | | | 74,978,000 | | | | — | | | | 74,978,000 | |
Total Short-Term Investments | | | 87,191,639 | | | | 74,978,000 | | | | — | | | | 162,169,639 | |
Total Investments | | $ | 1,184,096,096 | | | $ | 74,978,000 | | | $ | — | | | $ | 1,259,074,096 | |
| | | | | | | | | | | | | | | | | |
| * | See Schedule of Investments for additional detailed categorizations. |
See accompanying notes to financial statements.
7
MET INVESTORS SERIES TRUST
| | |
Legg Mason ClearBridge Aggressive Growth Portfolio | | |
Statement of Assets and Liabilities
June 30, 2011 (Unaudited)
| | | | |
| Assets | | | | |
Investments at value (a)(b) | | $ | 1,184,096,096 | |
Repurchase Agreement | | | 74,978,000 | |
Cash | | | 506 | |
Receivable for shares sold | | | 1,375,170 | |
Dividends receivable | | | 150,692 | |
| | | | |
Total assets | | | 1,260,600,464 | |
| | | | |
| Liabilities | | | | |
Payables for: | | | | |
Investments purchased | | | 335,362 | |
Shares redeemed | | | 487,959 | |
Collateral for securities loaned | | | 87,191,639 | |
Accrued Expenses: | | | | |
Management fees | | | 571,630 | |
Distribution and service fees - Class B | | | 86,026 | |
Distribution and service fees - Class E | | | 2,351 | |
Administration fees | | | 5,228 | |
Custodian and accounting fees | | | 2,294 | |
Deferred trustees’ fees | | | 43,094 | |
Other expenses | | | 165,214 | |
| | | | |
Total liabilities | | | 88,890,797 | |
| | | | |
| Net Assets | | $ | 1,171,709,667 | |
| | | | |
| Net Assets Represented by | | | | |
Paid in surplus | | $ | 1,142,027,199 | |
Accumulated net realized loss | | | (193,685,886 | ) |
Unrealized appreciation on investments | | | 222,810,023 | |
Undistributed net investment income | | | 558,331 | |
| | | | |
Net Assets | | $ | 1,171,709,667 | |
| | | | |
| Net Assets | | | | |
Class A | | $ | 717,900,435 | |
Class B | | | 434,241,772 | |
Class E | | | 19,567,460 | |
| Capital Shares Outstanding* | | | | |
Class A | | | 84,331,272 | |
Class B | | | 52,128,306 | |
Class E | | | 2,329,660 | |
| Net Asset Value, Offering Price and Redemption Price Per Share | | | | |
Class A | | $ | 8.51 | |
Class B | | | 8.33 | |
Class E | | | 8.40 | |
| (a) | | Identified cost of investments, excluding repurchase agreement, was $961,286,073. |
| (b) | | Includes securities loaned at value of $85,321,503. |
Statement of Operations
Six Months Ended June 30, 2011 (Unaudited)
| | | | |
| Investment Income | | | | |
Dividends (a) | | $ | 3,742,721 | |
Interest (b) | | | 71,291 | |
| | | | |
Total investment income | | | 3,814,012 | |
| | | | |
| Expenses | | | | |
Management fees | | | 2,927,191 | |
Administration fees | | | 24,807 | |
Custodian and accounting fees | | | 26,932 | |
Distribution and service fees - Class B | | | 365,379 | |
Distribution and service fees - Class E | | | 6,688 | |
Audit and tax services | | | 15,710 | |
Legal | | | 21,644 | |
Trustees’ fees and expenses | | | 15,868 | |
Shareholder reporting | | | 30,902 | |
Insurance | | | 2,210 | |
Miscellaneous | | | 4,904 | |
| | | | |
Total expenses | | | 3,442,235 | |
Less broker commission recapture | | | (16,906 | ) |
| | | | |
Net expenses | | | 3,425,329 | |
| | | | |
Net investment income | | | 388,683 | |
| | | | |
| Net Realized and Unrealized Gain (Loss) on Investments Transactions | | | | |
Net realized gain on investments | | | 6,868,853 | |
| | | | |
Net change in unrealized appreciation on investments | | | 95,942,110 | |
| | | | |
Net realized and unrealized gain on investments | | | 102,810,963 | |
| | | | |
| Net Increase in Net Assets from Operations | | $ | 103,199,646 | |
| | | | |
| (a) | | Net of foreign withholding taxes of $62,194. |
| (b) | | Includes net income on securities loaned of $68,564. |
See accompanying notes to financial statements.
8
MET INVESTORS SERIES TRUST
| | |
Legg Mason ClearBridge Aggressive Growth Portfolio | | |
Statements of Changes in Net Assets
June 30, 2011
| | | | | | | | |
| | | Six Months Ended
June 30, 2011
(Unaudited) | | | Year Ended
December 31,
2010 | |
| Increase (Decrease) in Net Assets: | | | | | | | | |
| Operations | | | | | | | | |
Net investment income | | $ | 388,683 | | | $ | 862,170 | |
Net realized gain (loss) on investments | | | 6,868,853 | | | | (13,920,384 | ) |
Net change in unrealized appreciation on investments | | | 95,942,110 | | | | 160,944,316 | |
| | | | | | | | |
Net increase in net assets resulting from operations | | | 103,199,646 | | | | 147,886,102 | |
| | | | | | | | |
| Distributions to Shareholders | | | | | | | | |
From net investment income | | | | | | | | |
Class A | | | (664,432 | ) | | | (319,182 | ) |
| | | | | | | | |
Net decrease in net assets resulting from distributions | | | (664,432 | ) | | | (319,182 | ) |
| | | | | | | | |
Net increase (Decrease) in net assets from capital share transactions | | | 283,249,879 | | | | (11,558,923 | ) |
| | | | | | | | |
| Net Increase in Net Assets | | | 385,785,093 | | | | 136,007,997 | |
Net assets at beginning of period | | | 785,924,574 | | | | 649,916,577 | |
| | | | | | | | |
Net assets at end of period | | $ | 1,171,709,667 | | | $ | 785,924,574 | |
| | | | | | | | |
Undistributed net investment income at end of period | | $ | 558,331 | | | $ | 834,080 | |
| | | | | | | | |
| | | | | | | | | | | | | | | | |
| Other Information: | | | | | | | | | | | | | | | | |
| Capital Shares | | | | | | | | | | | | | | | | |
| | | | |
Transactions in capital shares were as follows: | | | | | | | | | | | | | | | | |
| | | Six Months Ended
June 30, 2011
(Unaudited) | | | Year Ended
December 31,
2010 | |
| | | Shares | | | Value | | | Shares | | | Value | |
| Class A | | | | | | | | | | | | | | | | |
Sales | | | 21,995,906 | | | $ | 185,279,028 | | | | 5,496,033 | | | $ | 36,330,148 | |
Shares issued through acquisition | | | 2,902,620 | | | | 24,730,316 | | | | — | | | | — | |
Reinvestments | | | 80,245 | | | | 664,432 | | | | 48,288 | | | | 319,182 | |
Redemptions | | | (18,153,218 | ) | | | (152,277,990 | ) | | | (9,138,460 | ) | | | (55,944,200 | ) |
| | | | | | | | | | | | | | | | |
Net increase (decrease) | | | 6,825,553 | | | $ | 58,395,786 | | | | (3,594,139 | ) | | $ | (19,294,870 | ) |
| | | | | | | | | | | | | | | | |
| Class B | | | | | | | | | | | | | | | | |
Sales | | | 9,238,394 | | | $ | 72,563,490 | | | | 6,405,914 | | | $ | 41,621,647 | |
Shares issued through acquisition | | | 20,821,320 | | | | 173,649,815 | | | | — | | | | — | |
Redemptions | | | (4,647,748 | ) | | | (37,236,106 | ) | | | (5,296,420 | ) | | | (33,509,757 | ) |
| | | | | | | | | | | | | | | | |
Net increase | | | 25,411,966 | | | $ | 208,977,199 | | | | 1,109,494 | | | $ | 8,111,890 | |
| | | | | | | | | | | | | | | | |
| Class E | | | | | | | | | | | | | | | | |
Sales | | | 783,487 | | | $ | 6,520,754 | | | | 128,535 | | | $ | 832,931 | |
Shares issued through acquisition | | | 1,320,788 | | | | 11,107,831 | | | | — | | | | — | |
Redemptions | | | (217,104 | ) | | | (1,751,691 | ) | | | (190,994 | ) | | | (1,208,874 | ) |
| | | | | | | | | | | | | | | | |
Net increase (decrease) | | | 1,887,171 | | | $ | 15,876,894 | | | | (62,459 | ) | | $ | (375,943 | ) |
| | | | | | | | | | | | | | | | |
Increase (decrease) derived from capital shares transactions | | | | | | $ | 283,249,879 | | | | | | | $ | (11,558,923 | ) |
| | | | | | | | | | | | | | | | |
See accompanying notes to financial statements.
9
MET INVESTORS SERIES TRUST
| | |
Legg Mason ClearBridge Aggressive Growth Portfolio | | |
Financial Highlights
| | | | | | | | | | | | | | | | | | | | | | | | |
| Selected per share data | | | | | | | | | | | | | | | | | | |
| | | Class A | |
| | | Six Months Ended
June 30, 2011
(Unaudited) | | | Year Ended December 31, | |
| | | | 2010 | | | 2009 | | | 2008 | | | 2007 | | | 2006 | |
| Net Asset Value, Beginning of Period | | $ | 7.55 | | | $ | 6.09 | | | $ | 4.57 | | | $ | 7.54 | | | $ | 8.09 | | | $ | 8.70 | |
| | | | | | | | | | | | | | | | | | | | | | | | |
| Income (Loss) from Investment Operations: | | | | | | | | | | | | | | | | | | | | | | | | |
Net Investment Income(a) | | | 0.01 | | | | 0.01 | | | | 0.00 | + | | | 0.01 | | | | 0.01 | | | | 0.03 | |
Net Realized and Unrealized Gain (loss) on Investments | | | 0.96 | | | | 1.45 | | | | 1.53 | | | | (2.93 | ) | | | 0.22 | | | | (0.14 | ) |
| | | | | | | | | | | | | | | | | | | | | | | | |
Total From Investment Operations | | | 0.97 | | | | 1.46 | | | | 1.53 | | | | (2.92 | ) | | | 0.23 | | | | (0.11 | ) |
| | | | | | | | | | | | | | | | | | | | | | | | |
| Less Distributions | | | | | | | | | | | | | | | | | | | | | | | | |
Distributions from Net Investment Income | | | (0.01 | ) | | | (0.00 | )++ | | | (0.01 | ) | | | (0.00 | )++ | | | (0.02 | ) | | | — | |
Distributions from Net Realized Capital Gains | | | — | | | | — | | | | — | | | | (0.05 | ) | | | (0.76 | ) | | | (0.50 | ) |
| | | | | | | | | | | | | | | | | | | | | | | | |
Total Distributions | | | (0.01 | ) | | | (0.00 | )++ | | | (0.01 | ) | | | (0.05 | ) | | | (0.78 | ) | | | (0.50 | ) |
| | | | | | | | | | | | | | | | | | | | | | | | |
| Net Asset Value, End of Period | | $ | 8.51 | | | $ | 7.55 | | | $ | 6.09 | | | $ | 4.57 | | | $ | 7.54 | | | $ | 8.09 | |
| | | | | | | | | | | | | | | | | | | | | | | | |
| Total Return (%) | | | 12.83 | | | | 24.05 | | | | 33.45 | | | | (38.95 | ) | | | 2.60 | | | | (1.60 | ) |
| Ratios/Supplemental Data | | | | | | | | | | | | | | | | | | | | | | | | |
Ratio of Expenses to Average Net Assets (%) | | | 0.65 | * | | | 0.68 | | | | 0.67 | | | | 0.65 | | | | 0.67 | | | | 0.75 | |
Ratio of Net Expenses to Average Net Assets (%)(b) | | | 0.65 | * | | | 0.68 | | | | 0.67 | | | | 0.65 | | | | 0.67 | | | | 0.73 | |
Ratio of Net Investment Income to Average Net Assets (%) | | | 0.15 | * | | | 0.19 | | | | 0.11 | | | | 0.13 | | | | 0.07 | | | | 0.33 | |
Portfolio Turnover Rate (%) | | | 5.9 | | | | 1.1 | | | | 2.5 | | | | 6.2 | | | | 0.7 | | | | 190.3 | |
Net Assets, End of Period (in millions) | | $ | 717.9 | | | $ | 585.2 | | | $ | 493.9 | | | $ | 580.9 | | | $ | 874.6 | | | $ | 607.7 | |
| |
| | | Class B | |
| | | Six Months Ended
June 30, 2011
(Unaudited) | | | Year Ended December 31, | |
| | | | 2010 | | | 2009 | | | 2008 | | | 2007 | | | 2006 | |
| Net Asset Value, Beginning of Period | | $ | 7.39 | | | $ | 5.97 | | | $ | 4.49 | | | $ | 7.42 | | | $ | 7.98 | | | $ | 8.60 | |
| | | | | | | | | | | | | | | | | | | | | | | | |
| Income (Loss) from Investment Operations: | | | | | | | | | | | | | | | | | | | | | | | | |
Net Investment Income (Loss)(a) | | | (0.00 | ) + | | | 0.00 | + | | | (0.01 | ) | | | (0.01 | ) | | | (0.01 | ) | | | 0.01 | |
Net Realized and Unrealized Gain (Loss) on Investments | | | 0.94 | | | | 1.42 | | | | 1.49 | | | | (2.87 | ) | | | 0.21 | | | | (0.13 | ) |
| | | | | | | | | | | | | | | | | | | | | | | | |
Total From Investment Operations | | | 0.94 | | | | 1.42 | | | | 1.48 | | | | (2.88 | ) | | | 0.20 | | | | (0.12 | ) |
| | | | | | | | | | | | | | | | | | | | | | | | |
| Less Distributions | | | | | | | | | | | | | | | | | | | | | | | | |
Distributions from Net Realized Capital Gains | | | — | | | | — | | | | — | | | | (0.05 | ) | | | (0.76 | ) | | | (0.50 | ) |
| | | | | | | | | | | | | | | | | | | | | | | | |
Total Distributions | | | — | | | | — | | | | — | | | | (0.05 | ) | | | (0.76 | ) | | | (0.50 | ) |
| | | | | | | | | | | | | | | | | | | | | | | | |
| Net Asset Value, End of Period | | $ | 8.33 | | | $ | 7.39 | | | $ | 5.97 | | | $ | 4.49 | | | $ | 7.42 | | | $ | 7.98 | |
| | | | | | | | | | | | | | | | | | | | | | | | |
| Total Return (%) | | | 12.72 | | | | 23.79 | | | | 32.96 | | | | (39.05 | ) | | | 2.27 | | | | (1.74 | ) |
| | | | | | |
| Ratios/Supplemental Data | | | | | | | | | | | | | | | | | | | | | | | | |
Ratio of Expenses to Average Net Assets (%) | | | 0.90 | * | | | 0.93 | | | | 0.92 | | | | 0.90 | | | | 0.92 | | | | 1.00 | |
Ratio of Net Expenses to Average Net Assets (%)(b) | | | 0.90 | * | | | 0.93 | | | | 0.92 | | | | 0.90 | | | | 0.92 | | | | 0.98 | |
Ratio of Net Investment Income (Loss) to Average Net Assets (%) | | | (0.07 | )* | | | (0.06 | ) | | | (0.16 | ) | | | (0.13 | ) | | | (0.18 | ) | | | 0.10 | |
Portfolio Turnover Rate (%) | | | 5.9 | | | | 1.1 | | | | 2.5 | | | | 6.2 | | | | 0.7 | | | | 190.3 | |
Net Assets, End of Period (in millions) | | $ | 434.20 | | | $ | 197.5 | | | $ | 152.9 | | | $ | 120.4 | | | $ | 222.3 | | | $ | 254.0 | |
Please see following page for Financial Highlights footnote legend.
See accompanying notes to financial statements.
10
MET INVESTORS SERIES TRUST
|
Legg Mason ClearBridge Aggressive Growth Portfolio |
Financial Highlights
| | | | | | | | | | | | | | | | | | | | | | | | |
| Selected per share data | | | | | | | | | | | | | | | | | | |
| | | Class E | |
| | | Six Months Ended
June 30, 2011
(Unaudited) | | | Year Ended December 31, | |
| | | | 2010 | | | 2009 | | | 2008 | | | 2007 | | | 2006 | |
| Net Asset Value, Beginning of Period | | $ | 7.44 | | | $ | 6.01 | | | $ | 4.51 | | | $ | 7.45 | | | $ | 8.01 | | | $ | 8.62 | |
| | | | | | | | | | | | | | | | | | | | | | | | |
| Income (Loss) from Investment Operations | | | | | | | | | | | | | | | | | | | | | | | | |
Net Investment Income (Loss)(a) | | | 0.00 | + | | | 0.00 | + | | | (0.00 | )+ | | | (0.00 | )+ | | | (0.01 | ) | | | 0.02 | |
Net Realized and Unrealized Gain (Loss) on Investments | | | 0.96 | | | | 1.43 | | | | 1.50 | | | | (2.89 | ) | | | 0.21 | | | | (0.13 | ) |
| | | | | | | | | | | | | | | | | | | | | | | | |
Total From Investment Operations | | | 0.96 | | | | 1.43 | | | | 1.50 | | | | (2.89 | ) | | | 0.20 | | | | (0.11 | ) |
| | | | | | | | | | | | | | | | | | | | | | | | |
| Less Distributions | | | | | | | | | | | | | | | | | | | | | | | | |
Distributions from Net Investment Income | | | — | | | | — | | | | — | | | | — | | | | (0.00 | )++ | | | — | |
Distributions from Net Realized Capital Gains | | | — | | | | — | | | | — | | | | (0.05 | ) | | | (0.76 | ) | | | (0.50 | ) |
| | | | | | | | | | | | | | | | | | | | | | | | |
Total Distributions | | | — | | | | — | | | | — | | | | (0.05 | ) | | | (0.76 | ) | | | (0.50 | ) |
| | | | | | | | | | | | | | | | | | | | | | | | |
| Net Asset Value, End of Period | | $ | 8.40 | | | $ | 7.44 | | | $ | 6.01 | | | $ | 4.51 | | | $ | 7.45 | | | $ | 8.01 | |
| | | | | | | | | | | | | | | | | | | | | | | | |
| Total Return (%) | | | 12.90 | | | | 23.79 | | | | 33.26 | | | | (39.03 | ) | | | 2.32 | | | | (1.61 | ) |
| | | | | | |
| Ratios/Supplemental Data | | | | | | | | | | | | | | | | | | | | | | | | |
Ratio of Expenses to Average Net Assets (%) | | | 0.80 | * | | | 0.83 | | | | 0.82 | | | | 0.80 | | | | 0.82 | | | | 0.90 | |
Ratio of Net Expenses to Average Net Assets (%)(b) | | | 0.80 | * | | | 0.83 | | | | 0.82 | | | | 0.80 | | | | 0.82 | | | | 0.88 | |
Ratio of Net Investment Income (loss) to Average Net Assets (%) | | | 0.09 | * | | | 0.00 | + | | | (0.06 | ) | | | (0.03 | ) | | | (0.08 | ) | | | 0.20 | |
Portfolio Turnover Rate (%) | | | 5.9 | | | | 1.1 | | | | 2.5 | | | | 6.2 | | | | 0.7 | | | | 190.3 | |
Net Assets, End of Period (in millions) | | $ | 19.6 | | | $ | 3.3 | | | $ | 3.0 | | | $ | 2.5 | | | $ | 4.6 | | | $ | 5.9 | |
| + | | Net investment income was less than $0.01. |
| ++ | | Distributions from net investment income were less than $0.01. |
| (a) | | Per share amounts based on average shares outstanding during the period. |
| (b) | | Includes the effects of management fee waivers and expenses reimbursed by the Adviser, if applicable. |
See accompanying notes to financial statements.
11
MET INVESTORS SERIES TRUST
| | |
Legg Mason ClearBridge Aggressive Growth Portfolio | | |
Notes to Financial Statements—June 30, 2011 (Unaudited)
1. Organization
Met Investors Series Trust (the “Trust”) is organized as a statutory trust under the laws of Delaware, as an open-end management investment company under the Investment Company Act of 1940, as amended (the “1940 Act”). The Trust currently offers fifty-four Portfolios (the “Portfolios”), each of which operates as a distinct investment vehicle of the Trust. The portfolio included in this report is Legg Mason ClearBridge Aggressive Growth Portfolio (the “Portfolio”), which is non-diversified. Shares in the Portfolio are not offered directly to the general public and are currently available only to separate accounts established by Metropolitan Life Insurance Company (“MetLife”) and other affiliated life insurance companies.
The Portfolio has registered four classes of shares: Class A, B, C and E Shares. Class A, B and E Shares are currently offered by the Portfolio. Shares of each Class of the Portfolio represent an equal pro rata interest in the Portfolio and generally give the shareholder the same voting, dividend, liquidation, and other rights. Investment income, realized and unrealized capital gains and losses, the common expenses of the Portfolio and certain Portfolio-level expense reductions, if any, are allocated on a pro rata basis to each Class based on the relative net assets of each Class to the net assets of the Portfolio. Each Class of shares differs in its respective distribution expenses.
2. Significant Accounting Policies
The financial statements have been prepared in conformity with accounting principles generally accepted in the United States of America (“GAAP”) which require management to make estimates and assumptions that affect the reported amounts of assets and liabilities at the date of the financial statements and the reported amounts of income and expenses during the reporting period. Actual results could differ from these estimates. In the preparation of these financial statements, management has evaluated events and transactions subsequent to June 30, 2011 through the date that the financial statements were issued.
The following is a summary of significant accounting policies consistently followed by the Portfolio in the preparation of its financial statements.
Investment Valuation and Fair Value Measurements - Debt securities (other than short term obligations with a remaining maturity of sixty days or less) including corporate, convertible and municipal bonds and notes; U.S. government agencies; U.S. treasury obligations; sovereign issues; bank loans; and non-U.S. bonds are generally valued on the basis of evaluated or composite bid quotations obtained by independent pricing services and/or brokers and dealers selected by MetLife Advisers, LLC (“MLA” or the “Adviser”), an affiliate of MetLife, Inc., or the relevant Subadviser pursuant to authorization of the Board of Trustees of the Portfolio (the “Board”). Such quotations use inputs that are observable including, among other things, issuer details, interest rates, yield curves, prepayment speeds, credit risks/spreads, default rates and quoted prices for similar securities. Securities that use similar valuation techniques and inputs as described above are categorized as Level 2 within the fair value hierarchy.
Mortgage and asset-backed securities are usually issued as separate tranches, or classes, of securities within each deal. These securities are also generally valued on the basis of evaluated or composite bid quotations obtained by independent pricing services and/or brokers and dealers selected by the Adviser or relevant Subadviser pursuant to authorization of the Board. The pricing models for these securities usually consider tranche-level attributes, estimated cash flows for each tranche, market-based yield spreads for each tranche and current market data, and incorporate deal collateral performance, as available. Mortgage and asset-backed securities that use similar valuation techniques and inputs as described above are categorized as Level 2 within the fair value hierarchy.
Short term obligations with a remaining maturity of sixty days or less are valued at amortized cost which approximates fair market value and are categorized as Level 2 within the fair value hierarchy.
Equity securities such as common stock, exchange-traded funds and preferred stock that are traded on a national securities exchange or other exchanges are generally valued at their last sale price on the principal trading market. Equity securities traded on a national securities exchange or other exchanges for which there is no reported sale during the day are valued at the last reported bid price. A security that is listed or traded on more than one exchange is valued at the quotation on the exchange determined to be the primary market for that security by the Board or its delegates. If no closing price is available, then such securities are valued at the last reported bid price. Equity securities traded over-the-counter are generally valued at the last reported sales price. To the extent these securities are actively traded and valuation adjustments are not applied, they are categorized as Level 1 within the fair value hierarchy. Other equity securities traded on inactive markets or valued by reference to similar instruments are categorized as Level 2 within the fair value hierarchy.
Equity securities which are listed on foreign stock exchanges normally are valued at the market closing price, the last sale price on the day the securities are valued or, lacking any sales on such day, at the bid price. Valuation adjustments may be applied to certain equity securities that are solely traded on foreign exchanges closing before the U.S. market to account for the market movement between the close of the foreign exchanges and the close of the U.S. market. The Portfolio may use a systematic fair valuation model provided by an independent third party to value securities principally traded in these foreign markets closing before the U.S. market in order to adjust for possible stale pricing that may occur between the close of these foreign exchanges and the time of the Portfolio valuation. Securities using these valuation adjustments are categorized as Level 2 within the fair value hierarchy.
12
MET INVESTORS SERIES TRUST
| | |
Legg Mason ClearBridge Aggressive Growth Portfolio | | |
Notes to Financial Statements—June 30, 2011 (Unaudited)—(Continued)
2. Significant Accounting Policies - continued
Investments in registered open-end management investment companies are valued at reported net asset value per share and are categorized as Level 1 within the fair value hierarchy.
Forward foreign currency exchange contracts are valued based on the mean between closing bid and asked prices of the forward currency rates in the London foreign exchange markets on a daily basis as provided by a reliable bank or dealer. These contracts are categorized as Level 2 within the fair value hierarchy.
Options, whether on securities, indices, futures contracts, or otherwise, are valued at the last sales price available as of the close of business on the day of valuation or, if there is no such sale price available, at the bid price. Options on currencies are valued at the spot price each day. These types of options are categorized as Level 1 within the fair value hierarchy. Other options traded on inactive markets where a broker quotation is received or options valued by an evaluated quote provided by an independent pricing vendor are categorized as Level 2 within the fair value hierarchy.
Futures contracts, which are traded on commodity exchanges, are valued at their closing prices as of the close of such exchanges and are categorized as Level 1 within the fair value hierarchy. Futures contracts traded on inactive markets where a broker quotation is received are categorized as Level 2 within the fair value hierarchy. As a general matter, futures contracts are marked-to-market daily.
Options and futures contracts that are traded over-the-counter are generally valued on the basis of broker dealer quotations or pricing service providers who use a series of techniques, including simulation pricing models, to determine the value of the contracts. The pricing models use inputs that are observed from actively quoted markets such as issuer details, indices, spreads, interest rates, curves and exchange rates. These contracts are categorized as Level 2 within the fair value hierarchy.
If no current market value quotation or other observable inputs are readily available or reliable for a security, the fair value of the security will be determined in accordance with procedures approved by and under the general supervision of the Board. The Board has delegated the determination in good faith of the fair value of securities for which current market quotations are not readily available to a Valuation Committee established by the Board. Market quotes and other observable inputs are considered not readily available in circumstances where there is an absence of current or reliable market-based data. In addition, market quotes would be considered not readily available when, due to extraordinary circumstances, the exchanges or markets on which the securities trade, do not open for trading for the entire day and no other market prices are available. When the Portfolio uses fair value pricing, it may take into account any factors it deems appropriate, including significant unobservable inputs. The value of securities used by the Portfolio to calculate its net asset value may differ from quoted or published prices for the same securities. Fair value pricing involves subjective judgments and the fair value determined for a security may be materially different than the value that could be realized upon the sale of that security. These securities are categorized as Level 3 within the fair value hierarchy.
Investment Transactions and Related Investment Income - Portfolio security transactions are recorded on the trade date. Dividend income is recorded on the ex-dividend date or, for certain foreign securities, when notified. Interest income, which includes amortization of premium and accretion of discount on debt securities, is recorded on the accrual basis. Realized gains and losses on investments and unrealized appreciation and depreciation are determined on the identified cost basis, which is the same basis used for federal income tax purposes. Foreign income and foreign capital gains on some foreign securities may be subject to foreign withholding taxes, which are accrued as applicable.
Income Taxes - It is the Portfolio’s policy to comply with the requirements of the Internal Revenue Code of 1986, as amended (the “Code”), and regulations thereunder, applicable to regulated investment companies and to distribute, with respect to each taxable year, all of its taxable income to shareholders. Therefore, no federal income tax provision is required. The Portfolio files U.S. federal and various state tax returns. No income tax returns are currently under examination. The Portfolio’s federal tax returns for the prior three fiscal years remain subject to examination by the Internal Revenue Service.
Dividends and Distributions to Shareholders - The Portfolio records dividends and distributions on the ex-dividend date. Net realized gains from security transactions (if any) are generally distributed annually to shareholders. The timing and characterization of certain income and capital gains distributions are determined in accordance with federal tax regulations that may differ from GAAP. Permanent book and tax basis differences relating to shareholder distributions will result in reclassification between under/over distributed net investment income, accumulated net realized gains/losses and paid in surplus. Book-tax differences are primarily due to broker commission recapture, deferred trustees’ compensation, capital loss carryforwards and losses deferred due to wash sales, as applicable. These adjustments have no impact on net assets or the results of operations.
Securities Lending - The Portfolio may lend its portfolio securities to certain qualified brokers who borrow securities in order to complete certain securities transactions. By lending its portfolio securities, the Portfolio attempts to increase its net investment income through the receipt of income on the loaned securities. Any gain or loss in the market price of the loaned securities that might occur and any interest earned or dividends declared during the term of the loan would accrue to the account of the Portfolio.
13
MET INVESTORS SERIES TRUST
| | |
Legg Mason ClearBridge Aggressive Growth Portfolio | | |
Notes to Financial Statements—June 30, 2011 (Unaudited)—(Continued)
2. Significant Accounting Policies - continued
The Trust has entered into a securities lending arrangement with the custodian, State Street Bank and Trust Company (the “custodian”). Under this arrangement, the custodian is authorized to loan portfolio securities on the Portfolio’s behalf. In exchange, the Portfolio receives either cash or securities as collateral against the loaned securities. The Portfolio receives collateral at least equal to 102% of the market value of the loaned securities (105% for foreign equity securities), at each loan’s inception. Collateral representing at least 100% of the market value of the loaned securities must be maintained for the duration of the loan. Cash collateral is generally invested in the State Street Navigator Securities Lending Prime Portfolio (the “Navigator Portfolio”), managed by an affiliate of the custodian. The Navigator Portfolio is a registered money market fund which invests in a variety of high quality U.S. dollar-denominated instruments. If the market value of the collateral at the close of trading on a business day is less than 100% of the market value of the loaned securities at the close of trading on that day, the borrower shall be required to deliver, by the close of business on the following business day, an additional amount of collateral so that the total amount of posted collateral equals at least 100% of the market value of all the loaned securities as of such preceding day. A portion of net income (income after the deduction of expenses and fees of the Navigator Portfolio) on the collateral is rebated to the borrower of the securities and the remainder is split between the custodian and the Portfolio. On loans collateralized by U.S. Treasuries, a fee is received from the borrower and is allocated between the Portfolio and the custodian. The risks associated with lending portfolio securities include, but are not limited to, possible delays in receiving additional collateral or in the recovery of the loaned securities, possible loss of rights in the collateral should the borrower fail financially, as well as risk of loss in the value of the collateral or the value of the investments made with the collateral. Net interest income received by the Portfolio in securities lending transactions during the six months ended June 30, 2011 is disclosed in the footnotes to the Statement of Operations. Any outstanding loans by the Portfolio at June 30, 2011 are disclosed in the footnotes to the Schedule of Investments.
Repurchase Agreements - The Portfolio may enter into repurchase agreements with selected commercial banks and broker-dealers, under which the Portfolio acquires securities as collateral and agrees to resell the securities at an agreed upon time and at an agreed upon price. The Portfolio, through the custodian or a subcustodian, receives delivery of the underlying securities collateralizing repurchase agreements. The Portfolio requires the custodian to take possession, to have legally segregated in the Federal Reserve Book Entry System, or to have segregated within the custodian’s vault, all securities held as collateral for repurchase agreements. It is the Portfolio’s policy that the market value of the collateral be at least equal to 100% of the repurchase price in the case of a repurchase agreement of one-day duration and 102% of the repurchase price in the case of all other repurchase agreements. In connection with transactions in repurchase agreements, if the seller defaults and the value of the collateral declines or if the seller enters an insolvency proceeding, realization of the collateral by the Portfolio may be delayed, limited or wholly denied.
Directed Brokerage Agreement - The Trust has entered into a directed brokerage arrangement with State Street Global Markets (“SSGM”). Under this arrangement, the Portfolio directs certain trades to SSGM in return for a recapture credit. SSGM issues a cash rebate to the Portfolio. Amounts paid to the Portfolio are shown separately as broker commission recapture on the Statement of Operations of the Portfolio.
3. Investment Management Agreement and Other Transactions with Affiliates
Investment Management Agreement - The Trust is managed by the Adviser. The Trust has entered into a management agreement with the Adviser (the “Management Agreement”) for investment management services in connection with the investment management of the Portfolio. The Adviser is subject to the supervision and direction of the Board and has overall responsibility for the general management and administration of the Trust. The Adviser has entered into a subadvisory agreement with ClearBridge Advisors, LLC (the “Subadviser”) for investment subadvisory services in connection with the investment management of the Portfolio.
Subject to the supervision and direction of the Board, the Adviser supervises the Subadviser and has full discretion with respect to the retention or renewal of the subadvisory agreement. The Adviser pays the Subadviser a fee based on the Portfolio’s average daily net assets.
Under the terms of the Portfolio’s Management Agreement, the Portfolio pays the Adviser a monthly fee based upon annual rates applied to the Portfolio’s average daily net assets as follows:
| | | | | | | | |
Management Fees
earned by the Adviser
for the six months ended
June 30, 2011 | | % per annum | | | Average Daily Net Assets | |
| | |
| $2,927,191 | | | 0.65 | % | | | First $500 Million | |
| | |
| | | 0.60 | % | | | $500 Million to $1 Billion | |
| | |
| | | 0.55 | % | | | $1 Billion to $2 Billion | |
| | |
| | | 0.50 | % | | | Over $2 Billion | |
Certain officers and trustees of the Trust may also be officers of the Adviser; however, such officers and trustees receive no compensation from the Trust.
14
MET INVESTORS SERIES TRUST
| | |
Legg Mason ClearBridge Aggressive Growth Portfolio | | |
Notes to Financial Statements—June 30, 2011 (Unaudited)—(Continued)
3. Investment Management Agreement and Other Transactions with Affiliates - continued
Transfer Agency Agreement - MetLife serves as the transfer agent for the Trust. MetLife receives no fees for its services to the Trust under the transfer agency agreement.
Distribution Agreements and Plans - The Trust has distribution agreements with MetLife Investors Distribution Company (“MIDC” or the “Distributor”) in which MIDC serves as the Distributor for the Trust’s Class A, Class B and Class E Shares. MIDC is a wholly-owned subsidiary of MetLife Investors Group, Inc., an affiliate of the Adviser. The Class B and Class E distribution plans provide that the Trust, on behalf of the Portfolio, may pay annually up to 0.50% and 0.25%, respectively, of the average daily net assets of the Portfolio attributable to its Class B and Class E Shares with respect to activities primarily intended to result in the sale of Class B and Class E Shares. However, under the Class B and Class E distribution agreements, payments to the Distributor for activities pursuant to the Class B and Class E distribution plans are currently limited to payments at an annual rate equal to 0.25% and 0.15% of average daily net assets of the Portfolio attributable to its Class B and Class E Shares, respectively. Amounts incurred by the Portfolio for the six months ended June 30, 2011 are shown as Distribution and service fees in the Statement of Operations.
Under the terms of the Class B and Class E distribution plans and distribution agreements, the Portfolio is authorized to make payments monthly to the Distributor that may be used to pay or reimburse entities providing distribution and shareholder servicing with respect to the Class B and Class E Shares for such entities’ fees or expenses incurred.
Deferred Trustee Compensation - Each Trustee of the Trust who is not currently an employee of the Adviser or any of its affiliates receives compensation from the Trust for his or her service to the Portfolio. A deferred compensation plan (the “Plan”) is available to the Trustees on a voluntary basis. Deferred amounts remain in the Trust until distributed in accordance with the provisions of the Plan. The value of a participating Trustee’s deferral account is based on theoretical investments of deferred amounts, on the normal payment dates, in certain portfolios of the Trust or Metropolitan Series Fund, Inc. as designated by the participating Trustee. Changes in the value of participants’ deferral accounts are reflected as Trustees’ fees and expenses in the Statement of Operations. The portion of the accrued obligations allocated to the Portfolio, if any, under the Plan are reflected as Deferred trustees’ fees in the Statement of Assets and Liabilities.
4. Investment Transactions
Aggregate cost of purchases and proceeds of sales of investment securities, excluding short-term securities, for the six months ended June 30, 2011 were as follows:
| | | | | | | | | | | | |
| Purchases | | | Sales | |
| U.S. Government | | Non U.S. Government | | | U.S. Government | | | Non U.S. Government | |
| $— | | $ | 83,938,332 | | | $ | — | | | $ | 53,909,037 | |
The purchase and sales amounts exclude transition trades related to the merger of $187,457,974 and $0, respectively.
5. Contractual Obligations
The Trust has a variety of indemnification obligations under contracts with its service providers. The Trust’s maximum exposure under these arrangements is unknown.
6. Market, Credit and Counterparty Risk
In the normal course of business, the Portfolio invests in securities and enters into transactions where risks exist due to fluctuations in the market (market risk) or failure of the other party to a transaction to perform (credit and counterparty risk). The value of securities held by the Portfolio may decline in response to certain events, including those directly involving the companies whose securities are owned by the Portfolio; conditions affecting the general economy; overall market changes; local, regional or global political, social or economic instability; and currency and interest rate and price fluctuations. The Portfolio may be exposed to counterparty risk, or the risk that an entity with which the Portfolio has unsettled or open transactions may default. The potential loss could exceed the value of the financial assets recorded in the financial statements. Financial assets that potentially expose the Portfolio to credit risk consist principally of cash due from counterparties and investments. In order to preserve certain safeguards for derivatives and non-standard settlement trades, the Portfolio restricts its exposure to credit losses by entering into master netting agreements with counterparties (approved brokers) with whom it undertakes a significant volume of transactions. The Portfolio reduces the credit risk associated with favorable contracts by entering into a master netting arrangement to the extent that all amounts with the counterparty are terminated and settled on a net basis if an event of default occurs. The Portfolio’s overall exposure to credit risk on derivative instruments subject to master netting arrangements can change substantially within a short period, as it is affected by each transaction subject to the arrangement.
15
MET INVESTORS SERIES TRUST
| | |
Legg Mason ClearBridge Aggressive Growth Portfolio | | |
Notes to Financial Statements—June 30, 2011 (Unaudited)—(Continued)
7. Acquisition
At the close of business on April 29, 2011, the Portfolio, with aggregate Class A, Class B and Class E net assets of $690,422,921, $266,377,246 and $3,993,204 respectively, acquired all of the assets and liabilities of Legg Mason Value Equity Portfolio of the Met Investors Series Trust (“Legg Mason Value Equity”). The acquisition was accomplished by a tax-free exchange of 2,902,619 Class A shares of the Portfolio (valued at $24,730,316) for 3,555,394 Class A shares of Legg Mason Value Equity; 20,821,321 Class B shares of the Portfolio (valued at $173,649,815) for 24,981,757 of Class B shares of Legg Mason Value Equity; and 1,320,788 Class E shares of the Portfolio (value at $11,107,831) for 1,596,251 of Class E shares of Legg Mason Value Equity. Legg Mason Value Equity then distributed the Class A, B and E shares of the Portfolio that it received from the Portfolio to its shareholders by class. The transaction was part of a restructuring designed to eliminate the offering of overlapping Portfolios in the MetLife, Inc. families of funds with similar investment objectives and similar investment strategies that serve as funding vehicles for insurance contracts that are offered by affiliates of MetLife. The reorganization was proposed because Legg Mason Value Equity had experienced a significant decline in assets, which, if it continued, would affect the Portfolio’s ability to maintain certain operational efficiencies. Legg Mason Value Equity’s net assets on April 29, 2011, were $24,730,316, $173,649,815 and $11,107,831 for Class A, Class B and Class E shares, respectively, including investments valued at $203,440,228 with a cost basis of $195,398,974. For financial reporting purposes, assets received and shares issued by the Portfolio were recorded at fair value; however, the cost basis of the investments received by the Portfolio from Legg Mason Value Equity were carried forward to align ongoing reporting of the Portfolio’s realized and unrealized gains and losses with amounts distributable to shareholders for tax purposes. The Portfolio acquired $(968,634,364) in capital loss carry forwards from Legg Mason Value Equity.
The net assets of the Portfolio immediately after the acquisition were $1,170,281,333, which included $8,041,253 of acquired unrealized appreciation and $22,597 of acquired distributions in excess of net investment income.
Assuming the acquisition had been completed on January 1, 2011, the Portfolio’s pro-forma results of operations for the period ended June 30, 2011 are as follows:
| | | | |
(Unaudited) | | | |
Net investment income | | $ | 563,374 | (a) |
Net realized and unrealized gain (loss) on | | | | |
Investments | | | 146,660,170 | (b) |
| | | | |
Net increase in assets from operations | | $ | 147,223,544 | |
| | | | |
Because the combined investment portfolios have been managed as a single integrated portfolio since the acquisition was completed, it is not practicable to separate the amounts of revenue and earnings of Legg Mason Value Equity that have been included in the Portfolio’s Statement of Operations since April 29, 2011.
| (a) | | $388,683 as reported plus $(22,597) Legg Mason Value Equity pre-merger, plus $79,285 in lower Advisory fees, plus $118,003 of pro-forma eliminated other expenses. |
| (b) | | $102,810,963 as reported plus $43,849,207 Legg Mason Value Equity pre-merger. |
8. Income Tax Information
The tax character of distributions paid for the years ended December 31, 2010 and 2009 were as follows:
| | | | | | | | | | | | | | | | | | | | |
| Ordinary Income | | | Long-Term Capital Gain | | | Total | |
| 2010 | | 2009 | | | 2010 | | | 2009 | | | 2010 | | | 2009 | |
| | | | | |
| $319,182 | | $ | 778,848 | | | $ | — | | | $ | — | | | $ | 319,182 | | | $ | 778,848 | |
As of December 31, 2010, the components of distributable earnings (accumulated losses) on a federal income tax basis were as follows:
| | | | | | | | | | | | | | | | |
Undistributed
Ordinary
Income | | Undistributed
Long-Term Capital
Gain | | | Net
Unrealized
Appreciation | | | Loss Carryforwards | | | Total | |
| | | | |
| $850,382 | | $ | — | | | $ | 118,547,080 | | | $ | (200,275,159 | ) | | $ | (80,877,697 | ) |
The Portfolio utilizes the provisions of the federal income tax laws that provide for the carryforward of capital losses for eight years, offsetting such losses against any future net realized capital gains. At December 31, 2010, the accumulated capital loss carryforwards and expiration dates by the Portfolio were as follows:
| | | | | | | | | | | | |
Expiring
12/31/2016 | | Expiring
12/31/2017 | | | Expiring
12/31/2018 | | | Total | |
| $55,844,851 | | $ | 130,530,096 | | | $ | 13,900,212 | | | $ | 200,275,159 | |
The Regulated Investment Company Modernization Act of 2010 (the “Act”) was signed into law by President Obama on December 22, 2010.
16
MET INVESTORS SERIES TRUST
| | |
Legg Mason ClearBridge Aggressive Growth Portfolio | | |
Notes to Financial Statements—June 30, 2011 (Unaudited)—(Continued)
8. Income Tax Information - continued
The Act makes a number of changes to the provisions in the Code relating to regulated investment companies (“RICs”) that will generally become effective for taxable years of RICs beginning after December 22, 2010. The Act allows RICs to generally carryover net capital losses indefinitely, effective for losses arising in taxable years beginning after December 22, 2010. Such losses will retain their character as either long-term capital losses or short-term capital losses. Under pre-enactment law, capital losses could be carried forward for eight years and carried forward as short-term capital losses irrespective of the character of the original loss. Loss carryovers from years beginning prior to December 22, 2010 will still expire subject to the eight-year limitation. The Act further provides that losses arising in taxable years after December 22, 2010 (which are carried forward indefinitely) would be utilized prior to loss carryovers arising in taxable years beginning prior to December 22, 2010.
9. Recent Accounting Pronouncements
In January 2010, the Financial Accounting Standards Board (“FASB”) issued Accounting Standards Update No. 2010-06, “Improving Disclosures About Fair Value Measurements” (“ASU”) which was generally effective for years beginning after December 15, 2009 and was adopted by the Portfolio. The ASU requires enhanced disclosures about purchases, sales, issuances and settlements on a gross basis relating to Level 3 fair value measurements. These enhanced disclosures became effective for fiscal years beginning after December 15, 2010, and for interim periods within those years. Management has evaluated the impact of ASU 2010-06 and has concluded that ASU 2010-06 has no material impact on these financial statements.
In May 2011, FASB issued Accounting Standards Update (ASU) No. 2011-04 “Amendments to Achieve Common Fair Value Measurement and Disclosure Requirements in GAAP and the International Financial Reporting Standards (IFRS).” ASU 2011-04 includes common requirements for measurement of and disclosure about fair value between U.S. GAAP and IFRS. ASU 2011-04 will require reporting entities to categorize within Level 3 of the fair value hierarchy: quantitative information about the unobservable inputs used in the fair value measurement, the valuation processes used by the reporting entity and a narrative description of the sensitivity of the fair value measurement to changes in unobservable inputs and the interrelationships between those unobservable inputs. In addition, ASU 2011-04 will require reporting entities to make disclosures about amounts and reasons for all transfers in and out of Level 1 and Level 2 fair value measurements. The new and revised disclosures are effective for fiscal years beginning after December 15, 2011 and for interim periods within those fiscal years. Management is currently evaluating the implications of ASU 2011-04 and its impact on the financial statements.
17
MET INVESTORS SERIES TRUST
| | |
Legg Mason ClearBridge Aggressive Growth Portfolio | | |
Quarterly Portfolio Schedule
The Trust files Form N-Q for the first and third quarters of each fiscal year. The Trust’s Forms N-Q will be available on the Securities and Exchange Commission’s website at http://www.sec.gov. The Trust’s Forms N-Q may be reviewed and copied at the Securities and Exchange Commission’s Public Reference Room in Washington, D.C. and information on the operation of the Public Reference Room may be obtained by calling 1-800-SEC-0330. Once filed, the most recent Form N-Q will be available without charge, upon request, by calling (800) 848-3854.
Proxy Voting Policies and Procedures
A description of the policies and procedures that the Trust uses to determine how to vote proxies relating to portfolio securities is available without charge, upon request, by calling (800) 848-3854 and on the Securities and Exchange Commission’s website at http://www.sec.gov.
Proxy Voting Record
The Trust, on behalf of each of its Portfolios, has filed with the Securities and Exchange Commission its proxy voting record for the 12-month period ending June 30 on Form N-PX. Form N-PX must be filed by the Trust each year by August 31. Once filed, the most recent Form N-PX will be available without charge, upon request, by calling (800) 848-3854 or on the Securities and Exchange Commission’s website at http://www.sec.gov.
18
Simplify your life…
with MetLife eDelivery® while helping MetLife preserve the planet’s natural resources.
(see details on inside cover)
| | |
Met Investors Series Trust Met/Franklin Low Duration Total Return Portfolio Semiannual Report | | June 30, 2011, as amended December 16, 2011 |
MET INVESTORS SERIES TRUST
| | |
Met/Franklin Low Duration Total Return Portfolio | | |
Managed By Franklin Advisors, Inc.
Portfolio Manager Commentary*
Performance
Since its April 29, 2011 inception, the Class A and B shares of the Met/Franklin Low Duration Total Return Portfolio returned -0.10% and -0.10%, respectively, compared to the 0.40% return of its benchmark, the Barclays Capital US Government/Credit 1-3 Year Index1.
Market Environment/Conditions
During the period, some key economic indicators declined more than expected, and European sovereign credit risks lingered. These conditions led to a flight to quality and uncertainty about growth forecasts for the second half of 2011. As market volatility increased, analysts seemed unsure if the slowdown would be a temporary or persistent issue, which prompted them to downgrade their U.S. gross domestic product forecasts. Despite weak economic data and potential risks to global economic expansion, expectations were modestly positive for U.S. economic growth and a continued global recovery in the second half of 2011.
Corporate earnings continued to hold steady as news regarding profits and balance sheets was generally positive. Bank loan surveys showed improved consumer and business credit conditions. Core retail sales remained at moderate levels. Manufacturing sector activity began to slow, due to severe weather, global supply-chain disruptions and excessive inventory building. The labor market, which had shown signs of healing, delivered weak reports, and the unemployment rate remained at an elevated level. Year-over-year core consumer prices modestly increased, but slack in employment kept labor inflation contained. Headwinds including U.S. federal debt levels, eurozone credit concerns and a depressed U.S. housing market continued to challenge economic expansion.
Volatility and uncertainty increased during the period, leading most domestic fixed income sectors to trail the strong performance of U.S. Treasuries. Using the Barclays Capital U.S. Aggregate Index’s components as measures of fixed income performance, emerging market (U.S. dollar) securities were strongest during the period. High-quality fixed income sectors delivered positive returns as well, including U.S. Treasuries, U.S. residential mortgage-backed securities (MBS), asset-backed securities, U.S. agency securities and U.S. corporate investment grade bonds. More credit-sensitive sectors lagged and had slightly negative returns, including U.S. high yield bonds and commercial MBS (CMBS).
Portfolio Review/Current Positioning
Since the Portfolio’s inception on April 29, 2011, through the reporting period, we implemented our investment strategy and emphasized shorter term and adjustable-rate securities to maintain a lower interest rate risk profile. We held an overweighted allocation in many credit sectors based on our belief that valuations were attractive on a longer term basis. This included investment grade securities in the financials sector, where increased regulation may decrease earnings volatility. However, our expectations were tempered by remaining concerns over European sovereign and bank credit risks and potential oil supply shocks. We favored some higher quality CMBS that had become more seasoned and were appropriate for the Portfolio’s low duration mandate. We also invested in municipal bonds to take advantage of what we considered opportunities in that sector. Our research indicated that many of the best opportunities in global bond markets were outside the U.S., and, accordingly, we allocated exposure to diversified positions in international bonds and currencies.
During the period, sub-investment-grade credit sectors posted negative returns, and caused our allocation to these markets to detract from performance. The Portfolio’s positioning in CMBS detracted as spreads widened in the sector. Our exposure to non-U.S. government debt contributed to local currency market returns, though currency exposure had a negative impact on Portfolio results. Our weighting in agency MBS contributed to performance as the sector produced positive total returns during the period.
At period-end, we positioned the Portfolio with a duration shorter than that of the benchmark, seeking to reduce sensitivity to interest rate changes. We held an overweighted allocation to credit sectors, both investment grade and below investment grade. The Portfolio held a diversified allocation to international bonds and currencies. We favored some higher quality CMBS and had a weighting in municipal bonds and agency mortgages.
Roger A. Bayston, CFA
Kent Burns, CFA
Christopher J. Molumphy, CFA
Franklin Advisers, Inc.
*This commentary may include statements that constitute “forward-looking statements” under the U.S. securities laws. Forward-looking statements include, among other things, projections, estimates, and information about possible or future results related to the Portfolio, market or regulatory developments. The views expressed above are not guarantees of future performance or economic results and involve certain risks, uncertainties and assumptions that could cause actual outcomes and results to differ materially from the views expressed herein. The views expressed above are subject to change at any time based upon economic, market, or other conditions and the subadvisory firm undertakes no obligation to update the views expressed herein. Any discussions of specific securities should not be considered a recommendation to buy or sell those securities. The views expressed above (including any forward-looking statement) may not be relied upon as investment advice or as an indication of the Portfolio’s trading intent. Information about the Portfolio’s holdings, asset allocation or country diversification is historical and is not an indication of future Portfolio composition, which may vary. Direct investment in any index is not possible. The performance of any index mentioned in this commentary has not been adjusted for ongoing management, distribution and operating expenses, and sales charges applicable to mutual fund investments. In addition, the returns do not reflect additional fees charged by separate accounts or variable insurance contracts that an investor in the Portfolio may pay. If these additional fees were reflected, performance would have been lower.
1
MET INVESTORS SERIES TRUST
| | |
Met/Franklin Low Duration Total Return Portfolio | | |
Portfolio Composition as of June 30, 2011
Top Issuers
| | | | |
| | |
% of
Net Assets | |
U.S. Treasury Notes | | | 25.0 | |
Fannie Mae 30 Yr. Pool | | | 8.0 | |
Fannie Mae 15 Yr. Pool | | | 4.7 | |
Korea Treasury Bond | | | 2.4 | |
Sweden Government Bond | | | 1.6 | |
Malaysia Government Bond | | | 1.5 | |
Freddie Mac Multifamily Structured Pass Through Certificates | | | 1.4 | |
Freddie Mac Non Gold Pool | | | 1.4 | |
Norway Treasury Bill | | | 1.2 | |
Poland Government Bond | | | 1.2 | |
Top Sectors
| | | | |
| | | % of
Market Value of
Total Investments | |
U.S. Treasury & Government Agencies | | | 39.1 | |
Domestic Bonds & Debt Securities | | | 23.2 | |
Foreign Bonds & Debt Securities | | | 13.6 | |
Cash & Equivalents | | | 6.6 | |
Collateralized Mortgage Obligations | | | 5.9 | |
Municipals | | | 4.7 | |
Asset-Backed Securities | | | 4.6 | |
Loan Participations | | | 2.2 | |
Convertible Bonds | | | 0.1 | |
2
MET INVESTORS SERIES TRUST
| | |
Met/Franklin Low Duration Total Return Portfolio | | |
Met/Franklin Low Duration Total Return Portfolio managed by
Franklin Advisers, Inc. vs. Barclays Capital US Govt/Credit 1-3 Year Index1
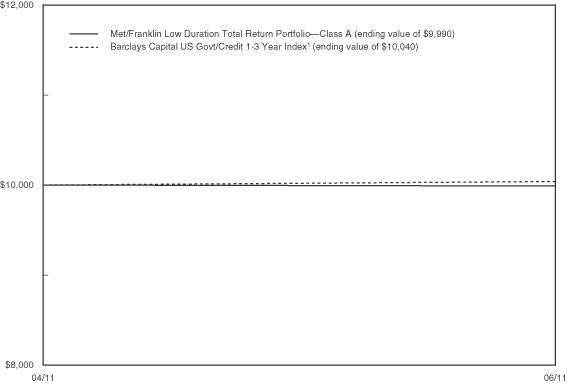
| | | | |
| | | Cumulative Return2 (for the period ended June 30, 2011) | |
| | | Since
Inception3 | |
Met/Franklin Low Duration Total Return
Portfolio—Class A | | | -0.10% | |
| Class B | | | -0.10% | |
| Barclays Capital US Govt/Credit 1-3 Year Index1 | | | 0.40% | |
The performance of Class A shares, as set forth in the line graph above, will differ from that of the other class because of the difference in expenses paid by policyholders investing in the different share classes.
1 The Barclays Capital US Government/Credit 1-3 Year Index is an unmanaged index which tracks public obligations of the U.S. Treasury with one to three years to final maturity and publicly issued debt of U.S. government agencies, quasi-federal corporations, and corporate or foreign debt guaranteed by the U.S. government.
2 “Cumulative Return” is calculated including reinvestment of all income dividends and capital gain distributions.
3 Inception of the Class A and B shares is 4/29/11. Index returns are based on an inception date of 4/29/11.
Past performance does not guarantee future results. The investment return and principal value of an investment in the Portfolio will fluctuate, so that shares, on any given day or when redeemed, may be worth more or less than their original cost. Performance numbers are net of all Portfolio expenses but do not include any insurance, sales, or administration charges of variable annuity or life insurance contracts. If these charges were included, the returns would be lower. The Index does not include fees or expenses and is not available for direct investment.
3
MET INVESTORS SERIES TRUST
| | |
Met/Franklin Low Duration Total Return Portfolio | | |
Understanding Your Portfolio’s Expenses
Shareholder Expense Example
As a shareholder of the Portfolio, you incur ongoing costs, including management fees; distribution and service (12b-1) fees; and other Portfolio expenses. This example is intended to help you understand your ongoing costs (in dollars) (referred to as “expenses”) of investing in the Portfolio and compare these costs with the ongoing costs of investing in other mutual funds. The example is based on an investment of $1,000 invested at the beginning of the period and held for the entire period, April 29, 2011 through June 30, 2011.
Actual Expenses
The first line for each share class of the Portfolio in the table below provides information about actual account values and actual expenses. You may use the information in this line, together with the amount you invested in the particular share class of the Portfolio, to estimate the expenses that you paid over the period. Simply divide your account value by $1,000 (for example, an $8,600 account value divided by $1,000 = 8.6), then multiply the result by the number in the first line under the heading entitled “Expenses Paid During Period” to estimate the expenses you paid on your account during this period.
Hypothetical Example for Comparison Purposes
The second line for each share class of the Portfolio in the table below provides information about hypothetical account values and hypothetical expenses based on the Portfolio’s actual expense ratio and an assumed rate of return of 5% per year before expenses, which is not the Portfolio’s actual return. The hypothetical account values and expenses may not be used to estimate the actual ending account balance or expenses you paid for the period. You may use this information to compare the ongoing costs of investing in the Portfolio and other funds. To do so, compare this 5% hypothetical example with the 5% hypothetical examples that appear in the shareholder reports of the other funds.
Please note that the expenses shown in the table are meant to highlight your ongoing costs only and do not reflect any fees or charges of your variable insurance product or any additional expenses that participants in certain eligible qualified plans may bear relating to the operations of their plan. Therefore, the second line for each share class in the table is useful in comparing ongoing costs only, and will not help you determine the relative total costs of owning different funds. In addition, if these other costs were included, your costs would have been higher.
| | | | | | | | | | | | | | | | |
| | | Annualized
Expense
Ratio | | | Beginning
Account Value
April 29, 2011** | | | Ending
Account Value
June 30, 2011 | | | Expenses Paid
During Period***
April 29, 2011
to June 30, 2011 | |
| | | | | | | | | | | | | | | | |
| | | | |
| | | | | | | | | | | | | | | | |
Class A(a)(b) | | | | | | | | | | | | | | | | |
Actual | | | 0.55% | | | $ | 1,000.00 | | | $ | 999.00 | | | $ | 0.95 | |
Hypothetical* | | | 0.55% | | | | 1,000.00 | | | | 1,007.68 | | | | 0.95 | |
| | | | | | | | | | | | | | | | |
| | | | |
| | | | | | | | | | | | | | | | |
Class B(a)(b) | | | | | | | | | | | | | | | | |
Actual | | | 0.80% | | | $ | 1,000.00 | | | $ | 999.00 | | | $ | 1.38 | |
Hypothetical* | | | 0.80% | | | | 1,000.00 | | | | 1,007.25 | | | | 1.39 | |
| | | | | | | | | | | | | | | | |
* Hypothetical assumes a rate of return of 5% per year before expenses.
** Commencement of operations—April 29, 2011.
*** Expenses paid are equal to the Portfolio’s annualized expense ratio for the most recent two month period, as shown above, multiplied by the average account value over the period, multiplied by the number of days (62 days) in the most recent fiscal half-year, divided by 365 (to reflect the two month period).
(a) The annualized expense ratio shown reflects an expense limitation agreement between MetLife Advisers, LLC and the Portfolio as described in Note 3 of the Notes to Financial Statements.
(b) The annualized expense ratio reflects the impact of the management fee waiver as described in Note 3 to the Financial Statements.
4
MET INVESTORS SERIES TRUST
| | |
Met/Franklin Low Duration Total Return Portfolio | | |
Schedule of Investments as of June 30, 2011 (Unaudited)
U.S. Treasury & Government Agencies—40.5% of Net Assets
| | | | | | | | |
| Security Description | | Par
Amount | | | Value | |
| | | | | | | | |
|
| Agency Sponsored Mortgage-Backed—14.1% | |
Fannie Mae 15 Yr. Pool
4.500%, 09/01/24 | | $ | 6,494,545 | | | $ | 6,902,853 | |
4.500%, 03/01/25 | | | 9,892,742 | | | | 10,503,871 | |
4.000%, 04/01/26 | | | 8,175,721 | | | | 8,526,209 | |
4.000%, 05/01/26 | | | 8,645,908 | | | | 9,021,956 | |
Fannie Mae ARM Pool
2.125%, 05/01/19 (a) | | | 138,145 | | | | 138,865 | |
2.305%, 01/01/20 (a) | | | 207,740 | | | | 216,462 | |
2.323%, 02/01/32 (a) | | | 157,526 | | | | 165,022 | |
2.413%, 06/01/32 (a) | | | 86,667 | | | | 88,037 | |
2.490%, 01/01/33 (a) | | | 211,633 | | | | 211,960 | |
2.447%, 06/01/33 (a) | | | 124,335 | | | | 124,445 | |
2.623%, 08/01/33 (a) | | | 139,821 | | | | 146,505 | |
2.611%, 10/01/33 (a) | | | 126,715 | | | | 132,966 | |
2.750%, 05/01/34 (a) | | | 227,379 | | | | 227,532 | |
3.754%, 05/01/34 (a) | | | 140,466 | | | | 141,133 | |
2.575%, 11/01/34 (a) | | | 104,061 | | | | 109,518 | |
2.680%, 11/01/34 (a) | | | 12,625,511 | | | | 13,312,802 | |
2.535%, 02/01/35 (a) | | | 239,069 | | | | 250,868 | |
4.764%, 03/01/35 (a) | | | 141,640 | | | | 148,520 | |
2.685%, 04/01/35 (a) | | | 2,389,100 | | | | 2,520,185 | |
4.140%, 04/01/35 (a) | | | 447,950 | | | | 466,778 | |
2.398%, 06/01/35 (a) | | | 133,281 | | | | 139,615 | |
2.506%, 07/01/35 (a) | | | 471,339 | | | | 497,266 | |
2.915%, 08/01/35 (a) | | | 3,429,980 | | | | 3,558,306 | |
2.651%, 09/01/35 (a) | | | 15,786,918 | | | | 16,612,133 | |
2.070%, 11/01/35 (a) | | | 416,582 | | | | 436,954 | |
2.837%, 11/01/35 (a) | | | 9,147,602 | | | | 9,658,449 | |
5.141%, 11/01/35 (a) | | | 134,480 | | | | 143,406 | |
2.528%, 12/01/35 (a) | | | 244,754 | | | | 257,506 | |
1.930%, 02/01/36 (a) | | | 254,872 | | | | 264,196 | |
2.085%, 03/01/36 (a) | | | 641,609 | | | | 672,051 | |
2.550%, 07/01/36 (a) | | | 118,799 | | | | 123,197 | |
2.926%, 11/01/36 (a) | | | 8,798,523 | | | | 9,258,540 | |
Freddie Mac ARM Non Gold Pool
2.850%, 04/01/34 (a) | | | 1,689,946 | | | | 1,787,194 | |
2.625%, 05/01/34 (a) | | | 534,964 | | | | 559,395 | |
2.616%, 01/01/35 (a) | | | 218,763 | | | | 230,109 | |
2.676%, 01/01/35 (a) | | | 1,991,492 | | | | 2,100,812 | |
2.598%, 03/01/35 (a) | | | 1,773,194 | | | | 1,867,095 | |
3.343%, 04/01/35 (a) | | | 129,261 | | | | 130,922 | |
4.637%, 07/01/35 (a) | | | 684,990 | | | | 718,854 | |
2.674%, 07/01/36 (a) | | | 168,227 | | | | 176,220 | |
4.126%, 06/01/37 (a) | | | 885,516 | | | | 932,839 | |
2.706%, 07/01/37 (a) | | | 965,096 | | | | 1,013,186 | |
| | | | | | | | |
|
| Agency Sponsored Mortgage-Backed—(Continued) | |
4.621%, 09/01/37 (a) | | $ | 886,320 | | | $ | 935,173 | |
| | | | | | | | |
| | | | | | | 105,429,905 | |
| | | | | | | | |
|
| Federal Agencies—1.4% | |
Freddie Mac Multifamily Structured Pass Through Certificates
2.902%, 08/25/20 | | | 10,470,145 | | | | 10,629,262 | |
| | | | | | | | |
|
| U.S. Treasuries—25.0% | |
U.S. Treasury Notes
4.625%, 07/31/12 | | | 29,000,000 | | | | 30,374,107 | |
1.750%, 08/15/12 | | | 25,000,000 | | | | 25,421,875 | |
0.375%, 09/30/12 | | | 12,000,000 | | | | 12,015,468 | |
1.375%, 01/15/13 | | | 10,000,000 | | | | 10,156,250 | |
3.500%, 05/31/13 | | | 4,500,000 | | | | 4,761,387 | |
4.250%, 08/15/13 | | | 23,300,000 | | | | 25,153,072 | |
3.125%, 08/31/13 | | | 28,000,000 | | | | 29,581,580 | |
0.750%, 09/15/13 | | | 4,000,000 | | | | 4,019,688 | |
3.125%, 09/30/13 | | | 10,000,000 | | | | 10,579,690 | |
2.750%, 10/31/13 | | | 15,000,000 | | | | 15,752,340 | |
2.000%, 11/30/13 | | | 15,000,000 | | | | 15,501,570 | |
1.875%, 04/30/14 | | | 2,900,000 | | | | 2,991,078 | |
| | | | | | | | |
| | | | | | | 186,308,105 | |
| | | | | | | | |
Total U.S. Treasury & Government Agencies
(Cost $301,661,106) | | | | 302,367,272 | |
| | | | | | | | |
|
| Domestic Bonds & Debt Securities—23.2% | |
| | |
| Airlines—0.1% | | | | | | | | |
American Airlines, Inc.
7.500%, 03/15/16 (144A) | | | 700,000 | | | | 689,500 | |
| | | | | | | | |
| | |
| Beverages — 0.6% | | | | | | | | |
Anheuser-Busch InBev Worldwide, Inc.
2.500%, 03/26/13 | | | 4,200,000 | | | | 4,305,764 | |
| | | | | | | | |
| | |
| Capital Markets—1.1% | | | | | | | | |
Goldman Sachs Group, Inc.(The)
5.500%, 11/15/14 | | | 4,200,000 | | | | 4,544,778 | |
Morgan Stanley, Series GMTN
0.590%, 01/09/14 (a) | | | 4,200,000 | | | | 4,097,276 | |
| | | | | | | | |
| | | | | | | 8,642,054 | |
| | | | | | | | |
|
| Commercial & Professional Services—0.6% | |
Block Financial LLC
5.125%, 10/30/14 | | | 4,200,000 | | | | 4,363,943 | |
| | | | | | | | |
See accompanying notes to financial statements.
5
MET INVESTORS SERIES TRUST
| | |
Met/Franklin Low Duration Total Return Portfolio | | |
Schedule of Investments as of June 30, 2011 (Unaudited)
Domestic Bonds & Debt Securities—(Continued)
| | | | | | | | |
| Security Description | | Par
Amount | | | Value | |
| | | | | | | | |
|
| Commercial Banks—6.1% | |
Banco Bradesco S.A. of the Cayman Islands
2.361%, 05/16/14 (144A) (a) | | $ | 4,200,000 | | | $ | 4,219,416 | |
BB&T Corp.
2.050%, 04/28/14 | | | 4,200,000 | | | | 4,249,669 | |
BBVA U.S. Senior SAU, Series FRN
2.386%, 05/16/14 (a) | | | 4,200,000 | | | | 4,178,939 | |
CIT Group, Inc.
7.000%, 05/02/16 (144A) | | | 1,000,000 | | | | 998,750 | |
Commonwealth Bank of Australia
3.750%, 10/15/14 (144A) | | | 4,200,000 | | | | 4,416,099 | |
Credit Suisse of New York
2.200%, 01/14/14 | | | 4,200,000 | | | | 4,257,351 | |
HSBC Bank Brasil S.A.—Banco Multiplo
4.000%, 05/11/16 (144A) | | | 4,200,000 | | | | 4,251,068 | |
Nordea Bank AB
2.125%, 01/14/14 (144A) | | | 4,200,000 | | | | 4,231,949 | |
Regions Financial Corp.
4.875%, 04/26/13 | | | 2,000,000 | | | | 2,018,052 | |
Royal Bank of Scotland plc(The)
4.875%, 08/25/14 (144A) | | | 4,200,000 | | | | 4,374,384 | |
Santander US Debt S.A. Unipersonal
2.991%, 10/07/13 (144A) | | | 4,200,000 | | | | 4,192,709 | |
U.S. Bancorp, Series MTN
1.375%, 09/13/13 | | | 4,200,000 | | | | 4,221,281 | |
| | | | | | | | |
| | | | | | | 45,609,667 | |
| | | | | | | | |
| | |
| Computers & Peripherals—0.6% | | | | | | | | |
Hewlett-Packard Co.
0.654%, 05/30/14 (a) | | | 4,200,000 | | | | 4,223,054 | |
| | | | | | | | |
| | |
| Construction Materials—0.1% | | | | | | | | |
Euramax International, Inc.
9.500%, 04/01/16 (144A) | | | 500,000 | | | | 487,500 | |
| | | | | | | | |
| | |
| Consumer Finance—3.1% | | | | | | | | |
Ally Financial, Inc.
1.750%, 10/30/12 | | | 7,000,000 | | | | 7,121,170 | |
4.500%, 02/11/14 | | | 1,750,000 | | | | 1,754,375 | |
Banque PSA Finance
3.375%, 04/04/14 (144A) | | | 4,100,000 | | | | 4,187,359 | |
Caterpillar Financial Services Corp., Series MTN
1.375%, 05/20/14 | | | 4,200,000 | | | | 4,220,080 | |
| | | | | | | | |
| |
| Consumer Finance—(Continued) | | | | | |
Daimler Finance North America LLC
1.950%, 03/28/14 (144A) | | $ | 4,200,000 | | | $ | 4,237,443 | |
Ford Motor Credit Co. LLC
7.000%, 04/15/15 | | | 1,500,000 | | | | 1,623,989 | |
| | | | | | | | |
| | | | | | | 23,144,416 | |
| | | | | | | | |
| |
| Diversified Financial Services—4.5% | | | | | |
Bank of America Corp., Series MTN
1.693%, 01/30/14 (a) | | | 4,200,000 | | | | 4,212,852 | |
Citigroup Funding, Inc.
1.875%, 10/22/12 | | | 7,000,000 | | | | 7,138,425 | |
Citigroup, Inc.
0.377%, 03/07/14 (a) | | | 4,200,000 | | | | 4,048,334 | |
General Electric Capital Corp.
2.100%, 01/07/14 | | | 4,200,000 | | | | 4,262,194 | |
International Lease Finance Corp.
8.625%, 09/15/15 | | | 1,000,000 | | | | 1,087,500 | |
JPMorgan Chase & Co., Series MTN
1.074%, 01/24/14 (a) | | | 4,200,000 | | | | 4,213,885 | |
UBS AG of Stamford, Connecticut
2.250%, 01/28/14 | | | 4,200,000 | | | | 4,246,549 | |
Woodside Finance, Ltd.
4.500%, 11/10/14 (144A) | | | 4,200,000 | | | | 4,503,420 | |
| | | | | | | | |
| | | | | | | 33,713,159 | |
| | | | | | | | |
|
| Diversified Telecommunication Services—1.6% | |
Frontier Communications Corp.
7.875%, 04/15/15 | | | 1,000,000 | | | | 1,090,000 | |
Qwest Corp.
7.500%, 10/01/14 | | | 4,200,000 | | | | 4,730,250 | |
Telefonica Emisiones SAU
2.582%, 04/26/13 | | | 2,100,000 | | | | 2,122,657 | |
Verizon Communications, Inc.
1.950%, 03/28/14 | | | 4,200,000 | | | | 4,271,198 | |
| | | | | | | | |
| | | | | | | 12,214,105 | |
| | | | | | | | |
| |
| Energy Equipment & Services—0.1% | | | | | |
Compagnie Generale de Geophysique-Veritas
9.500%, 05/15/16 | | | 1,000,000 | | | | 1,097,500 | |
| | | | | | | | |
|
| Health Care Providers & Services—0.1% | |
Community Health Systems, Inc.
8.875%, 07/15/15 | | | 800,000 | | | | 826,000 | |
| | | | | | | | |
See accompanying notes to financial statements.
6
MET INVESTORS SERIES TRUST
| | |
Met/Franklin Low Duration Total Return Portfolio | | |
Schedule of Investments as of June 30, 2011 (Unaudited)
Domestic Bonds & Debt Securities—(Continued)
| | | | | | | | |
| Security Description | | Par
Amount | | | Value | |
| | | | | | | | |
|
| Hotels, Restaurants & Leisure—0.1% | |
MGM Resorts International
6.625%, 07/15/15 | | $ | 1,000,000 | | | $ | 942,500 | |
| | | | | | | | |
|
| Lodging—0.9% | |
Hilton Worldwide, Inc.
4.761%, 11/15/13 (144A) (a) | | | 7,000,000 | | | | 6,912,500 | |
| | | | | | | | |
|
| Media—0.9% | |
CCH II LLC/CCH II Capital Corp.
13.500%, 11/30/16 | | | 1,000,000 | | | | 1,182,500 | |
Dish DBS Corp.
7.125%, 02/01/16 | | | 1,000,000 | | | | 1,060,000 | |
NBCUniversal Media LLC
2.100%, 04/01/14 (144A) | | | 4,200,000 | | | | 4,258,535 | |
| | | | | | | | |
| | | | | | | 6,501,035 | |
| | | | | | | | |
|
| Multi-Utilities—0.6% | |
Sempra Energy
2.000%, 03/15/14 | | | 4,200,000 | | | | 4,242,391 | |
| | | | | | | | |
|
| Office Electronics—0.6% | |
Xerox Corp.
1.081%, 05/16/14 (a) | | | 4,200,000 | | | | 4,223,810 | |
| | | | | | | | |
|
| Oil, Gas & Consumable Fuels—1.3% | |
Anadarko Petroleum Corp.
5.750%, 06/15/14 | | | 2,000,000 | | | | 2,209,450 | |
Chesapeake Energy Corp.
9.500%, 02/15/15 | | | 1,000,000 | | | | 1,165,000 | |
OPTI Canada, Inc.
9.000%, 12/15/12 (144A) | | | 700,000 | | | | 707,000 | |
Petrohawk Energy Corp.
7.875%, 06/01/15 | | | 1,000,000 | | | | 1,052,500 | |
Valero Energy Corp.
4.750%, 06/15/13 | | | 4,200,000 | | | | 4,467,947 | |
| | | | | | | | |
| | | | | | | 9,601,897 | |
| | | | | | | | |
|
| Paper & Forest Products—0.1% | |
NewPage Corp.
11.375%, 12/31/14 | | | 700,000 | | | | 656,250 | |
| | | | | | | | |
|
| Thrifts & Mortgage Finance—0.1% | |
Ineos Group Holdings Ltd.
8.500%, 02/15/16 (144A) | | | 700,000 | | | | 694,750 | |
| | | | | | | | |
Total Domestic Bonds & Debt Securities
(Cost $173,651,485) | | | | | | | 173,091,795 | |
| | | | | | | | |
| Foreign Bonds & Debt Securities—13.6% | |
| Security Description | | Par
Amount | | | Value | |
| | | | | | | | |
| | |
| Australia—1.8% | | | | | | | | |
New South Wales Treasury Corp., | | | | | | | | |
Series 813
5.500%, 08/01/13 (AUD) | | $ | 3,900,000 | | | $ | 4,228,545 | |
Queensland Treasury Corp.
6.000%, 08/21/13 (AUD) | | | 4,410,000 | | | | 4,821,527 | |
Western Australia Treasury Corp., | | | | | | | | |
Series 13
8.000%, 06/15/13 (AUD) | | | 3,600,000 | | | | 4,081,755 | |
| | | | | | | | |
| | | | | | | 13,131,827 | |
| | | | | | | | |
| | |
| Greece—0.5% | | | | | | | | |
Hellenic Republic Government Bond
4.500%, 05/20/14 (EUR) | | | 4,000,000 | | | | 3,430,452 | |
| | | | | | | | |
|
| Indonesia—0.6% | |
Indonesia Retail Bond, Series ORI7
7.950%, 08/15/13 (IDR) | | | 17,000,000,000 | | | | 2,054,081 | |
Indonesia Treasury Bond, Series FR33
12.500%, 03/15/13 (IDR) | | | 15,700,000,000 | | | | 2,022,445 | |
| | | | | | | | |
| | | | | | | 4,076,526 | |
| | | | | | | | |
| | |
| Ireland—0.4% | | | | | | | | |
Ireland Government Bond
4.600%, 04/18/16 (EUR) | | | 3,000,000 | | | | 3,124,244 | |
| | | | | | | | |
| | |
| Israel—0.7% | | | | | | | | |
Israel Government Bond, Series 0312
4.000%, 03/30/12 (ILS) | | | 8,550,000 | | | | 2,550,027 | |
Israel Treasury Bill—Makam, | | | | | | | | |
Series 0412
2.455%, 04/04/12 (b) (ILS) | | | 8,550,000 | | | | 2,451,255 | |
| | | | | | | | |
| | | | | | | 5,001,282 | |
| | | | | | | | |
| | |
| Malaysia—1.6% | | | | | | | | |
Bank Negara Monetary Notes, | | | | | | | | |
Series 3911
2.635%, 10/18/11 (b) (MYR) | | | 3,800,000 | | | | 1,247,122 | |
Malaysia Government Bond | | | | | | | | |
Series 0109
2.509%, 08/27/12 (MYR) | | | 7,120,000 | | | | 2,347,499 | |
Series 0309
2.711%, 02/14/12 (MYR) | | | 9,470,000 | | | | 3,138,959 | |
Series 5/06
3.718%, 06/15/12 (MYR) | | | 16,610,000 | | | | 5,546,783 | |
| | | | | | | | |
| | | | | | | 12,280,363 | |
| | | | | | | | |
See accompanying notes to financial statements.
7
MET INVESTORS SERIES TRUST
| | |
Met/Franklin Low Duration Total Return Portfolio | | |
Schedule of Investments as of June 30, 2011 (Unaudited)
Foreign Bonds & Debt Securities—(Continued)
| | | | | | | | |
| Security Description | | Par
Amount | | | Value | |
| | | | | | | | |
| | |
| Mexico—0.6% | | | | | | | | |
Mexican Bonos, Series MI10
8.000%, 12/19/13 (MXN) | | $ | 50,200,000 | | | $ | 4,541,019 | |
| | | | | | | | |
| | |
| Netherlands—0.1% | | | | | | | | |
Refresco Group B.V.
5.420%, 05/15/18 (144A) (a) (EUR) | | | 300,000 | | | | 435,622 | |
| | | | | | | | |
| | |
| Norway—1.2% | | | | | | | | |
Norway Treasury Bill
0.000%, 03/21/12 (b) (NOK) | | | 50,700,000 | | | | 9,266,236 | |
| | | | | | | | |
| | |
| Poland—1.2% | | | | | | | | |
Poland Government Bond | | | | | | | | |
Series 0113
3.390%, 01/25/13 (b) (PLN) | | | 14,620,000 | | | | 4,959,452 | |
Series 0412
4.750%, 04/25/12 (PLN) | | | 9,250,000 | | | | 3,375,165 | |
Series 1013
5.000%, 10/24/13 (PLN) | | | 1,925,000 | | | | 704,464 | |
| | | | | | | | |
| | | | | | | 9,039,081 | |
| | | | | | | | |
| | |
| South Africa—0.1% | | | | | | | | |
Edcon Proprietary, Ltd.
4.721%, 06/15/14 (144A) (a) (EUR) | | | 500,000 | | | | 639,034 | |
| | | | | | | | |
| | |
| South Korea—2.4% | | | | | | | | |
Korea Treasury Bond, | | | | | | | | |
Series 1312
3.000%, 12/10/13 (KRW) | | | 19,200,000,000 | | | | 17,694,662 | |
| | | | | | | | |
|
| Sweden—1.6% | |
Sweden Government, | | | | | | | | |
Series 1046
5.500%, 10/08/12 (SEK) | | | 72,600,000 | | | | 11,997,935 | |
Sweden Treasury Bill
0.000%, 12/21/11 (b) (SEK) | | | 1,700,000 | | | | 267,344 | |
| | | | | | | | |
| | | | | | | 12,265,279 | |
| | | | | | | | |
|
| United Kingdom—0.8% | |
United Kingdom Gilt
5.000%, 03/07/12 (GBP) | | | 3,770,000 | | | | 6,238,771 | |
| | | | | | | | |
Total Foreign Bonds & Debt Securities
(Cost $102,838,245) | | | | | | | 101,164,378 | |
| | | | | | | | |
|
| Municipals—4.7% | |
Arizona School Facilities Board, Certificates of Participation, | | | | | | | | |
Series A-2 (NATL-RE)
5.000%, 09/01/16 | | | 2,000,000 | | | | 2,172,940 | |
| Municipals—(Continued) | |
| Security Description | | Par
Amount | | | Value | |
| | | | | | | | |
| | |
| Municipals—(Continued) | | | | | | | | |
Citizens Property Insurance Corp. Revenue, Series A3
1.840%, 07/07/11 (a) | | $ | 2,500,000 | | | $ | 2,500,275 | |
City of Burleson, Texas, Refunding, General Oblgation, Ltd.
3.000%, 03/01/13 | | | 690,000 | | | | 714,060 | |
3.000%, 03/01/14 | | | 1,010,000 | | | | 1,064,378 | |
City of Cleveland, Ohio, Public Improvements, General Obligation, Ltd.
2.250%, 12/01/15 | | | 1,295,000 | | | | 1,314,050 | |
City of New York, New York, Refunding, General Obligation Unlimited, | | | | | | | | |
Series D (NATL-RE-FGIC/TCRs)
5.000%, 08/01/15 | | | 2,000,000 | | | | 2,276,160 | |
Columbia County School District, School Improvements
4.000%, 10/01/15 | | | 2,000,000 | | | | 2,229,720 | |
Cook County High School District No. 205 Thornton Township, School Improvements (Assured Guaranty Insured)
5.500%, 12/01/16 | | | 2,540,000 | | | | 2,967,558 | |
County of Pima Arizona, Public Improvements, General Obligation Unlimited
3.000%, 07/01/16 | | | 2,400,000 | | | | 2,527,368 | |
New York City Transitional Finance Authority, Revenue, Refunding, General Obligation, Ltd., | | | | | | | | |
Sub-Series E
5.000%, 11/01/14 | | | 2,000,000 | | | | 2,257,720 | |
New York State Dormitory Authority, Revenue, Refunding, Series B (Assured Guaranty Insured)
4.000%, 10/01/14 | | | 2,085,000 | | | | 2,236,017 | |
New York State Thruway Authority, Revenue, Refunding, | | | | | | | | |
Series B (AGM)
5.000%, 04/01/15 | | | 2,000,000 | | | | 2,269,760 | |
New York State Urban Development Corp., Revenue, Refunding, | | | | | | | | |
Series A-2
5.000%, 01/01/15 | | | 2,000,000 | | | | 2,247,040 | |
See accompanying notes to financial statements.
8
MET INVESTORS SERIES TRUST
| | |
Met/Franklin Low Duration Total Return Portfolio | | |
Schedule of Investments as of June 30, 2011 (Unaudited)
Municipals—(Continued)
| | | | | | | | |
| Security Description | | Par
Amount | | | Value | |
| | | | | | | | |
| | |
| Municipals—(Continued) | | | | | | | | |
Reading School District, Refunding, General Obligation Unlimited, | | | | | | | | |
Series A
5.000%, 04/01/15 | | $ | 2,500,000 | | | $ | 2,768,625 | |
State of Illinois, Refunding, General Obligation Unlimited (AGM)
5.000%, 01/01/16 | | | 2,500,000 | | | | 2,736,700 | |
Tulsa County Industrial Authority, School Improvements, Revenue
4.000%, 09/01/16 | | | 2,315,000 | | | | 2,513,372 | |
| | | | | | | | |
Total Municipals
(Cost $34,771,484) | | | | | | | 34,795,743 | |
| | | | | | | | |
|
| Asset-Backed Securities—4.6% | |
|
| Asset Backed - Credit Card—4.4% | |
American Express Credit Account Master Trust
0.487%, 05/15/15 (a) | | | 3,200,000 | | | | 3,208,742 | |
Capital One Multi-Asset Execution Trust
0.547%, 10/15/15 (a) | | | 3,935,000 | | | | 3,944,851 | |
0.247%, 01/15/16 (a) | | | 3,200,000 | | | | 3,191,778 | |
Chase Issuance Trust
0.217%, 06/16/14 (a) | | | 3,000,000 | | | | 2,998,278 | |
Citibank Credit Card Issuance Trust
1.937%, 03/17/14 (a) | | | 3,200,000 | | | | 3,238,201 | |
Citibank Omni Master Trust
2.287%, 05/16/16 (144A) (a) | | | 3,200,000 | | | | 3,239,226 | |
Discover Card Master Trust
1.487%, 12/15/14 (a) | | | 3,200,000 | | | | 3,238,137 | |
0.587%, 06/15/15 (a) | | | 3,200,000 | | | | 3,210,823 | |
GE Capital Credit Card Master Note Trust
0.237%, 06/15/15 (a) | | | 3,500,000 | | | | 3,494,053 | |
MBNA Credit Card Master Note Trust
0.247%, 10/15/15 (a) | | | 3,200,000 | | | | 3,196,168 | |
| | | | | | | | |
| | | | | | | 32,960,257 | |
| | | | | | | | |
|
| Asset Backed - Home Equity—0.2% | |
Morgan Stanley ABS Capital I
1.386%, 05/25/33 (a) | | | 692,219 | | | | 587,448 | |
0.921%, 01/25/35 (a) | | | 1,200,000 | | | | 990,421 | |
| | | | | | | | |
| | | | | | | 1,577,869 | |
| | | | | | | | |
Total Asset-Backed Securities
(Cost $34,535,400) | | | | | | | 34,538,126 | |
| | | | | | | | |
| Mortgage-Backed Securities—4.6% | |
| Security Description | | Par
Amount | | | Value | |
| | | | | | | | |
|
| Commercial Mortgage-Backed Securities—4.6% | |
Banc of America Commercial Mortgage, Inc.
5.421%, 09/10/45 | | $ | 3,200,000 | | | $ | 3,304,754 | |
5.460%, 09/10/45 | | | 3,200,000 | | | | 2,979,229 | |
5.695%, 07/10/46 (a) | | | 1,500,000 | | | | 1,351,544 | |
Banc of America Large Loan, Inc.
1.937%, 11/15/15 (144A) (a) | | | 3,121,024 | | | | 2,898,850 | |
Bear Stearns Commercial Mortgage Securities
5.611%, 09/11/41 | | | 3,000,000 | | | | 2,728,428 | |
Citigroup/Deutsche Bank Commercial Mortgage Trust
5.220%, 07/15/44 (a) | | | 1,700,000 | | | | 1,606,517 | |
5.617%, 10/15/48 | | | 3,200,000 | | | | 3,477,587 | |
Greenwich Capital Commercial Funding Corp.
5.224%, 04/10/37 | | | 3,200,000 | | | | 3,439,386 | |
5.881%, 07/10/38 | | | 3,200,000 | | | | 3,556,792 | |
GS Mortgage Securities Corp. II
5.553%, 04/10/38 | | | 3,200,000 | | | | 3,481,305 | |
Wachovia Bank Commercial Mortgage Trust
0.267%, 06/15/20 (144A) (a) | | | 2,883,220 | | | | 2,616,410 | |
5.740%, 05/15/43 (a) | | | 2,700,000 | | | | 2,470,166 | |
| | | | | | | | |
| | | | | | | 33,910,968 | |
| | | | | | | | |
Total Mortgage-Backed Securities
(Cost $34,637,526) | | | | | | | 33,910,968 | |
| | | | | | | | |
|
| Loan Participation (c)—2.2% | |
|
| Aerospace & Defense—0.1% | |
TransDigm Group, Inc.,
New Term Loan B
4.000%, 02/14/17 | | | 598,496 | | | | 600,854 | |
| | | | | | | | |
|
| Automobiles—0.2% | |
Hertz Corp., (The), Term Loan B
3.750%, 03/09/18 | | | 329,175 | | | | 327,923 | |
KAR Auction Services, Inc., Term Loan B
5.000%, 05/19/17 | | | 589,054 | | | | 593,716 | |
Tomkins LLC, New Term Loan B
4.250%, 09/29/16 | | | 219,449 | | | | 219,835 | |
| | | | | | | | |
| | | | | | | 1,141,474 | |
| | | | | | | | |
See accompanying notes to financial statements.
9
MET INVESTORS SERIES TRUST
| | |
Met/Franklin Low Duration Total Return Portfolio | | |
Schedule of Investments as of June 30, 2011 (Unaudited)
Loan Participation (c)—(Continued)
| | | | | | | | |
| Security Description | | Par
Amount | | | Value | |
| | | | | | | | |
|
| Chemicals—0.1% | |
Nalco Co., Term Loan B1
4.500%, 10/05/17 | | $ | 199,497 | | | $ | 200,980 | |
Rockwood Specialties Group, Inc., New Term Loan B
3.750%, 02/09/18 | | | 700,000 | | | | 704,483 | |
| | | | | | | | |
| | | | | | | 905,463 | |
| | | | | | | | |
|
| Containers & Packaging—0.0% | |
Reynolds Group Holdings, Inc., Tranche E Term Loan
4.250%, 02/09/18 | | | 222,789 | | | | 221,868 | |
| | | | | | | | |
|
| Diversified Financial Services—0.1% | |
Fidelity National Information Solutions, Inc., Term Loan B
5.250%, 07/18/16 | | | 219,447 | | | | 220,709 | |
Interactive Data Corp.,
New Term Loan B
4.750%, 02/12/18 | | | 219,450 | | | | 219,977 | |
Moneygram International, Inc.,
Term Loan B
4.529%, 11/17/17 | | | 109,800 | | | | 110,088 | |
MSCI, Inc., Term Loan B1
3.750%, 03/14/17 | | | 219,450 | | | | 220,752 | |
| | | | | | | | |
| | | | | | | 771,526 | |
| | | | | | | | |
|
| Diversified Telecommunication Services—0.2% | |
CSC Holdings, Inc., Incremental B-2 Term Loan
1.936%, 03/29/16 | | | 199,474 | | | | 198,310 | |
Intelsat Jackson Holdings S.A.,
Tranche B Term Loan
5.250%, 04/02/18 | | | 875,000 | | | | 879,008 | |
Weather Channel (The),
New Term Loan B
0.000%, 02/13/17 (d) | | | 225,198 | | | | 226,356 | |
| | | | | | | | |
| | | | | | | 1,303,674 | |
| | | | | | | | |
|
| Food & Staples Retailing—0.3% | |
Aramark corp.
Extended Letter of Credit
3.436%, 07/26/16 | | | 25,984 | | | | 25,924 | |
Extended Term Loan B | | | | | | | | |
3.496%, 07/26/16 | | | 394,579 | | | | 393,659 | |
Del Monte Foods Co., Term Loan
4.500%, 03/08/18 | | | 1,032,910 | | | | 1,031,619 | |
| | | | | | | | |
|
| Food & Staples Retailing—(Continued) | |
SUPERVALU, Inc., Extended Term Loan B2
0.000%, 10/05/15 (d) | | $ | 718,200 | | | $ | 708,271 | |
| | | | | | | | |
| | | | | | | 2,159,473 | |
| | | | | | | | |
|
| Health Care Providers & Services—0.4% | |
Community Health Systems, Inc., Extended Term Loan B
3.754%, 01/25/17 | | | 797,990 | | | | 780,342 | |
DaVita, Inc., New Term Loan B
4.500%, 10/20/16 | | | 299,248 | | | | 300,583 | |
HCA, Inc., Extended Term Loan B2
3.496%, 03/31/17 | | | 825,072 | | | | 815,274 | |
Universal Health Services, Inc.,
New Term Loan B
4.000%, 11/15/16 | | | 762,252 | | | | 765,690 | |
Warner Chilcott Co. LLC,
New Term Loan B2
4.250%, 03/15/18 | | | 125,780 | | | | 125,977 | |
Warner Chilcott corp.,
New Term Loan B1
4.250%, 03/15/18 | | | 251,560 | | | | 251,954 | |
WC Luxco S.A.R.L., New Term Loan B3
4.250%, 03/15/18 | | | 172,948 | | | | 173,218 | |
| | | | | | | | |
| | | | | | | 3,213,038 | |
| | | | | | | | |
|
| Hotels, Restaurants & Leisure—0.2% | |
Ameristar Casinos, Inc., Term Loan B
4.000%, 04/13/18 | | | 282,598 | | | | 283,864 | |
Burger King corp., New Term Loan B
4.500%, 10/19/16 | | | 873,339 | | | | 871,789 | |
Penn National Gaming, Inc.,
New Term Loan B
0.000%, 06/20/18 (d) | | | 79,106 | | | | 79,393 | |
| | | | | | | | |
| | | | | | | 1,235,046 | |
| | | | | | | | |
|
| Household Durables—0.0% | |
Goodman Global Holdings, Inc., 1st Lien Term Loan
0.000%, 10/28/16 (d) | | | 317,736 | | | | 319,126 | |
| | | | | | | | |
|
| Industrial Conglomerates—0.0% | |
Trans Union LLC, New Term Loan B
4.750%, 02/12/18 | | | 179,550 | | | | 179,679 | |
| | | | | | | | |
|
| IT Services—0.0% | |
Sungard Data Systems, Inc., Tranche B
3.870%, 02/26/16 | | | 220,000 | | | | 219,724 | |
| | | | | | | | |
See accompanying notes to financial statements.
10
MET INVESTORS SERIES TRUST
| | |
Met/Franklin Low Duration Total Return Portfolio | | |
Schedule of Investments as of June 30, 2011 (Unaudited)
Loan Participation (c)—(Continued)
| | | | | | | | |
| Security Description | | Par
Amount | | | Value | |
| | | | | | | | |
|
| Machinery—0.1% | |
Rexnord corp., Term Loan B
2.770%, 07/19/13 | | $ | 450,000 | | | $ | 447,001 | |
| | | | | | | | |
|
| Manufacturing—0.1% | |
Diversey Holdings, Inc., Term Loan B
0.000%, 11/24/15 (d) | | | 301,927 | | | | 302,399 | |
Walter Energy, Inc., Term Loan B
4.000%, 04/02/18 | | | 224,000 | | | | 224,344 | |
| | | | | | | | |
| | | | | | | 526,743 | |
| | | | | | | | |
|
| Media—0.1% | |
Cinemark USA, Inc., Extended Term Loan
3.470%, 04/29/16 | | | 219,443 | | | | 220,540 | |
Regal Cinemas, Inc., Term Loan B
3.496%, 08/23/17 | | | 219,449 | | | | 219,494 | |
UPC Financing Partnership, Term Loan T
3.691%, 12/30/16 | | | 220,000 | | | | 219,542 | |
| | | | | | | | |
| | | | | | | 659,576 | |
| | | | | | | | |
|
| Metals & Mining—0.1% | |
American Rock Salt Holdings LLC, Term Loan
5.500%, 04/19/17 | | | 612,500 | | | | 614,034 | |
| | | | | | | | |
|
| Multiline Retail—0.0% | |
Dollar General corp., Tranche B-1 Term Loan
2.970%, 07/07/14 | | | 220,000 | | | | 220,244 | |
| | | | | | | | |
|
| Personal Products—0.1% | |
Bausch and Lomb, Inc.
Delayed Draw Term Loan
0.000%, 04/24/15 (d) | | | 117,183 | | | | 116,646 | |
Term Loan | | | | | | | | |
0.000%, 04/24/15 (d) | | | 481,713 | | | | 479,206 | |
DineEquity, Inc., New Term Loan B
4.250%, 10/19/17 | | | 180,000 | | | | 180,337 | |
| | | | | | | | |
| | | | | | | 776,189 | |
| | | | | | | | |
|
| Publishing—0.1% | |
Visant Holding Corp., Term Loan B
5.250%, 12/22/16 | | | 872,807 | | | | 869,844 | |
| | | | | | | | |
| | | | | | | | |
|
| Wireless Telecommunication Services—0.0% | |
SBA Finance, Term Loan
0.000%, 06/29/18 (d) | | $ | 144,367 | | | $ | 144,843 | |
| | | | | | | | |
Total Loan Participation
(Cost $16,611,864) | | | | | | | 16,529,419 | |
| | | | | | | | |
|
| Convertible Bonds—0.1% | |
|
| Construction Materials—0.1% | |
Cemex S.A.B. de C.V.
3.250%, 03/15/16 | | | 1,000,000 | | | | 995,000 | |
| | | | | | | | |
Total Convertible Bonds
(Cost $968,254) | | | | | | | 995,000 | |
| | | | | | | | |
|
| Short-Term Investments—6.8% | |
|
| Discount Notes—4.1% | |
Federal Home Loan Bank
0.010%, 07/01/11 (b) | | | 30,800,000 | | | | 30,800,000 | |
| | | | | | | | |
|
| Repurchase Agreements—2.5% | |
Fixed Income Clearing Corp. Repurchase Agreement dated 06/30/11 at 0.010% to be repurchased at $18.,585,005 on 07/01/11 collateralized by $18,865,000 Fannie Mae at 5.000% due 04/08/30 with a value of $18,959,325. | | $ | 18,585,000 | | | | 18,585,000 | |
| | | | | | | | |
|
| U.S. Treasury—0.2% | |
U.S. Treasury Bills
0.039%, 08/25/11 (b) (e) | | | 1,000,000 | | | | 999,992 | |
| | | | | | | | |
Total Short-Term Investments
(Cost $50,384,941) | | | | | | | 50,384,992 | |
| | | | | | | | |
Total Investments—100.3%
(Cost $750,060,305#) | | | | | | | 747,777,693 | |
Other Assets and Liabilities
(net)—(0.3)% | | | | | | | (1,915,620 | ) |
| | | | | | | | |
| Net Assets—100.0% | | | | | | $ | 745,862,073 | |
| | | | | | | | |
See accompanying notes to financial statements.
11
MET INVESTORS SERIES TRUST
| | |
Met/Franklin Low Duration Total Return Portfolio | | |
Schedule of Investments as of June 30, 2011 (Unaudited)
| # | As of June 30, 2011, the aggregate cost of investments for federal income tax purposes was $750,061,553. The aggregate unrealized appreciation and depreciation of investments were $1,278,573 and $(3,561,191), respectively, resulting in a net unrealized depreciation of $(2,282,618) for federal income tax purposes. |
| (a) | Variable or floating rate security. The stated rate represents the rate at June 30, 2011. Maturity date shown for callable securities reflects the earliest possible call date. |
| (b) | Zero coupon bond—Interest rate represents current yield to maturity. |
| (c) | Senior floating-rate interests (Senior Loans) often require prepayments from excess cash flows or permit the borrowers to repay at their election. The degree to which borrowers repay, whether as a contractual requirement or at their election, cannot be predicted with accuracy. As a result, the actual remaining maturity may be substantially less than the stated maturities shown. However, Senior Loans will have an expected average life of approximately two to four years. The stated interest rate represents the weighted average interest rate of all contracts within the senior loan facility and includes commitment fees on unfunded loan commitments, if any. Senior Loans typically have rates of interest which are redetermined either daily, monthly, quarterly or semi-annually by reference to a base lending rate, plus a premium. These base rates are primarily the London Interbank Offered Rate (“LIBOR”) and secondarily, the prime rate offered by one or more major United States banks (the “Prime Rate”) and the certificate of deposit (“CD”) rate or other base lending rates used by commercial lenders. |
| (d) | This Senior Loan will settle after June 30, 2011, at which time the interest rate will be determined. |
| (e) | All or a portion of the security was pledged as collateral against open futures contracts. |
| (144A)— | Securities exempt from registration under Rule 144A of the Securities Act of 1933. These securities may be resold in transaction exempt from registration , normally to qualified institutional buyers, As of June 30, 2011, the market value of 144A securities was $63,191,524, which was 8.5% of net assets. |
| AGM— | Assured Guaranty Municipal Corporation |
See accompanying notes to financial statements.
12
MET INVESTORS SERIES TRUST
| | |
Met/Franklin Low Duration Total Return Portfolio | | |
Schedule of Investments as of June 30, 2011 (Unaudited)
FAIR VALUE HIERARCHY
Accounting principles generally accepted in the United States of America (“GAAP”) defines fair market value as the price that the Portfolio would receive to sell an asset or pay to transfer a liability in an orderly transaction between market participants at the measurement date. It establishes a fair value hierarchy that prioritizes inputs to valuation methods and requires disclosure of the fair value hierarchy that segregates fair value measurements into three levels. Levels 1, 2 and 3 of the fair value hierarchy are defined as follows:
Level 1 - unadjusted quoted prices in active markets for identical investments
Level 2 - other significant observable inputs (including, but not limited to, unadjusted quoted prices for similar investments in markets that are either active or inactive; inputs other than quoted prices that are observable such as interest rates, yield curves, volatilities, prepayment speeds, loss severities, credit risks, default rates, etc.)
Level 3 - significant unobservable inputs based on the best information available in the circumstances, to the extent observable inputs are unavailable (including the Portfolio’s own assumptions in determining the fair value of investments)
The inputs or methodologies used for valuing investments are not necessarily an indication of the risk associated with investing in them. For a change in the methodology used, transfers between levels will be recognized as of the beginning of the reporting period. Information on transfers between Level 1 and Level 2 deemed significant, if any, will be disclosed following the valuation table below. For the period from April 29, 2011 (commencement of operations) through June 30, 2011, there were no transfers between Levels 1 and 2. A reconciliation of Level 3 securities, if any, will also be disclosed following the valuation table. For more information about the Portfolio’s policy regarding the valuation of investments, please refer to the Notes to Financial Statements.
The following table summarizes the fair value hierarchy of the Portfolio’s investments as of June 30, 2011:
| | | | | | | | | | | | | | | | |
| Description | | Level 1 | | | Level 2 | | | Level 3 | | | Total | |
Total U.S. Treasury & Government Agencies* | | $ | — | | | $ | 302,367,272 | | | $ | — | | | $ | 302,367,272 | |
Total Domestic Bonds & Debt Securities* | | | — | | | | 173,091,795 | | | | — | | | | 173,091,795 | |
Total Foreign Bonds & Debt Securities* | | | — | | | | 101,164,378 | | | | — | | | | 101,164,378 | |
Municipals | | | — | | | | 34,795,743 | | | | — | | | | 34,795,743 | |
Total Asset-Backed Securities* | | | — | | | | 34,538,126 | | | | — | | | | 34,538,126 | |
Total Mortgage-Backed Securities* | | | — | | | | 33,910,968 | | | | — | | | | 33,910,968 | |
Total Loan Participation* | | | — | | | | 16,529,419 | | | | — | | | | 16,529,419 | |
Total Convertible Bonds* | | | — | | | | 995,000 | | | | — | | | | 995,000 | |
Total Short-Term Investments* | | | — | | | | 50,384,992 | | | | — | | | | 50,384,992 | |
Total Investments | | $ | — | | | $ | 747,777,693 | | | $ | — | | | $ | 747,777,693 | |
| | | | | | | | | | | | | | | | | |
Forward Contracts** | | | | | | | | | | | | | | | | |
Forward Contracts to Buy Appreciation | | $ | — | | | $ | 73,116 | | | $ | — | | | $ | 73,116 | |
Forward Contracts to Buy (Depreciation) | | | — | | | | (219,227 | ) | | | — | | | | (219,227 | ) |
Forward Contracts to Sell Appreciation | | | — | | | | 476,744 | | | | — | | | | 476,744 | |
Forward Contracts to Sell (Depreciation) | | | — | | | | (371,116 | ) | | | — | | | | (371,116 | ) |
Total Forward Contracts | | $ | — | | | $ | (40,483 | ) | | $ | — | | | $ | (40,483 | ) |
Futures Contracts** | | | | | | | | | | | | | | | | |
Futures Contracts Short (Depreciation) | | $ | (38,200 | ) | | $ | — | | | $ | — | | | $ | (38,200 | ) |
SWAP Contracts** | | | | | | | | | | | | | | | | |
Credit Default Swap Buy Protection Appreciation | | $ | — | | | $ | 492,606 | | | $ | — | | | $ | 492,606 | |
Credit Default Swap Buy Protection (Depreciation) | | | — | | | | (78,403 | ) | | | — | | | | (78,403 | ) |
Credit Default Swap Sell Protection Appreciation | | | — | | | | 22,456 | | | | — | | | | 22,456 | |
Credit Default Swap Sell Protection (Depreciation) | | | — | | | | (482,855 | ) | | | — | | | | (482,855 | ) |
Total SWAP Contracts | | $ | — | | | $ | (46,196 | ) | | $ | — | | | $ | (46,196 | ) |
| | | | | | | | | | | | | | | | | |
| * | | See Schedule of Investments for additional detailed categorizations. |
| ** | | Derivative instruments such as forwards, futures and swap contracts are valued based on the unrealized appreciation/depreciation on the instrument. |
See accompanying notes to financial statements.
13
MET INVESTORS SERIES TRUST
| | |
Met/Franklin Low Duration Total Return Portfolio | | |
Statement of Assets and Liabilities
June 30, 2011 (Unaudited)
| | | | |
| Assets | | | | |
Investments at value (a) | | $ | 729,192,693 | |
Repurchase Agreement | | | 18,585,000 | |
Cash | | | 43,493 | |
Cash denominated in foreign currencies (b) | | | 480,181 | |
Receivable for investments sold | | | 4,284,725 | |
Receivable for shares sold | | | 833,103 | |
Net variation margin on financial futures contracts | | | 79,921 | |
Interest receivable | | | 4,890,077 | |
Swap interest receivable | | | 275,981 | |
Swap premium paid | | | 3,167,518 | |
Unrealized appreciation on swap contracts | | | 515,062 | |
Unrealized appreciation on forward currency exchange contracts | | | 549,861 | |
| | | | |
Total assets | | | 762,897,615 | |
| | | | |
| Liabilities | | | | |
Payables for: | | | | |
Investments purchased | | | 10,637,767 | |
Shares redeemed | | | 225,302 | |
Unrealized depreciation on forward currency exchange contracts | | | 590,344 | |
Unrealized depreciation on swap contracts | | | 561,258 | |
Swap interest | | | 102,273 | |
Swap premium received | | | 603,997 | |
Premium for written swaps | | | 3,948,056 | |
Accrued Expenses: | | | | |
Management fees | | | 280,679 | |
Distribution and service fees - Class B | | | 1,843 | |
Administration fees | | | 3,510 | |
Custodian and accounting fees | | | 25,656 | |
Other expenses | | | 54,857 | |
| | | | |
Total liabilities | | | 17,035,542 | |
| | | | |
| Net Assets | | $ | 745,862,073 | |
| | | | |
| Net Assets Represented by | | | | |
Paid in surplus | | $ | 746,135,293 | |
Accumulated net realized gain | | | 383,645 | |
Unrealized depreciation on investments, futures contracts, swap contracts and foreign currency transacations | | | (2,404,108 | ) |
Undistributed net investment income | | | 1,747,243 | |
| | | | |
Net Assets | | $ | 745,862,073 | |
| | | | |
| Net Assets | | | | |
Class A | | $ | 731,694,940 | |
Class B | | | 14,167,133 | |
| Capital Shares Outstanding* | | | | |
Class A | | | 73,202,574 | |
Class B | | | 1,417,943 | |
| Net Asset Value, Offering Price and Redemption Price Per Share | | | | |
Class A | | $ | 10.00 | |
Class B | | | 9.99 | |
| * | | The Portfolio is authorized to issue an unlimited number of shares. |
| (a) | | Identified cost of investments, excluding repurchase agreement, was $731,475,305. |
| (b) | | Identified cost of cash denominated in foreign currencies was $475,662. |
Statement of Operations
Period Ended June 30, 2011* (Unaudited)
| | | | |
| Investment Income | | | | |
Interest | | $ | 2,413,017 | |
| | | | |
Total investment income | | | 2,413,017 | |
| | | | |
| Expenses | | | | |
Management fees | | | 602,859 | |
Administration fees | | | 6,494 | |
Custodian and accounting fees | | | 30,693 | |
Distribution and service fees - Class B | | | 2,169 | |
Audit and tax services | | | 16,896 | |
Legal | | | 20,227 | |
Trustees’ fees and expenses | | | 4,926 | |
Shareholder reporting | | | 18,818 | |
Insurance | | | 483 | |
Organizational expense | | | 769 | |
Miscellaneous | | | 2,330 | |
| | | | |
Total expenses | | | 706,664 | |
Less management fee waiver | | | (40,890 | ) |
| | | | |
Net expenses | | | 665,774 | |
| | | | |
Net investment income | | | 1,747,243 | |
| | | | |
| Net Realized and Unrealized Gain (Loss) on Investments, Futures Contracts, Swaps Contracts and Foreign Currency transactions | | | | |
Net realized gain (loss) on: | | | | |
Investments | | | 355,590 | |
Futures contracts | | | (44,045 | ) |
Swap contracts | | | (2,783 | ) |
Foreign currency transactions | | | 74,883 | |
| | | | |
Net realized gain on investments, futures contracts, swap contracts and foreign currency transactions | | | 383,645 | |
| | | | |
Net change in unrealized appreciation (depreciation) on: | | | | |
Investments | | | (2,282,612 | ) |
Futures contracts | | | (38,200 | ) |
Swap contracts | | | (46,196 | ) |
Foreign currency transactions | | | (37,100 | ) |
| | | | |
Net change in unrealized depreciation on investments, futures contracts, options contracts, swap contracts, and foreign currency transactions | | | (2,404,108 | ) |
| | | | |
Net realized and unrealized loss on investments, futures contracts, swap contracts and foreign currency transactions | | | (2,020,463 | ) |
| | | | |
| Net Decrease in Net Assets from Operations | | $ | (273,220 | ) |
| | | | |
| * | | Commencement of operations—4/29/2011. |
See accompanying notes to financial statements.
14
MET INVESTORS SERIES TRUST
| | |
Met/Franklin Low Duration Total Return Portfolio | | |
Statement of Changes in Net Assets
June 30, 2011
| | | | |
| | | Period Ended
June 30, 2011*
(Unaudited) | |
| Decrease in Net Assets: | | | | |
| Operations | | | | |
Net investment income | | $ | 1,747,243 | |
Net realized gain on investments, futures contracts, swap contracts, and foreign currency transactions | | | 383,645 | |
Net change in unrealized appreciation on investments, futures contracts, swap contracts, and foreign currency transactions | | | (2,404,108 | ) |
| | | | |
Net decrease in net assets resulting from operations | | | (273,220 | ) |
| | | | |
Net increase in net assets from capital share transactions | | | 746,135,293 | |
| | | | |
| Net Increase in Net Assets | | | 745,862,073 | |
Net assets at end of period | | $ | 745,862,073 | |
| | | | |
Undistributed net investment income at end of period | | $ | 1,747,243 | |
| | | | |
| | | | | | | | |
| Other Information: | | | | | | | | |
| Capital Shares | | | | | | | | |
| | |
Transactions in capital shares were as follows: | | | | | | | | |
| | | Period Ended
June 30, 2011*
(Unaudited) | |
| | | Shares | | | Value | |
| Class A | | | | | | | | |
Sales | | | 73,481,791 | | | $ | 734,770,063 | |
Redemptions | | | (279,217 | ) | | | (2,789,393 | ) |
| | | | | | | | |
Net increase | | | 73,202,574 | | | $ | 731,980,670 | |
| | | | | | | | |
| Class B | | | | | | | | |
Sales | | | 1,451,726 | | | $ | 14,491,989 | |
Redemptions | | | (33,783 | ) | | | (337,366 | ) |
| | | | | | | | |
Net increase | | | 1,417,943 | | | $ | 14,154,623 | |
| | | | | | | | |
Increase derived from capital shares transactions | | | | | | $ | 746,135,293 | |
| | | | | | | | |
| * | | Commencement of operations—4/29/2011. |
See accompanying notes to financial statements.
15
MET INVESTORS SERIES TRUST
|
Met/Franklin Low Duration Total Return Portfolio |
Financial Highlights
| | | | |
| Selected per share data | | | |
| | | Class A | |
| | | Period Ended
June 30, 2011(b)
(Unaudited) | |
| Net Asset Value, Beginning of Period | | $ | 10.00 | |
| | | | |
| Income from Investment Operations: | | | | |
Net Investment Income (a) | | | 0.03 | |
Net Realized and Unrealized gain on Investments | | | (0.03 | ) |
| | | | |
Total From Investment Operations | | | 0.00 | |
| | | | |
| Net Asset Value, End of Period | | $ | 10.00 | |
| | | | |
| Total Return (%) | | | (0.10 | ) |
| |
| Ratios/Supplemental Data | | | | |
Ratio of Expenses to Average Net Assets (%) | | | 0.59 | * |
Ratio of Net Expenses to Average Net Assets (%)(c) | | | 0.55 | * |
Ratio of Net Investment Income to Average Net Assets (%) | | | 1.45 | * |
Portfolio Turnover Rate (%) | | | 52.8 | |
Net Assets, End of Period (in millions) | | $ | 729.2 | |
| | | | |
| | | Class B | |
| | | Period Ended
June 30, 2011(b)
(Unaudited) | |
| Net Asset Value, Beginning of Period | | $ | 10.00 | |
| | | | |
| Income from Investment Operations: | | | | |
Net Investment Income(a) | | | 0.03 | |
Net Realized and Unrealized gain on Investments | | | (0.04 | ) |
| | | | |
Total From Investment Operations | | | (0.01 | ) |
| | | | |
| Net Asset Value, End of Period | | $ | 9.99 | |
| | | | |
| Total Return (%) | | | (0.10 | ) |
| |
| Ratios/Supplemental Data | | | | |
Ratio of Expenses to Average Net Assets (%) | | | 0.84 | * |
Ratio of Net Expenses to Average Net Assets (%)(c) | | | 0.80 | * |
Ratio of Net Investment Income to Average Net Assets (%) | | | 1.89 | * |
Portfolio Turnover Rate (%) | | | 52.8 | |
Net Assets, End of Period (in millions) | | $ | 14.1 | |
| (a) | | Per share amounts based on average shares outstanding during the period. |
| (b) | | Commencement of operations—4/29/2011. |
| (c) | | Includes the effects of management fee waivers and expenses reimbursed by the Adviser, if applicable. |
See accompanying notes to financial statements.
16
MET INVESTORS SERIES TRUST
| | |
Met/Franklin Low Duration Total Return Portfolio | | |
Notes to Financial Statements—June 30, 2011 (Unaudited)
1. Organization
Met Investors Series Trust (the “Trust”) is organized as a statutory trust under the laws of Delaware, as an open-end management investment company under the Investment Company Act of 1940, as amended (the “1940 Act”). The Trust currently offers fifty-four Portfolios (the “Portfolios”), each of which operates as a distinct investment vehicle of the Trust. The portfolio included in this report is Met/Franklin Low Duration Total Return Portfolio (the “Portfolio”) (commenced operations on April 29, 2011), which is diversified. Shares in the Portfolio are not offered directly to the general public and are currently available only to separate accounts established by Metropolitan Life Insurance Company (“MetLife”) and other affiliated life insurance companies.
The Portfolio has registered four classes of shares: Class A, B, C and E Shares. Class A and B Shares are currently offered by the Portfolio. Shares of each Class of the Portfolio represent an equal pro rata interest in the Portfolio and generally give the shareholder the same voting, dividend, liquidation, and other rights. Investment income, realized and unrealized capital gains and losses, the common expenses of the Portfolio and certain Portfolio-level expense reductions, if any, are allocated on a pro rata basis to each Class based on the relative net assets of each Class to the net assets of the Portfolio. Each Class of shares differs in its respective distribution expenses.
2. Significant Accounting Policies
The financial statements have been prepared in conformity with accounting principles generally accepted in the United States of America (“GAAP”) which require management to make estimates and assumptions that affect the reported amounts of assets and liabilities at the date of the financial statements and the reported amounts of income and expenses during the reporting period. Actual results could differ from these estimates. In the preparation of these financial statements, management has evaluated events and transactions subsequent to June 30, 2011 through the date that the financial statements were issued.
The following is a summary of significant accounting policies consistently followed by the Portfolio in the preparation of its financial statements.
Investment Valuation and Fair Value Measurements - Debt securities (other than short term obligations with a remaining maturity of sixty days or less) including corporate, convertible and municipal bonds and notes; U.S. government agencies; U.S. treasury obligations; sovereign issues; bank loans; and non-U.S. bonds are generally valued on the basis of evaluated or composite bid quotations obtained by independent pricing services and/or brokers and dealers selected by MetLife Advisers, LLC (“MLA” or the “Adviser”), an affiliate of MetLife, Inc., or the relevant Subadviser pursuant to authorization of the Board of Trustees of the Portfolio (the “Board”). Such quotations use inputs that are observable including, among other things, issuer details, interest rates, yield curves, prepayment speeds, credit risks/spreads, default rates and quoted prices for similar securities. Securities that use similar valuation techniques and inputs as described above are categorized as Level 2 within the fair value hierarchy.
Mortgage and asset-backed securities are usually issued as separate tranches, or classes, of securities within each deal. These securities are also generally valued on the basis of evaluated or composite bid quotations obtained by independent pricing services and/or brokers and dealers selected by the Adviser or relevant Subadviser pursuant to authorization of the Board. The pricing models for these securities usually consider tranche-level attributes, estimated cash flows for each tranche, market-based yield spreads for each tranche and current market data, and incorporate deal collateral performance, as available. Mortgage and asset-backed securities that use similar valuation techniques and inputs as described above are categorized as Level 2 within the fair value hierarchy.
Short term obligations with a remaining maturity of sixty days or less are valued at amortized cost which approximates fair market value and are categorized as Level 2 within the fair value hierarchy.
Equity securities such as common stock, exchange-traded funds and preferred stock that are traded on a national securities exchange or other exchanges are generally valued at their last sale price on the principal trading market. Equity securities traded on a national securities exchange or other exchanges for which there is no reported sale during the day are valued at the last reported bid price. A security that is listed or traded on more than one exchange is valued at the quotation on the exchange determined to be the primary market for that security by the Board or its delegates. If no closing price is available, then such securities are valued at the last reported bid price. Equity securities traded over-the-counter are generally valued at the last reported sales price. To the extent these securities are actively traded and valuation adjustments are not applied, they are categorized as Level 1 within the fair value hierarchy. Other equity securities traded on inactive markets or valued by reference to similar instruments are categorized as Level 2 within the fair value hierarchy.
Equity securities which are listed on foreign stock exchanges normally are valued at the market closing price, the last sale price on the day the securities are valued or, lacking any sales on such day, at the bid price. Valuation adjustments may be applied to certain equity securities that are solely traded on foreign exchanges closing before the U.S. market to account for the market movement between the close of the foreign exchanges and the close of the U.S. market. The Portfolio may use a systematic fair valuation model provided by an independent third party to value securities principally traded in these foreign markets closing before the U.S. market in order to adjust for possible stale pricing that may occur between the close of these foreign exchanges and the time of the Portfolio valuation. Securities using these valuation adjustments are categorized as Level 2 within the fair value hierarchy.
17
MET INVESTORS SERIES TRUST
| | |
Met/Franklin Low Duration Total Return Portfolio | | |
Notes to Financial Statements—June 30, 2011 (Unaudited)—(Continued)
2. Significant Accounting Policies - continued
Investments in registered open-end management investment companies are valued at reported net asset value per share and are categorized as Level 1 within the fair value hierarchy.
Forward foreign currency exchange contracts are valued based on the mean between closing bid and asked prices of the forward currency rates in the London foreign exchange markets on a daily basis as provided by a reliable bank or dealer. These contracts are categorized as Level 2 within the fair value hierarchy.
Options, whether on securities, indices, futures contracts, or otherwise, are valued at the last sales price available as of the close of business on the day of valuation or, if there is no such sale price available, at the bid price. Options on currencies are valued at the spot price each day. These types of options are categorized as Level 1 within the fair value hierarchy. Other options traded on inactive markets where a broker quotation is received or options valued by an evaluated quote provided by an independent pricing vendor are categorized as Level 2 within the fair value hierarchy.
Futures contracts, which are traded on commodity exchanges, are valued at their closing prices as of the close of such exchanges and are categorized as Level 1 within the fair value hierarchy. Futures contracts traded on inactive markets where a broker quotation is received are categorized as Level 2 within the fair value hierarchy. As a general matter, futures contracts are marked-to-market daily.
Options and futures contracts that are traded over-the-counter are generally valued on the basis of broker dealer quotations or pricing service providers who use a series of techniques, including simulation pricing models, to determine the value of the contracts. The pricing models use inputs that are observed from actively quoted markets such as issuer details, indices, spreads, interest rates, curves and exchange rates. These contracts are categorized as Level 2 within the fair value hierarchy.
If no current market value quotation or other observable inputs are readily available or reliable for a security, the fair value of the security will be determined in accordance with procedures approved by and under the general supervision of the Board. The Board has delegated the determination in good faith of the fair value of securities for which current market quotations are not readily available to a Valuation Committee established by the Board. Market quotes and other observable inputs are considered not readily available in circumstances where there is an absence of current or reliable market-based data. In addition, market quotes would be considered not readily available when, due to extraordinary circumstances, the exchanges or markets on which the securities trade, do not open for trading for the entire day and no other market prices are available. When the Portfolio uses fair value pricing, it may take into account any factors it deems appropriate, including significant unobservable inputs. The value of securities used by the Portfolio to calculate its net asset value may differ from quoted or published prices for the same securities. Fair value pricing involves subjective judgments and the fair value determined for a security may be materially different than the value that could be realized upon the sale of that security. These securities are categorized as Level 3 within the fair value hierarchy.
Investment Transactions and Related Investment Income - Portfolio security transactions are recorded on the trade date. Dividend income is recorded on the ex-dividend date or, for certain foreign securities, when notified. Interest income, which includes amortization of premium and accretion of discount on debt securities, is recorded on the accrual basis. Realized gains and losses on investments and unrealized appreciation and depreciation are determined on the identified cost basis, which is the same basis used for federal income tax purposes. Foreign income and foreign capital gains on some foreign securities may be subject to foreign withholding taxes, which are accrued as applicable.
Income Taxes - It is the Portfolio’s policy to comply with the requirements of the Internal Revenue Code of 1986, as amended (the “Code”), and regulations thereunder, applicable to regulated investment companies and to distribute, with respect to each taxable year, all of its taxable income to shareholders. Therefore, no federal income tax provision is required. The Portfolio files U.S. federal and various state tax returns. No income tax returns are currently under examination. The Portfolio’s federal tax returns will remain subject to examination by the Internal Revenue Service for three fiscal years after the returns are filed.
Dividends and Distributions to Shareholders - The Portfolio records dividends and distributions on the ex-dividend date. Net realized gains from security transactions (if any) are generally distributed annually to shareholders. The timing and characterization of certain income and capital gains distributions are determined in accordance with federal tax regulations that may differ from GAAP. Permanent book and tax basis differences relating to shareholder distributions will result in reclassification between under/over distributed net investment income, accumulated net realized gains/losses and paid in surplus. Book-tax differences are primarily due to futures transactions, foreign currency transactions, swap transactions, options transactions, premium amortization adjustments, paydown transactions, contingent payment debt instrument adjustments, forward transactions, deferred trustees’ compensation, and losses deferred due to wash sales, as applicable. These adjustments have no impact on net assets or the results of operations.
Repurchase Agreements - The Portfolio may enter into repurchase agreements with selected commercial banks and broker-dealers, under which the Portfolio acquires securities as collateral and agrees to resell the securities at an agreed upon time and at an agreed upon price. The Portfolio, through the custodian or a subcustodian, receives delivery of the underlying securities collateralizing repurchase agreements. The Portfolio requires the custodian to take possession, to have legally segregated in the Federal Reserve Book Entry System, or to have segregated
18
MET INVESTORS SERIES TRUST
| | |
Met/Franklin Low Duration Total Return Portfolio | | |
Notes to Financial Statements—June 30, 2011 (Unaudited)—(Continued)
2. Significant Accounting Policies - continued
within the custodian’s vault, all securities held as collateral for repurchase agreements. It is the Portfolio’s policy that the market value of the collateral be at least equal to 100% of the repurchase price in the case of a repurchase agreement of one-day duration and 102% of the repurchase price in the case of all other repurchase agreements. In connection with transactions in repurchase agreements, if the seller defaults and the value of the collateral declines or if the seller enters an insolvency proceeding, realization of the collateral by the Portfolio may be delayed, limited or wholly denied.
Foreign Currency Translation - The books and records of the Portfolio are maintained in U.S. dollars. The values of securities, currencies and other assets and liabilities denominated in currencies other than U.S. dollars are translated into U.S. dollars based upon foreign exchange rates prevailing at the end of the period. Purchases and sales of investment securities, income and expenses are translated on the respective dates of such transactions. Since the values of investment securities are presented at the foreign exchange rates prevailing at the end of the period, it is not practical to isolate that portion of the results of operations arising from changes in exchange rates from that portion of the results of operations reflecting fluctuations arising from changes in market prices of the investment securities. Such fluctuations are included in the net realized and unrealized gain or loss on investments.
Net realized foreign exchange gains or losses arise from activity in forward foreign currency exchange contracts, sales of foreign currency, currency gains or losses realized between the trade and settlement dates on securities transactions, and the difference between the amounts of dividends, interest, and foreign withholding taxes recorded by the Portfolio and the U.S. dollar equivalent of the amounts actually received or paid by the Portfolio. Gains and losses attributable to foreign currency exchange rates on sales of securities are recorded as Net realized gains and losses on investments. Net unrealized foreign exchange gains and losses arise from changes in the value of assets and liabilities, other than investment securities, resulting from changes in foreign exchange rates.
Forward Commitments and When-Issued and Delayed-Delivery Securities - The Portfolio may purchase securities on a when-issued or delayed delivery basis and may purchase or sell securities on a forward commitment basis. Settlement of such transactions normally occurs within a month or more after the purchase or sale commitment is made. The Portfolio may purchase securities under such conditions only with the intention of actually acquiring them, but may enter into a separate agreement to sell the securities before the settlement date. Since the value of securities purchased may fluctuate prior to settlement, the Portfolio may be required to pay more at settlement than the security is worth. In addition, the purchaser is not entitled to any of the interest earned prior to settlement. Upon making a commitment to purchase a security on a when-issued, delayed delivery or forward commitment basis, the Portfolio will hold liquid assets in a segregated account at the Portfolio’s custodian bank worth at least the equivalent of the amount due. The liquid assets will be monitored on a daily basis and adjusted as necessary to maintain the necessary value.
Loan Participations - The Portfolio may invest in loans arranged through private negotiation between one or more financial institutions. The Portfolio’s investment in any such loan may be in the form of a participation in or an assignment of the loan. In connection with purchasing participations, the Portfolio generally will have no right to enforce compliance by the borrower with the terms of the loan agreement relating to the loan, nor any rights of set-off against the borrower and the Portfolio may not benefit directly from any collateral supporting the loan in which it has purchased the participation.
Mortgage Related and Other Asset Backed Securities - The Portfolio may invest in mortgage related or other asset-backed securities. These securities may include mortgage pass-through securities, collateralized mortgaged obligations (“CMOs”), commercial mortgage-backed securities, mortgage dollar rolls, CMO residuals, stripped mortgage backed securities (“SMBS”) and other securities that directly or indirectly represent a participation in, or are secured by or payable from, mortgage loans on real property or other receivables. The value of some mortgage or asset-backed securities may be particularly sensitive to changes in prevailing interest rates. Early repayment of principal on some mortgage-related securities may expose the Portfolio to a lower rate of return upon reinvestment of principal. The value of these securities may fluctuate in response to the market’s perception of the creditworthiness of the issuers. Additionally, although mortgages and mortgage-related securities are generally supported by some form of government or private guarantee and/or insurance, there is no assurance that private guarantors or insurers will meet their obligations.
In one type of SMBS, one class receives all of the interest from the mortgage assets (the interest-only or “IO” class), while the other class will receive all of the principal (the principal-only or “PO” class). Payments received for the IOs are included in interest income on the Statement of Operations of the Portfolio. Because principal will not be received at the maturity of an IO, adjustments are made to the book value of the security until maturity. These adjustments are included in interest income on the Statement of Operations of the Portfolio. Payments received for POs are treated as reductions to the cost and par value of the securities. Details of mortgage related and other asset-backed securities held by the Portfolio are included in the Portfolio’s Schedule of Investments.
The Portfolio may invest a significant portion of its assets in securities of issuers that hold mortgage and asset-backed securities and direct investments in securities backed by commercial and residential mortgage loans and other financial assets. The value and related income of these securities are sensitive to changes in economic conditions, including delinquencies and/or defaults, and may be negatively impacted by increased volatility of market prices and periods of illiquidity.
19
MET INVESTORS SERIES TRUST
| | |
Met/Franklin Low Duration Total Return Portfolio | | |
Notes to Financial Statements—June 30, 2011 (Unaudited)—(Continued)
High Yield Debt Securities - The Portfolio may invest in high yield debt securities, or “junk bonds,” which are securities that are rated below “investment grade” or, if not rated, are of equivalent quality. A portfolio with high yield debt securities generally will be exposed to greater market risk and credit risk than a portfolio that invests only in investment grade debt securities because issuers of high yield debt securities are less secure financially, are more likely to default on their obligations, and their securities are more sensitive to interest rate changes and downturns in the economy. In addition, the secondary market for lower-rated debt securities may not be as liquid as that for more highly rated debt securities. As a result, the Portfolio’s Subadviser may find it more difficult to value lower-rated debt securities or sell them and may have to sell them at prices significantly lower than the values assigned to them by the Portfolio.
3. Investment Management Agreement and Other Transactions with Affiliates
Investment Management Agreement - The Trust is managed by the Adviser. The Trust has entered into a management agreement with the Adviser (the “Management Agreement”) for investment management services in connection with the investment management of the Portfolio. The Adviser is subject to the supervision and direction of the Board and has overall responsibility for the general management and administration of the Trust. The Adviser has entered into a subadvisory agreement with Franklin Advisers, Inc. (the “Subadviser”) for investment subadvisory services in connection with the investment management of the Portfolio.
Subject to the supervision and direction of the Board, the Adviser supervises the Subadviser and has full discretion with respect to the retention or renewal of the subadvisory agreement. The Adviser pays the Subadviser a fee based on the Portfolio’s average daily net assets.
Under the terms of the Portfolio’s Management Agreement, the Portfolio pays the Adviser a monthly fee based upon annual rates applied to the Portfolio’s average daily net assets as follows:
| | | | | | |
Management Fees
earned by the Adviser
for the period ended
June 30, 2011 | | % per annum | | | Average Daily Net Assets |
| | |
| $602,859 | | | 0.520 | % | | First $100 Million |
| | |
| | | 0.510 | % | | $100 Million to $250 Million |
| | |
| | | 0.500 | % | | $250 Million to $500 Million |
| | |
| | | 0.490 | % | | $500 Million to $1 Billion |
| | |
| | | 0.470 | % | | $1 Billion to $1.5 Billion |
| | |
| | | 0.450 | % | | Over $1.5 Billion |
Certain officers and trustees of the Trust may also be officers of the Adviser; however, such officers and trustees receive no compensation from the Trust.
Management Fee Waiver - The subadvisory fee the Adviser pays to the Subadviser in connection with the investment management of the Portfolio is calculated based on the aggregate average daily net assets of the Portfolio and certain other portfolios of the Trust that are managed by the Subadviser and/or its affiliates.
From May 1, 2011 through May 23, 2011, the Adviser contractually agreed to waive a portion of the management fee reflecting the difference, if any, between the subadvisory fee payable by the Adviser to the Subadviser that was calculated based solely on the assets of the Portfolio and the fee that was calculated when the Portfolio’s assets were aggregated with those of the Met/Franklin Income Portfolio, Met/Franklin Mutual Shares Portfolio and Met/Templeton Growth Portfolio, each a series of the Trust. Over the same period of time, the assets of Met/Templeton International Bond Portfolio were included on a voluntary basis for purposing of determining the amount of the management fee waiver. Effective May 24, 2011, the assets of Met/Templeton International Bond Portfolio were contractually added to the calculation of the management fee waiver.
Amounts waived for the period ended June 30, 2011 are shown as a management fee waiver in the Statement of Operations.
Transfer Agency Agreement - MetLife serves as the transfer agent for the Trust. MetLife receives no fees for its services to the Trust under the transfer agency agreement.
Expense Limitation Agreement - The Adviser has entered into an expense limitation agreement with the Trust (“Expense Limitation Agreement”) in the interest of limiting expenses of the Portfolio. The Expense Limitation Agreement shall continue in effect with respect to the Portfolio until April 30, 2012. Pursuant to that Expense Limitation Agreement, the Adviser has agreed to waive or limit its fees and to assume other expenses so that the total annual operating expenses of the Portfolio other than interest, taxes, brokerage commissions, other expenditures which are capitalized or expensed in accordance with GAAP, other extraordinary expenses not incurred in the ordinary course of the Portfolio’s business
20
MET INVESTORS SERIES TRUST
| | |
Met/Franklin Low Duration Total Return Portfolio | | |
Notes to Financial Statements—June 30, 2011 (Unaudited)—(Continued)
3. Investment Management Agreement and Other Transactions with Affiliates - continued
and acquired fund fees and expenses but including amounts payable pursuant to a plan adopted in accordance with Rule 12b-1 under the 1940 Act, are limited to the following expense ratios as a percentage of the Portfolio’s average daily net assets:
| | | | |
Maximum Expense Ratio under current
Expense Limitation Agreement | |
| Class A | | Class B | |
| |
| 0.75% | | | 1.00 | % |
If in any year in which the Management Agreement is still in effect, the estimated aggregate operating expenses of the Portfolio for the fiscal year are less than the Maximum Expense Ratios for that year, subject to approval by the Trust’s Board, the Adviser shall be entitled to reimbursement by the Portfolio to the extent that the charge does not cause the expenses in such subsequent year to exceed the Maximum Expense Ratios as stated above. The Portfolio is not obligated to repay any expense paid by the Adviser more than five years after the end of the fiscal year in which such expense was incurred.
Distribution Agreement and Plan - The Trust has a distribution agreement with MetLife Investors Distribution Company (“MIDC” or the “Distributor”) in which MIDC serves as the Distributor for the Trust’s Class A and Class B Shares. MIDC is a wholly-owned subsidiary of MetLife Investors Group, Inc., an affiliate of the Adviser. The Class B distribution plan provides that the Trust, on behalf of the Portfolio, may pay annually up to 0.50% of the average net daily assets of the Portfolio attributable to its Class B Shares with respect to activities primarily intended to result in the sale of Class B Shares. However, under the Class B distribution agreement, payments to the Distributor for activities pursuant to the Class B distribution plan are currently limited to payments at an annual rate equal to 0.25% of average daily net assets of the Portfolio attributable to its Class B Shares. Amounts incurred by the Portfolio for the period ended June 30, 2011 are shown as Distribution and service fees in the Statement of Operations.
Under the terms of the Class B distribution plan and distribution agreement, the Portfolio is authorized to make payments monthly to the Distributor that may be used to pay or reimburse entities providing distribution and shareholder servicing with respect to the Class B Shares for such entities’ fees or expenses incurred.
Deferred Trustee Compensation - Each Trustee of the Trust who is not currently an employee of the Adviser or any of its affiliates receives compensation from the Trust for his or her service to the Portfolio. A deferred compensation plan (the “Plan”) is available to the Trustees on a voluntary basis. Deferred amounts remain in the Trust until distributed in accordance with the provisions of the Plan. The value of a participating Trustee’s deferral account is based on theoretical investments of deferred amounts, on the normal payment dates, in certain portfolios of the Trust or Metropolitan Series Fund, Inc. as designated by the participating Trustee. Changes in the value of participants’ deferral accounts are reflected as Trustees’ fees and expenses in the Statement of Operations. The portion of the accrued obligations allocated to the Portfolio, if any, under the Plan are reflected as Deferred trustees’ fees in the Statement of Assets and Liabilities.
4. Investment Transactions
Aggregate cost of purchases and proceeds of sales of investment securities, excluding short-term securities, for the period ended June 30, 2011 were as follows:
| | | | | | | | | | | | | | | | | | | | |
| Purchases | | | Sales | |
| U.S. Government | | Non U.S. Government | | | Foreign Government | | | U.S. Government | | | Non U.S. Government | | | Foreign Government | |
| | | | | |
| $630,598,573 | | $ | 319,782,677 | | | $ | 76,498,354 | | | $ | 316,518,234 | | | $ | 8,101,164 | | | $ | — | |
5. Investments in Derivative Instruments
Investments in Derivative Instruments - Disclosures about derivative instruments are intended to improve financial reporting for derivative instruments by requiring enhanced disclosure that enables investors to understand how and why a Portfolio uses derivatives, how derivatives are accounted for, and how derivative instruments affect the Portfolio’s results of operations and financial position. Summarized below are the specific types of derivative instruments utilized by the Portfolio.
Forward Foreign Currency Exchange Contracts - The Portfolio may enter into forward foreign currency exchange contracts to obtain investment exposure, enhance return or hedge or protect its portfolio holdings against the risk of future movements in certain foreign currency exchange rates. When entering into these contracts, the Portfolio agrees to receive or deliver a fixed quantity of foreign currency for an agreed-upon price on an agreed upon future date. These contracts are valued daily and the Portfolio’s net equity therein, representing unrealized gain or loss on the contracts as measured by the difference between the forward foreign exchange rates at the dates of entry into the contracts and the forward foreign exchange rates at the value date, is included in the Statement of Assets and Liabilities. When a contract is closed, the Portfolio recognizes a realized gain or loss equal to the difference between the value of the contract at the time it was opened and the value at the time it was closed.
21
MET INVESTORS SERIES TRUST
| | |
Met/Franklin Low Duration Total Return Portfolio | | |
Notes to Financial Statements—June 30, 2011 (Unaudited)—(Continued)
5. Investments in Derivative Instruments - continued
Realized and unrealized gains and losses on forward foreign currency exchange contracts are included in the Statement of Operations. These contracts involve market and/or credit risk in excess of the amount recognized in the Statement of Assets and Liabilities.
The use of forward foreign currency exchange contracts does not eliminate fluctuations in the underlying prices of the securities of the Portfolio, but it does establish a rate of exchange that can be achieved in the future. Although forward foreign currency exchange contracts to sell limit the risk of loss due to a decline in the value of the currency holdings, they also limit any potential gain that might result should the value of the currency increase. In addition, the Portfolio could be exposed to risks if the counterparties to the contracts are unable to meet the terms of the contracts.
Futures Contracts - The Portfolio may buy and sell futures contracts (on recognized exchanges) as a hedge, to maintain investment exposure to a target asset class or to enhance return. The Portfolio may be subject to fluctuations in equity prices, interest rates, and foreign currency exchange rates in the normal course of pursuing its investment objective. Futures contracts are standardized agreements to buy or sell a security, or deliver a final cash settlement price in connection with an index, interest rate, currency, or other asset, for a set price in the future. The Portfolio must deposit an amount (“initial margin”) equal to a certain percentage of the face value of the futures contract. The initial margin may be in the form of cash or securities which is returned when the Portfolio’s obligations under the contract have been satisfied. Futures contracts are marked-to-market daily and subsequent payments (“variation margin”) are made or received by the Portfolio depending on the daily fluctuations in the value of the futures contract. These amounts are reflected as receivables or payables on the Statement of Assets and Liabilities. Risks of entering into futures contracts (and related options) include the possibility that the market for these instruments may be illiquid and that a change in the value of the contract or option may not correlate perfectly with changes in the value of the underlying securities. Futures contracts are exchange traded and the exchange’s clearinghouse, as counterparty to all exchange traded futures, guarantees the futures contracts against default.
Swap Agreements - The Portfolio may enter into swap contracts. Swap contracts are derivatives agreements to exchange the return generated by one instrument for the return generated by another instrument. The payment streams are calculated by reference to a specified index and agreed upon notional amount. The term “specified index” includes, but is not limited to, currencies, fixed interest rates, prices and total return on interest rate indices, fixed income indices, stock indices and commodity indices (as well as amounts derived from arithmetic operations on these indices). A Portfolio will usually enter into swaps on a net basis, i.e., the two payment streams are netted out in a cash settlement on the payment date or dates specified in the instrument, with the Portfolio receiving or paying, as the case may be, only the net amount of the two payments. The Portfolio’s obligations under a swap agreement will be accrued daily (offset against any amounts owing to the Portfolio) and any accrued but unpaid net amounts owed to a swap counterparty will be covered by designating the segregation, either on its records or with the Trust’s custodian, of cash or other liquid assets, to avoid any potential leveraging of the Portfolio. The Portfolio may enter into swap transactions with counterparties that are approved by the investment adviser in accordance with guidelines established by the Board. These guidelines provide for a minimum credit rating for each counterparty and various credit enhancement techniques (for example, collateralization of amounts due from counterparties) to limit exposure to counterparties that have lower credit ratings.
The swaps in which the Portfolio may engage may include instruments under which one party pays a single or periodic fixed amount(s) (or premium), and the other party pays periodic amounts based on the movement of a specified index. Swaps do not involve the delivery of securities, other underlying assets, or principal. Accordingly, the risk of loss with respect to swaps is limited to the net amount of payments the Portfolio is contractually obligated to receive. If the other party to a swap defaults, the Portfolio’s risk of loss consists of the net amount of payments that the Portfolio contractually is entitled to receive.
An index swap is an agreement to swap cash flows on a notional amount based on changes in the values of the reference indices.
A currency swap is an agreement to exchange cash flows on a notional amount of two or more currencies based on the relative value differential among them. Such swaps may involve initial and final exchanges that correspond to the agreed upon notional amount. Currency swaps usually involve the delivery of the entire principal value of one designated currency in exchange for the other designated currency. Therefore, the entire principal value of a currency swap is subject to the risk that the other party to the swap will default on its contractual delivery obligations. If there is a default by the counterparty, the Portfolio may have contractual remedies pursuant to the agreements related to the transaction.
Equity swaps are two-party contracts that generally obligate one party to pay the positive return and the other party to pay the negative return on a specified reference security, basket of securities, security index or index component during the period of the swap. Equity swap contracts are marked to market daily based on the value of the underlying security and the change, if any, is recorded as an unrealized gain or loss. Equity swaps normally do not involve the delivery of securities or other underlying assets. If the other party to an equity swap defaults, a Portfolio’s risk of loss consists of the net amount of payments that such Portfolio is contractually entitled to receive, if any. Equity swaps are derivatives and their value can be very volatile.
The use of swaps is a highly specialized activity that involves investment techniques and risks different from those associated with ordinary portfolio securities transactions. If an investment adviser is incorrect in its forecasts of market values, interest rates, and currency exchange rates, the investment performance of the Portfolio would be less favorable than it would have been if this investment technique were not used.
22
MET INVESTORS SERIES TRUST
| | |
Met/Franklin Low Duration Total Return Portfolio | | |
Notes to Financial Statements—June 30, 2011 (Unaudited)—(Continued)
5. Investments in Derivative Instruments - continued
Credit Default Swaps - The Portfolio is subject to credit risk in the normal course of pursuing its investment objectives. The Portfolio may enter into credit default swaps to manage its exposure to the market or certain sectors of the market, to reduce its risk exposure to defaults of corporate and sovereign issuers, or to create exposure to corporate or sovereign issuers to which it is not otherwise exposed. As the seller in a credit default swap contract, the Portfolio would be required to pay the par (or other agreed upon) value of a referenced debt obligation to the counterparty in the event of a default by a third party, such as a U.S. or foreign corporate issuer, on the debt obligation. In return, the Portfolio would receive from the counterparty an upfront or periodic stream of payments over the term of the contract provided that no event of default has occurred. If no default occurs, the Portfolio would keep the stream of payments and would have no payment obligations. An upfront payment received by the Portfolio is recorded as a liability on the books. An upfront payment made by the Portfolio is recorded as an asset on the books. As the seller, the Portfolio would be subject to investment exposure on the notional amount of the swap. The Portfolio may also purchase credit default swap contracts in order to hedge against the risk of default of debt securities held in its portfolio. This would involve the risk that the investment may expire worthless and would only generate income in the event of an actual default by the issuer of the underlying obligation (as opposed to a credit downgrade or other indication of financial instability). It would also involve credit risk—the seller may fail to satisfy its payment obligations to the Portfolio in the event of a default. The Portfolio’s maximum risk of loss from counterparty risk, either as the protection seller or as the protection buyer, is the unrealized appreciation of the contract. This risk is mitigated by having a master netting arrangement between the Portfolio and the counterparty and by the posting of collateral by the counterparty to the Portfolio to cover the Portfolio’s exposure to the counterparty.
Implied credit spreads, represented in absolute terms, utilized in determining the market value of credit default swap agreements on corporate issues or sovereign issues of an emerging country as of period end are disclosed in Note 8 to the Notes to Financials Statements and serve as an indicator of the status of the payment/performance risk and represent the likelihood or risk of default for the credit derivative. The implied credit spread of a particular referenced entity reflects the cost of buying/selling protection and may include upfront payments required to be made to enter into the agreement. For credit default swap agreements on asset-backed securities and credit indices, the quoted market prices and resulting values serve as the indicator of the current status of the payment/performance risk. Wider credit spreads represent a deterioration of the referenced entity’s credit soundness and a greater likelihood or risk of default or other credit event occurring as defined under the terms of the agreement.
The maximum potential amount of future payments (undiscounted) that a Portfolio as a seller of protection could be required to make under a credit default swap agreement would be an amount equal to the notional amount of the agreement. Notional amounts of all credit default swap agreements outstanding as of June 30, 2011 for which a Portfolio is the seller of protection are disclosed in Note 8 to the Notes to Financials Statements. These potential amounts would be partially offset by any recovery values of the respective referenced obligations, upfront payments received upon entering into the agreement, or net amounts received from the settlement of buy protection credit default swap agreements entered into by a Portfolio for the same referenced entity or entities.
Swap agreements are marked to market daily. The change in value, if any, is recorded as unrealized gain or loss in the Statement of Operations. A liquidation payment received or made at the termination of the swap is recorded as realized gain or loss in the Statement of Operations. Net periodic payments are included as part of realized gain (loss) on the Statement of Operations.
At June 30, 2011, the Portfolio had the following derivatives, grouped into appropriate risk categories:
| | | | | | | | | | | | |
| | | Asset Derivatives | | | Liability Derivatives | |
Risk Exposure | | Statement of Assets &
Liabilities Location | | Fair Value | | | Statement of Assets &
Liabilities Location | | Fair Value | |
| | | | |
Credit Risk | | Unrealized appreciation on swap contracts | | $ | 515,062 | | | Unrealized depreciation on swap contracts | | $ | 561,258 | |
| | | | |
| | Unrealized appreciation on futures contracts* | | | — | | | Unrealized depreciation on futures contracts* | | | 38,200 | |
| | | | |
Foreign Currency Exchange | | Unrealized appreciation on forward foreign currency exchange contracts | | | 549,861 | | | Unrealized depreciation on forward foreign currency exchange contracts | | | 590,344 | |
| | | | | | | | | | | | |
| | | | |
Total | | | | $ | 1,064,923 | | | | | $ | 1,189,802 | |
| | | | | | | | | | | | |
| * | | Includes cumulative appreciation/depreciation of futures contracts as reported in the notes to financial statements. Only the current day’s variation margin is reported within the Statement of Assets & Liabilities. |
23
MET INVESTORS SERIES TRUST
| | |
Met/Franklin Low Duration Total Return Portfolio | | |
Notes to Financial Statements—June 30, 2011 (Unaudited)—(Continued)
5. Investments in Derivative Instruments - continued
Transactions in derivative instruments during the period ended June 30, 2011, were as follows:
| | | | | | | | | | | | | | | | |
Statement of Operations Location - Net Realized Gain (Loss) | | Credit | | | Interest Rate | | | Foreign Currency
Exchange | | | Total | |
| | | | |
Futures contracts | | $ | — | | | $ | (44,045 | ) | | $ | — | | | $ | (44,045 | ) |
| | | | |
Swap contracts | | | (2,783 | ) | | | — | | | | — | | | | (2,783 | ) |
| | | | | | | | | | | | | | | | |
| | $ | (2,783 | ) | | $ | (44,045 | ) | | $ | — | | | $ | (46,828 | ) |
| | | | | | | | | | | | | | | | |
| | | | |
Statement of Operations Location - Net Change in Unrealized Gain
(Loss) | | | | | | | | | | | | |
| | | | |
Foreign currency transactions | | $ | — | | | $ | — | | | $ | (40,483 | ) | | $ | (40,483 | ) |
| | | | |
Futures contracts | | | — | | | | (38,200 | ) | | | — | | | | (38,200 | ) |
| | | | |
Swap contracts | | | (46,196 | ) | | | — | | | | — | | | | (46,196 | ) |
| | | | | | | | | | | | | | | | |
| | $ | (46,196 | ) | | $ | (38,200 | ) | | $ | (40,483 | ) | | $ | (124,879 | ) |
| | | | | | | | | | | | | | | | |
For the period ended June 30, 2011, the average amount or number per contract outstanding for each derivative type was as follows:
| | | | | | | | | | | | | | | | |
Average Notional or Face Amount(a) | | Credit Risk | | | Interest Rate
Risk | | | Foreign Currency
Risk | | | Total | |
| | | | |
Foreign currency transactions | | $ | — | | | $ | — | | | $ | 71,546,270 | | | $ | 71,546,270 | |
| | | | |
Futures contracts short | | | — | | | | (15,500,000 | ) | | | — | | | | (15,500,000 | ) |
| | | | |
Swap contracts | | | 75,476,319 | | | | — | | | | — | | | | 75,476,319 | |
(a) Averages are based on daily activity levels during 2011.
6. Forward Foreign Currency Exchange Contracts
Forward Foreign Currency Exchange Contracts to Buy:
| | | | | | | | | | | | | | | | | | | | | | |
Settlement Date | | Counterparty | | Contracts to Buy | | | Value at
June 30, 2011 | | | In Exchange
for U.S.$ | | | Net Unrealized
Appreciation/
(Depreciation) | |
| | | | | | |
| 5/4/2012 | | Deutsche Bank AG | | | 1,129,880,000 | | | | CLP | | | $ | 2,332,951 | | | $ | 2,350,000 | | | $ | (17,049 | ) |
| | | | | | |
| 5/9/2012 | | JPMorgan Chase Bank N.A. | | | 1,133,875,000 | | | | CLP | | | | 2,339,938 | | | | 2,350,000 | | | | (10,062 | ) |
| | | | | | |
| 5/7/2012 | | JPMorgan Chase Bank N.A. | | | 118,818,000 | | | | INR | | | | 2,532,433 | | | | 2,520,000 | | | | 12,433 | |
| | | | | | |
| 5/7/2012 | | Deutsche Bank AG | | | 119,574,000 | | | | INR | | | | 2,548,546 | | | | 2,520,000 | | | | 28,546 | |
| | | | | | |
| 5/4/2012 | | JPMorgan Chase Bank N.A. | | | 128,788,870 | | | | PHP | | | | 2,907,595 | | | | 3,010,000 | | | | (102,405 | ) |
| | | | | | |
| 5/7/2012 | | Deutsche Bank AG | | | 129,673,810 | | | | PHP | | | | 2,926,963 | | | | 3,010,000 | | | | (83,037 | ) |
| | | | | | |
| 5/4/2012 | | Deutsche Bank AG | | | 1,623,132 | | | | SGD | | | | 1,324,006 | | | | 1,330,000 | | | | (5,994 | ) |
| | | | | | |
| 5/7/2012 | | Morgan Stanley | | | 1,629,622 | | | | SGD | | | | 1,329,320 | | | | 1,330,000 | | | | (680 | ) |
| | | | | | |
| 5/18/2012 | | Morgan Stanley | | | 3,496,264 | | | | SGD | | | | 2,852,137 | | | | 2,820,000 | | | | 32,137 | |
| | | | | | | | | | | | | | | | | | | | | | |
Net Unrealized Depreciation | | | | | | | | | | | | | | | | | | $ | (146,111 | ) |
| | | | | | | | | | | | | | | | | | | | | | |
24
MET INVESTORS SERIES TRUST
| | |
Met/Franklin Low Duration Total Return Portfolio | | |
Notes to Financial Statements—June 30, 2011 (Unaudited)—(Continued)
6. Forward Foreign Currency Exchange Contracts - continued
Forward Foreign Currency Exchange Contracts to Sell:
| | | | | | | | | | | | | | | | | | | | | | |
Settlement Date | | Counterparty | | Contracts to Deliver | | | Value at
June 30, 2011 | | | In Exchange
for U.S.$ | | | Net Unrealized
Appreciation/
(Depreciation) | |
| | | | | | |
| 5/4/2012 | | Deutsche Bank AG | | | 8550000 | | | | EUR | | | $ | 12,299,793 | | | $ | 12,549,690 | | | $ | 249,897 | |
| | | | | | |
| 5/7/2012 | | Citibank N.A. | | | 456,944 | | | | EUR | | | | 657,281 | | | | 672,028 | | | | 14,747 | |
| | | | | | |
| 5/7/2012 | | Deutsche Bank Securities, Inc. | | | 2,350,000 | | | | EUR | | | | 3,380,303 | | | | 3,441,105 | | | | 60,802 | |
| | | | | | |
| 5/7/2012 | | Morgan Stanley | | | 6,170,000 | | | | EUR | | | | 8,875,093 | | | | 9,022,083 | | | | 146,990 | |
| | | | | | |
| 5/10/2012 | | Citibank N.A. | | | 2,909,965 | | | | EUR | | | | 4,185,348 | | | | 4,121,093 | | | | (64,255 | ) |
| | | | | | |
| 5/10/2012 | | Deutsche Bank AG | | | 300,000 | | | | EUR | | | | 431,484 | | | | 422,238 | | | | (9,246 | ) |
| | | | | | |
| 5/16/2012 | | Deutsche Bank AG | | | 2,134,000 | | | | EUR | | | | 3,068,671 | | | | 2,993,575 | | | | (75,096 | ) |
| | | | | | |
| 5/25/2012 | | Deutsche Bank AG | | | 3,772,396 | | | | EUR | | | | 5,423,023 | | | | 5,240,612 | | | | (182,411 | ) |
| | | | | | |
| 6/6/2012 | | Deutsche Bank AG | | | 500,796 | | | | EUR | | | | 719,631 | | | | 715,358 | | | | (4,273 | ) |
| | | | | | |
| 6/11/2012 | | Deutsche Bank AG | | | 187,000 | | | | EUR | | | | 268,669 | | | | 270,901 | | | | 2,232 | |
| | | | | | |
| 7/5/2012 | | Deutsche Bank AG | | | 1,455,100 | | | | EUR | | | | 2,088,899 | | | | 2,080,211 | | | | (8,688 | ) |
| | | | | | |
| 5/9/2012 | | Deutsche Bank AG | | | 283,178,000 | | | | JPY | | | | 3,523,044 | | | | 3,500,000 | | | | (23,044 | ) |
| | | | | | |
| 5/9/2012 | | Morgan Stanley | | | 281,655,500 | | | | JPY | | | | 3,504,103 | | | | 3,500,000 | | | | (4,103 | ) |
| | | | | | |
| 5/17/2012 | | Morgan Stanley | | | 265,900,000 | | | | JPY | | | | 3,308,535 | | | | 3,310,611 | | | | 2,076 | |
| | | | | | | | | | | | | | | | | | | | | | |
Net Unrealized Appreciation | | | | | | | | | | | | | | | | | | | 105,628 | |
| | | | | | | | | | | | | | | | | | | | | | |
CLP—Chilean Peso
EUR—Euro
INR—Indian Rupee
JPY—Japanese Yen
PHP—Philippine Peso
SGD—Singapore Dollar
7. Futures Contracts
The futures contracts outstanding as of June 30, 2011 and the description and unrealized appreciation (depreciation) were as follows:
| | | | | | | | | | | | | | | | | | | | |
Futures Contracts - Short | | Expiration
Date | | | Number of
Contracts | | | Contract
Amount | | | Valuation as of
June 30, 2011 | | | Unrealized
Depreciation | |
| | | | | |
U.S. Treasury Note 10 Year Futures | | | 09/21/2011 | | | | (155 | ) | | $ | (18,922,659 | ) | | $ | (18,960,859 | ) | | $ | (38,200 | ) |
| | | | | | | | | | | | | | | | | | | | |
| | | | | |
Net Unrealized Depreciation | | | | | | | | | | | | | | | | | | $ | (38,200 | ) |
| | | | | | | | | | | | | | | | | | | | |
25
MET INVESTORS SERIES TRUST
| | |
Met/Franklin Low Duration Total Return Portfolio | | |
Notes to Financial Statements—June 30, 2011 (Unaudited)—(Continued)
8. Swap Agreements
Credit Default Swaps on Corporate and Sovereign Issuers - Buy Protection (a)
| | | | | | | | | | | | | | | | | | | | | | | | | | | | | | | | | | |
Reference Obligation | | Fixed Deal
(Pay) Rate | | | Maturity
Date | | | Counterparty | | Implied Credit
Spread at
June 30,
2011 (b) | | | Notional
Amount (c) | | | Market
Value | | | Upfront
Premium
Paid/(Received) | | | Unrealized
Appreciation/
(Depreciation) | |
| | | | | | | | | |
Hellenic Republic | | | (1.000 | %) | | | 06/20/14 | | | Citibank N.A. | | | 24.46 | % | | | EUR | | | | 4,000,000 | | | $ | 2,301,717 | | | $ | 1,908,358 | | | $ | 393,359 | |
| | | | | | | | | |
5.900%, due 10/22/2022 | | | | | | | | | | | | | | | | | | | | | | | | | | | | | | | | | | |
| | | | | | | | | |
Hilton Worldwide, Inc. | | | (5.000 | %) | | | 12/20/13 | | | Credit Suisse Group AG | | | 3.06 | % | | | USD | | | | 7,000,000 | | | | (323,922 | ) | | | (263,676 | ) | | | (60,246 | ) |
| | | | | | | | | |
4.761%, due 11/15/2013 | | | | | | | | | | | | | | | | | | | | | | | | | | | | | | | | | | |
| | | | | | | | | |
Republic of Ireland | | | (1.000 | %) | | | 06/20/16 | | | Credit Suisse Group AG | | | 7.49 | % | | | EUR | | | | 3,000,000 | | | | 966,203 | | | | 866,956 | | | | 99,247 | |
| | | | | | | | | |
4.500%, due 04/18/2020 | | | | | | | | | | | | | | | | | | | | | | | | | | | | | | | | | | |
| | | | | | | | | | | | | | | | | | | | | | | | | | | | | | | | | | |
| | | | | | | | | |
Total | | | | | | | | | | | | | | | | | | | | | | | | $ | 2,943,998 | | | $ | 2,511,638 | | | $ | 432,360 | |
| | | | | | | | | | | | | | | | | | | | | | | | | | | | | | | | | | |
Credit Default Swaps on Corporate and Sovereign Issues - Sell Protection (d)
| | | | | | | | | | | | | | | | | | | | | | | | | | | | | | | | | | | | |
Reference Obligation | | Fixed Deal
(Pay) Rate | | | Maturity
Date | | | Counterparty | | | Implied
Credit
Spread at
June 30,
2011 (b) | | | Notional
Amount (c) | | | Market
Value | | | Upfront
Premium
Paid/(Received) | | | Unrealized
Appreciation/
(Depreciation) | |
| | | | | | | | | |
Celanese US Holdings LLC | | | 1.800 | % | | | 06/20/16 | | | | Credit Suisse Group AG | | | | 1.93 | % | | | USD | | | | 500,000 | | | $ | (2,821 | ) | | $ | — | | | $ | (2,821 | ) |
| | | | | | | | | |
3.303%, due 10/31/2016 | | | | | | | | | | | | | | | | | | | | | | | | | | | | | | | | | | | | |
| | | | | | | | | |
Republic of Hungary | | | 1.000 | % | | | 06/20/16 | | | | Credit Suisse Group AG | | | | 2.64 | % | | | USD | | | | 700,000 | | | | (52,167 | ) | | | (50,370 | ) | | | (1,797 | ) |
| | | | | | | | | |
4.750%, due 02/03/2015 | | | | | | | | | | | | | | | | | | | | | | | | | | | | | | | | | | | | |
| | | | | | | | | |
Republic of Lithuania | | | 1.000 | % | | | 06/20/16 | | | | Credit Suisse Group AG | | | | 1.99 | % | | | USD | | | | 400,000 | | | | (18,287 | ) | | | (18,566 | ) | | | 279 | |
| | | | | | | | | |
4.500%, due 03/05/2013 | | | | | | | | | | | | | | | | | | | | | | | | | | | | | | | | | | | | |
| | | | | | | | | | | | | | | | | | | | | | | | | | | | | | | | | | | | |
| | | | | | | | | |
Total | | | | | | | | | | | | | | | | | | | | | | | | | | $ | (73,275 | ) | | $ | (68,936 | ) | | $ | (4,339 | ) |
| | | | | | | | | | | | | | | | | | | | | | | | | �� | | | | | | | | | | | |
Credit Default Swaps on Credit Indices - Sell Protection (d)
| | | | | | | | | | | | | | | | | | | | | | | | | | | | | | | | | | |
Reference Obligation | | Fixed Deal
(Pay) Rate | | | Maturity
Date | | | Counterparty | | Implied
Credit
Spread at
June 30,
2011 (b) | | | Notional
Amount (c) | | | Market
Value | | | Upfront
Premium
Paid/(Received) | | | Unrealized
Appreciation/
(Depreciation) | |
| | | | | | | | | |
CDX.NA.IG.16 | | | 1.000 | % | | | 06/20/16 | | | Credit Suisse Group AG | | | — | | | | USD | | | | 15,000,000 | | | $ | 55,986 | | | $ | 86,723 | | | $ | (30,737 | ) |
| | | | | | | | | |
LCDX.NA.15 | | | 2.500 | % | | | 12/20/15 | | | Credit Suisse Group AG | | | — | | | | USD | | | | 20,000,000 | | | | (197,500 | ) | | | 250,000 | | | | (447,500 | ) |
| | | | | | | | | |
MCDX.NA.16 | | | 1.000 | % | | | 06/20/16 | | | Citibank N.A. | | | — | | | | USD | | | | 15,000,000 | | | | (194,208 | ) | | | (216,385 | ) | | | 22,177 | |
| | | | | | | | | | | | | | | | | | | | | | | | | | | | | | | | | | |
| | | | | | | | | |
Total | | | | | | | | | | | | | | | | | | | | | | | | $ | (335,722 | ) | | $ | 120,338 | | | $ | (456,060 | ) |
| | | | | | | | | | | | | | | | | | | | | | | | | | | | | | | | | | |
26
MET INVESTORS SERIES TRUST
| | |
Met/Franklin Low Duration Total Return Portfolio | | |
Notes to Financial Statements—June 30, 2011 (Unaudited)—(Continued)
8. Swap Agreements - continued
Credit Default Swaps on Credit Indices - Buy Protection (d)
| | | | | | | | | | | | | | | | | | | | | | | | | | | | | | | | | | |
Reference Obligation | | Fixed Deal
(Pay) Rate | | | Maturity
Date | | | Counterparty | | Implied Credit
Spread at
June 30,
2011 (b) | | | Notional
Amount (c) | | | Market
Value | | | Upfront
Premium
Paid/(Received) | | | Unrealized
Appreciation/
(Depreciation) | |
| | | | | | | | | |
CDX.NA.IG.16 | | | 1.000 | % | | | 06/20/16 | | | Goldman Sachs & Co. | | | 0.92 | % | | | USD | | | | 10,000,000 | | | $ | 37,324 | | | $ | 55,481 | | | $ | (18,157 | ) |
| | | | | | | | | |
LCDX.NA.16 | | | 2.500 | % | | | 06/20/16 | | | Credit Suisse Group AG | | | — | | | | USD | | | | 4,000,000 | | | | (55,000 | ) | | | (55,000 | ) | | | — | |
| | | | | | | | | | | | | | | | | | | | | | | | | | | | | | | | | | |
| | | | | | | | | |
Total | | | | | | | | | | | | | | | | | | | | | | | | $ | (17,676 | ) | | $ | 481 | | | $ | (18,157 | ) |
| | | | | | | | | | | | | | | | | | | | | | | | | | | | | | | | | | |
EUR—Euro
USD— United States Dollar
| (a) | | If the Portfolio is a buyer of protection and a credit event occurs, as defined under the terms of that particular swap agreement, the Portfolio will either (i) receive from the seller of protection an amount equal to the notional amount of the swap and deliver the referenced obligation or underlying securities comprising the referenced index or (ii) receive a net settlement amount in the form of cash or securities equal to the notional amount of the swap less the recovery value of the referenced obligation or underlying securities comprising the referenced index. |
| (b) | | Implied credit spreads, represented in absolute terms, utilized in determining the market value of credit default swap agreements on corporate issues or sovereign issues of an emerging country as of period end serve as an indicator of the current status of the payment/performance risk and represent the likelihood or risk of default for the credit derivative. The implied credit spread of a particular referenced entity reflects the cost of buying/selling protection and may include upfront payments required to be made to enter into the agreement. Wider credit spreads represent a deterioration of the referenced entity’s credit soundness and a greater likelihood or risk of default or other credit event occurring as defined under the terms of the agreement. A credit spread identified as “Defaulted” indicates a credit event has occurred for the referenced entity or obligation. |
| (c) | | The maximum potential amount of future undiscounted payments that the Portfolio could be required to make under a credit default swap contract would be the notional amount of the contract. These potential amounts would be partially offset by any recovery values of the referenced debt obligation or net amounts received from the settlement purchased protection credit default swap contracts entered into by the Portfolio for the same referenced debt obligation. |
| (d) | | If the Portfolio is a seller of protection and a credit event occurs, as defined under the terms of that particular swap agreement, the Portfolio will either (i) pay to the buyer of protection an amount equal to the notional amount of the swap and take delivery of the referenced obligation or underlying securities comprising the referenced index or (ii) pay a net settlement amount in the form of cash or securities equal to the notional amount of the swap less the recovery value of the referenced obligation or underlying securities comprising the referenced index. |
9. Contractual Obligations
The Trust has a variety of indemnification obligations under contracts with its service providers. The Trust’s maximum exposure under these arrangements is unknown.
10. Market, Credit and Counterparty Risk
In the normal course of business, the Portfolio invests in securities and enters into transactions where risks exist due to fluctuations in the market (market risk) or failure of the other party to a transaction to perform (credit and counterparty risk). The value of securities held by the Portfolio may decline in response to certain events, including those directly involving the companies whose securities are owned by the Portfolio; conditions affecting the general economy; overall market changes; local, regional or global political, social or economic instability; and currency and interest rate and price fluctuations. The Portfolio may be exposed to counterparty risk, or the risk that an entity with which the Portfolio has unsettled or open transactions may default. The potential loss could exceed the value of the financial assets recorded in the financial statements. Financial assets that potentially expose the Portfolio to credit risk consist principally of cash due from counterparties and investments. In order to preserve certain safeguards for derivatives and non-standard settlement trades, the Portfolio restricts its exposure to credit losses by entering into master netting agreements with counterparties (approved brokers) with whom it undertakes a significant volume of transactions. The Portfolio reduces the credit risk associated with favorable contracts by entering into a master netting arrangement to the extent that all amounts with the counterparty are terminated and settled on a net basis if an event of default occurs. The Portfolio’s overall exposure to credit risk on derivative instruments subject to master netting arrangements can change substantially within a short period, as it is affected by each transaction subject to the arrangement.
27
MET INVESTORS SERIES TRUST
| | |
Met/Franklin Low Duration Total Return Portfolio | | |
Quarterly Portfolio Schedule
The Trust files Form N-Q for the first and third quarters of each fiscal year. The Trust’s Forms N-Q will be available on the Securities and Exchange Commission’s website at http://www.sec.gov. The Trust’s Forms N-Q may be reviewed and copied at the Securities and Exchange Commission’s Public Reference Room in Washington, D.C. and information on the operation of the Public Reference Room may be obtained by calling 1-800-SEC-0330. Once filed, the most recent Form N-Q will be available without charge, upon request, by calling (800) 848-3854.
Proxy Voting Policies and Procedures
A description of the policies and procedures that the Trust uses to determine how to vote proxies relating to portfolio securities is available without charge, upon request, by calling (800) 848-3854 and on the Securities and Exchange Commission’s website at http://www.sec.gov.
Proxy Voting Record
The Trust, on behalf of each of its Portfolios, has filed with the Securities and Exchange Commission its proxy voting record for the 12-month period ending June 30 on Form N-PX. Form N-PX must be filed by the Trust each year by August 31. Once filed, the most recent Form N-PX will be available without charge, upon request, by calling (800) 848-3854 or on the Securities and Exchange Commission’s website at http://www.sec.gov.
28
MET INVESTORS SERIES TRUST
| | |
Met/Franklin Low Duration Total Return Portfolio | | |
Board of Trustees’ Consideration of Advisory and Sub-Advisory Agreement
At an in-person meeting of the Board of Trustees (the “Board”) of the Met Investors Series Trust (the “Trust”) held on February 14-15, 2011, the Board, including a majority of the Trustees who are not considered to be “interested persons” of the Trust (the “Independent Trustees”) under the Investment Company Act of 1940, as amended (the “1940 Act”), initially approved the Trust’s advisory agreement (the “Advisory Agreement”) with MetLife Advisers, LLC (the “Adviser”) and the investment sub-advisory agreement (the “Sub-Advisory Agreement”, and collectively with the Advisory Agreement, the “Agreements”) between the Adviser and Franklin Advisers, Inc. (the “Subadviser”) for the Met/Franklin Low Duration Total Return Portfolio (the “Portfolio”).1
In considering the Agreements, the Board reviewed a variety of materials provided by the Adviser and the Subadviser relating to the Portfolio, the Adviser and the Subadviser, including comparative fee and expense information for an appropriate peer group of similar mutual funds, performance information for relevant benchmark indices, and other information regarding the nature, extent and quality of services to be provided by the Adviser and the Subadviser under their respective Agreements. The Independent Trustees also assessed a report provided by the Board’s independent consultant, who reviewed and provided analyses regarding fees and expenses, and other information provided by, or at the direction of, the Adviser and Subadviser, as more fully discussed below.
The Independent Trustees were separately advised by independent legal counsel throughout the process. Prior to voting to approve the Agreements at the February meeting, the Independent Trustees also received a memorandum from their independent legal counsel discussing the legal standards for their consideration of the proposed initial approval of the Agreements. The Board also discussed the Portfolio with the Adviser on January 19, 2011. The Independent Trustees also discussed the proposed initial approval of the Agreements in private sessions with their independent legal counsel at which no representatives of management were present.
In considering whether to approve the Agreements, the Board reviewed and analyzed the factors it deemed relevant, including: (1) the nature, extent and quality of the services to be provided to the Portfolio by the Adviser and the Subadviser; (2) the performance of a comparable fund managed by the Subadviser as compared to an appropriate index; (3) the Adviser’s and the Subadviser’s personnel and operations; (4) the financial condition of the Adviser and of the Subadviser; (5) the level and method of computing the Portfolio’s proposed advisory and subadvisory fees; (6) the anticipated profitability of the Adviser under the Advisory Agreement and of the Subadviser under the Sub-Advisory Agreement; (7) any “fall-out” benefits to the Adviser, the Subadviser and their affiliates (i.e., ancillary benefits realized by the Adviser, the Subadviser or their affiliates from the Adviser’s or Subadviser’s relationship with the Trust); (8) the anticipated effect of growth in size on the Portfolio’s performance and expenses; (9) fees paid by comparable institutional and retail accounts; and (10) possible conflicts of interest. The Board also considered the nature, quality, and extent of the services to be provided to the Portfolio by the Adviser’s affiliates, including distribution services.
Nature, extent and quality of services. In considering the nature, extent and quality of the services to be provided by the Adviser to the Portfolio, the Board took into account the extensive responsibilities that the Adviser would have as investment adviser to the Portfolio, including the selection of the Subadviser for the Portfolio and oversight of the Subadviser’s compliance with fund policies and objectives, review of brokerage matters including with respect to trade allocation and best execution, oversight of general fund compliance with federal and state laws, its risk management processes, and the implementation of Board directives as they relate to the Portfolio. The Adviser’s role in coordinating the activities of the Portfolio’s other service providers was also considered. The Board also evaluated the expertise and performance of the personnel who would be overseeing the Subadviser and compliance with the Portfolio’s investment restrictions, tax and other requirements. The Board considered information received from the Trust’s Chief Compliance Officer (the “CCO”) regarding the Portfolio’s compliance policies and procedures established pursuant to Rule 38a-1 under the 1940 Act, including the policies and procedures in place relating to proxy voting. Based on the information provided to the Board and its discussions with the CCO, the Board approved the Rule 38a-1 compliance policies and procedures as they relate to the Portfolio. The Board also took into account its familiarity with management through Board meetings, discussions and reports during the preceding year. The Board also took into consideration the quality of services the Adviser provided to other Portfolios of the Trust.
The Board also recognized the Adviser’s reputation and long-standing experience in serving as an investment adviser to the Trust, and considered the anticipated benefit to shareholders of investing in a fund that is part of a family of variable annuity portfolios offering a variety of investments. In addition, the Board reviewed the financial condition of the Adviser and whether it had the financial wherewithal to provide a high level and quality of services to the Portfolio. In its review, the Board also received and took into account information regarding any services and/or payments to be provided to the Adviser by the Subadviser in connection with marketing activities.
With respect to the services to be provided by the Subadviser, the Board considered information provided to the Board by the Subadviser, including the Subadviser’s Form ADV, as well as information presented throughout the past year regarding the Subadviser. The Board considered the Subadviser’s current level of staffing and its overall resources, as well as its compensation program. The Board reviewed the Subadviser’s history and investment experience, as well as information regarding the qualifications, background and responsibilities of the Subadviser’s
1 At the February 14-15, 2011 meeting, the Board also approved Agreements with respect to the AQR Global Risk Balanced Portfolio, AllianceBernstein Global Dynamic Allocation Portfolio, BlackRock Global Tactical Strategies Portfolio, MetLife Balanced Plus Portfolio, Pyramis® Government Income Portfolio, and T. Rowe Price Large Cap Value Portfolio.
29
MET INVESTORS SERIES TRUST
| | |
Met/Franklin Low Duration Total Return Portfolio | | |
Board of Trustees’ Consideration of Advisory and Sub-Advisory Agreement—(Continued)
investment and compliance personnel who would be providing services to the Portfolio. The Board also considered, among other things, the Subadviser’s compliance program and its disciplinary history, and its risk assessment and monitoring process. The Board noted the Subadviser’s regulatory history, including whether it was currently involved in any regulatory actions or investigations as well as material litigation, and any settlements and ameliatory actions undertaken, as appropriate. The Board also noted that the CCO and his staff would be conducting regular, periodic compliance reviews with the Subadviser and present reports to the Independent Trustees regarding the same, which would include evaluating the regulatory compliance system of the Subadviser and procedures reasonably designed by the Subadviser assure compliance with the federal securities laws, including issues related to late trading and market timing, best execution, fair value pricing, and proxy voting procedures, among others. The Board also took into account the financial condition of the Subadviser. Based on the information provided to the Board and its discussions with the CCO, the Board approved the Rule 38a-1 compliance policies and procedures as they relate to the Portfolio.
The Board considered the Subadviser’s investment process and philosophy. The Board took into account that the Subadviser’s responsibilities would include the development and maintenance of an investment program for the Portfolio which would be consistent with the Portfolio’s investment objectives, the selection of investment securities and the placement of orders for the purchase and sale of such securities, as well as the implementation of compliance controls related to performance of these services. The Board also reviewed the Subadviser’s brokerage policies and practices, including with respect to best execution and soft dollars.
Based on its consideration and review of the foregoing information, the Board concluded that the nature, extent and quality of services to be provided by the Adviser and by the Subadviser were satisfactory and that there was a reasonable basis on which to conclude that each would provide a high quality of investment services to the Portfolio.
Performance. The Board considered the performance of a comparable fund managed by the Subadviser (the “Comparable Fund”). Among other data relating specifically to the Comparable Fund, the Board considered that the Comparable Fund outperformed its benchmark, the Barclays Capital U.S. Government and Credit (1-3 Year) Index for the one-, three- and five- year periods ended December 31, 2010. Based on its review, the Board concluded that the performance of the Comparable Fund, the Adviser and the Subadviser supported the approval of the Agreements.
Fees and expenses. The Board gave substantial consideration to the proposed management fees payable under the Advisory Agreement and the proposed subadvisory fee payable under the Sub-Advisory Agreement. In addition, the Independent Trustees reviewed a report prepared by Bobroff Consulting, Inc., an independent consultant (“Bobroff”), which analyzed certain of the other factors to be considered by the Board. The Independent Trustees, with the assistance of Bobroff, also examined the proposed fees to be paid by the Portfolio in light of fees paid to other investment managers by comparable funds and the method of computing the Portfolio’s proposed fee. In addition, the Board considered the Portfolio’s proposed management fee and total expenses as compared to similarly situated investment companies underlying variable insurance products and retail funds deemed to be comparable to the Portfolio as determined by Bobroff. In comparing the Portfolio’s proposed management fee to that of comparable funds, the Board noted that such fee includes both advisory and administrative fees.
The Board noted that the subadvisory fee for the Portfolio would be paid by the Adviser, not the Portfolio, out of the management fee. It was further noted that the Adviser negotiated such fee at arm’s length. The Board also considered that the Adviser had agreed to enter into an expense limitation agreement with the Portfolio, pursuant to which the Adviser would agree to waive a portion of its management fee and/or reimburse certain expenses as a means of limiting the Portfolio’s total annual operating expenses.
The Board also compared the proposed subadvisory fee to be paid by the Adviser to the fees charged by the Subadviser to manage other funds and funds not subject to regulation under the 1940 Act, such as separate accounts, as applicable. The Board considered the fee comparisons in light of the differences required to manage different types of accounts.
The Board considered that, according to a report prepared by Bobroff, the Portfolio’s proposed management fee was below the median of the peer group. The Board further considered that the Portfolio’s estimated total expenses (exclusive of 12b-1 fees) were above the median of the peer group. The Board took into account management’s discussion of the Portfolio’s estimated expenses.
After consideration of all relevant factors, the Board concluded that the proposed management and subadvisory fees were consistent with industry norms and were fair and reasonable in light of the services to be provided.
Profitability. The Board examined the anticipated profitability of the Adviser with respect to the Portfolio. The Board noted that a major component of profitability of the Adviser would be the margin between the management fee that the Adviser would receive from the Portfolio and the portion of that fee the Adviser would pay to the Subadviser. The Board also took into account the costs borne by the Adviser’s affiliates that support the operations of the Adviser, as well as considered the profitability of the insurance products, the function of which is supported in part by the Adviser’s revenues under the Advisory Agreement. The Board also considered that the Trust’s distributor, MetLife Investors Distribution Company, would receive Rule 12b-1 payments to support the distribution of the products. The Board concluded after extensive discussions with management that the anticipated profitability of the Adviser and its affiliates from their relationship with the Portfolio was reasonable in light of all relevant factors.
In considering the anticipated profitability to the Subadviser and its affiliates of their relationships with the Portfolio, the Board noted that the proposed subadvisory fee under the Sub-Advisory Agreement would be paid by the Adviser out of the management fee that it would receive under
30
MET INVESTORS SERIES TRUST
| | |
Met/Franklin Low Duration Total Return Portfolio | | |
Board of Trustees’ Consideration of Advisory and Sub-Advisory Agreement—(Continued)
the Advisory Agreement. The Board also relied on the ability of the Adviser to negotiate the Sub-Advisory Agreement and the fees thereunder at arm’s length. However, the Board placed more reliance on the fact that the Sub-Advisory Agreement was negotiated at arm’s length and that the proposed subadvisory fees would be paid by the Adviser than on the Subadviser’s anticipated profitability.
Economies of scale. The Board also considered the probable effect of the Portfolio’s growth in size on its performance and fees. The Board noted that the proposed management and subadvisory fees each contained breakpoints that would reduce the fee rate above specified asset levels. The Board also took into account that the proposed subadvisory fees would be paid by the Adviser out of the management fees. The Board considered the fact that the Portfolio’s fee levels decline as portfolio assets increase. The Board also noted that if the Portfolio’s assets increase over time, the Portfolio may realize other economies of scale if assets increase proportionally more than certain other fixed expenses. The Board concluded that the proposed advisory fee structure for the Portfolio, including breakpoints, was reasonable and appropriately reflects potential economies of scale.
Other factors. As part of its evaluation of the Adviser’s compensation, the Board considered other benefits that may be realized by the Adviser and its affiliates from their relationship with the Trust. Among them, the Board recognized that an affiliate of the Adviser, MetLife Investors Distribution Company, serves as the distributor for the Trust, and, as such, would receive payments pursuant to Rule 12b-1 from the Portfolio to compensate it for providing shareholder services and selling activities, which could lead to growth in the Trust’s assets and corresponding benefits from such growth, including economies of scale. The Board also considered that affiliates of the Adviser may benefit from certain indirect tax benefits relating to dividend received deductions and foreign tax credits. The Board concluded that anticipated ancillary benefits that may accrue to the Adviser and its affiliates by virtue of the Adviser’s relationship with the Portfolio are fair and reasonable in light of the anticipated costs of providing investment management and other services to the Portfolio and the ongoing commitment of the Adviser to the Portfolio.
The Board considered other benefits that may be realized by the Subadviser and its affiliates from their relationship with the Trust, including the opportunity to provide advisory services to additional portfolios of the Trust and reputational benefits. The Board concluded that the benefits that may accrue to the Subadviser and their affiliates by virtue of the Subadviser’s relationship to the Portfolio were fair and reasonable in light of the anticipated costs of providing investment advisory services to the Portfolio and the ongoing commitment of the Subadviser to the Portfolio.
The Board considered any possible conflicts of interest in the form of material benefits or detriments to the Trust resulting from the nature of the Trust’s and the Adviser’s or the Subadviser’s affiliations. Here, the Board considered possible conflicts of interest that may arise between the Trust and the Adviser or the Subadviser in connection with the services to be provided to the Trust and the various relationships that they and their affiliates may have with the Trust. The Board considered the procedures for monitoring and managing such potential conflicts.
Conclusion. In considering the initial approval of each of the Agreements, the Board, including the Independent Trustees, did not identify any single factor as controlling, and each Trustee may have attributed different weights to various factors. Based on all of the above-mentioned considerations, and the recommendations of management, the Board, including a majority of the Independent Trustees, determined that approval of the Advisory Agreement and the Sub-Advisory Agreement was in the best interests of the Portfolio. After full consideration of these and other factors, the Board, including a majority of the Independent Trustees, with the assistance of independent legal counsel, approved the Advisory Agreement and the Sub-Advisory Agreement with respect to the Portfolio.
31
Simplify your life…
with MetLife eDelivery® while helping MetLife preserve the planet’s natural resources.
(see details on inside cover)
| | |
Met Investors Series Trust Met/Franklin Mutual Shares Portfolio Semiannual Report | | June 30, 2011, as amended December 16, 2011 |
MET INVESTORS SERIES TRUST
| | |
Met/Franklin Mutual Shares Portfolio | | |
Managed by Franklin Mutual Advisers, LLC
Portfolio Manager Commentary*
Performance
For the six-month period ended June 30, 2011, the Class A and B shares of the Met/Franklin Mutual Shares Portfolio returned 5.97% and 5.84%, respectively, compared to its benchmark, the Standard & Poor’s (S&P) 500 Index1, which returned 6.02%.
Market Environment/Conditions
The global economy expanded despite geopolitical and inflationary pressures during the six-month period ended June 30, 2011. In the U.S., business activity increased and consumer spending stayed above pre-recession levels. The U.S. has been a key engine in a sustained global manufacturing expansion as international trade volume continued to increase, albeit at a moderate pace. The U.S. financial system appeared closer to a full recovery, although the country still faced challenges dealing with persistent unemployment, housing market weakness and massive debt.
Inflation at the consumer, producer and trade levels rose across much of the world, but in the U.S. it remained relatively contained. As a result, the Federal Reserve Board (Fed) maintained its accommodative monetary policy while ending its second round of quantitative easing on June 30. The Fed said, however, it would continue to purchase Treasuries with proceeds from maturing debt in an effort to support economic growth. This move deviated from many other central banks around the world that raised interest rates to dampen inflation pressures.
Continued corporate profit strength and still favorable economic growth prospects in some regions of the world supported equities. Global stock markets gained in the first half of 2011, though the positive momentum from the previous year waned as investors weathered international events that included revolutions and civil unrest across the Middle East and North Africa, the multiple crises triggered by Japan’s earthquake and tsunami, and sovereign debt worries and credit downgrades in Europe. The dollar declined during the period against most currencies, however, broadly reflecting divergent interest rate and/or economic growth expectations.
Portfolio Review/Current Positioning
During the period under review, some of the Portfolio’s investments lost value and negatively impacted the Portfolio’s results. These included U.S.-based Bank of America Corp., Japanese video game software and console maker Nintendo Co., Ltd., and U.S. network equipment provider Cisco Systems, Inc.
Bank of America detracted from performance during the six-month period largely due to concerns about potential mortgage losses, particularly from Countrywide Financial Corp., a mortgage-finance company it acquired in 2008. In addition, uncertainty regarding the systemically important financial institutions (SIFI) capital surcharge, a potential additional capital requirement for large banks, weighed on Bank of America’s share price. While potential regulatory and other risks to the company’s business prospects remained, we think these risks were priced into the stock at period-end. In our analysis, Bank of America has leading positions in all of its businesses, its capital position is adequate and the need to raise further capital is unlikely. Furthermore, its credit costs continued to fall, and the mortgage loss issue appeared manageable, according to our analysis.
Nintendo’s share price deteriorated after the company reported sales of its new handheld console, the Nintendo 3DS, were slower than anticipated. In particular, sales of this new gaming device were weak in its home market of Japan, where the natural disaster hurt consumer sentiment, and in other parts of the world due to a lack of compelling software titles at launch date and the console’s relatively high initial sales price. At period-end, net cash accounted for more than 50% of Nintendo’s market capitalization, and we believe the company can successfully leverage their software intellectual property in the next gaming console cycle. With this in mind, we continued to hold Nintendo in the Portfolio at period-end.
Cisco Systems, Inc. is a relatively new addition to the Portfolio, initiated in early 2011. Early in the first quarter, Cisco issued lower-than-expected earnings guidance citing economic pressures such as subdued spending by government agencies, a key revenue stream, and missteps in its consumer-focused businesses. In mid-May, Cisco shares declined further when the company confirmed it had completed another disappointing quarter. However, management announced significant cost realignment and an exit from certain consumer markets, both of which we believe should improve financial results. Cisco’s competitive position remained strong, its balance sheet appeared overcapitalized at period-end, and the company announced it would begin paying a dividend as well as continuing to buy back stock. For these reasons, along with management’s commitment to repair the company’s current cost structure, we found Cisco’s valuation appealing.
The Portfolio held currency forwards that detracted from performance for the period, primarily based on the euro’s and the U.K. pound’s appreciation versus the U.S. dollar.
In contrast, in an environment of generally rising equity prices, many Portfolio investments increased in value during the six-month period. Three particularly strong Portfolio performers were UnitedHealth Group, Inc. a U.S. managed health care provider; Marathon Oil Corp., a U.S.-based oil and gas exploration and production company with interests worldwide; and U.K.-based British American Tobacco plc (BAT).
Shares of UnitedHealth Group, Inc. rose sharply in value during the first half of 2011. In January, its share price was fueled by a combination of the company’s announcement of better-than-expected fourth quarter 2010 earnings and, more importantly, its higher revenue guidance for 2011. Other positive catalysts included the company’s ongoing efforts to increase shareholder value through share buybacks and dividends. In our view, UnitedHealth’s long-term earnings growth is supported by a diversified business mix and a
1
MET INVESTORS SERIES TRUST
| | |
Met/Franklin Mutual Shares Portfolio | | |
Managed by Franklin Mutual Advisers, LLC
Portfolio Manager Commentary* (continued)
growing percentage of earnings generated by its increasingly successful health care services business. Although there was no specific catalyst for the continued increase in the company’s stock price in the second quarter, we believe many investors may have recognized the low earnings multiple at which the company’s shares had been trading. In addition, investors seemed to become more comfortable with the implications of pending U.S. health care reforms on the company’s business model.
The value of our investment in Marathon Oil Corp. rose sharply in early 2011, initially driven by management’s announced plans to spin off its downstream operations to shareholders to become a pure-play exploration and production company. Investors pushed Marathon shares higher as they began to recognize the value of the underlying businesses. The share price showed continuing strength in the spring as the spin-off date approached, oil prices rose, and refining margins improved considerably, driven primarily by the company’s strong Midwestern refining system, which benefited from recent investments and widening crude oil price differentials in a land-locked market.
BAT is the world’s second-largest publicly traded tobacco company, with a presence in more than 180 countries. During the period under review, the stock performed well. In February, the company reported full-year 2010 operating results that exceeded market expectations. In addition, BAT management reported it had delivered on its five-year goal to realize £800 million in cost savings two years ahead of schedule. In May, the company held an investor relations day during which its top executives discussed further cost-cutting opportunities. Management believes it can continue to grow operating margins for the next six to seven years aided by price increases and cost-cutting programs. Management explained that cost savings will come from myriad opportunities including simplifying its business structure, improvements in procurement, a reduction in logistics costs, further rationalization of manufacturing facilities, and the standardization and consolidation of back-office centers and processes. The company also reaffirmed its goal to grow medium-term earnings per share in the high single-digit range, although management also mentioned it would likely exceed that goal in 2011. BAT is a long-term Portfolio holding, and the shares have generated nearly 700% in total shareholder returns over the past 10 years. At period-end, we continued to believe BAT was an attractive investment due to the industry’s pricing power, the company’s additional cost savings opportunities and a shareholder friendly management team that often has returned excess cash to shareholders through dividends and share buybacks.
For the period under review, equities we believe are undervalued remained the core of the Portfolio, with sector weightings remaining fairly consistent. The largest weighting changes were increases in our exposure to the Consumer Discretionary and Health Care sectors. The Portfolio’s exposure to Financials and Information Technology decreased, as did its cash position. Although merger and acquisition (M&A) opportunities accelerated during the first quarter of 2011, many of the available deals did not meet our investment criteria. Therefore, our weight in M&A investments remained moderate at approximately 2.5% of net assets on average during the six-month review period. Investment opportunities in the distressed space also remained moderate, and although credit spreads remained historically low through June, there appeared to be a lack of compelling distressed opportunities available at decent prices, according to our analysis.
We continue to employ a fundamental, bottom-up approach and favor opportunities with identifiable events or catalysts that we believe can unlock value for our shareholders. We also continue to prefer companies that tend to pay higher dividends and can generate solid and consistent free cash flow.
Peter A. Langerman, Co-Portfolio Manager
F. David Segal, CFA, Co-Portfolio Manager
Debbie A. Turner, CFA, Assistant Portfolio Manager
Franklin Mutual Advisers, LLC
*This commentary may include statements that constitute “forward-looking statements” under the U.S. securities laws. Forward-looking statements include, among other things, projections, estimates, and information about possible or future results related to the Portfolio, market or regulatory developments. The views expressed above are not guarantees of future performance or economic results and involve certain risks, uncertainties and assumptions that could cause actual outcomes and results to differ materially from the views expressed herein. The views expressed above are subject to change at any time based upon economic, market, or other conditions and the subadvisory firm undertakes no obligation to update the views expressed herein. Any discussions of specific securities should not be considered a recommendation to buy or sell those securities. The views expressed above (including any forward-looking statement) may not be relied upon as investment advice or as an indication of the Portfolio’s trading intent. Information about the Portfolio’s holdings, asset allocation or country diversification is historical and is not an indication of future Portfolio composition, which may vary. Direct investment in any index is not possible. The performance of any index mentioned in this commentary has not been adjusted for ongoing management, distribution and operating expenses, and sales charges applicable to mutual fund investments. In addition, the returns do not reflect additional fees charged by separate accounts or variable insurance contracts that an investor in the Portfolio may pay. If these additional fees were reflected, performance would have been lower.
2
MET INVESTORS SERIES TRUST
| | |
Met/Franklin Mutual Shares Portfolio | | |
Portfolio Composition as of June 30, 2011
Top Issuers
| | | | |
| | |
% of
Net Assets | |
CVS Caremark Corp. | | | 2.6 | |
British American Tobacco plc | | | 2.5 | |
Kraft Foods, Inc. Class A | | | 2.3 | |
Marathon Oil Corp. | | | 2.0 | |
UnitedHealth Group, Inc. | | | 2.0 | |
Pfizer, Inc. | | | 1.9 | |
Microsoft Corp. | | | 1.9 | |
Merck & Co., Inc. | | | 1.8 | |
Nestle S.A. | | | 1.7 | |
Imperial Tobacco Group plc | | | 1.7 | |
Top Sectors
| | | | |
| | | % of
Market Value of
Total Investments | |
Non-Cyclical | | | 30.6 | |
Financials | | | 13.5 | |
Communications | | | 10.7 | |
Cash & Equivalents | | | 7.6 | |
Energy | | | 6.7 | |
Industrials | | | 6.0 | |
Technology | | | 5.7 | |
Cyclical | | | 5.7 | |
Utilities | | | 4.1 | |
Basic Materials | | | 4.1 | |
3
MET INVESTORS SERIES TRUST
| | |
Met/Franklin Mutual Shares Portfolio | | |
Met/Franklin Mutual Shares Portfolio managed by
Franklin Mutual Advisers, LLC vs. S&P 500 Index1
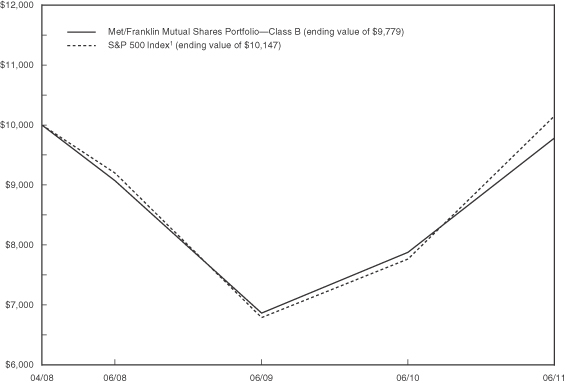
| | | | | | | | | | | | |
| | | Average Annual Return2
(for the six months ended June 30, 2011 | |
| | | 6 Month | | | 1 year | | | Since
Inception3 | |
Met/Franklin Mutual Shares
Portfolio—Class A | | | 5.97% | | | | 24.40% | | | | -0.46% | |
| Class B | | | 5.84% | | | | 24.20% | | | | -0.70% | |
| S&P 500 Index1 | | | 6.02% | | | | 30.69% | | | | 0.46% | |
The performance of Class B shares, as set forth in the line graph above, will differ from that of the other class of shares because of the difference in expenses paid by policyholders investing in the different share classes.
1The S&P 500 Index is an unmanaged index consisting of 500 stocks chosen for market size, liquidity, and industry group representation. It is a market-weighted index (stock price times number of shares outstanding) with each stock’s weight in the Index proportionate to its market value.
2“Average Annual Return” is calculated including reinvestment of all income dividends and capital gains distributions.
3Inception of Class A and Class B shares is 4/28/08. Index returns are based on an inception date of 4/28/08.
Past performance does not guarantee future results. The investment return and principal value of an investment in the Portfolio will fluctuate, so that shares, on any given day or when redeemed, may be worth more or less than their original cost. Performance numbers are net of all Portfolio expenses but do not include any insurance, sales, or administration charges of variable annuity or life insurance contracts. If these charges were included, the returns would be lower. The Index does not include fees or expenses and is not available for direct investment.
4
MET INVESTORS SERIES TRUST
| | |
Met/Franklin Mutual Shares Portfolio | | |
Understanding Your Portfolio’s Expenses
Shareholder Expense Example
As a shareholder of the Portfolio, you incur ongoing costs, including management fees; distribution and service (12b-1) fees; and other Portfolio expenses. This example is intended to help you understand your ongoing costs (in dollars) (referred to as “expenses”) of investing in the Portfolio and compare these costs with the ongoing costs of investing in other mutual funds. The example is based on an investment of $1,000 invested at the beginning of the period and held for the entire period, January 1, 2011 through June 30, 2011.
Actual Expenses
The first line for each share class of the Portfolio in the table below provides information about actual account values and actual expenses. You may use the information in this line, together with the amount you invested in the particular share class of the Portfolio, to estimate the expenses that you paid over the period. Simply divide your account value by $1,000 (for example, an $8,600 account value divided by $1,000 = 8.6), then multiply the result by the number in the first line under the heading entitled “Expenses Paid During Period” to estimate the expenses you paid on your account during this period.
Hypothetical Example for Comparison Purposes
The second line for each share class of the Portfolio in the table below provides information about hypothetical account values and hypothetical expenses based on the Portfolio’s actual expense ratio and an assumed rate of return of 5% per year before expenses, which is not the Portfolio’s actual return. The hypothetical account values and expenses may not be used to estimate the actual ending account balance or expenses you paid
for the period. You may use this information to compare the ongoing costs of investing in the Portfolio and other funds. To do so, compare this 5% hypothetical example with the 5% hypothetical examples that appear in the shareholder reports of the other funds.
Please note that the expenses shown in the table are meant to highlight your ongoing costs only and do not reflect any fees or charges of your variable insurance product or any additional expenses that participants in certain eligible qualified plans may bear relating to the operations of their plan. Therefore, the second line for each share class in the table is useful in comparing ongoing costs only, and will not help you determine the relative total costs of owning different funds. In addition, if these other costs were included, your costs would have been higher.
| | | | | | | | | | | | | | | | |
| | | Annualized
Expense
Ratio | | | Beginning
Account Value
January 1, 2011 | | | Ending
Account Value
June 30, 2011 | | | Expenses Paid
During Period**
January 1, 2011
to June 30, 2011 | |
| | | | | | | | | | | | | | | | |
| | | | |
| | | | | | | | | | | | | | | | |
Class A(a)(b) | | | | | | | | | | | | | | | | |
Actual | | | 0.86% | | | $ | 1,000.00 | | | $ | 1,059.70 | | | $ | 4.39 | |
Hypothetical* | | | 0.86% | | | | 1,000.00 | | | | 1,020.53 | | | $ | 4.31 | |
| | | | | | | | | | | | | | | | |
| | | | |
| | | | | | | | | | | | | | | | |
Class B(a)(b) | | | | | | | | | | | | | | | | |
Actual | | | 1.11% | | | $ | 1,000.00 | | | $ | 1,058.40 | | | $ | 5.67 | |
Hypothetical* | | | 1.11% | | | | 1,000.00 | | | | 1,019.29 | | | $ | 5.56 | |
| | | | | | | | | | | | | | | | |
* Hypothetical assumes a rate of return of 5% per year before expenses.
** Expenses paid are equal to the Portfolio’s annualized expense ratio for the most recent six month period, as shown above, multiplied by the average account value over the period, multiplied by the number of days (181 days) in the most recent fiscal half-year, divided by 365 (to reflect the one-half year period).
(a) The annualized expense ratio shown reflects an expense limitation agreement between MetLife Advisers, LLC and the Portfolio as described in Note 3 of the Notes to Financial Statements.
(b) The annualized expense ratio reflects the impact of the management fee waiver as described in Note 3 to the Financial Statements.
5
MET INVESTORS SERIES TRUST
| | |
Met/Franklin Mutual Shares Portfolio | | |
Schedule of Investments as of June 30, 2011 (Unaudited)
Common Stocks—88.2% of Net Assets
| | | | | | | | |
| Security Description | | Shares | | | Value | |
| | | | | | | | |
| | |
| Aerospace & Defense—0.4% | | | | | | | | |
GenCorp, Inc.* (a) | | | 84,611 | | | $ | 543,203 | |
Huntington Ingalls Industries, Inc.* (a) | | | 65,328 | | | | 2,253,816 | |
| | | | | | | | |
| | | | | | | 2,797,019 | |
| | | | | | | | |
|
| Air Freight & Logistics—0.4% | |
TNT N.V. | | | 143,235 | | | | 1,217,198 | |
TNT Express N.V.* | | | 143,235 | | | | 1,487,812 | |
| | | | | | | | |
| | | | | | | 2,705,010 | |
| | | | | | | | |
|
| Automobiles—1.4% | |
Daimler AG | | | 58,997 | | | | 4,446,905 | |
General Motors Co.* (a) | | | 144,192 | | | | 4,377,669 | |
| | | | | | | | |
| | | | | | | 8,824,574 | |
| | | | | | | | |
|
| Beverages—4.0% | |
Coca-Cola Enterprises, Inc. | | | 125,062 | | | | 3,649,309 | |
Dr Pepper Snapple Group, Inc. (a) | | | 156,583 | | | | 6,565,525 | |
Foster's Group, Ltd. | | | 405,612 | | | | 2,246,691 | |
PepsiCo, Inc. | | | 67,640 | | | | 4,763,885 | |
Pernod Ricard S.A. (a) | | | 90,594 | | | | 8,943,612 | |
| | | | | | | | |
| | | | | | | 26,169,022 | |
| | | | | | | | |
|
| Biotechnology—1.4% | |
Amgen, Inc.* | | | 119,794 | | | | 6,989,980 | |
Cephalon, Inc.* | | | 30,496 | | | | 2,436,630 | |
| | | | | | | | |
| | | | | | | 9,426,610 | |
| | | | | | | | |
|
| Building Products—0.9% | |
Owens Corning, Inc.* | | | 150,829 | | | | 5,633,463 | |
| | | | | | | | |
|
| Capital Markets—1.7% | |
Morgan Stanley | | | 297,572 | | | | 6,847,132 | |
UBS AG* | | | 243,231 | | | | 4,432,180 | |
| | | | | | | | |
| | | | | | | 11,279,312 | |
| | | | | | | | |
|
| Chemicals—1.4% | |
Linde AG | | | 51,509 | | | | 9,044,595 | |
| | | | | | | | |
|
| Commercial Banks—3.5% | |
Barclays plc | | | 1,256,980 | | | | 5,179,952 | |
CIT Group, Inc.* | | | 56,290 | | | | 2,491,396 | |
PNC Financial Services Group, Inc. | | | 120,394 | | | | 7,176,686 | |
Wells Fargo & Co. | | | 297,072 | | | | 8,335,840 | |
| | | | | | | | |
| | | | | | | 23,183,874 | |
| | | | | | | | |
|
| Communications Equipment—1.1% | |
Cisco Systems, Inc. | | | 325,049 | | | | 5,074,015 | |
Motorola Solutions, Inc.* | | | 48,949 | | | | 2,253,612 | |
| | | | | | | | |
| | | | | | | 7,327,627 | |
| | | | | | | | |
| | | | | | | | |
|
| Computers & Peripherals—1.1% | |
Hewlett-Packard Co. | | | 201,529 | | | $ | 7,335,656 | |
| | | | | | | | |
|
| Diversified Financial Services—2.2% | |
Bank of America Corp. | | | 506,044 | | | | 5,546,242 | |
Bond Street Holdings LLC—Class A* | | | 78,194 | | | | 1,602,977 | |
Deutsche Boerse AG | | | 51,060 | | | | 3,880,998 | |
NYSE Euronext | | | 100,060 | | | | 3,429,056 | |
| | | | | | | | |
| | | | | | | 14,459,273 | |
| | | | | | | | |
|
| Diversified Telecommunication Services—1.2% | |
Cable & Wireless Communications plc | | | 1,964,904 | | | | 1,279,771 | |
Telefonica S.A. | | | 271,795 | | | | 6,656,548 | |
| | | | | | | | |
| | | | | | | 7,936,319 | |
| | | | | | | | |
| | |
| Electric Utilities—2.6% | | | | | | | | |
Brookfield Infrastructure Partners LP | | | 104,787 | | | | 2,624,914 | |
E.On AG | | | 221,135 | | | | 6,287,102 | |
Entergy Corp. | | | 39,060 | | | | 2,667,017 | |
Exelon Corp. | | | 134,398 | | | | 5,757,610 | |
| | | | | | | | |
| | | | | | | 17,336,643 | |
| | | | | | | | |
| | |
| Electrical Equipment—0.1% | | | | | | | | |
Alstom S.A. (a) | | | 12,186 | | | | 751,636 | |
| | | | | | | | |
|
| Electronic Equipment, Instruments & Components—0.7% | |
TE Connectivity, Ltd. | | | 130,917 | | | | 4,812,509 | |
| | | | | | | | |
| | |
| Energy Equipment & Services—1.6% | | | | | | | | |
Ensco plc (ADR) | | | 44,143 | | | | 2,352,822 | |
Exterran Holdings, Inc.* (a) | | | 10,927 | | | | 216,683 | |
Transocean, Ltd. | | | 118,870 | | | | 7,674,247 | |
| | | | | | | | |
| | | | | | | 10,243,752 | |
| | | | | | | | |
| | |
| Food & Staples Retailing—4.8% | | | | | | | | |
Carrefour S.A. | | | 46,669 | | | | 1,919,637 | |
CVS Caremark Corp. | | | 458,177 | | | | 17,218,292 | |
Kroger Co. (The) | | | 338,909 | | | | 8,404,943 | |
Wal-Mart Stores, Inc. | | | 69,255 | | | | 3,680,211 | |
| | | | | | | | |
| | | | | | | 31,223,083 | |
| | | | | | | | |
| | |
| Food Products—4.8% | | | | | | | | |
General Mills, Inc. | | | 145,101 | | | | 5,400,659 | |
Kraft Foods, Inc.—Class A | | | 420,794 | | | | 14,824,573 | |
Nestle S.A. | | | 183,350 | | | | 11,386,939 | |
| | | | | | | | |
| | | | | | | 31,612,171 | |
| | | | | | | | |
|
| Health Care Equipment & Supplies—2.2% | |
Boston Scientific Corp.* | | | 538,422 | | | | 3,720,496 | |
See accompanying notes to financial statements.
6
MET INVESTORS SERIES TRUST
| | |
Met/Franklin Mutual Shares Portfolio | | |
Schedule of Investments as of June 30, 2011 (Unaudited)
Common Stocks—(Continued)
| | | | | | | | |
| Security Description | | Shares | | | Value | |
| | | | | | | | |
|
| Health Care Equipment & Supplies (Continued) | |
Medtronic, Inc. | | | 192,674 | | | $ | 7,423,729 | |
Zimmer Holdings, Inc.* | | | 46,641 | | | | 2,947,711 | |
| | | | | | | | |
| | | | | | | 14,091,936 | |
| | | | | | | | |
|
| Health Care Providers & Services—3.3% | |
Coventry Health Care, Inc.* | | | 71,208 | | | | 2,596,956 | |
Tenet Healthcare Corp.* | | | 915,943 | | | | 5,715,484 | |
UnitedHealth Group, Inc. | | | 252,127 | | | | 13,004,711 | |
| | | | | | | | |
| | | | | | | 21,317,151 | |
| | | | | | | | |
| | |
| Hotels, Restaurants & Leisure—0.0% | | | | | | | | |
Thomas Cook Group plc (a) | | | 126,403 | | | | 270,145 | |
| | | | | | | | |
| | |
| Household Durables—0.6% | | | | | | | | |
Stanley Black & Decker, Inc. | | | 52,688 | | | | 3,796,170 | |
| | | | | | | | |
|
| Independent Power Producers & Energy Traders—0.8% | |
NRG Energy, Inc.* (a) | | | 220,457 | | | | 5,418,833 | |
| | | | | | | | |
| | |
| Industrial Conglomerates—0.9% | | | | | | | | |
Koninklijke Philips Electronics N.V. | | | 105,724 | | | | 2,717,448 | |
Orkla A.S.A. | | | 327,309 | | | | 3,121,826 | |
| | | | | | | | |
| | | | | | | 5,839,274 | |
| | | | | | | | |
| | |
| Insurance—4.6% | | | | | | | | |
ACE, Ltd. | | | 109,876 | | | | 7,232,038 | |
Alleghany Corp.* | | | 8,909 | | | | 2,967,677 | |
American International Group, Inc.* | | | 192,570 | | | | 5,646,152 | |
CNO Financial Group, Inc.* (a) | | | 121,940 | | | | 964,545 | |
Old Republic International Corp. (a) | | | 226,404 | | | | 2,660,247 | |
White Mountains Insurance Group, Ltd. | | | 16,348 | | | | 6,868,776 | |
Zurich Financial Services AG | | | 14,150 | | | | 3,573,814 | |
| | | | | | | | |
| | | | | | | 29,913,249 | |
| | | | | | | | |
| |
| Leisure Equipment & Products—0.7% | | | | | |
Mattel, Inc. | | | 175,916 | | | | 4,835,931 | |
| | | | | | | | |
| |
| Marine—1.1% | | | | | |
A.P. Moller - Maersk A.S.—Class B | | | 854 | | | | 7,379,898 | |
| | | | | | | | |
| |
| Media—6.0% | | | | | |
British Sky Broadcasting Group plc | | | 434,740 | | | | 5,911,285 | |
News Corp.—Class A | | | 506,436 | | | | 8,963,917 | |
Time Warner Cable, Inc. | | | 105,716 | | | | 8,250,077 | |
Time Warner, Inc. | | | 215,332 | | | | 7,831,625 | |
Viacom, Inc.—Class B | | | 101,249 | | | | 5,163,699 | |
Virgin Media, Inc. (a) | | | 116,371 | | | | 3,482,984 | |
| | | | | | | | |
| | | | | | | 39,603,587 | |
| | | | | | | | |
| | | | | | | | |
| |
| Metals & Mining—1.3% | | | | | |
ThyssenKrupp AG | | | 166,690 | | | $ | 8,660,213 | |
| | | | | | | | |
| |
| Multi-Utilities—0.6% | | | | | |
GDF Suez | | | 112,921 | | | | 4,138,827 | |
| | | | | | | | |
| |
| Office Electronics—1.7% | | | | | |
Xerox Corp. | | | 1,049,414 | | | | 10,924,400 | |
| | | | | | | | |
| |
| Oil, Gas & Consumable Fuels—4.8% | | | | | |
BP plc | | | 302,119 | | | | 2,228,576 | |
Marathon Oil Corp. | | | 247,110 | | | | 13,017,755 | |
Murphy Oil Corp. | | | 57,968 | | | | 3,806,179 | |
Prime AET&D Holdings No. 1 (144A) (b) | | | 762,551 | | | | 1 | |
Royal Dutch Shell plc—Class A | | | 260,764 | | | | 9,271,083 | |
Williams Cos., Inc. (The) | | | 103,311 | | | | 3,125,158 | |
| | | | | | | | |
| | | | | | | 31,448,752 | |
| | | | | | | | |
| |
| Paper & Forest Products—1.7% | | | | | |
Domtar Corp. | | | 33,084 | | | | 3,133,717 | |
International Paper Co. | | | 269,715 | | | | 8,042,901 | |
| | | | | | | | |
| | | | | | | 11,176,618 | |
| | | | | | | | |
| |
| Pharmaceuticals—6.4% | | | | | |
Eli Lilly & Co. | | | 276,898 | | | | 10,391,982 | |
Merck & Co., Inc. | | | 327,965 | | | | 11,573,885 | |
Novartis AG | | | 81,659 | | | | 4,998,656 | |
Pfizer, Inc. | | | 599,308 | | | | 12,345,745 | |
Teva Pharmaceutical Industries, Ltd. (ADR) | | | 50,121 | | | | 2,416,834 | |
| | | | | | | | |
| | | | | | | 41,727,102 | |
| | | | | | | | |
| |
| Real Estate—0.6% | | | | | |
Canary Wharf Group plc (144A)* (b) | | | 767,618 | | | | 3,715,987 | |
| | | | | | | | |
| |
| Real Estate Investment Trusts—1.7% | | | | | |
Alexander’s, Inc. (a) | | | 11,059 | | | | 4,390,423 | |
Weyerhaeuser Co. (a) | | | 313,729 | | | | 6,858,116 | |
| | | | | | | | |
| | | | | | | 11,248,539 | |
| | | | | | | | |
| |
| Real Estate Management & Development—0.1% | | | | | |
Forestar Real Estate Group, Inc.* (a) | | | 51,756 | | | | 850,351 | |
| | | | | | | | |
|
| Semiconductors & Semiconductor Equipment—1.1% | |
LSI Corp.* | | | 960,137 | | | | 6,836,175 | |
| | | | | | | | |
| | |
| Software—2.9% | | | | | | | | |
Microsoft Corp. | | | 471,555 | | | | 12,260,430 | |
Nintendo Co., Ltd. | | | 13,417 | | | | 2,522,314 | |
Symantec Corp.* | | | 213,746 | | | | 4,215,071 | |
| | | | | | | | |
| | | | | | | 18,997,815 | |
| | | | | | | | |
See accompanying notes to financial statements.
7
MET INVESTORS SERIES TRUST
| | |
Met/Franklin Mutual Shares Portfolio | | |
Schedule of Investments as of June 30, 2011 (Unaudited)
Common Stocks—(Continued)
| | | | | | | | |
| Security Description | | Shares/Par
Amount | | | Value | |
| | | | | | | | |
| | |
| Tobacco—8.3% | | | | | | | | |
Altria Group, Inc. | | | 417,057 | | | $ | 11,014,475 | |
British American Tobacco plc | | | 378,015 | | | | 16,588,756 | |
Imperial Tobacco Group plc | | | 335,830 | | | | 11,178,654 | |
Japan Tobacco, Inc. | | | 256 | | | | 986,248 | |
Lorillard, Inc. | | | 45,758 | | | | 4,981,674 | |
Philip Morris International, Inc. | | | 73,378 | | | | 4,899,449 | |
Reynolds American, Inc. | | | 136,765 | | | | 5,067,143 | |
| | | | | | | | |
| | | | | | | 54,716,399 | |
| | | | | | | | |
|
| Wireless Telecommunication Services—1.5% | |
Vodafone Group plc | | | 3,764,126 | | | | 10,015,186 | |
| | | | | | | | |
Total Common Stocks
(Cost $499,521,033) | | | | | | | 579,024,686 | |
| | | | | | | | |
| | |
| Loan Participation—3.4% | | | | | | | | |
| | |
| Commercial Banks—0.3% | | | | | | | | |
CIT Group, Inc. | | | | | | | | |
6.250%, 08/11/15 (c) | | $ | 1,963,709 | | | | 1,978,152 | |
| | | | | | | | |
| | |
| Electronic Equipment—0.9% | | | | | | | | |
Texas Competitive Electric Holdings Co. LLC | | | | | | | | |
4.730%, 10/10/17 (c) | | | 7,576,241 | | | | 5,940,531 | |
| | | | | | | | |
| | |
| Media—0.8% | | | | | | | | |
Clear Channel Communications, Inc. | | | | | | | | |
3.836%, 01/28/16 (c) | | | 4,097,000 | | | | 3,482,450 | |
3.836%, 01/29/16 (c) | | | 2,059,976 | | | | 1,741,911 | |
| | | | | | | | |
| | | | | | | 5,224,361 | |
| | | | | | | | |
| | |
| Real Estate—1.4% | | | | | | | | |
Realogy Corp. | | | | | | | | |
4.643%, 10/10/13 (c) | | | 785,003 | | | | 736,926 | |
4.518%, 10/10/16 (c) | | | 9,016,300 | | | | 8,114,670 | |
13.500%, 10/15/17 | | | 273,000 | | | | 291,359 | |
| | | | | | | | |
| | | | | | | 9,142,955 | |
| | | | | | | | |
| | |
| Utilities—0.0% | | | | | | | | |
Boston Generating LLC | | | | | | | | |
4.503%, 12/21/13 (c) | | | 1,109 | | | | 391 | |
6.500%, 12/21/13 (c) | | | 35,464 | | | | 12,501 | |
| | | | | | | | |
| | | | | | | 12,892 | |
| | | | | | | | |
Total Loan Participation
(Cost $22,948,670) | | | | | | | 22,298,891 | |
| | | | | | | | |
| Domestic Bonds & Debt Securities—0.6% | |
| Security Description | | Shares/Par
Amount | | | Value | |
| | | | | | | | |
| | |
| Media—0.2% | | | | | | | | |
Clear Channel Communications, Inc. | | | | | | | | |
11.000%, 08/01/16 (a) (d) | | $ | 1,460,000 | | | $ | 1,299,400 | |
| | | | | | | | |
| | |
| Oil, Gas & Consumable Fuels—0.3% | | | | | | | | |
OPTI Canada, Inc. | | | | | | | | |
9.000%, 12/15/12 | | | 541,000 | | | | 546,410 | |
9.750%, 08/15/13 (a) | | | 1,449,000 | | | | 1,445,378 | |
| | | | | | | | |
| | | | | | | 1,991,788 | |
| | | | | | | | |
|
| Real Estate—0.1% | |
Realogy Corp.
7.875%, 02/15/19 (a) | | | 560,000 | | | | 560,000 | |
| | | | | | | | |
Total Domestic Bonds & Debt Securities
(Cost $3,911,335) | | | | | | | 3,851,188 | |
| | | | | | | | |
|
| Rights—0.0% | |
|
| Pharmaceuticals—0.0% | |
Sanofi
expires 12/31/20
(Cost—$201,290) | | | 90,671 | | | | 218,517 | |
| | | | | | | | |
|
| Short-Term Investments—13.6% | |
|
| Discount Notes—0.3% | |
Federal Home Loan Bank
0.010%, 07/01/11 (e) | | $ | 2,000,000 | | | | 2,000,000 | |
| | | | | | | | |
| | |
| Mutual Funds—6.0% | | | | | | | | |
State Street Navigator Securities Lending Prime Portfolio (f) | | | 39,430,200 | | | | 39,430,200 | |
| | | | | | | | |
| | |
| Repurchase Agreement—2.3% | | | | | | | | |
Fixed Income Clearing Corp. Repurchase Agreement dated 06/30/11 at 0.010% to be repurchased at $14,791,004 on 07/01/11 collateralized by $15,090,000 Federal Home Loan Bank at 0.330% due 07/16/12 with a value of $15,090,000. | | $ | 14,791,000 | | | | 14,791,000 | |
| | | | | | | | |
|
| U.S. Government & Agency Discount Notes—5.0% | |
U.S. Treasury Bills
0.175%, 07/07/11 (a) (e) | | | 5,000,000 | | | | 4,999,995 | |
0.148%, 08/04/11 (a) (e) | | | 5,000,000 | | | | 4,999,990 | |
0.125%, 08/25/11 (a) (e) | | | 10,000,000 | | | | 9,999,920 | |
0.100%, 09/22/11 (e) | | | 5,000,000 | | | | 4,999,825 | |
See accompanying notes to financial statements.
8
MET INVESTORS SERIES TRUST
| | |
Met/Franklin Mutual Shares Portfolio | | |
Schedule of Investments as of June 30, 2011 (Unaudited)
Short-Term Investments—(Continued)
| | | | | | | | |
| Security Description | | Par
Amount | | | Value | |
| | | | | | | | |
|
| U.S. Government & Agency Discount Notes—(Continued) | |
0.100%, 10/13/11 (e) | | $ | 5,000,000 | | | $ | 4,999,680 | |
0.075%, 11/25/11 (e) | | | 3,000,000 | | | | 2,999,241 | |
| | | | | | | | |
| | | | | | | 32,998,651 | |
| | | | | | | | |
Total Short-Term Investments
(Cost $89,214,932) | | | | | | | 89,219,851 | |
| | | | | | | | |
Total Investments—105.8%
(Cost $615,797,260#) | | | | | | | 694,613,133 | |
Other Assets and Liabilities
(net)—(5.8)% | | | | | | | (38,029,026 | ) |
| | | | | | | | |
| Net Assets—100.0% | | | | | | $ | 656,593,557 | |
| | | | | | | | |
| * | Non-income producing security. |
| # | As of June 30, 2011, the aggregate cost of investments for federal income tax purposes was $615,797,260. The aggregate unrealized appreciation and depreciation of investments were $95,150,834 and $(16,334,961), respectively, resulting in a net unrealized appreciation of $78,815,873 for federal income tax purposes. |
| (a) | All or a portion of the security was on loan. As of June 30, 2011, the market value of securities loaned was $44,092,356 and the collateral received consisted of cash in the amount of $39,430,200 and non-cash collateral with a value of $5,429,800. The cash collateral is invested in a money market fund managed by an affiliate of the custodian. The non-cash collateral received consists primarily of government securities and bank letters of credit, and are held for the benefit of the Portfolio at the Portfolio’s custodian. The Portfolio cannot repledge or resell this collateral. As such, these are excluded from the Statement of Assets and Liabilities. |
| (b) | Security was valued in good faith under procedures approved by the Board of Trustees. |
| (c) | Variable or floating rate security. The stated rate represents the rate at June 30, 2011. Maturity date shown for callable securities reflects the earliest possible call date. |
| (d) | Zero coupon bond—Interest rate represents current yield to maturity. |
| (e) | Payment-in-kind security for which part of the income earned may be paid as additional principal. |
| (f) | Represents investment of cash collateral received from securities lending transactions. |
| (144A)— | Securities exempt from registration under Rule 144A of the Securities Act of 1933. These securities may be resold in transactions exempt from registration, normally to qualified institutional buyers. As of June 30, 2011, the market value of 144A securities was $3,715,988, which was 0.6% of net assets. |
| ADR— | An American Depositary Receipt is a certificate issued by a custodian bank representing the right to receive securities of the foreign issuer described. Trading on exchanges not located in the United States or Canada significantly influences the value of ADRs. |
| | | | |
| Countries Diversification as of June 30, 2011 (Unaudited) | |
| Top Ten Countries | | % of
Net Assets | |
United States | | | 61.8 | |
United Kingdom | | | 10.4 | |
Switzerland | | | 6.7 | |
Germany | | | 4.9 | |
France | | | 2.4 | |
Bermuda | | | 1.4 | |
Denmark | | | 1.1 | |
Spain | | | 1.0 | |
Japan | | | 0.5 | |
Norway | | | 0.5 | |
See accompanying notes to financial statements.
9
MET INVESTORS SERIES TRUST
| | |
Met/Franklin Mutual Shares Portfolio | | |
Schedule of Investments as of June 30, 2011 (Unaudited)
FAIR VALUE HIERARCHY
Accounting principles generally accepted in the United States of America (“GAAP”) defines fair market value as the price that the Portfolio would receive to sell an asset or pay to transfer a liability in an orderly transaction between market participants at the measurement date. It establishes a fair value hierarchy that prioritizes inputs to valuation methods and requires disclosure of the fair value hierarchy that segregates fair value measurements into three levels. Levels 1, 2 and 3 of the fair value hierarchy are defined as follows:
Level 1 - unadjusted quoted prices in active markets for identical investments
Level 2 - other significant observable inputs (including, but not limited to, unadjusted quoted prices for similar investments in markets that are either active or inactive; inputs other than quoted prices that are observable such as interest rates, yield curves, volatilities, prepayment speeds, loss severities, credit risks, default rates, etc.)
Level 3 - significant unobservable inputs based on the best information available in the circumstances, to the extent observable inputs are unavailable (including the Portfolio's own assumptions in determining the fair value of investments)
The inputs or methodologies used for valuing investments are not necessarily an indication of the risk associated with investing in them. For a change in the methodology used, transfers between levels will be recognized as of the beginning of the reporting period. Information on transfers between Level 1 and Level 2 deemed significant, if any, will be disclosed following the valuation table below. For the six months ended June 30, 2011, there were no transfers between Levels 1 and 2. A reconciliation of Level 3 securities, if any, will also be disclosed following the valuation table. For more information about the Portfolio’s policy regarding the valuation of investments, please refer to the Notes to Financial Statements.
The following table summarizes the fair value hierarchy of the Portfolio's investments as of June 30, 2011:
| | | | | | | | | | | | | | | | |
| Description | | Level 1 | | | Level 2 | | | Level 3 | | | Total | |
Common Stocks | | | | | | | | | | | | | | | | |
Aerospace & Defense | | $ | 2,797,019 | | | $ | — | | | $ | — | | | $ | 2,797,019 | |
Air Freight & Logistics | | | 1,487,812 | | | | 1,217,198 | | | | — | | | | 2,705,010 | |
Automobiles | | | 4,377,669 | | | | 4,446,905 | | | | — | | | | 8,824,574 | |
Beverages | | | 14,978,719 | | | | 11,190,303 | | | | — | | | | 26,169,022 | |
Biotechnology | | | 9,426,610 | | | | — | | | | — | | | | 9,426,610 | |
Building Products | | | 5,633,463 | | | | — | | | | — | | | | 5,633,463 | |
Capital Markets | | | 6,847,132 | | | | 4,432,180 | | | | — | | | | 11,279,312 | |
Chemicals | | | — | | | | 9,044,595 | | | | — | | | | 9,044,595 | |
Commercial Banks | | | 18,003,922 | | | | 5,179,952 | | | | — | | | | 23,183,874 | |
Communications Equipment | | | 7,327,627 | | | | — | | | | — | | | | 7,327,627 | |
Computers & Peripherals | | | 7,335,656 | | | | — | | | | — | | | | 7,335,656 | |
Diversified Financial Services | | | 10,578,275 | | | | 3,880,998 | | | | — | | | | 14,459,273 | |
Diversified Telecommunication Services | | | — | | | | 7,936,319 | | | | — | | | | 7,936,319 | |
Electric Utilities | | | 11,049,541 | | | | 6,287,102 | | | | — | | | | 17,336,643 | |
Electrical Equipment | | | — | | | | 751,636 | | | | — | | | | 751,636 | |
Electronic Equipment, Instruments & Components | | | 4,812,509 | | | | — | | | | — | | | | 4,812,509 | |
Energy Equipment & Services | | | 10,243,752 | | | | — | | | | — | | | | 10,243,752 | |
Food & Staples Retailing | | | 29,303,446 | | | | 1,919,637 | | | | — | | | | 31,223,083 | |
Food Products | | | 20,225,232 | | | | 11,386,939 | | | | — | | | | 31,612,171 | |
Health Care Equipment & Supplies | | | 14,091,936 | | | | — | | | | — | | | | 14,091,936 | |
Health Care Providers & Services | | | 21,317,151 | | | | — | | | | — | | | | 21,317,151 | |
Hotels, Restaurants & Leisure | | | — | | | | 270,145 | | | | — | | | | 270,145 | |
Household Durables | | | 3,796,170 | | | | — | | | | — | | | | 3,796,170 | |
Independent Power Producers & Energy Traders | | | 5,418,833 | | | | — | | | | — | | | | 5,418,833 | |
Industrial Conglomerates | | | — | | | | 5,839,274 | | | | — | | | | 5,839,274 | |
Insurance | | | 26,339,435 | | | | 3,573,814 | | | | — | | | | 29,913,249 | |
Leisure Equipment & Products | | | 4,835,931 | | | | — | | | | — | | | | 4,835,931 | |
Marine | | | — | | | | 7,379,898 | | | | — | | | | 7,379,898 | |
Media | | | 33,692,302 | | | | 5,911,285 | | | | — | | | | 39,603,587 | |
Metals & Mining | | | — | | | | 8,660,213 | | | | — | | | | 8,660,213 | |
Multi-Utilities | | | — | | | | 4,138,827 | | | | — | | | | 4,138,827 | |
Office Electronics | | | 10,924,400 | | | | — | | | | — | | | | 10,924,400 | |
See accompanying notes to financial statements.
10
MET INVESTORS SERIES TRUST
| | |
Met/Franklin Mutual Shares Portfolio | | |
Schedule of Investments as of June 30, 2011 (Unaudited)
FAIR VALUE HIERARCHY—(Continued)
| | | | | | | | | | | | | | | | |
| Description | | Level 1 | | | Level 2 | | | Level 3 | | | Total | |
Oil, Gas & Consumable Fuels | | $ | 29,220,175 | | | $ | 2,228,576 | | | $ | 1 | | | $ | 31,448,752 | |
Paper & Forest Products | | | 11,176,618 | | | | — | | | | — | | | | 11,176,618 | |
Pharmaceuticals | | | 36,728,446 | | | | 4,998,656 | | | | — | | | | 41,727,102 | |
Real Estate | | | — | | | | — | | | | 3,715,987 | | | | 3,715,987 | |
Real Estate Investment Trusts | | | 11,248,539 | | | | — | | | | — | | | | 11,248,539 | |
Real Estate Management & Development | | | 850,351 | | | | — | | | | — | | | | 850,351 | |
Semiconductors & Semiconductor Equipment | | | 6,836,175 | | | | — | | | | — | | | | 6,836,175 | |
Software | | | 16,475,501 | | | | 2,522,314 | | | | — | | | | 18,997,815 | |
Tobacco | | | 25,962,741 | | | | 28,753,658 | | | | — | | | | 54,716,399 | |
Wireless Telecommunication Services | | | — | | | | 10,015,186 | | | | — | | | | 10,015,186 | |
Total Common Stocks | | | 423,343,088 | | | | 151,965,610 | | | | 3,715,988 | | | | 579,024,686 | |
Total Loan Participation* | | | — | | | | 22,298,891 | | | | — | | | | 22,298,891 | |
Total Domestic Bonds & Debt Securities* | | | — | | | | 3,851,188 | | | | — | | | | 3,851,188 | |
Total Rights* | | | 218,517 | | | | — | | | | — | | | | 218,517 | |
Short-Term Investments | | | | | | | | | | | | | | | | |
Discount Notes | | | — | | | | 2,000,000 | | | | — | | | | 2,000,000 | |
Mutual Funds | | | 39,430,200 | | | | — | | | | — | | | | 39,430,200 | |
Repurchase Agreements | | | — | | | | 14,791,000 | | | | — | | | | 14,791,000 | |
U.S. Government & Agency Discount Notes | | | — | | | | 32,998,651 | | | | — | | | | 32,998,651 | |
Total Short-Term Investments | | | 39,430,200 | | | | 49,789,651 | | | | — | | | | 89,219,851 | |
Total Investments | | $ | 462,991,805 | | | $ | 227,905,340 | | | $ | 3,715,988 | | | $ | 694,613,133 | |
| | | | | | | | | | | | | | | | | |
Forward Contracts** | | | | | | | | | | | | | | | | |
Forward Contracts to Buy (Appreciation) | | $ | — | | | $ | 161,934 | | | $ | — | | | $ | 161,934 | |
Forward Contracts to Buy (Depreciation) | | | — | | | | (17,649 | ) | | | — | | | | (17,649 | ) |
Forward Contracts to Sell (Appreciation) | | | — | | | | 844,179 | | | | — | | | | 844,179 | |
Forward Contracts to Buy (Depreciation) | | | — | | | | (1,379,546 | ) | | | — | | | | (1,379,546 | ) |
Total Forward Contracts | | $ | — | | | $ | (391,082 | ) | | $ | — | | | $ | (391,082 | ) |
| | | | | | | | | | | | | | | | | |
| * | | See Schedule of Investments for additional detailed categorizations. |
| ** | | Derivative instruments such as forwards, futures contracts and swap contracts are valued on the unrealized appreciation/depreciation on the instrument. |
Following is a reconciliation of Level 3 assets for which significant unobservable inputs were used to determine fair value:
| | | | | | | | | | | | | | | | |
| Investments in Securities | | Balance as of
December 31,
2010 | | | Change in
Unrealized
Appreciation | | | Balance
as of
June 30,
2011 | | | Change in
Unrealized
Appreciation
for
Investments
still held at
June 30,
2011 | |
Common Stocks | | | | | | | | | | | | | | | | |
Oil, Gas & Consumable Fuels | | $ | 1 | | | $ | — | | | $ | 1 | | | $ | — | |
Real Estate | | | 3,327,204 | | | | 388,783 | | | | 3,715,987 | | | | 388,783 | |
| | | | | | | | | | | | | | | | |
Total | | $ | 3,327,205 | | | $ | 388,783 | | | $ | 3,715,988 | | | $ | 388,783 | |
| | | | | | | | | | | | | | | | |
See accompanying notes to financial statements.
11
MET INVESTORS SERIES TRUST
| | |
Met/Franklin Mutual Shares Portfolio | | |
Statement of Assets and Liabilities
June 30, 2011 (Unaudited)
| | | | |
| Assets | | | | |
Investments at value (a)(b) | | $ | 679,822,133 | |
Repurchase Agreement | | | 14,791,000 | |
Cash | | | 93 | |
Cash denominated in foreign currencies (c) | | | 4,646,404 | |
Receivable for investments sold | | | 1,933,921 | |
Receivable for shares sold | | | 405,630 | |
Dividends receivable | | | 1,403,255 | |
Interest receivable | | | 286,505 | |
Unrealized appreciation on forward currency contracts | | | 1,006,113 | |
| | | | |
Total assets | | | 704,295,054 | |
| | | | |
| Liabilities | | | | |
Payables for: | | | | |
Investments purchased | | | 5,725,687 | |
Shares redeemed | | | 522,004 | |
Unrealized depreciation on forward currency contracts | | | 1,397,195 | |
Collateral for securities loaned | | | 39,430,200 | |
Accrued Expenses: | | | | |
Management fees | | | 423,269 | |
Distribution and service fees - Class B | | | 67,349 | |
Administration fees | | | 3,086 | |
Custodian and accounting fees | | | 44,068 | |
Deferred trustees' fees | | | 20,516 | |
Other expenses | | | 68,123 | |
| | | | |
Total liabilities | | | 47,701,497 | |
| | | | |
| Net Assets | | $ | 656,593,557 | |
| | | | |
| Net Assets Represented by | | | | |
Paid in surplus | | $ | 467,837,268 | |
Accumulated net realized gain | | | 99,784,145 | |
Unrealized appreciation on investments and foreign currency transacations | | | 78,491,407 | |
Undistributed net investment income | | | 10,480,737 | |
| | | | |
Net Assets | | $ | 656,593,557 | |
| Net Assets | | | | |
Class A | | $ | 320,835,278 | |
Class B | | | 335,758,279 | |
| Capital Shares Outstanding* | | | | |
Class A | | | 36,997,927 | |
Class B | | | 38,967,902 | |
| Net Asset Value, Offering Price and Redemption Price Per Share | | | | |
Class A | | $ | 8.67 | |
Class B | | | 8.62 | |
| * | | The Portfolio is authorized to issue an unlimited number of shares. |
| (a) | | Identified cost of investments, excluding repurchase agreement, was $601,006,260. |
| (b) | | Includes securities loaned at value of $44,092,356. |
| (c) | | Identified cost of cash denominated in foreign currencies was $4,582,376. |
Statement of Operations
Six Months June 30, 2011 (Unaudited)
| | | | |
| Investment Income | | | | |
Dividends (a) | | $ | 11,392,837 | |
Interest (b) | | | 1,696,688 | |
| | | | |
Total investment income | | | 13,089,525 | |
| | | | |
| Expenses | | | | |
Management fees | | | 3,586,103 | |
Administration fees | | | 23,762 | |
Custodian and accounting fees | | | 150,164 | |
Distribution and service fees - Class B | | | 384,519 | |
Audit and tax services | | | 16,834 | |
Legal | | | 20,801 | |
Trustees' fees and expenses | | | 15,868 | |
Shareholder reporting | | | 29,938 | |
Insurance | | | 10,085 | |
Miscellaneous | | | 6,604 | |
| | | | |
Total expenses | | | 4,244,678 | |
Less management fee waiver | | | (2,260 | ) |
| | | | |
Net expenses | | | 4,242,418 | |
| | | | |
Net investment income | | | 8,847,107 | |
| | | | |
| Net Realized and Unrealized Gain (Loss) on Investments, Futures Contracts and Foreign Currency Transactions | | | | |
Net realized gain (loss) on: | | | | |
Investments | | | 117,909,984 | |
Futures contracts | | | 3,002,180 | |
Foreign currency transactions | | | (16,832,762 | ) |
| | | | |
Net realized gain on investments, futures contracts and foreign currency transactions | | | 104,079,402 | |
| | | | |
Net change in unrealized appreciation (depreciation) on: | | | | |
Investments | | | (50,110,032 | ) |
Foreign currency transactions | | | 2,538,367 | |
| | | | |
Net change in unrealized depreciation on investments, futures contracts and foreign currency transactions | | | (47,571,665 | ) |
| | | | |
Net realized and unrealized gain on investments, futures contracts and foreign currency transactions | | | 56,507,737 | |
| | | | |
| Net Increase in Net Assets from Operations | | $ | 65,354,844 | |
| | | | |
| (a) | | Net of foreign withholding taxes of $500,137. |
| (b) | | Includes net income on securities loaned of $153,466. |
See accompanying notes to financial statements.
12
MET INVESTORS SERIES TRUST
| | |
Met/Franklin Mutual Shares Portfolio | | |
Statements of Changes in Net Assets
June 30, 2011
| | | | | | | | |
| | | Six Months
Ended
June 30, 2011
(Unaudited) | | | Year Ended
December 31,
2010 | |
| Increase in Net Assets: | | | | | | | | |
| Operations | | | | | | | | |
Net investment income | | $ | 8,847,107 | | | $ | 24,797,864 | |
Net realized gain on investments, futures contracts and foreign currency transactions | | | 104,079,402 | | | | 69,451,007 | |
Net change in unrealized appreciation (depreciation) on investments and foreign currency transactions | | | (47,571,665 | ) | | | 5,127,512 | |
| | | | | | | | |
Net increase in net assets resulting from operations | | | 65,354,844 | | | | 99,376,383 | |
| | | | | | | | |
| Distributions to Shareholders | | | | | | | | |
From net investment income | | | | | | | | |
Class A | | | (21,606,233 | ) | | | — | |
Class B | | | (8,703,947 | ) | | | — | |
From net realized gains | | | | | | | | |
Class A | | | (40,500,424 | ) | | | (9,081,969 | ) |
Class B | | | (17,263,421 | ) | | | (2,364,247 | ) |
| | | | | | | | |
Net decrease in net assets resulting from distributions | | | (88,074,025 | ) | | | (11,446,216 | ) |
| | | | | | | | |
Net increase (decrease) in net assets from capital share transactions | | | (285,816,863 | ) | | | 68,118,608 | |
| | | | | | | | |
| Net Increase (Decrease) in Net Assets | | | (308,536,044 | ) | | | 156,048,775 | |
Net assets at beginning of period | | | 965,129,601 | | | | 809,080,826 | |
| | | | | | | | |
Net assets at end of period | | $ | 656,593,557 | | | $ | 965,129,601 | |
| | | | | | | | |
Undistributed net investment income at end of period | | $ | 10,480,737 | | | $ | 31,944,360 | |
| | | | | | | | |
| | | | | | | | | | | | | | | | |
| Other Information: | | | | | | | | | | | | | | | | |
| Capital Shares | | | | | | | | | | | | | | | | |
| | | | |
Transactions in capital shares were as follows: | | | | | | | | | | | | | | | | |
| | | Six Months Ended
June 30, 2011
(Unaudited) | | | Year Ended
December 31, 2010 | |
| | | Shares | | | Value | | | Shares | | | Value | |
| Class A | | | | | | | | | | | | | | | | |
Sales | | | 5,528,342 | | | $ | 50,229,247 | | | | 12,853,216 | | | $ | 107,215,609 | |
Reinvestments | | | 7,163,398 | | | | 62,106,657 | | | | 1,047,517 | | | | 9,081,969 | |
Redemptions | | | (53,271,912 | ) | | | (469,825,713 | ) | | | (17,388,182 | ) | | | (148,343,041 | ) |
| | | | | | | | | | | | | | | | |
Net decrease | | | (40,580,172 | ) | | $ | (357,489,809 | ) | | | (3,487,449 | ) | | $ | (32,045,463 | ) |
| | | | | | | | | | | | | | | | |
| Class B | | | | | | | | | | | | | | | | |
Sales | | | 6,906,560 | | | $ | 62,024,927 | | | | 14,155,845 | | | $ | 116,595,743 | |
Reinvestments | | | 3,012,456 | | | | 25,967,368 | | | | 273,957 | | | | 2,364,247 | |
Redemptions | | | (1,835,643 | ) | | | (16,319,349 | ) | | | (2,295,834 | ) | | | (18,795,919 | ) |
| | | | | | | | | | | | | | | | |
Net increase | | | 8,083,373 | | | $ | 71,672,946 | | | | 12,133,968 | | | $ | 100,164,071 | |
| | | | | | | | | | | | | | | | |
Increase (decrease) derived from capital shares transactions | | | | | | $ | (285,816,863 | ) | | | | | | $ | 68,118,608 | |
| | | | | | | | | | | | | | | | |
See accompanying notes to financial statements.
13
MET INVESTORS SERIES TRUST
|
Met/Franklin Mutual Shares Portfolio |
Financial Highlights
| | | | | | | | | | | | | | | | |
| Selected per share data | | | | | | | | | | | | |
| | | Class A | |
| | | Six Months Ended
June 30, 2011
(Unaudited) | | | Year Ended December 31, | |
| | | | 2010 | | | 2009 | | | 2008(b) | |
| Net Asset Value, Beginning of Period | | $ | 8.91 | | | $ | 8.11 | | | $ | 6.48 | | | $ | 10.00 | |
| | | | | | | | | | | | | | | | |
| Income (Loss) from Investment Operations | | | | | | | | | | | | | | | | |
Net Investment Income(a) | | | 0.09 | | | | 0.25 | | | | 0.11 | | | | 0.07 | |
Net Realized and Unrealized Gain (Loss) on Investments | | | 0.44 | | | | 0.66 | | | | 1.52 | | | | (3.40 | ) |
| | | | | | | | | | | | | | | | |
Total From Investment Operations | | | 0.53 | | | | 0.91 | | | | 1.63 | | | | (3.33 | ) |
| | | | | | | | | | | | | | | | |
| Less Distributions | | | | | | | | | | | | | | | | |
Distributions from Net Investment Income | | | (0.27 | ) | | | — | | | | — | | | | (0.19 | ) |
Distributions from Net Realized Capital Gains | | | (0.50 | ) | | | (0.11 | ) | | | — | | | | — | |
Distributions from Return of Capital | | | — | | | | — | | | | — | | | | (0.00 | )+ |
| | | | | | | | | | | | | | | | |
Total Distributions | | | (0.77 | ) | | | (0.11 | ) | | | — | | | | (0.19 | ) |
| | | | | | | | | | | | | | | | |
| Net Asset Value, End of Period | | $ | 8.67 | | | $ | 8.91 | | | $ | 8.11 | | | $ | 6.48 | |
| | | | | | | | | | | | | | | | |
| Total Return (%) | | | 5.97 | | | | 11.23 | | | | 25.15 | | | | (33.20 | ) |
| | | | |
| Ratios/Supplemental Data | | | | | | | | | | | | | | | | |
Ratio of Expenses to Average Net Assets (%) | | | 0.86 | * | | | 0.88 | | | | 0.90 | | | | 1.32 | * |
Ratio of Net Expenses to Average Net Assets (%)(c) | | | 0.86 | * | | | 0.88 | | | | 0.90 | | | | 0.90 | * |
Ratio of Net Investment Income to Average Net Assets (%) | | | 1.96 | * | | | 3.00 | | | | 1.47 | | | | 1.29 | * |
Portfolio Turnover Rate (%) | | | 31.6 | | | | 42.3 | | | | 60.8 | | | | 23.6 | |
Net Assets, End of Period (in millions) | | $ | 320.8 | | | $ | 691.6 | | | $ | 657.6 | | | $ | 90.9 | |
| |
| | | Class B | |
| | | Six Months Ended
June 30, 2011
(Unaudited) | | | Year Ended December 31, | |
| | | | 2010 | | | 2009 | | | 2008(b) | |
| Net Asset Value, Beginning of Period | | $ | 8.86 | | | $ | 8.08 | | | $ | 6.47 | | | $ | 10.00 | |
| | | | | | | | | | | | | | | | |
| Income (Loss) from Investment Operations | | | | | | | | | | | | | | | | |
Net Investment Income(a) | | | 0.09 | | | | 0.23 | | | | 0.09 | | | | 0.05 | |
Net Realized and Unrealized Gain (loss) on Investments | | | 0.42 | | | | 0.66 | | | | 1.52 | | | | (3.39 | ) |
| | | | | | | | | | | | | | | | |
Total From Investment Operations | | | 0.51 | | | | 0.89 | | | | 1.61 | | | | (3.34 | ) |
| | | | | | | | | | | | | | | | |
| Less Distributions | | | | | | | | | | | | | | | | |
Distributions from Net Investment Income | | | (0.25 | ) | | | — | | | | — | | | | (0.19 | ) |
Distributions from Net Realized Capital Gains | | | (0.50 | ) | | | (0.11 | ) | | | — | | | | — | |
Distributions from Return of Capital | | | — | | | | — | | | | — | | | | (0.00 | )+ |
| | | | | | | | | | | | | | | | |
Total Distributions | | | (0.75 | ) | | | (0.11 | ) | | | — | | | | (0.19 | ) |
| | | | | | | | | | | | | | | | |
| Net Asset Value, End of Period | | $ | 8.62 | | | $ | 8.86 | | | $ | 8.08 | | | $ | 6.47 | |
| | | | | | | | | | | | | | | | |
| Total Return (%) | | | 5.84 | | | | 11.02 | | | | 24.88 | | | | (33.36 | ) |
| | | | |
| Ratios/Supplemental Data | | | | | | | | | | | | | | | | |
Ratio of Expenses to Average Net Assets (%) | | | 1.11 | * | | | 1.13 | | | | 1.15 | | | | 1.60 | * |
Ratio of Net Expenses to Average Net Assets (%)(c) | | | 1.11 | * | | | 1.13 | | | | 1.15 | | | | 1.15 | * |
Ratio of Net Investment Income to Average Net Assets (%) | | | 2.00 | * | | | 2.84 | | | | 1.27 | | | | 1.05 | * |
Portfolio Turnover Rate (%) | | | 31.6 | | | | 42.3 | | | | 60.8 | | | | 23.6 | |
Net Assets, End of Period (in millions) | | $ | 335.8 | | | $ | 273.6 | | | $ | 151.5 | | | $ | 31.9 | |
| + | | Distributions from return of capital were less than $0.01. |
| (a) | | Per share amounts based on average shares outstanding during the period. |
| (b) | | Commencement of operations—4/28/2008. |
| (c) | | Includes the effects of management fee waivers and expenses reimbursed by the Adviser, if applicable. |
See accompanying notes to financial statements.
14
MET INVESTORS SERIES TRUST
| | |
Met/Franklin Mutual Shares Portfolio | | |
Notes to Financial Statements—June 30, 2011 (Unaudited)
1. Organization
Met Investors Series Trust (the “Trust”) is organized as a statutory trust under the laws of Delaware, as an open-end management investment company under the Investment Company Act of 1940, as amended (the “1940 Act”). The Trust currently offers fifty-four Portfolios (the “Portfolios”), each of which operates as a distinct investment vehicle of the Trust. The portfolio included in this report is Met/Franklin Mutual Shares Portfolio (the “Portfolio”), which is diversified. Shares in the Portfolio are not offered directly to the general public and are currently available only to separate accounts established by Metropolitan Life Insurance Companies (“Metlife”) and other affiliated life insurance companies.
The Portfolio has registered four classes of shares: Class A, B, C and E Shares. Class A and B Shares are currently offered by the Portfolio. Shares of each Class of the Portfolio represent an equal pro rata interest in the Portfolio and generally give the shareholder the same voting, dividend, liquidation, and other rights. Investment income, realized and unrealized capital gains and losses, the common expenses of the Portfolio and certain Portfolio-level expense reductions, if any, are allocated on a pro rata basis to each Class based on the relative net assets of each Class to the net assets of the Portfolio. Each Class of shares differs in its respective distribution expenses.
2. Significant Accounting Policies
The financial statements have been prepared in conformity with accounting principles generally accepted in the United States of America (“GAAP”) which require management to make estimates and assumptions that affect the reported amounts of assets and liabilities at the date of the financial statements and the reported amounts of income and expenses during the reporting period. Actual results could differ from these estimates. In the preparation of these financial statements, management has evaluated events and transactions subsequent to June 30, 2011 through the date that the financial statements were issued.
The following is a summary of significant accounting policies consistently followed by the Portfolio in the preparation of its financial statements.
Investment Valuation and Fair Value Measurements - Debt securities (other than short term obligations with a remaining maturity of sixty days or less) including corporate, convertible and municipal bonds and notes; U.S. government agencies; U.S. treasury obligations; sovereign issues; bank loans; and non-U.S. bonds are generally valued on the basis of evaluated or composite bid quotations obtained by independent pricing services and/or brokers and dealers selected by MetLife Advisers, LLC (“MLA” or the “Adviser”), an affiliate of MetLife, Inc., or the relevant Subadviser pursuant to authorization of the Board of Trustees of the Portfolio (the “Board”). Such quotations use inputs that are observable including, among other things, issuer details, interest rates, yield curves, prepayment speeds, credit risks/spreads, default rates and quoted prices for similar securities. Securities that use similar valuation techniques and inputs as described above are categorized as Level 2 within the fair value hierarchy.
Mortgage and asset-backed securities are usually issued as separate tranches, or classes, of securities within each deal. These securities are also generally valued on the basis of evaluated or composite bid quotations obtained by independent pricing services and/or brokers and dealers selected by the Adviser or relevant Subadviser pursuant to authorization of the Board. The pricing models for these securities usually consider tranche-level attributes, estimated cash flows for each tranche, market-based yield spreads for each tranche and current market data, and incorporate deal collateral performance, as available. Mortgage and asset-backed securities that use similar valuation techniques and inputs as described above are categorized as Level 2 within the fair value hierarchy.
Short term obligations with a remaining maturity of sixty days or less are valued at amortized cost which approximates fair market value and are categorized as Level 2 within the fair value hierarchy.
Equity securities such as common stock, exchange-traded funds and preferred stock that are traded on a national securities exchange or other exchanges are generally valued at their last sale price on the principal trading market. Equity securities traded on a national securities exchange or other exchanges for which there is no reported sale during the day are valued at the last reported bid price. A security that is listed or traded on more than one exchange is valued at the quotation on the exchange determined to be the primary market for that security by the Board or its delegates. If no closing price is available, then such securities are valued at the last reported bid price. Equity securities traded over-the-counter are generally valued at the last reported sales price. To the extent these securities are actively traded and valuation adjustments are not applied, they are categorized as Level 1 within the fair value hierarchy. Other equity securities traded on inactive markets or valued by reference to similar instruments are categorized as Level 2 within the fair value hierarchy.
Equity securities which are listed on foreign stock exchanges normally are valued at the market closing price, the last sale price on the day the securities are valued or, lacking any sales on such day, at the bid price. Valuation adjustments may be applied to certain equity securities that are solely traded on foreign exchanges closing before the U.S. market to account for the market movement between the close of the foreign exchanges and the close of the U.S. market. The Portfolio may use a systematic fair valuation model provided by an independent third party to value securities principally traded in these foreign markets closing before the U.S. market in order to adjust for possible stale pricing that may occur between the close of these foreign exchanges and the time of the Portfolio valuation. Securities using these valuation adjustments are categorized as Level 2 within the fair value hierarchy.
15
MET INVESTORS SERIES TRUST
| | |
Met/Franklin Mutual Shares Portfolio | | |
Notes to Financial Statements—June 30, 2011 (Unaudited)—(Continued)
2. Significant Accounting Policies - continued
Investments in registered open-end management investment companies are valued at reported net asset value per share and are categorized as Level 1 within the fair value hierarchy.
Forward foreign currency exchange contracts are valued based on the mean between closing bid and asked prices of the forward currency rates in the London foreign exchange markets on a daily basis as provided by a reliable bank or dealer. These contracts are categorized as Level 2 within the fair value hierarchy.
Options, whether on securities, indices, futures contracts, or otherwise, are valued at the last sales price available as of the close of business on the day of valuation or, if there is no such sale price available, at the bid price. Options on currencies are valued at the spot price each day. These types of options are categorized as Level 1 within the fair value hierarchy. Other options traded on inactive markets where a broker quotation is received or options valued by an evaluated quote provided by an independent pricing vendor are categorized as Level 2 within the fair value hierarchy.
Futures contracts, which are traded on commodity exchanges, are valued at their closing prices as of the close of such exchanges and are categorized as Level 1 within the fair value hierarchy. Futures contracts traded on inactive markets where a broker quotation is received are categorized as Level 2 within the fair value hierarchy. As a general matter, futures contracts are marked-to-market daily.
Options and futures contracts that are traded over-the-counter are generally valued on the basis of broker dealer quotations or pricing service providers who use a series of techniques, including simulation pricing models, to determine the value of the contracts. The pricing models use inputs that are observed from actively quoted markets such as issuer details, indices, spreads, interest rates, curves and exchange rates. These contracts are categorized as Level 2 within the fair value hierarchy.
If no current market value quotation or other observable inputs are readily available or reliable for a security, the fair value of the security will be determined in accordance with procedures approved by and under the general supervision of the Board. The Board has delegated the determination in good faith of the fair value of securities for which current market quotations are not readily available to a Valuation Committee established by the Board. Market quotes and other observable inputs are considered not readily available in circumstances where there is an absence of current or reliable market-based data. In addition, market quotes would be considered not readily available when, due to extraordinary circumstances, the exchanges or markets on which the securities trade, do not open for trading for the entire day and no other market prices are available. When the Portfolio uses fair value pricing, it may take into account any factors it deems appropriate, including significant unobservable inputs. The value of securities used by the Portfolio to calculate its net asset value may differ from quoted or published prices for the same securities. Fair value pricing involves subjective judgments and the fair value determined for a security may be materially different than the value that could be realized upon the sale of that security. These securities are categorized as Level 3 within the fair value hierarchy.
Investment Transactions and Related Investment Income - Portfolio security transactions are recorded on the trade date. Dividend income is recorded on the ex-dividend date or, for certain foreign securities, when notified. Interest income, which includes amortization of premium and accretion of discount on debt securities, is recorded on the accrual basis. Realized gains and losses on investments and unrealized appreciation and depreciation are determined on the identified cost basis, which is the same basis used for federal income tax purposes. Foreign income and foreign capital gains on some foreign securities may be subject to foreign withholding taxes, which are accrued as applicable.
Income Taxes - It is the Portfolio’s policy to comply with the requirements of the Internal Revenue Code of 1986, as amended (the “Code”), and regulations thereunder, applicable to regulated investment companies and to distribute, with respect to each taxable year, all of its taxable income to shareholders. Therefore, no federal income tax provision is required. The Portfolio files U.S. federal and various state tax returns. No income tax returns are currently under examination. The Portfolio’s federal tax returns for the prior three fiscal years remain subject to examination by the Internal Revenue Service.
Dividends and Distributions to Shareholders - The Portfolio records dividends and distributions on the ex-dividend date. Net realized gains from security transactions (if any) are generally distributed annually to shareholders. The timing and characterization of certain income and capital gains distributions are determined in accordance with federal tax regulations that may differ from GAAP. Permanent book and tax basis differences relating to shareholder distributions will result in reclassification between under/over distributed net investment income, accumulated net realized gains/losses and paid in surplus. Book-tax differences are primarily due to foreign currency transactions, Real Estate Investment Trusts (REIT), forwards transactions, Ingersoll Rand security sold adjustment, passive foreign investment companies (PFIC), deferred trustees’ compensation, and losses deferred due to wash sales, as applicable. These adjustments have no impact on net assets or the results of operations.
Securities Lending - The Portfolio may lend its portfolio securities to certain qualified brokers who borrow securities in order to complete certain securities transactions. By lending its portfolio securities, the Portfolio attempts to increase its net investment income through the receipt of income on the loaned securities. Any gain or loss in the market price of the loaned securities that might occur and any interest earned or dividends declared during the term of the loan would accrue to the account of the Portfolio.
16
MET INVESTORS SERIES TRUST
| | |
Met/Franklin Mutual Shares Portfolio | | |
Notes to Financial Statements—June 30, 2011 (Unaudited)—(Continued)
2. Significant Accounting Policies - continued
The Trust has entered into a securities lending arrangement with the custodian, State Street Bank and Trust Company (the “custodian”). Under this arrangement, the custodian is authorized to loan portfolio securities on the Portfolio’s behalf. In exchange, the Portfolio receives either cash or securities as collateral against the loaned securities. The Portfolio receives collateral at least equal to 102% of the market value of the loaned securities (105% for foreign equity securities), at each loan’s inception. Collateral representing at least 100% of the market value of the loaned securities must be maintained for the duration of the loan. Cash collateral is generally invested in the State Street Navigator Securities Lending Prime Portfolio (the “Navigator Portfolio”), managed by an affiliate of the custodian. The Navigator Portfolio is a registered money market fund which invests in a variety of high quality U.S. dollar-denominated instruments. If the market value of the collateral at the close of trading on a business day is less than 100% of the market value of the loaned securities at the close of trading on that day, the borrower shall be required to deliver, by the close of business on the following business day, an additional amount of collateral so that the total amount of posted collateral equals at least 100% of the market value of all the loaned securities as of such preceding day. A portion of net income (income after the deduction of expenses and fees of the Navigator Portfolio) on the collateral is rebated to the borrower of the securities and the remainder is split between the custodian and the Portfolio. On loans collateralized by U.S. Treasuries, a fee is received from the borrower and is allocated between the Portfolio and the custodian. The risks associated with lending portfolio securities include, but are not limited to, possible delays in receiving additional collateral or in the recovery of the loaned securities, possible loss of rights in the collateral should the borrower fail financially, as well as risk of loss in the value of the collateral or the value of the investments made with the collateral. Net interest income received by the Portfolio in securities lending transactions during the six months ended June 30, 2011 is disclosed in the footnotes to the Statement of Operations. Any outstanding loans by the Portfolio at June 30, 2011 are disclosed in the footnotes to the Schedule of Investments.
Repurchase Agreements - The Portfolio may enter into repurchase agreements with selected commercial banks and broker-dealers, under which the Portfolio acquires securities as collateral and agrees to resell the securities at an agreed upon time and at an agreed upon price. The Portfolio, through the custodian or a subcustodian, receives delivery of the underlying securities collateralizing repurchase agreements. The Portfolio requires the custodian to take possession, to have legally segregated in the Federal Reserve Book Entry System, or to have segregated within the custodian’s vault, all securities held as collateral for repurchase agreements. It is the Portfolio’s policy that the market value of the collateral be at least equal to 100% of the repurchase price in the case of a repurchase agreement of one-day duration and 102% of the repurchase price in the case of all other repurchase agreements. In connection with transactions in repurchase agreements, if the seller defaults and the value of the collateral declines or if the seller enters an insolvency proceeding, realization of the collateral by the Portfolio may be delayed, limited or wholly denied.
Foreign Currency Translation - The books and records of the Portfolio are maintained in U.S. dollars. The values of securities, currencies and other assets and liabilities denominated in currencies other than U.S. dollars are translated into U.S. dollars based upon foreign exchange rates prevailing at the end of the period. Purchases and sales of investment securities, income and expenses are translated on the respective dates of such transactions. Since the values of investment securities are presented at the foreign exchange rates prevailing at the end of the period, it is not practical to isolate that portion of the results of operations arising from changes in exchange rates from that portion of the results of operations reflecting fluctuations arising from changes in market prices of the investment securities. Such fluctuations are included in the net realized and unrealized gain or loss on investments.
Net realized foreign exchange gains or losses arise from activity in forward foreign currency exchange contracts, sales of foreign currency, currency gains or losses realized between the trade and settlement dates on securities transactions, and the difference between the amounts of dividends, interest, and foreign withholding taxes recorded by the Portfolio and the U.S. dollar equivalent of the amounts actually received or paid by the Portfolio. Gains and losses attributable to foreign currency exchange rates on sales of securities are recorded as Net realized gains and losses on investments. Net unrealized foreign exchange gains and losses arise from changes in the value of assets and liabilities, other than investment securities, resulting from changes in foreign exchange rates.
Futures Contracts - The Portfolio may buy and sell futures contracts (on recognized exchanges) as a hedge, to maintain investment exposure to a target asset class or to enhance return. The Portfolio may be subject to fluctuations in equity prices, interest rates, and foreign currency exchange rates in the normal course of pursuing its investment objective. Futures contracts are standardized agreements to buy or sell a security, or deliver a final cash settlement price in connection with an index, interest rate, currency, or other asset, for a set price in the future. The Portfolio must deposit an amount (“initial margin”) equal to a certain percentage of the face value of the futures contract. The initial margin may be in the form of cash or securities which is returned when the Portfolio’s obligations under the contract have been satisfied. Futures contracts are marked-to-market daily and subsequent payments (“variation margin”) are made or received by the Portfolio depending on the daily fluctuations in the value of the futures contract. These amounts are reflected as receivables or payables on the Statement of Assets and Liabilities. Risks of entering into futures contracts (and related options) include the possibility that the market for these instruments may be illiquid and that a change in the value of the contract or option may not correlate perfectly with changes in the value of the underlying securities. Futures contracts are exchange traded and the exchange’s clearinghouse, as counterparty to all exchange traded futures, guarantees the futures contracts against default.
3. Investment Management Agreement and Other Transactions with Affiliates
Investment Management Agreement - The Trust is managed by the Adviser. The Trust has entered into a management agreement with the Adviser (the “Management Agreement”) for investment management services in connection with the investment management of the Portfolio. The
17
MET INVESTORS SERIES TRUST
| | |
Met/Franklin Mutual Shares Portfolio | | |
Notes to Financial Statements—June 30, 2011 (Unaudited)—(Continued)
3. Investment Management Agreement and Other Transactions with Affiliates - continued
Adviser is subject to the supervision and direction of the Board and has overall responsibility for the general management and administration of the Trust. The Adviser has entered into a subadvisory agreement with Franklin Mutual Advisers, LLC (the “Subadviser”) for investment advisory services in connection with the investment management of the Portfolio.
Subject to the supervision and direction of the Board, the Adviser supervises the Subadviser and has full discretion with respect to the retention or renewal of the subadvisory agreement. The Adviser pays the Subadviser a fee based on the Portfolio’s average daily net assets.
Under the terms of the Portfolio’s Management Agreement, the Portfolio pays the Adviser a monthly fee based upon annual rates applied to the Portfolio’s average daily net assets as follows:
| | | | | | | | |
Management Fees
earned by the Adviser
for the six months ended
June 30, 2011 | | % per annum | | | Average Daily Net Assets | |
| | |
| $3,586,103 | | | 0.800 | % | | | ALL | |
Certain officers and trustees of the Trust may also be officers of the Adviser; however, such officers and trustees receive no compensation from the Trust.
Management Fee Waiver - Effective May 1, 2011, the Adviser contractually agreed to waive a portion of the management fee through April 30, 2012. This waiver reduced the management fee to the annual rate of 0.780% of the Portfolio’s average daily net assets in excess of $1 billion. This arrangement was voluntary for the period January 1, 2011 through April 30, 2011. Amounts waived for the period ended June 30, 2011 are shown as a management fee waiver in the Statement of Operations.
Transfer Agency Agreement - MetLife serves as the transfer agent for the Trust. MetLife receives no fees for its services to the Trust under the transfer agency agreement.
Expense Limitation Agreement - The Adviser had entered into an expense limitation agreement with the Trust (“Expense Limitation Agreement”) in the interest of limiting expenses of the Portfolio. The Expense Limitation Agreement continued in effect with respect to the Portfolio until April 30, 2011. Pursuant to that Expense Limitation Agreement, the Adviser had agreed to waive or limit its fees and to assume other expenses so that the total annual operating expenses of the Portfolio other than interest, taxes, brokerage commissions, other expenditures which were capitalized or expensed in accordance with GAAP, other extraordinary expenses not incurred in the ordinary course of the Portfolio’s business and acquired fund fees and expenses but including amounts payable pursuant to a plan adopted in accordance with Rule 12b-1 under the 1940 Act, were limited to the following expense ratios as a percentage of the Portfolio’s average daily net assets:
| | | | |
Maximum Expense Ratio under current
Expense Limitation Agreement | |
| Class A | | Class B | |
| |
| 0.90% | | | 1.15 | % |
If in any year in which the Management Agreement is still in effect, the estimated aggregate operating expenses of the Portfolio for the fiscal year are less than the Maximum Expense Ratios for that year, subject to approval by the Trust’s Board, the Adviser shall be entitled to reimbursement by the Portfolio to the extent that the charge does not cause the expenses in such subsequent year to exceed the Maximum Expense Ratios as stated above. The Portfolio is not obligated to repay any expense paid by the Adviser more than five years after the end of the fiscal year in which such expense was incurred.
Effective May 1, 2011, there was no longer an expense cap for the Portfolio.
Distribution Agreement and Plan - The Trust has a distribution agreement with MetLife Investors Distribution Company (“MIDC” or the “Distributor”) in which MIDC serves as the Distributor for the Trust’s Class A and Class B Shares. MIDC is a wholly-owned subsidiary of MetLife Investors Group, Inc., an affiliate of the Adviser. The Class B distribution plan provides that the Trust, on behalf of the Portfolio, may pay annually up to 0.50% of the average daily net assets of the Portfolio attributable to its Class B Shares with respect to activities primarily intended to result in the sale of Class B Shares. However, under the Class B distribution agreement, payments to the Distributor for activities pursuant to the Class B distribution plan are currently limited to payments at an annual rate equal to 0.25% of average daily net assets of the Portfolio attributable to its Class B Shares. Amounts incurred by the Portfolio for the six months ended June 30, 2011 are shown as Distribution and service fees in the Statement of Operations.
Under the terms of the Class B distribution plan and distribution agreement, the Portfolio is authorized to make payments monthly to the Distributor that may be used to pay or reimburse entities providing distribution and shareholder servicing with respect to the Class B Shares for such entities’ fees or expenses incurred.
18
MET INVESTORS SERIES TRUST
| | |
Met/Franklin Mutual Shares Portfolio | | |
Notes to Financial Statements—June 30, 2011 (Unaudited)—(Continued)
4. Investment Transactions
Aggregate cost of purchases and proceeds of sales of investment securities, excluding short-term securities, for the six months ended June 30, 2011 were as follows:
| | | | | | | | | | | | |
| Purchases | | | Sales | |
| U.S. Government | | Non U.S. Government | | | U.S. Government | | | Non U.S. Government | |
| | | |
| $64,778,833 | | $ | 199,523,522 | | | $ | 97,799,730 | | | $ | 352,899,872 | |
5. Investments in Derivative Instruments
Investments in Derivative Instruments - Disclosures about derivative instruments are intended to improve financial reporting for derivative instruments by requiring enhanced disclosure that enables investors to understand how and why a Portfolio uses derivatives, how derivatives are accounted for, and how derivative instruments affect the Portfolio’s results of operations and financial position. Summarized below are the specific types of derivative instruments utilized by the Portfolio.
Forward Foreign Currency Exchange Contracts - The Portfolio may enter into forward foreign currency exchange contracts to hedge its portfolio holdings against the risk of future movements in certain foreign currency exchange rates. When entering into these contracts, the Portfolio agrees to receive or deliver a fixed quantity of foreign currency for an agreed-upon price on an agreed upon future date. These contracts are valued daily and the Portfolio’s net equity therein, representing unrealized gain or loss on the contracts as measured by the difference between the forward foreign exchange rates at the dates of entry into the contracts and the forward foreign exchange rates at the value date, is included in the Statement of Assets and Liabilities. When a contract is closed, the Portfolio recognizes a realized gain or loss equal to the difference between the value of the contract at the time it was opened and the value at the time it was closed.
Realized and unrealized gains and losses on forward foreign currency exchange contracts are included in the Statement of Operations. These contracts involve market and/or credit risk in excess of the amount recognized in the Statement of Assets and Liabilities.
The use of forward foreign currency exchange contracts does not eliminate fluctuations in the underlying prices of the securities of the Portfolio, but it does establish a rate of exchange that can be achieved in the future. Although forward foreign currency exchange contracts to sell limit the risk of loss due to a decline in the value of the currency holdings, they also limit any potential gain that might result should the value of the currency increase. In addition, the Portfolio could be exposed to risks if the counterparties to the contracts are unable to meet the terms of the contracts.
At June 30, 2011, the Portfolio had the following derivatives, grouped into appropriate risk categories:
| | | | | | | | | | | | |
| | | Asset Derivatives | | | Liability Derivatives | |
Risk Exposure | | Statement of Assets &
Liabilities Location | | Fair Value | | | Statement of Assets &
Liabilities Location | | Fair Value | |
Foreign Currency Exchange | | Unrealized appreciation on forward foreign currency exchange contracts | | $ | 1,006,113 | | | Unrealized depreciation on forward foreign currency exchange contracts | | $ | 1,397,195 | |
| | | | | | | | | | | | |
Transactions in derivative instruments during the six months ended June 30, 2011, were as follows:
| | | | | | | | | | | | |
Statement of Operations Location - Net Realized Gain (Loss) | | Equity | | | Foreign Currency
Exchange | | | Total | |
Foreign currency transactions | | $ | — | | | $ | (16,197,818 | ) | | $ | (16,197,818 | ) |
Futures contracts | | | 3,002,180 | | | | — | | | | 3,002,180 | |
| | | | | | | | | | | | |
| | | |
| | $ | 3,002,180 | | | $ | (16,197,818 | ) | | $ | (13,195,638 | ) |
| | | | | | | | | | | | |
| | | |
Statement of Operations Location - Net Change in Unrealized Gain (Loss) | | | | | | | | | |
Foreign currency transactions | | | | | | $ | 2,520,806 | | | | | |
| | | | | | | | | | | | |
19
MET INVESTORS SERIES TRUST
| | |
Met/Franklin Mutual Shares Portfolio | | |
Notes to Financial Statements—June 30, 2011 (Unaudited)—(Continued)
5. Investments in Derivative Instruments - continued
For the six months ended June 30, 2011, the average amount or number per contract outstanding for each derivative type was as follows:
| | | | |
Average Notional or Face Amount(a) | | Foreign Currency Risk | |
| |
Foreign currency transactions | | $ | 212,172,012 | |
| (a) | | Averages are based on daily activity levels during 2011. |
6. Forward Foreign Currency Exchange Contracts
Forward Foreign Currency Exchange Contracts to Buy:
| | | | | | | | | | | | | | | | | | | | | | |
Settlement Date | | Counterparty | | Contracts to Buy | | | Value at
June 30, 2011 | | | In Exchange
for U.S.$ | | | Net Unrealized
Appreciation/
(Depreciation) | |
| | | | | | |
| 8/10/2011 | | Deutsche Bank AG | | | 379,100 | | | | CHF | | | $ | 450,680 | | | $ | 449,944 | | | $ | 736 | |
| | | | | | |
| 8/10/2011 | | State Street Corp. | | | 163,000 | | | | CHF | | | | 193,777 | | | | 195,880 | | | | (2,103 | ) |
| | | | | | |
| 9/15/2011 | | Deutsche Bank AG | | | 1,344,329 | | | | EUR | | | | 1,948,424 | | | | 1,897,279 | | | | 51,145 | |
| | | | | | |
| 9/15/2011 | | Deutsche Bank AG | | | 74,486 | | | | EUR | | | | 107,958 | | | | 106,392 | | | | 1,566 | |
| | | | | | |
| 9/15/2011 | | Deutsche Bank AG | | | 860,000 | | | | EUR | | | | 1,246,454 | | | | 1,216,539 | | | | 29,915 | |
| | | | | | |
| 9/15/2011 | | State Street Corp. | | | 148,124 | | | | EUR | | | | 214,685 | | | | 210,916 | | | | 3,769 | |
| | | | | | |
| 9/15/2011 | | State Street Corp. | | | 79,504 | | | | EUR | | | | 115,230 | | | | 114,404 | | | | 826 | |
| | | | | | |
| 8/12/2011 | | Bank of America N.A. | | | 450,000 | | | | GBP | | | | 722,720 | | | | 728,370 | | | | (5,650 | ) |
| | | | | | |
| 9/16/2011 | | Barclays Bank plc | | | 450,000 | | | | GBP | | | | 722,407 | | | | 729,450 | | | | (7,043 | ) |
| | | | | | |
| 10/20/2011 | | Bank of America N.A. | | | 11,438,424 | | | | JPY | | | | 141,933 | | | | 139,269 | | | | 2,664 | |
| | | | | | |
| 10/20/2011 | | Bank of America N.A. | | | 11,629,629 | | | | JPY | | | | 144,305 | | | | 141,946 | | | | 2,359 | |
| | | | | | |
| 10/20/2011 | | Bank of America N.A. | | | 10,448,581 | | | | JPY | | | | 129,650 | | | | 130,439 | | | | (789 | ) |
| | | | | | |
| 10/20/2011 | | Barclays Bank plc | | | 8,497,858 | | | | JPY | | | | 105,445 | | | | 105,965 | | | | (520 | ) |
| | | | | | |
| 10/20/2011 | | Deutsche Bank AG | | | 176,994,300 | | | | JPY | | | | 2,196,221 | | | | 2,145,958 | | | | 50,263 | |
| | | | | | |
| 10/20/2011 | | Deutsche Bank AG | | | 9,092,881 | | | | JPY | | | | 112,828 | | | | 112,252 | | | | 576 | |
| | | | | | |
| 10/20/2011 | | Deutsche Bank AG | | | 3,300,000 | | | | JPY | | | | 40,948 | | | | 40,467 | | | | 481 | |
| | | | | | |
| 10/20/2011 | | Deutsche Bank AG | | | 6,932,810 | | | | JPY | | | | 86,025 | | | | 85,694 | | | | 331 | |
| | | | | | |
| 10/20/2011 | | Deutsche Bank AG | | | 6,872,299 | | | | JPY | | | | 85,274 | | | | 85,612 | | | | (338 | ) |
| | | | | | |
| 10/20/2011 | | Deutsche Bank AG | | | 15,340,000 | | | | JPY | | | | 190,345 | | | | 190,965 | | | | (620 | ) |
| | | | | | |
| 10/20/2011 | | Deutsche Bank AG | | | 9,878,500 | | | | JPY | | | | 122,576 | | | | 122,216 | | | | 360 | |
| | | | | | |
| 8/19/2011 | | Deutsche Bank AG | | | 1,135,170 | | | | NOK | | | | 210,584 | | | | 205,149 | | | | 5,435 | |
| | | | | | |
| 8/19/2011 | | Deutsche Bank AG | | | 325,000 | | | | NOK | | | | 60,290 | | | | 59,996 | | | | 294 | |
| | | | | | |
| 8/19/2011 | | Deutsche Bank AG | | | 1,040,305 | | | | NOK | | | | 192,985 | | | | 192,314 | | | | 671 | |
| | | | | | |
| 8/19/2011 | | Deutsche Bank AG | | | 1,958,600 | | | | NOK | | | | 363,337 | | | | 360,408 | | | | 2,929 | |
| | | | | | |
| 8/19/2011 | | Deutsche Bank AG | | | 807,146 | | | | NOK | | | | 149,733 | | | | 146,701 | | | | 3,032 | |
| | | | | | |
| 8/19/2011 | | Deutsche Bank AG | | | 333,800 | | | | NOK | | | | 61,923 | | | | 60,055 | | | | 1,868 | |
| | | | | | |
| 8/19/2011 | | Deutsche Bank AG | | | 729,842 | | | | NOK | | | | 135,392 | | | | 133,049 | | | | 2,343 | |
| | | | | | |
| 8/19/2011 | | State Street Corp. | | | 447,071 | | | | NOK | | | | 82,935 | | | | 82,564 | | | | 371 | |
| | | | | | |
| 8/19/2011 | | State Street Corp. | | | 789,632 | | | | NOK | | | | 146,483 | | | | 147,068 | | | | (585 | ) |
| | | | | | | | | | | | | | | | | | | | | | |
Net Unrealized Appreciation | | | | | | | | | | | | | | | | | | $ | 144,286 | |
| | | | | | | | | | | | | | | | | | | | | | |
20
MET INVESTORS SERIES TRUST
| | |
Met/Franklin Mutual Shares Portfolio | | |
Notes to Financial Statements—June 30, 2011 (Unaudited)—(Continued)
6. Forward Foreign Currency Exchange Contracts - continued
Forward Foreign Currency Exchange Contracts to Sell:
| | | | | | | | | | | | | | | | | | | | | | |
Settlement Date | | Counterparty | | Contracts to Deliver | | | Value at
June 30, 2011 | | | In Exchange
for U.S.$ | | | Net Unrealized
Appreciation/
(Depreciation) | |
| | | | | | |
| 8/23/2011 | | Barclays Bank plc | | | 899,941 | | | | AUD | | | $ | 959,816 | | | $ | 941,383 | | | $ | (18,433 | ) |
| | | | | | |
| 8/23/2011 | | Deutsche Bank AG | | | 666,084 | | | | AUD | | | | 710,401 | | | | 693,580 | | | | (16,821 | ) |
| | | | | | |
| 8/23/2011 | | Deutsche Bank AG | | | 240,478 | | | | AUD | | | | 256,478 | | | | 253,921 | | | | (2,557 | ) |
| | | | | | |
| 8/23/2011 | | Deutsche Bank AG | | | 240,478 | | | | AUD | | | | 256,478 | | | | 253,921 | | | | (2,557 | ) |
| | | | | | |
| 8/23/2011 | | State Street Corp. | | | 133,500 | | | | AUD | | | | 142,382 | | | | 142,144 | | | | (238 | ) |
| | | | | | |
| 8/10/2011 | | Bank of America N.A. | | | 250,000 | | | | CHF | | | | 297,204 | | | | 286,994 | | | | (10,210 | ) |
| | | | | | |
| 8/10/2011 | | State Street Corp. | | | 11,029,399 | | | | CHF | | | | 13,111,920 | | | | 12,619,450 | | | | (492,470 | ) |
| | | | | | |
| 9/15/2011 | | Barclays Bank plc | | | 1,000,000 | | | | EUR | | | | 1,449,365 | | | | 1,448,750 | | | | (615 | ) |
| | | | | | |
| 9/15/2011 | | Deutsche Bank AG | | | 18,451,284 | | | | EUR | | | | 26,742,641 | | | | 26,460,986 | | | | (281,655 | ) |
| | | | | | |
| 9/15/2011 | | HSBC Bank USA N.A | | | 19,511,471 | | | | EUR | | | | 28,279,240 | | | | 27,975,547 | | | | (303,693 | ) |
| | | | | | |
| 8/12/2011 | | Bank of America N.A. | | | 28,754,160 | | | | GBP | | | | 46,180,455 | | | | 47,013,051 | | | | 832,596 | |
| | | | | | |
| 8/12/2011 | | Deutsche Bank AG | | | 600,000 | | | | GBP | | | | 963,627 | | | | 975,210 | | | | 11,583 | |
| | | | | | |
| 10/20/2011 | | Bank of America N.A. | | | 215,284,324 | | | | JPY | | | | 2,671,339 | | | | 2,612,674 | | | | (58,665 | ) |
| | | | | | |
| 10/20/2011 | | Bank of America N.A. | | | 45,000,000 | | | | JPY | | | | 558,379 | | | | 546,886 | | | | (11,493 | ) |
| | | | | | |
| 10/20/2011 | | Barclays Bank plc | | | 16,607,200 | | | | JPY | | | | 206,069 | | | | 200,000 | | | | (6,069 | ) |
| | | | | | |
| 10/20/2011 | | Deutsche Bank AG | | | 33,210,820 | | | | JPY | | | | 412,094 | | | | 400,000 | | | | (12,094 | ) |
| | | | | | |
| 10/20/2011 | | Deutsche Bank AG | | | 24,685,800 | | | | JPY | | | | 306,312 | | | | 300,000 | | | | (6,312 | ) |
| | | | | | |
| 10/20/2011 | | HSBC Bank USA N.A | | | 16,601,400 | | | | JPY | | | | 205,997 | | | | 200,000 | | | | (5,997 | ) |
| | | | | | |
| 10/20/2011 | | HSBC Bank USA N.A | | | 12,328,500 | | | | JPY | | | | 152,977 | | | | 150,000 | | | | (2,977 | ) |
| | | | | | |
| 10/20/2011 | | HSBC Bank USA N.A | | | 5,000,000 | | | | JPY | | | | 62,042 | | | | 60,736 | | | | (1,306 | ) |
| | | | | | |
| 10/20/2011 | | HSBC Bank USA N.A | | | 61,300,000 | | | | JPY | | | | 760,636 | | | | 750,223 | | | | (10,413 | ) |
| | | | | | |
| 8/19/2011 | | Barclays Bank plc | | | 22,644,610 | | | | NOK | | | | 4,200,767 | | | | 4,065,795 | | | | (134,972 | ) |
| | | | | | | | | | | | | | | | | | | | | | |
Net Unrealized Depreciation | | | | | | | | | | | | | | | | | | $ | (535,368 | ) |
| | | | | | | | | | | | | | | | | | | | | | |
AUD—Australian Dollar
CHF—Swiss Franc
EUR—Euro
GBP—British Pound
JPY—Japanese Yen
NOK—Norwegian Krone
7. Contractual Obligations
The Trust has a variety of indemnification obligations under contracts with its service providers. The Trust’s maximum exposure under these arrangements is unknown.
8. Market, Credit and Counterparty Risk
In the normal course of business, the Portfolio invests in securities and enters into transactions where risks exist due to fluctuations in the market (market risk) or failure of the other party to a transaction to perform (credit and counterparty risk). The value of securities held by the Portfolio may decline in response to certain events, including those directly involving the companies whose securities are owned by the Portfolio; conditions affecting the general economy; overall market changes; local, regional or global political, social or economic instability; and currency and interest rate and price fluctuations. The Portfolio may be exposed to counterparty risk, or the risk that an entity with which the Portfolio has unsettled or open transactions may default. The potential loss could exceed the value of the financial assets recorded in the financial statements.
21
MET INVESTORS SERIES TRUST
| | |
Met/Franklin Mutual Shares Portfolio | | |
Notes to Financial Statements—June 30, 2011 (Unaudited)—(Continued)
8. Market, Credit and Counterparty Risk - continued
Financial assets that potentially expose the Portfolio to credit risk consist principally of cash due from counterparties and investments. In order to preserve certain safeguards for derivatives and non-standard settlement trades, the Portfolio restricts its exposure to credit losses by entering into master netting agreements with counterparties (approved brokers) with whom it undertakes a significant volume of transactions. The Portfolio reduces the credit risk associated with favorable contracts by entering into a master netting arrangement to the extent that all amounts with the counterparty are terminated and settled on a net basis if an event of default occurs. The Portfolio’s overall exposure to credit risk on derivative instruments subject to master netting arrangements can change substantially within a short period, as it is affected by each transaction subject to the arrangement.
9. Income Tax Information
The tax character of distributions paid for the years ended December 31, 2010 and 2009 were as follows:
| | | | | | | | | | | | | | | | | | | | | | | | | | | | |
| Ordinary Income | | | Long-Term Capital Gains | | | Return of Capital | | | Total | |
| 2010 | | 2009 | | | 2010 | | | 2009 | | | 2010 | | | 2009 | | | 2010 | | | 2009 | |
| | | | | | | |
| $11,446,216 | | $ | — | | | $ | — | | | $ | — | | | $ | — | | | $ | — | | | $ | 11,446,216 | | | $ | — | |
As of December 31, 2010, the components of distributable earnings (accumulated losses) on a federal income tax basis were as follows:
| | | | | | | | | | | | | | | | |
Undistributed
Ordinary
Income | | Undistributed
Long-Term Capital
Gain | | | Net
Unrealized
Appreciation | | | Loss Carryforwards
and Post October
Loss Deferrals | | | Total | |
| | | | |
| $55,359,626 | | $ | 32,691,006 | | | $ | 123,441,140 | | | $ | — | | | $ | 211,491,772 | |
The Regulated Investment Company Modernization Act of 2010 (the “Act”) was signed into law by President Obama on December 22, 2010.
The Act makes a number of changes to the provisions in the Code relating to regulated investment companies (“RICs”) that will generally become effective for taxable years of RICs beginning after December 22, 2010. The Act allows RICs to generally carryover net capital losses indefinitely, effective for losses arising in taxable years beginning after December 22, 2010. Such losses will retain their character as either long-term capital losses or short-term capital losses. Under pre-enactment law, capital losses could be carried forward for eight years and carried forward as short-term capital losses irrespective of the character of the original loss. Loss carryovers from years beginning prior to December 22, 2010 will still expire subject to the eight-year limitation. The Act further provides that losses arising in taxable years after December 22, 2010 (which are carried forward indefinitely) would be utilized prior to loss carryovers arising in taxable years beginning prior to December 22, 2010.
10. Recent Accounting Pronouncements
In January 2010, the Financial Accounting Standards Board (“FASB”) issued Accounting Standards Update No. 2010-06, “Improving Disclosures About Fair Value Measurements” (“ASU”) which was generally effective for years beginning after December 15, 2009 and was adopted by the Portfolio. The ASU requires enhanced disclosures about purchases, sales, issuances and settlements on a gross basis relating to Level 3 fair value measurements. These enhanced disclosures became effective for fiscal years beginning after December 15, 2010, and for interim periods within those years. Management has evaluated the impact of ASU 2010-06 and has concluded that ASU 2010-06 has no material impact on these financial statements.
In May 2011, FASB issued Accounting Standards Update (ASU) No. 2011-04 “Amendments to Achieve Common Fair Value Measurement and Disclosure Requirements in GAAP and the International Financial Reporting Standards (IFRS).” ASU 2011-04 includes common requirements for measurement of and disclosure about fair value between U.S. GAAP and IFRS. ASU 2011-04 will require reporting entities to categorize within Level 3 of the fair value hierarchy: quantitative information about the unobservable inputs used in the fair value measurement, the valuation processes used by the reporting entity and a narrative description of the sensitivity of the fair value measurement to changes in unobservable inputs and the interrelationships between those unobservable inputs. In addition, ASU 2011-04 will require reporting entities to make disclosures about amounts and reasons for all transfers in and out of Level 1 and Level 2 fair value measurements. The new and revised disclosures are effective for fiscal years beginning after December 15, 2011 and for interim periods within those fiscal years. Management is currently evaluating the implications of ASU 2011-04 and its impact on the financial statements.
22
MET INVESTORS SERIES TRUST
| | |
Met/Franklin Mutual Shares Portfolio | | |
Quarterly Portfolio Schedule
The Trust files Form N-Q for the first and third quarters of each fiscal year. The Trust’s Forms N-Q will be available on the Securities and Exchange Commission’s website at http://www.sec.gov. The Trust’s Forms N-Q may be reviewed and copied at the Securities and Exchange Commission’s Public Reference Room in Washington, D.C. and information on the operation of the Public Reference Room may be obtained by calling 1-800-SEC-0330. Once filed, the most recent Form N-Q will be available without charge, upon request, by calling (800) 848-3854.
Proxy Voting Policies and Procedures
A description of the policies and procedures that the Trust uses to determine how to vote proxies relating to portfolio securities is available without charge, upon request, by calling (800) 848-3854 and on the Securities and Exchange Commission’s website at http://www.sec.gov.
Proxy Voting Record
The Trust, on behalf of each of its Portfolios, has filed with the Securities and Exchange Commission its proxy voting record for the 12-month period ending June 30 on Form N-PX. Form N-PX must be filed by the Trust each year by August 31. Once filed, the most recent Form N-PX will be available without charge, upon request, by calling (800) 848-3854 or on the Securities and Exchange Commission’s website at http://www.sec.gov.
23
Simplify your life…
with MetLife eDelivery® while helping MetLife preserve the planet’s natural resources.
(see details on inside cover)
| | |
Met Investors Series Trust MetLife Balanced Plus Portfolio Semiannual Report | | June 30, 2011, as amended December 16, 2011 |
MET INVESTORS SERIES TRUST
| | |
MetLife Balanced Plus Portfolio | | |
Managed by MetLife Advisers, LLC and Pacific Investment Management Company LLC
Portfolio Manager Commentary*
Performance
Since its May 2, 2011 inception, the Class B shares of the MetLife Balanced Plus Portfolio returned -2.20% compared to the -1.53% return of its benchmark, the Dow Jones Moderate Index1.
Market Environment/Conditions
Amid increasing concerns about the strength and longevity of the economic recovery—due in part to the budget impasse in the U.S., the credit crisis in Europe, and persistently sluggish employment growth—interest rates declined and the spread between the yields of Treasury securities and credit based bonds widened during the two months following the Portfolio’s inception in May. Overall, the Barclays Capital U.S. Aggregate Bond Index returned 1.0% over the period. Corporate bonds, especially those with credit ratings below investment grade, lagged treasury securities of similar maturity during the two-month period. Longer maturity bonds outperformed short maturity bonds in this period of declining interest rates.
Following a strong first four months of 2011, U.S. equities, as measured by the Standard & Poor’s 500, fell 2.8% during May and June. The main driver for this decline was a shift in the outlook for the economy in general and corporate earnings in particular. While a late June rally limited the drop, it was not enough to recover entirely. Foreign stocks, as measured by the MSCI EAFE Index, also produced a negative return of -4.2%. The U.S. equity market volatility index, also known as the VIX index, ended the period at 16.52 from the 15.99 level on the inception day of May 2, 2011 and a high of 22.73 reached in the middle of June. Interest rate volatility also moved higher over the period.
Portfolio Review/Current Positioning: Total Portfolio
The Portfolio began operations on May 2, 2011. It was composed of two distinct portions. Seventy percent (70%) of the Portfolio’s assets were invested in a variety of underlying portfolios of the Met Investors Series Trust and the Metropolitan Series Fund, Inc. to achieve and maintain a broad asset allocation of approximately 40% to fixed income and 30% to equities. These assets, the “Base Portion”, were managed by the Investment Committee of MetLife Advisers in the same manner it manages the standard asset allocation portfolios. Thirty percent (30%) of the assets, the “Overlay Portion”, were invested in various fixed income instruments that served as the collateral for the equity derivative instruments purchased by the Portion’s subadviser, Pacific Investment Management Company LLC (PIMCO), to keep the Portfolio’s overall volatility level within the desired range. During the initial two month period ending in June, the allocation of the Portfolio’s assets remained close to the desired split between the Base (70%) and Overlay (30%) portions. It is important to remember that the Overlay Portion is managed to keep the Portfolio’s volatility within its target range; any resulting equity exposure is a result of that process. Combining the equity exposures of the two portions, the realized equity exposure of the Portfolio ranged from approximately 50% to 68% over the course of the two month period.
In contrast to the first four months of 2011 and during most of 2010, riskier assets such as high-yield bonds and small cap stocks underperformed safer asset classes such as treasury securities and large cap stocks during May and June. Exposures to these asset classes hurt the Base Portion’s absolute performance. On a relative basis, the Base Portion had a modestly above goal exposure to foreign equities due to the holding of such stocks by its primarily domestic equity underlying portfolios. This hurt relative performance over the period. A residual cash position from the underlying equity portfolios had a modestly positive impact in a period when stocks were mostly down.
Within the fixed income segment of the Base Portion, the underlying portfolio with the greatest exposure to below investment grade bonds hurt absolute performance in May and June. The BlackRock High Yield Portfolio trailed the broad market indices for fixed income. Lower credit bonds were hurt by heightened concern about the economy. On a relative basis, all of the Base Portion’s actively managed bond portfolios trailed the broad Barclays Capital U.S. Aggregate Bond Index over the two month period because these active managers—as is usually the case—held lower exposure to treasury securities than was held by the Index. Treasury securities outperformed all other sectors during the two month period.
While all of the Base Portion’s equity underlying portfolios were negative for the two month period, their relative performance varied. The domestic portfolios that held up better than the market over the period were the Legg Mason ClearBridge Aggressive Growth Portfolio and the Loomis Sayles Small Cap Growth Portfolio. The Harris Oakmark International Portfolio and the MFS® Research International Portfolio outperformed the foreign equity benchmark and contributed to relative performance. The two small cap value portfolios, Third Avenue Small Cap Value Portfolio and Dreman Small Cap Value Portfolio were among the biggest detractors, which should not be surprising since the Russell 2000 Value Index had the worst returns among the market segments.
Tactical equity positioning in the Overlay Portion detracted from performance as equity markets remained volatile on mixed economic and political data released. In regards to the fixed income collateral performance, an overall underweight to duration detracted from returns as rates fell on worries of a global economic slowdown. Modest exposure to financials detracted from performance as the sector underperformed like-duration Treasuries.
In regards to portfolio positioning, equity exposure in the Overlay Portion managed by PIMCO ranged between 20 and 38 percent during the period. Even with the rising level of volatility in equity market and interest rates, the VIX ended the period at relatively low levels. The fixed income collateral of the portfolio had a duration of 9.07 years, which is a modest underweight relative to the 9.91 years of duration of the benchmark. This is consistent with PIMCO’s views that yields were at historically low levels. Additionally, the duration exposure is predominantly obtained through Treasury securities and modest exposure is obtained through corporate bonds and money market futures, as PIMCO remained focused on the front-end of the yield curve.
1
MET INVESTORS SERIES TRUST
| | |
MetLife Balanced Plus Portfolio | | |
Managed by MetLife Advisers, LLC and Pacific Investment Management Company LLC
Portfolio Manager Commentary* (continued)
Investment Committee
MetLife Advisers, LLC
The overlay portion of the Portfolio is subadvised by:
Pacific Investment Management Company LLC
Vineer Bhansali, Ph.D., Managing Director
Steve A. Rodosky, Managing Director
*This commentary may include statements that constitute “forward-looking statements” under the U.S. securities laws. Forward-looking statements include, among other things, projections, estimates, and information about possible or future results related to the Portfolio and market or regulatory developments. The views expressed above are not guarantees of future performance or economic results and involve certain risks, uncertainties and assumptions that could cause actual outcomes and results to differ materially from the views expressed herein. The views expressed above are as June 30, 2011 and are subject to change at any time based upon an economic, market, or other conditions. Neither MetLife Advisers nor the subadvisory firm undertakes any obligation to update the views expressed herein. Any discussions of specific securities should not be considered a recommendation to buy or sell those securities. The views expressed above (including any forward-looking statements) may not be relied upon as investment advice or as an indication of the Portfolio’s trading intent. Information about the Portfolio’s holdings, asset allocation, or country diversification (or that of the underlying portfolios used in the Portfolio) is historical and is not an indication of future Portfolio composition, which may vary. Direct investment in any index is not possible. The performance of any index mentioned in this commentary has not been adjusted for ongoing management, distribution and operating expenses applicable to mutual fund investments. In addition, the returns do not reflect additional fees charged by separate accounts or variable insurance contracts that an investor in the Portfolio may pay. If these additional fees were reflected, performance would have been lower.
Portfolio Composition as of June 30, 2011
Top Holdings
| | | | |
| | |
% of
Net Assets | |
U.S. Treasury Bonds | | | 12.6 | |
PIMCO Total Return Portfolio (Class A) | | | 10.5 | |
BlackRock Bond Income Portfolio (Class A) | | | 10.4 | |
U.S. Treasury Bonds | | | 7.6 | |
MFS® Research International Portfolio (Class A) | | | 5.0 | |
Harris Oakmark International Portfolio (Class A) | | | 5.0 | |
Met/Franklin Low Duration Total Return Portfolio (Class A) | | | 3.5 | |
Western Asset Management U.S. Government Portfolio (Class A) | | | 3.5 | |
Western Asset Management Strategic Bond Opportunities Portfolio (Class A) | | | 3.5 | |
Artio International Stock Portfolio (Class A) | | | 2.1 | |
Top Sectors
| | | | |
| | | % of
Market Value of
Total Investments | |
Affiliated Investment Companies | | | 70.7 | |
U.S. Treasury & Government Agencies | | | 22.6 | |
Cash & Equivalents | | | 6.3 | |
Domestic Bonds & Debt Securities | | | 0.4 | |
2
MET INVESTORS SERIES TRUST
| | |
MetLife Balanced Plus Portfolio | | |
MetLife Balanced Plus Portfolio managed by
MetLife Advisers, LLC and Pacific Investment Management Company LLC vs. Dow Jones Moderate Index1
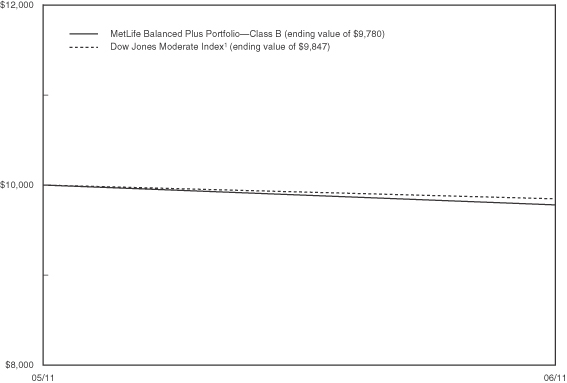
| | | | |
| | | Cumulative Return2 (for the period ended June 30, 2011) | |
| | | Since
Inception3 | |
MetLife Balanced Plus
Portfolio—Class B | | | -2.20% | |
| Dow Jones Moderate Index1 | | | -1.53% | |
1The Dow Jones Moderate Index is a total returns index designed to provide asset allocation strategists with a target risk benchmark. Each month, the index adjusts its weightings of stocks, bonds, and cash indices (both domestic and foreign) from Barclays and Dow Jones such that the risk of that combination will have 60% of the risk of an all equity portfolio.
2“Cumulative Return” is calculated including reinvestment of all income dividends and capital gain distributions.
3 Inception of the Class B shares is 5/2/11. Index returns are based on an inception date of 5/2/11.
Past performance does not guarantee future results. The investment return and principal value of an investment in the Portfolio will fluctuate, so that shares, on any given day or when redeemed, may be worth more or less than their original cost. Performance numbers are net of all Portfolio expenses but do not include any insurance, sales, or administration charges of variable annuity or life insurance contracts. If these charges were included, the returns would be lower. The Index does not include fees or expenses and is not available for direct investment.
3
MET INVESTORS SERIES TRUST
| | |
MetLife Balanced Plus Portfolio | | |
Understanding Your Portfolio’s Expenses
Shareholder Expense Example
As a shareholder of the Portfolio, you incur ongoing costs, including management fees; distribution and service (12b-1) fees; and other Portfolio expenses. This example is intended to help you understand your ongoing costs (in dollars) (referred to as “expenses”) of investing in the Portfolio and compare these costs with the ongoing costs of investing in other mutual funds. The example is based on an investment of $1,000 invested at the beginning of the period and held for the entire period, May 2, 2011 through June 30, 2011.
Actual Expenses
The first line in the table below provides information about actual account values and actual expenses. You may use the information in this line, together with the amount you invested in the Portfolio, to estimate the expenses that you paid over the period. Simply divide your account value by $1,000 (for example, an $8,600 account value divided by $1,000 = 8.6), then multiply the result by the number in the first line under the heading entitled “Expenses Paid During Period” to estimate the expenses you paid on your account during this period.
Hypothetical Example for Comparison Purposes
The second line in the table below provides information about hypothetical account values and hypothetical expenses based on the Portfolio’s actual expense ratio and an assumed rate of return of 5% per year before expenses, which is not the Portfolio’s actual return. The hypothetical account values and expenses may not be used to estimate the actual ending account balance or expenses you paid for the period. You may use this information to compare the ongoing costs of investing in the Portfolio and other funds. To do so, compare this 5% hypothetical example with the 5% hypothetical examples that appear in the shareholder reports of the other funds.
Please note that the expenses shown in the table are meant to highlight your ongoing costs only and do not reflect any fees or charges of your variable insurance product or any additional expenses that participants in certain eligible qualified plans may bear relating to the operations of their plan. Therefore, the second line in the table is useful in comparing ongoing costs only, and will not help you determine the relative total costs of owning different funds. In addition, if these other costs were included, your costs would have been higher.
| | | | | | | | | | | | | | | | |
| | | Annualized
Expense
Ratio | | | Beginning
Account Value
May 2, 2011** | | | Ending
Account Value
June 30, 2011 | | | Expenses Paid
During Period***
May 2, 2011
to June 30, 2011 | |
| | | | | | | | | | | | | | | | |
| | | | |
| | | | | | | | | | | | | | | | |
Class B(a)(b)(c) | | | | | | | | | | | | | | | | |
Actual | | | 1.03% | | | $ | 1,000.00 | | | $ | 978.00 | | | $ | 1.70 | |
Hypothetical* | | | 1.03% | | | | 1,000.00 | | | | 1,006.64 | | | | 1.73 | |
| | | | | | | | | | | | | | | | |
* Hypothetical assumes a rate of return of 5% per year before expenses.
** Commencement of operations—May 2, 2011.
*** Expenses paid are equal to the Portfolio’s annualized expense ratio for the most recent two month period, as shown above, multiplied by the average account value over the period, multiplied by the number of days (60 days) in the most recent fiscal period, divided by 365 (to reflect the two month period).
(a) The annualized expense ratio shown reflects an expense limitation agreement between MetLife Advisers, LLC and the Portfolio as described in Note 3 of the Notes to Financial Statements.
(b) The annualized expense ratio reflects the expenses of both the Portfolio and the Underlying Portfolios in which it invests.
(c) The annualized expense ratio reflects the impact of the management fee waiver as described in Note 3 to the Financial Statements.
4
MET INVESTORS SERIES TRUST
| | |
MetLife Balanced Plus Portfolio | | |
Schedule of Investments as of June 30, 2011 (Unaudited)
Affiliated Investment Companies—70.3% of Net Assets
| | | | | | | | |
| Security Description | |
Shares | | | Value | |
| | | | | | | | |
Artio International Stock Portfolio (Class A) (a) | | | 1,268,193 | | | $ | 12,707,299 | |
BlackRock Bond Income Portfolio (Class A) (a) | | | 580,469 | | | | 61,819,999 | |
BlackRock High Yield Portfolio (Class A) (b) | | | 971,838 | | | | 8,241,184 | |
BlackRock Legacy Large Cap Growth Portfolio (Class A) (a) | | | 149,648 | | | | 4,193,142 | |
Clarion Global Real Estate Portfolio (Class A) (b) | | | 797,534 | | | | 8,382,080 | |
Dreman Small Cap Value Portfolio (Class A) (b) | | | 700,190 | | | | 10,488,849 | |
Goldman Sachs Mid Cap Value Portfolio (Class A) (b) | | | 931,986 | | | | 12,609,769 | |
Harris Oakmark International Portfolio (Class A) (b) | | | 2,040,322 | | | | 29,401,037 | |
Invesco Small Cap Growth Portfolio (Class A) (b)* | | | 667,018 | | | | 10,625,601 | |
Legg Mason ClearBridge Aggressive Growth Portfolio (Class A) (b) | | | 500,359 | | | | 4,258,055 | |
Loomis Sayles Small Cap Growth Portfolio (Class A) (a) | | | 966,019 | | | | 10,693,826 | |
Met/Artisan Mid Cap Value Portfolio (Class A) (a) | | | 22,523 | | | | 4,181,445 | |
Met/Dimensional International Small Company Portfolio (Class A) (a) | | | 513,198 | | | | 8,359,988 | |
Met/Eaton Vance Floating Rate Portfolio (Class A) (b) | | | 803,740 | | | | 8,278,525 | |
Met/Franklin Low Duration Total Return Portfolio (Class A) (b)* | | | 2,073,859 | | | | 20,717,852 | |
Met/Templeton International Bond Portfolio (Class A) (b) | | | 1,021,701 | | | | 12,505,616 | |
MFS® Emerging Markets Equity Portfolio (Class A) (b) | | | 729,296 | | | | 8,394,193 | |
MFS® Research International Portfolio (Class A) (b) | | | 2,739,514 | | | | 29,477,170 | |
MFS® Value Portfolio (Class A) (a) | | | 324,871 | | | | 4,168,099 | |
Morgan Stanley Mid Cap Growth Portfolio (Class A) (b) | | | 327,513 | | | | 4,241,289 | |
Neuberger Berman Genesis Portfolio (Class A) (a) | | | 336,440 | | | | 4,245,874 | |
PIMCO Inflation Protected Bond Portfolio (Class A) (b) | | | 1,108,028 | | | | 12,465,311 | |
PIMCO Total Return Portfolio (Class A) (b) | | | 5,140,747 | | | | 62,151,635 | |
Third Avenue Small Cap Value Portfolio (Class A) (b) | | | 689,022 | | | | 10,535,144 | |
| | | | | | | | |
Van Eck Global Natural Resources Portfolio (Class A) (a) | | | 514,429 | | | $ | 8,488,087 | |
Van Kampen Comstock Portfolio (Class A) (b) | | | 419,953 | | | | 4,195,330 | |
Western Asset Management Strategic Bond Opportunities Portfolio (Class A) (a) | | | 1,627,236 | | | | 20,633,350 | |
Western Asset Management U.S. Government Portfolio (Class A) (a) | | | 1,749,908 | | | | 20,666,408 | |
| | | | | | | | |
Total Affiliated Investment Companies (Cost $414,109,727) | | | | | | | 417,126,157 | |
| | | | | | | | |
|
| U.S. Treasury & Government Agencies—22.5% | |
| | |
| U.S. Treasury | | | | | | | | |
U.S. Treasury Bonds | | | | | | | | |
6.250%, 08/15/23 | | $ | 58,700,000 | | | | 74,475,625 | |
5.500%, 08/15/28 | | | 4,200,000 | | | | 4,986,190 | |
5.375%, 02/15/31 | | | 38,600,000 | | | | 45,246,457 | |
U.S. Treasury Strip Principal (c) (d) | | | | | | | | |
2.963%, 11/15/27 | | | 17,500,000 | | | | 8,675,712 | |
| | | | | | | | |
Total U.S. Treasury & Government Agencies (Cost $135,733,483) | | | | | | | 133,383,984 | |
| | | | | | | | |
|
| Domestic Bonds & Debt Securities — 0.4% | |
| |
| Diversified Financial Services — 0.4% | | | | | |
Bank of America Corp.
1.693%, 01/30/14 (e) | | | 1,000,000 | | | | 1,003,060 | |
Citigroup, Inc.
1.733%, 01/13/14 (e) | | | 1,000,000 | | | | 1,007,186 | |
Morgan Stanley
1.874%, 01/24/14 (e) | | | 500,000 | | | | 503,889 | |
| | | | | | | | |
Total Domestic Bonds & Debt Securities (Cost $2,525,255) | | | | | | | 2,514,135 | |
| | | | | | | | |
|
| Collateralized Mortgage Obligations—0.0% | |
JPMorgan Chase Commercial Mortgage Securities Corp., Series 2011-C4 Class A3 4.106%, 07/15/46(144A) | | | | | | | | |
Total Collateralized Mortgage Obligations
(Cost $101,000) | | | 100,000 | | | | 99,860 | |
| | | | | | | | |
|
| Purchased Options—0.0% | |
S&P 500 Index 500 Put (Counterparty—Credit Suisse Group AG) | | | | | | | | |
Total Purchased Options
(Cost $2,417) | | | 22,000 | | | | 2,417 | |
| | | | | | | | |
See accompanying notes to financial statements.
5
MET INVESTORS SERIES TRUST
| | |
MetLife Balanced Plus Portfolio | | |
Schedule of Investments as of June 30, 2011 (Unaudited)
Short-Term Investments—6.2% of Net Assets
| | | | | | | | |
| Security Description | | Par
Amount | | | Value | |
| | | | | | | | |
| | |
| Repurchase Agreements—6.2% | | | | | | | | |
Barclays Capital, Inc. Repurchase Agreement dated 06/30/11 at 0.010% to be repurchased at $2,500,001 on 07/01/11 collateralized by $1,980,000 U.S. Treasury Inflation Index Note at 0.875% due 07/15/15 with a value of $2,545,092. | | $ | 2,500,000 | | | $ | 2,500,000 | |
Credit Suisse Securities (USA) LLC, Repurchase Agreement dated 06/30/11 at 0.010% to be repurchased at $15,800,004 on 07/01/11 collateralized by $16,118,000 U.S. Treasury Note at 3.125% due 05/15/21 with a value of $16,133,111. | | | 15,800,000 | | | | 15,800,000 | |
Fixed Income Clearing Corp. Repurchase Agreement dated 06/30/11 at 0.010% to be repurchased at $11,107,003 on 07/01/11 collateralized by $10,705,000 Federal Home Loan Bank at 3.500% due 03/08/13 with a value of $11,333,919. | | | 11,107,000 | | | | 11,107,000 | |
JPMorgan Securities LLC, Repurchase Agreement dated 06/30/11 at 0.040% to be repurchased at $7,500,008 on 07/01/11 collateralized by $6,811,000 Freddie Mac at 4.375% due 07/17/15 with a value of $7,700,121. | | | 7,500,000 | | | | 7,500,000 | |
| | | | | | | | |
Total Short-Term Investments (Cost $36,907,000) | | | | | | | 36,907,000 | |
| | | | | | | | |
Total Investments—99.4% (Cost $589,378,882#) | | | | | | | 590,033,553 | |
Other Assets and Liabilities (net)—0.6% | | | | | | | 3,383,925 | |
| | | | | | | | |
| Net Assets — 100.0% | | | | | | $ | 593,417,478 | |
| | | | | | | | |
| * | Non-income producing security. |
| # | As of June 30, 2011, the aggregate cost of investments for federal income tax purposes was $589,378,882. The aggregate unrealized appreciation and depreciation of investments were $3,488,153 and $(2,833,482), respectively, resulting in a net unrealized appreciation of $654,671 for federal income tax purposes. |
| (144A)— | Securities exempt from registration under Rule 144A of the Securities Act of 1933. These securities may be resold in transactions exempt from registration, normally to qualified institutional buyers. As of June 30, 2011, the market value of 144A securities was $99,860, which was 0.0% of net assets |
| (a) | A Portfolio of Metropolitan Series Fund, Inc. |
| (b) | A Portfolio of Met Investors Series Trust. |
| (c) | Zero coupon bond—Interest rate represents current yield to maturity. |
| (d) | Principal only security. |
| (e) | Variable or floating rate security. The stated rate represents the rate at June 30, 2011. Maturity date shown for callable securities reflects the earliest possible call date. |
See accompanying notes to financial statements.
6
MET INVESTORS SERIES TRUST
| | |
MetLife Balanced Plus Portfolio | | |
Schedule of Investments as of June 30, 2011 (Unaudited)
FAIR VALUE HIERARCHY
Accounting principles generally accepted in the United States of America (“GAAP”) defines fair market value as the price that the Portfolio would receive to sell an asset or pay to transfer a liability in an orderly transaction between market participants at the measurement date. It establishes a fair value hierarchy that prioritizes inputs to valuation methods and requires disclosure of the fair value hierarchy that segregates fair value measurements into three levels. Levels 1, 2 and 3 of the fair value hierarchy are defined as follows:
Level 1 - unadjusted quoted prices in active markets for identical investments
Level 2 - other significant observable inputs (including, but not limited to, unadjusted quoted prices for similar investments in markets that are either active or inactive; inputs other than quoted prices that are observable such as interest rates, yield curves, volatilities, prepayment speeds, loss severities, credit risks, default rates, etc.)
Level 3 - significant unobservable inputs based on the best information available in the circumstances, to the extent observable inputs are unavailable (including the Portfolio’s own assumptions in determining the fair value of investments)
The inputs or methodologies used for valuing investments are not necessarily an indication of the risk associated with investing in them. For a change in the methodology used, transfers between levels will be recognized as of the beginning of the reporting period. Information on transfers between Level 1 and Level 2 deemed significant, if any, will be disclosed following the valuation table below. For the period from May 2, 2011 (commencement of operations) through June 30, 2011, there were no transfers between Levels 1 and 2. A reconciliation of Level 3 securities, if any, will also be disclosed following the valuation table. For more information about the Portfolio’s policy regarding the valuation of investments, please refer to the Notes to Financial Statements.
The following table summarizes the fair value hierarchy of the Portfolio’s investments as of June 30, 2011:
| | | | | | | | | | | | | | | | |
| Description | | Level 1 | | | Level 2 | | | Level 3 | | | Total | |
Affiliated Investment Companies | | $ | 417,126,157 | | | $ | — | | | $ | — | | | $ | 417,126,157 | |
U.S. Treasury & Government Agencies* | | | — | | | | 133,383,984 | | | | — | | | | 133,383,984 | |
Total Domestic Bonds & Debt Securities* | | | — | | | | 2,514,135 | | | | — | | | | 2,514,135 | |
Collateralized Mortgage Obligations | | | — | | | | 99,860 | | | | — | | | | 99,860 | |
Purchased Options | | | — | | | | 2,417 | | | | — | | | | 2,417 | |
Total Short-Term Investments* | | | — | | | | 36,907,000 | | | | — | | | | 36,907,000 | |
Total Investments | | $ | 417,126,157 | | | $ | 172,907,396 | | | $ | — | | | $ | 590,033,553 | |
| | | | | | | | | | | | | | | | | |
Futures Contracts** | | | | | | | | | | | | | | | | |
Futures Contracts Long (Appreciation) | | $ | 4,871,091 | | | $ | — | | | $ | — | | | $ | 4,871,091 | |
Total Futures Contracts | | $ | 4,871,091 | | | $ | — | | | $ | — | | | $ | 4,871,091 | |
| | | | | | | | | | | | | | | | | |
| * | | See Schedule of Investments for additional detailed categorizations. |
| ** | | Derivative instruments such as forwards, futures contracts and swap contracts are valued on the unrealized appreciation/depreciation on the instrument. |
See accompanying notes to financial statements.
7
MET INVESTORS SERIES TRUST
| | |
MetLife Balanced Plus Portfolio | | |
Statement of Assets and Liabilities
June 30, 2011 (Unaudited)
| | | | |
| Assets | | | | |
Investments at value (a) | | $ | 553,126,553 | |
Repurchase Agreement | | | 36,927,000 | |
Receivable for shares sold | | | 15,103,449 | |
Net variation margin on financial futures contracts | | | 1,576,800 | |
Interest receivable | | | 2,253,478 | |
| | | | |
Total assets | | | 608,987,280 | |
| | | | |
| Liabilities | | | | |
Due to Adviser | | | 22,481 | |
Due to custodian | | | 16,802 | |
Payables for: | | | | |
Investments purchased | | | 15,324,187 | |
Shares redeemed | | | 344 | |
Accrued Expenses: | | | | |
Management fees | | | 67,536 | |
Distribution and service fees - Class B | | | 75,460 | |
Administration fees | | | 3,710 | |
Custodian and accounting fees | | | 18,510 | |
Other expenses | | | 40,772 | |
| | | | |
Total liabilities | | | 15,569,802 | |
| | | | |
| Net Assets | | $ | 593,417,478 | |
| | | | |
| Net Assets Represented by | | | | |
Paid in surplus | | $ | 591,691,344 | |
Accumulated net realized loss | | | (3,851,105 | ) |
Unrealized appreciation on investments and futures contracts | | | 5,525,762 | |
Undistributed net investment income | | | 51,477 | |
| | | | |
Net Assets | | $ | 593,417,478 | |
| Net Assets | | | | |
Class B | | $ | 593,417,478 | |
| Capital Shares Outstanding* | | | | |
Class B | | | 60,662,027 | |
| Net Asset Value, Offering Price and Redemption Price Per Share | | | | |
Class B | | $ | 9.78 | |
| * | | The Portfolio is authorized to issue an unlimited number of shares. |
| (a) | | Identified cost of investments was $552,471,882. |
Statement of Operations
Period Ended June 30, 2011* (Unaudited)
| | | | |
| Investment Income | | | | |
Interest | | $ | 291,109 | |
| | | | |
Total investment income | | | 291,109 | |
| | | | |
| Expenses | | | | |
Management fees | | | 105,990 | |
Administration fees | | | 5,187 | |
Custodian and accounting fees | | | 18,510 | |
Distribution and service fees - Class B | | | 92,166 | |
Audit and tax services | | | 16,359 | |
Legal | | | 19,585 | |
Trustees’ fees and expenses | | | 4,770 | |
Shareholder reporting | | | 2,175 | |
Insurance | | | 119 | |
Organizational expense | | | 744 | |
Miscellaneous | | | 2,481 | |
| | | | |
Total expenses | | | 268,086 | |
Less management fee waiver | | | (23,502 | ) |
Less expenses reimbursed by the Adviser | | | (4,952 | ) |
| | | | |
Net expenses | | | 239,632 | |
| | | | |
Net investment income | | | 51,477 | |
| | | | |
| Net Realized and Unrealized (Loss) on Investments and Futures Contracts | | | | |
Net realized loss on: | | | | |
Investments | | | (1,109 | ) |
Futures contracts | | | (3,849,996 | ) |
| | | | |
Net realized loss on investments and futures contracts | | | (3,851,105 | ) |
| | | | |
Net change in unrealized appreciation on: | | | | |
Investments | | | 654,671 | |
Futures contracts | | | 4,871,091 | |
| | | | |
Net change in unrealized appreciation on investments and futures contracts | | | 5,525,762 | |
| | | | |
Net realized and unrealized gain on investments and futures contracts | | | 1,674,657 | |
| | | | |
| Net Increase in Net Assets from Operations | | $ | 1,726,134 | |
| | | | |
| * | | Commencement of operations—5/2/2011. |
See accompanying notes to financial statements.
8
MET INVESTORS SERIES TRUST
| | |
MetLife Balanced Plus Portfolio | | |
Statement of Changes in Net Assets
June 30, 2011 (Unaudited)
| | | | |
| | | Period Ended
June 30, 2011*
(Unaudited) | |
| Increase (Decrease) in Net Assets: | | | | |
| Operations | | | | |
Net investment income | | $ | 51,477 | |
Net realized loss on investments and futures contracts | | | (3,851,105 | ) |
Net change in unrealized appreciation on investments and futures contracts | | | 5,525,762 | |
| | | | |
Net increase in net assets resulting from operations | | | 1,726,134 | |
| | | | |
Net increase in net assets from capital share transactions | | | 591,691,344 | |
| | | | |
| Net Increase in Net Assets | | | 593,417,478 | |
| | | | |
Net assets at end of period | | $ | 593,417,478 | |
| | | | |
Undistributed net investment income at end of period | | $ | 51,477 | |
| | | | |
| | | | | | | | |
| Other Information: | | | | | | | | |
| Capital Shares | | | | | | | | |
| | |
Transactions in capital shares were as follows: | | | | | | | | |
| | | Period Ended
June 30, 2011*
(Unaudited) | |
| | | Shares | | | Value | |
| Class B | | | | | | | | |
Sales | | | 61,685,822 | | | $ | 601,571,890 | |
Redemptions | | | (1,023,795 | ) | | | (9,880,546 | ) |
| | | | | | | | |
Net increase | | | 60,622,027 | | | $ | 591,691,344 | |
| | | | | | | | |
Increase derived from capital shares transactions | | | | | | $ | 591,691,344 | |
| | | | | | | | |
| * | | Commencement of operations—5/2/2011. |
See accompanying notes to financial statements.
9
MET INVESTORS SERIES TRUST
|
MetLife Balanced Plus Portfolio |
Financial Highlights
| | | | |
| Selected per share data | | | |
| | | Class B | |
| | | Period Ended
June 30, 2011(b)
(Unaudited) | |
| Net Asset Value, Beginning of Period | | $ | 10.00 | |
| | | | |
| Income from Investment Operations: | | | | |
Net Investment Income(a) | | | 0.00 | + |
Net Realized and Unrealized loss on Investments | | | (0.22 | ) |
| | | | |
Total From Investment Operations | | | (0.22 | ) |
| | | | |
| Net Asset Value, End of Period | | $ | 9.78 | |
| | | | |
| Total Return (%) | | | (2.20 | ) |
| |
| Ratios/Supplemental Data | | | | |
Ratio of Expenses to Average Net Assets (%)(c) | | | 0.73 | * |
Ratio of Net Expenses to Average Net Assets (%)(d)(e) | | | 0.65 | * |
Ratio of Net Investment Income to Average Net Assets (%) | | | 0.14 | * |
Portfolio Turnover Rate (%) | | | 0.0 | |
Net Assets, End of Period (in millions) | | $ | 593.4 | |
| + | | Net investment income rounds to less than $0.01. |
| (a) | | Per share amounts based on average shares outstanding during the period. |
| (b) | | Commencement of operations—5/2/2011. |
| (c) | | See Note 3 of the Notes to Financial Statements. |
| (d) | | Includes the effects of management fee waivers and expenses reimbursed by the Adviser, if applicable. |
| (e) | | The ratio of operating expenses to average net assets does not include expenses of the Underlying Portfolios in which the Portfolio invests. |
See accompanying notes to financial statements.
10
MET INVESTORS SERIES TRUST
| | |
MetLife Balanced Plus Portfolio | | |
Notes to Financial Statements—June 30, 2011 (Unaudited)
1. Organization
Met Investors Series Trust (the “Trust”) is organized as a statutory trust under the laws of Delaware, as an open-end management investment company under the Investment Company Act of 1940, as amended (the “1940 Act”). The Trust currently offers fifty-four Portfolios (the “Portfolios”), each of which operates as a distinct investment vehicle of the Trust. The portfolio included in this report is MetLife Balanced Plus Portfolio (the “Portfolio”) (commenced operations on May 2, 2011), which is diversified. Shares in the Portfolio are not offered directly to the general public and are currently available only to separate accounts established by Metropolitan Life Insurance Company (“MetLife”) and other affiliated life insurance companies.
The Portfolio has registered four classes of shares: Class A, B, C and E Shares. Class B Shares are currently offered by the Portfolio.
The Portfolio invests approximately 70% of its assets (the “Base Portion”) in other Portfolios of the Trust or of Metropolitan Series Fund, Inc. (“Underlying Portfolios”) and approximately 30% of its assets (the “Overlay Portion”) in a portfolio of fixed income instruments that serve as collateral for equity derivative instruments, primarily stock index futures.
2. Significant Accounting Policies
The financial statements have been prepared in conformity with accounting principles generally accepted in the United States of America (“GAAP”) which require management to make estimates and assumptions that affect the reported amounts of assets and liabilities at the date of the financial statements and the reported amounts of income and expenses during the reporting period. Actual results could differ from these estimates. In the preparation of these financial statements, management has evaluated events and transactions subsequent to June 30, 2011 through the date that the financial statements were issued.
The following is a summary of significant accounting policies consistently followed by the Portfolio in the preparation of its financial statements.
Investment Valuation and Fair Value Measurements - Debt securities (other than short term obligations with a remaining maturity of sixty days or less) including corporate, convertible and municipal bonds and notes; U.S. government agencies; U.S. treasury obligations; sovereign issues; bank loans; and non-U.S. bonds are generally valued on the basis of evaluated or composite bid quotations obtained by independent pricing services and/or brokers and dealers selected by MetLife Advisers, LLC (“MLA” or the “Adviser”), an affiliate of MetLife, Inc., or the relevant Subadviser pursuant to authorization of the Board of Trustees of the Portfolio (the “Board”). Such quotations use inputs that are observable including, among other things, issuer details, interest rates, yield curves, prepayment speeds, credit risks/spreads, default rates and quoted prices for similar securities. Securities that use similar valuation techniques and inputs as described above are categorized as Level 2 within the fair value hierarchy.
Mortgage and asset-backed securities are usually issued as separate tranches, or classes, of securities within each deal. These securities are also generally valued on the basis of evaluated or composite bid quotations obtained by independent pricing services and/or brokers and dealers selected by the Adviser or relevant Subadviser pursuant to authorization of the Board. The pricing models for these securities usually consider tranche-level attributes, estimated cash flows for each tranche, market-based yield spreads for each tranche and current market data, and incorporate deal collateral performance, as available. Mortgage and asset-backed securities that use similar valuation techniques and inputs as described above are categorized as Level 2 within the fair value hierarchy.
Short term obligations with a remaining maturity of sixty days or less are valued at amortized cost which approximates fair market value and are categorized as Level 2 within the fair value hierarchy.
Equity securities such as common stock, exchange-traded funds and preferred stock that are traded on a national securities exchange or other exchanges are generally valued at their last sale price on the principal trading market. Equity securities traded on a national securities exchange or other exchanges for which there is no reported sale during the day are valued at the last reported bid price. A security that is listed or traded on more than one exchange is valued at the quotation on the exchange determined to be the primary market for that security by the Board or its delegates. If no closing price is available, then such securities are valued at the last reported bid price. Equity securities traded over-the-counter are generally valued at the last reported sales price. To the extent these securities are actively traded and valuation adjustments are not applied, they are categorized as Level 1 within the fair value hierarchy. Other equity securities traded on inactive markets or valued by reference to similar instruments are categorized as Level 2 within the fair value hierarchy.
Equity securities which are listed on foreign stock exchanges normally are valued at the market closing price, the last sale price on the day the securities are valued or, lacking any sales on such day, at the bid price. Valuation adjustments may be applied to certain equity securities that are solely traded on foreign exchanges closing before the U.S. market to account for the market movement between the close of the foreign exchanges and the close of the U.S. market. The Portfolio may use a systematic fair valuation model provided by an independent third party to value securities principally traded in these foreign markets closing before the U.S. market in order to adjust for possible stale pricing that may occur between the close of these foreign exchanges and the time of the Portfolio valuation. Securities using these valuation adjustments are categorized as Level 2 within the fair value hierarchy.
Investments in registered open-end management investment companies, including Underlying Portfolios, are valued at reported net asset value per share and are categorized as Level 1 within the fair value hierarchy.
11
MET INVESTORS SERIES TRUST
| | |
MetLife Balanced Plus Portfolio | | |
Notes to Financial Statements—June 30, 2011 (Unaudited)—(Continued)
2. Significant Accounting Policies - continued
Forward foreign currency exchange contracts are valued based on the mean between closing bid and asked prices of the forward currency rates in the London foreign exchange markets on a daily basis as provided by a reliable bank or dealer. These contracts are categorized as Level 2 within the fair value hierarchy.
Options, whether on securities, indices, futures contracts, or otherwise, are valued at the last sales price available as of the close of business on the day of valuation or, if there is no such sale price available, at the bid price. Options on currencies are valued at the spot price each day. These types of options are categorized as Level 1 within the fair value hierarchy. Other options traded on inactive markets where a broker quotation is received or options valued by an evaluated quote provided by an independent pricing vendor are categorized as Level 2 within the fair value hierarchy.
Futures contracts, which are traded on commodity exchanges, are valued at their closing prices as of the close of such exchanges and are categorized as Level 1 within the fair value hierarchy. Futures contracts traded on inactive markets where a broker quotation is received are categorized as Level 2 within the fair value hierarchy. As a general matter, futures contracts are marked-to-market daily.
Options and futures contracts that are traded over-the-counter are generally valued on the basis of broker dealer quotations or pricing service providers who use a series of techniques, including simulation pricing models, to determine the value of the contracts. The pricing models use inputs that are observed from actively quoted markets such as issuer details, indices, spreads, interest rates, curves and exchange rates. These contracts are categorized as Level 2 within the fair value hierarchy.
If no current market value quotation or other observable inputs are readily available or reliable for a security, the fair value of the security will be determined in accordance with procedures approved by and under the general supervision of the Board. The Board has delegated the determination in good faith of the fair value of securities for which current market quotations are not readily available to a Valuation Committee established by the Board. Market quotes and other observable inputs are considered not readily available in circumstances where there is an absence of current or reliable market-based data. In addition, market quotes would be considered not readily available when, due to extraordinary circumstances, the exchanges or markets on which the securities trade, do not open for trading for the entire day and no other market prices are available. When the Portfolio uses fair value pricing, it may take into account any factors it deems appropriate, including significant unobservable inputs. The value of securities used by the Portfolio to calculate its net asset value may differ from quoted or published prices for the same securities. Fair value pricing involves subjective judgments and the fair value determined for a security may be materially different than the value that could be realized upon the sale of that security. These securities are categorized as Level 3 within the fair value hierarchy.
Investment Transactions and Related Investment Income - Portfolio security transactions are recorded on the trade date. Dividend income is recorded on the ex-dividend date or, for certain foreign securities, when notified. Interest income, which includes amortization of premium and accretion of discount on debt securities, is recorded on the accrual basis. Realized gains and losses on investments and unrealized appreciation and depreciation are determined on the identified cost basis, which is the same basis used for federal income tax purposes. Foreign income and foreign capital gains on some foreign securities may be subject to foreign withholding taxes, which are accrued as applicable.
Income Taxes - It is the Portfolio’s policy to comply with the requirements of the Internal Revenue Code of 1986, as amended (the “Code”), and regulations thereunder, applicable to regulated investment companies and to distribute, with respect to each taxable year, all of its taxable income to shareholders. Therefore, no federal income tax provision is required. The Portfolio files U.S. federal and various state tax returns. No income tax returns are currently under examination. The Portfolio’s federal tax returns will remain subject to examination by the Internal Revenue Service for three fiscal years after the returns are filed.
Dividends and Distributions to Shareholders - The Portfolio records dividends and distributions on the ex-dividend date. Net realized gains from security transactions (if any) are generally distributed annually to shareholders. The timing and characterization of certain income and capital gains distributions are determined in accordance with federal tax regulations that may differ from GAAP. Permanent book and tax basis differences relating to shareholder distributions will result in reclassification between under/over distributed net investment income, accumulated net realized gains/losses and paid in surplus. Book-tax differences are primarily due to futures transactions, foreign currency transactions, swap transactions, options transactions, premium amortization adjustments, paydown transactions, contingent payment debt instrument adjustments, forward transactions, deferred trustees’ compensation, and losses deferred due to wash sales, as applicable. These adjustments have no impact on net assets or the results of operations.
Repurchase Agreements - The Portfolio may enter into repurchase agreements with selected commercial banks and broker-dealers, under which the Portfolio acquires securities as collateral and agrees to resell the securities at an agreed upon time and at an agreed upon price. The Portfolio, through the custodian or a subcustodian, receives delivery of the underlying securities collateralizing repurchase agreements. The Portfolio requires the custodian to take possession, to have legally segregated in the Federal Reserve Book Entry System, or to have segregated within the custodian’s vault, all securities held as collateral for repurchase agreements. It is the Portfolio’s policy that the market value of the collateral be at least equal to 100% of the repurchase price in the case of a repurchase agreement of one-day duration and 102% of the
12
MET INVESTORS SERIES TRUST
| | |
MetLife Balanced Plus Portfolio | | |
Notes to Financial Statements—June 30, 2011 (Unaudited)—(Continued)
2. Significant Accounting Policies - continued
repurchase price in the case of all other repurchase agreements. In connection with transactions in repurchase agreements, if the seller defaults and the value of the collateral declines or if the seller enters an insolvency proceeding, realization of the collateral by the Portfolio may be delayed, limited or wholly denied.
Mortgage Related and Other Asset Backed Securities - The Portfolio may invest in mortgage related or other asset-backed securities. These securities may include mortgage pass-through securities, collateralized mortgaged obligations (“CMOs”), commercial mortgage-backed securities, mortgage dollar rolls, CMO residuals, stripped mortgage backed securities (“SMBS”) and other securities that directly or indirectly represent a participation in, or are secured by or payable from, mortgage loans on real property or other receivables. The value of some mortgage or asset-backed securities may be particularly sensitive to changes in prevailing interest rates. Early repayment of principal on some mortgage-related securities may expose the Portfolio to a lower rate of return upon reinvestment of principal. The value of these securities may fluctuate in response to the market’s perception of the creditworthiness of the issuers. Additionally, although mortgages and mortgage-related securities are generally supported by some form of government or private guarantee and/or insurance, there is no assurance that private guarantors or insurers will meet their obligations.
In one type of SMBS, one class receives all of the interest from the mortgage assets (the interest-only or “IO” class), while the other class will receive all of the principal (the principal-only or “PO” class). Payments received for the IOs are included in interest income on the Statement of Operations of the Portfolio. Because principal will not be received at the maturity of an IO, adjustments are made to the book value of the security until maturity. These adjustments are included in interest income on the Statement of Operations of the Portfolio. Payments received for POs are treated as reductions to the cost and par value of the securities. Details of mortgage related and other asset-backed securities held by the Portfolio are included in the Portfolio’s Schedule of Investments.
The Portfolio may invest a significant portion of its assets in securities of issuers that hold mortgage and asset-backed securities and direct investments in securities backed by commercial and residential mortgage loans and other financial assets. The value and related income of these securities are sensitive to changes in economic conditions, including delinquencies and/or defaults, and may be negatively impacted by increased volatility of market prices and periods of illiquidity.
3. Investment Management Agreement and Other Transactions with Affiliates
Investment Management Agreement - The Trust is managed by the Adviser. The Trust has entered into a management agreement with the Adviser (the “Management Agreement”) for investment management services in connection with the investment management of the Portfolio. The Adviser is responsible for managing the Base Portion of the Portfolio. The Adviser is subject to the supervision and direction of the Board and has overall responsibility for the general management and administration of the Trust. The Adviser has entered into a subadvisory agreement with Pacific Investment Management Company LLC (the “Subadviser”) for investment subadvisory services in connection with the investment management of the Overlay Portion of the Portfolio.
Subject to the supervision and direction of the Board, the Adviser supervises the Subadviser and has full discretion with respect to the retention or renewal of the subadvisory agreement. The Adviser pays the Subadviser a fee based on the Portfolio’s average daily net assets of the Overlay Portion of the Portfolio.
Under the terms of the Portfolio’s Management Agreement, the Portfolio pays the Adviser a monthly fee based upon annual rates applied to the Portfolio’s average daily net assets as follows:
| | | | |
Management Fees
earned by the Adviser (Overlay
Portion managed by PIMCO)
for the period ended
June 30, 2011 | | % per annum | | Average Daily Net Assets
of the Overlay Portion |
| | |
| $80,184 | | 0.725% | | First $250 Million |
| | |
| | 0.700% | | $250 Million to $750 Million |
| | |
| | 0.675% | | $750 Million to $1 Billion |
| | |
| | 0.650% | | Over $1 Billion |
13
MET INVESTORS SERIES TRUST
| | |
MetLife Balanced Plus Portfolio | | |
Notes to Financial Statements—June 30, 2011 (Unaudited)—(Continued)
3. Investment Management Agreement and Other Transactions with Affiliates - continued
| | | | |
Management Fees
earned by the Adviser (Base
Portion managed by MLA)
for the period ended
June 30, 2011 | | % per annum | | Average Daily Net Assets
of the Base Portion |
| | |
| $25,806 | | 0.100% | | First $500 Million |
| | |
| | 0.075% | | $500 Million to $1 Billion |
| | |
| | 0.050% | | Over $1 Billion |
In addition to the above management fees paid to the Adviser, the Portfolio indirectly pays MLA a management fee through its investment in the Underlying Portfolios.
Certain officers and trustees of the Trust may also be officers of the Adviser; however, such officers and trustees receive no compensation from the Trust.
Management Fee Waiver - The Subadviser voluntarily agreed to waive 50% of its subadvisory fee through July 31, 2011. Also through July 31, 2011, the Adviser voluntarily agreed to waive a portion of the management fee in an amount equal to the subadvisory fees waived. Amounts waived for the period ended June 30, 2011 are shown as a management fee waiver in the Statement of Operations.
Transfer Agency Agreement - MetLife serves as the transfer agent for the Trust. MetLife receives no fees for its services to the Trust under the transfer agency agreement.
Expense Limitation Agreement - The Adviser has entered into an expense limitation agreement with the Trust (“Expense Limitation Agreement”) in the interest of limiting expenses of the Portfolio. The Expense Limitation Agreement shall continue in effect with respect to the Portfolio until April 30, 2012. Pursuant to that Expense Limitation Agreement, the Adviser has agreed to waive or limit its fees and to assume other expenses so that the total annual operating expenses of the Portfolio other than interest, taxes, brokerage commissions, other expenditures which are capitalized or expensed in accordance with GAAP, other extraordinary expenses not incurred in the ordinary course of the Portfolio’s business, and Underlying Portfolios’ fees and expenses but including amounts payable pursuant to a plan adopted in accordance with Rule 12b-1 under the 1940 Act, are limited to the following expense ratio as a percentage of the Portfolio’s average daily net assets:
| | |
Maximum Expense Ratio under current
Expense Limitation Agreement | | Expenses Deferred in |
| | 2011 |
| | Subject to repayment until December 31, |
Class B | | 2016 |
| |
| 0.65% | | $4,952 |
As of June 30, 2011, there were no expenses repaid to the Adviser in accordance with the Expense Limitation Agreement. Amounts waived for the period ended June 30, 2011 are shown as expenses reimbursed by the Adviser in the Statement of Operations.
If in any year in which the Management Agreement is still in effect, the estimated aggregate operating expenses of the Portfolio for the fiscal year are less than the Maximum Expense Ratio for that year, subject to approval by the Trust’s Board, the Adviser shall be entitled to reimbursement by the Portfolio to the extent that the charge does not cause the expenses in such subsequent year to exceed the Maximum Expense Ratio as stated above. The Portfolio is not obligated to repay any expense paid by the Adviser more than five years after the end of the fiscal year in which such expense was incurred. As of June 30, 2011, there was $4,952 in expense deferrals eligible for recoupment by the Adviser.
Distribution Agreement and Plan - The Trust has a distribution agreement with MetLife Investors Distribution Company (“MIDC” or the “Distributor”) in which MIDC serves as the Distributor for the Trust’s Class B Shares. MIDC is a wholly-owned subsidiary of MetLife Investors Group, Inc., an affiliate of the Adviser. The Class B distribution plan provides that the Trust, on behalf of the Portfolio, may pay annually up to 0.50% of the average daily net assets of the Portfolio attributable to its Class B Shares with respect to activities primarily intended to result in the sale of Class B Shares. However, under the Class B distribution agreement, payments to the Distributor for activities pursuant to the Class B distribution plan are currently limited to payments at an annual rate equal to 0.25% of average daily net assets of the Portfolio attributable to its Class B Shares. Amounts incurred by the Portfolio for the period ended June 30, 2011 are shown as Distribution and service fees in the Statement of Operations.
Under the terms of the Class B distribution plan and distribution agreement the Portfolio is authorized to make payments monthly to the Distributor that may be used to pay or reimburse entities providing distribution and shareholder servicing with respect to the Class B Shares for such entities’ fees or expenses incurred.
14
MET INVESTORS SERIES TRUST
| | |
MetLife Balanced Plus Portfolio | | |
Notes to Financial Statements—June 30, 2011 (Unaudited)—(Continued)
3. Investment Management Agreement and Other Transactions with Affiliates - continued
Deferred Trustee Compensation - Each Trustee of the Trust who is not currently an employee of the Adviser or any of its affiliates receives compensation from the Trust for his or her service to the Portfolio. A deferred compensation plan (the “Plan”) is available to the Trustees on a voluntary basis. Deferred amounts remain in the Trust until distributed in accordance with the provisions of the Plan. The value of a participating Trustee’s deferral account is based on theoretical investments of deferred amounts, on the normal payment dates, in certain portfolios of the Trust or Metropolitan Series Fund, Inc. as designated by the participating Trustee. Changes in the value of participants’ deferral accounts are reflected as Trustees’ fees and expenses in the Statement of Operations. The portion of the accrued obligations allocated to the Portfolio, if any, under the Plan are reflected as Deferred trustees’ fees in the Statement of Assets and Liabilities.
4. Investment Transactions
Aggregate cost of purchases and proceeds of sales of investment securities, excluding short-term securities, for the period ended June 30, 2011 were as follows:
| | | | | | |
| Purchases | | Sales |
| U.S. Government | | Non U.S. Government | | U.S. Government | | Non U.S. Government |
| | | |
| $135,700,359 | | $416,806,292 | | $— | | $— |
5. Investments in Derivative Instruments
Investments in Derivative Instruments - Disclosures about derivative instruments are intended to improve financial reporting for derivative instruments by requiring enhanced disclosure that enables investors to understand how and why a Portfolio uses derivatives, how derivatives are accounted for, and how derivative instruments affect the Portfolio’s results of operations and financial position. Summarized below are the specific types of derivative instruments utilized by the Portfolio.
Futures Contracts - The Portfolio may buy and sell futures contracts (on recognized exchanges) as a hedge, to maintain investment exposure to a target asset class or to enhance return. The Portfolio may be subject to fluctuations in equity prices, interest rates, and foreign currency exchange rates in the normal course of pursuing its investment objective. Futures contracts are standardized agreements to buy or sell a security, or deliver a final cash settlement price in connection with an index, interest rate, currency, or other asset, for a set price in the future. The Portfolio must deposit an amount (“initial margin”) equal to a certain percentage of the face value of the futures contract. The initial margin may be in the form of cash or securities which is returned when the Portfolio’s obligations under the contract have been satisfied. Futures contracts are marked-to-market daily and subsequent payments (“variation margin”) are made or received by the Portfolio depending on the daily fluctuations in the value of the futures contract. These amounts are reflected as receivables or payables on the Statement of Assets and Liabilities. Risks of entering into futures contracts (and related options) include the possibility that the market for these instruments may be illiquid and that a change in the value of the contract or option may not correlate perfectly with changes in the value of the underlying securities. Futures contracts are exchange traded and the exchange’s clearinghouse, as counterparty to all exchange traded futures, guarantees the futures contracts against default.
Options Contracts - An option contract purchased by a Portfolio gives the Portfolio the right, but not the obligation, to buy (call) or sell (put) an underlying instrument at a fixed exercise price during a specified period. Call options written by a Portfolio give the holder the right to buy the underlying instrument from the Portfolio at a fixed exercise price; put options written by a Portfolio give the holder the right to sell the underlying instrument to the Portfolio at a fixed exercise price.
The Portfolio may use options to hedge against changes in values of securities the Portfolio owns or expects to purchase, to maintain exposure to the broad equity markets or to enhance return. Writing puts or buying calls tends to increase the Portfolio’s exposure to the underlying instrument and writing calls or buying puts tends to decrease the Portfolio’s exposure to the underlying instrument, and can be used to hedge other Portfolio investments. For options purchased to hedge the Portfolio’s investments, the potential risk to the Portfolio is that the change in value of options contracts may not correspond perfectly to the change in value of the hedged instruments. In addition, losses may arise from changes in the value of the underlying instrument, if there is an illiquid secondary market for the option contract, or if the counterparty to the option contract is unable to perform. The maximum loss for purchased options is limited to the premium initially paid for the option.
The main risk associated with purchasing an option is that the option expires without being exercised. In this case, the option expires worthless and the premium paid for the option is considered the loss. The risk associated with writing a call option is that the Portfolio may forgo the opportunity for a profit if the market value of the underlying instrument increases and the option is exercised, requiring the Portfolio to sell the underlying instrument at a price below its market value. When a Portfolio writes a call option on a security it does not own, its exposure on such an option is theoretically unlimited. The risk in writing a put option is that the Portfolio may incur a loss if the market value of the underlying instrument decreases and the option is exercised, requiring the Portfolio to purchase the underlying instrument at a price above its market value. In addition, the Portfolio risks not being able to enter into a closing transaction for the written option as the result of an illiquid market for the option.
15
MET INVESTORS SERIES TRUST
| | |
MetLife Balanced Plus Portfolio | | |
Notes to Financial Statements—June 30, 2011 (Unaudited)—(Continued)
5. Investments in Derivative Instruments - continued
Purchases of put and call options are recorded as investments, the value of which are marked-to-market daily. When a purchased option expires without being exercised, the Portfolio will realize a loss equal to the premium paid. When the Portfolio enters into a closing sale transaction, the Portfolio will realize a gain or loss depending on whether the sales proceeds from the closing sale transaction are greater or less than the premium initially paid for the option. When the Portfolio exercises a put option, it will realize a gain or loss from the sale of the underlying instrument and the proceeds from such sale will be decreased by the premium originally paid for the put option. When the Portfolio exercises a call option, the cost of the security which the Portfolio purchases upon exercise will be increased by the premium originally paid for the call option.
The premium received for a written option is recorded as an asset and an equivalent liability. The liability is marked-to-market daily based on the option’s quoted market price. When an option expires without being exercised or the Portfolio enters into a closing purchase transaction, the Portfolio realizes a gain (or loss if the cost of the closing purchase transaction exceeds the premium received when the option was sold) without regard to any unrealized gain or loss on the underlying instrument and the liability related to such option is eliminated. When a written call option is exercised, the Portfolio realizes a gain or loss from the sale of the underlying instrument.
At June 30, 2011, the Portfolio had the following derivatives, grouped into appropriate risk categories:
| | | | | | | | | | | | |
| | | Asset Derivatives | | | Liability Derivatives | |
Risk Exposure | | Statement of Assets &
Liabilities Location | | Fair Value | | | Statement of Assets &
Liabilities Location | | Fair Value | |
| | | | |
Interest Rate | | Unrealized appreciation on futures contracts* | | $ | 58,515 | | | Unrealized depreciation on futures contracts* | | $ | — | |
| | | | |
Equity | | Investment at value(a) | | | 2,417 | | | Investment at value(a) | | $ | — | |
| | | | |
| | Unrealized appreciation on futures contracts* | | | 4,812,576 | | | Unrealized depreciation on futures contracts* | | $ | — | |
| | | | | | | | | | | | |
| | | | |
Total | | | | $ | 4,873,508 | | | | | $ | — | |
| | | | | | | | | | | | |
| * | | Includes cumulative appreciation/depreciation of futures contracts as reported in the notes to financial statements. Only the current day’s variation margin is reported within the Statement of Assets & Liabilities. |
Transactions in derivative instruments during the period ended June 30, 2011, were as follows:
| | | | | | | | | | | | |
Statement of Operations Location - Net Realized Gain (Loss) | | Equity | | | Interest
Rate | | | Total | |
| | | |
Futures contracts | | $ | (3,849,996 | ) | | $ | — | | | $ | (3,849,996 | ) |
| | | |
Investment at value(a) | | | (1,109 | ) | | | — | | | | (1,109 | ) |
| | | | | | | | | | | | |
| | $ | (3,851,105 | ) | | $ | — | | | $ | (3,851,105 | ) |
| | | | | | | | | | | | |
Statement of Operations Location - Net Change in Unrealized Gain (Loss) | | | | | | | | | |
| | | |
Futures contracts | | $ | 58,515 | | | $ | 4,812,576 | | | | | |
| | | | | | | | | | | | |
| (a) | | Includes options purchased which are part of investments as shown in the Statement of Assets of Liabilities and change in unrealized appreciation (depreciation) on investments as shown in the Statement of Operations. |
For the period ended June 30, 2011, the average amount or number per contract outstanding for each derivative type was as follows:
| | | | | | | | |
Average Notional or Face Amount(b) | | Equity
Risk | | | Interest Rate
Risk | |
| | |
Futures contracts | | | 124,685,225 | | | | 42,730,175 | |
| | |
Options purchased | | | 18,375 | | | | — | |
| (b) | | Averages are based on daily activity levels during 2011. |
16
MET INVESTORS SERIES TRUST
| | |
MetLife Balanced Plus Portfolio | | |
Notes to Financial Statements—June 30, 2011 (Unaudited)—(Continued)
6. Futures Contracts
The futures contracts outstanding as of June 30, 2011 and the description and unrealized appreciation (depreciation) were as follows:
| | | | | | | | | | | | | | | | | | | | |
Futures Contracts - Long | | Expiration
Date | | | Number of
Contracts | | | Contract
Amount | | | Valuation as of
June 30, 2011 | | | Unrealized
Appreciation/
Depreciation | |
| | | | | |
S&P 500 E Mini Index Futures | | | 09/16/2011 | | | | 2,785 | | | $ | 178,370,799 | | | $ | 183,183,375 | | | $ | 4,812,576 | |
| | | | | |
90 Day Euro Dollar Futures | | | 06/18/2012 | | | | 172 | | | | 42,677,035 | | | | 42,735,550 | | | | 58,515 | |
| | | | | | | | | | | | | | | | | | | | |
| | | | | |
Net Unrealized Appreciation | | | | | | | | | | | | | | | | | | $ | 4,871,091 | |
| | | | | | | | | | | | | | | | | | | | |
7. Transactions in Securities of Affiliated Issuer
The Portfolio does not invest in the Underlying Portfolios for the purpose of exercising management or control; however, investments by the Portfolio within its principal investment strategies may represent a significant portion of the Underlying Portfolio’s net assets. Transactions in the Underlying Portfolios for the period from May 2, 2011 (commencement of operations) through June 30, 2011 were as follows:
| | | | | | | | | | | | | | | | |
Underlying Portfolio (Class A) | | Number of shares
held at May 2,
2011* | | | Shares purchased | | | Shares sold | | | Number of shares
held at June 30,
2011 | |
| | | | |
Artio International Stock | | | — | | | | 1,268,193 | | | | — | | | | 1,268,193 | |
| | | | |
BlackRock Bond Income | | | — | | | | 580,469 | | | | — | | | | 580,469 | |
| | | | |
BlackRock High Yield | | | — | | | | 971,838 | | | | — | | | | 971,838 | |
| | | | |
BlackRock Legacy Large Cap Growth | | | — | | | | 149,648 | | | | — | | | | 149,648 | |
| | | | |
Clarion Global Real Estate | | | — | | | | 797,534 | | | | — | | | | 797,534 | |
| | | | |
Dreman Small Cap Value | | | — | | | | 700,190 | | | | — | | | | 700,190 | |
| | | | |
Goldman Sachs Mid Cap Value | | | — | | | | 931,986 | | | | — | | | | 931,986 | |
| | | | |
Harris Oakmark International | | | — | | | | 2,040,322 | | | | — | | | | 2,040,322 | |
| | | | |
Invesco AIM Small Cap Growth | | | — | | | | 667,018 | | | | — | | | | 667,018 | |
| | | | |
Legg Mason ClearBridge Aggressive Growth | | | — | | | | 500,359 | | | | — | | | | 500,359 | |
| | | | |
Loomis Sayles Small Cap Growth | | | — | | | | 966,019 | | | | — | | | | 966,019 | |
| | | | |
Met/Artisan Mid Cap Value | | | — | | | | 22,523 | | | | — | | | | 22,523 | |
| | | | |
Met/Dimensional International Small Company | | | — | | | | 513,198 | | | | — | | | | 513,198 | |
| | | | |
Met/Eaton Vance Floating Rate | | | — | | | | 803,740 | | | | — | | | | 803,740 | |
| | | | |
Met/Franklin Low Duration Total Return | | | — | | | | 2,073,859 | | | | — | | | | 2,073,859 | |
| | | | |
Met/Templeton International Bond | | | — | | | | 1,021,701 | | | | — | | | | 1,021,701 | |
| | | | |
MFS® Emerging Markets Equity | | | — | | | | 729,296 | | | | — | | | | 729,296 | |
| | | | |
MFS® Research International | | | — | | | | 2,739,514 | | | | — | | | | 2,739,514 | |
| | | | |
MFS® Value | | | — | | | | 324,871 | | | | — | | | | 324,871 | |
| | | | |
Morgan Stanley Mid Cap Growth | | | — | | | | 327,513 | | | | — | | | | 327,513 | |
| | | | |
Neuberger Berman Genesis | | | — | | | | 336,440 | | | | — | | | | 336,440 | |
| | | | |
PIMCO Inflation Protected Bond | | | — | | | | 1,108,028 | | | | — | | | | 1,108,028 | |
| | | | |
PIMCO Total Return | | | — | | | | 5,140,747 | | | | — | | | | 5,140,747 | |
| | | | |
Third Avenue Small Cap Value | | | — | | | | 689,022 | | | | — | | | | 689,022 | |
| | | | |
Van Eck Global Natural Resources | | | — | | | | 514,429 | | | | — | | | | 514,429 | |
| | | | |
Van Kampen Comstock | | | — | | | | 419,953 | | | | — | | | | 419,953 | |
17
MET INVESTORS SERIES TRUST
| | |
MetLife Balanced Plus Portfolio | | |
Notes to Financial Statements—June 30, 2011 (Unaudited)—(Continued)
7. Transactions in Securities of Affiliated Issuer - continued
| | | | | | | | | | | | | | | | |
Underlying Portfolio (Class A) | | Number of shares
held at May 2,
2011* | | | Shares purchased | | | Shares sold | | | Number of shares
held at June 30,
2011 | |
| | | | |
Western Asset Management Strategic Bond Opportunities | | | — | | | | 1,627,236 | | | | — | | | | 1,627,236 | |
| | | | |
Western Asset Management U.S. Government | | | — | | | | 1,749,908 | | | | — | | | | 1,749,908 | |
| * | | Commencement of Operations |
| | | | | | | | | | | | | | | | |
Underlying Portfolio (Class A) | | Net Realized
Gain/(Loss) on sales
of Underlying
Portfolios | | | Capital Gain
Distributions
from Underlying
Portfolios | | | Dividend income
from Underlying
Portfolios | | | Ending Value as
of June 30,
2011 | |
| | | | |
Artio International Stock | | $ | — | | | $ | — | | | $ | — | | | $ | 12,707,299 | |
| | | | |
BlackRock Bond Income | | | — | | | | — | | | | — | | | | 61,819,999 | |
| | | | |
BlackRock High Yield | | | — | | | | — | | | | — | | | | 8,241,184 | |
| | | | |
BlackRock Legacy Large Cap Growth | | | — | | | | — | | | | — | | | | 4,193,142 | |
| | | | |
Clarion Global Real Estate | | | — | | | | — | | | | — | | | | 8,382,080 | |
| | | | |
Dreman Small Cap Value | | | — | | | | — | | | | — | | | | 10,488,849 | |
| | | | |
Goldman Sachs Mid Cap Value | | | — | | | | — | | | | — | | | | 12,609,769 | |
| | | | |
Harris Oakmark International | | | — | | | | — | | | | — | | | | 29,401,037 | |
| | | | |
Invesco AIM Small Cap Growth | | | — | | | | — | | | | — | | | | 10,625,601 | |
| | | | |
Legg Mason ClearBridge Aggressive Growth | | | — | | | | — | | | | — | | | | 4,258,055 | |
| | | | |
Loomis Sayles Small Cap Growth | | | — | | | | — | | | | — | | | | 10,693,826 | |
| | | | |
Met/Artisan Mid Cap Value | | | — | | | | — | | | | — | | | | 4,181,445 | |
| | | | |
Met/Dimensional International Small Company | | | — | | | | — | | | | — | | | | 8,359,988 | |
| | | | |
Met/Eaton Vance Floating Rate | | | — | | | | — | | | | — | | | | 8,278,525 | |
| | | | |
Met/Franklin Low Duration Total Return | | | — | | | | — | | | | — | | | | 20,717,852 | |
| | | | |
Met/Templeton International Bond | | | — | | | | — | | | | — | | | | 12,505,616 | |
| | | | |
MFS® Emerging Markets Equity | | | — | | | | — | | | | — | | | | 8,394,193 | |
| | | | |
MFS® Research International | | | — | | | | — | | | | — | | | | 29,477,170 | |
| | | | |
MFS® Value | | | — | | | | — | | | | — | | | | 4,168,099 | |
| | | | |
Morgan Stanley Mid Cap Growth | | | — | | | | — | | | | — | | | | 4,241,289 | |
| | | | |
Neuberger Berman Genesis | | | — | | | | — | | | | — | | | | 4,245,874 | |
| | | | |
PIMCO Inflation Protected Bond | | | — | | | | — | | | | — | | | | 12,465,311 | |
| | | | |
PIMCO Total Return | | | — | | | | — | | | | — | | | | 62,151,635 | |
| | | | |
Third Avenue Small Cap Value | | | — | | | | — | | | | — | | | | 10,535,144 | |
| | | | |
Van Eck Global Natural Resources | | | — | | | | — | | | | — | | | | 8,488,087 | |
| | | | |
Van Kampen Comstock | | | — | | | | — | | | | — | | | | 4,195,330 | |
| | | | |
Western Asset Management Strategic Bond Opportunities | | | — | | | | — | | | | — | | | | 20,633,350 | |
| | | | |
Western Asset Management U.S. Government | | | — | | | | — | | | | — | | | | 20,666,408 | |
| | | | | | | | | | | | | | | | |
| | | | |
| | $ | — | | | $ | — | | | $ | — | | | $ | 417,126,157 | |
| | | | | | | | | | | | | | | | |
18
MET INVESTORS SERIES TRUST
| | |
MetLife Balanced Plus Portfolio | | |
Notes to Financial Statements—June 30, 2011 (Unaudited)—(Continued)
8. Contractual Obligations
The Trust has a variety of indemnification obligations under contracts with its service providers. The Trust’s maximum exposure under these arrangements is unknown.
9. Market, Credit and Counterparty Risk
In the normal course of business, the Portfolio and the Underlying Portfolios invest in securities and enter into transactions where risks exist due to fluctuations in the market (market risk) or failure of the other party to a transaction to perform (credit and counterparty risk). The value of securities held by the Portfolio and the Underlying Portfolios may decline in response to certain events, including those directly involving the companies whose securities are owned by the Portfolio or the Underlying Portfolios; conditions affecting the general economy; overall market changes; local, regional or global political, social or economic instability; and currency and interest rate and price fluctuations. The Portfolio and the Underlying Portfolios may be exposed to counterparty risk, or the risk that an entity with which the Portfolio or the Underlying Portfolios have unsettled or open transactions may default. The potential loss could exceed the value of the financial assets recorded in the financial statements. Financial assets that potentially expose the Portfolio and the Underlying Portfolios to credit risk consist principally of cash due from counterparties and investments. In order to preserve certain safeguards for derivatives and non-standard settlement trades, the Portfolio and the Underlying Portfolios restrict their exposure to credit losses by entering into master netting agreements with counterparties (approved brokers) with whom they undertake a significant volume of transactions. The Portfolio and the Underlying Portfolios reduce the credit risk associated with favorable contracts by entering into master netting arrangements to the extent that all amounts with the counterparty are terminated and settled on a net basis if an event of default occurs. The Portfolio’s and the Underlying Portfolios’ overall exposure to credit risk on derivative instruments subject to master netting arrangements can change substantially within a short period, as it is affected by each transaction subject to the arrangement.
10. Recent Accounting Pronouncements
In January 2010, the Financial Accounting Standards Board (“FASB”) issued Accounting Standards Update No. 2010-06, “Improving Disclosures About Fair Value Measurements” (“ASU”) which was generally effective for years beginning after December 15, 2009 and was adopted by the Portfolio. The ASU requires enhanced disclosures about purchases, sales, issuances and settlements on a gross basis relating to Level 3 fair value measurements. These enhanced disclosures became effective for fiscal years beginning after December 15, 2010, and for interim periods within those years. Management has evaluated the impact of ASU 2010-06 and has concluded that ASU 2010-06 has no material impact on these financial statements.
In May 2011, FASB issued Accounting Standards Update (ASU) No. 2011-04 “Amendments to Achieve Common Fair Value Measurement and Disclosure Requirements in GAAP and the International Financial Reporting Standards (IFRS).” ASU 2011-04 includes common requirements for measurement of and disclosure about fair value between U.S. GAAP and IFRS. ASU 2011-04 will require reporting entities to categorize within Level 3 of the fair value hierarchy: quantitative information about the unobservable inputs used in the fair value measurement, the valuation processes used by the reporting entity and a narrative description of the sensitivity of the fair value measurement to changes in unobservable inputs and the interrelationships between those unobservable inputs. In addition, ASU 2011-04 will require reporting entities to make disclosures about amounts and reasons for all transfers in and out of Level 1 and Level 2 fair value measurements. The new and revised disclosures are effective for fiscal years beginning after December 15, 2011 and for interim periods within those fiscal years. Management is currently evaluating the implications of ASU 2011-04 and its impact on the financial statements.
19
MET INVESTORS SERIES TRUST
| | |
MetLife Balanced Plus Portfolio | | |
Quarterly Portfolio Schedule
The Trust files Form N-Q for the first and third quarters of each fiscal year. The Trust’s Forms N-Q will be available on the Securities and Exchange Commission’s website at http://www.sec.gov. The Trust’s Forms N-Q may be reviewed and copied at the Securities and Exchange Commission’s Public Reference Room in Washington, D.C. and information on the operation of the Public Reference Room may be obtained by calling 1-800-SEC-0330. Once filed, the most recent Form N-Q will be available without charge, upon request, by calling (800) 848-3854.
Proxy Voting Policies and Procedures
A description of the policies and procedures that the Trust uses to determine how to vote proxies relating to portfolio securities is available without charge, upon request, by calling (800) 848-3854 and on the Securities and Exchange Commission’s website at http://www.sec.gov.
Proxy Voting Record
The Trust, on behalf of each of its Portfolios, has filed with the Securities and Exchange Commission its proxy voting record for the 12-month period ending June 30 on Form N-PX. Form N-PX must be filed by the Trust each year by August 31. Once filed, the most recent Form N-PX will be available without charge, upon request, by calling (800) 848-3854 or on the Securities and Exchange Commission’s website at http://www.sec.gov.
20
MET INVESTORS SERIES TRUST
| | |
MetLife Balanced Plus Portfolio | | |
Board of Trustees’ Consideration of Advisory and Sub-Advisory Agreements
At an in-person meeting of the Board of Trustees (the “Board”) of the Met Investors Series Trust (the “Trust”) held on February 14-15, 2011, the Board, including a majority of the Trustees who are not considered to be “interested persons” of the Trust (the “Independent Trustees”) under the Investment Company Act of 1940, as amended (the “1940 Act”), initially approved the Trust’s advisory agreement (the “Advisory Agreement”) with MetLife Advisers, LLC (the “Adviser”) and the applicable investment sub-advisory agreements (each a “Sub-Advisory Agreement”, and collectively with the Advisory Agreement, the “Agreements”) between the Adviser and the investment sub-advisers (each a “Subadviser”, and collectively, the “Subadvisers”) for certain new series of the Trust, including the MetLife Balanced Plus Portfolio (each a “Portfolio,” and collectively, the “Portfolios”).1
In considering the Agreements, the Board reviewed a variety of materials provided by the Adviser and the Subadvisers relating to each Portfolio, the Adviser and each Subadviser, including comparative fee and expense information for an appropriate peer group of similar mutual funds if available, performance information for relevant benchmark indices, as applicable, and other information regarding the nature, extent and quality of services to be provided by the Adviser and the Subadvisers under their respective Agreements. The Independent Trustees also assessed a report provided by the Board’s independent consultant, who reviewed and provided analyses regarding fees and expenses, and other information provided by, or at the direction of, the Adviser and Subadvisers, as more fully discussed below.
The Independent Trustees were separately advised by independent legal counsel throughout the process. Prior to voting to approve the Agreements at the February meeting, the Independent Trustees also received a memorandum from their independent legal counsel discussing the legal standards for their consideration of the proposed initial approval of the Agreements. The Board also had previously received presentations from the Adviser with respect to the Managed Risk Portfolios at the August 3-4, 2010 and the November 9-10, 2010 Board meetings. The Board also further discussed the Managed Risk Portfolios with the Adviser on January 19, 2011, and received presentations regarding the Managed Risk Portfolios from the Subadvisers on January 26, 2011 and January 28, 2011 during which representatives of the Adviser and the Subadvisers responded to questions from the Independent Trustees. The Independent Trustees also discussed the proposed initial approval of the Agreements in private sessions with their independent legal counsel at which no representatives of management were present.
In considering whether to approve the Agreements, the Board reviewed and analyzed the factors it deemed relevant, including: (1) the nature, extent and quality of the services to be provided to the Portfolios by the Adviser and the Subadvisers; (2) the performance of comparable funds or accounts managed by the Subadvisers as compared to appropriate indices, to the extent available; (3) the Adviser’s and each of the Subadviser’s personnel and operations; (4) the financial condition of the Adviser and of the Subadvisers; (5) the level and method of computing each Portfolio’s proposed advisory and subadvisory fees; (6) the anticipated profitability of the Adviser under the Advisory Agreement and of the Subadvisers under the Sub-Advisory Agreements; (7) any “fall-out” benefits to the Adviser, the Subadvisers and their affiliates (i.e., ancillary benefits realized by the Adviser, the Subadvisers or their affiliates from the Adviser’s or Subadvisers’ relationship with the Trust); (8) the anticipated effect of growth in size on each Portfolio’s performance and expenses; (9) fees paid by comparable institutional and retail accounts; and (10) possible conflicts of interest. The Board also considered the nature, quality, and extent of the services to be provided to the Portfolios by the Adviser’s affiliates, including distribution services.
Nature, extent and quality of services. In considering the nature, extent and quality of the services to be provided by the Adviser to the Portfolios, the Board took into account the extensive responsibilities that the Adviser would have as investment adviser to the Portfolios, including the provision of investment advisory services to the MetLife Balanced Plus Portfolio, the selection of the Subadvisers for the other Portfolios and oversight of the Subadvisers’ compliance with fund policies and objectives, review of brokerage matters including with respect to trade allocation and best execution, oversight of general fund compliance with federal and state laws, its risk management processes, and the implementation of Board directives as they relate to the Portfolios. The Adviser’s role in coordinating the activities of the Portfolios’ other service providers was also considered. The Board also evaluated the expertise and performance of the investment personnel with respect to the MetLife Balanced Plus Portfolio and of the personnel who would be overseeing the Subadvisers of the other Portfolios and compliance with each Portfolio’s investment restrictions, tax and other requirements. The Board also considered that an Investment Committee, consisting of investment professionals from across MetLife, will meet at least quarterly to review the asset allocations of the MetLife Balanced Plus Portfolio. The Board considered information received from the Trust’s Chief Compliance Officer (the “CCO”) regarding the Portfolios’ compliance policies and procedures established pursuant to Rule 38a-1 under the 1940 Act, including the policies and procedures in place relating to proxy voting. Based on the information provided to the Board and its discussions with the CCO, the Board approved the Rule 38a-1 compliance policies and procedures as they relate to each Portfolio. The Board also took into account its familiarity with management through Board meetings, discussions and reports during the preceding year. The Board also took into consideration the quality of services the Adviser provided to other Portfolios of the Trust.
1 At the February 14-15, 2011 meeting, the Board also approved Agreements with respect to the AQR Global Risk Balanced Portfolio, AllianceBernstein Global Dynamic Allocation Portfolio, BlackRock Global Tactical Strategies Portfolio, Pyramis® Government Income Portfolio (together with the MetLife Balanced Plus Portfolio, the “Managed Risk Portfolios”), Met/Franklin Low Duration Total Return Portfolio and T. Rowe Price Large Cap Value Portfolio.
21
MET INVESTORS SERIES TRUST
| | |
MetLife Balanced Plus Portfolio | | |
Board of Trustees’ Consideration of Advisory and Sub-Advisory Agreements—(Continued)
The Board also recognized the Adviser’s reputation and long-standing experience in serving as an investment adviser to the Trust. In addition, the Board reviewed the financial condition of the Adviser and whether it had the financial wherewithal to provide a high level and quality of services to the Portfolios. In its review, the Board also received and took into account information regarding any services and/or payments to be provided to the Adviser by the Subadvisers in connection with marketing activities.
With respect to the services to be provided by the Subadvisers, the Board considered information provided to the Board by each Subadviser, including each Subadviser’s Form ADV, as well as information presented throughout the past year for those Subadvisers currently sub-advising existing Portfolios of the Trust. The Board considered each Subadviser’s current level of staffing and its overall resources, as well as its compensation program. The Board reviewed each Subadviser’s history and investment experience, as well as information regarding the qualifications, background and responsibilities of each Subadviser’s investment and compliance personnel who would be providing services to the Portfolios. The Board also considered, among other things, each Subadviser’s compliance program and its disciplinary history, and its risk assessment and monitoring process. The Board noted each Subadviser’s regulatory history, including whether it was currently involved in any regulatory actions or investigations as well as material litigation, and any settlements and ameliatory actions undertaken, as appropriate. The Board also noted that the CCO and his staff would be conducting regular, periodic compliance reviews with each of the Subadvisers and present reports to the Independent Trustees regarding the same, which would include evaluating the regulatory compliance system of the Subadvisers and procedures reasonably designed by them to assure compliance with the federal securities laws, including issues related to late trading and market timing, best execution, fair value pricing, and proxy voting procedures, among others. The Board also took into account the financial condition of each Subadviser. Based on the information provided to the Board and its discussions with the CCO, the Board approved the Rule 38a-1 compliance policies and procedures as they relate to the Portfolios.
The Board considered each Subadviser’s investment process and philosophy. The Board took into account that each Subadviser’s responsibilities would include the development and maintenance of an investment program for the applicable Portfolio which would be consistent with the Portfolio’s investment objectives, the selection of investment securities and the placement of orders for the purchase and sale of such securities, as well as the implementation of compliance controls related to performance of these services. The Board also reviewed each Subadviser’s brokerage policies and practices, including with respect to best execution and soft dollars.
Based on its consideration and review of the foregoing information, the Board concluded that the nature, extent and quality of services to be provided by the Adviser and by each Subadviser were satisfactory and that there was a reasonable basis on which to conclude that each would provide a high quality of investment services to the Portfolios.
Performance. The Board took into account that the AQR Global Risk Balanced Portfolio, AllianceBernstein Global Dynamic Allocation Portfolio, BlackRock Global Tactical Strategies Portfolio and MetLife Balanced Plus Portfolio utilize relatively unique investment strategies designed to manage volatility and noted the unavailability of comparable performance information for these types of strategies. With respect to the Pyramis® Government Income Portfolio, however, the Board considered the performance of a comparable fund managed by that Subadviser. The Board also considered the performance of other funds or accounts managed by the Subadvisers to the extent such information was relevant.
As discussed above with respect to the MetLife Balanced Plus Portfolio, the Board noted that no comparable performance data was available due to the fact that the Portfolio’s proposed strategy is highly customized, and because there is no equivalent fund or composite for which it will be patterned after. The Board took into account, however, the Adviser’s past performance in managing other asset allocation portfolios, as well as the Subadviser’s performance in managing a strategy similar to the sleeve it would be managing for the Portfolio.
Fees and expenses. The Board gave substantial consideration to the proposed management fees payable under the Advisory Agreement and the proposed subadvisory fees payable under each of the Sub-Advisory Agreements. In addition, the Independent Trustees reviewed a report prepared by Bobroff Consulting, Inc., an independent consultant (“Bobroff”), which analyzed the proposed fees to be paid by each Portfolio in light of fees paid to other investment managers by other somewhat comparable funds, as applicable, and the method of computing each Portfolio’s proposed fee. In addition, the Board considered each Portfolio’s proposed management fee and total expenses as compared to similarly situated investment companies underlying variable insurance products and retail funds deemed to be comparable to the Portfolio as determined by Bobroff. With respect to the AQR Global Risk Balanced Portfolio, AllianceBernstein Global Dynamic Allocation Portfolio, BlackRock Global Tactical Strategies Portfolio, and MetLife Balanced Plus Portfolio, the Board took into account the limited usefulness of the peer groups in which the Portfolios were included for comparative purposes. In comparing each Portfolio’s proposed management fee to that of comparable funds, the Board noted that such fee includes both advisory and administrative fees.
The Board noted that the subadvisory fees for the Portfolios would be paid by the Adviser, not the Portfolios, out of the management fee. It was further noted that the Adviser negotiated such fee at arm’s length. The Board also considered that the Adviser had agreed to enter into an expense limitation agreement with each Portfolio, pursuant to which the Adviser would agree to waive a portion of its management fee and/or reimburse certain expenses as a means of limiting a Portfolio’s total annual operating expenses.
The Board also compared the proposed subadvisory fee to be paid by the Adviser to the fees charged by each Subadviser to manage other funds and funds not subject to regulation under the 1940 Act, such as separate accounts, as applicable. The Board considered the fee comparisons in light of the differences required to manage different types of accounts.
22
MET INVESTORS SERIES TRUST
| | |
MetLife Balanced Plus Portfolio | | |
Board of Trustees’ Consideration of Advisory and Sub-Advisory Agreements—(Continued)
With respect to the MetLife Balanced Plus Portfolio, the Board considered that, according to a report prepared by Bobroff, the Portfolio’s proposed management fee was above the median of the peer group. The Board further considered that the Portfolio’s estimated total expenses (exclusive of 12b-1 fees) were above the median of the peer group. The Board took into account management’s discussion of the Portfolio’s estimated expenses and noted the small size of the peer group. The Board also noted that the Subadviser had agreed to waive a portion of its subadvisory fee for the Portfolio’s first three months of operations, and that the Adviser had also agreed to waive a portion of its advisory fee equal to the amount of the subadvisory fee waiver for the Portfolio’s first three months of operations. After consideration of all relevant factors, the Board concluded that the proposed management and subadvisory fees were consistent with industry norms and were fair and reasonable in light of the services to be provided.
Profitability. The Board examined the anticipated profitability of the Adviser with respect to each Portfolio. With respect to the MetLife Balanced Plus Portfolio, the Board noted that the advisory fee is in addition to the fees received by the Adviser and its affiliates with regard to the other Portfolios of the Trust or of Metropolitan Series Fund, Inc. (the “Underlying Portfolios”) in which the Portfolio may invest. With respect to the other Portfolios, the Board noted that a major component of profitability of the Adviser would be the margin between the management fee that the Adviser would receive from the Portfolio and the portion of that fee the Adviser would pay to the Subadviser. The Board also took into account the costs borne by the Adviser’s affiliates that support the operations of the Adviser, as well as considered the profitability of the insurance product, the function of which is supported in part by the Adviser’s revenues under the Advisory Agreement. The Board also considered that the Trust’s distributor, MetLife Investors Distribution Company, would receive Rule 12b-1 payments to support the distribution of the product. The Board concluded after extensive discussions with management that the anticipated profitability of the Adviser and its affiliates from their relationship with each Portfolio was reasonable in light of all relevant factors.
In considering the anticipated profitability to the Subadvisers and their affiliates of their relationships with the Portfolios, the Board noted that the proposed subadvisory fees under the Sub-Advisory Agreements would be paid by the Adviser out of the management fee that it would receive under the Advisory Agreement. The Board also relied on the ability of the Adviser to negotiate the Sub-Advisory Agreements and the fees thereunder at arm’s length. However, the Board placed more reliance on the fact that the Sub-Advisory Agreements were negotiated at arm’s length and that the proposed subadvisory fees would be paid by the Adviser than on the Subadvisers’ anticipated profitability.
Economies of scale. The Board also considered the probable effect of the Portfolios’ growth in size on their performance and fees. The Board noted that the proposed management and subadvisory fees each contained breakpoints that would reduce the fee rate above specified asset levels. The Board also took into account that the proposed subadvisory fees would be paid by the Adviser out of the management fees. The Board considered the fact that the Portfolios’ fee levels decline as portfolio assets increase. The Board also noted that if the Portfolios’ assets increase over time, the Portfolios may realize other economies of scale if assets increase proportionally more than certain other fixed expenses. The Board concluded that the proposed advisory fee structure for the Portfolios, including breakpoints, was reasonable and appropriately reflects potential economies of scale.
Other factors. As part of its evaluation of the Adviser’s compensation, the Board considered other benefits that may be realized by the Adviser and its affiliates from their relationship with the Trust. Among them, the Board recognized that an affiliate of the Adviser, MetLife Investors Distribution Company, serves as the distributor for the Trust, and, as such, would receive payments pursuant to Rule 12b-1 from the Portfolios to compensate it for providing shareholder services and selling activities, which could lead to growth in the Trust’s assets and corresponding benefits from such growth, including economies of scale. The Board also considered that affiliates of the Adviser may benefit from certain indirect tax benefits relating to dividend received deductions and foreign tax credits. The Board concluded that anticipated ancillary benefits that may accrue to the Adviser and its affiliates by virtue of the Adviser’s relationship with the Portfolios are fair and reasonable in light of the anticipated costs of providing investment management and other services to the Portfolios and the ongoing commitment of the Adviser to the Portfolios.
The Board considered other benefits that may be realized by each Subadviser and its affiliates from their relationship with the Trust, including the opportunity to provide advisory services to additional portfolios of the Trust and reputational benefits. The Board concluded that the benefits that may accrue to the Subadvisers and their affiliates by virtue of the Subadvisers’ relationships to the Portfolios were fair and reasonable in light of the anticipated costs of providing investment advisory services to the Portfolios and the ongoing commitment of the Subadvisers to the Portfolios.
The Board considered any possible conflicts of interest in the form of material benefits or detriments to the Trust resulting from the nature of the Trust’s and the Adviser’s or the Subadvisers’ affiliations. Here, the Board considered possible conflicts of interest that may arise between the Trust and the Adviser or a Subadviser in connection with the services to be provided to the Trust and the various relationships that they and their affiliates may have with the Trust. The Board considered the procedures for monitoring and managing such potential conflicts.
In addition, the Board reviewed the advisory fee to be paid to the Adviser for the MetLife Balanced Plus Portfolio and concluded that the advisory fee to be paid to the Adviser with respect to the Portfolio is based on services to be provided that are in addition to, rather than duplicative of, the services provided pursuant to the advisory agreements for the Underlying Portfolios in which the Portfolio invests and that the additional services are necessary because of the differences between the investment policies, strategies and techniques of the Portfolio and those of the Underlying Portfolios.
Conclusion. In considering the initial approval of each of the Agreements, the Board, including the Independent Trustees, did not identify any single factor as controlling, and each Trustee may have attributed different weights to various factors. The Board evaluated all information
23
MET INVESTORS SERIES TRUST
| | |
MetLife Balanced Plus Portfolio | | |
Board of Trustees’ Consideration of Advisory and Sub-Advisory Agreements—(Continued)
available to them on a Portfolio-by-Portfolio basis, and their determinations were made separately with respect to each Portfolio. Based on all of the above-mentioned considerations, and the recommendations of management, the Board, including a majority of the Independent Trustees, determined that approval of the Advisory Agreement and the Sub-Advisory Agreements was in the best interests of each Portfolio. After full consideration of these and other factors, the Board, including a majority of the Independent Trustees, with the assistance of independent legal counsel, approved the Advisory Agreement and the Sub-Advisory Agreement with respect to each Portfolio.
24
Simplify your life…
with MetLife eDelivery® while helping MetLife preserve the planet’s natural resources.
(see details on inside cover)
| | |
Met Investors Series Trust PIMCO Inflation Protected Bond Portfolio Semiannual Report | | June 30, 2011, as amended December 16, 2011 |
MET INVESTORS SERIES TRUST
| | |
PIMCO Inflation Protected Bond Portfolio | | |
Managed by Pacific Investment Management Company LLC
Portfolio Manager Commentary*
Performance
For the six-month period ended June 30, 2011, the Class A, B, and E shares of the PIMCO Inflation Protected Bond Portfolio returned 5.31%, 5.13% and 5.17%, respectively, compared to its benchmark, the Barclay’s Capital U.S. TIPS Index1, which returned 5.81%.
Market Environment/Conditions
Concern about political unrest across the Middle East/North Africa, the strongest earthquake on record in Japan, and the sovereign debt crisis in the Eurozone sparked a flight to safety and boosted demand for Treasuries and Treasury Inflation-Protected Securities (TIPS) during the first half of the year. During the first half of 2011, TIPS gained 5.81 percent year-to-date, as represented by the Barclays Capital U.S. TIPS Index. TIPS also outperformed their nominal Treasury bond counterparts as 10-year breakeven inflation levels widened (i.e. the difference between nominal and real yields), or nominal yields declined less than real yields. The real yield curve ended the first half of the year steeper as 2-year TIPS yields fell 18 basis points while 30-year TIPS yields fell 9 basis points.
The TIPS rally stalled late during the final days of the first half of the year as Greece’s parliament approved austerity measures, easing concerns (at least temporarily) about the potential for the Euro area’s first sovereign default. In addition, U.S. manufacturing businesses unexpectedly expanded at a faster pace in June, suggesting that the supply chain disruption from the Japanese earthquake was easing.
Another indicator that raised hopes for stronger growth in the second half of 2011 was falling commodity prices. Lower retail fuel prices relieved some stress on consumers coping with an official unemployment rate over 9 percent and continued weakness in residential property markets. On June 30 the Federal Reserve (Fed) ended its $600 billion program of buying Treasuries, including TIPS, known as QE2, and indicated its intent to continue buying Treasuries with proceeds from maturing debt on its $2.9 trillion balance sheet. The Fed also reiterated its “extended period” language for a near-zero federal funds rate.
Portfolio Review/Current Positioning
The Portfolio’s underweight to Treasury Inflation-Protected Securities (TIPS) detracted from performance as the sector outperformed Treasuries. A steepening bias added to performance as the nominal yield curve steepened; the 2-year yield fell 14 basis points while the 30-year rose 4 basis points. Additionally, exposure to Australian inflation-linked bonds (ILBs) added to performance during the period as real yields declined on slower growth prospects due to economic linkages with China. A modest exposure to commercial mortgage-backed securities added to returns as spreads on these securities tightened. Additionally, an overweight to bonds of banks, finance companies, and life insurers, which gained amid improving balance sheets and higher profits, added to performance. An emerging markets (EM) emphasis, especially to EM corporates in Russia, also added to performance. Finally, exposure to a basket of emerging market currencies added to returns as these currencies appreciated versus the U.S. dollar.
At period end, the Portfolio was underweight U.S. duration via TIPS given low real yields, however, overweight long-dated issues to capture relatively higher real yields in addition to attractiveness from “rolling down” a steep yield curve. The Portfolio also maintained positions in nominal money market futures where markets are pricing in more Fed tightening than we foresee. This offers potential to gain by “rolling down” the steep short maturity nominal curve. The Portfolio has also been diversifying its core exposure with allocations to ILBs in Australia, which offer relatively high real yields. Australia exhibits high quality real yields given favorable fiscal dynamics. The Portfolio also maintained exposure to German Bunds against core European linkers, especially France where inflation is expected to slow. In the spread sector space, the Portfolio continued to hold non-Agency mortgages and commercial mortgage-backed securities (CMBS) that have senior positions in the capital structure as another source of attractive yield. The Portfolio also included exposure to high grade corporates, especially U.S. banking and financial credits, where valuations and fundamentals remain compelling versus their counterparts in Europe and the broader corporate market. The Portfolio also included holdings of corporate and quasi-sovereign bonds in high quality EM countries and maintained exposure to relatively high nominal and real local interest rates in Brazil. Finally, the Portfolio invests in relatively high yielding, high quality EM currencies.
Mihir P. Worah
Managing Director
Pacific Investment Management Company LLC
*This commentary may include statements that constitute “forward-looking statements” under the U.S. securities laws. Forward-looking statements include, among other things, projections, estimates, and information about possible or future results related to the Portfolio, market or regulatory developments. The views expressed above are not guarantees of future performance or economic results and involve certain risks, uncertainties and assumptions that could cause actual outcomes and results to differ materially from the views expressed herein. The views expressed above are subject to change at any time based upon economic, market, or other conditions and the subadvisory firm undertakes no obligation to update the views expressed herein. Any discussions of specific securities should not be considered a recommendation to buy or sell those securities. The views expressed above (including any forward-looking statement) may not be relied upon as investment advice or as an indication of the Portfolio’s trading intent. Information about the Portfolio’s holdings, asset allocation or country diversification is historical and is not an indication of future Portfolio composition, which may vary. Direct investment in any index is not possible. The performance of any index mentioned in this commentary has not been adjusted for ongoing management, distribution and operating expenses, and sales charges
applicable to mutual fund investments. In addition, the returns do not
1
MET INVESTORS SERIES TRUST
| | |
PIMCO Inflation Protected Bond Portfolio | | |
Managed by Pacific Investment Management Company LLC
Portfolio Manager Commentary* (continued)
reflect additional fees charged by separate accounts or variable insurance contracts that an investor in the Portfolio may pay. If these additional fees were reflected, performance would have been lower.
Portfolio Composition as of June 30, 2011
| | | | |
Top Issuers | | | | |
| | |
% of
Net Assets | |
U.S. Treasury Inflation Indexed Bond | | | 43.3 | |
U.S. Treasury Inflation Index Note | | | 38.5 | |
Japan Treasury Bills | | | 4.0 | |
Italy Buoni Poliennali Del Tesoro | | | 3.0 | |
Royal Bank of Scotland plc | | | 2.5 | |
SLM Student Loan Trust | | | 1.9 | |
Westpac Banking Corp. | | | 1.7 | |
Citigroup, Inc. | | | 1.5 | |
Freddie Mac | | | 1.5 | |
Commonwealth Bank of Australia | | | 1.3 | |
| | | | |
Top Sectors | | | | |
| | | % of
Market Value of
Total Investments | |
U.S. Treasury & Government Agencies | | | 59.7 | |
Domestic Bonds & Debt Securities | | | 20.7 | |
Foreign Bonds & Debt Securities | | | 6.9 | |
Mortgage Backed Securities | | | 6.0 | |
Asset Backed Securities | | | 4.4 | |
Cash & Equivalents | | | 1.5 | |
Loan Participation | | | 0.7 | |
Municipals | | | 0.1 | |
2
MET INVESTORS SERIES TRUST
| | |
PIMCO Inflation Protected Bond Portfolio | | |
PIMCO Inflation Protected Bond Portfolio managed by
Pacific Investment Management Company LLC vs. Barclays Capital U.S. TIPS Index1
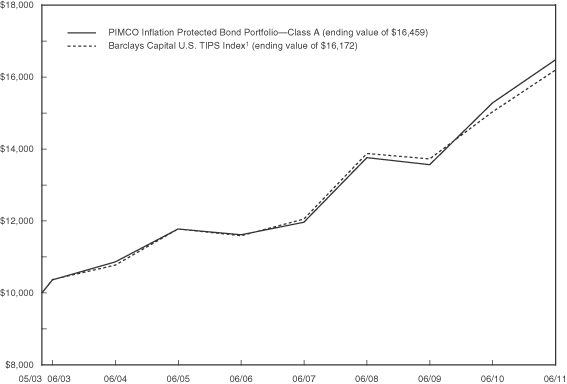
| | | | | | | | | | | | | | | | |
| | | Average Annual Return2 (for the six months ended June 30, 2011) | |
| | | 6 Month | | | 1 Year | | | 5 Year | | | Since
Inception3 | |
PIMCO Inflation Protected Bond
Portfolio—Class A | | | 5.31% | | | | 7.85% | | | | 7.22% | | | | 6.29% | |
| Class B | | | 5.13% | | | | 7.59% | | | | 6.95% | | | | 6.02% | |
| Class E | | | 5.17% | | | | 7.73% | | | | 7.06% | | | | 6.89% | |
| Barclays Capital U.S. TIPS Index1 | | | 5.81% | | | | 7.74% | | | | 6.91% | | | | 6.06% | |
The performance of Class A shares, as set forth in the line graph above, will differ from that of the other classes of shares because of the difference in expenses paid by policyholders investing in the different share classes.
1The Barclays Capital U.S. TIPS Index represents an unmanaged market index made up of U.S. Treasury Inflation Linked Index Securities.
2“Average Annual Return” is calculated including reinvestment of all income dividends and capital gain distributions.
3Inception of Class A and Class B shares is 5/1/03. Inception of Class E shares is 5/1/06. Index returns are based on an inception date of 5/1/03.
Past performance does not guarantee future results. The investment return and principal value of an investment in the Portfolio will fluctuate, so that shares, on any given day or when redeemed, may be worth more or less than their original cost. Performance numbers are net of all Portfolio expenses but do not include any insurance, sales, or administration charges of variable annuity or life insurance contracts. If these charges were included, the returns would be lower. The Index does not include fees or expenses and is not available for direct investment.
3
MET INVESTORS SERIES TRUST
| | |
PIMCO Inflation Protected Bond Portfolio | | |
Understanding Your Portfolio’s Expenses
Shareholder Expense Example
As a shareholder of the Portfolio, you incur ongoing costs, including management fees; distribution and service (12b-1) fees; and other Portfolio expenses. This example is intended to help you understand your ongoing costs (in dollars) (referred to as “expenses”) of investing in the Portfolio and compare these costs with the ongoing costs of investing in other mutual funds. The example is based on an investment of $1,000 invested at the beginning of the period and held for the entire period, January 1, 2011 through June 30, 2011.
Actual Expenses
The first line for each share class of the Portfolio in the table below provides information about actual account values and actual expenses. You may use the information in this line, together with the amount you invested in the particular share class of the Portfolio, to estimate the expenses that you paid over the period. Simply divide your account value by $1,000 (for example, an $8,600 account value divided by $1,000 = 8.6), then multiply the result by the number in the first line under the heading entitled “Expenses Paid During Period” to estimate the expenses you paid on your account during this period.
Hypothetical Example for Comparison Purposes
The second line for each share class of the Portfolio in the table below provides information about hypothetical account values and hypothetical expenses based on the Portfolio’s actual expense ratio and an assumed rate of return of 5% per year before expenses, which is not the Portfolio’s actual return. The hypothetical account values and expenses may not be used to estimate the actual ending account balance or expenses you paid for the period. You may use this information to compare the ongoing costs of investing in the Portfolio and other funds. To do so, compare this 5% hypothetical example with the 5% hypothetical examples that appear in the shareholder reports of the other funds.
Please note that the expenses shown in the table are meant to highlight your ongoing costs only and do not reflect any fees or charges of your variable insurance product or any additional expenses that participants in certain eligible qualified plans may bear relating to the operations of their plan. Therefore, the second line for each share class in the table is useful in comparing ongoing costs only, and will not help you determine the relative total costs of owning different funds. In addition, if these other costs were included, your costs would have been higher.
| | | | | | | | | | | | | | | | |
| | | Annualized
Expense
Ratio | | | Beginning
Account Value
January 1, 2011 | | | Ending
Account Value
June 30, 2011 | | | Expenses Paid
During Period**
January 1, 2011 to
June 30, 2011 | |
| | | | | | | | | | | | | | | | |
| | | | | | | | | | | | | | | | |
| | | | |
| | | | | | | | | | | | | | | | |
| | | | |
Class A | | | | | | | | | | | | | | | | |
Actual | | | 0.50% | | | $ | 1,000.00 | | | $ | 1,053.10 | | | $ | 2.55 | |
Hypothetical* | | | 0.50% | | | | 1,000.00 | | | | 1,022.32 | | | | 2.51 | |
| | | | | | | | | | | | | | | | |
| | | | |
| | | | | | | | | | | | | | | | |
Class B | | | | | | | | | | | | | | | | |
Actual | | | 0.75% | | | $ | 1,000.00 | | | $ | 1,051.30 | | | $ | 3.81 | |
Hypothetical* | | | 0.75% | | | | 1,000.00 | | | | 1,021.08 | | | | 3.76 | |
| | | | | | | | | | | | | | | | |
| | | | |
| | | | | | | | | | | | | | | | |
Class E | | | | | | | | | | | | | | | | |
Actual | | | 0.65% | | | $ | 1,000.00 | | | $ | 1,051.70 | | | $ | 3.31 | |
Hypothetical* | | | 0.65% | | | | 1,000.00 | | | | 1,021.57 | | | | 3.26 | |
| | | | | | | | | | | | | | | | |
* Hypothetical assumes a rate of return of 5% per year before expenses.
** Expenses paid are equal to the Portfolio’s annualized expense ratio for the most recent six month period, as shown above, multiplied by the average account value over the period, multiplied by the number of days (181 days) in the most recent fiscal half-year, divided by 365 (to reflect the one-half year period).
4
MET INVESTORS SERIES TRUST
| | |
PIMCO Inflation Protected Bond Portfolio | | |
Schedule of Investments as of June 30, 2011 (Unaudited)
U.S. Treasury & Government Agencies—86.8% of Net Assets
| | | | | | | | |
| Security Description | | Par
Amount | | | Value | |
| | | | | | | | |
| |
| Agency Sponsored Mortgage-Backed—2.1% | | | | | |
Fannie Mae 15 Yr. Pool | | | | | | | | |
4.500%, 04/01/23 | | $ | 2,408,306 | | | $ | 2,561,220 | |
4.500%, 04/01/24 | | | 10,836,356 | | | | 11,524,403 | |
Fannie Mae 30 Yr. Pool | | | | | | | | |
5.500%, 12/01/36 | | | 2,910,811 | | | | 3,156,968 | |
Fannie Mae ARM Pool | | | | | | | | |
2.680%, 11/01/34 (a) | | | 2,104,252 | | | | 2,218,801 | |
1.495%, 07/01/44 (a) | | | 44,173 | | | | 44,206 | |
1.495%, 09/01/44 (a) | | | 72,996 | | | | 73,082 | |
Fannie Mae REMICS | | | | | | | | |
0.336%, 08/25/34 (a) | | | 229,604 | | | | 221,022 | |
0.986%, 02/25/36 (a) | | | 804,041 | | | | 804,188 | |
0.246%, 12/25/36 (a) | | | 172,440 | | | | 170,223 | |
0.246%, 07/25/37 (a) | | | 1,934,090 | | | | 1,908,148 | |
0.566%, 07/25/37 (a) | | | 230,306 | | | | 231,198 | |
0.866%, 02/25/41 (a) | | | 12,404,648 | | | | 12,432,793 | |
Fannie Mae Whole Loan | | | | | | | | |
0.536%, 05/25/42 (a) | | | 173,186 | | | | 173,522 | |
5.950%, 02/25/44 | | | 199,865 | | | | 201,890 | |
Freddie Mac ARM Non-Gold Pool | | | | | | | | |
2.489%, 01/01/34 (a) | | | 195,150 | | | | 204,248 | |
Freddie Mac REMICS | | | | | | | | |
0.587%, 03/15/17 (a) | | | 54,331 | | | | 54,345 | |
0.417%, 02/15/19 (a) | | | 4,979,041 | | | | 4,982,045 | |
0.337%, 10/15/20 (a) | | | 1,788,745 | | | | 1,786,131 | |
0.537%, 12/15/30 (a) | | | 96,577 | | | | 96,655 | |
0.637%, 08/15/33 (a) | | | 13,096,406 | | | | 13,147,489 | |
Ginnie Mae | | | | | | | | |
0.486%, 03/20/37 (a) | | | 14,216,978 | | | | 14,168,155 | |
| | | | | | | | |
| | | | | | | 70,160,732 | |
| | | | | | | | |
| | |
| Federal Agencies—2.9% | | | | | | | | |
Fannie Mae REMICS | | | | | | | | |
2.524%, 05/25/35 (a) | | | 1,069,905 | | | | 1,114,758 | |
Federal Home Loan Mortgage Corp. | | | | | | | | |
0.146%, 03/21/13 (a) | | | 50,300,000 | | | | 50,322,668 | |
Federal National Mortgage Association | | | | | | | | |
1.250%, 03/14/14 | | | 10,700,000 | | | | 10,823,424 | |
6.000%, 03/09/20 | | | 10,100,000 | | | | 10,204,848 | |
5.375%, 04/11/22 | | | 1,700,000 | | | | 1,759,322 | |
6.280%, 06/15/27 | | | 1,000,000 | | | | 1,024,257 | |
Freddie Mac Structured Pass Through Securities | | | | | | | | |
0.446%, 08/25/31 (a) | | | 91,955 | | | | 89,410 | |
| | | | | | | | |
| |
| Federal Agencies—(Continued) | | | | | |
1.484%, 10/25/44 (a) | | $ | 5,577,914 | | | $ | 5,605,420 | |
1.495%, 02/25/45 (a) | | | 1,658,506 | | | | 1,638,564 | |
| NCUA Guaranteed Notes | | | | | | | | |
Series 2010-R1 Class 1A
0.635%, 10/07/20 (a) | | | 5,979,608 | | | | 5,990,850 | |
Series 2010-R3 Class 2A
0.745%, 12/08/20 (a) | | | 6,959,703 | | | | 6,999,373 | |
| | | | | | | | |
| | | | | | | 95,572,894 | |
| | | | | | | | |
| | |
| U.S. Treasury—81.8% | | | | | | | | |
U.S. Treasury Inflation Indexed Bonds
2.375%, 01/15/25 | | | 142,919,653 | | | | 164,491,660 | |
2.000%, 01/15/26 (b) | | | 88,289,080 | | | | 96,607,589 | |
2.375%, 01/15/27 | | | 120,101,058 | | | | 137,177,987 | |
1.750%, 01/15/28 (b) | | | 133,132,559 | | | | 139,560,332 | |
3.625%, 04/15/28 | | | 122,222,706 | | | | 161,171,660 | |
2.500%, 01/15/29 (b) | | | 90,995,278 | | | | 105,881,560 | |
3.875%, 04/15/29 (b) | | | 144,176,304 | | | | 197,825,605 | |
3.375%, 04/15/32 | | | 2,153,577 | | | | 2,853,657 | |
2.125%, 02/15/40 | | | 19,558,392 | | | | 21,326,295 | |
2.125%, 02/15/41 | | | 85,917,380 | | | | 93,535,846 | |
U.S. Treasury Inflation Indexed Notes
3.375%, 01/15/12 | | | 139,681,536 | | | | 142,747,965 | |
3.000%, 07/15/12 | | | 217,597,804 | | | | 227,117,707 | |
2.000%, 01/15/16 | | | 14,614,539 | | | | 16,251,820 | |
2.000%, 04/15/12 | | | 101,095,214 | | | | 103,330,328 | |
0.625%, 04/15/13 | | | 26,276,601 | | | | 27,066,949 | |
1.875%, 07/15/13 | | | 32,810,972 | | | | 34,882,165 | |
2.000%, 01/15/14 | | | 243,691,719 | | | | 262,692,118 | |
1.250%, 04/15/14 | | | 71,310,003 | | | | 75,694,427 | |
2.000%, 07/15/14 | | | 72,884,278 | | | | 79,529,283 | |
1.625%, 01/15/15 | | | 50,283,947 | | | | 54,573,821 | |
0.125%, 04/15/16 | | | 34,533,930 | | | | 35,335,221 | |
2.375%, 01/15/17 | | | 99,301,222 | | | | 113,374,092 | |
2.625%, 07/15/17 | | | 126,412,468 | | | | 147,171,797 | |
1.625%, 01/15/18 | | | 48,192,517 | | | | 53,041,889 | |
1.375%, 07/15/18 | | | 5,839,400 | | | | 6,345,787 | |
1.375%, 01/15/20 (b) | | | 80,027,657 | | | | 85,892,164 | |
1.250%, 07/15/20 (b) | | | 94,604,660 | | | | 100,162,684 | |
1.125%, 01/15/21 | | | 30,940,091 | | | | 32,158,357 | |
| | | | | | | | |
| | | | | | | 2,717,800,765 | |
| | | | | | | | |
Total U.S. Treasury & Government Agencies
(Cost $2,856,719,624) | | | | | | | 2,883,534,391 | |
| | | | | | | | |
See accompanying notes to financial statements.
5
MET INVESTORS SERIES TRUST
| | |
PIMCO Inflation Protected Bond Portfolio | | |
Schedule of Investments as of June 30, 2011 (Unaudited)
Domestic Bonds & Debt Securities—30.1%
| | | | | | | | |
| Security Description | | Par
Amount | | | Value | |
| | | | | | | | |
| | |
| Beverages—0.3% | | | | | | | | |
DanFin Funding, Ltd.
0.976%, 07/16/13
(144A) (a) | | $ | 11,600,000 | | | $ | 11,638,253 | |
| | | | | | | | |
| | |
| Capital Markets—4.7% | | | | | | | | |
ABN Amro Bank N.V.
2.043%, 01/30/14 (144A) (a) | | | 13,800,000 | | | | 13,789,465 | |
Banco Mercantil del Norte S.A. 4.375%, 07/19/15 (144A) | | | 5,600,000 | | | | 5,685,409 | |
Goldman Sachs Group, Inc. (The) 1.720%, 11/15/14 (EUR) (a) | | | 15,400,000 | | | | 21,719,614 | |
Lehman Brothers Holdings, Inc. 0.012%, 11/24/08 (c) | | | 300,000 | | | | 78,750 | |
0.000%, 12/23/08 (c) | | | 6,300,000 | | | | 1,653,750 | |
0.024%, 09/26/14 (c) | | | 700,000 | | | | 189,875 | |
0.011%, 09/27/27 (c) | | | 400,000 | | | | 106,500 | |
| Merrill Lynch & Co., Inc. | | | | | | | | |
Series C
0.482%, 06/05/12 (a) | | | 5,300,000 | | | | 5,291,414 | |
6.050%, 08/15/12 | | | 22,200,000 | | | | 23,376,511 | |
Series EMTN
2.276%, 09/27/12 (EUR) (a) | | | 3,000,000 | | | | 4,273,444 | |
1.621%, 01/31/14 (EUR) (a) | | | 3,400,000 | | | | 4,828,769 | |
1.730%, 05/30/14 (EUR) (a) | | | 2,000,000 | | | | 2,819,683 | |
1.734%, 08/25/14 (EUR) (a) | | | 3,000,000 | | | | 4,219,752 | |
| Morgan Stanley | | | | | | | | |
Series 1
1.104%, 12/01/11(a) | | | 3,815,000 | | | | 3,830,684 | |
Series EMTN
1.760%, 03/01/13 (EUR) (a) | | | 2,600,000 | | | | 3,734,620 | |
Series GMTN
2.761%, 05/14/13 (a) | | | 14,800,000 | | | | 15,203,729 | |
1.730%, 11/29/13 (EUR) (a) | | | 7,300,000 | | | | 10,338,123 | |
0.590%, 01/09/14 (a) | | | 8,925,000 | | | | 8,706,712 | |
Nordea Bank AB
1.181%, 01/14/14 (144A) (a) | | | 26,000,000 | | | | 26,247,208 | |
| | | | | | | | |
| | | | | | | 156,094,012 | |
| | | | | | | | |
| | | | | | | | |
|
| Chemicals—0.3% | |
Dow Chemical Co. (The)
2.518%, 08/08/11 (a) | | $ | 8,940,000 | | | $ | 8,959,677 | |
4.850%, 08/15/12 | | | 2,000,000 | | | | 2,089,480 | |
| | | | | | | | |
| | | | | | | 11,049,157 | |
| | | | | | | | |
|
| Commercial Banks—15.2% | |
ANZ National International, Ltd.
6.200%, 07/19/13 (144A) | | | 3,600,000 | | | | 3,925,102 | |
0.700%, 08/19/14 (144A) | | | 5,000,000 | | | | 5,034,980 | |
Banco Bradesco S.A. of the Cayman Islands
2.361%, 05/16/14 (144A) | | | 16,200,000 | | | | 16,274,889 | |
Banco Santander Brazil S.A.
2.504%, 12/28/11 (144A) (d) | | | 900,000 | | | | 892,620 | |
2.347%, 03/18/14 (144A) (a) | | | 1,200,000 | | | | 1,205,044 | |
4.250%, 01/14/16 (144A) | | | 5,500,000 | | | | 5,518,269 | |
Barclays Bank plc
7.434%, 09/29/49 (144A) (a) | | | 700,000 | | | | 719,250 | |
BBVA Bancomer S.A.
6.500%, 03/10/21 (144A) | | | 6,700,000 | | | | 6,867,500 | |
BPCE S.A.
2.375%, 10/04/13 (144A) | | | 10,740,000 | | | | 10,760,812 | |
Citigroup, Inc.
5.250%, 02/27/12 | | | 4,000,000 | | | | 4,116,612 | |
5.300%, 10/17/12 | | | 11,000,000 | | | | 11,548,097 | |
1.111%, 02/15/13 (a) | | | 19,500,000 | | | | 19,433,173 | |
6.000%, 12/13/13 | | | 2,300,000 | | | | 2,502,170 | |
0.552%, 11/05/14 (a) | | | 1,400,000 | | | | 1,337,346 | |
Series EMTN
1.575%, 03/05/14 (EUR) (a) | | | 1,400,000 | | | | 1,976,495 | |
7.375%, 06/16/14 (EUR) (a) | | | 3,400,000 | | | | 5,436,936 | |
Commonwealth Bank of Australia
0.705%, 07/12/13 (144A) (a) | | | 29,700,000 | | | | 29,701,515 | |
0.747%, 06/25/14 (144A) (a) | | | 7,900,000 | | | | 7,963,579 | |
0.525%, 09/17/14 (144A) (a) | | | 7,500,000 | | | | 7,512,728 | |
Dexia Credit Local
0.896%, 09/23/11 (144A) (a) | | | 2,700,000 | | | | 2,703,573 | |
See accompanying notes to financial statements.
6
MET INVESTORS SERIES TRUST
| | |
PIMCO Inflation Protected Bond Portfolio | | |
Schedule of Investments as of June 30, 2011 (Unaudited)
Domestic Bonds & Debt Securities—(Continued)
| | | | | | | | |
| Security Description | | Par
Amount | | | Value | |
| | | | | | | | |
|
| Commercial Banks—(Continued) | |
0.652%, 03/05/13 (144A) (a) | | $ | 4,800,000 | | | $ | 4,788,763 | |
0.753%, 04/29/14 (144A) (a) | | | 32,400,000 | | | | 32,301,472 | |
Export-Import Bank of Korea, Series 97
0.466%, 10/04/11 (144A) (a) | | | 1,600,000 | | | | 1,600,454 | |
ICICI Bank, Ltd.
2.063%, 02/24/14 (144A) | | | 4,500,000 | | | | 4,475,223 | |
ING Bank N.V.
1.046%, 03/30/12 (144A) (a) | | | 26,100,000 | | | | 26,207,010 | |
1.596%, 10/18/13 (144A) (a) | | | 7,300,000 | | | | 7,365,904 | |
1.652%, 06/09/14 (144A) (a) | | | 23,200,000 | | | | 23,293,032 | |
Intesa Sanpaolo
2.658%, 02/24/14 (144A) (a) | | | 27,700,000 | | | | 27,653,215 | |
LeasePlan Corp. N.V.
3.000%, 05/07/12 (144A) | | | 5,200,000 | | | | 5,316,657 | |
National Australia Bank, Ltd.
5.350%, 06/12/13 (144A) | | | 3,000,000 | | | | 3,219,249 | |
0.793%, 07/08/14 (144A) (a) | | | 15,500,000 | | | | 15,657,542 | |
NIBC Bank N.V.
2.800%, 12/02/14 (144A) | | | 24,000,000 | | | | 25,004,952 | |
Royal Bank of Scotland plc (The)
1.450%, 10/20/11 (144A) | | | 25,000,000 | | | | 25,083,650 | |
3.000%, 12/09/11 (144A) | | | 2,500,000 | | | | 2,528,865 | |
2.679%, 08/23/13 (a) | | | 17,500,000 | | | | 17,960,425 | |
Series EMTN
1.174%, 04/23/12 (a) | | | 800,000 | | | | 804,931 | |
Series MTN
0.514%, 03/30/12 (144A) (a) | | | 36,500,000 | | | | 36,550,698 | |
Societe Financement de l’Economie Francaise
2.125%, 01/30/12 (144A) | | | 800,000 | | | | 807,701 | |
0.476%, 07/16/12 (144A) (a) | | | 21,500,000 | | | | 21,570,950 | |
Svenska Handelsbanken AB
1.249%, 09/14/12 (144A) (a) | | | 8,700,000 | | | | 8,781,493 | |
| | | | | | | | |
|
| Commercial Banks—(Continued) | |
Turkiye Garanti Bankasi A.S.
2.774%, 04/20/16 (144A) (a) | | $ | 1,800,000 | | | $ | 1,795,500 | |
UBS AG, Series BKNT
2.250%, 08/12/13 | | | 2,600,000 | | | | 2,646,103 | |
Wachovia Bank N.A.
0.653%, 11/03/14 (a) | | | 1,700,000 | | | | 1,672,858 | |
Wachovia Corp., Series EMTN
1.570%, 02/13/14 (EUR) (a) | | | 500,000 | | | | 712,364 | |
Westpac Banking Corp.
0.439%, 12/14/12 (144A) (a) | | | 43,500,000 | | | | 43,531,929 | |
3.585%, 08/14/14 (144A) | | | 6,700,000 | | | | 7,140,157 | |
0.530%, 09/10/14 (144A) (a) | | | 1,300,000 | | | | 1,302,590 | |
2.700%, 12/09/14 (144A) | | | 4,900,000 | | | | 5,108,103 | |
Westpac Securities NZ, Ltd.
2.500%, 05/25/12 (144A) | | | 4,000,000 | | | | 4,065,504 | |
| | | | | | | | |
| | | | | | | 504,377,984 | |
| | | | | | | | |
|
| Computers & Peripherals—0.2% | |
Lexmark International, Inc.
5.900%, 06/01/13 | | | 5,000,000 | | | | 5,333,325 | |
| | | | | | | | |
|
| Consumer Finance—1.9% | |
Ally Financial, Inc.
6.875%, 09/15/11 | | | 3,700,000 | | | | 3,732,375 | |
3.466%, 02/11/14 (a) | | | 17,600,000 | | | | 17,307,347 | |
3.647%, 06/20/14 (a) | | | 1,300,000 | | | | 1,272,034 | |
8.300%, 02/12/15 | | | 500,000 | | | | 560,000 | |
Series UNRE
7.000%, 02/01/12 | | | 4,300,000 | | | | 4,392,450 | |
American Express Bank FSB, Series BKNT
0.316%, 05/29/12 (a) | | | 1,400,000 | | | | 1,397,111 | |
American Express Co.
7.250%, 05/20/14 | | | 2,000,000 | | | | 2,288,884 | |
American Express Credit Corp., Series C
0.306%, 02/24/12 (a) | | | 3,000,000 | | | | 2,997,534 | |
5.875%, 05/02/13 | | | 400,000 | | | | 430,804 | |
Ford Motor Credit Co. LLC
7.250%, 10/25/11 | | | 5,800,000 | | | | 5,887,487 | |
7.800%, 06/01/12 | | | 400,000 | | | | 418,404 | |
7.000%, 04/15/15 | | | 16,200,000 | | | | 17,539,076 | |
See accompanying notes to financial statements.
7
MET INVESTORS SERIES TRUST
| | |
PIMCO Inflation Protected Bond Portfolio | | |
Schedule of Investments as of June 30, 2011 (Unaudited)
Domestic Bonds & Debt Securities—(Continued)
| | | | | | | | |
| Security Description | | Par
Amount | | | Value | |
| | | | | | | | |
|
| Consumer Finance—(Continued) | |
Hyundai Capital Services, Inc.
4.375%, 07/27/16 (144A) | | $ | 3,100,000 | | | $ | 3,182,401 | |
RCI Banque S.A.
2.155%, 04/11/14 (144A) (a) | | | 1,600,000 | | | | 1,604,309 | |
| | | | | | | | |
| | | | | | | 63,010,216 | |
| | | | | | | | |
|
| Diversified Financial Services—3.3% | |
Bank of America Corp., Series 170
0.924%, 06/11/12 (GBP) | | | 2,300,000 | | | | 3,676,700 | |
Citigroup, Inc.
2.262%, 08/13/13 (a) | | | 4,000,000 | | | | 4,077,400 | |
Credit Agricole S.A.
1.024%, 07/21/14 (144A) (a) | | | 2,000,000 | | | | 2,002,424 | |
FIH Erhvervsbank AS
2.000%, 06/12/13 (144A) | | | 1,200,000 | | | | 1,227,265 | |
General Electric Capital Corp., Series G
0.247%, 09/21/12 (a) | | | 42,900,000 | | | | 42,961,089 | |
HSBC Finance Corp.
0.625%, 07/19/12 (a) | | | 3,932,000 | | | | 3,930,970 | |
0.528%, 01/15/14 (a) | | | 3,800,000 | | | | 3,740,234 | |
Series EMTN
1.797%, 04/05/13 (EUR) (a) | | | 1,100,000 | | | | 1,581,881 | |
International Lease Finance Corp.
6.625%, 11/15/13 | | | 1,100,000 | | | | 1,144,000 | |
6.500%, 09/01/14 (144A) | | | 1,500,000 | | | | 1,597,500 | |
5.750%, 05/15/16 | | | 7,100,000 | | | | 6,998,797 | |
6.750%, 09/01/16 (144A) | | | 1,300,000 | | | | 1,391,000 | |
7.125%, 09/01/18 (144A) | | | 2,700,000 | | | | 2,902,500 | |
Macquarie Bank, Ltd., Series B
2.600%, 01/20/12 (144A) | | | 1,400,000 | | | | 1,417,545 | |
Racers, Series A
0.476%, 07/25/17 (144A) (a) (e) | | | 1,585,818 | | | | 1,553,949 | |
TransCapitalInvest, Ltd.
7.700%, 08/07/13 (144A) | | | 2,700,000 | | | | 2,998,674 | |
Vita Capital III, Ltd., Series B-II
1.366%, 01/01/12 (144A) (a) | | | 800,000 | | | | 794,320 | |
| | | | | | | | |
|
| Diversified Financial Services—(Continued) | |
Volkswagen International Finance N.V.
0.696%, 10/01/12 (144A) (a) | | $ | 25,100,000 | | | $ | 25,175,124 | |
| | | | | | | | |
| | | | | | | 109,171,372 | |
| | | | | | | | |
|
| Diversified Telecommunication Services—0.2% | |
Telefonica Emisiones SAU
0.603%, 02/04/13 (a) | | | 6,000,000 | | | | 5,911,308 | |
| | | | | | | | |
|
| Health Care Providers & Services—0.3% | |
HCA, Inc.
9.250%, 11/15/16 | | | 9,775,000 | | | | 10,422,594 | |
| | | | | | | | |
|
| Household Durables—0.3% | |
Black & Decker Corp. (The)
8.950%, 04/15/14 | | | 2,000,000 | | | | 2,368,086 | |
D.R. Horton, Inc.
5.250%, 02/15/15 | | | 7,500,000 | | | | 7,631,250 | |
| | | | | | | | |
| | | | | | | 9,999,336 | |
| | | | | | | | |
|
| Insurance—0.6% | |
American International Group, Inc.
8.250%, 08/15/18 | | | 1,700,000 | | | | 1,953,516 | |
6.400%, 12/15/20 | | | 12,700,000 | | | | 13,694,499 | |
8.175%, 05/15/38 (144A) (a) | | | 2,700,000 | | | | 2,960,145 | |
| | | | | | | | |
| | | | | | | 18,608,160 | |
| | | | | | | | |
|
| Media—0.4% | |
CCO Operating LLC/CCO Operating Capital Corp.
8.000%, 04/30/12 (144A) | | | 5,000,000 | | | | 5,225,000 | |
EchoStar DBS Corp.
7.000%, 10/01/13 | | | 6,200,000 | | | | 6,688,250 | |
Videotron Ltee
6.875%, 01/15/14 | | | 2,000,000 | | | | 2,032,500 | |
| | | | | | | | |
| | | | | | | 13,945,750 | |
| | | | | | | | |
|
| Oil, Gas & Consumable Fuels—1.5% | |
EOG Resources, Inc.
1.023%, 02/03/14 (a) | | | 14,600,000 | | | | 14,749,957 | |
Petrobras International Finance Co.
3.875%, 01/27/16 | | | 13,800,000 | | | | 14,048,511 | |
Petroleos Mexicanos
5.500%, 01/21/21 | | | 1,900,000 | | | | 1,998,230 | |
6.500%, 06/02/41 (144A) | | | 2,500,000 | | | | 2,549,117 | |
See accompanying notes to financial statements.
8
MET INVESTORS SERIES TRUST
| | |
PIMCO Inflation Protected Bond Portfolio | | |
Schedule of Investments as of June 30, 2011 (Unaudited)
Domestic Bonds & Debt Securities—(Continued)
| | | | | | | | |
| Security Description | | Par
Amount | | | Value | |
| | | | | | | | |
|
| Oil, Gas & Consumable Fuels—(Continued) | |
Pricoa Global Funding 1
0.377%, 06/26/12
(144A) (a) | | $ | 17,300,000 | | | $ | 17,219,226 | |
| | | | | | | | |
| | | | | | | 50,565,041 | |
| | | | | | | | |
|
| Thrifts & Mortgage Finance—0.9% | |
Achmea Hypotheekbank N.V.
3.200%, 11/03/14 (144A) | | | 6,000,000 | | | | 6,302,592 | |
Countrywide Financial Corp., Series MTN
5.800%, 06/07/12 | | | 1,400,000 | | | | 1,460,697 | |
Santander US Debt S.A. Unipersonal
1.046%, 03/30/12 (144A) (a) | | | 22,000,000 | | | | 22,006,644 | |
| | | | | | | | |
| | | | | | | 29,769,933 | |
| | | | | | | | |
Total Domestic Bonds & Debt Securities
(Cost $994,572,285) | | | | | | | 999,896,441 | |
| | | | | | | | |
|
| Foreign Bonds & Debt Securities—10.0% | |
|
| Australia—1.1% | |
Australia Government Bond | | | | | | | | |
Series 20CI
4.000%, 08/20/20 (AUD) | | | 5,100,000 | | | | 9,166,953 | |
Series 25CI
3.000%, 09/20/25 (AUD) | | | 12,600,000 | | | | 15,074,524 | |
Series CAIN408
2.500%, 09/20/30 (AUD) | | | 2,500,000 | | | | 2,720,989 | |
ING Bank Australia, Ltd., Series RTD
5.668%, 06/24/14 (a) (g) (AUD) | | | 800,000 | | | | 864,411 | |
New South Wales Treasury Corp., | | | | | | | | |
Series CIB1
2.750%, 11/20/25 (AUD) | | | 8,300,000 | | | | 9,599,214 | |
| | | | | | | | |
| | | | | | | 37,426,091 | |
| | | | | | | | |
| | |
| Denmark—0.4% | | | | | | | | |
TDC A.S., Series EMTN
3.500%, 02/23/15 (c) (EUR) | | | 9,400,000 | | | | 13,793,149 | |
| | | | | | | | |
| | | | | | | | |
| | |
| Italy—3.4% | | | | | | | | |
Italy Buoni Poliennali Del Tesoro
2.350%, 09/15/19 (EUR) | | | 11,707,410 | | | | 16,629,209 | |
2.600%, 09/15/23 (EUR) | | | 4,061,379 | | | | 5,726,362 | |
| | | | | | | | |
| | |
| Italy—(Continued) | | | | | | | | |
Series CPI
2.100%, 09/15/16 (EUR) | | $ | 22,438,086 | | | $ | 32,306,700 | |
2.100%, 09/15/21 (EUR) | | | 32,499,480 | | | | 44,172,622 | |
Italy Certificati di Credito del Tesoro/CCTS-eu
2.426%, 10/15/17 (a) (EUR) | | | 10,100,000 | | | | 14,116,976 | |
| | | | | | | | |
| | | | | | | 112,951,869 | |
| | | | | | | | |
| | |
| Japan—4.1% | | | | | | | | |
Japan Treasury Bills, Series 188
0.102%, 07/25/11 (e) (JPY) | | | 10,810,000,000 | | | | 134,035,287 | |
| | | | | | | | |
| | |
| Spain—0.9% | | | | | | | | |
Instituto de Credito Oficial
3.276%, 03/25/14
(144A) (a) (EUR) | | | 20,800,000 | | | | 30,036,912 | |
| | | | | | | | |
| | | | | | | | |
| | |
| United Kingdom—0.1% | | | | | | | | |
FCE Bank plc, Series EMTN
7.125%, 01/16/12 (c) (EUR) | | | 2,500,000 | | | | 3,708,940 | |
| | | | | | | | |
| | | | | | | | |
Total Foreign Bonds & Debt Securities (Cost $321,548,709) | | | | | | | 331,952,248 | |
| | | | | | | | |
|
| Mortgage-Backed Securities—8.8% | |
| |
| Collateralized-Mortgage Obligation—6.0% | | | | | |
American General Mortgage Loan Trust, Series 2010 Class A1
5.150%, 03/25/58 (144A) (a) | | | 6,418,444 | | | | 6,620,208 | |
Arran Residential Mortgages Funding plc
2.624%, 11/19/47 (144A) (EUR) (a) | | | 14,900,000 | | | | 21,631,032 | |
2.874%, 11/19/47 (144A) (EUR) (a) | | | 7,200,000 | | | | 10,472,934 | |
Arran Residential Mortgages Funding plc, Series 2010-1A Class A1B
2.620%, 05/16/47 (144A) (EUR) (a) | | | 1,140,045 | | | | 1,655,715 | |
Banc of America Funding Corp.
2.785%, 02/20/36 (a) | | | 2,778,861 | | | | 2,564,889 | |
See accompanying notes to financial statements.
9
MET INVESTORS SERIES TRUST
| | |
PIMCO Inflation Protected Bond Portfolio | | |
Schedule of Investments as of June 30, 2011 (Unaudited)
Mortgage-Backed Securities—(Continued)
| | | | | | | | |
| Security Description | | Par
Amount | | | Value | |
| | | | | | | | |
|
| Collateralized-Mortgage Obligation—(Continued) | |
Banc of America Mortgage Securities, Inc.
6.500%, 09/25/33 | | $ | 138,305 | | | $ | 145,123 | |
5.060%, 11/25/34 (a) | | | 259,062 | | | | 235,132 | |
2.867%, 06/25/35 (a) | | | 712,345 | | | | 608,245 | |
3.199%, 09/25/35 (a) | | | 404,504 | | | | 333,148 | |
BCAP LLC Trust
0.000%, 05/25/37 (e) | | | 2,700,000 | | | | 2,115,425 | |
0.000%, 08/26/37 (144A) (e) | | | 10,300,000 | | | | 10,213,385 | |
Bear Stearns ALT-A Trust 0.346%, 02/25/34 (a) | | | 392,050 | | | | 309,017 | |
2.916%, 09/25/35 (a) | | | 2,606,434 | | | | 1,899,089 | |
Bear Stearns ARM Trust
3.113%, 01/25/35 (a) | | | 4,422,051 | | | | 3,961,862 | |
2.710%, 03/25/35 (a) | | | 2,338,127 | | | | 2,199,726 | |
2.731%, 03/25/35 (a) | | | 16,061 | | | | 15,093 | |
2.340%, 08/25/35 (a) | | | 347,698 | | | | 328,453 | |
Series 2005-1 Class 2A1 2.769%, 03/25/35 (a) | | | 1,044,209 | | | | 816,258 | |
Bear Stearns Structured Products, Inc.
3.191%, 01/26/36 (a) | | | 989,529 | | | | 635,047 | |
Chase Mortgage Finance Corp., Series 2007-A1 Class 5A1
2.787%, 02/25/37 (a) | | | 412,431 | | | | 372,174 | |
Citigroup Mortgage Loan Trust, Inc.
2.370%, 08/25/35 (a) | | | 501,431 | | | | 478,374 | |
2.450%, 08/25/35 (a) | | | 468,978 | | | | 408,641 | |
2.660%, 12/25/35 (a) | | | 105,940 | | | | 94,744 | |
2.670%, 12/25/35 (a) | | | 7,526,507 | | | | 6,992,340 | |
Countrywide Alternative Loan Trust
0.466%, 12/25/35 (a) | | | 59,372 | | | | 39,679 | |
0.366%, 02/20/47 (a) | | | 1,847,891 | | | | 968,169 | |
0.356%, 05/25/47 (a) | | | 12,812,992 | | | | 8,478,843 | |
0.366%, 05/25/47 (a) | | | 641,914 | | | | 351,064 | |
Series 2005-11CB Class 2A6 5.500%, 06/25/35 | | | 1,200,000 | | | | 1,002,251 | |
Countrywide Home Loan Mortgage Pass Through Trust
2.789%, 11/19/33 (a) | | | 83,403 | | | | 82,230 | |
2.923%, 08/25/34 (a) | | | 460,279 | | | | 344,060 | |
4.922%, 11/20/34 (a) | | | 1,028,467 | | | | 958,623 | |
0.476%, 04/25/35 (a) | | | 1,528,378 | | | | 972,711 | |
| | | | | | | | |
|
| Collateralized-Mortgage Obligation—(Continued) | |
0.526%, 06/25/35 (144A) (a) | | $ | 320,062 | | | $ | 290,166 | |
Deutsche Alt-A Securities, Inc. Mortgage Loan Trust
0.286%, 10/25/36 (a) | | | 71,444 | | | | 30,825 | |
5.869%, 10/25/36 | | | 1,223,678 | | | | 730,326 | |
5.886%, 10/25/36 | | | 1,223,678 | | | | 731,309 | |
Deutsche Mortgage Securities, Inc., Series 2010-RS2 Class A1
1.436%, 06/28/47
(144A) (a) | | | 1,027,368 | | | | 1,025,668 | |
First Franklin Mortgage Loan Asset Backed Certificates
0.236%, 11/25/36 (a) | | | 53,584 | | | | 53,335 | |
First Horizon Alternative Mortgage Securities
2.343%, 06/25/34 (a) | | | 522,478 | | | | 469,343 | |
Fosse Master Issuer plc
1.650%, 10/18/54
(144A) (a) | | | 13,300,000 | | | | 13,281,820 | |
Granite Master Issuer plc
Series 2006-3 Class A3
0.226%, 12/20/54 (a) | | | 1,799,336 | | | | 1,703,971 | |
Series 2006-3 Class A7 0.286%, 12/20/54 (a) | | | 490,416 | | | | 465,076 | |
Series 2006-4 Class A6 0.276%, 12/20/54 (a) | | | 392,333 | | | | 372,062 | |
Granite Mortgages plc
1.015%, 09/20/44
(GBP) (a) | | | 1,725,313 | | | | 2,668,274 | |
Greenpoint Mortgage Funding Trust
0.406%, 06/25/45 (a) | | | 636,699 | | | | 423,506 | |
0.456%, 11/25/45 (a) | | | 281,084 | | | | 173,434 | |
0.266%, 10/25/46 (a) | | | 141,480 | | | | 131,101 | |
GSR Mortgage Loan Trust
2.790%, 09/25/35 (a) | | | 1,070,022 | | | | 1,024,207 | |
5.206%, 11/25/35 (a) | | | 2,295,485 | | | | 2,041,938 | |
Series 2005-AR1 Class 1A1 3.042%, 01/25/35 (a) | | | 790,486 | | | | 705,344 | |
Series 2005-AR3 Class 6A1 2.769%, 05/25/35 (a) | | | 1,326,158 | | | | 1,071,578 | |
Series 2005-AR14 Class 2A1 5.184%, 12/25/35 (a) | | | 488,599 | | | | 455,590 | |
Series 2007-OA4 Class 1A
1.048%, 05/25/47 (a) | | | 740,767 | | | | 497,500 | |
See accompanying notes to financial statements.
10
MET INVESTORS SERIES TRUST
| | |
PIMCO Inflation Protected Bond Portfolio | | |
Schedule of Investments as of June 30, 2011 (Unaudited)
Mortgage-Backed Securities—(Continued)
| | | | | | | | |
| Security Description | | Par
Amount | | | Value | |
| | | | | | | | |
|
| Collateralized-Mortgage Obligation—(Continued) | |
Harborview Mortgage Loan Trust
0.407%, 05/19/35 (a) | | $ | 163,876 | | | $ | 109,164 | |
0.466%, 02/19/36 (a) | | | 326,705 | | | | 193,107 | |
Holmes Master Issuer plc
2.677%, 10/15/54 (144A) (EUR) | | | 15,300,000 | | | | 22,309,447 | |
Indymac Index Mortgage Loan Trust, Series 2005-AR1
Class 2A1
5.067%, 11/25/35 (a) | | | 2,315,916 | | | | 1,949,683 | |
JPMorgan Mortgage Trust
5.015%, 02/25/35 (a) | | | 2,415,602 | | | | 2,403,843 | |
5.180%, 06/25/35 (a) | | | 4,986,570 | | | | 4,947,588 | |
2.842%, 07/25/35 (a) | | | 719,386 | | | | 694,800 | |
3.079%, 08/25/35 (a) | | | 1,193,971 | | | | 972,218 | |
5.423%, 07/27/37
(144A) (a) | | | 1,934,743 | | | | 1,625,328 | |
Series 2005-A6 Class 2A1 3.141%, 08/25/35 (a) | | | 898,688 | | | | 755,758 | |
Series 2005-A6 Class 4A1 5.433%, 09/25/35 (a) | | | 420,724 | | | | 394,008 | |
Series 2007-A1 Class 1A1 2.968%, 07/25/35 (a) | | | 759,767 | | | | 723,401 | |
Master Adjustable Rate Mortgages Trust
2.447%, 12/25/33 (a) | | | 456,073 | | | | 423,847 | |
2.836%, 11/21/34 (a) | | | 600,000 | | | | 575,691 | |
Mellon Residential Funding Corp.
0.627%, 12/15/30 (a) | | | 107,046 | | | | 98,982 | |
0.887%, 11/15/31 (a) | | | 908,103 | | | | 838,235 | |
Merrill Lynch Floating Trust
0.257%, 06/15/22
(144A) (a) | | | 50,159 | | | | 49,420 | |
Merrill Lynch/Countrywide Mortgage Investors Trust
1.191%, 10/25/35 (a) | | | 491,867 | | | | 405,012 | |
1.653%, 10/25/35 (a) | | | 2,508,216 | | | | 2,245,853 | |
0.436%, 11/25/35 (a) | | | 356,425 | | | | 306,722 | |
5.426%, 12/25/35 (a) | | | 851,217 | | | | 740,120 | |
Permanent Master Issuer plc
2.905%, 07/15/42 (144A) (EUR) (a) | | | 1,500,000 | | | | 2,176,369 | |
RBSSP Resecuritization Trust 2.214%, 07/26/45
(144A) (a) | | | 14,184,756 | | | | 13,823,073 | |
| | | | | | | | |
|
| Collateralized-Mortgage Obligation—(Continued) | |
Residential Accredit Loans, Inc.
0.486%, 08/25/35 (a) | | $ | 255,804 | | | $ | 155,445 | |
1.638%, 09/25/45 (a) | | | 276,650 | | | | 166,554 | |
Securitized Asset Sales, Inc. 2.565%, 11/26/23 (a) | | | 4,973 | | | | 4,799 | |
Sequoia Mortgage Trust 0.537%, 10/19/26 (a) | | | 231,262 | | | | 206,620 | |
0.386%, 07/20/36 (a) | | | 2,923,286 | | | | 2,307,655 | |
Structured Adjustable Rate Mortgage Loan Trust
2.580%, 02/25/34 (a) | | | 359,016 | | | | 334,594 | |
5.500%, 12/25/34 (a) | | | 1,882,841 | | | | 1,744,418 | |
1.678%, 01/25/35 (a) | | | 209,051 | | | | 133,175 | |
Structured Asset Mortgage Investments, Inc.
0.516%, 10/19/34 (a) | | | 177,564 | | | | 158,542 | |
0.437%, 07/19/35 (a) | | | 350,834 | | | | 246,019 | |
0.376%, 06/25/36 (a) | | | 172,748 | | | | 109,363 | |
0.396%, 05/25/46 (a) | | | 74,089 | | | | 41,118 | |
Structured Asset Securities Corp.
2.750%, 10/25/35
(144A) (a) | | | 350,215 | | | | 282,745 | |
0.236%, 05/25/36 (a) | | | 1,850 | | | | 1,827 | |
SWAN Environment Pvt., Ltd. 6.190%, 04/25/41
(AUD) (a) | | | 708,887 | | | | 748,987 | |
TBW Mortgage Backed Pass Through Certificates
6.015%, 07/25/37 | | | 534,179 | | | | 292,196 | |
Thornburg Mortgage Securities Trust
0.316%, 06/25/37 (a) | | | 1,650,203 | | | | 1,607,057 | |
6.043%, 09/25/37 (a) | | | 5,118,154 | | | | 5,104,355 | |
0.306%, 10/25/46 (a) | | | 1,589,566 | | | | 1,580,093 | |
WaMu Mortgage Pass Through Certificates
1.478%, 11/25/42 (a) | | | 41,154 | | | | 35,458 | |
0.476%, 10/25/45 (a) | | | 1,887,367 | | | | 1,555,389 | |
0.446%, 11/25/45 (a) | | | 298,959 | | | | 249,232 | |
1.278%, 02/25/46 (a) | | | 300,144 | | | | 226,567 | |
2.859%, 07/25/46 (a) | | | 1,233,572 | | | | 901,582 | |
1.778%, 11/25/46 (a) | | | 440,865 | | | | 327,504 | |
1.088%, 12/25/46 (a) | | | 174,641 | | | | 121,545 | |
Series 2005-AR10 Class 3A1
5.523%, 08/25/35 (a) | | | 825,831 | | | | 724,804 | |
See accompanying notes to financial statements.
11
MET INVESTORS SERIES TRUST
| | |
PIMCO Inflation Protected Bond Portfolio | | |
Schedule of Investments as of June 30, 2011 (Unaudited)
Mortgage-Backed Securities—(Continued)
| | | | | | | | |
| Security Description | | Par
Amount | | | Value | |
| | | | | | | | |
|
| Collateralized-Mortgage Obligation—(Continued) | |
Wells Fargo Mortgage Backed Securities Trust
2.832%, 09/25/34 (a) | | $ | 1,150,334 | | | $ | 1,146,557 | |
2.760%, 11/25/34 (a) | | | 499,423 | | | | 485,143 | |
2.814%, 10/25/35 (a) | | | 44,661 | | | | 40,423 | |
2.819%, 03/25/36 (a) | | | 309,845 | | | | 262,343 | |
2.872%, 04/25/36 (a) | | | 1,976,221 | | | | 1,686,010 | |
Series 2006-AR4 Class 2A4
5.620%, 04/25/36 (a) | | | 1,000,000 | | | | 938,097 | |
| | | | | | | | |
| | | | | | | 199,337,942 | |
| | | | | | | | |
|
| Commercial Mortgage-Backed Securities—2.8% | |
Banc of America Commercial Mortgage, Inc.
0.356%, 06/10/49
(144A) (a) | | | 548,928 | | | | 530,549 | |
5.802%, 06/10/49 (a) | | | 1,648,928 | | | | 1,750,866 | |
5.930%, 02/10/51 (a) | | | 1,100,000 | | | | 1,196,964 | |
Banc of America Large Loan, Inc.
1.937%, 11/15/15
(144A) (a) | | | 22,704,858 | | | | 21,088,579 | |
0.697%, 08/15/29
(144A) (a) | | | 3,801,425 | | | | 3,508,719 | |
5.672%, 02/17/51
(144A) (a) | | | 1,000,000 | | | | 1,094,898 | |
Series 2009-UB1 Class A4A
5.692%, 06/24/50 (a) | | | 1,700,000 | | | | 1,867,685 | |
BCRR Trust
4.230%, 12/22/28 (144A) | | | 359,454 | | | | 359,240 | |
4.230%, 04/22/34 (144A) | | | 11,420,202 | | | | 11,623,929 | |
Commercial Mortgage Pass Through Certificates,
Series 2010-C1 Class A1
3.156%, 07/10/46 (144A) | | | 2,468,864 | | | | 2,488,917 | |
Credit Suisse First Boston Mortgage Securities Corp., Series 2010-RR4
5.467%, 09/18/39
(144A) (a) | | | 2,000,000 | | | | 2,177,847 | |
Credit Suisse Mortgage Capital Certificates, Series 2009-RR1 Class A3A
5.383%, 02/15/40 (144A) | | | 1,600,000 | | | | 1,724,649 | |
GS Mortgage Securities Corp. II
1.317%, 03/06/20 (144A) (a) | | | 3,600,000 | | | | 3,534,283 | |
| | | | | | | | |
|
| Commercial Mortgage-Backed Securities—(Continued) | |
Series 2010-C1 Class A2
4.592%, 08/10/43 | | $ | 6,500,000 | | | $ | 6,547,824 | |
Indus (Eclipse 2007-1X) plc, Series 2007-1X Class A
0.989%, 01/25/20 (GBP) (a) | | | 2,547,000 | | | | 3,505,693 | |
JPMorgan Chase Commercial Mortgage Securities Corp.
5.794%, 02/12/51 (a) | | | 1,500,000 | | | | 1,630,602 | |
Merrill Lynch/Countrywide Commercial Mortgage Trust
5.700%, 09/12/49 | | | 5,400,000 | | | | 5,823,463 | |
RBSCF Trust, Series 2010-RR4 Class CMLA
6.213%, 12/16/49 (144A) (a) | | | 2,600,000 | | | | 2,845,759 | |
Vornado DP LLC, Series 2010-VNO Class A2FX-4
4.004%, 09/13/28 (144A) | | | 7,000,000 | | | | 6,794,329 | |
Wachovia Bank Commercial Mortgage Trust
0.267%, 06/15/20
(144A) (a) | | | 3,867,734 | | | | 3,509,819 | |
0.277%, 09/15/21 (144A) (a) | | | 6,881,773 | | | | 6,639,640 | |
Series 2004-C14 Class A4
5.088%, 08/15/41 (a) | | | 1,500,000 | | | | 1,605,627 | |
| | | | | | | | |
| | | | | | | 91,849,881 | |
| | | | | | | | |
Total Mortgage-Backed Securities
(Cost $292,080,710) | | | | | | | 291,187,823 | |
| | | | | | | | |
|
| Asset-Backed Securities—6.4% | |
|
| Asset Backed - Automobile—0.2% | |
Capital Auto Receivables Asset Trust
1.637%, 10/15/12 (a) | | | 1,419,330 | | | | 1,422,106 | |
Daimler Chrysler Auto Trust
1.670%, 09/10/12 (a) | | | 8,403 | | | | 8,405 | |
Ford Credit Auto Owner Trust
2.687%, 05/15/13 (a) | | | 4,300,391 | | | | 4,329,286 | |
Magnolia Funding, Ltd.
3.000%, 04/20/17 (144A) (EUR) | | | 1,291,341 | | | | 1,871,897 | |
| | | | | | | | |
| | | | | | | 7,631,694 | |
| | | | | | | | |
See accompanying notes to financial statements.
12
MET INVESTORS SERIES TRUST
| | |
PIMCO Inflation Protected Bond Portfolio | | |
Schedule of Investments as of June 30, 2011 (Unaudited)
Asset-Backed Securities—(Continued)
| | | | | | | | |
| Security Description | | Par
Amount | | | Value | |
| | | | | | | | |
|
| Asset Backed - Credit Card—0.7% | |
Bank of America Credit Card Trust
0.207%, 03/15/14 (a) | | $ | 875,000 | | | $ | 874,577 | |
Citibank Omni Master Trust
2.287%, 05/16/16
(144A) (a) | | | 16,600,000 | | | | 16,803,486 | |
2.937%, 08/15/18 (144A) (a) | | | 7,100,000 | | | | 7,470,165 | |
| | | | | | | | |
| | | | | | | 25,148,228 | |
| | | | | | | | |
|
| Asset Backed - Home Equity—0.2% | |
ACE Securities Corp.
0.236%, 12/25/36 (a) | | | 34,597 | | | | 33,893 | |
Asset Backed Funding Certificates
0.536%, 06/25/34 (a) | | | 852,021 | | | | 678,955 | |
Bear Stearns Asset Backed Securities Trust
0.846%, 10/25/32 (a) | | | 25,475 | | | | 22,557 | |
0.516%, 01/25/36 (a) | | | 2,047 | | | | 2,042 | |
0.236%, 11/25/36 (a) | | | 13,395 | | | | 12,883 | |
1.186%, 10/25/37 (a) | | | 3,706,444 | | | | 2,294,515 | |
Countrywide Asset-Backed Certificates
0.436%, 04/25/36 (a) | | | 430,075 | | | | 379,443 | |
First NLC Trust 0.256%,
08/25/37 (144A) (a) | | | 1,937,153 | | | | 1,056,075 | |
Household Home Equity Loan Trust
0.336%, 03/20/36 (a) | | | 2,587,134 | | | | 2,378,819 | |
5.910%, 03/20/36 | | | 1,280 | | | | 1,278 | |
HSI Asset Securitization Corp. Trust
0.236%, 10/25/36 (a) | | | 19,120 | | | | 14,428 | |
Merrill Lynch/Countrywide Mortgage Investors Trust
0.256%, 07/25/37 (a) | | | 15,531 | | | | 15,217 | |
Soundview Home Equity Loan Trust
0.246%, 11/25/36
(144A) (a) | | | 69,116 | | | | 21,749 | |
| | | | | | | | |
| | | | | | | 6,911,854 | |
| | | | | | | | |
| | |
| Asset Backed - Other—3.1% | | | | | | | | |
Alzette European CLO S.A.
0.567%, 12/15/20
(144A) (a) | | | 1,047,791 | | | | 1,016,500 | |
| | | | | | | | |
|
| Asset Backed - Other—(Continued) | |
American Money Management Corp.
0.482%, 05/03/18
(144A) (a) | | $ | 500,000 | | | $ | 489,201 | |
Aquilae Clo plc, Series 2006-1 X Class A
2.057%, 01/17/23
(EUR) (a) | | | 3,596,685 | | | | 4,894,926 | |
Ares Management LLC, Series CLO Funds 2006-6RA Class A1B
0.477%, 03/12/18
(144A) (a) | | | 2,299,530 | | | | 2,271,430 | |
Babson CLO, Ltd.
0.581%, 11/15/16
(144A) (a) | | | 2,168,109 | | | | 2,118,716 | |
Carrington Mortgage Loan Trust
0.506%, 10/25/35 (a) | | | 361,439 | | | | 338,112 | |
Conseco Finance Securitizations Corp.
6.681%, 12/01/33 (a) | | | 6,958,482 | | | | 7,418,691 | |
Countrywide Asset-Backed Certificates
0.366%, 07/25/36 (a) | | | 6,393,411 | | | | 5,496,300 | |
Credit-Based Asset Servicing and Securitization LLC
0.306%, 07/25/37
(144A) (a) | | | 285,131 | | | | 264,370 | |
CSAB Mortgage Backed Trust
5.720%, 09/25/36 | | | 1,306,910 | | | | 918,753 | |
Cumberland CLO, Ltd.
0.517%, 11/10/19
(144A) (a) | | | 4,903,822 | | | | 4,712,841 | |
Duane Street CLO
0.518%, 11/08/17
(144A) (a) | | | 1,649,638 | | | | 1,594,587 | |
Equity One ABS, Inc.
0.486%, 04/25/34 (a) | | | 118,587 | | | | 89,740 | |
First CLO, Ltd.
0.559%, 12/14/16 (a) | | | 1,667,490 | | | | 1,625,733 | |
Gallatin Funding, Ltd.
0.511%, 08/15/17
(144A) (a) | | | 1,000,000 | | | | 959,427 | |
GSAMP Trust
0.256%, 10/25/36 (a) | | | 414 | | | | 406 | |
See accompanying notes to financial statements.
13
MET INVESTORS SERIES TRUST
| | |
PIMCO Inflation Protected Bond Portfolio | | |
Schedule of Investments as of June 30, 2011 (Unaudited)
Asset-Backed Securities—(Continued)
| | | | | | | | |
| Security Description | | Par
Amount | | | Value | |
| | | | | | | | |
|
| Asset Backed - Other—(Continued) | |
Harbourmaster CLO
1.731%, 06/15/20 (144A) (EUR) (a) | | $ | 714,425 | | | $ | 983,641 | |
Harvest CLO
2.003%, 03/29/17
(EUR) (a) | | | 543,737 | | | | 754,216 | |
Hillmark Funding
0.509%, 05/21/21
(144A) (a) | | | 15,600,000 | | | | 14,657,869 | |
HSI Asset Securitization Corp. Trust
0.246%, 05/25/37 (a) | | | 140,566 | | | | 138,573 | |
JPMorgan Mortgage Acquisition Corp.
0.246%, 03/25/47 (a) | | | 741,754 | | | | 622,176 | |
Katonah, Ltd.
0.567%, 09/20/16
(144A) (a) | | | 4,387,997 | | | | 4,280,445 | |
Landmark CDO, Series 2005-1A Class A1L
0.554%, 06/01/17
(144A) (a) | | | 6,900,297 | | | | 6,717,342 | |
Magi Funding plc
1.835%, 04/11/21 (144A) (EUR) (a) (e) | | | 2,509,607 | | | | 3,407,838 | |
Morgan Stanley Capital, Inc.
0.236%, 11/25/36 (a) | | | 958 | | | | 330 | |
Nautique Funding, Ltd.,
Series 2006-1A Class A1A
0.499%, 04/15/20
(144A) (a) (b) | | | 962,297 | | | | 899,502 | |
Navigare Funding CLO, Ltd.,
Series 2006-1A Class A
0.520%, 05/20/19
(144A) (a) | | | 700,000 | | | | 687,186 | |
Navigator CDO, Ltd.
1.111%, 11/15/15
(144A) (a) | | | 376,899 | | | | 376,610 | |
NYLIM Flatiron CLO, Ltd.,
Series 2006-1A Class A2A
0.488%, 08/08/20
(144A) (a) | | | 600,000 | | | | 567,391 | |
Pacifica CDO Ltd.
0.611%, 02/15/17 (a) | | | 9,908,516 | | | | 9,695,356 | |
| | | | | | | | |
|
| Asset Backed - Other—(Continued) | |
Park Place Securities, Inc.
0.866%, 12/25/34 (a) | | $ | 4,184,849 | | | $ | 3,946,210 | |
0.446%, 09/25/35 (a) | | | 30,826 | | | | 27,645 | |
Penta CLO S.A.
1.934%, 06/04/24
(EUR) (a) | | | 4,357,383 | | | | 5,785,468 | |
Small Business Administration Participation Certificates 5.510%, 11/01/27 | | | 5,334,344 | | | | 5,853,822 | |
Structured Asset Securities Corp. 1.686%, 04/25/35 (a) | | | 738,285 | | | | 594,061 | |
0.236%, 10/25/36 (a) | | | 16,714 | | | | 16,672 | |
0.326%, 05/25/47 (a) | | | 3,200,000 | | | | 2,270,085 | |
Symphony CLO, Ltd.
0.501%, 05/15/19
(144A) (a) | | | 3,500,000 | | | | 3,268,983 | |
Wind River CLO, Ltd.
0.577%, 12/19/16
(144A) (a) | | | 769,233 | | | | 745,190 | |
Wood Street CLO B.V.,
Series II-A Class A1
1.763%, 03/29/21 (144A) (EUR) (a) | | | 886,946 | | | | 1,227,257 | |
| | | | | | | | |
| | | | | | | 101,733,601 | |
| | | | | | | | |
|
| Asset Backed - Student Loan—2.2% | |
College Loan Corp. Trust 0.524%, 01/25/24 (a) | | | 900,000 | | | | 904,249 | |
Illinois Student Assistance Commission, Series 2010-1 Class A1
0.754%, 04/25/17 (a) | | | 1,743,362 | | | | 1,743,327 | |
Nelnet Student Loan Trust, Series 2008-4 Class A2
0.974%, 07/25/18 (a) | | | 1,450,160 | | | | 1,457,923 | |
North Carolina State Education Assistance Authority
0.785%, 10/26/20 (a) | | | 4,900,000 | | | | 4,890,935 | |
SLM Student Loan Trust
0.284%, 10/25/17 (a) | | | 1,215,849 | | | | 1,208,828 | |
0.774%, 10/25/17 (a) | | | 860,000 | | | | 861,558 | |
1.837%, 12/15/17
(144A) (a) | | | 3,113,603 | | | | 3,135,839 | |
0.364%, 07/25/22 (a) | | | 943,891 | | | | 942,255 | |
1.774%, 04/25/23 (a) | | | 25,600,239 | | | | 26,456,444 | |
2.350%, 04/15/39
(144A) (a) | | | 6,722,431 | | | | 6,739,963 | |
See accompanying notes to financial statements.
14
MET INVESTORS SERIES TRUST
| | |
PIMCO Inflation Protected Bond Portfolio | | |
Schedule of Investments as of June 30, 2011 (Unaudited)
Asset-Backed Securities—(Continued)
| | | | | | | | |
| Security Description | | Par
Amount | | | Value | |
| | | | | | | | |
|
| Asset Backed-Student Loan—(Continued) | |
6.187%, 07/15/42
(144A) (a) | | $ | 14,523,153 | | | $ | 13,827,910 | |
4.500%, 11/16/43
(144A) (a) | | | 4,841,628 | | | | 4,670,487 | |
Series 2004-5X Class A5
1.429%, 10/25/23
(EUR) (a) | | | 4,100,000 | | | | 5,150,648 | |
| | | | | | | | |
| | | | | | | 71,990,366 | |
| | | | | | | | |
Total Asset-Backed Securities (Cost $212,275,924) | | | | | | | 213,415,743 | |
| | | | | | | | |
|
| Loan Participation—1.0% | |
| Security Description | | Principal
Amount | | | Value | |
|
| Automobiles—0.0% | |
Ford Motor Corp.
2.940%, 12/15/13 (144A) | | | 291,994 | | | | 292,228 | |
2.940%, 12/16/13 (144A) | | | 33,872 | | | | 33,900 | |
| | | | | | | | |
| | | | | | | 326,128 | |
| | | | | | | | |
| | |
| Consumer Finance—0.5% | | | | | | | | |
Springleaf Finance Corp.
0.000%, 05/28/17 | | | 16,200,000 | | | | 15,902,325 | |
| | | | | | | | |
| | | | | | | 15,902,325 | |
| | | | | | | | |
|
| Health Care Providers & Services—0.2% | |
IASIS Healthcare LLC
5.000%, 04/18/18 | | | 7,300,000 | | | | 7,282,407 | |
| | | | | | | | |
|
| Utilities—0.3% | |
NRG Energy, Inc.
0.000%, 11/04/12 | | | 8,000,000 | | | | 8,015,000 | |
| | | | | | | | |
|
| Wireless Telecommunication Services—0.0% | |
Intelsat Jackson Holdings, Ltd.
5.250%, 02/01/14 | | | 500,000 | | | | 481,040 | |
| | | | | | | | |
Total Loan Participation
(Cost $32,187,443) | | | | | | | 32,006,900 | |
| | | | | | | | |
| Security Description | | Par
Amount | | | Value | |
| | |
| Municipals—0.1% | | | | | | | | |
Buckeye Tobacco Settlement Financing Authority
5.875%, 06/01/47 | | | 1,000,000 | | | | 730,450 | |
| | | | | | | | |
|
| Municipals—(Continued) | |
Tobacco Settlement Financing Corp.
6.000%, 06/01/23 | | $ | 530,000 | | | $ | 536,789 | |
7.467%, 06/01/47 | | | 1,125,000 | | | | 834,323 | |
| | | | | | | | |
Total Municipals
(Cost $2,546,429) | | | | | | | 2,101,562 | |
| | | | | | | | |
|
| Convertible Preferred Stocks—0.0% | |
| | |
| Commercial Banks—0.0% | | | | | | | | |
Wells Fargo & Co.,
Series L 7.500%
(Cost $900,000) | | | 900 | | | | 954,000 | |
| | | | | | | | |
| Security Description | | Shares | | | Value | |
| | |
| Purchased Options—0.0% | | | | | | | | |
IRO USD 1 Year Swaption 1.25, (Counterparty - Goldman Sachs & Co.)
0.000%, 04/30/12 | | | 105,700,000 | | | | 554,196 | |
IRO USD 1 Year Swaption 2.0, (Counterparty - Goldman Sachs & Co.)
0.000%, 11/19/12 | | | 3,950,000 | | | | 95,736 | |
| | | | | | | | |
| | | | | | | 649,932 | |
| | | | | | | | |
Total Purchased Options
(Cost $454,850) | | | | | | | 649,932 | |
| | | | | | | | |
|
| Short-Term Investments—2.2% | |
| Security Description | | Par
Amount | | | Value | |
| | |
| Commercial Paper—2.0% | | | | | | | | |
Banco Do Brasil S.A.
0.000%, 11/15/11 (d) | | $ | 7,100,000 | | | | 7,065,218 | |
Barclays Bank plc,
Series YCD
0.000%, 12/16/11 (d) | | | 27,400,000 | | | | 27,400,000 | |
Itau Unibanco S.A. New York
0.000%, 03/02/12 (d) | | | 28,900,000 | | | | 28,571,232 | |
Nordea Bank Finland plc,
Series YCD
0.000%, 10/14/11 (d) | | | 2,940,000 | | | | 2,942,820 | |
| | | | | | | | |
| | | | | | | 65,979,270 | |
| | | | | | | | |
See accompanying notes to financial statements.
15
MET INVESTORS SERIES TRUST
| | |
PIMCO Inflation Protected Bond Portfolio | | |
Schedule of Investments as of June 30, 2011 (Unaudited)
Short-Term Investments—(Continued)
| | | | | | | | |
| Security Description | | Par
Amount | | | Value | |
| | | | | | | | |
|
| Repurchase Agreements—0.1% | |
Fixed Income Clearing Corp. Repurchase Agreement dated 06/30/11 at 0.010% to be repurchased at $3,496,001 on 07/01/11 collateralized by $3,490,000 Federal Home Loan Bank at 1.750% due 8/22/12 with a value of $3,568,525. | | $ | 3,496,000 | | | $ | 3,496,000 | |
| | | | | | | | |
| | | | | | | 3,496,000 | |
| | | | | | | | |
|
| U.S. Government & Agency Discount Notes—0.1% | |
U.S. Treasury Bills
0.000%, 08/18/11 (d) | | | 2,480,000 | | | | 2,479,858 | |
0.000%, 09/22/11 (d) | | | 826,000 | | | | 825,924 | |
| | | | | | | | |
| | | | | | | 3,305,782 | |
| | | | | | | | |
Total Short-Term Investments
(Cost $72,781,052) | | | | | | | 72,781,052 | |
| | | | | | | | |
Total Investments—145.4%
(Cost $4,786,067,026#) | | | | | | | 4,828,480,092 | |
Other Assets and Liabilities
(net)—(45.4)% | | | | | | | (1,506,747,466 | ) |
| | | | | | | | |
| Net Assets—100.0% | | | | | | $ | 3,321,732,626 | |
| | | | | | | | |
| # | As of June 30, 2011, the aggregate cost of investments for federal income tax purposes was $4,786,067,026. The aggregate unrealized appreciation and depreciation of investments were $62,991,835 and $(21,298,769), respectively, resulting in net unrealized appreciation of $41,693,066 for federal income tax purposes. |
| (a) | Variable or floating rate security. The stated rate represents the rate at June 30, 2011. Maturity date shown for callable securities reflects the earliest possible call date. |
| (b) | All or a portion of the security was pledged as collateral against open futures contracts. |
| (c) | Security is in default and/or issuer is in bankruptcy. |
| (d) | Zero coupon bond—Interest rate represents current yield to maturity. |
| (e) | Security was valued in good faith under procedures approved by the Board of Trustees. |
| (144A)—Securities | exempt from registration under Rule 144A of the Securities Act of 1933. These securities may be resold in transactions exempt from registration, normally to qualified institutional buyers. As of June 30, 2011, the market value of 144A securities was $902,488,071, which was 27.2% of net assets. |
Forward Sales Commitments
| | | | | | | | | | | | |
Security Sold Short | | Counterparty | | | Interest Rate | | Maturity | | Proceeds | | Value |
| | | | | |
Fannie Mae Pool | | | Goldman Sachs & Co. | | | 5.500% | | TBA | | $(5,412,500) | | $(5,396,875) |
See accompanying notes to financial statements.
16
MET INVESTORS SERIES TRUST
| | |
PIMCO Inflation Protected Bond Portfolio | | |
Schedule of Investments as of June 30, 2011 (Unaudited)
FAIR VALUE HIERARCHY
Accounting principles generally accepted in the United States of America (“GAAP”) defines fair market value as the price that the Portfolio would receive to sell an asset or pay to transfer a liability in an orderly transaction between market participants at the measurement date. It establishes a fair value hierarchy that prioritizes inputs to valuation methods and requires disclosure of the fair value hierarchy that segregates fair value measurements into three levels. Levels 1, 2 and 3 of the fair value hierarchy are defined as follows:
Level 1 - unadjusted quoted prices in active markets for identical investments
Level 2 - other significant observable inputs (including, but not limited to, unadjusted quoted prices for similar investments in markets that are either active or inactive; inputs other than quoted prices that are observable such as interest rates, yield curves, volatilities, prepayment speeds, loss severities, credit risks, default rates, etc.)
Level 3 - significant unobservable inputs based on the best information available in the circumstances, to the extent observable inputs are unavailable (including the Portfolio’s own assumptions in determining the fair value of investments)
The inputs or methodologies used for valuing investments are not necessarily an indication of the risk associated with investing in them. For a change in the methodology used, transfers between levels will be recognized as of the beginning of the reporting period. Information on transfers between Level 1 and Level 2 deemed significant, if any, will be disclosed following the valuation table below. For the six months ended June 30, 2011, there were no transfers between Levels 1 and 2. A reconciliation of Level 3 securities, if any, will also be disclosed following the valuation table. For more information about the Portfolio’s policy regarding the valuation of investments, please refer to Notes to Financial Statements.
The following table summarizes the fair value hierarchy of the Portfolio’s investments as of June 30, 2011:
| | | | | | | | | | | | | | | | |
| Description | | Level 1 | | | Level 2 | | | Level 3 | | | Total | |
Total U.S. Treasury & Government Agencies* | | $ | — | | | $ | 2,883,534,391 | | | $ | — | | | $ | 2,883,534,391 | |
Domestic Bonds & Debt Securities | | | | | | | | | | | | | | | | |
Beverages | | | — | | | | 11,638,253 | | | | — | | | | 11,638,253 | |
Capital Markets | | | — | | | | 156,094,012 | | | | — | | | | 156,094,012 | |
Chemicals | | | — | | | | 11,049,157 | | | | — | | | | 11,049,157 | |
Commercial Banks | | | — | | | | 504,377,984 | | | | — | | | | 504,377,984 | |
Computers & Peripherals | | | — | | | | 5,333,325 | | | | — | | | | 5,333,325 | |
Consumer Finance | | | — | | | | 63,010,216 | | | | — | | | | 63,010,216 | |
Diversified Financial Services | | | — | | | | 107,617,423 | | | | 1,553,949 | | | | 109,171,372 | |
Diversified Telecommunication Services | | | — | | | | 5,911,308 | | | | — | | | | 5,911,308 | |
Health Care Providers & Services | | | — | | | | 10,422,594 | | | | — | | | | 10,422,594 | |
Household Durables | | | — | | | | 9,999,336 | | | | — | | | | 9,999,336 | |
Insurance | | | — | | | | 18,608,160 | | | | — | | | | 18,608,160 | |
Media | | | — | | | | 13,945,750 | | | | — | | | | 13,945,750 | |
Oil, Gas & Consumable Fuels | | | — | | | | 50,565,041 | | | | — | | | | 50,565,041 | |
Thrifts & Mortgage Finance | | | — | | | | 29,769,933 | | | | — | | | | 29,769,933 | |
Total Domestic Bonds & Debt Securities | | | — | | | | 998,342,492 | | | | 1,553,949 | | | | 999,896,441 | |
Total Foreign Bonds & Debt Securities* | | | — | | | | 331,952,248 | | | | — | | | | 331,952,248 | |
Mortgage-Backed Securities | | | | | | | | | | | | | | | | |
Collateralized-Mortgage Obligation | | | — | | | | 187,009,132 | | | | 12,328,810 | | | | 199,337,942 | |
Commercial Mortgage-Backed Securities | | | — | | | | 91,849,881 | | | | — | | | | 91,849,881 | |
Total Mortgage-Backed Securities | | | — | | | | 278,859,013 | | | | 12,328,810 | | | | 291,187,823 | |
Asset-Backed Securities | | | | | | | | | | | | | | | | |
Asset Backed—Automobile | | | — | | | | 7,631,694 | | | | — | | | | 7,631,694 | |
Asset Backed—Credit Card | | | — | | | | 25,148,228 | | | | — | | | | 25,148,228 | |
Asset Backed—Home Equity | | | — | | | | 6,911,854 | | | | — | | | | 6,911,854 | |
Asset Backed—Other | | | — | | | | 97,426,261 | | | | 4,307,340 | | | | 101,733,601 | |
Asset Backed—Student Loan | | | — | | | | 71,990,366 | | | | — | | | | 71,990,366 | |
Total Asset-Backed Securities | | | — | | | | 209,108,403 | | | | 4,307,340 | | | | 213,415,743 | |
Total Loan Participation* | | | — | | | | 32,006,900 | | | | — | | | | 32,006,900 | |
See accompanying notes to financial statements.
17
MET INVESTORS SERIES TRUST
| | |
PIMCO Inflation Protected Bond Portfolio | | |
Schedule of Investments as of June 30, 2011 (Unaudited)
FAIR VALUE HIERARCHY—(Continued)
| | | | | | | | | | | | | | | | |
| Description | | Level 1 | | | Level 2 | | | Level 3 | | | Total | |
Municipals | | $ | — | | | $ | 2,101,562 | | | $ | — | | | $ | 2,101,562 | |
Total Convertible Preferred Stock* | | | 954,000 | | | | — | | | | — | | | | 954,000 | |
Purchased Options | | | — | | | | 649,932 | | | | — | | | | 649,932 | |
Total Short-Term Investments* | | | — | | | | 72,781,052 | | | | — | | | | 72,781,052 | |
Total Investments | | $ | 954,000 | | | $ | 4,809,335,993 | | | $ | 18,190,099 | | | $ | 4,828,480,092 | |
| | | | | | | | | | | | | | | | | |
Forward Contracts** | | | | | | | | | | | | | | | | |
Forward Contracts to Buy Appreciation | | $ | — | | | $ | 4,520,331 | | | $ | — | | | $ | 4,520,331 | |
Forward Contracts to Buy (Depreciation) | | | — | | | | (218,092 | ) | | | — | | | | (218,092 | ) |
Forward Contracts to Sell Appreciation | | | — | | | | 285,081 | | | | — | | | | 285,081 | |
Forward Contracts to Sell (Depreciation) | | | — | | | | (7,269,966 | ) | | | — | | | | (7,269,966 | ) |
Total Forward Contracts | | $ | — | | | $ | (2,682,646 | ) | | $ | — | | | $ | (2,682,646 | ) |
Futures Contracts** | | | | | | | | | | | | | | | | |
Futures Contracts Long (Appreciation) | | $ | 1,591,044 | | | $ | — | | | $ | — | | | $ | 1,591,044 | |
Futures Contracts Long (Depreciation) | | | (226,727 | ) | | | — | | | | — | | | | (226,727 | ) |
Total Futures Contracts | | $ | 1,364,317 | | | $ | — | | | $ | — | | | $ | 1,364,317 | |
Forward Sales Commitments | | $ | — | | | $ | (5,396,875 | ) | | $ | — | | | $ | (5,396,875 | ) |
Written Options** | | | | | | | | | | | | | | | | |
Call Written Options | | $ | — | | | $ | (2,455,595 | ) | | $ | — | | | $ | (2,455,595 | ) |
Put Written Options | | | — | | | | (1,410,807 | ) | | | — | | | | (1,410,807 | ) |
Total Written Options | | $ | — | | | $ | (3,866,402 | ) | | $ | — | | | $ | (3,866,402 | ) |
SWAP Contracts** | | | | | | | | | | | | | | | | |
Credit Default Swap Buy Protection Appreciation | | $ | — | | | $ | 38,455 | | | $ | — | | | $ | 38,455 | |
Credit Default Swap Buy Protection (Depreciation) | | | — | | | | (563,288 | ) | | | — | | | | (563,288 | ) |
Credit Default Swap Sell Protection Appreciation | | | — | | | | 462,025 | | | | — | | | | 462,025 | |
Credit Default Swap Sell Protection (Depreciation) | | | — | | | | (959,717 | ) | | | — | | | | (959,717 | ) |
Interest Rate Swap Appreciation | | | — | | | | 7,184,663 | | | | — | | | | 7,184,663 | |
Interest Rate Swap (Depreciation) | | | — | | | | (1,495,341 | ) | | | — | | | | (1,495,341 | ) |
Total SWAP Contracts | | $ | — | | | $ | 4,666,797 | | | $ | — | | | $ | 4,666,797 | |
| | | | | | | | | | | | | | | | | |
| * | | See Schedule of Investments for additional detailed categorizations. |
| ** | | Derivative instruments such as forwards, futures contracts and swap contracts are valued on the unrealized appreciation/depreciation on the instrument. Written options are presented at value. |
Following is a reconciliation of Level 3 assets for which significant unobservable inputs were used to determine fair value:
| | | | | | | | | | | | | | | | | | | | | | | | | | | | | | | | |
Investments
in Securities | | Balance as of
December 31,
2010 | | | Realized
Gain | | | Change in
Unrealized
Appreciation/
(Depreciation) | | | Net
Purchases | | | Net
Sales | | | Net
Transfers
out of
Level 3 | | | Balance
as of
June 30,
2011 | | | Change in
Unrealized
Appreciation/
(Depreciation)
for Investments
still held at
June 30, 2011 | |
U.S. Government & Agency Obligations | | $ | 13,393,721 | | | $ | — | | | $ | 2,091 | | | $ | (13,395,812 | ) | | $ | — | | | $ | — | | | $ | — | | | $ | — | |
Domestic Bonds and Debt Securities | | | | | | | | | | | | | | | | | | | | | | | | | | | | | | | | |
Commercial Banks | | | 877,231 | | | | — | | | | — | | | | — | | | | | | | | (877,231 | ) | | | — | | | | — | |
Diversified Financial Services | | | 1,564,016 | | | | 441 | | | | (1,472 | ) | | | — | | | | (9,036 | ) | | | — | | | | 1,553,949 | | | | (1,471 | ) |
Asset Backed Securities | | | | | | | | | | | | | | | | | | | | | | | | | | | | | | | | |
Asset Backed-Other | | | 21,949,465 | | | | — | | | | 76,945 | | | | 3,365,946 | | | | — | | | | (21,085,016 | ) | | | 4,307,340 | | | | 76,945 | |
Mortgage-Backed Securities | | | | | | | | | | | | | | | | | | | | | | | | | | | | | | | | |
Collateralized-Mortgage Obligation | | | 13,066,747 | | | | 50,875 | | | | 56,891 | | | | 12,246,703 | | | | (3,700,000 | ) | | | (9,392,406 | ) | | | 12,328,810 | | | | 82,107 | |
| | | | | | | | | | | | | | | | | | | | | | | | | | | | | | | | |
Total | | $ | 50,851,180 | | | $ | 51,316 | | | $ | 134,455 | | | $ | 2,216,837 | | | $ | (3,709,036 | ) | | $ | (31,354,653 | ) | | $ | 18,190,099 | | | $ | 157,581 | |
| | | | | | | | | | | | | | | | | | | | | | | | | | | | | | | | |
Domestic Bonds and Debt Securities in the amount of $877,231, Asset Backed Securities in the amount of $21,085,016 and Mortgage-Backed Securities in the amount of $9,392,406 were transferred out of Level 3 due to the initiation of a vendor or broker providing prices.
See accompanying notes to financial statements.
18
MET INVESTORS SERIES TRUST
| | |
PIMCO Inflation Protected Bond Portfolio | | |
Statement of Assets and Liabilities
June 30, 2011 (Unaudited)
| | | | |
| Assets | | | | |
Investments at value (a) | | $ | 4,824,984,092 | |
Repurchase Agreement | | | 3,496,000 | |
Cash | | | 166,965 | |
Cash denominated in foreign currencies (b) | | | 8,117,681 | |
Collateral for cash collateral | | | 316,166 | |
Receivable for investments sold | | | 72,767,560 | |
Receivable for shares sold | | | 1,117,662 | |
Net variation margin on financial futures contracts | | | 90,143 | |
Interest receivable | | | 22,248,379 | |
Swap interest receivable | | | 98,389 | |
Swap premium paid | | | 8,776,429 | |
Unrealized appreciation on swap contracts | | | 7,685,143 | |
Unrealized appreciation on forward currency contracts | | | 4,805,412 | |
| | | | |
Total assets | | | 4,954,670,021 | |
| | | | |
| Liabilities | | | | |
Payables for: | | | | |
Investments purchased | | | 1,595,951,451 | |
Payable for cash collateral | | | 11,720,000 | |
Shares redeemed | | | 1,579,354 | |
Forward sales commitments, at value | | | 5,396,875 | |
Unrealized depreciation on forward currency contracts | | | 7,488,058 | |
Unrealized depreciation on swaps | | | 3,018,346 | |
Outstanding written options (c) | | | 3,866,402 | |
Swap interest | | | 12,853 | |
Swap premium received | | | 2,026,884 | |
Accrued Expenses: | | | | |
Management fees | | | 1,271,718 | |
Distribution and service fees - Class B | | | 349,560 | |
Distribution and service fees - Class E | | | 6,891 | |
Administration fees | | | 14,011 | |
Custodian and accounting fees | | | 59,310 | |
Deferred trustees’ fees | | | 20,516 | |
Other expenses | | | 155,166 | |
| | | | |
Total liabilities | | | 1,632,937,395 | |
| | | | |
| Net Assets | | $ | 3,321,732,626 | |
| | | | |
| Net Assets Represented by | | | | |
Paid in surplus | | $ | 3,219,356,118 | |
Accumulated net realized gain | | | 10,092,255 | |
Unrealized appreciation on investments, futures contracts, written options contracts, short sales, swap contracts and foreign currency transactions | | | 46,523,395 | |
Undistributed net investment income | | | 45,760,858 | |
| | | | |
Net Assets | | $ | 3,321,732,626 | |
| Net Assets | | | | |
Class A | | $ | 1,556,676,870 | |
Class B | | | 1,709,472,055 | |
Class E | | | 55,583,701 | |
| | | | |
| Capital Shares Outstanding* | | | | |
Class A | | | 138,376,724 | |
Class B | | | 152,633,216 | |
Class E | | | 4,958,816 | |
| | | | |
| Net Asset Value, Offering Price and Redemption Price Per Share | | | | |
Class A | | $ | 11.25 | |
Class B | | | 11.20 | |
Class E | | | 11.21 | |
| | | | |
| * | | The Portfolio is authorized to issue an unlimited number of shares. |
| (a) | | Identified cost of investments, excluding repurchase agreement, was $4,782,571,026. |
| (b) | | Identified cost of cash denominated in foreign currencies was $8,106,533. |
| (c) | | Premiums received on written options were $5,333,330. |
Statement of Operations
Six Months Ended June 30, 2011 (Unaudited)
| | | | |
| Investment Income | | | | |
Dividends (a) | | $ | 24,918 | |
Interest | | | 53,975,633 | |
| | | | |
Total investment income | | | 54,000,551 | |
| | | | |
| Expenses | | | | |
Management fees | | | 7,007,610 | |
Administration fees | | | 74,375 | |
Custodian and accounting fees | | | 212,680 | |
Distribution and service fees - Class B | | | 1,941,683 | |
Distribution and service fees - Class E | | | 39,747 | |
Audit and tax services | | | 34,161 | |
Legal | | | 20,801 | |
Trustees’ fees and expenses | | | 15,868 | |
Shareholder reporting | | | 65,821 | |
Insurance | | | 8,571 | |
Miscellaneous | | | 11,384 | |
| | | | |
Total expenses | | | 9,432,701 | |
| | | | |
Net investment income | | | 44,567,850 | |
| | | | |
| Net Realized and Unrealized Gain (Loss) on Investments, Futures Contracts, Written Options Contracts, Forward Sales Commitments, Swaps Contracts and Foreign Currency Transactions | | | | |
Net realized gain (loss) on: | | | | |
Investments | | | 52,895,727 | |
Futures contracts | | | 331,652 | |
Written options contracts | | | (1,169,379 | ) |
Swap contracts | | | 528,793 | |
Foreign currency transactions | | | (3,786,648 | ) |
| | | | |
Net realized gain on investments, futures contracts, written options contracts, swap contracts and foreign currency transactions | | | 48,800,145 | |
| | | | |
Net change in unrealized appreciation (depreciation) on: | | | | |
Investments | | | 56,538,666 | |
Futures contracts | | | 1,348,530 | |
Written options contracts | | | 4,986,959 | |
Forward sales commitments | | | 15,625 | |
Swap contracts | | | (419,589 | ) |
Foreign currency transactions | | | (2,958,564 | ) |
| | | | |
Net change in unrealized appreciation on investments, futures contracts, written options contracts, forward sales commitments, swap contracts and foreign currency transactions | | | 59,511,627 | |
| | | | |
Net realized and unrealized gain on investments, futures contracts, written options contracts, forward sales commitments, swap contracts and foreign currency transactions | | | 108,311,772 | |
| | | | |
| Net Increase in Net Assets from Operations | | $ | 152,879,622 | |
| | | | |
| (a) | | Net of foreign withholding taxes of $8,832. |
See accompanying notes to financial statements.
19
MET INVESTORS SERIES TRUST
| | |
PIMCO Inflation Protected Bond Portfolio | | |
Statements of Changes in Net Assets
June 30, 2011
| | | | | | | | |
| | | Six Months
Ended
June 30, 2011
(Unaudited) | | | Year Ended
December 31,
2010 | |
| Increase (Decrease) in Net Assets: | | | | | | | | |
| Operations | | | | | | | | |
Net investment income | | $ | 44,567,850 | | | $ | 30,916,090 | |
Net realized gain on investments, futures contracts, written options contracts, swap contracts and foreign currency transactions | | | 48,800,145 | | | | 171,981,436 | |
Net change in unrealized appreciation (depreciation) on investments, futures contracts, written options contracts, forward sales commitments, swap contracts and foreign currency transactions | | | 59,511,627 | | | | (24,023,226 | ) |
| | | | | | | | |
Net increase in net assets resulting from operations | | | 152,879,622 | | | | 178,874,300 | |
| | | | | | | | |
| Distributions to Shareholders | | | | | | | | |
From net investment income | | | | | | | | |
Class A | | | (24,956,696 | ) | | | (31,738,835 | ) |
Class B | | | (26,951,824 | ) | | | (26,604,062 | ) |
Class E | | | (908,972 | ) | | | (1,258,253 | ) |
From net realized gains | | | | | | | | |
Class A | | | (64,106,474 | ) | | | (33,191,843 | ) |
Class B | | | (76,807,887 | ) | | | (29,719,980 | ) |
Class E | | | (2,535,191 | ) | | | (1,383,067 | ) |
| | | | | | | | |
Net decrease in net assets resulting from distributions | | | (196,267,044 | ) | | | (123,896,040 | ) |
| | | | | | | | |
Net increase in net assets from capital share transactions | | | 647,256,268 | | | | 482,747,548 | |
| | | | | | | | |
| Net Increase in Net Assets | | | 603,868,846 | | | | 537,725,808 | |
Net assets at beginning of period | | | 2,717,863,780 | | | | 2,180,137,972 | |
| | | | | | | | |
Net assets at end of period | | $ | 3,321,732,626 | | | $ | 2,717,863,780 | |
| | | | | | | | |
Undistributed net investment income at end of period | | $ | 45,760,858 | | | $ | 54,010,500 | |
| | | | | | | | |
| | | | | | | | | | | | | | | | |
| Other Information: | | | | | | | | | | | | | | | | |
| Capital Shares | | | | | | | | | | | | | | | | |
| | | | |
Transactions in capital shares were as follows: | | | | | | | | | | | | | | | | |
| | | Six Months Ended
June 30, 2011
(Unaudited) | | | Year Ended
December 31, 2010 | |
| | | Shares | | | Value | | | Shares | | | Value | |
| Class A | | | | | | | | | | | | | | | | |
Sales | | | 35,374,916 | | | $ | 396,827,442 | | | | 21,989,311 | | | $ | 248,415,204 | |
Reinvestments | | | 8,045,454 | | | | 89,063,170 | | | | 5,956,943 | | | | 64,930,678 | |
Redemptions | | | (16,414,759 | ) | | | (184,154,283 | ) | | | (20,445,750 | ) | | | (227,961,144 | ) |
| | | | | | | | | | | | | | | | |
Net increase | | | 27,005,611 | | | $ | 301,736,329 | | | | 7,500,504 | | | $ | 85,384,738 | |
| | | | | | | | | | | | | | | | |
| Class B | | | | | | | | | | | | | | | | |
Sales | | | 27,567,727 | | | $ | 313,448,034 | | | | 42,388,465 | | | $ | 479,649,156 | |
Reinvestments | | | 9,407,045 | | | | 103,759,711 | | | | 5,186,376 | | | | 56,324,042 | |
Redemptions | | | (6,633,023 | ) | | | (75,224,425 | ) | | | (12,571,794 | ) | | | (141,714,866 | ) |
| | | | | | | | | | | | | | | | |
Net increase | | | 30,341,749 | | | $ | 341,983,320 | | | | 35,003,047 | | | $ | 394,258,332 | |
| | | | | | | | | | | | | | | | |
| Class E | | | | | | | | | | | | | | | | |
Sales | | | 483,946 | | | $ | 5,479,536 | | | | 1,048,545 | | | $ | 11,873,924 | |
Reinvestments | | | 312,254 | | | | 3,444,164 | | | | 243,216 | | | | 2,641,320 | |
Redemptions | | | (474,627 | ) | | | (5,387,081 | ) | | | (1,010,335 | ) | | | (11,410,766 | ) |
| | | | | | | | | | | | | | | | |
Net increase | | | 321,573 | | | $ | 3,536,619 | | | | 281,426 | | | $ | 3,104,478 | |
| | | | | | | | | | | | | | | | |
Increase derived from capital shares transactions | | | | | | $ | 647,256,268 | | | | | | | $ | 482,747,548 | |
| | | | | | | | | | | | | | | | |
See accompanying notes to financial statements.
20
MET INVESTORS SERIES TRUST
| | |
PIMCO Inflation Protected Bond Portfolio | | |
Financial Highlights
| | | | | | | | | | | | | | | | | | | | | | | | |
| Selected per share data | | | | | | | | | | | | | | | | | | |
| |
| | | Class A | |
| | | Six Months Ended
June 30, 2011
(Unaudited) | | | Year Ended December 31, | |
| | | | 2010 | | | 2009 | | | 2008 | | | 2007 | | | 2006 | |
| Net Asset Value, Beginning of Period | | $ | 11.43 | | | $ | 11.17 | | | $ | 9.84 | | | $ | 10.98 | | | $ | 10.08 | | | $ | 10.78 | |
| | | | | | | | | | | | | | | | | | | | | | | | |
| Income (Loss) from Investment Operations | | | | | | | | | | | | | | | | | | | | | | | | |
Net Investment Income(a) | | | 0.21 | | | | 0.16 | | | | 0.29 | | | | 0.40 | | | | 0.49 | | | | 0.43 | |
Net Realized and Unrealized Gain (Loss) on Investments | | | 0.39 | | | | 0.71 | | | | 1.46 | | | | (1.09 | ) | | | 0.65 | | | | (0.40 | ) |
| | | | | | | | | | | | | | | | | | | | | | | | |
Total From Investment Operations | | | 0.60 | | | | 0.87 | | | | 1.75 | | | | (0.69 | ) | | | 1.14 | | | | 0.03 | |
| | | | | | | | | | | | | | | | | | | | | | | | |
| Less Distributions | | | | | | | | | | | | | | | | | | | | | | | | |
Distributions from Net Investment Income | | | (0.22 | ) | | | (0.30 | ) | | | (0.42 | ) | | | (0.43 | ) | | | (0.24 | ) | | | (0.43 | ) |
Distributions from Net Realized Capital Gains | | | (0.56 | ) | | | (0.31 | ) | | | — | | | | (0.02 | ) | | | — | | | | (0.30 | ) |
| | | | | | | | | | | | | | | | | | | | | | | | |
Total Distributions | | | (0.78 | ) | | | (0.61 | ) | | | (0.42 | ) | | | (0.45 | ) | | | (0.24 | ) | | | (0.73 | ) |
| | | | | | | | | | | | | | | | | | | | | | | | |
| Net Asset Value, End of Period | | $ | 11.25 | | | $ | 11.43 | | | $ | 11.17 | | | $ | 9.84 | | | $ | 10.98 | | | $ | 10.08 | |
| | | | | | | | | | | | | | | | | | | | | | | | |
| Total Return (%) | | | 5.31 | | | | 8.00 | | | | 18.37 | | | | (6.88 | ) | | | 11.08 | | | | 0.65 | |
| | | | | | |
| Ratios/Supplemental Data | | | | | | | | | | | | | | | | | | | | | | | | |
Ratio of Expenses to Average Net Assets (%) | | | 0.50 | * | | | 0.51 | | | | 0.53 | | | | 0.53 | | | | 0.55 | | | | 0.58 | |
Ratio of Net Expenses to Average Net Assets (%)(c) | | | 0.50 | * | | | 0.51 | | | | 0.53 | | | | 0.53 | | | | 0.55 | | | | 0.58 | |
Ratio of Net Investment Income to Average Net Assets (%) | | | 3.66 | * | | | 1.38 | | | | 2.78 | | | | 3.74 | | | | 4.78 | | | | 4.21 | |
Portfolio Turnover Rate (%) | | | 207.3 | | | | 526.8 | | | | 667.7 | | | | 1,143.3 | | | | 945.3 | | | | 851.3 | |
Net Assets, End of Period (in millions) | | $ | 1,556.7 | | | $ | 1,273.4 | | | $ | 1,160.3 | | | $ | 824.7 | | | $ | 857.5 | | | $ | 885.5 | |
| | | | | | | | | | | | | | | | | | | | | | | | |
| | | Class B | |
| | | Six Months Ended
June 30, 2011
(Unaudited) | | | Year Ended December 31, | |
| | | | 2010 | | | 2009 | | | 2008 | | | 2007 | | | 2006 | |
| Net Asset Value, Beginning of Period | | $ | 11.38 | | | $ | 11.13 | | | $ | 9.80 | | | $ | 10.96 | | | $ | 10.06 | | | $ | 10.76 | |
| | | | | | | | | | | | | | | | | | | | | | | | |
| Income (Loss) from Investment Operations | | | | | | | | | | | | | | | | | | | | | | | | |
Net Investment Income(a) | | | 0.19 | | | | 0.13 | | | | 0.27 | | | | 0.37 | | | | 0.46 | | | | 0.40 | |
Net Realized and Unrealized Gain (Loss) on Investments | | | 0.39 | | | | 0.71 | | | | 1.45 | | | | (1.10 | ) | | | 0.66 | | | | (0.41 | ) |
| | | | | | | | | | | | | | | | | | | | | | | | |
Total From Investment Operations | | | 0.58 | | | | 0.84 | | | | 1.72 | | | | (0.73 | ) | | | 1.12 | | | | (0.01 | ) |
| | | | | | | | | | | | | | | | | | | | | | | | |
| Less Distributions | | | | | | | | | | | | | | | | | | | | | | | | |
Distributions from Net Investment Income | | | (0.20 | ) | | | (0.28 | ) | | | (0.39 | ) | | | (0.41 | ) | | | (0.22 | ) | | | (0.39 | ) |
Distributions from Net Realized Capital Gains | | | (0.56 | ) | | | (0.31 | ) | | | — | | | | (0.02 | ) | | | — | | | | (0.30 | ) |
| | | | | | | | | | | | | | | | | | | | | | | | |
Total Distributions | | | (0.76 | ) | | | (0.59 | ) | | | (0.39 | ) | | | (0.43 | ) | | | (0.22 | ) | | | (0.69 | ) |
| | | | | | | | | | | | | | | | | | | | | | | | |
| Net Asset Value, End of Period | | $ | 11.20 | | | $ | 11.38 | | | $ | 11.13 | | | $ | 9.80 | | | $ | 10.96 | | | $ | 10.06 | |
| | | | | | | | | | | | | | | | | | | | | | | | |
| Total Return (%) | | | 5.13 | | | | 7.76 | | | | 18.05 | | | | (7.06 | ) | | | 10.80 | | | | 0.39 | |
| | | | | | |
| Ratios/Supplemental Data | | | | | | | | | | | | | | | | | | | | | | | | |
Ratio of Expenses to Average Net Assets (%) | | | 0.75 | * | | | 0.76 | | | | 0.78 | | | | 0.78 | | | | 0.80 | | | | 0.82 | |
Ratio of Net Expenses to Average Net Assets (%)(c) | | | 0.75 | * | | | 0.76 | | | | 0.78 | | | | 0.78 | | | | 0.80 | | | | 0.82 | |
Ratio of Net Investment Income to Average Net Assets (%) | | | 3.40 | * | | | 1.13 | | | | 2.55 | | | | 3.44 | | | | 4.52 | | | | 3.93 | |
Portfolio Turnover Rate (%) | | | 207.3 | | | | 526.8 | | | | 667.7 | | | | 1,143.3 | | | | 945.3 | | | | 851.3 | |
Net Assets, End of Period (in millions) | | $ | 1,709.5 | | | $ | 1,391.6 | | | $ | 971.4 | | | $ | 542.9 | | | $ | 401.6 | | | $ | 367.0 | |
Please see following page for Financial Highlights footnote legend.
See accompanying notes to financial statements.
21
MET INVESTORS SERIES TRUST
| | |
PIMCO Inflation Protected Bond Portfolio | | |
Financial Highlights
| | | | | | | | | | | | | | | | | | | | | | | | |
| Selected per share data | | | | | | | | | | | | | | | | | | |
| |
| | | Class E | |
| | | Six Months Ended
June 30, 2011
(Unaudited) | | | Year Ended December 31, | |
| | | | 2010 | | | 2009 | | | 2008 | | | 2007 | | | 2006(b) | |
| Net Asset Value, Beginning of Period | | $ | 11.39 | | | $ | 11.13 | | | $ | 9.80 | | | $ | 10.96 | | | $ | 10.06 | | | $ | 9.92 | |
| | | | | | | | | | | | | | | | | | | | | | | | |
| Income (Loss) from Investment Operations | | | | | | | | | | | | | | | | | | | | | | | | |
Net Investment Income(a) | | | 0.19 | | | | 0.14 | | | | 0.28 | | | | 0.37 | | | | 0.48 | | | | 0.29 | |
Net Realized and Unrealized Gain (Loss) on Investments | | | 0.39 | | | | 0.71 | | | | 1.45 | | | | (1.09 | ) | | | 0.65 | | | | (0.15 | ) |
| | | | | | | | | | | | | | | | | | | | | | | | |
Total From Investment Operations | | | 0.58 | | | | 0.85 | | | | 1.73 | | | | (0.72 | ) | | | 1.13 | | | | 0.14 | |
| | | | | | | | | | | | | | | | | | | | | | | | |
| Less Distributions | | | | | | | | | | | | | | | | | | | | | | | | |
Distributions from Net Investment Income | | | (0.20 | ) | | | (0.28 | ) | | | (0.40 | ) | | | (0.42 | ) | | | (0.23 | ) | | | — | |
Distributions from Net Realized Capital Gains | | | (0.56 | ) | | | (0.31 | ) | | | — | | | | (0.02 | ) | | | — | | | | — | |
| | | | | | | | | | | | | | | | | | | | | | | | |
Total Distributions | | | (0.76 | ) | | | (0.59 | ) | | | (0.40 | ) | | | (0.44 | ) | | | (0.23 | ) | | | — | |
| | | | | | | | | | | | | | | | | | | | | | | | |
| Net Asset Value, End of Period | | $ | 11.21 | | | $ | 11.39 | | | $ | 11.13 | | | $ | 9.80 | | | $ | 10.96 | | | $ | 10.06 | |
| | | | | | | | | | | | | | | | | | | | | | | | |
| Total Return (%) | | | 5.17 | | | | 7.90 | | | | 18.15 | | | | (6.92 | ) | | | 10.93 | | | | 1.41 | |
| | | | | | |
| Ratios/Supplemental Data | | | | | | | | | | | | | | | | | | | | | | | | |
Ratio of Expenses to Average Net Assets (%) | | | 0.65 | * | | | 0.66 | | | | 0.68 | | | | 0.68 | | | | 0.71 | | | | 0.75 | * |
Ratio of Net Expenses to Average Net Assets (%)(c) | | | 0.65 | * | | | 0.66 | | | | 0.68 | | | | 0.68 | | | | 0.71 | | | | 0.75 | * |
Ratio of Net Investment Income to Average Net Assets (%) | | | 3.44 | * | | | 1.24 | | | | 2.63 | | | | 3.47 | | | | 4.63 | | | | 4.23 | * |
Portfolio Turnover Rate (%) | | | 207.3 | | | | 526.8 | | | | 667.7 | | | | 1,143.3 | | | | 945.3 | | | | 851.3 | |
Net Assets, End of Period (in millions) | | $ | 55.6 | | | $ | 52.8 | | | $ | 48.5 | | | $ | 38.8 | | | $ | 7.3 | | | $ | 3.3 | |
| (a) | | Per share amounts based on average shares outstanding during the period. |
| (b) | | Commencement of operations—05/01/2006. |
| (c) | | Includes the effects of management fee waivers and expenses reimbursed by the Adviser, if applicable. |
See accompanying notes to financial statements.
22
MET INVESTORS SERIES TRUST
| | |
PIMCO Inflation Protected Bond Portfolio | | |
Notes to Financial Statements—June 30, 2011 (Unaudited)
1. Organization
Met Investors Series Trust (the “Trust”) is organized as a statutory trust under the laws of Delaware, as an open-end management investment company under the Investment Company Act of 1940, as amended (the “1940 Act”). The Trust currently offers fifty-four Portfolios (the “Portfolios”), each of which operates as a distinct investment vehicle of the Trust. The portfolio included in this report is PIMCO Inflation Protected Bond Portfolio (the “Portfolio”), which is diversified. Shares in the Portfolio are not offered directly to the general public and are currently available only to separate accounts established by Metropolitan Life Insurance Companies (“MetLife”) and other affiliated life insurance companies.
The Portfolio has registered four classes of shares: Class A, B, C and E Shares. Class A, B and E Shares are currently offered by the Portfolio. Shares of each Class of the Portfolio represent an equal pro rata interest in the Portfolio and generally give the shareholder the same voting, dividend, liquidation, and other rights. Investment income, realized and unrealized capital gains and losses, the common expenses of the Portfolio and certain Portfolio-level expense reductions, if any, are allocated on a pro rata basis to each Class based on the relative net assets of each Class to the net assets of the Portfolio. Each Class of shares differs in its respective distribution expenses.
2. Significant Accounting Policies
The financial statements have been prepared in conformity with accounting principles generally accepted in the United States of America (“GAAP”) which require management to make estimates and assumptions that affect the reported amounts of assets and liabilities at the date of the financial statements and the reported amounts of income and expenses during the reporting period. Actual results could differ from these estimates. In the preparation of these financial statements, management has evaluated events and transactions subsequent to June 30, 2011 through the date that the financial statements were issued.
The following is a summary of significant accounting policies consistently followed by the Portfolio in the preparation of its financial statements.
Investment Valuation and Fair Value Measurements - Debt securities (other than short term obligations with a remaining maturity of sixty days or less) including corporate, convertible and municipal bonds and notes; U.S. government agencies; U.S. treasury obligations; sovereign issues; bank loans; and non-U.S. bonds are generally valued on the basis of evaluated or composite bid quotations obtained by independent pricing services and/or brokers and dealers selected by MetLife Advisers, LLC (“MLA” or the “Adviser”), an affiliate of MetLife, Inc., or the relevant Subadviser pursuant to authorization of the Board of Trustees of the Portfolio (the “Board”). Such quotations use inputs that are observable including, among other things, issuer details, interest rates, yield curves, prepayment speeds, credit risks/spreads, default rates and quoted prices for similar securities. Securities that use similar valuation techniques and inputs as described above are categorized as Level 2 within the fair value hierarchy.
Mortgage and asset-backed securities are usually issued as separate tranches, or classes, of securities within each deal. These securities are also generally valued on the basis of evaluated or composite bid quotations obtained by independent pricing services and/or brokers and dealers selected by the Adviser or relevant Subadviser pursuant to authorization of the Board. The pricing models for these securities usually consider tranche-level attributes, estimated cash flows for each tranche, market-based yield spreads for each tranche and current market data, and incorporate deal collateral performance, as available. Mortgage and asset-backed securities that use similar valuation techniques and inputs as described above are categorized as Level 2 within the fair value hierarchy.
Short term obligations with a remaining maturity of sixty days or less are valued at amortized cost which approximates fair market value and are categorized as Level 2 within the fair value hierarchy.
Equity securities such as common stock, exchange-traded funds and preferred stock that are traded on a national securities exchange or other exchanges are generally valued at their last sale price on the principal trading market. Equity securities traded on a national securities exchange or other exchanges for which there is no reported sale during the day are valued at the last reported bid price. A security that is listed or traded on more than one exchange is valued at the quotation on the exchange determined to be the primary market for that security by the Board or its delegates. If no closing price is available, then such securities are valued at the last reported bid price. Equity securities traded over-the-counter are generally valued at the last reported sales price. To the extent these securities are actively traded and valuation adjustments are not applied, they are categorized as Level 1 within the fair value hierarchy. Other equity securities traded on inactive markets or valued by reference to similar instruments are categorized as Level 2 within the fair value hierarchy.
Equity securities which are listed on foreign stock exchanges normally are valued at the market closing price, the last sale price on the day the securities are valued or, lacking any sales on such day, at the bid price. Valuation adjustments may be applied to certain equity securities that are solely traded on foreign exchanges closing before the U.S. market to account for the market movement between the close of the foreign exchanges and the close of the U.S. market. The Portfolio may use a systematic fair valuation model provided by an independent third party to value securities principally traded in these foreign markets closing before the U.S. market in order to adjust for possible stale pricing that may occur between the close of these foreign exchanges and the time of the Portfolio valuation. Securities using these valuation adjustments are categorized as Level 2 within the fair value hierarchy.
Investments in registered open-end management investment companies are valued at reported net asset value per share and are categorized as Level 1 within the fair value hierarchy.
23
MET INVESTORS SERIES TRUST
| | |
PIMCO Inflation Protected Bond Portfolio | | |
Notes to Financial Statements—June 30, 2011 (Unaudited)—(Continued)
2. Significant Accounting Policies - continued
Forward foreign currency exchange contracts are valued based on the mean between closing bid and asked prices of the forward currency rates in the London foreign exchange markets on a daily basis as provided by a reliable bank or dealer. These contracts are categorized as Level 2 within the fair value hierarchy.
Options, whether on securities, indices, futures contracts, or otherwise, are valued at the last sales price available as of the close of business on the day of valuation or, if there is no such sale price available, at the bid price. Options on currencies are valued at the spot price each day. These types of options are categorized as Level 1 within the fair value hierarchy. Other options traded on inactive markets where a broker quotation is received or options valued by an evaluated quote provided by an independent pricing vendor are categorized as Level 2 within the fair value hierarchy.
Futures contracts, which are traded on commodity exchanges, are valued at their closing prices as of the close of such exchanges and are categorized as Level 1 within the fair value hierarchy. Futures contracts traded on inactive markets where a broker quotation is received are categorized as Level 2 within the fair value hierarchy. As a general matter, futures contracts are marked-to-market daily.
Options and futures contracts that are traded over-the-counter are generally valued on the basis of broker dealer quotations or pricing service providers who use a series of techniques, including simulation pricing models, to determine the value of the contracts. The pricing models use inputs that are observed from actively quoted markets such as issuer details, indices, spreads, interest rates, curves and exchange rates. These contracts are categorized as Level 2 within the fair value hierarchy.
If no current market value quotation or other observable inputs are readily available or reliable for a security, the fair value of the security will be determined in accordance with procedures approved by and under the general supervision of the Board. The Board has delegated the determination in good faith of the fair value of securities for which current market quotations are not readily available to a Valuation Committee established by the Board. Market quotes and other observable inputs are considered not readily available in circumstances where there is an absence of current or reliable market-based data. In addition, market quotes would be considered not readily available when, due to extraordinary circumstances, the exchanges or markets on which the securities trade, do not open for trading for the entire day and no other market prices are available. When the Portfolio uses fair value pricing, it may take into account any factors it deems appropriate, including significant unobservable inputs. The value of securities used by the Portfolio to calculate its net asset value may differ from quoted or published prices for the same securities. Fair value pricing involves subjective judgments and the fair value determined for a security may be materially different than the value that could be realized upon the sale of that security. These securities are categorized as Level 3 within the fair value hierarchy.
Investment Transactions and Related Investment Income - Portfolio security transactions are recorded on the trade date. Dividend income is recorded on the ex-dividend date or, for certain foreign securities, when notified. Interest income, which includes amortization of premium and accretion of discount on debt securities, is recorded on the accrual basis. Realized gains and losses on investments and unrealized appreciation and depreciation are determined on the identified cost basis, which is the same basis used for federal income tax purposes. Foreign income and foreign capital gains on some foreign securities may be subject to foreign withholding taxes, which are accrued as applicable.
Income Taxes - It is the Portfolio’s policy to comply with the requirements of the Internal Revenue Code of 1986, as amended (the “Code”), and regulations thereunder, applicable to regulated investment companies and to distribute, with respect to each taxable year, all of its taxable income to shareholders. Therefore, no federal income tax provision is required. The Portfolio files U.S. federal and various state tax returns. No income tax returns are currently under examination. The Portfolio’s federal tax returns for the prior three fiscal years remain subject to examination by the Internal Revenue Service.
Dividends and Distributions to Shareholders - The Portfolio records dividends and distributions on the ex-dividend date. Net realized gains from security transactions (if any) are generally distributed annually to shareholders. The timing and characterization of certain income and capital gains distributions are determined in accordance with federal tax regulations that may differ from GAAP. Permanent book and tax basis differences relating to shareholder distributions will result in reclassification between under/over distributed net investment income, accumulated net realized gains/losses and paid in surplus. Book-tax differences are primarily due to futures, options, swap, and forward transactions, foreign currency transactions, deferred trustees’ compensation, paydown, premium amortization, deferred deflation adjustments and losses deferred due to wash sales, as applicable. These adjustments have no impact on net assets or the results of operations.
Foreign Currency Translation - The books and records of the Portfolio are maintained in U.S. dollars. The values of securities, currencies and other assets and liabilities denominated in currencies other than U.S. dollars are translated into U.S. dollars based upon foreign exchange rates prevailing at the end of the period. Purchases and sales of investment securities, income and expenses are translated on the respective dates of such transactions. Since the values of investment securities are presented at the foreign exchange rates prevailing at the end of the period, it is not practical to isolate that portion of the results of operations arising from changes in exchange rates from that portion of the results of operations reflecting fluctuations arising from changes in market prices of the investment securities. Such fluctuations are included in the net realized and unrealized gain or loss on investments.
24
MET INVESTORS SERIES TRUST
| | |
PIMCO Inflation Protected Bond Portfolio | | |
Notes to Financial Statements—June 30, 2011 (Unaudited)—(Continued)
2. Significant Accounting Policies - continued
Net realized foreign exchange gains or losses arise from activity in forward foreign currency exchange contracts, sales of foreign currency, currency gains or losses realized between the trade and settlement dates on securities transactions, and the difference between the amounts of dividends, interest, and foreign withholding taxes recorded by the Portfolio and the U.S. dollar equivalent of the amounts actually received or paid by the Portfolio. Gains and losses attributable to foreign currency exchange rates on sales of securities are recorded as Net realized gains and losses on investments. Net unrealized foreign exchange gains and losses arise from changes in the value of assets and liabilities, other than investment securities, resulting from changes in foreign exchange rates.
Short Sales - The Portfolio may enter into a “short sale” of securities in circumstances in which, at the time the short position is open, the Portfolio owns an equal amount of the securities sold short or owns preferred stocks or debt securities, convertible or exchangeable without payment of further consideration, into an equal number of securities sold short. This kind of short sale, which is referred to as one “against the box,” may be entered into by the Portfolio to, for example, lock in a sale price for a security the Portfolio does not wish to sell immediately.
The Portfolio may also make short sales of a security it does not own, in anticipation of a decline in the market value of that security. To complete such a transaction, the Portfolio must borrow the security to make delivery to the buyer. The Portfolio then is obligated to replace the security borrowed by purchasing it at market price at the time of replacement. The price at such time may be more or less than the price at which the security was sold by the Portfolio. Until the security is replaced, the Portfolio is required to pay to the lender any dividends or interest which accrue during the period of the loan. To borrow the security, the Portfolio also may be required to pay a premium, which would increase the cost of the security sold. The proceeds of the short sale will be retained by the broker, to the extent necessary to meet margin requirements, until the short position is closed out. Until the Portfolio replaces a borrowed security, the Portfolio will segregate with its custodian, or earmark, cash or other liquid assets at such a level that (i) the amount segregated, or earmarked, plus the amount deposited with the broker as collateral will equal the current value of the security sold short and (ii) the amount segregated plus the amount deposited with the broker as collateral will not be less than the market value of the security at the time it was sold short. The Portfolio will incur a loss as a result of the short sale if the price of the security increases between the date of the short sale and the date on which the Portfolio replaces the borrowed security. The Portfolio will realize a gain if the security declines in price between those dates. This result is the opposite of what one would expect from a cash purchase of a long position in a security. The amount of any gain will be decreased, and the amount of any loss increased, by the amount of any premium, dividends or interest the Portfolio may be required to pay in connection with a short sale. No more than one third of the Portfolio’s net assets will be, when added together: (i) deposited as collateral for the obligation to replace securities borrowed to effect short sales; and (ii) segregated in connection with short sales.
Repurchase Agreements - The Portfolio may enter into repurchase agreements with selected commercial banks and broker-dealers, under which the Portfolio acquires securities as collateral and agrees to resell the securities at an agreed upon time and at an agreed upon price. The Portfolio, through the custodian or a subcustodian, receives delivery of the underlying securities collateralizing repurchase agreements. The Portfolio requires the custodian to take possession, to have legally segregated in the Federal Reserve Book Entry System, or to have segregated within the custodian’s vault, all securities held as collateral for repurchase agreements. It is the Portfolio’s policy that the market value of the collateral be at least equal to 100% of the repurchase price in the case of a repurchase agreement of one-day duration and 102% of the repurchase price in the case of all other repurchase agreements. In connection with transactions in repurchase agreements, if the seller defaults and the value of the collateral declines or if the seller enters an insolvency proceeding, realization of the collateral by the Portfolio may be delayed, limited or wholly denied.
Reverse Repurchase Agreements - The Portfolio may enter into reverse repurchase agreements with qualified institutions to seek to enhance returns. Reverse repurchase agreements involve sales by the Portfolio of securities concurrently with an agreement by the Portfolio to repurchase the same assets at a later date at a fixed price. During the reverse repurchase agreement period, the Portfolio continues to receive principal and interest payments on these securities. The Portfolio will establish a segregated account with its custodian in which it will maintain liquid assets equal in value to its obligations in respect of reverse repurchase agreements. Reverse repurchase agreements involve the risk that the market value of the securities retained by the Portfolio may decline below the price of the securities the Portfolio has sold but is obligated to repurchase under the agreement. In the event the buyer of securities under a reverse repurchase agreement files for bankruptcy or becomes insolvent, the Portfolio’s use of the proceeds of the agreement may be restricted pending a determination by the other party, or its trustee or receiver, whether to enforce the Portfolio’s obligation to repurchase the securities. For the six months ended June 30, 2011, the Portfolio had an outstanding reverse repurchase agreement balance for 77 days. The average amount of borrowings was $18,331,684 and the weighted average interest rate was 0.23%.
Forward Commitments and When-Issued and Delayed-Delivery Securities - The Portfolio may purchase securities on a when-issued or delayed delivery basis and may purchase or sell securities on a forward commitment basis. Settlement of such transactions normally occurs within a month or more after the purchase or sale commitment is made. The Portfolio may purchase securities under such conditions only with the intention of actually acquiring them, but may enter into a separate agreement to sell the securities before the settlement date. Since the value of securities purchased may fluctuate prior to settlement, the Portfolio may be required to pay more at settlement than the security is worth. In addition, the purchaser is not entitled to any of the interest earned prior to settlement. Upon making a commitment to purchase a security on a when-issued, delayed delivery or forward commitment basis, the Portfolio will hold liquid assets in a segregated account at the Portfolio’s
25
MET INVESTORS SERIES TRUST
| | |
PIMCO Inflation Protected Bond Portfolio | | |
Notes to Financial Statements—June 30, 2011 (Unaudited)—(Continued)
2. Significant Accounting Policies - continued
custodian bank worth at least the equivalent of the amount due. The liquid assets will be monitored on a daily basis and adjusted as necessary to maintain the necessary value. As of June 30, 2011, the Portfolio had no forward commitments and when-issued and delayed-delivery securities.
Loan Participations - The Portfolio may invest in loans arranged through private negotiation between one or more financial institutions. The Portfolio’s investment in any such loan may be in the form of a participation in or an assignment of the loan. In connection with purchasing participations, the Portfolio generally will have no right to enforce compliance by the borrower with the terms of the loan agreement relating to the loan, nor any rights of set-off against the borrower and the Portfolio may not benefit directly from any collateral supporting the loan in which it has purchased the participation.
Mortgage Related and Other Asset Backed Securities - The Portfolio may invest in mortgage related or other asset-backed securities. These securities may include mortgage pass-through securities, collateralized mortgaged obligations (“CMOs”), commercial mortgage-backed securities, mortgage dollar rolls, CMO residuals, stripped mortgage backed securities (“SMBS”) and other securities that directly or indirectly represent a participation in, or are secured by or payable from, mortgage loans on real property or other receivables. The value of some mortgage or asset-backed securities may be particularly sensitive to changes in prevailing interest rates. Early repayment of principal on some mortgage-related securities may expose the Portfolio to a lower rate of return upon reinvestment of principal. The value of these securities may fluctuate in response to the market’s perception of the creditworthiness of the issuers. Additionally, although mortgages and mortgage-related securities are generally supported by some form of government or private guarantee and/or insurance, there is no assurance that private guarantors or insurers will meet their obligations.
In one type of SMBS, one class receives all of the interest from the mortgage assets (the interest-only or “IO” class), while the other class will receive all of the principal (the principal-only or “PO” class). Payments received for the IOs are included in interest income on the Statement of Operations of the Portfolio. Because principal will not be received at the maturity of an IO, adjustments are made to the book value of the security until maturity. These adjustments are included in interest income on the Statement of Operations of the Portfolio. Payments received for POs are treated as reductions to the cost and par value of the securities. Details of mortgage related and other asset-backed securities held by the Portfolio are included in the Portfolio’s Schedule of Investments.
The Portfolio may invest a significant portion of its assets in securities of issuers that hold mortgage and asset-backed securities and direct investments in securities backed by commercial and residential mortgage loans and other financial assets. The value and related income of these securities are sensitive to changes in economic conditions, including delinquencies and/or defaults, and may be negatively impacted by increased volatility of market prices and periods of illiquidity.
High Yield Debt Securities - The Portfolio may invest in high yield debt securities, or “junk bonds,” which are securities that are rated below “investment grade” or, if not rated, are of equivalent quality. A portfolio with high yield debt securities generally will be exposed to greater market risk and credit risk than a portfolio that invests only in investment grade debt securities because issuers of high yield debt securities are less secure financially, are more likely to default on their obligations, and their securities are more sensitive to interest rate changes and downturns in the economy. In addition, the secondary market for lower-rated debt securities may not be as liquid as that for more highly rated debt securities. As a result, the Portfolio’s Subadviser may find it more difficult to value lower-rated debt securities or sell them and may have to sell them at prices significantly lower than the values assigned to them by the Portfolio.
3. Investment Management Agreement and Other Transactions with Affiliates
Investment Management Agreement - The Trust is managed by the Adviser. The Trust has entered into a management agreement with the Adviser (the “Management Agreement”) for investment management services in connection with the investment management of the Portfolio. The Adviser is subject to the supervision and direction of the Board and has overall responsibility for the general management and administration of the Trust. The Adviser has entered into a subadvisory agreement with Pacific Investment Management Company LLC (the “Subadviser”) for investment subadvisory services in connection with the investment management of the Portfolio.
Subject to the supervision and direction of the Board, the Adviser supervises the Subadviser and has full discretion with respect to the retention or renewal of the subadvisory agreement. The Adviser pays the Subadviser a fee based on the Portfolio’s average daily net assets.
Under the terms of the Portfolio’s Management Agreement, the Portfolio pays the Adviser a monthly fee based upon annual rates applied to the Portfolio’s average daily net assets as follows:
| | | | | | | | |
Management Fees
earned by the Adviser
for the six months ended
June 30, 2011 | | % per annum | | | Average Daily Net Assets | |
| | |
| $7,007,610 | | | 0.50 | % | | First $ | 1.2 Billion | |
| | |
| | | 0.45 | % | | Over $ | 1.2 Billion | |
26
MET INVESTORS SERIES TRUST
| | |
PIMCO Inflation Protected Bond Portfolio | | |
Notes to Financial Statements—June 30, 2011 (Unaudited)—(Continued)
3. Investment Management Agreement and Other Transactions with Affiliates - continued
Certain officers and trustees of the Trust may also be officers of the Adviser; however, such officers and trustees receive no compensation from the Trust.
Transfer Agency Agreement - MetLife serves as the transfer agent for the Trust. MetLife receives no fees for its services to the Trust under the transfer agency agreement.
Distribution Agreements and Plans - The Trust has distribution agreements with MetLife Investors Distribution Company (“MIDC” or the “Distributor”) in which MIDC serves as the Distributor for the Trust’s Class A, Class B and Class E Shares.
MIDC is a wholly-owned subsidiary of MetLife Investors Group, Inc., an affiliate of the Adviser. The Class B and Class E distribution plans provide that the Trust, on behalf of the Portfolio, may pay annually up to 0.50% and 0.25%, respectively, of the average daily net assets of the Portfolio attributable to its Class B and Class E Shares with respect to activities primarily intended to result in the sale of Class B and Class E Shares. However, under the Class B and Class E distribution agreements, payments to the Distributor for activities pursuant to the Class B and Class E distribution plans are currently limited to payments at an annual rate equal to 0.25% and 0.15% of average daily net assets of the Portfolio attributable to its Class B and Class E Shares, respectively. Amounts incurred by the Portfolio for the six months ended June 30, 2011 are shown as Distribution and service fees in the Statement of Operations.
Under the terms of the Class B and Class E distribution plans and distribution agreements, the Portfolio is authorized to make payments monthly to the Distributor that may be used to pay or reimburse entities providing distribution and shareholder servicing with respect to the Class B and Class E Shares for such entities’ fees or expenses incurred.
Deferred Trustee Compensation - Each Trustee of the Trust who is not currently an employee of the Adviser or any of its affiliates receives compensation from the Trust for his or her service to the Portfolio. A deferred compensation plan (the “Plan”) is available to the Trustees on a voluntary basis. Deferred amounts remain in the Trust until distributed in accordance with the provisions of the Plan. The value of a participating Trustee’s deferral account is based on theoretical investments of deferred amounts, on the normal payment dates, in certain portfolios of the Trust or Metropolitan Series Fund, Inc. as designated by the participating Trustee. Changes in the value of participants’ deferral accounts are reflected as Trustees’ fees and expenses in the Statement of Operations. The portion of the accrued obligations allocated to the Portfolio, if any, under the Plan are reflected as Deferred trustees’ fees in the Statement of Assets and Liabilities.
4. Investment Transactions
Aggregate cost of purchases and proceeds of sales of investment securities, excluding short-term securities, for the six months ended June 30, 2011 were as follows:
| | | | | | | | | | | | | | | | | | | | |
| Purchases | | | Sales | |
| U.S. Government | | Non U.S. Government | | | Foreign Government | | | U.S. Government | | | Non U.S. Government | | | Foreign Government | |
| | | | | |
| $8,532,177,584 | | $ | 820,363,049 | | | $ | 262,607,301 | | | $ | 8,259,613,256 | | | $ | 223,434,375 | | | $ | 263,043,514 | |
5. Investments in Derivative Instruments
Investments in Derivative Instruments - Disclosures about derivative instruments are intended to improve financial reporting for derivative instruments by requiring enhanced disclosure that enables investors to understand how and why a Portfolio uses derivatives, how derivatives are accounted for, and how derivative instruments affect the Portfolio’s results of operations and financial position. Summarized below are the specific types of derivative instruments utilized by the Portfolio.
Forward Foreign Currency Exchange Contracts - The Portfolio may enter into forward foreign currency exchange contracts to hedge its portfolio holdings against the risk of future movements in certain foreign currency exchange rates. When entering into these contracts, the Portfolio agrees to receive or deliver a fixed quantity of foreign currency for an agreed-upon price on an agreed upon future date. These contracts are valued daily and the Portfolio’s net equity therein, representing unrealized gain or loss on the contracts as measured by the difference between the forward foreign exchange rates at the dates of entry into the contracts and the forward foreign exchange rates at the value date, is included in the Statement of Assets and Liabilities. When a contract is closed, the Portfolio recognizes a realized gain or loss equal to the difference between the value of the contract at the time it was opened and the value at the time it was closed.
Realized and unrealized gains and losses on forward foreign currency exchange contracts are included in the Statement of Operations. These contracts involve market and/or credit risk in excess of the amount recognized in the Statement of Assets and Liabilities.
The use of forward foreign currency exchange contracts does not eliminate fluctuations in the underlying prices of the securities of the Portfolio, but it does establish a rate of exchange that can be achieved in the future. Although forward foreign currency exchange contracts to sell limit the
27
MET INVESTORS SERIES TRUST
| | |
PIMCO Inflation Protected Bond Portfolio | | |
Notes to Financial Statements—June 30, 2011 (Unaudited)—(Continued)
5. Investments in Derivative Instruments - continued
risk of loss due to a decline in the value of the currency holdings, they also limit any potential gain that might result should the value of the currency increase. In addition, the Portfolio could be exposed to risks if the counterparties to the contracts are unable to meet the terms of the contracts.
Futures Contracts - The Portfolio may buy and sell futures contracts (on recognized exchanges) as a hedge, to maintain investment exposure to a target asset class or to enhance return. The Portfolio may be subject to fluctuations in equity prices, interest rates, and foreign currency exchange rates in the normal course of pursuing its investment objective. Futures contracts are standardized agreements to buy or sell a security, or deliver a final cash settlement price in connection with an index, interest rate, currency, or other asset, for a set price in the future. The Portfolio must deposit an amount (“initial margin”) equal to a certain percentage of the face value of the futures contract. The initial margin may be in the form of cash or securities which is returned when the Portfolio’s obligations under the contract have been satisfied. Futures contracts are marked-to-market daily and subsequent payments (“variation margin”) are made or received by the Portfolio depending on the daily fluctuations in the value of the futures contract. These amounts are reflected as receivables or payables on the Statement of Assets and Liabilities. Risks of entering into futures contracts (and related options) include the possibility that the market for these instruments may be illiquid and that a change in the value of the contract or option may not correlate perfectly with changes in the value of the underlying securities. Futures contracts are exchange traded and the exchange’s clearinghouse, as counterparty to all exchange traded futures, guarantees the futures contracts against default.
Options Contracts - An option contract purchased by a Portfolio gives the Portfolio the right, but not the obligation, to buy (call) or sell (put) an underlying instrument at a fixed exercise price during a specified period. Call options written by a Portfolio give the holder the right to buy the underlying instrument from the Portfolio at a fixed exercise price; put options written by a Portfolio give the holder the right to sell the underlying instrument to the Portfolio at a fixed exercise price.
The Portfolio may use options to hedge against changes in values of securities the Portfolio owns or expects to purchase, to maintain exposure to the broad equity markets or to enhance return. Writing puts or buying calls tends to increase the Portfolio’s exposure to the underlying instrument and writing calls or buying puts tends to decrease the Portfolio’s exposure to the underlying instrument, and can be used to hedge other Portfolio investments. For options purchased to hedge the Portfolio’s investments, the potential risk to the Portfolio is that the change in value of options contracts may not correspond perfectly to the change in value of the hedged instruments. In addition, losses may arise from changes in the value of the underlying instrument, if there is an illiquid secondary market for the option contract, or if the counterparty to the option contract is unable to perform. The maximum loss for purchased options is limited to the premium initially paid for the option.
The main risk associated with purchasing an option is that the option expires without being exercised. In this case, the option expires worthless and the premium paid for the option is considered the loss. The risk associated with writing a call option is that the Portfolio may forgo the opportunity for a profit if the market value of the underlying instrument increases and the option is exercised, requiring the Portfolio to sell the underlying instrument at a price below its market value. When a Portfolio writes a call option on a security it does not own, its exposure on such an option is theoretically unlimited. The risk in writing a put option is that the Portfolio may incur a loss if the market value of the underlying instrument decreases and the option is exercised, requiring the Portfolio to purchase the underlying instrument at a price above its market value. In addition, the Portfolio risks not being able to enter into a closing transaction for the written option as the result of an illiquid market for the option.
Purchases of put and call options are recorded as investments, the value of which are marked-to-market daily. When a purchased option expires without being exercised, the Portfolio will realize a loss equal to the premium paid. When the Portfolio enters into a closing sale transaction, the Portfolio will realize a gain or loss depending on whether the sales proceeds from the closing sale transaction are greater or less than the premium initially paid for the option. When the Portfolio exercises a put option, it will realize a gain or loss from the sale of the underlying instrument and the proceeds from such sale will be decreased by the premium originally paid for the put option. When the Portfolio exercises a call option, the cost of the security which the Portfolio purchases upon exercise will be increased by the premium originally paid for the call option.
The premium received for a written option is recorded as an asset and an equivalent liability. The liability is marked-to-market daily based on the option’s quoted market price. When an option expires without being exercised or the Portfolio enters into a closing purchase transaction, the Portfolio realizes a gain (or loss if the cost of the closing purchase transaction exceeds the premium received when the option was sold) without regard to any unrealized gain or loss on the underlying instrument and the liability related to such option is eliminated. When a written call option is exercised, the Portfolio realizes a gain or loss from the sale of the underlying instrument.
Swap Agreements - The Portfolio may enter into swap contracts. Swap contracts are derivatives agreements to exchange the return generated by one instrument for the return generated by another instrument. The payment streams are calculated by reference to a specified index and agreed upon notional amount. The term “specified index” includes, but is not limited to, currencies, fixed interest rates, prices and total return on interest rate indices, fixed income indices, stock indices and commodity indices (as well as amounts derived from arithmetic operations on these indices). A Portfolio will usually enter into swaps on a net basis, i.e., the two payment streams are netted out in a cash settlement on the payment
28
MET INVESTORS SERIES TRUST
| | |
PIMCO Inflation Protected Bond Portfolio | | |
Notes to Financial Statements—June 30, 2011 (Unaudited)—(Continued)
5. Investments in Derivative Instruments - continued
date or dates specified in the instrument, with the Portfolio receiving or paying, as the case may be, only the net amount of the two payments. The Portfolio’s obligations under a swap agreement will be accrued daily (offset against any amounts owing to the Portfolio) and any accrued but unpaid net amounts owed to a swap counterparty will be covered by designating the segregation, either on its records or with the Trust’s custodian, of cash or other liquid assets, to avoid any potential leveraging of the Portfolio. The Portfolio may enter into swap transactions with counterparties that are approved by the investment adviser in accordance with guidelines established by the Board. These guidelines provide for a minimum credit rating for each counterparty and various credit enhancement techniques (for example, collateralization of amounts due from counterparties) to limit exposure to counterparties that have lower credit ratings.
The swaps in which the Portfolio may engage may include instruments under which one party pays a single or periodic fixed amount(s) (or premium), and the other party pays periodic amounts based on the movement of a specified index. Swaps do not involve the delivery of securities, other underlying assets, or principal. Accordingly, the risk of loss with respect to swaps is limited to the net amount of payments the Portfolio is contractually obligated to receive. If the other party to a swap defaults, the Portfolio’s risk of loss consists of the net amount of payments that the Portfolio contractually is entitled to receive.
An index swap is an agreement to swap cash flows on a notional amount based on changes in the values of the reference indices.
A currency swap is an agreement to exchange cash flows on a notional amount of two or more currencies based on the relative value differential among them. Such swaps may involve initial and final exchanges that correspond to the agreed upon notional amount. Currency swaps usually involve the delivery of the entire principal value of one designated currency in exchange for the other designated currency. Therefore, the entire principal value of a currency swap is subject to the risk that the other party to the swap will default on its contractual delivery obligations. If there is a default by the counterparty, the Portfolio may have contractual remedies pursuant to the agreements related to the transaction.
Equity swaps are two-party contracts that generally obligate one party to pay the positive return and the other party to pay the negative return on a specified reference security, basket of securities, security index or index component during the period of the swap. Equity swap contracts are marked to market daily based on the value of the underlying security and the change, if any, is recorded as an unrealized gain or loss. Equity swaps normally do not involve the delivery of securities or other underlying assets. If the other party to an equity swap defaults, a Portfolio’s risk of loss consists of the net amount of payments that such Portfolio is contractually entitled to receive, if any. Equity swaps are derivatives and their value can be very volatile.
The use of swaps is a highly specialized activity that involves investment techniques and risks different from those associated with ordinary portfolio securities transactions. If an investment adviser is incorrect in its forecasts of market values, interest rates, and currency exchange rates, the investment performance of the Portfolio would be less favorable than it would have been if this investment technique were not used.
Interest Rate Swaps - The Portfolio may enter into interest rate swaps and the purchase or sale of related caps and floors. The Portfolio may enter into these transactions primarily to manage its exposure to interest rates, to protect against currency fluctuations, or to preserve a return or spread on a particular investment. The Portfolio is subject to interest rate risk exposure in the normal course of pursuing its investment objectives. Because the Portfolio holds has exposure to fixed income securities, the value of these securities may decrease if interest rates rise. To help hedge against this risk and to maintain its ability to generate income at prevailing market rates, the Portfolio may enter into interest rate swap contracts. Interest rate swaps are arrangements between two parties to exchange cash flows based on a notional principal amount, to manage the Portfolio’s exposure to interest rates. Interest rate swap contracts are marked-to-market daily based upon quotations from market makers and the change, if any, is recorded as unrealized gain or loss. Payments received or made are recorded as realized gains or losses. The Portfolio could be exposed to credit or market risk due to unfavorable changes in the fluctuation of interest rates or if the counterparty defaults on its obligation to perform. Risks may exceed amounts recognized on the Statement of Assets and Liabilities. The purchase of a cap entitles the purchaser, to the extent that a specific index exceeds a predetermined interest rate, to receive payments of interest on a notional principal amount from the party selling such cap. The purchase of a floor entitles the purchaser to receive payments on a notional principal amount from the party selling such floor to the extent that a specified index falls below a predetermined interest rate or amount. The Portfolio’s maximum risk of loss from counterparty credit risk is the discounted net value of the cash flows to be received from/paid to the counterparty over the contract’s remaining life, to the extent that amount is positive. As of June 30, 2011, the net unrealized appreciation on such transactions was $5,689,322. This risk is mitigated by maintaining a master netting arrangement between the Portfolio and the counterparty and by the posting of collateral by the counterparty to the Portfolio to cover the Portfolio’s exposure to the counterparty.
Credit Default Swaps - The Portfolio is subject to credit risk in the normal course of pursuing its investment objectives. The Portfolio may enter into credit default swaps to manage its exposure to the market or certain sectors of the market, to reduce its risk exposure to defaults of corporate and sovereign issuers, or to create exposure to corporate or sovereign issuers to which it is not otherwise exposed. As the seller in a credit default swap contract, the Portfolio would be required to pay the par (or other agreed upon) value of a referenced debt obligation to the counterparty in the event of a default by a third party, such as a U.S. or foreign corporate issuer, on the debt obligation. In return, the Portfolio would receive from the counterparty an upfront or periodic stream of payments over the term of the contract provided that no event of default has occurred. If no default occurs, the Portfolio would keep the stream of payments and would have no payment obligations. An upfront payment
29
MET INVESTORS SERIES TRUST
| | |
PIMCO Inflation Protected Bond Portfolio | | |
Notes to Financial Statements—June 30, 2011 (Unaudited)—(Continued)
5. Investments in Derivative Instruments - continued
received by the Portfolio is recorded as a liability on the books. An upfront payment made by the Portfolio is recorded as an asset on the books. As the seller, the Portfolio would be subject to investment exposure on the notional amount of the swap. The Portfolio may also purchase credit default swap contracts in order to hedge against the risk of default of debt securities held in its portfolio. This would involve the risk that the investment may expire worthless and would only generate income in the event of an actual default by the issuer of the underlying obligation (as opposed to a credit downgrade or other indication of financial instability). It would also involve credit risk—the seller may fail to satisfy its payment obligations to the Portfolio in the event of a default. The Portfolio’s maximum risk of loss from counterparty risk, either as the protection seller or as the protection buyer, is the unrealized appreciation of the contract. This risk is mitigated by having a master netting arrangement between the Portfolio and the counterparty and by the posting of collateral by the counterparty to the Portfolio to cover the Portfolio’s exposure to the counterparty.
Implied credit spreads, represented in absolute terms, utilized in determining the market value of credit default swap agreements on corporate issues or sovereign issues of an emerging country as of period end are disclosed in Note 9 to the Notes to Financial Statements and serve as an indicator of the status of the payment/performance risk and represent the likelihood or risk of default for the credit derivative. The implied credit spread of a particular referenced entity reflects the cost of buying/selling protection and may include upfront payments required to be made to enter into the agreement. For credit default swap agreements on asset-backed securities and credit indices, the quoted market prices and resulting values serve as the indicator of the current status of the payment/performance risk. Wider credit spreads represent a deterioration of the referenced entity’s credit soundness and a greater likelihood or risk of default or other credit event occurring as defined under the terms of the agreement.
The maximum potential amount of future payments (undiscounted) that a Portfolio as a seller of protection could be required to make under a credit default swap agreement would be an amount equal to the notional amount of the agreement. Notional amounts of all credit default swap agreements outstanding as of June 30, 2011 for which a Portfolio is the seller of protection are disclosed in Note 9 to the Notes to Financials Statements. These potential amounts would be partially offset by any recovery values of the respective referenced obligations, upfront payments received upon entering into the agreement, or net amounts received from the settlement of buy protection credit default swap agreements entered into by a Portfolio for the same referenced entity or entities.
Swap agreements are marked to market daily. The change in value, if any, is recorded as unrealized gain or loss in the Statement of Operations. A liquidation payment received or made at the termination of the swap is recorded as realized gain or loss in the Statement of Operations. Net periodic payments are included as part of realized gain (loss) on the Statement of Operations.
At June 30, 2011, the Portfolio had the following derivatives, grouped into appropriate risk categories:
| | | | | | | | | | | | |
| | | Asset Derivatives | | | Liability Derivatives | |
Risk Exposure | | Statement of Assets &
Liabilities Location | | Fair Value | | | Statement of Assets &
Liabilities Location | | Fair Value | |
Interest Rate | | Unrealized appreciation on swap contracts | | $ | 7,184,663 | | | Unrealized depreciation on swap contracts | | $ | 1,495,341 | |
| | | | | | | | | | | | |
| | | | |
| | Unrealized appreciation on futures contracts* | | | 1,591,045 | | | Unrealized depreciation on futures contracts* | | | 226,727 | |
| | | | | | | | | | | | |
| | | | |
| | Investments at value(a) | | | 649,932 | | | Investments at value(a) | | | — | |
| | | | |
| | Outstanding written options | | | — | | | Outstanding written option | | | 3,847,863 | |
| | | | | | | | | | | | |
Foreign Currency Exchange | | Unrealized appreciation on forward foreign currency exchange contracts | | | 4,805,412 | | | Unrealized depreciation on forward foreign currency exchange contracts | | | 7,488,058 | |
| | | | | | | | | | | | |
Credit | | Unrealized appreciation on swap contracts | | | 500,480 | | | Unrealized depreciation on swap contracts | | | 1,523,005 | |
| | Outstanding written options | | | — | | | Outstanding written options | | | 18,539 | |
| | | | | | | | | | | | |
| | | | |
Total | | | | $ | 14,731,532 | | | | | $ | 14,599,533 | |
| | | | | | | | | | | | |
| * | | Includes cumulative appreciation/depreciation of futures contracts as reported in the notes to financial statements. Only the current day’s variation margin is reported within the Statement of Assets & Liabilities. |
30
MET INVESTORS SERIES TRUST
| | |
PIMCO Inflation Protected Bond Portfolio | | |
Notes to Financial Statements—June 30, 2011 (Unaudited)—(Continued)
5. Investments in Derivative Instruments - continued
Transactions in derivative instruments during the six months ended June 30, 2011, were as follows:
| | | | | | | | | | | | | | | | |
Statement of Operations Location - Net Realized Gain (Loss) | | Interest
Rate | | | Foreign
Currency
Exchange | | | Credit | | | Total | |
Foreign currency transactions | | $ | — | | | $ | (4,865,807 | ) | | $ | — | | | $ | (4,865,807 | ) |
Futures contracts | | | 331,652 | | | | — | | | | — | | | | 331,652 | |
Swap contracts | | | 456,962 | | | | — | | | | 71,831 | | | | 528,793 | |
Written options contracts | | | (1,278,304 | ) | | | — | | | | 108,925 | | | | (1,169,379 | ) |
| | | | | | | | | | | | | | | | |
| | | | |
| | $ | (489,690 | ) | | $ | (4,865,807 | ) | | $ | 180,756 | | | $ | (5,174,741 | ) |
| | | | | | | | | | | | | | | | |
| | | | |
Statement of Operations Location - Net Change in Unrealized Gain (Loss) | | | | | | | | | | | | |
Investments(a) | | $ | 34,136 | | | $ | — | | | $ | — | | | $ | 34,136 | |
Foreign currency transactions | | | — | | | | (2,962,174 | ) | | | — | | | | (2,962,174 | ) |
Futures contracts | | | 1,348,530 | | | | — | | | | — | | | | 1,348,530 | |
Swap contracts | | | (359,756 | ) | | | — | | | | (59,833 | ) | | | (419,589 | ) |
Written options contracts | | | 5,053,085 | | | | — | | | | (66,126 | ) | | | 4,986,959 | |
| | | | | | | | | | | | | | | | |
| | | | |
| | $ | 6,075,995 | | | $ | (2,962,174 | ) | | $ | (125,959 | ) | | $ | 2,987,862 | |
| | | | | | | | | | | | | | | | |
| (a) | | Includes options purchased which are part of Investments as shown in the Statement of Assets of Liabilities and change in unrealized appreciation (depreciation) on Investments as shown in the Statement of Operations. |
For the six months ended June 30, 2011, the average amount or number per contract outstanding for each derivative type was as follows:
| | | | | | | | | | | | |
Average Notional or Face Amount(b) | | Foreign
Currency
Risk | | | Interest
Rate Risk | | | Credit
Risk | |
Investments(a) | | $ | — | | | $ | 92,350,000 | | | $ | — | |
Foreign currency transactions | | | 619,710,928 | | | | — | | | | — | |
Futures contracts long | | | — | | | | 369,515,052 | | | | — | |
Swap contracts | | | — | | | | 10,720,000 | | | | 4,945,000 | |
Written options contracts | | | 600 | | | | 29,402,956 | | | | 8,877,273 | |
(b) Averages are based on daily activity levels during 2011.
6. Forward Foreign Currency Exchange Contracts
Forward Foreign Currency Exchange Contracts to Buy:
| | | | | | | | | | | | | | | | | | | | | | |
Settlement Date | | Counterparty | | Contracts to Buy | | | | | | Value at
June 30, 2011 | | | In Exchange
for U.S.$ | | | Net Unrealized
Appreciation/
(Depreciation) | |
| | | | | | |
| 8/2/2011 | | UBS AG | | | 24,037,729 | | | | BRL | | | $ | 15,305,891 | | | $ | 14,869,312 | | | $ | 436,579 | |
| | | | | | |
| 9/2/2011 | | Barclays Bank plc | | | 24,037,729 | | | | BRL | | | | 15,204,009 | | | | 14,937,689 | | | | 266,320 | |
| | | | | | |
| 9/19/2011 | | Deutsche Bank AG | | | 24,497,000 | | | | CAD | | | | 25,357,041 | | | | 24,866,895 | | | | 490,146 | |
| | | | | | |
| 11/15/2011 | | JPMorgan Chase Bank N.A. | | | 43,219,513 | | | | CNY | | | | 6,709,799 | | | | 6,728,867 | | | | (19,068 | ) |
| | | | | | |
| 2/13/2012 | | Deutsche Bank AG | | | 37,170,584 | | | | CNY | | | | 5,795,743 | | | | 5,738,415 | | | | 57,328 | |
| | | | | | |
| 9/19/2011 | | JPMorgan Chase Bank N.A. | | | 531,000 | | | | EUR | | | | 769,524 | | | | 762,890 | | | | 6,634 | |
| | | | | | |
| 10/31/2011 | | Citibank N.A. | | | 28,025,600,000 | | | | IDR | | | | 3,206,427 | | | | 3,020,000 | | | | 186,427 | |
31
MET INVESTORS SERIES TRUST
| | |
PIMCO Inflation Protected Bond Portfolio | | |
Notes to Financial Statements—June 30, 2011 (Unaudited)—(Continued)
6. Forward Foreign Currency Exchange Contracts - continued
| | | | | | | | | | | | | | | | | | | | | | |
Settlement Date | | Counterparty | | Contracts to Buy | | | | | | Value at
June 30, 2011 | | | In Exchange
for U.S.$ | | | Net Unrealized
Appreciation/
(Depreciation) | |
| | | | | | |
| 10/31/2011 | | Citibank N.A. | | | 17,461,600,000 | | | | IDR | | | $ | 1,997,793 | | | $ | 1,898,000 | | | $ | 99,793 | |
| | | | | | |
| 10/31/2011 | | Goldman Sachs & Co. | | | 20,257,500,000 | | | | IDR | | | | 2,317,674 | | | | 2,190,000 | | | | 127,674 | |
| | | | | | |
| 1/31/2012 | | Citibank N.A. | | | 17,814,000,000 | | | | IDR | | | | 2,010,550 | | | | 1,963,408 | | | | 47,142 | |
| | | | | | |
| 8/12/2011 | | Barclays Bank plc | | | 99,914,100 | | | | INR | | | | 2,220,783 | | | | 2,210,000 | | | | 10,783 | |
| | | | | | |
| 8/12/2011 | | Deutsche Bank AG | | | 145,400,000 | | | | INR | | | | 3,231,795 | | | | 3,110,160 | | | | 121,635 | |
| | | | | | |
| 8/12/2011 | | JPMorgan Chase Bank N.A. | | | 104,512,000 | | | | INR | | | | 2,322,981 | | | | 2,300,000 | | | | 22,981 | |
| | | | | | |
| 8/12/2011 | | Morgan Stanley | | | 1,073,391,000 | | | | INR | | | | 23,858,184 | | | | 22,867,299 | | | | 990,885 | |
| | | | | | |
| 8/12/2011 | | JPMorgan Chase Bank N.A. | | | 37,231,492,000 | | | | KRW | | | | 34,790,960 | | | | 33,903,831 | | | | 887,129 | |
| | | | | | |
| 8/12/2011 | | Morgan Stanley | | | 218,660,000 | | | | KRW | | | | 204,327 | | | | 200,000 | | | | 4,327 | |
| | | | | | |
| 7/7/2011 | | Barclays Bank plc | | | 49,952,350 | | | | MXN | | | | 4,261,452 | | | | 4,130,000 | | | | 131,452 | |
| | | | | | |
| 7/7/2011 | | Morgan Stanley | | | 35,784,920 | | | | MXN | | | | 3,052,823 | | | | 2,960,000 | | | | 92,823 | |
| | | | | | |
| 7/7/2011 | | Morgan Stanley | | | 13,292,950 | | | | MXN | | | | 1,134,026 | | | | 1,100,000 | | | | 34,026 | |
| | | | | | |
| 11/18/2011 | | Morgan Stanley | | | 99,030,220 | | | | MXN | | | | 8,345,217 | | | | 8,294,336 | | | | 50,881 | |
| | | | | | |
| 8/11/2011 | | Barclays Bank plc | | | 2,000,000 | | | | MYR | | | | 660,526 | | | | 644,434 | | | | 16,092 | |
| | | | | | |
| 8/11/2011 | | Barclays Bank plc | | | 2,000,000 | | | | MYR | | | | 660,526 | | | | 647,606 | | | | 12,920 | |
| | | | | | |
| 8/11/2011 | | Barclays Bank plc | | | 1,900,000 | | | | MYR | | | | 627,499 | | | | 617,384 | | | | 10,115 | |
| | | | | | |
| 8/11/2011 | | Barclays Bank plc | | | 6,527,918 | | | | MYR | | | | 2,155,929 | | | | 2,110,000 | | | | 45,929 | |
| | | | | | |
| 8/11/2011 | | Citibank N.A. | | | 3,600,000 | | | | MYR | | | | 1,188,947 | | | | 1,163,505 | | | | 25,442 | |
| | | | | | |
| 8/11/2011 | | Citibank N.A. | | | 2,000,000 | | | | MYR | | | | 660,526 | | | | 648,508 | | | | 12,018 | |
| | | | | | |
| 8/11/2011 | | Citibank N.A. | | | 3,000,000 | | | | MYR | | | | 990,789 | | | | 972,857 | | | | 17,932 | |
| | | | | | |
| 8/11/2011 | | Citibank N.A. | | | 3,000,000 | | | | MYR | | | | 990,789 | | | | 975,071 | | | | 15,718 | |
| | | | | | |
| 8/11/2011 | | JPMorgan Chase Bank N.A. | | | 2,000,000 | | | | MYR | | | | 660,526 | | | | 649,035 | | | | 11,491 | |
| | | | | | |
| 8/11/2011 | | Morgan Stanley | | | 3,306,560 | | | | MYR | | | | 1,092,034 | | | | 1,075,269 | | | | 16,765 | |
| | | | | | |
| 11/10/2011 | | Citibank N.A. | | | 3,095,462 | | | | MYR | | | | 1,015,685 | | | | 1,038,049 | | | | (22,364 | ) |
| | | | | | |
| 11/15/2011 | | Barclays Bank plc | | | 102,300,000 | | | | PHP | | | | 2,334,710 | | | | 2,306,132 | | | | 28,578 | |
| | | | | | |
| 11/15/2011 | | Barclays Bank plc | | | 43,100,000 | | | | PHP | | | | 983,636 | | | | 977,324 | | | | 6,312 | |
| | | | | | |
| 11/15/2011 | | Barclays Bank plc | | | 43,300,000 | | | | PHP | | | | 988,201 | | | | 977,647 | | | | 10,554 | |
| | | | | | |
| 11/15/2011 | | Barclays Bank plc | | | 43,400,000 | | | | PHP | | | | 990,483 | | | | 976,378 | | | | 14,105 | |
| | | | | | |
| 11/15/2011 | | Barclays Bank plc | | | 33,597,090 | | | | PHP | | | | 766,759 | | | | 750,270 | | | | 16,489 | |
| | | | | | |
| 11/15/2011 | | Citibank N.A. | | | 84,800,000 | | | | PHP | | | | 1,935,321 | | | | 1,912,926 | | | | 22,395 | |
| | | | | | |
| 3/15/2012 | | Citibank N.A. | | | 428,905,200 | | | | PHP | | | | 9,713,925 | | | | 9,890,585 | | | | (176,660 | ) |
| | | | | | |
| 9/9/2011 | | Barclays Bank plc | | | 700,000 | | | | SGD | | | | 570,327 | | | | 547,485 | | | | 22,842 | |
| | | | | | |
| 9/9/2011 | | Citibank N.A. | | | 900,000 | | | | SGD | | | | 733,277 | | | | 703,180 | | | | 30,097 | |
| | | | | | |
| 9/9/2011 | | Deutsche Bank AG | | | 1,200,000 | | | | SGD | | | | 977,703 | | | | 940,918 | | | | 36,785 | |
| | | | | | |
| 9/9/2011 | | Deutsche Bank AG | | | 3,000,000 | | | | SGD | | | | 2,444,258 | | | | 2,434,867 | | | | 9,391 | |
| | | | | | |
| 9/9/2011 | | Deutsche Bank AG | | | 2,400,000 | | | | SGD | | | | 1,955,406 | | | | 1,949,064 | | | | 6,342 | |
| | | | | | |
| 9/9/2011 | | Goldman Sachs & Co. | | | 3,000,000 | | | | SGD | | | | 2,444,258 | | | | 2,436,667 | | | | 7,591 | |
| | | | | | |
| 9/9/2011 | | JPMorgan Chase Bank N.A. | | | 300,000 | | | | SGD | | | | 244,426 | | | | 234,212 | | | | 10,214 | |
32
MET INVESTORS SERIES TRUST
| | |
PIMCO Inflation Protected Bond Portfolio | | |
Notes to Financial Statements—June 30, 2011 (Unaudited)—(Continued)
6. Forward Foreign Currency Exchange Contracts - continued
| | | | | | | | | | | | | | | | | | | | | | |
Settlement Date | | Counterparty | | Contracts to Buy | | | | | | Value at
June 30, 2011 | | | In Exchange
for U.S.$ | | | Net Unrealized
Appreciation/
(Depreciation) | |
| | | | | | |
| 9/9/2011 | | JPMorgan Chase Bank N.A. | | | 1,395,927 | | | | SGD | | | $ | 1,137,335 | | | $ | 1,096,238 | | | $ | 41,097 | |
| | | | | | |
| 9/9/2011 | | JPMorgan Chase Bank N.A. | | | 2,995,628 | | | | SGD | | | | 2,440,695 | | | | 2,433,748 | | | | 6,947 | |
| | | | | | |
| 9/9/2011 | | UBS AG | | | 2,000,000 | | | | SGD | | | | 1,629,505 | | | | 1,628,300 | | | | 1,205 | |
| | | | | | | | | | | | | | | | | | | | | | |
Net Unrealized Appreciation | | | | | | | | | | | | | | | | | | | $4,302,239 | |
| | | | | | | | | | | | | | | | | | | | | | |
| | | | | | | | | | | | | | | | | | | | | | |
|
Forward Foreign Currency Exchange Contracts to Sell: | |
Settlement Date | | Counterparty | | Contracts to Deliver | | | | | | Value at
June 30, 2011 | | | In Exchange
for U.S.$ | | | Net Unrealized
Appreciation/
(Depreciation) | |
| | | | | | |
| 7/29/2011 | | Deutsche Bank AG | | | 6,609,000 | | | | AUD | | | $ | 7,070,941 | | | $ | 6,887,239 | | | $ | (183,702 | ) |
| | | | | | |
| 8/2/2011 | | Barclays Bank plc | | | 24,037,729 | | | | BRL | | | | 15,305,891 | | | | 15,032,976 | | | | (272,915 | ) |
| | | | | | |
| 7/6/2011 | | JPMorgan Chase Bank N.A. | | | 4,370,000 | | | | EUR | | | | 6,346,597 | | | | 6,320,523 | | | | (26,074 | ) |
| | | | | | |
| 7/6/2011 | | UBS AG | | | 50,000 | | | | EUR | | | | 72,615 | | | | 72,313 | | | | (302 | ) |
| | | | | | |
| 7/18/2011 | | Barclays Bank plc | | | 9,806,000 | | | | EUR | | | | 14,236,648 | | | | 14,033,475 | | | | (203,173 | ) |
| | | | | | |
| 7/18/2011 | | Barclays Bank plc | | | 220,000 | | | | EUR | | | | 319,403 | | | | 313,319 | | | | (6,084 | ) |
| | | | | | |
| 7/18/2011 | | BNP Paribas Bank | | | 4,511,000 | | | | EUR | | | | 6,549,206 | | | | 6,458,534 | | | | (90,672 | ) |
| | | | | | |
| 7/18/2011 | | Citibank N.A. | | | 1,496,000 | | | | EUR | | | | 2,171,938 | | | | 2,121,958 | | | | (49,980 | ) |
| | | | | | |
| 7/18/2011 | | Citibank N.A. | | | 7,143,000 | | | | EUR | | | | 10,370,424 | | | | 10,424,923 | | | | 54,499 | |
| | | | | | |
| 7/18/2011 | | Citibank N.A. | | | 2,227,000 | | | | EUR | | | | 3,233,226 | | | | 3,138,950 | | | | (94,276 | ) |
| | | | | | |
| 7/18/2011 | | Citibank N.A. | | | 13,063,000 | | | | EUR | | | | 18,965,259 | | | | 18,554,842 | | | | (410,417 | ) |
| | | | | | |
| 7/18/2011 | | Citibank N.A. | | | 17,478,000 | | | | EUR | | | | 25,375,090 | | | | 25,103,858 | | | | (271,232 | ) |
| | | | | | |
| 7/18/2011 | | JPMorgan Chase Bank N.A. | | | 173,140,000 | | | | EUR | | | | 251,369,898 | | | | 249,825,437 | | | | (1,544,461 | ) |
| | | | | | |
| 7/18/2011 | | JPMorgan Chase Bank N.A. | | | 3,874,000 | | | | EUR | | | | 5,624,391 | | | | 5,428,136 | | | | (196,255 | ) |
| | | | | | |
| 7/18/2011 | | UBS AG | | | 8,829,000 | | | | EUR | | | | 12,818,210 | | | | 12,516,252 | | | | (301,958 | ) |
| | | | | | |
| 9/13/2011 | | UBS AG | | | 6,300,000 | | | | GBP | | | | 10,114,100 | | | | 10,344,682 | | | | 230,582 | |
| | | | | | |
| 7/14/2011 | | JPMorgan Chase Bank N.A. | | | 303,653,000 | | | | JPY | | | | 3,765,468 | | | | 3,625,037 | | | | (140,431 | ) |
| | | | | | |
| 7/25/2011 | | Citibank N.A. | | | 10,810,000,000 | | | | JPY | | | | 134,057,191 | | | | 130,622,602 | | | | (3,434,589 | ) |
| | | | | | |
| 7/7/2011 | | Morgan Stanley | | | 99,030,220 | | | | MXN | | | | 8,448,301 | | | | 8,404,856 | | | | (43,445 | ) |
| | | | | | | | | | | | | | | | | | | | | | |
Net Unrealized Depreciation | | | | | | | | | | | | | | | | | | | $(6,984,885) | |
| | | | | | | | | | | | | | | | | | | | | | |
AUD—Australian Dollar
BRL—Brazilian Real
CAD—Canadian Dollar
CNY—China Yuan Renminbi
EUR—Euro
GBP—British Pound
IDR—Indonesia Rupiah
INR—Indian Rupee
JPY—Japanese Yen
KRW—South Korean Won
MXN—Mexican Peso
MYR—Malaysian Ringgit
PHP—Philippine Peso
SGD—Singapore Dollar
33
MET INVESTORS SERIES TRUST
| | |
PIMCO Inflation Protected Bond Portfolio | | |
Notes to Financial Statements—June 30, 2011 (Unaudited)—(Continued)
7. Futures Contracts
The futures contracts outstanding as of June 30, 2011 and the description and unrealized appreciation (depreciation) were as follows:
| | | | | | | | | | | | | | | | | | | | |
Futures Contracts - Long | | Expiration
Date | | | Number of
Contracts | | | Contract
Amount | | | Valuation as of
June 30, 2011 | | | Unrealized
Appreciation/
Depreciation | |
| | | | | |
3MO Euribor | | | 06/18/2012 | | | | 65 | | | $ | 23,042,789 | | | $ | 23,116,882 | | | $ | 74,093 | |
| | | | | |
3MO Euribor | | | 09/17/2012 | | | | 65 | | | | 23,007,860 | | | | 23,098,002 | | | | 90,142 | |
| | | | | |
3MO Euribor | | | 12/17/2012 | | | | 65 | | | | 22,973,348 | | | | 23,072,041 | | | | 98,693 | |
| | | | | |
3MO Euribor | | | 03/18/2013 | | | | 65 | | | | 22,949,493 | | | | 23,050,800 | | | | 101,307 | |
| | | | | |
90 Day EuroDollar Futures | | | 09/19/2011 | | | | 639 | | | | 159,058,672 | | | | 159,198,863 | | | | 140,191 | |
| | | | | |
90 Day EuroDollar Futures | | | 12/19/2011 | | | | 61 | | | | 15,170,413 | | | | 15,185,950 | | | | 15,537 | |
| | | | | |
90 Day EuroDollar Futures | | | 03/19/2012 | | | | 880 | | | | 218,331,450 | | | | 218,933,000 | | | | 601,550 | |
| | | | | |
90 Day EuroDollar Futures | | | 06/18/2012 | | | | 456 | | | | 113,008,765 | | | | 113,298,900 | | | | 290,135 | |
| | | | | |
90 Day EuroDollar Futures | | | 12/17/2012 | | | | 494 | | | | 122,287,555 | | | | 122,178,550 | | | | (109,005 | ) |
| | | | | |
90 Day EuroDollar Futures | | | 03/18/2013 | | | | 207 | | | | 51,184,622 | | | | 51,066,900 | | | | (117,722 | ) |
| | | | | |
90 Day EuroDollar Futures | | | 09/17/2012 | | | | 328 | | | | 81,148,204 | | | | 81,327,600 | | | | 179,396 | |
| | | | | | | | | | | | | | | | | | | | |
| | | | | |
Net Unrealized Appreciation | | | | | | | | | | | | | | | | | | $ | 1,364,317 | |
| | | | | | | | | | | | | | | | | | | | |
8. Options Written
The options contracts outstanding as of June 30, 2011 and the description and unrealized appreciation (depreciation) were as follows:
| | | | | | | | | | | | | | | | | | | | | | |
Over the Counter
Options Written - Calls | | Counterparty | | Expiration
Date | | | Number of
Contracts | | | Premiums
Received | | | Valuation
as of
June 30, 2011 | | | Unrealized
Appreciation/
Depreciation | |
| | | | | | |
317513GS2 | | JPMorgan Chase Bank N.A. | | | 10/11/2011 | | | | (17,200,000 | ) | | $ | (87,376 | ) | | $ | (111,321 | ) | | $ | (23,945 | ) |
| | | | | | |
CDX.O 5 Year Swaption 0.8 | | BNP Paribas Bank | | | 09/21/2011 | | | | (3,200,000 | ) | | | (6,880 | ) | | | (7,139 | ) | | | (259 | ) |
| | | | | | |
CDX.O 5 Year Swaption 0.8 | | Credit Suisse Group AG | | | 09/21/2011 | | | | (1,000,000 | ) | | | (3,900 | ) | | | (2,231 | ) | | | 1,669 | |
| | | | | | |
EuroDollar Futures | | Citibank N.A. | | | 09/19/2011 | | | | (119 | ) | | | (55,702 | ) | | | (92,225 | ) | | | (36,523 | ) |
| | | | | | |
IRO USD 3 Year Swaption 3.0 | | Morgan Stanley | | | 10/11/2011 | | | | (126,400,000 | ) | | | (639,900 | ) | | | (760,789 | ) | | | (120,889 | ) |
| | | | | | |
IRO USD 5 Year Swaption 1.8 | | Credit Suisse Group AG | | | 08/24/2011 | | | | (13,600,000 | ) | | | (27,200 | ) | | | (21,129 | ) | | | 6,071 | |
| | | | | | |
OCD001044 FVA USD | | Morgan Stanley | | | 10/11/2011 | | | | (37,100,000 | ) | | | (411,799 | ) | | | (601,308 | ) | | | (189,509 | ) |
| | | | | | |
OCD001077 FVA USD | | Morgan Stanley | | | 11/14/2011 | | | | (42,500,000 | ) | | | (462,139 | ) | | | (696,661 | ) | | | (234,522 | ) |
| | | | | | |
OCD001119 FVA USD | | Goldman Sachs & Co. | | | 10/11/2011 | | | | (17,700,000 | ) | | | (93,460 | ) | | | (114,557 | ) | | | (21,097 | ) |
| | | | | | | | | | | | | | | | | | | | | | |
| | | | | | |
| | | | | | | | | | | | $ | (1,788,356 | ) | | $ | (2,407,360 | ) | | $ | (619,004 | ) |
| | | | | | | | | | | | | | | | | | | | | | |
| | | | | | |
Exchange Traded
Options Written - Calls | | | | | | | | | | | | | | | | | |
| | | | | | |
U.S. Treasury Note 5 Year Futures | | | | | 07/01/2011 | | | | (186 | ) | | | (80,595 | ) | | | (42,141 | ) | | | 38,454 | |
| | | | | | |
U.S. Treasury Note 10 Year Futures | | | | | 07/01/2011 | | | | (65 | ) | | | (30,006 | ) | | | (6,094 | ) | | | 23,912 | |
| | | | | | | | | | | | | | | | | | | | | | |
| | | | | | |
| | | | | | | | | | | | $ | (110,601 | ) | | $ | (48,235 | ) | | $ | 62,366 | |
| | | | | | | | | | | | | | | | | | | | | | |
34
MET INVESTORS SERIES TRUST
| | |
PIMCO Inflation Protected Bond Portfolio | | |
Notes to Financial Statements—June 30, 2011 (Unaudited)—(Continued)
8. Options Written - continued
| | | | | | | | | | | | | | | | | | | | | | |
Over the Counter
Options Written - Puts | | Counterparty | | Expiration
Date | | | Number of
Contracts | | | Premiums
Received | | | Valuation
as of
June 30, 2011 | | | Unrealized
Appreciation/
Depreciation | |
| | | | | | |
CDX.O 5 Year Swaption 0.8 | | BNP Paribas Bank | | | 09/21/2011 | | | | (3,200,000 | ) | | $ | (13,120 | ) | | $ | (1,647 | ) | | $ | 11,473 | |
| | | | | | |
CDX.O 5 Year Swaption 0.8 | | Credit Suisse Group AG | | | 09/21/2011 | | | | (1,000,000 | ) | | | (4,600 | ) | | | (515 | ) | | | 4,085 | |
| | | | | | |
CDX.O 5 Year Swaption 0.8 | | Morgan Stanley | | | 09/21/2011 | | | | (5,000,000 | ) | | | (22,500 | ) | | | (6,132 | ) | | | 16,368 | |
| | | | | | |
CDX.O 5 Year Swaption 0.8 | | UBS AG | | | 09/21/2011 | | | | (1,700,000 | ) | | | (9,180 | ) | | | (875 | ) | | | 8,305 | |
| | | | | | |
EuroDollar Futures | | Citibank N.A. | | | 09/19/2011 | | | | (119 | ) | | | (76,150 | ) | | | (8,925 | ) | | | 67,225 | |
| | | | | | |
INF Floor USD CPURNS 215.95 | | Deutsche Bank AG | | | 03/10/2020 | | | | (5,100,000 | ) | | | (38,250 | ) | | | (18,107 | ) | | | 20,143 | |
| | | | | | |
INF Floor USD CPURNS 215.95 | | Citibank N.A. | | | 03/12/2020 | | | | (13,900,000 | ) | | | (119,540 | ) | | | (37,238 | ) | | | 82,302 | |
| | | | | | |
INF Floor USD CPURNS 216.69 | | Citibank N.A. | | | 04/07/2020 | | | | (49,000,000 | ) | | | (436,720 | ) | | | (136,683 | ) | | | 300,037 | |
| | | | | | |
INF Floor USD CPURNS 217.97 | | Citibank N.A. | | | 09/29/2020 | | | | (4,700,000 | ) | | | (60,630 | ) | | | (14,452 | ) | | | 46,178 | |
| | | | | | |
IRO USD 1 Year Swaption 1.0 | | Goldman Sachs & Co. | | | 11/19/2012 | | | | (39,500,000 | ) | | | (225,359 | ) | | | (233,429 | ) | | | (8,070 | ) |
| | | | | | |
IRO USD 1 Year Swaption 2.0 | | Goldman Sachs & Co. | | | 04/30/2012 | | | | (211,400,000 | ) | | | (375,235 | ) | | | (123,331 | ) | | | 251,904 | |
| | | | | | |
IRO USD 10 Year Swaption 4.25 | | Morgan Stanley | | | 10/11/2011 | | | | (126,400,000 | ) | | | (639,900 | ) | | | (270,268 | ) | | | 369,632 | |
| | | | | | |
IRO USD 3 Year Swaption 3.0 | | Barclays Bank plc | | | 06/18/2012 | | | | (3,600,000 | ) | | | (31,637 | ) | | | (13,775 | ) | | | 17,862 | |
| | | | | | |
IRO USD 3 Year Swaption 3.0 | | Citibank N.A. | | | 06/18/2012 | | | | (59,100,000 | ) | | | (657,643 | ) | | | (226,140 | ) | | | 431,503 | |
| | | | | | |
IRO USD 3 Year Swaption 3.0 | | Deutsche Bank AG | | | 06/18/2012 | | | | (16,000,000 | ) | | | (178,832 | ) | | | (61,222 | ) | | | 117,610 | |
| | | | | | |
IRO USD 3 Year Swaption 3.0 | | JPMorgan Chase Bank N.A. | | | 06/18/2012 | | | | (40,700,000 | ) | | | (431,713 | ) | | | (155,734 | ) | | | 275,979 | |
| | | | | | |
IRO USD 5 Year Swaption 2.5 | | Credit Suisse Group AG | | | 08/24/2011 | | | | (13,600,000 | ) | | | (54,060 | ) | | | (31,616 | ) | | | 22,444 | |
| | | | | | | | | | | | | | | | | | | | | | |
| | | | | | |
| | | | | | | | | | | | $ | (3,375,069 | ) | | $ | (1,340,089 | ) | | $ | 2,034,980 | |
| | | | | | | | | | | | | | | | | | | | | | |
| | | | | | |
Exchange
Traded
Options
Written - Puts | | | | | | | | | | | | | | | | | |
| | | | | | |
U.S. Treasury Note 5 Year Futures | | | | | 07/01/2011 | | | | (186 | ) | | | (37,789 | ) | | | (39,234 | ) | | | (1,445 | ) |
| | | | | | |
U.S. Treasury Note 10 Year Futures | | | | | 07/01/2011 | | | | (65 | ) | | | (21,515 | ) | | | (31,484 | ) | | | (9,969 | ) |
| | | | | | | | | | | | | | | | | | | | | | |
| | | | | | | | | | | | $ | (59,304 | ) | | $ | (70,718 | ) | | $ | (11,414 | ) |
| | | | | | | | | | | | | | | | | | | | | | |
Total | | | | | | | | | | | | $ | 5,333,330 | | | $ | (3,866,402 | ) | | $ | 1,466,928 | |
| | | | | | | | | | | | | | | | | | | | | | |
The Portfolio transactions in options written during the period ended June 30, 2011 were as follows:
| | | | | | | | |
Call Options | | Number of
Contracts | | | Premium
received | |
| | |
Options outstanding December 31, 2010 | | | 286,400,719 | | | $ | 1,749,288 | |
| | |
Options written | | | 249,000,251 | | | | 1,137,846 | |
| | |
Options bought back | | | (600 | ) | | | (280,848 | ) |
| | |
Options expired | | | (276,700,000 | ) | | | (707,329 | ) |
| | | | | | | | |
| | |
Options outstanding June 30, 2011 | | | 258,700,370 | | | $ | 1,898,957 | |
| | | | | | | | |
35
MET INVESTORS SERIES TRUST
| | |
PIMCO Inflation Protected Bond Portfolio | | |
Notes to Financial Statements—June 30, 2011 (Unaudited)—(Continued)
8. Options Written - continued
| | | | | | | | |
Put Options | | Number of
Contracts | | | Premium
received | |
| | |
Options outstanding December 31, 2010 | | | 417,200,719 | | | $ | 3,534,538 | |
| | |
Options written | | | 467,800,251 | | | | 1,648,852 | |
| | |
Options bought back | | | (157,100,600 | ) | | | (1,139,047 | ) |
| | |
Options expired | | | (134,000,000 | ) | | | (609,969 | ) |
| | | | | | | | |
| | |
Options outstanding June 30, 2011 | | | 593,900,370 | | | $ | 3,434,374 | |
| | | | | | | | |
9. Swap Agreements
Open interest rate swap agreements at June 30, 2011 were as follows:
| | | | | | | | | | | | | | | | | | | | | | | | | | | | |
Pay/
Receive
Floating
Rate | | Floating
Rate
Index | | Fixed
Rate | | | Maturity
Date | | | Counter
party | | Notional
Amount | | | Market
Value | | | Upfront
Premium
Paid/
(Received) | | | Unrealized
Appreciation/
(Depreciation) | |
| | | | | | | | |
| Pay | | INF EUR FRCPXTOB | | | 2.261 | % | | | 7/14/2011 | | | JPMorgan Chase Bank N.A. | | EUR | 66,200,000 | | | $ | (2,528,400 | ) | | $ | (1,087,869 | ) | | $ | (1,440,531 | ) |
| | | | | | | | |
| Receive | | ZCS BRL CDI | | | 10.115 | % | | | 1/2/2012 | | | Morgan Stanley | | BRL | 2,500,000 | | | | 132,236 | | | | (7,260 | ) | | | 139,496 | |
| | | | | | | | |
| Receive | | ZCS BRL CDI | | | 12.540 | % | | | 1/2/2012 | | | Morgan Stanley | | BRL | 124,800,000 | | | | 3,136,080 | | | | 1,107,194 | | | | 2,028,886 | |
| | | | | | | | |
| Receive | | ZCS BRL CDI | | | 11.670 | % | | | 1/2/2012 | | | Goldman Sachs & Co. | | BRL | 61,300,000 | | | | 308,923 | | | | 29,301 | | | | 279,622 | |
| | | | | | | | |
| Receive | | ZCS BRL CDI | | | 10.835 | % | | | 1/2/2012 | | | JPMorgan Chase Bank N.A. | | BRL | 7,000,000 | | | | 76,962 | | | | 29,726 | | | | 47,236 | |
| | | | | | | | |
| Receive | | ZCS BRL CDI | | | 11.290 | % | | | 1/2/2012 | | | Morgan Stanley | | BRL | 11,300,000 | | | | 73,275 | | | | — | | | | 73,275 | |
| | | | | | | | |
| Receive | | ZCS BRL CDI | | | 11.250 | % | | | 1/2/2012 | | | JPMorgan Chase Bank N.A. | | BRL | 10,200,000 | | | | 84,725 | | | | 20,793 | | | | 63,932 | |
| | | | | | | | |
| Receive | | ZCS BRL CDI | | | 11.630 | % | | | 1/2/2012 | | | Morgan Stanley | | BRL | 5,900,000 | | | | (18,205 | ) | | | (5,309 | ) | | | (12,896 | ) |
| | | | | | | | |
| Receive | | ZCS BRL CDI | | | 11.890 | % | | | 1/2/2013 | | | Goldman Sachs & Co. | | BRL | 12,000,000 | | | | (42,220 | ) | | | (306 | ) | | | (41,914 | ) |
| | | | | | | | |
| Receive | | ZCS BRL CDI | | | 12.170 | % | | | 1/2/2013 | | | JPMorgan Chase Bank N.A. | | BRL | 20,000,000 | | | | 95,511 | | | | (235 | ) | | | 95,746 | |
| | | | | | | | |
| Receive | | ZCS BRL CDI | | | 11.980 | % | | | 1/2/2013 | | | Morgan Stanley | | BRL | 82,600,000 | | | | 4,305,741 | | | | — | | | | 4,305,741 | |
| | | | | | | | |
| Receive | | IRS USD 3MIL | | | 4.000 | % | | | 12/21/2041 | | | Morgan Stanley | | USD | 6,100,000 | | | | 185,804 | | | | 35,075 | | | | 150,729 | |
| | | | | | | | | | | | | | | | | | | | | | | | | | | | |
| | | | | | | | |
| Total | | | | | | | | | | | | | | | | | | $ | 5,810,432 | | | $ | 121,110 | | | $ | 5,689,322 | |
| | | | | | | | | | | | | | | | | | | | | | | | | | | | |
Credit Default Swaps on Corporate and Sovereign Issuers - Buy Protection (a)
| | | | | | | | | | | | | | | | | | | | | | | | | | | | | | |
Reference
Obligation | | Fixed Deal
(Pay) Rate | | | Maturity
Date | | | Counterparty | | Implied Credit
Spread at
June 30, 2011 (b) | | | Notional
Amount (c) | | | Market
Value | | | Upfront
Premium
Paid/(Received) | | | Unrealized
Appreciation/
(Depreciation) | |
| | | | | | | | |
| Black and Decker Corp. (The) | | | | | | | | | | | | | | | | | | | | | | | | | | | | | | |
| 8.950%, due 04/15/2014 | | | (2.200 | %) | | | 6/20/2014 | | | Citibank N.A. | | | 0.29 | % | | $ | 2,000,000 | | | $ | (113,562 | ) | | $ | — | | | $ | (113,562 | ) |
| | | | | | | | |
| D.R. Horton, Inc. | | | | | | | | | | | | | | | | | | | | | | | | | | | | | | |
| 5.375%, due 06/15/2012 | | | (1.000 | %) | | | 3/20/2015 | | | JPMorgan Chase Bank N.A. | | | 1.93 | % | | | 7,500,000 | | | | 248,314 | | | | 403,143 | | | | (154,829 | ) |
| | | | | | | | |
| Echostar DBS Corp. | | | | | | | | | | | | | | | | | | | | | | | | | | | | | | |
| 6.625%, due 10/01/2014 | | | (3.650 | %) | | | 12/20/2013 | | | Citibank N.A. | | | 1.80 | % | | | 6,200,000 | | | | (278,286 | ) | | | — | | | | (278,286 | ) |
| | | | | | | | |
| International Lease Finance Corp. | | | | | | | | | | | | | | | | | | | | | | | | | | | | | | |
| 6.625%, due 11/15/2013 | | | (1.530 | %) | | | 12/20/2013 | | | JPMorgan Chase Bank N.A. | | | 3.02 | % | | | 1,100,000 | | | | 38,455 | | | | — | | | | 38,455 | |
| | | | | | | | |
| Lexmark International, Inc. | | | | | | | | | | | | | | | | | | | | | | | | | | | | | | |
| 5.900%, due 06/01/2013 | | | (1.170 | %) | | | 6/20/2013 | | | JPMorgan Chase Bank N.A. | | | 1.00 | % | | | 5,000,000 | | | | (16,611 | ) | | | — | | | | (16,611 | ) |
| | | | | | | | | | | | | | | | | | | | | | | | | | | | | | |
| Total | | | | | | | | | | | | | | | | | | | | $ | (121,690 | ) | | $ | 403,143 | | | $ | (524,833 | ) |
| | | | | | | | | | | | | | | | | | | | | | | | | | | | | | |
36
MET INVESTORS SERIES TRUST
| | |
PIMCO Inflation Protected Bond Portfolio | | |
Notes to Financial Statements—June 30, 2011 (Unaudited)—(Continued)
9. Swap Agreements - continued
Credit Default Swaps on Corporate and Sovereign Issues - Sell Protection (d)
| | | | | | | | | | | | | | | | | | | | | | | | | | | | | | |
Reference Obligation | | Fixed Deal
(Pay) Rate | | | Maturity
Date | | | Counterparty | | Implied Credit
Spread at
June 30, 2011 (b) | | | Notional
Amount (c) | | | Market
Value | | | Upfront
Premium
Paid/(Received) | | | Unrealized
Appreciation/
(Depreciation) | |
| | | | | | | | |
Brazilian Government International Bond | | | | | | | | | | | | | | | | | | | | | | | | | | | | | | |
| 12.250%, due 03/06/2030 | | | 1.000 | % | | | 6/20/2020 | | | Deutsche Bank AG | | | 1.47 | % | | $ | 7,200,000 | | | $ | (259,655 | ) | | $ | (238,660 | ) | | $ | (20,995 | ) |
| | | | | | | | |
Brazilian Government International Bond | | | | | | | | | | | | | | | | | | | | | | | | | | | | | | |
| 12.250%, due 03/06/2030 | | | 1.000 | % | | | 6/20/2015 | | | JPMorgan Chase Bank N.A. | | | 0.94 | % | | | 2,500,000 | | | | 5,965 | | | | (28,452 | ) | | | 34,417 | |
| | | | | | | | |
| Government of France | | | | | | | | | | | | | | | | | | | | | | | | | | | | | | |
| 4.250%, due 04/25/2019 | | | 0.250 | % | | | 6/20/2015 | | | Citibank N.A. | | | 0.62 | % | | | 3,300,000 | | | | (47,923 | ) | | | (78,850 | ) | | | 30,927 | |
| | | | | | | | |
| Government of France | | | | | | | | | | | | | | | | | | | | | | | | | | | | | | |
| 4.250%, due 04/25/2019 | | | 4.250 | % | | | 12/20/2015 | | | Citibank N.A. | | | 0.70 | % | | | 2,700,000 | | | | (52,666 | ) | | | (74,254 | ) | | | 21,588 | |
| | | | | | | | |
| Government of France | | | | | | | | | | | | | | | | | | | | | | | | | | | | | | |
| 4.250%, due 04/25/2019 | | | 0.250 | % | | | 6/20/2015 | | | Deutsche Bank AG | | | 0.62 | % | | | 3,000,000 | | | | (43,566 | ) | | | (98,285 | ) | | | 54,719 | |
| | | | | | | | |
| Government of France | | | | | | | | | | | | | | | | | | | | | | | | | | | | | | |
| 4.250%, due 04/25/2019 | | | 0.250 | % | | | 6/20/2015 | | | JPMorgan Chase Bank N.A. | | | 0.62 | % | | | 2,800,000 | | | | (40,662 | ) | | | (98,833 | ) | | | 58,171 | |
| | | | | | | | |
| Government of France | | | | | | | | | | | | | | | | | | | | | | | | | | | | | | |
| 4.250%, due 04/25/2019 | | | 0.250 | % | | | 12/20/2015 | | | JPMorgan Chase Bank N.A. | | | 0.70 | % | | | 11,000,000 | | | | (214,564 | ) | | | (221,148 | ) | | | 6,584 | |
| | | | | | | | |
| Government of Japan | | | | | | | | | | | | | | | | | | | | | | | | | | | | | | |
| 2.000% due 03/21/2022 | | | 1.000 | % | | | 12/20/2015 | | | Deutsche Bank AG | | | 0.79 | % | | | 1,100,000 | | | | 9,896 | | | | 22,879 | | | | (12,983 | ) |
| | | | | | | | |
| Government of Japan | | | | | | | | | | | | | | | | | | | | | | | | | | | | | | |
| 2.000% due 03/21/2022 | | | 1.000 | % | | | 12/20/2015 | | | Goldman Sachs & Co. | | | 0.79 | % | | | 4,400,000 | | | | 39,583 | | | | 92,772 | | | | (53,189 | ) |
| | | | | | | | |
| Government of Japan | | | | | | | | | | | | | | | | | | | | | | | | | | | | | | |
| 2.000% due 03/21/2022 | | | 1.000 | % | | | 12/20/2015 | | | Goldman Sachs & Co. | | | 0.79 | % | | | 5,500,000 | | | | 49,479 | | | | 113,527 | | | | (64,048 | ) |
| | | | | | | | |
| Government of Japan | | | | | | | | | | | | | | | | | | | | | | | | | | | | | | |
| 2.000% due 03/21/2022 | | | 1.000 | % | | | 12/20/2015 | | | Goldman Sachs & Co. | | | 0.79 | % | | | 2,300,000 | | | | 20,691 | | | | 51,101 | | | | (30,410 | ) |
| | | | | | | | |
| Government of Japan | | | | | | | | | | | | | | | | | | | | | | | | | | | | | | |
| 2.000% due 03/21/2022 | | | 1.000 | % | | | 12/20/2015 | | | JPMorgan Chase Bank N.A. | | | 0.79 | % | | | 4,500,000 | | | | 40,483 | | | | 92,584 | | | | (52,101 | ) |
| | | | | | | | |
| United Kingdom Gilt | | | | | | | | | | | | | | | | | | | | | | | | | | | | | | |
| 4.250%, due 06/07/2032 | | | 1.000 | % | | | 6/20/2015 | | | Citibank N.A. | | | 0.48 | % | | | 4,300,000 | | | | 87,506 | | | | 34,941 | | | | 52,565 | |
| | | | | | | | |
| United Kingdom Gilt | | | | | | | | | | | | | | | | | | | | | | | | | | | | | | |
| 4.250%, due 06/07/2032 | | | 1.000 | % | | | 12/20/2015 | | | Credit Suisse Group AG | | | 0.53 | % | | | 2,100,000 | | | | 42,586 | | | | 49,257 | | | | (6,671 | ) |
| | | | | | | | |
| United Kingdom Gilt | | | | | | | | | | | | | | | | | | | | | | | | | | | | | | |
| 4.250%, due 06/07/2032 | | | 1.000 | % | | | 6/20/2015 | | | Deutsche Bank AG | | | 0.48 | % | | | 5,100,000 | | | | 103,787 | | | | 43,721 | | | | 60,066 | |
| | | | | | | | |
| United Kingdom Gilt | | | | | | | | | | | | | | | | | | | | | | | | | | | | | | |
| 4.250%, due 06/07/2032 | | | 1.000 | % | | | 6/20/2015 | | | Deutsche Bank AG | | | 0.48 | % | | | 1,800,000 | | | | 36,631 | | | | 8,559 | | | | 28,072 | |
| | | | | | | | |
| United Kingdom Gilt | | | | | | | | | | | | | | | | | | | | | | | | | | | | | | |
| 4.250%, due 06/07/2032 | | | 1.000 | % | | | 12/20/2015 | | | Deutsche Bank AG | | | 0.53 | % | | | 2,700,000 | | | | 54,753 | | | | 62,664 | | | | (7,911 | ) |
| | | | | | | | |
| Petrobras International Bond | | | | | | | | | | | | | | | | | | | | | | | | | | | | | | |
| 8.375%, due 12/10/2018 | | | 1.000 | % | | | 9/20/2012 | | | Deutsche Bank AG | | | 0.69 | % | | | 700,000 | | | | 2,695 | | | | (8,684 | ) | | | 11,379 | |
| | | | | | | | |
| Government of Spain | | | | | | | | | | | | | | | | | | | | | | | | | | | | | | |
| 5.500%, due 7/30/2017 | | | 1.000 | % | | | 3/20/2016 | | | Goldman Sachs & Co. | | | 2.57 | % | | | 1,300,000 | | | | (86,698 | ) | | | (74,096 | ) | | | (12,602 | ) |
| | | | | | | | |
| Government of Japan | | | | | | | | | | | | | | | | | | | | | | | | | | | | | | |
| 2.000% due 03/21/2022 | | | 1.000 | % | | | 6/20/2016 | | | Citibank N.A. | | | 0.87 | % | | | 9,500,000 | | | | 60,248 | | | | (4,643 | ) | | | 64,891 | |
| | | | | | | | | | | | | | | | | | | | | | | | | | | | | | |
| Total | | | | | | | | | | | | | | | | | | | | $ | (191,431 | ) | | $ | (353,900 | ) | | $ | 162,469 | |
| | | | | | | | | | | | | | | | | | | | | | | | | | | | | | |
37
MET INVESTORS SERIES TRUST
| | |
PIMCO Inflation Protected Bond Portfolio | | |
Notes to Financial Statements—June 30, 2011 (Unaudited)—(Continued)
9. Swap Agreements - continued
Credit Default Swaps on Credit Indices - Sell Protection (d)
| | | | | | | | | | | | | | | | | | | | | | | | | | | | | | |
Reference
Obligation | | Fixed Deal
(Pay) Rate | | | Maturity
Date | | | Counterparty | | Implied Credit
Spread at
June 30, 2011 (b) | | | Notional
Amount (c) | | | Market
Value | | | Upfront
Premium
Paid/(Received) | | | Unrealized
Appreciation/
(Depreciation) | |
| | | | | | | | |
| CDX.EM.14 | | | 5.000 | % | | | 12/20/2015 | | | Deutsche Bank AG | | | 2.07 | % | | $ | 3,200,000 | | | $ | 389,110 | | | $ | 474,400 | | | $ | (85,290 | ) |
| | | | | | | | |
| CDX.EM.14 | | | 5.000 | % | | | 12/20/2015 | | | Morgan Stanley | | | 2.07 | % | | | 7,000,000 | | | | 851,177 | | | | 987,000 | | | | (135,823 | ) |
| | | | | | | | |
| CDX.EM.14 | | | 5.000 | % | | | 12/20/2015 | | | UBS AG | | | 2.07 | % | | | 4,200,000 | | | | 510,706 | | | | 592,200 | | | | (81,494 | ) |
| | | | | | | | |
| CDX.EM.14 | | | 5.000 | % | | | 12/20/2015 | | | Citibank N.A. | | | 2.07 | % | | | 30,900,000 | | | | 3,757,339 | | | | 4,143,505 | | | | (386,166 | ) |
| | | | | | | | |
| CDX.NA.IG.16 | | | 1.000 | % | | | 6/20/2016 | | | Goldman Sachs & Co. | | | 0.92 | % | | | 22,300,000 | | | | 83,233 | | | | 44,587 | | | | 38,646 | |
| | | | | | | | |
| CDX.EM.15 | | | 5.000 | % | | | 6/20/2016 | | | Barclays Bank plc | | | 2.12 | % | | | 2,500,000 | | | | 327,466 | | | | 337,500 | | | | (10,034 | ) |
| | | | | | | | | | | | | | | | | | | | | | | | | | | | | | |
| Total | | | | | | | | | | | | | | | | | | | | $ | 5,919,031 | | | $ | 6,579,192 | | | $ | (660,161 | ) |
| | | | | | | | | | | | | | | | | | | | | | | | | | | | | | |
BRL—Brazilian Real
EUR—Euro
MXN—Mexican Peso
USD—United States Dollar
IG—Investment Grade
NA—North America
| (a) | | If the Portfolio is a buyer of protection and a credit event occurs, as defined under the terms of that particular swap agreement, the Portfolio will either (i) receive from the seller of protection an amount equal to the notional amount of the swap and deliver the referenced obligation or underlying securities comprising the referenced index or (ii) receive a net settlement amount in the form of cash or securities equal to the notional amount of the swap less the recovery value of the referenced obligation or underlying securities comprising the referenced index. |
| (b) | | Implied credit spreads, represented in absolute terms, utilized in determining the market value of credit default swap agreements on corporate issues or sovereign issues of an emerging country as of period end serve as an indicator of the current status of the payment/performance risk and represent the likelihood or risk of default for the credit derivative. The implied credit spread of a particular referenced entity reflects the cost of buying/selling protection and may include upfront payments required to be made to enter into the agreement. Wider credit spreads represent a deterioration of the referenced entity’s credit soundness and a greater likelihood or risk of default or other credit event occurring as defined under the terms of the agreement. A credit spread identified as “Defaulted” indicates a credit event has occurred for the referenced entity or obligation. |
| (c) | | The maximum potential amount of future undiscounted payments that the Portfolio could be required to make under a credit default swap contract would be the notional amount of the contract. These potential amounts would be partially offset by any recovery values of the referenced debt obligation or net amounts received from the settlement purchased protection credit default swap contracts entered into by the Portfolio for the same referenced debt obligation. |
| (d) | | If the Portfolio is a seller of protection and a credit event occurs, as defined under the terms of that particular swap agreement, the Portfolio will either (i) pay to the buyer of protection an amount equal to the notional amount of the swap and take delivery of the referenced obligation or underlying securities comprising the referenced index or (ii) pay a net settlement amount in the form of cash or securities equal to the notional amount of the swap less the recovery value of the referenced obligation or underlying securities comprising the referenced index. |
10. Contractual Obligations
The Trust has a variety of indemnification obligations under contracts with its service providers. The Trust’s maximum exposure under these arrangements is unknown.
11. Market, Credit and Counterparty Risk
In the normal course of business, the Portfolio invests in securities and enters into transactions where risks exist due to fluctuations in the market (market risk) or failure of the other party to a transaction to perform (credit and counterparty risk). The value of securities held by the Portfolio may decline in response to certain events, including those directly involving the companies whose securities are owned by the Portfolio; conditions affecting the general economy; overall market changes; local, regional or global political, social or economic instability; and currency and interest rate and price fluctuations. The Portfolio may be exposed to counterparty risk, or the risk that an entity with which the Portfolio has unsettled or open transactions may default. The potential loss could exceed the value of the financial assets recorded in the financial statements. Financial assets that potentially expose the Portfolio to credit risk consist principally of cash due from counterparties and investments. In order to preserve certain safeguards for derivatives and non-standard settlement trades, the Portfolio restricts its exposure to credit losses by entering into master netting agreements with counterparties (approved brokers) with whom it undertakes a significant volume of transactions. The Portfolio
38
MET INVESTORS SERIES TRUST
| | |
PIMCO Inflation Protected Bond Portfolio | | |
Notes to Financial Statements—June 30, 2011 (Unaudited)—(Continued)
11. Market, Credit and Counterparty Risk - continued
reduces the credit risk associated with favorable contracts by entering into a master netting arrangement to the extent that all amounts with the counterparty are terminated and settled on a net basis if an event of default occurs. The Portfolio’s overall exposure to credit risk on derivative instruments subject to master netting arrangements can change substantially within a short period, as it is affected by each transaction subject to the arrangement.
12. Income Tax Information
The tax character of distributions paid for the six months ended December 31, 2010 and 2009 were as follows:
| | | | | | | | | | | | | | | | | | | | |
| Ordinary Income | | | Long-Term Capital Gain | | | Total | |
| 2010 | | 2009 | | | 2010 | | | 2009 | | | 2010 | | | 2009 | |
| | | | | |
| $123,896,040 | | $ | 59,876,258 | | | $ | — | | | $ | — | | | $ | 123,896,040 | | | $ | 59,876,258 | |
As of December 31, 2010, the components of distributable earnings (accumulated losses) on a federal income tax basis were as follows:
| | | | | | | | | | | | | | | | |
Undistributed
Ordinary
Income | | Undistributed
Long-Term Capital
Gain | | | Net
Unrealized
Depreciation | | | Loss Carryforwards | | | Total | |
| | | | |
| $189,578,043 | | $ | 6,687,579 | | | $ | (50,485,392 | ) | | $ | — | | | | 145,780,230 | |
The Regulated Investment Company Modernization Act of 2010 (the “Act”) was signed into law by President Obama on December 22, 2010.
The Act makes a number of changes to the provisions in the Code relating to regulated investment companies (“RICs”) that will generally become effective for taxable years of RICs beginning after December 22, 2010. The Act allows RICs to generally carryover net capital losses indefinitely, effective for losses arising in taxable years beginning after December 22, 2010. Such losses will retain their character as either long-term capital losses or short-term capital losses. Under pre-enactment law, capital losses could be carried forward for eight years and carried forward as short-term capital losses irrespective of the character of the original loss. Loss carryovers from years beginning prior to December 22, 2010 will still expire subject to the eight-year limitation. The Act further provides that losses arising in taxable years after December 22, 2010 (which are carried forward indefinitely) would be utilized prior to loss carryovers arising in taxable years beginning prior to December 22, 2010.
13. Recent Accounting Pronouncements
In January 2010, the Financial Accounting Standards Board (“FASB”) issued Accounting Standards Update No. 2010-06, “Improving Disclosures About Fair Value Measurements” (“ASU”) which was generally effective for years beginning after December 15, 2009 and was adopted by the Portfolio. The ASU requires enhanced disclosures about purchases, sales, issuances and settlements on a gross basis relating to Level 3 fair value measurements. These enhanced disclosures became effective for fiscal years beginning after December 15, 2010, and for interim periods within those years. Management has evaluated the impact of ASU 2010-06 and has concluded that ASU 2010-06 has no material impact on these financial statements.
In May 2011, FASB issued Accounting Standards Update (ASU) No. 2011-04 “Amendments to Achieve Common Fair Value Measurement and Disclosure Requirements in GAAP and the International Financial Reporting Standards (IFRS).” ASU 2011-04 includes common requirements for measurement of and disclosure about fair value between U.S. GAAP and IFRS. ASU 2011-04 will require reporting entities to categorize within Level 3 of the fair value hierarchy: quantitative information about the unobservable inputs used in the fair value measurement, the valuation processes used by the reporting entity and a narrative description of the sensitivity of the fair value measurement to changes in unobservable inputs and the interrelationships between those unobservable inputs. In addition, ASU 2011-04 will require reporting entities to make disclosures about amounts and reasons for all transfers in and out of Level 1 and Level 2 fair value measurements. The new and revised disclosures are effective for fiscal years beginning after December 15, 2011 and for interim periods within those fiscal years. Management is currently evaluating the implications of ASU 2011-04 and its impact on the financial statements.
39
MET INVESTORS SERIES TRUST
| | |
PIMCO Inflation Protected Bond Portfolio | | |
Quarterly Portfolio Schedule
The Trust files Form N-Q for the first and third quarters of each fiscal year. The Trust’s Forms N-Q will be available on the Securities and Exchange Commission’s website at http://www.sec.gov. The Trust’s Forms N-Q may be reviewed and copied at the Securities and Exchange Commission’s Public Reference Room in Washington, D.C. and information on the operation of the Public Reference Room may be obtained by calling 1-800-SEC-0330. Once filed, the most recent Form N-Q will be available without charge, upon request, by calling (800) 848-3854.
Proxy Voting Policies and Procedures
A description of the policies and procedures that the Trust uses to determine how to vote proxies relating to portfolio securities is available without charge, upon request, by calling (800) 848-3854 and on the Securities and Exchange Commission’s website at http://www.sec.gov.
Proxy Voting Record
The Trust, on behalf of each of its Portfolios, has filed with the Securities and Exchange Commission its proxy voting record for the 12-month period ending June 30 on Form N-PX. Form N-PX must be filed by the Trust each year by August 31. Once filed, the most recent Form N-PX will be available without charge, upon request, by calling (800) 848-3854 or on the Securities and Exchange Commission’s website at http://www.sec.gov.
40
Simplify your life…
with MetLife eDelivery® while helping MetLife preserve the planet’s natural resources.
(see details on inside cover)
| | |
Met Investors Series Trust PIMCO Total Return Portfolio Semiannual Report | | June 30, 2011, as amended December 16, 2011 |
MET INVESTORS SERIES TRUST
| | |
PIMCO Total Return Portfolio | | |
Managed by Pacific Investment Management Company LLC
Portfolio Manager Commentary*
Performance
For the six-month period ended June 30, 2011, the Class A, B, and E shares of the PIMCO Total Return Portfolio returned 3.00%, 2.82% and 2.94%, respectively, compared to its benchmark, the Barclays Capital U.S. Aggregate Bond Index1, which returned 2.72%.
Market Environment/Conditions
Concern about political unrest across the Middle East/North Africa, the strongest earthquake on record in Japan, and the sovereign debt crisis in the Eurozone sparked a flight to safety and boosted demand for Treasuries during the first half of the year. The Barclays Capital U.S. Aggregate (BCAG) Bond Index, a widely used index of U.S. high-grade bonds, returned 2.72 percent during the first half of 2011.
The Treasury rally stalled late during the final days of the first half of the year as Greece’s parliament approved austerity measures, easing concerns (at least temporarily) about the potential for the Euro area’s first sovereign default. In addition, U.S. manufacturing businesses unexpectedly expanded at a faster pace in June, suggesting that the supply chain disruption from the Japanese earthquake was easing.
Another indicator that raised hopes for stronger growth in the second half of 2011 was falling commodity prices. Lower retail fuel prices relieved some stress on consumers coping with an official unemployment rate over 9 percent and continued weakness in residential property markets. On June 30 the Federal Reserve (Fed) ended its $600 billion program of buying Treasuries known as QE2, and indicated its intent to continue buying Treasuries with proceeds from maturing debt on its $2.9 trillion balance sheet. The Fed also reiterated its “extended period” language for a near-zero federal funds rate.
Portfolio Review/Current Positioning
Exposure to non-U.S. developed interest rates, particularly core Europe, added to returns as rates fell on fears of a global economic slowdown; however, an underweight to U.S. duration detracted from returns as rates fell. A focus on shorter maturities, implemented via money market futures, added to performance as these contracts increased in price during the first half of the year. An overweight to emerging markets, especially to dollar denominated debt in Brazil and emerging market corporates in Russia were positive for performance. An underweight to Agency mortgage-backed securities (MBS) detracted from performance as the sector outperformed like-duration Treasuries during the period; however, exposure to Non-Agency mortgages partially mitigated some of this negative impact. An overweight to bonds of banks, finance companies, and life insurers all added to performance as these sectors outpaced the broader corporate market amid improving balance sheets and higher profits. Additionally, exposure to Build America Bonds (BABs) added to performance, given the light supply and reduced negative headlines for municipals. Finally, exposure to emerging market currencies added to returns as these currencies appreciated versus the U.S. dollar.
In regards to Portfolio positioning as of June 30, 2011, PIMCO has been broadening sources of Portfolio returns and reducing overall risk exposures in light of market uncertainties. We have maintained an underweight to duration overall. The focus of the duration is on the short end of the yield curve, where markets are pricing in more and faster Fed tightening than we foresee. This offers potential to gain from “roll down”, or the maturing of bonds along the relatively steep short maturity curve. We have retained Agency mortgages as important source of high quality income. We continued to hold non-Agency mortgages and commercial mortgage-backed securities (CMBS) that have senior positions in the capital structure as another source of attractive yield. In the corporate sector, we have maintained an overweight to banking/financial credits, which are attractively valued vs. the broader market. We continued to favor Build America Bonds, seeking to capture their attractive valuations relative to corporates. Additionally, we continued to own corporate and quasi-sovereign bonds in high quality countries; taking exposure to relatively high nominal and real local interest rates in Brazil. The portfolio also held long positions in relatively high yielding, high quality emerging market currencies as well as commodity-based, fiscally sound currencies such as Norway and Canada.
William H. Gross, CFA
Managing Director, Co-Chief Investment Officer
Pacific Investment Management Company LLC
*This commentary may include statements that constitute “forward-looking statements” under the U.S. securities laws. Forward-looking statements include, among other things, projections, estimates, and information about possible or future results related to the Portfolio, market or regulatory developments. The views expressed above are not guarantees of future performance or economic results and involve certain risks, uncertainties and assumptions that could cause actual outcomes and results to differ materially from the views expressed herein. The views expressed above are subject to change at any time based upon economic, market, or other conditions and the subadvisory firm undertakes no obligation to update the views expressed herein. Any discussions of specific securities should not be considered a recommendation to buy or sell those securities. The views expressed above (including any forward-looking statement) may not be relied upon as investment advice or as an indication of the Portfolio’s trading intent. Information about the Portfolio’s holdings, asset allocation or country diversification is historical and is not an indication of future Portfolio composition, which may vary. Direct investment in any index is not possible. The performance of any index mentioned in this commentary has not been adjusted for ongoing management, distribution and operating expenses, and sales charges applicable to mutual fund investments. In addition, the returns do not reflect additional fees charged by separate accounts or variable insurance contracts that an investor in the Portfolio may pay. If these additional fees were reflected, performance would have been lower.
1
MET INVESTORS SERIES TRUST
| | |
PIMCO Total Return Portfolio | | |
Portfolio Composition as of June 30, 2011
Top Issuers
| | | | |
| | | % of
Net Assets | |
Fannie Mae | | | 27.0 | |
Japan Treasury Bills | | | 20.0 | |
Freddie Mac | | | 3.5 | |
Citigroup, Inc. | | | 1.8 | |
Barclays Bank plc | | | 1.8 | |
Brazil Notas do Tesouro Nacional | | | 1.8 | |
U.S. Treasury Notes | | | 1.6 | |
Wells Fargo & Co. | | | 1.5 | |
JPMorgan Chase & Co. | | | 1.5 | |
U.S. Treasury Inflation Index Bonds | | | 1.1 | |
Top Sectors
| | | | |
| | | % of
Market Value of
Total Investments | |
U.S. Treasury & Government Agencies | | | 30.1 | |
Domestic Bonds & Debt Securities | | | 24.6 | |
Foreign Bonds & Debt Securities | | | 24.2 | |
Cash & Equivalents | | | 10.0 | |
Mortgage-Backed Securities | | | 4.4 | |
Municipals | | | 2.9 | |
Asset-Backed Securities | | | 1.7 | |
Preferred Stocks | | | 0.9 | |
Convertible Preferred Stocks | | | 0.9 | |
Loan Participation | | | 0.3 | |
2
MET INVESTORS SERIES TRUST
| | |
PIMCO Total Return Portfolio | | |
PIMCO Total Return Portfolio managed by
Pacific Investment Management Company LLC vs. Barclays Capital U.S. Aggregate Bond Index1
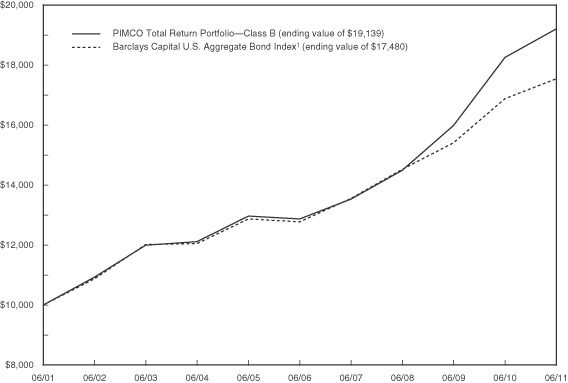
| | | | | | | | | | | | | | | | | | | | |
| | | Average Annual Return2
(for the six months ended June 30, 2011) | |
| | | 6 Month | | | 1 Year | | | 5 Year | | | 10 Year | | | Since
Inception3 | |
PIMCO Total Return
Portfolio—Class A | | | 3.00% | | | | 5.53% | | | | 8.58% | | | | 6.97% | | | | — | |
| Class B | | | 2.82% | | | | 5.22% | | | | 8.31% | | | | 6.70% | | | | — | |
| Class E | | | 2.94% | | | | 5.33% | | | | 8.42% | | | | — | | | | 6.26% | |
| Barclays Capital U.S. Aggregate Bond Index1 | | | 2.72% | | | | 3.90% | | | | 6.52% | | | | 5.74% | | | | — | |
The performance of Class B shares, as set forth in the line graph above, will differ from that of the other classes because of the difference in expenses paid by policyholders investing in the different share classes.
1 The Barclays Capital U.S. Aggregate Bond Index is a broad-based benchmark that measures the investment grade, U.S. dollar-denominated, fixed-rate taxable bond market, including Treasuries, government-related and corporate securities, MBS, ABS, and CMBS.
2“Average Annual Return” is calculated including reinvestment of all income dividends and capital gain distributions.
3 Inception of the Class A shares is 5/1/01. Inception of the Class B shares is 2/12/01. Inception of the Class E shares is 11/1/01. Index returns are based on an inception date of 2/12/01.
Past performance does not guarantee future results. The investment return and principal value of an investment in the Portfolio will fluctuate, so that shares, on any given day or when redeemed, may be worth more or less than their original cost. Performance numbers are net of all Portfolio expenses but do not include any insurance, sales, or administration charges of variable annuity or life insurance contracts. If these charges were included, the returns would be lower. The Index does not include fees or expenses and is not available for direct investment.
3
MET INVESTORS SERIES TRUST
| | |
PIMCO Total Return Portfolio | | |
Understanding Your Portfolio’s Expenses
Shareholder Expense Example
As a shareholder of the Portfolio, you incur ongoing costs, including management fees; distribution and service (12b-1) fees; and other Portfolio expenses. This example is intended to help you understand your ongoing costs (in dollars) (referred to as “expenses”) of investing in the Portfolio and compare these costs with the ongoing costs of investing in other mutual funds. The example is based on an investment of $1,000 invested at the beginning of the period and held for the entire period, January 1, 2011 through June 30, 2011 .
Actual Expenses
The first line for each share class of the Portfolio in the table below provides information about actual account values and actual expenses. You may use the information in this line, together with the amount you invested in the particular share class of the Portfolio, to estimate the expenses that you paid over the period. Simply divide your account value by $1,000 (for example, an $8,600 account value divided by $1,000 = 8.6), then multiply the result by the number in the first line under the heading entitled “Expenses Paid During Period” to estimate the expenses you paid on your account during this period.
Hypothetical Example for Comparison Purposes
The second line for each share class of the Portfolio in the table below provides information about hypothetical account values and hypothetical expenses based on the Portfolio’s actual expense ratio and an assumed rate of return of 5% per year before expenses, which is not the Portfolio’s actual return. The hypothetical account values and expenses may not be used to estimate the actual ending account balance or expenses you paid for the period. You may use this information to compare the ongoing costs of investing in the Portfolio and other funds. To do so, compare this 5% hypothetical example with the 5% hypothetical examples that appear in the shareholder reports of the other funds.
Please note that the expenses shown in the table are meant to highlight your ongoing costs only and do not reflect any fees or charges of your variable insurance product or any additional expenses that participants in certain eligible qualified plans may bear relating to the operations of their plan. Therefore, the second line for each share class in the table is useful in comparing ongoing costs only, and will not help you determine the relative total costs of owning different funds. In addition, if these other costs were included, your costs would have been higher.
| | | | | | | | | | | | | | | | |
| | | Annualized
Expense
Ratio | | | Beginning
Account Value
January 1, 2011 | | | Ending
Account Value
June 30, 2011 | | | Expenses Paid
During Period**
January 1, 2011
to June 30, 2011 | |
| | | | | | | | | | | | | | | | |
| | | | |
| | | | | | | | | | | | | | | | |
Class A | | | | | | | | | | | | | | | | |
Actual | | | 0.51% | | | $ | 1,000.00 | | | $ | 1,030.00 | | | $ | 2.57 | |
Hypothetical* | | | 0.51% | | | | 1,000.00 | | | | 1,022.27 | | | | 2.56 | |
| | | | | | | | | | | | | | | | |
| | | | |
| | | | | | | | | | | | | | | | |
Class B | | | | | | | | | | | | | | | | |
Actual | | | 0.76% | | | $ | 1,000.00 | | | $ | 1,028.20 | | | $ | 3.82 | |
Hypothetical* | | | 0.76% | | | | 1,000.00 | | | | 1,021.03 | | | | 3.81 | |
| | | | | | | | | | | | | | | | |
| | | | |
| | | | | | | | | | | | | | | | |
Class E | | | | | | | | | | | | | | | | |
Actual | | | 0.66% | | | $ | 1,000.00 | | | $ | 1,029.40 | | | $ | 3.32 | |
Hypothetical* | | | 0.66% | | | | 1,000.00 | | | | 1,021.52 | | | | 3.31 | |
| | | | | | | | | | | | | | | | |
* Hypothetical assumes a rate of return of 5% per year before expenses.
** Expenses paid are equal to the Portfolio’s annualized expense ratio for the most recent six month period, as shown above, multiplied by the average account value over the period, multiplied by the number of days (181 days) in the most recent fiscal half-year, divided by 365 (to reflect the one-half year period).
4
MET INVESTORS SERIES TRUST
| | |
PIMCO Total Return Portfolio | | |
Schedule of Investments as of June 30, 2011 (Unaudited)
U.S. Treasury & Government Agencies—33.9% of Net Assets
| | | | | | | | |
| Security Description | | Par
Amount | | | Value | |
| | | | | | | | |
|
| Agency Sponsored Mortgage-Backed—30.4% | |
Fannie Mae
8.000%, 08/01/14 | | $ | 2,049 | | | $ | 2,201 | |
Fannie Mae 10 Yr. Pool
4.500%, 01/01/13 | | | 255,524 | | | | 266,200 | |
4.500%, 03/01/13 | | | 231,487 | | | | 236,089 | |
4.500%, 04/01/13 | | | 539,767 | | | | 567,246 | |
4.000%, 08/01/13 | | | 79,000 | | | | 82,485 | |
3.500%, 09/01/13 | | | 43,782 | | | | 44,512 | |
4.000%, 09/01/13 | | | 215,355 | | | | 224,954 | |
4.500%, 09/01/13 | | | 540,908 | | | | 568,441 | |
3.500%, 10/01/13 | | | 62,512 | | | | 63,640 | |
4.000%, 12/01/13 | | | 553,502 | | | | 566,111 | |
4.500%, 12/01/13 | | | 341,435 | | | | 362,671 | |
4.000%, 03/01/14 | | | 19,417 | | | | 19,947 | |
4.500%, 03/01/14 | | | 785,244 | | | | 823,757 | |
4.000%, 05/01/14 | | | 784,645 | | | | 819,116 | |
3.500%, 06/01/14 | | | 16,810 | | | | 17,184 | |
4.000%, 06/01/14 | | | 412,643 | | | | 427,098 | |
3.500%, 07/01/14 | | | 30,198 | | | | 30,870 | |
4.000%, 07/01/14 | | | 9,708 | | | | 10,120 | |
4.000%, 09/01/15 | | | 6,256 | | | | 6,476 | |
5.500%, 04/01/16 | | | 133,173 | | | | 144,776 | |
5.500%, 06/01/16 | | | 45,418 | | | | 48,219 | |
5.500%, 06/01/16 | | | 30,625 | | | | 33,379 | |
5.500%, 08/01/17 | | | 12,394 | | | | 13,269 | |
5.500%, 09/01/18 | | | 756,897 | | | | 820,963 | |
5.500%, 10/01/18 | | | 352,363 | | | | 382,127 | |
Fannie Mae 15 Yr. Pool
5.500%, 03/01/13 | | | 10,318 | | | | 11,195 | |
5.500%, 11/01/13 | | | 9,294 | | | | 10,083 | |
6.500%, 12/01/13 | | | 2,059 | | | | 2,115 | |
5.500%, 01/01/14 | | | 13,355 | | | | 14,490 | |
5.500%, 02/01/14 | | | 11,220 | | | | 12,173 | |
5.500%, 03/01/14 | | | 11,042 | | | | 11,980 | |
5.500%, 04/01/14 | | | 141,828 | | | | 153,874 | |
5.500%, 04/01/14 | | | 12,102 | | | | 13,130 | |
5.500%, 06/01/14 | | | 12,437 | | | | 13,493 | |
5.500%, 09/01/14 | | | 690,065 | | | | 748,678 | |
5.500%, 12/01/14 | | | 209,309 | | | | 227,087 | |
5.500%, 08/01/15 | | | 2,074,032 | | | | 2,171,346 | |
5.500%, 03/01/16 | | | 21,418 | | | | 23,237 | |
6.500%, 04/01/16 | | | 50,524 | | | | 55,336 | |
6.500%, 06/01/16 | | | 27,145 | | | | 29,731 | |
6.500%, 07/01/16 | | | 77,220 | | | | 84,576 | |
6.500%, 08/01/16 | | | 4,900 | | | | 5,367 | |
| | | | | | | | |
|
| Agency Sponsored Mortgage-Backed—(Continued) | |
6.000%, 09/01/16 | | $ | 13,167 | | | $ | 14,398 | |
6.500%, 09/01/16 | | | 30,057 | | | | 32,919 | |
6.500%, 10/01/16 | | | 64,374 | | | | 70,505 | |
5.500%, 11/01/16 | | | 12,855 | | | | 13,955 | |
5.500%, 12/01/16 | | | 11,436 | | | | 12,415 | |
5.500%, 01/01/17 | | | 14,180 | | | | 15,391 | |
6.500%, 02/01/17 | | | 43,759 | | | | 47,927 | |
6.000%, 03/01/17 | | | 12,249 | | | | 13,409 | |
6.000%, 04/01/17 | | | 28,778 | | | | 31,505 | |
6.000%, 06/01/17 | | | 23,675 | | | | 25,919 | |
6.000%, 07/01/17 | | | 66,077 | | | | 72,340 | |
6.500%, 07/01/17 | | | 51,947 | | | | 56,896 | |
5.500%, 09/01/17 | | | 14,514 | | | | 15,765 | |
5.500%, 10/01/17 | | | 11,352 | | | | 12,331 | |
6.500%, 10/01/17 | | | 16,058 | | | | 17,587 | |
5.500%, 12/01/17 | | | 15,301 | | | | 16,760 | |
5.500%, 01/01/18 | | | 484,789 | | | | 526,538 | |
5.500%, 02/01/18 | | | 3,905,133 | | | | 4,241,732 | |
5.500%, 02/01/18 | | | 183,517 | | | | 199,105 | |
4.500%, 06/01/18 | | | 203,979 | | | | 218,333 | |
5.500%, 11/01/18 | | | 13,481 | | | | 14,641 | |
5.500%, 09/01/20 | | | 60,260 | | | | 65,566 | |
5.500%, 12/01/20 | | | 13,238 | | | | 14,379 | |
4.000%, 03/01/22 | | | 290,134 | | | | 307,105 | |
5.500%, 03/01/22 | | | 1,266,738 | | | | 1,373,865 | |
5.500%, 04/01/22 | | | 530,981 | | | | 580,230 | |
5.500%, 04/01/22 | | | 41,485 | | | | 44,993 | |
5.500%, 07/01/22 | | | 846,806 | | | | 919,983 | |
5.500%, 09/01/22 | | | 368,469 | | | | 399,630 | |
5.500%, 10/01/22 | | | 2,549,778 | | | | 2,770,510 | |
5.500%, 11/01/22 | | | 683,410 | | | | 741,261 | |
5.500%, 12/01/22 | | | 637,214 | | | | 691,202 | |
4.500%, 01/01/23 | | | 2,001,633 | | | | 2,128,776 | |
4.500%, 02/01/23 | | | 1,434,870 | | | | 1,525,976 | |
5.500%, 02/01/23 | | | 882,153 | | | | 956,797 | |
5.500%, 03/01/23 | | | 119,299 | | | | 129,388 | |
4.500%, 04/01/23 | | | 2,338,947 | | | | 2,487,457 | |
4.500%, 05/01/23 | | | 2,451,134 | | | | 2,606,767 | |
4.500%, 06/01/23 | | | 3,956,058 | | | | 4,207,245 | |
4.500%, 07/01/23 | | | 2,410,460 | | | | 2,563,511 | |
5.500%, 07/01/23 | | | 62,090 | | | | 67,351 | |
5.500%, 08/01/23 | | | 420,232 | | | | 455,771 | |
5.500%, 10/01/23 | | | 530,736 | | | | 575,702 | |
5.500%, 11/01/23 | | | 103,202 | | | | 112,612 | |
5.500%, 12/01/23 | | | 265,951 | | | | 288,707 | |
See accompanying notes to financial statements.
5
MET INVESTORS SERIES TRUST
| | |
PIMCO Total Return Portfolio | | |
Schedule of Investments as of June 30, 2011 (Unaudited)
U.S. Treasury & Government Agencies—(Continued)
| | | | | | | | |
| Security Description | | Par
Amount | | | Value | |
| | | | | | | | |
|
| Agency Sponsored Mortgage-Backed—(Continued) | |
4.500%, 01/01/24 | | $ | 329,822 | | | $ | 350,403 | |
5.500%, 01/01/24 | | | 75,460 | | | | 81,853 | |
4.500%, 03/01/24 | | | 15,465,189 | | | | 16,438,732 | |
4.000%, 04/01/24 | | | 351,785 | | | | 367,415 | |
4.500%, 04/01/24 | | | 2,221,765 | | | | 2,362,469 | |
4.500%, 05/01/24 | | | 6,051,877 | | | | 6,433,300 | |
4.000%, 07/01/24 | | | 734,446 | | | | 767,079 | |
5.500%, 09/01/24 | | | 296,734 | | | | 322,123 | |
4.500%, 10/01/24 | | | 1,619,561 | | | | 1,721,382 | |
4.000%, 11/01/24 | | | 409,846 | | | | 428,056 | |
4.000%, 12/01/24 | | | 717,501 | | | | 750,002 | |
5.500%, 01/01/25 | | | 5,529,862 | | | | 5,998,385 | |
4.000%, 02/01/25 | | | 851,595 | | | | 889,433 | |
4.000%, 03/01/25 | | | 1,527,361 | | | | 1,594,747 | |
4.500%, 04/01/25 | | | 927,604 | | | | 985,342 | |
4.000%, 05/01/25 | | | 4,349,160 | | | | 4,541,042 | |
4.000%, 06/01/25 | | | 1,310,215 | | | | 1,368,020 | |
4.000%, 07/01/25 | | | 7,895,676 | | | | 8,244,029 | |
4.500%, 07/01/25 | | | 481,170 | | | | 510,895 | |
3.500%, 08/01/25 | | | 1,815,989 | | | | 1,852,412 | |
4.000%, 08/01/25 | | | 35,654,898 | | | | 37,227,967 | |
3.500%, 09/01/25 | | | 410,337 | | | | 418,567 | |
4.000%, 09/01/25 | | | 47,486 | | | | 49,581 | |
3.500%, 10/01/25 | | | 875,000 | | | | 892,549 | |
4.000%, 10/01/25 | | | 2,381,647 | | | | 2,486,724 | |
3.500%, 11/01/25 | | | 4,943,757 | | | | 5,042,913 | |
4.500%, 11/01/25 | | | 633,089 | | | | 672,496 | |
3.500%, 12/01/25 | | | 19,865,484 | | | | 20,263,922 | |
4.000%, 12/01/25 | | | 8,434,435 | | | | 8,806,557 | |
3.500%, 01/01/26 | | | 8,015,192 | | | | 8,176,958 | |
3.500%, 02/01/26 | | | 15,704,021 | | | | 16,023,231 | |
4.000%, 02/01/26 | | | 17,847,910 | | | | 18,624,193 | |
3.500%, 03/01/26 | | | 4,208,512 | | | | 4,294,238 | |
4.000%, 03/01/26 | | | 25,696,034 | | | | 26,829,066 | |
3.500%, 04/01/26 | | | 8,069,549 | | | | 8,233,923 | |
4.000%, 04/01/26 | | | 2,568,522 | | | | 2,680,751 | |
4.000%, 04/01/26 | | | 658,064 | | | | 686,686 | |
3.500%, 05/01/26 | | | 12,366,679 | | | | 12,618,581 | |
3.500%, 05/01/26 | | | 1,225,139 | | | | 1,250,094 | |
4.000%, 05/01/26 | | | 2,084,829 | | | | 2,175,508 | |
3.500%, 06/01/26 | | | 104,119,781 | | | | 106,240,629 | |
4.000%, 06/01/26 | | | 4,215,922 | | | | 4,399,291 | |
3.500%, 07/01/26 | | | 10,227,269 | | | | 10,432,240 | |
4.000%, 07/01/26 | | | 140,748 | | | | 146,795 | |
4.500%, TBA (a) | | | 37,000,000 | | | | 39,231,544 | |
| | | | | | | | |
|
| Agency Sponsored Mortgage-Backed—(Continued) | |
5.500%, TBA (a) | | $ | 500,000 | | | $ | 541,953 | |
Fannie Mae 20 Yr. Pool | | | | | | | | |
6.000%, 08/01/18 | | | 14,183 | | | | 15,543 | |
6.000%, 12/01/18 | | | 21,487 | | | | 23,547 | |
5.500%, 02/01/19 | | | 71,407 | | | | 77,483 | |
6.000%, 02/01/19 | | | 32,832 | | | | 35,979 | |
6.000%, 06/01/22 | | | 2,463,542 | | | | 2,721,754 | |
5.500%, 09/01/22 | | | 31,005 | | | | 33,876 | |
6.000%, 09/01/22 | | | 636,162 | | | | 700,713 | |
5.500%, 10/01/22 | | | 138,735 | | | | 151,581 | |
6.000%, 10/01/22 | | | 416,462 | | | | 460,112 | |
6.000%, 01/01/23 | | | 779,179 | | | | 860,847 | |
5.500%, 06/01/23 | | | 1,081,819 | | | | 1,181,449 | |
5.500%, 03/01/25 | | | 2,044,232 | | | | 2,230,451 | |
5.500%, 11/01/26 | | | 75,796 | | | | 82,246 | |
5.500%, 01/01/27 | | | 379,145 | | | | 411,408 | |
5.500%, 06/01/27 | | | 72,482 | | | | 78,736 | |
5.500%, 08/01/27 | | | 773,753 | | | | 840,516 | |
5.500%, 11/01/27 | | | 281,798 | | | | 306,113 | |
6.000%, 11/01/27 | | | 58,899 | | | | 64,765 | |
5.500%, 12/01/27 | | | 662,768 | | | | 719,955 | |
5.500%, 03/01/28 | | | 326,998 | | | | 354,907 | |
5.500%, 04/01/28 | | | 892,291 | | | | 968,457 | |
5.500%, 05/01/28 | | | 410,028 | | | | 445,023 | |
5.500%, 06/01/28 | | | 126,450 | | | | 137,242 | |
5.500%, 07/01/28 | | | 72,861 | | | | 79,080 | |
5.500%, 09/01/28 | | | 1,134,229 | | | | 1,230,855 | |
6.000%, 09/01/28 | | | 358,109 | | | | 393,776 | |
5.500%, 10/01/28 | | | 194,038 | | | | 210,629 | |
6.000%, 10/01/28 | | | 316,657 | | | | 348,195 | |
5.500%, 12/01/28 | | | 86,080 | | | | 93,427 | |
5.500%, 01/01/29 | | | 1,104,782 | | | | 1,199,073 | |
5.500%, 07/01/29 | | | 395,799 | | | | 429,579 | |
5.500%, 10/01/29 | | | 1,020,701 | | | | 1,107,975 | |
5.500%, 04/01/30 | | | 1,222,315 | | | | 1,326,637 | |
Fannie Mae 30 Yr. Pool
8.000%, 11/01/13 | | | 2,061 | | | | 2,163 | |
8.000%, 10/01/25 | | | 3,412 | | | | 4,007 | |
6.000%, 12/01/28 | | | 150,102 | | | | 166,529 | |
6.000%, 01/01/29 | | | 106,866 | | | | 118,561 | |
6.000%, 02/01/29 | | | 541,314 | | | | 600,555 | |
6.000%, 04/01/29 | | | 15,903 | | | | 17,643 | |
6.000%, 06/01/29 | | | 23,352 | | | | 25,908 | |
5.000%, 09/01/30 | | | 241,813 | | | | 258,439 | |
7.500%, 09/01/30 | | | 2,405 | | | | 2,826 | |
See accompanying notes to financial statements.
6
MET INVESTORS SERIES TRUST
| | |
PIMCO Total Return Portfolio | | |
Schedule of Investments as of June 30, 2011 (Unaudited)
U.S. Treasury & Government Agencies—(Continued)
| | | | | | | | |
| Security Description | | Par
Amount | | | Value | |
| | | | | | | | |
|
| Agency Sponsored Mortgage-Backed—(Continued) | |
5.000%, 03/01/32 | | $ | 7,959 | | | $ | 8,549 | |
6.000%, 07/01/32 | | | 621,143 | | | | 689,121 | |
5.000%, 09/01/32 | | | 19,106 | | | | 20,437 | |
5.000%, 10/01/32 | | | 38,247 | | | | 40,913 | |
5.000%, 11/01/32 | | | 8,032 | | | | 8,591 | |
6.000%, 11/01/32 | | | 339,381 | | | | 376,523 | |
6.000%, 01/01/33 | | | 117,672 | | | | 129,220 | |
6.000%, 02/01/33 | | | 100,432 | | | | 111,423 | |
5.000%, 03/01/33 | | | 23,471 | | | | 25,089 | |
6.000%, 03/01/33 | | | 98,441 | | | | 109,214 | |
5.000%, 04/01/33 | | | 20,587,613 | | | | 22,006,332 | |
6.000%, 04/01/33 | | | 65,422 | | | | 72,581 | |
5.000%, 05/01/33 | | | 107,913,617 | | | | 115,350,084 | |
6.000%, 05/01/33 | | | 101,958 | | | | 113,117 | |
5.000%, 06/01/33 | | | 14,566,407 | | | | 15,570,220 | |
5.000%, 07/01/33 | | | 27,336,711 | | | | 29,216,349 | |
6.000%, 07/01/33 | | | 103,490 | | | | 114,816 | |
5.000%, 08/01/33 | | | 76,732,258 | | | | 82,019,978 | |
6.000%, 08/01/33 | | | 349,059 | | | | 387,261 | |
5.000%, 09/01/33 | | | 36,087 | | | | 38,640 | |
5.000%, 10/01/33 | | | 120,303 | | | | 128,594 | |
5.000%, 11/01/33 | | | 9,561,229 | | | | 10,220,105 | |
5.000%, 12/01/33 | | | 15,726 | | | | 16,810 | |
5.000%, 01/01/34 | | | 580,594 | | | | 621,420 | |
6.000%, 01/01/34 | | | 11,648 | | | | 12,923 | |
5.000%, 02/01/34 | | | 3,711,198 | | | | 3,966,942 | |
5.000%, 03/01/34 | | | 7,339,916 | | | | 7,842,279 | |
5.000%, 04/01/34 | | | 886,732 | | | | 948,100 | |
5.000%, 05/01/34 | | | 135,471 | | | | 144,742 | |
5.500%, 05/01/34 | | | 192,207 | | | | 209,212 | |
5.000%, 06/01/34 | | | 122,615 | | | | 131,052 | |
5.500%, 06/01/34 | | | 174,400 | | | | 189,829 | |
5.500%, 07/01/34 | | | 154,575 | | | | 168,347 | |
5.000%, 08/01/34 | | | 451,255 | | | | 482,539 | |
5.500%, 09/01/34 | | | 33,142 | | | | 36,074 | |
6.000%, 09/01/34 | | | 158,084 | | | | 175,385 | |
5.000%, 10/01/34 | | | 9,457 | | | | 10,105 | |
5.000%, 11/01/34 | | | 5,896 | | | | 6,300 | |
5.500%, 11/01/34 | | | 1,554,374 | | | | 1,691,894 | |
6.000%, 11/01/34 | | | 42,893 | | | | 47,399 | |
5.000%, 12/01/34 | | | 25,330 | | | | 27,064 | |
5.500%, 12/01/34 | | | 35,742 | | | | 38,904 | |
5.000%, 01/01/35 | | | 575,801 | | | | 615,556 | |
5.500%, 01/01/35 | | | 2,245,055 | | | | 2,443,681 | |
5.000%, 02/01/35 | | | 11,226 | | | | 11,995 | |
| | | | | | | | |
|
| Agency Sponsored Mortgage-Backed—(Continued) | |
5.500%, 02/01/35 | | $ | 2,959,354 | | | $ | 3,221,176 | |
5.000%, 03/01/35 | | | 43,974,313 | | | | 46,984,026 | |
5.000%, 04/01/35 | | | 45,258,555 | | | | 48,356,122 | |
6.000%, 04/01/35 | | | 4,553,879 | | | | 5,052,258 | |
5.000%, 05/01/35 | | | 23,317 | | | | 24,904 | |
6.000%, 05/01/35 | | | 205,168 | | | | 226,468 | |
5.000%, 06/01/35 | | | 25,592,327 | | | | 27,343,928 | |
5.000%, 07/01/35 | | | 9,848,049 | | | | 10,516,506 | |
6.000%, 07/01/35 | | | 377,048 | | | | 416,645 | |
5.000%, 08/01/35 | | | 20,939 | | | | 22,358 | |
5.000%, 09/01/35 | | | 65,938 | | | | 70,418 | |
6.000%, 09/01/35 | | | 74,495 | | | | 82,229 | |
5.000%, 10/01/35 | | | 3,223,631 | | | | 3,445,547 | |
5.000%, 11/01/35 | | | 1,141,372 | | | | 1,218,777 | |
6.000%, 12/01/35 | | | 408,101 | | | | 451,307 | |
5.000%, 02/01/36 | | | 9,112,009 | | | | 9,729,964 | |
5.000%, 03/01/36 | | | 24,227 | | | | 25,870 | |
6.000%, 03/01/36 | | | 553,285 | | | | 609,860 | |
6.000%, 05/01/36 | | | 2,322,520 | | | | 2,560,686 | |
6.000%, 06/01/36 | | | 1,561,772 | | | | 1,721,466 | |
5.000%, 07/01/36 | | | 162,569 | | | | 173,695 | |
5.500%, 07/01/36 | | | 8,035,985 | | | | 8,746,951 | |
6.000%, 07/01/36 | | | 1,086,084 | | | | 1,197,141 | |
5.000%, 08/01/36 | | | 3,428,837 | | | | 3,661,372 | |
6.000%, 08/01/36 | | | 23,238,107 | | | | 25,614,368 | |
5.500%, 09/01/36 | | | 954,310 | | | | 1,039,336 | |
6.000%, 09/01/36 | | | 9,557,560 | | | | 10,534,847 | |
6.000%, 09/01/36 | | | 108,483 | | | | 119,576 | |
6.000%, 10/01/36 | | | 27,205,217 | | | | 29,987,527 | |
5.500%, 11/01/36 | | | 75,443 | | | | 81,823 | |
6.000%, 11/01/36 | | | 4,512,478 | | | | 4,974,403 | |
5.500%, 12/01/36 | | | 191,080 | | | | 207,213 | |
6.000%, 12/01/36 | | | 23,544,638 | | | | 25,952,167 | |
5.500%, 01/01/37 | | | 853,869 | | | | 925,612 | |
6.000%, 01/01/37 | | | 1,037,363 | | | | 1,143,514 | |
5.000%, 02/01/37 | | | 26,559,523 | | | | 28,360,832 | |
5.500%, 02/01/37 | | | 611,622 | | | | 662,741 | |
6.000%, 02/01/37 | | | 38,601,571 | | | | 42,486,557 | |
5.500%, 03/01/37 | | | 406,301 | | | | 440,661 | |
6.000%, 03/01/37 | | | 3,204,230 | | | | 3,529,184 | |
6.000%, 04/01/37 | | | 11,749,247 | | | | 12,931,305 | |
5.500%, 05/01/37 | | | 369,535 | | | | 400,381 | |
6.000%, 05/01/37 | | | 7,450,016 | | | | 8,204,824 | |
5.500%, 06/01/37 | | | 1,447,375 | | | | 1,568,191 | |
6.000%, 06/01/37 | | | 13,156,401 | | | | 14,478,809 | |
See accompanying notes to financial statements.
7
MET INVESTORS SERIES TRUST
| | |
PIMCO Total Return Portfolio | | |
Schedule of Investments as of June 30, 2011 (Unaudited)
U.S. Treasury & Government Agencies—(Continued)
| | | | | | | | |
| Security Description | | Par
Amount | | | Value | |
| | | | | | | | |
|
| Agency Sponsored Mortgage-Backed—(Continued) | |
5.500%, 07/01/37 | | $ | 3,922,067 | | | $ | 4,250,159 | |
6.000%, 07/01/37 | | | 73,899,392 | | | | 81,317,607 | |
5.500%, 08/01/37 | | | 551,200 | | | | 597,210 | |
6.000%, 08/01/37 (b) | | | 26,439,723 | | | | 29,093,690 | |
6.000%, 08/01/37 | | | 18,551,539 | | | | 20,415,819 | |
5.500%, 09/01/37 | | | 287,120 | | | | 311,047 | |
6.000%, 09/01/37 | | | 33,454,056 | | | | 36,813,113 | |
6.000%, 10/01/37 | | | 5,808,665 | | | | 6,391,229 | |
6.000%, 11/01/37 | | | 416,774 | | | | 458,609 | |
5.500%, 12/01/37 | | | 9,802,107 | | | | 10,620,317 | |
6.000%, 12/01/37 | | | 611,920 | | | | 673,344 | |
5.500%, 01/01/38 | | | 260,082 | | | | 281,792 | |
5.500%, 02/01/38 | | | 8,708,875 | | | | 9,429,336 | |
6.000%, 02/01/38 | | | 13,614,745 | | | | 14,981,672 | |
5.500%, 03/01/38 | | | 10,902,936 | | | | 11,864,142 | |
6.000%, 03/01/38 | | | 357,875 | | | | 393,463 | |
5.500%, 04/01/38 | | | 160,310 | | | | 173,537 | |
6.000%, 04/01/38 | | | 156,162 | | | | 171,762 | |
5.500%, 05/01/38 | | | 5,667,524 | | | | 6,135,295 | |
6.000%, 05/01/38 | | | 21,007,927 | | | | 23,112,801 | |
5.500%, 06/01/38 | | | 3,094,910 | | | | 3,351,573 | |
6.000%, 06/01/38 | | | 404,082 | | | | 444,338 | |
5.500%, 07/01/38 | | | 506,941 | | | | 548,782 | |
6.000%, 07/01/38 | | | 8,472,516 | | | | 9,315,028 | |
5.500%, 08/01/38 | | | 360,955 | | | | 390,746 | |
6.000%, 08/01/38 | | | 8,493,918 | | | | 9,341,718 | |
6.000%, 09/01/38 | | | 17,598,046 | | | | 19,351,441 | |
5.500%, 10/01/38 | | | 47,275 | | | | 51,169 | |
6.000%, 10/01/38 | | | 11,695,821 | | | | 12,862,964 | |
6.000%, 11/01/38 | | | 5,101,364 | | | | 5,609,981 | |
6.000%, 12/01/38 | | | 4,663,307 | | | | 5,129,030 | |
4.500%, 01/01/39 | | | 192,630 | | | | 199,882 | |
5.500%, 01/01/39 | | | 1,180,265 | | | | 1,277,678 | |
6.000%, 01/01/39 | | | 2,592,384 | | | | 2,853,766 | |
4.500%, 02/01/39 | | | 15,126,666 | | | | 15,693,142 | |
6.000%, 02/01/39 | | | 211,458 | | | | 232,486 | |
4.500%, 03/01/39 | | | 878,437 | | | | 910,683 | |
4.500%, 04/01/39 | | | 57,675,498 | | | | 59,805,442 | |
5.500%, 04/01/39 | | | 165,303 | | | | 179,076 | |
6.000%, 04/01/39 | | | 1,179,987 | | | | 1,297,510 | |
4.500%, 05/01/39 | | | 3,117,327 | | | | 3,231,759 | |
4.500%, 06/01/39 | | | 18,970,250 | | | | 19,666,621 | |
6.000%, 06/01/39 | | | 348,487 | | | | 383,141 | |
4.500%, 07/01/39 | | | 26,864 | | | | 27,838 | |
6.000%, 07/01/39 | | | 14,669 | | | | 16,142 | |
| | | | | | | | |
|
| Agency Sponsored Mortgage-Backed—(Continued) | |
4.500%, 08/01/39 | | $ | 2,067,091 | | | $ | 2,142,971 | |
5.500%, 08/01/39 | | | 497,543 | | | | 538,700 | |
6.000%, 08/01/39 | | | 221,331 | | | | 243,548 | |
5.500%, 09/01/39 | | | 1,728,564 | | | | 1,882,813 | |
6.000%, 09/01/39 | | | 545,948 | | | | 600,750 | |
5.500%, 12/01/39 | | | 343,994 | | | | 372,332 | |
4.500%, 04/01/40 | | | 99 | | | | 103 | |
5.500%, 04/01/40 | | | 92,541 | | | | 100,179 | |
6.000%, 05/01/40 | | | 30,814 | | | | 33,878 | |
4.500%, 06/01/40 | | | 480,172 | | | | 498,248 | |
4.500%, 07/01/40 | | | 1,420,758 | | | | 1,472,119 | |
4.500%, 09/01/40 | | | 4,405,067 | | | | 4,565,394 | |
5.500%, 12/01/40 | | | 497,379 | | | | 538,430 | |
3.500%, 01/01/41 | | | 7,921,662 | | | | 7,587,628 | |
3.500%, 02/01/41 | | | 21,313,524 | | | | 20,391,476 | |
4.000%, 02/01/41 | | | 13,954,118 | | | | 13,978,172 | |
3.500%, 03/01/41 | | | 22,620,589 | | | | 21,666,739 | |
3.500%, 03/01/41 | | | 7,017,328 | | | | 6,721,426 | |
3.500%, 05/01/41 | | | 500,299 | | | | 479,202 | |
4.500%, 05/01/41 | | | 497,508 | | | | 515,654 | |
3.500%, 06/01/41 | | | 424,338 | | | | 406,436 | |
4.000%, 06/01/41 | | | 23,069,823 | | | | 23,109,591 | |
4.500%, TBA (a) | | | 804,000,000 | | | | 832,014,576 | |
5.500%, TBA (a) | | | 26,000,000 | | | | 28,116,556 | |
6.000%, TBA (a) | | | 25,000,000 | | | | 27,464,850 | |
Fannie Mae ARM Pool
2.289%, 10/01/28 (c) | | | 236,322 | | | | 245,892 | |
2.745%, 02/01/31 (c) | | | 279,463 | | | | 280,804 | |
2.518%, 09/01/31 (c) | | | 118,710 | | | | 124,729 | |
2.636%, 07/01/32 (c) | | | 44,895 | | | | 45,225 | |
2.745%, 09/01/32 (c) | | | 378,656 | | | | 396,755 | |
2.917%, 11/01/32 (c) | | | 248,113 | | | | 261,155 | |
2.351%, 03/01/33 (c) | | | 9,552 | | | | 10,014 | |
1.915%, 06/01/33 (c) | | | 111,314 | | | | 115,270 | |
2.555%, 07/01/33 (c) | | | 86,274 | | | | 90,535 | |
2.590%, 04/01/34 (c) | | | 28,768 | | | | 30,138 | |
2.410%, 05/01/34 (c) | | | 1,639,693 | | | | 1,719,103 | |
4.774%, 09/01/34 (c) | | | 225,782 | | | | 241,276 | |
4.982%, 09/01/34 (c) | | | 2,516,850 | | | | 2,638,629 | |
2.629%, 10/01/34 (c) | | | 47,756 | | | | 50,267 | |
2.553%, 11/01/34 (c) | | | 11,963 | | | | 12,573 | |
2.680%, 11/01/34 (c) | | | 7,154,456 | | | | 7,543,921 | |
2.689%, 11/01/34 (c) | | | 343,894 | | | | 361,446 | |
2.078%, 12/01/34 (c) | | | 4,167,652 | | | | 4,296,512 | |
2.113%, 12/01/34 (c) | | | 1,426,413 | | | | 1,486,331 | |
See accompanying notes to financial statements.
8
MET INVESTORS SERIES TRUST
| | |
PIMCO Total Return Portfolio | | |
Schedule of Investments as of June 30, 2011 (Unaudited)
U.S. Treasury & Government Agencies—(Continued)
| | | | | | | | |
| Security Description | | Par
Amount | | | Value | |
| | | | | | | | |
|
| Agency Sponsored Mortgage-Backed—(Continued) | |
2.350%, 12/01/34 (c) | | $ | 144,248 | | | $ | 151,378 | |
2.020%, 01/01/35 (c) | | | 564,240 | | | | 593,544 | |
2.337%, 01/01/35 (c) | | | 202,824 | | | | 212,423 | |
2.360%, 01/01/35 (c) | | | 158,429 | | | | 166,305 | |
2.362%, 01/01/35 (c) | | | 58,937 | | | | 61,872 | |
2.368%, 01/01/35 (c) | | | 168,098 | | | | 176,429 | |
2.378%, 02/01/35 (c) | | | 107,108 | | | | 112,481 | |
2.446%, 02/01/35 (c) | | | 505,227 | | | | 529,853 | |
2.149%, 03/01/35 (c) | | | 161,384 | | | | 167,105 | |
2.685%, 04/01/35 (c) | | | 315,553 | | | | 330,840 | |
2.434%, 05/01/35 (c) | | | 176,855 | | | | 186,310 | |
2.562%, 05/01/35 (c) | | | 1,271,259 | | | | 1,339,365 | |
2.599%, 08/01/35 (c) | | | 2,208,753 | | | | 2,296,853 | |
2.809%, 08/01/35 (c) | | | 2,071,387 | | | | 2,177,228 | |
1.877%, 09/01/35 (c) | | | 4,556,507 | | | | 4,694,292 | |
2.430%, 10/01/35 (c) | | | 2,149,387 | | | | 2,244,790 | |
2.254%, 11/01/35 (c) | | | 622,617 | | | | 642,003 | |
2.497%, 11/01/35 (c) | | | 1,667,321 | | | | 1,744,821 | |
2.551%, 11/01/35 (c) | | | 1,040,938 | | | | 1,096,384 | |
5.375%, 01/01/36 (c) | | | 805,728 | | | | 866,464 | |
6.155%, 08/01/36 (c) | | | 1,187,114 | | | | 1,248,074 | |
4.558%, 12/01/36 (c) | | | 827,443 | | | | 865,443 | |
1.495%, 08/01/41 (c) | | | 1,134,380 | | | | 1,132,296 | |
1.545%, 09/01/41 (c) | | | 2,080,609 | | | | 2,100,224 | |
1.495%, 07/01/42 (c) | | | 732,623 | | | | 731,860 | |
1.495%, 08/01/42 (c) | | | 681,374 | | | | 681,139 | |
1.495%, 10/01/44 (c) | | | 1,075,185 | | | | 1,074,367 | |
Freddie Mac 15 Yr. Gold Pool
5.500%, 05/01/14 | | | 12,318 | | | | 12,986 | |
6.000%, 06/01/14 | | | 13,506 | | | | 14,735 | |
6.000%, 10/01/14 | | | 7,007 | | | | 7,645 | |
6.000%, 03/01/15 | | | 1,058 | | | | 1,154 | |
5.500%, 04/01/16 | | | 9,102 | | | | 9,851 | |
5.500%, 09/01/19 | | | 1,230,551 | | | | 1,335,620 | |
Freddie Mac 20 Yr. Gold Pool
6.000%, 03/01/21 | | | 198,052 | | | | 218,092 | |
5.500%, 04/01/21 | | | 49,761 | | | | 53,987 | |
6.000%, 01/01/22 | | | 710,571 | | | | 786,026 | |
6.000%, 10/01/22 | | | 2,507,149 | | | | 2,769,618 | |
5.500%, 12/01/22 | | | 4,908 | | | | 5,310 | |
6.000%, 12/01/22 | | | 154,832 | | | | 171,041 | |
6.000%, 02/01/23 | | | 91,563 | | | | 100,966 | |
5.500%, 03/01/23 | | | 1,001,424 | | | | 1,083,331 | |
6.000%, 04/01/23 | | | 140,094 | | | | 154,761 | |
5.500%, 08/01/26 | | | 9,028 | | | | 9,800 | |
| | | | | | | | |
|
| Agency Sponsored Mortgage-Backed—(Continued) | |
5.500%, 12/01/27 | | $ | 446,341 | | | $ | 484,156 | |
5.500%, 01/01/28 | | | 249,410 | | | | 270,541 | |
5.500%, 05/01/28 | | | 524,835 | | | | 569,301 | |
Freddie Mac 30 Yr. Gold Pool
5.500%, 03/01/32 | | | 109,982 | | | | 119,730 | |
5.500%, 10/01/35 | | | 165,985 | | | | 180,489 | |
5.500%, 11/01/35 | | | 520,913 | | | | 566,430 | |
5.500%, 01/01/36 | | | 514,755 | | | | 558,656 | |
5.500%, 02/01/36 | | | 283,315 | | | | 308,337 | |
5.500%, 04/01/36 | | | 238,949 | | | | 258,409 | |
5.500%, 06/01/36 | | | 13,708,324 | | | | 14,914,711 | |
5.500%, 08/01/36 | | | 662,708 | | | | 718,647 | |
5.500%, 12/01/36 | | | 3,440,025 | | | | 3,730,398 | |
5.500%, 02/01/37 | | | 139,317 | | | | 150,871 | |
5.500%, 03/01/37 | | | 122,609 | | | | 133,284 | |
5.500%, 04/01/37 | | | 196,799 | | | | 213,340 | |
5.500%, 06/01/37 | | | 94,362 | | | | 102,179 | |
5.500%, 07/01/37 | | | 927,260 | | | | 1,005,482 | |
5.500%, 08/01/37 | | | 797,488 | | | | 866,207 | |
5.500%, 09/01/37 | | | 196,493 | | | | 212,772 | |
5.500%, 10/01/37 | | | 132,309 | | | | 143,226 | |
5.500%, 11/01/37 | | | 348,801 | | | | 377,881 | |
5.500%, 12/01/37 | | | 286,128 | | | | 309,834 | |
5.500%, 01/01/38 | | | 689,982 | | | | 747,145 | |
5.500%, 02/01/38 | | | 1,667,289 | | | | 1,805,420 | |
5.500%, 03/01/38 | | | 180,537 | | | | 195,729 | |
5.500%, 04/01/38 | | | 888,218 | | | | 962,806 | |
5.500%, 07/01/38 | | | 4,940,496 | | | | 5,349,805 | |
4.500%, 09/01/38 | | | 879,664 | | | | 912,231 | |
5.500%, 09/01/38 | | | 1,667,361 | | | | 1,803,935 | |
5.500%, 10/01/38 | | | 583,708 | | | | 633,348 | |
5.500%, 11/01/38 | | | 629,046 | | | | 680,571 | |
5.500%, 12/01/38 | | | 37,846 | | | | 41,000 | |
5.500%, 01/01/39 | | | 5,681,660 | | | | 6,151,480 | |
4.500%, 02/01/39 | | | 364,360 | | | | 377,635 | |
5.500%, 02/01/39 | | | 128,303 | | | | 138,752 | |
5.500%, 09/01/39 | | | 354,630 | | | | 383,512 | |
5.500%, 12/01/39 | | | 170,813 | | | | 184,724 | |
5.500%, 02/01/40 | | | 236,814 | | | | 256,100 | |
4.500%, 10/01/40 | | | 494,826 | | | | 512,063 | |
4.500%, 12/01/40 | | | 62,167 | | | | 64,294 | |
4.500%, TBA (a) | | | 58,000,000 | | | | 59,749,048 | |
5.500%, TBA (a) | | | 170,000,000 | | | | 183,653,210 | |
Freddie Mac ARM Non-Gold Pool
2.784%, 01/01/29 (c) | | | 1,063,735 | | | | 1,122,270 | |
See accompanying notes to financial statements.
9
MET INVESTORS SERIES TRUST
| | |
PIMCO Total Return Portfolio | | |
Schedule of Investments as of June 30, 2011 (Unaudited)
U.S. Treasury & Government Agencies—(Continued)
| | | | | | | | |
| Security Description | | Par
Amount | | | Value | |
| | | | | | | | |
|
| Agency Sponsored Mortgage-Backed—(Continued) | |
2.505%, 11/01/31 (c) | | $ | 56,761 | | | $ | 59,386 | |
3.181%, 08/01/32 (c) | | | 234,811 | | | | 244,508 | |
2.368%, 10/01/34 (c) | | | 146,051 | | | | 151,611 | |
2.500%, 11/01/34 (c) | | | 284,941 | | | | 298,595 | |
2.718%, 11/01/34 (c) | | | 103,072 | | | | 108,773 | |
2.897%, 11/01/34 (c) | | | 139,073 | | | | 146,719 | |
2.966%, 11/01/34 (c) | | | 75,918 | | | | 80,027 | |
2.427%, 01/01/35 (c) | | | 145,456 | | | | 152,601 | |
2.501%, 01/01/35 (c) | | | 641,659 | | | | 673,472 | |
2.358%, 02/01/35 (c) | | | 146,473 | | | | 153,077 | |
2.375%, 02/01/35 (c) | | | 172,046 | | | | 180,714 | |
2.382%, 02/01/35 (c) | | | 121,606 | | | | 127,739 | |
2.428%, 02/01/35 (c) | | | 151,981 | | | | 159,777 | |
2.472%, 02/01/35 (c) | | | 87,933 | | | | 92,442 | |
2.494%, 02/01/35 (c) | | | 282,001 | | | | 298,819 | |
2.653%, 02/01/35 (c) | | | 148,640 | | | | 157,218 | |
5.177%, 03/01/35 (c) | | | 1,202,204 | | | | 1,287,765 | |
2.561%, 06/01/35 (c) | | | 3,646,858 | | | | 3,837,021 | |
2.567%, 08/01/35 (c) | | | 1,867,391 | | | | 1,965,380 | |
2.520%, 09/01/35 (c) | | | 563,194 | | | | 585,596 | |
2.546%, 09/01/35 (c) | | | 1,786,389 | | | | 1,868,620 | |
Freddie Mac Gold Pool
5.500%, 04/01/37 | | | 273,764 | | | | 296,802 | |
5.500%, 07/01/37 | | | 3,216,893 | | | | 3,483,405 | |
5.500%, 11/01/37 | | | 2,512,824 | | | | 2,721,006 | |
5.500%, 03/01/38 | | | 996,497 | | | | 1,079,054 | |
4.500%, 02/01/39 | | | 3,277,213 | | | | 3,395,735 | |
Ginnie Mae I 15 Yr. Pool
6.000%, 04/15/14 | | | 31,787 | | | | 34,865 | |
Ginnie Mae I 30 Yr. Pool
7.000%, 10/15/23 | | | 25,225 | | | | 29,280 | |
7.500%, 01/15/26 | | | 18,414 | | | | 21,583 | |
3.500%, 12/15/40 | | | 1,929,982 | | | | 1,876,908 | |
3.500%, 01/15/41 | | | 565,489 | | | | 549,938 | |
3.500%, 02/15/41 | | | 1,498,402 | | | | 1,457,196 | |
Ginnie Mae I Pool
7.500%, 04/15/31 | | | 5,738,560 | | | | 6,058,590 | |
Ginnie Mae II 30 Yr. Pool
3.500%, 01/20/41 | | | 1,993,864 | | | | 1,938,410 | |
Ginnie Mae II ARM Pool
2.375%, 02/20/22 (c) | | | 21,848 | | | | 22,616 | |
3.375%, 04/20/22 (c) | | | 2,734 | | | | 2,852 | |
2.375%, 01/20/23 (c) | | | 41,973 | | | | 43,448 | |
2.125%, 01/20/26 (c) | | | 18,024 | | | | 18,590 | |
2.375%, 02/20/26 (c) | | | 20,521 | | | | 21,242 | |
| | | | | | | | |
|
| Agency Sponsored Mortgage-Backed—(Continued) | |
3.375%, 05/20/26 (c) | | $ | 30,184 | | | $ | 31,479 | |
2.500%, 11/20/26 (c) | | | 19,169 | | | | 19,815 | |
2.375%, 01/20/27 (c) | | | 11,829 | | | | 12,244 | |
2.375%, 02/20/27 (c) | | | 13,110 | | | | 13,571 | |
3.375%, 06/20/27 (c) | | | 10,825 | | | | 11,290 | |
2.625%, 08/20/27 (c) | | | 117,198 | | | | 121,553 | |
2.625%, 09/20/27 (c) | | | 92,594 | | | | 96,034 | |
2.125%, 11/20/27 (c) | | | 32,486 | | | | 33,506 | |
2.250%, 02/20/28 (c) | | | 23,740 | | | | 24,550 | |
2.250%, 03/20/28 (c) | | | 24,460 | | | | 25,294 | |
3.375%, 05/20/28 (c) | | | 11,884 | | | | 12,394 | |
2.125%, 10/20/28 (c) | | | 23,570 | | | | 24,310 | |
3.375%, 04/20/29 (c) | | | 15,812 | | | | 16,491 | |
3.875%, 04/20/29 (c) | | | 18,533 | | | | 19,399 | |
3.375%, 05/20/29 (c) | | | 16,336 | | | | 17,037 | |
2.625%, 07/20/29 (c) | | | 18,680 | | | | 19,374 | |
2.625%, 08/20/29 (c) | | | 17,597 | | | | 18,251 | |
2.625%, 09/20/29 (c) | | | 22,454 | | | | 23,288 | |
2.125%, 10/20/29 (c) | | | 16,178 | | | | 16,686 | |
2.250%, 01/20/30 (c) | | | 70,627 | | | | 73,036 | |
3.375%, 04/20/30 (c) | | | 42,455 | | | | 44,277 | |
3.375%, 05/20/30 (c) | | | 58,142 | | | | 60,637 | |
3.375%, 06/20/30 (c) | | | 23,974 | | | | 25,002 | |
2.500%, 10/20/30 (c) | | | 6,441 | | | | 6,658 | |
2.125%, 11/20/30 (c) | | | 93,765 | | | | 96,709 | |
3.375%, 04/20/31 (c) | | | 31,983 | | | | 33,355 | |
2.625%, 08/20/31 (c) | | | 7,007 | | | | 7,267 | |
2.500%, 10/20/31 (c) | | | 7,255 | | | | 7,503 | |
1.750%, 03/20/32 (c) | | | 1,255 | | | | 1,290 | |
3.375%, 04/20/32 (c) | | | 3,315 | | | | 3,457 | |
3.500%, 04/20/32 (c) | | | 12,142 | | | | 12,681 | |
3.375%, 05/20/32 (c) | | | 35,916 | | | | 37,457 | |
2.625%, 07/20/32 (c) | | | 16,999 | | | | 17,631 | |
2.000%, 03/20/33 (c) | | | 11,942 | | | | 12,334 | |
2.625%, 09/20/33 (c) | | | 130,218 | | | | 135,056 | |
| | | | | | | | |
| | | | | | | 2,951,068,334 | |
| | | | | | | | |
|
| Federal Agencies—0.2% | |
Fannie Mae REMICS
0.587%, 09/18/31 (c) | | | 841,727 | | | | 845,328 | |
1.086%, 04/25/32 (c) | | | 329,341 | | | | 333,413 | |
2.524%, 05/25/35 (c) | | | 3,407,846 | | | | 3,550,710 | |
5.500%, 03/15/17 | | | 139,296 | | | | 140,991 | |
1.875%, 11/15/23 (c) | | | 1,300,196 | | | | 1,342,865 | |
6.500%, 01/15/24 | | | 88,163 | | | | 99,124 | |
See accompanying notes to financial statements.
10
MET INVESTORS SERIES TRUST
| | |
PIMCO Total Return Portfolio | | |
Schedule of Investments as of June 30, 2011 (Unaudited)
U.S. Treasury & Government Agencies—(Continued)
| | | | | | | | |
| Security Description | | Par
Amount | | | Value | |
| | | | | | | | |
|
| Federal Agencies—(Continued) | |
3.500%, 07/15/32 | | $ | 149,866 | | | $ | 157,108 | |
0.437%, 07/15/34 (c) | | | 332,968 | | | | 332,277 | |
Freddie Mac Structured Pass Through Securities
1.695%, 07/25/44 (c) | | | 11,345,065 | | | | 11,089,379 | |
1.484%, 10/25/44 (c) | | | 2,191,323 | | | | 2,202,129 | |
1.495%, 02/25/45 (c) | | | 193,852 | | | | 191,520 | |
Ginnie Mae
0.687%, 02/16/30 (c) | | | 28,513 | | | | 28,606 | |
0.487%, 01/16/31 (c) | | | 68,442 | | | | 68,383 | |
| | | | | | | | |
| | | | | | | 20,381,833 | |
| | | | | | | | |
|
| U.S. Treasury—3.3% | |
U.S. Treasury Inflation Index Bonds
2.375%, 01/15/25 | | | 2,624,380 | | | | 3,020,499 | |
2.000%, 01/15/26 (b) | | | 33,987,300 | | | | 37,189,549 | |
2.375%, 01/15/27 (b) | | | 48,168,432 | | | | 55,017,405 | |
1.750%, 01/15/28 | | | 11,484,631 | | | | 12,039,120 | |
2.500%, 01/15/29 (b) | | | 41,159,283 | | | | 47,892,695 | |
3.875%, 04/15/29 | | | 2,872,401 | | | | 3,941,247 | |
U.S. Treasury Notes
0.750%, 06/15/14 | | | 28,900,000 | | | | 28,870,667 | |
1.500%, 06/30/16 | | | 127,600,000 | | | | 125,985,062 | |
| | | | | | | | |
| | | | | | | 313,956,244 | |
| | | | | | | | |
Total U.S. Treasury & Government Agencies
(Cost $3,222,842,692) | | | | | | | 3,285,406,411 | |
| | | | | | | | |
|
| Domestic Bonds & Debt Securities—27.7% | |
|
| Capital Markets—2.3% | |
Goldman Sachs Group, Inc. (The)
6.600%, 01/15/12 | | | 10,000,000 | | | | 10,310,170 | |
5.700%, 09/01/12 | | | 55,000 | | | | 57,850 | |
0.674%, 07/22/15 (c) | | | 5,400,000 | | | | 5,130,545 | |
1.784%, 05/23/16 (EUR) (c) | | | 4,300,000 | | | | 5,919,612 | |
6.250%, 09/01/17 | | | 14,200,000 | | | | 15,688,529 | |
6.150%, 04/01/18 | | | 1,800,000 | | | | 1,961,735 | |
7.500%, 02/15/19 | | | 10,000,000 | | | | 11,652,690 | |
6.750%, 10/01/37 | | | 13,500,000 | | | | 13,541,121 | |
| | | | | | | | |
|
| Capital Markets—(Continued) | |
Lehman Brothers Holdings, Inc.
0.000%, 12/23/08 (d) | | $ | 12,500,000 | | | $ | 3,281,250 | |
5.625%, 01/24/13 (d) | | | 32,500,000 | | | | 8,775,000 | |
6.750%, 12/28/17 (d) | | | 14,800,000 | | | | 22,200 | |
6.875%, 05/02/18 (d) | | | 3,900,000 | | | | 1,067,625 | |
Merrill Lynch & Co., Inc. | | | | | | | | |
Series C
0.482%, 06/05/12 (c) | | | 1,800,000 | | | | 1,797,084 | |
6.050%, 08/15/12 | | | 26,500,000 | | | | 27,904,394 | |
6.400%, 08/28/17 | | | 3,100,000 | | | | 3,388,223 | |
Series MTN
6.875%, 04/25/18 | | | 23,400,000 | | | | 25,925,703 | |
Morgan Stanley
Series EMTN 1.711%, 04/13/16
(EUR) (c) | | | 300,000 | | | | 403,829 | |
Series F
0.450%, 04/19/12 (c) | | | 800,000 | | | | 800,031 | |
0.726%, 10/18/16 (c) | | | 3,400,000 | | | | 3,134,032 | |
5.950%, 12/28/17 | | | 48,200,000 | | | | 51,887,107 | |
Scotland International Finance No. 2 B.V.
4.250%, 05/23/13 (144A) | | | 19,800,000 | | | | 19,871,260 | |
Small Business Administration Participation Certificates
5.500%, 10/01/18 | | | 47,519 | | | | 51,584 | |
SteelRiver Transmission Co. LLC
4.710%, 06/30/17 (144A) | | | 8,820,497 | | | | 8,949,921 | |
| | | | | | | | |
| | | | | | | 221,521,495 | |
| | | | | | | | |
|
| Chemicals—0.6% | |
Braskem Finance, Ltd.
5.750%, 04/15/21 (144A) | | | 3,300,000 | | | | 3,337,290 | |
Dow Chemical Co. (The)
4.850%, 08/15/12 | | | 26,100,000 | | | | 27,267,714 | |
6.000%, 10/01/12 | | | 3,300,000 | | | | 3,508,745 | |
7.375%, 11/01/29 | | | 185,000 | | | | 227,987 | |
ICI Wilmington, Inc.
5.625%, 12/01/13 | | | 340,000 | | | | 368,972 | |
NGPL PipeCo LLC
7.119%, 12/15/17 (144A) | | | 16,400,000 | | | | 18,396,667 | |
Rohm & Haas Co.
6.000%, 09/15/17 | | | 8,500,000 | | | | 9,677,292 | |
| | | | | | | | |
| | | | | | | 62,784,667 | |
| | | | | | | | |
See accompanying notes to financial statements.
11
MET INVESTORS SERIES TRUST
| | |
PIMCO Total Return Portfolio | | |
Schedule of Investments as of June 30, 2011 (Unaudited)
Domestic Bonds & Debt Securities—(Continued)
| | | | | | | | |
| Security Description | | Par
Amount | | | Value | |
| | | | | | | | |
|
| Commercial Banks—8.7% | |
ABN AMRO N.A. Holding Capital
6.523%, 12/29/49
(144A) (c) | | $ | 345,000 | | | $ | 322,575 | |
ANZ National International, Ltd.
3.125%, 08/10/15 (144A) | | | 8,700,000 | | | | 8,771,775 | |
Australia & New Zealand Banking Group, Ltd.
2.125%, 01/10/14 (144A) | | | 17,100,000 | | | | 17,250,548 | |
Banco Santander Brazil S.A.
2.347%, 03/18/14
(144A) (c) | | | 20,800,000 | | | | 20,887,426 | |
4.250%, 01/14/16 (144A) | | | 14,800,000 | | | | 14,849,160 | |
Series 141
10.956%, 07/13/11
(144A) (e) | | | 36,300,000 | | | | 36,470,610 | |
Banco Santander Chile
1.875%, 01/19/16
(144A) (c) | | | 6,900,000 | | | | 6,819,449 | |
Bank of China (Hong Kong), Ltd. | | | | | | | | |
5.550%, 02/11/20 (144A) | | | 2,500,000 | | | | 2,523,264 | |
Bank of India, Series EMTN
4.750%, 09/30/15 | | | 5,100,000 | | | | 5,287,593 | |
Bank of Montreal, Series CB2
2.850%, 06/09/15 (144A) | | | 5,600,000 | | | | 5,807,458 | |
Bank of Nova Scotia
1.650%, 10/29/15 (144A) | | | 6,100,000 | | | | 5,999,990 | |
Barclays Bank plc
5.450%, 09/12/12 | | | 39,300,000 | | | | 41,418,702 | |
2.375%, 01/13/14 | | | 6,300,000 | | | | 6,378,706 | |
5.000%, 09/22/16 | | | 26,400,000 | | | | 28,432,246 | |
0.421%, 03/23/17 (c) | | | 1,500,000 | | | | 1,463,069 | |
6.050%, 12/04/17 (144A) | | | 44,400,000 | | | | 47,072,791 | |
10.179%, 06/12/21 (144A) | | | 18,080,000 | | | | 22,774,834 | |
7.434%, 09/29/49
(144A) (c) | | | 6,700,000 | | | | 6,884,250 | |
BBVA Bancomer S.A.
4.500%, 03/10/16 (144A) | | | 3,900,000 | | | | 3,987,750 | |
6.500%, 03/10/21 (144A) | | | 7,800,000 | | | | 7,995,000 | |
BNP Paribas S.A., Series BKNT
1.190%, 01/10/14 (c) | | | 26,000,000 | | | | 25,827,126 | |
BPCE S.A.
2.375%, 10/04/13 (144A) | | | 2,400,000 | | | | 2,404,651 | |
CIT Group, Inc.
7.000%, 05/01/14 | | | 1,197,315 | | | | 1,213,778 | |
7.000%, 05/01/15 | | | 889,144 | | | | 892,478 | |
7.000%, 05/01/16 | | | 1,481,907 | | | | 1,478,202 | |
7.000%, 05/01/17 | | | 2,074,669 | | | | 2,072,076 | |
| | | | | | | | |
|
| Commercial Banks—(Continued) | |
Series C
5.250%, 04/01/14 (144A) | | $ | 2,600,000 | | | $ | 2,600,000 | |
Credit Agricole S.A.
8.375%, 10/31/49
(144A) (c) | | | 46,000,000 | | | | 48,300,000 | |
Credit Suisse of New York
2.200%, 01/14/14 | | | 5,700,000 | | | | 5,777,833 | |
Danske Bank A.S.
2.500%, 05/10/12 (144A) | | | 4,500,000 | | | | 4,566,700 | |
Deutsche Bank AG London
6.000%, 09/01/17 | | | 25,700,000 | | | | 28,711,886 | |
Dexia Credit Local
0.753%, 04/29/14
(144A) (c) | | | 1,200,000 | | | | 1,175,736 | |
DnB NOR Bank ASA
0.484%, 09/01/16 (c) | | | 1,500,000 | | | | 1,495,328 | |
Export-Import Bank of Korea
5.125%, 06/29/20 | | | 4,300,000 | | | | 4,372,988 | |
4.000%, 01/29/21 | | | 2,700,000 | | | | 2,495,525 | |
HSBC Bank plc
2.000%, 01/19/14 (144A) | | | 6,000,000 | | | | 6,036,102 | |
HSBC Capital Funding LP
4.610%, 12/31/49
(144A) (c) | | | 585,000 | | | | 573,328 | |
ING Bank N.V.
1.046%, 03/30/12
(144A) (c) | | | 66,800,000 | | | | 67,073,880 | |
2.650%, 01/14/13 (144A) | | | 1,500,000 | | | | 1,520,868 | |
2.000%, 10/18/13 (144A) | | | 3,300,000 | | | | 3,291,176 | |
Intesa Sanpaolo | | | | | | | | |
2.658%, 02/24/14
(144A) (c) | | | 14,100,000 | | | | 14,076,185 | |
Intesa Sanpaolo/New York,
Series YCD | | | | | | | | |
2.375%, 12/21/12 | | | 45,500,000 | | | | 45,864,045 | |
Key Bank N.A., Series EMTN | | | | | | | | |
1.559%, 11/21/11
(EUR) (c) | | | 500,000 | | | | 723,233 | |
Lloyds TSB Bank plc | | | | | | | | |
4.875%, 01/21/16 | | | 7,400,000 | | | | 7,576,172 | |
12.000%, 12/31/49
(144A) (c) | | | 5,800,000 | | | | 6,315,999 | |
Nordea Bank AB | | | | | | | | |
2.125%, 01/14/14 (144A) | | | 2,700,000 | | | | 2,731,345 | |
See accompanying notes to financial statements.
12
MET INVESTORS SERIES TRUST
| | |
PIMCO Total Return Portfolio | | |
Schedule of Investments as of June 30, 2011 (Unaudited)
Domestic Bonds & Debt Securities—(Continued)
| | | | | | | | |
| Security Description | | Par
Amount | | | Value | |
| | | | | | | | |
|
| Commercial Banks—(Continued) | |
Rabobank Nederland | | | | | | | | |
11.000%, 06/29/49
(144A) (c) | | $ | 277,000 | | | $ | 355,683 | |
RBS Capital Trust II | | | | | | | | |
6.425%, 12/29/49 | | | 120,000 | | | | 86,400 | |
Resona Bank, Ltd. | | | | | | | | |
5.850%, 09/29/49
(144A) (c) | | | 4,400,000 | | | | 4,394,711 | |
Royal Bank of Scotland Group plc | | | | | | | | |
7.640%, 03/31/49 | | | 14,500,000 | | | | 11,346,250 | |
6.990%, 10/29/49 (144A) | | | 2,000,000 | | | | 1,810,000 | |
Royal Bank of Scotland plc (The) | | | | | | | | |
3.950%, 09/21/15 | | | 12,300,000 | | | | 12,369,643 | |
Series EMTN
0.986%, 09/29/15 (c) | | | 500,000 | | | | 438,127 | |
0.561%, 10/14/16 (c) | | | 500,000 | | | | 444,403 | |
Santander US Debt S.A. Unipersonal | | | | | | | | |
2.991%, 10/07/13 (144A) | | | 24,300,000 | | | | 24,257,815 | |
Societe Financement de l’Economie Francaise | | | | | | | | |
0.476%, 07/16/12
(144A) (c) | | | 57,000,000 | | | | 57,188,100 | |
Societe Generale S.A. | | | | | | | | |
5.922%, 04/29/49
(144A) (c) | | | 13,200,000 | | | | 11,431,358 | |
State Bank of India | | | | | | | | |
4.500%, 07/27/15 (144A) | | | 12,200,000 | | | | 12,570,094 | |
Sumitomo Mitsui Banking Corp. | | | | | | | | |
1.950%, 01/14/14 (144A) | | | 7,400,000 | | | | 7,461,013 | |
Svenska Handelsbanken AB | | | | | | | | |
1.249%, 09/14/12
(144A) (c) | | | 34,000,000 | | | | 34,318,478 | |
Turkiye Garanti Bankasi A.S. | | | | | | | | |
2.774%, 04/20/16
(144A) (c) | | | 3,800,000 | | | | 3,790,500 | |
UBS AG | | | | | | | | |
1.273%, 01/28/14 (c) | | | 1,700,000 | | | | 1,704,600 | |
Series BKNT
2.250%, 08/12/13 | | | 14,900,000 | | | | 15,164,207 | |
5.875%, 12/20/17 | | | 21,700,000 | | | | 23,836,430 | |
Series MTN
1.359%, 02/2A3/12 (c) | | | 7,900,000 | | | | 7,951,366 | |
USB Capital IX | | | | | | | | |
3.500%, 10/29/49 (c) | | | 8,125,000 | | | | 6,725,794 | |
| | | | | | | | |
|
| Commercial Banks—(Continued) | |
Wachovia Bank N.A., Series MTN | | | | | | | | |
0.577%, 03/15/16 (c) | | $ | 6,000,000 | | | $ | 5,707,320 | |
Westpac Banking Corp.
0.756%, 07/16/14
(144A) (c) | | | 29,000,000 | | | | 29,141,578 | |
Westpac Capital Trust III
5.819%, 09/30/13
(144A) (c) | | | 80,000 | | | | 79,257 | |
Westpac Capital Trust IV
5.256%, 03/31/16
(144A) (c) | | | 165,000 | | | | 159,225 | |
| | | | | | | | |
| | | | | | | 853,296,188 | |
| | | | | | | | |
|
| Commercial Services & Supplies—0.1% | |
R.R. Donnelley & Sons Co.
4.950%, 04/01/14 | | | 6,200,000 | | | | 6,308,190 | |
| | | | | | | | |
|
| Computers & Peripherals—0.6% | |
Hewlett-Packard Co.
0.534%, 05/24/13 (c) | | | 38,300,000 | | | | 38,408,427 | |
International Business Machines Corp.
5.700%, 09/14/17 | | | 19,300,000 | | | | 22,468,829 | |
| | | | | | | | |
| | | | | | | 60,877,256 | |
| | | | | | | | |
|
| Construction Materials—0.1% | |
C10 Capital, Ltd.
6.722%, 12/18/49 (c) | | | 4,800,000 | | | | 3,600,000 | |
C8 Capital SPV, Ltd.
6.640%, 12/31/14
(144A) (c) | | | 1,700,000 | | | | 1,275,000 | |
| | | | | | | | |
| | | | | | | 4,875,000 | |
| | | | | | | | |
|
| Consumer Finance—2.3% | |
Ally Financial, Inc.
6.875%, 09/15/11 | | | 9,000,000 | | | | 9,078,750 | |
6.000%, 12/15/11 | | | 5,035,000 | | | | 5,110,525 | |
6.875%, 08/28/12 | | | 1,500,000 | | | | 1,556,250 | |
3.466%, 02/11/14 (c) | | | 8,900,000 | | | | 8,752,011 | |
4.500%, 02/11/14 | | | 9,000,000 | | | | 9,022,500 | |
3.647%, 06/20/14 (c) | | | 9,000,000 | | | | 8,806,392 | |
6.750%, 12/01/14 | | | 9,458,000 | | | | 9,919,721 | |
8.300%, 02/12/15 | | | 3,500,000 | | | | 3,920,000 | |
6.250%, 12/01/17 (144A) | | | 23,000,000 | | | | 22,932,886 | |
7.500%, 09/15/20 | | | 7,800,000 | | | | 8,190,000 | |
See accompanying notes to financial statements.
13
MET INVESTORS SERIES TRUST
| | |
PIMCO Total Return Portfolio | | |
Schedule of Investments as of June 30, 2011 (Unaudited)
Domestic Bonds & Debt Securities—(Continued)
| | | | | | | | |
| Security Description | | Par
Amount | | | Value | |
| | | | | | | | |
|
| Consumer Finance—(Continued) | |
American Express Bank FSB S.A.
5.500%, 04/16/13 | | $ | 16,700,000 | | | $ | 17,873,225 | |
6.000%, 09/13/17 | | | 34,000,000 | | | | 38,402,728 | |
American Express Centurion Bank
6.000%, 09/13/17 | | | 34,000,000 | | | | 38,402,728 | |
Banque PSA Finance
2.146%, 04/04/14
(144A) (c) | | | 14,900,000 | | | | 14,884,146 | |
Ford Motor Credit Co. LLC
7.250%, 10/25/11 | | | 1,300,000 | | | | 1,319,609 | |
3.033%, 01/13/12 (c) | | | 9,000,000 | | | | 9,022,770 | |
7.800%, 06/01/12 | | | 800,000 | | | | 836,808 | |
7.000%, 10/01/13 | | | 500,000 | | | | 535,589 | |
8.000%, 06/01/14 | | | 2,500,000 | | | | 2,744,392 | |
7.000%, 04/15/15 | | | 500,000 | | | | 541,329 | |
12.000%, 05/15/15 | | | 4,000,000 | | | | 4,964,440 | |
8.000%, 12/15/16 | | | 500,000 | | | | 563,493 | |
Springleaf Finance Corp., | | | | | | | | |
Series MTN
6.900%, 12/15/17 | | | 3,200,000 | | | | 2,952,000 | |
Sydney Airport Finance Co. Pty, Ltd.
5.125%, 02/22/21 (144A) | | | 1,300,000 | | | | 1,315,191 | |
| | | | | | | | |
| | | | | | | 221,647,483 | |
| | | | | | | | |
|
| Diversified Financial Services—5.3% | |
ANZ Capital Trust II
5.360%, 11/29/49 (144A) | | | 525,000 | | | | 539,438 | |
Bank of America Corp.
5.650%, 05/01/18 | | | 17,800,000 | | | | 18,793,632 | |
8.000%, 12/29/49 (c) | | | 5,000,000 | | | | 5,228,190 | |
Bear Stearns & Co., Inc.
6.400%, 10/02/17 | | | 19,300,000 | | | | 22,048,783 | |
Bear Sterns Cos. LLC (The)
6.950%, 08/10/12 | | | 8,200,000 | | | | 8,756,772 | |
7.250%, 02/01/18 | | | 5,000,000 | | | | 5,945,405 | |
BM&F Bovespa S.A.
5.500%, 07/16/20 (144A) | | | 1,000,000 | | | | 1,040,500 | |
Citigroup Capital XXI
8.300%, 12/21/57 (c) | | | 35,900,000 | | | | 36,797,500 | |
Citigroup, Inc.
5.625%, 08/27/12 | | | 1,000,000 | | | | 1,044,983 | |
5.500%, 04/11/13 | | | 17,900,000 | | | | 19,012,037 | |
2.262%, 08/13/13 (c) | | | 7,000,000 | | | | 7,135,450 | |
5.500%, 10/15/14 | | | 35,000,000 | | | | 38,090,605 | |
| | | | | | | | |
|
| Diversified Financial Services—(Continued) | |
6.125%, 11/21/17 | | $ | 44,600,000 | | | $ | 49,324,166 | |
6.125%, 05/15/18 | | | 2,900,000 | | | | 3,198,077 | |
8.500%, 05/22/19 | | | 3,800,000 | | | | 4,717,742 | |
General Electric Capital Corp.
6.750%, 03/15/32 | | | 165,000 | | | | 183,856 | |
6.875%, 01/10/39 | | | 6,500,000 | | | | 7,382,336 | |
6.500%, 09/15/67
(144A) (GBP) (c) | | | 11,900,000 | | | | 18,929,711 | |
6.375%, 11/15/67 (c) | | | 5,400,000 | | | | 5,555,250 | |
International Lease Finance Corp.
1.795%, 08/15/11
(EUR) (c) | | | 30,400,000 | | | | 44,039,754 | |
5.400%, 02/15/12 | | | 16,642,000 | | | | 16,933,235 | |
5.300%, 05/01/12 | | | 24,700,000 | | | | 25,194,000 | |
5.250%, 01/10/13 | | | 2,900,000 | | | | 2,961,480 | |
6.375%, 03/25/13 | | | 2,900,000 | | | | 3,001,500 | |
5.875%, 05/01/13 | | | 1,600,000 | | | | 1,646,000 | |
6.750%, 09/01/16 (144A) | | | 5,300,000 | | | | 5,671,000 | |
JPMorgan Chase & Co.
0.580%, 06/13/16 (c) | | | 5,300,000 | | | | 4,967,817 | |
6.000%, 10/01/17 | | | 23,600,000 | | | | 26,260,452 | |
6.000%, 01/15/18 | | | 25,600,000 | | | | 28,509,952 | |
JPMorgan Chase Capital XXI Series U
1.223%, 02/02/37 (c) | | | 27,300,000 | | | | 21,943,603 | |
LBG Capital No.1 plc
7.875%, 11/01/20 (144A) | | | 285,000 | | | | 269,325 | |
Macquarie Bank, Ltd., Series B
2.600%, 01/20/12 (144A) | | | 2,200,000 | | | | 2,227,570 | |
Nationwide Building Society
6.250%, 02/25/20 (144A) | | | 10,800,000 | | | | 11,249,852 | |
Pearson Dollar Finance plc
5.700%, 06/01/14 (144A) | | | 13,500,000 | | | | 14,875,420 | |
SLM Corp.
4.182%, 03/15/12 (c) | | | 1,500,000 | | | | 1,503,825 | |
5.125%, 08/27/12 | | | 400,000 | | | | 410,546 | |
5.375%, 01/15/13 | | | 700,000 | | | | 719,662 | |
5.000%, 10/01/13 | | | 4,739,000 | | | | 4,931,166 | |
0.574%, 01/27/14 (c) | | | 11,600,000 | | | | 11,007,275 | |
5.375%, 05/15/14 | | | 8,235,000 | | | | 8,579,363 | |
Series MTN
6.250%, 01/25/16 | | | 3,200,000 | | | | 3,323,270 | |
8.450%, 06/15/18 | | | 7,400,000 | | | | 8,133,103 | |
8.000%, 03/25/20 | | | 400,000 | | | | 430,201 | |
Teco Finance, Inc.
6.750%, 05/01/15 | | | 4,400,000 | | | | 5,026,547 | |
See accompanying notes to financial statements.
14
MET INVESTORS SERIES TRUST
| | |
PIMCO Total Return Portfolio | | |
Schedule of Investments as of June 30, 2011 (Unaudited)
Domestic Bonds & Debt Securities—(Continued)
| | | | | | | | |
| Security Description | | Par
Amount | | | Value | |
| | | | | | | | |
|
| Diversified Financial Services—(Continued) | |
Temasek Financial I, Ltd.
4.300%, 10/25/19 (144A) | | $ | 5,500,000 | | | $ | 5,683,172 | |
Trans Capital Investment, Ltd.
8.700%, 08/07/18 (144A) | | | 2,800,000 | | | | 3,451,000 | |
| | | | | | | | |
| | | | | | | 516,674,523 | |
| | | | | | | | |
| |
| Diversified Telecommunication Services—0.3% | | | | | |
AT&T, Inc.
5.100%, 09/15/14 | | | 380,000 | | | | 417,909 | |
5.625%, 06/15/16 | | | 455,000 | | | | 516,355 | |
6.300%, 01/15/38 | | | 6,400,000 | | | | 6,799,859 | |
5.350%, 09/01/40 | | | 301,000 | | | | 286,330 | |
CenturyTel, Inc.
6.000%, 04/01/17 | | | 5,000,000 | | | | 5,222,925 | |
Deutsche Telekom International Finance B.V.
8.750%, 06/15/30 | | | 50,000 | | | | 66,162 | |
Embarq Corp.
7.995%, 06/01/36 | | | 6,600,000 | | | | 6,780,886 | |
France Telecom S.A.
8.500%, 03/01/31 | | | 165,000 | | | | 222,679 | |
Qtel International Finance, Ltd.
3.375%, 10/14/16 (144A) | | | 400,000 | | | | 401,000 | |
4.750%, 02/16/21 (144A) | | | 800,000 | | | | 784,000 | |
Qwest Corp.
8.875%, 03/15/12 | | | 1,720,000 | | | | 1,814,600 | |
Sprint Capital Corp.
8.750%, 03/15/32 | | | 6,900,000 | | | | 7,503,750 | |
Verizon Global Funding Corp.
7.375%, 09/01/12 | | | 185,000 | | | | 199,016 | |
Verizon New York, Inc.
6.875%, 04/01/12 | | | 325,000 | | | | 339,531 | |
7.375%, 04/01/32 | | | 155,000 | | | | 178,779 | |
| | | | | | | | |
| | | | | | | 31,533,781 | |
| | | | | | | | |
| | |
| Electric Utilities—1.2% | | | | | | | | |
Arizona Public Service Co.
4.650%, 05/15/15 | | | 165,000 | | | | 178,649 | |
Centrais Eletricas Brasileiras S.A.
6.875%, 07/30/19 (144A) | | | 54,400,000 | | | | 61,880,000 | |
Consumers Energy Co.
5.000%, 02/15/12 | | | 2,500,000 | | | | 2,564,023 | |
Dominion Resources, Inc.
6.300%, 03/15/33 | | | 210,000 | | | | 231,280 | |
DTE Energy Co.
6.375%, 04/15/33 | | | 260,000 | | | | 280,212 | |
| | | | | | | | |
| |
| Electric Utilities—(Continued) | | | | | |
Electricite de France
5.500%, 01/26/14 (144A) | | $ | 5,100,000 | | | $ | 5,607,516 | |
6.500%, 01/26/19 (144A) | | | 5,100,000 | | | | 5,970,223 | |
6.950%, 01/26/39 (144A) | | | 5,100,000 | | | | 5,985,263 | |
Enel Finance International S.A.
6.250%, 09/15/17 (144A) | | | 9,350,000 | | | | 10,335,471 | |
Entergy Corp.
3.625%, 09/15/15 | | | 14,300,000 | | | | 14,540,655 | |
Majapahit Holding B.V.
7.250%, 06/28/17 | | | 2,040,000 | | | | 2,315,669 | |
7.750%, 01/20/20 | | | 5,000,000 | | | | 5,857,686 | |
Nisource Finance Corp.
6.150%, 03/01/13 | | | 475,000 | | | | 511,156 | |
Pepco Holdings, Inc.
7.450%, 08/15/32 | | | 180,000 | | | | 208,756 | |
Progress Energy, Inc.
6.850%, 04/15/12 | | | 650,000 | | | | 680,729 | |
| | | | | | | | |
| | | | | | | 117,147,288 | |
| | | | | | | | |
| |
| Energy Equipment & Services—0.1% | | | | | |
Cameron International Corp.
1.183%, 06/02/14 (c) | | | 9,100,000 | | | | 9,144,408 | |
Transocean, Inc.
7.500%, 04/15/31 | | | 1,000,000 | | | | 1,129,081 | |
| | | | | | | | |
| | | | | | | 10,273,489 | |
| | | | | | | | |
| |
| Food & Drug Retail—0.0% | | | | | |
CVS Pass-Through Trust
6.943%, 01/10/30 | | | 1,018,480 | | | | 1,148,651 | |
| | | | | | | | |
| |
| Food & Staples Retailing—0.1% | | | | | |
Wal-Mart Stores, Inc.
5.800%, 02/15/18 | | | 6,600,000 | | | | 7,617,555 | |
| | | | | | | | |
| |
| Food Products—0.3% | | | | | |
Kraft Foods, Inc.
6.125%, 02/01/18 | | | 23,500,000 | | | | 27,072,399 | |
6.875%, 02/01/38 | | | 2,100,000 | | | | 2,437,447 | |
| | | | | | | | |
| | | | | | | 29,509,846 | |
| | | | | | | | |
| |
| Gas Utilities—0.0% | | | | | |
ENN Energy Holdings, Ltd.
6.000%, 05/13/21 (144A) | | | 1,600,000 | | | | 1,574,989 | |
| | | | | | | | |
| |
| Health Care Providers & Services—0.2% | | | | | |
Prudential Holding LLC
8.695%, 12/18/23 (144A) | | | 150,000 | | | | 182,187 | |
See accompanying notes to financial statements.
15
MET INVESTORS SERIES TRUST
| | |
PIMCO Total Return Portfolio | | |
Schedule of Investments as of June 30, 2011 (Unaudited)
Domestic Bonds & Debt Securities—(Continued)
| | | | | | | | |
| Security Description | | Par
Amount | | | Value | |
| | | | | | | | |
|
| Health Care Providers & Services—(Continued) | |
UnitedHealth Group, Inc.
6.000%, 02/15/18 | | $ | 11,100,000 | | | $ | 12,603,484 | |
6.875%, 02/15/38 | | | 2,200,000 | | | | 2,523,774 | |
| | | | | | | | |
| | | | | | | 15,309,445 | |
| | | | | | | | |
|
| Independent Power Producers & Energy Traders—0.1% | |
Korea Hydro & Nuclear Power Co., Ltd.
3.125%, 09/16/15 (144A) | | | 11,200,000 | | | | 11,137,481 | |
PSEG Power LLC
5.500%, 12/01/15 | | | 420,000 | | | | 464,052 | |
8.625%, 04/15/31 | | | 245,000 | | | | 315,670 | |
| | | | | | | | |
| | | | | | | 11,917,203 | |
| | | | | | | | |
| |
| Insurance—1.6% | | | | | |
American General Finance Corp. Series I
4.875%, 07/15/12 | | | 800,000 | | | | 798,000 | |
Series J
0.497%, 12/15/11 (c) | | | 3,400,000 | | | | 3,356,643 | |
American General Institutional Capital, Series B
8.125%, 03/15/46
(144A) | | | 24,700,000 | | | | 26,737,750 | |
American International Group, Inc.
4.250%, 05/15/13 | | | 8,545,000 | | | | 8,792,574 | |
5.050%, 10/01/15 | | | 6,300,000 | | | | 6,582,051 | |
5.450%, 05/18/17 | | | 700,000 | | | | 732,922 | |
5.850%, 01/16/18 | | | 23,700,000 | | | | 24,866,301 | |
8.250%, 08/15/18 | | | 300,000 | | | | 344,738 | |
6.400%, 12/15/20 | | | 2,800,000 | | | | 3,019,260 | |
5.250%/6.250%, 11/16/22 (f) | | | 3,163,000 | | | | 3,024,619 | |
8.000%, 05/22/38
(EUR) (c) | | | 2,750,000 | | | | 4,003,949 | |
8.625%, 05/22/38
(GBP) (c) | | | 5,500,000 | | | | 9,146,709 | |
Series EMTN
5.000%, 06/26/17 (EUR) | | | 24,000,000 | | | | 33,583,631 | |
CNA Financial Corp.
5.850%, 12/15/14 | | | 5,000,000 | | | | 5,420,810 | |
Dai-ichi Life Insurance Co., Ltd.
7.250%, 12/31/49
(144A) (c) | | | 7,400,000 | | | | 7,488,103 | |
| | | | | | | | |
| |
| Insurance—(Continued) | | | | | |
ING Capital Funding Trust III
3.846%, 12/31/49 (c) | | $ | 200,000 | | | $ | 189,798 | |
Liberty Mutual Group, Inc.
5.750%, 03/15/14 (144A) | | | 5,750,000 | | | | 6,103,361 | |
Nationwide Financial Services, Inc.
6.250%, 11/15/11 | | | 55,000 | | | | 55,728 | |
5.900%, 07/01/12 | | | 60,000 | | | | 61,668 | |
Pacific LifeCorp.
6.000%, 02/10/20 (144A) | | | 2,600,000 | | | | 2,792,738 | |
Principal Life Income Funding Trusts
5.300%, 04/24/13 | | | 3,400,000 | | | | 3,657,978 | |
| | | | | | | | |
| | | | | | | 150,759,331 | |
| | | | | | | | |
| | |
| Machinery—0.3% | | | | | | | | |
Caterpillar, Inc.
0.425%, 05/21/13 (c) | | | 33,000,000 | | | | 33,056,001 | |
| | | | | | | | |
| | |
| Media—0.3% | | | | | | | | |
British Sky Broadcasting Group plc
6.100%, 02/15/18 (144A) | | | 15,000,000 | | | | 16,800,645 | |
Comcast Corp.
7.050%, 03/15/33 | | | 75,000 | | | | 87,051 | |
COX Communications, Inc.
4.625%, 06/01/13 | | | 430,000 | | | | 456,800 | |
Historic TW, Inc.
9.150%, 02/01/23 | | | 155,000 | | | | 208,968 | |
News America Holdings, Inc.
8.250%, 08/10/18 | | | 110,000 | | | | 137,219 | |
7.750%, 01/20/24 | | | 25,000 | | | | 30,651 | |
Time Warner Cable, Inc.
5.400%, 07/02/12 | | | 5,000,000 | | | | 5,228,145 | |
Time Warner Cos., Inc.
5.875%, 11/15/16 | | | 6,500,000 | | | | 7,438,450 | |
7.625%, 04/15/31 | | | 310,000 | | | | 372,955 | |
Time Warner Entertainment Co. LP
8.375%, 03/15/23 | | | 260,000 | | | | 330,740 | |
| | | | | | | | |
| | | | | | | 31,091,624 | |
| | | | | | | | |
| | |
| Metals & Mining—0.3% | | | | | | | | |
AngloGold Ashanti Holdings plc | | | | | | | | |
5.375%, 04/15/20 | | | 2,400,000 | | | | 2,367,151 | |
See accompanying notes to financial statements.
16
MET INVESTORS SERIES TRUST
| | |
PIMCO Total Return Portfolio | | |
Schedule of Investments as of June 30, 2011 (Unaudited)
Domestic Bonds & Debt Securities—(Continued)
| | | | | | | | |
| Security Description | | Par
Amount | | | Value | |
| | | | | | | | |
| |
| Metals & Mining—(Continued) | | | | | |
Gerdau Trade, Inc. | | | | | | | | |
5.750%, 01/30/21 (144A) | | $ | 6,900,000 | | | $ | 6,941,977 | |
Vale Overseas, Ltd. | | | | | | | | |
4.625%, 09/15/20 | | | 5,000,000 | | | | 4,997,690 | |
6.875%, 11/21/36 | | | 8,200,000 | | | | 8,923,945 | |
6.875%, 11/10/39 | | | 3,600,000 | | | | 3,930,408 | |
| | | | | | | | |
| | | | | | | 27,161,171 | |
| | | | | | | | |
|
| Oil & Gas Exploration & Production—0.0% | |
Novatek Finance, Ltd. | | | | | | | | |
5.326%, 02/03/16 (144A) | | | 3,100,000 | | | | 3,180,915 | |
| | | | | | | | |
|
| Oil, Gas & Consumable Fuels—1.0% | |
El Paso Corp. | | | | | | | | |
7.750%, 01/15/32 | | | 2,715,000 | | | | 3,171,858 | |
Gazprom Via Gaz Capital S.A. | | | | | | | | |
8.146%, 04/11/18 (144A) | | | 12,400,000 | | | | 14,647,500 | |
8.625%, 04/28/34 | | | 23,300,000 | | | | 29,183,250 | |
Series REGS | | | | | | | | |
8.125%, 07/31/14 | | | 3,600,000 | | | | 4,090,500 | |
Husky Energy, Inc. | | | | | | | | |
6.150%, 06/15/19 | | | 215,000 | | | | 241,007 | |
Indian Oil Corp., Ltd. | | | | | | | | |
4.750%, 01/22/15 | | | 2,200,000 | | | | 2,298,032 | |
Kinder Morgan Energy Partners LP | | | | | | | | |
7.400%, 03/15/31 | | | 225,000 | | | | 256,996 | |
7.750%, 03/15/32 | | | 135,000 | | | | 160,715 | |
7.300%, 08/15/33 | | | 90,000 | | | | 102,839 | |
Magellan Midstream Partners | | | | | | | | |
5.650%, 10/15/16 | | | 385,000 | | | | 435,981 | |
Noble Group, Ltd. | | | | | | | | |
4.875%, 08/05/15 (144A) | | | 2,500,000 | | | | 2,598,438 | |
Petrobras International Finance Co. | | | | | | | | |
5.750%, 01/20/20 | | | 4,800,000 | | | | 5,144,424 | |
5.375%, 01/27/21 | | | 26,600,000 | | | | 27,374,912 | |
Ras Laffan Liquefied Natural Gas Co., Ltd. III, Series REGS | | | | | | | | |
5.500%, 09/30/14 | | | 1,400,000 | | | | 1,532,464 | |
Spectra Energy Capital LLC | | | | | | | | |
6.250%, 02/15/13 | | | 375,000 | | | | 404,154 | |
8.000%, 10/01/19 | | | 55,000 | | | | 67,385 | |
Total Capital S.A. | | | | | | | | |
4.450%, 06/24/20 | | | 3,100,000 | | | | 3,241,549 | |
| | | | | | | | |
|
| Oil, Gas & Consumable Fuels—(Continued) | |
TransCanada Pipelines, Ltd. | | | | | | | | |
7.625%, 01/15/39 | | $ | 2,500,000 | | | $ | 3,105,758 | |
Transcontinental Gas Pipe Line Corp. | | | | | | | | |
8.875%, 07/15/12 | | | 35,000 | | | | 37,796 | |
Valero Energy Corp. | | | | | | | | |
7.500%, 04/15/32 | | | 225,000 | | | | 251,965 | |
Williams Cos., Inc. | | | | | | | | |
7.500%, 01/15/31 | | | 592,000 | | | | 678,872 | |
| | | | | | | | |
| | | | | | | 99,026,395 | |
| | | | | | | | |
|
| Paper & Forest Products—0.1% | |
International Paper Co. | | | | | | | | |
5.250%, 04/01/16 | | | 6,500,000 | | | | 7,029,555 | |
| | | | | | | | |
|
| Pharmaceuticals—0.7% | |
GlaxoSmithKline Capital, Inc. | | | | | | | | |
4.850%, 05/15/13 | | | 49,400,000 | | | | 53,141,507 | |
Roche Holdings, Inc. | | | | | | | | |
7.000%, 03/01/39(144A) | | | 8,000,000 | | | | 9,741,600 | |
Wyeth | | | | | | | | |
5.500%, 03/15/13 | | | 2,500,000 | | | | 2,698,112 | |
5.500%, 02/15/16 | | | 5,000,000 | | | | 5,704,355 | |
6.450%, 02/01/24 | | | 160,000 | | | | 191,009 | |
| | | | | | | | |
| | | | | | | 71,476,583 | |
| | | | | | | | |
|
| Real Estate Investment Trusts—0.1% | |
HCP, Inc. | | | | | | | | |
6.700%, 01/30/18 | | | 7,500,000 | | | | 8,395,807 | |
Health Care Property Investors, Inc. | | | | | | | | |
5.950%, 09/15/11 | | | 3,500,000 | | | | 3,534,199 | |
| | | | | | | | |
| | | | | | | 11,930,006 | |
| | | | | | | | |
|
| Real Estate Management & Development—0.0% | |
Qatari Diar Finance QSC | | | | | | | | |
3.500%, 07/21/15 | | | 1,000,000 | | | | 1,024,470 | |
| | | | | | | | |
|
| Road & Rail—0.3% | |
Con-way, Inc. | | | | | | | | |
7.250%, 01/15/18 | | | 10,000,000 | | | | 11,015,680 | |
CSX Corp. | | | | | | | | |
6.250%, 03/15/18 | | | 8,100,000 | | | | 9,359,040 | |
Norfolk Southern Corp. | | | | | | | | |
5.590%, 05/17/25 | | | 60,000 | | | | 64,983 | |
7.800%, 05/15/27 | | | 7,000 | | | | 9,097 | |
5.640%, 05/17/29 | | | 168,000 | | | | 178,724 | |
7.250%, 02/15/31 | | | 65,000 | | | | 80,299 | |
See accompanying notes to financial statements.
17
MET INVESTORS SERIES TRUST
| | |
PIMCO Total Return Portfolio | | |
Schedule of Investments as of June 30, 2011 (Unaudited)
Domestic Bonds & Debt Securities—(Continued)
| | | | | | | | |
| Security Description | | Par
Amount | | | Value | |
| | | | | | | | |
|
| Road & Rail—(Continued) | |
RZD Capital Ltd., Series EMTN | | | | | | | | |
5.739%, 04/03/17 | | $ | 3,200,000 | | | $ | 3,412,000 | |
Union Pacific Corp. | | | | | | | | |
6.625%, 02/01/29 | | | 50,000 | | | | 58,002 | |
| | | | | | | | |
| | | | | | | 24,177,825 | |
| | | | | | | | |
|
| Specialty Retail—0.2% | |
Home Depot, Inc. | | | | | | | | |
5.400%, 03/01/16 | | | 5,000,000 | | | | 5,592,870 | |
Limited Brands, Inc. | | | | | | | | |
6.900%, 07/15/17 | | | 15,000,000 | | | | 16,143,750 | |
| | | | | | | | |
| | | | | | | 21,736,620 | |
| | | | | | | | |
|
| Tobacco—0.2% | |
Altria Group, Inc. | | | | | | | | |
9.700%, 11/10/18 | | | 7,600,000 | | | | 10,001,227 | |
Philip Morris International, Inc. | | | | | | | | |
6.375%, 05/16/38 | | | 4,100,000 | | | | 4,660,454 | |
Reynolds American, Inc. | | | | | | | | |
7.625%, 06/01/16 | | | 2,400,000 | | | | 2,881,625 | |
| | | | | | | | |
| | | | | | | 17,543,306 | |
| | | | | | | | |
|
| Transportation—0.1% | |
GATX Corp. | | | | | | | | |
6.000%, 02/15/18 | | | 5,000,000 | | | | 5,437,255 | |
GATX Financial Corp. | | | | | | | | |
5.800%, 03/01/16 | | | 5,000,000 | | | | 5,473,390 | |
| | | | | | | | |
| | | | | | | 10,910,645 | |
| | | | | | | | |
|
| Wireless Telecommunication Services—0.1% | |
America Movil S.A.B de C.V.
5.000%, 03/30/20 | | | 5,000,000 | | | | 5,240,995 | |
AT&T Wireless Services, Inc.
8.125%, 05/01/12 | | | 200,000 | | | | 212,091 | |
Cingular Wireless LLC
6.500%, 12/15/11 | | | 700,000 | | | | 717,938 | |
| | | | | | | | |
| | | | | | | 6,171,024 | |
| | | | | | | | |
Total Domestic Bonds & Debt Securities
(Cost $2,563,080,835) | | | | | | | 2,690,292,520 | |
| | | | | | | | |
|
| Foreign Bonds & Debt Securities—27.3% | |
| | |
| Aruba Guilder—0.0% | | | | | | | | |
UFJ Finance Aruba AEC
6.750%, 07/15/13 | | | 220,000 | | | | 241,852 | |
| | | | | | | | |
| | | | | | | | |
| | |
| Brazil—1.8% | | | | | | | | |
Banco Nacional de Desenvolvimento Economico e Social | | | | | | | | |
4.125%, 09/15/17 (144A) (EUR) | | $ | 2,700,000 | | | $ | 3,813,510 | |
| Brazil Notas do Tesouro Nacional, | | | | | | | | |
Series F
10.000%, 01/01/12 (BRL) | | | 21,916,200 | | | | 138,848,503 | |
10.000%, 01/01/17
(BRL) | | | 5,730,000 | | | | 33,307,772 | |
| | | | | | | | |
| | | | | | | 175,969,785 | |
| | | | | | | | |
| | |
| Canada—2.5% | | | | | | | | |
Canada Housing Trust No.1 | | | | | | | | |
4.000%, 06/15/12 (144A)
(CAD) | | | 15,200,000 | | | | 16,162,995 | |
4.800%, 06/15/12 (144A) (CAD) | | | 11,800,000 | | | | 12,639,247 | |
4.550%, 12/15/12 (144A) (CAD) | | | 26,300,000 | | | | 28,468,097 | |
2.750%, 12/15/15 (144A) (CAD) | | | 9,000,000 | | | | 9,494,587 | |
3.350%, 12/15/20 (144A) (CAD) | | | 16,300,000 | | | | 16,836,374 | |
Series 15
3.950%, 12/15/11 (CAD) | | | 3,000,000 | | | | 3,150,739 | |
Canadian Government Bond
1.500%, 12/01/12 (CAD) | | | 9,600,000 | | | | 9,966,776 | |
1.750%, 03/01/13 (CAD) | | | 19,900,000 | | | | 20,722,416 | |
2.000%, 08/01/13 (CAD) | | | 19,700,000 | | | | 20,622,049 | |
2.500%, 09/01/13 (CAD) | | | 21,600,000 | | | | 22,836,343 | |
2.250%, 08/01/14 (CAD) | | | 7,900,000 | | | | 8,290,570 | |
2.000%, 12/01/14 (CAD) | | | 18,900,000 | | | | 19,624,247 | |
4.500%, 06/01/15 (CAD) | | | 2,700,000 | | | | 3,057,639 | |
3.000%, 12/01/15 (CAD) | | | 2,800,000 | | | | 3,003,398 | |
Province of Ontario
1.375%, 01/27/14 | | | 13,800,000 | | | | 13,890,224 | |
1.875%, 09/15/15 | | | 3,900,000 | | | | 3,900,589 | |
4.300%, 03/08/17 (CAD) | | | 4,200,000 | | | | 4,640,494 | |
4.200%, 03/08/18 (CAD) | | | 1,300,000 | | | | 1,430,007 | |
5.500%, 06/02/18 (CAD) | | | 2,600,000 | | | | 3,046,550 | |
4.400%, 06/02/19 (CAD) | | | 9,100,000 | | | | 10,013,067 | |
4.200%, 06/02/20 (CAD) | | | 6,900,000 | | | | 7,423,305 | |
Series MTN
4.600%, 06/02/39 (CAD) | | | 4,600,000 | | | | 4,926,295 | |
See accompanying notes to financial statements.
18
MET INVESTORS SERIES TRUST
| | |
PIMCO Total Return Portfolio | | |
Schedule of Investments as of June 30, 2011 (Unaudited)
Foreign Bonds & Debt Securities—(Continued)
| | | | | | | | |
| Security Description | | Par
Amount | | | Value | |
| | | | | | | | |
| |
| Canada—(Continued) | | | | | |
Province of Quebec | | | | | | | | |
4.500%, 12/01/16 (CAD) | | $ | 400,000 | | | $ | 448,747 | |
4.500%, 12/01/20 (CAD) | | | 400,000 | | | | 434,174 | |
| | | | | | | | |
| | | | | | | 245,028,929 | |
| | | | | | | | |
| | |
| Cayman Islands—0.0% | | | | | | | | |
Hutchison Whampoa International, Ltd.
6.250%, 01/24/14 (144A) | | | 245,000 | | | | 271,371 | |
Mizuho Financial Group Cayman, Ltd.
5.790%, 04/15/14 (144A) | | | 315,000 | | | | 341,549 | |
| | | | | | | | |
| | | | | | | 612,920 | |
| | | | | | | | |
| | |
| Denmark—0.3% | | | | | | | | |
Nykredit Realkredit A.S.
2.359%, 04/01/38 (c)
(DKK) | | | 23,030,195 | | | | 4,264,319 | |
2.359%, 10/01/38 (c)
(DKK) | | | 25,195,342 | | | | 4,631,371 | |
| Realkredit Danmark A.S. | | | | | | | | |
Series 73D
2.480%, 01/01/38 (c) (DKK) | | | 22,860,372 | | | | 4,246,674 | |
Series 83D
2.480%, 01/01/38 (DKK) | | | 97,066,598 | | | | 17,889,891 | |
| | | | | | | | |
| | | | | | | 31,032,255 | |
| | | | | | | | |
| | |
| France—0.1% | | | | | | | | |
AXA S.A.
8.600%, 12/15/30 | | | 60,000 | | | | 71,667 | |
Societe Generale S.A.
8.875%, 06/29/49 (c) (GBP) | | | 5,000,000 | | | | 8,034,000 | |
| | | | | | | | |
| | | | | | | 8,105,667 | |
| | | | | | | | |
| | |
| Germany—0.2% | | | | | | | | |
Bundesrepublik Deutschland
3.250%, 07/04/21 (EUR) | | | 14,000,000 | | | | 20,724,947 | |
| | | | | | | | |
| | |
| Italy—0.6% | | | | | | | | |
Italy Buoni Poliennali Del Tesoro
2.350%, 09/15/19 (EUR) | | | 7,343,739 | | | | 10,431,049 | |
Series CPI
2.100%, 09/15/16 (EUR) | | | 823,416 | | | | 1,185,567 | |
2.100%, 09/15/21 (EUR) | | | 31,145,335 | | | | 42,332,097 | |
| | | | | | | | |
| | | | | | | 53,948,713 | |
| | | | | | | | |
| | | | | | | | |
| | |
| Japan—20.0% | | | | | | | | |
| Japan Treasury Bills | | | | | | | | |
Series 130
1.087%, 08/22/11 (e)
(JPY) | | $ | 7,820,000,000 | | | $ | 96,954,231 | |
Series 183
170.594%, 07/11/11 (e) (JPY) | | | 27,820,000,000 | | | | 344,958,686 | |
Series 188
14.977%, 07/25/11 (e) (JPY) | | | 38,270,000,000 | | | | 474,517,154 | |
Series 189
16.634%, 08/01/11 (e)
(JPY) | | | 830,000,000 | | | | 10,291,135 | |
Series 190
0.395%, 08/08/11 (e)
(JPY) | | | 6,310,000,000 | | | | 78,235,941 | |
Series 192
1.719%, 08/15/11 (e) (JPY) | | | 33,460,000,000 | | | | 414,869,563 | |
Series 194
0.010%, 08/22/11 (e) (JPY) | | | 6,310,000,000 | | | | 78,232,968 | |
Series 197
1.384%, 09/05/11 (e) (JPY) | | | 23,810,000,000 | | | | 295,193,808 | |
Series 202
0.485%, 09/20/11 (e) (JPY) | | | 300,000,000 | | | | 3,719,226 | |
Series 204
0.844%, 10/03/11 (e) (JPY) | | | 20,000,000 | | | | 248,241 | |
Series186
71.704%, 07/19/11 (e) (JPY) | | | 11,710,000,000 | | | | 145,197,321 | |
| | | | | | | | |
| | | | | | | 1,942,418,274 | |
| | | | | | | | |
| | |
| Mexico—0.2% | | | | | | | | |
Mexican Bonos
6.000%, 06/18/15 (MXN) | | | 70,900,000 | | | | 6,060,253 | |
United Mexican States
6.050%, 01/11/40 (MXN) | | | 5,100,000 | | | | 5,451,900 | |
| | | | | | | | |
| | | | | | | 11,512,153 | |
| | | | | | | | |
| | |
| Netherlands—0.2% | | | | | | | | |
Deutsche Telekom Finance
5.250%, 07/22/13 | | | 425,000 | | | | 458,578 | |
Fortis Bank Nederland Holding NV
3.000%, 04/17/12 (EUR) | | | 1,600,000 | | | | 2,346,743 | |
GMAC International Finance B.V.
7.500%, 04/21/15 (EUR) | | | 2,800,000 | | | | 4,236,504 | |
See accompanying notes to financial statements.
19
MET INVESTORS SERIES TRUST
| | |
PIMCO Total Return Portfolio | | |
Schedule of Investments as of June 30, 2011 (Unaudited)
Foreign Bonds & Debt Securities—(Continued)
| | | | | | | | |
| Security Description | | Par
Amount | | | Value | |
| | | | | | | | |
| |
| Netherlands—(Continued) | | | | | |
LeasePlan Corp. NV
3.125%, 02/10/12 (EUR) | | $ | 7,700,000 | | | $ | 11,283,669 | |
| | | | | | | | |
| | | | | | | 18,325,494 | |
| | | | | | | | |
| | |
| Panama—0.0% | | | | | | | | |
Panama Government International Bond
9.375%, 04/01/29 | | | 1,161,000 | | | | 1,729,890 | |
6.700%, 01/26/36 | | | 1,150,000 | | | | 1,362,750 | |
| | | | | | | | |
| | | | | | | 3,092,640 | |
| | | | | | | | |
| | |
| Russia—0.0% | | | | | | | | |
Morgan Stanley (Gazprom)
9.625%, 03/01/13 (144A) | | | 130,000 | | | | 146,575 | |
Russian Foreign Bond, Series REGS
3.625%, 04/29/15 | | | 1,500,000 | | | | 1,548,750 | |
| | | | | | | | |
| | | | | | | 1,695,325 | |
| | | | | | | | |
| | |
| Singapore—0.0% | | | | | | | | |
United Overseas Bank, Ltd.
5.375%, 09/03/19 (144A) (c) | | | 470,000 | | | | 504,337 | |
| | | | | | | | |
| | |
| South Africa—0.0% | | | | | | | | |
South Africa Government International Bond
5.875%, 05/30/22 | | | 700,000 | | | | 782,775 | |
| | | | | | | | |
| | |
| South Korea—0.2% | | | | | | | | |
Export-Import Bank of Korea
1.050%, 03/03/12 (144A) (SGD) | | | 18,300,000 | | | | 14,900,895 | |
Korea Housing Finance Corp.
4.125%, 12/15/15 (144A) | | | 2,500,000 | | | | 2,566,726 | |
Standard Chartered First Bank Korea, Ltd.
7.267%, 03/03/34 (144A) (c) | | | 240,000 | | | | 256,200 | |
Woori Bank
6.025%, 03/13/14 (144A) (c) | | | 305,000 | | | | 292,176 | |
| | | | | | | | |
| | | | | | | 18,015,997 | |
| | | | | | | | |
| | |
| Spain—0.8% | | | | | | | | |
Instituto de Credito Oficial
3.276%, 03/25/14 (144A) (c) (EUR) | | | 19,200,000 | | | | 27,726,381 | |
| | | | | | | | |
| |
| Spain—(Continued) | | | | | |
Santander Finance Preferred S.A. Unipersonal, Series 8
| | | | | | | | |
11.300%, 07/27/49 (c) (GBP) | | $ | 7,900,000 | | | $ | 13,487,077 | |
Santander Issuances S.A.
Unipersonal, Series 24
| | | | | | | | |
7.300%, 07/27/19 (c) (GBP) | | | 5,000,000 | | | | 8,367,973 | |
Spain Government Bond
4.650%, 07/30/25 (EUR) | | | 17,000,000 | | | | 22,253,060 | |
4.900%, 07/30/40 (EUR) | | | 1,300,000 | | | | 1,624,294 | |
| | | | | | | | |
| | | | | | | 73,458,785 | |
| | | | | | | | |
| | |
| Sweden—0.0% | | | | | | | | |
Swedbank A.B.
3.625%, 12/02/11 (EUR) | | | 1,400,000 | | | | 2,047,554 | |
| | | | | | | | |
| | |
| United Kingdom—0.4% | | | | | | | | |
| Barclays Bank plc, | | | | | | | | |
Series EMTN
6.000%, 01/23/18 (EUR) | | | 15,000,000 | | | | 21,725,894 | |
| FCE Bank plc, | | | | | | | | |
Series EMTN
7.125%, 01/15/13 (EUR) | | | 4,000,000 | | | | 6,027,255 | |
HBOS Capital Funding LP
6.071%, 06/30/49 (144A) (c) | | | 45,000 | | | | 39,150 | |
Royal Bank of Scotland plc (The), Series MPLE | | | | | | | | |
2.011%, 03/30/15 (c) (CAD) | | | 7,763,000 | | | | 7,082,223 | |
| | | | | | | | |
| | | | | | | 34,874,522 | |
| | | | | | | | |
Total Foreign Bonds & Debt Securities
(Cost $2,564,158,282) | | | | | | | 2,642,392,924 | |
| | | | | | | | |
|
| Mortgage-Backed Securities—4.9% | |
|
| Collateralized-Mortgage Obligations—3.3% | |
Adjustable Rate Mortgage Trust
2.791%, 05/25/35 (c) | | | 569,828 | | | | 556,909 | |
4.207%, 11/25/35 (c) | | | 1,085,636 | | | | 811,357 | |
2.820%, 05/16/47 (144A) (EUR) (c) | | | 13,300,000 | | | | 19,301,941 | |
See accompanying notes to financial statements.
20
MET INVESTORS SERIES TRUST
| | |
PIMCO Total Return Portfolio | | |
Schedule of Investments as of June 30, 2011 (Unaudited)
Mortgage-Backed Securities—(Continued)
| | | | | | | | |
| Security Description | | Par
Amount | | | Value | |
| | | | | | | | |
|
| Collateralized-Mortgage Obligations—(Continued) | |
American Home Mortgage Assets
1.198%, 11/25/46 (c) | | $ | 5,629,212 | | | $ | 2,620,640 | |
American Home Mortgage Investment Trust 2.403%, 02/25/45 (c) | | | 2,876,593 | | | | 2,560,617 | |
Arran Residential Mortgages Funding plc 2.620%, 05/16/47 (144A) (EUR) (c) | | | 4,209,397 | | | | 6,113,409 | |
Banc of America Funding Corp.
2.783%, 05/25/35 (c) | | | 4,549,104 | | | | 4,411,296 | |
2.785%, 02/20/36 (c) | | | 10,314,755 | | | | 9,520,519 | |
5.775%, 01/20/47 (c) | | | 634,067 | | | | 423,153 | |
Banc of America Mortgage Securities, Inc. 5.000%, 05/25/34 | | | 360,746 | | | | 361,598 | |
BCAP LLC Trust
5.250%, 02/26/36 (144A) | | | 13,735,485 | | | | 13,519,545 | |
0.356%, 01/25/37 (c) | | | 3,986,687 | | | | 2,101,875 | |
5.250%, 08/26/37 (144A) (g) | | | 23,354,000 | | | | 23,157,612 | |
Bear Stearns Adjustable Rate Mortgage Trust 2.768%, 02/25/33 (c) | | | 37,437 | | | | 33,431 | |
2.340%, 08/25/35 (c) | | | 64,869 | | | | 61,279 | |
2.400%, 08/25/35 (c) | | | 1,820,517 | | | | 1,691,349 | |
Bear Stearns ALT-A Trust
1.026%, 11/25/34 (c) | | | 1,372,209 | | | | 1,091,232 | |
2.652%, 05/25/35 (c) | | | 2,917,944 | | | | 2,306,127 | |
2.916%, 09/25/35 (c) | | | 2,299,794 | | | | 1,675,667 | |
4.627%, 11/25/36 (c) | | | 6,959,315 | | | | 4,432,704 | |
4.838%, 11/25/36 (c) | | | 3,943,475 | | | | 2,334,356 | |
Bear Stearns Structured Products, Inc.
3.190%, 01/26/36 (c) | | | 2,350,132 | | | | 1,508,236 | |
5.027%, 12/26/46 (c) | | | 1,638,483 | | | | 1,092,105 | |
Chase Mortgage Finance Corp.
5.392%, 12/25/35 (c) | | | 19,686,373 | | | | 18,711,307 | |
6.019%, 09/25/36 (c) | | | 11,473,248 | | | | 10,914,225 | |
Chevy Chase Mortgage Funding Corp. | | | | | | | | |
0.436%, 08/25/35
(144A) (c) | | | 109,108 | | | | 76,063 | |
0.316%, 05/25/48
(144A) (c) | | | 4,480,282 | | | | 1,903,604 | |
| | | | | | | | |
|
| Collateralized-Mortgage Obligations—(Continued) | |
Citigroup Mortgage Loan Trust, Inc.
2.370%, 08/25/35 (c) | | $ | 6,614,117 | | | $ | 6,309,983 | |
2.450%, 08/25/35 (c) | | | 2,183,175 | | | | 1,902,293 | |
2.670%, 12/25/35 (c) | | | 10,679,472 | | | | 9,921,534 | |
Countrywide Alternative Loan Trust
4.814%, 05/25/35 (c) | | | 8,062,335 | | | | 912,390 | |
0.396%, 03/20/46 (c) | | | 336,694 | | | | 192,212 | |
Countrywide Home Loan Mortgage Pass Through Trust
0.476%, 04/25/35 (c) | | | 179,809 | | | | 114,437 | |
0.526%, 06/25/35
(144A) (c) | | | 6,145,185 | | | | 5,571,182 | |
Countrywide Home Loans
5.750%, 05/25/33 | | | 28,095 | | | | 28,280 | |
0.506%, 03/25/35 (c) | | | 1,608,062 | | | | 1,069,551 | |
4.757%, 09/20/36 (c) | | | 8,257,833 | | | | 4,717,696 | |
Credit Suisse First Boston Mortgage Securities Corp. | | | | | | | | |
0.884%, 03/25/32
(144A) (c) | | | 144,560 | | | | 119,998 | |
6.500%, 04/25/33 | | | 131,230 | | | | 137,930 | |
6.000%, 11/25/35 | | | 4,495,091 | | | | 3,278,032 | |
DSLA Mortgage Loan Trust
2.505%, 07/19/44 (c) | | | 1,266,879 | | | | 976,267 | |
First Horizon Alternative Mortgage Securities
4.514%, 01/25/36 (c) | | | 82,453,129 | | | | 9,392,961 | |
First Horizon Asset Securities, Inc.
2.848%, 08/25/35 (c) | | | 453,619 | | | | 380,892 | |
GMAC Mortgage Corp.
5.940%, 07/01/13 (g) | | | 3,068 | | | | 3,062 | |
Granite Mortgages plc | | | | | | | | |
1.199%, 01/20/44
(GBP) (c) | | | 1,221,292 | | | | 1,892,707 | |
1.718%, 01/20/44
(EUR) (c) | | | 759,241 | | | | 1,063,539 | |
1.015%, 09/20/44
(GBP) (c) | | | 6,240,025 | | | | 9,650,479 | |
1.634%, 09/20/44
(EUR) (c) | | | 743,633 | | | | 1,039,515 | |
Greenpoint Mortgage Funding Trust
0.406%, 06/25/45 (c) | | | 124,234 | | | | 82,635 | |
0.266%, 01/25/47 (c) | | | 56,595 | | | | 53,249 | |
See accompanying notes to financial statements.
21
MET INVESTORS SERIES TRUST
| | |
PIMCO Total Return Portfolio | | |
Schedule of Investments as of June 30, 2011 (Unaudited)
Mortgage-Backed Securities—(Continued)
| | | | | | | | |
| Security Description | | Par
Amount | | | Value | |
| | | | | | | | |
|
| Collateralized-Mortgage Obligations—(Continued) | |
GSR Mortgage Loan Trust
6.000%, 03/25/32 | | $ | 478 | | | $ | 502 | |
2.790%, 09/25/35 (c) | | | 164,619 | | | | 157,570 | |
2.841%, 04/25/36 (c) | | | 4,893,342 | | | | 3,984,267 | |
Harborview Mortgage Loan Trust
0.407%, 05/19/35 (c) | | | 1,925,537 | | | | 1,282,680 | |
0.377%, 01/19/38 (c) | | | 291,324 | | | | 184,245 | |
Holmes Master Issuer plc | | | | | | | | |
2.677%, 10/15/54
(144A) (EUR) | | | 7,600,000 | | | | 11,081,817 | |
Indymac ARM Trust | | | | | | | | |
1.928%, 01/25/32 (c) | | | 1,199 | | | | 997 | |
1.929%, 01/25/32 (c) | | | 40,351 | | | | 33,440 | |
Indymac Index Mortgage Loan Trust | | | | | | | | |
2.664%, 12/25/34 (c) | | | 313,049 | | | | 234,068 | |
JPMorgan Mortgage Trust | | | | | | | | |
5.015%, 02/25/35 (c) | | | 1,175,373 | | | | 1,169,651 | |
2.967%, 07/25/35 (c) | | | 7,646,597 | | | | 7,522,347 | |
5.359%, 07/25/35 (c) | | | 14,886,565 | | | | 14,632,377 | |
5.750%, 01/25/36 | | | 1,466,834 | | | | 1,363,114 | |
Master Alternative Loans Trust | | | | | | | | |
0.586%, 03/25/36 (c) | | | 1,023,074 | | | | 335,827 | |
Merrill Lynch Mortgage Investments, Inc. | | | | | | | | |
1.191%, 10/25/35 (c) | | | 363,554 | | | | 299,357 | |
4.250%, 10/25/35 (c) | | | 1,204,650 | | | | 1,004,656 | |
0.436%, 11/25/35 (c) | | | 260,464 | | | | 224,143 | |
0.396%, 02/25/36 (c) | | | 1,948,308 | | | | 1,431,541 | |
Morgan Stanley Mortgage Loan Trust | | | | | | | | |
5.500%, 08/25/35 | | | 12,541,507 | | | | 12,206,661 | |
Nomura Asset Acceptance Corp. | | | | | | | | |
4.976%, 05/25/35 (f) | | | 7,419,190 | | | | 6,723,099 | |
RBSSP Resecuritization Trust | | | | | | | | |
0.426%, 06/27/36
(144A) (c) | | | 8,300,000 | | | | 4,606,500 | |
Residential Accredit Loans, Inc. | | | | | | | | |
0.586%, 03/25/33 (c) | | | 889,408 | | | | 808,936 | |
6.000%, 06/25/36 | | | 3,777,616 | | | | 2,349,243 | |
0.366%, 06/25/46 (c) | | | 2,498,344 | | | | 922,916 | |
Residential Asset Securitization Trust | | | | | | | | |
0.586%, 05/25/33 (c) | | | 589,298 | | | | 565,874 | |
0.586%, 01/25/46 (c) | | | 2,549,825 | | | | 1,139,616 | |
| | | | | | | | |
|
| Collateralized-Mortgage Obligations—(Continued) | |
Residential Funding Mortgage Securities I | | | | | | | | |
0.536%, 06/25/18 (c) | | $ | 43,973 | | | $ | 42,994 | |
Sequoia Mortgage Trust | | | | | | | | |
0.536%, 07/20/33 (c) | | | 710,405 | | | | 663,970 | |
Structured Adjustable Rate Mortgage Loan Trust | | | | | | | | |
2.609%, 01/25/35 (c) | | | 4,178,350 | | | | 3,391,128 | |
2.532%, 04/25/35 (c) | | | 13,607,469 | | | | 10,554,518 | |
2.638%, 08/25/35 (c) | | | 320,500 | | | | 250,872 | |
Structured Asset Mortgage Investments, Inc. | | | | | | | | |
0.436%, 07/19/35 (c) | | | 2,199,308 | | | | 1,934,938 | |
0.416%, 05/25/45 (c) | | | 1,974,824 | | | | 1,241,195 | |
Structured Asset Securities Corp. | | | | | | | | |
2.750%, 10/25/35
(144A) (c) | | | 109,442 | | | | 88,358 | |
Thornburg Mortgage Securities Trust | | | | | | | | |
0.306%, 10/25/46 (c) | | | 926,653 | | | | 921,131 | |
Washington Mutual Pass-Through Certificate | | | | | | | | |
2.609%, 02/27/34 (c) | | | 496,281 | | | | 496,193 | |
1.678%, 06/25/42 (c) | | | 310,074 | | | | 247,831 | |
1.678%, 08/25/42 (c) | | | 153,582 | | | | 134,430 | |
Wells Fargo Mortgage Backed Securities Trust | | | | | | | | |
2.733%, 09/25/33 (c) | | | 1,860,322 | | | | 1,832,938 | |
2.756%, 03/25/36 (c) | | | 31,042,600 | | | | 26,933,580 | |
2.872%, 04/25/36 (c) | | | 4,071,800 | | | | 3,724,742 | |
5.620%, 04/25/36 (c) | | | 1,896,494 | | | | 872,349 | |
5.195%, 08/25/36 (c) | | | 352,260 | | | | 351,025 | |
| | | | | | | | |
| | | | | | | 320,050,616 | |
| | | | | | | | |
|
| Commercial Mortgage-Backed Securities—1.6% | |
Banc of America Commercial Mortgage, Inc. | | | | | | | | |
5.451%, 01/15/49 | | | 8,400,000 | | | | 9,096,118 | |
Banc of America Large Loan, Inc. | | | | | | | | |
1.938%, 11/15/15
(144A) (c) | | | 7,022,305 | | | | 6,522,412 | |
Bear Stearns Commercial Mortgage Securities, Inc. | | | | | | | | |
5.331%, 02/11/44 | | | 400,000 | | | | 423,073 | |
5.471%, 01/12/45 (c) | | | 1,100,000 | | | | 1,212,738 | |
5.700%, 06/11/50 | | | 6,400,000 | | | | 6,966,308 | |
See accompanying notes to financial statements.
22
MET INVESTORS SERIES TRUST
| | |
PIMCO Total Return Portfolio | | |
Schedule of Investments as of June 30, 2011 (Unaudited)
Mortgage-Backed Securities—(Continued)
| | | | | | | | |
| Security Description | | Par
Amount | | | Value | |
| | | | | | | | |
|
| Commercial Mortgage-Backed Securities—(Continued) | |
Commercial Mortgage Pass Through Certificates | | | | | | | | |
5.306%, 12/10/46 | | $ | 1,900,000 | | | $ | 2,037,187 | |
Credit Suisse Mortgage Capital Certificates | | | | | | | | |
5.661%, 03/15/39 (c) | | | 400,000 | | | | 436,303 | |
5.467%, 09/15/39 | | | 22,300,000 | | | | 24,078,258 | |
Greenwich Capital Commercial Funding Corp. | | | | | | | | |
5.444%, 03/10/39 | | | 9,800,000 | | | | 10,526,150 | |
4.799%, 08/10/42 (c) | | | 100,000 | | | | 106,924 | |
GS Mortgage Securities Corp. II | | | | | | | | |
1.142%, 03/06/20
(144A) (c) | | | 5,259,966 | | | | 5,203,222 | |
JPMorgan Chase Commercial Mortgage Securities | | | | | | | | |
4.070%, 11/15/43 (144A) | | | 13,700,000 | | | | 13,247,538 | |
5.420%, 01/15/49 | | | 400,000 | | | | 429,442 | |
5.882%, 02/15/51 (c) | | | 900,000 | | | | 979,960 | |
Lehman Brothers-UBS Commercial Mortgage Trust | | | | | | | | |
5.866%, 09/15/45 (c) | | | 15,200,000 | | | | 16,551,788 | |
Merrill Lynch Commercial Mortgage Pass-Through Certificates | | | | | | | | |
0.728%, 07/09/21 (144A) (c) | | | 13,297,259 | | | | 12,780,757 | |
Merrill Lynch/Countrywide Commercial Mortgage Trust | | | | | | | | |
5.967%, 08/12/49 (c) | | | 11,800,000 | | | | 12,936,818 | |
5.485%, 03/12/51 (c) | | | 2,200,000 | | | | 2,340,000 | |
Morgan Stanley Capital, Inc. | | | | | | | | |
0.247%, 10/15/20 (144A) (c) | | | 703,754 | | | | 686,937 | |
5.879%, 06/11/49 (c) | | | 3,600,000 | | | | 3,941,467 | |
5.809%, 12/12/49 | | | 200,000 | | | | 219,768 | |
Morgan Stanley Dean Witter Capital I | | | | | | | | |
4.920%, 03/12/35 | | | 495,000 | | | | 519,426 | |
Morgan Stanley Reremic Trust | | | | | | | | |
5.800%, 08/12/45 (144A) (c) | | | 900,000 | | | | 986,230 | |
Silenus (European Loan Conduit) | | | | | | | | |
1.570%, 05/15/19 (EUR) (c) | | | 1,174,144 | | | | 1,563,687 | |
Sovereign Commercial Mortgage Securities Trust | | | | | | | | |
5.938%, 07/22/30 (144A) (c) | | | 1,248,079 | | | | 1,297,529 | |
| | | | | | | | |
|
| Commercial Mortgage-Backed Securities—(Continued) | |
Wachovia Bank Commercial Mortgage Trust | | | | | | | | |
0.277%, 09/15/21 (144A) (c) | | $ | 3,160,518 | | | $ | 3,049,316 | |
5.342%, 12/15/43 | | | 16,700,000 | | | | 17,608,613 | |
| | | | | | | | |
| | | | | | | 155,747,969 | |
| | | | | | | | |
Total Mortgage-Backed Securities
(Cost $481,655,741) | | | | | | | 475,798,585 | |
| | | | | | | | |
|
| Municipals—3.2% | |
American Municipal Power-Ohio, Inc., Combined Hydroelectric Projects Revenue, Build America Bonds, Taxable | | | | | | | | |
8.084%, 02/15/50 | | | 6,900,000 | | | | 8,587,947 | |
Badger Tobacco Asset Securitization Corp. | | | | | | | | |
6.125%, 06/01/27 | | | 115,000 | | | | 120,938 | |
Bay Area Toll Bridge Authority, Build America Bonds,
Series S1 | | | | | | | | |
7.043%, 04/01/50 | | | 10,400,000 | | | | 11,397,568 | |
Buckeye Tobacco Settlement Financing Authority | | | | | | | | |
5.875%, 06/01/47 | | | 4,600,000 | | | | 3,360,070 | |
California Infrastructure & Economic Development Bank Revenue, Build America Bonds | | | | | | | | |
6.486%, 05/15/49 | | | 2,500,000 | | | | 2,567,450 | |
California State General Obligation Unlimited, Build America Bonds | | | | | | | | |
5.650%, 04/01/13 (c) | | | 2,700,000 | | | | 2,876,337 | |
7.500%, 04/01/34 | | | 2,900,000 | | | | 3,282,800 | |
7.950%, 03/01/36 | | | 700,000 | | | | 763,378 | |
7.550%, 04/01/39 | | | 2,900,000 | | | | 3,321,544 | |
7.600%, 11/01/40 | | | 6,900,000 | | | | 7,958,253 | |
California State Public Works Board Lease Revenue, Build America Bonds, Taxable, University Projects, | | | | | | | | |
Series B-2 7.804%, 03/01/35 | | | 3,100,000 | | | | 3,145,043 | |
California State University Revenue, Build America Bonds | | | | | | | | |
6.484%, 11/01/41 | | | 4,400,000 | | | | 4,456,936 | |
See accompanying notes to financial statements.
23
MET INVESTORS SERIES TRUST
| | |
PIMCO Total Return Portfolio | | |
Schedule of Investments as of June 30, 2011 (Unaudited)
Municipals—(Continued)
| | | | | | | | |
| Security Description | | Par
Amount | | | Value | |
| | | | | | | | |
Calleguas-Las Virgenes California Public Financing Water Revenue Authority, Build America Bonds | | | | | | | | |
5.944%, 07/01/40 | | $ | 7,800,000 | | | $ | 7,843,602 | |
Chicago Transit Authority Transfer Tax Receipts Revenue | | | | | | | | |
Series A
6.300%, 12/01/21 | | | 400,000 | | | | 427,912 | |
6.899%, 12/01/40 | | | 7,300,000 | | | | 7,783,333 | |
Series B
6.300%, 12/01/21 | | | 700,000 | | | | 748,846 | |
6.899%, 12/01/40 | | | 7,200,000 | | | | 7,676,712 | |
Clark County NV, Airport Revenue, Series C | | | | | | | | |
6.820%, 07/01/45 | | | 4,800,000 | | | | 5,237,136 | |
Clark County NV, Refunding | | | | | | | | |
4.750%, 06/01/30 | | | 5,500,000 | | | | 5,425,475 | |
East Baton Rouge Sewer Commission, Build America Bonds | | | | | | | | |
6.087%, 02/01/45 | | | 17,000,000 | | | | 17,347,990 | |
Golden State Tobacco Securitization Corp., Series A-1 5.000%, 06/01/33 | | | 10,000,000 | | | | 7,373,300 | |
Illinois Finance Authority, Peoples Gas Light & Coke | | | | | | | | |
5.000%, 02/01/33(AMBAC) | | | 7,410,000 | | | | 7,413,038 | |
Irvine Ranch CA, Water District, Build America Bonds, Taxable,
Series B | | | | | | | | |
6.622%, 05/01/40 | | | 21,700,000 | | | | 25,631,389 | |
Los Angeles CA, Wastewater System Revenue, Build America Bonds | | | | | | | | |
5.713%, 06/01/39 | | | 2,300,000 | | | | 2,289,121 | |
Los Angeles Department of Water & Power Build America Bonds | | | | | | | | |
6.166%, 07/01/40 | | | 60,200,000 | | | | 60,512,438 | |
Subseries A-2 5.000%, 07/01/44 | | | 2,900,000 | | | | 2,905,916 | |
Los Angeles Department of Water & Power Revenue, Build America Bonds | | | | | | | | |
6.603%, 07/01/50 | | | 3,200,000 | | | | 3,567,008 | |
| | | | | | | | |
Los Angeles, California Unified School District Build America Bonds | | | | | | | | |
6.758%, 07/01/34 | | $ | 1,100,000 | | | $ | 1,246,014 | |
Refunding, Series A 4.500%, 07/01/25(MBIA) | | | 5,000,000 | | | | 4,959,000 | |
4.500%, 01/01/28(MBIA) | | | 3,700,000 | | | | 3,502,827 | |
Metropolitan Transportation Authority, Build America Bonds, Metro Transit Authority, Series A2 6.089%, 11/15/40 | | | 200,000 | | | | 210,622 | |
Municipal Electric Authority of Georgia
6.655%, 04/01/57 | | | 1,300,000 | | | | 1,226,888 | |
New Jersey Economic Development Authority, Build America Bonds
1.247%, 09/15/11 (c) | | | 19,100,000 | | | | 19,082,810 | |
New Jersey State Turnpike Authority Revenue, Build America Bonds, Taxable
7.102%, 01/01/41 | | | 5,300,000 | | | | 6,167,928 | |
Newport Beach CA, Certificates of Participation, Build America Bonds
7.168%, 07/01/40 | | | 31,650,000 | | | | 32,005,113 | |
Palomar Community College District, Series A
4.750%, 05/01/32 | | | 300,000 | | | | 297,240 | |
Pennsylvania Economic Development Financing Authority, Build America Bonds
6.532%, 06/15/39 | | | 1,000,000 | | | | 1,011,200 | |
Port Authority of New York & New Jersey, One Hundred Sixtyfifth
5.647%, 11/01/40 | | | 3,000,000 | | | | 3,032,010 | |
Public Power Generation Agency, Build America Bonds, Whelan Energy Centre Unit, Series 2-B
7.242%, 01/01/41 | | | 1,800,000 | | | | 1,856,898 | |
State of Illinois
4.071%, 01/01/14 | | | 7,300,000 | | | | 7,562,216 | |
Build America Bonds
6.900%, 03/01/35 | | | 2,100,000 | | | | 2,142,546 | |
See accompanying notes to financial statements.
24
MET INVESTORS SERIES TRUST
| | |
PIMCO Total Return Portfolio | | |
Schedule of Investments as of June 30, 2011 (Unaudited)
Municipals—(Continued)
| | | | | | | | |
| Security Description | | Par
Amount | | | Value | |
| | | | | | | | |
State of Texas Transportation Commission Mobility Funding, Series A
4.750%, 04/01/35 | | $ | 3,500,000 | | | $ | 3,521,175 | |
State of Texas Transportation Commission Revenue, Build America Bonds, Series B
5.178%, 04/01/30 | | | 3,000,000 | | | | 3,075,600 | |
Tobacco Settlement Financing Corp.
5.000%, 06/01/41 | | | 900,000 | | | | 615,762 | |
7.467%, 06/01/47 | | | 7,915,000 | | | | 5,869,922 | |
Tobacco Settlement Funding Corp. 5.875%, 05/15/39 | | | 2,000,000 | | | | 1,932,100 | |
6.250%, 06/01/42 | | | 1,300,000 | | | | 1,220,765 | |
| | | | | | | | |
Total Municipals (Cost $304,109,132) | | | | | | | 314,560,116 | |
| | | | | | | | |
|
| Asset-Backed Securities—1.9% | |
| |
| Asset Backed - Automobile—0.0% | | | | | |
Daimler Chrysler Auto Trust 1.670%, 09/10/12 (c) | | | 38,651 | | | | 38,662 | |
| | | | | | | | |
| |
| Asset Backed-Home Equity—0.2% | | | | | |
Asset Backed Funding Certificates | | | | | | | | |
0.536%, 06/25/34 (c) | | | 4,224,232 | | | | 3,366,185 | |
0.246%, 01/25/37 (c) | | | 13,240 | | | | 13,209 | |
Asset Backed Securities Corp. | | | | | | | | |
0.266%, 05/25/37 (c) | | | 361,366 | | | | 306,237 | |
Bear Stearns Asset Backed Securities Trust | | | | | | | | |
0.586%, 10/27/32 (c) | | | 23,611 | | | | 20,642 | |
0.436%, 04/25/37 (c) | | | 15,761,000 | | | | 4,908,976 | |
1.186%, 10/25/37 (c) | | | 7,476,793 | | | | 4,628,591 | |
Household Home Equity Loan | | | | | | | | |
0.986%, 11/20/36 (c) | | | 98,024 | | | | 97,973 | |
Morgan Stanley Capital, Inc. | | | | | | | | |
0.246%, 05/25/37 (c) | | | 683,554 | | | | 590,064 | |
Option One Mortgage Loan Trust | | | | | | | | |
0.826%, 08/25/33 (c) | | | 29,133 | | | | 23,820 | |
0.246%, 07/25/37 (c) | | | 564,922 | | | | 544,711 | |
Renaissance Home Equity Loan Trust | | | | | | | | |
0.626%, 08/25/33 (c) | | | 264,865 | | | | 244,573 | |
Soundview Home Equity Loan Trust | | | | | | | | |
0.266%, 06/25/37 (c) | | | 73,221 | | | | 61,769 | |
| | | | | | | | |
| | | | | | | 14,806,750 | |
| | | | | | | | |
| Asset-Backed Securities—(Continued) | |
| Security Description | | Par
Amount | | | Value | |
| | | | | | | | |
| |
| Asset Backed - Other—1.6% | | | | | |
ARES CLO Funds | | | | | | | | |
0.544%, 04/20/17 (144A) (c) | | $ | 6,923,330 | | | $ | 6,795,473 | |
Avery Point CLO, Ltd. | | | | | | | | |
0.725%, 12/17/15 (144A) (c) | | | 2,263,435 | | | | 2,221,217 | |
Babson CLO, Ltd. | | | | | | | | |
0.617%, 06/15/16 (144A) (c) | | | 3,695,692 | | | | 3,633,327 | |
Blackrock Senior Income Series Corp. | | | | | | | | |
0.514%, 04/20/19 (144A) (c) | | | 7,870,863 | | | | 7,381,924 | |
Carrington Mortgage Loan Trust | | | | | | | | |
0.506%, 10/25/35 (c) | | | 880,024 | | | | 823,230 | |
Citigroup Mortgage Loan Trust, Inc. | | | | | | | | |
0.246%, 07/25/45 (c) | | | 1,117,858 | | | | 916,236 | |
Denali Capitala CLO IV, Ltd. | | | | | | | | |
0.616%, 08/23/16 (144A) (c) | | | 4,784,366 | | | | 4,702,203 | |
Dryden Leveraged Loan CDO | | | | | | | | |
0.787%, 12/22/15 (144A) (c) | | | 1,669,017 | | | | 1,651,297 | |
Galaxy CLO, Ltd. | | | | | | | | |
0.514%, 04/25/19 (144A) (c) | | | 14,400,681 | | | | 13,725,649 | |
Grayston CLO, Ltd. | | | | | | | | |
0.641%, 08/15/16 (144A) (c) | | | 2,111,353 | | | | 2,077,127 | |
Green Tree Financial Corp. | | | | | | | | |
6.220%, 03/01/30 | | | 106,768 | | | | 114,430 | |
Hillmark Funding | | | | | | | | |
0.509%, 05/21/21 (144A) (c) | | | 29,600,000 | | | | 27,812,367 | |
Hudson Straits CLO, Ltd. | | | | | | | | |
0.658%, 10/15/16 (144A) (c) | | | 4,305,936 | | | | 4,246,892 | |
Katonah, Ltd. | | | | | | | | |
0.797%, 02/20/15 (144A) (c) | | | 1,570,035 | | | | 1,549,985 | |
0.701%, 05/18/15 (144A) (c) | | | 5,620,402 | | | | 5,499,726 | |
Merrill Lynch First Franklin Mortgage Loan Trust
0.246%, 07/25/37 (c) | | | 88,418 | | | | 86,590 | |
See accompanying notes to financial statements.
25
MET INVESTORS SERIES TRUST
| | |
PIMCO Total Return Portfolio | | |
Schedule of Investments as of June 30, 2011 (Unaudited)
Asset-Backed Securities—(Continued)
| | | | | | | | |
| Security Description | | Par
Amount | | | Value | |
| | | | | | | | |
| |
| Asset Backed - Other—(Continued) | | | | | |
Mid-State Trust
7.791%, 03/15/38 | | $ | 182,735 | | | $ | 176,094 | |
Mountain View Funding CLO
0.538%, 04/15/19 (144A) (c) | | | 4,958,831 | | | | 4,751,256 | |
MSIM Peconic Bay, Ltd.
0.554%, 07/20/19 (144A) (c) | | | 9,200,000 | | | | 8,816,481 | |
NYLIM Flatiron CLO, Ltd.
0.826%, 07/18/15 (144A) (c) | | | 3,412,106 | | | | 3,385,386 | |
Octagon Investment Partners V, Ltd.
0.554%, 11/28/18 (144A) (c) | | | 12,600,000 | | | | 12,032,840 | |
Octagon Investment Partners VII, Ltd.
0.613%, 12/02/16 (144A) (c) | | | 5,962,858 | | | | 5,783,823 | |
Pacifica CDO, Ltd. | | | | | | | | |
0.640%, 05/13/16 (144A) (c) | | | 4,898,156 | | | | 4,778,057 | |
0.534%, 01/26/20 (144A) (c) | | | 12,051,095 | | | | 11,582,549 | |
Penta CLO S.A.
1.934%, 06/04/24 (c) (EUR) | | | 2,808,091 | | | | 3,728,413 | |
Popular ABS Mortgage Pass-Through Trust 0.276%, 06/25/47 (c) | | | 1,498,504 | | | | 1,327,339 | |
Residential Asset Securities Corp. 0.296%, 04/25/37 (c) | | | 326,848 | | | | 322,597 | |
Small Business Administration Participation Certificates
6.220%, 12/01/28 | | | 8,872,606 | | | | 9,858,338 | |
United States Small Business Administration
5.471%, 03/10/18 | | | 3,817,897 | | | | 4,129,346 | |
Velocity CLO, Ltd.
0.609%, 08/22/16 (144A) (c) | | | 2,776,778 | | | | 2,718,769 | |
| | | | | | | | |
| | | | | | | 156,628,961 | |
| | | | | | | | |
|
| Asset Backed - Student Loan—0.1% | |
SLM Student Loan Trust
0.724%, 01/25/17 (c) | | | 3,000,000 | | | | 3,006,240 | |
| | | | | | | | |
|
| Asset Backed - Student Loan—(Continued) | |
0.404%, 01/25/19 (c) | | $ | 7,547,268 | | | $ | 7,521,118 | |
2.837%, 12/16/19 (144A) (c) | | | 2,200,000 | | | | 2,251,598 | |
| | | | | | | | |
| | | | | | | 12,778,956 | |
| | | | | | | | |
Total Asset-Backed Securities
(Cost $187,133,789) | | | | | | | 184,253,329 | |
| | | | | | | | |
|
| Convertible Preferred Stocks—1.0% | |
| Security Description | | Shares | | | Value | |
|
| Commercial Banks—0.6% | |
Wells Fargo & Co., Series L
7.500%, due 12/31/49 | | | 53,950 | | | | 57,187,000 | |
| | | | | | | | |
|
| Energy Equipment & Services—0.4% | |
Transocean, Ltd., Series B
1.500%, due 12/15/37 | | | 44,600,000 | | | | 44,767,250 | |
| | | | | | | | |
Total Convertible Preferred Stocks
(Cost $81,535,468) | | | | | | | 101,954,250 | |
| | | | | | | | |
|
| Preferred Stocks—1.0% | |
|
| Commercial Banks—0.6% | |
Wells Fargo Co. (c) | | | 50,400,000 | | | | 54,684,000 | |
| | | | | | | | |
|
| Diversified Financial Services—0.4% | |
GMAC Capital Trust I, Series 2* (c) | | | 1,130,800 | | | | 29,051,948 | |
JPMorgan Chase & Co., Series 1 (c) | | | 8,200,000 | | | | 8,837,509 | |
| | | | | | | | |
| | | | | | | 37,889,457 | |
| | | | | | | | |
|
| Insurance—0.0% | |
American International Group, Inc. | | | 168,900 | | | | 293,886 | |
| | | | | | | | |
Total Preferred Stocks
(Cost $96,543,148) | | | | | | | 92,867,343 | |
| | | | | | | | |
|
| Loan Participation—0.3% | |
| Security Description | | Principal
Amount | | | Value | |
|
| Automobiles—0.0% | |
Ford Motor Co. | | | | | | | | |
2.940%, 11/29/13 | | $ | 1,490,385 | | | | 1,491,584 | |
See accompanying notes to financial statements.
26
MET INVESTORS SERIES TRUST
| | |
PIMCO Total Return Portfolio | | |
Schedule of Investments as of June 30, 2011 (Unaudited)
Loan Participation—(Continued)
| | | | | | | | |
| Security Description | | Principal
Amount | | | Value | |
| | | | | | | | |
|
| Automobiles—(Continued) | |
2.940%, 12/15/13 | | $ | 533,129 | | | $ | 533,558 | |
2.940%, 12/16/13 | | | 234,736 | | | | 234,925 | |
| | | | | | | | |
| | | | | | | 2,260,067 | |
| | | | | | | | |
|
| Commercial Banks—0.0% | |
CIT Group, Inc. | | | | | | | | |
6.250%, 07/27/15 | | | 383,385 | | | | 386,205 | |
6.250%, 08/11/15 | | | 1,150,115 | | | | 1,158,574 | |
| | | | | | | | |
| | | | | | | 1,544,779 | |
| | | | | | | | |
|
| Consumer Finance—0.2% | |
Springleaf Finance Corp. | | | | | | | | |
5.500%, 05/28/17 | | | 23,300,000 | | | | 22,871,863 | |
| | | | | | | | |
|
| Oil & Gas Exploration & Production—0.1% | |
Petroleum Export, Ltd. | | | | | | | | |
3.247%, 12/07/12 | | | 7,675,560 | | | | 7,630,789 | |
| | | | | | | | |
Total Loan Participation
(Cost $34,631,136) | | | | | | | 34,307,498 | |
| | | | | | | | |
|
| Short-Term Investments—11.3% | |
| Security Description | | Par
Amount | | | Value | |
|
| Commercial Paper—10.1% | |
Banco Bradesco S.A. | | | | | | | | |
1.000%, 08/26/11 (144A) | | | 92,900,000 | | | | 92,669,360 | |
Bank of Nova Scotia | | | | | | | | |
0.518%, 08/09/12 (c) | | | 7,400,000 | | | | 7,397,780 | |
Erste Abwicklungsanstalt | | | | | | | | |
0.370%, 01/17/12 | | | 1,800,000 | | | | 1,796,300 | |
Itau Unibanco S.A. New York | | | | | | | | |
0.010%, 07/11/11 | | | 37,100,000 | | | | 37,086,647 | |
1.450%, 12/05/11 | | | 8,900,000 | | | | 8,843,074 | |
0.010%, 01/17/12 | | | 29,500,000 | | | | 29,218,154 | |
Kells Funding LLC | | | | | | | | |
0.300%, 07/07/11 | | | 32,300,000 | | | | 32,298,385 | |
0.280%, 07/08/11 | | | 30,800,000 | | | | 30,798,323 | |
0.280%, 07/08/11 | | | 8,100,000 | | | | 8,099,559 | |
0.280%, 07/13/11 | | | 12,400,000 | | | | 12,398,843 | |
0.130%, 07/18/11 | | | 26,000,000 | | | | 25,998,404 | |
0.280%, 07/18/11 | | | 14,300,000 | | | | 14,298,109 | |
0.250%, 08/16/11 | | | 10,000,000 | | | | 9,996,806 | |
0.250%, 08/16/11 | | | 900,000 | | | | 899,713 | |
0.240%, 08/19/11 | | | 18,200,000 | | | | 18,194,055 | |
0.260%, 09/02/11 | | | 50,000,000 | | | | 49,977,250 | |
| Short-Term Investments—(Continued) | |
| Security Description | | Par
Amount | | | Value | |
| | | | | | | | |
|
| Commercial Paper—(Continued) | |
0.260%, 09/02/11 | | $ | 9,000,000 | | | $ | 8,995,905 | |
0.260%, 09/02/11 | | | 5,100,000 | | | | 5,097,679 | |
0.240%, 09/21/11 | | | 28,000,000 | | | | 27,984,693 | |
0.300%, 10/03/11 | | | 48,500,000 | | | | 48,462,008 | |
0.260%, 10/05/11 | | | 25,000,000 | | | | 24,982,667 | |
0.260%, 10/05/11 | | | 3,000,000 | | | | 2,997,920 | |
0.310%, 11/16/11 | | | 10,100,000 | | | | 10,087,998 | |
0.260%, 12/01/11 | | | 27,000,000 | | | | 26,970,165 | |
0.310%, 01/27/12 | | | 96,900,000 | | | | 96,724,772 | |
Straight A Funding LLC | | | | | | | | |
0.200%, 07/06/11 | | | 15,400,000 | | | | 15,399,572 | |
0.200%, 07/07/11 | | | 2,800,000 | | | | 2,799,907 | |
0.190%, 07/25/11 | | | 11,400,000 | | | | 11,398,556 | |
0.190%, 08/01/11 | | | 2,000,000 | | | | 1,999,673 | |
0.170%, 08/04/11 | | | 54,100,000 | | | | 54,091,314 | |
0.170%, 08/04/11 | | | 19,400,000 | | | | 19,396,885 | |
0.180%, 08/04/11 | | | 102,600,000 | | | | 102,582,558 | |
0.170%, 08/05/11 | | | 5,100,000 | | | | 5,099,157 | |
0.170%, 08/08/11 | | | 15,000,000 | | | | 14,997,308 | |
0.170%, 08/08/11 | | | 15,000,000 | | | | 14,997,308 | |
0.160%, 08/22/11 | | | 28,000,000 | | | | 27,993,529 | |
0.160%, 09/01/11 | | | 28,000,000 | | | | 27,992,284 | |
0.160%, 09/02/11 | | | 28,000,000 | | | | 27,992,160 | |
0.160%, 09/06/11 | | | 18,000,000 | | | | 17,994,640 | |
0.160%, 09/19/11 | | | 2,000,000 | | | | 1,999,289 | |
Vodafone Group plc | | | | | | | | |
0.830%, 01/13/12 | | | 1,800,000 | | | | 1,791,866 | |
| | | | | | | | |
| | | | | | | 980,800,575 | |
| | | | | | | | |
|
| Repurchase Agreements—0.7% | |
Barclays Capital, Inc. Repurchase Agreement dated 06/28/11 at 0.050% to be repurchased at $15,300,149 on 07/05/11 collateralized by $19,452,000 Freddie Mac at 4.500% due 01/01/25 with a value of $15,796,683. | | | 15,300,000 | | | | 15,300,000 | |
Credit Suisse Securities (USA) LLC Repurchase Agreement dated 06/15/11 at 0.100% to be repurchased at $50,004,028 on 07/14/11 collateralized by $46,640,000 Federal Home Loan Bank at 5.250% due 08/08/33 with a value of $50,685,009. | | | 50,000,000 | | | | 50,000,000 | |
See accompanying notes to financial statements.
27
MET INVESTORS SERIES TRUST
| | |
PIMCO Total Return Portfolio | | |
Schedule of Investments as of June 30, 2011 (Unaudited)
Short-Term Investments—(Continued)
| | | | | | | | |
| Security Description | | Par
Amount | | | Value | |
| | | | | | | | |
|
| Repurchase Agreements—(Continued) | |
State Street Bank & Trust Co. Repurchase Agreement dated 06/30/11 at 0.010% to be repurchased at $3,032,001 on 07/01/11, collateralized by $1,110,000 Federal Home Loan Bank at 3.625% due 10/18/13 with a value of $1,191,863 and collateralized by $1,860,000 Federal Home Loan Bank at 1.750% due 08/22/12 with a value of $1,901,850. | | $ | 3,032,000 | | | $ | 3,032,000 | |
| | | | | | | | |
| | | | | | | 68,332,000 | |
| | | | | | | | |
|
| U.S. Treasury—0.5% | |
U.S. Treasury Bills | | | | | | | | |
0.025%, 08/04/11 (e) | | | 780,000 | | | | 779,982 | |
0.036%, 08/04/11 (e) | | | 33,599,000 | | | | 33,597,849 | |
0.172%, 08/04/11 (e) | | | 392,000 | | | | 391,936 | |
0.022%, 08/11/11 (e) | | | 1,510,000 | | | | 1,509,963 | |
0.051%, 08/18/11 (e) | | | 1,940,000 | | | | 1,939,867 | |
0.004%, 08/25/11 (e) | | | 70,000 | | | | 69,999 | |
0.010%, 08/25/11 (e) | | | 1,380,000 | | | | 1,379,978 | |
0.045%, 09/01/11 (e) | | | 160,000 | | | | 159,988 | |
0.045%, 09/08/11 (e) | | | 1,020,000 | | | | 1,019,912 | |
0.043%, 09/15/11 (e) | | | 10,000 | | | | 9,999 | |
0.046%, 09/15/11 (e) | | | 1,140,000 | | | | 1,139,890 | |
0.047%, 09/15/11 (e) | | | 1,960,000 | | | | 1,959,805 | |
0.035%, 09/22/11 (e) | | | 1,331,000 | | | | 1,330,893 | |
0.034%, 10/20/11 (e) | | | 820,000 | | | | 819,915 | |
| | | | | | | | |
| | | | | | | 46,109,976 | |
| | | | | | | | |
Total Short-Term Investments
(Cost $1,095,242,551) | | | | | | | 1,095,242,551 | |
| | | | | | | | |
Total Investments—112.5%
(Cost $10,630,932,774#) | | | | | | | 10,917,075,527 | |
Other Assets and Liabilities (net)—(12.5)% | | | | | | | (1,216,743,432 | ) |
| | | | | | | | |
| Net Assets—100.0% | | | | | | $ | 9,700,332,095 | |
| | | | | | | | |
| * | Non-income producing security. |
| # | As of June 30, 2011, the aggregate cost of investments for federal income tax purposes was $10,630,932,774. The aggregate unrealized appreciation and depreciation of investments were $419,765,688 and $(133,622,935), respectively, resulting in net unrealized appreciation of $286,142,753 for federal income tax purposes. |
| (a) | This security is traded on a “to-be-announced” basis. |
| (b) | All or a portion of the security was pledged as collateral against open futures contracts. |
| (c) | Variable or floating rate security. The stated rate represents the rate at June 30, 2011. Maturity date shown for callable securities reflects the earliest possible call date. |
| (d) | Security is in default and/or issuer is in bankruptcy. |
| (e) | Zero coupon bond—Interest rate represents current yield to maturity. |
| (f) | Security is a “step-up” bond where coupon increases or steps up at a predetermined date. Rates shown are current coupon and next coupon rate when security steps up. |
| (g) | Security was valued in good faith under procedures approved by the Board of Trustees. |
| (144A)— | Securities exempt from registration under Rule 144A of the Securities Act of 1933. These securities may be resold in transactions exempt from registration, normally to qualified institutional buyers. As of June 30, 2011, the market value of 144A securities was $1,408,823,353, which was 14.5% of net assets. |
| AMBAC— | Ambac Indemnity Corporation |
| MBIA— | Municipal Bond Insurance Association |
See accompanying notes to financial statements.
28
MET INVESTORS SERIES TRUST
| | |
PIMCO Total Return Portfolio | | |
Schedule of Investments as of June 30, 2011 (Unaudited)
| TBA— | A contract for the purchase or sale of a Mortgage Backed Security to be delivered at a future date but does not include a specified pool or precise amount to be delivered. |
| | | | | | | | | | | | | | | | | | |
Forward Sales Commitments | | Counterparty | | Interest Rate | | | Maturity Date | | | Proceeds | | | Value | |
| | | | | |
U.S. Treasury Bill | | Barclays Bank plc | | | 0.170 | % | | | 8/4/2011 | | | $ | (33,997,828 | ) | | $ | (33,999,932 | ) |
| | | | | |
Fannie Mae | | Barclays Bank plc | | | 5.000 | % | | | TBA | | | | (249,190,000 | ) | | | (248,661,504 | ) |
| | | | | |
Fannie Mae | | JPMorgan Chase Bank N.A. | | | 3.500 | % | | | TBA | | | | (196,260,000 | ) | | | (195,540,096 | ) |
| | | | | |
Fannie Mae | | JPMorgan Chase Bank N.A. | | | 4.000 | % | | | TBA | | | | (122,830,659 | ) | | | (122,941,250 | ) |
| | | | | |
Fannie Mae | | Credit Suisse Group AG | | | 3.500 | % | | | TBA | | | | (57,975,000 | ) | | | (57,393,720 | ) |
| | | | | |
Fannie Mae | | Goldman Sachs & Co. | | | 4.000 | % | | | TBA | | | | (37,380,000 | ) | | | (37,011,544 | ) |
| | | | | |
Ginnie Mae | | UBS AG | | | 3.500 | % | | | TBA | | | | (3,913,320 | ) | | | (3,882,500 | ) |
| | | | | |
Ginnie Mae | | JPMorgan Chase Bank N.A. | | | 3.500 | % | | | TBA | | | | (1,958,750 | ) | | | (1,940,624 | ) |
| | | | | | | | | | | | | | | | | | |
| | | | | |
| | | | | | | | | | | | $ | (703,505,557 | ) | | $ | (701,371,170 | ) |
| | | | | | | | | | | | | | | | | | |
See accompanying notes to financial statements.
29
MET INVESTORS SERIES TRUST
| | |
PIMCO Total Return Portfolio | | |
Schedule of Investments as of June 30, 2011 (Unaudited)
FAIR VALUE HIERARCHY
Accounting principles generally accepted in the United States of America (“GAAP”) defines fair market value as the price that the Portfolio would receive to sell an asset or pay to transfer a liability in an orderly transaction between market participants at the measurement date. It establishes a fair value hierarchy that prioritizes inputs to valuation methods and requires disclosure of the fair value hierarchy that segregates fair value measurements into three levels. Levels 1, 2 and 3 of the fair value hierarchy are defined as follows:
Level 1 - unadjusted quoted prices in active markets for identical investments
Level 2 - other significant observable inputs (including, but not limited to, unadjusted quoted prices for similar investments in markets that are either active or inactive; inputs other than quoted prices that are observable such as interest rates, yield curves, volatilities, prepayment speeds, loss severities, credit risks, default rates, etc.)
Level 3 - significant unobservable inputs based on the best information available in the circumstances, to the extent observable inputs are unavailable (including the Portfolio’s own assumptions in determining the fair value of investments)
The inputs or methodologies used for valuing investments are not necessarily an indication of the risk associated with investing in them. For a change in the methodology used, transfers between levels will be recognized as of the beginning of the reporting period. Information on transfers between Level 1 and Level 2 deemed significant, if any, will be disclosed following the valuation table below. For the six months ended June 30, 2011, there were no transfers between Levels 1 and 2. A reconciliation of Level 3 securities, if any, will also be disclosed following the valuation table. For more information about the Portfolio’s policy regarding the valuation of investments, please refer to the Notes to Financial Statements.
The following table summarizes the fair value hierarchy of the Portfolio’s investments as of June 30, 2011:
| | | | | | | | | | | | | | | | |
| Description | | Level 1 | | | Level 2 | | | Level 3 | | | Total | |
Total U.S. Treasury & Government Agencies* | | $ | — | | | $ | 3,285,406,411 | | | $ | — | | | $ | 3,285,406,411 | |
Total Domestic Bonds & Debt Securities* | | | — | | | | 2,690,292,520 | | | | — | | | | 2,690,292,520 | |
Total Foreign Bonds & Debt Securities* | | | — | | | | 2,642,392,924 | | | | — | | | | 2,642,392,924 | |
Mortgage-Backed Securities | | | | | | | | | | | | | | | | |
Collateralized-Mortgage Obligation | | | — | | | | 296,889,942 | | | | 23,160,674 | | | | 320,050,616 | |
Commercial Mortgage-Backed Securities | | | — | | | | 155,747,969 | | | | — | | | | 155,747,969 | |
Total Mortgage-Backed Securities | | | — | | | | 452,637,911 | | | | 23,160,674 | | | | 475,798,585 | |
Municipals | | | — | | | | 314,560,116 | | | | — | | | | 314,560,116 | |
Total Asset-Backed Securities* | | | — | | | | 184,253,329 | | | | — | | | | 184,253,329 | |
Convertible Preferred Stocks | | | | | | | | | | | | | | | | |
Commercial Banks | | | 57,187,000 | | | | — | | | | — | | | | 57,187,000 | |
Energy Equipment & Services | | | — | | | | 44,767,250 | | | | — | | | | 44,767,250 | |
Total Convertible Preferred Stocks | | | 57,187,000 | | | | 44,767,250 | | | | — | | | | 101,954,250 | |
Total Preferred Stocks* | | | — | | | | 92,867,343 | | | | — | | | | 92,867,343 | |
Total Loan Participation* | | | — | | | | 34,307,498 | | | | — | | | | 34,307,498 | |
Total Short-Term Investments* | | | — | | | | 1,095,242,551 | | | | — | | | | 1,095,242,551 | |
Total Investments | | $ | 57,187,000 | | | $ | 10,836,727,853 | | | $ | 23,160,674 | | | $ | 10,917,075,527 | |
| | | | | | | | | | | | | | | | | |
Forward Contracts** | | | | | | | | | | | | | | | | |
Forward Contracts to Buy Appreciation | | $ | — | | | $ | 22,656,464 | | | $ | — | | | $ | 22,656,464 | |
Forward Contracts to Buy (Depreciation) | | | — | | | | (2,540,651 | ) | | | — | | | | (2,540,651 | ) |
Forward Contracts to Sell Appreciation | | | — | | | | 5,249,983 | | | | — | | | | 5,249,983 | |
Forward Contracts to Sell (Depreciation) | | | — | | | | (44,766,757 | ) | | | — | | | | (44,766,757 | ) |
Total Forward Contracts | | $ | — | | | $ | (19,400,961 | ) | | $ | — | | | $ | (19,400,961 | ) |
Futures Contracts** | | | | | | | | | | | | | | | | |
Futures Contracts Long (Appreciation) | | $ | 39,743,078 | | | $ | — | | | $ | — | | | $ | 39,743,078 | |
Futures Contracts Long (Depreciation) | | | (6,392,073 | ) | | | — | | | | — | | | | (6,392,073 | ) |
Total Futures Contracts | | $ | 33,351,005 | | | $ | — | | | $ | — | | | $ | 33,351,005 | |
See accompanying notes to financial statements.
30
MET INVESTORS SERIES TRUST
| | |
PIMCO Total Return Portfolio | | |
Schedule of Investments as of June 30, 2011 (Unaudited)
FAIR VALUE HIERARCHY—(Continued)
| | | | | | | | | | | | | | | | |
| Description | | Level 1 | | | Level 2 | | | Level 3 | | | Total | |
Forward Sales Commitments | | $ | — | | | $ | (701,371170 | ) | | $ | — | | | $ | (701,371170 | ) |
Written Options** | | | | | | | | | | | | | | | | |
Call Written Options | | $ | — | | | $ | (10,566,011 | ) | | $ | — | | | $ | (10,566,011 | ) |
Put Written Options | | | — | | | | (9,499,766 | ) | | | — | | | | (9,499,766 | ) |
Total Written Options | | $ | — | | | $ | (20,065,777 | ) | | $ | — | | | $ | (20,065,777 | ) |
SWAP Contracts** | | | | | | | | | | | | | | | | |
Credit Default Swap Buy Protection Appreciation | | $ | — | | | $ | 658,712 | | | $ | — | | | $ | 658,712 | |
Credit Default Swap Buy Protection (Depreciation) | | | — | | | | (307,672 | ) | | | — | | | | (307,672 | ) |
Credit Default Swap Sell Protection Appreciation | | | — | | | | 10,487,467 | | | | — | | | | 10,487,467 | |
Credit Default Swap Sell Protection (Depreciation) | | | — | | | | (3,639,095 | ) | | | — | | | | (3,639,095 | ) |
Interest Rate Swap Appreciation | | | — | | | | 20,032,033 | | | | — | | | | 20,032,033 | |
Interest Rate Swap (Depreciation) | | | — | | | | (27,953,979 | ) | | | — | | | | (27,953,979 | ) |
Total SWAP Contracts | | $ | — | | | $ | (722,534 | ) | | $ | — | | | $ | (722,534 | ) |
| * | | See Schedule of Investments for additional detailed categorizations. |
| ** | | Derivative instruments such as forwards, futures contracts and swap contracts are valued on the unrealized appreciation/depreciation on the instrument. Written options are presented at value. |
Following is a reconciliation of Level 3 assets for which significant unobservable inputs were used to determine fair value:
| | | | | | | | | | | | | | | | | | | | | | | | | | | | |
| Investments in Securities | | Balance as of
December 31,
2010 | | | Realized
Gain | | | Change in
Unrealized
Appreciation
(Depreciation) | | | Net
Purchases | | | Net
Sales | | | Balance as of
June 30,
2011 | | | Change in
unrealized
appreciation
for investments
still held at
June 30, 2011 | |
Asset Backed Securities | | $ | 175,495 | | | $ | — | | | $ | (20,660 | ) | | $ | 23,002,777 | | | $ | — | | | $ | 23,157,612 | | | $ | 104,815 | |
Foreign Bonds & Debt Securities | | | 4,337 | | | | 14 | | | | 36 | | | | — | | | | (1,325 | ) | | | 3,062 | | | | 27,215 | |
| | | | | | | | | | | | | | | | | | | | | | | | | | | | |
Total | | $ | 179,832 | | | $ | 14 | | | $ | (20,624 | ) | | $ | 23,002,777 | | | $ | (1,325 | ) | | $ | 23,160,674 | | | $ | 132,030 | |
| | | | | | | | | | | | | | | | | | | | | | | | | | | | |
See accompanying notes to financial statements.
31
MET INVESTORS SERIES TRUST
| | |
PIMCO Total Return Portfolio | | |
Statement of Assets and Liabilities
June 30, 2011 (Unaudited)
| | | | |
| Assets | | | | |
Investments at value (a) | | $ | 10,848,743,527 | |
Repurchase Agreement | | | 68,332,000 | |
Cash | | | 427,528 | |
Cash denominated in foreign currencies (b) | | | 5,490,562 | |
Receivable for investments sold | | | 895,414,463 | |
Receivable for shares sold | | | 3,564,934 | |
Interest receivable | | | 62,176,785 | |
Receivable for variation margin on futures contracts | | | 1,376,453 | |
Swap interest receivable | | | 938,975 | |
Swap premium paid | | | 29,609,990 | |
Unrealized appreciation on swap contracts | | | 31,178,212 | |
Unrealized appreciation on forward currency exchange contracts | | | 27,907,938 | |
Miscellaneous assets | | | 513,974 | |
| | | | |
Total assets | | | 11,975,675,341 | |
| | | | |
| Liabilities | | | | |
Payables for: | | | | |
Investments purchased | | | 1,423,099,783 | |
Cash collateral | | | 27,988,000 | |
Shares redeemed | | | 3,691,570 | |
Forward sales commitments, at value (c) | | | 701,371,170 | |
Unrealized depreciation on forward currency exchange contracts | | | 47,307,660 | |
Unrealized depreciation on swap contracts | | | 31,900,746 | |
Outstanding written options (d) | | | 20,065,777 | |
Swap interest | | | 1,064,019 | |
Swap premium received | | | 13,454,251 | |
Accrued Expenses: | | | | |
Management fees | | | 3,797,619 | |
Distribution and service fees - Class B | | | 918,029 | |
Distribution and service fees - Class E | | | 12,806 | |
Administration fees | | | 41,388 | |
Custodian and accounting fees | | | 227,347 | |
Deferred trustees’ fees | | | 20,516 | |
Other expenses | | | 382,565 | |
| | | | |
Total liabilities | | | 2,275,343,246 | |
| | | | |
| Net Assets | | $ | 9,700,332,095 | |
| | | | |
| Net Assets Represented by | | | | |
Paid in surplus | | $ | 9,344,908,635 | |
Accumulated net realized loss | | | (44,699,620 | ) |
Unrealized appreciation on investments, futures contracts, written options contracts, forward sales commitments, swap contracts and foreign currency transactions | | | 308,769,386 | |
Undistributed net investment income | | | 91,353,694 | |
| | | | |
Net Assets | | $ | 9,700,332,095 | |
| Net Assets | | | | |
Class A | | $ | 5,118,575,856 | |
Class B | | | 4,479,207,072 | |
Class E | | | 102,549,167 | |
| Capital Shares Outstanding* | | | | |
Class A | | | 423,518,663 | |
Class B | | | 375,720,583 | |
Class E | | | 8,547,160 | |
| Net Asset Value, Offering Price and Redemption Price Per Share | | | | |
Class A | | $ | 12.09 | |
Class B | | | 11.92 | |
Class E | | | 12.00 | |
| * | | The Portfolio is authorized to issue an unlimited number of shares. |
| (a) | | Identified cost of investments, excluding repurchase agreement, was $10,562,600,774. |
| (b) | | Identified cost of cash denominated in foreign currencies was $5,476,924. |
| (c) | | Proceeds of forward sales commitments was $703,505,557. |
| (d) | | Premiums received on written options were $28,090,308. |
Statement of Operations
Six Months Ended June 30, 2011 (Unaudited)
| | | | |
| Investment Income | | | | |
Dividends | | $ | 2,299,867 | |
Interest | | | 140,395,457 | |
| | | | |
Total investment income | | | 142,695,324 | |
| | | | |
| Expenses | | | | |
Management fees | | | 23,309,919 | |
Administration fees | | | 238,524 | |
Custodian and accounting fees | | | 858,313 | |
Distribution and service fees - Class B | | | 5,228,858 | |
Distribution and service fees - Class E | | | 81,203 | |
Audit and tax services | | | 38,399 | |
Legal | | | 20,801 | |
Trustees’ fees and expenses | | | 15,868 | |
Shareholder reporting | | | 181,221 | |
Insurance | | | 49,960 | |
Miscellaneous | | | 34,696 | |
| | | | |
Total expenses | | | 30,057,762 | |
| | | | |
Net investment income | | | 112,637,562 | |
| | | | |
| Net Realized and Unrealized Gain (Loss) on Investments, Futures Contracts, Written Options Contracts, Forward Sales Commitments, Swaps Contracts and Foreign Currency Transactions | | | | |
Net realized gain (loss) on: | | | | |
Investments | | | (22,310,317 | ) |
Futures contracts | | | 3,748,225 | |
Written options contracts | | | 3,572,145 | |
Swap contracts | | | 3,304,700 | |
Foreign currency transactions | | | 10,627,349 | |
| | | | |
Net realized loss on investments, futures contracts, written options contracts, swap contracts and foreign currency transactions | | | (1,057,898 | ) |
| | | | |
Net change in unrealized appreciation (depreciation) on: | | | | |
Investments | | | 164,179,248 | |
Futures contracts | | | 42,776,131 | |
Written options contracts | | | 20,476,897 | |
Forward sales commitments | | | 3,948,657 | |
Swap contracts | | | (27,771,899 | ) |
Foreign currency transactions | | | (25,971,619 | ) |
| | | | |
Net change in unrealized appreciation on investments, futures contracts, written options contracts, forward sales commitments, swap contracts and foreign currency transactions | | | 177,637,415 | |
| | | | |
Net realized and unrealized gain on investments, futures contracts, written options contracts, forward sales commitments, swap contracts and foreign currency transactions | | | 176,579,517 | |
| | | | |
| Net Increase in Net Assets from Operations | | $ | 289,217,079 | |
| | | | |
See accompanying notes to financial statements.
32
MET INVESTORS SERIES TRUST
| | |
PIMCO Total Return Portfolio | | |
Statements of Changes in Net Assets
June 30, 2011
| | | | | | | | |
| | | Six Months
Ended
June 30, 2011
(Unaudited) | | | Year Ended
December 31,
2010 | |
| Increase (Decrease) in Net Assets: | | | | | | | | |
| Operations | | | | | | | | |
Net investment income | | $ | 112,637,562 | | | $ | 188,552,358 | |
Net realized gain (loss) on investments, futures contracts, written options contracts, swap contracts and foreign currency transactions | | | (1,057,898 | ) | | | 397,523,418 | |
Net change in unrealized appreciation on investments, futures contracts, written options contracts, forward sales commitments, swap contracts and foreign currency transactions | | | 177,637,415 | | | | 56,388,960 | |
| | | | | | | | |
Net increase in net assets resulting from operations | | | 289,217,079 | | | | 642,464,736 | |
| | | | | | | | |
| Distributions to Shareholders | | | | | | | | |
From net investment income | | | | | | | | |
Class A | | | (168,583,951 | ) | | | (168,538,898 | ) |
Class B | | | (114,599,829 | ) | | | (117,649,661 | ) |
Class E | | | (2,895,746 | ) | | | (3,886,900 | ) |
From net realized gains | | | | | | | | |
Class A | | | (181,361,626 | ) | | | (24,340,157 | ) |
Class B | | | (132,645,160 | ) | | | (17,748,769 | ) |
Class E | | | (3,288,406 | ) | | | (582,497 | ) |
| | | | | | | | |
Net decrease in net assets resulting from distributions | | | (603,374,718 | ) | | | (332,746,882 | ) |
| | | | | | | | |
Net increase in net assets from capital share transactions | | | 393,498,281 | | | | 2,255,272,505 | |
| | | | | | | | |
| Net Increase in Net Assets | | | 79,340,642 | | | | 2,564,990,359 | |
Net assets at beginning of period | | | 9,620,991,453 | | | | 7,056,001,094 | |
| | | | | | | | |
Net assets at end of period | | $ | 9,700,332,095 | | | $ | 9,620,991,453 | |
| | | | | | | | |
Undistributed net investment income at end of period | | $ | 91,353,694 | | | $ | 264,795,658 | |
| | | | | | | | |
| | | | | | | | | | | | | | | | |
| Other Information: | | | | | | | | | | | | | | | | |
| Capital Shares | | | | | | | | | | | | | | | | |
| | | | |
Transactions in capital shares were as follows: | | | | | | | | | | | | | | | | |
| | | Six Months Ended
June 30, 2011
(Unaudited) | | | Year Ended
December 31, 2010 | |
| | | Shares | | | Value | | | Shares | | | Value | |
| Class A | | | | | | | | | | | | | | | | |
Sales | | | 45,240,758 | | | $ | 560,576,998 | | | | 113,975,303 | | | $ | 1,390,268,654 | |
Reinvestments | | | 29,210,816 | | | | 349,945,577 | | | | 16,167,565 | | | | 192,879,055 | |
Redemptions | | | (95,586,983 | ) | | | (1,153,336,021 | ) | | | (26,248,418 | ) | | | (323,370,121 | ) |
| | | | | | | | | | | | | | | | |
Net increase | | | (21,135,409 | ) | | $ | (242,813,446 | ) | | | 103,894,450 | | | $ | 1,259,777,588 | |
| | | | | | | | | | | | | | | | |
| Class B | | | | | | | | | | | | | | | | |
Sales | | | 56,043,502 | | | $ | 683,313,279 | | | | 114,832,514 | | | $ | 1,397,664,338 | |
Reinvestments | | | 20,917,512 | | | | 247,244,988 | | | | 11,493,924 | | | | 135,398,430 | |
Redemptions | | | (23,127,761 | ) | | | (281,430,054 | ) | | | (44,449,844 | ) | | | (541,598,121 | ) |
| | | | | | | | | | | | | | | | |
Net increase | | | 53,833,253 | | | $ | 649,128,213 | | | | 81,876,594 | | | $ | 991,464,647 | |
| | | | | | | | | | | | | | | | |
| Class E | | | | | | | | | | | | | | | | |
Sales | | | 460,700 | | | $ | 5,665,391 | | | | 3,072,747 | | | $ | 38,243,830 | |
Reinvestments | | | 519,677 | | | | 6,184,152 | | | | 377,164 | | | | 4,469,397 | |
Redemptions | | | (2,007,268 | ) | | | (24,666,029 | ) | | | (3,166,247 | ) | | | (38,682,957 | ) |
| | | | | | | | | | | | | | | | |
Net decrease | | | (1,026,891 | ) | | $ | (12,816,486 | ) | | | 283,664 | | | $ | 4,030,270 | |
| | | | | | | | | | | | | | | | |
Increase derived from capital shares transactions | | | | | | $ | 393,498,281 | | | | | | | $ | 2,255,272,505 | |
| | | | | | | | | | | | | | | | |
See accompanying notes to financial statements.
33
MET INVESTORS SERIES TRUST
|
PIMCO Total Return Portfolio |
Financial Highlights
| | | | | | | | | | | | | | | | | | | | | | | | |
| Selected per share data | | | | | | | | | | | | | | | | | | |
| |
| | | Class A | |
| | | Six Months Ended
June 30, 2011
(Unaudited) | | | Year Ended December 31, | |
| | | | 2010 | | | 2009 | | | 2008 | | | 2007 | | | 2006 | |
| Net Asset Value, Beginning of Period | | $ | 12.47 | | | $ | 12.02 | | | $ | 11.60 | | | $ | 12.29 | | | $ | 11.80 | | | $ | 11.60 | |
| | | | | | | | | | | | | | | | | | | | | | | | |
| Income (Loss) from Investment Operations | | | | | | | | | | | | | | | | | | | | | | | | |
Net Investment Income(a) | | | 0.15 | | | | 0.28 | | | | 0.45 | | | | 0.59 | | | | 0.56 | | | | 0.49 | |
Net Realized and Unrealized Gain (Loss) on Investments | | | 0.22 | | | | 0.71 | | | | 1.47 | | | | (0.51 | ) | | | 0.35 | | | | 0.04 | |
| | | | | | | | | | | | | | | | | | | | | | | | |
Total From Investment Operations | | | 0.37 | | | | 0.99 | | | | 1.92 | | | | 0.08 | | | | 0.91 | | | | 0.53 | |
| | | | | | | | | | | | | | | | | | | | | | | | |
| Less Distributions | | | | | | | | | | | | | | | | | | | | | | | | |
Distributions from Net Investment Income | | | (0.36 | ) | | | (0.47 | ) | | | (0.96 | ) | | | (0.48 | ) | | | (0.42 | ) | | | (0.32 | ) |
Distributions from Net Realized Capital Gains | | | (0.39 | ) | | | (0.07 | ) | | | (0.54 | ) | | | (0.29 | ) | | | — | | | | (0.01 | ) |
| | | | | | | | | | | | | | | | | | | | | | | | |
Total Distributions | | | (0.75 | ) | | | (0.54 | ) | | | (1.50 | ) | | | (0.77 | ) | | | (0.42 | ) | | | (0.33 | ) |
| | | | | | | | | | | | | | | | | | | | | | | | |
| Net Asset Value, End of Period | | $ | 12.09 | | | $ | 12.47 | | | $ | 12.02 | | | $ | 11.60 | | | $ | 12.29 | | | $ | 11.80 | |
| | | | | | | | | | | | | | | | | | | | | | | | |
| Total Return (%) | | | 3.00 | | | | 8.41 | | | | 18.39 | | | | 0.64 | | | | 7.85 | | | | 4.80 | |
| | | | | | |
| Ratios/Supplemental Data | | | | | | | | | | | | | | | | | | | | | | | | |
Ratio of Expenses to Average Net Assets (%) | | | 0.51 | * | | | 0.51 | | | | 0.52 | | | | 0.52 | | | | 0.54 | | | | 0.58 | |
Ratio of Net Expenses to Average Net Assets (%)(b) | | | 0.51 | * | | | 0.51 | | | | 0.52 | | | | 0.52 | | | | 0.54 | | | | 0.58 | |
Ratio of Net investment Income to Average Net Assets (%) | | | 2.41 | * | | | 2.31 | | | | 3.93 | | | | 5.00 | | | | 4.74 | | | | 4.28 | |
Portfolio Turnover Rate (%) | | | 246.5 | | | | 713.7 | | | | 633.1 | | | | 800.2 | | | | 943.9 | | | | 161.2 | |
Net Assets, End of Period (in millions) | | $ | 5,118.6 | | | $ | 5,543.8 | | | $ | 4,095.7 | | | $ | 2,696.4 | | | $ | 3,045.1 | | | $ | 1,445.1 | |
| |
| | | Class B | |
| | | Six Months Ended
June 30, 2011
(Unaudited) | | | Year Ended December 31, | |
| | | | 2010 | | | 2009 | | | 2008 | | | 2007 | | | 2006 | |
| Net Asset Value, Beginning of Period | | $ | 12.30 | | | $ | 11.87 | | | $ | 11.47 | | | $ | 12.17 | | | $ | 11.69 | | | $ | 11.50 | |
| | | | | | | | | | | | | | | | | | | | | | | | |
| Income (Loss) from Investment Operations | | | | | | | | | | | | | | | | | | | | | | | | |
Net Investment Income(a) | | | 0.13 | | | | 0.25 | | | | 0.42 | | | | 0.55 | | | | 0.53 | | | | 0.46 | |
Net Realized and Unrealized Gain (Loss) on Investments | | | 0.21 | | | | 0.70 | | | | 1.45 | | | | (0.50 | ) | | | 0.34 | | | | 0.04 | |
| | | | | | | | | | | | | | | | | | | | | | | | |
Total From Investment Operations | | | 0.34 | | | | 0.95 | | | | 1.87 | | | | 0.05 | | | | 0.87 | | | | 0.50 | |
| | | | | | | | | | | | | | | | | | | | | | | | |
| Less Distributions | | | | | | | | | | | | | | | | | | | | | | | | |
Distributions from Net Investment Income | | | (0.33 | ) | | | (0.45 | ) | | | (0.93 | ) | | | (0.46 | ) | | | (0.39 | ) | | | (0.30 | ) |
Distributions from Net Realized Capital Gains | | | (0.39 | ) | | | (0.07 | ) | | | (0.54 | ) | | | (0.29 | ) | | | — | | | | (0.01 | ) |
| | | | | | | | | | | | | | | | | | | | | | | | |
Total Distributions | | | (0.72 | ) | | | (0.52 | ) | | | (1.47 | ) | | | (0.75 | ) | | | (0.39 | ) | | | (0.31 | ) |
| | | | | | | | | | | | | | | | | | | | | | | | |
| Net Asset Value, End of Period | | $ | 11.92 | | | $ | 12.30 | | | $ | 11.87 | | | $ | 11.47 | | | $ | 12.17 | | | $ | 11.69 | |
| | | | | | | | | | | | | | | | | | | | | | | | |
| Total Return (%) | | | 2.82 | | | | 8.17 | | | | 18.03 | | | | 0.41 | | | | 7.56 | | | | 4.52 | |
| | | | | | |
| Ratios/Supplemental Data | | | | | | | | | | | | | | | | | | | | | | | | |
Ratio of Expenses to Average Net Assets (%) | | | 0.76 | * | | | 0.76 | | | | 0.77 | | | | 0.78 | | | | 0.79 | | | | 0.83 | |
Ratio of Net Expenses to Average Net Assets (%)(b) | | | 0.76 | * | | | 0.76 | | | | 0.77 | | | | 0.78 | | | | 0.79 | | | | 0.83 | |
Ratio of Net Investment Income to Average Net Assets (%) | | | 2.19 | * | | | 2.06 | | | | 3.64 | | | | 4.77 | | | | 4.51 | | | | 4.01 | |
Portfolio Turnover Rate (%) | | | 246.5 | | | | 713.7 | | | | 633.1 | | | | 800.2 | | | | 943.9 | | | | 161.2 | |
Net Assets, End of Period (in millions) | | $ | 4,479.2 | | | $ | 3,958.7 | | | $ | 2,849.6 | | | $ | 1,353.6 | | | $ | 1,274.4 | | | $ | 1,219.1 | |
| Please | | see following page for Financial Highlights footnote legend. |
See accompanying notes to financial statements.
34
MET INVESTORS SERIES TRUST
|
PIMCO Total Return Portfolio |
Financial Highlights
| | | | | | | | | | | | | | | | | | | | | | | | |
| Selected per share data | | | | | | | | | | | | | | | | | | |
| | | Class E | |
| | | Six Months Ended
June 30, 2011
(Unaudited) | | | Year Ended December 31, | |
| | | | 2010 | | | 2009 | | | 2008 | | | 2007 | | | 2006 | |
| Net Asset Value, Beginning of Period | | $ | 12.37 | | | $ | 11.93 | | | $ | 11.52 | | | $ | 12.21 | | | $ | 11.73 | | | $ | 11.53 | |
| | | | | | | | | | | | | | | | | | | | | | | | |
| Income (Loss) from Investment Operations | | | | | | | | | | | | | | | | | | | | | | | | |
Net Investment Income(a) | | | 0.14 | | | | 0.27 | | | | 0.44 | | | | 0.57 | | | | 0.54 | | | | 0.47 | |
Net Realized and Unrealized Gain (Loss) on Investments | | | 0.22 | | | | 0.69 | | | | 1.44 | | | | (0.51 | ) | | | 0.35 | | | | 0.05 | |
| | | | | | | | | | | | | | | | | | | | | | | | |
Total From Investment Operations | | | 0.36 | | | | 0.96 | | | | 1.88 | | | | 0.06 | | | | 0.89 | | | | 0.52 | |
| | | | | | | | | | | | | | | | | | | | | | | | |
| Less Distributions | | | | | | | | | | | | | | | | | | | | | | | | |
Distributions from Net Investment Income | | | (0.34 | ) | | | (0.45 | ) | | | (0.93 | ) | | | (0.46 | ) | | | (0.41 | ) | | | (0.31 | ) |
Distributions from Net Realized Capital Gains | | | (0.39 | ) | | | (0.07 | ) | | | (0.54 | ) | | | (0.29 | ) | | | — | | | | (0.01 | ) |
| | | | | | | | | | | | | | | | | | | | | | | | |
Total Distributions | | | (0.73 | ) | | | (0.52 | ) | | | (1.47 | ) | | | (0.75 | ) | | | (0.41 | ) | | | (0.32 | ) |
| | | | | | | | | | | | | | | | | | | | | | | | |
| Net Asset Value, End of Period | | $ | 12.00 | | | $ | 12.37 | | | $ | 11.93 | | | $ | 11.52 | | | $ | 12.21 | | | $ | 11.73 | |
| | | | | | | | | | | | | | | | | | | | | | | | |
| Total Return (%) | | | 2.94 | | | | 8.24 | | | | 18.21 | | | | 0.47 | | | | 7.63 | | | | 4.67 | |
| | | | | | |
| Ratios/Supplemental Data | | | | | | | | | | | | | | | | | | | | | | | | |
Ratio of Expenses to Average Net Assets (%) | | | 0.66 | * | | | 0.66 | | | | 0.67 | | | | 0.67 | | | | 0.69 | | | | 0.72 | |
Ratio of Net Expenses to Average Net Assets (%)(b) | | | 0.66 | * | | | 0.66 | | | | 0.67 | | | | 0.67 | | | | 0.69 | | | | 0.72 | |
Ratio of Net investment Income to Average Net Assets (%) | | | 2.27 | * | | | 2.17 | | | | 3.82 | | | | 4.88 | | | | 4.61 | | | | 4.10 | |
Portfolio Turnover Rate (%) | | | 246.5 | | | | 713.7 | | | | 633.1 | | | | 800.2 | | | | 943.9 | | | | 161.2 | |
Net Assets, End of Period (in millions) | | $ | 102.5 | | | $ | 118.5 | | | $ | 110.9 | | | $ | 88.8 | | | $ | 132.0 | | | $ | 132.5 | |
| (a) | | Per share amounts based on average shares outstanding during the period. |
| (b) | | Includes the effects of management fee waivers and expenses reimbursed by the Adviser, if applicable. |
See accompanying notes to financial statements.
35
MET INVESTORS SERIES TRUST
| | |
PIMCO Total Return Portfolio | | |
Notes to Financial Statements—June 30, 2011 (Unaudited)
1. Organization
Met Investors Series Trust (the “Trust”) is organized as a statutory trust under the laws of Delaware, as an open-end management investment company under the Investment Company Act of 1940, as amended (the “1940 Act”). The Trust currently offers fifty-four Portfolios (the “Portfolios”), each of which operates as a distinct investment vehicle of the Trust. The portfolio included in this report is PIMCO Total Return Portfolio (the “Portfolio”), which is diversified. Shares in the Portfolio are not offered directly to the general public and are currently available only to separate accounts established by Metropolitan Life Insurance Company (“MetLife”) and other affiliated life insurance companies.
The Portfolio has registered four classes of shares: Class A, B, C and E Shares. Class A, B and E Shares are currently offered by the Portfolio. Shares of each Class of the Portfolio represent an equal pro rata interest in the Portfolio and generally give the shareholder the same voting, dividend, liquidation, and other rights. Investment income, realized and unrealized capital gains and losses, the common expenses of the Portfolio and certain Portfolio-level expense reductions, if any, are allocated on a pro rata basis to each Class based on the relative net assets of each Class to the net assets of the Portfolio. Each Class of shares differs in its respective distribution expenses.
2. Significant Accounting Policies
The financial statements have been prepared in conformity with accounting principles generally accepted in the United States of America (“GAAP”) which require management to make estimates and assumptions that affect the reported amounts of assets and liabilities at the date of the financial statements and the reported amounts of income and expenses during the reporting period. Actual results could differ from these estimates. In the preparation of these financial statements, management has evaluated events and transactions subsequent to June 30, 2011 through the date that the financial statements were issued.
The following is a summary of significant accounting policies consistently followed by the Portfolio in the preparation of its financial statements.
Investment Valuation and Fair Value Measurements - Debt securities (other than short term obligations with a remaining maturity of sixty days or less) including corporate, convertible and municipal bonds and notes; U.S. government agencies; U.S. treasury obligations; sovereign issues; bank loans; and non-U.S. bonds are generally valued on the basis of evaluated or composite bid quotations obtained by independent pricing services and/or brokers and dealers selected by MetLife Advisers, LLC (“MLA” or the “Adviser”), an affiliate of MetLife, Inc., or the relevant Subadviser pursuant to authorization of the Board of Trustees of the Portfolio (the “Board”). Such quotations use inputs that are observable including, among other things, issuer details, interest rates, yield curves, prepayment speeds, credit risks/spreads, default rates and quoted prices for similar securities. Securities that use similar valuation techniques and inputs as described above are categorized as Level 2 within the fair value hierarchy.
Mortgage and asset-backed securities are usually issued as separate tranches, or classes, of securities within each deal. These securities are also generally valued on the basis of evaluated or composite bid quotations obtained by independent pricing services and/or brokers and dealers selected by the Adviser or relevant Subadviser pursuant to authorization of the Board. The pricing models for these securities usually consider tranche-level attributes, estimated cash flows for each tranche, market-based yield spreads for each tranche and current market data, and incorporate deal collateral performance, as available. Mortgage and asset-backed securities that use similar valuation techniques and inputs as described above are categorized as Level 2 within the fair value hierarchy.
Short term obligations with a remaining maturity of sixty days or less are valued at amortized cost which approximates fair market value and are categorized as Level 2 within the fair value hierarchy.
Equity securities such as common stock, exchange-traded funds and preferred stock that are traded on a national securities exchange or other exchanges are generally valued at their last sale price on the principal trading market. Equity securities traded on a national securities exchange or other exchanges for which there is no reported sale during the day are valued at the last reported bid price. A security that is listed or traded on more than one exchange is valued at the quotation on the exchange determined to be the primary market for that security by the Board or its delegates. If no closing price is available, then such securities are valued at the last reported bid price. Equity securities traded over-the-counter are generally valued at the last reported sales price. To the extent these securities are actively traded and valuation adjustments are not applied, they are categorized as Level 1 within the fair value hierarchy. Other equity securities traded on inactive markets or valued by reference to similar instruments are categorized as Level 2 within the fair value hierarchy.
Equity securities which are listed on foreign stock exchanges normally are valued at the market closing price, the last sale price on the day the securities are valued or, lacking any sales on such day, at the bid price. Valuation adjustments may be applied to certain equity securities that are solely traded on foreign exchanges closing before the U.S. market to account for the market movement between the close of the foreign exchanges and the close of the U.S. market. The Portfolio may use a systematic fair valuation model provided by an independent third party to value securities principally traded in these foreign markets closing before the U.S. market in order to adjust for possible stale pricing that may occur between the close of these foreign exchanges and the time of the Portfolio valuation. Securities using these valuation adjustments are categorized as Level 2 within the fair value hierarchy.
Investments in registered open-end management investment companies are valued at reported net asset value per share and are categorized as Level 1 within the fair value hierarchy.
36
MET INVESTORS SERIES TRUST
| | |
PIMCO Total Return Portfolio | | |
Notes to Financial Statements—June 30, 2011 (Unaudited)—(Continued)
2. Significant Accounting Policies - continued
Forward foreign currency exchange contracts are valued based on the mean between closing bid and asked prices of the forward currency rates in the London foreign exchange markets on a daily basis as provided by a reliable bank or dealer. These contracts are categorized as Level 2 within the fair value hierarchy.
Options, whether on securities, indices, futures contracts, or otherwise, are valued at the last sales price available as of the close of business on the day of valuation or, if there is no such sale price available, at the bid price. Options on currencies are valued at the spot price each day. These types of options are categorized as Level 1 within the fair value hierarchy. Other options traded on inactive markets where a broker quotation is received or options valued by an evaluated quote provided by an independent pricing vendor are categorized as Level 2 within the fair value hierarchy.
Futures contracts, which are traded on commodity exchanges, are valued at their closing prices as of the close of such exchanges and are categorized as Level 1 within the fair value hierarchy. Futures contracts traded on inactive markets where a broker quotation is received are categorized as Level 2 within the fair value hierarchy. As a general matter, futures contracts are marked-to-market daily.
Options and futures contracts that are traded over-the-counter are generally valued on the basis of broker dealer quotations or pricing service providers who use a series of techniques, including simulation pricing models, to determine the value of the contracts. The pricing models use inputs that are observed from actively quoted markets such as issuer details, indices, spreads, interest rates, curves and exchange rates. These contracts are categorized as Level 2 within the fair value hierarchy.
If no current market value quotation or other observable inputs are readily available or reliable for a security, the fair value of the security will be determined in accordance with procedures approved by and under the general supervision of the Board. The Board has delegated the determination in good faith of the fair value of securities for which current market quotations are not readily available to a Valuation Committee established by the Board. Market quotes and other observable inputs are considered not readily available in circumstances where there is an absence of current or reliable market-based data. In addition, market quotes would be considered not readily available when, due to extraordinary circumstances, the exchanges or markets on which the securities trade, do not open for trading for the entire day and no other market prices are available. When the Portfolio uses fair value pricing, it may take into account any factors it deems appropriate, including significant unobservable inputs. The value of securities used by the Portfolio to calculate its net asset value may differ from quoted or published prices for the same securities. Fair value pricing involves subjective judgments and the fair value determined for a security may be materially different than the value that could be realized upon the sale of that security. These securities are categorized as Level 3 within the fair value hierarchy.
Investment Transactions and Related Investment Income - Portfolio security transactions are recorded on the trade date. Dividend income is recorded on the ex-dividend date or, for certain foreign securities, when notified. Interest income, which includes amortization of premium and accretion of discount on debt securities, is recorded on the accrual basis. Realized gains and losses on investments and unrealized appreciation and depreciation are determined on the identified cost basis, which is the same basis used for federal income tax purposes. Foreign income and foreign capital gains on some foreign securities may be subject to foreign withholding taxes, which are accrued as applicable.
Income Taxes - It is the Portfolio’s policy to comply with the requirements of the Internal Revenue Code of 1986, as amended (the “Code”), and regulations thereunder, applicable to regulated investment companies and to distribute, with respect to each taxable year, all of its taxable income to shareholders. Therefore, no federal income tax provision is required. The Portfolio files U.S. federal and various state tax returns. No income tax returns are currently under examination. The Portfolio’s federal tax returns for the prior three fiscal years remain subject to examination by the Internal Revenue Service.
Dividends and Distributions to Shareholders - The Portfolio records dividends and distributions on the ex-dividend date. Net realized gains from security transactions (if any) are generally distributed annually to shareholders. The timing and characterization of certain income and capital gains distributions are determined in accordance with federal tax regulations that may differ from GAAP. Permanent book and tax basis differences relating to shareholder distributions will result in reclassification between under/over distributed net investment income, accumulated net realized gains/losses and paid in surplus. Book-tax differences are primarily due to futures transactions, foreign currency transactions, swap transactions, options transactions, premium amortization adjustments, paydown transactions, contingent payment debt instrument adjustments, forward transactions, deferred trustees’ compensation, and losses deferred due to wash sales, as applicable. These adjustments have no impact on net assets or the results of operations.
Foreign Currency Translation - The books and records of the Portfolio are maintained in U.S. dollars. The values of securities, currencies and other assets and liabilities denominated in currencies other than U.S. dollars are translated into U.S. dollars based upon foreign exchange rates prevailing at the end of the period. Purchases and sales of investment securities, income and expenses are translated on the respective dates of such transactions. Since the values of investment securities are presented at the foreign exchange rates prevailing at the end of the period, it is not practical to isolate that portion of the results of operations arising from changes in exchange rates from that portion of the results of operations reflecting fluctuations arising from changes in market prices of the investment securities. Such fluctuations are included in the net realized and unrealized gain or loss on investments.
37
MET INVESTORS SERIES TRUST
| | |
PIMCO Total Return Portfolio | | |
Notes to Financial Statements—June 30, 2011 (Unaudited)—(Continued)
2. Significant Accounting Policies - continued
Net realized foreign exchange gains or losses arise from activity in forward foreign currency exchange contracts, sales of foreign currency, currency gains or losses realized between the trade and settlement dates on securities transactions, and the difference between the amounts of dividends, interest, and foreign withholding taxes recorded by the Portfolio and the U.S. dollar equivalent of the amounts actually received or paid by the Portfolio. Gains and losses attributable to foreign currency exchange rates on sales of securities are recorded as Net realized gains and losses on investments. Net unrealized foreign exchange gains and losses arise from changes in the value of assets and liabilities, other than investment securities, resulting from changes in foreign exchange rates.
Short Sales - The Portfolio may enter into a “short sale” of securities in circumstances in which, at the time the short position is open, the Portfolio owns an equal amount of the securities sold short or owns preferred stocks or debt securities, convertible or exchangeable without payment of further consideration, into an equal number of securities sold short. This kind of short sale, which is referred to as one “against the box,” may be entered into by the Portfolio to, for example, lock in a sale price for a security the Portfolio does not wish to sell immediately.
The Portfolio may also make short sales of a security it does not own, in anticipation of a decline in the market value of that security. To complete such a transaction, the Portfolio must borrow the security to make delivery to the buyer. The Portfolio then is obligated to replace the security borrowed by purchasing it at market price at the time of replacement. The price at such time may be more or less than the price at which the security was sold by the Portfolio. Until the security is replaced, the Portfolio is required to pay to the lender any dividends or interest which accrue during the period of the loan. To borrow the security, the Portfolio also may be required to pay a premium, which would increase the cost of the security sold. The proceeds of the short sale will be retained by the broker, to the extent necessary to meet margin requirements, until the short position is closed out. Until the Portfolio replaces a borrowed security, the Portfolio will segregate with its custodian, or earmark, cash or other liquid assets at such a level that (i) the amount segregated, or earmarked, plus the amount deposited with the broker as collateral will equal the current value of the security sold short and (ii) the amount segregated plus the amount deposited with the broker as collateral will not be less than the market value of the security at the time it was sold short. The Portfolio will incur a loss as a result of the short sale if the price of the security increases between the date of the short sale and the date on which the Portfolio replaces the borrowed security. The Portfolio will realize a gain if the security declines in price between those dates. This result is the opposite of what one would expect from a cash purchase of a long position in a security. The amount of any gain will be decreased, and the amount of any loss increased, by the amount of any premium, dividends or interest the Portfolio may be required to pay in connection with a short sale. No more than one third of the Portfolio’s net assets will be, when added together: (i) deposited as collateral for the obligation to replace securities borrowed to effect short sales; and (ii) segregated in connection with short sales.
Repurchase Agreements - The Portfolio may enter into repurchase agreements with selected commercial banks and broker-dealers, under which the Portfolio acquires securities as collateral and agrees to resell the securities at an agreed upon time and at an agreed upon price. The Portfolio, through the custodian or a subcustodian, receives delivery of the underlying securities collateralizing repurchase agreements. The Portfolio requires the custodian to take possession, to have legally segregated in the Federal Reserve Book Entry System, or to have segregated within the custodian’s vault, all securities held as collateral for repurchase agreements. It is the Portfolio’s policy that the market value of the collateral be at least equal to 100% of the repurchase price in the case of a repurchase agreement of one-day duration and 102% of the repurchase price in the case of all other repurchase agreements. In connection with transactions in repurchase agreements, if the seller defaults and the value of the collateral declines or if the seller enters an insolvency proceeding, realization of the collateral by the Portfolio may be delayed, limited or wholly denied.
Forward Commitments and When-Issued and Delayed-Delivery Securities - The Portfolio may purchase securities on a when-issued or delayed delivery basis and may purchase or sell securities on a forward commitment basis. Settlement of such transactions normally occurs within a month or more after the purchase or sale commitment is made. The Portfolio may purchase securities under such conditions only with the intention of actually acquiring them, but may enter into a separate agreement to sell the securities before the settlement date. Since the value of securities purchased may fluctuate prior to settlement, the Portfolio may be required to pay more at settlement than the security is worth. In addition, the purchaser is not entitled to any of the interest earned prior to settlement. Upon making a commitment to purchase a security on a when-issued, delayed delivery or forward commitment basis, the Portfolio will hold liquid assets in a segregated account at the Portfolio’s custodian bank worth at least the equivalent of the amount due. The liquid assets will be monitored on a daily basis and adjusted as necessary to maintain the necessary value.
Mortgage Dollar Rolls - The Portfolio may enter into mortgage “dollar rolls” in which a Portfolio sells TBA mortgage-backed securities for delivery in the current month and simultaneously contracts to repurchase substantially similar (same type, coupon and maturity) securities on a specified future date. During the roll period, the Portfolio foregoes principal (including prepayments of principal) and interest paid on the securities sold. Dollar rolls are accounted for as purchase and sale transactions; gain or loss is recognized at the commencement of the term of the dollar roll and each time the mortgage-backed security is rolled.
A Portfolio that enters into mortgage dollar rolls is subject to the risk that the market value of the securities the Portfolio is obligated to repurchase may decline below the agreed upon repurchase price. In the event the buyer of securities under a mortgage dollar roll files for
38
MET INVESTORS SERIES TRUST
| | |
PIMCO Total Return Portfolio | | |
Notes to Financial Statements—June 30, 2011 (Unaudited)—(Continued)
2. Significant Accounting Policies - continued
bankruptcy or becomes insolvent, the Portfolio’s use of proceeds from the dollar roll may be restricted pending a court determination, a determination by the other party, or its trustee or receiver, whether to enforce the Portfolio’s obligation to repurchase the securities sold.
Loan Participations - The Portfolio may invest in loans arranged through private negotiation between one or more financial institutions. The Portfolio’s investment in any such loan may be in the form of a participation in or an assignment of the loan. In connection with purchasing participations, the Portfolio generally will have no right to enforce compliance by the borrower with the terms of the loan agreement relating to the loan, nor any rights of set-off against the borrower and the Portfolio may not benefit directly from any collateral supporting the loan in which it has purchased the participation.
Mortgage Related and Other Asset Backed Securities - The Portfolio may invest in mortgage related or other asset-backed securities. These securities may include mortgage pass-through securities, collateralized mortgaged obligations (“CMOs”), commercial mortgage-backed securities, mortgage dollar rolls, CMO residuals, stripped mortgage backed securities (“SMBS”) and other securities that directly or indirectly represent a participation in, or are secured by or payable from, mortgage loans on real property or other receivables. The value of some mortgage or asset-backed securities may be particularly sensitive to changes in prevailing interest rates. Early repayment of principal on some mortgage-related securities may expose the Portfolio to a lower rate of return upon reinvestment of principal. The value of these securities may fluctuate in response to the market’s perception of the creditworthiness of the issuers. Additionally, although mortgages and mortgage-related securities are generally supported by some form of government or private guarantee and/or insurance, there is no assurance that private guarantors or insurers will meet their obligations.
In one type of SMBS, one class receives all of the interest from the mortgage assets (the interest-only or “IO” class), while the other class will receive all of the principal (the principal-only or “PO” class). Payments received for the IOs are included in interest income on the Statement of Operations of the Portfolio. Because principal will not be received at the maturity of an IO, adjustments are made to the book value of the security until maturity. These adjustments are included in interest income on the Statement of Operations of the Portfolio. Payments received for POs are treated as reductions to the cost and par value of the securities. Details of mortgage related and other asset-backed securities held by the Portfolio are included in the Portfolio’s Schedule of Investments.
The Portfolio may invest a significant portion of its assets in securities of issuers that hold mortgage and asset-backed securities and direct investments in securities backed by commercial and residential mortgage loans and other financial assets. The value and related income of these securities are sensitive to changes in economic conditions, including delinquencies and/or defaults, and may be negatively impacted by increased volatility of market prices and periods of illiquidity.
High Yield Debt Securities - The Portfolio may invest in high yield debt securities, or “junk bonds,” which are securities that are rated below “investment grade” or, if not rated, are of equivalent quality. A portfolio with high yield debt securities generally will be exposed to greater market risk and credit risk than a portfolio that invests only in investment grade debt securities because issuers of high yield debt securities are less secure financially, are more likely to default on their obligations, and their securities are more sensitive to interest rate changes and downturns in the economy. In addition, the secondary market for lower-rated debt securities may not be as liquid as that for more highly rated debt securities. As a result, the Portfolio’s Subadviser may find it more difficult to value lower-rated debt securities or sell them and may have to sell them at prices significantly lower than the values assigned to them by the Portfolio.
3. Investment Management Agreement and Other Transactions with Affiliates
Investment Management Agreement - The Trust is managed by the Adviser. The Trust has entered into a management agreement with the Adviser (the “Management Agreement”) for investment management services in connection with the investment management of the Portfolio. The Adviser is subject to the supervision and direction of the Board and has overall responsibility for the general management and administration of the Trust. The Adviser has entered into a subadvisory agreement with Pacific Investment Management Company LLC (the “Subadviser”) for investment subadvisory services in connection with the investment management of the Portfolio.
Subject to the supervision and direction of the Board, the Adviser supervises the Subadviser and has full discretion with respect to the retention or renewal of the subadvisory agreement. The Adviser pays the Subadviser a fee based on the Portfolio’s average daily net assets.
Under the terms of the Portfolio’s Management Agreement, the Portfolio pays the Adviser a monthly fee based upon annual rates applied to the Portfolio’s average daily net assets as follows:
| | | | | | | | |
Management Fees
earned by the Adviser
for the six months ended
June 30, 2011 | | % per annum | | | Average Daily Net Assets | |
| | |
| $23,309,919 | | | 0.50 | % | | First $ | 1.2 Billion | |
| | |
| | | 0.475 | % | | Over $ | 1.2 Billion | |
39
MET INVESTORS SERIES TRUST
| | |
PIMCO Total Return Portfolio | | |
Notes to Financial Statements—June 30, 2011 (Unaudited)—(Continued)
3. Investment Management Agreement and Other Transactions with Affiliates - continued
Certain officers and trustees of the Trust may also be officers of the Adviser; however, such officers and trustees receive no compensation from the Trust.
Transfer Agency Agreement - MetLife serves as the transfer agent for the Trust. MetLife receives no fees for its services to the Trust under the transfer agency agreement.
Distribution Agreements and Plans - The Trust has distribution agreements with MetLife Investors Distribution Company (“MIDC” or the “Distributor”) in which MIDC serves as the Distributor for the Trust’s Class A, Class B and Class E Shares. MIDC is a wholly-owned subsidiary of MetLife Investors Group, Inc., an affiliate of the Adviser. The Class B and Class E distribution plans provide that the Trust, on behalf of the Portfolio, may pay annually up to 0.50% and 0.25%, respectively, of the average daily net assets of the Portfolio attributable to its Class B and Class E Shares with respect to activities primarily intended to result in the sale of Class B and Class E Shares. However, under the Class B and Class E distribution agreements, payments to the Distributor for activities pursuant to the Class B and Class E distribution plans are currently limited to payments at an annual rate equal to 0.25% and 0.15% of average daily net assets of the Portfolio attributable to its Class B and Class E Shares, respectively. Amounts incurred by the Portfolio for the six months ended June 30, 2011 are shown as Distribution and service fees in the Statement of Operations.
Under the terms of the Class B and Class E distribution plans and distribution agreements the Portfolio is authorized to make payments monthly to the Distributor that may be used to pay or reimburse entities providing distribution and shareholder servicing with respect to the Class B and Class E Shares for such entities’ fees or expenses incurred.
Deferred Trustee Compensation - Each Trustee of the Trust who is not currently an employee of the Adviser or any of its affiliates receives compensation from the Trust for his or her service to the Portfolio. A deferred compensation plan (the “Plan”) is available to the Trustees on a voluntary basis. Deferred amounts remain in the Trust until distributed in accordance with the provisions of the Plan. The value of a participating Trustee’s deferral account is based on theoretical investments of deferred amounts, on the normal payment dates, in certain portfolios of the Trust or Metropolitan Series Fund, Inc. as designated by the participating Trustee. Changes in the value of participants’ deferral accounts are reflected as Trustees’ fees and expenses in the Statement of Operations. The portion of the accrued obligations allocated to the Portfolio, if any, under the Plan are reflected as Deferred trustees’ fees in the Statement of Assets and Liabilities.
4. Investment Transactions
Aggregate cost of purchases and proceeds of sales of investment securities, excluding short-term securities, for the six months ended June 30, 2011 were as follows:
| | | | | | | | | | | | | | | | | | | | |
| Purchases | | | Sales | |
| U.S. Government | | Non U.S. Government | | | Foreign Government | | | U.S. Government | | | Non U.S. Government | | | Foreign Government | |
| $18,533,176,168 | | $ | 1,121,642,712 | | | $ | 3,145,211,660 | | | $ | 22,916,451,019 | | | $ | 293,907,795 | | | $ | 1,728,575,725 | |
5. Investments in Derivative Instruments
Investments in Derivative Instruments - Disclosures about derivative instruments are intended to improve financial reporting for derivative instruments by requiring enhanced disclosure that enables investors to understand how and why a Portfolio uses derivatives, how derivatives are accounted for, and how derivative instruments affect the Portfolio’s results of operations and financial position. Summarized below are the specific types of derivative instruments utilized by the Portfolio.
Forward Foreign Currency Exchange Contracts - The Portfolio may enter into forward foreign currency exchange contracts to hedge its portfolio holdings against the risk of future movements in certain foreign currency exchange rates. When entering into these contracts, the Portfolio agrees to receive or deliver a fixed quantity of foreign currency for an agreed-upon price on an agreed upon future date. These contracts are valued daily and the Portfolio’s net equity therein, representing unrealized gain or loss on the contracts as measured by the difference between the forward foreign exchange rates at the dates of entry into the contracts and the forward foreign exchange rates at the value date, is included in the Statement of Assets and Liabilities. When a contract is closed, the Portfolio recognizes a realized gain or loss equal to the difference between the value of the contract at the time it was opened and the value at the time it was closed.
Realized and unrealized gains and losses on forward foreign currency exchange contracts are included in the Statement of Operations. These contracts involve market and/or credit risk in excess of the amount recognized in the Statement of Assets and Liabilities.
The use of forward foreign currency exchange contracts does not eliminate fluctuations in the underlying prices of the securities of the Portfolio, but it does establish a rate of exchange that can be achieved in the future. Although forward foreign currency exchange contracts to sell limit the risk of loss due to a decline in the value of the currency holdings, they also limit any potential gain that might result should the value of the currency increase. In addition, the Portfolio could be exposed to risks if the counterparties to the contracts are unable to meet the terms of the contracts.
40
MET INVESTORS SERIES TRUST
| | |
PIMCO Total Return Portfolio | | |
Notes to Financial Statements—June 30, 2011 (Unaudited)—(Continued)
5. Investments in Derivative Instruments - continued
Futures Contracts - The Portfolio may buy and sell futures contracts (on recognized exchanges) as a hedge, to maintain investment exposure to a target asset class or to enhance return. The Portfolio may be subject to fluctuations in equity prices, interest rates, and foreign currency exchange rates in the normal course of pursuing its investment objective. Futures contracts are standardized agreements to buy or sell a security, or deliver a final cash settlement price in connection with an index, interest rate, currency, or other asset, for a set price in the future. The Portfolio must deposit an amount (“initial margin”) equal to a certain percentage of the face value of the futures contract. The initial margin may be in the form of cash or securities which is returned when the Portfolio’s obligations under the contract have been satisfied. Futures contracts are marked-to-market daily and subsequent payments (“variation margin”) are made or received by the Portfolio depending on the daily fluctuations in the value of the futures contract. These amounts are reflected as receivables or payables on the Statement of Assets and Liabilities. Risks of entering into futures contracts (and related options) include the possibility that the market for these instruments may be illiquid and that a change in the value of the contract or option may not correlate perfectly with changes in the value of the underlying securities. Futures contracts are exchange traded and the exchange’s clearinghouse, as counterparty to all exchange traded futures, guarantees the futures contracts against default.
Options Contracts - An option contract purchased by a Portfolio gives the Portfolio the right, but not the obligation, to buy (call) or sell (put) an underlying instrument at a fixed exercise price during a specified period. Call options written by a Portfolio give the holder the right to buy the underlying instrument from the Portfolio at a fixed exercise price; put options written by a Portfolio give the holder the right to sell the underlying instrument to the Portfolio at a fixed exercise price.
The Portfolio may use options to hedge against changes in values of securities the Portfolio owns or expects to purchase, to maintain exposure to the broad equity markets or to enhance return. Writing puts or buying calls tends to increase the Portfolio’s exposure to the underlying instrument and writing calls or buying puts tends to decrease the Portfolio’s exposure to the underlying instrument, and can be used to hedge other Portfolio investments. For options purchased to hedge the Portfolio’s investments, the potential risk to the Portfolio is that the change in value of options contracts may not correspond perfectly to the change in value of the hedged instruments. In addition, losses may arise from changes in the value of the underlying instrument, if there is an illiquid secondary market for the option contract, or if the counterparty to the option contract is unable to perform. The maximum loss for purchased options is limited to the premium initially paid for the option.
The main risk associated with purchasing an option is that the option expires without being exercised. In this case, the option expires worthless and the premium paid for the option is considered the loss. The risk associated with writing a call option is that the Portfolio may forgo the opportunity for a profit if the market value of the underlying instrument increases and the option is exercised, requiring the Portfolio to sell the underlying instrument at a price below its market value. When a Portfolio writes a call option on a security it does not own, its exposure on such an option is theoretically unlimited. The risk in writing a put option is that the Portfolio may incur a loss if the market value of the underlying instrument decreases and the option is exercised, requiring the Portfolio to purchase the underlying instrument at a price above its market value. In addition, the Portfolio risks not being able to enter into a closing transaction for the written option as the result of an illiquid market for the option.
Purchases of put and call options are recorded as investments, the value of which are marked-to-market daily. When a purchased option expires without being exercised, the Portfolio will realize a loss equal to the premium paid. When the Portfolio enters into a closing sale transaction, the Portfolio will realize a gain or loss depending on whether the sales proceeds from the closing sale transaction are greater or less than the premium initially paid for the option. When the Portfolio exercises a put option, it will realize a gain or loss from the sale of the underlying instrument and the proceeds from such sale will be decreased by the premium originally paid for the put option. When the Portfolio exercises a call option, the cost of the security which the Portfolio purchases upon exercise will be increased by the premium originally paid for the call option.
The premium received for a written option is recorded as an asset and an equivalent liability. The liability is marked-to-market daily based on the option’s quoted market price. When an option expires without being exercised or the Portfolio enters into a closing purchase transaction, the Portfolio realizes a gain (or loss if the cost of the closing purchase transaction exceeds the premium received when the option was sold) without regard to any unrealized gain or loss on the underlying instrument and the liability related to such option is eliminated. When a written call option is exercised, the Portfolio realizes a gain or loss from the sale of the underlying instrument.
Swap Agreements - The Portfolio may enter into swap contracts. Swap contracts are derivatives agreements to exchange the return generated by one instrument for the return generated by another instrument. The payment streams are calculated by reference to a specified index and agreed upon notional amount. The term “specified index” includes, but is not limited to, currencies, fixed interest rates, prices and total return on interest rate indices, fixed income indices, stock indices and commodity indices (as well as amounts derived from arithmetic operations on these indices). A Portfolio will usually enter into swaps on a net basis, i.e., the two payment streams are netted out in a cash settlement on the payment date or dates specified in the instrument, with the Portfolio receiving or paying, as the case may be, only the net amount of the two payments. The Portfolio’s obligations under a swap agreement will be accrued daily (offset against any amounts owing to the Portfolio) and any accrued but unpaid net amounts owed to a swap counterparty will be covered by designating the segregation, either on its records or with the Trust’s
41
MET INVESTORS SERIES TRUST
| | |
PIMCO Total Return Portfolio | | |
Notes to Financial Statements—June 30, 2011 (Unaudited)—(Continued)
5. Investments in Derivative Instruments - continued
custodian, of cash or other liquid assets, to avoid any potential leveraging of the Portfolio. The Portfolio may enter into swap transactions with counterparties that are approved by the investment adviser in accordance with guidelines established by the Board. These guidelines provide for a minimum credit rating for each counterparty and various credit enhancement techniques (for example, collateralization of amounts due from counterparties) to limit exposure to counterparties that have lower credit ratings.
The swaps in which the Portfolio may engage may include instruments under which one party pays a single or periodic fixed amount(s) (or premium), and the other party pays periodic amounts based on the movement of a specified index. Swaps do not involve the delivery of securities, other underlying assets, or principal. Accordingly, the risk of loss with respect to swaps is limited to the net amount of payments the Portfolio is contractually obligated to receive. If the other party to a swap defaults, the Portfolio’s risk of loss consists of the net amount of payments that the Portfolio contractually is entitled to receive.
An index swap is an agreement to swap cash flows on a notional amount based on changes in the values of the reference indices.
A currency swap is an agreement to exchange cash flows on a notional amount of two or more currencies based on the relative value differential among them. Such swaps may involve initial and final exchanges that correspond to the agreed upon notional amount. Currency swaps usually involve the delivery of the entire principal value of one designated currency in exchange for the other designated currency. Therefore, the entire principal value of a currency swap is subject to the risk that the other party to the swap will default on its contractual delivery obligations. If there is a default by the counterparty, the Portfolio may have contractual remedies pursuant to the agreements related to the transaction.
Equity swaps are two-party contracts that generally obligate one party to pay the positive return and the other party to pay the negative return on a specified reference security, basket of securities, security index or index component during the period of the swap. Equity swap contracts are marked to market daily based on the value of the underlying security and the change, if any, is recorded as an unrealized gain or loss. Equity swaps normally do not involve the delivery of securities or other underlying assets. If the other party to an equity swap defaults, a Portfolio’s risk of loss consists of the net amount of payments that such Portfolio is contractually entitled to receive, if any. Equity swaps are derivatives and their value can be very volatile.
The use of swaps is a highly specialized activity that involves investment techniques and risks different from those associated with ordinary portfolio securities transactions. If an investment adviser is incorrect in its forecasts of market values, interest rates, and currency exchange rates, the investment performance of the Portfolio would be less favorable than it would have been if this investment technique were not used.
Interest Rate Swaps - The Portfolio may enter into interest rate swaps and the purchase or sale of related caps and floors. The Portfolio may enter into these transactions primarily to manage its exposure to interest rates, to protect against currency fluctuations, or to preserve a return or spread on a particular investment. The Portfolio is subject to interest rate risk exposure in the normal course of pursuing its investment objectives. Because the Portfolio holds has exposure to fixed income securities, the value of these securities may decrease if interest rates rise. To help hedge against this risk and to maintain its ability to generate income at prevailing market rates, the Portfolio may enter into interest rate swap contracts. Interest rate swaps are arrangements between two parties to exchange cash flows based on a notional principal amount, to manage the Portfolio’s exposure to interest rates. Interest rate swap contracts are marked-to-market daily based upon quotations from market makers and the change, if any, is recorded as unrealized gain or loss. Payments received or made are recorded as realized gains or losses. The Portfolio could be exposed to credit or market risk due to unfavorable changes in the fluctuation of interest rates or if the counterparty defaults on its obligation to perform. Risks may exceed amounts recognized on the Statement of Assets and Liabilities. The purchase of a cap entitles the purchaser, to the extent that a specific index exceeds a predetermined interest rate, to receive payments of interest on a notional principal amount from the party selling such cap. The purchase of a floor entitles the purchaser to receive payments on a notional principal amount from the party selling such floor to the extent that a specified index falls below a predetermined interest rate or amount. The Portfolio’s maximum risk of loss from counterparty credit risk is the discounted net value of the cash flows to be received from/paid to the counterparty over the contract’s remaining life, to the extent that amount is positive. This risk is mitigated by maintaining a master netting arrangement between the Portfolio and the counterparty and by the posting of collateral by the counterparty to the Portfolio to cover the Portfolio’s exposure to the counterparty.
Credit Default Swaps - The Portfolio is subject to credit risk in the normal course of pursuing its investment objectives. The Portfolio may enter into credit default swaps to manage its exposure to the market or certain sectors of the market, to reduce its risk exposure to defaults of corporate and sovereign issuers, or to create exposure to corporate or sovereign issuers to which it is not otherwise exposed. As the seller in a credit default swap contract, the Portfolio would be required to pay the par (or other agreed upon) value of a referenced debt obligation to the counterparty in the event of a default by a third party, such as a U.S. or foreign corporate issuer, on the debt obligation. In return, the Portfolio would receive from the counterparty an upfront or periodic stream of payments over the term of the contract provided that no event of default has occurred. If no default occurs, the Portfolio would keep the stream of payments and would have no payment obligations. An upfront payment received by the Portfolio is recorded as a liability on the books. An upfront payment made by the Portfolio is recorded as an asset on the books. As the seller, the Portfolio would be subject to investment exposure on the notional amount of the swap. The Portfolio may also purchase credit default swap contracts in order to hedge against the risk of default of debt securities held in its portfolio. This would involve the risk that the investment may expire worthless and would only generate income in the event of an actual default by the issuer of the underlying obligation (as
42
MET INVESTORS SERIES TRUST
| | |
PIMCO Total Return Portfolio | | |
Notes to Financial Statements—June 30, 2011 (Unaudited)—(Continued)
5. Investments in Derivative Instruments - continued
opposed to a credit downgrade or other indication of financial instability). It would also involve credit risk—the seller may fail to satisfy its payment obligations to the Portfolio in the event of a default. The Portfolio’s maximum risk of loss from counterparty risk, either as the protection seller or as the protection buyer, is the unrealized appreciation of the contract. This risk is mitigated by having a master netting arrangement between the Portfolio and the counterparty and by the posting of collateral by the counterparty to the Portfolio to cover the Portfolio’s exposure to the counterparty.
Implied credit spreads, represented in absolute terms, utilized in determining the market value of credit default swap agreements on corporate issues or sovereign issues of an emerging country as of period end are disclosed in Note 9 to the Notes to Financials Statements and serve as an indicator of the status of the payment/performance risk and represent the likelihood or risk of default for the credit derivative. The implied credit spread of a particular referenced entity reflects the cost of buying/selling protection and may include upfront payments required to be made to enter into the agreement. For credit default swap agreements on asset-backed securities and credit indices, the quoted market prices and resulting values serve as the indicator of the current status of the payment/performance risk. Wider credit spreads represent a deterioration of the referenced entity’s credit soundness and a greater likelihood or risk of default or other credit event occurring as defined under the terms of the agreement.
The maximum potential amount of future payments (undiscounted) that a Portfolio as a seller of protection could be required to make under a credit default swap agreement would be an amount equal to the notional amount of the agreement. Notional amounts of all credit default swap agreements outstanding as of June 30, 2011 for which a Portfolio is the seller of protection are disclosed in Note 9 to the Notes to Financials Statements. These potential amounts would be partially offset by any recovery values of the respective referenced obligations, upfront payments received upon entering into the agreement, or net amounts received from the settlement of buy protection credit default swap agreements entered into by a Portfolio for the same referenced entity or entities.
Swap agreements are marked to market daily. The change in value, if any, is recorded as unrealized gain or loss in the Statement of Operations. A liquidation payment received or made at the termination of the swap is recorded as realized gain or loss in the Statement of Operations. Net periodic payments are included as part of realized gain (loss) on the Statement of Operations.
At June 30, 2011, the Portfolio had the following derivatives, grouped into appropriate risk categories:
| | | | | | | | | | | | |
| | | Asset Derivatives | | | Liability Derivatives | |
Risk Exposure | | Statement of Assets &
Liabilities Location | | Fair Value | | | Statement of Assets &
Liabilities Location | | Fair Value | |
Interest Rate | | Unrealized appreciation on swap contracts | | $ | 20,032,033 | | | Unrealized depreciation on swap contracts | | $ | 27,953,979 | |
| | Unrealized appreciation on futures contracts* | | | 39,743,078 | | | Unrealized depreciation on futures contracts* | | | 6,392,073 | |
| | Outstanding written options | | | — | | | Outstanding written options | | | 19,960,683 | |
Foreign Currency Exchange | | Unrealized appreciation on forward foreign currency exchange contracts | | | 27,907,938 | | | Unrealized depreciation on forward foreign currency exchange contracts | | | 47,307,660 | |
Credit | | Unrealized appreciation on swap contracts | | | 11,146,179 | | | Unrealized depreciation on swap contracts | | | 3,946,767 | |
| | Outstanding written options | | | — | | | Outstanding written options | | | 105,094 | |
| | | | | | | | | | | | |
| | | | |
Total | | | | $ | 98,829,228 | | | | | $ | 105,666,256 | |
| | | | | | | | | | | | |
| * | | Includes cumulative appreciation/depreciation of futures contracts as reported in the notes to financial statements. Only the current day’s variation margin is reported within the Statement of Assets & Liabilities. |
Transactions in derivative instruments during the six months ended June 30, 2011, were as follows:
| | | | | | | | | | | | | | | | |
Statement of Operations Location - Net Realized Gain (Loss) | | Interest
Rate | | | Foreign Currency
Exchange | | | Credit | | | Total | |
Foreign currency transactions | | $ | — | | | $ | (4,248,015 | ) | | $ | — | | | $ | (4,248,015 | ) |
Futures contracts | | | 3,748,225 | | | | — | | | | — | | | | 3,748,225 | |
Swap contracts | | | (4,303,074 | ) | | | — | | | | 7,607,774 | | | | 3,304,700 | |
Written options contracts | | | 4,070,004 | | | | (539,109 | ) | | | 41,250 | | | | 3,572,145 | |
| | | | | | | | | | | | | | | | |
| | | | |
| | $ | 3,515,155 | | | $ | (4,787,124 | ) | | $ | 7,649,024 | | | $ | 6,377,055 | |
| | | | | | | | | | | | | | | | |
43
MET INVESTORS SERIES TRUST
| | |
PIMCO Total Return Portfolio | | |
Notes to Financial Statements—June 30, 2011 (Unaudited)—(Continued)
5. Investments in Derivative Instruments - continued
| | | | | | | | | | | | | | | | |
Statement of Operations Location -Net Change in Unrealized Gain (Loss) | | Interest
Rate | | | Foreign
Currency
Exchange | | | Credit | | | Total | |
Foreign currency transactions | | $ | — | | | $ | (25,766,470 | ) | | $ | — | | | $ | (25,766,470 | ) |
Futures contracts | | | 42,776,131 | | | | — | | | | — | | | | 42,776,131 | |
Swap contracts | | | (18,958,762 | ) | | | — | | | | (8,813,137 | ) | | | (27,771,899 | ) |
Written options contracts | | | 20,452,900 | | | | — | | | | 23,997 | | | | 20,476,897 | |
| | | | | | | | | | | | | | | | |
| | | | |
| | $ | 44,270,269 | | | $ | (25,766,470 | ) | | $ | (8,789,140 | ) | | $ | 9,714,659 | |
| | | | | | | | | | | | | | | | |
For the six months ended June 30, 2011, the average amount or number per contract outstanding for each derivative type was as follows:
| | | | | | | | | | | | |
Average Notional or Face Amount(a) | | Foreign Currency
Risk | | | Interest Rate
Risk | | | Credit Risk | |
Foreign currency transactions | | $ | 2,735,588,571 | | | $ | — | | | $ | — | |
Futures contracts long | | | — | | | | 13,637,397,050 | | | | — | |
Futures contracts short | | | — | | | | 167,250,000 | | | | — | |
Swap contracts | | | — | | | | 22,863,393 | | | | 9,903,892 | |
Written options contracts | | | 536 | | | | 64,462,571 | | | | 30,153,333 | |
| (a) | | Averages are based on activity levels during 2011. |
6. Forward Foreign Currency Exchange Contracts
Forward Foreign Currency Exchange Contracts to Buy:
| | | | | | | | | | | | | | | | | | | | | | |
Settlement
Date | | Counterparty | | Contracts to Buy | | | | | | Value at
June 30,
2011 | | | In Exchange
for U.S.$ | | | Net Unrealized
Appreciation/
(Depreciation) | |
| | | | | | |
7/29/2011 | | Deutsche Bank AG | | | 288,000 | | | | AUD | | | $ | 308,130 | | | $ | 300,125 | | | $ | 8,005 | |
| | | | | | |
8/2/2011 | | Barclays Bank plc | | | 10,928,923 | | | | BRL | | | | 6,958,931 | | | | 6,834,848 | | | | 124,083 | |
| | | | | | |
8/2/2011 | | UBS AG | | | 48,319,817 | | | | BRL | | | | 30,767,376 | | | | 29,889,779 | | | | 877,597 | |
| | | | | | |
9/2/2011 | | Morgan Stanley | | | 5,950,400 | | | | BRL | | | | 3,763,664 | | | | 3,200,000 | | | | 563,664 | |
| | | | | | |
9/19/2011 | | Deutsche Bank AG | | | 25,657,000 | | | | CAD | | | | 26,557,766 | | | | 26,044,410 | | | | 513,356 | |
| | | | | | |
11/15/2011 | | JPMorgan Chase Bank N.A. | | | 46,396,886 | | | | CNY | | | | 7,203,084 | | | | 7,223,554 | | | | (20,470 | ) |
| | | | | | |
11/15/2011 | | JPMorgan Chase Bank N.A. | | | 1,928,000 | | | | CNY | | | | 299,321 | | | | 299,658 | | | | (337 | ) |
| | | | | | |
2/13/2012 | | Barclays Bank plc | | | 4,300,777 | | | | CNY | | | | 670,589 | | | | 672,669 | | | | (2,080 | ) |
| | | | | | |
2/13/2012 | | Citibank N.A. | | | 53,000,000 | | | | CNY | | | | 8,263,910 | | | | 8,216,417 | | | | 47,493 | |
| | | | | | |
2/13/2012 | | Citibank N.A. | | | 71,900,000 | | | | CNY | | | | 11,210,852 | | | | 11,154,723 | | | | 56,129 | |
| | | | | | |
2/13/2012 | | JPMorgan Chase Bank N.A. | | | 108,762,192 | | | | CNY | | | | 16,958,510 | | | | 16,829,740 | | | | 128,770 | |
| | | | | | |
6/1/2012 | | Citibank N.A. | | | 26,898,900 | | | | CNY | | | | 4,214,582 | | | | 4,200,000 | | | | 14,582 | |
| | | | | | |
6/1/2012 | | JPMorgan Chase Bank N.A. | | | 33,909,400 | | | | CNY | | | | 5,313,004 | | | | 5,300,000 | | | | 13,004 | |
| | | | | | |
2/1/2013 | | Citibank N.A. | | | 100,000,000 | | | | CNY | | | | 15,891,565 | | | | 15,745,552 | | | | 146,013 | |
| | | | | | |
7/18/2011 | | Barclays Bank plc | | | 1,315,000 | | | | EUR | | | | 1,909,156 | | | | 1,864,880 | | | | 44,276 | |
| | | | | | |
7/18/2011 | | Citibank N.A. | | | 3,803,000 | | | | EUR | | | | 5,521,311 | | | | 5,394,255 | | | | 127,056 | |
| | | | | | |
7/18/2011 | | Citibank N.A. | | | 323,000 | | | | EUR | | | | 468,941 | | | | 455,267 | | | | 13,674 | |
| | | | | | |
7/18/2011 | | JPMorgan Chase Bank N.A. | | | 6,210,000 | | | | EUR | | | | 9,015,866 | | | | 8,885,316 | | | | 130,550 | |
44
MET INVESTORS SERIES TRUST
| | |
PIMCO Total Return Portfolio | | |
Notes to Financial Statements—June 30, 2011 (Unaudited)—(Continued)
6. Forward Foreign Currency Exchange Contracts - continued
| | | | | | | | | | | | | | | | | | | | | | |
Settlement
Date | | Counterparty | | Contracts to Buy | | | | | | Value at
June 30,
2011 | | | In Exchange
for U.S.$ | | | Net Unrealized
Appreciation/
(Depreciation) | |
| | | | | | |
7/18/2011 | | JPMorgan Chase Bank N.A. | | | 2,117,000 | | | | EUR | | | $ | 3,073,525 | | | $ | 2,997,617 | | | $ | 75,908 | |
| | | | | | |
7/18/2011 | | JPMorgan Chase Bank N.A. | | | 4,212,000 | | | | EUR | | | | 6,115,109 | | | | 6,087,671 | | | | 27,438 | |
| | | | | | |
7/18/2011 | | Morgan Stanley | | | 2,233,000 | | | | EUR | | | | 3,241,937 | | | | 3,218,668 | | | | 23,269 | |
| | | | | | |
7/18/2011 | | Morgan Stanley | | | 2,000,000 | | | | EUR | | | | 2,903,661 | | | | 2,838,060 | | | | 65,601 | |
| | | | | | |
7/27/2011 | | Barclays Bank plc | | | 59,321,523,000 | | | | IDR | | | | 6,894,735 | | | | 6,423,554 | | | | 471,181 | |
| | | | | | |
7/27/2011 | | Citibank N.A. | | | 5,252,500,000 | | | | IDR | | | | 610,480 | | | | 550,000 | | | | 60,480 | |
| | | | | | |
7/27/2011 | | Citibank N.A. | | | 7,814,600,000 | | | | IDR | �� | | | 908,264 | | | | 820,000 | | | | 88,264 | |
| | | | | | |
7/27/2011 | | Citibank N.A. | | | 26,407,900,000 | | | | IDR | | | | 3,069,298 | | | | 2,840,475 | | | | 228,823 | |
| | | | | | |
7/27/2011 | | Citibank N.A. | | | 132,854,400,000 | | | | IDR | | | | 15,441,207 | | | | 14,551,413 | | | | 889,794 | |
| | | | | | |
7/27/2011 | | JPMorgan Chase Bank N.A. | | | 27,376,000,000 | | | | IDR | | | | 3,181,818 | | | | 2,900,000 | | | | 281,818 | |
| | | | | | |
7/27/2011 | | JPMorgan Chase Bank N.A. | | | 16,712,000,000 | | | | IDR | | | | 1,942,378 | | | | 1,820,678 | | | | 121,700 | |
| | | | | | |
1/31/2012 | | Citibank N.A. | | | 147,642,200,000 | | | | IDR | | | | 16,663,412 | | | | 16,272,699 | | | | 390,713 | |
| | | | | | |
8/12/2011 | | Barclays Bank plc | | | 1,264,752,000 | | | | INR | | | | 28,111,551 | | | | 27,870,251 | | | | 241,300 | |
| | | | | | |
8/12/2011 | | Morgan Stanley | | | 672,340,000 | | | | INR | | | | 14,944,053 | | | | 14,323,392 | | | | 620,661 | |
| | | | | | |
7/5/2011 | | Citibank N.A. | | | 20,000,000 | | | | JPY | | | | 248,000 | | | | 246,761 | | | | 1,239 | |
| | | | | | |
7/14/2011 | | Barclays Bank plc | | | 11,045,000 | | | | JPY | | | | 136,964 | | | | 135,075 | | | | 1,889 | |
| | | | | | |
7/14/2011 | | JPMorgan Chase Bank N.A. | | | 785,340,000 | | | | JPY | | | | 9,738,658 | | | | 9,375,459 | | | | 363,199 | |
| | | | | | |
7/14/2011 | | JPMorgan Chase Bank N.A. | | | 110,348,000 | | | | JPY | | | | 1,368,377 | | | | 1,339,637 | | | | 28,740 | |
| | | | | | |
7/14/2011 | | UBS AG | | | 331,725,000 | | | | JPY | | | | 4,113,576 | | | | 3,920,075 | | | | 193,501 | |
| | | | | | |
7/25/2011 | | Citibank N.A. | | | 23,805,738,000 | | | | JPY | | | | 295,220,201 | | | | 291,351,730 | | | | 3,868,471 | |
| | | | | | |
8/12/2011 | | Goldman Sachs & Co. | | | 6,200,150,000 | | | | KRW | | | | 5,793,729 | | | | 5,500,000 | | | | 293,729 | |
| | | | | | |
8/12/2011 | | JPMorgan Chase Bank N.A. | | | 106,468,788,219 | | | | KRW | | | | 99,489,739 | | | | 96,952,865 | | | | 2,536,874 | |
| | | | | | |
8/12/2011 | | Morgan Stanley | | | 2,480,280,000 | | | | KRW | | | | 2,317,697 | | | | 2,206,164 | | | | 111,533 | |
| | | | | | |
7/7/2011 | | Citibank N.A. | | | 54,614,250 | | | | MXN | | | | 4,659,160 | | | | 4,500,000 | | | | 159,160 | |
| | | | | | |
7/7/2011 | | Citibank N.A. | | | 4,507,000 | | | | MXN | | | | 384,494 | | | | 366,706 | | | | 17,788 | |
| | | | | | |
7/7/2011 | | Deutsche Bank AG | | | 28,447,550 | | | | MXN | | | | 2,426,870 | | | | 2,300,000 | | | | 126,870 | |
| | | | | | |
7/7/2011 | | JPMorgan Chase Bank N.A. | | | 144,693,647 | | | | MXN | | | | 12,343,863 | | | | 11,900,000 | | | | 443,863 | |
| | | | | | |
7/7/2011 | | Morgan Stanley | | | 45,219,550 | | | | MXN | | | | 3,857,695 | | | | 3,700,000 | | | | 157,695 | |
| | | | | | |
7/7/2011 | | Morgan Stanley | | | 44,004,600 | | | | MXN | | | | 3,754,047 | | | | 3,600,000 | | | | 154,047 | |
| | | | | | |
7/7/2011 | | Morgan Stanley | | | 1,145,034,758 | | | | MXN | | | | 97,683,294 | | | | 93,632,738 | | | | 4,050,556 | |
| | | | | | |
7/7/2011 | | UBS AG | | | 53,754,800 | | | | MXN | | | | 4,585,840 | | | | 4,400,000 | | | | 185,840 | |
| | | | | | |
7/7/2011 | | UBS AG | | | 78,449,280 | | | | MXN | | | | 6,692,534 | | | | 6,400,000 | | | | 292,534 | |
| | | | | | |
11/18/2011 | | Citibank N.A. | | | 982,327,288 | | | | MXN | | | | 82,780,127 | | | | 83,075,588 | | | | (295,461 | ) |
| | | | | | |
11/18/2011 | | Morgan Stanley | | | 616,398,147 | | | | MXN | | | | 51,943,499 | | | | 52,353,818 | | | | (410,319 | ) |
| | | | | | |
8/11/2011 | | Barclays Bank plc | | | 3,500,000 | | | | MYR | | | | 1,155,920 | | | | 1,127,759 | | | | 28,161 | |
| | | | | | |
8/11/2011 | | Barclays Bank plc | | | 3,600,000 | | | | MYR | | | | 1,188,947 | | | | 1,165,690 | | | | 23,257 | |
| | | | | | |
8/11/2011 | | Barclays Bank plc | | | 3,400,000 | | | | MYR | | | | 1,122,894 | | | | 1,104,793 | | | | 18,101 | |
| | | | | | |
8/11/2011 | | Citibank N.A. | | | 6,370,000 | | | | MYR | | | | 2,103,775 | | | | 2,058,757 | | | | 45,018 | |
| | | | | | |
8/11/2011 | | Citibank N.A. | | | 3,600,000 | | | | MYR | | | | 1,188,946 | | | | 1,167,315 | | | | 21,631 | |
45
MET INVESTORS SERIES TRUST
| | |
PIMCO Total Return Portfolio | | |
Notes to Financial Statements—June 30, 2011 (Unaudited)—(Continued)
6. Forward Foreign Currency Exchange Contracts - continued
| | | | | | | | | | | | | | | | | | | | | | |
Settlement
Date | | Counterparty | | Contracts to Buy | | | | | | Value at
June 30,
2011 | | | In Exchange
for U.S.$ | | | Net Unrealized
Appreciation/
(Depreciation) | |
| | | | | | |
8/11/2011 | | Citibank N.A. | | | 5,300,000 | | | | MYR | | | $ | 1,750,394 | | | $ | 1,718,715 | | | $ | 31,679 | |
| | | | | | |
8/11/2011 | | Citibank N.A. | | | 5,200,000 | | | | MYR | | | | 1,717,368 | | | | 1,690,123 | | | | 27,245 | |
| | | | | | |
8/11/2011 | | JPMorgan Chase Bank N.A. | | | 3,500,000 | | | | MYR | | | | 1,155,920 | | | | 1,135,810 | | | | 20,110 | |
| | | | | | |
8/11/2011 | | Morgan Stanley | | | 5,913,557 | | | | MYR | | | | 1,953,028 | | | | 1,923,045 | | | | 29,983 | |
| | | | | | |
11/15/2011 | | Barclays Bank plc | | | 48,900,000 | | | | PHP | | | | 1,116,004 | | | | 1,102,344 | | | | 13,660 | |
| | | | | | |
11/15/2011 | | Barclays Bank plc | | | 20,600,000 | | | | PHP | | | | 470,137 | | | | 467,120 | | | | 3,017 | |
| | | | | | |
11/15/2011 | | Barclays Bank plc | | | 20,700,000 | | | | PHP | | | | 472,419 | | | | 467,374 | | | | 5,045 | |
| | | | | | |
11/15/2011 | | Barclays Bank plc | | | 20,700,000 | | | | PHP | | | | 472,419 | | | | 465,692 | | | | 6,727 | |
| | | | | | |
11/15/2011 | | Barclays Bank plc | | | 16,067,377 | | | | PHP | | | | 366,693 | | | | 358,807 | | | | 7,886 | |
| | | | | | |
11/15/2011 | | Citibank N.A. | | | 47,410,000 | | | | PHP | | | | 1,082,000 | | | | 1,100,000 | | | | (18,000 | ) |
| | | | | | |
11/15/2011 | | Citibank N.A. | | | 47,734,500 | | | | PHP | | | | 1,089,406 | | | | 1,100,000 | | | | (10,594 | ) |
| | | | | | |
11/15/2011 | | Citibank N.A. | | | 52,200,000 | | | | PHP | | | | 1,191,318 | | | | 1,200,000 | | | | (8,682 | ) |
| | | | | | |
11/15/2011 | | Citibank N.A. | | | 65,835,000 | | | | PHP | | | | 1,502,499 | | | | 1,500,000 | | | | 2,499 | |
| | | | | | |
11/15/2011 | | Citibank N.A. | | | 49,005,000 | | | | PHP | | | | 1,118,401 | | | | 1,100,000 | | | | 18,401 | |
| | | | | | |
11/15/2011 | | Citibank N.A. | | | 57,473,000 | | | | PHP | | | | 1,311,660 | | | | 1,300,000 | | | | 11,660 | |
| | | | | | |
11/15/2011 | | Citibank N.A. | | | 40,600,000 | | | | PHP | | | | 926,580 | | | | 915,858 | | | | 10,722 | |
| | | | | | |
11/15/2011 | | Deutsche Bank AG | | | 52,860,000 | | | | PHP | | | | 1,206,381 | | | | 1,200,000 | | | | 6,381 | |
| | | | | | |
11/15/2011 | | Goldman Sachs & Co. | | | 87,840,000 | | | | PHP | | | | 2,004,701 | | | | 2,000,000 | | | | 4,701 | |
| | | | | | |
11/15/2011 | | JPMorgan Chase Bank N.A. | | | 47,410,000 | | | | PHP | | | | 1,082,000 | | | | 1,100,000 | | | | (18,000 | ) |
| | | | | | |
11/15/2011 | | JPMorgan Chase Bank N.A. | | | 119,070,000 | | | | PHP | | | | 2,717,438 | | | | 2,700,000 | | | | 17,438 | |
| | | | | | |
11/15/2011 | | JPMorgan Chase Bank N.A. | | | 53,244,000 | | | | PHP | | | | 1,215,144 | | | | 1,200,000 | | | | 15,144 | |
| | | | | | |
3/15/2012 | | Citibank N.A. | | | 168,900,000 | | | | PHP | | | | 3,825,278 | | | | 3,895,744 | | | | (70,466 | ) |
| | | | | | |
3/15/2012 | | Citibank N.A. | | | 1,197,565,000 | | | | PHP | | | | 27,122,675 | | | | 27,584,130 | | | | (461,455 | ) |
| | | | | | |
3/15/2012 | | Morgan Stanley | | | 173,011,500 | | | | PHP | | | | 3,918,397 | | | | 3,973,166 | | | | (54,769 | ) |
| | | | | | |
7/1/2011 | | Barclays Bank plc | | | 86,910,000 | | | | RUB | | | | 3,118,916 | | | | 3,042,002 | | | | 76,914 | |
| | | | | | |
7/1/2011 | | Citibank N.A. | | | 86,910,000 | | | | RUB | | | | 3,118,916 | | | | 3,118,664 | | | | 252 | |
| | | | | | |
9/9/2011 | | Barclays Bank plc | | | 3,400,000 | | | | SGD | | | | 2,770,158 | | | | 2,659,210 | | | | 110,948 | |
| | | | | | |
9/9/2011 | | Citibank N.A. | | | 4,300,000 | | | | SGD | | | | 3,503,435 | | | | 3,359,637 | | | | 143,798 | |
| | | | | | |
9/9/2011 | | Deutsche Bank AG | | | 8,000,000 | | | | SGD | | | | 6,518,020 | | | | 6,272,788 | | | | 245,232 | |
| | | | | | |
9/9/2011 | | Deutsche Bank AG | | | 11,000,000 | | | | SGD | | | | 8,962,278 | | | | 8,927,847 | | | | 34,431 | |
| | | | | | |
9/9/2011 | | Deutsche Bank AG | | | 7,300,000 | | | | SGD | | | | 5,947,693 | | | | 5,928,404 | | | | 19,289 | |
| | | | | | |
9/9/2011 | | Goldman Sachs & Co. | | | 10,000,000 | | | | SGD | | | | 8,147,525 | | | | 8,122,223 | | | | 25,302 | |
| | | | | | |
9/9/2011 | | Goldman Sachs & Co. | | | 1,927,677 | | | | SGD | | | | 1,570,580 | | | | 1,568,403 | | | | 2,177 | |
| | | | | | |
9/9/2011 | | JPMorgan Chase Bank N.A. | | | 2,000,000 | | | | SGD | | | | 1,629,505 | | | | 1,561,414 | | | | 68,091 | |
| | | | | | |
9/9/2011 | | JPMorgan Chase Bank N.A. | | | 9,748,580 | | | | SGD | | | | 7,942,680 | | | | 7,655,672 | | | | 287,008 | |
| | | | | | |
9/9/2011 | | JPMorgan Chase Bank N.A. | | | 7,000,000 | | | | SGD | | | | 5,703,267 | | | | 5,687,034 | | | | 16,233 | |
| | | | | | |
9/9/2011 | | UBS AG | | | 6,100,000 | | | | SGD | | | | 4,969,990 | | | | 4,966,314 | | | | 3,676 | |
| | | | | | |
7/27/2011 | | JPMorgan Chase Bank N.A. | | | 40,792,204 | | | | TRY | | | | 25,050,481 | | | | 25,697,495 | | | | (647,014 | ) |
| | | | | | |
7/27/2011 | | JPMorgan Chase Bank N.A. | | | 4,488,040 | | | | TRY | | | | 2,756,104 | | | | 2,900,000 | | | | (143,896 | ) |
46
MET INVESTORS SERIES TRUST
| | |
PIMCO Total Return Portfolio | | |
Notes to Financial Statements—June 30, 2011 (Unaudited)—(Continued)
6. Forward Foreign Currency Exchange Contracts - continued
| | | | | | | | | | | | | | | | | | | | | | |
Settlement
Date | | Counterparty | | Contracts to Buy | | | | | | Value at
June 30,
2011 | | | In Exchange
for U.S.$ | | | Net Unrealized
Appreciation/
(Depreciation) | |
| | | | | | |
7/27/2011 | | JPMorgan Chase Bank N.A. | | | 6,479,340 | | | | TRY | | | $ | 3,978,961 | | | $ | 4,200,000 | | | $ | (221,039 | ) |
| | | | | | |
7/27/2011 | | JPMorgan Chase Bank N.A. | | | 5,116,320 | | | | TRY | | | | 3,141,931 | | | | 3,300,000 | | | | (158,069 | ) |
| | | | | | |
10/27/2011 | | JPMorgan Chase Bank N.A. | | | 56,875,904 | | | | TRY | | | | 34,333,337 | | | | 33,830,540 | | | | 502,797 | |
| | | | | | |
1/11/2012 | | Barclays Bank plc | | | 127,386,100 | | | | TWD | | | | 4,453,670 | | | | 4,444,735 | | | | 8,935 | |
| | | | | | |
7/28/2011 | | Barclays Bank plc | | | 174,452,689 | | | | ZAR | | | | 25,734,081 | | | | 25,171,732 | | | | 562,349 | |
| | | | | | |
7/28/2011 | | Citibank N.A. | | | 14,622,300 | | | | ZAR | | | | 2,156,983 | | | | 2,100,000 | | | | 56,983 | |
| | | | | | |
7/28/2011 | | Morgan Stanley | | | 36,956,550 | | | | ZAR | | | | 5,451,581 | | | | 5,409,173 | | | | 42,408 | |
| | | | | | |
9/13/2011 | | Barclays Bank plc | | | 9,881,950 | | | | ZAR | | | | 1,447,768 | | | | 1,300,000 | | | | 147,768 | |
| | | | | | |
9/13/2011 | | Morgan Stanley | | | 5,319,300 | | | | ZAR | | | | 779,311 | | | | 700,000 | | | | 79,311 | |
| | | | | | |
9/13/2011 | | UBS AG | | | 4,560,000 | | | | ZAR | | | | 668,069 | | | | 600,000 | | | | 68,069 | |
| | | | | | |
10/28/2011 | | Deutsche Bank AG | | | 211,270,939 | | | | ZAR | | | | 30,744,987 | | | | 30,340,199 | | | | 404,788 | |
| | | | | | | | | | | | | | | | | | | | | | |
| | | | | |
Net Unrealized Appreciation | | | | | | | | | | | | | | | | | | $ | 20,117,304 | |
| | | | | | | | | | | | | | | | | | | | | | |
Forward Foreign Currency Exchange Contracts to Sell:
| | | | | | | | | | | | | | | | | | | | | | |
Settlement
Date | | Counterparty | | Contracts to Deliver | | | | | | Value at
June 30,
2011 | | | In Exchange
for U.S.$ | | | Net Unrealized
Appreciation/
(Depreciation) | |
| | | | | | |
8/2/2011 | | Barclays Bank plc | | | 3,458,070 | | | | BRL | | | $ | 2,201,907 | | | $ | 2,100,000 | | | $ | (101,907 | ) |
| | | | | | |
8/2/2011 | | Barclays Bank plc | | | 10,197,760 | | | | BRL | | | | 6,493,367 | | | | 6,200,000 | | | | (293,367 | ) |
| | | | | | |
8/2/2011 | | Citibank N.A. | | | 2,123,940 | | | | BRL | | | | 1,352,407 | | | | 1,300,000 | | | | (52,407 | ) |
| | | | | | |
8/2/2011 | | Citibank N.A. | | | 2,612,480 | | | | BRL | | | | 1,663,482 | | | | 1,600,000 | | | | (63,482 | ) |
| | | | | | |
8/2/2011 | | Citibank N.A. | | | 1,468,800 | | | | BRL | | | | 935,250 | | | | 900,000 | | | | (35,250 | ) |
| | | | | | |
8/2/2011 | | Morgan Stanley | | | 22,509,800 | | | | BRL | | | | 14,332,991 | | | | 14,005,600 | | | | (327,391 | ) |
| | | | | | |
8/2/2011 | | Morgan Stanley | | | 2,121,600 | | | | BRL | | | | 1,350,917 | | | | 1,300,000 | | | | (50,917 | ) |
| | | | | | |
8/2/2011 | | Morgan Stanley | | | 2,123,810 | | | | BRL | | | | 1,352,324 | | | | 1,300,000 | | | | (52,324 | ) |
| | | | | | |
8/2/2011 | | Morgan Stanley | | | 1,632,400 | | | | BRL | | | | 1,039,422 | | | | 1,000,000 | | | | (39,422 | ) |
| | | | | | |
8/2/2011 | | UBS AG | | | 4,628,650 | | | | BRL | | | | 2,947,267 | | | | 2,872,262 | | | | (75,005 | ) |
| | | | | | |
8/2/2011 | | UBS AG | | | 2,123,810 | | | | BRL | | | | 1,352,324 | | | | 1,300,000 | | | | (52,324 | ) |
| | | | | | |
8/2/2011 | | UBS AG | | | 4,247,620 | | | | BRL | | | | 2,704,649 | | | | 2,600,000 | | | | (104,649 | ) |
| | | | | | |
9/2/2011 | | Barclays Bank plc | | | 10,928,923 | | | | BRL | | | | 6,912,610 | | | | 6,791,525 | | | | (121,085 | ) |
| | | | | | |
9/19/2011 | | BNP Paribas Bank | | | 5,851,000 | | | | CAD | | | | 6,056,417 | | | | 5,946,138 | | | | (110,279 | ) |
| | | | | | |
9/19/2011 | | Citibank N.A. | | | 6,583,000 | | | | CAD | | | | 6,814,116 | | | | 6,657,289 | | | | (156,827 | ) |
| | | | | | |
9/19/2011 | | JPMorgan Chase Bank N.A. | | | 2,617,000 | | | | CAD | | | | 2,708,877 | | | | 2,645,489 | | | | (63,388 | ) |
| | | | | | |
9/19/2011 | | JPMorgan Chase Bank N.A. | | | 2,330,000 | | | | CAD | | | | 2,411,802 | | | | 2,390,845 | | | | (20,957 | ) |
| | | | | | |
8/8/2011 | | Citibank N.A. | | | 158,350,000 | | | | DKK | | | | 30,810,510 | | | | 31,433,488 | | | | 622,978 | |
| | | | | | |
7/18/2011 | | Barclays Bank plc | | | 874,000 | | | | EUR | | | | 1,268,900 | | | | 1,249,647 | | | | (19,253 | ) |
| | | | | | |
7/18/2011 | | Barclays Bank plc | | | 1,550,000 | | | | EUR | | | | 2,250,337 | | | | 2,249,059 | | | | (1,278 | ) |
| | | | | | |
7/18/2011 | | Barclays Bank plc | | | 1,692,000 | | | | EUR | | | | 2,456,497 | | | | 2,421,440 | | | | (35,057 | ) |
| | | | | | |
7/18/2011 | | Barclays Bank plc | | | 2,834,000 | | | | EUR | | | | 4,114,487 | | | | 4,196,437 | | | | 81,950 | |
47
MET INVESTORS SERIES TRUST
| | |
PIMCO Total Return Portfolio | | |
Notes to Financial Statements—June 30, 2011 (Unaudited)—(Continued)
6. Forward Foreign Currency Exchange Contracts - continued
| | | | | | | | | | | | | | | | | | | | | | |
Settlement
Date | | Counterparty | | Contracts to Deliver | | | | | | Value at
June 30,
2011 | | | In Exchange
for U.S.$ | | | Net Unrealized
Appreciation/
(Depreciation) | |
| | | | | | |
7/18/2011 | | Barclays Bank plc | | | 5,555,000 | | | | EUR | | | $ | 8,064,917 | | | $ | 7,941,617 | | | $ | (123,300 | ) |
| | | | | | |
7/18/2011 | | Barclays Bank plc | | | 12,668,000 | | | | EUR | | | | 18,391,786 | | | | 18,217,217 | | | | (174,569 | ) |
| | | | | | |
7/18/2011 | | Barclays Bank plc | | | 21,598,000 | | | | EUR | | | | 31,356,631 | | | | 30,552,877 | | | | (803,754 | ) |
| | | | | | |
7/18/2011 | | BNP Paribas Bank | | | 6,470,000 | | | | EUR | | | | 9,393,342 | | | | 9,380,335 | | | | (13,007 | ) |
| | | | | | |
7/18/2011 | | Citibank N.A. | | | 1,000 | | | | EUR | | | | 1,452 | | | | 1,481 | | | | 29 | |
| | | | | | |
7/18/2011 | | Citibank N.A. | | | 2,281,000 | | | | EUR | | | | 3,311,625 | | | | 3,276,227 | | | | (35,398 | ) |
| | | | | | |
7/18/2011 | | Citibank N.A. | | | 2,615,000 | | | | EUR | | | | 3,796,536 | | | | 3,816,488 | | | | 19,952 | |
| | | | | | |
7/18/2011 | | Citibank N.A. | | | 5,800,000 | | | | EUR | | | | 8,420,616 | | | | 8,330,823 | | | | (89,793 | ) |
| | | | | | |
7/18/2011 | | Deutsche Bank AG | | | 3,700,000 | | | | EUR | | | | 5,371,772 | | | | 5,401,759 | | | | 29,987 | |
| | | | | | |
7/18/2011 | | JPMorgan Chase Bank N.A. | | | 1,193,000 | | | | EUR | | | | 1,732,033 | | | | 1,739,615 | | | | 7,582 | |
| | | | | | |
7/18/2011 | | JPMorgan Chase Bank N.A. | | | 2,856,000 | | | | EUR | | | | 4,146,427 | | | | 4,164,577 | | | | 18,150 | |
| | | | | | |
7/18/2011 | | JPMorgan Chase Bank N.A. | | | 4,185,000 | | | | EUR | | | | 6,075,910 | | | | 6,055,172 | | | | (20,738 | ) |
| | | | | | |
7/18/2011 | | JPMorgan Chase Bank N.A. | | | 4,219,000 | | | | EUR | | | | 6,125,272 | | | | 6,049,791 | | | | (75,481 | ) |
| | | | | | |
7/18/2011 | | JPMorgan Chase Bank N.A. | | | 7,097,000 | | | | EUR | | | | 10,303,640 | | | | 10,087,662 | | | | (215,978 | ) |
| | | | | | |
7/18/2011 | | JPMorgan Chase Bank N.A. | | | 8,794,000 | | | | EUR | | | | 12,767,396 | | | | 12,657,133 | | | | (110,263 | ) |
| | | | | | |
7/18/2011 | | JPMorgan Chase Bank N.A. | | | 181,998,000 | | | | EUR | | | | 264,230,211 | | | | 262,606,734 | | | | (1,623,477 | ) |
| | | | | | |
7/18/2011 | | UBS AG | | | 4,939,000 | | | | EUR | | | | 7,170,590 | | | | 7,220,426 | | | | 49,836 | |
| | | | | | |
7/18/2011 | | UBS AG | | | 7,138,000 | | | | EUR | | | | 10,363,165 | | | | 10,397,518 | | | | 34,353 | |
| | | | | | |
7/18/2011 | | UBS AG | | | 34,721,000 | | | | EUR | | | | 50,409,000 | | | | 48,862,863 | | | | (1,546,137 | ) |
| | | | | | |
9/13/2011 | | UBS AG | | | 48,768,000 | | | | GBP | | | | 78,292,766 | | | | 80,077,690 | | | | 1,784,924 | |
| | | | | | |
7/11/2011 | | JPMorgan Chase Bank N.A. | | | 27,803,740,000 | | | | JPY | | | | 344,777,036 | | | | 330,800,000 | | | | (13,977,036 | ) |
| | | | | | |
7/14/2011 | | Barclays Bank plc | | | 1,296,903,000 | | | | JPY | | | | 16,082,327 | | | | 15,502,253 | | | | (580,074 | ) |
| | | | | | |
7/19/2011 | | JPMorgan Chase Bank N.A. | | | 11,695,660,000 | | | | JPY | | | | 145,036,261 | | | | 139,400,000 | | | | (5,636,261 | ) |
| | | | | | |
7/25/2011 | | Citibank N.A. | | | 38,780,000,000 | | | | JPY | | | | 480,919,322 | | | | 468,598,012 | | | | (12,321,310 | ) |
| | | | | | |
7/25/2011 | | Citibank N.A. | | | 23,300,000,000 | | | | JPY | | | | 288,948,433 | | | | 290,352,810 | | | | 1,404,377 | |
| | | | | | |
8/1/2011 | | UBS AG | | | 830,000,000 | | | | JPY | | | | 10,293,360 | | | | 10,163,286 | | | | (130,074 | ) |
| | | | | | |
8/8/2011 | | Deutsche Bank AG | | | 6,310,000,000 | | | | JPY | | | | 78,257,178 | | | | 78,207,790 | | | | (49,388 | ) |
| | | | | | |
8/15/2011 | | JPMorgan Chase Bank N.A. | | | 25,060,000,000 | | | | JPY | | | | 310,808,647 | | | | 309,490,847 | | | | (1,317,800 | ) |
| | | | | | |
8/18/2011 | | JPMorgan Chase Bank N.A. | | | 8,400,000,000 | | | | JPY | | | | 104,183,438 | | | | 103,869,125 | | | | (314,313 | ) |
| | | | | | |
8/22/2011 | | Citibank N.A. | | | 6,310,000,000 | | | | JPY | | | | 78,263,378 | | | | 78,682,229 | | | | 418,851 | |
| | | | | | |
8/22/2011 | | JPMorgan Chase Bank N.A. | | | 7,820,000,000 | | | | JPY | | | | 96,992,015 | | | | 96,543,210 | | | | (448,805 | ) |
| | | | | | |
9/6/2011 | | Citibank N.A. | | | 23,810,000,000 | | | | JPY | | | | 295,342,190 | | | | 292,882,140 | | | | (2,460,050 | ) |
| | | | | | |
9/20/2011 | | Citibank N.A. | | | 300,000,000 | | | | JPY | | | | 3,721,578 | | | | 3,732,086 | | | | 10,508 | |
| | | | | | |
10/3/2011 | | Citibank N.A. | | | 20,000,000 | | | | JPY | | | | 248,127 | | | | 246,902 | | | | (1,225 | ) |
| | | | | | |
7/7/2011 | | Citibank N.A. | | | 982,327,288 | | | | MXN | | | | 83,802,667 | | | | 84,088,965 | | | | 286,298 | |
| | | | | | |
7/7/2011 | | Morgan Stanley | | | 616,398,147 | | | | MXN | | | | 52,585,130 | | | | 53,000,700 | | | | 415,570 | |
| | | | | | |
7/1/2011 | | Citibank N.A. | | | 86,910,000 | | | | RUB | | | | 3,118,916 | | | | 3,160,938 | | | | 42,022 | |
| | | | | | |
7/1/2011 | | Barclays Bank plc | | | 86,910,000 | | | | RUB | | | | 3,118,916 | | | | 3,118,664 | | | | (252 | ) |
| | | | | | |
7/27/2011 | | JPMorgan Chase Bank N.A. | | | 56,875,904 | | | | TRY | | | | 34,927,477 | | | | 34,418,096 | | | | (509,381 | ) |
48
MET INVESTORS SERIES TRUST
| | |
PIMCO Total Return Portfolio | | |
Notes to Financial Statements—June 30, 2011 (Unaudited)—(Continued)
6. Forward Foreign Currency Exchange Contracts - continued
| | | | | | | | | | | | | | | | | | | | | | |
Settlement
Date | | Counterparty | | Contracts to Deliver | | | | | | Value at
June 30,
2011 | | | In Exchange
for U.S.$ | | | Net Unrealized
Appreciation/
(Depreciation) | |
| | | | | | |
7/28/2011 | | Barclays Bank plc | | | 12,074,400 | | | | ZAR | | | $ | 1,781,134 | | | $ | 1,800,000 | | | $ | 18,866 | |
| | | | | | |
7/28/2011 | | Deutsche Bank AG | | | 211,270,939 | | | | ZAR | | | | 31,165,260 | | | | 30,752,684 | | | | (412,576 | ) |
| | | | | | |
7/28/2011 | | Morgan Stanley | | | 2,686,200 | | | | ZAR | | | | 396,250 | | | | 400,000 | | | | 3,750 | |
| | | | | | | | | | | | | | | | | | | | | | |
| | | | | |
Net Unrealized Depreciation | | | | | | | | | | | | | | | | | | $ | (39,517,026 | ) |
| | | | | | | | | | | | | | | | | | | | | | |
AUD—Australian Dollar
BRL—Brazilian Real
CAD—Canadian Dollar
CNY—China Yuan Renminbi
DKK—Danish Krone
EUR—Euro
GBP—British Pound
IDR—Indonesian Rupiah
INR—Indian Rupee
JPY—Japanese Yen
KRW—South Korean Won
MXN—Mexican Peso
MYR—Malaysian Ringgit
PHP—Philippine Peso
RUB—Russian Ruble
SGD—Singapore Dollar
TRY—Turkish Lira
TWD—New Taiwan Dollar
ZAR—South African Rand
7. Futures Contracts
The futures contracts outstanding as of June 30, 2011 and the description and unrealized appreciation (depreciation) were as follows:
| | | | | | | | | | | | | | | | | | | | | | | | |
Futures Contracts - Long | | Expiration
Date | | | Number of
Contracts | | | Contract Amount | | | Valuation as of
June 30, 2011 | | | Unrealized
Appreciation/
Depreciation | |
| | | | | | |
3MO Euribor Interest Rate Futures | | | 6/18/2012 | | | | 268 | | | | EUR | | | | 95,133,714 | | | $ | 95,312,684 | | | $ | 178,970 | |
| | | | | | |
3MO Euribor Interest Rate Futures | | | 9/17/2012 | | | | 268 | | | | EUR | | | | 95,012,334 | | | | 95,234,838 | | | | 222,504 | |
| | | | | | |
3MO Euribor Interest Rate Futures | | | 12/17/2012 | | | | 268 | | | | EUR | | | | 94,885,489 | | | | 95,127,799 | | | | 242,310 | |
| | | | | | |
3MO Euribor Interest Rate Futures | | | 3/18/2013 | | | | 268 | | | | EUR | | | | 94,793,483 | | | | 95,040,223 | | | | 246,740 | |
| | | | | | |
90 Day EuroDollar Futures | | | 9/19/2011 | | | | 740 | | | | USD | | | | 184,252,015 | | | | 184,361,750 | | | | 109,735 | |
| | | | | | |
90 Day EuroDollar Futures | | | 12/19/2011 | | | | 5,342 | | | | USD | | | | 1,325,799,883 | | | | 1,329,890,900 | | | | 4,091,017 | |
| | | | | | |
90 Day EuroDollar Futures | | | 3/19/2012 | | | | 19,408 | | | | USD | | | | 4,809,480,002 | | | | 4,828,467,800 | | | | 18,987,798 | |
| | | | | | |
90 Day EuroDollar Futures | | | 6/18/2012 | | | | 18,649 | | | | USD | | | | 4,618,547,036 | | | | 4,633,577,162 | | | | 15,030,126 | |
| | | | | | |
90 Day EuroDollar Futures | | | 9/17/2012 | | | | 8,147 | | | | USD | | | | 2,019,555,971 | | | | 2,020,048,650 | | | | 492,679 | |
| | | | | | |
90 Day EuroDollar Futures | | | 12/17/2012 | | | | 2,781 | | | | USD | | | | 688,588,715 | | | | 687,810,825 | | | | (777,890 | ) |
| | | | | | |
90 Day EuroDollar Futures | | | 3/18/2013 | | | | 4,751 | | | | USD | | | | 1,173,586,578 | | | | 1,172,071,700 | | | | (1,514,878 | ) |
| | | | | | |
90 Day EuroDollar Futures | | | 6/17/2013 | | | | 1,324 | | | | USD | | | | 326,602,882 | | | | 325,753,650 | | | | (849,232 | ) |
| | | | | | |
90 Day EuroDollar Futures | | | 9/16/2013 | | | | 1,122 | | | | USD | | | | 275,862,357 | | | | 275,324,775 | | | | (537,582 | ) |
| | | | | | |
90 Day EuroDollar Futures | | | 12/16/2013 | | | | 581 | | | | USD | | | | 142,452,070 | | | | 142,177,963 | | | | (274,107 | ) |
49
MET INVESTORS SERIES TRUST
| | |
PIMCO Total Return Portfolio | | |
Notes to Financial Statements—June 30, 2011 (Unaudited)—(Continued)
7. Futures Contracts - continued
| | | | | | | | | | | | | | | | | | | | | | | | |
Futures Contracts - Long | | Expiration
Date | | | Number of
Contracts | | | Contract Amount | | | Valuation as of
June 30, 2011 | | | Unrealized
Appreciation/
Depreciation | |
| | | | | | |
90 Day EuroDollar Futures | | | 3/17/2014 | | | | 948 | | | | USD | | | | 231,897,389 | | | $ | 231,383,100 | | | $ | (514,289 | ) |
| | | | | | |
90 Day EuroDollar Futures | | | 6/16/2014 | | | | 187 | | | | USD | | | | 45,611,282 | | | | 45,520,475 | | | | (90,807 | ) |
| | | | | | |
German Euro Bobl Futures | | | 9/8/2011 | | | | 743 | | | | EUR | | | | 126,015,363 | | | | 125,801,066 | | | | (214,297 | ) |
| | | | | | |
German Euro Bund Futures | | | 9/8/2011 | | | | 458 | | | | EUR | | | | 83,872,895 | | | | 83,466,354 | | | | (406,541 | ) |
| | | | | | |
U.S. Treasury Note 2 Year Futures | | | 9/30/2011 | | | | 698 | | | | USD | | | | 152,960,738 | | | | 153,101,937 | | | | 141,199 | |
| | | | | | |
U.S. Treasury Note 5 Year Futures | | | 9/30/2011 | | | | 1,396 | | | | USD | | | | 167,609,107 | | | | 166,396,657 | | | | (1,212,450 | ) |
| | | | | | | | | | | | | | | | | | | | | | | | |
| | | | | | |
Net Unrealized Appreciation | | | | | | | | | | | | | | | | | | | | | | $ | 33,351,005 | |
| | | | | | | | | | | | | | | | | | | | | | | | |
EUR—Euro
USD—United States Dollar
8. Options written
The options contracts outstanding as of June 30, 2011, the description and unrealized appreciation (depreciation) were as follows:
| | | | | | | | | | | | | | | | | | | | | | |
Over the Counter
Options Written - Calls | | Counterparty | | Expiration
Date | | | Number of
Contracts | | | Premiums
Received | | | Valuation as of
June 30, 2011 | | | Unrealized
Appreciation/
(Depreciation) | |
| | | | | | |
CDX.O 5 Year Swaption 0.8 | | BNP Paribas Bank | | | 9/21/2011 | | | | (16,600,000 | ) | | $ | (35,690 | ) | | $ | (37,034 | ) | | $ | (1,344 | ) |
| | | | | | |
FNMA 4.5 | | Credit Suisse Group AG | | | 8/4/2011 | | | | (26,000,000 | ) | | | (65,000 | ) | | | (26,534 | ) | | | 38,466 | |
| | | | | | |
FVA USD 1 Year 1.0 | | JPMorgan Chase Bank N.A. | | | 10/11/2011 | | | | (56,400,000 | ) | | | (286,512 | ) | | | (365,030 | ) | | | (78,518 | ) |
| | | | | | |
FVA USD 1 Year 1.0 | | Goldman Sachs & Co. | | | 10/11/2012 | | | | (60,900,000 | ) | | | (321,564 | ) | | | (394,155 | ) | | | (72,591 | ) |
| | | | | | |
FVA USD 1 Year 2.0 | | Morgan Stanley | | | 10/11/2011 | | | | (277,500,000 | ) | | | (3,102,220 | ) | | | (4,497,651 | ) | | | (1,395,431 | ) |
| | | | | | |
FVA USD 1 Year 2.0 | | Morgan Stanley | | | 11/14/2011 | | | | (151,400,000 | ) | | | (1,646,680 | ) | | | (2,481,752 | ) | | | (835,072 | ) |
| | | | | | |
IRO USD 5 Year Swaption 1.8 | | Credit Suisse Group AG | | | 8/24/2011 | | | | (111,800,000 | ) | | | (223,600 | ) | | | (173,692 | ) | | | 49,908 | |
| | | | | | |
IRO USD 10 Year Swaption 3.0 | | Morgan Stanley | | | 10/11/2011 | | | | (390,800,000 | ) | | | (1,985,259 | ) | | | (2,352,186 | ) | | | (366,927 | ) |
| | | | | | | | | | | | | | | | | | | | | | |
| | | | | | |
| | | | | | | | | | | | $ | (7,666,525 | ) | | $ | (10,328,034 | ) | | $ | (2,661,509 | ) |
| | | | | | | | | | | | | | | | | | | | | | |
Exchange Traded
Options Written - Calls | | | | | | | | | | | | | | | | | |
| | | | | | |
U.S. Treasury Note 5 Year Futures | | Citibank N.A. | | | 7/22/2011 | | | | (137 | ) | | $ | (31,587 | ) | | $ | (20,336 | ) | | $ | 11,251 | |
| | | | | | |
U.S. Treasury Note 5 Year Futures | | Citibank N.A. | | | 7/22/2011 | | | | (882 | ) | | | (382,177 | ) | | | (199,828 | ) | | | 182,349 | |
| | | | | | |
U.S. Treasury Note 10 Year Futures | | Citibank N.A. | | | 7/22/2011 | | | | (190 | ) | | | (87,711 | ) | | | (17,813 | ) | | | 69,898 | |
| | | | | | | | | | | | | | | | | | | | | | |
| | | | | | |
| | | | | | | | | | | | $ | (501,475 | ) | | $ | (237,977 | ) | | $ | 263,498 | |
| | | | | | | | | | | | | | | | | | | | | | |
| | | | | | | | | | | | | | | | | | | | | | |
Over the Counter
Options Written - Puts | | | | | | | | | | | | | | | | | |
| | | | | | |
CDX.O 5 Year Swaption 1.2 | | BNP Paribas Bank | | | 9/21/2011 | | | | (16,600,000 | ) | | $ | (68,060 | ) | | $ | (8,543 | ) | | $ | 59,517 | |
| | | | | | |
FNMA 4.5 | | Credit Suisse Group AG | | | 8/4/2011 | | | | (26,000,000 | ) | | | (81,250 | ) | | | (88,539 | ) | | | (7,289 | ) |
| | | | | | |
INF Floor USD CPURNS 215.95 | | Citibank N.A. | | | 3/12/2020 | | | | (16,200,000 | ) | | | (137,080 | ) | | | (43,399 | ) | | | 93,681 | |
| | | | | | |
INF Floor USD CPURNS 215.95 | | Deutsche Bank AG | | | 3/10/2020 | | | | (5,800,000 | ) | | | (43,500 | ) | | | (20,592 | ) | | | 22,908 | |
50
MET INVESTORS SERIES TRUST
| | |
PIMCO Total Return Portfolio | | |
Notes to Financial Statements—June 30, 2011 (Unaudited)—(Continued)
8. Options written - continued
| | | | | | | | | | | | | | | | | | | | | | |
Over the Counter
Options Written - Puts | | Counterparty | | Expiration
Date | | | Number of
Contracts | | | Premiums
Received | | | Valuation as of
June 30, 2011 | | | Unrealized
Appreciation/
(Depreciation) | |
| | | | | | |
INF Floor USD CPURNS 216.69 | | Citibank N.A. | | | 4/7/2020 | | | | (38,800,000 | ) | | $ | (346,040 | ) | | $ | (108,231 | ) | | $ | 237,809 | |
| | | | | | |
INF Floor USD CPURNS 217.97 | | Citibank N.A. | | | 9/29/2020 | | | | (17,500,000 | ) | | | (225,750 | ) | | | (53,809 | ) | | | 171,941 | |
| | | | | | |
INF Floor USD CPURNS 218.011 | | Deutsche Bank AG | | | 10/13/2020 | | | | (18,000,000 | ) | | | (176,400 | ) | | | (73,385 | ) | | | 103,015 | |
| | | | | | |
IRO USD 1 Year Swaption 0.65 | | Goldman Sachs & Co. | | | 11/14/2011 | | | | (121,900,000 | ) | | | (249,895 | ) | | | (96,057 | ) | | | 153,838 | |
| | | | | | |
IRO USD 1 Year Swaption 1.0 | | Goldman Sachs & Co. | | | 11/19/2012 | | | | (139,600,000 | ) | | | (796,458 | ) | | | (824,980 | ) | | | (28,522 | ) |
| | | | | | |
IRO USD 2 Year Swaption 2.25 | | Citibank N.A. | | | 9/24/2012 | | | | (23,000,000 | ) | | | (156,688 | ) | | | (121,095 | ) | | | 35,593 | |
| | | | | | |
IRO USD 2 Year Swaption 2.25 | | Goldman Sachs & Co. | | | 9/24/2012 | | | | (89,300,000 | ) | | | (529,847 | ) | | | (470,165 | ) | | | 59,682 | |
| | | | | | |
IRO USD 2 Year Swaption 2.25 | | Morgan Stanley | | | 9/24/2012 | | | | (196,500,000 | ) | | | (1,247,163 | ) | | | (1,034,573 | ) | | | 212,590 | |
| | | | | | |
IRO USD 5 Year Swaption 2.5 | | Credit Suisse Group AG | | | 8/24/2011 | | | | (111,800,000 | ) | | | (444,405 | ) | | | (259,901 | ) | | | 184,504 | |
| | | | | | |
IRO USD 3 Year Swaption 2.75 | | Deutsche Bank AG | | | 6/18/2012 | | | | (240,800,000 | ) | | | (2,499,648 | ) | | | (1,198,991 | ) | | | 1,300,657 | |
| | | | | | |
IRO USD 3 Year Swaption 3.0 | | Barclays Bank plc | | | 6/18/2012 | | | | (50,200,000 | ) | | | (448,989 | ) | | | (192,085 | ) | | | 256,904 | |
| | | | | | |
IRO USD 3 Year Swaption 3.0 | | Citibank N.A. | | | 6/18/2012 | | | | (189,200,000 | ) | | | (2,064,210 | ) | | | (723,955 | ) | | | 1,340,255 | |
| | | | | | |
IRO USD 3 Year Swaption 3.0 | | Credit Suisse Group AG | | | 6/18/2012 | | | | (115,800,000 | ) | | | (732,435 | ) | | | (443,097 | ) | | | 289,338 | |
| | | | | | |
IRO USD 3 Year Swaption 3.0 | | Deutsche Bank AG | | | 6/18/2012 | | | | (72,500,000 | ) | | | (788,856 | ) | | | (277,414 | ) | | | 511,442 | |
| | | | | | |
IRO USD 3 Year Swaption 3.0 | | JPMorgan Chase Bank N.A. | | | 6/18/2012 | | | | (167,600,000 | ) | | | (1,750,743 | ) | | | (641,305 | ) | | | 1,109,438 | |
| | | | | | |
IRO USD 5 Year Swaption 3.25 | | Citibank N.A. | | | 7/16/2012 | | | | (99,100,000 | ) | | | (2,450,082 | ) | | | (1,380,988 | ) | | | 1,069,094 | |
| | | | | | |
IRO USD 10 Year Swaption 4.25 | | Morgan Stanley | | | 10/11/2011 | | | | (390,800,000 | ) | | | (1,985,259 | ) | | | (835,609 | ) | | | 1,149,650 | |
| | | | | | |
IRO USD 10 Year Swaption 10.0 | | Morgan Stanley | | | 7/10/2012 | | | | (40,200,000 | ) | | | (242,205 | ) | | | (575 | ) | | | 241,630 | |
| | | | | | | | | | | | | | | | | | | | | | |
| | | | | | |
| | | | | | | | | | | | $ | (17,464,963 | ) | | $ | (8,897,288 | ) | | $ | 8,567,675 | |
| | | | | | | | | | | | | | | | | | | | | | |
Exchange Traded
Options Written - Puts | | | | | | | | | | | | | | | | | |
| | | | | | |
CME APUT EUR 99.375 | | Merrill Lynch & Co., Inc. | | | 9/19/2011 | | | | (1,887 | ) | | $ | (1,175,285 | ) | | $ | (141,525 | ) | | $ | 1,033,760 | |
| | | | | | |
CME APUT EUR 99.0 | | Merrill Lynch & Co., Inc. | | | 3/19/2012 | | | | (1,330 | ) | | | (1,059,324 | ) | | | (182,875 | ) | | | 876,449 | |
| | | | | | |
U.S. Treasury Note 5 Year Futures | | Citibank N.A. | | | 7/22/2011 | | | | (882 | ) | | | (159,845 | ) | | | (186,047 | ) | | | (26,202 | ) |
| | | | | | |
U.S. Treasury Note 10 Year Futures | | Citibank N.A. | | | 7/22/2011 | | | | (190 | ) | | | (62,891 | ) | | | (92,031 | ) | | | (29,140 | ) |
| | | | | | | | | | | | | | | | | | | | | | |
| | | | | | |
| | | | | | | | | | | | $ | (2,457,345 | ) | | $ | (602,478 | ) | | $ | 1,854,867 | |
| | | | | | | | | | | | | | | | | | | | | | |
| | | | | | |
Total | | | | | | | | | | | | $ | (28,090,308 | ) | | $ | (20,065,777 | ) | | $ | 8,024,531 | |
| | | | | | | | | | | | | | | | | | | | | | |
The Portfolio transactions in options written during the period ended June 30, 2011 were as follows:
| | | | | | | | |
Call Options | | Number of
Contracts | | | Premium
received | |
| | |
Options outstanding December 31, 2010 | | | 736,201,887 | | | $ | 6,557,029 | |
| | |
Options written | | | 793,801,209 | | | | 3,633,970 | |
| | |
Options bought back | | | (1,887 | ) | | | (808,783 | ) |
| | |
Options expired | | | (438,600,000 | ) | | | (1,214,216 | ) |
| | | | | | | | |
| | |
Options outstanding June 30, 2011 | | | 1,091,401,209 | | | $ | 8,168,000 | |
| | | | | | | | |
51
MET INVESTORS SERIES TRUST
| | |
PIMCO Total Return Portfolio | | |
Notes to Financial Statements—June 30, 2011 (Unaudited)—(Continued)
8. Options written - continued
| | | | | | | | |
Put Options | | Number of
Contracts | | | Premium
received | |
| | |
Options outstanding December 31, 2010 | | | 1,882,301,887 | | | $ | 17,650,522 | |
| | |
Options written | | | 793,802,402 | | | | 5,168,124 | |
| | |
Options bought back | | | - | | | | - | |
| | |
Options expired | | | (488,900,000 | ) | | | (2,896,338 | ) |
| | | | | | | | |
| | |
Options outstanding June 30, 2011 | | | 2,187,204,289 | | | $ | 19,922,308 | |
| | | | | | | | |
9. Swap Agreements
Open interest rate swap agreements at June 30, 2011 were as follows:
| | | | | | | | | | | | | | | | | | | | | | | | | | | | | | |
Pay/
Receive
Floating
Rate | | Floating
Rate Index | | | Fixed
Rate | | | Maturity
Date | | | Counter
party | | Notional
Amount | | | Market
Value | | | Upfront
Premium
Paid/
(Received) | | | Unrealized
Appreciation/
(Depreciation) | |
| | | | | | | | |
Receive | | | IRS USD 3ML | | | | 3.500 | % | | | 6/15/2021 | | | Morgan
Stanley | | USD | 7,800,000 | | | $ | (159,316 | ) | | $ | 11,232 | | | $ | (170,548 | ) |
| | | | | | | | |
Receive | | | IRS USD 3ML | | | | 3.500 | % | | | 6/15/2021 | | | Deutsche Bank AG | | USD | 20,900,000 | | | | (426,885 | ) | | | 191,100 | | | | (617,985 | ) |
| | | | | | | | |
Receive | | | IRS USD 3ML | | | | 3.500 | % | | | 6/15/2021 | | | UBS AG | | USD | 28,000,000 | | | | (571,903 | ) | | | 375,622 | | | | (947,525 | ) |
| | | | | | | | |
Receive | | | IRS USD 3ML | | | | 3.500 | % | | | 6/15/2021 | | | JPMorgan
Chase Bank
N.A. | | USD | 36,800,000 | | | | (751,644 | ) | | | (49,872 | ) | | | (701,772 | ) |
| | | | | | | | |
Receive | | | IRS USD 3ML | | | | 3.500 | % | | | 6/15/2021 | | | Citibank N.A. | | USD | 90,300,000 | | | | (1,844,387 | ) | | | (69,376 | ) | | | (1,775,011 | ) |
| | | | | | | | |
Receive | | | IRS USD 3ML | | | | 4.250 | % | | | 6/15/2041 | | | Credit Suisse Group AG | | USD | 2,500,000 | | | | (79,040 | ) | | | 79,125 | | | | (158,165 | ) |
| | | | | | | | |
Receive | | | IRS USD 3ML | | | | 4.250 | % | | | 6/15/2041 | | | Barclays Bank plc | | USD | 7,000,000 | | | | (221,311 | ) | | | 157,500 | | | | (378,811 | ) |
| | | | | | | | |
Receive | | | IRS USD 3ML | | | | 4.250 | % | | | 6/15/2041 | | | Citibank N.A. | | USD | 12,700,000 | | | | (401,522 | ) | | | 460,060 | | | | (861,582 | ) |
| | | | | | | | |
Receive | | | IRS USD 3ML | | | | 4.250 | % | | | 6/15/2041 | | | Goldman Sachs & Co. | | USD | 15,800,000 | | | | (499,531 | ) | | | 440,080 | | | | (939,611 | ) |
| | | | | | | | |
Receive | | | IRS USD 3ML | | | | 4.250 | % | | | 6/15/2041 | | | Deutsche Bank AG | | USD | 19,800,000 | | | | (625,995 | ) | | | (734,580 | ) | | | 108,585 | |
| | | | | | | | |
Receive | | | IRS USD 3ML | | | | 4.250 | % | | | 6/15/2041 | | | JPMorgan
Chase Bank
N.A. | | USD | 24,200,000 | | | | (765,105 | ) | | | (618,798 | ) | | | (146,307 | ) |
| | | | | | | | |
Receive | | | IRS USD 3ML | | | | 4.250 | % | | | 6/15/2041 | | | BNP Paribas Bank | | USD | 63,300,000 | | | | (2,001,286 | ) | | | 1,691,040 | | | | (3,692,326 | ) |
| | | | | | | | |
Receive | | | IRS USD 3ML | | | | 4.250 | % | | | 6/15/2041 | | | UBS AG | | USD | 90,600,000 | | | | (2,864,401 | ) | | | 2,135,355 | | | | (4,999,756 | ) |
| | | | | | | | |
Receive | | | IRS USD 3ML | | | | 4.250 | % | | | 6/15/2041 | | | Morgan Stanley | | USD | 145,200,000 | | | | (4,590,629 | ) | | | 3,019,175 | | | | (7,609,804 | ) |
| | | | | | | | |
Receive | | | IRS USD 3ML | | | | 4.000 | % | | | 12/21/2041 | | | Deutsche Bank AG | | USD | 8,700,000 | | | | 268,727 | | | | (34,800 | ) | | | 303,527 | |
| | | | | | | | |
Receive | | | IRS USD 3ML | | | | 4.000 | % | | | 12/21/2041 | | | Morgan Stanley | | USD | 26,500,000 | | | | 807,182 | | | | 340,400 | | | | 466,782 | |
| | | | | | | | |
Receive | | | IRS USD 3ML | | | | 4.000 | % | | | 12/21/2041 | | | Citibank N.A. | | USD | 31,300,000 | | | | 966,801 | | | | 382,240 | | | | 584,561 | |
| | | | | | | | |
Pay | | | IRS EUR 6ME | | | | 3.500 | % | | | 9/21/2021 | | | Barclays Bank plc | | EUR | 39,400,000 | | | | (12,286 | ) | | | 512,035 | | | | (524,321 | ) |
| | | | | | | | |
Pay | | | IRS EUR 6ME | | | | 3.650 | % | | | 9/21/2021 | | | Citibank N.A. | | EUR | 11,000,000 | | | | 198,666 | | | | 13,581 | | | | 185,085 | |
| | | | | | | | |
Pay | | | IRS EUR 6ME | | | | 3.500 | % | | | 9/21/2021 | | | Deutsche Bank AG | | EUR | 17,100,000 | | | | (5,332 | ) | | | 205,430 | | | | (210,762 | ) |
| | | | | | | | |
Pay | | | IRS EUR 6ME | | | | 3.500 | % | | | 9/21/2021 | | | Goldman Sachs & Co. | | EUR | 64,900,000 | | | | (20,237 | ) | | | (724,545 | ) | | | 704,308 | |
| | | | | | | | |
Pay | | | IRS EUR 6ME | | | | 3.500 | % | | | 9/21/2021 | | | Morgan Stanley | | EUR | 28,000,000 | | | | (8,731 | ) | | | (214,741 | ) | | | 206,010 | |
| | | | | | | | |
Pay | | | IRS EUR 6ME | | | | 3.650 | % | | | 9/21/2021 | | | Morgan Stanley | | EUR | 28,800,000 | | | | 520,145 | | | | 141,911 | | | | 378,234 | |
| | | | | | | | |
Pay | | | IRS MXN TIIE | | | | 6.500 | % | | | 3/5/2013 | | | Morgan Stanley | | MXN | 37,200,000 | | | | 25,845 | | | | (1,452 | ) | | | 27,297 | |
| | | | | | | | |
Pay | | | IRS MXN TIIE | | | | 7.330 | % | | | 1/28/2015 | | | JPMorgan Chase Bank N.A. | | MXN | 97,200,000 | | | | 352,018 | | | | (5,572 | ) | | | 357,590 | |
| | | | | | | | |
Pay | | | IRS MXN TIIE | | | | 7.330 | % | | | 1/28/2015 | | | Citibank N.A. | | MXN | 215,600,000 | | | | 780,813 | | | | 100,718 | | | | 680,095 | |
| | | | | | | | |
Pay | | | ZCS BRL CDI | | | | 10.835 | % | | | 1/2/2012 | | | Goldman Sachs & Co. | | BRL | 27,600,000 | | | | 229,257 | | | | 26,466 | | | | 202,791 | |
| | | | | | | | |
Pay | | | ZCS BRL CDI | | | | 10.990 | % | | | 1/2/2012 | | | Goldman Sachs & Co. | | BRL | 42,300,000 | | | | 326,396 | | | | 69,702 | | | | 256,694 | |
52
MET INVESTORS SERIES TRUST
| | |
PIMCO Total Return Portfolio | | |
Notes to Financial Statements—June 30, 2011 (Unaudited)—(Continued)
9. Swap Agreements - continued
| | | | | | | | | | | | | | | | | | | | | | | | | | | | | | |
Pay/
Receive
Floating
Rate | | Floating
Rate Index | | | Fixed
Rate | | | Maturity
Date | | | Counter
party | | Notional
Amount | | | Market
Value | | | Upfront
Premium
Paid/
(Received) | | | Unrealized
Appreciation/
(Depreciation) | |
| | | | | | | | |
Pay | | | ZCS BRL CDI | | | | 12.540 | % | | | 1/2/2012 | | | Merrill Lynch & Co., Inc. | | BRL | 80,800,000 | | | $ | 4,273,855 | | | $ | (443,165 | ) | | $ | 4,717,020 | |
| | | | | | | | |
Pay | | | ZCS BRL CDI | | | | 12.540 | % | | | 1/2/2012 | | | Morgan Stanley | | BRL | 90,500,000 | | | | 4,786,929 | | | | (503,219 | ) | | | 5,290,148 | |
| | | | | | | | |
Pay | | | ZCS BRL CDI | | | | 11.630 | % | | | 1/2/2012 | | | Morgan Stanley | | BRL | 105,400,000 | | | | 503,343 | | | | (42,617 | ) | | | 545,960 | |
| | | | | | | | |
Pay | | | ZCS BRL CDI | | | | 10.115 | % | | | 1/2/2012 | | | Morgan Stanley | | BRL | 295,300,000 | | | | (11,278,498 | ) | | | (7,355,900 | ) | | | (3,922,598 | ) |
| | | | | | | | |
Pay | | | ZCS BRL CDI | | | | 11.980 | % | | | 1/2/2013 | | | Morgan Stanley | | BRL | 31,600,000 | | | | 204,911 | | | | 49,229 | | | | 155,682 | |
| | | | | | | | |
Pay | | | ZCS BRL CDI | | | | 12.170 | % | | | 1/2/2013 | | | JPMorgan Chase Bank N.A. | | BRL | 43,900,000 | | | | 482,662 | | | | 158,550 | | | | 324,112 | |
| | | | | | | | |
Pay | | | ZCS BRL CDI | | | | 11.890 | % | | | 1/2/2013 | | | Goldman Sachs & Co. | | BRL | 52,700,000 | | | | 265,583 | | | | 47,758 | | | | 217,825 | |
| | | | | | | | |
Pay | | | ZCS BRL CDI | | | | 11.930 | % | | | 1/2/2013 | | | Goldman Sachs & Co. | | BRL | 63,700,000 | | | | 341,019 | | | | (91,373 | ) | | | 432,392 | |
| | | | | | | | |
Pay | | | ZCS BRL CDI | | | | 12.070 | % | | | 1/2/2013 | | | JPMorgan
Chase
Bank
N.A. | | BRL | 64,200,000 | | | | 122,913 | | | | 150,874 | | | | (27,961 | ) |
| | | | | | | | |
Pay | | | ZCS BRL CDI | | | | 12.590 | % | | | 1/2/2013 | | | Morgan Stanley | | BRL | 321,000,000 | | | | 3,815,653 | | | | 289,533 | | | | 3,526,120 | |
| | | | | | | | |
Pay | | | ZCS BRL CDI | | | | 12.510 | % | | | 1/2/2014 | | | Morgan Stanley | | BRL | 3,400,000 | | | | 59,564 | | | | 15,642 | | | | 43,922 | |
| | | | | | | | |
Pay | | | ZCS BRL CDI | | | | 11.990 | % | | | 1/2/2014 | | | Barclays Bank plc | | BRL | 19,400,000 | | | | 26,759 | | | | 86,039 | | | | (59,280 | ) |
| | | | | | | | |
Pay | | | ZCS BRL CDI | | | | 12.650 | % | | | 1/2/2014 | | | Goldman Sachs & Co. | | BRL | 23,900,000 | | | | 509,844 | | | | 192,551 | | | | 317,293 | |
| | | | | | | | |
Pay | | | ZCS BRL CDI | | | | 11.890 | % | | | 1/2/2014 | | | Morgan Stanley | | BRL | 38,000,000 | | | | (213,380 | ) | | | (3,526 | ) | | | (209,854 | ) |
| | | | | | | | | | | | | | | | | | | | | | | | | | | | | | |
Total | | | | | | | | | | | | | | | | | | | | $ | (7,472,534 | ) | | $ | 449,412 | | | $ | (7,921,946 | ) |
| | | | | | | | | | | | | | | | | | | | | | | | | | | | | | |
Credit Default Swaps on Corporate and Sovereign Issuers - Buy Protection (a)
| | | | | | | | | | | | | | | | | | | | | | | | | | | | | | |
Reference Obligation | | Fixed
Deal
(Pay) Rate | | | Maturity
Date | | | Counterparty | | Implied
Credit
Spread at
June 30,
2011 (b) | | | Notional
Amount (c) | | | Market
Value | | | Upfront
Premium
Paid/(Received) | | | Unrealized
Appreciation/
(Depreciation) | |
| | | | | | | | |
CNA Financial Corp. 5.850%, due
12/15/2014 | | | (0.630 | %) | | | 12/20/2014 | | | Bank of America N.A. | | | 1.092 | % | | | 5,000,000 | | | $ | 78,321 | | | $ | — | | | $ | 78,321 | |
| | | | | | | | |
Con-way, Inc. 7.250%, due 01/15/2018 | | | (1.834 | %) | | | 3/20/2018 | | | Bank of America N.A. | | | 2.281 | % | | | 10,000,000 | | | | 262,952 | | | | — | | | | 262,952 | |
| | | | | | | | |
Health Care Property Investors, Inc. 5.950%, due
09/15/2011 | | | (0.460 | %) | | | 9/20/2011 | | | JPMorgan
Chase
Bank N.A. | | | 0.318 | % | | | 3,600,000 | | | | (1,163 | ) | | | — | | | | (1,163 | ) |
| | | | | | | | |
Liberty Mutual Group, Inc. 5.750%, due 03/15/2014 | | | (0.680 | %) | | | 3/20/2014 | | | Bank of America N.A. | | | 1.388 | % | | | 5,750,000 | | | | 108,485 | | | | — | | | | 108,485 | |
| | | | | | | | |
Limited Brands, Inc. 6.900%, due 07/15/2017 | | | (3.113 | %) | | | 9/20/2017 | | | Morgan Stanley | | | 2.493 | % | | | 5,000,000 | | | | (169,698 | ) | | | — | | | | (169,698 | ) |
| | | | | | | | |
Pearson Dollar Finance plc 5.700%, due 06/01/2014 | | | (0.760 | %) | | | 6/20/2014 | | | Morgan Stanley | | | 0.443 | % | | | 8,500,000 | | | | (79,623 | ) | | | — | | | | (79,623 | ) |
| | | | | | | | |
Pearson Dollar Finance plc 5.700%, due 06/01/2014 | | | (0.830 | %) | | | 6/20/2014 | | | JPMorgan Chase Bank N.A. | | | 0.443 | % | | | 5,000,000 | | | | (57,188 | ) | | | — | | | | (57,188 | ) |
| | | | | | | | |
R.R. Donnelley
& Sons Co. 4.950%, due 04/01/2014 | | | (1.030 | %) | | | 6/20/2014 | | | Bank of America N.A. | | | 2.101 | % | | | 6,200,000 | | | | 191,018 | | | | — | | | | 191,018 | |
| | | | | | | | |
Rohm & Haas Holdings 6.000%, due 09/15/2017 | | | (0.423 | %) | | | 9/20/2017 | | | Bank of America N.A. | | | 0.459 | % | | | 8,500,000 | | | | 17,936 | | | | — | | | | 17,936 | |
| | | | | | | | | | | | | | | | | | | | | | | | | | | | | | |
| | | | | | | | |
Total | | | | | | | | | | | | | | | | | | | | $ | 351,040 | | | $ | — | | | $ | 351,040 | |
| | | | | | | | | | | | | | | | | | | | | | | | | | | | | | |
53
MET INVESTORS SERIES TRUST
| | |
PIMCO Total Return Portfolio | | |
Notes to Financial Statements—June 30, 2011 (Unaudited)—(Continued)
9. Swap Agreements - continued
Credit Default Swaps on Corporate and Sovereign Issues - Sell Protection (d)
| | | | | | | | | | | | | | | | | | | | | | | | | | | | | | |
Reference Obligation | | Fixed Deal
(Pay) Rate | | | Maturity
Date | | | Counterparty | | Implied Credit
Spread at
June 30, 2011(b) | | | Notional
Amount(c) | | | Market
Value | | | Upfront
Premium
Paid/(Received) | | | Unrealized
Appreciation/
(Depreciation) | |
| | | | | | | | |
ArcelorMittal 6.125%, due 06/01/2018 | | | 1.000 | % | | | 6/20/2016 | | | Credit Suisse Group AG | | | 2.236 | % | | | 4,400,000 | | | $ | (246,861 | ) | | $ | (221,992 | ) | | $ | (24,869 | ) |
| | | | | | | | |
Berkshire Hathaway Finance Corp. 4.625%, due 10/15/2013 | | | 1.000 | % | | | 3/20/2015 | | | Goldman Sachs & Co. | | | 0.816 | % | | | 3,100,000 | | | | 20,800 | | | | (54,777 | ) | | | 75,577 | |
| | | | | | | | |
Berkshire Hathaway Finance Corp. 4.625%, due 10/15/2013 | | | 1.000 | % | | | 3/20/2016 | | | Citibank N.A. | | | 1.043 | % | | | 900,000 | | | | (1,756 | ) | | | (10,165 | ) | | | 8,409 | |
| | | | | | | | |
Brazilian Government International Bond 12.250%, due 03/06/2030 | | | 1.000 | % | | | 6/20/2015 | | | Citibank N.A. | | | 0.938 | % | | | 11,700,000 | | | | 27,916 | | | | (327,293 | ) | | | 355,209 | |
| | | | | | | | |
Brazilian Government International Bond 12.250%, due 03/06/2030 | | | 1.000 | % | | | 6/20/2015 | | | Deutsche Bank AG | | | 0.938 | % | | | 6,100,000 | | | | 14,554 | | | | (66,949 | ) | | | 81,503 | |
| | | | | | | | |
Brazilian Government International Bond 12.250%, due 03/06/2030 | | | 1.000 | % | | | 6/20/2015 | | | JPMorgan Chase Bank N.A. | | | 0.938 | % | | | 12,700,000 | | | | 30,302 | | | | (139,386 | ) | | | 169,688 | |
| | | | | | | | |
Brazilian Government International Bond 12.250%, due 03/06/2030 | | | 1.000 | % | | | 9/20/2015 | | | Citibank N.A. | | | 0.964 | % | | | 1,200,000 | | | | 1,765 | | | | (18,832 | ) | | | 20,597 | |
| | | | | | | | |
Brazilian Government International Bond 12.250%, due 03/06/2030 | | | 1.000 | % | | | 9/20/2015 | | | JPMorgan Chase Bank N.A. | | | 0.964 | % | | | 4,100,000 | | | | 6,030 | | | | (41,229 | ) | | | 47,259 | |
| | | | | | | | |
Brazilian Government International Bond 12.250%, due 03/06/2030 | | | 1.000 | % | | | 9/20/2015 | | | UBS AG | | | 0.964 | % | | | 1,600,000 | | | | 2,353 | | | | (15,139 | ) | | | 17,492 | |
| | | | | | | | |
Brazilian Government International Bond 12.250%, due 03/06/2030 | | | 1.000 | % | | | 12/20/2015 | | | Morgan Stanley | | | 1.006 | % | | | 37,100,000 | | | | (9,285 | ) | | | (214,047 | ) | | | 204,762 | |
| | | | | | | | |
Brazilian Government International Bond 12.250%, due 03/06/2030 | | | 1.000 | % | | | 3/20/2016 | | | Deutsche Bank AG | | | 1.043 | % | | | 25,000,000 | | | | (48,862 | ) | | | (146,458 | ) | | | 97,596 | |
| | | | | | | | |
Brazilian Government International Bond 12.250%, due 03/06/2030 | | | 1.000 | % | | | 3/20/2016 | | | Morgan Stanley | | | 1.043 | % | | | 25,000,000 | | | | (48,862 | ) | | | (146,458 | ) | | | 97,596 | |
| | | | | | | | |
Brazilian Government International Bond 12.250%, due 03/06/2030 | | | 1.000 | % | | | 6/20/2016 | | | Citibank N.A. | | | 1.077 | % | | | 19,300,000 | | | | (70,459 | ) | | | (65,160 | ) | | | (5,299 | ) |
| | | | | | | | |
Brazilian Government International Bond 12.250%, due 03/06/2030 | | | 1.000 | % | | | 6/20/2016 | | | Deutsche Bank AG | | | 1.077 | % | | | 11,000,000 | | | | (40,159 | ) | | | (36,869 | ) | | | (3,290 | ) |
| | | | | | | | |
China Government International Bond 4.750%, due 10/29/2013 | | | 1.000 | % | | | 3/20/2015 | | | Deutsche Bank AG | | | 0.654 | % | | | 15,000,000 | | | | 189,434 | | | | 85,576 | | | | 103,858 | |
| | | | | | | | |
China Government International Bond 4.750%, due 10/29/2013 | | | 1.000 | % | | | 3/20/2016 | | | Barclays Bank plc | | | 0.783 | % | | | 1,200,000 | | | | 11,872 | | | | 14,340 | | | | (2,468 | ) |
| | | | | | | | |
China Government International Bond 4.750%, due 10/29/2013 | | | 1.000 | % | | | 3/20/2016 | | | BNP Paribas Bank | | | 0.783 | % | | | 600,000 | | | | 5,936 | | | | 7,258 | | | | (1,322 | ) |
54
MET INVESTORS SERIES TRUST
| | |
PIMCO Total Return Portfolio | | |
Notes to Financial Statements—June 30, 2011 (Unaudited)—(Continued)
9. Swap Agreements - continued
| | | | | | | | | | | | | | | | | | | | | | | | | | | | | | |
Reference Obligation | | Fixed Deal
(Pay) Rate | | | Maturity
Date | | | Counterparty | | Implied Credit
Spread at
June 30, 2011(b) | | | Notional
Amount(c) | | | Market
Value | | | Upfront
Premium
Paid/(Received) | | | Unrealized
Appreciation/
(Depreciation) | |
| | | | | | | | |
China Government International Bond 4.750%, due 10/29/2013 | | | 1.000 | % | | | 6/20/2016 | | | Citibank N.A. | | | 0.813 | % | | | 13,400,000 | | | $ | 119,717 | | | $ | 141,012 | | | $ | (21,295) | |
| | | | | | | | |
China Government International Bond 4.750%, due 10/29/2013 | | | 1.000 | % | | | 6/20/2016 | | | Deutsche Bank AG | | | 0.813 | % | | | 3,600,000 | | | | 32,163 | | | | 34,343 | | | | (2,180) | |
| | | | | | | | |
China Government International Bond 4.750%, due 10/29/2013 | | | 1.000 | % | | | 6/20/2016 | | | JPMorgan Chase Bank N.A. | | | 0.813 | % | | | 11,700,000 | | | | 104,529 | | | | 125,946 | | | | (21,417) | |
| | | | | | | | |
China Government International Bond 4.750%, due 10/29/2013 | | | 1.000 | % | | | 9/20/2016 | | | Deutsche Bank AG | | | 0.840 | % | | | 2,200,000 | | | | 17,577 | | | | 12,154 | | | | 5,423 | |
| | | | | | | | |
China Government International Bond 4.750%, due 10/29/2013 | | | 1.000 | % | | | 9/20/2016 | | | JPMorgan Chase Bank N.A. | | | 0.840 | % | | | 1,500,000 | | | | 11,984 | | | | 8,160 | | | | 3,824 | |
| | | | | | | | |
China Government International Bond 4.750%, due 10/29/2013 | | | 1.000 | % | | | 9/20/2016 | | | Morgan Stanley | | | 0.840 | % | | | 1,500,000 | | | | 11,984 | | | | 7,415 | | | | 4,569 | |
| | | | | | | | |
China Government International Bond 4.750%, due 10/29/2013 | | | 1.000 | % | | | 9/20/2016 | | | UBS AG | | | 0.840 | % | | | 700,000 | | | | 5,592 | | | | 3,634 | | | | 1,958 | |
| | | | | | | | |
Egypt Government International Bond 5.750%, due 04/29/2020 | | | 1.000 | % | | | 3/20/2016 | | | Deutsche Bank AG | | | 3.053 | % | | | 18,400,000 | | | | (1,614,013) | | | | (1,946,383) | | | | 332,370 | |
| | | | | | | | |
Egypt Government International Bond 5.750%, due 04/29/2020 | | | 1.000 | % | | | 3/20/2016 | | | JPMorgan Chase Bank N.A. | | | 3.053 | % | | | 3,600,000 | | | | (315,785) | | | | (443,014) | | | | 127,229 | |
| | | | | | | | |
General Electric Capital Corp 5.625%, due 09/15/2017 | | | 4.000 | % | | | 12/20/2013 | | | Citibank N.A. | | | 0.789 | % | | | 3,600,000 | | | | 284,434 | | | | — | | | | 284,434 | |
| | | | | | | | |
General Electric Capital Corp. 5.625%, due 09/15/2017 | | | 4.000 | % | | | 12/20/2013 | | | Citibank N.A. | | | 0.789 | % | | | 20,800,000 | | | | 1,643,394 | | | | — | | | | 1,643,394 | |
| | | | | | | | |
General Electric Capital Corp. 5.625%, due 09/15/2017 | | | 6.950 | % | | | 3/20/2013 | | | Citibank N.A. | | | 0.606 | % | | | 375,000 | | | | 41,117 | | | | — | | | | 41,117 | |
| | | | | | | | |
General Electric Capital Corp. 5.625%, due 9/15/2017 | | | 4.850 | % | | | 12/20/2013 | | | Citibank N.A. | | | 0.789 | % | | | 9,100,000 | | | | 909,309 | | | | — | | | | 909,309 | |
| | | | | | | | |
General Electric Capital Corp. 5.625%, due 09/15/2017 | | | 4.325 | % | | | 12/20/2013 | | | Citibank N.A. | | | 0.789 | % | | | 10,200,000 | | | | 887,463 | | | | — | | | | 887,463 | |
| | | | | | | | |
General Electric Capital Corp. 5.625%, due 09/15/2017 | | | 4.200 | % | | | 12/20/2013 | | | Citibank N.A. | | | 0.789 | % | | | 21,900,000 | | | | 1,838,077 | | | | — | | | | 1,838,077 | |
| | | | | | | | |
General Electric Capital Corp. 5.625%, due 09/15/2017 | | | 4.875 | % | | | 12/20/2013 | | | Citibank N.A. | | | 0.789 | % | | | 3,100,000 | | | | 311,672 | | | | — | | | | 311,672 | |
| | | | | | | | |
General Electric Capital Corp. 5.625%, due 09/15/2017 | | | 1.000 | % | | | 12/20/2015 | | | Morgan Stanley | | | 1.207 | % | | | 13,500,000 | | | | (119,723) | | | | (264,491) | | | | 144,768 | |
| | | | | | | | |
Government of France 4.250%, due 04/25/2019 | | | 0.250 | % | | | 9/20/2015 | | | UBS AG | | | 0.656 | % | | | 5,000,000 | | | | (83,581) | | | | (132,503) | | | | 48,922 | |
| | | | | | | | |
Government of France 4.250%, due 04/25/2019 | | | 0.250 | % | | | 12/20/2015 | | | Goldman Sachs & Co. | | | 0.700 | % | | | 3,700,000 | | | | (72,171) | | | | (72,557) | | | | 386 | |
55
MET INVESTORS SERIES TRUST
| | |
PIMCO Total Return Portfolio | | |
Notes to Financial Statements—June 30, 2011 (Unaudited)—(Continued)
9. Swap Agreements - continued
| | | | | | | | | | | | | | | | | | | | | | | | | | | | | | |
Reference Obligation | | Fixed Deal
(Pay) Rate | | | Maturity
Date | | | Counterparty | | Implied Credit
Spread at
June 30, 2011(b) | | | Notional
Amount(c) | | | Market
Value | | | Upfront
Premium
Paid/(Received) | | | Unrealized
Appreciation/
(Depreciation) | |
| | | | | | | | |
Government of France 4.250%, due 04/25/2019 | | | 0.250 | % | | | 3/20/2016 | | | Deutsche Bank AG | | | 0.739 | % | | | 7,200,000 | | | $ | (160,265 | ) | | $ | (291,432 | ) | | $ | 131,167 | |
| | | | | | | | |
Government of France 4.250%, due 04/25/2019 | | | 0.250 | % | | | 3/20/2016 | | | Morgan Stanley | | | 0.739 | % | | | 1,600,000 | | | | (35,614 | ) | | | (54,485 | ) | | | 18,871 | |
| | | | | | | | |
Government of France 4.250%, due 04/25/2019 | | | 0.250 | % | | | 3/20/2016 | | | UBS AG | | | 0.739 | % | | | 2,500,000 | | | | (55,648 | ) | | | (101,149 | ) | | | 45,501 | |
| | | | | | | | |
Government of France 4.250%, due 04/25/2019 | | | 0.250 | % | | | 6/20/2016 | | | Goldman Sachs & Co. | | | 0.774 | % | | | 26,100,000 | | | | (652,441 | ) | | | (681,657 | ) | | | 29,216 | |
| | | | | | | | |
Government of South Korea 4.875%, due 09/22/2014 | | | 1.000 | % | | | 6/20/2016 | | | Deutsche Bank AG | | | 0.973 | % | | | 3,100,000 | | | | 3,923 | | | | 1,476 | | | | 2,447 | |
| | | | | | | | |
Government of South Korea 4.875%, due 09/22/2014 | | | 1.000 | % | | | 6/20/2016 | | | Deutsche Bank AG | | | 0.973 | % | | | 2,000,000 | | | | 2,532 | | | | 1,429 | | | | 1,103 | |
| | | | | | | | |
Japanese Government Bond 2.000%, due 03/21/2022 | | | 1.000 | % | | | 12/20/2015 | | | Goldman Sachs & Co. | | | 0.792 | % | | | 6,700,000 | | | | 60,274 | | | | 163,889 | | | | (103,615 | ) |
| | | | | | | | |
Japanese Government Bond 2.000%, due 03/21/2022 | | | 1.000 | % | | | 3/20/2016 | | | JPMorgan Chase Bank N.A. | | | 0.832 | % | | | 4,300,000 | | | | 32,964 | | | | 37,798 | | | | (4,834 | ) |
| | | | | | | | |
Limited Brands, Inc. 6.900%, due 07/15/2017 | | | 2.290 | % | | | 9/20/2017 | | | Bank of America N.A. | | | 2.493 | % | | | 10,000,000 | | | | 111,465 | | | | — | | | | 111,465 | |
| | | | | | | | |
Merrill Lynch & Co., Inc. 5.000%, due 01/15/2015 | | | 1.000 | % | | | 9/20/2011 | | | Citibank N.A. | | | 0.422 | % | | | 700,000 | | | | 921 | | | | (1,243 | ) | | | 2,164 | |
| | | | | | | | |
Merrill Lynch & Co., Inc. 5.000%, due 01/15/2015 | | | 1.000 | % | | | 9/20/2011 | | | JPMorgan Chase Bank N.A. | | | 0.422 | % | | | 2,700,000 | | | | 3,553 | | | | (3,197 | ) | | | 6,750 | |
| | | | | | | | |
Mexico Government
International Bond 7.500%, due 04/08/2033 | | | 1.000 | % | | | 3/20/2015 | | | Citibank N.A. | | | 0.885 | % | | | 4,300,000 | | | | 17,978 | | | | (98,727 | ) | | | 116,705 | |
| | | | | | | | |
Mexico Government
International Bond 7.500%, due 04/08/2033 | | | 1.000 | % | | | 3/20/2015 | | | Deutsche Bank AG | | | 0.885 | % | | | 6,400,000 | | | | 26,757 | | | | (146,943 | ) | | | 173,700 | |
| | | | | | | | |
Mexico Government
International Bond 7.500%, due 04/08/2033 | | | 1.000 | % | | | 9/20/2015 | | | Citibank N.A. | | | 0.943 | % | | | 1,900,000 | | | | 4,456 | | | | (28,651 | ) | | | 33,107 | |
| | | | | | | | |
Mexico Government
International Bond 7.500%, due 04/08/2033 | | | 1.000 | % | | | 9/20/2015 | | | UBS AG | | | 0.943 | % | | | 600,000 | | | | 1,407 | | | | (8,488 | ) | | | 9,895 | |
| | | | | | | | |
Mexico Government
International Bond 7.500%, due 04/08/2033 | | | 1.000 | % | | | 3/20/2016 | | | Barclays Bank plc | | | 1.012 | % | | | 31,800,000 | | | | (17,891 | ) | | | (244,359 | ) | | | 226,468 | |
| | | | | | | | |
Mexico Government
International Bond 7.500%, due 04/08/2033 | | | 1.000 | % | | | 3/20/2016 | | | Deutsche Bank AG | | | 1.012 | % | | | 20,600,000 | | | | (11,590 | ) | | | (151,130 | ) | | | 139,540 | |
| | | | | | | | |
Mexico Government
International Bond 7.500%, due 04/08/2033 | | | 1.000 | % | | | 6/20/2016 | | | Citibank N.A. | | | 1.042 | % | | | 10,000,000 | | | | (20,027 | ) | | | (21,564 | ) | | | 1,537 | |
| | | | | | | | |
Mexico Government
International Bond 7.500%, due 04/08/2033 | | | 1.000 | % | | | 3/20/2021 | | | Barclays Bank plc | | | 1.401 | % | | | 24,600,000 | | | | (806,994 | ) | | | (1,177,460 | ) | | | 370,466 | |
| | | | | | | | |
Republic of Indonesia 6.750%, due 03/10/2014 | | | 1.000 | % | | | 9/20/2015 | | | Citibank N.A. | | | 1.144 | % | | | 1,400,000 | | | | (8,241 | ) | | | (31,728 | ) | | | 23,487 | |
| | | | | | | | |
Republic of Indonesia 7.250%, due 04/20/2015 | | | 1.000 | % | | | 6/20/2016 | | | Barclays Bank plc | | | 1.329 | % | | | 5,000,000 | | | | (77,515 | ) | | | (78,629 | ) | | | 1,114 | |
| | | | | | | | |
Republic of Indonesia 7.250%, due 04/20/2015 | | | 1.000 | % | | | 6/20/2016 | | | Barclays Bank plc | | | 1.329 | % | | | 5,600,000 | | | | (86,816 | ) | | | (89,360 | ) | | | 2,544 | |
56
MET INVESTORS SERIES TRUST
| | |
PIMCO Total Return Portfolio | | |
Notes to Financial Statements—June 30, 2011 (Unaudited)—(Continued)
9. Swap Agreements - continued
| | | | | | | | | | | | | | | | | | | | | | | | | | | | | | |
Reference Obligation | | Fixed Deal
(Pay) Rate | | | Maturity
Date | | | Counterparty | | Implied Credit
Spread at
June 30, 2011(b) | | | Notional
Amount(c) | | | Market
Value | | | Upfront
Premium
Paid/(Received) | | | Unrealized
Appreciation/
(Depreciation) | |
| | | | | | | | |
Republic of Indonesia 6.750%, due 03/10/2014 | | | 1.000 | % | | | 6/20/2016 | | | Citibank N.A. | | | 1.329 | % | | | 4,200,000 | | | $ | (65,113 | ) | | $ | (77,852 | ) | | $ | 12,739 | |
| | | | | | | | |
Republic of Indonesia 6.750%, due 03/10/2014 | | | 1.000 | % | | | 6/20/2016 | | | Citibank N.A. | | | 1.329 | % | | | 1,700,000 | | | | (26,355 | ) | | | (32,306 | ) | | | 5,951 | |
| | | | | | | | |
Republic of Indonesia 7.250%, due 04/20/2015 | | | 1.000 | % | | | 6/20/2021 | | | Citibank N.A. | | | 1.820 | % | | | 3,400,000 | | | | (225,720 | ) | | | (243,711 | ) | | | 17,991 | |
| | | | | | | | |
Republic of Indonesia 6.750%, due 03/10/2014 | | | 1.000 | % | | | 6/20/2021 | | | UBS AG | | | 1.820 | % | | | 1,700,000 | | | | (112,860 | ) | | | (124,288 | ) | | | 11,428 | |
| | | | | | | | |
Republic of Italy 6.875%, due 09/27/2023 | | | 1.000 | % | | | 3/20/2016 | | | Barclays Bank plc | | | 1.661 | % | | | 4,000,000 | | | | (116,352 | ) | | | (155,679 | ) | | | 39,327 | |
| | | | | | | | |
Republic of Italy 6.875%, due 09/27/2023 | | | 1.000 | % | | | 3/20/2016 | | | Barclays Bank plc | | | 1.661 | % | | | 8,300,000 | | | | (241,431 | ) | | | (271,979 | ) | | | 30,548 | |
| | | | | | | | |
Republic of Italy 6.875%, due 09/27/2023 | | | 1.000 | % | | | 3/20/2016 | | | Goldman Sachs & Co. | | | 1.661 | % | | | 1,300,000 | | | | (37,814 | ) | | | (50,014 | ) | | | 12,200 | |
| | | | | | | | |
Republic of Italy 6.875%, due 09/27/2023 | | | 1.000 | % | | | 3/20/2016 | | | Goldman Sachs & Co. | | | 1.661 | % | | | 20,600,000 | | | | (599,215 | ) | | | (746,548 | ) | | | 147,333 | |
| | | | | | | | |
Republic of Italy 6.875%, due 09/27/2023 | | | 1.000 | % | | | 3/20/2016 | | | Goldman Sachs & Co. | | | 1.661 | % | | | 24,500,000 | | | | (712,657 | ) | | | (813,650 | ) | | | 100,993 | |
| | | | | | | | |
Republic of Italy 6.875%, due 09/27/2023 | | | 1.000 | % | | | 6/20/2016 | | | Deutsche Bank AG | | | 1.688 | % | | | 7,900,000 | | | | (250,218 | ) | | | (203,582 | ) | | | (46,636 | ) |
| | | | | | | | |
Republic of Italy 6.875%, due 09/27/2023 | | | 1.000 | % | | | 6/20/2016 | | | Goldman Sachs & Co. | | | 1.688 | % | | | 3,000,000 | | | | (95,019 | ) | | | (59,111 | ) | | | (35,908 | ) |
| | | | | | | | |
Republic of Kazakhstan | | | 1.000 | % | | | 3/20/2016 | | | Citibank N.A. | | | 1.504 | % | | | 1,200,000 | | | | (27,259 | ) | | | (34,632 | ) | | | 7,373 | |
| | | | | | | | |
Republic of Kazakhstan | | | 1.000 | % | | | 3/20/2016 | | | Deutsche Bank AG | | | 1.504 | % | | | 1,200,000 | | | | (27,259 | ) | | | (36,299 | ) | | | 9,040 | |
| | | | | | | | |
Spanish Government Bond 5.500%, due 07/30/2017 | | | 1.000 | % | | | 3/20/2016 | | | Goldman Sachs & Co. | | | 2.571 | % | | | 26,400,000 | | | | (1,760,627 | ) | | | (1,632,936 | ) | | | (127,691 | ) |
| | | | | | | | |
Spanish Government Bond 5.500%, due 07/30/2017 | | | 1.000 | % | | | 3/20/2016 | | | Goldman Sachs & Co. | | | 2.571 | % | | | 2,800,000 | | | | (186,734 | ) | | | (186,074 | ) | | | (660 | ) |
| | | | | | | | |
Spanish Government Bond 5.500%, due 07/30/2017 | | | 1.000 | % | | | 3/20/2016 | | | Goldman Sachs & Co. | | | 2.571 | % | | | 15,300,000 | | | | (1,020,364 | ) | | | (929,289 | ) | | | (91,075 | ) |
| | | | | | | | |
Spanish Government Bond 5.500%, due 07/30/2017 | | | 1.000 | % | | | 3/20/2016 | | | Morgan Stanley | | | 2.571 | % | | | 8,200,000 | | | | (546,861 | ) | | | (494,613 | ) | | | (52,248 | ) |
| | | | | | | | |
Spanish Government Bond 5.500%, due 07/30/2017 | | | 1.000 | % | | | 6/20/2016 | | | Citibank N.A. | | | 2.589 | % | | | 10,500,000 | | | | (739,325 | ) | | | (727,340 | ) | | | (11,985 | ) |
| | | | | | | | |
United Kingdom Gilt 4.250%, due 06/07/2032 | | | 1.000 | % | | | 3/20/2015 | | | JPMorgan Chase Bank N.A. | | | 0.451 | % | | | 2,900,000 | | | | 58,327 | | | | 12,266 | | | | 46,061 | |
| | | | | | | | |
United Kingdom Gilt 4.250%, due 06/07/2032 | | | 1.000 | % | | | 3/20/2015 | | | JPMorgan Chase Bank N.A. | | | 0.451 | % | | | 1,500,000 | | | | 30,169 | | | | 7,052 | | | | 23,117 | |
| | | | | | | | |
United Kingdom Gilt 4.250%, due 06/07/2032 | | | 1.000 | % | | | 6/20/2015 | | | Goldman Sachs & Co. | | | 0.478 | % | | | 35,400,000 | | | | 720,401 | | | | 327,080 | | | | 393,321 | |
| | | | | | | | |
United Kingdom Gilt 4.250%, due 06/07/2032 | | | 1.000 | % | | | 12/20/2015 | | | Goldman Sachs & Co. | | | 0.534 | % | | | 2,400,000 | | | | 48,670 | | | | 55,666 | | | | (6,996 | ) |
| | | | | | | | |
United Kingdom Gilt 4.250%, due 06/07/2032 | | | 1.000 | % | | | 3/20/2016 | | | Credit Suisse Group AG | | | 0.563 | % | | | 2,500,000 | | | | 49,929 | | | | 48,244 | | | | 1,685 | |
| | | | | | | | |
U.S. Treasury Note 4.875%, due 8/15/2016 | | | 0.250 | % | | | 9/20/2015 | | | UBS AG | | | 0.449 | % | | | 31,800,000 | | | | (368,403 | ) | | | (477,132 | ) | | | 108,729 | |
| | | | | | | | |
United Kingdom Gilt 4.250% due 06/07/2032 | | | 1.000 | % | | | 6/20/2016 | | | UBS AG | | | 0.590 | % | | | 5,500,000 | | | | 108,155 | | | | 95,155 | | | | 13,000 | |
| | | | | | | | |
U.S. Treasury Note 4.875%, due 08/15/2016 | | | 0.250 | % | | | 3/20/2016 | | | BNP Paribas Bank | | | 0.484 | % | | | 21,500,000 | | | | (324,305 | ) | | | (303,267 | ) | | | (21,038 | ) |
| | | | | | | | | | | | | | | | | | | | | | | | | | | | | | |
| | | | | | | | |
Total | | | | | | | | | | | | | | | | | | | | $ | (4,276,595 | ) | | $ | (13,984,313 | ) | | $ | 9,707,718 | |
| | | | | | | | | | | | | | | | | | | | | | | | | | | | | | |
57
MET INVESTORS SERIES TRUST
| | |
PIMCO Total Return Portfolio | | |
Notes to Financial Statements—June 30, 2011 (Unaudited)—(Continued)
9. Swap Agreements - continued
Credit Default Swaps on Credit Indices - Sell Protection (d)
| | | | | | | | | | | | | | | | | | | | | | | | | | | | | | |
Reference
Obligation | | Fixed
Deal
(Pay)
Rate | | | Maturity
Date | | | Counterparty | | Implied
Credit
Spread at
June 30,
2011 (b) | | | Notional
Amount(c) | | | Market
Value | | | Upfront
Premium
Paid/(Received) | | | Unrealized
Appreciation/
(Depreciation) | |
| | | | | | | | |
CDX.EM.12 | | | 5.000 | % | | | 12/20/2014 | | | Deutsche
Bank AG | | | 1.962 | % | | | 4,400,000 | | | $ | 442,911 | | | $ | 439,300 | | | $ | 3,611 | |
| | | | | | | | |
CDX.EM.13 | | | 5.000 | % | | | 6/20/2015 | | | Barclays Bank plc | | | 1.983 | % | | | 62,900,000 | | | | 7,103,685 | | | | 7,847,300 | | | | (743,615 | ) |
| | | | | | | | |
CDX.EM.13 | | | 5.000 | % | | | 6/20/2015 | | | Deutsche Bank AG | | | 1.983 | % | | | 40,900,000 | | | | 4,619,089 | | | | 5,209,850 | | | | (590,761 | ) |
| | | | | | | | |
CDX.EM.13 | | | 5.000 | % | | | 6/20/2015 | | | JPMorgan
Chase Bank
N.A. | | | 1.983 | % | | | 29,900,000 | | | | 3,376,792 | | | | 3,609,900 | | | | (233,108 | ) |
| | | | | | | | |
CDX.EM.13 | | | 5.000 | % | | | 6/20/2015 | | | Morgan Stanley | | | 1.983 | % | | | 11,300,000 | | | | 1,276,179 | | | | 1,326,150 | | | | (49,971 | ) |
| | | | | | | | |
CDX.EM.14 | | | 5.000 | % | | | 12/20/2015 | | | Barclays Bank plc | | | 2.073 | % | | | 20,600,000 | | | | 2,504,893 | | | | 2,770,700 | | | | (265,807 | ) |
| | | | | | | | |
CDX.EM.14 | | | 5.000 | % | | | 12/20/2015 | | | Citibank N.A. | | | 2.073 | % | | | 6,000,000 | | | | 729,580 | | | | 830,100 | | | | (100,520 | ) |
| | | | | | | | |
CDX.EM.14 | | | 5.000 | % | | | 12/20/2015 | | | Deutsche Bank AG | | | 2.073 | % | | | 13,700,000 | | | | 1,665,875 | | | | 1,704,150 | | | | (38,275 | ) |
| | | | | | | | |
CDX.EM.14 | | | 5.000 | % | | | 12/20/2015 | | | JPMorgan Chase Bank N.A. | | | 2.073 | % | | | 1,200,000 | | | | 145,916 | | | | 158,400 | | | | (12,484 | ) |
| | | | | | | | |
CDX.EM.14 | | | 5.000 | % | | | 12/20/2015 | | | Morgan Stanley | | | 2.073 | % | | | 5,000,000 | | | | 607,984 | | | | 650,000 | | | | (42,016 | ) |
| | | | | | | | |
CDX.EM.14 | | | 5.000 | % | | | 12/20/2015 | | | UBS AG | | | 2.073 | % | | | 2,200,000 | | | | 267,513 | | | | 304,700 | | | | (37,187 | ) |
| | | | | | | | |
CDX.EM.15 | | | 5.000 | % | | | 6/20/2016 | | | Barclays Bank plc | | | 2.122 | % | | | 6,900,000 | | | | 903,807 | | | | 928,200 | | | | (24,393 | ) |
| | | | | | | | |
CDX.EM.15 | | | 5.000 | % | | | 6/20/2016 | | | Deutsche Bank AG | | | 2.122 | % | | | 3,400,000 | | | | 445,354 | | | | 460,700 | | | | (15,346 | ) |
| | | | | | | | |
CDX.NA.HY.16 | | | 5.000 | % | | | 6/20/2016 | | | Barclays Bank plc | | | 4.611 | % | | | 68,400,000 | | | | 1,108,149 | | | | 1,881,000 | | | | (772,851 | ) |
| | | | | | | | |
CDX.NA.IG.9 | | | 0.553 | % | | | 12/20/2017 | | | JPMorgan
Chase Bank
N.A. | | | 0.364 | % | | | 1,928,998 | | | | 21,710 | | | | — | | | | 21,710 | |
| | | | | | | | |
CDX.NA.IG.10 | | | 0.463 | % | | | 6/20/2013 | | | Goldman Sachs & Co. | | | 0.079 | % | | | 6,172,793 | | | | 46,858 | | | | — | | | | 46,858 | |
| | | | | | | | |
CDX.NA.IG.16 | | | 1.000 | % | | | 6/20/2016 | | | BNP Paribas Bank | | | 0.921 | % | | | 298,600,000 | | | | 1,114,498 | | | | 991,754 | | | | 122,744 | |
| | | | | | | | |
CDX.NA.IG.16 | | | 1.000 | % | | | 6/20/2016 | | | Credit Suisse Group AG | | | 0.921 | % | | | 94,800,000 | | | | 353,833 | | | | 453,312 | | | | (99,479 | ) |
| | | | | | | | |
CDX.NA.IG.16 | | | 1.000 | % | | | 6/20/2016 | | | Deutsche Bank AG | | | 0.921 | % | | | 15,600,000 | | | | 58,225 | | | | 74,990 | | | | (16,765 | ) |
| | | | | | | | |
CDX.NA.IG.16 | | | 1.000 | % | | | 6/20/2016 | | | Morgan Stanley | | | 0.921 | % | | | 10,300,000 | | | | 38,443 | | | | 50,134 | | | | (11,691 | ) |
| | | | | | | | | | | | | | | | | | | | | | | | | | | | | | |
| | | | | | | | |
Total | | | | | | | | | | | | | | | | | | | | $ | 26,831,294 | | | $ | 29,690,640 | | | $ | (2,859,346 | ) |
| | | | | | | | | | | | | | | | | | | | | | | | | | | | | | |
AUD—Australian Dollar
BRL—Brazilian Real
EUR—Euro
HY—High Yield
IG—Investment Grade
MXN—Mexican Peso
USD—United States Dollar
| (a) | | If the Portfolio is a buyer of protection and a credit event occurs, as defined under the terms of that particular swap agreement, the Portfolio will either (i) receive from the seller of protection an amount equal to the notional amount of the swap and deliver the referenced obligation or underlying securities comprising the referenced index or (ii) receive a net settlement amount in the form of cash or securities equal to the notional amount of the swap less the recovery value of the referenced obligation or underlying securities comprising the referenced index. |
| (b) | | Implied credit spreads, represented in absolute terms, utilized in determining the market value of credit default swap agreements on corporate issues or sovereign issues of a country as of period end serve as an indicator of the current status of the payment/performance risk and represent the likelihood or risk of default for the credit derivative. |
| | | The implied credit spread of a particular referenced entity reflects the cost of buying/selling protection and may include upfront payments required to be made to enter into the agreement. Wider credit spreads represent a deterioration of the referenced entity’s credit soundness and a greater likelihood or risk of default or other credit event occurring as defined under the terms of the agreement. A credit spread identified as “Defaulted” indicates a credit event has occurred for the referenced entity or obligation. |
| (c) | | The maximum potential amount of future undiscounted payments that the Portfolio could be required to make under a credit default swap contract would be the notional amount of the contract. These potential amounts would be partially offset by any recovery values of the referenced debt obligation or net amounts received from the settlement purchased protection credit default swap contracts entered into by the Portfolio for the same referenced debt obligation. |
| (d) | | If the Portfolio is a seller of protection and a credit event occurs, as defined under the terms of that particular swap agreement, the Portfolio will either (i) pay to the buyer of protection an amount equal to the notional amount of the swap and take delivery of the referenced obligation or underlying securities comprising the referenced index or (ii) pay a net settlement amount in the form of cash or securities equal to the notional amount of the swap less the recovery value of the referenced obligation or underlying securities comprising the referenced index. |
58
MET INVESTORS SERIES TRUST
| | |
PIMCO Total Return Portfolio | | |
Notes to Financial Statements—June 30, 2011 (Unaudited)—(Continued)
10. Contractual Obligations
The Trust has a variety of indemnification obligations under contracts with its service providers. The Trust’s maximum exposure under these arrangements is unknown.
11. Market, Credit and Counterparty Risk
In the normal course of business, the Portfolio invests in securities and enters into transactions where risks exist due to fluctuations in the market (market risk) or failure of the other party to a transaction to perform (credit and counterparty risk). The value of securities held by the Portfolio may decline in response to certain events, including those directly involving the companies whose securities are owned by the Portfolio; conditions affecting the general economy; overall market changes; local, regional or global political, social or economic instability; and currency and interest rate and price fluctuations. The Portfolio may be exposed to counterparty risk, or the risk that an entity with which the Portfolio has unsettled or open transactions may default. The potential loss could exceed the value of the financial assets recorded in the financial statements. Financial assets that potentially expose the Portfolio to credit risk consist principally of cash due from counterparties and investments. In order to preserve certain safeguards for derivatives and non-standard settlement trades, the Portfolio restricts its exposure to credit losses by entering into master netting agreements with counterparties (approved brokers) with whom it undertakes a significant volume of transactions. The Portfolio reduces the credit risk associated with favorable contracts by entering into a master netting arrangement to the extent that all amounts with the counterparty are terminated and settled on a net basis if an event of default occurs. The Portfolio’s overall exposure to credit risk on derivative instruments subject to master netting arrangements can change substantially within a short period, as it is affected by each transaction subject to the arrangement.
12. Income Tax Information
The tax character of distributions paid for the years ended December 31, 2010 and 2009 were as follows:
| | | | | | | | | | | | | | | | | | | | |
| Ordinary Income | | | Long-Term Capital Gain | | | Total | |
| 2010 | | 2009 | | | 2010 | | | 2009 | | | 2010 | | | 2009 | |
| | | | | |
| $290,075,459 | | $ | 447,577,455 | | | $ | 42,671,423 | | | $ | 91,728,216 | | | $ | 332,746,882 | | | $ | 539,305,671 | |
As of December 31, 2010, the components of distributable earnings (accumulated losses) on a federal income tax basis were as follows:
| | | | | | | | | | | | | | | | |
Undistributed
Ordinary
Income | | Undistributed
Long-Term Capital
Gain | | | Net
Unrealized
Appreciation | | | Loss Carryforwards | | | Total | |
| $473,921,418 | | $ | 128,696,511 | | | $ | 66,979,472 | | | $ | — | | | $ | 669,579,401 | |
The Regulated Investment Company Modernization Act of 2010 (the “Act”) was signed into law by President Obama on December 22, 2010.
The Act makes a number of changes to the provisions in the Code relating to regulated investment companies (“RICs”) that will generally become effective for taxable years of RICs beginning after December 22, 2010. The Act allows RICs to generally carryover net capital losses indefinitely, effective for losses arising in taxable years beginning after December 22, 2010. Such losses will retain their character as either long-term capital losses or short-term capital losses. Under pre-enactment law, capital losses could be carried forward for eight years and carried forward as short-term capital losses irrespective of the character of the original loss. Loss carryovers from years beginning prior to December 22, 2010 will still expire subject to the eight-year limitation. The Act further provides that losses arising in taxable years after December 22, 2010 (which are carried forward indefinitely) would be utilized prior to loss carryovers arising in taxable years beginning prior to December 22, 2010.
13. Recent Accounting Pronouncements
In January 2010, the Financial Accounting Standards Board (“FASB”) issued Accounting Standards Update No. 2010-06, “Improving Disclosures About Fair Value Measurements” (“ASU”) which was generally effective for years beginning after December 15, 2009 and was adopted by the Portfolio. The ASU requires enhanced disclosures about purchases, sales, issuances and settlements on a gross basis relating to Level 3 fair value measurements. These enhanced disclosures became effective for fiscal years beginning after December 15, 2010, and for interim periods within those years. Management has evaluated the impact of ASU 2010-06 and has concluded that ASU 2010-06 has no material impact on these financial statements.
In May 2011, FASB issued Accounting Standards Update (ASU) No. 2011-04 “Amendments to Achieve Common Fair Value Measurement and Disclosure Requirements in GAAP and the International Financial Reporting Standards (IFRS).” ASU 2011-04 includes common requirements for measurement of and disclosure about fair value between U.S. GAAP and IFRS. ASU 2011-04 will require reporting entities to categorize within Level 3 of the fair value hierarchy: quantitative information about the unobservable inputs used in the fair value measurement, the valuation processes used by the reporting entity and a narrative description of the sensitivity of the fair value measurement to changes in unobservable inputs and the interrelationships between those unobservable inputs. In addition, ASU 2011-04 will require reporting entities to make disclosures about amounts and reasons for all transfers in and out of Level 1 and Level 2 fair value measurements. The new and revised disclosures are effective for fiscal years beginning after December 15, 2011 and for interim periods within those fiscal years. Management is currently evaluating the implications of ASU 2011-04 and its impact on the financial statements.
59
MET INVESTORS SERIES TRUST
| | |
PIMCO Total Return Portfolio | | |
Quarterly Portfolio Schedule
beginning after December 15, 2011 and for interim periods within those fiscal years. Management is currently evaluating the implications of ASU 2011-04 and its impact on the financial statements.
The Trust files Form N-Q for the first and third quarters of each fiscal year. The Trust’s Forms N-Q will be available on the Securities and Exchange Commission’s website at http://www.sec.gov. The Trust’s Forms N-Q may be reviewed and copied at the Securities and Exchange Commission’s Public Reference Room in Washington, D.C. and information on the operation of the Public Reference Room may be obtained by calling 1-800-SEC-0330. Once filed, the most recent Form N-Q will be available without charge, upon request, by calling (800) 848-3854.
Proxy Voting Policies and Procedures
A description of the policies and procedures that the Trust uses to determine how to vote proxies relating to portfolio securities is available without charge, upon request, by calling (800) 848-3854 and on the Securities and Exchange Commission’s website at http://www.sec.gov.
Proxy Voting Record
The Trust, on behalf of each of its Portfolios, has filed with the Securities and Exchange Commission its proxy voting record for the 12-month period ending June 30 on Form N-PX. Form N-PX must be filed by the Trust each year by August 31. Once filed, the most recent Form N-PX will be available without charge, upon request, by calling (800) 848-3854 or on the Securities and Exchange Commission’s website at http://www.sec.gov.
60
Simplify your life…
with MetLife eDelivery® while helping MetLife preserve the planet’s natural resources.
(see details on inside cover)
| | |
Met Investors Series Trust T. Rowe Price Mid Cap Growth Portfolio Semiannual Report | | June 30, 2011, as amended December 16, 2011 |
MET INVESTORS SERIES TRUST
| | |
T. Rowe Price Mid Cap Growth Portfolio | | |
Managed by T. Rowe Price Associates, Inc.
Portfolio Manager Commentary*
Performance
For the six-month period ended June 30, 2011, the Class A, B, and E shares of the T. Rowe Price Mid Cap Growth Portfolio returned 7.29%, 7.18% and 7.20%, respectively, compared to its benchmark, the Russell Midcap Growth Index1, which returned 9.59%.
Market Environment/Conditions
Most equity indices ended at or slightly below their previous levels, but the period was very volatile. Early in the period, strong economic data pushed the market higher. Yet tumultuous world events, including political upheaval in North Africa and the Middle East and a major natural disaster in Japan, joined with more simmering concerns, such as the Greek debt crisis and the slow pace of economic recovery, in undermining investor confidence. Within the mid-cap universe, growth outperformed value. All capitalization ranges ended in positive territory, led by mid-caps. Swings in investor sentiment created a wide dispersion in returns, but defensive sectors (such as consumer staples, utilities, and health care) led the index. Meanwhile, the telecommunications and industrials and business services sectors lagged.
Portfolio Review/Current Positioning
Consumer Discretionary was a notable detractor, due to stock choices and an unfavorable underweight to this high-performing benchmark sector. Among our weakest holdings were Lamar Advertising Co. and Marriott International, Inc. With a focus on billboard advertising in local markets, Lamar Advertising suffered from a slower recovery in smaller markets as opposed to the U.S. economy as a whole. As a result, the company reduced its estimates of future revenues. However, we believe that the firm has strong prospects as a leader in digital billboards, with a strong leadership team focused on finding small and mid-size markets where it can be more competitive. Marriott suffered from weak demand in the U.S., though its international business is strong, and from the continued effects of its decision to spin off its timeshare business.
Our overall investment level in the sector is lower than historical levels due to continuing challenges facing consumers following the 2008/2009 financial crisis. We continue to focus on companies with strong brands and innovative managements that will be able to prosper as they seize market share from less-nimble competitors. Our largest areas of investment are generally in media, specialty retailers, and hotels, restaurants, and leisure companies.
An underweight to Consumer Staples, the strongest benchmark sector, proved detrimental. Our underweight to the food products industry in particular hurt, as did underperforming stock choices such as Shoppers Drug Mart Corp. (Canada). Shoppers Drug Mart lagged the very strong position of the sector as a whole. While a decline in risk appetite boosted consumer staples stocks this quarter, we maintain our strategic underweight here, as few stocks meet our long-term growth requirements.
Materials was another area of relative weakness, due to underperforming stock holdings that included Agnico-Eagle Mines, Ltd. and HudBay Minerals, Inc. (Canada). Despite historically high gold prices, gold producer Agnico-Eagle Mines posted lower-than-expected revenues due to unanticipated cash costs. A Canadian mining company, Hudbay Minerals had difficulty bringing their products to market due to a lack of railcars. We typically maintain a very small position in Materials and focus primarily in metals and mining.
Stock selection and a favorable overweight in Health Care boosted relative returns. The pharmaceuticals industry was a key area of strength, due to holdings such as Valeant Pharmaceuticals International, Inc., Elan Corp., and Regeneron Pharmaceuticals. Valeant Pharmaceuticals, Inc. benefited from its acquisition strategy, while Elan boosted sales for one of its drugs. Favorable test results pushed one of Regeneron Pharmaceuticals’ new drugs closer to Food and Drug Administration (FDA) approval.
Brian W.H. Berghuis, CFA, MBA,
Portfolio Manager
T. Rowe Price Associates, Inc.
*This commentary may include statements that constitute “forward-looking statements” under the U.S. securities laws. Forward-looking statements include, among other things, projections, estimates, and information about possible or future results related to the Portfolio, market or regulatory developments. The views expressed above are not guarantees of future performance or economic results and involve certain risks, uncertainties and assumptions that could cause actual outcomes and results to differ materially from the views expressed herein. The views expressed above are subject to change at any time based upon economic, market, or other conditions and the subadvisory firm undertakes no obligation to update the views expressed herein. Any discussions of specific securities should not be considered a recommendation to buy or sell those securities. The views expressed above (including any forward-looking statement) may not be relied upon as investment advice or as an indication of the Portfolio’s trading intent. Information about the Portfolio’s holdings, asset allocation or country diversification is historical and is not an indication of future Portfolio composition, which may vary. Direct investment in any index is not possible. The performance of any index mentioned in this commentary has not been adjusted for ongoing management, distribution and operating expenses, and sales charges applicable to mutual fund investments. In addition, the returns do not reflect additional fees charged by separate accounts or variable insurance contracts that an investor in the Portfolio may pay. If these additional fees were reflected, performance would have been lower.
1
MET INVESTORS SERIES TRUST
| | |
T. Rowe Price Mid Cap Growth Portfolio | | |
Portfolio Composition as of June 30, 2011
Top Holdings
| | | | |
| | |
% of
Net Assets | |
AMETEK, Inc. | | | 1.7 | |
Nuance Communications, Inc. | | | 1.5 | |
Dollar General Corp. | | | 1.4 | |
Roper Industries, Inc. | | | 1.4 | |
Gardner Denver, Inc. | | | 1.4 | |
IHS, Inc. - Class A | | | 1.4 | |
Valeant Pharmaceuticals International, Inc. | | | 1.3 | |
Fastenal Co. | | | 1.3 | |
Global Payments, Inc. | | | 1.3 | |
Range Resources Corp. | | | 1.2 | |
Top Sectors
| | | | |
| | | % of
Market Value of
Total Investments | |
Non-Cyclical | | | 22.6 | |
Technology | | | 17.7 | |
Industrials | | | 14.7 | |
Cyclical | | | 12.2 | |
Energy | | | 8.5 | |
Financials | | | 8.1 | |
Communications | | | 7.8 | |
Cash & Equivalents | | | 4.0 | |
Basic Materials | | | 3.2 | |
Utilities | | | 1.2 | |
2
MET INVESTORS SERIES TRUST
| | |
T. Rowe Price Mid Cap Growth Portfolio | | |
T. Rowe Price Mid Cap Growth Portfolio managed by
T. Rowe Price Associates, Inc. vs. Russell Midcap Growth Index1
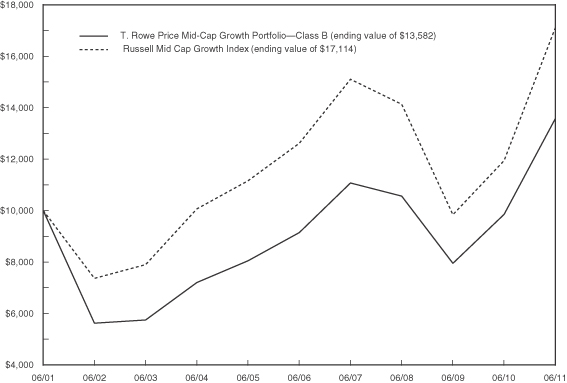
| | | | | | | | | | | | | | | | | | | | |
| | | Average Annual Return2 (for the six months ended June 30, 2011) | |
| | | 6 Month | | | 1 Year | | | 5 Year | | | 10 Year | | | Since
Inception3 | |
T. Rowe Price Mid-Cap Growth
Portfolio—Class A | | | 7.29% | | | | 38.13% | | | | 8.49% | | | | 3.38% | | | | — | |
| Class B | | | 7.18% | | | | 37.76% | | | | 8.23% | | | | 3.11% | | | | — | |
| Class E | | | 7.20% | | | | 37.89% | | | | 8.34% | | | | — | | | | 6.01% | |
| Russell Midcap Growth Index1 | | | 9.59% | | | | 43.25% | | | | 6.28% | | | | 5.52% | | | | — | |
The performance of Class B shares, as set forth in the line graph above, will differ from that of the other classes because of the difference in expenses paid by policyholders investing in the different share classes.
1 The Russell Midcap Growth Index is an unmanaged measure of performance of those Russell Midcap companies (the 800 smallest companies in the Russell 1000 Index) with higher price-to-book ratios and higher forecasted growth values.
2“Average Annual Return” is calculated including reinvestment of all income dividends and capital gain distributions.
3Inception of the Class A shares is 5/1/01. Inception of the Class B shares is 2/12/01. Inception of the Class E shares is 11/1/01. Index returns are based on an inception date of 2/12/01.
Past performance does not guarantee future results. The investment return and principal value of an investment in the Portfolio will fluctuate, so that shares, on any given day or when redeemed, may be worth more or less than their original cost. Performance numbers are net of all Portfolio expenses but do not include any insurance, sales, or administration charges of variable annuity or life insurance contracts. If these charges were included, the returns would be lower. The Index does not include fees or expenses and is not available for direct investment.
3
MET INVESTORS SERIES TRUST
| | |
T. Rowe Price Mid Cap Growth Portfolio | | |
Understanding Your Portfolio’s Expenses
Shareholder Expense Example
As a shareholder of the Portfolio, you incur ongoing costs, including management fees; distribution and service (12b-1) fees; and other Portfolio expenses. This example is intended to help you understand your ongoing costs (in dollars) (referred to as “expenses”) of investing in the Portfolio and compare these costs with the ongoing costs of investing in other mutual funds. The example is based on an investment of $1,000 invested at the beginning of the period and held for the entire period, January 1, 2011 through June 30, 2011.
Actual Expenses
The first line for each share class of the Portfolio in the table below provides information about actual account values and actual expenses. You may use the information in this line, together with the amount you invested in the particular share class of the Portfolio, to estimate the expenses that you paid over the period. Simply divide your account value by $1,000 (for example, an $8,600 account value divided by $1,000 = 8.6), then multiply the result by the number in the first line under the heading entitled “Expenses Paid During Period” to estimate the expenses you paid on your account during this period.
Hypothetical Example for Comparison Purposes
The second line for each share class of the Portfolio in the table below provides information about hypothetical account values and hypothetical expenses based on the Portfolio’s actual expense ratio and an assumed rate of return of 5% per year before expenses, which is not the Portfolio’s actual return. The hypothetical account values and expenses may not be used to estimate the actual ending account balance or expenses you paid for the period. You may use this information to compare the ongoing costs of investing in the Portfolio and other funds. To do so, compare this 5% hypothetical example with the 5% hypothetical examples that appear in the shareholder reports of the other funds.
Please note that the expenses shown in the table are meant to highlight your ongoing costs only and do not reflect any fees or charges of your variable insurance product or any additional expenses that participants in certain eligible qualified plans may bear relating to the operations of their plan. Therefore, the second line for each share class in the table is useful in comparing ongoing costs only, and will not help you determine the relative total costs of owning different funds. In addition, if these other costs were included, your costs would have been higher.
| | | | | | | | | | | | | | | | |
| | | Annualized
Expense
Ratio | | | Beginning
Account Value
January 1, 2011 | | | Ending
Account Value
June 30, 2011 | | | Expenses Paid
During Period** January 1, 2011
to June 30, 2011 | |
| | | | | | | | | | | | | | | | |
| | | | |
| | | | | | | | | | | | | | | | |
Class A(a) | | | | | | | | | | | | | | | | |
Actual | | | 0.75% | | | $ | 1,000.00 | | | $ | 1,072.90 | | | $ | 3.85 | |
Hypothetical* | | | 0.75% | | | | 1,000.00 | | | | 1,021.08 | | | | 3.76 | |
| | | | | | | | | | | | | | | | |
| | | | |
| | | | | | | | | | | | | | | | |
Class B(a) | | | | | | | | | | | | | | | | |
Actual | | | 1.00% | | | $ | 1,000.00 | | | $ | 1,071.80 | | | $ | 5.14 | |
Hypothetical* | | | 1.00% | | | | 1,000.00 | | | | 1,019.84 | | | | 5.01 | |
| | | | | | | | | | | | | | | | |
| | | | |
| | | | | | | | | | | | | | | | |
Class E(a) | | | | | | | | | | | | | | | | |
Actual | | | 0.90% | | | $ | 1,000.00 | | | $ | 1,072.00 | | | $ | 4.62 | |
Hypothetical* | | | 0.90% | | | | 1,000.00 | | | | 1,020.33 | | | | 4.51 | |
| | | | | | | | | | | | | | | | |
* Hypothetical assumes a rate of return of 5% per year before expenses.
** Expenses paid are equal to the Portfolio’s annualized expense ratio for the most recent six month period, as shown above, multiplied by the average account value over the period, multiplied by the number of days (181 days) in the most recent fiscal half-year, divided by 365 (to reflect the one-half year period).
(a) The annualized expense ratio reflects the impact of the management fee waiver as described in Note 3 to the Financial Statements.
4
MET INVESTORS SERIES TRUST
| | |
T. Rowe Price Mid Cap Growth Portfolio | | |
Schedule of Investments as of June 30, 2011 (Unaudited)
Common Stocks—95.5% of Net Assets
| | | | | | | | |
Security Description | | Shares | | | Value | |
| | | | | | | | |
|
| Aerospace & Defense—2.3% | |
Goodrich Corp. | | | 105,000 | | | $ | 10,027,500 | |
Rockwell Collins, Inc. (a) | | | 151,000 | | | | 9,315,190 | |
Textron, Inc. (a) | | | 701,000 | | | | 16,550,610 | |
| | | | | | | | |
| | | | | | | 35,893,300 | |
| | | | | | | | |
|
| Air Freight & Logistics—0.5% | |
UTI Worldwide, Inc. (a) | | | 396,000 | | | | 7,797,240 | |
| | | | | | | | |
|
| Beverages—0.3% | |
Hansen Natural Corp.* | | | 58,000 | | | | 4,695,100 | |
| | | | | | | | |
|
| Biotechnology—3.8% | |
Alexion Pharmaceuticals, Inc.* | | | 195,000 | | | | 9,170,850 | |
BioMarin Pharmaceutical, Inc.* (a) | | | 140,000 | | | | 3,809,400 | |
Cephalon, Inc.* (a) | | | 183,000 | | | | 14,621,700 | |
Human Genome Sciences, Inc.* (a) | | | 377,000 | | | | 9,251,580 | |
Regeneron Pharmaceuticals, Inc.* (a) | | | 195,000 | | | | 11,058,450 | |
Theravance, Inc.* (a) | | | 234,000 | | | | 5,197,140 | |
Vertex Pharmaceuticals, Inc.* | | | 130,000 | | | | 6,758,700 | |
| | | | | | | | |
| | | | | | | 59,867,820 | |
| | | | | | | | |
|
| Capital Markets—1.3% | |
Apollo Global Management LLC— Class A | | | 4,300 | | | | 73,960 | |
Eaton Vance Corp. (a) | | | 262,000 | | | | 7,920,260 | |
TD Ameritrade Holding Corp. (a) | | | 674,000 | | | | 13,149,740 | |
| | | | | | | | |
| | | | | | | 21,143,960 | |
| | | | | | | | |
|
| Chemicals—0.7% | |
Rockwood Holdings, Inc.* | | | 193,000 | | | | 10,670,970 | |
| | | | | | | | |
|
| Commercial Banks—1.0% | |
Fifth Third BanCorp. | | | 318,000 | | | | 4,054,500 | |
Popular, Inc.* | | | 446,000 | | | | 1,230,960 | |
SunTrust Banks, Inc. | | | 148,000 | | | | 3,818,400 | |
TCF Financial Corp. (a) | | | 534,000 | | | | 7,369,200 | |
| | | | | | | | |
| | | | | | | 16,473,060 | |
| | | | | | | | |
|
| Communications Equipment—2.4% | |
JDS Uniphase Corp.* | | | 1,141,000 | | | | 19,009,060 | |
Juniper Networks, Inc.* | | | 200,000 | | | | 6,300,000 | |
Motorola Mobility Holdings, Inc.* (a) | | | 584,000 | | | | 12,871,360 | |
| | | | | | | | |
| | | | | | | 38,180,420 | |
| | | | | | | | |
|
| Construction & Engineering—1.1% | |
Foster Wheeler AG* (a) | | | 82,100 | | | | 2,494,198 | |
Quanta Services, Inc.* | | | 764,000 | | | | 15,432,800 | |
| | | | | | | | |
| | | | | | | 17,926,998 | |
| | | | | | | | |
| Common Stocks—(Continued) | |
Security Description | | Shares | | | Value | |
| | | | | | | | |
|
| Diversified Financial Services—2.3% | |
CBOE Holdings, Inc. (a) | | | 257,000 | | | $ | 6,322,200 | |
Interactive Brokers Group, Inc.—Class A (a) | | | 151,000 | | | | 2,363,150 | |
IntercontinentalExchange, Inc.* | | | 91,000 | | | | 11,348,610 | |
MSCI, Inc.—Class A* | | | 442,000 | | | | 16,654,560 | |
| | | | | | | | |
| | | | | | | 36,688,520 | |
| | | | | | | | |
|
| Electrical Equipment—4.5% | |
A123 Systems, Inc.* (a) | | | 186,000 | | | | 989,520 | |
Acuity Brands, Inc. (a) | | | 105,000 | | | | 5,856,900 | |
AMETEK, Inc. | | | 608,000 | | | | 27,299,200 | |
Babcock & Wilcox Co.* | | | 545,000 | | | | 15,101,950 | |
Roper Industries, Inc. (a) | | | 265,000 | | | | 22,074,500 | |
| | | | | | | | |
| | | | | | | 71,322,070 | |
| | | | | | | | |
|
| Electronic Equipment, Instruments & Components—2.6% | |
Dolby Laboratories, Inc.—Class A* (a) | | | 301,000 | | | | 12,780,460 | |
FLIR Systems, Inc. (a) | | | 390,000 | | | | 13,146,900 | |
Trimble Navigation, Ltd.* | | | 389,000 | | | | 15,419,960 | |
| | | | | | | | |
| | | | | | | 41,347,320 | |
| | | | | | | | |
|
| Energy Equipment & Services—2.5% | |
FMC Technologies, Inc.* | | | 225,000 | | | | 10,077,750 | |
McDermott International, Inc.* | | | 934,000 | | | | 18,502,540 | |
Trican Well Service, Ltd. | | | 449,000 | | | | 10,551,558 | |
| | | | | | | | |
| | | | | | | 39,131,848 | |
| | | | | | | | |
|
| Food & Staples Retailing—1.9% | |
Shoppers Drug Mart Corp. | | | 436,000 | | | | 17,952,689 | |
Whole Foods Market, Inc. | | | 187,000 | | | | 11,865,150 | |
| | | | | | | | |
| | | | | | | 29,817,839 | |
| | | | | | | | |
|
| Health Care Equipment & Supplies—4.2% | |
C.R. Bard, Inc. | | | 150,000 | | | | 16,479,000 | |
CareFusion Corp.* | | | 506,000 | | | | 13,748,020 | |
DENTSPLY International, Inc. | | | 389,000 | | | | 14,813,120 | |
Edwards Lifesciences Corp.* | | | 112,000 | | | | 9,764,160 | |
IDEXX Laboratories, Inc.* (a) | | | 156,000 | | | | 12,099,360 | |
| | | | | | | | |
| | | | | | | 66,903,660 | |
| | | | | | | | |
|
| Health Care Providers & Services—2.5% | |
Community Health Systems, Inc.* | | | 305,000 | | | | 7,832,400 | |
Henry Schein, Inc.* (a) | | | 249,000 | | | | 17,825,910 | |
Laboratory Corp. of America Holdings* | | | 96,000 | | | | 9,291,840 | |
MEDNAX, Inc.* | | | 70,000 | | | | 5,053,300 | |
| | | | | | | | |
| | | | | | | 40,003,450 | |
| | | | | | | | |
See accompanying notes to financial statements.
5
MET INVESTORS SERIES TRUST
| | |
T. Rowe Price Mid Cap Growth Portfolio | | |
Schedule of Investments as of June 30, 2011 (Unaudited)
Common Stocks—(Continued)
| | | | | | | | |
| Security Description | |
Shares | | | Value | |
| | | | | | | | |
|
| Health Care Technology—0.9% | |
Allscripts Healthcare Solutions, Inc.* (a) | | | 310,000 | | | $ | 6,020,200 | |
SXC Health Solutions Corp.* | | | 136,000 | | | | 8,013,120 | |
| | | | | | | | |
| | | | | | | 14,033,320 | |
| | | | | | | | |
|
| Hotels, Restaurants & Leisure—3.6% | |
Chipotle Mexican Grill, Inc.* (a) | | | 39,000 | | | | 12,019,410 | |
Choice Hotels International, Inc. (a) | | | 183,000 | | | | 6,104,880 | |
Marriott International, Inc.—Class A (a) | | | 467,000 | | | | 16,573,830 | |
Panera Bread Co.—Class A* (a) | | | 60,000 | | | | 7,539,600 | |
Starbucks Corp. | | | 149,000 | | | | 5,884,010 | |
Tim Hortons, Inc. | | | 171,000 | | | | 8,346,510 | |
| | | | | | | | |
| | | | | | | 56,468,240 | |
| | | | | | | | |
|
| Independent Power Producers & Energy Traders—1.2% | |
Calpine Corp.* (a) | | | 1,186,000 | | | | 19,130,180 | |
| | | | | | | | |
|
| Insurance—3.1% | |
Aon Corp. | | | 262,000 | | | | 13,440,600 | |
HCC Insurance Holdings, Inc. | | | 271,000 | | | | 8,536,500 | |
Principal Financial Group, Inc. | | | 354,000 | | | | 10,768,680 | |
W.R. Berkley Corp. (a) | | | 276,000 | | | | 8,953,440 | |
Willis Group Holdings plc (a) | | | 187,000 | | | | 7,687,570 | |
| | | | | | | | |
| | | | | | | 49,386,790 | |
| | | | | | | | |
| |
| Internet & Catalog Retail—0.7% | | | | | |
Liberty Media Corp.—Interactive—Class A* | | | 674,000 | | | | 11,302,980 | |
| | | | | | | | |
| |
| Internet Software & Services—1.1% | | | | | |
Equinix, Inc.* | | | 69,000 | | | | 6,970,380 | |
LinkedIn Corp.—Class A* (a) | | | 20,000 | | | | 1,801,800 | |
Rackspace Hosting, Inc.* | | | 130,000 | | | | 5,556,200 | |
WebMD Health Corp.* | | | 74,000 | | | | 3,372,920 | |
| | | | | | | | |
| | | | | | | 17,701,300 | |
| | | | | | | | |
| |
| IT Services—4.6% | | | | | |
Fiserv , Inc.* | | | 265,000 | | | | 16,596,950 | |
Gartner, Inc.—Class A* | | | 463,500 | | | | 18,674,415 | |
Global Payments, Inc. | | | 399,000 | | | | 20,349,000 | |
Western Union Co. | | | 841,000 | | | | 16,845,230 | |
| | | | | | | | |
| | | | | | | 72,465,595 | |
| | | | | | | | |
| |
| Life Sciences Tools & Services—3.6% | | | | | |
Bruker Corp.* (a) | | | 516,000 | | | | 10,505,760 | |
Covance, Inc.* | | | 305,000 | | | | 18,107,850 | |
Illumina, Inc.* (a) | | | 112,000 | | | | 8,416,800 | |
| | | | | | | | |
| |
| Life Sciences Tools & Services—(Continued) | | | | | |
Qiagen N.V.* (a) | | | 430,000 | | | $ | 8,178,600 | |
Waters Corp.* | | | 120,000 | | | | 11,488,800 | |
| | | | | | | | |
| | | | | | | 56,697,810 | |
| | | | | | | | |
| |
| Machinery—3.6% | | | | | |
Crane Co. | | | 113,000 | | | | 5,583,330 | |
Gardner Denver, Inc. | | | 262,000 | | | | 22,021,100 | |
IDEX Corp. (a) | | | 343,000 | | | | 15,726,550 | |
WABCO Holdings, Inc.* | | | 198,000 | | | | 13,673,880 | |
| | | | | | | | |
| | | | | | | 57,004,860 | |
| | | | | | | | |
| |
| Media—2.7% | | | | | |
Discovery Communications, Inc.—Class A* (a) | | | 243,000 | | | | 9,953,280 | |
Discovery Communications, Inc.—Class C* | | | 251,000 | | | | 9,174,050 | |
Lamar Advertising Co.—Class A* (a) | | | 423,000 | | | | 11,577,510 | |
Liberty Media-Starz, Series A* | | | 112,900 | | | | 8,494,596 | |
Madison Square Garden, Inc. (The)—Class A* (a) | | | 100,000 | | | | 2,753,000 | |
| | | | | | | | |
| | | | | | | 41,952,436 | |
| | | | | | | | |
| |
| Metals & Mining—2.5% | | | | | |
Agnico-Eagle Mines, Ltd. | | | 241,000 | | | | 15,214,330 | |
Franco-Nevada Corp. | | | 299,000 | | | | 11,163,080 | |
HudBay Minerals, Inc. | | | 374,000 | | | | 5,598,780 | |
Osisko Mining Corp.* | | | 469,515 | | | | 7,298,968 | |
| | | | | | | | |
| | | | | | | 39,275,158 | |
| | | | | | | | |
| |
| Multiline Retail—1.4% | | | | | |
Dollar General Corp.* (a) | | | 662,000 | | | | 22,435,180 | |
| | | | | | | | |
| |
| Oil, Gas & Consumable Fuels—6.9% | | | | | |
Consol Energy, Inc. | | | 305,000 | | | | 14,786,400 | |
Continental Resources, Inc.* (a) | | | 134,000 | | | | 8,697,940 | |
EQT Corp. | | | 311,000 | | | | 16,333,720 | |
Peabody Energy Corp. | | | 93,000 | | | | 5,478,630 | |
QEP Resources, Inc. | | | 311,000 | | | | 13,009,130 | |
Quicksilver Resources, Inc.* (a) | | | 545,000 | | | | 8,044,200 | |
Range Resources Corp. (a) | | | 350,000 | | | | 19,425,000 | |
SM Energy Co. (a) | | | 149,000 | | | | 10,948,520 | |
Ultra Petroleum Corp.* (a) | | | 262,000 | | | | 11,999,600 | |
| | | | | | | | |
| | | | | | | 108,723,140 | |
| | | | | | | | |
| |
| Pharmaceuticals—1.7% | | | | | |
Elan Corp. plc (ADR)* | | | 584,000 | | | | 6,640,080 | |
Valeant Pharmaceuticals International, Inc. (a) | | | 401,600 | | | | 20,867,136 | |
| | | | | | | | |
| | | | | | | 27,507,216 | |
| | | | | | | | |
See accompanying notes to financial statements.
6
MET INVESTORS SERIES TRUST
| | |
T. Rowe Price Mid Cap Growth Portfolio | | |
Schedule of Investments as of June 30, 2011 (Unaudited)
Common Stocks—(Continued)
| | | | | | | | |
| Security Description | |
Shares | | | Value | |
| | | | | | | | |
| |
| Professional Services—3.2% | | | | | |
IHS, Inc.—Class A* (a) | | | 262,000 | | | $ | 21,856,040 | |
Manpower, Inc. | | | 245,000 | | | | 13,144,250 | |
Robert Half International, Inc. (a) | | | 277,000 | | | | 7,487,310 | |
Verisk Analytics, Inc.—Class A* | | | 232,000 | | | | 8,031,840 | |
| | | | | | | | |
| | | | | | | 50,519,440 | |
| | | | | | | | |
| |
| Real Estate Management & Development—0.5% | | | | | |
Jones Lang LaSalle, Inc. (a) | | | 89,000 | | | | 8,392,700 | |
| | | | | | | | |
| |
| Road & Rail—0.9% | | | | | |
Hertz Global Holdings, Inc.* | | | 870,000 | | | | 13,815,600 | |
| | | | | | | | |
|
| Semiconductors & Semiconductor Equipment—7.8% | |
Altera Corp. (a) | | | 195,000 | | | | 9,038,250 | |
Atmel Corp.* (a) | | | 623,000 | | | | 8,765,610 | |
Cree, Inc.* (a) | | | 189,000 | | | | 6,348,510 | |
First Solar, Inc.* (a) | | | 43,000 | | | | 5,687,610 | |
Intersil Corp.—Class A (a) | | | 617,000 | | | | 7,928,450 | |
Marvell Technology Group, Ltd.* | | | 623,000 | | | | 9,198,595 | |
MEMC Electronic Materials, Inc.* (a) | | | 632,000 | | | | 5,390,960 | |
Microchip Technology, Inc. (a) | | | 233,000 | | | | 8,833,030 | |
National Semiconductor Corp. | | | 686,000 | | | | 16,882,460 | |
NVIDIA Corp.* | | | 701,000 | | | | 11,170,435 | |
PMC-Sierra, Inc.* | | | 323,000 | | | | 2,445,110 | |
Silicon Laboratories, Inc.* (a) | | | 226,800 | | | | 9,357,768 | |
Varian Semiconductor Equipment Associates, Inc.* | | | 89,000 | | | | 5,468,160 | |
Xilinx, Inc. (a) | | | 452,000 | | | | 16,484,440 | |
| | | | | | | | |
| | | | | | | 122,999,388 | |
| | | | | | | | |
| |
| Software—6.2% | | | | | |
Ariba, Inc.* (a) | | | 155,000 | | | | 5,342,850 | |
Concur Technologies, Inc.* (a) | | | 191,000 | | | | 9,563,370 | |
FactSet Research Systems, Inc. (a) | | | 115,000 | | | | 11,766,800 | |
MICROS Systems, Inc.* | | | 225,000 | | | | 11,184,750 | |
Nuance Communications, Inc.* (a) | | | 1,103,000 | | | | 23,681,410 | |
Red Hat, Inc.* | | | 337,000 | | | | 15,468,300 | |
Rovi Corp.* (a) | | | 273,000 | | | | 15,659,280 | |
TIBCO Software, Inc.* (a) | | | 195,000 | | | | 5,658,900 | |
| | | | | | | | |
| | | | | | | 98,325,660 | |
| | | | | | | | |
| |
| Specialty Retail—2.7% | | | | | |
Bed Bath & Beyond, Inc.* | | | 149,000 | | | | 8,697,130 | |
CarMax, Inc.* (a) | | | 547,000 | | | | 18,089,290 | |
O’Reilly Automotive, Inc.* (a) | | | 232,000 | | | | 15,198,320 | |
| | | | | | | | |
| | | | | | | 41,984,740 | |
| | | | | | | | |
| Security Description | | Shares/Par
Amount | | | Value | |
| | | | | | | | |
| |
| Textiles, Apparel & Luxury Goods—0.1% | | | | | |
Coach, Inc. | | | 28,000 | | | $ | 1,790,040 | |
| | | | | | | | |
| |
| Thrifts & Mortgage Finance—0.3% | | | | | |
BankUnited, Inc. (a) | | | 171,000 | | | | 4,538,340 | |
| | | | | | | | |
| |
| Trading Companies & Distributors—2.3% | | | | | |
Air Lease Corp.* (a) | | | 323,000 | | | | 7,845,670 | |
Fastenal Co | | | 576,000 | | | | 20,730,240 | |
MSC Industrial Direct Co., Inc.—Class A | | | 127,000 | | | | 8,421,370 | |
| | | | | | | | |
| | | | | | | 36,997,280 | |
| | | | | | | | |
Total Common Stocks
(Cost $1,125,264,222) | | | | | | | 1,511,310,968 | |
| | | | | | | | |
| | |
| Preferred Stocks—0.5% | | | | | | | | |
| |
| Hotels, Restaurants & Leisure—0.2% | | | | | |
Coupon.Com (144A) (b)* | | | 296,331 | | | | 3,255,700 | |
| | | | | | | | |
| |
| Internet Software & Services—0.3% | | | | | |
Hungry Machine, Inc. (144A) (b) | | | 757,490 | | | | 4,280,576 | |
| | | | | | | | |
Total Preferred Stocks
(Cost $7,536,276) | | | | | | | 7,536,276 | |
| | | | | | | | |
| | |
| Convertible Bonds—0.1% | | | | | | | | |
|
| Electrical Equipment—0.1% | |
A123 Systems, Inc.
3.750%, 04/15/16
(Cost—$1,403,000) | | $ | 1,403,000 | | | | 1,276,145 | |
| | | | | | | | |
| | |
| Short-Term Investments—27.8% | | | | | | | | |
| | |
| Mutual Funds—27.8% | | | | | | | | |
State Street Navigator Securities Lending Prime Portfolio (c) | | | 376,314,358 | | | | 376,314,358 | |
T. Rowe Price Government Reserve Investment Fund** | | | 63,129,353 | | | | 63,129,353 | |
| | | | | | | | |
| | | | | | | 439,443,711 | |
| | | | | | | | |
Total Short-Term Investments
(Cost $439,443,711) | | | | | | | 439,443,711 | |
| | | | | | | | |
Total Investments—123.9%
(Cost $1,573,647,209#) | | | | | | | 1,959,567,100 | |
| | | | | | | | |
Other Assets and Liabilities
(net)—(23.9)% | | | | | | | (377,628,585 | ) |
| | | | | | | | |
| Net Assets—100.0% | | | | | | $ | 1,581,938,515 | |
| | | | | | | | |
See accompanying notes to financial statements.
7
MET INVESTORS SERIES TRUST
| | |
T. Rowe Price Mid Cap Growth Portfolio | | |
Schedule of Investments as of June 30, 2011 (Unaudited)
| * | Non-income producing security. |
| ** | Affiliated issuer. (See Note 8 to Financial Statements for a summary of transactions in the investments of affiliated issuers.) |
| # | As of June 30, 2011, the aggregate cost of investments for federal income tax purposes was $1,573,647,209. The aggregate unrealized appreciation and depreciation of investments were $405,094,997 and $(19,175,106), respectively, resulting in net unrealized appreciation of $385,919,891 for federal income tax purpose. |
| (a) | All or a portion of the security was on loan. As of June 30, 2011, the market value of securities loaned was $370,817,796 and the collateral received consisted of cash in the amount of $376,314,358. The cash collateral is invested in a money market fund managed by an affiliate of the custodian. |
| (b) | Security was valued in good faith under procedures approved by the Board of Trustees. |
| (c) | Represents investment of cash collateral received from securities lending transactions. |
| (144A)— | Securities exempt from registration under Rule 144A of the Securities Act of 1933. These securities may be resold in transactions exempt from registration, normally to qualified institutional buyers. As of June 30, 2011, the market value of 144A securities was $7,536,276, which was 0.5% of net assets. |
| ADR— | An American Depositary Receipt is a certificate issued by a custodian bank representing the right to receive securities of the foreign issuer described. Trading on exchanges not located in the United States or Canada significantly influences the value of ADRs. |
See accompanying notes to financial statements.
8
MET INVESTORS SERIES TRUST
| | |
T. Rowe Price Mid Cap Growth Portfolio | | |
Schedule of Investments as of June 30, 2011 (Unaudited)
FAIR VALUE HIERARCHY
Accounting principles generally accepted in the United States of America (“GAAP”) defines fair market value as the price that the Portfolio would receive to sell an asset or pay to transfer a liability in an orderly transaction between market participants at the measurement date. It establishes a fair value hierarchy that prioritizes inputs to valuation methods and requires disclosure of the fair value hierarchy that segregates fair value measurements into three levels. Levels 1, 2 and 3 of the fair value hierarchy are defined as follows:
Level 1 - unadjusted quoted prices in active markets for identical investments
Level 2 - other significant observable inputs (including, but not limited to, unadjusted quoted prices for similar investments in markets that are either active or inactive; inputs other than quoted prices that are observable such as interest rates, yield curves, volatilities, prepayment speeds, loss severities, credit risks, default rates, etc.)
Level 3 - significant unobservable inputs based on the best information available in the circumstances, to the extent observable inputs are unavailable (including the Portfolio’s own assumptions in determining the fair value of investments)
The inputs or methodologies used for valuing investments are not necessarily an indication of the risk associated with investing in them. For a change in the methodology used, transfers between levels will be recognized as of the beginning of the reporting period. Information on transfers between Level 1 and Level 2 deemed significant, if any, will be disclosed following the valuation table below. For the six months ended June 30, 2011, there were no transfers between Levels 1 and 2. A reconciliation of Level 3 securities, if any, will also be disclosed following the valuation table. For more information about the Portfolio’s policy regarding the valuation of investments, please refer to the Notes to Financial Statements.
The following table summarizes the fair value hierarchy of the Portfolio’s investments as of June 30, 2011:
| | | | | | | | | | | | | | | | |
| Description | | Level 1 | | | Level 2 | | | Level 3 | | | Total | |
Total Common Stocks* | | $ | 1,511,310,968 | | | $ | — | | | $ | — | | | $ | 1,511,310,968 | |
Total Preferred Stocks* | | | — | | | | — | | | | 7,536,276 | | | | 7,536,276 | |
Total Convertible Bonds* | | | — | | | | 1,276,145 | | | | — | | | | 1,276,145 | |
Total Short-Term Investments* | | | 439,443,711 | | | | — | | | | — | | | | 439,443,711 | |
Total Investments | | $ | 1,950,754,679 | | | $ | 1,276,145 | | | $ | 7,536,276 | | | $ | 1,959,567,100 | |
| | | | | | | | | | | | | | | | | |
| * | | See Schedule of Investments for additional detailed categorizations. |
Following is a reconciliation of Level 3 assets for which significant unobservable inputs were used to determine fair value:
| | | | | | | | | | | | | | | | |
| Investments in Securities | | Balance as of
December 31,
2010 | | | Purchases | | | Balance as of
June 30,
2011 | | | Change in Unrealized
Appreciation/(Depreciation)
for Investments still held at
June 30, 2011 | |
Preferred Stock | | | | | | | | | | | | | | | | |
Hotels, Restaurants & Leisure | | $ | — | | | $ | 3,255,700 | | | $ | 3,255,700 | | | $ | — | |
Internet Software & Services | | | — | | | | 4,280,576 | | | | 4,280,576 | | | | — | |
| | | | | | | | | | | | | | | | |
Total | | $ | — | | | $ | 7,536,276 | | | $ | 7,536,276 | | | $ | — | |
| | | | | | | | | | | | | | | | |
See accompanying notes to financial statements.
9
MET INVESTORS SERIES TRUST
| | |
T. Rowe Price Mid Cap Growth Portfolio | | |
Statement of Assets and Liabilities
June 30, 2011 (Unaudited)
| | | | |
| Assets | | | | |
Investments at value (a)(b) | | $ | 1,896,437,747 | |
Short-term from affiliated transactions | | | 63,129,353 | |
Cash denominated in foreign currencies | | | 9,272 | |
Receivable for investments sold | | | 10,965,199 | |
Receivable for shares sold | | | 541,694 | |
Dividends receivable | | | 435,283 | |
Interest receivable | | | 30,325 | |
| | | | |
Total assets | | | 1,971,548,873 | |
| | | | |
| Liabilities | | | | |
Payables for: | | | | |
Investments purchased | | | 11,192,100 | |
Shares redeemed | | | 850,475 | |
Collateral for securities loaned | | | 376,314,358 | |
Accrued Expenses: | | | | |
Management fees | | | 916,316 | |
Distribution and service fees - Class B | | | 183,566 | |
Distribution and service fees - Class E | | | 2,740 | |
Administration fees | | | 6,701 | |
Custodian and accounting fees | | | 16,105 | |
Deferred trustees’ fees | | | 20,516 | |
Other expenses | | | 107,481 | |
| | | | |
Total liabilities | | | 389,610,358 | |
| | | | |
| Net Assets | | $ | 1,581,938,515 | |
| | | | |
| Net Assets Represented by | | | | |
Paid in surplus | | $ | 1,058,480,034 | |
Accumulated net realized gain | | | 143,400,640 | |
Unrealized appreciation on investments and foreign currency transactions | | | 385,921,714 | |
Distributions in excess of net investment income | | | (5,863,873 | ) |
| | | | |
Net Assets | | $ | 1,581,938,515 | |
| | | | |
| Net Assets | | | | |
Class A | | $ | 643,021,705 | |
Class B | | | 916,385,615 | |
Class E | | | 22,531,195 | |
| Capital Shares Outstanding* | | | | |
Class A | | | 61,989,223 | |
Class B | | | 90,877,162 | |
Class E | | | 2,208,537 | |
| Net Asset Value, Offering Price and Redemption Price Per Share | | | | |
Class A | | $ | 10.37 | |
Class B | | | 10.08 | |
Class E | | | 10.20 | |
| * | | The Portfolio is authorized to issue an unlimited number of shares. |
| (a) | | Identified cost of investments, excluding short-term from affiliated transaction, was $1,510,517,856. |
| (b) | | Includes securities loaned at value of $370,817,796. |
Statement of Operations
Six Months Ended June 30, 2011 (Unaudited)
| | | | |
| Investment Income | | | | |
Dividends (a) | | $ | 3,703,946 | |
Interest (b) | | | 390,164 | |
Income earned from affilliated transactions | | | 61,230 | |
| | | | |
Total investment income | | | 4,155,340 | |
| | | | |
| Expenses | | | | |
Management fees | | | 6,179,915 | |
Administration fees | | | 41,994 | |
Custodian and accounting fees | | | 85,907 | |
Distribution and service fees - Class B | | | 1,094,218 | |
Distribution and service fees - Class E | | | 17,993 | |
Audit and tax services | | | 15,966 | |
Legal | | | 20,801 | |
Trustees’ fees and expenses | | | 15,868 | |
Shareholder reporting | | | 55,301 | |
Insurance | | | 6,528 | |
Miscellaneous | | | 7,233 | |
| | | | |
Total expenses | | | 7,541,724 | |
Less management fee waiver | | | (200,391 | ) |
Less broker commission recapture | | | (17,270 | ) |
| | | | |
Net expenses | | | 7,324,063 | |
| | | | |
Net investment loss | | | (3,168,723 | ) |
| | | | |
| Net Realized and Unrealized Gain (Loss) on Investments, Futures Contracts and Foreign Currency Transactions | | | | |
Net realized gain (loss) on: | | | | |
Investments | | | 147,875,695 | |
Futures contracts | | | 843,710 | |
Foreign currency transactions | | | (50,681 | ) |
| | | | |
Net realized gain on investments, futures contracts and foreign currency transactions | | | 148,668,724 | |
| | | | |
Net change in unrealized appreciation (depreciation) on: | | | | |
Investments | | | (23,719,122 | ) |
Foreign currency transactions | | | 1,323 | |
| | | | |
Net change in unrealized depreciation on investments and foreign currency transactions | | | (23,717,799 | ) |
| | | | |
Net realized and unrealized gain on investments and foreign currency transactions | | | 124,950,925 | |
| | | | |
| Net Increase in Net Assets from Operations | | $ | 121,782,202 | |
| | | | |
| (a) | | Net of foreign withholding taxes of $71,210. |
| (b) | | Includes net income on securities loaned of $377,739. |
See accompanying notes to financial statements.
10
MET INVESTORS SERIES TRUST
| | |
T. Rowe Price Mid Cap Growth Portfolio | | |
Statements of Changes in Net Assets
June 30, 2011
| | | | | | | | |
| | | Six Months
Ended
June 30, 2011
(Unaudited) | | | Year Ended
December 31,
2010 | |
| Increase (Decrease) in Net Assets: | | | | | | | | |
| Operations | | | | | | | | |
Net investment loss | | $ | (3,168,723 | ) | | $ | (2,748,272 | ) |
Net realized gain on investments, futures contracts and foreign currency transactions | | | 148,668,724 | | | | 76,380,300 | |
Net change in unrealized appreciation (depreciation) on investments and foreign currency transactions | | | (23,717,799 | ) | | | 258,202,845 | |
| | | | | | | | |
Net increase in net assets resulting from operations | | | 121,782,202 | | | | 331,834,873 | |
| | | | | | | | |
| Distributions to Shareholders | | | | | | | | |
From net realized gains | | | | | | | | |
Class A | | | (19,985,267 | ) | | | — | |
Class B | | | (22,409,779 | ) | | | — | |
Class E | | | (585,910 | ) | | | — | |
| | | | | | | | |
Net decrease in net assets resulting from distributions | | | (42,980,956 | ) | | | — | |
| | | | | | | | |
Net increase (decrease) in net assets from capital share transactions | | | (82,630,010 | ) | | | 104,243,629 | |
| | | | | | | | |
| Net Increase (Decrease) in Net Assets | | | (3,828,764 | ) | | | 436,078,502 | |
Net assets at beginning of period | | | 1,585,767,279 | | | | 1,149,688,777 | |
| | | | | | | | |
Net assets at end of period | | $ | 1,581,938,515 | | | $ | 1,585,767,279 | |
| | | | | | | | |
Distributions in excess of net investment income at end of period | | $ | (5,863,873 | ) | | $ | (2,695,150 | ) |
| | | | | | | | |
| | | | | | | | | | | | | | | | |
| Other Information: | | | | | | | | | | | | | | | | |
| Capital Shares | | | | | | | | | | | | | | | | |
| | | | |
Transactions in capital shares were as follows: | | | | | | | | | | | | | | | | |
| | | Six Months Ended
June 30, 2011
(Unaudited) | | | Year Ended
December 31, 2010 | |
| | | Shares | | | Value | | | Shares | | | Value | |
| Class A | | | | | | | | | | | | | | | | |
Sales | | | 3,707,010 | | | $ | 38,615,255 | | | | 12,130,789 | | | $ | 104,608,215 | |
Reinvestments | | | 1,897,936 | | | | 19,985,267 | | | | — | | | | — | |
Redemptions | | | (20,827,411 | ) | | | (222,667,119 | ) | | | (10,677,049 | ) | | | (89,400,980 | ) |
| | | | | | | | | | | | | | | | |
Net increase (decrease) | | | (15,222,465 | ) | | $ | (164,066,597 | ) | | | 1,453,740 | | | $ | 15,207,235 | |
| | | | | | | | | | | | | | | | |
| Class B | | | | | | | | | | | | | | | | |
Sales | | | 12,299,908 | | | $ | 125,084,199 | | | | 21,237,106 | | | $ | 176,915,008 | |
Reinvestments | | | 2,188,455 | | | | 22,409,779 | | | | — | | | | — | |
Redemptions | | | (6,232,027 | ) | | | (62,852,071 | ) | | | (10,436,882 | ) | | | (84,633,830 | ) |
| | | | | | | | | | | | | | | | |
Net increase | | | 8,256,336 | | | $ | 84,641,907 | | | | 10,800,224 | | | $ | 92,281,178 | |
| | | | | | | | | | | | | | | | |
| Class E | | | | | | | | | | | | | | | | |
Sales | | | 241,425 | | | $ | 2,482,245 | | | | 501,243 | | | $ | 4,198,021 | |
Reinvestments | | | 56,555 | | | | 585,909 | | | | — | | | | — | |
Redemptions | | | (611,741 | ) | | | (6,273,474 | ) | | | (886,297 | ) | | | (7,442,805 | ) |
| | | | | | | | | | | | | | | | |
Net decrease | | | (313,761 | ) | | $ | (3,205,320 | ) | | | (385,054 | ) | | $ | (3,244,784 | ) |
| | | | | | | | | | | | | | | | |
Increase (decrease) derived from capital shares transactions | | | | | | $ | (82,630,010 | ) | | | | | | $ | 104,243,629 | |
| | | | | | | | | | | | | | | | |
See accompanying notes to financial statements.
11
MET INVESTORS SERIES TRUST
| | |
T. Rowe Price Mid Cap Growth Portfolio | | |
Financial Highlights
| | | | | | | | | | | | | | | | | | | | | | | | |
| Selected per share data | | | | | | | | | | | | | | | | | | |
| | | Class A | |
| | | Six Months
Ended
June 30, 2011
(Unaudited) | | | Year Ended December 31, | |
| | | | 2010 | | | 2009 | | | 2008 | | | 2007 | | | 2006 | |
| Net Asset Value, Beginning of Period | | $ | 9.90 | | | $ | 7.73 | | | $ | 5.30 | | | $ | 9.83 | | | $ | 8.76 | | | $ | 8.49 | |
| | | | | | | | | | | | | | | | | | | | | | | | |
| Income (Loss) from Investment Operations: | | | | | | | | | | | | | | | | | | | | | | | | |
Net Investment Income (Loss)(a) | | | (0.01 | ) | | | (0.01 | ) | | | (0.00 | )+ | | | 0.01 | | | | 0.02 | | | | 0.03 | |
Net Realized and Unrealized Gain (Loss) on Investments | | | 0.74 | | | | 2.18 | | | | 2.43 | | | | (3.54 | ) | | | 1.50 | | | | 0.53 | |
| | | | | | | | | | | | | | | | | | | | | | | | |
Total From Investment Operations | | | 0.73 | | | | 2.17 | | | | 2.43 | | | | (3.53 | ) | | | 1.52 | | | | 0.56 | |
| | | | | | | | | | | | | | | | | | | | | | | | |
| Less Distributions: | | | | | | | | | | | | | | | | | | | | | | | | |
Distributions from Net Investment Income | | | — | | | | — | | | | — | | | | (0.01 | ) | | | (0.02 | ) | | | — | |
Distributions from Net Realized Capital Gains | | | (0.26 | ) | | | — | | | | — | | | | (0.99 | ) | | | (0.43 | ) | | | (0.29 | ) |
| | | | | | | | | | | | | | | | | | | | | | | | |
Total Distributions | | | (0.26 | ) | | | — | | | | — | | | | (1.00 | ) | | | (0.45 | ) | | | (0.29 | ) |
| | | | | | | | | | | | | | | | | | | | | | | | |
| Net Asset Value, End of Period | | $ | 10.37 | | | $ | 9.90 | | | $ | 7.73 | | | $ | 5.30 | | | $ | 9.83 | | | $ | 8.76 | |
| | | | | | | | | | | | | | | | | | | | | | | | |
| Total Return (%) | | | 7.29 | | | | 28.07 | | | | 45.85 | | | | (39.62 | ) | | | 17.85 | | | | 6.56 | |
| | | | | | |
| Ratios/Supplemental Data | | | | | | | | | | | | | | | | | | | | | | | | |
Ratio of Expenses to Average Net Assets (%) | | | 0.78 | * | | | 0.79 | | | | 0.79 | | | | 0.78 | | | | 0.80 | | | | 0.81 | |
Ratio of Net Expenses to Average Net Assets (%)(b) | | | 0.76 | * | | | 0.77 | | | | 0.77 | | | | 0.76 | | | | 0.78 | | | | 0.81 | |
Ratio of Net Investment Income (Loss) to Average Net Assets (%) | | | (0.25 | )* | | | (0.10 | ) | | | (0.05 | ) | | | 0.09 | | | | 0.16 | | | | 0.32 | |
Portfolio Turnover Rate (%) | | | 22.8 | | | | 27.6 | | | | 31.5 | | | | 36.2 | | | | 35.5 | | | | 33.7 | |
Net Assets, End of Period (in millions) | | $ | 643.0 | | | $ | 764.5 | | | $ | 585.5 | | | $ | 347.4 | | | $ | 524.2 | | | $ | 386.8 | |
| |
| | | Class B | |
| | | Six Months
Ended
June 30, 2011
(Unaudited) | | | Year Ended December 31, | |
| | | | 2010 | | | 2009 | | | 2008 | | | 2007 | | | 2006 | |
| Net Asset Value, Beginning of Period | | $ | 9.64 | | | $ | 7.55 | | | $ | 5.19 | | | $ | 9.66 | | | $ | 8.62 | | | $ | 8.38 | |
| | | | | | | | | | | | | | | | | | | | | | | | |
| Income (Loss) from Investment Operations: | | | | | | | | | | | | | | | | | | | | | | | | |
Net Investment Income (Loss)(a) | | | (0.02 | ) | | | (0.03 | ) | | | (0.02 | ) | | | (0.01 | ) | | | (0.01 | ) | | | 0.01 | |
Net Realized and Unrealized Gain (Loss) on Investments | | | 0.72 | | | | 2.12 | | | | 2.38 | | | | (3.47 | ) | | | 1.48 | | | | 0.52 | |
| | | | | | | | | | | | | | | | | | | | | | | | |
Total From Investment Operations | | | 0.70 | | | | 2.09 | | | | 2.36 | | | | (3.48 | ) | | | 1.47 | | | | 0.53 | |
| | | | | | | | | | | | | | | | | | | | | | | | |
| Less Distributions: | | | | | | | | | | | | | | | | | | | | | | | | |
Distributions from Net Investment Income | | | — | | | | — | | | | — | | | | — | | | | (0.00 | )++ | | | — | |
Distributions from Net Realized Capital Gains | | | (0.26 | ) | | | — | | | | — | | | | (0.99 | ) | | | (0.43 | ) | | | (0.29 | ) |
| | | | | | | | | | | | | | | | | | | | | | | | |
Total Distributions | | | (0.26 | ) | | | — | | | | — | | | | (0.99 | ) | | | (0.43 | ) | | | (0.29 | ) |
| | | | | | | | | | | | | | | | | | | | | | | | |
| Net Asset Value, End of Period | | $ | 10.08 | | | $ | 9.64 | | | $ | 7.55 | | | $ | 5.19 | | | $ | 9.66 | | | $ | 8.62 | |
| | | | | | | | | | | | | | | | | | | | | | | | |
| Total Return (%) | | | 7.18 | | | | 27.68 | | | | 45.47 | | | | (39.75 | ) | | | 17.64 | | | | 6.16 | |
| | | | | | |
| Ratios/Supplemental Data | | | | | | | | | | | | | | | | | | | | | | | | |
Ratio of Expenses to Average Net Assets (%) | | | 1.03 | * | | | 1.04 | | | | 1.04 | | | | 1.03 | | | | 1.05 | | | | 1.06 | |
Ratio of Net Expenses to Average Net Assets (%)(b) | | | 1.01 | * | | | 1.02 | | | | 1.02 | | | | 1.01 | | | | 1.03 | | | | 1.05 | |
Ratio of Net Investment Income (Loss) to Average Net Assets (%) | | | (0.50 | )* | | | (0.33 | ) | | | (0.30 | ) | | | (0.16 | ) | | | (0.08 | ) | | | 0.12 | |
Portfolio Turnover Rate (%) | | | 22.8 | | | | 27.6 | | | | 31.5 | | | | 36.2 | | | | 35.5 | | | | 33.7 | |
Net Assets, End of Period (in millions) | | $ | 916.4 | | | $ | 796.7 | | | $ | 542.0 | | | $ | 314.0 | | | $ | 523.0 | | | $ | 453.6 | |
Please see following page for Financial Highlights footnote legend.
See accompanying notes to financial statements.
12
MET INVESTORS SERIES TRUST
| | |
T. Rowe Price Mid Cap Growth Portfolio | | |
Financial Highlights
| | | | | | | | | | | | | | | | | | | | | | | | |
| Selected per share data | | | | | | | | | | | | | | | | | | |
| | | Class E | |
| | | Six Months Ended
June 30, 2011
(Unaudited) | | | Year Ended December 31, | |
| | | | 2010 | | | 2009 | | | 2008 | | | 2007 | | | 2006 | |
| Net Asset Value, Beginning of Period | | $ | 9.75 | | | $ | 7.62 | | | $ | 5.24 | | | $ | 9.72 | | | $ | 8.67 | | | $ | 8.42 | |
| | | | | | | | | | | | | | | | | | | | | | | | |
| Income (Loss) from Investment Operations | | | | | | | | | | | | | | | | | | | | | | | | |
Net Investment Income (Loss)(a) | | | (0.02 | ) + | | | (0.02 | ) | | | (0.01 | ) | | | (0.01 | ) | | | 0.00 | + | | | 0.02 | |
Net Realized and Unrealized Gain (Loss) on Investments | | | 0.73 | | | | 2.15 | | | | 2.39 | | | | (3.48 | ) | | | 1.49 | | | | 0.52 | |
| | | | | | | | | | | | | | | | | | | | | | | | |
Total From Investment Operations | | | 0.71 | | | | 2.13 | | | | 2.38 | | | | (3.49 | ) | | | 1.49 | | | | 0.54 | |
| | | | | | | | | | | | | | | | | | | | | | | | |
| Less Distributions | | | | | | | | | | | | | | | | | | | | | | | | |
Distributions from Net Investment Income | | | — | | | | — | | | | — | | | | — | | | | (0.01 | ) | | | — | |
Distributions from Net Realized Capital Gains | | | (0.26 | ) | | | — | | | | — | | | | (0.99 | ) | | | (0.43 | ) | | | (0.29 | ) |
| | | | | | | | | | | | | | | | | | | | | | | | |
Total Distributions | | | (0.26 | ) | | | — | | | | — | | | | (0.99 | ) | | | (0.44 | ) | | | (0.29 | ) |
| | | | | | | | | | | | | | | | | | | | | | | | |
| Net Asset Value, End of Period | | $ | 10.20 | | | $ | 9.75 | | | $ | 7.62 | | | $ | 5.24 | | | $ | 9.72 | | | $ | 8.67 | |
| | | | | | | | | | | | | | | | | | | | | | | | |
| Total Return (%) | | | 7.20 | | | | 27.95 | | | | 45.42 | | | | (39.60 | ) | | | 17.62 | | | | 6.38 | |
| | | | | | |
| Ratios/Supplemental Data | | | | | | | | | | | | | | | | | | | | | | | | |
Ratio of Expenses to Average Net Assets (%) | | | 0.93 | * | | | 0.94 | | | | 0.94 | | | | 0.93 | | | | 0.95 | | | | 0.96 | |
Ratio of Net Expenses to Average Net Assets (%)(b) | | | 0.91 | * | | | 0.92 | | | | 0.92 | | | | 0.91 | | | | 0.93 | | | | 0.95 | |
Ratio of Net Investment Income (Loss) to Average Net Assets (%) | | | (0.40 | )* | | | (0.27 | ) | | | (0.19 | ) | | | (0.07 | ) | | | 0.00 | +++ | | | 0.22 | |
Portfolio Turnover Rate (%) | | | 22.8 | | | | 27.6 | | | | 31.5 | | | | 36.2 | | | | 35.5 | | | | 33.7 | |
Net Assets, End of Period (in millions) | | $ | 22.5 | | | $ | 24.6 | | | $ | 22.2 | | | $ | 17.3 | | | $ | 37.3 | | | $ | 25.0 | |
| + | | Net investment income was less than $0.01. |
| ++ | | Distributions from net investment income were less than $0.01. |
| +++ | | Ratio of net investment income to average net assets was less than 0.01% |
| (a) | | Per share amounts based on average shares outstanding during the period. |
| (b) | | Includes the effects of management fee waivers and expenses reimbursed by the Adviser, if applicable. |
See accompanying notes to financial statements.
13
MET INVESTORS SERIES TRUST
| | |
T. Rowe Price Mid Cap Growth Portfolio | | |
Notes to Financial Statements—June 30, 2011 (Unaudited)
1. Organization
Met Investors Series Trust (the “Trust”) is organized as a statutory trust under the laws of Delaware, as an open-end management investment company under the Investment Company Act of 1940, as amended (the “1940 Act”). The Trust currently offers fifty-four Portfolios (the “Portfolios”), each of which operates as a distinct investment vehicle of the Trust. The portfolio included in this report is T. Rowe Price Mid Cap Growth Portfolio (the “Portfolio”), which is diversified. Shares in the Portfolio are not offered directly to the general public and are currently available only to separate accounts established by Metropolitan Life Insurance Company (“MetLife”) and other affiliated life insurance companies.
The Portfolio has registered four classes of shares: Class A, B, C and E Shares. Class A, B and E Shares are currently offered by the Portfolio. Shares of each Class of the Portfolio represent an equal pro rata interest in the Portfolio and generally give the shareholder the same voting, dividend, liquidation, and other rights. Investment income, realized and unrealized capital gains and losses, the common expenses of the Portfolio and certain Portfolio-level expense reductions, if any, are allocated on a pro rata basis to each Class based on the relative net assets of each Class to the net assets of the Portfolio. Each Class of shares differs in its respective distribution expenses.
2. Significant Accounting Policies
The financial statements have been prepared in conformity with accounting principles generally accepted in the United States of America (“GAAP”) which require management to make estimates and assumptions that affect the reported amounts of assets and liabilities at the date of the financial statements and the reported amounts of income and expenses during the reporting period. Actual results could differ from these estimates. In the preparation of these financial statements, management has evaluated events and transactions subsequent to June 30, 2011 through the date that the financial statements were issued.
The following is a summary of significant accounting policies consistently followed by the Portfolio in the preparation of its financial statements.
Investment Valuation and Fair Value Measurements - Debt securities (other than short term obligations with a remaining maturity of sixty days or less) including corporate, convertible and municipal bonds and notes; U.S. government agencies; U.S. treasury obligations; sovereign issues; bank loans; and non-U.S. bonds are generally valued on the basis of evaluated or composite bid quotations obtained by independent pricing services and/or brokers and dealers selected by MetLife Advisers, LLC (“MLA” or the “Adviser”), an affiliate of MetLife, Inc., or the relevant Subadviser pursuant to authorization of the Board of Trustees of the Portfolio (the “Board”). Such quotations use inputs that are observable including, among other things, issuer details, interest rates, yield curves, prepayment speeds, credit risks/spreads, default rates and quoted prices for similar securities. Securities that use similar valuation techniques and inputs as described above are categorized as Level 2 within the fair value hierarchy.
Mortgage and asset-backed securities are usually issued as separate tranches, or classes, of securities within each deal. These securities are also generally valued on the basis of evaluated or composite bid quotations obtained by independent pricing services and/or brokers and dealers selected by the Adviser or relevant Subadviser pursuant to authorization of the Board. The pricing models for these securities usually consider tranche-level attributes, estimated cash flows for each tranche, market-based yield spreads for each tranche and current market data, and incorporate deal collateral performance, as available. Mortgage and asset-backed securities that use similar valuation techniques and inputs as described above are categorized as Level 2 within the fair value hierarchy.
Short term obligations with a remaining maturity of sixty days or less are valued at amortized cost which approximates fair market value and are categorized as Level 2 within the fair value hierarchy.
Equity securities such as common stock, exchange-traded funds and preferred stock that are traded on a national securities exchange or other exchanges are generally valued at their last sale price on the principal trading market. Equity securities traded on a national securities exchange or other exchanges for which there is no reported sale during the day are valued at the last reported bid price. A security that is listed or traded on more than one exchange is valued at the quotation on the exchange determined to be the primary market for that security by the Board or its delegates. If no closing price is available, then such securities are valued at the last reported bid price. Equity securities traded over-the-counter are generally valued at the last reported sales price. To the extent these securities are actively traded and valuation adjustments are not applied, they are categorized as Level 1 within the fair value hierarchy. Other equity securities traded on inactive markets or valued by reference to similar instruments are categorized as Level 2 within the fair value hierarchy.
Equity securities which are listed on foreign stock exchanges normally are valued at the market closing price, the last sale price on the day the securities are valued or, lacking any sales on such day, at the bid price. Valuation adjustments may be applied to certain equity securities that are solely traded on foreign exchanges closing before the U.S. market to account for the market movement between the close of the foreign exchanges and the close of the U.S. market. The Portfolio may use a systematic fair valuation model provided by an independent third party to value securities principally traded in these foreign markets closing before the U.S. market in order to adjust for possible stale pricing that may occur between the close of these foreign exchanges and the time of the Portfolio valuation. Securities using these valuation adjustments are categorized as Level 2 within the fair value hierarchy.
Investments in registered open-end management investment companies are valued at reported net asset value per share and are categorized as Level 1 within the fair value hierarchy.
14
MET INVESTORS SERIES TRUST
| | |
T. Rowe Price Mid Cap Growth Portfolio | | |
Notes to Financial Statements—June 30, 2011 (Unaudited)—(Continued)
2. Significant Accounting Policies - continued
Forward foreign currency exchange contracts are valued based on the mean between closing bid and asked prices of the forward currency rates in the London foreign exchange markets on a daily basis as provided by a reliable bank or dealer. These contracts are categorized as Level 2 within the fair value hierarchy.
Options, whether on securities, indices, futures contracts, or otherwise, are valued at the last sales price available as of the close of business on the day of valuation or, if there is no such sale price available, at the bid price. Options on currencies are valued at the spot price each day. These types of options are categorized as Level 1 within the fair value hierarchy. Other options traded on inactive markets where a broker quotation is received or options valued by an evaluated quote provided by an independent pricing vendor are categorized as Level 2 within the fair value hierarchy.
Futures contracts, which are traded on commodity exchanges, are valued at their closing prices as of the close of such exchanges and are categorized as Level 1 within the fair value hierarchy. Futures contracts traded on inactive markets where a broker quotation is received are categorized as Level 2 within the fair value hierarchy. As a general matter, futures contracts are marked-to-market daily.
Options and futures contracts that are traded over-the-counter are generally valued on the basis of broker dealer quotations or pricing service providers who use a series of techniques, including simulation pricing models, to determine the value of the contracts. The pricing models use inputs that are observed from actively quoted markets such as issuer details, indices, spreads, interest rates, curves and exchange rates. These contracts are categorized as Level 2 within the fair value hierarchy.
If no current market value quotation or other observable inputs are readily available or reliable for a security, the fair value of the security will be determined in accordance with procedures approved by and under the general supervision of the Board. The Board has delegated the determination in good faith of the fair value of securities for which current market quotations are not readily available to a Valuation Committee established by the Board. Market quotes and other observable inputs are considered not readily available in circumstances where there is an absence of current or reliable market-based data. In addition, market quotes would be considered not readily available when, due to extraordinary circumstances, the exchanges or markets on which the securities trade, do not open for trading for the entire day and no other market prices are available. When the Portfolio uses fair value pricing, it may take into account any factors it deems appropriate, including significant unobservable inputs. The value of securities used by the Portfolio to calculate its net asset value may differ from quoted or published prices for the same securities. Fair value pricing involves subjective judgments and the fair value determined for a security may be materially different than the value that could be realized upon the sale of that security. These securities are categorized as Level 3 within the fair value hierarchy.
Investment Transactions and Related Investment Income - Portfolio security transactions are recorded on the trade date. Dividend income is recorded on the ex-dividend date or, for certain foreign securities, when notified. Interest income, which includes amortization of premium and accretion of discount on debt securities, is recorded on the accrual basis. Realized gains and losses on investments and unrealized appreciation and depreciation are determined on the identified cost basis, which is the same basis used for federal income tax purposes. Foreign income and foreign capital gains on some foreign securities may be subject to foreign withholding taxes, which are accrued as applicable.
Income Taxes - It is the Portfolio’s policy to comply with the requirements of the Internal Revenue Code of 1986, as amended (the “Code”), and regulations thereunder, applicable to regulated investment companies and to distribute, with respect to each taxable year, all of its taxable income to shareholders. Therefore, no federal income tax provision is required. The Portfolio files U.S. federal and various state tax returns. No income tax returns are currently under examination. The Portfolio’s federal tax returns for the prior three fiscal years remain subject to examination by the Internal Revenue Service.
Dividends and Distributions to Shareholders - The Portfolio records dividends and distributions on the ex-dividend date. Net realized gains from security transactions (if any) are generally distributed annually to shareholders. The timing and characterization of certain income and capital gains distributions are determined in accordance with federal tax regulations that may differ from GAAP. Permanent book and tax basis differences relating to shareholder distributions will result in reclassification between under/over distributed net investment income, accumulated net realized gains/losses and paid in surplus. Book-tax differences are primarily due to broker commission recapture, foreign currency transaction, passive foreign investment companies (PFIC), deferred trustees’ compensation, capital loss carryforwards, and losses deferred due to wash sales, as applicable. These adjustments have no impact on net assets or the results of operations.
Securities Lending - The Portfolio may lend its portfolio securities to certain qualified brokers who borrow securities in order to complete certain securities transactions. By lending its portfolio securities, the Portfolio attempts to increase its net investment income through the receipt of income on the loaned securities. Any gain or loss in the market price of the loaned securities that might occur and any interest earned or dividends declared during the term of the loan would accrue to the account of the Portfolio.
The Trust has entered into a securities lending arrangement with the custodian, State Street Bank and Trust Company (the “custodian”). Under this arrangement, the custodian is authorized to loan portfolio securities on the Portfolio’s behalf. In exchange, the Portfolio receives either cash
15
MET INVESTORS SERIES TRUST
| | |
T. Rowe Price Mid Cap Growth Portfolio | | |
Notes to Financial Statements—June 30, 2011 (Unaudited)—(Continued)
2. Significant Accounting Policies - continued
or securities as collateral against the loaned securities. The Portfolio receives collateral at least equal to 102% of the market value of the loaned securities (105% for foreign equity securities), at each loan’s inception. Collateral representing at least 100% of the market value of the loaned securities must be maintained for the duration of the loan. Cash collateral is generally invested in the State Street Navigator Securities Lending Prime Portfolio (the “Navigator Portfolio”), managed by an affiliate of the custodian. The Navigator Portfolio is a registered money market fund which invests in a variety of high quality U.S. dollar-denominated instruments. If the market value of the collateral at the close of trading on a business day is less than 100% of the market value of the loaned securities at the close of trading on that day, the borrower shall be required to deliver, by the close of business on the following business day, an additional amount of collateral so that the total amount of posted collateral equals at least 100% of the market value of all the loaned securities as of such preceding day. A portion of net income (income after the deduction of expenses and fees of the Navigator Portfolio) on the collateral is rebated to the borrower of the securities and the remainder is split between the custodian and the Portfolio. On loans collateralized by U.S. Treasuries, a fee is received from the borrower and is allocated between the Portfolio and the custodian. The risks associated with lending portfolio securities include, but are not limited to, possible delays in receiving additional collateral or in the recovery of the loaned securities, possible loss of rights in the collateral should the borrower fail financially, as well as risk of loss in the value of the collateral or the value of the investments made with the collateral. Net interest income received by the Portfolio in securities lending transactions during the six months ended June 30, 2011 is disclosed in the footnotes to the Statement of Operations. Any outstanding loans by the Portfolio at June 30, 2011 are disclosed in the footnotes to the Schedule of Investments.
Repurchase Agreements - The Portfolio may enter into repurchase agreements with selected commercial banks and broker-dealers, under which the Portfolio acquires securities as collateral and agrees to resell the securities at an agreed upon time and at an agreed upon price. The Portfolio, through the custodian or a subcustodian, receives delivery of the underlying securities collateralizing repurchase agreements. The Portfolio requires the custodian to take possession, to have legally segregated in the Federal Reserve Book Entry System, or to have segregated within the custodian’s vault, all securities held as collateral for repurchase agreements. It is the Portfolio’s policy that the market value of the collateral be at least equal to 100% of the repurchase price in the case of a repurchase agreement of one-day duration and 102% of the repurchase price in the case of all other repurchase agreements. In connection with transactions in repurchase agreements, if the seller defaults and the value of the collateral declines or if the seller enters an insolvency proceeding, realization of the collateral by the Portfolio may be delayed, limited or wholly denied.
Directed Brokerage Agreement - The Trust has entered into a directed brokerage arrangement with State Street Global Markets (“SSGM”). Under this arrangement, the Portfolio directs certain trades to SSGM in return for a recapture credit. SSGM issues a cash rebate to the Portfolio. Amounts paid to the Portfolio are shown separately as broker commission recapture on the Statement of Operations of the Portfolio.
Foreign Currency Translation - The books and records of the Portfolio are maintained in U.S. dollars. The values of securities, currencies and other assets and liabilities denominated in currencies other than U.S. dollars are translated into U.S. dollars based upon foreign exchange rates prevailing at the end of the period. Purchases and sales of investment securities, income and expenses are translated on the respective dates of such transactions. Since the values of investment securities are presented at the foreign exchange rates prevailing at the end of the period, it is not practical to isolate that portion of the results of operations arising from changes in exchange rates from that portion of the results of operations reflecting fluctuations arising from changes in market prices of the investment securities. Such fluctuations are included in the net realized and unrealized gain or loss on investments.
Net realized foreign exchange gains or losses arise from activity in forward foreign currency exchange contracts, sales of foreign currency, currency gains or losses realized between the trade and settlement dates on securities transactions, and the difference between the amounts of dividends, interest, and foreign withholding taxes recorded by the Portfolio and the U.S. dollar equivalent of the amounts actually received or paid by the Portfolio. Gains and losses attributable to foreign currency exchange rates on sales of securities are recorded as Net realized gains and losses on investments. Net unrealized foreign exchange gains and losses arise from changes in the value of assets and liabilities, other than investment securities, resulting from changes in foreign exchange rates.
3. Investment Management Agreement and Other Transactions with Affiliates
Investment Management Agreement - The Trust is managed by the Adviser. The Trust has entered into a management agreement with the Adviser (the “Management Agreement”) for investment management services in connection with the investment management of the Portfolio. The Adviser is subject to the supervision and direction of the Board and has overall responsibility for the general management and administration of the Trust. The Adviser has entered into a subadvisory agreement with T. Rowe Price Associates, Inc. (the “Subadviser”) for investment subadvisory services in connection with the investment management of the Portfolio.
Subject to the supervision and direction of the Board, the Adviser supervises the Subadviser and has full discretion with respect to the retention or renewal of the subadvisory agreement. The Adviser pays the Subadviser a fee based on the Portfolio’s average daily net assets.
16
MET INVESTORS SERIES TRUST
| | |
T. Rowe Price Mid Cap Growth Portfolio | | |
Notes to Financial Statements—June 30, 2011 (Unaudited)—(Continued)
3. Investment Management Agreement and Other Transactions with Affiliates - continued
Under the terms of the Portfolio’s Management Agreement, the Portfolio pays the Adviser a monthly fee based upon annual rates applied to the Portfolio’s average daily net assets as follows:
| | | | | | | | |
Management Fees
earned by the Adviser
for the six months ended
June 30, 2011 | | % per annum | | | Average Daily Net Assets | |
| | |
| $6,179,915 | | | 0.75 | % | | | All | |
Certain officers and trustees of the Trust may also be officers of the Adviser; however, such officers and trustees receive no compensation from the Trust.
Management Fee Waiver - Effective February 17, 2005, the Subadviser has agreed to a voluntary subadvisory fee waiver that applies if (i) assets under management by the Subadviser for the Trust and Metropolitan Series Fund, Inc. (“MSF”) in the aggregate exceed $750,000,000, (ii) the Subadviser subadvises three or more portfolios of the Trust and MSF in the aggregate and (iii) at least one of those portfolios is a large cap domestic equity portfolio. The Adviser has voluntarily agreed to reduce its management fee for the Portfolio by the amount waived (if any) by the Subadviser for the Portfolio pursuant to this voluntary subadvisory fee waiver. Amounts waived for the six months ended June 30, 2011 are shown as a management fee waiver in the Statement of Operations.
The subadvisory fee waiver schedule for the period January 1 through June 30, 2011 was:
| | |
| Percentage Fee Waiver | | Combined Assets |
| |
| 0.0% | | First $750 Million |
| |
| 5.0% | | Next $750 Million |
| |
| 7.5% | | Next $1.5 Billion |
| |
| 10.0% | | Excess over $3 Billion |
Transfer Agency Agreement - MetLife serves as the transfer agent for the Trust. MetLife receives no fees for its services to the Trust under the transfer agency agreement.
Distribution Agreements and Plans - The Trust has distribution agreements with MetLife Investors Distribution Company (“MIDC” or the “Distributor”) in which MIDC serves as the Distributor for the Trust’s Class A, Class B and Class E Shares. MIDC is a wholly-owned subsidiary of MetLife Investors Group, Inc., an affiliate of the Adviser. The Class B and Class E distribution plans provide that the Trust, on behalf of the Portfolio, may pay annually up to 0.50% and 0.25%, respectively, of the average daily net assets of the Portfolio attributable to its Class B and Class E Shares with respect to activities primarily intended to result in the sale of Class B and Class E Shares. However, under the Class B and Class E distribution agreements, payments to the Distributor for activities pursuant to the Class B and Class E distribution plans are currently limited to payments at an annual rate equal to 0.25% and 0.15% of average daily net assets of the Portfolio attributable to its Class B and Class E Shares, respectively. Amounts incurred by the Portfolio for the six months ended June 30, 2011 are shown as Distribution and service fees in the Statement of Operations.
Under the terms of the Class B and Class E distribution plans and distribution agreements, the Portfolio is authorized to make payments monthly to the Distributor that may be used to pay or reimburse entities providing distribution and shareholder servicing with respect to the Class B and Class E Shares for such entities’ fees or expenses incurred.
Deferred Trustee Compensation - Each Trustee of the Trust who is not currently an employee of the Adviser or any of its affiliates receives compensation from the Trust for his or her service to the Portfolio. A deferred compensation plan (the “Plan”) is available to the Trustees on a voluntary basis. Deferred amounts remain in the Trust until distributed in accordance with the provisions of the Plan. The value of a participating Trustee’s deferral account is based on theoretical investments of deferred amounts, on the normal payment dates, in certain portfolios of the Trust or Metropolitan Series Fund, Inc. as designated by the participating Trustee. Changes in the value of participants’ deferral accounts are reflected as Trustees’ fees and expenses in the Statement of Operations. The portion of the accrued obligations allocated to the Portfolio, if any, under the Plan are reflected as Deferred trustees’ fees in the Statement of Assets and Liabilities.
17
MET INVESTORS SERIES TRUST
| | |
T. Rowe Price Mid Cap Growth Portfolio | | |
Notes to Financial Statements—June 30, 2011 (Unaudited)—(Continued)
4. Investment Transactions
Aggregate cost of purchases and proceeds of sales of investment securities, excluding short-term securities, for the six months ended June 30, 2011 were as follows:
| | | | | | | | | | | | |
| Purchases | | | Sales | |
| U.S. Government | | Non U.S. Government | | | U.S. Government | | | Non U.S. Government | |
| | | |
| $— | | $ | 358,744,608 | | | $ | — | | | $ | 401,417,162 | |
5. Investments in Derivative Instruments
Investments in Derivative Instruments - Authoritative accounting guidance requires qualitative disclosures about objectives and strategies for using derivatives, quantitative disclosures about fair value amounts of and gains and losses on derivative instruments, and disclosures about credit risk-related contingent features in derivative agreements. The disclosure requirements distinguish between derivatives which are accounted for as “hedges” and those that do not qualify for such accounting.
Futures Contracts - The Portfolio may buy and sell futures contracts (on recognized exchanges) as a hedge, to maintain investment exposure to a target asset class or to enhance return. The Portfolio may be subject to fluctuations in equity prices, interest rates, and foreign currency exchange rates in the normal course of pursuing its investment objective. Futures contracts are standardized agreements to buy or sell a security, or deliver a final cash settlement price in connection with an index, interest rate, currency, or other asset, for a set price in the future. The Portfolio must deposit an amount (“initial margin”) equal to a certain percentage of the face value of the futures contract. The initial margin may be in the form of cash or securities which is returned when the Portfolio’s obligations under the contract have been satisfied. Futures contracts are marked-to-market daily and subsequent payments (“variation margin”) are made or received by the Portfolio depending on the daily fluctuations in the value of the futures contract. These amounts are reflected as receivables or payables on the Statement of Assets and Liabilities. Risks of entering into futures contracts (and related options) include the possibility that the market for these instruments may be illiquid and that a change in the value of the contract or option may not correlate perfectly with changes in the value of the underlying securities. Futures contracts are exchange traded and the exchange’s clearinghouse, as counterparty to all exchange traded futures, guarantees the futures contracts against default.
During the six months ended June 30, 2011, the Portfolio entered into equity index futures contracts which were subject to equity price risk. During the period April 26 through April 28, 2011, the Portfolio had bought and sold $117,190,779 in equity index futures contracts. At June 30, 2011, the Portfolio did not have any open futures contracts. For the six months ended June 30, 2011, the Portfolio had realized gains in the amount of $843,705 which are shown under Net realized gain on futures contracts in the Statement of Operations.
6. Contractual Obligations
The Trust has a variety of indemnification obligations under contracts with its service providers. The Trust’s maximum exposure under these arrangements is unknown.
7. Market, Credit and Counterparty Risk
In the normal course of business, the Portfolio invests in securities and enters into transactions where risks exist due to fluctuations in the market (market risk) or failure of the other party to a transaction to perform (credit and counterparty risk). The value of securities held by the Portfolio may decline in response to certain events, including those directly involving the companies whose securities are owned by the Portfolio; conditions affecting the general economy; overall market changes; local, regional or global political, social or economic instability; and currency and interest rate and price fluctuations. The Portfolio may be exposed to counterparty risk, or the risk that an entity with which the Portfolio has unsettled or open transactions may default. The potential loss could exceed the value of the financial assets recorded in the financial statements. Financial assets that potentially expose the Portfolio to credit risk consist principally of cash due from counterparties and investments. In order to preserve certain safeguards for derivatives and non-standard settlement trades, the Portfolio restricts its exposure to credit losses by entering into master netting agreements with counterparties (approved brokers) with whom it undertakes a significant volume of transactions. The Portfolio reduces the credit risk associated with favorable contracts by entering into a master netting arrangement to the extent that all amounts with the counterparty are terminated and settled on a net basis if an event of default occurs. The Portfolio’s overall exposure to credit risk on derivative instruments subject to master netting arrangements can change substantially within a short period, as it is affected by each transaction subject to the arrangement.
18
MET INVESTORS SERIES TRUST
| | |
T. Rowe Price Mid Cap Growth Portfolio | | |
Notes to Financial Statements—June 30, 2011 (Unaudited)—(Continued)
8. Affiliated Issuer
At the end of the period, the Portfolio was the owner of record of 5% or more of the total outstanding voting shares of the following investment company:
| | | | | | | | | | | | | | | | | | | | |
Security Description | | Number of shares
held at
December 31, 2010 | | | Shares purchased | | | Shares sold | | | Number of shares
held at
June 30, 2011 | | | Income earned
from affiliates
during the period | |
| | | | | |
T. Rowe Price Government Reserve Investment Fund | | | 77,240,903 | | | | 144,051,986 | | | | (158,163,536 | ) | | | 63,129,353 | | | $ | 61,230 | |
9. Income Tax Information
The tax character of distributions paid for the years ended December 31, 2010 and 2009 were as follows:
| | | | | | | | | | | | | | | | | | | | |
| Ordinary Income | | | Long-Term Capital Gain | | | Total | |
| 2010 | | 2009 | | | 2010 | | | 2009 | | | 2010 | | | 2009 | |
| | | | | |
| $— | | $ | — | | | $ | — | | | $ | — | | | $ | — | | | $ | — | |
There were no distributions paid for the years ending December 31, 2010 and 2009.
As of December 31, 2010, the components of distributable earnings (accumulated losses) on a federal income tax basis were as follows:
| | | | | | | | | | | | | | | | |
Undistributed
Ordinary
Income | | Undistributed
Long-Term Capital
Gain | | | Net
Unrealized
Appreciation | | | Loss Carryforwards | | | Total | |
| | | | |
| $— | | $ | 42,980,885 | | | $ | 401,692,652 | | | $ | — | | | $ | 444,673,537 | |
The Regulated Investment Company Modernization Act of 2010 (the “Act”) was signed into law by President Obama on December 22, 2010.
The Act makes a number of changes to the provisions in the Code relating to regulated investment companies (“RICs”) that will generally become effective for taxable years of RICs beginning after December 22, 2010. The Act allows RICs to generally carryover net capital losses indefinitely, effective for losses arising in taxable years beginning after December 22, 2010. Such losses will retain their character as either long-term capital losses or short-term capital losses. Under pre-enactment law, capital losses could be carried forward for eight years and carried forward as short-term capital losses irrespective of the character of the original loss. Loss carryovers from years beginning prior to December 22, 2010 will still expire subject to the eight-year limitation. The Act further provides that losses arising in taxable years after December 22, 2010 (which are carried forward indefinitely) would be utilized prior to loss carryovers arising in taxable years beginning prior to December 22, 2010.
10. Recent Accounting Pronouncements
In January 2010, the Financial Accounting Standards Board (“FASB”) issued Accounting Standards Update No. 2010-06, “Improving Disclosures About Fair Value Measurements” (“ASU”) which was generally effective for years beginning after December 15, 2009 and was adopted by the Portfolio. The ASU requires enhanced disclosures about purchases, sales, issuances and settlements on a gross basis relating to Level 3 fair value measurements. These enhanced disclosures became effective for fiscal years beginning after December 15, 2010, and for interim periods within those years. Management has evaluated the impact of ASU 2010-06 and has concluded that ASU 2010-06 has no material impact on these financial statements.
In May 2011, FASB issued Accounting Standards Update (ASU) No. 2011-04 “Amendments to Achieve Common Fair Value Measurement and Disclosure Requirements in GAAP and the International Financial Reporting Standards (IFRS).” ASU 2011-04 includes common requirements for measurement of and disclosure about fair value between U.S. GAAP and IFRS. ASU 2011-04 will require reporting entities to categorize within Level 3 of the fair value hierarchy: quantitative information about the unobservable inputs used in the fair value measurement, the valuation processes used by the reporting entity and a narrative description of the sensitivity of the fair value measurement to changes in unobservable inputs and the interrelationships between those unobservable inputs. In addition, ASU 2011-04 will require reporting entities to make disclosures about amounts and reasons for all transfers in and out of Level 1 and Level 2 fair value measurements. The new and revised disclosures are effective for fiscal years beginning after December 15, 2011 and for interim periods within those fiscal years. Management is currently evaluating the implications of ASU 2011-04 and its impact on the financial statements.
19
MET INVESTORS SERIES TRUST
| | |
T. Rowe Price Mid Cap Growth Portfolio | | |
Quarterly Portfolio Schedule
The Trust files Form N-Q for the first and third quarters of each fiscal year. The Trust’s Forms N-Q will be available on the Securities and Exchange Commission’s website at http://www.sec.gov. The Trust’s Forms N-Q may be reviewed and copied at the Securities and Exchange Commission’s Public Reference Room in Washington, D.C. and information on the operation of the Public Reference Room may be obtained by calling 1-800-SEC-0330. Once filed, the most recent Form N-Q will be available without charge, upon request, by calling (800) 848-3854.
Proxy Voting Policies and Procedures
A description of the policies and procedures that the Trust uses to determine how to vote proxies relating to portfolio securities is available without charge, upon request, by calling (800) 848-3854 and on the Securities and Exchange Commission’s website at http://www.sec.gov.
Proxy Voting Record
The Trust, on behalf of each of its Portfolios, has filed with the Securities and Exchange Commission its proxy voting record for the 12-month period ending June 30 on Form N-PX. Form N-PX must be filed by the Trust each year by August 31. Once filed, the most recent Form N-PX will be available without charge, upon request, by calling (800) 848-3854 or on the Securities and Exchange Commission’s website at http://www.sec.gov.
20
Simplify your life…
with MetLife eDelivery® while helping MetLife preserve the planet’s natural resources.
(see details on inside cover)
| | |
Met Investors Series Trust Third Avenue Small Cap Value Portfolio Semiannual Report | | June 30, 2011, as amended December 16, 2011 |
MET INVESTORS SERIES TRUST
| | |
Third Avenue Small Cap Value Portfolio | | |
Managed by Third Avenue Management LLC
Portfolio Manager Commentary*
Performance
For the six-month period ended June 30, 2011, the Class A and B shares of the Third Avenue Small Cap Value Portfolio returned 2.88% and 2.67%, respectively, compared to its benchmarks, the Russell 2000 Value Index1 and the Dow Jones U.S. Small-Cap Total Stock Market Index2, which returned 3.77% and 7.72%, respectively.
Market Environment / Conditions
The U.S. economy showed resilience during the first half of 2011 and the operational results of its public companies are mostly showing rising profits and rising cash balances. Also, as we have predicted in the past, mergers and acquisitions activity has continued to increase, both in the U.S. and around the world. Unfortunately, some exogenous events have weighed on equity prices, though this has, in some cases, created buying opportunities for us at Third Avenue. Global equity markets began to tumble in mid-May, as fears spread regarding a possible sovereign default in Greece that might have sparked a financial crisis within the European Union. The International Monetary Fund, the European Commission and the European Central Bank all demanded that Greece adopt further unpopular austerity measures before receiving further bailout funds from the EU. As is typical, negotiations in Greece’s parliament went down to the wire and while the EU’s demands were ultimately met, the resolution was unclear for most of the quarter. This uncertainty, along with fears about the possible effects of a government-engineered economic slowdown in China, weighed on stock prices and made for an uncomfortable end to spring.
Portfolio Review / Current Positioning
At Third Avenue, sector allocations are determined from the bottom up. Our investments in real estate management and development, as well as the hotel and leisure industries, were performance detractors. Owing largely to the recent takeover of Bronco Drilling, energy equipment services companies were the largest contributors to performance for the six months ended June 30, 2011. A discussion of individual performance detractors and contributors follows.
Skyline Corp., down 31.8%, was the largest detractor from performance so far in 2011. Skyline is a producer of manufactured homes and recreation vehicles. Its business continues to be depressed due to a decline in industry sales and a lack of retail financing opportunities. The balance sheet is strong with $53.4 million in cash and short-term investments and no debt, positioning Skyline well for an industry recovery.
The next largest detractor from performance was Tellabs, Inc., down 31.5% for the first two quarters. For the first quarter of 2011, Tellabs reported a $24.1 million loss compared with profit of $45.6 million in the first quarter of 2010 as sales from North American customers, which have typically accounted for more than half of revenues, fell 36% and gross margins fell from over 50% to 38%. Tellabs has cash and short term investments worth $1.06 billion, leaving cash and investments less debt supporting 68% of its market capitalization.
Our top performance contributor for the first half of the year, as it was in the first quarter, was Bronco Drilling Co., Inc., up 37.5%. Bronco, a U.S. oil and land gas drilling company, also saw its share price double during the fourth quarter of 2010 as it benefitted from increased inland exploration and production activity and utilization of its drills. We sold our position in Bronco after its announced acquisition by Chesapeake Energy at a 6% premium over its mid-April share price.
Our next top contributor to performance for the quarter was Westlake Chemical Corp., up 19.7%. Westlake, a petrochemical company producing plastic resins and PVC building products is a well managed company with a strong balance sheet that has been performing well over the last year. Westlake continues to benefit from low natural gas prices and high oil prices, as its raw materials are natural gas derivates, while its global competitors rely on oil as the basis for their manufacturing.
We sold our investment in Bronco Drilling after the announcement of the Chesapeake Energy Corp. takeover, and our investment in Herley Industries was similarly exited with its takeover by Kratos Defense and Security Solutions in a cash transaction. Shares of Parco (Japan) were sold to Aeon, a publicly listed Japanese retailer after we negotiated a 15% premium to its market price. We sold our investment in Cimarex Energy as the stock price had climbed to what we deemed its full value. Portfolio company New Alliance Bancshares merged with First Niagara Financial Group to form a much larger regional bank in the Northeast. As a result of the merger, First Niagara became part of the portfolio.
In order of the amount of capital invested, new positions in the portfolio that attained a meaningful size include:
Viterra, Inc. (Canada), a diversified grain handling and storage company with irreplaceable networks for bringing grains to market, primarily in North America and Australia.
Mantech International, which provides information technology, cyber security, technical and consulting services primarily to U.S. federal government agencies, with a large exposure to the Department of Defense and intelligence community.
Oshkosh Corp., a manufacturer of heavy vehicles and vehicle bodies, mostly for defense, construction, and municipal customers.
The Madison Square Garden Company, owner of New York’s Madison Square Garden, the New York Knicks and the New York Rangers, as well as media properties.
Liberty Media—Starz is the television programming subsidiary of Liberty Media Group.
Seacor Holdings, a well-run and well-financed conglomerate that provides logistical services to various commodities related industries including offshore oil and gas and inland chemical and petroleum shipping.
1
MET INVESTORS SERIES TRUST
| | |
Third Avenue Small Cap Value Portfolio | | |
Managed by Third Avenue Management LLC
Portfolio Manager Commentary* (continued)
Third Avenue adheres to a disciplined investment strategy driven by our deep dive fundamental analysis of companies and the securities they issue. We don’t choose investments based on top-down themes or macroeconomic forecasts. Our strategy is to maintain a portfolio of well-financed and well-managed companies acquired at a discount to net asset value in order to build a portfolio that is measurably cheaper than the market and to hold these investments for the long-term in the belief that the value of our investments will ultimately be recognized in the marketplace.
Curtis Jensen, Chief Investment Officer
Ian Lapey, Portfolio Manager
Third Avenue Management LLC
*This commentary may include statements that constitute “forward-looking statements” under the U.S. securities laws. Forward-looking statements include, among other things, projections, estimates, and information about possible or future results related to the Portfolio, market or regulatory developments. The views expressed above are not guarantees of future performance or economic results and involve certain risks, uncertainties and assumptions that could cause actual outcomes and results to differ materially from the views expressed herein. The views expressed above are subject to change at any time based upon economic, market, or other conditions and the subadvisory firm undertakes no obligation to update the views expressed herein. Any discussions of specific securities should not be considered a recommendation to buy or sell those securities. The views expressed above (including any forward-looking statement) may not be relied upon as investment advice or as an indication of the Portfolio’s trading intent. Information about the Portfolio’s holdings, asset allocation or country diversification is historical and is not an indication of future Portfolio composition, which may vary. Direct investment in any index is not possible. The performance of any index mentioned in this commentary has not been adjusted for ongoing management, distribution and operating expenses, and sales charges applicable to mutual fund investments. In addition, the returns do not reflect additional fees charged by separate accounts or variable insurance contracts that an investor in the Portfolio may pay. If these additional fees were reflected, performance would have been lower.
Portfolio Composition as of June 30, 2011
Top Holdings
| | | | |
| | |
% of
Net Assets | |
Superior Industries International, Inc. | | | 3.1 | |
Wheelock & Co., Ltd. | | | 2.7 | |
Cavco Industries, Inc. | | | 2.5 | |
Canfor Corp. | | | 2.5 | |
Montpelier Re Holdings, Ltd. | | | 2.5 | |
Alexander & Baldwin, Inc. | | | 2.2 | |
K-Swiss, Inc. - Class A | | | 2.1 | |
AVX Corp. | | | 2.0 | |
Ingram Micro, Inc. - Class A | | | 2.0 | |
Vail Resorts, Inc. | | | 1.9 | |
Top Sectors
| | | | |
| | | % of Market Value of Total Investments | |
Cyclical | | | 20.6 | |
Cash & Equivalents | | | 19.5 | |
Financial | | | 15.2 | |
Industrial | | | 13.9 | |
Basic Materials | | | 8.1 | |
Technology | | | 7.1 | |
Non-Cyclical | | | 5.8 | |
Communications | | | 4.7 | |
Energy | | | 2.6 | |
Diversified | | | 2.5 | |
2
MET INVESTORS SERIES TRUST
| | |
Third Avenue Small Cap Value Portfolio | | |
Third Avenue Small Cap Value Portfolio managed by
Third Avenue Management LLC vs. Russell 2000 Value Index1 and
Dow Jones U.S. Small-Cap Total Stock Market Index2
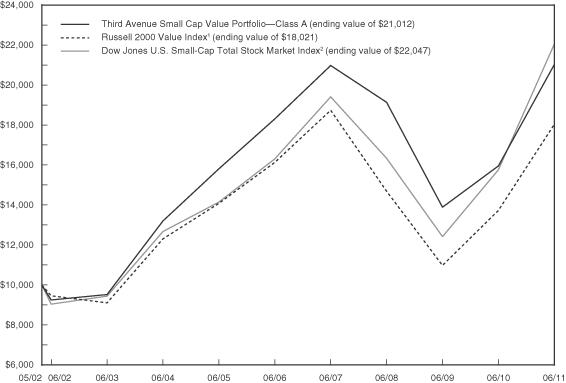
| | | | | | | | | | | | | | | | |
| | | Average Annual Return3 (for the six months ended June 30, 2011) | |
| | | 6 Month | | | 1 Year | | | 5 Year | | | Since
Inception4 | |
| Third Avenue Small Cap Value Portfolio—Class A | | | 2.88% | | | | 31.79% | | | | 2.80% | | | | 8.44% | |
| Class B | | | 2.67% | | | | 31.43% | | | | 2.55% | | | | 8.19% | |
| Russell 2000 Value Index1 | | | 3.77% | | | | 31.35% | | | | 2.24% | | | | 6.62% | |
| Dow Jones U.S. Small-Cap Total Stock Market Index2 | | | 7.72% | | | | 40.01% | | | | 6.24% | | | | 9.01% | |
The performance of Class A shares, as set forth in the line graph above, will differ from that of the other class of shares because of the difference in expenses paid by policyholders investing in the different share classes.
1The Russell 2000 Value Index is an unmanaged measure of performance of those Russell 2000 companies with lower price-to-book ratios and lower forecasted growth values.
2The Dow Jones U.S. Small-Cap Total Stock Market Index is a float-adjusted market capitalization weighted index that reflects the shares of securities of the small-cap portion of the Dow Jones U.S. Total Full Cap Equity Index available to investors in the marketplace. The Index includes the components ranked 751 to 2,500 by full market capitalization.
3 “Average Annual Return” is calculated including reinvestment of all income dividends and capital gain distributions.
4 Inception of the Class A and Class B shares is 5/1/02. Index returns are based on an inception date of 5/1/02.
Past performance does not guarantee future results. The investment return and principal value of an investment in the Portfolio will fluctuate, so that shares, on any given day or when redeemed, may be worth more or less than their original cost. Performance numbers are net of all Portfolio expenses but do not include any insurance, sales, or administration charges of variable annuity or life insurance contracts. If these charges were included, the returns would be lower. The Indexes do not include fees or expenses and are not available for direct investment.
3
MET INVESTORS SERIES TRUST
| | |
Third Avenue Small Cap Value Portfolio | | |
Understanding Your Portfolio’s Expenses
Shareholder Expense Example
As a shareholder of the Portfolio, you incur ongoing costs, including management fees; distribution and service (12b-1) fees; and other Portfolio expenses. This example is intended to help you understand your ongoing costs (in dollars) (referred to as “expenses”) of investing in the Portfolio and compare these costs with the ongoing costs of investing in other mutual funds. The example is based on an investment of $1,000 invested at the beginning of the period and held for the entire period, January 1, 2011 through June 30, 2011.
Actual Expenses
The first line for each share class of the Portfolio in the table below provides information about actual account values and actual expenses. You may use the information in this line, together with the amount you invested in the particular share class of the Portfolio, to estimate the expenses that you paid over the period. Simply divide your account value by $1,000 (for example, an $8,600 account value divided by $1,000 = 8.6), then multiply the result by the number in the first line under the heading entitled “Expenses Paid During Period” to estimate the expenses you paid on your account during this period.
Hypothetical Example for Comparison Purposes
The second line for each share class of the Portfolio in the table below provides information about hypothetical account values and hypothetical expenses based on the Portfolio’s actual expense ratio and an assumed rate of return of 5% per year before expenses, which is not the Portfolio’s actual return. The hypothetical account values and expenses may not be used to estimate the actual ending account balance or expenses you paid for the period. You may use this information to compare the ongoing costs of investing in the Portfolio and other funds. To do so, compare this 5% hypothetical example with the 5% hypothetical examples that appear in the shareholder reports of the other funds.
Please note that the expenses shown in the table are meant to highlight your ongoing costs only and do not reflect any fees or charges of your variable insurance product or any additional expenses that participants in certain eligible qualified plans may bear relating to the operations of their plan. Therefore, the second line for each share class in the table is useful in comparing ongoing costs only, and will not help you determine the relative total costs of owning different funds. In addition, if these other costs were included, your costs would have been higher.
| | | | | | | | | | | | | | | | |
| | | Annualized
Expense
Ratio | | | Beginning
Account Value
January 1, 2011 | | | Ending
Account Value
June 30, 2011 | | | Expenses Paid
During Period** January 1, 2011 to June 30, 2011 | |
| | | | | | | | | | | | | |
| | | | | | | | | | | | | | | | |
| | | | |
| | | | | | | | | | | | | | | | |
Class A | | | | | | | | | | | | | | | | |
Actual | | | 0.77% | | | $ | 1,000.00 | | | $ | 1,028.80 | | | $ | 3.87 | |
Hypothetical* | | | 0.77% | | | | 1,000.00 | | | | 1,020.98 | | | | 3.86 | |
| | | | | | | | | | | | | | | | |
| | | | |
| | | | | | | | | | | | | | | | |
Class B | | | | | | | | | | | | | | | | |
Actual | | | 1.02% | | | $ | 1,000.00 | | | $ | 1,026.7 | | | $ | 5.13 | |
Hypothetical* | | | 1.02% | | | | 1,000.00 | | | | 1,019.74 | | | | 5.11 | |
| | | | | | | | | | | | | | | | |
* Hypothetical assumes a rate of return of 5% per year before expenses.
** Expenses paid are equal to the Portfolio’s annualized expense ratio for the most recent six month period, as shown above, multiplied by the average account value over the period, multiplied by the number of days (181 days) in the most recent fiscal half-year, divided by 365 (to reflect the one-half year period).
4
MET INVESTORS SERIES TRUST
| | |
Third Avenue Small Cap Value Portfolio | | |
Schedule of Investments as of June 30, 2011 (Unaudited)
Common Stocks—79.9% of Net Assets
| | | | | | | | |
| Security Description | |
Shares | | | Value | |
| | | | | | | | |
| | |
| Auto Components—3.1% | | | | | | | | |
Superior Industries International, Inc. (a) | | | 1,941,976 | | | $ | 42,937,089 | |
| | | | | | | | |
| | |
| Beverages—1.2% | | | | | | | | |
Sapporo Holdings, Ltd. | | | 4,051,800 | | | | 16,676,876 | |
| | | | | | | | |
| | |
| Building Products—0.8% | | | | | | | | |
Insteel Industries, Inc. | | | 855,820 | | | | 10,731,983 | |
| | | | | | | | |
| | |
| Capital Markets—2.0% | | | | | | | | |
Investment Technology Group, Inc.* | | | 1,150,635 | | | | 16,131,903 | |
Westwood Holdings Group, Inc. | | | 315,624 | | | | 12,025,274 | |
| | | | | | | | |
| | | | | | | 28,157,177 | |
| | | | | | | | |
| | |
| Chemicals—3.1% | | | | | | | | |
Lanxess AG | | | 134,961 | | | | 11,081,213 | |
Minerals Technologies, Inc. | | | 152,659 | | | | 10,119,765 | |
Stepan Co. | | | 19,153 | | | | 1,357,948 | |
Westlake Chemical Corp. | | | 399,837 | | | | 20,751,540 | |
| | | | | | | | |
| | | | | | | 43,310,466 | |
| | | | | | | | |
| |
| Commercial & Professional Services—0.8% | | | | | |
UniFirst Corp. | | | 211,455 | | | | 11,881,656 | |
| | | | | | | | |
| | |
| Communications Equipment—4.0% | | | | | | | | |
Bel Fuse, Inc.—Class B | | | 457,269 | | | | 9,918,164 | |
Sycamore Networks, Inc. | | | 947,195 | | | | 21,065,617 | |
Tellabs, Inc. | | | 5,498,462 | | | | 25,347,910 | |
| | | | | | | | |
| | | | | | | 56,331,691 | |
| | | | | | | | |
| | |
| Computers & Peripherals—2.2% | | | | | | | | |
Electronics for Imaging, Inc.* | | | 580,701 | | | | 9,999,671 | |
Lexmark International, Inc.—Class A* | | | 697,460 | | | | 20,407,680 | |
| | | | | | | | |
| | | | | | | 30,407,351 | |
| | | | | | | | |
| | |
| Diversified Financial Services—2.5% | | | | | | | | |
Ackermans & van Haaren N.V. | | | 243,811 | | | | 23,721,925 | |
Leucadia National Corp. | | | 336,339 | | | | 11,469,160 | |
| | | | | | | | |
| | | | | | | 35,191,085 | |
| | | | | | | | |
| | |
| Electrical Equipment—1.4% | | | | | | | | |
Encore Wire Corp. | | | 825,737 | | | | 19,999,350 | |
| | | | | | | | |
|
| Electronic Equipment, Instruments & Components—6.5% | |
AVX Corp. | | | 1,824,452 | | | | 27,804,648 | |
Electro Scientific Industries, Inc.* (a) | | | 1,036,485 | | | | 20,004,161 | |
Ingram Micro, Inc.—Class A* | | | 1,527,451 | | | | 27,707,961 | |
Park Electrochemical Corp. | | | 565,162 | | | | 15,796,278 | |
| | | | | | | | |
| | | | | | | 91,313,048 | |
| | | | | | | | |
| | | | | | | | |
| | |
| Energy Equipment & Services—4.1% | | | | | | | | |
Bristow Group, Inc. | | | 407,497 | | | $ | 20,790,497 | |
Pioneer Drilling Co.* | | | 324,324 | | | | 4,942,698 | |
SEACOR Holdings, Inc. | | | 166,528 | | | | 16,646,139 | |
Tidewater, Inc. | | | 282,803 | | | | 15,217,629 | |
| | | | | | | | |
| | | | | | | 57,596,963 | |
| | | | | | | | |
| | |
| Food Products—2.3% | | | | | | | | |
Sanderson Farms, Inc. | | | 203,666 | | | | 9,731,162 | |
Viterra, Inc. | | | 2,076,450 | | | | 22,568,002 | |
| | | | | | | | |
| | | | | | | 32,299,164 | |
| | | | | | | | |
| |
| Health Care Equipment & Supplies—0.3% | | | | | |
Teleflex, Inc. | | | 62,111 | | | | 3,792,498 | |
| | | | | | | | |
| |
| Health Care Providers & Services—1.5% | | | | | |
Cross Country Healthcare, Inc.* (a) | | | 2,707,534 | | | | 20,577,258 | |
| | | | | | | | |
| | |
| Hotels, Restaurants & Leisure—1.9% | | | | | | | | |
Vail Resorts, Inc. | | | 582,377 | | | | 26,917,465 | |
| | | | | | | | |
| | |
| Household Durables—5.3% | | | | | | | | |
Cavco Industries, Inc.* (a) | | | 787,653 | | | | 35,444,385 | |
M.D.C. Holdings, Inc. | | | 144,759 | | | | 3,566,862 | |
Skyline Corp. (a) | | | 1,157,658 | | | | 20,259,015 | |
Stanley Furniture Co., Inc.* (a) | | | 3,543,535 | | | | 14,847,411 | |
| | | | | | | | |
| | | | | | | 74,117,673 | |
| | | | | | | | |
| | |
| Insurance—6.4% | | | | | | | | |
Arch Capital Group, Ltd.* | | | 370,350 | | | | 11,821,572 | |
E-L Financial Corp. | | | 40,155 | | | | 18,323,256 | |
HCC Insurance Holdings, Inc. | | | 391,919 | | | | 12,345,449 | |
Montpelier Re Holdings, Ltd. | | | 1,917,672 | | | | 34,518,096 | |
National Western Life Insurance Co.—Class A | | | 82,335 | | | | 13,129,962 | |
| | | | | | | | |
| | | | | | | 90,138,335 | |
| | | | | | | | |
| | |
| IT Services—2.8% | | | | | | | | |
Broadridge Financial Solutions, Inc. | | | 728,976 | | | | 17,546,452 | |
ManTech International Corp. | | | 490,268 | | | | 21,777,705 | |
| | | | | | | | |
| | | | | | | 39,324,157 | |
| | | | | | | | |
| |
| Leisure Equipment & Products—0.8% | | | | | |
JAKKS Pacific, Inc.* | | | 633,023 | | | | 11,653,953 | |
| | | | | | | | |
| |
| Life Sciences Tools & Services—1.6% | | | | | |
Pharmaceutical Product Development, Inc. | | | 850,465 | | | | 22,826,481 | |
| | | | | | | | |
See accompanying notes to financial statements.
5
MET INVESTORS SERIES TRUST
| | |
Third Avenue Small Cap Value Portfolio | | |
Schedule of Investments as of June 30, 2011 (Unaudited)
Common Stocks—(Continued)
| | | | | | | | |
| Security Description | |
Shares | | | Value | |
| | | | | | | | |
| | |
| Machinery—2.4% | | | | | | | | |
Alamo Group, Inc. | | | 523,010 | | | $ | 12,395,337 | |
Oshkosh Corp.* | | | 709,923 | | | | 20,545,172 | |
| | | | | | | | |
| | | | | | | 32,940,509 | |
| | | | | | | | |
| | |
| Marine—2.2% | | | | | | | | |
Alexander & Baldwin, Inc. | | | 628,130 | | | | 30,250,741 | |
| | | | | | | | |
| | |
| Media—2.5% | | | | | | | | |
Liberty Media-Starz, Series A* | | | 226,100 | | | | 17,011,764 | |
Madison Square Garden, Inc.—Class A (The)* | | | 658,675 | | | | 18,133,323 | |
| | | | | | | | |
| | | | | | | 35,145,087 | |
| | | | | | | | |
| | |
| Metals & Mining—1.0% | | | | | | | | |
Kaiser Aluminum Corp. | | | 252,552 | | | | 13,794,390 | |
| | | | | | | | |
| | |
| Paper & Forest Products—4.0% | | | | | | | | |
Canfor Corp.* | | | 3,221,400 | | | | 35,245,808 | |
Glatfelter | | | 1,336,992 | | | | 20,562,937 | |
| | | | | | | | |
| | | | | | | 55,808,745 | |
| | | | | | | | |
| | |
| Professional Services—0.8% | | | | | | | | |
ICF International Inc.* | | | 429,824 | | | | 10,908,933 | |
| | | | | | | | |
| |
| Real Estate Investment Trusts—0.3% | | | | | |
Excel Trust Inc. | | | 209,516 | | | | 2,310,962 | |
Origen Financial, Inc.* | | | 811,331 | | | | 1,338,696 | |
| | | | | | | | |
| | | | | | | 3,649,658 | |
| | | | | | | | |
|
| Real Estate Management & Development—5.5% | |
Brookfield Asset Management, Inc.—Class A | | | 463,778 | | | | 15,383,516 | |
Hang Lung Group, Ltd. | | | 3,756,000 | | | | 23,987,966 | |
Wheelock & Co., Ltd. | | | 9,286,000 | | | | 37,691,729 | |
| | | | | | | | |
| | | | | | | 77,063,211 | |
| | | | | | | | |
|
| Semiconductors & Semiconductor Equipment—1.1% | |
MEMC Electronic Materials, Inc.* | | | 1,843,521 | | | | 15,725,234 | |
| | | | | | | | |
| | |
| Software—0.9% | | | | | | | | |
Synopsys, Inc.* | | | 514,536 | | | | 13,228,721 | |
| | | | | | | | |
| | |
| Specialty Retail—1.6% | | | | | | | | |
Haverty Furniture Cos., Inc. (a) | | | 1,966,587 | | | | 22,635,416 | |
| | | | | | | | |
| |
| Textiles, Apparel & Luxury Goods—2.1% | | | | | |
K-Swiss, Inc.—Class A* (a) | | | 2,830,169 | | | | 30,084,697 | |
| | | | | | | | |
| | | | | | | | |
| |
| Thrifts & Mortgage Finance—0.9% | | | | | |
First Niagara Financial Group, Inc. | | | 551,909 | | | $ | 7,285,199 | |
Kearny Financial Corp. | | | 660,494 | | | | 6,017,100 | |
| | | | | | | | |
| | | | | | | 13,302,299 | |
| | | | | | | | |
Total Common Stocks
(Cost $980,367,205) | | | | | | | 1,120,719,360 | |
| | | | | | | | |
| | |
| Short-Term Investment—19.4% | | | | | | | | |
| | |
| Repurchase Agreement—19.4% | | | | | | | | |
Fixed Income Clearing Corp. Repurchase Agreement dated 06/30/11 at 0.010% to be repurchased at $272,070,076 on 07/01/11 collateralized by $18,500,000 Federal Home Loan Bank at 4.125% due 03/13/20 with a value of $19,864,375; by $63,265,000 Freddie Mac at 3.500% due 08/18/20 with a value of $63,739,488; by $82,035,000 Freddie Mac at 2.550% due 09/08/17 with a value of $82,240,088; by $865,000 Freddie Mac at 3.310% due 11/10/20 with a value of $837,969; by $74,000,000 Fannie Mae at 4.377% due 01/23/2018 with a value of $82,695,000; by U.S. Treasury Notes at 2.375% due 06/30/18 with a value of $28,136,631
(Cost—$272,070,000) | | $ | 272,070,000 | | | | 272,070,000 | |
| | | | | | | | |
Total Short-Term Investments
(Cost $272,070,000) | | | | | | | 272,070,000 | |
| | | | | | | | |
Total Investments—99.3%
(Cost $1,252,437,205) | | | | | | | 1,392,789,360 | |
Other Assets and Liabilities
(net)—0.7% | | | | | | | 9,180,711 | |
| | | | | | | | |
| Net Assets—100.0% | | | | | | $ | 1,401,970,071 | |
| | | | | | | | |
| * | Non-income producing security. |
| # | As of June 30, 2011, the aggregate cost of investments for federal income tax purposes was $1,252,437,205. The aggregate unrealized appreciation and depreciation of investments were $224,051,357 and $(83,699,202), respectively, resulting in net unrealized appreciation of $140,352,155 for federal income tax purposes. |
| (a) | Affiliated issuer. (See Note 7 to Financial Statements for a summary of transactions in the investments of affiliated issuers.) |
See accompanying notes to financial statements.
6
MET INVESTORS SERIES TRUST
| | |
Third Avenue Small Cap Value Portfolio | | |
Schedule of Investments as of June 30, 2011 (Unaudited)
FAIR VALUE HIERARCHY
Accounting principles generally accepted in the United States of America (“GAAP”) defines fair market value as the price that the Portfolio would receive to sell an asset or pay to transfer a liability in an orderly transaction between market participants at the measurement date. It establishes a fair value hierarchy that prioritizes inputs to valuation methods and requires disclosure of the fair value hierarchy that segregates fair value measurements into three levels. Levels 1, 2 and 3 of the fair value hierarchy are defined as follows:
Level 1 - unadjusted quoted prices in active markets for identical investments
Level 2 - other significant observable inputs (including, but not limited to, unadjusted quoted prices for similar investments in markets that are either active or inactive; inputs other than quoted prices that are observable such as interest rates, yield curves, volatilities, prepayment speeds, loss severities, credit risks, default rates, etc.)
Level 3 - significant unobservable inputs based on the best information available in the circumstances, to the extent observable inputs are unavailable (including the Portfolio’s own assumptions in determining the fair value of investments)
The inputs or methodologies used for valuing investments are not necessarily an indication of the risk associated with investing in them. For a change in the methodology used, transfers between levels will be recognized as of the beginning of the reporting period. Information on transfers between Level 1 and Level 2 deemed significant, if any, will be disclosed following the valuation table below. For the six months ended June 30, 2011, there were no transfers between Levels 1 and 2. A reconciliation of Level 3 securities, if any, will also be disclosed following the valuation table. For more information about the Portfolio’s policy regarding the valuation of investments, please refer to the Notes to Financial Statements.
The following table summarizes the fair value hierarchy of the Portfolio’s investments as of June 30, 2011:
| | | | | | | | | | | | | | | | |
| Description | | Level 1 | | | Level 2 | | | Level 3 | | | Total | |
Common Stocks | | | | | | | | | | | | | | | | |
Auto Components | | $ | 42,937,089 | | | $ | — | | | $ | — | | | $ | 42,937,089 | |
Beverages | | | — | | | | 16,676,876 | | | | — | | | | 16,676,876 | |
Building Products | | | 10,731,983 | | | | — | | | | — | | | | 10,731,983 | |
Capital Markets | | | 28,157,177 | | | | — | | | | — | | | | 28,157,177 | |
Chemicals | | | 32,229,253 | | | | 11,081,213 | | | | — | | | | 43,310,466 | |
Commercial & Professional Services | | | 11,881,656 | | | | — | | | | — | | | | 11,881,656 | |
Communications Equipment | | | 56,331,691 | | | | — | | | | — | | | | 56,331,691 | |
Computers & Peripherals | | | 30,407,351 | | | | — | | | | — | | | | 30,407,351 | |
Diversified Financial Services | | | 11,469,160 | | | | 23,721,925 | | | | — | | | | 35,191,085 | |
Electrical Equipment | | | 19,999,350 | | | | — | | | | — | | | | 19,999,350 | |
Electronic Equipment, Instruments & Components | | | 91,313,048 | | | | — | | | | — | | | | 91,313,048 | |
Energy Equipment & Services | | | 57,596,963 | | | | — | | | | — | | | | 57,596,963 | |
Food Products | | | 32,299,164 | | | | — | | | | — | | | | 32,299,164 | |
Health Care Equipment & Supplies | | | 3,792,498 | | | | — | | | | — | | | | 3,792,498 | |
Health Care Providers & Services | | | 20,577,258 | | | | — | | | | — | | | | 20,577,258 | |
Hotels, Restaurants & Leisure | | | 26,917,465 | | | | — | | | | — | | | | 26,917,465 | |
Household Durables | | | 74,117,673 | | | | — | | | | — | | | | 74,117,673 | |
Insurance | | | 90,138,335 | | | | — | | | | — | | | | 90,138,335 | |
IT Services | | | 39,324,157 | | | | — | | | | — | | | | 39,324,157 | |
Leisure Equipment & Products | | | 11,653,953 | | | | — | | | | — | | | | 11,653,953 | |
Life Sciences Tools & Services | | | 22,826,481 | | | | — | | | | — | | | | 22,826,481 | |
Machinery | | | 32,940,509 | | | | — | | | | — | | | | 32,940,509 | |
Marine | | | 30,250,741 | | | | — | | | | — | | | | 30,250,741 | |
Media | | | 35,145,087 | | | | — | | | | — | | | | 35,145,087 | |
Metals & Mining | | | 13,794,390 | | | | — | | | | — | | | | 13,794,390 | |
Paper & Forest Products | | | 55,808,745 | | | | — | | | | — | | | | 55,808,745 | |
Professional Services | | | 10,908,933 | | | | — | | | | — | | | | 10,908,933 | |
Real Estate Investment Trusts | | | 3,649,658 | | | | — | | | | — | | | | 3,649,658 | |
Real Estate Management & Development | | | 15,383,516 | | | | 61,679,695 | | | | — | | | | 77,063,211 | |
Semiconductors & Semiconductor Equipment | | | 15,725,234 | | | | — | | | | — | | | | 15,725,234 | |
Software | | | 13,228,721 | | | | — | | | | — | | | | 13,228,721 | |
Specialty Retail | | | 22,635,416 | | | | — | | | | — | | | | 22,635,416 | |
See accompanying notes to financial statements.
7
MET INVESTORS SERIES TRUST
| | |
Third Avenue Small Cap Value Portfolio | | |
Schedule of Investments as of June 30, 2011 (Unaudited)
FAIR VALUE HIERARCHY—(Continued)
| | | | | | | | | | | | | | | | |
| Description | | Level 1 | | | Level 2 | | | Level 3 | | | Total | |
Textiles, Apparel & Luxury Goods | | $ | 30,084,697 | | | $ | — | | | $ | — | | | $ | 30,084,697 | |
Thrifts & Mortgage Finance | | | 13,302,299 | | | | — | | | | — | | | | 13,302,299 | |
Total Common Stocks | | | 1,007,559,651 | | | | 113,159,709 | | | | — | | | | 1,120,719,360 | |
Short-Term Investment | | | — | | | | 272,070,000 | | | | — | | | | 272,070,000 | |
Total Investments | | $ | 1,007,559,651 | | | $ | 385,229,709 | | | $ | — | | | $ | 1,392,789,360 | |
| | | | | | | | | | | | | | | | | |
See accompanying notes to financial statements.
8
MET INVESTORS SERIES TRUST
| | |
Third Avenue Small Cap Value Portfolio | | |
Statement of Assets and Liabilities
June 30, 2011 (Unaudited)
| | | | |
| Assets | | | | |
Investments at value (a) | | $ | 892,864,310 | |
Investment from affiliated transaction (b) | | | 227,855,050 | |
Repurchase Agreement | | | 272,070,000 | |
Cash | | | 940 | |
Cash denominated in foreign currencies (c) | | | 533,976 | |
Receivable for investments sold | | | 11,684,150 | |
Receivable for shares sold | | | 330,605 | |
Dividends receivable | | | 1,282,996 | |
Interest receivable | | | 76 | |
| | | | |
Total assets | | | 1,406,622,103 | |
| | | | |
| Liabilities | | | | |
Payables for: | | | | |
Investments purchased | | | 1,983,327 | |
Shares redeemed | | | 1,575,015 | |
Accrued Expenses: | | | | |
Management fees | | | 822,371 | |
Distribution and service fees - Class B | | | 126,835 | |
Administration fees | | | 5,940 | |
Custodian and accounting fees | | | 22,950 | |
Deferred trustees’ fees | | | 20,516 | |
Other expenses | | | 95,078 | |
| | | | |
Total liabilities | | | 4,652,032 | |
| | | | |
| Net Assets | | $ | 1,401,970,071 | |
| | | | |
| Net Assets Represented by | | | | |
Paid in surplus | | $ | 1,421,339,999 | |
Accumulated net realized loss | | | (159,652,929 | ) |
Unrealized appreciation on investments and foreign currency transactions | | | 162,865,424 | |
Unrealized depreciation on investment from affiliated transactions | | | (22,524,115 | ) |
Undistributed net investment income | | | (58,308 | ) |
| | | | |
Net Assets | | $ | 1,401,970,071 | |
| | | | |
| Net Assets | | | | |
Class A | | $ | 769,284,089 | |
Class B | | | 632,685,982 | |
| Capital Shares Outstanding* | | | | |
Class A | | | 50,315,019 | |
Class B | | | 41,509,464 | |
| Net Asset Value, Offering Price and Redemption Price Per Share | | | | |
Class A | | $ | 15.29 | |
Class B | | | 15.24 | |
| * | | The Portfolio is authorized to issue an unlimited number of shares. |
| (a) | | Identified cost of investments, excluding repurchase agreement and investment from affiliated transaction, was $729,988,040. |
| (b) | | Identified cost of investment from affiliated transaction was $250,379,165 |
| (c) | | Identified cost of cash denominated in foreign currencies was $530,537. |
Statement of Operations
Six Months Ended June 30, 2011 (Unaudited)
| | | | |
| Investment Income | | | | |
Dividends (a) | | $ | 4,744,274 | |
Interest | | | 11,471 | |
Income earned from affiliated transactions | | | 975,485 | |
| | | | |
Total investment income | | | 5,731,230 | |
| | | | |
| Expenses | | | | |
Management fees | | | 4,753,733 | |
Administration fees | | | 33,266 | |
Custodian and accounting fees | | | 80,060 | |
Distribution and service fees - Class B | | | 799,739 | |
Audit and tax services | | | 15,966 | |
Legal | | | 20,801 | |
Trustees’ fees and expenses | | | 15,868 | |
Shareholder reporting | | | 43,279 | |
Insurance | | | 2,624 | |
Miscellaneous | | | 7,511 | |
| | | | |
Total expenses | | | 5,772,847 | |
| | | | |
Net investment loss | | | (41,617 | ) |
| | | | |
| Net Realized and Unrealized Gain (Loss) on Investments, Investments in Affiliates and Foreign Currency Transactions | | | | |
Net realized gain (loss) on: | | | | |
Investments | | | 76,989,495 | |
Investments in affiliates | | | (18,600,980 | ) |
Foreign currency transactions | | | 293,993 | |
| | | | |
Net realized gain on investments, investments in affiliates and foreign currency transactions | | | 58,682,508 | |
| | | | |
Net change in unrealized appreciation (depreciation) on: | | | | |
Investments | | | (59,582,755 | ) |
Investments in affiliates | | | 26,790,665 | |
Foreign currency transactions | | | (4,931 | ) |
| | | | |
Net change in unrealized depreciation on investments, investments in affiliates, and foreign currency transactions | | | (32,797,021 | ) |
| | | | |
Net realized and unrealized loss on investments, investments in affiliates and foreign currency transactions | | | 25,885,487 | |
| | | | |
| Net Increase in Net Assets from Operations | | $ | 25,843,870 | |
| | | | |
| (a) | | Net of foreign withholding taxes of $127,393. |
See accompanying notes to financial statements.
9
MET INVESTORS SERIES TRUST
| | |
Third Avenue Small Cap Value Portfolio | | |
Statements of Changes in Net Assets
June 30, 2011
| | | | | | | | |
| | | Six Months
Ended
June 30, 2011
(Unaudited) | | | Year Ended
December 31,
2010 | |
| Increase (Decrease) in Net Assets: | | | | | | | | |
| Operations | | | | | | | | |
Net investment income (loss) | | $ | (41,617 | ) | | $ | 2,120,799 | |
Net realized gain on investments, investments in affiliates and foreign currency transactions | | | 58,682,508 | | | | 58,259,136 | |
Net change in unrealized appreciation (depreciation) on investments in affiliated and foreign currency transactions | | | (32,797,021 | ) | | | 179,775,996 | |
| | | | | | | | |
Net increase in net assets resulting from operations | | | 25,843,870 | | | | 240,155,931 | |
| | | | | | | | |
| Distributions to Shareholders | | | | | | | | |
From net investment income | | | | | | | | |
Class A | | | (7,475,653 | ) | | | (10,503,841 | ) |
Class B | | | (6,576,253 | ) | | | (6,636,258 | ) |
| | | | | | | | |
Net decrease in net assets resulting from distributions | | | (14,051,906 | ) | | | (17,140,099 | ) |
| | | | | | | | |
Net increase (decrease) in net assets from capital share transactions | | | 169,754,942 | | | | (279,709,273 | ) |
| | | | | | | | |
| Net Increase (Decrease) in Net Assets | | | 181,546,906 | | | | (56,693,441 | ) |
Net assets at beginning of period | | | 1,220,423,165 | | | | 1,277,116,606 | |
| | | | | | | | |
Net assets at end of period | | $ | 1,401,970,071 | | | $ | 1,220,423,165 | |
| | | | | | | | |
Undistributed (distribution in excess of) net investment income at end of period | | $ | (58,308 | ) | | $ | 14,035,215 | |
| | | | | | | | |
| | | | | | | | | | | | | | | | |
| Other Information: | | | | | | | | | | | | | | | | |
| Capital Shares | | | | | | | | | | | | | | | | |
| | | | |
Transactions in capital shares were as follows: | | | | | | | | | | | | | | | | |
| | | Six Months Ended
June 30, 2011
(Unaudited) | | | Year Ended
December 31, 2010 | |
| | | Shares | | | Value | | | Shares | | | Value | |
| Class A | | | | | | | | | | | | | | | | |
Sales | | | 19,507,818 | | | $ | 311,944,550 | | | | 5,369,946 | | | $ | 70,232,466 | |
Reinvestments | | | 471,650 | | | | 7,475,652 | | | | 749,739 | | | | 10,503,841 | |
Redemptions | | | (8,235,671 | ) | | | (131,816,129 | ) | | | (24,879,321 | ) | | | (351,194,806 | ) |
| | | | | | | | | | | | | | | | |
Net increase (decrease) | | | 11,743,797 | | | $ | 187,604,073 | | | | (18,759,636 | ) | | $ | (270,458,499 | ) |
| | | | | | | | | | | | | | | | |
| Class B | | | | | | | | | | | | | | | | |
Sales | | | 2,720,449 | | | $ | 41,591,509 | | | | 5,683,346 | | | $ | 74,753,841 | |
Reinvestments | | | 415,955 | | | | 6,576,253 | | | | 474,697 | | | | 6,636,258 | |
Redemptions | | | (4,342,865 | ) | | | (66,016,893 | ) | | | (6,941,718 | ) | | | (90,640,873 | ) |
| | | | | | | | | | | | | | | | |
Net decrease | | | (1,206,461 | ) | | $ | (17,849,131 | ) | | | (783,675 | ) | | $ | (9,250,774 | ) |
| | | | | | | | | | | | | | | | |
Increase (decrease) derived from capital shares transactions | | | | | | $ | 169,754,942 | | | | | | | $ | (279,709,273 | ) |
| | | | | | | | | | | | | | | | |
See accompanying notes to financial statements.
10
MET INVESTORS SERIES TRUST
|
Third Avenue Small Cap Value Portfolio |
Financial Highlights
| | | | | | | | | | | | | | | | | | | | | | | | |
| Selected per share data | | | | | | | | | | | | | | | | | | |
| | | Class A | |
| | | Six Months Ended
June 30, 2011
(Unaudited) | | | Year Ended December 31, | |
| | | | 2010 | | | 2009 | | | 2008 | | | 2007 | | | 2006 | |
| Net Asset Value, Beginning of Period | | $ | 15.04 | | | $ | 12.68 | | | $ | 10.29 | | | $ | 15.75 | | | $ | 17.48 | | | $ | 16.61 | |
| | | | | | | | | | | | | | | | | | | | | | | | |
| Income (Loss) from Investment Operations | | | | | | | | | | | | | | | | | | | | | | | | |
Net Investment Income(a) | | | 0.01 | | | | 0.03 | | | | 0.17 | | | | 0.16 | | | | 0.17 | | | | 0.27 | |
Net Realized and Unrealized Gain (Loss) on Investments | | | 0.43 | | | | 2.51 | | | | 2.50 | | | | (4.46 | ) | | | (0.54 | ) | | | 1.89 | |
| | | | | | | | | | | | | | | | | | | | | | | | |
Total From Investment Operations | | | 0.44 | | | | 2.54 | | | | 2.67 | | | | (4.30 | ) | | | (0.37 | ) | | | 2.16 | |
| | | | | | | | | | | | | | | | | | | | | | | | |
| Less Distributions | | | | | | | | | | | | | | | | | | | | | | | | |
Distributions from Net Investment Income | | | (0.19 | ) | | | (0.18 | ) | | | (0.16 | ) | | | (0.15 | ) | | | (0.21 | ) | | | (0.11 | ) |
Distributions from Net Realized Capital Gains | | | — | | | | — | | | | (0.12 | ) | | | (1.01 | ) | | | (1.15 | ) | | | (1.18 | ) |
| | | | | | | | | | | | | | | | | | | | | | | | |
Total Distributions | | | (0.19 | ) | | | (0.18 | ) | | | (0.28 | ) | | | (1.16 | ) | | | (1.36 | ) | | | (1.29 | ) |
| | | | | | | | | | | | | | | | | | | | | | | | |
| Net Asset Value, End of Period | | $ | 15.29 | | | $ | 15.04 | | | $ | 12.68 | | | $ | 10.29 | | | $ | 15.75 | | | $ | 17.48 | |
| | | | | | | | | | | | | | | | | | | | | | | | |
| Total Return (%) | | | 2.88 | | | | 20.15 | | | | 26.82 | | | | (29.69 | ) | | | (2.79 | ) | | | 13.38 | |
| Ratios/Supplemental Data | | | | | | | | | | | | | | | | | | | | | | | | |
Ratio of Expenses to Average Net Assets (%) | | | 0.77 | * | | | 0.78 | | | | 0.78 | | | | 0.77 | | | | 0.76 | | | | 0.80 | |
Ratio of Net Expenses to Average Net Assets (%)(b) | | | 0.77 | * | | | 0.78 | | | | 0.78 | | | | 0.77 | | | | 0.76 | | | | 0.80 | |
Ratio of Net Investment Income to Average Net Assets (%) | | | 0.14 | * | | | 0.22 | | | | 1.62 | | | | 1.18 | | | | 0.99 | | | | 1.64 | |
Portfolio Turnover Rate (%) | | | 23.7 | | | | 11.4 | | | | 12.9 | | | | 39.8 | | | | 36.0 | | | | 12.1 | |
Net Assets, End of Period (in millions) | | $ | 769.3 | | | $ | 580.3 | | | $ | 727.2 | | | $ | 747.1 | | | $ | 1,171.6 | | | $ | 883.6 | |
| |
| | | Class B | |
| | | Six Months Ended
June 30, 2011
(Unaudited) | | | Year Ended December 31, | |
| | | | 2010 | | | 2009 | | | 2008 | | | 2007 | | | 2006 | |
| Net Asset Value, Beginning of Period | | $ | 14.99 | | | $ | 12.64 | | | $ | 10.25 | | | $ | 15.68 | | | $ | 17.41 | | | $ | 16.55 | |
| | | | | | | | | | | | | | | | | | | | | | | | |
| Income (Loss) from Investment Operations | | | | | | | | | | | | | | | | | | | | | | | | |
Net Investment Income (Loss)(a) | | | (0.01 | ) | | | 0.02 | | | | 0.16 | | | | 0.13 | | | | 0.13 | | | | 0.21 | |
Net Realized and Unrealized Gain (Loss) on Investments | | | 0.42 | | | | 2.48 | | | | 2.48 | | | | (4.44 | ) | | | (0.54 | ) | | | 1.91 | |
| | | | | | | | | | | | | | | | | | | | | | | | |
Total From Investment Operations | | | 0.41 | | | | 2.50 | | | | 2.64 | | | | (4.31 | ) | | | (0.41 | ) | | | 2.12 | |
| | | | | | | | | | | | | | | | | | | | | | | | |
| Less Distributions | | | | | | | | | | | | | | | | | | | | | | | | |
Distributions from Net Investment Income | | | (0.16 | ) | | | (0.15 | ) | | | (0.13 | ) | | | (0.11 | ) | | | (0.17 | ) | | | (0.08 | ) |
Distributions from Net Realized Capital Gains | | | — | | | | — | | | | (0.12 | ) | | | (1.01 | ) | | | (1.15 | ) | | | (1.18 | ) |
| | | | | | | | | | | | | | | | | | | | | | | | |
Total Distributions | | | (0.16 | ) | | | (0.15 | ) | | | (0.25 | ) | | | (1.12 | ) | | | (1.32 | ) | | | (1.26 | ) |
| | | | | | | | | | | | | | | | | | | | | | | | |
| Net Asset Value, End of Period | | $ | 15.24 | | | $ | 14.99 | | | $ | 12.64 | | | $ | 10.25 | | | $ | 15.68 | | | $ | 17.41 | |
| | | | | | | | | | | | | | | | | | | | | | | | |
| Total Return (%) | | | 2.67 | | | | 19.90 | | | | 26.45 | | | | (29.82 | ) | | | (3.02 | ) | | | 13.13 | |
| Ratios/Supplemental Data | | | | | | | | | | | | | | | | | | | | | | | | |
Ratio of Expenses to Average Net Assets (%) | | | 1.02 | * | | | 1.03 | | | | 1.03 | | | | 1.02 | | | | 1.01 | | | | 1.05 | |
Ratio of Net Expenses to Average Net Assets (%)(b) | | | 1.02 | * | | | 1.03 | | | | 1.03 | | | | 1.02 | | | | 1.01 | | | | 1.05 | |
Ratio of Net Investment Income (Loss) to Average Net Assets (%) | | | 0.15 | * | | | 0.15 | | | | 1.46 | | | | 0.92 | | | | 0.76 | | | | 1.28 | |
Portfolio Turnover Rate (%) | | | 23.7 | | | | 11.4 | | | | 12.9 | | | | 39.8 | | | | 36.0 | | | | 12.1 | |
Net Assets, End of Period (in millions) | | $ | 632.7 | | | $ | 640.1 | | | $ | 549.9 | | | $ | 444.0 | | | $ | 741.5 | | | $ | 573.8 | |
| (a) | | Per share amounts based on average shares outstanding during the period. |
| (b) | | Includes the effects of management fee waivers and expenses reimbursed by the Adviser, if applicable. |
See accompanying notes to financial statements.
11
MET INVESTORS SERIES TRUST
| | |
Third Avenue Small Cap Value Portfolio | | |
Notes to Financial Statements—June 30, 2011 (Unaudited)
1. Organization
Met Investors Series Trust (the “Trust”) is organized as a statutory trust under the laws of Delaware, as an open-end management investment company under the Investment Company Act of 1940, as amended (the “1940 Act”). The Trust currently offers fifty-four Portfolios (the “Portfolios”), each of which operates as a distinct investment vehicle of the Trust. The portfolio included in this report is Third Avenue Small Cap Value Portfolio (the “Portfolio”), which is diversified. Shares in the Portfolio are not offered directly to the general public and are currently available only to separate accounts established by Metropolitan Life Insurance Company (“MetLife”) and other affiliated life insurance companies.
The Portfolio has registered four classes of shares: Class A, B, C and E Shares. Class A and B Shares are currently offered by the Portfolio. Shares of each Class of the Portfolio represent an equal pro rata interest in the Portfolio and generally give the shareholder the same voting, dividend, liquidation, and other rights. Investment income, realized and unrealized capital gains and losses, the common expenses of the Portfolio and certain Portfolio-level expense reductions, if any, are allocated on a pro rata basis to each Class based on the relative net assets of each Class to the net assets of the Portfolio. Each Class of shares differs in its respective distribution expenses.
2. Significant Accounting Policies
The financial statements have been prepared in conformity with accounting principles generally accepted in the United States of America (“GAAP”) which require management to make estimates and assumptions that affect the reported amounts of assets and liabilities at the date of the financial statements and the reported amounts of income and expenses during the reporting period. Actual results could differ from these estimates. In the preparation of these financial statements, management has evaluated events and transactions subsequent to June 30, 2011 through the date that the financial statements were issued.
The following is a summary of significant accounting policies consistently followed by the Portfolio in the preparation of its financial statements.
Investment Valuation and Fair Value Measurements - Debt securities (other than short term obligations with a remaining maturity of sixty days or less) including corporate, convertible and municipal bonds and notes; U.S. government agencies; U.S. treasury obligations; sovereign issues; bank loans; and non-U.S. bonds are generally valued on the basis of evaluated or composite bid quotations obtained by independent pricing services and/or brokers and dealers selected by MetLife Advisers, LLC (“MLA” or the “Adviser”), an affiliate of MetLife, Inc., or the relevant Subadviser pursuant to authorization of the Board of Trustees of the Portfolio (the “Board”). Such quotations use inputs that are observable including, among other things, issuer details, interest rates, yield curves, prepayment speeds, credit risks/spreads, default rates and quoted prices for similar securities. Securities that use similar valuation techniques and inputs as described above are categorized as Level 2 within the fair value hierarchy.
Mortgage and asset-backed securities are usually issued as separate tranches, or classes, of securities within each deal. These securities are also generally valued on the basis of evaluated or composite bid quotations obtained by independent pricing services and/or brokers and dealers selected by the Adviser or relevant Subadviser pursuant to authorization of the Board. The pricing models for these securities usually consider tranche-level attributes, estimated cash flows for each tranche, market-based yield spreads for each tranche and current market data, and incorporate deal collateral performance, as available. Mortgage and asset-backed securities that use similar valuation techniques and inputs as described above are categorized as Level 2 within the fair value hierarchy.
Short term obligations with a remaining maturity of sixty days or less are valued at amortized cost which approximates fair market value and are categorized as Level 2 within the fair value hierarchy.
Equity securities such as common stock, exchange-traded funds and preferred stock that are traded on a national securities exchange or other exchanges are generally valued at their last sale price on the principal trading market. Equity securities traded on a national securities exchange or other exchanges for which there is no reported sale during the day are valued at the last reported bid price. A security that is listed or traded on more than one exchange is valued at the quotation on the exchange determined to be the primary market for that security by the Board or its delegates. If no closing price is available, then such securities are valued at the last reported bid price. Equity securities traded over-the-counter are generally valued at the last reported sales price. To the extent these securities are actively traded and valuation adjustments are not applied, they are categorized as Level 1 within the fair value hierarchy. Other equity securities traded on inactive markets or valued by reference to similar instruments are categorized as Level 2 within the fair value hierarchy.
Equity securities which are listed on foreign stock exchanges normally are valued at the market closing price, the last sale price on the day the securities are valued or, lacking any sales on such day, at the bid price. Valuation adjustments may be applied to certain equity securities that are solely traded on foreign exchanges closing before the U.S. market to account for the market movement between the close of the foreign exchanges and the close of the U.S. market. The Portfolio may use a systematic fair valuation model provided by an independent third party to value securities principally traded in these foreign markets closing before the U.S. market in order to adjust for possible stale pricing that may occur between the close of these foreign exchanges and the time of the Portfolio valuation. Securities using these valuation adjustments are categorized as Level 2 within the fair value hierarchy.
Investments in registered open-end management investment companies are valued at reported net asset value per share and are categorized as Level 1 within the fair value hierarchy.
12
MET INVESTORS SERIES TRUST
| | |
Third Avenue Small Cap Value Portfolio | | |
Notes to Financial Statements—June 30, 2011 (Unaudited)—(Continued)
2. Significant Accounting Policies - continued
Forward foreign currency exchange contracts are valued based on the mean between closing bid and asked prices of the forward currency rates in the London foreign exchange markets on a daily basis as provided by a reliable bank or dealer. These contracts are categorized as Level 2 within the fair value hierarchy.
Options, whether on securities, indices, futures contracts, or otherwise, are valued at the last sales price available as of the close of business on the day of valuation or, if there is no such sale price available, at the bid price. Options on currencies are valued at the spot price each day. These types of options are categorized as Level 1 within the fair value hierarchy. Other options traded on inactive markets where a broker quotation is received or options valued by an evaluated quote provided by an independent pricing vendor are categorized as Level 2 within the fair value hierarchy.
Futures contracts, which are traded on commodity exchanges, are valued at their closing prices as of the close of such exchanges and are categorized as Level 1 within the fair value hierarchy. Futures contracts traded on inactive markets where a broker quotation is received are categorized as Level 2 within the fair value hierarchy. As a general matter, futures contracts are marked-to-market daily.
Options and futures contracts that are traded over-the-counter are generally valued on the basis of broker dealer quotations or pricing service providers who use a series of techniques, including simulation pricing models, to determine the value of the contracts. The pricing models use inputs that are observed from actively quoted markets such as issuer details, indices, spreads, interest rates, curves and exchange rates. These contracts are categorized as Level 2 within the fair value hierarchy.
If no current market value quotation or other observable inputs are readily available or reliable for a security, the fair value of the security will be determined in accordance with procedures approved by and under the general supervision of the Board. The Board has delegated the determination in good faith of the fair value of securities for which current market quotations are not readily available to a Valuation Committee established by the Board. Market quotes and other observable inputs are considered not readily available in circumstances where there is an absence of current or reliable market-based data. In addition, market quotes would be considered not readily available when, due to extraordinary circumstances, the exchanges or markets on which the securities trade, do not open for trading for the entire day and no other market prices are available. When the Portfolio uses fair value pricing, it may take into account any factors it deems appropriate, including significant unobservable inputs. The value of securities used by the Portfolio to calculate its net asset value may differ from quoted or published prices for the same securities. Fair value pricing involves subjective judgments and the fair value determined for a security may be materially different than the value that could be realized upon the sale of that security. These securities are categorized as Level 3 within the fair value hierarchy.
Investment Transactions and Related Investment Income - Portfolio security transactions are recorded on the trade date. Dividend income is recorded on the ex-dividend date or, for certain foreign securities, when notified. Interest income, which includes amortization of premium and accretion of discount on debt securities, is recorded on the accrual basis. Realized gains and losses on investments and unrealized appreciation and depreciation are determined on the identified cost basis, which is the same basis used for federal income tax purposes. Foreign income and foreign capital gains on some foreign securities may be subject to foreign withholding taxes, which are accrued as applicable.
Income Taxes - It is the Portfolio’s policy to comply with the requirements of the Internal Revenue Code of 1986, as amended (the “Code”), and regulations thereunder, applicable to regulated investment companies and to distribute, with respect to each taxable year, all of its taxable income to shareholders. Therefore, no federal income tax provision is required. The Portfolio files U.S. federal and various state tax returns. No income tax returns are currently under examination. The Portfolio’s federal tax returns for the prior three fiscal years remain subject to examination by the Internal Revenue Service.
Dividends and Distributions to Shareholders - The Portfolio records dividends and distributions on the ex-dividend date. Net realized gains from security transactions (if any) are generally distributed annually to shareholders. The timing and characterization of certain income and capital gains distributions are determined in accordance with federal tax regulations that may differ from GAAP. Permanent book and tax basis differences relating to shareholder distributions will result in reclassification between under/over distributed net investment income, accumulated net realized gains/losses and paid in surplus. Book-tax differences are primarily due to foreign currency transactions, deferred trustees’ compensation, capital loss carryforwards, and losses deferred due to wash sales, Real Estate Investment Trust (REITs), and return of capital from certain securities as applicable. These adjustments have no impact on net assets or the results of operations.
Repurchase Agreements - The Portfolio may enter into repurchase agreements with selected commercial banks and broker-dealers, under which the Portfolio acquires securities as collateral and agrees to resell the securities at an agreed upon time and at an agreed upon price. The Portfolio, through the custodian or a subcustodian, receives delivery of the underlying securities collateralizing repurchase agreements. The Portfolio requires the custodian to take possession, to have legally segregated in the Federal Reserve Book Entry System, or to have segregated within the custodian’s vault, all securities held as collateral for repurchase agreements. It is the Portfolio’s policy that the market value of the collateral be at least equal to 100% of the repurchase price in the case of a repurchase agreement of one-day duration and 102% of the repurchase price in the case of all other repurchase agreements. In connection with transactions in repurchase agreements, if the seller defaults and the value of the collateral declines or if the seller enters an insolvency proceeding, realization of the collateral by the Portfolio may be delayed, limited or wholly denied.
13
MET INVESTORS SERIES TRUST
| | |
Third Avenue Small Cap Value Portfolio | | |
Notes to Financial Statements—June 30, 2011 (Unaudited)—(Continued)
2. Significant Accounting Policies - continued
Foreign Currency Translation - The books and records of the Portfolio are maintained in U.S. dollars. The values of securities, currencies and other assets and liabilities denominated in currencies other than U.S. dollars are translated into U.S. dollars based upon foreign exchange rates prevailing at the end of the period. Purchases and sales of investment securities, income and expenses are translated on the respective dates of such transactions. Since the values of investment securities are presented at the foreign exchange rates prevailing at the end of the period, it is not practical to isolate that portion of the results of operations arising from changes in exchange rates from that portion of the results of operations reflecting fluctuations arising from changes in market prices of the investment securities. Such fluctuations are included in the net realized and unrealized gain or loss on investments.
Net realized foreign exchange gains or losses arise from activity in forward foreign currency exchange contracts, sales of foreign currency, currency gains or losses realized between the trade and settlement dates on securities transactions, and the difference between the amounts of dividends, interest, and foreign withholding taxes recorded by the Portfolio and the U.S. dollar equivalent of the amounts actually received or paid by the Portfolio. Gains and losses attributable to foreign currency exchange rates on sales of securities are recorded as Net realized gains and losses on investments. Net unrealized foreign exchange gains and losses arise from changes in the value of assets and liabilities, other than investment securities, resulting from changes in foreign exchange rates.
3. Investment Management Agreement and Other Transactions with Affiliates
Investment Management Agreement - The Trust is managed by the Adviser. The Trust has entered into a management agreement with the Adviser (the “Management Agreement”) for investment management services in connection with the investment management of the Portfolio. The Adviser is subject to the supervision and direction of the Board and has overall responsibility for the general management and administration of the Trust. The Adviser has entered into a subadvisory agreement with Third Avenue Management LLC (the “Subadviser”) for investment subadvisory services in connection with the investment management of the Portfolio.
Subject to the supervision and direction of the Board, the Adviser supervises the Subadviser and has full discretion with respect to the retention or renewal of the subadvisory agreement. The Adviser pays the Subadviser a fee based on the Portfolio’s average daily net assets.
Under the terms of the Portfolio’s Management Agreement, the Portfolio pays the Adviser a monthly fee based upon annual rates applied to the Portfolio’s average daily net assets as follows:
| | | | | | |
Management Fees
earned by the Adviser
for the six months ended
June 30, 2011 | | % per annum | | | Average Daily Net Assets |
| | |
| $4,753,733 | | | 0.75 | % | | First $1 Billion |
| | |
| | | 0.70 | % | | Over $1 Billion |
Certain officers and trustees of the Trust may also be officers of the Adviser; however, such officers and trustees receive no compensation from the Trust.
Transfer Agency Agreement - MetLife serves as the transfer agent for the Trust. MetLife receives no fees for its services to the Trust under the transfer agency agreement.
Distribution Agreement and Plan - The Trust has a distribution agreement with MetLife Investors Distribution Company (“MIDC” or the “Distributor”) in which MIDC serves as the Distributor for the Trust’s Class A and Class B Shares. MIDC is a wholly-owned subsidiary of MetLife Investors Group, Inc., an affiliate of the Adviser. The Class B distribution plan provides that the Trust, on behalf of the Portfolio, may pay annually up to 0.50% of the average daily net assets of the Portfolio attributable to its Class B shares with respect to activities primarily intended to result in the sale of Class B Shares. However, under the Class B distribution agreement, payments to the Distributor for activities pursuant to the Class B distribution plan are currently limited to payments at an annual rate equal to 0.25% of average daily net assets of the Portfolio attributable to its Class B Shares. Amounts incurred by the Portfolio for the six months ended June 30, 2011 are shown as Distribution and service fees in the Statement of Operations.
Under the terms of the Class B distribution plan and distribution agreement, the Portfolio is authorized to make payments monthly to the distributor that may be used to pay or reimburse entities providing distribution and shareholder servicing with respect to the Class B Shares for such entities’ fees or expenses incurred or paid in that regard.
Deferred Trustee Compensation - Each Trustee of the Trust who is not currently an employee of the Adviser or any of its affiliates receives compensation from the Trust for his or her service to the Portfolio. A deferred compensation plan (the “Plan”) is available to the Trustees on a voluntary basis. Deferred amounts remain in the Trust until distributed in accordance with the provisions of the Plan. The value of a participating
14
MET INVESTORS SERIES TRUST
| | |
Third Avenue Small Cap Value Portfolio | | |
Notes to Financial Statements—June 30, 2011 (Unaudited)—(Continued)
3. Investment Management Agreement and Other Transactions with Affiliates - continued
Trustee’s deferral account is based on theoretical investments of deferred amounts, on the normal payment dates, in certain portfolios of the Trust or Metropolitan Series Fund, Inc. as designated by the participating Trustee. Changes in the value of participants’ deferral accounts are reflected as Trustees’ fees and expenses in the Statement of Operations. The portion of the accrued obligations allocated to the Portfolio, if any, under the Plan are reflected as Deferred trustees’ fees in the Statement of Assets and Liabilities.
Affiliated Broker - During the six months ended June 30, 2011, the Portfolio paid brokerage commissions to affiliated brokers/dealers:
| | | | |
Affiliate | | Commission | |
| |
M.J. Whitman LLC | | $ | 17,709 | |
4. Investment Transactions
Aggregate cost of purchases and proceeds of sales of investment securities, excluding short-term securities, for the six months ended June 30, 2011 were as follows:
| | | | | | | | | | | | | | |
| Purchases | | | Sales | |
| U.S. Government | | | Non U.S. Government | | | U.S. Government | | | Non U.S. Government | |
| | | |
| $ | — | | | $ | 269,090,472 | | | $ | — | | | $ | 328,811,262 | |
5. Contractual Obligations
The Trust has a variety of indemnification obligations under contracts with its service providers. The Trust’s maximum exposure under these arrangements is unknown.
6. Market, Credit and Counterparty Risk
In the normal course of business, the Portfolio invests in securities and enters into transactions where risks exist due to fluctuations in the market (market risk) or failure of the other party to a transaction to perform (credit and counterparty risk). The value of securities held by the Portfolio may decline in response to certain events, including those directly involving the companies whose securities are owned by the Portfolio; conditions affecting the general economy; overall market changes; local, regional or global political, social or economic instability; and currency and interest rate and price fluctuations. The Portfolio may be exposed to counterparty risk, or the risk that an entity with which the Portfolio has unsettled or open transactions may default. The potential loss could exceed the value of the financial assets recorded in the financial statements. Financial assets that potentially expose the Portfolio to credit risk consist principally of cash due from counterparties and investments. In order to preserve certain safeguards for derivatives and non-standard settlement trades, the Portfolio restricts its exposure to credit losses by entering into master netting agreements with counterparties (approved brokers) with whom it undertakes a significant volume of transactions. The Portfolio reduces the credit risk associated with favorable contracts by entering into a master netting arrangement to the extent that all amounts with the counterparty are terminated and settled on a net basis if an event of default occurs. The Portfolio’s overall exposure to credit risk on derivative instruments subject to master netting arrangements can change substantially within a short period, as it is affected by each transaction subject to the arrangement.
15
MET INVESTORS SERIES TRUST
| | |
Third Avenue Small Cap Value Portfolio | | |
Notes to Financial Statements—June 30, 2011 (Unaudited)—(Continued)
7. Affiliated Issuers
A summay of Portfolio's transactions in the securities of affiliated issuers during the period ended June 30, 2011 was as follows:
| | | | | | | | | | | | | | | | |
Security Description | | Number of shares
held at
December 31, 2010 | | | Shares
purchased | | | Shares sold | | | Number of shares
held at
June 30, 2011 | |
| | | | |
Bronco Drilling Co., Inc. | | | 4,460,843 | | | | — | | | | (4,460,843 | ) | | | — | |
| | | | |
Cavco Industries, Inc. | | | 787,653 | | | | — | | | | — | | | | 787,653 | |
| | | | |
Cross Country Healthcare, Inc. | | | 2,684,784 | | | | 25,000 | | | | (2,250 | ) | | | 2,707,534 | |
| | | | |
Electro Scientific Industries, Inc. | | | 1,427,802 | | | | — | | | | (391,317 | ) | | | 1,036,485 | |
| | | | |
Haverty Furniture Cos., Inc. | | | 1,966,587 | | | | — | | | | — | | | | 1,966,587 | |
| | | | |
Herley Industries, Inc. | | | 1,060,702 | | | | — | | | | (1,060,702 | ) | | | — | |
| | | | |
K-Swiss, Inc. | | | 2,830,169 | | | | — | | | | — | | | | 2,830,169 | |
| | | | |
Skyline Corp. | | | 1,275,713 | | | | 1,172 | | | | (119,227 | ) | | | 1,157,658 | |
| | | | |
Stanley Furniture Co., Inc. | | | 3,627,538 | | | | — | | | | (84,003.00 | ) | | | 3,543,535 | |
| | | | |
Superior Industries International, Inc. | | | 2,243,637 | | | | — | | | | (301,661 | ) | | | 1,941,976 | |
| | | | |
Sycamore Networks, Inc. | | | 1,884,001 | | | | — | | | | (936,806 | ) | | | 947,195 | |
| | | | |
Security Description | | Net Realized
Gain/(Loss) | | | Return of Capital | | | Dividend Income | | | Ending Value as of
June 30, 2011 | |
| | | | |
Bronco Drilling Co., Inc. | | $ | (8,543,351 | ) | | $ | — | | | $ | — | | | $ | — | |
| | | | |
Cavco Industries, Inc. | | | — | | | | — | | | | — | | | | 35,444,385 | |
| | | | |
Cross Country Healthcare, Inc. | | | (16,048 | ) | | | — | | | | — | | | | 20,577,258 | |
| | | | |
Electro Scientific Industries, Inc. | | | (718,524 | ) | | | — | | | | — | | | | 20,004,161 | |
| | | | |
Haverty Furniture Cos., Inc. | | | — | | | | — | | | | — | | | | 22,635,416 | |
| | | | |
Herley Industries, Inc. | | | 4,840,855 | | | | — | | | | — | | | | — | |
| | | | |
K-Swiss, Inc. | | | — | | | | — | | | | — | | | | 30,084,697 | |
| | | | |
Skyline Corp. | | | (1,063,074 | ) | | | — | | | | 325,876 | | | | 20,259,015 | |
| | | | |
Stanley Furniture Co., Inc. | | | (1,542,557 | ) | | | — | | | | — | | | | 14,847,412 | |
| | | | |
Superior Industries International, Inc. | | | (266,847 | ) | | | — | | | | 649,609 | | | | 42,937,089 | |
| | | | |
Sycamore Networks, Inc. | | | (11,291,434 | ) | | | — | | | | — | | | | 21,065,617 | |
| | | | | | | | | | | | | | | | |
| | | | |
| | $ | (18,600,980 | ) | | $ | — | | | $ | 975,485 | | | $ | 227,855,050 | |
| | | | | | | | | | | | | | | | |
8. Income Tax Information
The tax character of distributions paid for the years ended December 31, 2010 and 2009 were as follows:
| | | | | | | | | | | | | | | | | | | | |
| Ordinary Income | | | Long-Term Capital Gain | | | Total | |
| 2010 | | 2009 | | | 2010 | | | 2009 | | | 2010 | | | 2009 | |
| | | | | |
| $17,140,099 | | $ | 17,771,886 | | | $ | — | | | $ | 13,940,862 | | | $ | 17,140,099 | | | $ | 31,712,748 | |
As of December 31, 2010, the components of distributable earnings (accumulated losses) on a federal income tax basis were as follows:
| | | | | | | | | | | | | | | | |
Undistributed
Ordinary
Income | | Undistributed
Long-Term Capital
Gain | | | Net
Unrealized
Appreciation | | | Loss Carryforwards | | | Total | |
| | | | |
| $14,051,518 | | $ | — | | | $ | 157,572,812 | | | $ | (202,769,921 | ) | | $ | (31,145,591 | ) |
16
MET INVESTORS SERIES TRUST
| | |
Third Avenue Small Cap Value Portfolio | | |
Notes to Financial Statements—June 30, 2011 (Unaudited)—(Continued)
8. Income Tax Information - continued
The Portfolio utilizes the provisions of the federal income tax laws that provide for the carryforward of capital losses for eight years, offsetting such losses against any future net realized capital gains. At December 31, 2010, the accumulated capital loss carryforwards and expiration dates by the Portfolio were as follows:
| | | | |
Expiring
12/31/2017 | | Total | |
| |
| $202,769,921 | | $ | 202,769,921 | |
The Regulated Investment Company Modernization Act of 2010 (the “Act”) was signed into law by President Obama on December 22, 2010.
The Act makes a number of changes to the provisions in the Code relating to regulated investment companies (“RICs”) that will generally become effective for taxable years of RICs beginning after December 22, 2010. The Act allows RICs to generally carryover net capital losses indefinitely, effective for losses arising in taxable years beginning after December 22, 2010. Such losses will retain their character as either long-term capital losses or short-term capital losses. Under pre-enactment law, capital losses could be carried forward for eight years and carried forward as short-term capital losses irrespective of the character of the original loss. Loss carryovers from years beginning prior to December 22, 2010 will still expire subject to the eight-year limitation. The Act further provides that losses arising in taxable years after December 22, 2010 (which are carried forward indefinitely) would be utilized prior to loss carryovers arising in taxable years beginning prior to December 22, 2010.
9. Recent Accounting Pronouncements
In January 2010, the Financial Accounting Standards Board (“FASB”) issued Accounting Standards Update No. 2010-06, “Improving Disclosures About Fair Value Measurements” (“ASU”) which was generally effective for years beginning after December 15, 2009 and was adopted by the Portfolio. The ASU requires enhanced disclosures about purchases, sales, issuances and settlements on a gross basis relating to Level 3 fair value measurements. These enhanced disclosures became effective for fiscal years beginning after December 15, 2010, and for interim periods within those years. Management has evaluated the impact of ASU 2010-06 and has concluded that ASU 2010-06 has no material impact on these financial statements.
In May 2011, FASB issued Accounting Standards Update (ASU) No. 2011-04 “Amendments to Achieve Common Fair Value Measurement and Disclosure Requirements in GAAP and the International Financial Reporting Standards (IFRS).” ASU 2011-04 includes common requirements for measurement of and disclosure about fair value between U.S. GAAP and IFRS. ASU 2011-04 will require reporting entities to categorize within Level 3 of the fair value hierarchy: quantitative information about the unobservable inputs used in the fair value measurement, the valuation processes used by the reporting entity and a narrative description of the sensitivity of the fair value measurement to changes in unobservable inputs and the interrelationships between those unobservable inputs. In addition, ASU 2011-04 will require reporting entities to make disclosures about amounts and reasons for all transfers in and out of Level 1 and Level 2 fair value measurements. The new and revised disclosures are effective for fiscal years beginning after December 15, 2011 and for interim periods within those fiscal years. Management is currently evaluating the implications of ASU 2011-04 and its impact on the financial statements.
17
MET INVESTORS SERIES TRUST
| | |
Third Avenue Small Cap Value Portfolio | | |
Quarterly Portfolio Schedule
The Trust files Form N-Q for the first and third quarters of each fiscal year. The Trust’s Forms N-Q will be available on the Securities and Exchange Commission’s website at http://www.sec.gov. The Trust’s Forms N-Q may be reviewed and copied at the Securities and Exchange Commission’s Public Reference Room in Washington, D.C. and information on the operation of the Public Reference Room may be obtained by calling 1-800-SEC-0330. Once filed, the most recent Form N-Q will be available without charge, upon request, by calling (800) 848-3854.
Proxy Voting Policies and Procedures
A description of the policies and procedures that the Trust uses to determine how to vote proxies relating to portfolio securities is available without charge, upon request, by calling (800) 848-3854 and on the Securities and Exchange Commission’s website at http://www.sec.gov.
Proxy Voting Record
The Trust, on behalf of each of its Portfolios, has filed with the Securities and Exchange Commission its proxy voting record for the 12-month period ending June 30 on Form N-PX. Form N-PX must be filed by the Trust each year by August 31. Once filed, the most recent Form N-PX will be available without charge, upon request, by calling (800) 848-3854 or on the Securities and Exchange Commission’s website at http://www.sec.gov.
18
Item applicable only to annual report on Form N-CSR.
| Item 3. | Audit Committee Financial Expert. |
Item applicable only to annual report on Form N-CSR.
| Item 4. | Principal Accountant Fees and Services. |
Item applicable only to annual report on Form N-CSR.
| Item 5. | Audit Committee of Listed Registrants. |
Not applicable.
| Item 6. | Schedule of Investments. |
| (a) | Schedule of Investments is included as a part of the report to shareholders filed under Item 1 of this Form N-CSR. |
| Item 7. | Disclosure of Proxy Voting Policies and Procedures for Closed-End Management Investment Companies. |
Not applicable.
| Item 8. | Portfolio Managers of Closed-End Management Investment Companies. |
Not applicable.
| Item 9. | Purchases of Equity Securities by Closed-End Management Investment Company and Affiliated Purchasers. |
Not applicable.
| Item 10. | Submission of Matters to a Vote of Security Holders. |
The registrant does not have procedures by which shareholders may recommend nominees to the registrant’s Board of Trustees.
| Item 11. | Controls and Procedures. |
(a) Within 90 days of the filing date of this Form N-CSR, Elizabeth M. Forget, the registrant’s President and Jeffrey A. Tupper, the registrant’s Chief Financial Officer and Treasurer, reviewed the registrant’s disclosure controls and procedures (as defined in Rule 30a-3(c) under the Investment Company Act of 1940, as amended (the “1940 Act”)) (the “Procedures”) and evaluated their effectiveness. Based on their review, Ms. Forget and Mr. Tupper determined that the Procedures adequately ensure that information required to be disclosed by the registrant on Form N-CSR and Form N-Q is recorded, processed, summarized and reported within the time periods required by the Securities and Exchange Commission.
(b) There were no significant changes in the registrant’s internal control over financial reporting (as defined in Rule 30a-3(d) under the 1940 Act) that occurred during the registrant’s second fiscal quarter of the period covered by the report that has materially affected, or is reasonably likely to materially affect, the registrant’s internal control over financial reporting.
| (a)(2) | The certifications required by Rule 30a-2(a) of the 1940 Act are attached hereto. |
| (b) | The certifications required by Rule 30a-2(b) of the 1940 Act and Section 906 of the Sarbanes-Oxley Act of 2002 are attached hereto. |
SIGNATURES
Pursuant to the requirements of the Securities Exchange Act of 1934 and the Investment Company Act of 1940, the registrant has duly caused this report to be signed on its behalf by the undersigned, thereunto duly authorized.
| | |
| MET INVESTORS SERIES TRUST |
| |
| By: | | /s/ Elizabeth M. Forget |
| | Elizabeth M. Forget President |
Date: December 16, 2011
Pursuant to the requirements of the Securities Exchange Act of 1934 and the Investment Company Act of 1940, this report has been signed below by the following persons on behalf of the registrant and in the capacities and on the dates indicated.
| | |
| By: | | /s/ Elizabeth M. Forget |
| | Elizabeth M. Forget President |
Date: December 16, 2011
| | |
| |
| By: | | /s/ Jeffrey A. Tupper |
| | Jeffrey A. Tupper Chief Financial Officer and Treasurer |
Date: December 16, 2011