
ANNUAL INFORMATION FORM
For the year ended December 31, 2016
February 24, 2017
| |
| Page |
| |
Glossary of Terms | 1 |
Abbreviations and Conversions | 3 |
Presentation of Oil and Gas Reserves, Contingent Resources, and Production Information | 4 |
Note to Reader Regarding Oil and Gas Information, Definitions and National Instrument 51‑101 | 4 |
Disclosure of Reserves and Production Information | 4 |
Barrels of Oil and Cubic Feet of Gas Equivalent | 5 |
Interests in Reserves, Contingent Resources, Production, Wells and Properties | 5 |
Reserves Categories and Levels of Certainty for Reported Reserves | 5 |
Development and Production Status | 6 |
Description of Price and Cost Assumptions | 6 |
Presentation of Financial Information | 6 |
Forward‑Looking Statements and Information | 6 |
Corporate Structure | 10 |
Enerplus Corporation | 10 |
Material Subsidiaries | 10 |
Organizational Structure | 10 |
General Development of the Business | 11 |
Developments in the Past Three Years | 11 |
Business of the Corporation | 12 |
Overview | 12 |
Summary of Principal Production Locations | 12 |
Capital Expenditures and Costs Incurred | 13 |
Exploration and Development Activities | 14 |
Oil and Natural Gas Wells and Unproved Properties | 14 |
Description of Properties | 15 |
Quarterly Production History | 17 |
Quarterly Netback History | 18 |
Tax Horizon | 19 |
Marketing Arrangements and Forward Contracts | 19 |
Oil and Natural Gas Reserves | 21 |
Summary of Reserves | 21 |
Forecast Prices and Costs | 24 |
Undiscounted Future Net Revenue by Reserves Category | 24 |
Net Present Value of Future Net Revenue by Reserves Category and Product Type | 25 |
Estimated Production for Gross Reserves Estimates | 26 |
Future Development Costs | 28 |
Reconciliation of Reserves | 28 |
Undeveloped Reserves | 30 |
Significant Factors or Uncertainties | 31 |
Proved and Probable Reserves not on Production | 31 |
Supplemental Operational Information | 32 |
Safety and Social Responsibility | 32 |
Insurance | 34 |
Personnel | 34 |
Description of Capital Structure | 35 |
Common Shares | 35 |
Preferred Shares | 35 |
Shareholder Rights Plan | 35 |
Senior Unsecured Notes | 36 |
Bank Credit Facility | 36 |
Dividends | 37 |
Dividend Policy and History | 37 |
Stock Dividend Program | 37 |
Industry Conditions | 38 |
Overview | 38 |
Pricing and Marketing of Crude Oil and Natural Gas | 38 |
Royalties and Incentives | 39 |
Land Tenure | 39 |
Environmental Regulation | 40 |
Worker Safety | 43 |
Risk Factors | 44 |
Market for Securities | 56 |
Directors and Officers | 57 |
Directors of the Corporation | 57 |
Officers of the Corporation | 59 |
Common Share Ownership | 60 |
Conflicts of Interest | 60 |
Audit & Risk Management Committee Disclosure | 60 |
Legal Proceedings and Regulatory Actions | 60 |
Interest of Management and Others in Material Transactions | 60 |
Material Contracts and Documents Affecting the Rights of Securityholders | 60 |
Interests of Experts | 61 |
Transfer Agent and Registrar | 61 |
Additional Information | 61 |
Appendix A – Contingent Resources Information | A-1 |
Appendix B – Report on Reserves Data and Contingent Resources Data by Independent Qualified Reserves Evaluator or Auditor | B-1 |
Appendix C – Report of Management and Directors on Oil and Gas Disclosure | C-1 |
Appendix D – Audit & Risk Management Committee Disclosure Pursuant to National Instrument 52‑110 | D-1 |
Glossary of Terms
Unless the context otherwise requires, in this Annual Information Form, the following terms and abbreviations have the meanings set forth below. Additional terms relating to oil and natural gas reserves, resources and operations have the meanings set forth under "Presentation of Oil and Gas Reserves, Contingent Resources and Production Information" in this Annual Information Form and under “Note to Reader Regarding Disclosure of Contingent Resources Information” in Appendix A. All references to “Annual Information Form” include this Annual Information Form of the Corporation dated February 24, 2017 for the year ended December 31, 2016 and all appendices hereto.
"ABCA" means the Business Corporations Act (Alberta), as amended;
"AECO" means the physical storage and trading hub for natural gas on the TransCanada Alberta Transmission System (NOVA) which is the delivery point for the various benchmark Alberta index prices;
"Bank Credit Facility" means, as at December 31, 2016, the Corporation's $800 million unsecured, covenant‑based revolving credit facility with a syndicate of financial institutions. See “Description of Capital Structure – Bank Credit Facility” and "Material Contracts and Documents Affecting the Rights of Securityholders";
"COGE Handbook" means the Canadian Oil and Gas Evaluation Handbook prepared jointly by the Society of Petroleum Evaluation Engineers (Calgary Chapter) Canada and the Canadian Institute of Mining, Metallurgy and Petroleum (Petroleum Society), as amended from time to time;
"Common Shares" means the common shares in the capital of the Corporation;
"Conversion" means the conversion of Enerplus' business from an income trust structure (with the parent entity being the Fund) to a corporate structure (with the parent entity being the Corporation) effective January 1, 2011 by way of a plan of arrangement under the ABCA, pursuant to which, among other things, the former trust units of the Fund, each of which represented an equal undivided beneficial interest in the Fund, were exchanged on a one‑for‑one basis for Common Shares;
"Corporation" means Enerplus Corporation, a corporation amalgamated under the ABCA, and, where the context requires, its subsidiaries, taken as a whole;
"Credit Facilities" means, collectively, the Bank Credit Facility and the Senior Unsecured Notes. See "Material Contracts and Documents Affecting the Rights of Securityholders";
"CSA Notice 51‑324" means Canadian Securities Administrators Staff Notice 51‑324 (Revised) – Glossary to NI 51‑101 Standards of Disclosure for Oil and Gas Activities, issued by the Canadian securities regulatory authorities;
"Enerplus" means (i) on and after January 1, 2011, the Corporation and, where the context requires, its subsidiaries, taken as a whole, and (ii) prior to January 1, 2011, the Fund and its subsidiaries, taken as a whole;
"Enerplus USA" means Enerplus Resources (USA) Corporation, a corporation organized under the laws of Delaware and a wholly‑owned subsidiary of the Corporation;
"Fund" means Enerplus Resources Fund, formerly a trust formed pursuant to the laws of Alberta that was dissolved on January 1, 2011 in connection with the Conversion, and which was the predecessor issuer to the Corporation;
"IFRS" means International Financial Reporting Standards, as issued by the International Accounting Standards Board, as amended from time to time;
"McDaniel" means McDaniel & Associates Consultants Ltd., independent petroleum consultants;
"McDaniel Reports" means, collectively, the independent engineering evaluations of the Corporation's oil, natural gas liquids and natural gas reserves in Canada and the Corporation's oil, natural gas liquids and natural gas reserves in the United States prepared by McDaniel effective December 31, 2016, utilizing commodity price forecasts of McDaniel as of January 1, 2017;
"MD&A" means management's discussion and analysis;
"NI 51‑101" means National Instrument 51‑ 101 – Standards of Disclosure for Oil and Gas Activities, adopted by the Canadian securities regulatory authorities;
ENERPLUS 2016 ANNUAL INFORMATION FORM 1
"NSAI" means Netherland, Sewell & Associates, Inc., independent petroleum consultants;
"NSAI Report" means the independent engineering evaluation of the Corporation's shale gas reserves and contingent resources in the Marcellus properties prepared by NSAI effective December 31, 2016, utilizing commodity price forecasts of McDaniel (for internal consistency in the Corporation's reserves reporting) as of January 1, 2017;
"NYSE" means the New York Stock Exchange;
"SEC" means the United States Securities and Exchange Commission;
"Senior Unsecured Notes" means, as at December 31, 2016, the US$533 million principal amount and CDN$30 million principal amount of outstanding senior unsecured notes issued by Enerplus. See "Description of Capital Structure – Senior Unsecured Notes" and "Material Contracts and Documents Affecting the Rights of Securityholders";
"Shareholder Rights Plan" means the amended and restated shareholder rights plan agreement between the Corporation and Computershare Trust Company of Canada, as rights agent, dated as of May 6, 2016. See “Description of Capital Structure – Shareholder Rights Plan” and "Material Contracts and Documents Affecting the Rights of Securityholders";
"Tax Act" means the Income Tax Act (Canada), R.S.C. 1985, c.1 (5th Supp.), as amended, including the regulations promulgated thereunder, as amended from time to time;
"TSX" means the Toronto Stock Exchange; and
"U.S. GAAP" means generally accepted accounting principles in the United States.
2 ENERPLUS 2016 ANNUAL INFORMATION FORM
Abbreviations and Conversions
In this Annual Information Form, the following abbreviations have the meanings set forth below:
| | |
API | | American Petroleum Institute gravity, a measure of how heavy or light a petroleum liquid is compared to water |
bbls | | barrels, with each barrel representing 34.972 imperial gallons or 42 U.S. gallons |
bbls/day | | barrels per day |
Bcf | | billion cubic feet |
BcfGE(1) | | one billion cubic feet of natural gas equivalent |
BOE(1) | | barrels of oil equivalent |
BOE/day | | barrels of oil equivalent per day |
GJ | | gigajoule; equal to one thousand million joules |
Mbbls | | one thousand barrels |
MBOE(1) | | one thousand barrels of oil equivalent |
Mcf | | one thousand cubic feet |
Mcf/day | | one thousand cubic feet per day |
MMBOE(1) | | one million barrels of oil equivalent |
MMbtu | | one million British Thermal Units |
MMcf | | one million cubic feet |
NGLs | | natural gas liquids |
NPV | | net present value of future net revenue, discounted at 10% |
NYMEX | | the New York Mercantile Exchange |
Tcf | | trillion cubic feet |
WTI | | West Texas Intermediate crude oil that serves as the benchmark crude oil for the NYMEX crude oil contract delivered in Cushing, Oklahoma |
Note: (1) The Corporation has adopted the standard of 6 Mcf of natural gas: 1 bbl of oil when converting natural gas to BOEs, MBOEs and MMBOEs, and 1 bbl of oil and NGLs: 6 Mcf of natural gas when converting oil and NGLs to BcfGEs. For further information, see "Presentation of Oil and Gas Reserves, Contingent Resources and Production Information – Barrels of Oil and Cubic Feet of Gas Equivalent".
In this Annual Information Form, unless otherwise indicated, all dollar amounts are in Canadian dollars and all references to "$" and "CDN$" are to Canadian dollars. References to "US$" are to U.S. dollars. On December 30, 2016, the exchange rate for one U.S. dollar, expressed in Canadian dollars and based upon the noon buying rate of the Bank of Canada, was CDN$1.3427.
The following table sets forth certain standard conversions between Standard Imperial Units and the International System of Units (or metric units).
| | | | |
| | | | Multiply |
To Convert From | | To | | By |
Mcf | | cubic metres | | 28.174 |
cubic metres | | cubic feet | | 35.494 |
bbls | | cubic metres | | 0.159 |
cubic metres | | bbls | | 6.293 |
feet | | metres | | 0.305 |
metres | | feet | | 3.281 |
miles | | kilometres | | 1.609 |
kilometres | | miles | | 0.621 |
acres | | hectares | | 0.4047 |
hectares | | acres | | 2.471 |
ENERPLUS 2016 ANNUAL INFORMATION FORM 3
Presentation of Oil and Gas Reserves, Contingent Resources, and Production Information
Note to Reader Regarding Oil and Gas Information, Definitions and National Instrument 51‑101
The oil and gas reserves and operational information of the Corporation contained in this Annual Information Form contains the information required to be included in the Statement of Reserves Data and Other Oil and Gas Information pursuant to NI 51‑101 adopted by the Canadian securities regulatory authorities. Readers should also refer to the Report on Reserves Data and Contingent Resources Data by McDaniel and NSAI attached as Appendix B and the Report of Management and Directors on Oil and Gas Disclosure attached hereto as Appendix C. The effective date for the Statement of Reserves Data and Contingent Resources and Other Oil and Gas Information contained in this Annual Information Form is December 31, 2016 and the preparation dates for such information are January 25, 2017 for the McDaniel Reports and February 3, 2017 for the NSAI Report.
Certain of the following definitions and guidelines are contained in the Glossary to NI 51‑101 contained in CSA Notice 51‑324, which incorporates certain definitions from the COGE Handbook. Readers should consult CSA Notice 51‑324 and the COGE Handbook for additional explanation and guidance.
For information regarding contingent resources of the Corporation and its presentation, see Appendix A.
Disclosure Of Reserves And Production Information
Presentation of Information
In this Annual Information Form, all oil and natural gas production and realized product prices information is presented on a "company interest" basis (as defined below), unless expressly indicated that it is being presented on a "gross" or "net" basis. "Company interest" means, in relation to the Corporation's interest in production, its working interest (operating or non‑operating) share before deduction of royalties, plus the Corporation's royalty interests in production. "Company interest" is not a term defined or recognized under NI 51‑101 and does not have a standardized meaning under NI 51‑101. Therefore, the "company interest" production of the Corporation may not be comparable to similar measures presented by other issuers, and investors are cautioned that "company interest" production should not be construed as an alternative to "gross" or "net" production calculated in accordance with NI 51‑101.
In this Annual Information Form, all crude oil and natural gas information includes tight oil and shale gas, respectively, unless expressly indicated that it is being presented on a separate basis. The Corporation's actual oil and natural gas reserves and future production may be greater than or less than the estimates provided in this Annual Information Form. The estimated future net revenue from the production of such oil and natural gas reserves does not represent the fair market value of such reserves. See "Oil and Natural Gas Reserves – Summary of Reserves" for additional information.
Notice to U.S. Readers
Data on oil and natural gas reserves contained in this Annual Information Form has generally been prepared in accordance with Canadian disclosure standards, which are not comparable in all respects to United States or other foreign disclosure standards. For example, although the SEC now generally permits oil and gas issuers, in their filings with the SEC, to disclose both proved reserves and probable reserves (each as defined in the SEC rules), the SEC definitions of proved reserves and probable reserves may differ from the definitions of "proved reserves" and "probable reserves" under Canadian securities laws. In addition, under Canadian disclosure requirements and industry practice, reserves and production are reported using gross (or, as noted above with respect to production information, "company interest") volumes, which are volumes prior to deduction of applicable royalties and similar payments. The practice in the United States is to report reserves and production using net volumes, after deduction of applicable royalties and similar payments. Moreover, in accordance with Canadian disclosure requirements, the Corporation has determined and disclosed estimated future net revenue from its reserves using forecast prices and costs, whereas the SEC generally requires that reserves estimates be prepared using an unweighted average of the closing prices for the applicable commodity on the first day of each of the twelve months preceding the company's fiscal year‑end, with the option of also disclosing reserves estimates based upon future or other prices. As a consequence of the foregoing, the Corporation's reserves estimates and production volumes may not be comparable to those made by companies utilizing United States reporting and disclosure standards. Additionally, the SEC prohibits disclosure of oil and gas resources in SEC filings, including contingent resources, whereas Canadian securities regulatory authorities allow disclosure of oil and gas resources. Resources are different than, and should not be construed as, reserves. For a description of the definition of, and the risks and uncertainties surrounding the disclosure of, contingent resources, see "Note to Reader Regarding Disclosure of Contingent Resources Information" in Appendix A.
4 ENERPLUS 2016 ANNUAL INFORMATION FORM
Barrels of Oil and Cubic Feet of Gas Equivalent
The Corporation has adopted the standard of 6 Mcf of natural gas: 1 bbl of oil when converting natural gas to BOEs, MBOEs and MMBOEs, and 1 bbl of oil and NGLs: 6 Mcf of natural gas when converting oil and NGLs to and BcfGEs. BOEs, MBOEs, MMBOEs, and BcfGEs may be misleading, particularly if used in isolation. The foregoing conversion ratios are based on an energy equivalency conversion method primarily applicable at the burner tip and do not represent a value equivalency at the wellhead. Given that the value ratio based on the current price of crude oil as compared to natural gas is significantly different from the energy equivalency of 6:1, utilizing a conversion on a 6:1 basis may be misleading as an indication of value.
Interests in Reserves, Contingent Resources, Production, Wells and Properties
In addition to the terms having defined meanings set forth in CSA Notice 51‑324, the terms set forth below have the following meanings when used in this Annual Information Form:
"gross" means:
| (i) | | in relation to the Corporation's interest in production, reserves or contingent resources, its working interest (operating or non‑operating) share before deduction of royalties and without including any royalty interests of the Corporation; |
| (ii) | | in relation to wells, the total number of wells in which the Corporation has an interest; and |
| (iii) | | in relation to properties, the total area in which the Corporation has an interest. |
"net" means:
| (i) | | in relation to the Corporation's interest in production, reserves or contingent resources, its working interest (operating or non‑operating) share after deduction of royalty obligations, plus the Corporation's royalty interests in production or reserves; |
| (ii) | | in relation to the Corporation's interest in wells, the number of wells obtained by aggregating the Corporation's working interest in each of its gross wells; and |
| (iii) | | in relation to the Corporation's interest in a property, the total area in which the Corporation has an interest multiplied by the working interest owned by the Corporation. |
"working interest" means the percentage of undivided interest held by the Corporation in the oil and/or natural gas or mineral lease granted by the mineral owner (Crown or freehold), which interest gives the Corporation the right to "work" the property (lease) to explore for, develop, produce and market the leased substances.
Reserves Categories and Levels of Certainty for Reported Reserves
In this Annual Information Form, the following terms have the meaning assigned thereto in CSA Notice 51‑324 and the COGE Handbook:
"reserves" are estimated remaining quantities of oil and natural gas and related substances anticipated to be recoverable from known accumulations, as of a given date, based on: analysis of drilling, geological, geophysical and engineering data; the use of established technology; and specified economic conditions, which are generally accepted as being reasonable, and shall be disclosed. Reserves may be divided into proved and probable categories according to the degree of certainty associated with the estimates.
"proved reserves" are those reserves that can be estimated with a high degree of certainty to be recoverable. It is likely that the actual remaining quantities recovered will exceed the estimated proved reserves.
"probable reserves" are those additional reserves that are less certain to be recovered than proved reserves. It is equally likely that the actual remaining quantities recovered will be greater or less than the sum of the estimated proved plus probable reserves.
The qualitative certainty levels referred to in the definitions above are applicable to individual reserves entities (which refers to the lowest level at which reserves calculations are performed) and to reported reserves (which refers to the highest‑level
ENERPLUS 2016 ANNUAL INFORMATION FORM 5
sum of individual entity estimates for which reserves estimates are presented). Reported reserves should target the following levels of certainty under a specific set of economic conditions:
| · | | at least a 90% probability that the quantities actually recovered will equal or exceed the estimated proved reserves; and |
| · | | at least a 50% probability that the quantities actually recovered will equal or exceed the sum of the estimated proved plus probable reserves. |
Development and Production Status
Each of the reserves categories reported by the Corporation (proved and probable) may be divided into developed and undeveloped categories:
"developed reserves" are those reserves that are expected to be recovered from existing wells and installed facilities or, if facilities have not been installed, that would involve a low expenditure (for example, when compared to the cost of drilling a well) to put the reserves on production. The developed category may be subdivided into producing and non‑producing.
| · | | "developed producing reserves" are those reserves that are expected to be recovered from completion intervals open at the time of the estimate. These reserves may be currently producing or, if shut‑in, they must have previously been on production, and the date of resumption of production must be known with reasonable certainty. |
| · | | "developed non‑producing reserves" are those reserves that either have not been on production, or have previously been on production, but are shut‑in, and the date of resumption of production is unknown. |
"undeveloped reserves" are those reserves that are expected to be recovered from known accumulations where a significant expenditure (for example, when compared to the cost of drilling a well) is required to render them capable of production. They must fully meet the requirements of the reserves classification (proved or probable) to which they are assigned.
Description of Price and Cost Assumptions
"Forecast prices and costs" means future prices and costs that are:
| (i) | | generally accepted as being a reasonable outlook of the future; and |
| (ii) | | if, and only to the extent that, there are fixed or presently determinable future prices or costs to which the Corporation is legally bound by a contractual or other obligation to supply a physical product, including those for an extension period of a contract that is likely to be extended, those prices or costs rather than the prices or costs referred to in paragraph (i). |
Presentation of Financial Information
The Corporation has converted its financial reporting from IFRS to U.S. GAAP as (i) over 50% of the book value of the assets (as previously calculated under IFRS) was in the United States, and (ii) over 50% of the Common Shares are held by U.S. residents. Reporting under U.S. GAAP began with the financial statements for the year ended December 31, 2013.
The Corporation continues to qualify as a foreign private issuer for its U.S. securities filings as less than 50% of the book value of its assets is in the United States, as calculated under U.S. GAAP as at June 30, 2016. The Corporation is required to reassess this annually, at the end of the second quarter. See "Risk Factors – Government regulations and required regulatory approvals and compliance may adversely impact the Corporation's operations and result in increased operating and capital costs".
Forward‑Looking Statements and Information
This Annual Information Form contains certain forward‑looking statements and forward‑looking information (collectively, "forward‑looking information") within the meaning of applicable securities laws which are based on the Corporation's current internal expectations, estimates, projections, assumptions, and beliefs. The use of any of the words "anticipate", "continue", "estimate", "expect", "may", "will", "project", "plan", "intend", "guidance", "objective", "strategy", "should", "believe" and similar expressions are intended to identify forward‑looking statements and forward‑looking information. These statements are not guarantees of future performance, and involve known and unknown risks, uncertainties and other factors that may cause actual results or events to differ materially from those anticipated in such forward‑looking information. The
6 ENERPLUS 2016 ANNUAL INFORMATION FORM
Corporation believes the expectations reflected in such forward‑looking information are reasonable but no assurance can be given that these expectations will prove to be correct, and such forward‑looking information included in this Annual Information Form should not be unduly relied upon. Such forward‑looking information speaks only as of the date of this Annual Information Form and the Corporation does not undertake any obligation to publicly update or revise any forward‑looking information, except as required by applicable laws.
In particular, this Annual Information Form contains forward‑looking information pertaining to the following:
| · | | the quantity of, and future net revenues from, the Corporation's reserves and/or contingent resources; |
| · | | crude oil, NGLs and natural gas production levels; |
| · | | commodity prices, foreign currency exchange rates and interest rates; |
| · | | current capital expenditure programs, drilling programs, development plans and other future expenditures, including the planned allocation of capital expenditures among the Corporation's properties and the sources of funding for such expenditures; |
| · | | supply and demand for oil, NGLs and natural gas; |
| · | | the Corporation's business strategy, including its asset and operational focus; |
| · | | future acquisitions and divestments and future growth potential; |
| · | | expectations regarding the Corporation's ability to raise capital and to continually add to reserves and/or resources through acquisitions and development; |
| · | | schedules for and timing of certain projects and the Corporation's strategy for growth; |
| · | | the Corporation's future operating and financial results; |
| · | | future dividends that may be paid by the Corporation; |
| · | | the Corporation's tax pools and the time at which the Corporation may incur certain income or other taxes; and |
| · | | treatment under governmental and other regulatory regimes and tax, environmental and other laws and expectations |
| · | | regarding the Corporation’s compliance therewith. |
The forward‑looking information contained in this Annual Information Form reflects several material factors and expectations and assumptions made by the Corporation including, without limitation, that: the Corporation's current commodity price and other cost assumptions will generally be accurate; the Corporation will have sufficient cash flow, debt or equity sources or other financial resources required to fund its capital and operating expenditures and requirements as needed; the Corporation's conduct and results of operations will be consistent with its expectations; the Corporation and its industry partners will have the ability to develop the Corporation's oil and gas properties in the manner currently contemplated; a lack of infrastructure does not result in the Corporation curtailing its production and/or receiving reductions to its realized prices; current or, where applicable, proposed assumed industry conditions, laws and regulations will continue in effect or as anticipated as described herein; the estimates of the Corporation's reserves and resources volumes and the assumptions related thereto (including commodity prices and development costs) are accurate in all material respects; and there will be sufficient availability of services and labour to conduct the Corporation's operations as planned.
The Corporation’s current 2017 capital expenditure budget contained in this Annual Information Form assumes: WTI price of US$55.00/bbl; NYMEX gas price of US$3.00/Mcf; AECO gas price of $2.75/GJ; and a foreign exchange rate of USD/CDN 1.35.
The Corporation believes the material factors, expectations and assumptions reflected in the forward‑looking information are reasonable at this time but no assurance can be given that these factors, expectations and assumptions will prove to be correct.
ENERPLUS 2016 ANNUAL INFORMATION FORM 7
The Corporation's actual results could differ materially from those anticipated in this forward‑looking information as a result of both known and unknown risks, including the risk factors set forth under "Risk Factors" in this Annual Information Form and risks relating to:
| · | | volatility, including further decline, in market prices for oil, NGLs and natural gas, including changes in supply or demand for those products; |
| · | | actions, by governmental or regulatory authorities, including different interpretations of applicable laws, treaties or administrative positions, as well as changes in income tax laws or changes in royalty regimes and incentive programs relating to the oil and gas industry; |
| · | | unanticipated operating results, including changes or fluctuations in oil, NGLs and natural gas production levels; |
| · | | changes in foreign currency exchange rates, including Canadian currency compared to U.S., and its impact on the Corporation’s operations and financial condition; |
| · | | changes in interest rates; |
| · | | changes in development plans by the Corporation or third party operators; |
| · | | the ability of the Corporation to comply with debt covenants under the Credit Facilities; |
| · | | the ability of the Corporation to access required capital; |
| · | | changes in capital and other expenditure requirements and debt service requirements; |
| · | | liabilities and unexpected events inherent in oil and gas operations, including geological, technical, drilling and processing risks, as well as unforeseen title defects or litigation; |
| · | | actions of and reliance on industry partners; |
| · | | uncertainties associated with estimating reserves and resources; |
| · | | competition for, among other things, capital, acquisitions of reserves and resources, undeveloped lands, access to third party processing capacity, and skilled personnel; |
| · | | incorrect assessments of the value of acquisitions or divestments, or the failure to complete divestments; |
| · | | constraints on, or the unavailability of, adequate infrastructure, including pipeline and other transportation capacity, to deliver the Corporation's production to market; |
| · | | the Corporation's success at the acquisition, exploitation and development of reserves and resources; |
| · | | changes in general economic, market (including credit market) and business conditions in Canada, North America and worldwide; and |
| · | | changes in tax, environmental, regulatory, or other legislation applicable to the Corporation and its operations, and the Corporation's ability to comply with current and future environmental legislation and regulations and other laws and regulations, including those impacting financial institutions that could limit commodity market liquidity. |
Many of these risk factors and other specific risks and uncertainties are discussed in further detail throughout this Annual Information Form and in the Corporation's MD&A for the year ended December 31, 2016, which is available on the internet on the Corporation's SEDAR profile at www.sedar.com, on the Corporation's EDGAR profile at www.sec.gov as part of the annual report on Form 40‑F filed with the SEC together with this Annual Information Form, and on the Corporation's website at www.enerplus.com. Readers are also referred to the risk factors described in this Annual Information Form under "Risk Factors" and in other documents the Corporation files from time to time with securities regulatory authorities. Copies of these documents are available without charge from the Corporation or electronically on the internet on the Corporation's SEDAR profile at www.sedar.com, on the Corporation's EDGAR profile at www.sec.gov and on the Corporation's website at www.enerplus.com.
8 ENERPLUS 2016 ANNUAL INFORMATION FORM
Corporate Structure
Enerplus Corporation
The Corporation was incorporated on August 12, 2010 under the ABCA for the purposes of participating in the Conversion under which the business of the Fund, as the Corporation's predecessor, was transitioned to the Corporation. As part of the plan of arrangement under the ABCA pursuant to which the Conversion was effected, the Corporation was amalgamated with several other former direct and indirect subsidiaries of the Fund on January 1, 2011 and continued as the Corporation. Prior to the Conversion, the business of the Corporation was carried on by the Fund and its subsidiaries as an income trust since 1986.
Effective May 11, 2012, the Corporation amended and restated its articles of amalgamation in connection with the implementation of a stock dividend program. The Corporation amended the rights, privileges, restrictions and conditions in respect of Common Shares to set forth the terms and conditions pursuant to which the Corporation may issue Common Shares as payment of all or any portion of dividends declared on the Common Shares for those shareholders who elect to receive stock dividends instead of cash dividends. The Corporation's board of directors suspended the stock dividend program effective September 19, 2014. See "Description of Capital Structure – Common Shares" and "Dividends – Stock Dividend Program".
The head, principal and registered office of the Corporation is located at The Dome Tower, 3000, 333 ‑ 7th Avenue S.W., Calgary, Alberta, T2P 2Z1. The Corporation also has a U.S. office located at 950 ‑ 17th Street, Suite 2200, Denver, Colorado, 80202‑2805. The Common Shares are currently traded on the TSX and the NYSE under the symbol "ERF".
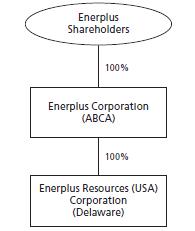
Material Subsidiaries
As of December 31, 2016, Enerplus USA was the only material subsidiary of Enerplus Corporation. All of the issued and outstanding securities of Enerplus USA are owned by the Corporation.
Organizational Structure
The simplified organizational structure of Enerplus Corporation and its material subsidiary as of December 31, 2016 is set forth below.
ENERPLUS 2016 ANNUAL INFORMATION FORM 9
General Development of the Business
Developments in the Past Three Years
Developments in 2014
FINANCING
On September 3, 2014, the Corporation completed a private placement offering of 3.79% Senior Unsecured Notes in an aggregate principal amount of US$200 million due September 3, 2026. The Corporation used the net proceeds of this offering to reduce its outstanding indebtedness under the Bank Credit Facility. See "Description of Capital Structure – Senior Unsecured Notes".
SALE OF ASSETS
In 2014, the Corporation realized proceeds of over $200 million from divestment activities involving certain of the Corporation's Deep Basin assets in Canada and its gross overriding royalty interest in the Jonah natural gas property in the United States. These divestments included in aggregate approximately 3,500 BOE/day of production. The proceeds from the Corporation's divestment activities were used to fund the Corporation's capital program and to reduce indebtedness under the Bank Credit Facility.
SUCCESSION OF CHAIRMAN OF THE BOARD OF DIRECTORS
Mr. Doug Martin, the former Chairman of the board of directors of the Corporation, retired from this position effective June 1, 2014 and as a director of the Corporation effective November 30, 2014. Mr. Elliott Pew succeeded Mr. Martin as the Chairman of the board of directors of the Corporation effective June 1, 2014. Mr. Pew has been a director of the Corporation since September 2010. See "Directors and Officers".
Developments in 2015
SALE OF ASSETS
In 2015, the Corporation realized proceeds of approximately $286.6 million from divestment activities involving certain of the Corporation's assets. These divestments included approximately 6,200 BOE/day of production, in aggregate, from non-core shallow gas assets and Pembina waterflood assets in Canada, as well as certain non-operated North Dakota assets and operated Marcellus assets in the United States. The proceeds from the Corporation's divestment activities were used to fund the Corporation's capital program as well as the principal instalments due on its Senior Unsecured Notes.
SUCCESSION OF SENIOR VICE PRESIDENT & CHIEF FINANCIAL OFFICER
Ms. Jodine J. Jenson Labrie succeeded Mr. Robert J. Waters as the Senior Vice President & Chief Financial Officer effective September 15, 2015. Prior thereto, Ms. Jenson Labrie held the position of Vice President, Finance of the Corporation. See "Directors and Officers".
Developments in 2016
SENIOR Notes repurchase
The Corporation repurchased a total of US$267 million aggregate principal amount of the Senior Unsecured Notes between 90% of par and par during the first half of 2016, resulting in a gain of $19.3 million being recorded for the year. The repurchases were funded through asset divestment proceeds and the Bank Credit Facility.
FInancing
On May 31, 2016, the Corporation completed a bought-deal offering of 33,350,000 Common Shares (including 4,300,000 Common Shares issued pursuant to the exercise in full of the over-allotment option granted to the underwriters), at $6.90 per Common Share, for total proceeds of $230,115,000. The net proceeds from the offering were used by the Corporation to reduce indebtedness under the Bank Credit Facility, to fund its capital expenditures and for general corporate purposes.
10 ENERPLUS 2016 ANNUAL INFORMATION FORM
SALE OF ASSETS
In 2016, the Corporation realized proceeds of approximately $670 million from the divestment of certain of its non-strategic crude oil and natural gas assets. These divestments included approximately 13,500 BOE/day of production, in aggregate, from crude oil and natural gas assets in Canada, as well as certain non-operated North Dakota assets in the United States. The proceeds from the Corporation's divestment activities were used to fund the Corporation's capital program, repurchase a portion of its Senior Unsecured Notes, as described above, and to reduce amounts outstanding under the Bank Credit Facility.
Business of the Corporation
Overview
The Corporation's oil and natural gas property interests are located in the United States, primarily in North Dakota, Montana, and Pennsylvania, as well as in western Canada in the provinces of Alberta, British Columbia and Saskatchewan. Capital spending on these assets in 2016 totaled approximately $209 million with over 85% of this focused on the Corporation’s crude oil assets in North Dakota and waterflood projects in Canada.
In the United States, capital spending on the Bakken and Three Forks assets in North Dakota totaled $136 million during 2016. In Canada, capital spending of approximately $44 million in 2016 was directed to crude oil waterflood projects at Cadogan, Giltedge, Medicine Hat and southeast Saskatchewan. Capital spending on the Corporation’s natural gas interests in northeast Pennsylvania was approximately $24 million, about 25% less than in 2015, due to low regional natural gas prices. Canadian natural gas assets received a minimal amount of maintenance capital during 2016; the Corporation’s focus was on retaining value and reducing operating costs for these assets.
During 2016, the Corporation continued to concentrate its portfolio, divesting of certain crude oil and natural gas assets in Canada and the United States for total proceeds of approximately $670 million, after closing adjustments. These assets had associated production of approximately 13,500 BOE/day (60% natural gas). In November 2016, the Corporation acquired a waterflood asset in Northern Alberta’s Ante Creek area, with associated average production of 3,800 BOE/day, for approximately $110 million, after closing adjustments.
The Corporation's major producing properties generally have related field facilities and infrastructure to accommodate its production. Production volumes for the year ended December 31, 2016 from the Corporation's properties consisted of approximately 46% crude oil and NGLs and 54% natural gas, on a BOE basis. The Corporation's 2016 average daily production was 93,125 BOE/day, comprised of 38,353 bbls/day of crude oil, 4,903 bbls/day of NGLs and 299,214 Mcf/day of natural gas, a decrease of approximately 13% compared to 2015 average daily production of 106,524 BOE/day, comprised of 41,639 bbls/day of crude oil, 4,763 bbls/day of NGLs and 360,733 Mcf/day of natural gas. The decrease in average daily production during 2016 is largely attributable to a reduction in capital spending during 2016, combined with the divestment of non-strategic crude oil and natural gas assets mentioned previously. The Corporation’s 2016 production in the United States was approximately 71% of its total production, with the remaining 29% from Canada. Approximately 53% of the Corporation’s 2016 production was operated by the Corporation, with the remainder operated by industry partners.
As at December 31, 2016, the oil and natural gas property interests held by the Corporation were estimated to contain proved plus probable gross reserves of approximately 14.3 MMbbls of light and medium crude oil, 39.0 MMbbls of heavy crude oil, 123.0 MMbbls of tight oil, 18.1 MMbbls of NGLs, 126.3 Bcf of conventional natural gas and 1,002.8 Bcf of shale gas, for a total of 382.5 MMBOE. The Corporation's proved reserves represented approximately 70% of total proved plus probable reserves, with approximately 51% of the Corporation's proved plus probable reserves weighted to crude oil and NGLs. See "Oil and Natural Gas Reserves".
Unless otherwise noted, (i) all production and operational information in this Annual Information Form is presented as at or, where applicable, for the year ended, December 31, 2016, (ii) all production information represents the Corporation's company interest in production from these properties, which includes overriding royalty interests of the Corporation but is calculated before deduction of royalty interests owned by others, and (iii) all references to reserves volumes represent gross reserves using forecast prices and costs. See "Presentation of Oil and Gas Reserves, Contingent Resources, and Production Information".
Summary of Principal Production Locations
During the year ended December 31, 2016, on a BOE basis, approximately 71% of the Corporation's production was derived from the United States (31% from North Dakota, 35% from Pennsylvania and 5% from Montana) and approximately 29%
ENERPLUS 2016 ANNUAL INFORMATION FORM 11
from Canada (21% from Alberta, 6% from Saskatchewan and 2% from British Columbia). The following table describes the average daily production from the Corporation's principal producing properties and regions during the year ended December 31, 2016.
2016 Average Daily Production from Principal Properties and Regions
| | | | | | | | | | | | | | |
| | Products | | |
| | Crude Oil | | | | | | | | |
| | | | | | | | | | Conventional | | | | |
| | Light and | | | | | | | | Natural | | Shale | | |
Property/Region | | Medium | | Heavy | | Tight | | NGLs | | Gas | | Gas | | Total |
| | (bbls/day) | | (bbls/day) | | (bbls/day) | | (bbls/day) | | (Mcf/day) | | (Mcf/day) | | (BOE/day) |
United States | | | | | | | | | | | | | | |
Marcellus, Pennsylvania | | - | | - | | - | | - | | - | | 195,317 | | 32,553 |
Fort Berthold, North Dakota(1) | | - | | - | | 22,114 | | 3,490 | | - | | 17,798 | | 28,570 |
Sleeping Giant, Montana | | - | | - | | 3,150 | | 5 | | - | | 7,042 | | 4,329 |
Total United States | | - | | - | | 25,264 | | 3,495 | | - | | 220,157 | | 65,452 |
| | | | | | | | | | | | | | |
Canada | | | | | | | | | | | | | | |
Medicine Hat Glauconitic "C" East Unit, Alberta | | - | | 3,423 | | - | | - | | 322 | | - | | 3,476 |
Brooks, Alberta | | - | | 2,155 | | - | | 39 | | 6,389 | | - | | 3,259 |
Freda Lake, Saskatchewan | | 3,002 | | - | | - | | - | | - | | - | | 3,002 |
Tommy Lakes, British Columbia | | 70 | | - | | - | | 196 | | 10,789 | | - | | 2,064 |
Shackleton, Saskatchewan | | - | | - | | - | | - | | 12,357 | | - | | 2,060 |
Giltedge, Alberta | | - | | 1,594 | | - | | - | | 58 | | - | | 1,604 |
Willesden North, Alberta | | 3 | | - | | - | | 229 | | 3,633 | | - | | 837 |
Hanna Garden, Alberta | | - | | - | | - | | - | | 4,595 | | - | | 766 |
Cadogan, Alberta | | - | | 722 | | - | | 10 | | 191 | | - | | 764 |
Pine Creek, Alberta | | 2 | | - | | - | | 144 | | 3,508 | | - | | 731 |
Medicine Hat, Alberta | | - | | - | | - | | - | | 4,124 | | - | | 687 |
Joarcam, Alberta | | 367 | | - | | - | | 23 | | 1,231 | | - | | 595 |
Kaybob South, Alberta | | 1 | | - | | - | | 167 | | 1,874 | | - | | 480 |
Ante Creek, Alberta(2) | | 194 | | - | | - | | 10 | | 1,165 | | - | | 398 |
Other Canada(3) | | 1,173 | | 383 | | - | | 590 | | 28,074 | | 747 | | 6,950 |
Total Canada | | 4,812 | | 8,277 | | - | | 1,408 | | 78,310 | | 747 | | 27,673 |
| | | | | | | | | | | | | | |
Total | | 4,812 | | 8,277 | | 25,264 | | 4,903 | | 78,310 | | 220,904 | | 93,125 |
Notes:
| (1) | | North Dakota non-operated assets were sold on December 30, 2016. These assets had associated production of approximately 5,000 BOE/day, which is included in the table above. |
| (2) | | Acquired on November 15, 2016. |
| (3) | | A portion was sold during 2016, the largest of which included the Wilrich asset, as well as Pouce Coupe, Progress and Valhalla properties in the Peace River Arch area. Total production associated with these divestments was approximated at 8,500 BOE/day, which is not included in the table above. |
For additional information on the Corporation's oil and natural gas properties, see "Description of Properties".
Capital Expenditures and Costs Incurred
The Corporation invested approximately $209 million in its capital program during 2016, approximately 92% of which was directed to oil-related projects, compared to total capital spending in 2015 of approximately $493 million. Capital investment during 2016 was focused on the Corporation’s U.S. North Dakota Bakken crude oil property, where it invested $136 million, its U.S. Marcellus assets with investment of $24 million, as well as in its Canadian waterflood properties where it invested $44 million.
In the financial year ended December 31, 2016, the Corporation made the following expenditures in the categories noted, as prescribed by NI 51‑101:
| | | | | | | | | | | | |
| | Property Acquisition | | | | |
| | Costs | | Exploration | | Development |
| | Proved | | Unproved | | Costs | | Costs |
| | ($ in millions) |
Canada | | $ | 49.0 | | $ | 65.4 | | $ | 0.7 | | $ | 43.7 |
United States | | | 1.8 | | | 9.9 | | | 2.2 | | | 162.5 |
Total | | $ | 50.8 | | $ | 75.3 | | $ | 2.9 | | $ | 206.2 |
12 ENERPLUS 2016 ANNUAL INFORMATION FORM
Based on the commodity price environment as of the date hereof, the Corporation currently expects its 2017 exploration and development capital spending to be approximately $450 million, with approximately 87% of this spending projected to be invested in the Corporation's U.S. and Canadian crude oil projects. The Corporation currently expects to invest approximately 74% of its planned 2017 capital spending on its Fort Berthold property in the United States and 13% on its Canadian oil assets. In addition, the Corporation intends to spend approximately 13% of its 2017 capital on its Marcellus properties in the northeast region of Pennsylvania.
The Corporation intends to finance its 2017 capital expenditure program through a combination of internally generated cash flow and debt. The Corporation will review its 2017 capital investment plans throughout the year in the context of prevailing economic conditions, commodity prices and potential acquisitions and divestments, making adjustments as it deems necessary. See “Forward-Looking Statements and Information”.
For further information regarding the Corporation's properties and its 2016 exploration and development activities see "Description of Properties" below.
Exploration and Development Activities
The following table summarizes the number and type of wells that the Corporation drilled or participated in the drilling of for the year ended December 31, 2016, in each of Canada and the United States. Wells have been classified in accordance with the definitions of such terms in NI 51‑101.
| | | | | | | | | | | | | | | | |
| | Canada | | United States |
| | Development Wells | | Exploratory Wells | | Development Wells | | Exploratory Wells |
Category of Well | | Gross | | Net | | Gross | | Net | | Gross | | Net | | Gross | | Net |
Crude oil wells | | 7 | | 5 | | - | | - | | 25 | | 16 | | - | | - |
Natural gas wells | | - | | - | | - | | - | | 14 | | 1 | | - | | - |
Service wells | | 4 | | 4 | | - | | - | | - | | - | | - | | - |
Dry and abandoned wells | | - | | - | | - | | - | | - | | - | | - | | - |
Total | | 11 | | 9 | | - | | - | | 39 | | 17 | | - | | - |
For a description of the Corporation’s 2017 development plans and the anticipated sources of funding these plans, see "Capital Expenditures and Costs Incurred", above.
Oil and Natural Gas Wells and Unproved Properties
The following table summarizes, as at December 31, 2016, the Corporation's interests in producing wells and in non‑producing wells which were not producing but which may be capable of production, along with the Corporation's interests in unproved properties (as defined in NI 51‑101). Although many wells produce both oil and natural gas, a well is categorized as an oil well or a natural gas well based upon the proportion of oil or natural gas production that constitutes the majority of production from that well.
| | | | | | | | | | | | | | | | | | | | |
| | Producing Wells | | Non-Producing Wells | | Unproved Properties |
| | Oil | | Natural Gas | | Oil | | Natural Gas | | (acres) |
| | Gross | | Net | | Gross | | Net | | Gross | | Net | | Gross | | Net | | Gross | | Net |
Canada | | | | | | | | | | | | | | | | | | | | |
Alberta | | 943 | | 532 | | 2,689 | | 1,372 | | 536 | | 251 | | 507 | | 182 | | 304,600 | | 200,100 |
Saskatchewan | | 751 | | 110 | | 1,521 | | 1,460 | | 283 | | 43 | | 750 | | 713 | | 119,200 | | 107,500 |
British Columbia | | - | | - | | 160 | | 147 | | - | | - | | 17 | | 11 | | 38,200 | | 30,900 |
United States | | | | | | | | | | | | | | | | | | | | |
Colorado | | - | | - | | - | | - | | - | | - | | - | | - | | 27,728 | | 27,728 |
Montana | | 243 | | 164 | | - | | - | | 20 | | 18 | | - | | - | | - | | - |
North Dakota | | 155 | | 128 | | - | | - | | 15 | | 12 | | - | | - | | - | | - |
Pennsylvania | | - | | - | | 732 | | 80 | | - | | - | | 90 | | 8 | | 82,119 | | 23,141 |
Total | | 2,092 | | 934 | | 5,102 | | 3,059 | | 854 | | 325 | | 1,364 | | 913 | | 571,847 | | 389,369 |
The Corporation expects its rights to explore, develop and exploit on approximately 21,200 net acres of unproved properties in Canada and the United States to expire, in the ordinary course, prior to December 31, 2017. The Corporation has no material work commitments on such properties and, where the Corporation determines appropriate, it can extend expiring leases by either making the necessary applications to extend or performing the necessary work.
ENERPLUS 2016 ANNUAL INFORMATION FORM 13
Description of Properties
Outlined below is a description of the Corporation's Canadian and U.S. crude oil and natural gas properties and assets.
For additional information on contingent resources associated with certain of the Corporation’s United States and Canadian crude oil and natural gas properties, including estimated volumes of economic contingent resources, see “Appendix A – Contingent Resources Information”.
U.S. Crude Oil Properties
OVERVIEW
The Corporation’s primary U.S. crude oil properties are located in the Fort Berthold region of North Dakota and in Richland County, Montana. The Corporation has approximately 65,500 net acres of land in Fort Berthold, primarily in Dunn and McKenzie counties and, on a production basis, operated approximately 81% of its Fort Berthold asset (prior to the divestment of its non-operated assets described below). The Corporation’s Fort Berthold property produces a light sweet crude oil (42° API), with some associated natural gas and NGLs, from both the Bakken and Three Forks formations. Fort Berthold production averaged approximately 28,570 BOE/day in 2016.
During the fourth quarter of 2016, the Corporation announced the sale of non-operated North Dakota Bakken assets having associated production of approximately 5,000 BOE/day and proved plus probable reserves of 12.0 MMBOE. On December 30, 2016, the Corporation closed this sale for proceeds of approximately $392 million, after closing adjustments.
Approximately 17.5 MMBOE of proved plus probable reserves were added at Fort Berthold during 2016, including due to technical revisions; however, after adjusting for the non-operated divestments of 12.0 MMBOE and 2016 production of 10.4 MMBOE, total proved plus probable reserves associated with this property as at December 31, 2016 were 138.7 MMBOE, 3% lower than as at December 31, 2015.
The Corporation also has working interests in Sleeping Giant, a mature, light oil property located in the Elm Coulee field in Richland County, Montana. Sleeping Giant produced approximately 4,329 BOE/day on average from the Bakken formation in 2016. The Corporation believes there is additional upside potential at the Sleeping Giant property through production optimization, refracs, limited infill drilling and the potential for Enhanced Oil Recovery (“EOR”) techniques.
Overall, the Corporation's U.S. Williston Basin crude oil properties produced an average of approximately 32,900 BOE/day in 2016. On a BOE basis, this represents 76% of the Corporation’s crude oil and NGLs production, and 35% of the Corporation's 2016 average daily production.
The Corporation spent approximately $140 million on its U.S. crude oil assets in 2016, with approximately $136 million of that spending directed to its operated assets in North Dakota where the Corporation continued to advance its completions techniques. During 2016, the Corporation drilled approximately 16 net horizontal wells in the Fort Berthold region, targeting both the Bakken and Three Forks formations (consisting of 4.0 short lateral wells and 12.0 long lateral wells) with approximately 16.1 net wells brought on-stream.
The Corporation had 156.0 MMBOE of proved plus probable reserves associated with its U.S. crude oil assets at December 31, 2016, representing approximately 41% of its total proved plus probable reserves.
U.S. Natural Gas Properties
OVERVIEW
The Corporation's U.S. natural gas properties consist entirely of its non‑operated Marcellus shale gas interests located in northeastern Pennsylvania, where the Corporation holds an interest in approximately 39,100 net acres. The Corporation's Marcellus shale gas production averaged 195,317 Mcf/day in 2016, representing approximately 65% of the Corporation's total natural gas production. While 2016 regional demand growth and the addition of incremental interstate pipeline capacity helped reduce infrastructure constraints, for both the Corporation and other producers in northeast Pennsylvania, the Corporation’s production was curtailed at times due to low regional spot pricing. See "Risk Factors – Lack of adequately developed infrastructure may result in a decline in the Corporation's ability to market oil and natural gas production".
In 2016, approximately $24 million was invested in the Corporation's interests in the Marcellus. The Corporation participated in the drilling of a total of approximately 1.4 net wells, and a total of approximately 5.2 net wells were brought on-stream. The Corporation currently has 80.0 net producing wells in the Marcellus, and 4.2 net wells waiting on completion or tie‑in.
14 ENERPLUS 2016 ANNUAL INFORMATION FORM
Proved plus probable Marcellus shale gas reserves were 894.6 Bcf as at December 31, 2016, an increase of 53.6 Bcf from 2015, and represented approximately 39% of the Corporation's total proved plus probable reserves.
The Corporation has entered into long‑term agreements for the gathering, dehydration, processing, compression and transportation of the Corporation's share of production from its Marcellus properties. These agreements are intended to provide the Corporation with cost certainty and access to the northeastern United States and broader U.S. natural gas markets through connections with major interstate pipelines.
Canadian Crude Oil Properties
OVERVIEW
Production from the Corporation’s Canadian crude oil properties comes primarily from mature, low decline assets under waterflood and EOR techniques. In traditional waterflooding, water is injected into the formation through injection wells to supplement reservoir pressure and provide a drive mechanism to move additional oil to producing wells. Pressure maintenance and the production of oil from water injection can result in a production profile with more predictable and stable declines and higher recovery of reserves. Infill drilling, well injection optimization and EOR techniques are effective methods of improving recovery of reserves even further. These properties have associated crude oil production facilities for emulsion treatment and injection, or water disposal.
The Canadian waterflood assets provide a stable production base with free cash flow to support the Corporation’s investment in growth plays, as well as its dividend. Canadian crude oil properties production averaged 16,160 BOE/day during 2016, or 33% of the Corporation’s crude oil properties production during the year. The Canadian crude oil properties where the Corporation invested its capital in 2016 included Mannville oil production in Medicine Hat and Cadogan in Alberta, as well as southeast Saskatchewan, which produces from the Mississippian Ratcliffe formation. On a production basis, the Corporation operated over 89% of its Canadian crude oil properties.
In 2016, the Corporation invested approximately $44 million in its Canadian crude oil properties, with approximately 50% directed to drilling and completions and the remainder on plant and facility enhancements to support future activities. The Corporation drilled 8.0 net crude oil wells (inclusive of water injection wells) in its Canadian waterflood assets in 2016, advancing projects targeting the Mannville and Ratcliffe plays. At Medicine Hat, polymer injection continued on the Corporation’s second polymer pilot with results in line with expectations.
In November 2016, the Corporation acquired a waterflood property in Northern Alberta’s Ante Creek area with associated average production of 3,800 BOE/day, for approximately $110 million, net of closing adjustments. At December 31, 2016, proved plus probable reserves associated with this property were 4.8 MMBOE.
Of the 59.9 MMBOE of proved plus probable reserves associated with the Corporation’s Canadian crude oil properties at December 31, 2016, 59.5 MMBOE (or approximately 16% of the Corporation’s total proved plus probable reserves) were associated with the Canadian crude oil waterflood properties, including those acquired at Ante Creek.
Canadian Natural Gas Properties
OVERVIEW
The Corporation's Canadian natural gas properties are located in Alberta, Saskatchewan and British Columbia. During 2016, the Corporation focused on divesting non-strategic assets within its Canadian natural gas portfolio.
Production from the Corporation's Canadian natural gas properties averaged 69,144 Mcf/day in 2016. The Corporation's largest producing Canadian natural gas properties in 2016 were Shackleton, Tommy Lakes and Brooks.
The Corporation spent a minimal amount of capital on its Canadian natural gas assets during 2016, where the focus was on maintenance and optimization of operations. The Corporation spent approximately $7 million on abandonment and reclamation activities on these assets in 2016.
Canadian natural gas properties proved plus probable reserves totaled 105 BcfGE as at December 31, 2016. Canadian natural gas proved plus probable reserves represent approximately 5% of the Corporation's total proved plus probable reserves, measured on a BOE basis, at December 31, 2016.
During 2016, the Corporation divested assets in the Alberta Deep Basin (Ansell area) in two separate transactions for aggregate consideration of approximately $186 million, net of closing adjustments. Production associated with these assets was 5,400 BOE/day (97% natural gas). In addition to the divestment of its Deep Basin assets, the Corporation divested of
ENERPLUS 2016 ANNUAL INFORMATION FORM 15
some high operating cost shallow gas assets in southeast Alberta, as well as its Pouce Coupe, Progress and Valhalla assets in the Peace River Arch area of Alberta. Combined, these assets were expected to produce approximately 3,100 BOE/day. The Corporation received total proceeds of approximately $94 million in respect of these two divestments, net of closing adjustments.
Quarterly Production History
The following table sets forth the Corporation's average daily production volumes, on a company interest basis, by product type, for each fiscal quarter in 2016 and for the entire year, separately for production in Canada and the United States, and in total.
| | | | | | | | | | |
| | Year Ended December 31, 2016 |
| | First | | Second | | Third | | Fourth | | |
Country and Product Type | | Quarter | | Quarter | | Quarter | | Quarter | | Annual |
United States | | | | | | | | | | |
Light and medium oil (bbls/day) | | - | | - | | - | | - | | - |
Heavy oil (bbls/day) | | - | | - | | - | | - | | - |
Tight oil (bbls/day) | | 25,322 | | 25,582 | | 25,444 | | 24,711 | | 25,264 |
Total crude oil (bbls/day) | | 25,322 | | 25,582 | | 25,444 | | 24,711 | | 25,264 |
Natural gas liquids (bbls/day) | | 3,690 | | 3,411 | | 3,627 | | 3,253 | | 3,495 |
Total liquids (bbls/day) | | 29,012 | | 28,993 | | 29,071 | | 27,964 | | 28,759 |
Conventional natural gas (Mcf/day) | | - | | - | | - | | - | | - |
Shale gas (Mcf/day) | | 217,611 | | 218,625 | | 228,271 | | 216,078 | | 220,157 |
Total United States (BOE/day) | | 65,280 | | 65,431 | | 67,116 | | 63,977 | | 65,452 |
| | | | | | | | | | |
Canada | | | | | | | | | | |
Light and medium oil (bbls/day) | | 5,607 | | 5,044 | | 3,970 | | 4,640 | | 4,812 |
Heavy oil (bbls/day) | | 8,579 | | 8,453 | | 8,303 | | 7,777 | | 8,277 |
Tight oil (bbls/day) | | - | | - | | - | | - | | - |
Total crude oil (bbls/day) | | 14,186 | | 13,497 | | 12,273 | | 12,417 | | 13,089 |
Natural gas liquids (bbls/day) | | 1,804 | | 1,418 | | 1,254 | | 1,160 | | 1,408 |
Total liquids (bbls/day) | | 15,990 | | 14,915 | | 13,527 | | 13,577 | | 14,497 |
Conventional natural gas (Mcf/day) | | 98,610 | | 78,950 | | 68,048 | | 67,861 | | 78,310 |
Shale gas (Mcf/day) | | 929 | | 928 | | 557 | | 576 | | 747 |
Total Canada (BOE/day) | | 32,580 | | 28,228 | | 24,961 | | 24,983 | | 27,673 |
| | | | | | | | | | |
Total | | | | | | | | | | |
Light and medium oil (bbls/day) | | 5,607 | | 5,044 | | 3,970 | | 4,640 | | 4,812 |
Heavy oil (bbls/day) | | 8,579 | | 8,453 | | 8,303 | | 7,777 | | 8,277 |
Tight oil (bbls/day) | | 25,322 | | 25,582 | | 25,444 | | 24,711 | | 25,264 |
Total crude oil (bbls/day) | | 39,508 | | 39,079 | | 37,717 | | 37,128 | | 38,353 |
Natural gas liquids (bbls/day) | | 5,494 | | 4,829 | | 4,881 | | 4,413 | | 4,903 |
Total liquids (bbls/day) | | 45,002 | | 43,908 | | 42,598 | | 41,541 | | 43,256 |
Conventional natural gas (Mcf/day) | | 98,610 | | 78,950 | | 68,048 | | 67,861 | | 78,310 |
Shale gas (Mcf/day) | | 218,540 | | 219,553 | | 228,828 | | 216,654 | | 220,904 |
Total (BOE/day) | | 97,860 | | 93,659 | | 92,077 | | 88,960 | | 93,125 |
16 ENERPLUS 2016 ANNUAL INFORMATION FORM
Quarterly Netback History
The following tables set forth the Corporation's average netbacks received for each fiscal quarter in 2016 and for the entire year, separately for production in Canada and the United States. Netbacks are calculated on the basis of prices received, which are net of transportation costs but before the effects of commodity derivative instruments, less related royalties and production costs. For multiple product wells, production costs are entirely attributed to that well's principal product type. As a result, no production costs are attributed to the Corporation's NGLs production as those costs have been attributed to the applicable wells' principal product type.
| | | | | | | | | | | | | | | |
| | Year Ended December 31, 2016 |
Light and Medium Crude Oil ($ per bbl) | | First
Quarter | | Second
Quarter | | Third
Quarter | | Fourth
Quarter | | Annual |
Canada | | | | | | | | | | | | | | | |
Sales price(1) | | $ | 30.14 | | $ | 46.73 | | $ | 47.50 | | $ | 52.76 | | $ | 43.55 |
Royalties(2) | | | (4.84) | | | (8.14) | | | (11.05) | | | (10.80) | | | (8.44) |
Production costs(3) | | | (14.79) | | | (7.90) | | | (15.31) | | | (14.25) | | | (12.97) |
Netback | | $ | 10.51 | | $ | 30.69 | | $ | 21.14 | | $ | 27.71 | | $ | 22.14 |
| | | | | | | | | | | | | | | |
| | Year Ended December 31, 2016 |
| | First | | Second | | Third | | Fourth | | |
Heavy Oil ($ per bbl) | | Quarter | | Quarter | | Quarter | | Quarter | | Annual |
Canada | | | | | | | | | | | | | | | |
Sales price(1) | | $ | 22.88 | | $ | 38.89 | | $ | 38.77 | | $ | 43.98 | | $ | 35.94 |
Royalties(2) | | | (4.32) | | | (6.36) | | | (7.09) | | | (8.23) | | | (6.47) |
Production costs(3) | | | (12.44) | | | (11.64) | | | (17.43) | | | (17.18) | | | (14.61) |
Netback | | $ | 6.12 | | $ | 20.89 | | $ | 14.25 | | $ | 18.57 | | $ | 14.86 |
| | | | | | | | | | | | | | | |
| | Year Ended December 31, 2016 |
Tight Oil ($ per bbl) | | First
Quarter | | Second
Quarter | | Third
Quarter | | Fourth
Quarter | | Annual |
United States | | | | | | | | | | | | | | | |
Sales price(1) | | $ | 31.79 | | $ | 45.51 | | $ | 47.75 | | $ | 54.15 | | $ | 44.78 |
Royalties(2) | | | (9.17) | | | (12.55) | | | (13.31) | | | (16.43) | | | (12.85) |
Production costs(3) | | | (12.02) | | | (12.66) | | | (10.74) | | | (11.94) | | | (11.84) |
Netback | | $ | 10.60 | | $ | 20.30 | | $ | 23.70 | | $ | 25.78 | | $ | 20.09 |
| | | | | | | | | | | | | | | |
Natural Gas Liquids ($ per bbl) | | First
Quarter | | Second
Quarter | | Third
Quarter | | Fourth
Quarter | | Annual |
Canada | | | | | | | | | | | | | | | |
Sales price(1) | | $ | 24.21 | | $ | 24.37 | | $ | 24.98 | | $ | 35.43 | | $ | 26.75 |
Royalties(2) | | | (4.60) | | | (6.08) | | | (5.67) | | | (7.59) | | | (5.83) |
Production costs(3) | | | - | | | - | | | - | | | - | | | - |
Netback | | $ | 19.61 | | $ | 18.29 | | $ | 19.31 | | $ | 27.84 | | $ | 20.92 |
| | | | | | | | | | | | | | | |
United States | | | | | | | | | | | | | | | |
Sales price(1) | | $ | (0.33) | | $ | 6.81 | | $ | 4.37 | | $ | 11.04 | | $ | 5.29 |
Royalties(2) | | | (0.35) | | | (1.69) | | | (1.45) | | | (2.75) | | | (1.52) |
Production costs(3) | | | - | | | - | | | - | | | - | | | - |
Netback | | $ | (0.68) | | $ | 5.12 | | $ | 2.92 | | $ | 8.29 | | $ | 3.77 |
| | | | | | | | | | | | | | | |
| | Year Ended December 31, 2016 |
Conventional Natural Gas ($ per Mcf) | | First
Quarter | | Second
Quarter | | Third
Quarter | | Fourth
Quarter | | Annual |
Canada | | | | | | | | | | | | | | | |
Sales price(1) | | $ | 1.74 | | $ | 1.13 | | $ | 2.19 | | $ | 2.84 | | $ | 1.92 |
Royalties(2) | | | 0.04 | | | (0.07) | | | (0.12) | | | (0.02) | | | (0.03) |
Production costs(3) | | | (2.94) | | | (2.48) | | | (1.78) | | | (1.86) | | | (2.34) |
Netback | | $ | (1.16) | | $ | (1.42) | | $ | 0.29 | | $ | 0.96 | | $ | (0.45) |
ENERPLUS 2016 ANNUAL INFORMATION FORM 17
| | | | | | | | | | | | | | | |
| | Year Ended December 31, 2016 |
Shale Gas ($ per Mcf) | | First
Quarter | | Second
Quarter | | Third
Quarter | | Fourth
Quarter | | Annual |
United States | | | | | | | | | | | | | | | |
Sales price(1) | | $ | 0.99 | | $ | 0.87 | | $ | 1.14 | | $ | 1.88 | | $ | 1.22 |
Royalties(2) | | | (0.39) | | | (0.36) | | | (0.44) | | | (0.58) | | | (0.44) |
Production costs(3) | | | (0.06) | | | (0.03) | | | (0.05) | | | (0.07) | | | (0.05) |
Netback | | $ | 0.54 | | $ | 0.48 | | $ | 0.65 | | $ | 1.23 | | $ | 0.73 |
| | | | | | | | | | | | | | | |
Canada | | $ | 1.68 | | $ | 1.61 | | $ | 2.84 | | $ | 3.65 | | $ | 2.26 |
Royalties(2) | | | (0.11) | | | (0.07) | | | (0.13) | | | (0.16) | | | (0.11) |
Production costs(3) | | | (1.38) | | | (1.34) | | | (1.69) | | | (2.52) | | | (1.65) |
Netback | | $ | 0.19 | | $ | 0.20 | | $ | 1.02 | | $ | 0.97 | | $ | 0.50 |
Notes:
| (1) | | Net of transportation costs but before the effects of commodity derivative instruments. |
| (2) | | Includes production taxes. |
| (3) | | Production costs are costs incurred to operate and maintain wells and related equipment and facilities, including operating costs of support equipment used in oil and gas activities and other costs of operating and maintaining those wells and related equipment and facilities. Examples of production costs include items such as field staff labour costs, costs of materials, supplies and fuel consumed and supplies utilized in operating the wells and related equipment (such as power (including gains and losses on electricity contracts), chemicals and lease rentals), repairs and maintenance costs, property taxes, insurance costs, costs of workovers, net processing and treating fees, overhead fees, taxes (other than income, capital, withholding or U.S. state production taxes) and other costs. |
Tax Horizon
The Corporation is subject to standard applicable corporate income taxes. Based on existing tax legislation, the Corporation’s available tax pools, expected capital expenditures and forecasted net income, the Corporation does not anticipate paying material cash taxes in either Canada or the United States in 2017. These expectations may vary depending on numerous factors, including fluctuations in commodity prices, and the Corporation's capital spending, changes in governing tax laws, and the nature and timing of the Corporation's acquisitions and divestments. As a result, the Corporation emphasizes that it is difficult to give guidance on future taxability as it operates within an industry that constantly changes. See "Risk Factors – Changes in laws, including those affecting tax, royalties and other financial matters, and interpretations of those laws, may adversely affect the Corporation and its securityholders”.
For additional information, see Notes 2(i) and 13 to the Corporation's audited consolidated financial statements for the year ended December 31, 2016 and the information under the heading "Taxes" in the Corporation's MD&A for the year ended December 31, 2016.
Marketing Arrangements and Forward Contracts
Crude Oil and NGLs
The Corporation's crude oil and NGLs production is marketed to a diverse portfolio of intermediaries and end users, generally on 30‑day continuously renewing contracts for crude oil in Canada, 30-day negotiated contracts for crude oil in the United States, and yearly contracts for NGLs in Canada, where terms fluctuate with the monthly spot markets. NGL contracts in the United States are processing arrangement-linked contracts with pricing linked to the monthly spot markets. The Corporation received an average price (before transportation costs, royalties, and the effects of commodity derivative instruments) of $44.84/bbl for its crude oil and $15.29/bbl for its NGLs for the year ended December 31, 2016, compared to $48.43/bbl for its crude oil and $18.06/bbl for its NGLs for the year ended December 31, 2015.
In Canada, the Corporation typically transports its Canadian crude oil production to its buyers by pipeline and/or truck. The Corporation may occasionally sell a portion of its crude oil production to buyers who may use rail transportation after title is transferred into the buyer’s name. The Corporation has approximately 2,700 BOE/day of crude oil and NGLs firm take-or-pay pipeline transportation agreements in place for 2017, and then approximately 1,800 BOE/day on average for 2018 through 2027 for its Alberta crude oil and condensate production. Additionally, the Corporation had contracted firm NGLs fractionation agreements for 825 BOE/day at the end of 2016, and this increases to 1,125 BOE/day from April 2017 through 2026.
In the United States, the Corporation transports its U.S. crude oil production to its buyers by pipeline and/or truck, in addition to selling a portion of its crude oil production to buyers who may utilize rail transportation after title is transferred into the
18 ENERPLUS 2016 ANNUAL INFORMATION FORM
buyer’s name. The Corporation has a mix of approximately 12,500 bbls/day of firm sales contracts on average during 2017 for its U.S. oil production. The Corporation’s NGLs associated with its U.S. crude oil production volumes are marketed on its behalf by midstream companies in North Dakota and Montana.
Natural Gas
In marketing its natural gas production, the Corporation strives for a mix of contracts and customers. In Canada, the Corporation sells its natural gas production at a mix of fixed and floating prices for a variety of terms ranging from spot sales to one year or longer. The Corporation's monthly sales portfolio reflected a mix of the daily and monthly AECO market indices, as well as the basis differential to NYMEX gas prices in 2016. Approximately 26% of the Corporation's total natural gas production originated in Canada in 2016 and received an average price, before transportation, royalties, and the effects of commodity derivative instruments, of $2.20/Mcf during the year. As at December 31, 2016, the Corporation held firm service natural gas transportation contracts for its natural gas production in Canada for 2017 totalling 99 MMcf/day.
In 2016, approximately 74% of the Corporation's natural gas production originated in the United States. The Corporation delivered approximately 47% of its Marcellus production in 2016 onto the Transco Leidy Pipeline, with the majority of the remaining volumes delivered onto the Tennessee Gas Pipeline 300 Line, in Pennsylvania, a portion of which is then transported to the Kentucky/Tennessee border. The Corporation has firm "must‑take" sales contracts for up to 65 MMcf/day of natural gas production in the Marcellus for terms of up to nine years with buyers holding pipeline capacity on these and other pipelines in the region. The Corporation also has firm transportation agreements for approximately 66 MMcf/day, with terms ending between 2020 and 2036. The Corporation also holds a contract for five years of firm transportation capacity for 30 MMcf/day on the PennEast pipeline project. This project has an expected in-service date of late 2018, depending on regulatory approvals.
The Corporation received an average price differential for its U.S. Marcellus shale gas production of US$0.93/Mcf below NYMEX prices. Approximately 11% of the Corporation's U.S. natural gas production was associated natural gas production from its crude oil operations in North Dakota and Montana. The Corporation does not market these volumes directly, as they are marketed on Enerplus’ behalf by midstream companies.
The Corporation's percentage of 2016 revenues attributable to natural gas (before transportation and cash operating costs, royalties, and the effects of commodity derivative instruments) was 26%, a decrease of approximately 1% from 2015. The average price received by the Corporation (before transportation and cash operating costs, royalties, and the effects of commodity derivative instruments) for its natural gas in 2016 was $2.06/Mcf compared to $2.15/Mcf for the year ended December 31, 2015.
Future Commitments and Forward Contracts
The Corporation may use various types of derivative financial instruments and fixed price physical sales contracts to manage the risk related to fluctuating commodity prices. Absent such hedging activities, all of the crude oil and NGLs and the majority of natural gas production of the Corporation is sold into the open market at prevailing market prices, which exposes the Corporation to the risks associated with commodity price fluctuations and foreign exchange rates. See "Risk Factors". Information regarding the Corporation's financial instruments is contained in Note 15(b) and (c)(i) to the Corporation's audited consolidated financial statements for the year ended December 31, 2016 and under the heading "Results of Operations – Price Risk Management" in the Corporation's MD&A for the year ended December 31, 2016, each of which is available through the internet on the Corporation's website at www.enerplus.com, on the Corporation's SEDAR profile at www.sedar.com and on the Corporation's EDGAR profile at www.sec.gov.
ENERPLUS 2016 ANNUAL INFORMATION FORM 19
Oil and Natural Gas Reserves
Summary of Reserves
All of the Corporation's reserves, including its U.S. reserves, have been evaluated in accordance with NI 51‑101. Independent reserves evaluations have been conducted on properties comprising approximately 86% of the net present value (discounted at 10%, before tax, using forecast prices and costs) of the Corporation's total proved plus probable reserves.
McDaniel, an independent petroleum consulting firm based in Calgary, Alberta, has evaluated properties which comprise approximately 48% of the net present value (discounted at 10%, before tax, using forecast prices and costs) of the Corporation's proved plus probable reserves located in Canada and all of the Corporation's reserves associated with the Corporation's properties located in North Dakota and Montana. The Corporation has evaluated the remaining 52% of the net present value of its Canadian properties using similar evaluation parameters, including the same forecast price and inflation rate assumptions utilized by McDaniel. McDaniel has reviewed the Corporation's internal evaluation of these properties.
NSAI, independent petroleum consultants based in Dallas, Texas, has evaluated all of the Corporation's reserves associated with the Corporation's properties in Pennsylvania. For consistency in the Corporation's reserves reporting, NSAI used McDaniel's January 1, 2017 forecast prices and inflation rates to prepare its report.
The Corporation used McDaniel's forecast exchange rates, set forth below, to convert U.S. dollar amounts in both the McDaniel and NSAI Reports to Canadian dollar amounts for presentation in this Annual Information Form.
The following sections and tables summarize, as at December 31, 2016, the Corporation's crude oil, NGLs and natural gas reserves and the estimated net present values of future net revenues associated with such reserves, together with certain information, estimates and assumptions associated with such reserves estimates. The data contained in the tables is a summary of the evaluations and, as a result, the tables may contain slightly different numbers than the evaluations themselves due to rounding. Additionally, the columns and rows in the tables may not add due to rounding. For information relating to the changes in the volumes of the Corporation's reserves from December 31, 2015 to December 31, 2016, see "– Reconciliation of Reserves" below.
All estimates of future net revenues are stated prior to provision for interest and general and administrative expenses and after deduction of royalties and estimated future capital expenditures, and are presented both before and after deducting income taxes. For additional information, see "Business of the Corporation – Tax Horizon", "Industry Conditions" and "Risk Factors" in this Annual Information Form.
With respect to pricing information in the following reserves information, the wellhead oil prices were adjusted for quality and transportation based on historical actual prices. The natural gas prices were adjusted, where necessary, based on historical pricing based on heating values and transportation. The NGLs prices were adjusted to reflect historical average prices received.
It should not be assumed that the present worth of estimated future cash flows shown below is representative of the fair market value of the reserves. There is no assurance that such price and cost assumptions will be attained and variances could be material. The reserves estimates of the Corporation's crude oil, NGLs and natural gas reserves provided herein are estimates only. Actual reserves may be greater than or less than the estimates provided herein. Readers should review the definitions and information contained in "Presentation of Oil and Gas Reserves, Contingent Resources, and Production Information" in conjunction with the following tables and notes.
20 ENERPLUS 2016 ANNUAL INFORMATION FORM
The following tables set forth the estimated gross and net reserves volumes and net present value of future net revenue attributable to the Corporation's reserves at December 31, 2016, using forecast price and cost cases.
Summary of Oil and Gas Reserves (Forecast Prices and Costs)
As of December 31, 2016
| | | | | | | | | | | | | | | | | | | | | | | | | | | | |
| | OIL AND NATURAL GAS RESERVES |
| | Light & | | | | | | | | | | Natural Gas | | Conventional | | | | | | | | |
| | Medium Oil | | Heavy Oil | | Tight Oil | | Liquids | | Natural Gas | | Shale Gas | | Total |
RESERVES
CATEGORY | | Gross | | Net | | Gross | | Net | | Gross | | Net | | Gross | | Net | | Gross | | Net | | Gross | | Net | | Gross | | Net |
| | (Mbbls) | | (Mbbls) | | (Mbbls) | | (Mbbls) | | (Mbbls) | | (Mbbls) | | (Mbbls) | | (Mbbls) | | (MMcf) | | (MMcf) | | (MMcf) | | (MMcf) | | (MBOE) | | (MBOE) |
Proved Developed Producing | | | | | | | | | | | | | | | | | | | | | | | | | | | | |
Canada | | 11,306 | | 9,677 | | 26,388 | | 21,857 | | - | | - | | 2,033 | | 1,697 | | 89,205 | | 87,416 | | 1,527 | | 1,450 | | 54,848 | | 48,042 |
United States | | - | | - | | - | | - | | 45,402 | | 36,740 | | 6,209 | | 4,978 | | - | | - | | 507,688 | | 407,023 | | 136,225 | | 109,555 |
Total | | 11,306 | | 9,677 | | 26,388 | | 21,857 | | 45,402 | | 36,740 | | 8,242 | | 6,675 | | 89,205 | | 87,416 | | 509,215 | | 408,473 | | 191,073 | | 157,597 |
Proved Developed Non-Producing | | | | | | | | | | | | | | | | | | | | | | | | | | | | |
Canada | | 15 | | 14 | | - | | - | | - | | - | | 17 | | 12 | | 4,839 | | 3,966 | | - | | - | | 838 | | 688 |
United States | | - | | - | | - | | - | | 420 | | 351 | | - | | - | | - | | - | | 989 | | 827 | | 585 | | 489 |
Total | | 15 | | 14 | | - | | - | | 420 | | 351 | | 17 | | 12 | | 4,839 | | 3,966 | | 989 | | 827 | | 1,423 | | 1,177 |
Proved Undeveloped | | | | | | | | | | | | | | | | | | | | | | | | | | | | |
Canada | | 300 | | 277 | | 3,845 | | 3,119 | | - | | - | | 11 | | 7 | | 1,726 | | 1,336 | | - | | - | | 4,443 | | 3,626 |
United States | | - | | - | | - | | - | | 31,744 | | 25,300 | | 3,555 | | 2,834 | | - | | - | | 216,411 | | 173,076 | | 71,368 | | 56,980 |
Total | | 300 | | 277 | | 3,845 | | 3,119 | | 31,744 | | 25,300 | | 3,566 | | 2,841 | | 1,726 | | 1,336 | | 216,411 | | 173,076 | | 75,811 | | 60,606 |
Total Proved | | | | | | | | | | | | | | | | | | | | | | | | | | | | |
Canada | | 11,621 | | 9,968 | | 30,232 | | 24,976 | | - | | - | | 2,061 | | 1,716 | | 95,769 | | 92,717 | | 1,527 | | 1,450 | | 60,130 | | 52,355 |
United States | | - | | - | | - | | - | | 77,566 | | 62,391 | | 9,764 | | 7,812 | | - | | - | | 725,087 | | 580,925 | | 208,178 | | 167,024 |
Total | | 11,621 | | 9,968 | | 30,232 | | 24,976 | | 77,566 | | 62,391 | | 11,825 | | 9,528 | | 95,769 | | 92,717 | | 726,614 | | 582,375 | | 268,308 | | 219,379 |
Probable | | | | | | | | | | | | | | | | | | | | | | | | | | | | |
Canada | | 2,645 | | 2,246 | | 8,721 | | 7,057 | | - | | - | | 704 | | 586 | | 30,521 | | 29,140 | | 619 | | 579 | | 17,260 | | 14,842 |
United States | | - | | - | | - | | - | | 45,432 | | 36,561 | | 5,569 | | 4,471 | | - | | - | | 275,550 | | 220,702 | | 96,926 | | 77,816 |
Total | | 2,645 | | 2,246 | | 8,721 | | 7,057 | | 45,432 | | 36,561 | | 6,273 | | 5,057 | | 30,521 | | 29,140 | | 276,169 | | 221,281 | | 114,186 | | 92,658 |
Total Proved Plus Probable | | | | | | | | | | | | | | | | | | | | | | | | | | | | |
Canada | | 14,265 | | 12,214 | | 38,953 | | 32,033 | | - | | - | | 2,765 | | 2,302 | | 126,290 | | 121,857 | | 2,146 | | 2,029 | | 77,389 | | 67,196 |
United States | | - | | - | | - | | - | | 122,998 | | 98,952 | | 15,333 | | 12,283 | | - | | - | | 1,000,637 | | 801,628 | | 305,104 | | 244,840 |
Total | | 14,265 | | 12,214 | | 38,953 | | 32,033 | | 122,998 | | 98,952 | | 18,098 | | 14,585 | | 126,290 | | 121,857 | | 1,002,783 | | 803,657 | | 382,493 | | 312,036 |
ENERPLUS 2016 ANNUAL INFORMATION FORM 21
Summary of Net Present Value of Future Net Revenue
Attributable to Oil and Gas Reserves (Forecast Prices and Costs)
As of December 31, 2016
| | | | | | | | | | | | | | | | | | | | | | | | |
| | NET PRESENT VALUE OF FUTURE NET REVENUE DISCOUNTED AT (%/Year) | | | | |
| | Before Deducting Income Taxes | | After Deducting Income Taxes(1) | | Unit | |
RESERVES CATEGORY | | 0% | | 5% | | 10% | | 15% | | 20% | | 0% | | 5% | | 10% | | 15% | | 20% | | Value | (2) |
| | (in $ millions) | | $/BOE | |
Proved Developed Producing | | | | | | | | | | | | | | | | | | | | | | | | |
Canada | | 1,155 | | 844 | | 665 | | 551 | | 473 | | 1,070 | | 805 | | 645 | | 540 | | 466 | | $ | 13.84 | |
United States | | 2,866 | | 1,923 | | 1,452 | | 1,179 | | 1,002 | | 2,529 | | 1,768 | | 1,370 | | 1,130 | | 970 | | $ | 13.25 | |
Total | | 4,021 | | 2,767 | | 2,117 | | 1,730 | | 1,475 | | 3,599 | | 2,573 | | 2,015 | | 1,670 | | 1,436 | | $ | 13.43 | |
| | | | | | | | | | | | | | | | | | | | | | | | |
Proved Developed Non‑Producing | | | | | | | | | | | | | | | | | | | | | | | | |
Canada | | 12 | | 4 | | 1 | | 1 | | - | | 8 | | 3 | | 1 | | 1 | | - | | $ | 1.45 | |
United States | | 8 | | 7 | | 6 | | 5 | | 4 | | 5 | | 6 | | 5 | | 4 | | 4 | | $ | 12.27 | |
Total | | 20 | | 11 | | 7 | | 6 | | 4 | | 13 | | 9 | | 6 | | 5 | | 4 | | $ | 5.95 | |
| | | | | | | | | | | | | | | | | | | | | | | | |
Proved Undeveloped | | | | | | | | | | | | | | | | | | | | | | | | |
Canada | | 98 | | 65 | | 44 | | 29 | | 19 | | 71 | | 48 | | 33 | | 22 | | 14 | | $ | 12.13 | |
United States | | 1,159 | | 635 | | 376 | | 226 | | 131 | | 681 | | 376 | | 218 | | 124 | | 62 | | $ | 6.60 | |
Total | | 1,257 | | 700 | | 420 | | 255 | | 150 | | 752 | | 424 | | 251 | | 146 | | 76 | | $ | 6.93 | |
| | | | | | | | | | | | | | | | | | | | | | | | |
Total Proved | | | | | | | | | | | | | | | | | | | | | | | | |
Canada | | 1,264 | | 913 | | 710 | | 581 | | 492 | | 1,150 | | 856 | | 678 | | 562 | | 481 | | $ | 13.56 | |
United States | | 4,033 | | 2,566 | | 1,834 | | 1,410 | | 1,137 | | 3,216 | | 2,150 | | 1,593 | | 1,259 | | 1,035 | | $ | 10.98 | |
Total | | 5,297 | | 3,479 | | 2,544 | | 1,991 | | 1,629 | | 4,366 | | 3,006 | | 2,271 | | 1,821 | | 1,516 | | $ | 11.60 | |
| | | | | | | | | | | | | | | | | | | | | | | | |
Probable | | | | | | | | | | | | | | | | | | | | | | | | |
Canada | | 511 | | 271 | | 170 | | 117 | | 87 | | 373 | | 200 | | 128 | | 91 | | 68 | | $ | 11.45 | |
United States | | 2,554 | | 1,161 | | 650 | | 407 | | 270 | | 1,520 | | 671 | | 360 | | 214 | | 134 | | $ | 8.35 | |
Total | | 3,065 | | 1,432 | | 820 | | 524 | | 357 | | 1,893 | | 871 | | 488 | | 305 | | 202 | | $ | 8.85 | |
| | | | | | | | | | | | | | | | | | | | | | | | |
Total Proved Plus Probable | | | | | | | | | | | | | | | | | | | | | | | | |
Canada | | 1,775 | | 1,184 | | 880 | | 698 | | 579 | | 1,523 | | 1,056 | | 806 | | 653 | | 549 | | $ | 13.10 | |
United States | | 6,587 | | 3,727 | | 2,484 | | 1,817 | | 1,407 | | 4,736 | | 2,821 | | 1,953 | | 1,473 | | 1,169 | | $ | 10.15 | |
Total | | 8,362 | | 4,911 | | 3,364 | | 2,515 | | 1,986 | | 6,259 | | 3,877 | | 2,759 | | 2,126 | | 1,718 | | $ | 10.78 | |
Notes: (1) Income tax calculations are based on the forecast cash flows of reserves volumes only, taking into consideration the forecast capital required to develop the reserves, and having regard for remaining corporate tax pools at the effective date, applicable deductions and appropriate federal, provincial and state tax rates.
(2) Calculated using net present value of future net revenue before deducting income taxes, discounted at 10% per year, and net reserves. The unit values are based on net reserves volumes.
22 ENERPLUS 2016 ANNUAL INFORMATION FORM
Forecast Prices and Costs
The forecast price and cost case assumes no legislative or regulatory amendments, and includes the effects of inflation. The estimated future net revenue to be derived from the production of the reserves is based on the following price forecasts supplied by McDaniel as of January 1, 2017 (and utilized by NSAI and by the Corporation in its internal evaluations for consistency in the Corporation's reserves reporting), and the following inflation and exchange rate assumptions:
| | | | | | NATURAL GAS LIQUIDS | | | | | |
| | CRUDE OIL | | NATURAL GAS | | Edmonton Par Price | | | | | |
Year | | WTI(1) | | Edmonton
Light(2) | | Alberta
Heavy(3) | | Sask
Cromer
Medium(4) | | Alberta
AECO
Spot Prices | | U.S. Henry
Hub
Gas Price | | Propane | | Butanes | | Condensate
&
Natural
Gasolines | | Inflation
Rate | | Exchange
Rate | |
| | ($US/bbl) | | ($Cdn/bbl) | | ($Cdn/bbl) | | ($Cdn/bbl) | | ($Cdn/MMbtu) | | ($US/MMbtu) | | ($Cdn/bbl) | | ($Cdn/bbl) | | ($Cdn/bbl) | | (%/year) | | ($US/$Cdn) | |
| 2017 | | 55.00 | | 69.80 | | 46.50 | | 62.80 | | 3.40 | | 3.40 | | 23.30 | | 43.50 | | 72.80 | | 0.0 | | 0.750 | |
| 2018 | | 58.70 | | 72.70 | | 50.50 | | 67.60 | | 3.15 | | 3.20 | | 23.70 | | 47.90 | | 75.80 | | 2.0 | | 0.775 | |
| 2019 | | 62.40 | | 75.50 | | 54.00 | | 70.20 | | 3.30 | | 3.35 | | 26.20 | | 49.80 | | 78.60 | | 2.0 | | 0.800 | |
| 2020 | | 69.00 | | 81.10 | | 58.00 | | 75.40 | | 3.60 | | 3.65 | | 28.30 | | 56.40 | | 84.30 | | 2.0 | | 0.825 | |
| 2021 | | 75.80 | | 86.60 | | 61.90 | | 80.50 | | 3.90 | | 4.00 | | 30.30 | | 63.40 | | 89.80 | | 2.0 | | 0.850 | |
| 2022 | | 77.30 | | 88.30 | | 63.10 | | 82.10 | | 3.95 | | 4.05 | | 30.90 | | 64.70 | | 91.60 | | 2.0 | | 0.850 | |
| 2023 | | 78.80 | | 90.00 | | 64.40 | | 83.70 | | 4.10 | | 4.15 | | 31.50 | | 65.90 | | 93.40 | | 2.0 | | 0.850 | |
| 2024 | | 80.40 | | 91.80 | | 65.60 | | 85.40 | | 4.25 | | 4.25 | | 32.20 | | 67.30 | | 95.20 | | 2.0 | | 0.850 | |
| 2025 | | 82.00 | | 93.70 | | 67.00 | | 87.10 | | 4.30 | | 4.30 | | 32.90 | | 68.60 | | 97.20 | | 2.0 | | 0.850 | |
| 2026 | | 83.70 | | 95.60 | | 68.40 | | 88.90 | | 4.40 | | 4.40 | | 33.60 | | 70.00 | | 99.20 | | 2.0 | | 0.850 | |
| 2027 | | 85.30 | | 97.40 | | 69.60 | | 90.60 | | 4.50 | | 4.50 | | 34.20 | | 71.40 | | 101.10 | | 2.0 | | 0.850 | |
| 2028 | | 87.00 | | 99.40 | | 71.10 | | 92.40 | | 4.60 | | 4.60 | | 34.90 | | 72.80 | | 103.10 | | 2.0 | | 0.850 | |
| 2029 | | 88.80 | | 101.40 | | 72.50 | | 94.30 | | 4.65 | | 4.65 | | 35.60 | | 74.30 | | 105.20 | | 2.0 | | 0.850 | |
| 2030 | | 90.60 | | 103.50 | | 74.00 | | 96.30 | | 4.75 | | 4.75 | | 36.30 | | 75.80 | | 107.40 | | 2.0 | | 0.850 | |
| 2031 | | 92.40 | | 105.50 | | 75.40 | | 98.10 | | 4.85 | | 4.85 | | 37.10 | | 77.30 | | 109.50 | | 2.0 | | 0.850 | |
Thereafter | | (5) | | (5) | | (5) | | (5) | | (5) | | (5) | | (5) | | (5) | | (5) | | (5) | | 0.850 | |
Notes: (1) West Texas Intermediate at Cushing Oklahoma 40o API/0.5% sulphur.
(2) Edmonton Light Sweet 40o API/0.3% sulphur.
(3) Heavy Crude Oil 12o API at Hardisty, Alberta (after deducting blending costs to reach pipeline quality).
(4) Midale Cromer Crude Oil 29o API/2.0% sulphur.
(5) Escalation is approximately 2% per year thereafter.
In 2016, the Corporation received a weighted average price (before transportation costs, royalties, and the effects of commodity derivative instruments) of $44.84/bbl for crude oil, $15.29/bbl for natural gas liquids and $2.06/Mcf for natural gas.
Undiscounted Future Net Revenue by Reserves Category
The undiscounted total future net revenue by reserves category as of December 31, 2016, using forecast prices and costs, is set forth below (columns or rows may not add due to rounding):
| | | | | | | | | | | | | | | | |
RESERVES CATEGORY | | Revenue | | Royalties(1) | | Operating
Costs | | Development
Costs | | Abandonment
and
Reclamation
Costs | | Future Net
Revenue
Before
Income
Taxes | | Income
Taxes | | Future Net
Revenue
After
Income
Taxes(2) |
| | (in $ millions) |
Proved Reserves | | | | | | | | | | | | | | | | |
Canada | | 3,550 | | 546 | | 1,407 | | 206 | | 127 | | 1,264 | | 114 | | 1,150 |
United States | | 9,408 | | 2,397 | | 2,060 | | 738 | | 180 | | 4,033 | | 818 | | 3,216 |
Total | | 12,957 | | 2,943 | | 3,467 | | 943 | | 307 | | 5,297 | | 931 | | 4,366 |
Proved Plus Probable
Reserves | | | | | | | | | | | | | | | | |
Canada | | 4,719 | | 739 | | 1,840 | | 231 | | 135 | | 1,775 | | 252 | | 1,523 |
United States | | 15,103 | | 3,871 | | 3,018 | | 1,398 | | 229 | | 6,587 | | 1,851 | | 4,736 |
Total | | 19,822 | | 4,610 | | 4,857 | | 1,629 | | 364 | | 8,362 | | 2,103 | | 6,259 |
Notes:
| (1) | | Royalties include any net profits interests paid, as well as the Saskatchewan Corporation Capital Tax Surcharge. |
| (2) | | Income tax calculations are based on the forecast cash flows of reserves volumes only, taking into consideration the forecast capital required to develop the reserves, and having regard for remaining corporate tax pools at the effective date, applicable deductions and appropriate federal, provincial and state tax rates. |
ENERPLUS 2016 ANNUAL INFORMATION FORM 23
Net Present Value of Future Net Revenue by Reserves Category and Product Type
The net present value of future net revenue before income taxes by reserves category and product type as of December 31, 2016, using forecast prices and costs and discounted at 10% per year, is set forth below:
| | | | | | |
RESERVES CATEGORY | | PRODUCT TYPE | | Future Net
Revenue
Before Income
Taxes
(Discounted at 10%) | | Unit Value(1) |
| | | | (in $ millions) | | ($/bbl; $/Mcf) |
Canada | | | | | | |
Proved Reserves | | Light and Medium Oil (including solution gas and by-products)(2) | | 224,920 | | 22.65 |
| | Heavy Oil (including solution gas and by-products) (2) | | 428,603 | | 17.17 |
| | Tight Oil(2) | | n/a | | n/a |
| | Conventional Natural Gas (including by-products)(3) | | 52,258 | | 0.72 |
| | Shale Gas(3) | | 4,499 | | 3.10 |
| | Total | | 710,280 | | |
Proved Plus Probable Reserves | | Light and Medium Oil (including solution gas and by-products) (2) | | 267,213 | | 21.97 |
| | Heavy Oil (including solution gas and by-products) (2) | | 524,197 | | 16.37 |
| | Tight Oil(2) | | n/a | | n/a |
| | Conventional Natural Gas (including by-products) (3) | | 82,414 | | 0.86 |
| | Shale Gas(3) | | 5,800 | | 2.86 |
| | Total | | 879,624 | | |
United States | | | | | | |
Proved Reserves | | Light and Medium Oil (including solution gas and by-products) (2) | | n/a | | n/a |
| | Heavy Oil (including solution gas and by-products) (2) | | n/a | | n/a |
| | Tight Oil(2) | | 1,247,876 | | 20.00 |
| | Conventional Natural Gas (including by-products) (3) | | n/a | | n/a |
| | Shale Gas(4) | | 585,881 | | 1.12 |
| | Total | | 1,833,757 | | |
Proved Plus Probable Reserves | | Light and Medium Oil (including solution gas and by-products) (2) | | n/a | | n/a |
| | Heavy Oil (including solution gas and by-products) (2) | | n/a | | n/a |
| | Tight Oil(2) | | 1,772,631 | | 17.91 |
| | Conventional Natural Gas (including by-products) (3) | | n/a | | n/a |
| | Shale Gas(4) | | 711,305 | | 0.99 |
| | Total | | 2,483,936 | | |
Total | | | | | | |
Proved Reserves | | Light and Medium Oil (including solution gas and by-products) (2) | | 224,920 | | |
| | Heavy Oil (including solution gas and by-products) (2) | | 428,603 | | |
| | Tight Oil(2) | | 1,247,876 | | |
| | Conventional Natural Gas (including by-products) (3) | | 52,258 | | |
| | Shale Gas(3)(4) | | 590,380 | | |
| | Total | | 2,544,037 | | |
Proved Plus Probable Reserves | | Light and Medium Oil (including solution gas and by-products) (2) | | 267,213 | | |
| | Heavy Oil (including solution gas and by-products) (2) | | 524,197 | | |
| | Tight Oil(2) | | 1,772,631 | | |
| | Conventional Natural Gas (including by-products) (3) | | 82,414 | | |
| | Shale Gas(3)(4) | | 717,105 | | |
| | Total | | 3,363,560 | | |
Notes:
| (1) | | Unit values are calculated using the 10% discounted rate divided by the major product type net reserves for each group. |
| (2) | | Including net present value of solution gas and other by-products. |
| (3) | | Including net present value of by-products, but excluding solution gas and by-products from oil wells. |
| (4) | | No by-product oil or NGLs are associated with U.S. shale gas. |
24 ENERPLUS 2016 ANNUAL INFORMATION FORM
Estimated Production for Gross Reserves Estimates
The volume of total production for the Corporation estimated for 2017 in preparing the estimates of gross proved reserves and gross probable reserves is set forth below. Actual 2017 production (including from the Fort Berthold and Marcellus properties in the separate table below) may vary from the estimates provided by McDaniel and NSAI as the Corporation's actual development programs, timing and priorities may differ from the forecast of development by McDaniel and NSAI. Columns may not add due to rounding.
| | | | | | | | | | | | | | | | |
| | Gross Proved Reserves |
| | Canada | | United States |
| | Estimated 2017 | | Estimated 2017 | | Estimated 2017 | | Estimated 2017 |
| | Aggregate | | Average Daily | | Aggregate | | Average Daily |
Product Type | | Production | | Production | | Production | | Production |
Crude Oil | | | | | | | | | | | | | | | | |
Light and Medium Crude Oil | | 1,781 | | Mbbls | | 4,880 | | bbls/day | | - | | Mbbls | | - | | bbls/day |
Heavy Oil | | 2,860 | | Mbbls | | 7,836 | | bbls/day | | - | | Mbbls | | - | | bbls/day |
Tight Oil | | - | | Mbbls | | - | | bbls/day | | 8,348 | | Mbbls | | 22,870 | | bbls/day |
Total Crude Oil | | 4,641 | | Mbbls | | 12,716 | | bbls/day | | 8,348 | | Mbbls | | 22,870 | | bbls/day |
Natural Gas Liquids | | 318 | | Mbbls | | 872 | | bbls/day | | 1,117 | | Mbbls | | 3,060 | | bbls/day |
Total Liquids | | 4,960 | | Mbbls | | 13,588 | | bbls/day | | 9,464 | | Mbbls | | 25,930 | | bbls/day |
Conventional Natural Gas | | 17,511 | | MMcf | | 47,976 | | Mcf/day | | - | | MMcf | | - | | Mcf/day |
Shale Gas | | 176 | | MMcf | | 482 | | Mcf/day | | 72,271 | | MMcf | | 198,003 | | Mcf/day |
Total | | 7,907 | | MBOE | | 21,664 | | BOE/day | | 21,510 | | MBOE | | 58,930 | | BOE/day |
| | | | | | | | | | | | | | | | |
| | Gross Probable Reserves |
| | Canada | | United States |
| | Estimated 2017 | | Estimated 2017 | | Estimated 2017 | | Estimated 2017 |
| | Aggregate | | Average Daily | | Aggregate | | Average Daily |
Product Type | | Production | | Production | | Production | | Production |
Crude Oil | | | | | | | | | | | | | | | | |
Light and Medium Crude Oil | | 53 | | Mbbls | | 146 | | bbls/day | | - | | Mbbls | | - | | bbls/day |
Heavy Oil | | 106 | | Mbbls | | 289 | | bbls/day | | - | | Mbbls | | - | | bbls/day |
Tight Oil | | - | | Mbbls | | - | | bbls/day | | 731 | | Mbbls | | 2,003 | | bbls/day |
Total Crude Oil | | 159 | | Mbbls | | 435 | | bbls/day | | 731 | | Mbbls | | 2,003 | | bbls/day |
Natural Gas Liquids | | 25 | | Mbbls | | 68 | | bbls/day | | 99 | | Mbbls | | 271 | | bbls/day |
Total Liquids | | 184 | | Mbbls | | 503 | | bbls/day | | 830 | | Mbbls | | 2,275 | | bbls/day |
Conventional Natural Gas | | 1,599 | | MMcf | | 4,382 | | Mcf/day | | - | | MMcf | | - | | Mcf/day |
Shale Gas | | 8 | | MMcf | | 22 | | Mcf/day | | 506 | | MMcf | | 1,385 | | Mcf/day |
Total | | 452 | | MBOE | | 1,237 | | BOE/day | | 915 | | MBOE | | 2,506 | | BOE/day |
ENERPLUS 2016 ANNUAL INFORMATION FORM 25
The tables below set forth McDaniel's and NSAI’s estimated 2017 production for the Corporation's Fort Berthold property located in North Dakota, United States, and the Marcellus property, located in Pennsylvania, United States, respectively, as each field is estimated to account for more than 20% of the above estimate of the Corporation's 2017 production.
| | | | | | | | | | | | | | | | |
| | Gross Proved Reserves |
| | Fort Berthold | | Marcellus |
| | Estimated 2017 | | Estimated 2017 | | Estimated 2017 | | Estimated 2017 |
| | Aggregate | | Average Daily | | Aggregate | | Average Daily |
Product Type | | Production | | Production | | Production | | Production |
Crude Oil | | | | | | | | | | | | | | | | |
Light and Medium Crude Oil | | - | | Mbbls | | - | | bbls/day | | - | | Mbbls | | - | | bbls/day |
Heavy Oil | | - | | Mbbls | | - | | bbls/day | | - | | Mbbls | | - | | bbls/day |
Tight Oil | | 7,272 | | Mbbls | | 19,923 | | bbls/day | | - | | Mbbls | | - | | bbls/day |
Total Crude Oil | | 7,272 | | Mbbls | | 19,923 | | bbls/day | | - | | Mbbls | | - | | bbls/day |
Natural Gas Liquids | | 1,117 | | Mbbls | | 3,060 | | bbls/day | | - | | Mbbls | | - | | bbls/day |
Total Liquids | | 8,389 | | Mbbls | | 22,983 | | bbls/day | | - | | Mbbls | | - | | bbls/day |
Conventional Natural Gas | | - | | MMcf | | - | | Mcf/day | | - | | MMcf | | - | | Mcf/day |
Shale Gas | | 5,584 | | MMcf | | 15,298 | | Mcf/day | | 64,211 | | MMcf | | 175,920 | | Mcf/day |
Total | | 9,319 | | MBOE | | 25,532 | | BOE/day | | 10,702 | | MBOE | | 29,320 | | BOE/day |
| | | | | | | | | | | | | | | | |
| | Gross Probable Reserves |
| | Fort Berthold | | Marcellus |
| | Estimated 2017 | | Estimated 2017 | | Estimated 2017 | | Estimated 2017 |
| | Aggregate | | Average Daily | | Aggregate | | Average Daily |
Product Type | | Production | | Production | | Production | | Production |
Crude Oil | | | | | | | | | | | | | | | | |
Light and Medium Crude Oil | | - | | Mbbls | | - | | bbls/day | | - | | Mbbls | | - | | bbls/day |
Heavy Oil | | - | | Mbbls | | - | | bbls/day | | - | | Mbbls | | - | | bbls/day |
Tight Oil | | 728 | | Mbbls | | 1,993 | | bbls/day | | - | | Mbbls | | - | | bbls/day |
Total Crude Oil | | 728 | | Mbbls | | 1,993 | | bbls/day | | - | | Mbbls | | - | | bbls/day |
Natural Gas Liquids | | 99 | | Mbbls | | 272 | | bbls/day | | - | | Mbbls | | - | | bbls/day |
Total Liquids | | 827 | | Mbbls | | 2,265 | | bbls/day | | - | | Mbbls | | - | | bbls/day |
Conventional Natural Gas | | - | | MMcf | | - | | Mcf/day | | - | | MMcf | | - | | Mcf/day |
Shale Gas | | 496 | | MMcf | | 1,360 | | Mcf/day | | - | | MMcf | | - | | Mcf/day |
Total | | 910 | | MBOE | | 2,492 | | BOE/day | | - | | MBOE | | - | | BOE/day |
26 ENERPLUS 2016 ANNUAL INFORMATION FORM
Future Development Costs
The amount of development costs deducted in the estimation of net present value of future net revenue is set forth below. The Corporation intends to fund its development activities through internally generated cash flow and debt. The Corporation does not anticipate that the cost of obtaining the funds required for these development activities will have a material effect on the Corporation's disclosed oil and gas reserves or future net revenue attributable to those reserves. For additional information, see "Business of the Corporation – Capital Expenditures and Costs Incurred".
| | | | | | | | | | | | | | | | |
| | CANADA | | UNITED STATES |
| | | | Proved Plus | | | | | | Proved Plus |
| | Proved Reserves | | Probable Reserves | | Proved Reserves | | Probable Reserves |
| | | | Discounted | | | | Discounted | | | | Discounted | | | | Discounted |
Year | | Undiscounted | | at 10%/year | | Undiscounted | | at 10%/year | | Undiscounted | | at 10%/year | | Undiscounted | | at 10%/year |
| | (in $ millions) |
2017 | | 43 | | 42 | | 45 | | 44 | | 334 | | 318 | | 352 | | 335 |
2018 | | 47 | | 42 | | 51 | | 45 | | 346 | | 301 | | 427 | | 369 |
2019 | | 45 | | 36 | | 51 | | 40 | | 52 | | 42 | | 350 | | 278 |
2020 | | 18 | | 14 | | 30 | | 22 | | 6 | | 4 | | 268 | | 192 |
2021 | | 11 | | 8 | | 14 | | 9 | | - | | - | | 1 | | 1 |
Remainder | | 42 | | 22 | | 40 | | 23 | | - | | - | | - | | - |
Total | | 206 | | 164 | | 231 | | 183 | | 738 | | 665 | | 1,398 | | 1,174 |
Reconciliation of Reserves
Overview
The Corporation's total gross proved plus probable reserves at December 31, 2016 were approximately 382.5 MMBOE, down approximately 6% from year‑end 2015. The Corporation's gross proved plus probable crude oil and NGLs reserves were 194.3 MMBOE and represented approximately 51% of total proved plus probable gross reserves, down 6% from year‑end 2015. The Corporation replaced approximately 126% of its 2016 gross production through its exploration and development program, adding 42.6 MMBOE of proved plus probable reserves, including revisions. Approximately 42% of the additions, including revisions, were crude oil and NGLs, representing the replacement of 113% of the Corporation's 2016 crude oil and NGLs production. The largest amount of crude oil reserves additions, including due to technical revisions, was in the Corporation's Fort Berthold crude oil property in North Dakota. The largest amount of conventional natural gas and shale gas reserves additions, including due to technical revisions, was in the Marcellus shale gas property, as a result of development activities and production outperformance.
The Corporation sold 37.3 MMBOE of proved plus probable reserves in 2016, all of which were associated with the divestment of certain of the Corporation's assets. Total proved plus probable conventional natural gas reserves, excluding shale gas, decreased by approximately 47% from year‑end 2015. Total proved plus probable conventional natural gas and shale gas reserves decreased by approximately 6% from year-end 2015, largely due to these divestments.
ENERPLUS 2016 ANNUAL INFORMATION FORM 27
The following tables reconcile the Corporation's gross crude oil and natural gas reserves from December 31, 2015 to December 31, 2016, by country and in total, using forecast prices and costs. Certain columns may not add due to rounding.
CANADIAN OIL AND GAS RESERVES
| | | | | | | | | | | | | | | | | | | | | | | | |
CANADA | | Light & Medium Oil | | Heavy Oil | | Tight Oil | | Natural Gas Liquids |
Factors | | Proved | | Probable | | Proved
Plus
Probable | | Proved | | Probable | | Proved
Plus
Probable | | Proved | | Probable | | Proved
Plus
Probable | | Proved | | Probable | | Proved
Plus
Probable |
| | (Mbbls) | | (Mbbls) | | (Mbbls) | | (Mbbls) | | (Mbbls) | | (Mbbls) | | (Mbbls) | | (Mbbls) | | (Mbbls) | | (Mbbls) | | (Mbbls) | | (Mbbls) |
December 31, 2015 | | 13,871 | | 3,367 | | 17,238 | | 31,705 | | 9,804 | | 41,509 | | - | | - | | - | | 3,274 | | 949 | | 4,223 |
Acquisitions | | 1,765 | | 373 | | 2,137 | | - | | - | | - | | - | | - | | - | | 24 | | 1 | | 25 |
Dispositions | | (2,885) | | (845) | | (3,730) | | - | | - | | - | | - | | - | | - | | (882) | | (256) | | (1,138) |
Discoveries | | - | | - | | - | | - | | - | | - | | - | | - | | - | | - | | - | | - |
Extensions and Improved Recovery | | 100 | | 45 | | 145 | | - | | - | | - | | - | | - | | - | | - | | - | | - |
Economic Factors | | (606) | | 534 | | (72) | | (533) | | (193) | | (726) | | - | | - | | - | | (173) | | (69) | | (242) |
Technical Revisions | | 1,123 | | (829) | | 294 | | 2,088 | | (890) | | 1,198 | | - | | - | | - | | 263 | | 80 | | 343 |
Production | | (1,746) | | - | | (1,746) | | (3,027) | | - | | (3,027) | | - | | - | | - | | (445) | | - | | (445) |
December 31, 2016 | | 11,621 | | 2,645 | | 14,265 | | 30,232 | | 8,721 | | 38,953 | | - | | - | | - | | 2,061 | | 704 | | 2,765 |
| | | | | | | | | | | | | | | | | | |
CANADA | | Conventional Natural Gas | | Shale Gas | | Total |
Factors | | Proved | | Probable | | Proved
Plus
Probable | | Proved | | Probable | | Proved
Plus
Probable | | Proved | | Probable | | Proved
Plus
Probable |
| | (MMcf) | | (MMcf) | | (MMcf) | | (MMcf) | | (MMcf) | | (MMcf) | | (MBOE) | | (MBOE) | | (MBOE) |
December 31, 2015 | | 183,564 | | 53,802 | | 237,366 | | 4,149 | | 1,530 | | 5,678 | | 80,135 | | 23,342 | | 103,477 |
Acquisitions | | 14,162 | | 3,227 | | 17,389 | | - | | - | | - | | 4,149 | | 911 | | 5,060 |
Dispositions | | (90,343) | | (29,438) | | (119,781) | | (2,237) | | (895) | | (3,133) | | (19,198) | | (6,157) | | (25,354) |
Discoveries | | - | | - | | - | | - | | - | | - | | - | | - | | - |
Extensions and Improved Recovery | | - | | - | | - | | - | | - | | - | | 100 | | 45 | | 145 |
Economic Factors | | (4,731) | | (396) | | (5,127) | | - | | - | | - | | (2,101) | | 207 | | (1,894) |
Technical Revisions | | 20,012 | | 3,325 | | 23,337 | | (128) | | (15) | | (143) | | 6,789 | | (1,089) | | 5,700 |
Production | | (26,894) | | - | | (26,894) | | (256) | | - | | (256) | | (9,744) | | - | | (9,744) |
December 31, 2016 | | 95,769 | | 30,521 | | 126,290 | | 1,527 | | 619 | | 2,146 | | 60,130 | | 17,260 | | 77,389 |
UNITED STATES OIL AND GAS RESERVES
| | | | | | | | | | | | | | | | | | | | | | | | |
UNITED STATES | | Light & Medium Oil | | Heavy Oil | | Tight Oil | | Natural Gas Liquids |
Factors | | Proved | | Probable | | Proved
Plus
Probable | | Proved | | Probable | | Proved
Plus
Probable | | Proved | | Probable | | Proved
Plus
Probable | | Proved | | Probable | | Proved
Plus
Probable |
| | (Mbbls) | | (Mbbls) | | (Mbbls) | | (Mbbls) | | (Mbbls) | | (Mbbls) | | (Mbbls) | | (Mbbls) | | (Mbbls) | | (Mbbls) | | (Mbbls) | | (Mbbls) |
December 31, 2015 | | - | | - | | - | | - | | - | | - | | 86,202 | | 45,051 | | 131,253 | | 7,430 | | 4,044 | | 11,474 |
Acquisitions | | - | | - | | - | | - | | - | | - | | - | | - | | - | | - | | - | | - |
Dispositions | | - | | - | | - | | - | | - | | - | | (6,034) | | (3,680) | | (9,713) | | (640) | | (366) | | (1,007) |
Discoveries | | - | | - | | - | | - | | - | | - | | - | | - | | - | | - | | - | | - |
Extensions and Improved Recovery | | - | | - | | - | | - | | - | | - | | 5,429 | | 13,810 | | 19,239 | | 589 | | 1,540 | | 2,129 |
Economic Factors | | - | | - | | - | | - | | - | | - | | - | | - | | - | | - | | - | | - |
Technical Revisions | | - | | - | | - | | - | | - | | - | | 1,182 | | (9,749) | | (8,566) | | 3,662 | | 351 | | 4,013 |
Production | | - | | - | | - | | - | | - | | - | | (9,214) | | - | | (9,214) | | (1,277) | | - | | (1,277) |
December 31, 2016 | | - | | - | | - | | - | | - | | - | | 77,566 | | 45,432 | | 122,998 | | 9,764 | | 5,569 | | 15,333 |
28 ENERPLUS 2016 ANNUAL INFORMATION FORM
| | | | | | | | | | | | | | | | | | |
UNITED STATES | | Conventional Natural Gas | | Shale Gas | | Total |
Factors | | Proved | | Probable | | Proved
Plus
Probable | | Proved | | Probable | | Proved
Plus
Probable | | Proved | | Probable | | Proved
Plus
Probable |
| | (MMcf) | | (MMcf) | | (MMcf) | | (MMcf) | | (MMcf) | | (MMcf) | | (MBOE) | | (MBOE) | | (MBOE) |
December 31, 2015 | | - | | - | | - | | 620,932 | | 336,758 | | 957,690 | | 197,120 | | 105,221 | | 302,341 |
Acquisitions | | - | | - | | - | | - | | - | | - | | - | | - | | - |
Dispositions | | - | | - | | - | | (4,873) | | (2,670) | | (7,543) | | (7,486) | | (4,491) | | (11,977) |
Discoveries | | - | | - | | - | | - | | - | | - | | - | | - | | - |
Extensions and Improved Recovery | | - | | - | | - | | 36,268 | | 27,948 | | 64,216 | | 12,063 | | 20,008 | | 32,071 |
Economic Factors | | - | | - | | - | | (30,053) | | 1,998 | | (28,056) | | (5,009) | | 333 | | (4,676) |
Technical Revisions | | - | | - | | - | | 183,321 | | (88,484) | | 94,837 | | 35,398 | | (24,145) | | 11,253 |
Production | | - | | - | | - | | (80,507) | | - | | (80,507) | | (23,909) | | - | | (23,909) |
| | | | | | | | | | | | | | | | | | |
December 31, 2016 | | - | | - | | - | | 725,087 | | 275,550 | | 1,000,637 | | 208,178 | | 96,926 | | 305,104 |
TOTAL OIL AND GAS RESERVES
| | | | | | | | | | | | | | | | | | | | | | | | |
TOTAL | | Light & Medium Oil | | Heavy Oil | | Tight Oil | | Natural Gas Liquids |
Factors | | Proved | | Probable | | Proved
Plus
Probable | | Proved | | Probable | | Proved
Plus
Probable | | Proved | | Probable | | Proved
Plus
Probable | | Proved | | Probable | | Proved
Plus
Probable |
| | (Mbbls) | | (Mbbls) | | (Mbbls) | | (Mbbls) | | (Mbbls) | | (Mbbls) | | (Mbbls) | | (Mbbls) | | (Mbbls) | | (Mbbls) | | (Mbbls) | | (Mbbls) |
December 31, 2015 | | 13,871 | | 3,367 | | 17,238 | | 31,705 | | 9,804 | | 41,509 | | 86,202 | | 45,051 | | 131,253 | | 10,704 | | 4,993 | | 15,697 |
Acquisitions | | 1,765 | | 373 | | 2,137 | | - | | - | | - | | - | | - | | - | | 24 | | 1 | | 25 |
Dispositions | | (2,885) | | (845) | | (3,730) | | - | | - | | - | | (6,034) | | (3,680) | | (9,713) | | (1,522) | | (622) | | (2,145) |
Discoveries | | - | | - | | - | | - | | - | | - | | - | | - | | - | | - | | - | | - |
Extensions and Improved Recovery | | 100 | | 45 | | 145 | | - | | - | | - | | 5,429 | | 13,810 | | 19,239 | | 589 | | 1,540 | | 2,129 |
Economic Factors | | (606) | | 534 | | (72) | | (533) | | (193) | | (726) | | - | | - | | - | | (173) | | (69) | | (242) |
Technical Revisions | | 1,123 | | (829) | | 294 | | 2,088 | | (890) | | 1,198 | | 1,182 | | (9,749) | | (8,566) | | 3,925 | | 430 | | 4,356 |
Production | | (1,746) | | - | | (1,746) | | (3,027) | | - | | (3,027) | | (9,214) | | - | | (9,214) | | (1,722) | | - | | (1,722) |
December 31, 2016 | | 11,621 | | 2,645 | | 14,265 | | 30,232 | | 8,721 | | 38,953 | | 77,566 | | 45,432 | | 122,998 | | 11,825 | | 6,273 | | 18,098 |
| | | | | | | | | | | | | | | | | | |
TOTAL | | Conventional Natural Gas | | Shale Gas | | Total | |
Factors | | Proved | | Probable | | Proved
Plus
Probable | | Proved | | Probable | | Proved
Plus
Probable | | Proved | | Probable | | Proved
Plus
Probable |
| | (MMcf) | | (MMcf) | | (MMcf) | | (MMcf) | | (MMcf) | | (MMcf) | | (MBOE) | | (MBOE) | | (MBOE) |
December 31, 2015 | | 183,564 | | 53,802 | | 237,366 | | 625,081 | | 338,288 | | 963,368 | | 277,255 | | 128,563 | | 405,818 |
Acquisitions | | 14,162 | | 3,227 | | 17,389 | | - | | - | | - | | 4,149 | | 911 | | 5,060 |
Dispositions | | (90,343) | | (29,438) | | (119,781) | | (7,110) | | (3,566) | | (10,676) | | (26,683) | | (10,648) | | (37,331) |
Discoveries | | - | | - | | - | | - | | - | | - | | - | | - | | - |
Extensions and Improved Recovery | | - | | - | | - | | 36,268 | | 27,948 | | 64,216 | | 12,163 | | 20,053 | | 32,216 |
Economic Factors | | (4,731) | | (396) | | (5,127) | | (30,053) | | 1,998 | | (28,056) | | (7,110) | | 540 | | (6,570) |
Technical Revisions | | 20,012 | | 3,325 | | 23,337 | | 183,193 | | (88,499) | | 94,694 | | 42,187 | | (25,234) | | 16,953 |
Production | | (26,894) | | - | | (26,894) | | (80,763) | | - | | (80,763) | | (33,653) | | - | | (33,653) |
December 31, 2016 | | 95,769 | | 30,521 | | 126,290 | | 726,614 | | 276,169 | | 1,002,783 | | 268,307 | | 114,186 | | 382,493 |
Undeveloped Reserves
The following tables disclose the volumes of proved undeveloped reserves and probable undeveloped reserves of the Corporation that were first attributed in the years indicated.
Proved Undeveloped Reserves
| | | | | | | | | | | | | | |
| | Crude Oil | | | | | | | | |
Year(1) | | Light &
Medium | | Heavy | | Tight | | NGLs | | Conventional
Natural
Gas | | Shale
Gas | | Total |
| | (Mbbls) | | (Mbbls) | | (Mbbls) | | (Mbbls) | | (MMcf) | | (MMcf) | | (MBOE) |
2014 | | 398 | | 1,590 | | 3,051 | | 293 | | 13,374 | | 63,033 | | 18,067 |
2015 | | 82 | | 1,390 | | 1,194 | | 109 | | 56 | | 16,776 | | 5,579 |
2016 | | 100 | | - | | 3,492 | | 391 | | - | | 6,080 | | 4,996 |
Note: (1) First attributed volumes include additions during the year and do not include revisions to previous undeveloped reserves.
ENERPLUS 2016 ANNUAL INFORMATION FORM 29
Probable Undeveloped Reserves
| | | | | | | | | | | | | | |
| | Crude Oil | | | | | | | | |
Year(1) | | Light &
Medium | | Heavy | | Tight | | NGLs | | Conventional
Natural
Gas | | Shale
Gas | | Total |
| | (Mbbls) | | (Mbbls) | | (Mbbls) | | (Mbbls) | | (MMcf) | | (MMcf) | | (MBOE) |
2014 | | 181 | | 1,568 | | 2,043 | | 183 | | 6,536 | | 24,014 | | 9,067 |
2015 | | 37 | | 558 | | 6,296 | | 573 | | 33 | | 37,948 | | 13,794 |
2016 | | 45 | | - | | 13,104 | | 1,468 | | - | | 26,468 | | 19,028 |
Note: (1) First attributed volumes include additions during the year and do not include revisions to previous undeveloped reserves.
The Corporation attributes proved and probable undeveloped reserves based on accepted engineering and geological practices as defined under NI 51‑101. These practices include the determination of reserves based on the presence of commercial test rates from either production tests or drill stem tests, extensions of known accumulations based upon either geological or geophysical information, and the optimization of existing fields. The Corporation has been active for the last several years in drilling and developing these undeveloped reserves and the Corporation expects this to continue. Despite the current reduced drilling activity level, development of the proved undeveloped reserves is now forecast to occur continuously over the next three years, while development of the proved plus probable undeveloped reserves is forecast to occur over the next five years.
Significant Factors or Uncertainties
Changes in future commodity prices relative to the forecasts described above under "Forecast Prices and Costs" could have a negative impact on the Corporation's reserves, and in particular on the development of undeveloped reserves, unless future development costs are adjusted in parallel. Other than the foregoing and the factors disclosed or described in the tables above, the Corporation does not anticipate any other significant economic factors or other significant uncertainties which may affect any particular components of its reserves data.
In connection with its operations, the Corporation will incur abandonment and reclamation costs for surface leases, wells, facilities and pipelines. The Corporation budgets for and recognizes as a liability the estimated present value of the future decommissioning liabilities associated with its property, plant and equipment. There are no unusually significant abandonment and reclamation costs associated with its reserves properties or properties with no attributed reserves.
For further information, see "Risk Factors – The Corporation's actual reserves and resources will vary from its reserves and resources estimates, and those variations could be material".
Proved and Probable Reserves not on Production
The Corporation has approximately 1.4 MMBOE of proved plus probable reserves which are capable of production but which, as of December 31, 2016, were not on production. These reserves have generally been non‑producing for periods ranging from a few months to more than five years. The majority of these reserves are related to reserves volumes from recently drilled wells which require the completion of infrastructure before production can begin. A minor portion of these reserves is related to commercially producible volumes that are not producing due to production requirements of other reserves formations or zones in the same well bore. These reserves relate to the longer term non-producing periods.
30 ENERPLUS 2016 ANNUAL INFORMATION FORM
Supplemental Operational Information
Safety and Social Responsibility
The Corporation has adopted a Safety and Social Responsibility Policy (“S&SR Policy”), which articulates its commitment to health and safety, environmental, stakeholder engagement, and regulatory compliance. The S&SR Policy applies to any activities undertaken by or on behalf of the Corporation in its operating areas. The Corporation’s board of directors and the President & Chief Executive Officer are ultimately accountable for ensuring compliance with the S&SR Policy. The Corporation’s management and its Safety & Social Responsibility department are responsible for ensuring that the S&SR Policy is implemented and communicated across the Corporation. All employees and contractors of the Corporation are responsible for complying with the S&SR Policy. The Safety & Social Responsibility Committee of the Corporation’s board of directors (the “S&SR Committee”) is responsible for overseeing the Corporation’s S&SR performance and ensuring there are adequate systems in place to support ongoing compliance, and to plan and execute the Corporation’s activities in a safe and socially responsible manner.
The Corporation strives to develop and operate its oil and natural gas assets in a socially responsible manner and places a high priority on protecting the health and safety of its employees, contractors, and the public in the communities in which it operates, and preserving the quality of the environment. The Corporation also encourages active and open collaboration with its stakeholders. The Corporation has established processes and programs designed to evaluate and minimize health, safety, and environmental risks, and strives for continuous improvement in its S&SR performance. The Corporation also actively participates in industry recognized programs that support its sustainability goals.
The S&SR Policy articulates the Corporation's commitment to protecting the health and safety of all persons and communities involved in, or affected by, its business activities. Specifically, the S&SR Policy outlines that the Corporation will: (i) promote and support a culture in which all employees and contractors share ownership of a workplace where no one gets injured; (ii) provide the resources, equipment and training needed to ensure everyone complies with its health and safety programs; and (iii) strive to continually improve its safety culture by integrating applicable industry best practices and operational experience into its health and safety mindset and programs.
The S&SR Policy also articulates the Corporation's commitment to the environment and states that the Corporation will: (i) proactively manage its impact on the environment and consider innovative improvement opportunities; (ii) work to reduce its environmental impact in the areas in which it operates, including reviewing the efficiency of its energy consumption to reduce emissions intensity; (iii) improve its water and land use practices; (iv) limit the waste it generates; (v) prevent and manage environmental releases; (vi) provide transparent disclosure; and (vii) provide resources and training to meet its environmental commitments.
The Corporation's commitment to building meaningful and transparent relationships with its stakeholders is articulated in its S&SR Policy. In addition, the S&SR Policy expresses the Corporation’s commitment to engaging with stakeholders to promote economic and social development for the people and communities in its operating areas.
Finally, the Corporation’s commitment to the responsible development of resources and regulatory compliance is stated in its S&SR Policy.
Health and Safety
The Corporation's combined (employee/contractor) recordable injury frequency rate for 2016 was 0.81 injuries per 200,000 man hours, a decrease from the rate of 1.24 recorded in 2015. The Corporation's employee recordable injury frequency rate of 0.37 injuries per 200,000 man hours in 2016 also decreased from 0.99 injuries per 200,000 man hours in 2015. The Corporation's total contractor recordable injury frequency of 1.32 injuries per 200,000 man hours in 2016 decreased from 1.48 injuries per 200,000 man hours in 2015. The Corporation recorded two lost-time injuries in 2016, a decrease from three recorded in 2015. The Corporation had zero employee or contractor fatalities in 2016 and 2015.
Health and safety risks influence workplace practices, operating costs, and the establishment of regulatory standards. The Corporation maintains a health and safety management system designed to:
| · | | increase emphasis on safety awareness and promote continuous improvement and safety excellence; |
| · | | provide staff with the training and resources needed to complete work safely; |
| · | | incorporate hazard assessment and risk management as an integral part of everyday business; and |
ENERPLUS 2016 ANNUAL INFORMATION FORM 31
| · | | monitor performance to ensure that its operations comply with all legal obligations and its internally‑imposed standards. |
The health and safety component of the S&SR management system is reviewed annually for continuous improvement opportunity. Every three years, the Health and Safety Management System is subject to a third‑party audit utilizing the Enform Certificate of Recognition ("COR") Audit Protocol. Annual maintenance audits against the COR Audit Protocol are conducted each year. In 2016, the Corporation successfully renewed its COR certification.
The Corporation continues to develop and implement prevention measures and safety management program improvements to support its focus and commitment for an injury‑free workplace.
Environment
The Corporation is committed to meeting its responsibilities to protect the environment through a variety of programs and actively monitors its operations for compliance with all relevant and applicable environmental regulations and industry best practices. The Corporation engages in the following activities:
| · | | Site abandonment, remediation, and reclamation capital expenditures for the Corporation's Canadian and United States properties in 2016 totaled $8.4 million ($5.9 million on operated properties and $2.5 million on non‑operated properties). The Corporation received 41 reclamation certificates from regulatory agencies in 2016 by returning sites to their previous equivalent land capability; |
| · | | The Corporation completes third-party environmental compliance audits designed to ensure compliance with environmental legislation and regulations. In 2016, three environmental compliance audits were completed; |
| · | | The Corporation completes third-party loss prevention audits to identify and evaluate the risk exposures associated with production equipment, process operations, utility supply systems and natural hazards. In 2016, two facilities were audited. The purpose of the loss prevention audits is to generate detailed loss prevention reports with risk-based recommendations for improving the overall safety and performance of our facilities, mitigating the potential exposure to financial loss associated with property damage and production loss, and ensuring the adequacy of our relevant insurance coverage; |
| · | | Government regulators conducted 238 inspections of the Corporation’s field operations in the United States and Canada in 2016, an increase from the 148 government regulator inspections conducted in 2015. The percentage of noncompliant field inspections received by the Corporation in 2016 was 7%, an improvement from the 15% noncompliant field inspections received in 2015; |
| · | | The Corporation continues its internal facility inspection program and completed 25 inspections at major Canadian facilities in 2016. The average score of compliance resulting from the internal inspection program in 2016 was 93% compared to 85% in 2015; |
| · | | The Corporation conducts its internal monthly site inspection program at its U.S. and Canadian locations, the focus of which is to assess environmental, regulatory, and general housekeeping items. Findings from the monthly site inspection program are recorded in the Corporation’s internal Sustainability Information Management System; |
| · | | The Corporation conducts annual property reviews with specific risk reduction objectives. The Corporation also continues to manage risk through the ongoing Pipeline Risk Assessment Process and various other activities, such as inspections of pipelines at water crossings. The Corporation reviews each of its pipeline systems annually. The Corporation continues to incorporate improvements to these programs which are designed to identify and mitigate significant risks, and to decrease the number and severity of pipeline failure incidents; |
| · | | The Corporation has estimated its direct emissions in 2016 to be approximately 645,950 carbon dioxide equivalent tonnes per year, which is 7% less than the Corporation's direct emissions in 2015 of 696,953 carbon dioxide equivalent tonnes per year. The estimated numbers will be adjusted as additional data becomes available. In 2016, the Corporation completed 24 fugitive emissions surveys at its Canadian facilities and 66 at its U.S. production pad facilities to detect losses from leaks and vents, and is working to repair identified leaks. |
Greenhouse gas regulations have been enacted in British Columbia, Alberta and at the federal level in Canada and the United States. In 2016, the Corporation’s only operations with an active carbon tax was in the jurisdiction of British Columbia. The total carbon tax paid was approximately $0.7 million in 2016. In addition, the Corporation is required to report third-party verified greenhouse gas emissions annually to the government of British Columbia under the Greenhouse Gas
32 ENERPLUS 2016 ANNUAL INFORMATION FORM
Reduction (Cap and Trade) Act (British Columbia) (the "BCCTA"). The Corporation is not subject to the Canadian greenhouse gas emissions reporting requirement as it does not currently operate facilities above the 50,000 tonnes of carbon dioxide equivalent per year per facility threshold. However, the Corporation is subject to the reporting requirement in the United States under the U.S. Environmental Protection Agency (the “U.S. EPA”) Clean Air Act and the Mandatory Reporting of Greenhouse Gases Rule. The latest of these reports was submitted to the U.S. EPA on March 31, 2016 for the 2015 operational year. The report for the 2016 operational year will be submitted on March 31, 2017. For more information on the environmental regulation applicable to the Corporation, see "Industry Conditions – Environmental Regulation”.
Some of the Corporation’s operations use hydraulic fracturing techniques to stimulate the production of oil and natural gas from geological formations which were previously unproductive. Hydraulic fracturing involves the injection of pressurized fluids, sand, and small amounts of additives into a well bore. The practice of hydraulic fracturing associated with drilling in shale formations is the subject of significant focus among some environmentalists and regulators. Concerns have been raised by local, state, provincial, and federal levels of government in Canada and the U.S. over the potential hazards and environmental impact associated with the use of hydraulic fracturing. The Corporation strives to comply with all current Canadian and U.S. regulations and adheres to best practices and industry standards for well construction and hydraulic fracturing operating practices. Although the Corporation proactively mitigates perceived risks involved in the hydraulic fracturing process, increased capital and operating costs may be incurred if regulations in Canada or the United States impose more stringent hydraulic fracturing compliance requirements.
The S&SR Committee regularly reviews health, safety, environmental and regulatory updates, and risks. At present, the Corporation believes it is, and expects to continue to be, in compliance with all material applicable environmental laws and regulations and has included appropriate amounts in its capital expenditure budget to continue to meet its ongoing environmental obligations.
Overall, the Corporation strives to operate in a socially responsible manner and believes its health, safety and environmental initiatives and performance confirm its ongoing commitment to environmental stewardship and the health and safety of its employees, contractors, and the general public in the communities in which it operates. Annually, the Corporation identifies key S&SR focus areas to support this commitment and sets forth strategic improvement targets. The Corporation believes that by monitoring S&SR metrics, identifying areas for improvement and implementing strategies, processes and procedures in those key focus areas, the Corporation will continue to improve its S&SR performance.
Insurance
The Corporation carries insurance coverage to protect its assets at the standards typical within the oil and natural gas industry. Insurance levels are determined and acquired by the Corporation after considering the perceived risk of loss and appropriate coverage, together with the overall cost. The Corporation currently purchases insurance to protect against third party liability, property damage, business interruption, terrorism, cyber-attacks, pollution and well control. In addition, liability coverage is also carried for the directors and officers of the Corporation.
Personnel
As at December 31, 2016, the Corporation employed a total of 472 persons, including full‑time benefit employees and payroll consultants, 340 of whom were in Canada and 132 of whom were in the United States.
ENERPLUS 2016 ANNUAL INFORMATION FORM 33
Description of Capital Structure
The authorized capital of the Corporation consists of an unlimited number of Common Shares and a number of preferred shares, issuable in series ("Preferred Shares"), which are limited to an amount equal to not more than one‑quarter of the number of issued and outstanding Common Shares at the time of the issuance of any such Preferred Shares. The following is a summary of the rights, privileges, restrictions and conditions attaching to the Common Shares and the Preferred Shares. Copies of the Corporation's articles of amalgamation, By-law No. 1 and By-law No. 2 were filed on January 2, 2013, June 16, 2014, and May 6, 2016, respectively, on the Corporation's SEDAR profile at www.sedar.com and on the Corporation's EDGAR profile at www.sec.gov.
Common Shares
Holders of Common Shares are entitled to receive notice of and to attend all meetings of shareholders of the Corporation and to one vote at such meetings for each Common Share held. The holders of the Common Shares are, at the discretion of the Corporation's board of directors and subject to applicable legal restrictions and subject to the rights, privileges, restrictions and conditions attaching to any other class or series of shares of the Corporation, entitled to receive any dividends declared by the Corporation on the Common Shares and to share in the remaining property of the Corporation upon liquidation, dissolution or winding‑up.
The articles of the Corporation, as amended and restated on May 11, 2012, contain provisions facilitating payment of dividends on Common Shares through issuance of Common Shares in circumstances where the board of directors discloses, and a shareholder of the Corporation validly elects to receive, payment of dividends, in whole or in part, in the form of Common Shares. See "Dividends – Stock Dividend Program".
Preferred Shares
There are no Preferred Shares outstanding as of the date of this Annual Information Form. The Preferred Shares may be issued from time to time in one or more series with such rights, restrictions, privileges, conditions and designations attached thereto as shall be fixed from time to time by the Corporation's board of directors. Subject to the provisions of the ABCA, the Preferred Shares of each series shall rank in parity with the Preferred Shares of every other series. The Preferred Shares shall be entitled to preference over the Common Shares and any other shares of the Corporation ranking junior to the said Preferred Shares with respect to payment of dividends and the distribution of assets in the event of liquidation, dissolution or winding‑up of the Corporation, whether voluntary or involuntary, to the extent fixed in the case of each respective series, and may also be given such other preferences over the Common Shares and any other shares of the Corporation ranking junior to the said Preferred Shares as may be fixed in the case of each such series.
Shareholder Rights Plan
The continuation and amendment and restatement of the Shareholder Rights Plan was approved by shareholders of the Corporation, including by requisite number of the Corporation's "Independent Shareholders" (as defined in the Shareholder Rights Plan), at the annual meeting held on May 6, 2016. The continuation of the Shareholder Rights Plan must next be approved by the Corporation's "Independent Shareholders" at the annual meeting of shareholders of the Corporation to be held in 2019, failing which it will expire at the end of such meeting. The Shareholder Rights Plan, under which Computershare Trust Company of Canada acts as rights agent, generally provides that, following the acquisition by any person or entity of 20% or more of the issued and outstanding Common Shares (except pursuant to certain permitted or excepted transactions) and upon the occurrence of certain other events, each holder of Common Shares, other than such acquiring person or entity, shall be entitled to acquire Common Shares at a discounted price. The Shareholder Rights Plan is similar to other shareholder rights plans adopted in the energy sector. A copy of the Shareholder Rights Plan was filed on May 6, 2016 as an "Other securityholders documents" on the Corporation's SEDAR profile at www.sedar.com and on the Corporation's EDGAR profile at www.sec.gov, and is available on the Corporation's website at www.enerplus.com under "Corporate Governance".
34 ENERPLUS 2016 ANNUAL INFORMATION FORM
Senior Unsecured Notes
Enerplus has issued Senior Unsecured Notes, of which US$533 million and CDN$30 million principal amounts were outstanding at December 31, 2016. Certain terms of the Senior Unsecured Notes are summarized below:
| | | | | | | | | | | | |
Issue Date | | Original
Principal | | Remaining
Principal | | Coupon
Rate | | Interest
Payment Dates | | Maturity Date | | Term |
September 3, 2014 | | US$200 million | | US$105 million | | 3.79% | | March 3 and September 3 | | September 3, 2026 | | Principal payments required in five equal annual installments beginning September 3, 2022 |
May 15, 2012 | | CDN$30 million | | CDN$30 million | | 4.34% | | May 15 and November 15 | | May 15, 2019 | | Bullet payment on maturity |
May 15, 2012 | | US$20 million | | US$20 million | | 4.40% | | May 15 and November 15 | | May 15, 2022 | | Bullet payment on maturity |
May 15, 2012 | | US$355 million | | US$298 million | | 4.40% | | May 15 and November 15 | | May 15, 2024 | | Principal payments required in five equal annual installments beginning May 15, 2020 |
June 18, 2009 | | US$225 million | | US$110 million | | 7.97% | | June 18 and December 18 | | June 18, 2021 | | Principal payments required in five equal annual installments beginning June 18, 2017 |
| | | | | | | | | | | | |
For additional information see "Material Contracts and Documents Affecting the Rights of Securityholders".
Bank Credit Facility
As of December 31, 2016, the Corporation had $23.2 million drawn on its $800 million senior unsecured, covenant‑based credit facility with a syndicate of financial institutions maturing October 31, 2019.
For a description of the Bank Credit Facility, see Note 7 to the Corporation's audited consolidated financial statements for the year ended December 31, 2016. See also "Material Contracts and Documents Affecting the Rights of Securityholders".
ENERPLUS 2016 ANNUAL INFORMATION FORM 35
Dividends
Dividend Policy and History
The Corporation's board of directors is responsible for determining the dividend policy of the Corporation. The dividend policy must comply with the requirements of the ABCA, including satisfying the solvency test applicable to ABCA corporations. The Corporation has currently established a dividend policy of paying monthly dividends to holders of Common Shares. The dividend record date is on or about the last business day of each calendar month and the corresponding dividend payment date is on or about the 15th day of the following month. However, any decision to pay dividends on the Common Shares will be made by the Corporation's board of directors on the basis of the relevant conditions existing at such future time, and there can be no guarantee that the Corporation will maintain its current dividend policy. Dividend amounts likely will vary, and there can be no assurance as to the level of dividends that will be paid or that any dividends will be paid at all. See "Risk Factors – Dividends on the Corporation's Common Shares are variable". Monthly cash dividends paid to U.S. resident shareholders are converted to U.S. dollars based upon the actual Canadian to U.S. dollar exchange rate on the dividend payment date and, accordingly, shareholders that are not resident in Canada are subject to foreign exchange rate risk on such payments.
The table below sets forth the dividends paid or declared by the Corporation in 2014, 2015, 2016 and January through March of 2017:
| | | | | | | | | | | | |
Month | | 2017 | | 2016 | | 2015 | | 2014 |
January | | $ | 0.01 | | $ | 0.03 | | $ | 0.09 | | $ | 0.09 |
February | | | 0.01 | | | 0.03 | | | 0.09 | | | 0.09 |
March | | | 0.01 | | | 0.03 | | | 0.09 | | | 0.09 |
April | | | N/A | | | 0.01 | | | 0.05 | | | 0.09 |
May | | | N/A | | | 0.01 | | | 0.05 | | | 0.09 |
June | | | N/A | | | 0.01 | | | 0.05 | | | 0.09 |
July | | | N/A | | | 0.01 | | | 0.05 | | | 0.09 |
August | | | N/A | | | 0.01 | | | 0.05 | | | 0.09 |
September | | | N/A | | | 0.01 | | | 0.05 | | | 0.09 |
October | | | N/A | | | 0.01 | | | 0.05 | | | 0.09 |
November | | | N/A | | | 0.01 | | | 0.05 | | | 0.09 |
December | | | N/A | | | 0.01 | | | 0.03 | | | 0.09 |
For certain tax information relating to the dividends paid on the Common Shares for Canadian and U.S. federal income tax purposes, please refer to the Corporation's website at www.enerplus.com.
Shareholders are advised to consult their tax advisors regarding questions relating to the tax treatment of dividends paid by the Corporation. For additional information on potential risks associated with the taxation of dividends paid by the Corporation, see "Risk Factors".
Stock Dividend Program
Effective May 11, 2012, the Corporation implemented a stock dividend program pursuant to which shareholders of the Corporation were able to elect to receive dividends in the form of Common Shares, instead of receiving a cash dividend, issued at a deemed price of 95% of the five day weighted average trading price of the Common Shares on the TSX immediately prior to the applicable dividend payment date. Effective with the April 2014 dividend, the Corporation elected to eliminate the 5% discount applied to determine the number of Common Shares issued pursuant to the stock dividend program. Effective September 19, 2014, the board of directors of the Corporation suspended the stock dividend program to eliminate the dilution associated with the issuance of Common Shares through the program.
36 ENERPLUS 2016 ANNUAL INFORMATION FORM
Industry Conditions
Overview
The oil and natural gas industry is subject to extensive controls and regulation governing its operations (including land tenure, exploration, development, production, refining, transportation, marketing, remediation, abandonment and reclamation) imposed by legislation enacted by various levels of government. The oil and natural gas industry is also subject to agreements among the various federal, provincial and state governments with respect to pricing and taxation of oil and natural gas. Although it is not expected that any of these controls, regulations or agreements will affect the Corporation's operations in a manner materially different than they would affect other oil and gas issuers in similar operating areas, the controls, regulations and agreements should be considered carefully by investors in the oil and gas industry. All current legislation is a matter of public record and the Corporation is unable to predict what additional legislation or amendments may be enacted. Outlined below are some of the principal aspects of legislation, regulations and agreements governing the oil and gas industry.
The Corporation owns oil and natural gas properties and related assets in Canada (primarily in Alberta, Saskatchewan and British Columbia) and in Montana, North Dakota, Pennsylvania and Colorado in the United States. The Corporation's oil and natural gas operations are regulated by administrative agencies under statutory provisions of the provinces and states where such operations are conducted, and by certain agencies of the federal government for operations on U.S. federal leases. These statutory provisions regulate matters such as the exploration for and production of crude oil and natural gas, including provisions related to permits for the drilling of wells, bonding requirements to drill or operate wells, the location of wells, the method of drilling and casing wells, the surface use and restoration of properties upon which wells are drilled, and the abandonment of wells. The Corporation's operations are also subject to various conservation laws and regulations which regulate matters such as the size of drilling and spacing units or proration units, the number of wells which may be drilled in an area, and the unitization or pooling of crude oil and natural gas properties. In addition, conservation laws sometimes establish maximum rates of production from crude oil and natural gas wells, generally prohibit or limit the venting or flaring of natural gas and associated liquids, and impose certain requirements regarding the rateability or fair apportionment of production from fields and individual wells. As well, the Corporation is required to disclose payments made to governments of all levels in both Canada and the United States as part of a transparency reporting initiative legislated by the Canadian government.
Pricing and Marketing of Crude Oil and Natural Gas
In Canada and the Unites States, producers of crude oil negotiate sales contracts directly with crude oil purchasers. Most agreements are linked to global oil prices, which are set by daily, weekly and monthly physical and financial transactions for crude oil around the world. Those prices are primarily based on worldwide fundamentals of supply and demand. Specific prices depend, in part, on crude oil quality, prices of competing fuels, distance to markets, access to downstream transportation, the value of refined products, the supply/demand balance and other contractual terms.
In Canada and the United States, producers of natural gas are free to negotiate prices and other terms with purchasers, provided that export contracts meet certain criteria prescribed by the National Energy Board and the Government of Canada or, in relation to U.S. exports, restrictions on export licenses imposed by the United States Department of Energy. The price depends, in part, on natural gas quality, prices of competing natural gas and other fuels, distance to the market, access to downstream transportation, length of contract term, seasonal factors, weather conditions, the value of refined products, the supply/demand balance and other contractual terms. In the United States, the Federal Energy Regulatory Commission regulates interstate natural gas rates and service conditions, which affect the marketing of natural gas, as well as revenues producers receive for sales of natural gas. Intrastate natural gas transportation service is also subject to regulation by state regulatory agencies.
Internationally, prices for crude oil and natural gas fluctuate in response to changes in the supply and demand for crude oil and natural gas, market uncertainty and a variety of other factors beyond the Corporation's control. Since mid-2014, crude oil and natural gas prices experienced significant decline and have fluctuated in response to a variety of factors including, among others, the increase in supply of crude oil and the decision by the Organization of Petroleum Exporting Countries to decrease production levels in response to such increase. See "Risk Factors – Low or volatile oil and natural gas prices could have a material adverse effect on the Corporation's results of operations and financial condition". In addition, crude oil and natural gas producers in North America currently receive significantly discounted prices for their production relative to certain international prices as a result of constraints on the ability to transport and sell their products to national, and in some cases, international markets due to lack of infrastructure capacity. See "Risk Factors – Lack of adequately developed infrastructure, and the impact of special interest groups on such development, may result in a decline in the Corporation's ability to market oil and natural gas production".
ENERPLUS 2016 ANNUAL INFORMATION FORM 37
Royalties and Incentives
In addition to federal regulations, each province in Canada and each U.S. state has legislation and regulations which govern oil and gas holdings and land tenure, royalties, production rates, environmental protection and other matters. In all Canadian jurisdictions, producers of oil and natural gas are required to pay annual rental payments and royalties in respect of Crown leases, and royalties and freehold production taxes in respect of oil and natural gas produced from freehold lands. In all U.S. jurisdictions, producers of oil and natural gas are typically required to pay annual rental payments in respect of federal, state and freehold leases until production begins. Upon commencement of production, royalties and production taxes are paid in respect of oil and natural gas produced from federal, state and freehold lands. Producers of U.S. Indian leases are required to make annual rental payments regardless of well production, in addition to other fixed fees for land improvement, on a per well basis. Royalty and production tax regime is a significant factor in the profitability of oil and natural gas production. Royalties payable on production from lands other than Crown‑owned lands in Canada and federal and state lands in the U.S. are determined by negotiations between the freehold mineral owner and the lessee. Crown royalties in Canada and federal, U.S. Indian and state royalties and production taxes in the U.S. are determined by government regulation and are generally calculated as a percentage of the value of the gross production. The rate of royalties payable generally depends in part on prescribed reference prices, well productivity, geographical location, field discovery date and the type or quality of the petroleum product produced. Other royalties and royalty‑like interests are from time to time carved out of the working interest owner's interest through non‑public transactions. These are often referred to as overriding royalties, gross overriding royalties or net profits or net carried interests.
From time to time, the federal and provincial governments in Canada and the federal and state governments in the U.S. have established incentive programs which have included royalty rate or production tax reductions (including for specific wells), royalty holidays and tax credits for the purpose of encouraging oil and natural gas exploration or enhanced planning projects. If applicable, oil and natural gas royalty holidays, reductions and tax credits would effectively reduce the amount of royalties paid by oil and gas producers to the applicable governmental entities.
Land Tenure
Crude oil and natural gas located in the western Canadian provinces is owned predominantly by the respective provincial governments. Provincial governments grant rights to explore for and produce oil and natural gas pursuant to leases, licences and permits for varying periods and on conditions set forth in provincial legislation including requirements to perform specific work or make payments. Oil and natural gas located in such provinces can also be privately owned, and rights to explore for and produce such oil and natural gas are granted by lease on such terms and conditions as may be negotiated.
Crude oil and natural gas located in the U.S. is predominantly owned by private owners. The U.S. Department of the Interior - Bureau of Land Management ("BLM"), and the state in which the minerals are located also may hold ownership to such rights. These owners, from governmental bodies to private individuals, grant rights to explore for and produce oil and gas pursuant to leases, licenses and permits for varying periods and on conditions including requirements to perform specific work or make payments. As to those rights held by private owners, all terms and conditions may be negotiated. For those rights held by governmental agencies, typically the terms and conditions of the oil and gas lease have been predetermined by each governing or regulatory body. Substantially all of the leaseholds currently owned by the Corporation in the U.S. have been granted through private individuals.
The majority of the Corporation's operations in North Dakota take place on the Fort Berthold Indian Reservation ("FBIR") and involve allotee lands, which are lands that are administered by the Bureau of Indian Affairs ("BIA") but owned by individual band members. As such, these operations are governed by both state and federal regulations. U.S. federal departments such as the BIA, the BLM, and the U.S. EPA enforce the federal regulations. Federal U.S. regulations may differ significantly from regulations generally applicable to non‑federally regulated lands and, as a consequence, may result in the slowing, or halting of, the Corporation's developments on the FBIR.
A lease may generally be continued after the initial term provided certain minimum levels of exploration or production have been achieved and all lease rentals have been timely paid, subject to certain exceptions. To develop minerals, including oil and natural gas, it is necessary for the mineral estate owner to have access to the surface estate. Under common law, the mineral estate is considered the "dominant" estate with the right to extract minerals subject to reasonable use of the surface. Each jurisdiction has developed and adopted its own statutes that operators must follow both prior to drilling and following drilling, including notification requirements and the obligation to provide compensation for lost land use and surface damage. The surface rights required for pipelines and facilities are generally governed by leases, easements, rights‑of‑way, permits or licenses granted by landowners or governmental authorities.
38 ENERPLUS 2016 ANNUAL INFORMATION FORM
Environmental Regulation
The Corporation is subject to the applicable municipal, provincial, state and federal environmental laws and regulations in its operating areas in both Canada and the U.S. These requirements provide for environmental protection and apply restrictions and prohibitions regarding disturbances and releases or emissions of various substances produced or utilized in association with oil and gas industry operations. Environmental laws may impose remediation obligations with respect to a property designated as a contaminated site upon certain responsible persons, which include persons responsible for the substance causing the contamination, persons who caused release of the substance and any past or present owner, tenant, or other person in possession of the site. In addition, legislation and regulation requires that well, pipeline and facility sites are abandoned and reclaimed to the satisfaction of the applicable authorities. Compliance with these requirements can involve significant expenditures. A breach of such requirements may result in the imposition of material fines and penalties, the suspension or revocation of necessary licenses and authorizations, civil liability for pollution damage or the issuance of clean‑up orders. See “Risk Factors – The Corporation's operation of oil and natural gas wells could subject it to environmental costs, claims and liabilities, as well as public opposition and activism”.
In British Columbia, energy projects may be subject to review pursuant to the provisions of the Environmental Assessment Act, which rolls the previous processes for the review of major energy projects into a single environmental assessment process that contemplates public participation in the environmental review. Other environmental protection and management measures, including reclamation, are governed by the Oil and Gas Activities Act and the Environmental Management Act.
In Alberta, the Alberta Energy Regulator (“AER”) is now the single regulator of energy development in Alberta and oversees all aspects of the regulatory process, including application and exploration, construction and development, abandonment, reclamation, and remediation activities. The AER oversees compliance with the Public Lands Act and the Mines and Minerals Act, the Water Act and the Environmental Protection and Enhancement Act by oil and gas operators and imposes penalties for violations, which may be significant.
In Saskatchewan, environmental regulation is governed by the Saskatchewan Environmental Code, which prescribes applicable levels of emissions without mandating express measures to achieve such levels. The Corporation's strives to carry out its activities and operations in compliance with all relevant and applicable Saskatchewan environmental regulations.
In 2008, the Province of British Columbia instituted a carbon tax that applies to all fuel users and producers in the province, as well as the BCCTA, which requires third party verified greenhouse gas emissions to be reported annually. See "Supplemental Operational Information – Safety and Social Responsibility – Environment". The Province of British Columbia is in discussions with stakeholders and partners of the Western Climate Initiative to develop an Emissions Trading Regulation and an Offsets Regulation under the BCCTA to price carbon and to reduce greenhouse gas emissions of regulated emitters through a regional cap and trade program. The Corporation is unable to estimate the future potential compliance costs of these pending regulations without a carbon price or an allocation of emission allowances. However, given the Corporation's current hydrocarbon production levels in British Columbia and a current price of carbon offsets in the marketplace of approximately $30 per tonne of carbon dioxide equivalent, the Corporation does not expect such costs to be material.
The Province of Alberta instituted the Climate Leadership Act in 2016 (the “Alberta Climate Leadership Act”), which imposes a carbon tax for all on-site combustion emissions. The carbon tax will be $30 per tonne of carbon dioxide equivalent emissions, and goes into effect beginning in 2023. In 2017, the Corporation will potentially be subject to increased costs due to the carbon tax coming into effect for electricity generators. In addition, the Province of Alberta has established a reduction goal of 45% for methane gas emissions by 2025, and will mandate prescriptive measures to reduce methane in methane venting equipment, which include increased fugitive leak detection inspections. This is in alignment with federal methane emissions reduction regulations that are currently in draft form. The Corporation may incur increased costs to facilities due to equipment retrofits, increased measurement and reporting work, and higher frequency of fugitive leak inspections. The Alberta Climate Leadership Act has set emission reduction targets for large emitters (e.g., 100,000 tonnes of carbon dioxide per year at a single facility). Currently, the Corporation does not operate any facility classed within this large emitter category.
The Province of Saskatchewan has passed, but not yet proclaimed, The Management and Reduction of Greenhouse Gases Act, which would require regulated emitters to report and reduce their greenhouse gas emissions below a prescribed amount below their individual baseline emission level. The Corporation does not operate any facility classed within the regulated emitter category in Saskatchewan based on the 50,000 tonne per year carbon dioxide equivalent emissions threshold.
In the United States, oil and gas operations are regulated at the federal, state, county, and tribal levels of government. At the federal level, well planning and permitting is primarily regulated by the BLM and the BIA for operations on public and tribal lands under the Federal Land Policy and Management Act and the National Environmental Policy Act. Environmental
ENERPLUS 2016 ANNUAL INFORMATION FORM 39
conservation and cultural and natural resources protection at the federal level are administered by numerous agencies under multiple statutes.
Planning, permitting and compliance related to environmental media protection and contaminants at the federal level are administered by the U.S. EPA, or by various states whose programs have been granted primacy by the U.S. EPA. The U.S. EPA governs federal legislation, including the Clean Air Act, the Clean Water Act, the Resource Conservation and Recovery Act (other than oil and gas exempt wastes), the Comprehensive Environmental Response, Compensation and Liability Act, the Oil Pollution Act, the Emergency Planning and Community Right‑to‑Know Act and the Safe Drinking Water Act and Federal Executive Orders.
The Corporation’s U.S. operations are subject to various regulations, including those relating to well permits, linear facilities, hydraulic fracturing, underground injection, and setbacks (buffers) for environmental protection, imposed by several state agencies regulating oil and gas activities. In addition to the agencies that directly regulate oil and gas operations, there are other state and local conservation and environmental protection agencies that regulate air quality, water quality, aquatic biology, wildlife, visual quality, transportation, noise, spills and incidents and transportation.
Additional regulations affecting the Corporation's U.S. operations include: (i) the Federal Implementation Plan for Oil and Natural Gas Well Production Facilities, Fort Berthold Indian Reservation (Mandan, Hidatsa, and Arikara Nations), North Dakota, and (ii) the Standards of Performance for Crude Oil and Natural Gas Production, Transmission, and Distribution. These regulations provide emission control requirements for the Corporation's U.S. assets, as well as increased monitoring, recordkeeping, reporting, and regulatory oversight.
At the request of Congress, in 2011 the U.S. EPA began research under its Plan to Study the Potential Impacts of Hydraulic Fracturing on Drinking Water Resources. The purpose of the study was to assess the potential impacts of hydraulic fracturing on drinking water resources, and to identify the driving factors that may affect the severity and frequency of such impacts. The U.S. EPA published the final report in December 2016. The report did not identify systemic or widespread impacts to groundwater from hydraulic fracturing.
The BLM, which regulates oil and gas operations located on federal and tribal lands, including the Corporation’s Fort Berthold operations, published its final hydraulic fracturing rules on March 26, 2015. Certain industry participants have objected to the proposed rules on various bases. On June 21, 2016, a federal District Court struck down the rules, concluding that the BLM had exceeded its regulatory authority with the new rules. BLM has filed an appeal to the decision, which is currently ongoing.
All U.S. states in which the Corporation operates have regulations on hydraulic fracturing disclosure. The Corporation utilizes the internet‑based chemical registry FracFocus both in Canada and the United States for posting of the required disclosure information. In the United States, FracFocus is operated by the Ground Water Protection Council, a group of state water officials, and the Interstate Oil and Gas Compact Commission, an association of oil and gas producing states. The online registry was created in 2011, in response, at least in part, to concerns from landowners about the chemical content of fracturing fluids that were being injected into oil and gas wells on their land as well as adjacent properties. FracFocus is widely accepted among the petroleum industry, and the Corporation utilizes the registry in all states and provinces in which it operates. Currently, FracFocus lists over 700 companies as registry participants.
Implementation of more stringent environmental regulations on the Corporation's U.S. operations could affect the capital and operating expenditures and plans for the Corporation's U.S. operations. The Corporation minimizes the potential of these impacts to U.S. operations in many ways, including through participation and membership in trade organizations such as North Dakota Petroleum Council, Montana Petroleum Association, Independent Petroleum Association of America and Western Energy Alliance. In addition, the Corporation participates directly in legislative hearings, rulemaking processes, meetings with state officials and local stakeholder groups, and provides both written and verbal comment on proposed legislation and regulations. As in Canada, the Corporation's U.S. operations endeavour to carry out its activities and operations in compliance with all relevant and applicable environmental regulations and good industry practice.
In July of 2014, the North Dakota Industrial Commission (“NDIC”) finalized a rule that imposes restrictions on the flaring of gas. The rule establishes gas capture rates that must be met by operators to avoid the imposition of crude oil production curtailments. These gas capture rates went into effect in October 2014 and gas capture efficiencies have increased per the regulations timeframe. The need for an operator to flare gas primarily stems from the fact that the rate of oil and gas development in North Dakota currently outpaces the construction of gas gathering and processing infrastructure. This situation is the result of various factors, including delays in obtaining right of way approvals, which is particularly cumbersome with respect to operations taking place on FBIR due to the application of additional regulatory requirements. The Corporation is working diligently with its midstream partner and the regulators to expand gas gathering capacity and increase gas capture rates. One measure being taken is the installation of NGL processing skids which are being used to extract NGLs from gas that would have otherwise been flared. See “Risk Factors - Higher than expected declines in
40 ENERPLUS 2016 ANNUAL INFORMATION FORM
production, or curtailments in the Corporation’s production due to environmental regulations, volatility in commodity prices and third party operational business practices which could have an adverse effect on results of operations and financial condition”. The Corporation received no NDIC orders to curtail crude oil production in 2016 and has consistently exceeded regulatory established gas capture rates since January 2015.
In December of 2014, NDIC adopted conditioning standards aimed at improving the safety of crude oil when transported. The regulation focuses on ensuring that produced crude oil is sufficiently conditioned at the well site to remove volatility characteristics that might pose unreasonable transportation hazards, regardless of the mode of transportation utilized. The standards, which require quarterly sampling and analysis, became effective during the second quarter of 2015. The Corporation was in compliance with these requirements in 2016.
In 2016, the U.S. EPA finalized three air quality regulations potentially affecting the Corporation. Two of the regulations are related to administrative permitting actions, which pose no additional operational costs for the Corporation. The third rule sets out additional emission control requirements for oil and gas sources. While the Corporation is now largely in compliance with these additional emission control requirements, there may be a risk of non-compliance when the rule is promulgated as final.
In addition, on November 17, 2016, BLM finalized revisions to various rules pertaining to the measurement of oil and gas and site security requirements, which had not been updated for nearly 30 years. The Corporation has been active, along with its industry partners, in these rulemaking processes and does not expect significant business impacts from these changes. BLM also finalized new rules on the venting and flaring of produced gas on November 18, 2016, which impose further limits on natural gas flaring, require additional gas leak detection and repair, as well as provide further clarification on associated royalty obligations. The rules are currently the subject of lawsuits from multiple industry organizations and governmental entities, and are expected to be addressed in late 2017. Many of the requirements set out in the rules are duplicative of existing state and U.S. EPA requirements that are already applicable to the Corporation.
After the United Nations Framework Convention on Climate Change (“UNFCCC”) meeting in Copenhagen in December 2009, the governments of the United States and Canada committed to a 17% reduction in greenhouse gas emissions by 2020 relative to a 2005 baseline. The Government of Canada is working towards this target on a sector by sector basis, but has yet to finalize regulations pertaining to the oil and gas sector. During the UNFCCC Paris 2015 meetings, the governments of the U.S. and Canada restated their commitment to emission reductions that were in-line with the targets previously set. Furthermore, a binding commitment was signed by all panel countries that set a target of no more than a two-degree Celsius warming of the earth based on greenhouse gas levels in the atmosphere. This commitment to limit warming may increase provincial, state and federal greenhouse gas regulatory rigour as country-level emissions will be reviewed periodically in subsequent meetings to assess alignment with the targets agreed upon.
In 2016, the Canadian federal government announced intentions to implement a federal carbon tax applicable to hydrocarbon combustion and methane emissions. The tax is proposed to begin in 2018 at rate of $10/tonne and would increase by $10/tonne per year to a maximum rate of $50/tonne in 2022. The rate would be paused at $30/tonne in 2020 to undergo a formal reassessment. Specifics regarding implementation and harmonization with existing provincial carbon pricing have yet to be announced. The federal plan would supersede provincial jurisdictions with less stringent or non-existent carbon reduction mechanisms, such as Saskatchewan. The federal tax would be applicable to electricity generation.
The Canadian federal government has also announced a methane reduction strategy with proposed implementation in two stages: Stage 1 (leak detection and repair, completions and compressors) in 2020 and Stage 2 (venting and pneumatics) in 2023. Although there would likely be significant costs associated with compliance, more details regarding the proposed strategy are required before impacts thereof on the Corporation’s operations can be determined.
The Corporation believes that it is, and expects to continue to be, in material compliance with applicable environmental laws and regulations and is committed to meeting its responsibilities to protect the environment wherever it operates or holds working interests. The Corporation anticipates that this compliance may result in increased costs of both a capital and expense nature as a result of increasingly stringent laws relating to the protection of the environment. The Corporation believes that it is reasonably likely that the trend in environmental legislation and regulation will continue toward stricter standards. See "Risk Factors – The Corporation's operation of oil and natural gas wells could subject it to environmental costs, claims and liabilities, as well as public opposition and activism" and "Risk Factors – Government regulations and required regulatory approvals and compliance may adversely impact the Corporation's operations and result in increased operating and capital costs".
ENERPLUS 2016 ANNUAL INFORMATION FORM 41
Worker Safety
The Corporation’s oilfield operations must be carried out in accordance with safe work procedures, rules and policies contained in applicable safety legislation. Such legislation requires that every employer ensures the health and safety of all persons at any of its work sites and all workers engaged in the work of that employer. The legislation, which provides for incident reporting procedures, also requires that every employer ensure that all of its employees are aware of their duties and responsibilities under the applicable legislation. Penalties under applicable occupational health and safety legislation include significant fines and incarceration. The Corporation is currently in compliance with applicable safety legislation.
42 ENERPLUS 2016 ANNUAL INFORMATION FORM
Risk Factors
The following risk factors, together with other information contained in this Annual Information Form, should be carefully considered before investing in the Corporation. Each of these risks may negatively affect the trading price of the Common Shares or the amount of dividends that may, from time to time and at the discretion of the Corporation's board of directors, be declared and paid by the Corporation to its shareholders. As stated above, references to “natural gas” refer to both natural gas and shale gas, unless otherwise specified.
Low or volatile oil and natural gas prices could have a material adverse effect on the Corporation's results of operations and financial condition.
The Corporation's results of operations and financial condition are dependent on the prices it receives for the oil and natural gas it produces and sells. Oil and natural gas prices have fluctuated widely during recent years and may continue to be volatile in the future. Oil and natural gas prices have decreased significantly since mid-2014 and have fluctuated in response to a variety of factors beyond the Corporation's control, including: (i) global energy supply and demand, production and policies, including the ability of OPEC to set, maintain, and reduce production levels in order to influence prices for oil; (ii) political conditions, including the risk of hostilities in the Middle East and global terrorism; (iii) global and domestic economic conditions, including currency fluctuations; (iv) the level of consumer demand, including demand for different qualities and types of crude oil and liquids; (v) the production and storage levels of North American natural gas and crude oil and the supply and price of imported oil and liquefied natural gas; (vi) weather conditions; (vii) the proximity of reserves and resources to, and capacity of, transportation facilities and the availability of refining and fractionation capacity; (viii) the ability, considering regulation, taxation, and market demand, to export oil and liquefied natural gas and NGLs from North America; (ix) the effect of world‑wide energy conservation and greenhouse gas reduction measures and the price and availability of alternative fuels; and (x) existing and proposed changes to government regulations. Oil and natural gas producers in North America currently receive significantly discounted prices for some of their production due to regional constraints on the ability to transport and sell such production to international markets. Additionally, limited natural gas and NGLs processing capacity may result in producers not realizing the full price for liquids associated with their natural gas production. A failure to resolve such constraints may result in continued reduced commodity prices received by oil and natural gas producers such as the Corporation.
Further declines in crude oil and/or natural gas prices, or prolonged continuation of the current low commodity price environment, may have a material adverse effect on the Corporation's operations, financial condition, borrowing ability, levels of reserves and resources and the level of expenditures for the development of the Corporation's oil and natural gas reserves or resources. Certain oil or natural gas wells may become or remain uneconomic to produce if commodity prices are low, thereby impacting the Corporation's production volumes, or its desire to market its production in unsatisfactory market conditions. Alternatively, due to regulatory or contractual obligations, the Corporation may be required to develop certain properties in order to fulfill its obligations despite unsatisfactory market conditions for marketing of any production therefrom, increasing the risk of financial losses. Furthermore, the Corporation may be subject to the decisions of third party operators who, independently and using different economic parameters than the Corporation, may decide to curtail or shut in production.
An increase in capital or operating costs could have a material adverse effect on results of operations and financial condition.
Higher capital or operating costs associated with the Corporation's operations will directly impact our capital efficiencies and/or decrease the amount of the Corporation's cash flow, which could result in a lower price of its Common Shares. Capital costs of completions, specifically the costs of proppant, and operating costs such as electricity, chemicals, supplies, energy services and labour costs, are a few of the Corporation's costs that are susceptible to material fluctuation. Although the Corporation has a portion of its 2017 capital and operating costs protected with existing agreements, changing regulatory conditions, such as those in the United States requiring that certain raw materials, including steel, for United States businesses be sourced from the United States, may result in higher than expected supply costs on a portion of the Corporation’s costs.
The Corporation may be unable to compete successfully with other organizations in the oil and natural gas industry, or obtain required vendor services to compete.
The oil and natural gas industry is highly competitive. The Corporation competes for capital, acquisitions of reserves and/or resources, undeveloped lands, skilled personnel, access to drilling rigs, service rigs and other equipment, access to processing facilities, pipeline and refining capacity, as well as many other services, and, in many other respects, with a substantial number of other organizations, many of which may have greater technical and financial resources than the Corporation. Some of these organizations not only explore for, develop and produce oil and natural gas, but also conduct refining operations and market oil and other products on a world‑wide basis. As a result of these complementary activities,
ENERPLUS 2016 ANNUAL INFORMATION FORM 43
some of the Corporation's competitors may have greater and more diverse resources to draw upon. Also, organizations that have complementary activities, or are integrated, may have access to, or be able to access, services or vendors that the Corporation is not able to access, thereby limiting its ability to compete.
The Corporation may be at a competitive disadvantage to other industry participants, such as pension resource corporations, U.S. flow‑through entities, such as master limited partnerships and limited liability companies, and U.S. or other foreign corporations that are able to minimize Canadian tax through the use of inter‑company debt and cross‑border tax planning measures, or who have access to a lower cost of capital.
Higher than expected declines in production, or curtailments in the Corporation’s production due to environmental regulations, volatility in commodity prices and third party operational business practices could have an adverse effect on results of operations and financial condition.
The Corporation may also be required to curtail or shut-in production, which could damage a reservoir and potentially prevent the Corporation from achieving production and operating levels that were in place prior to the curtailment or shutting-in of the reservoir.
These lower levels of production could result in a material reduction to the Corporation’s cash flow, or may result in the Corporation incurring additional operating and capital costs for the well(s) to achieve prior production levels. With regard to curtailment, although regional pipeline capacity has increased over the past several years, sales gas infrastructure capacity in northeastern Pennsylvania remains constrained relative to the amount of natural gas that can be produced. Combined with the ongoing volatility in natural gas prices, the Corporation may continue to be subject to discounted prices and, therefore, the risk of potential production curtailments due to price remains.
Debt covenants of the Corporation may be exceeded with no ability to negotiate covenant relief.
Further declines in, or continued low oil and natural gas prices may result in a significant reduction in earnings or cash flow, which could lead the Corporation to increase drawn amounts under the Bank Credit Facility in order to carry out its operations and fulfill its obligations. Significant reductions to cash flow, significant increases in drawn amounts under the Bank Credit Facility, or significant reductions to proved reserves may result in the Corporation breaching its debt covenants under the Credit Facilities. If a breach occurs, there is a risk that the Corporation may not be able to negotiate covenant relief with one or more of its lenders under the Credit Facilities. Failure to comply with debt covenants or negotiate relief may result in the Corporation’s indebtedness under the Credit Facilities becoming immediately due and payable, which may have a material adverse effect on the Corporation’s operations and financial condition.
The Corporation's Credit Facilities and any replacement credit facility may not provide sufficient liquidity.
Although the Corporation believes that its existing Credit Facilities are sufficient, there can be no assurance that the current amount will continue to be available or will be adequate for the financial obligations of the Corporation or that additional funds can be obtained as required or on terms which are economically advantageous to the Corporation. The amounts available under the Credit Facilities may not be sufficient for future operations, or the Corporation may not be able to renew its Bank Credit Facility or obtain additional financing on attractive economic terms, if at all. The Bank Credit Facility is generally available on a three year term, extendable each year with a bullet payment required at the end of three years if the facility is not renewed. The Corporation renewed its Bank Credit Facility in 2016 and, accordingly, it currently expires on October 31, 2019. There can be no assurance that such a renewal will be available on favourable terms or that all of the current lenders under the facility will renew at their current commitment levels. If this occurs, the Corporation may need to obtain alternate financing. Any failure of a member of the lending syndicate to fund its obligations under the Bank Credit Facility or to renew its commitment in respect of such Bank Credit Facility, or failure of the Corporation to obtain replacement financing or financing on favourable terms, may have a material adverse effect on the Corporation's business and operations. In addition, dividends to shareholders may be eliminated, as repayment of debt under the Credit Facilities has priority over dividend payments by the Corporation to its shareholders.
During 2016, the Corporation made aggregate principal repayments on Senior Unsecured Notes of US$267 million, at a discount. The Corporation did not have principal repayments due during 2016; however, the Corporation will be required to repay US$22 million in five equal annual installments, beginning in June of 2017, as part of the Corporation’s scheduled principal repayments on its Senior Unsecured Notes. See “Description of Capital Structure – Senior Unsecured Notes” for repayment terms on existing Senior Unsecured Notes. The repayment of the Senior Unsecured Notes may require the Corporation to obtain additional financing, which may not be available or may be available on unfavourable terms.
44 ENERPLUS 2016 ANNUAL INFORMATION FORM
The Corporation is subject to risk of default by the counterparties to the Corporation's contracts.
The Corporation is subject to the risk that counterparties to its risk management contracts, marketing arrangements, and operating agreements, as well as other suppliers of products and services, may default on their obligations under such agreements, arrangements, or programs, including as a result of liquidity requirements or insolvency. Furthermore, low oil and natural gas prices increase the risk of bad debts related to the Corporation's joint venture and industry partners. A failure by such counterparties to make payments or perform their operational or other obligations to the Corporation may adversely affect the results of operations, cash flows and financial position of the Corporation.
Delays in payment for business operations could adversely affect the Corporation.
In addition to the usual delays in payment by purchasers of oil and natural gas to the Corporation or to the operators of the Corporation's properties (and the delays of those operators in remitting payment to the Corporation), payments between any of these parties may also be delayed by, among other things: (i) capital or liquidity constraints experienced by such parties, including restrictions imposed by lenders; (ii) accounting delays or adjustments for prior periods; (iii) delays in the sale or delivery of products or delays in the connection of wells to a gathering system; (iv) weather related delays, such as freeze‑offs, flooding and premature thawing; (v) blow‑outs or other accidents; or (vi) recovery by the operator of expenses incurred in the operation of the properties or the establishment by the operator of reserves for these expenses.
Any of these delays could reduce the amount of the Corporation's cash flow and the payment of cash dividends to its shareholders in a given period and expose the Corporation to additional third party credit risks.
The Corporation's actual reserves and resources will vary from its reserves and resources estimates, and those variations could be material.
The value of the Common Shares depends upon, among other things, the reserves and resources attributable to the Corporation's properties. The actual reserves and resources contained in the Corporation's properties will vary from the estimates summarized in this Annual Information Form and those variations could be material. Estimates of reserves and resources are by necessity projections, and thus are inherently uncertain. The process of estimating reserves or resources requires interpretations and judgments on the part of petroleum engineers, resulting in imprecise determinations, particularly with respect to new discoveries. Different engineers may make different estimates of reserves or resources quantities and revenues attributable thereto based on the same data. Ultimately, actual reserves and resources attributable to the Corporation's properties will vary and be revised from current estimates, and those variations and revisions may be material. The reserves and resources information contained in this Annual Information Form is only an estimate. A number of factors are considered and a number of assumptions are made when estimating reserves and resources, such as, among others described in this Annual Information Form: (i) historical production in the area compared with production rates from similar producing areas; (ii) future commodity prices, production and development costs, royalties and planned capital expenditures; (iii) initial production rates and production decline rates; (iv) ultimate recovery of reserves and resources and the success of future exploitation activities; (v) marketability of production; and (vi) the effects of government regulation and other government royalties or levies, such as environmental costs, that may be imposed over the producing life of reserves and resources.
Reserves and resources estimates are based on the relevant factors, assumptions and prices on the date the evaluations were prepared. Many of these factors are subject to change and are beyond the Corporation's control. If these factors, assumptions and prices prove to be inaccurate, the Corporation's actual reserves and resources could vary materially from its estimates. Additionally, all such estimates are, to some degree, uncertain, and classifications of reserves and resources are only attempts to define the degree of uncertainty involved. For these reasons, estimates of the economically recoverable quantities of oil and natural gas, the classification of such reserves and resources based on risk of recovery and associated contingencies, and the estimates of future net revenues expected therefrom, prepared by different engineers or by the same engineers at different times, may vary substantially.
Estimates with respect to reserves and resources that may be developed and produced in the future are often based upon volumetric or probabilistic calculations and upon analogy to similar types of reserves or resources, rather than upon actual production history. Estimates based on these methods generally are less reliable than those based on actual production history. Subsequent evaluation of the same reserves or resources based upon production history may result in variations or revisions in the estimated reserves or resources, and any such variations or revisions could be material.
Reserves and resources estimates may require revision based on actual production experience. Such figures have been determined based upon assumed oil, natural gas and NGLs prices and operating costs. Market price fluctuations of commodity prices may render uneconomic the recovery of certain categories of petroleum or natural gas. Moreover, short‑term factors may impair the economic viability of certain reserves or resources in any particular period. With commodity prices remaining at current levels, or further declining, there remains a risk for additional write-downs under U.S.
ENERPLUS 2016 ANNUAL INFORMATION FORM 45
GAAP. See “Risk Factors – Lower oil and gas prices and higher costs increase the risk of write-downs of the Corporation’s oil and gas properties and deferred tax assets”. Additional write-downs may lead to the Corporation breaching its covenants under the Bank Credit Facility, and the Corporation may not be able to negotiate any covenant relief. See "Risk Factors – Debt covenants of the Corporation may be exceeded with no ability to negotiate covenant relief.”
Lower oil and gas prices and higher costs increase the risk of write‑downs of the Corporation's oil and gas properties and deferred tax assets.
Under U.S. GAAP, the net capitalized cost of oil and gas properties, net of deferred income taxes, is limited to the present value of after‑tax future net revenue from proved reserves, discounted at 10%, and based on the unweighted average of the closing prices for the applicable commodity on the first day of the twelve months preceding the issuer's fiscal quarter and annual fiscal periods. The amount by which the net capitalized costs exceed the discounted value will be charged to net income.
Under U.S. GAAP, the net deferred tax assets of a corporation is limited to the estimate of future taxable income resulting from existing properties. The Corporation estimates future taxable income based on before‑tax future net revenue from proved reserves, undiscounted, using December 30, 2016 benchmark forward prices for 2017, held constant, and adjusted for other significant items affecting taxable income. The amount by which the gross deferred tax assets exceed the estimate of future taxable income will be charged to net income.
As the ceiling test is based on trailing twelve month actual prices, which have declined since mid-2014, the Corporation incurred non-cash property impairments of approximately $301.2 million (before tax) in 2016. Under U.S. GAAP, a previously recorded valuation allowance can be reversed if the estimate of future taxable income increases. In 2016, the benchmark forward prices increased from 2015; therefore, the Corporation had a non-cash recovery of $266.9 million on the reversal of a portion of the valuation allowance recorded in 2015.
With commodity prices remaining at current levels, or further declining, there remains a risk for additional write-downs under U.S. GAAP. While these write‑downs would not affect cash flow, the charge to earnings may be viewed unfavourably in the market. With commodity prices remaining at current levels, or further declining, there remains a risk for additional write-downs under U.S. GAAP.
Additional write-downs may lead to the Corporation breaching its covenants under the Credit Facilities, and the Corporation may not be able to negotiate any covenant relief. See "Risk Factors – Debt covenants of the Corporation may be exceeded with no ability to negotiate covenant relief.”
Since a portion of the Corporation's properties are not operated by the Corporation, results of operations may be adversely affected by the failure of third party operators.
The continuing production from a property, and to some extent the marketing of that production, is dependent upon the abilities of the operators of the Corporation's properties. In 2016, approximately 47% of the Corporation's production was from properties operated by third parties. This results in significant reliance on third party operators in both the operation and development of such properties and control over capital expenditures relating thereto. The timing and amount of capital required to be spent by the Corporation may differ from the Corporation's expectations and planning, and may impact the ability of and/or cost to the Corporation to finance such expenditures, as well as adversely affect other parts of the Corporation's business and operations. To the extent a third party operator fails to perform its duties properly, faces capital or liquidity constraints or becomes insolvent, the Corporation's results of operations will be negatively impacted.
Further, the operating agreements governing the properties not operated by the Corporation typically require the operator to conduct operations in a good and "workmanlike" manner. These operating agreements generally provide, however, that the operator has no liability to the other non‑operating working interest owners for losses sustained or liabilities incurred, except for liabilities that may result from the operator’s gross negligence or wilful misconduct.
The Corporation's risk management activities, as well as ongoing regulatory changes affecting financial institutions, could expose it to losses.
The Corporation may use financial derivative instruments and other hedging mechanisms to limit a portion of the adverse effects resulting from volatility in natural gas and oil commodity prices. To the extent the Corporation hedges its commodity price and foreign exchange exposure, it may forego the benefits it would otherwise experience if commodity prices were to increase or if the Canadian dollar were to weaken relative to the U.S. dollar. In addition, the Corporation's commodity and foreign exchange hedging activities, and changing bank regulations that may limit market liquidity in the commodity markets, could expose it to losses. These losses could occur under various circumstances, including if the other party to the Corporation's hedge does not perform its obligations under the hedge agreement. The Corporation has also entered into
46 ENERPLUS 2016 ANNUAL INFORMATION FORM
hedging arrangements to settle future payments under its equity‑based long term incentive programs, which could result in the Corporation suffering losses to the extent the hedged costs of such arrangements exceed the actual costs that would otherwise be payable at the time of settlement.
The Corporation may require additional financing to maintain and/or expand its assets and operations.
In the normal course of making capital investments to maintain and/or expand the Corporation's oil, NGLs and natural gas reserves and resources, additional Common Shares or other securities of the Corporation may be issued, which may result in a decline in production per share and reserves and/or resources per share. Additionally, from time to time, the Corporation may issue Common Shares or other securities from treasury in order to reduce debt, complete acquisitions and maintain a more optimal capital structure. The Corporation may also divest of existing properties or assets as a means of financing alternative projects or developments. To the extent that external sources of capital, including the availability of debt financing from banks or other creditors or the issuance of additional Common Shares or other securities, become limited, unavailable or available on less favourable terms, the Corporation's ability to make the necessary capital investments to: (i) retain leases, (ii) carry out its operations, and/or (iii) maintain and/or expand its oil, NGLs and natural gas reserves and resources could be adversely affected. To the extent that the Corporation is required to use additional cash flow to finance capital expenditures or property acquisitions, or to pay debt service charges or to reduce debt, the level of cash that may be available for the Corporation to pay dividends to its shareholders may be reduced.
Lack of adequately developed infrastructure, and the impact of special interest groups on such development, may result in a decline in the Corporation's ability to market oil and natural gas production.
The Corporation's business depends in part upon the availability, proximity, and capacity of oil and natural gas gathering systems, pipelines and/or rail transportation systems and processing facilities to provide access to markets for its production. Canadian federal and provincial, as well as U.S. federal and state, regulation of oil and gas production, processing and transportation, could adversely affect the Corporation's ability to produce and market oil and natural gas. Special interest groups could also oppose infrastructure development resulting in a delay, or even the cancellation of the required infrastructure, further impeding the Corporation’s ability to produce and market its products. In addition, the assets of the Corporation are concentrated in regions with varying levels of government regulations, or under local or tribal rules that could result in the imposition of a limit or ban on shipping of commodities by truck, pipeline or rail.
Oil and Natural Gas Gathering Systems
As new resource plays are developed, they generally experience a sharp increase in the volume of oil and natural gas production being produced in the area, which could exceed government regulated gas capture requirements, or the existing capacity of the various gathering system infrastructure. The Corporation relies on the timely construction of adequate gathering systems that allow its crude oil and natural gas production to be transported from the wellhead to existing and/or new sales infrastructure systems, such as pipelines or rail terminals.
The pace at which midstream companies are able to construct adequate gathering infrastructure to allow for the required capture of natural gas production associated with the development of crude oil properties may have an impact on the Corporation’s ability to increase crude oil production in the region. Additionally, as exploration and drilling on the Corporation's properties increases, the amount of natural gas being produced by the Corporation and others could exceed the capacity of the various gathering pipelines available in those areas. If these constraints remain unresolved, the Corporation's ability to transport its production to sales pipelines in these regions may be impaired and could adversely impact the Corporation's production volumes or realized prices in these areas.
In Western Canada, concerns over the integrity and safety of certain aging natural gas gathering and sales pipelines resulted in an order by Canadian regulators for a major pipeline company to reduce the maximum operating pressure of certain lateral connections onto sales pipelines in order to conduct safety inspections of these gathering pipelines within Alberta. This regulatory order temporarily reduced the amount of firm natural gas transportation service available in certain areas of Western Canada until safety inspections were concluded and any safety risks were subsequently corrected. This work is expected to continue over a number of years resulting in the ongoing risk of reduced production volumes within the affected regions until the safety issues, if any, are properly mitigated by the pipeline operators.
Sales Pipelines and Rail Transportation Systems
Oil and natural gas producers in North America, and particularly in Canada and in the Marcellus region of the United States, currently receive significantly discounted prices relative to benchmark prices for their production due to constraints on the ability to transport and sell such production to domestic and international markets. While the third party pipeline and railroad companies generally expand capacity to meet market needs, there can be differences in timing between the growth of production and the growth of sales pipeline and rail capacity. This is currently the case with natural gas sales pipelines in
ENERPLUS 2016 ANNUAL INFORMATION FORM 47
Alberta, British Columbia and Pennsylvania, as well as on a number of proposed crude oil pipeline expansion projects in Western Canada and the United States. Unfavourable economic conditions or financing terms, as well as significant delays in the regulatory approval process, may defer or prevent the completion of certain pipeline projects, gathering systems or railway projects that are planned for such areas. Also, there may be operational or economic reasons, including but not limited to maintenance activities, for curtailing transportation capacity. Accordingly, there can be periods where transportation capacity is insufficient to accommodate all of the production from a given region, causing added expense and/or volume curtailments for all shippers. To the extent that the transportation capacity becomes insufficient in areas where the Corporation operates, the Corporation may have to defer the development of, curtail production from or shut-in wells awaiting a pipeline connection or other available transportation capacity, and/or sell its production at lower prices than it would otherwise realize or it had projected to realize. This would adversely affect the Corporation's results of, and cash flow from, operations.
The Corporation transports its crude oil production by a diverse mix of pipeline, rail (after title is transferred to buyer’s name) and trucking transportation, all subject to various risks of cost escalation and new costs. In certain regions the Corporation is currently dependent upon only one means of transportation. With respect to rail transportation, there may be future incremental costs associated with transporting, and there is a risk that access to rail transport may be constrained, depending upon changes made to existing rail transport regulations. More stringent government regulations concerning the usage of certain types of tank cars that transport crude oil and NGLs by rail in Canada and the United States have been enacted, and this could increase the cost of utilizing rail to transport crude oil and/or NGLs. In addition, oil and natural gas volumes being shipped by pipelines are required to meet certain quality specifications, which vary by pipeline. Should crude oil or natural gas quality specifications fail to be met by a producer that is shipping volumes on a pipeline, the pipeline could shut down or curtail volumes of other producers shipping on that pipeline. Any shut down or curtailment on pipelines shipping volumes of the Corporation’s production may impact the Corporation’s ability to reach its intended market, or deliver fully on its obligations.
Access to Processing Facilities
NGLs production requires processing at fractionation facilities in order to separate the liquids stream into individual saleable products. The Corporation and the industry as a whole rely on the addition of adequate fractionation capacity to ensure the timely and economic processing of its liquids and the continued production of its crude oil and natural gas associated with those liquids. Limited natural gas processing capacity in certain regions may result in producers not realizing the full price for NGLs associated with their natural gas production.
A failure to resolve any of the constraints described above may result in shut‑in production or continued reduced commodity prices received by the Corporation and other oil and natural gas producers.
Fluctuations in foreign currency exchange rates could adversely affect the Corporation's business.
The price that the Corporation receives for a majority of its oil and natural gas is based on U.S.‑dollar denominated benchmarks and, therefore, the price that the Corporation receives in Canadian dollars is affected by the exchange rate between the two currencies. Should there be a material increase in the value of the Canadian dollar relative to the U.S. dollar, it may negatively impact the Corporation's net production revenue by decreasing the Canadian dollars the Corporation receives for a given sale in U.S. dollars, while offering limited relief to the Corporation's cost structure, when its costs are incurred in Canadian dollars. However, the Corporation’s business and operations in Canada and the United States have contracts that are linked to the U.S. dollar and, therefore, the Corporation is exposed to foreign currency risk on both revenues and costs. The value of the Canadian dollar has decreased significantly compared to the U.S. dollar since mid-2014 and may decrease further in the future. In addition, the Corporation has U.S.-dollar denominated Senior Unsecured Notes and is exposed to increased foreign currency risk should the Canadian dollar weaken further against the U.S. dollar. The Corporation may from time‑to‑time use derivative instruments to manage a portion of its foreign exchange risk, as described in Note 15(b) to the Corporation's audited consolidated financial statements for the year ended December 31, 2016.
Regulatory requirements may impede the Corporation’s ability to divest properties.
Recent regulatory changes in Alberta and Saskatchewan have increased the minimum corporate liability rating required of purchasers of oil and natural gas properties. As a result, the potential number of parties able to acquire the Corporation’s non-core assets has been reduced, the Corporation may not be able to realize full value for such assets, or transactions may involve greater risk and complexity.
48 ENERPLUS 2016 ANNUAL INFORMATION FORM
The Corporation may not realize the anticipated benefits of its acquisitions or divestments.
From time to time, the Corporation may acquire additional oil and natural gas properties and related assets. Achieving the anticipated benefits of such acquisitions will depend in part on successfully consolidating functions and integrating operations, procedures and personnel in a timely and efficient manner, as well as the Corporation's ability to realize the anticipated growth opportunities and synergies from combining and integrating the acquired assets and properties into the Corporation's existing business. These activities will require the dedication of substantial management effort, time and capital and other resources, which may divert management's focus, capital and other resources from other strategic opportunities and operational matters during this process. The integration process may result in the loss of key employees and the disruption of ongoing business, customer and employee relationships that may adversely affect the Corporation's ability to achieve the anticipated benefits of future acquisitions. The risk factors set forth in this Annual Information Form relating to the oil and natural gas business and the operations, reserves and resources of the Corporation apply equally in respect of any future properties or assets that the Corporation may acquire. The Corporation generally conducts certain due diligence in connection with acquisitions, but there can be no assurance that the Corporation will identify all of the potential risks and liabilities related to the subject properties.
When acquiring assets, the Corporation is subject to inherent risks associated with predicting the future performance of those assets. The Corporation makes certain estimates and assumptions respecting the prospectivity and characteristics of the assets it acquires, which may not be realized over time. As such, assets acquired may not possess the value the Corporation attributed to them, which could adversely impact the Corporation's cash flows. To the extent that the Corporation makes acquisitions with higher growth potential, the higher risks often associated with such potential may result in increased chances that actual results may vary from the Corporation's initial estimates. An initial assessment of an acquisition may be based on a report by engineers or firms of engineers that have different evaluation methods, approaches and assumptions than those of the Corporation's engineers, and these initial assessments may differ significantly from the Corporation's subsequent assessments.
Furthermore, potential investors should be aware that certain acquisitions, and in particular acquisitions of higher risk/higher growth assets and the development of those acquired assets, may require capital expenditures from the Corporation, and the Corporation may not receive cash flow from operations from these acquisitions for several years or may receive cash flow in an amount less than anticipated. Accordingly, the timing and amount of capital expenditures may adversely affect the Corporation's cash flow.
The Corporation may also from time to time seek to divest of properties and assets. These divestments may consist of non‑core properties or assets, or may consist of assets or properties that are being monetized to fund debt repayment, alternative projects, or development by the Corporation. There can be no assurance that the Corporation will be successful in such divestments, or realize the amount of desired proceeds from such divestments, or that such divestments will be viewed positively by the financial markets, and such divestments may negatively affect the Corporation's results of operations or the trading price of the Common Shares. In addition, although divestments typically transfer future obligations to the buyer, the Corporation may not be exempt from certain obligations in the future, including for example, abandonment and reclamation obligations, which may have an adverse effect on the Corporation’s operations and financial condition.
The Corporation may lose its current status as a "foreign private issuer" in the United States, which may result in additional compliance costs and restricted access to capital markets.
The Corporation is required to assess its "foreign private issuer" status under U.S. securities laws on an annual basis at the end of its second quarter. If the Corporation were to lose its status as a "foreign private issuer" under U.S. securities laws and be required to fully comply with both U.S. and Canadian securities and accounting requirements applicable to domestic issuers in each country, it may incur additional general and administrative compliance costs and may have restricted access to capital markets for a period of time until it has the required approvals in place from the SEC.
Government regulations and required regulatory approvals and compliance may adversely impact the Corporation's operations and result in increased operating and capital costs.
The oil and gas industry operates under federal, provincial, state and municipal legislation and regulation governing such matters as royalties, land tenure, prices, production rates, various environmental protection controls, well and facility design and operation, income, the exportation of crude oil, natural gas and other products, as well as other matters. The industry is also subject to regulation by governments in such matters as the awarding or acquisition of exploration and production rights, the imposition of specific drilling obligations, control over the development and abandonment of fields (including restrictions on production), and possibly expropriation or cancellation of contract rights. See "Industry Conditions". To the extent that the Corporation fails to comply with applicable government regulations or regulatory approvals, the Corporation may be subject to compliance and enforcement actions that are either remedial, which are intended to fix the noncompliance
ENERPLUS 2016 ANNUAL INFORMATION FORM 49
and any related impacts, or punitive, which are intended to deter future noncompliance. Such actions include fines or fees, notices of noncompliance, warnings, orders, administrative sanctions, and prosecution.
Government regulations may be changed from time to time in response to economic or political conditions. Additionally, the Corporation's entry into new jurisdictions and its adoption of new technology may attract additional regulatory oversight which could result in higher costs or require changes to proposed operations. For example, U.S. federal and state governments have increased their scrutiny of the usage and disposal of chemicals and water used in fracturing procedures in the oil and gas industry, while certain states, such as New York, have called for bans on oil and gas drilling using hydraulic fracturing. Similarly, Canadian regulatory bodies have enhanced their oversight of and reporting obligations associated with fracturing procedures. More activity by the Corporation on Indian lands, such as the current activity in North Dakota, may also increase compliance obligations under local or tribal rules. The exercise of discretion by governmental authorities under existing regulations, the implementation of new regulations or the modification of existing regulations affecting the crude oil and natural gas industry could negatively impact the development of oil and gas properties and assets, reduce demand for crude oil and natural gas or impose increased costs on oil and gas companies, any of which could have a material adverse impact on the Corporation.
Additionally, various levels of Canadian and U.S. governments are considering, or have implemented, legislation to reduce emissions of greenhouse gases, including volatile organic compounds. See "Industry Conditions – Environmental Regulation" for a description of these initiatives. Because the Corporation's operations emit various types of greenhouse gases, such new legislation or regulation could increase the costs related to operating and maintaining the Corporation's facilities, and could require it to install new emission controls on its facilities, acquire allowances for its greenhouse gas emissions, pay taxes, fees and other penalties related to its greenhouse gas emissions, and administer and manage a greenhouse gas emissions program. Currently, the Corporation is not able to estimate such increased costs; however, they could be material. Any of the foregoing could have adverse effects on the Corporation's business, financial position, results of operations and prospects.
The Corporation's operation of oil and natural gas wells could subject it to environmental costs, claims and liabilities, as well as public opposition and activism.
General
The oil and natural gas industry elicits concerns over climate change, as well as general public opposition to the industry. As a result, industry participants may be subject to increased public activism, as well as extensive environmental regulation pursuant to local, provincial, and federal legislation in Canada and federal and state laws and regulations in the United States. Activist activity, or the Corporation’s default under applicable legislation, may result in increased costs due to delays or damage and, for breaches, the imposition of fines or the issuance of "clean up" orders. Legislation regulating the industry may be changed to impose higher standards and potentially more costly obligations, such as legislation that would require significant reductions in greenhouse gas emissions. Failure to comply with such regulations and laws can result in significant increases in costs, penalties or loss of operating licenses. Further, the business of exploration, development and production of oil and natural gas wells and facilities is subject to the risks and hazards associated with such operations. These include, but are not limited to, blowouts, fire, explosion, environmental releases (including sour gas), and other safety hazards, which could result in significant damage to the Corporation’s property, personal injury, loss of life and liability to regulators or third parties. Although the actual form such legislation or regulation may take is largely currently unknown, the implementation of more stringent environmental legislation or regulatory requirements may result in additional costs for oil and natural gas producers such as the Corporation, and such costs may be significant.
The Corporation is not fully insured against certain environmental risks, either because such insurance is not available or because of high premium costs. In particular, insurance against risks from environmental pollution occurring over time (as opposed to sudden and catastrophic damages) is not available on economically reasonable terms. Accordingly, the Corporation's properties may be subject to liability due to hazards that cannot be insured against, or that have not been insured against due to prohibitive premium costs or for other reasons.
The Corporation does not establish a separate reclamation fund for the purpose of funding its estimated future environmental and reclamation obligations. The Corporation cannot assure investors that it will be able to satisfy its future environmental and reclamation obligations. Any site reclamation or abandonment costs incurred in the ordinary course, in a specific period, will be funded out of cash flows and, therefore, will reduce the amounts that may be available for development of projects and resources, debt repayments, or as available cash for dividends to shareholders. Should the Corporation be unable to fully fund the cost of remedying an environmental claim, the Corporation might be required to suspend operations or enter into interim compliance measures pending completion of the required remedy.
50 ENERPLUS 2016 ANNUAL INFORMATION FORM
Risks Relating to Fracturing
The Corporation utilizes horizontal drilling, multi‑stage hydraulic fracturing, specially formulated drilling fluids and other technologies in connection with its drilling and completion activities. There has been public concern over the hydraulic fracturing process. Most of these concerns have raised questions regarding the drilling fluids used in the fracturing process, their effect on fresh water aquifers, the use of water in connection with completion operations, the ability of such water to be recycled, and induced seismicity associated with fracturing. The U.S. and Canadian federal governments and certain U.S. state and Canadian provincial governments are currently reviewing certain aspects of the scientific, regulatory and policy framework under which hydraulic fracturing operations are conducted. At present, most of these governments are primarily engaged in the collection, review and assessment of technical information regarding the hydraulic fracturing process and, with the exception of increased chemical disclosure requirements in certain of the jurisdictions in which the Corporation operates, have not provided specific details with respect to any significant actual, proposed or contemplated changes to the hydraulic fracturing regulatory construct. However, certain environmental and other groups have suggested that additional federal, provincial, territorial, state and municipal laws and regulations may be needed to more closely regulate the hydraulic fracturing process, and have made claims that hydraulic fracturing techniques are harmful to surface water and drinking water sources and may contribute to earthquake activity particularly where in proximity to pre‑existing faults. Further, certain governments in jurisdictions where the Corporation does not currently operate have considered a temporary moratorium on hydraulic fracturing until further studies can be completed and some governments have adopted, and others have considered adopting, regulations that could impose more stringent permitting, disclosure and well construction requirements on hydraulic fracturing operations.
It is anticipated that federal, provincial and state regulatory frameworks to address concerns related to hydraulic fracturing will continue to emerge. While the Corporation is unable to predict the impact of any potential regulations upon its business, the implementation of new laws, regulations or permitting regulations with respect to water usage or disposal, or hydraulic fracturing generally could increase the Corporation's costs of compliance, operating costs, the risk of litigation and environmental liability, or negatively impact the Corporation's production and prospects, any of which may have a material adverse effect on the Corporation's business, financial condition and results of operations.
The Corporation's expanding portfolio of growth‑oriented projects in recent years may expose it to increased operational and financial risks.
The Corporation’s participation in projects that are more exploration‑oriented in nature than the Corporation has historically participated in, increases the risk that the Corporation's expenditures on land, seismic and drilling may not provide economic returns. To the extent the Corporation acquires properties or assets with a higher exploration risk profile, the risk associated with such acquisitions and the future development of those assets has greater uncertainty.
Changes in laws, including those affecting tax, royalties and other financial matters, and interpretations of those laws, may adversely affect the Corporation and its securityholders.
Tax laws, including those that may affect the taxation of the Corporation, or other laws or government incentive programs relating to the oil and gas industry, may be changed, or interpreted in a manner that adversely affects the Corporation and its securityholders. Canadian, U.S. and foreign tax authorities and applicable tax treaties having jurisdiction over the Corporation (whether as a result of the Corporation's operations or financing structures) may change or interpret applicable tax laws or treaties or administrative positions in a manner which is detrimental to the Corporation or its securityholders. Tax authorities may disagree with how the Corporation calculates its income for tax purposes. The Corporation may be subject to additional taxation (direct or indirect, including carbon tax, goods and services tax, or sales tax), levies or royalty payments imposed by government and tribal authorities that have jurisdiction over its properties. The Corporation has income and other tax filings that are subject to audit and potential reassessment which may impact the Corporation's tax liability. The Corporation believes appropriate provisions for current and deferred income taxes have been made in its financial statements; however, it is difficult to predict the outcome of audit findings by tax authorities. These findings may increase the amount of its tax liabilities and be detrimental to the Corporation.
The Corporation may be unable to add or develop additional reserves or resources.
The Corporation adds to its oil and natural gas reserves primarily through acquisitions and ongoing development of its existing reserves and resources, together with certain exploration activities. As a result, the level of the Corporation's future oil and natural gas reserves is highly dependent on its success in developing and exploiting its reserves and resources base and acquiring additional reserves and/or resources through purchases or exploration. Exploitation, exploration and development risks arise for the Corporation and, as a result, may affect the value of the Common Shares and dividends to shareholders due to the uncertain results of searching for and producing oil and natural gas using imperfect scientific methods. Additionally, if capital from external sources is not available or is not available on commercially advantageous terms, the Corporation's ability to make the necessary capital investments to maintain, develop or expand its oil and natural
ENERPLUS 2016 ANNUAL INFORMATION FORM 51
gas reserves and resources will be impaired. Even if the necessary capital is available, the Corporation cannot assure that it will be successful in acquiring additional reserves or resources on terms that meet its investment objectives. Without these additions, the Corporation's reserves will deplete and, as a consequence, either its production or the average life of its reserves will decline.
The Corporation's expanded scope of activities and participation in the capital markets may attract increased criticism, shareholder activism and costly litigation.
The expansion of the Corporation's business activities, both geographically and with a new focus on exploration, may draw increased attention from shareholder activists who oppose the strategy of the Corporation, including its operation of the business or its plans for development, which could have an adverse effect on market value. The Corporation’s ongoing participation in the Canadian and U.S. capital markets may expose the Corporation to greater risk of class action lawsuits related to, among other things, securities law matters (including with regard to alleged deficiencies in the Corporation’s public disclosure), title, contractual and environmental matters.
Changes in market‑based factors may adversely affect the trading price of the Common Shares and/or the Corporation’s stock exchange listings.
The market price of the Common Shares is primarily a function of the value of the properties owned by the Corporation, as well as the anticipated growth in production and cash flow, or dividends paid to its shareholders. The market price of the Common Shares is, therefore, sensitive to a variety of market‑based factors, including, but not limited to, the inclusion, or removal, of the Common Shares from one or more stock market indexes or exchange traded funds, interest rates, and the comparability of the Corporation’s performance to other growth or yield‑oriented exploration and production companies. Additionally, the Common Shares may, from time to time, not meet the investment criteria or characteristics of a particular institutional or other investor, including for reasons unrelated to financial or operational performance. Any changes in these market‑based factors may adversely affect the trading price of the Common Shares, and/or their inclusion in the portfolios of investment managers. In addition, should the trading price of the Common Share fall below stock exchange listing thresholds, the exchanges will review the appropriateness of the Common Shares for continued listing (NYSE), or ongoing listing (TSX).
The Corporation's operations are subject to certain risks and liabilities inherent in the oil and natural gas business, some of which may not be covered by insurance.
The Corporation's business and operations, including the drilling of oil and natural gas wells and the production and transportation of oil and natural gas, are subject to certain risks inherent in the oil and natural gas business. These risks and hazards include encountering unexpected formations or pressures, blow‑outs, pipeline breaks, rail transportation incidents, craterings, fires, power interruptions and severe weather conditions. The Corporation's operations may also subject it to the risk of vandalism or terrorist threats, including eco‑terrorism and cyber-attacks. The foregoing hazards could result in personal injury, loss of life, reduced production volumes or environmental and other damage to the Corporation's property and the property of others. The Corporation cannot fully protect against all of these risks, nor are all of these risks insurable. Although the Corporation carries liability, business interruption, terrorism, cyber-attack, and property insurance in respect of such matters, there can be no assurance that insurance proceeds will be received or, if received, be adequate to cover all losses resulting from such events, or that the lost production will be restored in a timely manner. The Corporation may become liable for damages arising from these events against which it cannot insure, or against which it may elect not to insure because of high premium costs, or other reasons. While the Corporation has both safety and environmental policies in place to protect its operators and employees, and to meet regulatory requirements in areas where they operate, any costs incurred to repair, damage, or pay liabilities would adversely affect the Corporation's financial position, including the amount of funds that may be available for development programs, debt repayments, or dividend payments to shareholders.
In addition, the Corporation's unconventional oil and gas operations (such as the development and production of Bakken oil and shale gas) involve certain additional risks and uncertainties. The drilling and completion of wells and operations on these unconventional assets present certain challenges that differ from conventional oil and gas operations. Wells on these properties generally must be drilled deeper than in many other areas, which makes the wells more expensive to drill and complete. To reduce costs, wells may be drilled as part of a multi-well pad which may increase the risk of being able to drill and complete any of the wells on the pad if problems occur. In addition, because of the depth and length of these unconventional wells, they may also be more susceptible to mechanical problems associated with the drilling and completion of the wells, such as casing collapse and lost equipment in the wellbore. In addition, the fracturing activities required to be undertaken on these unconventional assets may be more extensive and complicated than fracturing the geological formations in the Corporation's other areas of operation and require greater volumes of water than conventional wells. The management of water and the treatment of produced water from these wells may be more costly than the management of produced water from other geologic formations.
52 ENERPLUS 2016 ANNUAL INFORMATION FORM
Unforeseen title defects, disputes or litigation may result in a loss of entitlement to production, reserves and resources.
From time to time, the Corporation conducts title reviews in accordance with industry practice prior to purchases of assets. However, if conducted, these reviews do not guarantee that an unforeseen defect in the chain of title will not arise and defeat the Corporation's title to the purchased assets. If this type of defect were to occur, the Corporation's entitlement to the production and reserves and, if applicable, resources from the purchased assets could be jeopardized. Furthermore, from time to time, the Corporation may have disputes with industry partners as to ownership rights of certain properties or resources, including with respect to the validity of oil and gas leases held by the Corporation or with respect to the calculation or deduction of royalties payable on the Corporation's production. The existence of title defects or the resolution of disputes may have a material adverse effect on the Corporation or its assets and operations. Furthermore, from time to time, the Corporation or its industry partners may owe one another contractual, trust related or offset obligations which they may default in satisfying and which may adversely affect the validity of an oil and gas lease in which the Corporation has an interest. The existence of title defects, unsatisfied contractual or trust related obligations, including offset obligations, or the resolution of any disputes with industry partners arising from same, may have a material adverse effect on the Corporation or its assets and operations.
Dividends on the Corporation's Common Shares are variable.
Although the Corporation currently intends to pay monthly cash dividends to its shareholders, these cash dividends may be reduced or suspended. In addition, cash dividends declared in Canadian dollars are converted to foreign denominated currencies at the spot exchange rate at the time of payment. As a consequence, investors are subject to foreign exchange risk. To the extent that the Canadian dollar weakens with respect to their currency, the amount of the dividend may be reduced when converted to shareholders’ home currency. In addition, shareholders may be subject to withholding taxes in accordance with tax treaties or domestic tax law changes, as determined by shareholder residency.
The amount of cash available to the Corporation to pay dividends can vary significantly from period to period for a number of reasons, including among other things: (i) the Corporation's operational and financial performance (including fluctuations in the quantity of the Corporation's oil, NGLs and natural gas production and the sales price that the Corporation realizes for such production (after hedging contract receipts and payments)); (ii) fluctuations in the costs to produce oil, NGLs and natural gas, including royalty burdens, and costs to administer and manage the Corporation and its subsidiaries; (iii) the amount of cash required or retained for debt service or repayment; (iv) amounts required to fund capital expenditures and working capital requirements; (v) access to equity markets; (vi) foreign currency exchange rates and interest rates; and (vii) the risk factors set forth in this Annual Information Form. The decision whether or not to pay dividends and the amount of any such dividend is subject to the discretion of the board of directors of the Corporation, which regularly evaluates the Corporation's dividend policy and the solvency test requirements of the ABCA. In addition, the level of dividends per Common Share will be affected by the number of outstanding Common Shares and other securities that may be entitled to receive cash dividends or other payments. Dividends may be increased, reduced or suspended entirely depending on the Corporation's operations and the performance of its assets. The market value of the Common Shares may deteriorate if the Corporation is unable to meet dividend expectations in the future, and that deterioration may be material.
To the extent that the Corporation uses internally‑generated cash flow to finance acquisitions, development costs and other significant capital expenditures, the amount of cash available to pay dividends to the Corporation's shareholders may be reduced. To the extent that external sources of capital, including debt or the issuance of additional Common Shares or other securities of the Corporation, become limited or unavailable, the Corporation's ability to make the necessary capital investments to maintain, develop or expand its oil and gas reserves and resources and to invest in assets, may be impaired. To the extent that the Corporation is required to use cash flow to finance capital expenditures, property acquisitions or asset acquisitions, as the case may be, the level of the Corporation's cash dividend payments to its shareholders may be reduced or even eliminated.
The board of directors of the Corporation has the discretion to determine the extent to which the Corporation's cash flow will be allocated to the payment of debt service charges as well as the repayment of outstanding debt. The payments of interest and principal with respect to the Corporation's third party indebtedness, including the Credit Facilities, rank ahead of dividend payments that may be made by the Corporation to its shareholders. An increase in the amount of funds used to pay debt service charges or reduce debt will reduce the amount of cash that may be available for the Corporation to pay dividends to its shareholders. In addition, variations in interest rates and scheduled principal repayments, if and as required under the terms of the Credit Facilities, could result in significant changes in the amount required to be applied to debt service. Certain covenants in agreements with lenders may also limit payments of dividends.
ENERPLUS 2016 ANNUAL INFORMATION FORM 53
If the Corporation expands beyond its current areas of operations or expands the scope of operations beyond oil and natural gas production, the Corporation may face new challenges and risks. If the Corporation is unsuccessful in managing these challenges and risks, its results of operations and financial condition could be adversely affected.
The Corporation may acquire oil and natural gas properties and assets outside the geographic areas in which it has historically conducted its business and operations. The expansion of the Corporation's activities into new locations may present challenges and risks that the Corporation has not faced in the past, including operational and additional regulatory matters. The Corporation's failure to manage these challenges and risks successfully may adversely affect results of operations and financial condition. In addition, the Corporation's activities are not limited to oil and natural gas production and development, and the Corporation could acquire other energy related assets. Expansion of the Corporation's activities into new areas may present challenges and risks that it has not faced in the past, including dealing with additional regulatory matters. If the Corporation does not manage these challenges and risks successfully, its results of operations and financial condition could be adversely affected.
The Corporation sets out to hire competent personnel and the loss of such personnel, including the Corporation's key management, could impact its business.
Shareholders are entirely dependent on the management of the Corporation with respect to the exploration for and development of additional reserves and resources, the acquisition of oil and natural gas properties and assets, and the management and administration of all matters relating to the Corporation and its properties and assets, including hiring competent personnel. The loss of the services of competent personnel and key individuals could have a detrimental effect on the Corporation. Further, the Corporation's acquisitions and activities in various play types require different skill sets than those needed in developing its mature income‑oriented assets. There is no assurance that the Corporation will be able to attract and retain personnel with the technical expertise and competence necessary to develop such properties, which could adversely affect the Corporation's exploration and development plans.
Conflicts of interest may arise between the Corporation and its directors and officers.
Circumstances may arise where directors and officers of the Corporation are directors or officers of corporations or other entities involved in the oil and gas industry which are in competition to the interests of the Corporation. See "Directors and Officers – Conflicts of Interest".
The Corporation's information assets and critical infrastructure may be subject to cyber security risks.
The Corporation is subject to a variety of information technology and system risks as a part of its normal course operations, including potential breakdown, invasion, virus, cyber-attack, cyber-fraud, security breach, and destruction or interruption of the Corporation's information technology systems by third parties or insiders. Although the Corporation has security measures and controls in place that are designed to mitigate these risks, a breach of its security measures and/or a loss of information could occur and result in a loss of material and confidential information and reputation, a breach of privacy laws, and disruption to business activities. The significance of any such event is difficult to quantify, but may in certain circumstances be material and could have a material adverse effect on the Corporation's business, financial condition and results of operations.
The ability of United States and other non‑resident shareholder investors to enforce civil remedies may be limited.
The Corporation is formed under the laws of Alberta, Canada, and its principal place of business is in Canada. Most of the directors and officers of the Corporation are residents of Canada and some of the experts who provide services to the Corporation (such as its auditors and some of its independent reserves engineers) are residents of Canada, and a portion of their assets and the Corporation's assets are located within Canada. As a result, it may be difficult for investors in the United States or other non‑Canadian jurisdictions (a "Foreign Jurisdiction") to effect service of process within such Foreign Jurisdiction upon such directors, officers and representatives of experts who are not residents of the Foreign Jurisdiction or to enforce against them judgments of courts of the applicable Foreign Jurisdiction based upon civil liability under the securities laws of such Foreign Jurisdiction, including U.S. federal securities laws or the securities laws of any state within the United States. In particular, there is doubt as to the enforceability in Canada against the Corporation or any of its directors, officers or representatives of experts who are not residents of the United States, in original actions or in actions for enforcement of judgments of U.S. courts of liabilities based solely upon the U.S. federal securities laws or the securities laws of any state within the United States.
54 ENERPLUS 2016 ANNUAL INFORMATION FORM
Market for Securities
The Common Shares are listed and posted for trading on the TSX and the NYSE under the trading symbol "ERF".
The following table sets forth certain trading information for the Common Shares on the TSX composite index and the United States composite index information for 2016.
| | TSX Composite Trading | | U.S. Composite Trading |
Month | | High | | Low | | Volume | | High | | Low | | Volume |
January | | 5.08 | | 2.68 | | 60,802,023 | | 3.66 | | 1.84 | | 33,811,983 |
February | | 4.58 | | 3.37 | | 46,266,821 | | 3.35 | | 2.43 | | 28,199,613 |
March | | 5.37 | | 3.82 | | 57,919,116 | | 4.03 | | 2.84 | | 43,291,417 |
April | | 7.12 | | 4.68 | | 54,614,431 | | 5.70 | | 3.55 | | 34,928,872 |
May | | 7.43 | | 6.04 | | 82,342,803 | | 5.74 | | 4.69 | | 36,118,141 |
June | | 8.78 | | 6.89 | | 66,975,757 | | 6.94 | | 5.27 | | 31,844,783 |
July | | 8.79 | | 7.46 | | 44,929,682 | | 6.74 | | 5.67 | | 19,383,211 |
August | | 10.06 | | 7.51 | | 45,094,921 | | 7.82 | | 5.62 | | 21,652,268 |
September | | 9.45 | | 7.43 | | 52,989,510 | | 7.36 | | 5.61 | | 23,054,437 |
October | | 10.12 | | 8.24 | | 73,641,986 | | 7.74 | | 6.28 | | 25,644,646 |
November | | 11.86 | | 8.50 | | 55,900,180 | | 8.84 | | 6.26 | | 26,040,442 |
December | | 13.55 | | 11.47 | | 46,765,526 | | 10.33 | | 8.65 | | 26,445,809 |
ENERPLUS 2016 ANNUAL INFORMATION FORM 55
Directors and Officers
Directors of the Corporation
The directors of the Corporation are elected by the shareholders of the Corporation at each annual meeting of shareholders. All directors serve until the next annual meeting or until a successor is elected or appointed or until the director is removed at a meeting of shareholders. The name, municipality of residence, year of appointment as a director of the Corporation (or its predecessor EnerMark Inc., the administrator of the Fund prior to the Conversion) and principal occupation for the past five years for each current director of the Corporation are set forth below.
| | | | |
Name and Residence | | Director Since | | Principal Occupation for Past Five Years |
| | | | |
Elliott Pew(1)
Boerne, Texas, United States | | September 2010 | | Director of Southwestern Energy Company, a NYSE‑listed oil and gas company, since July 2012. Prior thereto, a director of Common Resources III, L.L.C., a private oil and gas company, since May 2012, and a director of Common Resources II, L.L.C., a private oil and gas company, from May 2010 to August 2012. |
| | | | |
David H. Barr(4)(6)
The Woodlands, Texas, United States | | July 2011 | | Corporate director. Prior thereto, director, President, and Chief Executive Officer and, prior thereto, the Chairman of the board of directors of Logan International Inc., a TSX-listed oil and gas services company focused on downhole tools and completion services. Director of ION Geophysical Corporation, a NYSE-listed oil and gas seismic company. Prior thereto, Group President of various divisions of Baker Hughes Incorporated, a NYSE‑listed oilfield services company. |
| | | | |
Michael R. Culbert(2)(3)(4)
Calgary, Alberta, Canada | | March 2014 | | Mr. Culbert is Vice Chairman of Progress Energy Canada Ltd. (“Progress Energy”), an oil and gas company, since November 2016. He continues to serve as a director on the boards of Progress Energy and Pacific Northwest LNG, each an oil and gas company. Prior thereto, he was President and Chief Executive Officer of Progress Energy. |
| | | | |
Ian C. Dundas
Calgary, Alberta, Canada | | July 2013 | | President & Chief Executive Officer of Enerplus since July 2013. Prior thereto, Executive Vice President and Chief Operating Officer of Enerplus from April 2011 to July 2013 and prior thereto, Senior Vice President, Business Development of Enerplus from August 2010. |
| | | | |
Hilary A. Foulkes(2)(4)(5)(6)(8)
Calgary, Alberta, Canada | | February 2014 | | Corporate director. Currently Chair, Tudor, Pickering, Holt & Co. Securities – Canada, ULC. Prior thereto, Executive Vice President and Chief Operating Officer of Penn West Petroleum Ltd., a TSX and NYSE‑listed oil and gas company, from 2011 to 2012. |
| | | | |
Robert B. Hodgins(2)(3)(7)
Calgary, Alberta, Canada | | November 2007 | | Corporate director and independent businessman. |
| | | | |
Susan M. MacKenzie(4)(5)(6)
Calgary, Alberta, Canada | | July 2011 | | Corporate director. Prior thereto, independent consultant from 2010 to 2015. |
| | | | |
Glen D. Roane(2)(3)
Canmore, Alberta, Canada | | June 2004 | | Corporate director. |
| | | | |
Sheldon B. Steeves(2)(5)
Calgary, Alberta, Canada | | June 2012 | | Corporate director. From January 2001 until April 2012, Chairman and Chief Executive Officer of Echoex Ltd., a junior private oil and gas company. |
Notes:
| (1) | | Chairman of the board of directors and ex officio member of all committees of the board of directors. |
| (2) | | The Audit & Risk Management Committee is currently comprised of Robert B. Hodgins as Chair, Michael R. Culbert, Hilary A. Foulkes, Glen D. Roane and Sheldon B. Steeves. |
| (3) | | The Corporate Governance & Nominating Committee is currently comprised of Glen D. Roane as Chair, Michael R. Culbert and Robert B. Hodgins. |
| (4) | | The Compensation & Human Resources Committee is currently comprised of Susan M. MacKenzie as Chair, David H. Barr, Michael R. Culbert and Hilary A. Foulkes. |
| (5) | | The Reserves Committee is currently comprised of Sheldon B. Steeves as Chair, Susan M. MacKenzie and Hilary A. Foulkes. |
| (6) | | The Safety & Social Responsibility Committee is currently comprised of David H. Barr as Chair, Hilary A. Foulkes and Susan M. MacKenzie. |
56 ENERPLUS 2016 ANNUAL INFORMATION FORM
| (7) | | Mr. Hodgins was a director of Skope Energy Inc. ("Skope") in November 2012 when Skope entered into a settlement agreement with Pine Cliff Energy Ltd. ("Pine Cliff") and filed for protection under the Companies' Creditors Arrangement Act (Canada) ("CCAA"). A plan for compromise and arrangement under the CCAA filed by Pine Cliff and Skope was accepted by the Court of Queen's Bench of Alberta on January 15, 2013, received the requisite approval of Skope's creditors on February 15, 2013 and came into effect on February 20, 2013. Mr. Hodgins resigned as a director of Skope on February 19, 2013. |
| (8) | | Ms. Foulkes was a director of Parallel Energy Trust (“Parallel”). On November 9, 2015, Parallel and its affiliated entities filed an application for protection under the CCAA and voluntary petitions for relief under Chapter 11 of Title 11 of the United States Code in the United States Bankruptcy Court of Delaware. On March 3, 2016, Parallel filed an assignment in bankruptcy and CCAA were terminated. |
ENERPLUS 2016 ANNUAL INFORMATION FORM 57
Officers of the Corporation
The name, municipality of residence, position held and principal occupation for the past five years for each officer of the Corporation are set out below.
Name and Residence | | Office | | Principal Occupation for Past Five Years |
| | | | |
Ian C. Dundas
Calgary, Alberta, Canada | | President & Chief Executive Officer | | President & Chief Executive Officer of Enerplus since July 2013. Prior thereto, Executive Vice President and Chief Operating Officer of Enerplus from April 2011 to July 2013 and prior thereto, Senior Vice President, Business Development of Enerplus from August 2010. |
| | | | |
Jodine J. Jenson Labrie
Calgary, Alberta, Canada | | Senior Vice President & Chief Financial Officer | | Senior Vice President & Chief Financial Officer of the Corporation since September 2015. Vice President, Finance of the Corporation since July 2013. Prior thereto, Controller, and Senior Manager, Planning & Marketing. |
| | | | |
Raymond J. Daniels
Calgary, Alberta, Canada | | Senior Vice President, Operations, People & Culture(1) | | Senior Vice President, Operations, People & Culture of the Corporation since January 2017. Prior thereto, Senior Vice President, Operations of the Corporation since May 2012 and prior thereto, Senior Vice President, Canadian Operations of the Corporation since April 2011. |
| | | | |
Eric G. Le Dain
Calgary, Alberta, Canada | | Senior Vice President, Corporate Development, Commercial | | Senior Vice President, Corporate Development, Commercial of the Corporation since July 2013. Prior thereto, Senior Vice President, Strategic Planning, Reserves & Marketing of the Corporation since April 2011. |
| | | | |
Nathan D. Fisher
Denver, Colorado, United States | | Vice President, U.S. Development & Geosciences | | Vice President, U.S. Development & Geosciences of the Corporation since September 2015. Prior thereto, Manager, Geology & Geophysics for U.S. Operations from April 2011 to September 2015. |
| | | | |
Daniel J. Fitzgerald
Calgary, Alberta, Canada | | Vice President, Business Development | | Vice President, Business Development of the Corporation since September 2015. From December 2012 to September 2015, Manager, Business Development & Strategic Planning. Prior thereto, Vice President, Corporate Development of Storm Resources Ltd. from September 2010 until November 2012. |
| | | | |
John E. Hoffman
Calgary, Alberta, Canada | | Vice President, Canadian Operations | | Vice President, Canadian Operations of the Corporation since April 2015. Prior thereto, General Manager, North America Onshore at Suncor Energy Inc. |
| | | | |
David A. McCoy
Calgary, Alberta, Canada | | Vice President, General Counsel & Corporate Secretary | | Vice President, General Counsel & Corporate Secretary of Enerplus. |
| | | | |
Edward L. McLaughlin
Denver, Colorado, United States | | President, U.S. Operations | | President, U.S. Operations of the Corporation since May 2012. Prior thereto, Manager of Land of Enerplus USA since joining the Corporation in November 2011. |
| | | | |
Shaina B. Morihira
Calgary, Alberta, Canada | | Corporate Controller | | Corporate Controller of the Corporation since July 2015. Prior thereto, Controller, Financial of Progress Energy Canada Ltd. from January 2015 to July 2015. Prior thereto, Manager, Financial Reporting and Senior Financial Analyst of Progress Energy from April 2008 to December 2014. |
| | | | |
| (1) | | Ms. Lisa Ower resigned her duties as Vice President, People & Culture effective October 11, 2016. Mr. Raymond Daniels, Senior Vice President, Operations now has oversight of People & Culture. |
58 ENERPLUS 2016 ANNUAL INFORMATION FORM
Common Share Ownership
As of February 17, 2017, the directors and officers of the Corporation named above beneficially own, or control or exercise direction over, directly or indirectly, an aggregate of 723,853 Common Shares, representing approximately 0.3% of the outstanding Common Shares as of that date.
Conflicts of Interest
Certain of the directors and officers named above may be directors or officers of issuers which are in competition with the Corporation, and as such may encounter conflicts of interests in the administration of their duties with respect to the Corporation. In situations where conflicts of interest arise, the Corporation expects the applicable director or officer to declare the conflict and, if a director of the Corporation, abstain from voting in respect of such matters on behalf of the Corporation.
See "Risk Factors – Conflicts of interest may arise between the Corporation and its directors and officers".
Audit & Risk Management Committee Disclosure
The disclosure regarding the Corporation's Audit & Risk Management Committee required under National Instrument 52‑110 adopted by the Canadian securities regulatory authorities is contained in Appendix D to this Annual Information Form.
Legal Proceedings and Regulatory Actions
The Corporation is involved in various claims and litigation arising in the normal course of business. While the outcome of these matters is uncertain and there can be no assurance that such matters will be resolved in the Corporation's favour, the Corporation does not currently believe that the outcome of any pending or threatened proceedings related to these or other matters, or the amounts which the Corporation may be required to pay by reason thereof, would have a material adverse impact on its financial position, results of operations or liquidity. The Corporation is not and was not during 2016 a party to, and none of the Corporation's property is or was during 2016 the subject of, any legal proceeding that involves a claim for damages (exclusive of interest and costs) greater than 10% of its current assets as at December 31, 2016, and the Corporation has no knowledge of any such proceeding being contemplated.
Interest of Management and Others in Material Transactions
To the knowledge of the directors and executive officers of the Corporation, none of the directors or executive officers of the Corporation and no person or company that is the direct or indirect beneficial owner of, or who exercises control or direction over, more than 10% of any class or series of the Corporation's securities, nor any associate or affiliate of any of the foregoing, has had any material interest, direct or indirect, in any transaction with the Corporation since January 1, 2014 or in any proposed transaction that has materially affected or is reasonably expected to materially affect Enerplus.
Material Contracts and Documents Affecting the Rights of Security holders
The Corporation is not a party to any contracts material to its business or operations, other than contracts entered into in the normal course of business.
Copies of the following documents entered in the normal course of business and relating to the Credit Facilities have been filed on the Fund's SEDAR profile at www.sedar.com and on Form 6‑K on the Fund's EDGAR profile at www.sec.gov, if they were filed prior to the January 1, 2011 Conversion, and on the Corporation's SEDAR profile at www.sedar.com and on Form 6‑K on the Corporation's EDGAR profile at www.sec.gov, if they were filed on or after the January 1, 2011 Conversion:
| 1. | | Amended and Restated Bank Credit Facility (November 5, 2012); the First Amending Agreement relating thereto (January 13, 2014); the Second Amending Agreement relating thereto (May 13, 2014); the Third Amending Agreement relating thereto (SEDAR – December 1, 2014; EDGAR – December 9, 2014); the Fourth Amending Agreement relating thereto (November 6, 2015); and the Fifth Amending Agreement relating thereto (November 7, 2016); |
| 2. | | Form of the Note Purchase Agreement for the Senior Unsecured Notes issued in 2009 (SEDAR – June 23, 2009; EDGAR – June 25, 2009); |
ENERPLUS 2016 ANNUAL INFORMATION FORM 59
| 3. | | Form of the Note Purchase Agreement for the Senior Unsecured Notes issued in 2012 (SEDAR – May 23, 2012; EDGAR – May 24, 2012); and |
| 4. | | Form of the Note Purchase Agreement for the Senior Unsecured Notes issued in 2014 (SEDAR – October 10, 2014; EDGAR – October 15, 2014). |
Copies of the following documents affecting the rights of securityholders have been filed on the Corporation's SEDAR profile at www.sedar.com and on Form 6‑K on the Corporation's EDGAR profile at www.sec.gov, as they were filed after the January 1, 2011 Conversion:
| 1. | | the Articles of Amalgamation (January 2, 2013); By-law No. 1 of the Corporation (June 16, 2014); and By-law No. 2 of the Corporation (May 6, 2016); and |
| 2. | | the Shareholder Rights Plan, as described under "Description of Capital Structure – Shareholder Rights Plan" (May 6, 2016). |
Interests of Experts
McDaniel prepared the McDaniel Reports in respect of certain reserves attributable to the Corporation's oil and natural gas properties in Canada and the western United States, a summary of which is contained in this Annual Information Form, and reviewed certain reserves evaluated internally by the Corporation. McDaniel also audited the internal estimates of contingent resources attributable to the Corporation's interests in the Fort Berthold, North Dakota area, and certain of its waterflood assets located in Alberta and Saskatchewan, which are referred to in this Annual Information Form in Appendix A. As of the dates of the McDaniel Reports, the "designated professionals" (as defined in Form 51‑102F2 – Annual Information Form of the Canadian securities regulatory authorities) of McDaniel, as a group, beneficially owned, directly or indirectly, no outstanding Common Shares. NSAI prepared the NSAI Report in respect of the reserves and contingent resources attributable to the Corporation's interests in the Marcellus property, a summary of which is contained in this Annual Information Form. As of the dates of the NSAI Report, the designated professionals of NSAI, as a group, beneficially owned, directly or indirectly, no outstanding Common Shares.
The independent registered public accounting firm of the Corporation is Deloitte LLP ("Deloitte"), Chartered Professional Accountants, Calgary, Canada. Deloitte is independent within the meaning of the Rules of Professional Conduct of the Chartered Professional Accountants of Alberta, and the applicable rules and regulations thereunder adopted by the SEC and the Public Company Accounting Oversight Board (United States).
Transfer Agent and Registrar
The transfer agent and registrar for the Common Shares in Canada is Computershare Trust Company of Canada, at its principal offices in Calgary, Alberta and Toronto, Ontario. Computershare Trust Company N.A. at its principal offices in Golden, Colorado is the transfer agent for the Common Shares in the United States.
Additional Information
Additional information relating to the Corporation may be found on the Corporation's profile on the SEDAR website at www.sedar.com, on the EDGAR website at www.sec.gov and on the Corporation's website at www.enerplus.com. Additional information, including directors' and officers' remuneration and indebtedness, principal holders of the Corporation's securities and securities authorized for issuance under equity compensation plans, as applicable, will be contained in the Corporation's information circular and proxy statement with respect to its 2017 annual meeting of shareholders. Furthermore, additional financial information relating to the Corporation is provided in the Corporation's audited consolidated financial statements and MD&A for the year ended December 31, 2016. Shareholders who wish to receive printed copies of these documents free of charge should contact the Corporation's Investor Relations Department using the contact information on the back cover of this Annual Information Form.
60 ENERPLUS 2016 ANNUAL INFORMATION FORM
Appendix A – Contingent Resources Information
Note to Reader Regarding Disclosure of Contingent Resources Information
All of the Corporation's contingent resources have been evaluated in accordance with NI 51-101. NSAI, an independent petroleum consulting firm based in Dallas, Texas, has evaluated the Corporation's contingent resources attributable to its Marcellus properties located in Pennsylvania, United States, using McDaniel's January 1, 2017 forecast prices. The Corporation has evaluated the balance of its U.S. properties located in North Dakota, United States, and its Canadian properties located in Alberta and Saskatchewan to which contingent resources have been assigned using similar evaluation parameters, including the same forecast price, inflation and exchange rate assumptions utilized by McDaniel. McDaniel has audited the Corporation's internal evaluation of these properties.
The following sections and tables summarize, as at December 31, 2016, the Corporation's "best estimate" (as defined below) contingent resources, including risked contingent resource volumes and risked net present value of future net revenue of contingent resources in development pending project maturity sub-class, together with certain information, estimates and assumptions associated with such estimates. The data contained in the tables is a summary of the evaluations, and as a result the tables may contain slightly different numbers than the evaluations themselves due to rounding. Additionally, the columns and rows in the tables may not add due to rounding.
All estimates of future net revenues are stated prior to provision for interest and general and administrative expenses and after deduction of royalties and estimated future capital expenditures, and are presented before deducting income taxes. For additional information, see "Business of the Corporation – Tax Horizon", "Industry Conditions" and "Risk Factors" in the Annual Information Form.
With respect to pricing information in the following resources information, the wellhead oil prices were adjusted for quality and transportation based on historical actual prices. The natural gas prices were adjusted, where necessary, based on historical pricing based on heating values and transportation. The NGLs prices were adjusted to reflect historical average prices received.
The estimated future net revenue to be derived from the production of the contingent resources set out in this Appendix A is based on the price forecast supplied by McDaniel as of January 1, 2017, and utilized by NSAI and by the Corporation in its internal evaluations for consistency in the Corporation's reporting, and the inflation and exchange rate assumptions set forth under "Oil and Natural Gas Reserves – Forecast Prices and Costs" in the Annual Information Form. Also see "Presentation of Oil and Gas Reserves, Contingent Resources and Production Information – Description of Price and Cost Assumptions" in the Annual Information Form.
It should not be assumed that the summary of risked net present value of estimated future cash flows shown in the tables below is representative of the fair market value of the contingent resources. There is no assurance that such price and cost assumptions will be attained and variances could be material. The recovery and contingent resources estimates of the Corporation's crude oil, natural gas liquids and natural gas contingent resources provided herein are estimates only. Actual resources may be greater than or less than the estimates provided herein. Readers should review the definitions and information contained below.
Contingent Resources Categories and Levels of Certainty for Reported Resources
In this Appendix A, the Corporation has disclosed estimated volumes of economic "contingent resources" which relate to the Corporation's interests in its Fort Berthold property located in North Dakota, its Marcellus shale gas property located in Pennsylvania, and certain of its crude oil waterflood properties located in Alberta and Saskatchewan.
"resources" are petroleum quantities that originally existed on or within the earth's crust in naturally occurring accumulations, including discovered and undiscovered (recoverable and unrecoverable) plus quantities already produced.
"contingent resources" are defined as those quantities of petroleum estimated, as of a given date, to be potentially recoverable from known accumulations using established technology or technology under development, but which are not currently considered to be commercially recoverable due to one or more contingencies. Contingencies may include factors such as economic, legal, environmental, political and regulatory matters or a lack of markets. It is also appropriate to classify as "contingent resources" the estimated discovered recoverable quantities associated with a project in the early project stage. "Economic" contingent resources are those resources that are economically recoverable based on McDaniel’s January 1, 2017 forecast prices.
The economic contingent resources estimates in this Appendix A are presented as the "best estimate" of the quantity that will actually be recovered, meaning that it is equally likely that the actual remaining quantities recovered will be greater or
ENERPLUS 2016 ANNUAL INFORMATION FORM A-1
less than the “best estimate”, and if probabilistic methods are used, there should be at least a 50% probability that the quantities actually recovered will equal or exceed the “best estimate”.
"risked" means that the applicable volumes or revenues have been adjusted for the probability of loss or failure in accordance with the COGEH. See "Description of Properties" below.
Resources and contingent resources do not constitute, and should not be confused with, reserves. See "Business of the Corporation – Description of Properties" and "Risk Factors – The Corporation's actual reserves and resources will vary from its reserves and resources estimates, and those variations could be material".
Contingent Resources Development Status
Contingent resources may be divided into the following project maturity sub-classes:
"development pending" resources sub-class is assigned to contingent resources for a particular project where resolution of the final conditions for development is being actively pursued (there is a high chance of development) and the project is expected to be developed in a reasonable timeframe;
"development on hold" resources sub-class is assigned to contingent resources for a particular project where there is a reasonable chance of development, but there are major non-technical contingencies to be resolved that are usually beyond the control of the operator;
"development unclarified" resources are those for which additional information is being acquired;
"development not viable" resources are those where no further data acquisition or evaluation is currently planned and there is a low chance of development.
All of the Corporation's contingent resources fall into the "development pending" sub-class.
CONTINGENT RESOURCES DATA
The following tables set forth the "best estimate" of gross and net risked contingent resources volumes and risked net present value of future net revenue attributable to the Corporation's contingent resources in the development pending project maturity sub-class, at December 31, 2016, using forecast price and cost cases. An estimate of risked net present value of future net revenue of contingent resources is preliminary in nature and is provided to assist the reader in reaching an opinion on the merit and likelihood of the Corporation proceeding with the required investment. It includes contingent resources that are considered too uncertain with respect to the chance of development to be classified as reserves. There is no certainty that the estimate of risked net present value of future net revenue will be realized.
Summary of Risked Oil and Gas
Contingent Resources (Forecast Prices and Costs)
As of December 31, 2016
| | | | | | | | | | | | | | | | | | | | | | | | | | | | |
| | CONTINGENT RESOURCES |
PROJECT
MATURITY
SUB-CLASS | | Light &
Medium Oil | | Heavy Oil | | Tight Oil | | Natural Gas
Liquids | | Conventional
Natural Gas | | Shale Gas | | Total |
| | Gross | | Net | | Gross | | Net | | Gross | | Net | | Gross | | Net | | Gross | | Net | | Gross | | Net | | Gross | | Net |
| | (Mbbls) | | (Mbbls) | | (Mbbls) | | (Mbbls) | | (Mbbls) | | (Mbbls) | | (Mbbls) | | (Mbbls) | | (MMcf) | | (MMcf) | | (MMcf) | | (MMcf) | | (MBOE) | | (MBOE) |
Development Pending | | 3,812 | | 3,191 | | 25,633 | | 21,464 | | 89,287 | | 71,340 | | 10,098 | | 8,069 | | 1,012 | | 877 | | 720,073 | | 576,012 | | 249,011 | | 200,213 |
Risked Net Present Value of Future Net Revenue
Contingent Resources (Forecast Prices and Costs)
As of December 31, 2016
| | | | | | | | | | |
RISKED NET PRESENT VALUE OF FUTURE NET REVENUE DISCOUNTED AT (%/Year) |
| | Before Deducting Income Taxes |
PROJECT
MATURITY SUB-CLASS | | 0% | | 5% | | 10% | | 15% | | 20% |
| | (in $ millions) |
Development Pending | | 4,656.1 | | 1,976.6 | | 901.3 | | 411.8 | | 169.6 |
A-2 ENERPLUS 2016 ANNUAL INFORMATION FORM
Description of Properties
Outlined below is a description of the Corporation's "best estimate" of economic contingent resources for its Canadian and U.S. crude oil and natural gas properties and assets. There is no certainty it will be commercially viable to produce, or that the Corporation will produce, any portion of the volumes currently classified as "contingent resources".
Canadian Crude Oil Properties
The Corporation has conducted an internal evaluation of the contingent resources associated with a portion of its crude oil waterflood properties which has resulted in an unrisked "best estimate" of 34.4 MMBOE (29.6 MMBOE risked) being classified as economic contingent resources effective as of December 31, 2016. The unrisked net present value of future net revenue, discounted at 10%, of these contingent resources is $333.3 million ($290.6 million risked). This internal evaluation has been independently audited by McDaniel. Improved oil recovery from five existing waterfloods through optimization work accounts for approximately 12.5 MMBOE of the total volumes; 7.7 MMBOE from areas producing heavy crude oil and 4.8 MMBOE from areas producing light or medium crude oil. Approximately 21.9 MMBOE of the total is attributable to heavy crude oil EOR projects in the Corporation's Giltedge property and the Medicine Hat Glauconitic "C" East Unit where polymer flood projects are underway. To implement the projects to recover the contingent resources, it is estimated that $759.2 million of capital will be required. For the improved oil recovery projects this capital will be spent from 2017 to 2025, and from 2017 to 2038 for the EOR polymer flood projects. As work proceeds and assessed results continue to support the economic viability of these projects, each year a portion of contingent resources is anticipated to be reclassified as reserves. Although further EOR projects are being contemplated on certain of the Corporation's other Canadian crude oil properties, these have not been fully evaluated and no contingent resources have been assessed.
Significant positive factors embedded in this estimate include well‑established waterflood technology, a long history of waterflood performance data and success with the EOR projects that have been implemented. The EOR estimates are based on incremental recovery from higher displacement efficiency without any improvement in areal sweep. A significant negative factor relevant to this estimate is the geological complexity and its effect on injector producer connectivity. These resources are all classified into "development pending" project maturity sub-class as the Corporation is actively pursuing these projects. The chance of development is estimated to be 90% for the 20.7 MMBOE of contingent resources assigned to the Medicine Hat Glauconitic "C" East Unit. This estimate is based on the success of the initial pilot projects and the Corporation’s approval to expand the current projects. For the remaining waterflood contingent resources, a chance of development of 80% is estimated based on the favourable results to date and the slight variability of the reservoirs. The contingency preventing these resources from being classified as reserves is the early stage of implementation to the specific waterfloods and the lack of internal approvals for full field implementation. There are several inherent risks and contingencies associated with the development of these properties, including the Corporation's ability to make the necessary capital expenditures to develop the properties, reliance on the Corporation's industry partners in project development, acquisitions, funding and provision of services and those other risks and contingencies described above and that apply generally to oil and gas operations as described above and under "Risk Factors" in the Annual Information Form.
Canadian Natural Gas Properties
The Corporation had disclosed Development Pending Contingent Resources for the Wilrich property in 2015. This property was divested in 2016.
U.S. Crude Oil Properties
An evaluation of the Corporation's interests in the Bakken and Three Forks formations at Fort Berthold, North Dakota conducted internally by the Corporation and audited by McDaniel has attributed an unrisked "best estimate" of 119.8 MMBOE (107.8 MMBOE risked) of economic contingent resources attributable to these formations, effective as of December 31, 2016, an increase of approximately 24% from the estimate as of December 31, 2015 notwithstanding the divestment of an estimated 7.3 MMBOE of contingent resources in non-operated lands at Fort Berthold. The increase was primarily the result of the Corporation’s decision to drill currently spaced units to higher densities as compared to December 31, 2015. The recovery of these tight oil contingent resources is under a primary solution gas drive through horizontal wells completed with multiple fracture treatments. These contingent resources represent approximately 215.3 net future drilling locations over and above 88.5 net booked drilling locations identified in the Corporation's booked proved plus probable reserves. The capital required to drill these locations is estimated to be US$2,195.0 million (or CDN$2,588.5 million) between 2020 and 2025. These estimates are based primarily upon a drilling density of up to 10 wells per drilling spacing unit in the Bakken and Three Forks formations combined. The contingent resources average expected ultimate recovery per well is estimated at 561 MBOE. These contingent resources are economic using established technologies and under current forecast commodity prices. Given the drilling density to date, these contingent resources represent a non‑reserve land utilization of 100% for the operated lands. All of these contingent resources are classified into "development pending" project maturity sub-class, with an estimated chance of development of 90% as their development is expected to
ENERPLUS 2016 ANNUAL INFORMATION FORM A-3
immediately follow the reserves development. After application of the chance of development, the risked NPV is $361.9 million. The Corporation has approximately 125.8 net reserves wells currently on production in this area.
The primary contingencies which currently prevent the classification of the Corporation's disclosed contingent resources associated with the Fort Berthold, North Dakota property as reserves consists of lack of corporate approval for development in addition to undeveloped reserves. Significant positive factors related to the estimate include continued advancement of drilling and completion technology, and performance of producing wells that continues to exceed expectations resulting in positive revisions to reserves. A significant factor related to the estimate is the limited long‑term performance history in the immediate area of the contingent resources. There are a number of inherent risks and contingencies associated with the development of the interests in the property including commodity price fluctuations, project costs, the Corporation's ability to make the necessary capital expenditures to develop the properties, reliance on industry partners in project development, funding and provision of services and those other risks and contingencies described above and that apply generally to oil and gas operations as described above and under "Risk Factors" in the Annual Information Form.
U.S. Natural Gas Properties
NSAI has conducted an independent assessment of the contingent resources attributable to the Corporation's interests in the Marcellus property and has provided an unrisked "best estimate" of economic shale gas contingent resources of approximately 837 Bcf (669.6 Bcf risked) at December 31, 2016. The unrisked NPV associated with these contingent resources is $311.0 million ($248.8 million risked). Approximately 53.6 Bcf of contingent resources were reclassified as reserves in 2016. The Corporation saw an increase in the contingent resources estimate assigned to its non‑operated leases in northeast Pennsylvania due to continued development which held the lands that were previously at risk of expiry. The remaining contingent resources are economic based on the forecast price and cost assumptions used for the Corporation's year‑end 2016 reserves evaluations. This estimate represents a non-reserve land utilization rate of 95% and average well ultimate recovery of approximately 8.7 Bcf. These contingent resources are classified into "development pending" project maturity sub-class as it is anticipated that their development will be a continuation of the current reserves development. These contingent resources have an estimated 80% chance of development. It is also estimated that US$622.4 million (or CDN$732.2 million) of capital will be required to develop these contingent resources with multifractured horizontal wells and development will occur from 2020 to 2028. The primary contingencies which currently prevent the classification of the Corporation's disclosed contingent resources associated with its Marcellus interests as reserves consist of additional delineation drilling to confirm economic productivity in the immediate vicinity of the development areas, limitations to development based on adverse topography or other surface restrictions, the uncertainty regarding marketing and transportation of natural gas from development areas, the receipt of all required regulatory permits and approvals to develop the land, and limited access to confidential information of other operators in the Marcellus formation that would support the recognition of reserves on the Corporation's areas of interest. Significant negative factors related to the estimate include the following: the pace of development, including drilling and infrastructure, is slower than the forecast, risk of adverse regulatory and tax changes, and other issues related to gas development in populated areas. There are a number of inherent risks and contingencies associated with the development of the Corporation's interests in the Marcellus property including commodity price fluctuations, project costs, the Corporation's ability to make the necessary capital expenditures to develop the properties, reliance on the Corporation's industry partners in project development, acquisitions, funding and provision of services and those other risks and contingencies described above and that apply generally to oil and gas operations as described above and under "Risk Factors" in the Annual Information Form.
A-4 ENERPLUS 2016 ANNUAL INFORMATION FORM
Appendix B – Report on Reserves Data and Contingent Resources Data by Independent Qualified Reserves Evaluator or Auditor
To the board of directors of Enerplus Corporation (the “Corporation”):
| 1. | | We have audited, evaluated and reviewed, as applicable, the Corporation’s reserves data and contingent resources data as at December 31, 2016. The reserves data are estimates of proved reserves and probable reserves and related future net revenue as at December 31, 2016, estimated using forecast prices and costs. The contingent resources data are risked estimates of volume of contingent resources and related risked net present value of future net revenue as at December 31, 2016, estimated using forecast prices and costs. |
| 2. | | The reserves data and contingent resources data are the responsibility of the Corporation’s management. Our responsibility is to express an opinion on the reserves data and contingent resources data based on our audit, evaluation and review. |
| 3. | | We carried out our audit, evaluation and review, as applicable, in accordance with standards set out in the Canadian Oil and Gas Evaluation Handbook as amended from time to time (the “COGE Handbook”) maintained by the Society of Petroleum Evaluation Engineers (Calgary Chapter). |
| 4. | | Those standards require that we plan and perform an audit, evaluation and review, as applicable, to obtain reasonable assurance as to whether the reserves data and contingent resources data are free of material misstatement. An audit, evaluation and review also includes assessing whether the reserves data and contingent resources data are in accordance with principles and definitions presented in the COGE Handbook. |
| 5. | | The following table sets forth the net present value of future net revenue (before deduction of income taxes) attributed to proved plus probable reserves, estimated using forecast prices and costs and calculated using a discount rate of 10 percent, included in the reserves data of the Corporation evaluated and reviewed for the year ended December 31, 2016, and identifies the respective portions thereof that we have evaluated and reviewed and reported on to the Corporation’s management: |
| | | | | | | | | | | | | | | |
Independent | | | | | | |
Qualified | | | | | | Net Present Value of Future Net Revenue |
Reserves | | Effective Date of | | | | (before income taxes, 10% discount rate) |
Evaluator | | Evaluation or Review | | Location of | | (in $ thousands) |
or Auditor | | Report | | Reserves | | Audited | | Evaluated | | Reviewed | | Total |
McDaniel & Associates Consultants Ltd. | | December 31, 2016 | | Canada | | - | | $ | 425,283.2 | | $ | 454,340.4 | | $ | 879,623.7 |
| | | | | | | | | | | | | | | |
McDaniel & Associates Consultants Ltd. | | December 31, 2016 | | North Dakota & Montana, USA | | - | | | US$1,485,770.0 (1) | | | - | | | US$1,485,770.0 (1) |
| | | | | | | | | | | | | | | |
Netherland, Sewell & Associates, Inc. | | December 31, 2016 | | Pennsylvania, USA | | - | | | US$593,022.0 (1) | | | - | | | US$593,022.0 (1) |
| | | | | | | | | | | | | | | |
TOTALS | | | | | | | | $ | 2,909,219.3 | | $ | 454,340.4 | | $ | 3,363,559.8 |
(1) Future net revenue in $US was converted to $Cdn using McDaniel’s forecast of exchange rates. These are 0.75 for 2017, 0.775 for 2018, 0.80 for 2019, 0.825 for 2020 and 0.85 thereafter
| 6. | | The following table sets forth the risked volume and risked net present value of future net revenue of contingent resources (before deduction of income taxes) attributed to contingent resources, estimated using forecast prices and costs and calculated using a discount rate of 10 percent, included in the Corporation’s statement prepared in accordance with Form 51-101F1 and identifies the respective portions of the contingent resources that we have audited and evaluated and reported on to the Corporation’s management: |
ENERPLUS 2016 ANNUAL INFORMATION FORM B-1
| | | | | | | | | | | | | | | | |
| | Independent | | Effective | | | | | | | | | | |
| | Qualified | | Date of | | Location of | | | | Risked Net Present Value of Future Net Revenue |
| | Reserves | | Audit or | | Resources | | Risked | | (before income taxes, 10% discount rate) |
| | Evaluator | | Evaluation | | Other than | | Volume | | (in $ thousands) |
Classification | | or Auditor | | Report | | Reserves | | (MMBOE) | | Audited | | Evaluated | | Total |
Development Pending Contingent Resources (2C) | | McDaniel & Associates Consultants Ltd. | | December 31, 2016 | | Canada | | 29.6 | | $ | 290,616.6 | | - | | $ | 290,616.6 |
| | | | | | | | | | | | | | | | |
Development Pending Contingent Resources (2C) | | McDaniel & Associates Consultants Ltd. | | December 31, 2016 | | North Dakota, USA | | 107.8 | | | US$309,891.3 | | - | | | US$309,891.3 |
| | | | | | | | | | | | | | | | |
Development Pending Contingent Resources (2C) | | Netherland, Sewell & Associates, Inc. | | December 31, 2016 | | Pennsylvania, USA | | 111.6 | | | - | | US$211,887.1 | | | US$211,887.1 |
| | | | | | | | | | | | | | | | |
| 7. | | In our opinion, the reserves data and contingent resources data, respectively, audited and evaluated by us have, in all material respects, been determined and are in accordance with the COGE Handbook, consistently applied. We express no opinion on the reserves data that we reviewed but did not audit or evaluate. |
| 8. | | We have no responsibility to update our reports referred to in paragraphs 5 and 6 for events and circumstances occurring after the respective effective dates of our reports. |
| 9. | | Because the reserves data and contingent resources data are based on judgments regarding future events, actual results will vary and the variations may be material. |
| 10. | | Executed as to our report referred to above: |
| | |
MCDANIEL & ASSOCIATES CONSULTANTS LTD. | | NETHERLAND, SEWELL & ASSOCIATES, INC. |
“signed by P.A. Welch” | | “signed by C.H. (Scott) Rees III” |
P.A. Welch, P.Eng. | | C.H. (Scott) Rees III, P.E. |
President & Managing Director | | Chairman and Chief Executive Officer |
| | |
Calgary, Alberta, Canada | | Texas Registered Engineering Firm F-2699 |
| | Dallas, Texas, USA |
| | |
February 21, 2017 | | February 21, 2017 |
B-2 ENERPLUS 2016 ANNUAL INFORMATION FORM
Appendix C – Report of Management and Directors on Oil and Gas Disclosure
Terms to which a meaning is described in CSA Staff Notice 51‑324 – Glossary to NI 51‑101 Standards of Disclosure for Oil and Gas Activities have the same meaning herein.
Management of Enerplus Corporation (the "Corporation") is responsible for the preparation and disclosure of information with respect to the Corporation's oil and gas activities in accordance with securities regulatory requirements. This information includes reserves data and contingent resources data.
Independent qualified reserves evaluators have evaluated, reviewed and audited, as applicable, the Corporation's reserves data and contingent resources data. The report of the independent qualified reserves evaluators is presented as Appendix B to this Annual Information Form.
The Reserves Committee of the board of directors of the Corporation has:
| (a) | | reviewed the Corporation's procedures for providing information to the independent qualified reserves evaluators; |
| (b) | | met with the independent qualified reserves evaluators to determine whether any restrictions affected the ability of the independent qualified reserves evaluators to report without reservation; and |
| (c) | | reviewed the reserves data and contingent resources data with management and the independent qualified reserves evaluators. |
The Reserves Committee of the board of directors of the Corporation has reviewed the Corporation's procedures for assembling and reporting other information associated with oil and gas activities and has reviewed that information with management. The board of directors of the Corporation has, on the recommendation of the Reserves Committee, approved:
| (a) | | the content and filing with securities regulatory authorities of Form 51‑101F1 containing reserves data, contingent resources data and other oil and gas information; |
| (b) | | the filing of Form 51‑101F2 which is the report of the independent qualified reserves evaluators on the reserves and resources data; and |
| (c) | | the content and filing of this report. |
Because the reserves data and contingent resources data are based on judgments regarding future events, actual results will vary and the variations may be material.
ENERPLUS CORPORATION | | |
| | |
"Ian C. Dundas" | | "Eric G. Le Dain" |
| | |
Ian C. Dundas | | Eric G. Le Dain |
President & Chief Executive Officer | | Senior Vice President, Corporate Development, |
| | Commercial |
| | |
"Elliott Pew" | | "Sheldon B. Steeves" |
Elliott Pew | | Sheldon B. Steeves |
Director | | Director |
| | |
February 24, 2017 | | |
ENERPLUS 2016 ANNUAL INFORMATION FORM C-1
Appendix D – Audit & Risk Management Committee Disclosure Pursuant to National Instrument 52‑110
A.THE AUDIT & RISK MANAGEMENT COMMITTEE'S CHARTER
The charter of the Audit & Risk Management Committee (the "Committee") of the board of directors of the Corporation is attached as Schedule 1 to this Appendix D.
B.COMPOSITION OF THE AUDIT & RISK MANAGEMENT COMMITTEE
The current members of the Committee are Robert B. Hodgins (Chairman), Hilary A. Foulkes, Glen D. Roane and Sheldon B. Steeves. Each member of the Committee is independent and financially literate within the meaning of National Instrument 52‑110.
C.RELEVANT EDUCATION AND EXPERIENCE
Name (Director Since) | | Principal Occupation and Biography |
| | |
Robert B. Hodgins
(Honors B.A. (Business), CPA, CA) (Director since November 2007) Other Public Directorships AltaGas Ltd. (energy midstream services) Gran Tierra Energy Inc. (international oil and gas exploration and production company) MEG Energy Corp. (oil sands company) | | Mr. Hodgins has been an independent businessman since November 2004. Prior to that, Mr. Hodgins served as the Chief Financial Officer of Pengrowth Energy Trust (a TSX and NYSE‑listed energy trust) from 2002 to 2004. Prior to that, Mr. Hodgins held the position of Vice President and Treasurer of Canadian Pacific Limited (a diversified energy, transportation and hotels company) from 1998 to 2002 and was Chief Financial Officer of TransCanada PipeLines Limited (a TSX and NYSE‑listed energy transportation company) from 1993 to 1998. Mr. Hodgins received an Honors Bachelor of Arts in Business from the Richard Ivey School of Business at the University of Western Ontario in 1975 and received a Chartered Accountant designation and was admitted as a member of the Institute of Chartered Accountants of Ontario in 1977 and Alberta in 1991. |
| | |
| | |
Michael R. Culbert
(B.Sc. (Business Administration)) (Director since February 2014) | | Mr. Culbert is Vice Chairman of Progress Energy Canada Ltd. (“Progress Energy”), an oil and gas company, since November 2016. He continues to serve as a director on the boards of Progress Energy and Pacific Northwest LNG, each an oil and gas company. Prior thereto, he was President and Chief Executive Officer of Progress Energy. |
Hilary A. Foulkes
(B.Sc., Honours (Earth Sciences)) (Director since February 2014) | | Ms. Foulkes has over 30 years of oil and gas industry experience and is currently Chair, Tudor, Pickering, Holt & Co. Securities – Canada, ULC. From 2008 to 2012, Ms. Foulkes held a number of executive roles at Penn West Petroleum Ltd., a TSX and NYSE-listed oil and gas company, including Executive Vice President and Chief Operating Officer. Prior thereto, Ms. Foulkes was Managing Director at Scotia Waterous, an investment banking firm, from April 2000 to March 2008. Ms. Foulkes holds an Honours Bachelor of Science degree in Earth Sciences from the University of Waterloo, is a professional geologist, and a member of the Association of Professional Engineers and Geoscientists of Alberta and Canadian Association of Petroleum Geologists. |
| | |
ENERPLUS 2016 ANNUAL INFORMATION FORM D-1
Name (Director Since) | | Principal Occupation and Biography |
| | |
Glen D. Roane
(B.A., MBA) (Director since June 2004) Other Public Directorships Badger Daylighting Ltd. (provider of non‑destructive excavation services) Crown Capital Partners, Inc. (financing company) | | Mr. Roane is a corporate director and currently serves as a director of Enerplus, Badger Daylighting Ltd., and Crown Capital Partners, Inc. Previously, he served as a board member of a number of TSX-listed energy/ resources companies. Mr. Roane also served two terms as a Member of the Alberta Securities Commission. Mr. Roane retired from TD Asset Management Inc., a subsidiary of the Toronto-Dominion Bank in 1997. Mr. Roane is a director of GBC American Growth Fund Inc., a Canadian mutual fund corporation. Mr. Roane holds a Bachelor of Arts and an MBA from Queen's University in Kingston, Ontario and also holds the ICD.D designation from the Institute of Corporate Directors. |
| | |
| | |
Sheldon B. Steeves
(B.Sc. (Geology)) (Director since June 2012) Other Public Directorships NuVista Energy Ltd. (oil and gas exploration and production company) PrairieSky Royalty Ltd. (oil and gas royalty-focused company) | | Mr. Steeves has over 38 years of experience in the North American oil and gas industry and is currently a director of NuVista Energy Ltd., a TSX‑listed Canadian oil and gas company with operations in the Western Canadian Sedimentary Basin, and of PrairieSky Royalty Ltd., a TSX-listed Canadian oil and gas royalty-focused company. From January 2001 until April 2012, Mr. Steeves was Chairman and Chief Executive Officer of Echoex Ltd., a junior oil and gas private company focused on greenfield organic growth in Western Canada. Mr. Steeves spent over 15 years at Renaissance Energy Ltd., where he was appointed Chief Operating Officer in 1997. Mr. Steeves holds a Bachelor of Science in Geology from the University of Calgary. |
| | |
D.PRE‑APPROVAL POLICIES AND PROCEDURES
The Committee has implemented a policy restricting the services that may be provided by the Corporation's auditors and the fees paid to the Corporation's auditors. Prior to the engagement of the Corporation's auditors to perform both audit and non‑audit services, the Committee pre‑approves the provision of the services. In making their determination regarding non‑audit services, the Committee considers the compliance with the policy and the provision of non‑audit services in the context of avoiding impact on auditor independence. All audit and non‑audit fees paid to Deloitte in 2016 and 2015 were pre‑approved by the Committee. Based on the Committee's discussions with management and the independent auditors, the Committee is of the view that the provision of the non‑audit services by Deloitte described above is compatible with maintaining that firm's independence from the Corporation.
E.EXTERNAL AUDITOR SERVICE FEES
The aggregate fees paid by the Corporation to Deloitte, Independent Registered Public Accounting Firm, the independent auditor of Enerplus, for professional services rendered in Enerplus' last two fiscal years are as follows:
| | 2016 | | 2015 |
| | (in $ thousands) |
Audit fees(1) | | $ | 654.7 | | $ | 773.3 |
Audit‑related fees(2) | | | - | | | - |
Tax fees(3) | | | 43.9 | | | 129.2 |
All other fees(4) | | | - | | | - |
| | $ | 698.6 | | $ | 902.6 |
Notes:
| (1) | | Audit fees were for professional services rendered by Deloitte for the audit of the Corporation's annual financial statements and review of the Corporation's quarterly financial statements, as well as services provided in connection with statutory and regulatory filings or engagements. |
| (2) | | Audit‑related fees are for assurance and related services reasonably related to the performance of the audit or review of the Corporation's financial statements and not reported under "Audit fees" above. |
| (3) | | Tax fees were for tax compliance, tax advice and tax planning. |
| (4) | | All other fees are fees for products and services provided by Deloitte other than those described as "Audit fees", "Audit‑related fees" and "Tax fees". |
D-2 ENERPLUS 2016 ANNUAL INFORMATION FORM
Audit & Risk Management Committee Charter
I. AUTHORITY
The Audit & Risk Management Committee (the “Committee”) of the Board of Directors (the “Board”) of Enerplus Corporation (the “Corporation”) shall be comprised of three or more Directors as determined from time to time by resolution of the Board. Consistent with the appointment of other Board committees, the members of the Committee shall be elected by the Board at the first meeting of the Board following each annual meeting of Shareholders of the Corporation or at such other time as may be determined by the Board. The Chair of the Committee shall be designated by the Board, provided that if the Board does not so designate a Chair, the members of the Committee, by majority vote, may designate a Chair. The presence in person or by telephone of a majority of the Committee’s members shall constitute a quorum for any meeting of the Committee. All actions of the Committee will require the vote of a majority of its members present at a meeting of the Committee at which a quorum is present.
Members of the Committee do not receive any compensation from the Corporation other than compensation as directors and committee members. Prohibited compensation includes fees paid, directly or indirectly, for services as consultant or as legal or financial advisor, regardless of the amount, but excludes any compensation approved by the Board and that is paid to the directors as members of the Board and its committees.
II. PURPOSE OF THE COMMITTEE
The Committee’s mandate is to assist the Board in fulfilling its oversight responsibilities with respect to:
1. financial reporting and continuous disclosure of the Corporation;
2. the Corporation’s internal controls and policies, the certification process and compliance with regulatory requirements over financial matters;
3. evaluating and monitoring the performance and independence of the Corporation’s external auditors; and
4. monitoring the manner in which the business risks of the Corporation are being identified and managed.
The Committee shall report to the Board on a regular basis with regard to such matters. The Committee has direct responsibility to recommend the appointment of the external auditors and approve their remuneration. The Committee may take such actions as it deems necessary to satisfy itself that the Corporation’s auditors are independent of management. It is the objective of the Committee to maintain free and open communication among the Board, the external auditors, and the financial senior management of the Corporation.
III. COMPOSITION AND COMPETENCY OF THE COMMITTEE
Each member of the Committee shall be unrelated to the Corporation and, as such, shall be free from any relationship that may interfere with the exercise of his or her independent judgement as a member of the Committee. All members of the Committee shall be financially literate and at least one member of the Committee shall have accounting or related financial management expertise – "literate” or “literacy” and “expertise” as defined by applicable securities legislation. Members are encouraged to enhance their understanding of current issues through means of their preference.
IV. MEETINGS OF THE COMMITTEE
The Committee shall meet with such frequency and at such intervals as it shall determine is necessary to carry out its duties and responsibilities. As part of its purpose to foster open communications, the Committee shall meet at least quarterly with management and the Corporation’s external auditors in separate executive sessions to discuss any matters that the Committee or each of these groups or persons believes should be discussed privately. The Chair works with the Chief Financial Officer and external auditors to establish the agendas for Committee meetings, ensuring that each party’s expectations are understood and addressed. The Committee, in its discretion, may ask members of management or others to attend its meetings (or portions thereof) and to provide pertinent information as necessary. The Committee shall maintain minutes of its meetings and records relating to those meetings and the Committee’s activities and provide copies of such minutes to the Board.
V. DUTIES AND ACTIVITIES OF THE COMMITTEE
Evaluating and monitoring the performance and independence of external auditors
1. Make recommendations to the Board on the appointment of external auditors of the Corporation;
ENERPLUS 2016 ANNUAL INFORMATION FORM D-3
2. Review and approve the Corporation’s external auditors’ annual engagement letter, including the proposed fees contained therein;
3. Review the performance of the external auditors and make recommendations to the Board regarding their replacement when circumstances warrant. The review shall take into consideration the evaluation made by management of the external auditors’ performance and shall include:
a) review annually the external auditors’ quality control, any material issues raised by the most recent quality control review, or peer review, of the firm, or any inquiry or investigation by governmental or professional authorities of the firm within the preceding five years, and any steps taken to deal with such issues;
b) obtain assurances from the external auditors that the audit was conducted in accordance with Canadian and US generally accepted auditing standards; and
c) ensure that management interacts professionally with the auditors and confirm such behavior annually with both parties;
4. Oversee the independence of the external auditors by, among other things:
a) requiring the external auditors to deliver to the Committee on a periodic basis a formal written statement detailing all relationships between the external auditors and the Corporation;
b) reviewing and approving the Corporation’s hiring policies regarding partners, employees and former partners and employees of current and former external auditors;
c) actively engaging in a dialogue with the external auditors with respect to any disclosed relationships or services that may impact the objectivity and independence of the external auditors and recommending that the Board take appropriate action to satisfy itself of the auditors’ independence;
d) pre-approving the nature of non-audit related services and the fees thereon;
e) conducting private sessions with the external auditors and encouraging direct communications between the Chair of the Committee and the audit partner;
f) instructing the Corporation’s external auditors that they are ultimately accountable to the Committee and the Board and that the Committee and the Board are responsible for the selection (subject to Shareholder approval), evaluation and termination of the Corporation’s external auditors;
g) have a private meeting with the external auditors at every quarterly Committee meeting;
h) obtain annually the auditors’ views on competency and integrity of the Committee and senior financial executives;
Oversight of annual and quarterly financial statements, management discussion and analysis and press releases
5. Review and approve the annual audit plan of the external auditors, including the scope of audit activities, and monitor such plan’s progress and results quarterly and at year end;
6. Confirm, through private discussions with the external auditors and management, that no restrictions are being placed on the scope of the external auditors’ work;
7. Review the appropriateness of management’s representation letter transmitted to the external auditors;
8. Receipt of certifications from the CEO and CFO;
9. Review with management the adequacy of annual and quarterly financial statements and disclosure in the management discussion and analysis and press release and recommend approval to the Board of:
a) satisfactory answers from management following the review of the annual and quarterly financial statements and management discussion and analysis and press release;
D-4 ENERPLUS 2016 ANNUAL INFORMATION FORM
b) the qualitative judgments of the external auditors about the appropriateness, not just the acceptability, of accounting principles and financial disclosure practices used or proposed to be adopted by the Corporation and, particularly, their views about alternate accounting treatments and their effects on the financial results;
c) the methods used to account for significant unusual transactions;
d) the effect of significant accounting policies in controversial or emerging areas for which there is a lack of authoritative guidance or consensus;
e) management’s process for formulating sensitive accounting estimates and the reasonableness of these estimates;
f) significant recorded and unrecorded audit adjustments;
g) any material accounting issues among management and the external auditors;
h) other matters required to be communicated to the Committee by the external auditors under generally accepted auditing standards; and
i) management’s acknowledgement of its responsibility towards the financial statements.
j) significant legal, compliance or regulatory matters that may have a material effect on the financial statements or the business of the organization (including material notices to, or inquiries received from, governmental agencies); and
k) receive the report from the Reserves Committee over the appropriateness of reported reserves and resources.
Oversight of financial reporting process, internal controls, the continuous disclosure and certification process and compliance with regulatory requirements
10. Establishment of the Corporation’s Whistleblower Policy for the submission, receipt, retention and treatment of complaints and concerns regarding accounting and auditing matters, and review any developments and responses on reports received thereunder;
11. Review the adequacy and effectiveness of the financial reporting system and internal control policies and procedures with the external auditors and management. Ensure that the Corporation complies with all new regulations in this regard;
12. Review with management the Corporation’s internal controls, and evaluate whether the Corporation is operating in accordance with prescribed policies and procedures;
13. Review with management and the external auditors any reportable condition and material weaknesses affecting internal controls;
14. Review the management disclosure and oversight Committee’s CEO and CFO certification processes to ensure compliance with US and Canadian requirements;
15. Receive periodic reports from the external auditors and management to assess the impact of significant accounting or financial reporting developments proposed by the CICA, the AICPA, the Financial Accounting Standards Board, the SEC, the relevant Canadian securities commissions, stock exchanges or other regulatory body, or any other significant accounting or financial reporting related matters that may have a bearing on the Corporation; and
16. Review annually the report of the external auditors on the Corporation’s internal controls over financial reporting describing any material issues raised by the most recent reviews of internal controls and management information systems or by any inquiry or investigation by governmental or professional authorities and any recommendations made and steps taken to deal with any such issues.
ENERPLUS 2016 ANNUAL INFORMATION FORM D-5
Review of Business Risks
17. Review with management the process followed to do the Corporation’s risk assessment and the policies to monitor, mitigate and report such business risks.
Other Matters
18. Review of appointment or dismissal of senior financial executives;
19. Conduct or authorize investigations into any matters within the Committee’s scope of responsibilities, including retaining outside counsel or other consultants or experts for this purpose;
20. Review the disclosure made in the Annual Information Form, 40-F and the Information Circular regarding the Committee;
21. Establish and maintain a free and open means of communication between the Board, the Committee, the external auditors, and management;
22. Perform such additional activities, and consider such other matters, within the scope of its responsibilities, as the Committee or the Board deems necessary or appropriate; and
23. Once a year, review the adequacy of its Charter and bring to the attention of the Board required changes, if any, for approval. The Committee is also reviewed annually by the Corporate Governance and Nominating Committee, which reports its findings to the Board.
24. Hold an in-camera session of the independent members of the Committee at each meeting of the Committee.
While the Committee has the duties and responsibilities set forth in this Charter, the Committee is not responsible for planning or conducting the audit or for determining whether the Corporation’s financial statements are complete and accurate and are in accordance with generally accepted accounting principles. Similarly, it is not the responsibility of the Committee to resolve disagreements, if any, between management and the external auditors. While it is acknowledged that the Committee is not legally obliged to ensure that the Corporation complies with all laws and regulations, the spirit and intent of this Charter is that the Committee shall take reasonable steps to encourage the Corporation to act in full compliance therewith.
D-6 ENERPLUS 2016 ANNUAL INFORMATION FORM

Enerplus Corporation
The Dome Tower
3000, 333 ‑ 7th Avenue S.W.
Calgary, Alberta, Canada
T2P 2Z1
Telephone: 403.298.2200
Toll free: 1.800.319.6462
Fax: 403.298.2211
www.enerplus.com