Table of Contents
SECURITIES AND EXCHANGE COMMISSION
Washington, D.C. 20549
Form 6-K
Report of Foreign Private Issuer
Pursuant to Rules 13a-16 or 15d-16 of
the Securities Exchange Act of 1934
for the period ended March 31, 2007
Commission file Number: 1-15154
ALLIANZ SE
Königinstrasse 28
80802 Munich
Germany
(Address of principal executive offices)
Indicate by check mark whether the registrant files or will file annual reports under cover Form 20-F or Form 40-F.
Form 20-F x Form 40-F ¨
Indicate by check mark whether the registrant by furnishing the information contained in this Form is also thereby furnishing the information to the Commission pursuant to Rule 12g3-2(b) under the Securities Exchange Act of 1934.
Yes ¨ No x
THIS REPORT ON FORM 6-K (EXCEPT FOR ANY NON-GAAP FINANCIAL MEASURE AS SUCH TERM IS DEFINED IN REGULATION G UNDER THE SECURITIES EXCHANGE ACT OF 1934, AS AMENDED) SHALL BE DEEMED TO BE INCORPORATED BY REFERENCE IN THE REGISTRATION STATEMENTS ON FORM S-8 (FILE NO. 333-13462 AND NO. 333-139900) OF ALLIANZ SE AND TO BE A PART THEREOF FROM THE DATE ON WHICH THIS REPORT IS FURNISHED, TO THE EXTENT NOT SUPERSEDED BY DOCUMENTS OR REPORTS SUBSEQUENTLY FILED OR FURNISHED. FOR THE AVOIDANCE OF DOUBT, THE DISCLOSURE CONTAINING ANY NON-GAAP FINANCIAL MEASURE CONTAINED IN THE ATTACHED REPORT IS NOT INCORPORATED BY REFERENCE INTO THE ABOVE-MENTIONED REGISTRATION STATEMENTS FILED BY ALLIANZ SE.
Table of Contents

Table of Contents
| Content | ||
| 2 | ||
| 2 | ||
| 7 | ||
| 12 | ||
| 16 | ||
| 20 | ||
| 24 | ||
| 25 | ||
| 28 | ||
| Consolidated Financial Statements for the First Quarter of 2007 | 31 | |
| 37 | ||
Development of the Allianz share price versus Dow Jones EURO STOXX 50 and Dow Jones EURO STOXX Insurance
indexed on the Allianz share price in€
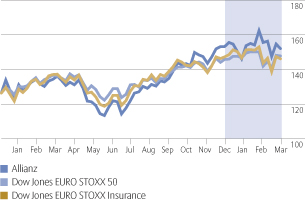
Source: Thomson Financial Datastream
Current information on the development of the Allianz share price is available on the internet atwww.allianz.com/stock.
Basic Allianz share information
| Share type | Registered share with restricted transfer | |||
| Denomination | No-par-value share | |||
| Stock exchanges | All German stock exchanges, London, Paris, Zurich, Milan, New York | |||
| Security Codes | WKN 840 400 ISIN DE 000 840 400 5 | |||
| Bloomberg | ALV GY | |||
| Reuters | ALVG.DE |
Investor Relations
We endeavour to keep our shareholders up-to-date on all company developments. Our Investor Relations Team is pleased to answer any questions you may have.
Allianz SE
Investor Relations
Koeniginstrasse 28
80802 Muenchen
Germany
| Investor Line: | + 49 1802 2554269 | |||
| + 49 1802 ALLIANZ | ||||
| Fax: | + 49 89 3800 3899 | |||
| E-mail: investor.relations@allianz.com | ||||
| Internet:www.allianz.com/investor-relations | ||||
Table of Contents
Allianz Group Key Data
Balance sheet
As of March 31, 2007 € mn | As of December 31, € mn | Change from previous year | ||||||||||
| Investments | 298,763 | 298,134 | 0.2% | |||||||||
| Loans and advances to banks and customers | 444,446 | 408,278 | 8.9% | |||||||||
| Total assets | 1,102,373 | 1,053,226 | 4.7% | |||||||||
| Liabilities to banks and customers | 393,010 | 361,078 | 8.8% | |||||||||
| Reserves for loss and loss adjustment expenses | 64,200 | 65,464 | (1.9)% | |||||||||
| Reserves for insurance and investment contracts | 289,390 | 287,697 | 0.6% | |||||||||
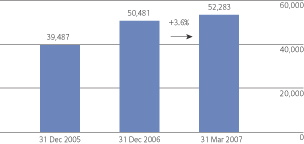
| Shareholders’ equity | 52,283 | 50,481 | 3.6% | |||||||||
| Minority interests | 6,639 | 6,409 | 3.6% |
Allianz SE ratings as of March 31, 20071)
Standard & Poor’s | Moody’s | A.M. Best | ||||||||||
| Insurer financial strength | AA– | Aa3 | A+ | |||||||||
| Outlook | Positive | Stable | Stable | |||||||||
| Counterparty credit | AA– | Not rated | aa–2) | |||||||||
| Outlook | Positive | Stable | ||||||||||
| Senior unsecured debt | AA– | Aa3 | aa– | |||||||||
| Outlook | Stable | Stable | ||||||||||
| Subordinated debt | A/A–3) | A2/A33) | a+/a3) | |||||||||
| Outlook | Stable | Stable | ||||||||||
Commercial paper (short term) | A-1+ | P-1 | Not rated | |||||||||
| Outlook | Stable | |||||||||||
1) | Includes ratings for securities issued by Allianz Finance B.V., Allianz Finance II B.V. and Allianz Finance Corporation. |
2) | Issuer credit rating. |
3) | Ratings vary on the basis of maturity period and terms. |
Other selected financial data
| Three months ended March 31, | 2007 | 2006 | Change from year | |||||||||||
| Income statement | ||||||||||||||
| Total revenues1) | € mn | 29,323 | 29,641 | (1.1)% | ||||||||||
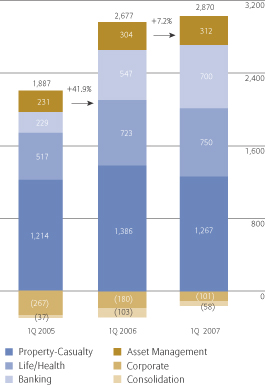
| Operating profit2) | € mn | 2,870 | 2,677 | 7.2% | ||||||||||
| Income before income taxes and minority interests in earnings | € mn | 4,556 | 3,031 | 50.3% | ||||||||||
| Net income | € mn | 3,240 | 1,779 | 82.1% | ||||||||||
| Return | ||||||||||||||
| Return on equity after income taxes3) | % | 6.3 | 4.4 | 1.9 pts | ||||||||||
| Segments | ||||||||||||||
| Property-Casualty | ||||||||||||||
| Operating profit2) | € mn | 1,267 | 1,386 | (8.6)% | ||||||||||
| Loss ratio | % | 68.2 | 66.2 | 2.0 pts | ||||||||||
| Expense ratio | % | 28.6 | 28.5 | 0.1 pts | ||||||||||
| Combined ratio | % | 96.8 | 94.7 | 2.1 pts | ||||||||||
| Life/Health | ||||||||||||||
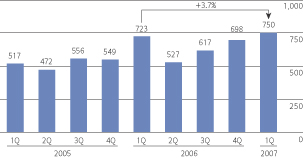
| Operating profit2) | € mn | 750 | 723 | 3.7% | ||||||||||
| Statutory expense ratio | % | 7.2 | 8.2 | (1.0) pts | ||||||||||
| Banking | ||||||||||||||
| Operating profit2) | € mn | 700 | 547 | 28.0% | ||||||||||
| Cost-income ratio | % | 66.9 | 73.6 | (6.7) pts | ||||||||||
| Loan loss provisions | € mn | 5 | 33 | (84.8)% | ||||||||||
| Coverage ratio as of March 31,4) | % | 61.3 | 60.4 | 0.9 pts | ||||||||||
Asset Management | ||||||||||||||
| Operating profit2) | € mn | 312 | 304 | 2.6% | ||||||||||
| Cost-income ratio | % | 60.0 | 59.5 | 0.5 pts | ||||||||||
| Third-party assets under management as of March 31, | € bn | 781 | 7645) | 2.2% | ||||||||||
| Share information | ||||||||||||||
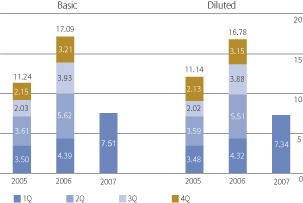
| Basic earnings per share | € | 7.51 | 4.39 | 71.1% | ||||||||||
| Diluted earnings per share | € | 7.34 | 4.32 | 69.9% | ||||||||||
| Share price as of March 31, | € | 153.71 | 154.765) | (0.7)% | ||||||||||
| Market capitalization as of March 31, | € bn | 66.4 | 66.95) | (0.7)% |
1) | Total revenues comprise Property-Casualty segment’s gross premiums written, Life/Health segment’s statutory premiums, Banking segment’s operating revenues and Asset Management segment’s operating revenues. |
2) | The Allianz Group uses operating profit to evaluate the performance of its business segments and the Group as a whole. |
3) | Based on average shareholders’ equity. Average shareholders’ equity has been calculated based upon the average of the current and preceding end of period’s shareholders’ equity. |
4) | Represents total loan loss allowances as a percentage of total non- performing loans and potential problem loans. |
5) | As of December 31, 2006. |
1
Table of Contents
Allianz Group Interim Report First Quarter of 2007
Good start to 2007 and on track to achieve our targets.
| • | Total revenues in line with expectations. |
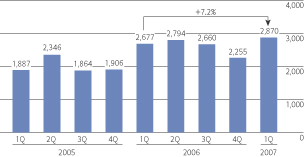
| • | Operating profit was up 7.2% to€ 2.9 billion. |
| • | € 2.0 billion of realized capital gains. |
| • | Net income of€ 3.2 billion. |
| • | Shareholder’s equity increased to€ 52.3 billion. |
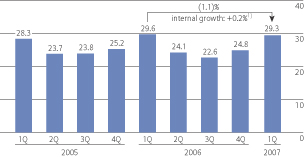
Total revenues
in€ bn
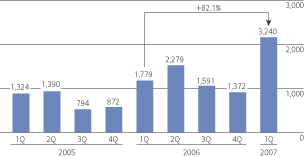
Net income
in€ mn
Operating profit
in€ mn
Shareholders’ equity2)
in€ mn
1) | Internal total revenue growth excludes the effects of foreign currency translation as well as acquisitions and disposals. Please see page 29 for a reconciliation of nominal total revenue growth to internal total revenue growth for each of our segments and the Allianz Group as a whole. |
2) | Does not include minority interests. |
2
Table of Contents
Group Management Report
Allianz Group’s Consolidated Results of Operations
Total revenues
Total revenues – Segments
in€ mn
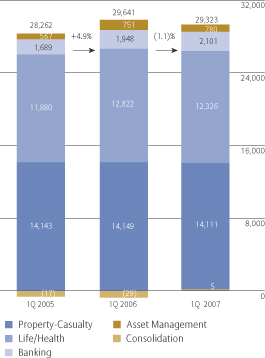
At € 29.3 billion, total revenues were slightly up 0.2% on an internal growth basis, in line with our expectations. Due largely to the depreciation of the U.S. Dollar compared to the Euro primarily impacting the development in our Property-Casualty, Life/Health and Asset Management segments, overall, total revenues declined by 1.1%.
Property-Casualty Gross premiums written were flat at € 14.1 billion, principally reflecting slightly increased volume offset by a negative price impact of a similar magnitude. We continued to stay disciplined in our risk selection and to focus on profitability.
Life/Health At € 12.3 billion, statutory premiums were down 2.0% from a year earlier before foreign currency translation effects, however this was not unexpected. We recorded strong growth in our Italian bancassurance
distribution channel at RAS Group, while our operations in the United States successfully stabilized statutory premium level compared to 4Q 2006, although it was significantly down from 1Q 2006. However, the slowdown at our U.S. entities bottoms out.
Banking Our Banking segment’s operating revenues, at € 2.1 billion in 1Q 2007, exceeded the already outstanding prior year level by 7.9%. This increase was supported by a significant positive one-off effect within our net interest income.
Asset Management Internal operating revenue growth was 9.9%, benefiting from the growth of third-party assets with solid net inflows of € 12 billion based on our consistent strong investment performance. Together with effects from market-related appreciation of € 13 billion and negative foreign currency impacts, third-party assets as of March 31, 2007 amounted to € 781 billion, up 2.2% from December 31, 2006.
Operating profit
Operating profit – Segments
in€ mn
3
Table of Contents
Allianz Group Interim Report First Quarter of 2007
Except for Property-Casualty, where losses from natural catastrophes had a significant impact, all business segments delivered higher operating profits than a year ago.
Property-Casualty We had another quarter of strong operating profitability, “Kyrill”, one of the heaviest winterstorms in Europe ever, caused net losses of € 340 million. Despite this burden, operating profit only decreased € 119 million from a year ago.
Life/Health Operating profit, at € 750 million in 1Q 2007, was up 3.7% from an already strong level a year ago. We continued to benefit from our growing asset base, while, at the same time, our operating margin also increased.
Banking Operating profit grew 28.0% over the already outstanding level last year, benefiting from higher revenues and lower expenses.
Asset Management Operating profit was up 2.6%. On a local currency basis, the increase was 9.9%. These improvements were driven by our growing asset base and tight expense management. At 60.0% in 1Q 2007, our cost-income ratio remained at a very competitive level.
Non-operating items
Non-operating items created an aggregate income of € 1.7 billion in 1Q 2007, compared to € 354 million a year ago, primarily due to a high level of realized capital gains.
Overall, the impact from net realized gains and impairments of investments amounted to € 2.0 billion, up from € 778 million last year. This coincided with the early redemption of 64.35% of our BITES bond with shares of Münchener Rückversicherungs-Gesellschaft Aktiengesellschaft (“Munich Re”). Furthermore, we realized significant gains from the sale of shares in BMW AG and KarstadtQuelle AG. We locked in unrealized gains after the strong performance of our equity investments and generated in 1Q 2007 a significant part of our capital gains target for 2007. In addition, these gains were also harvested in preparation for the contemplated acquisition of the outstanding shares in Assurances Générales de France (“AGF”, and together with its subsidiaries, the “AGF Group”) that Allianz SE does not already own.
Net income
Following the operating profit growth and the high level of realized capital gains, net income in 1Q 2007 rose 82.1% over the prior year period to € 3.2 billion.
Income tax expenses at € 967 million remained relatively stable despite the significant increase in income before income taxes and minority interests in earnings, primarily benefiting from the tax-exemption of the realized capital gains. Hence, our effective tax rate dropped from 29.7% to 21.2%.
Minority interests in earnings were flat at € 349 million. Increased minority interests in higher earnings at AGF Group in France and at our credit insurer Euler Hermes were offset by now zero minority interests at Riunione Adriatica di Sicurtà S.p.A. (or “RAS”, and taken together with its subsidiaries, the “RAS Group”) in Italy following the execution of RAS’s merger with and into Allianz SE in October 2006. The high level of realized gains arose in entities with almost no minority interests.
Earnings per share1)
in€
1) | See Note 37 to our consolidated financial statements for further details. |
4
Table of Contents
Group Management Report
The following table summarizes the total revenues, operating profit and net income for each of our segments for the three months ended March 31, 2007 and 2006, as well as IFRS consolidated net income of the Allianz Group.
| Three months ended March 31, | Property- Casualty | Life/Health
€ mn | Banking
€ mn | Asset Management € mn | Corporate
€ mn | Consolidation adjustments € mn | Allianz Group
€ mn | |||||||||||||||||||||
| 2007 | ||||||||||||||||||||||||||||
| Total revenues1) | 14,111 | 12,326 | 2,101 | 780 | — | 5 | 29,323 | |||||||||||||||||||||
| Operating profit (loss) | 1,267 | 750 | 700 | 312 | (101) | (58) | 2,870 | |||||||||||||||||||||
| Non-operating items | 664 | 103 | 117 | (122) | 511 | 413 | 1,686 | |||||||||||||||||||||
| Income (loss) before income taxes and minority interests in earnings | 1,931 | 853 | 817 | 190 | 410 | 355 | 4,556 | |||||||||||||||||||||
| Income taxes | (537) | (201) | (168) | (80) | (25) | 44 | (967) | |||||||||||||||||||||
| Minority interests in earnings | (214) | (99) | (24) | (11) | (4) | 3 | (349) | |||||||||||||||||||||
| Net income (loss) | 1,180 | 553 | 625 | 99 | 381 | 402 | 3,240 | |||||||||||||||||||||
| 2006 | ||||||||||||||||||||||||||||
| Total revenues1) | 14,149 | 12,822 | 1,948 | 751 | — | (29) | 29,641 | |||||||||||||||||||||
| Operating profit (loss) | 1,386 | 723 | 547 | 304 | (180) | (103) | 2,677 | |||||||||||||||||||||
| Non-operating items | 428 | 158 | 392 | (136) | (211) | (277) | 354 | |||||||||||||||||||||
| Income (loss) before income taxes and minority interests in earnings | 1,814 | 881 | 939 | 168 | (391) | (380) | 3,031 | |||||||||||||||||||||
| Income taxes | (524) | (219) | (245) | (65) | 154 | — | (899) | |||||||||||||||||||||
| Minority interests in earnings | (190) | (128) | (28) | (13) | (2) | 8 | (353) | |||||||||||||||||||||
| Net income (loss) | 1,100 | 534 | 666 | 90 | (239) | (372) | 1,779 |
1) | Total revenues comprise Property-Casualty segment’s gross premiums written, Life/Health segment’s statutory premiums, Banking segment’s operating revenues and Asset Management segment’s operating revenues. |
5
Table of Contents
Allianz Group Interim Report First Quarter of 2007
Events After the Balance Sheet Date
See Note 41 to the consolidated financial statements.
Outlook
Our outlook remains unchanged.
In the years 2007 to 2009, we expect average annual consolidated operating profit growth of 10% from the 2006 level, adjusted for the particularly favorable natural catastrophe trend in 2006. Within the same time period,
we are striving to maintain a strong combined ratio of less than 94% on average in our Property-Casualty segment. In Life/Health we aim to achieve an average new business margin1) greater than 3%. We are also confident of an average return on risk-adjusted capital in our Banking segment of above 15%. For our Asset Management segment, we are targeting average annual growth of third-party assets under management of 10%, excluding foreign currency conversion effects.
As always, natural catastrophes and adverse developments in the capital markets, as well as the factors stated below in our cautionary note regarding forward-looking statements, may severely impact our results of operations.
Cautionary Note Regarding Forward-Looking Statements
The statements contained herein may include statements of future expectations and other forward-looking statements that are based on management’s current views and assumptions and involve known and unknown risks and uncertainties that could cause actual results, performance or events to differ materially from those expressed or implied in such statements. In addition to statements which are forward-looking by reason of context, the words “may”, “will”, “should”, “expects”, “plans”, “intends”, “anticipates”, “believes”, “estimates”, “predicts”, “potential”, or “continue” and similar expressions identify forward-looking statements.
Actual results, performance or events may differ materially from those in such statements due to, without limitation, (i) general economic conditions, including in particular economic conditions in the Allianz Group’s core business and core markets, (ii) performance of financial markets, including emerging markets, (iii) the frequency and severity of insured loss events, (iv) mortality and
morbidity levels and trends, (v) persistency levels, (vi) the extent of credit defaults, (vii) interest rate levels, (viii) currency exchange rates including the Euro/U.S. Dollar exchange rate, (ix) changing levels of competition, (x) changes in laws and regulations, including monetary convergence and the European Monetary Union, (xi) changes in the policies of central banks and/or foreign governments, (xii) the impact of acquisitions, including related integration issues, (xiii) reorganization measures, and (xiv) general competitive factors, in each case on a local, regional, national and/or global basis. Many of these factors may be more likely to occur, or more pronounced, as a result of terrorist activities and their consequences.
The matters discussed herein may also be affected by risks and uncertainties described from time to time in Allianz SE’s filings with the U.S. Securities and Exchange Commission. The company assumes no obligation to update any forward-looking statement.
1) | New business margin according to the definition of European Embedded Value. |
6
Table of Contents
Group Management Report
Property-Casualty Insurance Operations
Strong operating profit despite “Kyrill”.
| • | 3.7% impact on loss ratio from natural catastrophes. |
| • | We grew selectively and stayed disciplined. |
| • | Higher yields drove current investment income. |
Earnings Summary
Gross premiums written
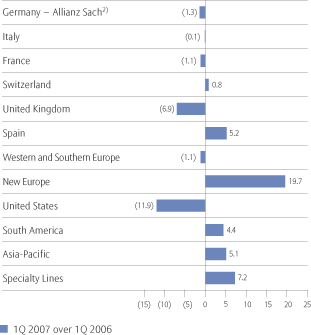
Gross premiums written by region1)
in %

1) | After elimination of transactions between Allianz Group companies in different geographic regions and different segments. Gross premiums written from our specialty lines have been allocated to the respective geographic regions. |
1Q 2007 was another quarter of selective profitable growth. Our gross premiums written remained basically flat overall at € 14,111 million, principally reflecting our successful cycle management efforts. On an internal our
Gross premiums written – Growth rates1)
in %
1) | Before elimination of transactions between Allianz Group companies in different geographic regions and different segments. |
2) | Together with our property-casualty assumed reinsurance business, primarily attributable to Allianz SE, the decline within Germany was 4.9%. |
successful cycle management efforts. On an internal basis, gross premiums written slightly increased by 0.3%. The development of gross premiums varied considerably across our various markets and operations.
7
Table of Contents
Allianz Group Interim Report First Quarter of 2007
At Allianz Sach within Germany, gross premiums written decreased moderately by 1.3% to € 4,144 million as premiums from our motor business were down, largely reflecting higher no claims bonuses.
Growth was primarily achieved within our markets in Central and Eastern Europe, at Allianz Global Corporate & Specialty, and in Spain, with additional gross premiums written of € 110 million, € 64 million, and € 34 million, respectively. Within New Europe, our subsidiaries successfully leveraged the well-performing economies in this region. In particular, our motor business in Romania and Poland delivered solid premium growth from higher volumes. Furthermore, the first-time consolidation of Russian People’s Insurance Society “Rosno” contributed to the higher premium volume within New Europe. At Allianz Global Corporate & Specialty, gross premiums written benefited from increased business volumes in the United Kingdom and North America. Our Spanish operations recorded growth due to increased sales in motor business, a good performance of our direct distribution channel Fénix Directo and a favorable volume development in the industrial line of business.
At Fireman’s Fund Insurance Company in the United States, the decline of 11.9% in gross premiums written resulted mainly from the depreciation of the U.S. Dollar against the Euro. Based on internal growth gross premiums written were down 4.0% reflecting primarily a lower volume of crop insurance business.
Operating profit
Operating profit
in€ mn
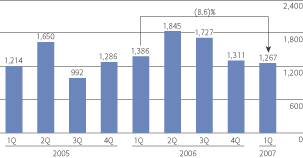
Operating profit, at € 1,267 million in 1Q 2007, was again strong, despite net losses from natural catastrophes of € 349 million, of which € 340 million related to winterstorm “Kyrill” in Europe. Catastrophe risk (“CAT risk”) is an integral part of our property-casualty business and we therefore manage and quantify CAT risk and price for it. We, at the same time, closely monitor severity and frequency of all other claims to determine our underlying profitability, which is measured by accident year loss ratio without natural catastrophes and which we were able to reduce by 1.0 percentage point to 66.7%. We continued to benefit from our strong underwriting profitability and our initiatives to improve claims management processes. With the impact from natural catastrophes our accident year loss ratio increased from 68.1% a year ago to 70.4%. At 2.2%, compared to 1.9% in 1Q 2006, the net development in prior year’s loss reserves remained positive.
Overall, natural catastrophes drove up net claims and insurance benefits incurred by € 201 million to € 6,383 million. Hence, on a calendar year basis, our loss ratio was up from 66.2% to 68.2%. With a nearly flat expense ratio, our combined ratio increased from 94.7% to 96.8%.
Interest and similar income rose by € 84 million to € 1,006 million, mainly reflecting higher yields on debt securities.
8
Table of Contents
Group Management Report
Other income amounted to € 84 million, up € 70 million due to a gain on the disposal of an office building in Ireland.
Top contributing markets to our operating profit included Italy at € 175 million and the United States at € 166 million. The strongest absolute increases were recorded in Ireland by € 71 million and Italy by € 67 million. In Germany we experienced a decrease in operating profit of € 254 million, mainly attributable to losses associated with “Kyrill”.
Non-operating items
In aggregate, non-operating items rose substantially by 55.1% to a gain of € 664 million. This improvement resulted predominantly from higher net realized gains from investments which amounted to € 733 million, up € 294 million from a year ago.
Net income
Net income was up 7.3% to € 1,180 million, driven both by the solid operating profit development and a significantly higher aggregate gain from non-operating items.
Income tax expenses, at € 537 million in 1Q 2007, remained stable. Based on considerably increased income before income taxes and minority interests in earnings, our effective tax rate decreased from 28.9% to 27.8%, benefiting from, among other factors, tax-exempted realized gains.
Minority interests in earnings rose by € 24 million to € 214 million. The execution of the merger of RAS with and into Allianz SE in October 2006 led to now zero minority interests in earnings at our Italian subsidiary. However, higher earnings at our French property-casualty operations of AGF Group as well as at Euler Hermes had a more than offsetting increasing effect.
9
Table of Contents
Allianz Group Interim Report First Quarter of 2007
The following table sets forth our Property-Casualty insurance segment’s income statement, loss ratio, expense ratio and combined ratio for the three months ended March 31, 2007 and 2006.
| Three months ended March 31, | 2007 € mn | 2006 € mn | ||||||
| Gross premiums written1) | 14,111 | 14,149 | ||||||
| Ceded premiums written | (1,586) | (1,712) | ||||||
| Change in unearned premiums | (3,167) | (3,096) | ||||||
| Premiums earned (net) | 9,358 | 9,341 | ||||||
| Interest and similar income | 1,006 | 922 | ||||||
| Income from financial assets and liabilities designated at fair value through income (net)2) | 32 | 36 | ||||||
| Income from financial assets and liabilities held for trading (net), shared with policyholders2) | (15) | — | ||||||
| Realized gains/losses (net) from investments, shared with policyholders3) | 34 | 25 | ||||||
| Fee and commission income | 272 | 252 | ||||||
| Other income | 84 | 14 | ||||||
| Operating revenues | 10,771 | 10,590 | ||||||
| Claims and insurance benefits incurred (net) | (6,383) | (6,182) | ||||||
| Changes in reserves for insurance and investment contracts (net) | (81) | (72) | ||||||
| Interest expense | (92) | (63) | ||||||
| Loan loss provisions | — | (1) | ||||||
| Impairments of investments (net), shared with policyholders4) | (2) | (4) | ||||||
| Investment expenses | (74) | (48) | ||||||
| Acquisition and administrative expenses (net) | (2,675) | (2,663) | ||||||
| Fee and commission expenses | (197) | (170) | ||||||
| Other expenses | — | (1) | ||||||
| Operating expenses | (9,504) | (9,204) | ||||||
| Operating profit | 1,267 | 1,386 | ||||||
| Income from financial assets and liabilities held for trading (net), not shared with policyholders2) | (29) | 4 | ||||||
| Realized gains/losses (net) from investments, not shared with policyholders3) | 733 | 439 | ||||||
| Impairments of investments (net), not shared with policyholders4) | (24) | (9) | ||||||
| Amortization of intangible assets | (2) | (4) | ||||||
| Restructuring charges | (14) | (2) | ||||||
| Non-operating items | 664 | 428 | ||||||
| Income before income taxes and minority interests in earnings | 1,931 | 1,814 | ||||||
| Income taxes | (537) | (524) | ||||||
| Minority interests in earnings | (214) | (190) | ||||||
| Net income | 1,180 | 1,100 | ||||||
| Loss ratio5)in % | 68.2 | 66.2 | ||||||
| Expense ratio6)in % | 28.6 | 28.5 | ||||||
| Combined ratio7)in % | 96.8 | 94.7 |
1) | For the Property-Casualty segment, total revenues are measured based upon gross premiums written. |
2) | The total of these items equals income from financial assets and liabilities carried at fair value through income (net) in the segment income statement included in Note 3 to the consolidated financial statements. |
3) | The total of these items equals realized gains/losses (net) in the segment income statement included in Note 3 to the consolidated financial statements. |
4) | The total of these items equals impairments of investments (net) in the segment income statement included in Note 3 to the consolidated financial statements. |
5) | Represents claims and insurance benefits incurred (net) divided by premiums earned (net). |
6) | Represents acquisition and administrative expenses (net) divided by premiums earned (net). |
7) | Represents the total of acquisition and administrative expenses (net) and claims and insurance benefits incurred (net) divided by premiums earned (net). |
10
Table of Contents
Group Management Report
Property-Casualty Operations by Geographic Region
The following table sets forth our Property-Casualty gross premiums written, premiums earned (net), combined ratio, loss ratio, expense ratio and operating profit by geographic region for the three months ended March 31, 2007 and 2006. Consistent with our general practice, these figures are presented before consolidation adjustments, representing the elimination of transactions between Allianz Group companies in different geographic regions and different segments.
| Gross premiums written | Premiums earned (net) | Combined ratio | Loss ratio | Expense ratio | Operating profit | |||||||||||||||||||||||||||||||||||||||||||
| Three months ended March 31, | 2007 € mn | 2006 € mn | 2007 € mn | 2006 € mn | 2007 % | 2006 % | 2007 % | 2006 % | 2007 % | 2006 % | 2007 € mn | 2006 € mn | ||||||||||||||||||||||||||||||||||||
| Germany | 4,616 | 4,853 | 2,267 | 2,412 | 103.2 | 92.7 | 73.6 | 59.6 | 29.6 | 33.1 | 115 | 369 | ||||||||||||||||||||||||||||||||||||
| France | 1,695 | 1,713 | 1,114 | 1,114 | 101.2 | 101.0 | 73.7 | 74.3 | 27.5 | 26.7 | 75 | 78 | ||||||||||||||||||||||||||||||||||||
| Italy | 1,246 | 1,247 | 1,197 | 1,205 | 93.4 | 96.8 | 70.1 | 72.9 | 23.3 | 23.9 | 175 | 108 | ||||||||||||||||||||||||||||||||||||
| United Kingdom | 539 | 579 | 491 | 457 | 96.3 | 98.9 | 62.9 | 67.9 | 33.4 | 31.0 | 63 | 56 | ||||||||||||||||||||||||||||||||||||
| Switzerland | 966 | 958 | 404 | 436 | 97.6 | 96.3 | 70.3 | 70.2 | 27.3 | 26.1 | 51 | 63 | ||||||||||||||||||||||||||||||||||||
| Spain | 691 | 657 | 434 | 395 | 90.1 | 91.4 | 71.2 | 72.7 | 18.9 | 18.7 | 69 | 58 | ||||||||||||||||||||||||||||||||||||
Netherlands | 306 | 318 | 198 | 198 | 93.6 | 93.4 | 62.2 | 59.5 | 31.4 | 33.9 | 24 | 27 | ||||||||||||||||||||||||||||||||||||
Austria | 351 | 357 | 183 | 192 | 97.3 | 109.8 | 76.6 | 86.4 | 20.7 | 23.4 | 21 | (6) | ||||||||||||||||||||||||||||||||||||
Ireland | 203 | 198 | 151 | 153 | 93.2 | 91.8 | 68.6 | 67.7 | 24.6 | 24.1 | 98 | 27 | ||||||||||||||||||||||||||||||||||||
Belgium | 124 | 121 | 75 | 74 | 109.2 | 101.7 | 75.3 | 65.4 | 33.9 | 36.3 | 5 | 9 | ||||||||||||||||||||||||||||||||||||
Portugal | 80 | 84 | 62 | 66 | 89.5 | 87.3 | 60.9 | 65.5 | 28.6 | 21.8 | 10 | 11 | ||||||||||||||||||||||||||||||||||||
Greece | 21 | 19 | 12 | 11 | 85.8 | 95.1 | 56.7 | 65.6 | 29.1 | 29.5 | 3 | 1 | ||||||||||||||||||||||||||||||||||||
Western and Southern Europe | 1,085 | 1,097 | 681 | 694 | 95.7 | 98.0 | 68.7 | 70.2 | 27.0 | 27.8 | 1661) | 741) | ||||||||||||||||||||||||||||||||||||
Hungary | 194 | 192 | 126 | 127 | 92.1 | 91.9 | 64.8 | 64.6 | 27.3 | 27.3 | 23 | 27 | ||||||||||||||||||||||||||||||||||||
Slovakia | 106 | 93 | 67 | 62 | 66.4 | 80.2 | 40.3 | 46.9 | 26.1 | 33.3 | 28 | 17 | ||||||||||||||||||||||||||||||||||||
Czech Republic | 78 | 81 | 45 | 43 | 79.8 | 90.1 | 57.6 | 67.3 | 22.2 | 22.8 | 12 | 5 | ||||||||||||||||||||||||||||||||||||
Poland | 86 | 72 | 56 | 47 | 96.4 | 96.4 | 63.8 | 65.5 | 32.6 | 30.9 | 5 | 3 | ||||||||||||||||||||||||||||||||||||
Romania | 90 | 71 | 36 | 36 | 103.8 | 89.6 | 80.8 | 71.4 | 23.0 | 18.2 | — | 3 | ||||||||||||||||||||||||||||||||||||
Bulgaria | 23 | 20 | 16 | 17 | 77.5 | 74.1 | 39.0 | 44.4 | 38.5 | 29.7 | 4 | 5 | ||||||||||||||||||||||||||||||||||||
Croatia | 23 | 22 | 15 | 13 | 97.7 | 96.5 | 68.5 | 65.7 | 29.2 | 30.8 | 1 | 1 | ||||||||||||||||||||||||||||||||||||
Russia2) | 68 | 7 | 45 | 1 | 104.8 | 60.3 | 66.5 | 28.2 | 38.3 | 32.1 | 1 | 1 | ||||||||||||||||||||||||||||||||||||
New Europe | 668 | 558 | 406 | 346 | 90.3 | 89.2 | 60.6 | 61.5 | 29.7 | 27.7 | 74 | 62 | ||||||||||||||||||||||||||||||||||||
| Other Europe | 1,753 | 1,655 | 1,087 | 1,040 | 93.2 | 95.2 | 65.6 | 67.3 | 27.6 | 27.9 | 240 | 136 | ||||||||||||||||||||||||||||||||||||
| United States | 882 | 1,001 | 801 | 886 | 90.8 | 90.2 | 57.0 | 59.8 | 33.8 | 30.4 | 166 | 199 | ||||||||||||||||||||||||||||||||||||
| Mexico3) | 39 | 51 | 19 | 25 | 84.5 | 108.8 | 58.2 | 84.0 | 26.3 | 24.8 | 5 | 3 | ||||||||||||||||||||||||||||||||||||
| NAFTA | 921 | 1,052 | 820 | 911 | 90.6 | 90.7 | 57.0 | 60.4 | 33.6 | 30.3 | 171 | 202 | ||||||||||||||||||||||||||||||||||||
| Australia | 352 | 334 | 304 | 300 | 102.4 | 102.5 | 77.9 | 77.6 | 24.5 | 24.9 | 50 | 38 | ||||||||||||||||||||||||||||||||||||
| Other | 81 | 78 | 37 | 34 | 100.5 | 95.2 | 60.5 | 57.8 | 40.0 | 37.4 | 3 | 4 | ||||||||||||||||||||||||||||||||||||
| Asia-Pacific | 433 | 412 | 341 | 334 | 102.2 | 101.7 | 76.0 | 75.5 | 26.2 | 26.2 | 53 | 42 | ||||||||||||||||||||||||||||||||||||
| South America | 236 | 226 | 168 | 152 | 100.1 | 103.0 | 65.3 | 66.5 | 34.8 | 36.5 | 14 | 12 | ||||||||||||||||||||||||||||||||||||
| Other | 34 | 25 | 8 | 5 | —4) | —4) | —4) | —4) | —4) | —4) | 3 | 1 | ||||||||||||||||||||||||||||||||||||
| Specialty lines | ||||||||||||||||||||||||||||||||||||||||||||||||
| Credit Insurance | 489 | 468 | 301 | 260 | 76.3 | 81.1 | 48.5 | 53.9 | 27.8 | 27.2 | 117 | 95 | ||||||||||||||||||||||||||||||||||||
| Allianz Global Corporate & Specialty | 934 | 870 | 467 | 389 | 94.0 | 83.1 | 66.3 | 62.6 | 27.7 | 20.5 | 95 | 145 | ||||||||||||||||||||||||||||||||||||
| Travel Insurance and Assistance Services | 296 | 266 | 259 | 231 | 100.6 | 101.5 | 54.9 | 61.8 | 45.7 | 39.7 | 31 | 22 | ||||||||||||||||||||||||||||||||||||
| Subtotal | 14,849 | 14,981 | 9,358 | 9,341 | — | — | — | — | — | — | 1,272 | 1,387 | ||||||||||||||||||||||||||||||||||||
| Consolidation adjustments5) | (738) | (832) | — | — | — | — | — | — | — | — | (5) | (1) | ||||||||||||||||||||||||||||||||||||
| Total | 14,111 | 14,149 | 9,358 | 9,341 | 96.8 | 94.7 | 68.2 | 66.2 | 28.6 | 28.5 | 1,267 | 1,386 | ||||||||||||||||||||||||||||||||||||
1) | Contains run-off of€ 5 mn in both 1Q 2007 and 1Q 2006 from a former operating entity located in Luxembourg. |
2) | Effective February 21, 2007, Russian People’s Insurance Society “Rosno” was consolidated following the acquisition of approximately 49.2% of the shares in Rosno by the Allianz Group, increasing our holding to approximately 97%. |
3) | Effective 1Q 2007, life business in Mexico is shown within the Life/Health segment. |
4) | Presentation not meaningful. |
5) | Represents elimination of transactions between Allianz Group companies in different geographic regions. |
11
Table of Contents
Allianz Group Interim Report First Quarter of 2007
Life/Health Insurance Operations
Promising start going into 2007.
| • | Significant revenue growth in Italy, first signs of recovery in the United States. |
| • | Strong level of operating profitability maintained. |
| • | Investment income grew with asset base. |
Earnings Summary
Statutory premiums
Statutory premiums by region1)
in %
1) | After elimination of transactions between Allianz Group companies in different geographic regions and different segments. |
Statutory premiums, at € 12,326 million in 1Q 2007, were in line with our expectations, albeit down 3.9% from a year earlier. Nearly half of that decrease was brought about by negative currency conversion effects, primarily from the depreciation of the U.S. Dollar and of various currencies in the Asia-Pacific region compared to the Euro. On an internal growth basis, statutory premiums declined 2.0%.
Statutory premiums – Growth rates1)
in %
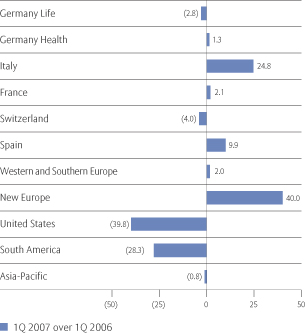
1) | Before elimination of transactions between Allianz Group companies in different geographic regions and different segments. |
In Italy, total revenues increased by € 562 million, mainly as our bancassurance distribution channel at RAS Group showed strong growth. Statutory premiums in the United States decreased by € 1,103 million from the very high level of a year ago. However, the slowdown at Allianz Life bottoms out.
12
Table of Contents
Group Management Report
In Germany, total life revenues were down € 89 million to € 3,039 million in 1Q 2007. A year ago, the sale of so- called “Riester” pension products was promoted by an increase at that time in the maximum premium amount entitled to subsidies and tax incentives according to German law. Partially offsetting this negative effect on premium development were higher volumes of new recurring premium business versus last year.
Aggregate statutory premiums from our growth markets in Central and Eastern Europe significantly increased by € 112 million to € 392 million. In the fourth quarter of 2006, we successfully launched a limited-edition index-linked life insurance product across six markets which largely contributed to this increase. The highest absolute growth in the region was generated in Poland where we also continued to record increasing sales through our bank partner.
Our operations in Taiwan and China grew significantly. In China, statutory premiums grew primarily due to our expanded sales capacity. In South Korea, total revenues were down following regulatory discussions regarding variable annuity products.
Operating profit
Operating profit
in€ mn
Operating profit was € 750 million in 1Q 2007, up 3.7% from an already very high level a year ago. On balance, this improvement was a result of lower expenses. The markets which contributed strongest to operating profit were Germany, France, Italy, the United States and South Korea.
Interest and similar income continued to increase in line with our growing asset base. Income from financial assets and liabilities carried at fair value through income amounted to a net charge of € 311 million in 1Q 2007 mainly as we observed negative effects from the accounting treatment for certain derivative instruments.
Net acquisition and administrative expenses were down € 151 million to € 874 million. This development reflected primarily adjustments within our deferred acquisition costs asset as a result of the regular review of calculation parameters. Consequently, our statutory expense ratio decreased 1.0 percentage point to 7.2%.
Non-operating items
Income from non-operating items, at € 103 million in 1Q 2007, was down € 55 million from a year earlier. This development resulted primarily from lower net realized gains from investments, not shared with policyholders, at our U.S. operations.
Net income
Net income increased € 19 million to € 553 million. Lower income tax expenses and minority interests in earnings more than balanced the € 28 million decline in income before income taxes and minority interests in earnings.
13
Table of Contents
Allianz Group Interim Report First Quarter of 2007
With income tax expenses down € 18 million to € 201 million, our effective tax rate decreased to 23.6% in 1Q 2007 from 24.9% a year ago. A key factor in this decline was a relatively higher tax-exempted income in 1Q 2007 compared to last year.
Minority interests in earnings decreased to € 99 million primarily as a result of now zero minority interests at RAS in Italy following the execution of its merger with and into Allianz SE, and lower earnings at the life operating entities of AGF Group in France.
The following table sets forth our Life/Health insurance segment’s income statement and statutory expense ratio for the three months ended March 31, 2007 and 2006.
| Three months ended March 31, | 2007 € mn | 2006 € mn | ||||||
Statutory premiums1) | 12,326 | 12,822 | ||||||
Ceded premiums written | (193) | (196) | ||||||
Change in unearned premiums | (27) | (75) | ||||||
Statutory premiums (net) | 12,106 | 12,551 | ||||||
Deposits from SFAS 97 insurance and investment contracts | (6,921) | (7,472) | ||||||
Premiums earned (net) | 5,185 | 5,079 | ||||||
Interest and similar income | 3,155 | 3,047 | ||||||
Income from financial assets and liabilities carried at fair value through income (net), shared with policyholders2) | (311) | 31 | ||||||
Realized gains/losses (net) from investments, shared with policyholders3) | 1,088 | 1,103 | ||||||
Fee and commission income | 171 | 129 | ||||||
Other income | 54 | 6 | ||||||
Operating revenues | 9,342 | 9,395 | ||||||
Claims and insurance benefits incurred (net) | (4,702) | (4,693) | ||||||
Changes in reserves for insurance and investment contracts (net) | (2,624) | (2,648) | ||||||
Interest expense | (91) | (64) | ||||||
Loan loss provisions | (3) | — | ||||||
Impairments of investments (net), shared with policyholders | (37) | (35) | ||||||
Investment expenses | (196) | (157) | ||||||
Acquisition and administrative expenses (net) | (874) | (1,025) | ||||||
Fee and commission expenses | (62) | (50) | ||||||
Operating restructuring charges4) | (3) | — | ||||||
Operating expenses | (8,592) | (8,672) | ||||||
Operating profit | 750 | 723 | ||||||
Income from financial assets and liabilities carried at fair value through income (net), not shared with policyholders2) | 1 | — | ||||||
Realized gains/losses (net) from investments, not shared with policyholders3) | 105 | 159 | ||||||
Amortization of intangible assets | (1) | (1) | ||||||
Non-operating restructuring charges4) | (2) | — | ||||||
Non-operating items | 103 | 158 | ||||||
Income before income taxes and minority interests in earnings | 853 | 881 | ||||||
Income taxes | (201) | (219) | ||||||
Minority interests in earnings | (99) | (128) | ||||||
Net income | 553 | 534 | ||||||
Statutory expense ratio5) in % | 7.2 | 8.2 |
1) | For the Life/Health segment, total revenues are measured based upon statutory premiums. Statutory premiums are gross premiums written from sales of life insurance policies, as well as gross receipts from sales of unit-linked and other investment-oriented products, in accordance with the statutory accounting practices applicable in the insurer’s home jurisdiction. |
2) | The total of these items equals income from financial assets and liabilities carried at fair value through income (net) in the segment income statement included in Note 3 to the consolidated financial statements. |
3) | The total of these items equals realized gains/losses (net) in the segment income statement included in Note 3 to the consolidated financial statements. |
4) | The total of these items equals restructuring charges in the segment income statement included in Note 3 to the consolidated financial statements. |
5) | Represents acquisition and administrative expenses (net) divided by statutory premiums (net). |
14
Table of Contents
Group Management Report
Life/Health Operations by Geographic Region
The following table sets forth our Life/Health statutory premiums, premiums earned (net), statutory expense ratio and operating profit by geographic region for the three months ended March 31, 2007 and 2006. Consistent with our general practice, these figures are presented before consolidation adjustments, representing the elimination of transactions between Allianz Group companies in different geographic regions and different segments.
| Statutory premiums1) | Premiums earned (net) | Statutory expense ratio | Operating profit | |||||||||||||||||||||||||||||
| Three months ended March 31, | 2007 € mn | 2006 € mn | 2007 € mn | 2006 € mn | 2007 % | 2006 % | 2007 € mn | 2006 € mn | ||||||||||||||||||||||||
| Germany Life | 3,039 | 3,128 | 2,567 | 2,581 | 1.4 | 8.7 | 191 | 133 | ||||||||||||||||||||||||
| Germany Health2) | 779 | 769 | 780 | 770 | 10.2 | 7.1 | 41 | 53 | ||||||||||||||||||||||||
| Italy | 2,830 | 2,268 | 243 | 242 | 5.3 | 5.8 | 94 | 94 | ||||||||||||||||||||||||
| France | 1,490 | 1,460 | 435 | 356 | 13.5 | 13.1 | 135 | 174 | ||||||||||||||||||||||||
| Switzerland | 498 | 519 | 195 | 209 | 4.5 | 5.5 | 16 | 15 | ||||||||||||||||||||||||
| Spain | 156 | 142 | 111 | 100 | 10.6 | 8.4 | 27 | 21 | ||||||||||||||||||||||||
Netherlands | 112 | 124 | 36 | 38 | 12.4 | 12.3 | 11 | 10 | ||||||||||||||||||||||||
Austria | 102 | 102 | 68 | 68 | 10.1 | 9.6 | 19 | 13 | ||||||||||||||||||||||||
Belgium | 194 | 179 | 76 | 75 | 7.7 | 8.0 | 44 | 16 | ||||||||||||||||||||||||
Portugal | 22 | 19 | 18 | 17 | 31.3 | 13.8 | 10 | 7 | ||||||||||||||||||||||||
Luxembourg | 10 | 10 | 6 | 7 | 24.2 | 17.4 | 3 | 1 | ||||||||||||||||||||||||
Greece | 29 | 26 | 16 | 15 | 16.7 | 24.2 | 1 | 2 | ||||||||||||||||||||||||
Western and Southern Europe | 469 | 460 | 220 | 220 | 11.4 | 10.7 | 873) | 483) | ||||||||||||||||||||||||
Hungary | 30 | 23 | 20 | 19 | 20.5 | 26.7 | 4 | 4 | ||||||||||||||||||||||||
Slovakia | 63 | 43 | 40 | 32 | 14.9 | 19.7 | 7 | 6 | ||||||||||||||||||||||||
Czech Republic | 21 | 18 | 13 | 14 | 20.0 | 22.6 | 4 | 2 | ||||||||||||||||||||||||
Poland | 248 | 169 | 28 | 19 | 8.5 | 7.4 | 3 | 2 | ||||||||||||||||||||||||
Romania | 9 | 10 | 2 | 2 | 28.0 | 31.3 | (1) | — | ||||||||||||||||||||||||
Bulgaria | 7 | 5 | 6 | 5 | 14.3 | 14.5 | 1 | 1 | ||||||||||||||||||||||||
Croatia | 12 | 10 | 9 | 8 | 16.5 | 26.0 | 2 | 1 | ||||||||||||||||||||||||
Russia | 2 | 2 | 2 | 2 | 147.0 | 39.2 | (1) | — | ||||||||||||||||||||||||
New Europe | 392 | 280 | 120 | 101 | 12.4 | 13.4 | 19 | 16 | ||||||||||||||||||||||||
| Other Europe | 861 | 740 | 340 | 321 | 11.9 | 11.7 | 106 | 64 | ||||||||||||||||||||||||
| United States | 1,669 | 2,772 | 101 | 88 | 9.3 | 5.7 | 71 | 121 | ||||||||||||||||||||||||
| Mexico4) | 7 | — | 7 | — | 16.2 | — | 1 | — | ||||||||||||||||||||||||
| NAFTA | 1,676 | 2,772 | 108 | 88 | 9.4 | 5.7 | 72 | 121 | ||||||||||||||||||||||||
| South Korea | 465 | 572 | 253 | 255 | 14.0 | 11.0 | 54 | 25 | ||||||||||||||||||||||||
| Taiwan | 350 | 299 | 15 | 14 | 2.3 | 1.1 | 3 | 4 | ||||||||||||||||||||||||
| Malaysia | 29 | 22 | 23 | 19 | 15.0 | 17.8 | 3 | 2 | ||||||||||||||||||||||||
| Indonesia | 30 | 15 | 11 | 9 | 21.4 | 34.7 | 2 | — | ||||||||||||||||||||||||
| Other | 48 | 21 | 4 | 4 | 13.5 | 18.1 | (4) | — | ||||||||||||||||||||||||
| Asia-Pacific | 922 | 929 | 306 | 301 | 9.9 | 8.7 | 58 | 31 | ||||||||||||||||||||||||
| South America | 33 | 46 | 9 | 13 | 20.4 | 10.9 | (2) | — | ||||||||||||||||||||||||
| Other5) | 102 | 114 | 91 | 98 | —6) | —6) | 20 | 19 | ||||||||||||||||||||||||
| Subtotal | 12,386 | 12,887 | 5,185 | 5,079 | — | — | 758 | 725 | ||||||||||||||||||||||||
| Consolidation adjustments7) | (60) | (65) | — | — | — | — | (8) | (2) | ||||||||||||||||||||||||
| Total | 12,326 | 12,822 | 5,185 | 5,079 | 7.2 | 8.2 | 750 | 723 | ||||||||||||||||||||||||
1) | Statutory premiums are gross premiums written from sales of life insurance policies as well as gross receipts from sales of unit-linked and other investment-oriented products, in accordance with the statutory accounting practices applicable in the insurer’s home jurisdiction. |
2) | Loss ratios were 77.8% and 75.7% for the three months ended March 31, 2007 and 2006, respectively. |
3) | Contains run-off of€ (1) mn in both 1Q 2007 and 1Q 2006 from our former life insurance business in the United Kingdom which we sold in December 2004. |
4) | Effective 1Q 2007, life business in Mexico is shown within the Life/Health Segment. |
5) | Contains, among others, the Life/Health business assumed by Allianz SE. |
6) | Presentation not meaningful. |
7) | Represents elimination of transactions between Allianz Group companies in different geographic regions. |
15
Table of Contents
Allianz Group Interim Report First Quarter of 2007
Strong operating profit.
| • | Overall revenues exceeded prior year outstanding level. |
| • | Ongoing efficiency improvements. |
| • | Disciplined risk taking. |
Earnings Summary
The results of operations of our Banking segment are almost exclusively represented by Dresdner Bank, accounting for 96.3% of our total Banking segment’s operating revenues in 1Q 2007 (1Q 2006: 96.7%). Accordingly, the discussion of our Banking segment’s results of operations relates solely to the operations of Dresdner Bank.
Operating revenues
At € 2,023 million, up 7.4% from a year ago, Dresdner Bank’s operating revenues exceeded the outstanding prior year level, driven by net interest income.
Net interest income increased to € 900 million in 1Q 2007, up € 322 million compared to a year earlier, of which € 171 million stemmed from the disposal of subsidiaries at an associated company and € 72 million from a favourable impact from the accounting treatment for derivative financial instruments which do not qualify for hedge accounting. Net interest income from our operating divisions grew by € 34 million, or 5.3%. The remaining increase was brought about by higher net interest income from our own funds.
Net trading income dropped by € 139 million to € 345 million. In the amount of € 69 million, this decline resulted from a higher negative impact from the accounting treatment for derivative financial instruments which do not qualify for hedge accounting in 1Q 2007 compared to a year ago. An additional negative impact of € 44 million was brought about by trading positions in own financial instruments. Net trading income from our operating divisions was down € 14 million, or 3.2%, from the level of a year ago.
Net fee and commission income, at € 789 million in 1Q 2007, was almost on a par with the already high level of a year earlier. A favourable development of our leveraged finance business was offset by a slight decline of our securities business.
Operating profit
Operating profit
in€ mn
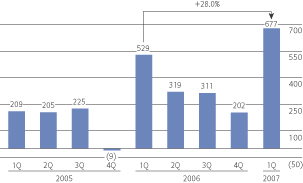
Operating profit amounted to € 677 million, up 28.0% over the already outstanding prior year level. 1Q 2007 represents the seventh consecutive quarter of year-on-year increase in operating profit, despite a lower net release of loan loss provisions. Our cost-income ratio decreased significantly to 66.9% from 73.7% a year ago. Excluding the disposal gain of€ 171 million previously mentioned, our cost-income ratio improved by 0.7 percentage points to 73.0%.
Benefiting from further efficiency gains and the ongoing progress of the “Neue Dresdner Plus” reorganization program, at € 1,353 million, operating expenses declined 2.5%, mainly attributable to the reduction of administrative expenses to € 1,355 million. Thereof, non-personnel expenses amounted to € 470million, down
16
Table of Contents
Group Management Report
4.1%. While lower costs for office space and for external services were the main contributors to this development, we achieved reductions across almost all cost categories. Personnel expenses, at € 885 million,were also slightly below the prior year level. Non-performance-related personnel expenses declined following the headcount reduction. Performance-related payments increased in line with the new value-based bonus system in our Investment Banking division.
In 1Q 2007, loan loss provisions amounted to a net release of € 7 million after a net release of € 33 million a year ago. While new provisions of € 101 million were slightly reduced, aggregate releases and recoveries decreased from € 147 million to € 108 million. Our coverage ratio1)improved to 61.3% as of March 31, 2007 from 60.4% a year ago.
1) | Represents total loan loss allowance as a percentage of total non-performing loans and potential problem loans. |
Non-operating items
In aggregate, the positive impact from non-operating items dropped from € 392 million to € 115 million. This development was almost exclusively driven by a € 277 million decrease in realized gains.
Net income
Based on the favorable operating profit development and despite the significant reduction of non-operating income, net income came in at € 612 million in 1Q 2007. With income tax expenses of € 158 million, down € 80 million from a year ago, our effective tax rate fell to 19.9% from 25.8%, primarily benefiting from increased tax-exempted income and effects from the utilization of tax losses.
17
Table of Contents
Allianz Group Interim Report First Quarter of 2007
The following table sets forth the income statements and cost-income ratios for both our Banking segment as a whole and Dresdner Bank for the three months ended March 31, 2007 and 2006.
| Three months ended March 31, | 2007 | 2006 | ||||||||||||||||
| Banking Segment € mn | Dresdner Bank € mn | Banking Segment € mn | Dresdner Bank € mn | |||||||||||||||
Net interest income1) | 928 | 900 | 601 | 578 | ||||||||||||||
Net fee and commission income2) | 832 | 789 | 832 | 793 | ||||||||||||||
Trading income (net)3) | 351 | 345 | 487 | 484 | ||||||||||||||
| Income from financial assets and liabilities designated at fair value through income (net)3) | (10) | (11) | 3 | 3 | ||||||||||||||
Other income | — | — | 25 | 26 | ||||||||||||||
Operating revenues4) | 2,101 | 2,023 | 1,948 | 1,884 | ||||||||||||||
Administrative expenses | (1,410) | (1,355) | (1,428) | (1,381) | ||||||||||||||
Investment expenses | (9) | (11) | (6) | (7) | ||||||||||||||
Other expenses | 13 | 13 | — | — | ||||||||||||||
Operating expenses | (1,406) | (1,353) | (1,434) | (1,388) | ||||||||||||||
| Loan loss provisions | 5 | 7 | 33 | 33 | ||||||||||||||
Operating profit | 700 | 677 | 547 | 529 | ||||||||||||||
Realized gains/losses (net) | 139 | 137 | 414 | 414 | ||||||||||||||
Impairments of investments (net) | (13) | (13) | (20) | (20) | ||||||||||||||
Restructuring charges | (9) | (9) | (2) | (2) | ||||||||||||||
Non-operating items | 117 | 115 | 392 | 392 | ||||||||||||||
Income before income taxes and minority interests in earnings | 817 | 792 | 939 | 921 | ||||||||||||||
Income taxes | (168) | (158) | (245) | (238) | ||||||||||||||
Minority interests in earnings | (24) | (22) | (28) | (25) | ||||||||||||||
Net income | 625 | 612 | 666 | 658 | ||||||||||||||
Cost-income ratio5) in % | 66.9 | 66.9 | 73.6 | 73.7 | ||||||||||||||
1) | Represents interest and similar income less interest expense. |
2) | Represents fee and commission income less fee and commission expense. |
3) | The total of these items equals income from financial assets and liabilities carried at fair value through income (net) in the segment income statement included in Note 3 to the consolidated financial statements. |
4) | For the Banking segment, total revenues are measured based upon operating revenues. |
5) | Represents operating expenses divided by operating revenues. |
18
Table of Contents
Group Management Report
Banking Operations by Division
The following table sets forth our banking operating revenues, operating profit and cost-income ratio by division. Consistent with our general practice, these figures are presented before consolidation adjustments, representing the elimination of transactions between Allianz Group companies in different segments.
| Operating revenues | Operating profit (loss) | Cost-Income ratio | ||||||||||||||||||||||
| Three months ended March 31, | 2007 € mn | 2006 € mn | 2007 € mn | 2006 € mn | 2007 % | 2006 % | ||||||||||||||||||
| Private & Corporate Clients1) | 984 | 991 | 316 | 312 | 67.8 | 67.3 | ||||||||||||||||||
| Investment Banking1) | 891 | 864 | 213 | 220 | 77.1 | 78.6 | ||||||||||||||||||
| Corporate Other2) | 148 | 29 | 148 | (3) | —3) | —3) | ||||||||||||||||||
| Dresdner Bank | 2,023 | 1,884 | 677 | 529 | 66.9 | 73.7 | ||||||||||||||||||
| Other Banks4) | 78 | 64 | 23 | 18 | 67.9 | 71.9 | ||||||||||||||||||
| Total | 2,101 | 1,948 | 700 | 547 | 66.9 | 73.6 | ||||||||||||||||||
1) | Our reporting by division reflects the organizational changes within Dresdner Bank effective starting with 1Q 2007, resulting in two operating divisions, Private & Corporate Clients (“PCC”) and Investment Banking (“IB”). PCC combines all banking activities formerly provided by the Personal Banking and Private & Business Banking (including Private Wealth Management) divisions as well as our activities with medium-sized business clients from our former Corporate Banking division. IB, with Global Banking and Capital Markets, unites the activities formerly provided by the Dresdner Kleinwort Wasserstein division and the remaining activities of the former Corporate Banking division. Prior year balances have been adjusted accordingly to reflect these reorganization measures and allow for comparability across periods. |
2) | The Corporate Other division contains income and expense items that are not assigned to Dresdner Bank’s operating divisions. These items include, in particular, impacts from the accounting treatment for derivative financial instruments which do not qualify for hedge accounting as well as provisioning requirements for country and general risks. In 1Q 2007 the impact from the accounting treatment for derivative financial instruments which do not qualify for hedge accounting on Corporate Other’s operating revenues amounted to€(20) mn (1Q 2006:€(23) mn). |
3) | Presentation not meaningful. |
4) | Consists of non-Dresdner Bank banking operations within our Banking segment. |
19
Table of Contents
Allianz Group Interim Report First Quarter of 2007
Solid growth masked by U.S. Dollar depreciation.
| • | Operating profit increased 2.6%. |
| • | Continuous high investment performance attracts inflows. |
| • | Cost-income ratio of 60.0% in 1Q 2007. |
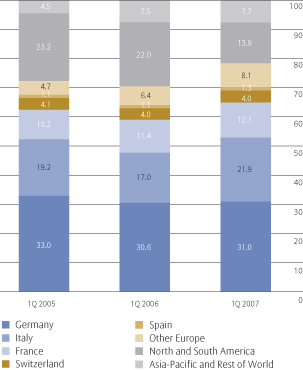
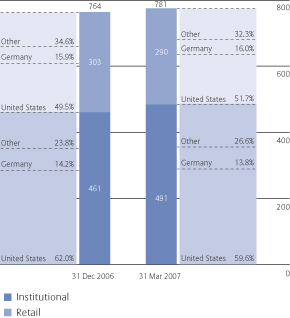
Third-Party Assets Under Management of the Allianz Group
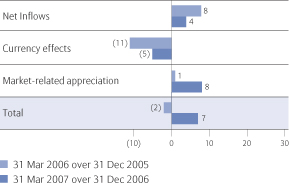
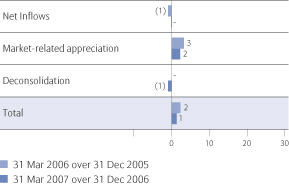
Our third-party assets increased by € 17 billion1) to € 781 billion as of March 31, 2007, compared to € 764 billion as of December 31, 2006. In 1Q 2007, we achieved net inflows to third-party assets of € 12 billion, primarily in the United States, France and Asia-Pacific. Of the total net inflows, our fixed income business made up for € 10 billion and our equity business for € 2 billion. These strong net inflow levels were achieved despite uncertainty in the fixed income markets and very volatile equity markets.
Market-related appreciation was € 13 billion. The overwhelming majority of both the fixed income and equity assets we manage again outperformed their respective benchmarks, one of our key success factors.
Net inflows and positive market effects were partly offset by negative currency translation effects of € 6 billion, resulting primarily from a weaker U.S. Dollar versus the Euro.
We operate our third-party asset management business primarily through Allianz Global Investors (“AGI”). As of March 31, 2007, AGI managed approximately 94.7% (December 31, 2006: 94.6%) of the Allianz Group’s third-party assets. The remaining third-party assets are managed by Dresdner Bank (approximately 2.7% as of both, March 31, 2007 and December 31, 2006) and other Allianz Group subsidiaries (approximately 2.6% and 2.7% as of March 31, 2007 and December 31, 2006, respectively).
1) | Including a negative deconsolidation effect of€ 2 bn. |
The following graphs present the third-party assets managed by the Allianz Group by geographic region, investment category and investor class as of March 31, 2007 and December 31, 2006, respectively.
Third-party assets under management – Fair values by geographic region1)
in€ bn
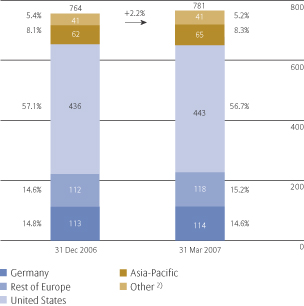
1) | Based on the origination of the assets. |
2) | Consists of third-party assets managed by Dresdner Bank (approximately € 21 bn as of both, March 31, 2007 and December 31, 2006) and by other Allianz Group companies (approximately€ 20 bn as of both, March 31, 2007 and December 31, 2006). |
20
Table of Contents
Group Management Report
Third-party assets under management – Fair values by investment category
in€ bn
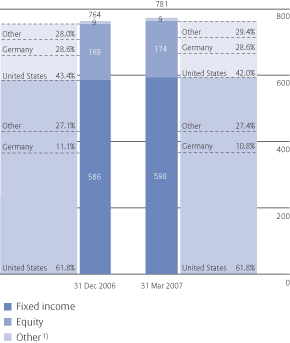
1) | Includes primarily investments in real estate. |
Third-party assets under management – Fair values by Investor class
in€ bn
Third-party assets under management – Composition of fair value development in the United States
in€ bn
Third-party assets under management – Composition of fair value development in Germany
in€ bn
Our major achievements in the first quarter of 2007 included:
| • | Particularly strong net inflows of approximately € 1.2 billion at our U.S. equity fund manager NFJ Investment Group. |
• | AGI Germany with assets under management of € 278.6 billion and a market share of 19.5% market leader in Germany.1) |
• | Market leadership in “Zertifikatefonds” business with € 3.7 billion assets under management and 63% market share.1) |
21
1) | Source: Bundesverband Investment und Asset Management (“BVI“), an association representing the German investment fund industry. |
Table of Contents
Allianz Group Interim Report First Quarter of 2007
Earnings Summary
The results of operations of our Asset Management segment are almost exclusively represented by AGI, accounting for 97.2% and 97.4% of our total Asset Management segment’s operating revenues and operating profit, respectively, in 1Q 2007 (1Q 2006: 97.9% and 98.7%, respectively). Accordingly, the discussion of our Asset Management segment’s results of operations relates solely to the operations of AGI.
Operating revenues
At € 758 million, operating revenues were up € 23 million from a year ago, a development which was significantly subdued by currency related effects. Internal operating revenue growth amounted to9.9%.
Higher asset-based management fees at stable revenue margins resulted from the growth of our third-party asset base. Loading and exit fees did not reach the prior year level due to less mutual funds sales. Other net fee and commission income increased as a result of our business expansion.
The following table sets forth the composition of AGI’s net fee and commission income.
| Three months ended March 31, | 2007 € mn | 2006 € mn | ||||||
| Management fees | 851 | 829 | ||||||
| Loading and exit fees | 81 | 91 | ||||||
| Performance fees | 16 | 16 | ||||||
| Other income | 101 | 79 | ||||||
| Fee and commission income | 1,049 | 1,015 | ||||||
| Commissions | (220) | (226) | ||||||
| Other expenses | (101) | (85) | ||||||
| Fee and commission expenses | (321) | (311) | ||||||
| Net fee and commission income | 728 | 704 |
Operating profit
Operating profit
in€ mn
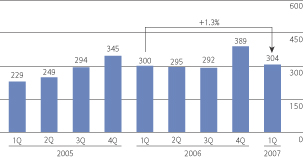
Operating profit, at € 304 million in 1Q 2007, was up slightly compared with a year earlier on a Euro-basis. At constant exchange rates, operating profit would have grown by 8.7%.
Administrative expenses, excluding acquisition-related expenses, increased 4.4% to € 454 million in 1Q 2007. Thereof, personnel expenses amounted to € 297 million, up from € 285 million a year ago, and non-personnel expenses were at € 157 million, compared to € 149 million. These developments were in line with our business expansion and investments in future growth,such as investments in our distribution network and human resources development.
Following the slightly more than proportionate increase in operating expenses compared to that in operating revenues, our cost-income-ratio was up 0.7 percentage points to 59.9%.
22
Table of Contents
Group Management Report
Non-operating items
Acquisition-related expenses fell 11.6% to € 122 million. As of March 31, 2007, the Allianz Group had acquired 37,760 of the 150,000 PIMCO LLC Class B Units originally outstanding, compared to 11,721 as of March 31, 2006. The resulting lowering effect on acquisition-related expenses was partially offset by the positive operating profit development at PIMCO in the United States.
Net income
At € 93 million, net income was up 6.9% from a year ago.
With income tax expenses of € 79 million, up 23.4%, our effective tax rate increased to 43.4% from 39.3%. This increase was, among other factors, driven by higher taxable income in the United States.
The following table sets forth the income statements and cost-income ratios for both our Asset Management segment as a whole and AGI for the three months ended March 31, 2007 and 2006.
| Three months ended March 31, | 2007 | 2006 | ||||||||||||||
Asset Management Segment € mn | Allianz Global Investors € mn | Asset Management Segment € mn | Allianz Global Investors € mn | |||||||||||||
| Net fee and commission income1) | 746 | 728 | 717 | 704 | ||||||||||||
| Net interest income2) | 23 | 19 | 17 | 14 | ||||||||||||
| Income from financial assets and liabilities carried at fair value through income (net) | 7 | 7 | 14 | 14 | ||||||||||||
| Other income | 4 | 4 | 3 | 3 | ||||||||||||
| Operating revenues3) | 780 | 758 | 751 | 735 | ||||||||||||
| Administrative expenses, excluding acquisition-related expenses4) | (468) | (454) | (447) | (435) | ||||||||||||
| Operating expenses | (468) | (454) | (447) | (435) | ||||||||||||
| Operating profit | 312 | 304 | 304 | 300 | ||||||||||||
| Realized gains/losses (net) | 2 | 2 | 2 | 1 | ||||||||||||
| Acquisition-related expenses, thereof4) | ||||||||||||||||
Deferred purchases of interests in PIMCO | (122) | (122) | (136) | (136) | ||||||||||||
Other acquisition-related expenses5) | — | — | (2) | (2) | ||||||||||||
Subtotal | (122) | (122) | (138) | (138) | ||||||||||||
| Restructuring charges | (2) | (2) | — | — | ||||||||||||
| Non-operating items | (122) | (122) | (136) | (137) | ||||||||||||
| Income before income taxes and minority interests in earnings | 190 | 182 | 168 | 163 | ||||||||||||
| Income taxes | (80) | (79) | (65) | (64) | ||||||||||||
| Minority interests in earnings | (11) | (10) | (13) | (12) | ||||||||||||
| Net income | 99 | 93 | 90 | 87 | ||||||||||||
| Cost-income ratio6)in % | 60.0 | 59.9 | 59.5 | 59.2 | ||||||||||||
1) | Represents fee and commission income less fee and commission expense. |
2) | Represents interest and similar income less interest expense and investment expenses. |
3) | For the Asset Management segment, total revenues are measured based upon operating revenues. |
4) | The total of these items equals acquisition and administration expenses (net) in the segment income statement in Note 3 to the consolidated financial statements. |
5) | Consists of retention payments for the management and employees of PIMCO and Nicholas Applegate. |
6) | Represents operating expenses divided by operating revenues. |
23
Table of Contents
Allianz Group Interim Report First Quarter of 2007
Earnings Summary
Operating loss was € 101 million in 1Q 2007, down € 79 million from a year earlier, reflecting improvements in both Holding Function and Private Equity.
Mainly attributable to exceptionally high realized capital gains, non-operating items rose from an aggregate loss of € 211 million to an aggregate gain of € 511 million.
These developments translate into improved income before income taxes and minorities, amounting to a gain of € 410 million in 1Q 2007 after a loss of € 391 million in the same period last year.
| Operating profit (loss) | Non-operating items | |||||||||||||||
Three months ended March 31, | 2007 € mn | 2006 € mn | 2007 € mn | 2006 € mn | ||||||||||||
Holding Function | (132) | (188) | 512 | (217) | ||||||||||||
Private Equity | 31 | 8 | (1) | 6 | ||||||||||||
Total | (101) | (180) | 511 | (211) | ||||||||||||
Holding Function
Operating profit The decline in operating profit loss primarily driven by higher investment result due to an increased asset base.
Non-operating items Realized capital gains of € 640 million resulted from the sale of shares.
Private Equity
Operating profit Operating profit rose by € 23 million to € 31 million. This development resulted predominantly from higher dividends received from equity investments as well as an increased gain from fully consolidated private equity investments, specifically from MAN Roland Druckmaschinen AG.
24
Table of Contents
Group Management Report
At€ 52.3 billion, shareholders’ equity was up 3.6% compared to year-end 2006.
Shareholders’ Equity
As of March 31, 2007, shareholders’ equity was 3.6% higher than at year-end 2006, primarily driven by the high net income in 1Q 2007. Commensurate with the high level of realizations which benefited net income, net unrealized gains/losses declined. An additional negative impact on shareholders’ equity was brought about by increased negative foreign currency translation adjustments, included in revenue reserves in the graph below, stemming predominantly from the depreciation of the U.S. Dollar compared to the Euro in the first three months of the year.
The following graph sets forth the development of our shareholders’ equity.
Shareholders’ equity1)
in€ mn
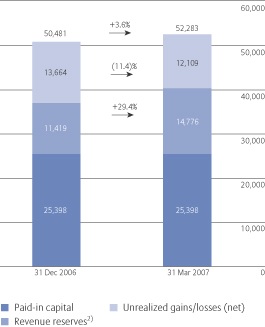
1) | Does not include minority interests of€ 6.6 bn as of March 31, 2007 and of€ 6.4 bn as of December 31, 2006. Please see Note 18 to the consolidated financial statements for further information. |
2) | Includes foreign currency translation adjustments. |
Total Assets and Total Liabilities
Total assets and total liabilities increased by € 49.1 billion and € 47.1 billion, respectively. In the following sections we analyze important developments within the balance sheets of our Life/Health, Property-Casualty and Banking segments. Relative to the Allianz Group’s total assets and total liabilities, we consider the total assets and total liabilities from our Asset Management segment as immaterial and have, accordingly, excluded these assets and liabilities from the following discussion. Our Asset Management segment’s results of operations stem primarily from its business with third-party assets. Please see pages 20 to 21 for further information on the development of our third-party assets.
Insurance Assets and Liabilities
Life/Health insurance operations
Reserves for insurance and investment contracts from our Life/Health segment rose by € 1.7 billion, mainly due to increased aggregate policy reserves for universal-life type insurance contracts. Financial liabilities for unit-linked contracts as of March 31, 2007 were € 1.9 billion higher than as of year-end 2006, reflecting our continuous sales successes with unit-linked insurance and investment contracts. Similarly, our Life/Health asset base grew by € 5.1 billion.
25
Table of Contents
Allianz Group Interim Report First Quarter of 2007
The following graph sets forth the development of our Life/Health asset base.
Life/Health asset base
fair values1) in€ bn
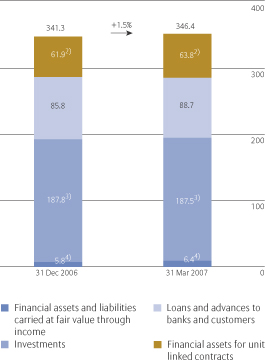
1) | Loans and advances to banks and customers, held-to-maturity investments, and real estate held for investment are stated at amortized cost. Investments in associates and joint ventures are stated at either amortized cost or equity, depending upon, among other factors, our ownership percentage. |
2) | Financial assets for unit-linked contracts represent assets owned by, and managed on the behalf of, policyholders of the Allianz Group, with all appreciation and depreciation in these assets accruing to the benefit of policyholders. As a result, the value of financial assets for unit-linked contracts in our balance sheet corresponds with the value of financial liabilities for unit-linked contracts. |
3) | Does not include affiliates at€ 2.8 bn and€ 2.8 bn as of March 31, 2007 and December 31, 2006, respectively. |
4) | Includes, in each case as of March 31, 2007 and December 31, 2006, respectively, debt securities at€ 8.1 bn and€ 7.3 bn, equity securities at€ 2.9 bn and€ 2.9 bn, and derivative financial instruments at€ (4.6) bn and€ (4.4) bn. |
Property-Casualty insurance operations
Our Property-Casualty segment’s reserves for loss and loss adjustment expenses declined € 1.3 billion from year-end 2006 to € 57.3 billion as of March 31, 2007, due, among other factors, to the depreciation of the U.S. Dollar relative to the Euro. Our Property-Casualty asset base increased by € 1.7 billion.
The following graph sets forth the development of our Property-Casualty asset base.
Property-Casualty asset base
fair values1) in€ bn
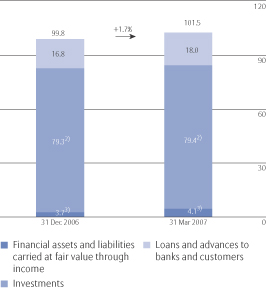
1) | Loans and advances to banks and customers, held-to-maturity investments, and real estate held for investment are stated at amortized cost. Investments in associates and joint ventures are stated at either amortized cost or equity, depending upon, among other factors, our ownership percentage. |
2) | Does not include affiliates at€ 9.5 bn and€ 9.5 bn as of March 31, 2007 and December 31, 2006, respectively. |
3) | Includes, in each case as of March 31, 2007 and December 31, 2006, respectively, debt securities at€ 3.6 bn and€ 3.2 bn, equity securities at€ 0.4 bn and€ 0.4 bn, and derivative financial instruments at€ 0.1 bn and€ 0.1 bn. |
26
Table of Contents
Group Management Report
Banking Assets and Liabilities
Loans and advances to banks and customers in our Banking segment were € 346.8 billion as of March 31, 2007, up € 33.1 billion from year-end 2006. This increase was particularly driven by higher volumes of collateralized refinancing activities at Dresdner Bank which also led to an increase in our liabilities to banks and customers, primarily in the from of repurchase agreements and collateral received from securities lending transactions.
The following graph sets forth the development of our Banking segment’s loans and advances to banks and customers.
Banking loans and advances to banks and customers
in€ bn
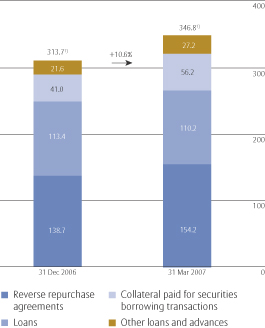
1) | Includes loan loss allowance at€ (1.0) bn as of both March 31, 2007 and December 31, 2006, respectively. |
27
Table of Contents
Allianz Group Interim Report First Quarter of 2007
Reconciliation of Consolidated Operating Profit and Income before Income Taxes and Minority Interests in Earnings
The previous analysis is based on our consolidated financial statements and should be read in conjunction with those statements. The Allianz Group uses operating profit to evaluate the performance of its business segments and the Group as a whole. The Allianz Group considers the presentation of operating profit to be useful and meaningful to investors because it enhances the understanding of the Allianz Group’s underlying operating performance and the comparability of its operating performance over time. Operating profit highlights the portion of income before income taxes and minority interests in earnings attributable to the on-going core operations of the Allianz Group. To better understand the on-going operations of the business, we exclude the effects of acquisition-related expenses and the amortization of intangible assets, as these relate to business combinations; and we exclude interest expense from external debt and income from financial assets and liabilities held for trading (relating to exchangeables on external debt) as these relate to our capital structure.
We believe that trends in the underlying profitability of our business can be more clearly identified without the fluctuating effects of the realized capital gains and losses or impairments of investment securities, as these are largely dependent on market cycles or issuer-specific
events over which we have little or no control, and can and do vary, sometimes materially, across periods. Further, the timing of sales that would result in such gains or losses is largely at our discretion. Similarly, we exclude restructuring charges because the timing of the restructuring charges are largely within our control, and accordingly their exclusion provides additional insight into the operating trends of the underlying business.
Operating profit should be viewed as complementary to, and not a substitute for, income before income taxes and minority interests in earnings or net income as determined in accordance with IFRS.
The following table reconciles operating profit on a consolidated basis to the Allianz Group’s income before income taxes and minority interests in earnings.
Three months ended March 31, | 2007 € mn | 2006 € mn | ||||||
| Operating profit | 2,870 | 2,677 | ||||||
| Realized gains/losses and impairments of investments (net) | 2,045 | 778 | ||||||
| Income from financial assets and liabilities held for trading (net) | 34 | (79) | ||||||
| Interest expense from external debt | (222) | (198) | ||||||
| Restructuring charges | (27) | (4) | ||||||
| Acquisition-related expenses | (122) | (138) | ||||||
| Amortization of intangible assets | (3) | (5) | ||||||
| Reclassification of policyholder participation in tax benefits arising in connection with tax-exempt income | (19) | — | ||||||
| Income before income taxes and minority interests in earnings | 4,556 | 3,031 |
28
Table of Contents
Group Management Report
Composition of Total Revenue Growth
We further believe that an understanding of our total revenue performance is enhanced when the effects of foreign currency translation as well as acquisitions and disposals (or “changes in scope of consolidation”) are excluded. Accordingly, in addition to presenting “nominal growth”, we also present “internal growth”, which excludes the effects of foreign currency translation and changes in scope of consolidation. The following table sets forth the reconciliation of nominal total revenue growth to internal total revenue growth for each of our segments and the Allianz Group as a whole for the three months ended March 31, 2007.
Composition of total revenue1) growth for the three months ended March 31, 2007
| Segment | Nominal | Changes dation | Foreign | Internal | ||||||||||||
% | % | % | % | |||||||||||||
| Property-Casualty | (0.3) | 0.4 | (1.0) | 0.3 | ||||||||||||
| Life/Health | (3.9) | — | (1.9) | (2.0) | ||||||||||||
| Banking | 7.9 | — | (0.3) | 8.2 | ||||||||||||
thereof: Dresdner Bank | 7.4 | — | (0.3) | 7.7 | ||||||||||||
| Asset Management | 3.9 | 0.6 | (6.6) | 9.9 | ||||||||||||
thereof: Allianz Global Investors | 3.1 | — | (6.8) | 9.9 | ||||||||||||
| Allianz Group | (1.1) | 0.2 | (1.5) | 0.2 |
1) | Total revenues comprise Property-Casualty segment’s gross premiums written, Life/Health segment’s statutory premiums, Banking segment’s operating revenues and Asset Management segment’s operating revenues. Segment growth rates are presented before the elimination of transactions between Allianz Group companies in different segments. |
29
Table of Contents
Allianz Group Interim Report First Quarter of 2007
30
Table of Contents
Consolidated Financial Statements
Contents
Table of Contents
Allianz Group Interim Report First Quarter of 2007
As of March 31, 2007 and as of December 31, 2006
| Note | As of March 31, 2007 € mn | As of € mn | ||||||||||
| ASSETS | ||||||||||||
| Cash and cash equivalents | 35,713 | 33,031 | ||||||||||
| Financial assets carried at fair value through income | 4 | 162,238 | 156,869 | |||||||||
| Investments | 5 | 298,763 | 298,134 | |||||||||
| Loans and advances to banks and customers | 6 | 444,446 | 408,278 | |||||||||
| Financial assets for unit linked contracts | 63,765 | 61,864 | ||||||||||
| Reinsurance assets | 7 | 17,477 | 19,360 | |||||||||
| Deferred acquisition costs | 8 | 19,926 | 19,135 | |||||||||
| Deferred tax assets | 4,562 | 4,727 | ||||||||||
| Other assets | 9 | 42,058 | 38,893 | |||||||||
| Intangible assets | 10 | 13,425 | 12,935 | |||||||||
| Total assets | 1,102,373 | 1,053,226 | ||||||||||
| Note | As of March 31, 2007 € mn | As of € mn | ||||||||||
| LIABILITIES AND EQUITY | ||||||||||||
| Financial liabilities carried at fair value through income | 11 | 90,429 | 79,699 | |||||||||
| Liabilities to banks and customers | 12 | 393,010 | 361,078 | |||||||||
| Unearned premiums | 18,731 | 14,868 | ||||||||||
| Reserves for loss and loss adjustment expenses | 13 | 64,200 | 65,464 | |||||||||
| Reserves for insurance and investment contracts | 14 | 289,390 | 287,697 | |||||||||
| Financial liabilities for unit linked contracts | 63,765 | 61,864 | ||||||||||
| Deferred tax liabilities | 4,588 | 4,618 | ||||||||||
| Other liabilities | 15 | 50,282 | 49,764 | |||||||||
| Certificated liabilities | 16 | 53,129 | 54,922 | |||||||||
| Participation certificates and subordinated liabilities | 17 | 15,927 | 16,362 | |||||||||
| Total liabilities | 1,043,451 | 996,336 | ||||||||||
| Shareholders’ equity | 52,283 | 50,481 | ||||||||||
| Minority interests | 6,639 | 6,409 | ||||||||||
| Total equity | 18 | 58,922 | 56,890 | |||||||||
| Total liabilities and equity | 1,102,373 | 1,053,226 |
32
Table of Contents
Consolidated Financial Statements
Consolidated Income Statements
For the three months ended March 31, 2007 and 2006
| Three months ended March 31, | Note | 2007 € mn | 2006 € mn | |||||||||
| Premiums earned (net) | 19 | 14,543 | 14,420 | |||||||||
| Interest and similar income | 20 | 6,266 | 5,683 | |||||||||
| Income from financial assets and liabilities carried at fair value through income (net) | 21 | 115 | 500 | |||||||||
| Realized gains/losses (net) | 22 | 3,209 | 1,895 | |||||||||
| Fee and commission income | 23 | 2,356 | 2,252 | |||||||||
| Other income | 24 | 93 | 39 | |||||||||
| Income from fully consolidated private equity investments | 25 | 471 | 159 | |||||||||
| Total income | 27,053 | 24,948 | ||||||||||
| Claims and insurance benefits incurred (net) | 26 | (11,085) | (10,875) | |||||||||
| Changes in reserves for insurance and investment contracts (net) | 27 | (2,736) | (2,712) | |||||||||
| Interest expense | 28 | (1,598) | (1,565) | |||||||||
| Loan loss provisions | 29 | 2 | 32 | |||||||||
| Impairments of investments (net) | 30 | (67) | (55) | |||||||||
| Investment expenses | 31 | (261) | (183) | |||||||||
| Acquisition and administrative expenses (net) | 32 | (5,638) | (5,809) | |||||||||
| Fee and commission expenses | 33 | (634) | (578) | |||||||||
| Amortization of intangible assets | (3) | (5) | ||||||||||
| Restructuring charges | (30) | (4) | ||||||||||
| Other expenses | 34 | 13 | (1) | |||||||||
| Expenses from fully consolidated private equity investments | 35 | (460) | (162) | |||||||||
| Total expenses | (22,497) | (21,917) | ||||||||||
| Income before income taxes and minority interests in earnings | 4,556 | 3,031 | ||||||||||
| Income taxes | 36 | (967) | (899) | |||||||||
| Minority interests in earnings | (349) | (353) | ||||||||||
| Net income | 3,240 | 1,779 | ||||||||||
| Three months ended March 31, | Note | 2007 € | 2006 € | |||||||||
| Basic earnings per share | 37 | 7.51 | 4.39 | |||||||||
| Diluted earnings per share | 37 | 7.34 | 4.32 |
33
Table of Contents
Allianz Group Interim Report First Quarter of 2007
Consolidated Statements of Changes in Equity
For the three months ended March 31, 2007 and 2006
Paid-in capital
| Revenue
| Foreign currency translation adjustments | Unrealized | Shareholders’ | Minority
| Total equity
| ||||||||||||||||||||||||||
| € mn | € mn | € mn | € mn | € mn | € mn | € mn | ||||||||||||||||||||||||||
| Balance as of December 31, 2005 | 21,616 | 8,579 | (1,032) | 10,324 | 39,487 | 7,615 | 47,102 | |||||||||||||||||||||||||
| Foreign currency translation adjustments | — | — | (335) | (13) | (348) | (110) | (458) | |||||||||||||||||||||||||
| Available-for-sale investments | ||||||||||||||||||||||||||||||||
Unrealized gains and losses (net) arising during the year | — | — | — | 858 | 858 | (71) | 787 | |||||||||||||||||||||||||
Transferred to net income on disposal | — | — | — | (463) | (463) | (91) | (554) | |||||||||||||||||||||||||
| Cash flow hedges | — | — | — | (16) | (16) | — | (16) | |||||||||||||||||||||||||
| Miscellaneous | — | (259) | — | — | (259) | (4) | (263) | |||||||||||||||||||||||||
| Total income and expense recognized directly in shareholders’ equity | — | (259) | (335) | 366 | (228) | (276) | (504) | |||||||||||||||||||||||||
| Net income | — | 1,779 | — | — | 1,779 | 353 | 2,132 | |||||||||||||||||||||||||
| Total recognized income and expense for the period | — | 1,520 | (335) | 366 | 1,551 | 77 | 1,628 | |||||||||||||||||||||||||
| Treasury shares | — | 255 | — | — | 255 | — | 255 | |||||||||||||||||||||||||
| Transactions between equity holders | — | 12 | — | (4) | 8 | 28 | 36 | |||||||||||||||||||||||||
| Dividends paid | — | — | — | — | — | (15) | (15) | |||||||||||||||||||||||||
| Balance as of March 31, 2006 | 21,616 | 10,366 | (1,367) | 10,686 | 41,301 | 7,705 | 49,006 | |||||||||||||||||||||||||
| Balance as of December 31, 2006 | 25,398 | 13,629 | (2,210) | 13,664 | 50,481 | 6,409 | 56,890 | |||||||||||||||||||||||||
| Foreign currency translation adjustments | — | — | (141) | (4) | (145) | (23) | (168) | |||||||||||||||||||||||||
| Available-for-sale investments | ||||||||||||||||||||||||||||||||
Unrealized gains and losses (net) arising during the year | — | — | — | 233 | 233 | (28) | 205 | |||||||||||||||||||||||||
Transferred to net income on disposal | — | — | — | (1,787) | (1,787) | (86) | (1,873) | |||||||||||||||||||||||||
| Cash flow hedges | — | — | — | 5 | 5 | — | 5 | |||||||||||||||||||||||||
| Miscellaneous | — | (84) | — | — | (84) | 7 | (77) | |||||||||||||||||||||||||
| Total income and expense recognized directly in shareholders’ equity | — | (84) | (141) | (1,553) | (1,778) | (130) | (1,908) | |||||||||||||||||||||||||
| Net income | — | 3,240 | — | — | 3,240 | 349 | 3,589 | |||||||||||||||||||||||||
| Total recognized income and expense for the period | — | 3,156 | (141) | (1,553) | 1,462 | 219 | 1,681 | |||||||||||||||||||||||||
| Treasury shares | — | 348 | — | — | 348 | — | 348 | |||||||||||||||||||||||||
| Transactions between equity holders | — | (6) | — | (2) | (8) | 34 | 26 | |||||||||||||||||||||||||
| Dividends paid | — | — | — | — | — | (23) | (23) | |||||||||||||||||||||||||
| Balance as of March 31, 2007 | 25,398 | 17,127 | (2,351) | 12,109 | 52,283 | 6,639 | 58,922 |
34
Table of Contents
Consolidated Financial Statements
Consolidated Statements of Cash Flows
For the three months ended March 31, 2007 and 2006
Three months ended March 31, | 2007 € mn | 2006 € mn | ||||||
| Cash flow from operating activities: | ||||||||
| Net income | 3,240 | 1,779 | ||||||
| Adjustments to reconcile net income to net cash flow provided by (used in) operating activities: | ||||||||
Minority interests in earnings | 349 | 353 | ||||||
Share of earnings from investments in associates and joint ventures | (259) | (74) | ||||||
Realized gains/losses (net) and impairments of investments (net) of: | ||||||||
Available-for-sale and held-to-maturity investments, investments in associates and joint ventures, real estate held for investment, loans to banks and customers | (3,142) | (1,840) | ||||||
Other investments, mainly financial assets held for trading and designated at fair value through income | (459) | (138) | ||||||
Depreciation and amortization | 200 | 163 | ||||||
Loan loss provision | (2) | (32) | ||||||
Interest credited to policyholder accounts | 657 | 656 | ||||||
Net change in: | ||||||||
Financial assets and liabilities held for trading | 7,597 | 8,842 | ||||||
Reverse repurchase agreements and collateral paid for securities borrowing transactions | (30,887) | (46,705) | ||||||
Repurchase agreements and collateral received from securities lending transactions | 25,798 | 38,953 | ||||||
Reinsurance assets | 623 | (177) | ||||||
Deferred acquisition costs | (756) | (712) | ||||||
Unearned premiums | 3,554 | 3,699 | ||||||
Reserves for losses and loss adjustment expenses | (1,221) | (373) | ||||||
Reserves for insurance and investment contracts | 1,866 | 1,781 | ||||||
Deferred tax assets/liabilities | 266 | 215 | ||||||
Other (net) | (1,757) | 205 | ||||||
| Net cash flow provided by operating activities | 5,667 | 6,595 | ||||||
| Cash flow from investing activities: | ||||||||
| Net change in: | ||||||||
Financial assets designated at fair value through income | (977) | (111) | ||||||
Available-for-sale investments | (1,420) | (2,720) | ||||||
Held-to-maturity investments | 21 | 42 | ||||||
Investments in associates and joint ventures | (331) | (346) | ||||||
Non-current assets and disposal groups held for sale | — | 1,416 | ||||||
Real estate held for investment | 157 | 96 | ||||||
Loans and advances to banks and customers | (5,422) | (8,296) | ||||||
Property and equipment | 49 | (460) | ||||||
| Acquisition of subsidiary, net of cash acquired | (507) | — | ||||||
| Other (net) | (124) | 141 | ||||||
| Net cash flow used in investing activities | (8,554) | (10,238) | ||||||
| Cash flow from financing activities: | ||||||||
| Net change in: | ||||||||
Policyholders’ accounts | 491 | 1,827 | ||||||
Liabilities to banks and customers | 6,139 | 6,050 | ||||||
Certificated liabilities, participation certificates and subordinated liabilities | (1,009) | (2,304) | ||||||
| Transactions between equity holders | 21 | (9) | ||||||
| Dividends paid to shareholders | (23) | (15) | ||||||
| Net cash from sale or purchase of treasury shares | 189 | 73 | ||||||
| Other (net) | (225) | (702) | ||||||
| Net cash flow provided by financing activities | 5,583 | 4,920 | ||||||
| Effect of exchange rate changes on cash and cash equivalents | (14) | (27) | ||||||
| Change in cash and cash equivalents | 2,682 | 1,250 | ||||||
| Cash and cash equivalents at beginning of period | 33,031 | 31,647 | ||||||
| Cash and cash equivalents at end of period | 35,713 | 32,897 |
35
Table of Contents
Allianz Group Interim Report First Quarter of 2007
[THIS PAGE INTENTIONALLY LEFT BLANK]
36
Table of Contents
Notes to the Consolidated Financial Statements
Notes to the Consolidated Financial Statements
The consolidated financial statements of the Allianz
Group have been prepared in conformity with International Financial Reporting Standards (“IFRS”), as adopted under European Union (“EU”) regulations in accordance with section 315a of the German Commercial Code (“HGB”). IFRS as adopted by the EU offers certain options for applying IFRS standards. The Allianz Group’s application of these options results in no material differences between IFRS as adopted by the EU and IFRS as adopted by the International Accounting Standard Board (“IASB”).
IFRS does not provide specific guidance concerning all aspects of the recognition and measurement of insurance and reinsurance contracts. Therefore, as envisioned in IAS 8, Accounting Policies, Changes in Accounting Estimates and Errors, the provisions embodied under accounting principles generally accepted in the United States of America (“US GAAP”) have been applied to those aspects where specific guidance is not provided by IFRS 4, Insurance Contracts.
The consolidated financial statements are presented in millions of Euro (€ mn).
2 Changes in the presentation of the consolidated financial statements
Recently adopted US accounting pronouncements
In September 2005, the Accounting Standards Executive Committee (“AcSEC”) of the AICPA issued SOP 05-1, Accounting by Insurance Enterprises for Deferred Acquisition Costs in Connection with Modifications or Exchanges of Insurance Contracts (“SOP 05-1”). SOP 05-1 provides guidance on accounting by insurance enterprises for deferred costs on internal replacements of insurance and investment contracts other than those specifically described in SFAS 97. SOP 05-1 defines an internal replacement as a modification in product benefits, features, rights, or coverages that occurs by the exchange of a contract for a new contract, or by amendment, endorsement, or rider to a contract, or by the election of a feature or coverage within a contract. SOP 05-1 is effective for the year ending December 31, 2007.
Consistent with the Allianz Group’s application of US GAAP for insurance and reinsurance contracts, Allianz has adopted SOP 05-1 as of January 1, 2007. SOP 05-1 has had no material impact on Allianz’s net income or financial position.
Reclassifications
Beginning with the third quarter of 2006, income from fully consolidated private equity investments and expenses from fully consolidated private equity investments have been included as separate line items in the consolidated income statements. Accordingly, the prior period income statement has been reclassified to conform to the current period presentation.
A summary of the impact of these changes on the consolidated income statement for the three months ended March, 31, 2006 is as follows:
Three months as previously | Reclassifi- cations | Three months ended March 31, 2006 | ||||||||||
| € mn | € mn | € mn | ||||||||||
| Interest and similar income | 5,691 | (8) | 5,683 | |||||||||
| Fee and commission income | 2,403 | (151) | 2,252 | |||||||||
Income from fully con- solidated private equity investments | — | 159 | 159 | |||||||||
| Interest expense | (1,600) | 35 | (1,565) | |||||||||
Acquisition costs and ad- ministrative expenses (net) | (5,843) | 17 | (5,826) | |||||||||
| Fee and commission expenses | (688) | 110 | (578) | |||||||||
| Expenses from fully con- solidated private equity investments | — | (162) | (162) |
Certain immaterial amounts of unearned premiums were previously netted against deferred acquisition costs in the consolidated balance sheets and against the related amortization account in the income statements. All periods have now been presented on a gross basis.
37
Table of Contents
Allianz Group Interim Report First Quarter of 2007
Business Segment Information – Consolidated Balance Sheets
As of March 31, 2007 and as of December 31, 2006
| Property-Casualty | Life/Health | Banking | ||||||||||||||||||||||||
As of March 31, 2007 € mn | As of December 31, € mn | As of March 31, 2007 € mn | As of December 31, € mn | As of March 31, 2007 € mn | As of December 31, € mn | |||||||||||||||||||||
| ASSETS | ||||||||||||||||||||||||||
| Cash and cash equivalents | 4,865 | 4,100 | 10,531 | 6,998 | 13,121 | 21,528 | ||||||||||||||||||||
| Financial assets carried at fair value through income | 4,996 | 4,814 | 11,823 | 11,026 | 143,967 | 139,505 | ||||||||||||||||||||
| Investments | 88,901 | 88,819 | 190,330 | 190,607 | 18,435 | 17,803 | ||||||||||||||||||||
| Loans and advances to banks and customers | 17,954 | 16,825 | 88,686 | 85,769 | 346,788 | 313,709 | ||||||||||||||||||||
| Financial assets for unit linked contracts | — | — | 63,765 | 61,864 | — | — | ||||||||||||||||||||
| Reinsurance assets | 10,835 | 11,437 | 6,679 | 7,966 | — | — | ||||||||||||||||||||
| Deferred acquisition costs | 4,065 | 3,704 | 15,809 | 15,381 | — | — | ||||||||||||||||||||
| Deferred tax assets | 1,635 | 1,651 | 505 | 503 | 1,709 | 1,679 | ||||||||||||||||||||
| Other assets | 21,039 | 17,737 | 15,475 | 12,891 | 11,307 | 9,571 | ||||||||||||||||||||
| Intangible assets | 2,182 | 1,653 | 2,397 | 2,399 | 2,284 | 2,285 | ||||||||||||||||||||
| Total assets | 156,472 | 150,740 | 406,000 | 395,404 | 537,611 | 506,080 | ||||||||||||||||||||
| Property-Casualty | Life/Health | Banking | ||||||||||||||||||||||||
As of March 31, 2007 € mn | As of 2006 € mn | As of March 31, 2007 € mn | As of December 31, € mn | As of March 31, 2007 € mn | As of December 31, € mn | |||||||||||||||||||||
| LIABILITIES AND EQUITY | ||||||||||||||||||||||||||
| Financial liabilities carried at fair value through income | 951 | 1,070 | 5,439 | 5,251 | 83,559 | 72,215 | ||||||||||||||||||||
| Liabilities to banks and customers | 4,709 | 4,473 | 10,931 | 7,446 | 371,704 | 350,148 | ||||||||||||||||||||
| Unearned premiums | 16,789 | 12,994 | 1,943 | 1,874 | — | — | ||||||||||||||||||||
| Reserves for loss and loss adjustment expenses | 57,321 | 58,664 | 6,877 | 6,804 | — | — | ||||||||||||||||||||
| Reserves for insurance and investment contracts | 9,011 | 8,956 | 280,387 | 278,701 | — | — | ||||||||||||||||||||
| Financial liabilities for unit linked contracts | — | — | 63,765 | 61,864 | — | — | ||||||||||||||||||||
| Deferred tax liabilities | 3,690 | 3,902 | 1,328 | 1,181 | 92 | 83 | ||||||||||||||||||||
| Other liabilities | 20,156 | 18,699 | 18,293 | 16,314 | 12,702 | 12,140 | ||||||||||||||||||||
| Certificated liabilities | 58 | 657 | 603 | 3 | 44,088 | 46,191 | ||||||||||||||||||||
| Participation certificates and subordinated liabilities | 1,606 | 1,605 | 66 | 66 | 8,025 | 8,456 | ||||||||||||||||||||
| Total liabilities | 114,291 | 111,020 | 389,632 | 379,504 | 520,170 | 489,233 | ||||||||||||||||||||
38
Table of Contents
Notes to the Consolidated Financial Statements
| Asset Management | Corporate | Consolidation | Group | |||||||||||||||||||||||||||
As of March 31, 2007 € mn | As of December 31, € mn | As of March 31, 2007 € mn | As of December 31, € mn | As of March 31, 2007 € mn | As of December 31, € mn | As of March 31, 2007 € mn | As of December 31, € mn | |||||||||||||||||||||||
| 578 | 767 | 7,313 | 536 | (695) | (898) | 35,713 | 33,031 | |||||||||||||||||||||||
| 1,032 | 985 | 896 | 1,158 | (476) | (619) | 162,238 | 156,869 | |||||||||||||||||||||||
| 720 | 774 | 97,286 | 96,652 | (96,909) | (96,521) | 298,763 | 298,134 | |||||||||||||||||||||||
| 511 | 367 | 3,376 | 2,963 | (12,869) | (11,355) | 444,446 | 408,278 | |||||||||||||||||||||||
| — | — | — | — | — | — | 63,765 | 61,864 | |||||||||||||||||||||||
| — | — | — | — | (37) | (43) | 17,477 | 19,360 | |||||||||||||||||||||||
| 52 | 50 | — | — | — | — | 19,926 | 19,135 | |||||||||||||||||||||||
| 191 | 196 | 1,223 | 1,473 | (701) | (775) | 4,562 | 4,727 | |||||||||||||||||||||||
| 3,602 | 3,471 | 5,270 | 7,020 | (14,635) | (11,797) | 42,058 | 38,893 | |||||||||||||||||||||||
| 6,300 | 6,334 | 262 | 264 | — | — | 13,425 | 12,935 | |||||||||||||||||||||||
| 12,986 | 12,944 | 115,626 | 110,066 | (126,322) | (122,008) | 1,102,373 | 1,053,226 | |||||||||||||||||||||||
| Asset Management | Corporate | Consolidation | Group | |||||||||||||||||||||||||||
As of March 31, 2007 € mn | As of December 31, € mn | As of March 31, 2007 € mn | As of December 31, € mn | As of March 31, 2007 € mn | As of December 31, € mn | As of March 31, 2007 € mn | As of December 31, € mn | |||||||||||||||||||||||
| — | — | 899 | 1,713 | (419) | (550) | 90,429 | 79,699 | |||||||||||||||||||||||
| 670 | 605 | 14,799 | 7,293 | (9,803) | (8,887) | 393,010 | 361,078 | |||||||||||||||||||||||
| — | — | — | — | (1) | — | 18,731 | 14,868 | |||||||||||||||||||||||
| — | — | — | — | 2 | (4) | 64,200 | 65,464 | |||||||||||||||||||||||
| — | — | 257 | 306 | (265) | (266) | 289,390 | 287,697 | |||||||||||||||||||||||
| — | — | — | — | — | — | 63,765 | 61,864 | |||||||||||||||||||||||
| 43 | 46 | 123 | 171 | (688) | (765) | 4,588 | 4,618 | |||||||||||||||||||||||
| 3,471 | 3,689 | 13,702 | 14,149 | (18,042) | (15,227) | 50,282 | 49,764 | |||||||||||||||||||||||
| — | — | 9,579 | 9,265 | (1,199) | (1,194) | 53,129 | 54,922 | |||||||||||||||||||||||
| — | — | 7,097 | 7,099 | (867) | (864) | 15,927 | 16,362 | |||||||||||||||||||||||
| 4,184 | 4,340 | 46,456 | 39,996 | (31,282) | (27,757) | 1,043,451 | 996,336 | |||||||||||||||||||||||
| Total equity | 58,922 | 56,890 | ||||||||||||||||||||||||||||
| Total liabilities and equity | 1,102,373 | 1,053,226 | ||||||||||||||||||||||||||||
39
Table of Contents
Allianz Group Interim Report First Quarter of 2007
Business Segment Information – Consolidated Income Statements
For the three months ended March 31, 2007 and 2006
| Property-Casualty | Life/Health | Banking | ||||||||||||||||||||||||
Three months ended March 31, | 2007 € mn | 2006 € mn | 2007 € mn | 2006 € mn | 2007 € mn | 2006 € mn | ||||||||||||||||||||
| Premiums earned (net) | 9,358 | 9,341 | 5,185 | 5,079 | — | — | ||||||||||||||||||||
| Interest and similar income | 1,006 | 922 | 3,155 | 3,047 | 2,209 | 1,880 | ||||||||||||||||||||
| Income from financial assets and liabilities carried at fair value through income (net) | (12) | 40 | (310) | 31 | 341 | 490 | ||||||||||||||||||||
| Realized gains/losses (net) | 767 | 464 | 1,193 | 1,262 | 139 | 414 | ||||||||||||||||||||
| Fee and commission income | 272 | 252 | 171 | 129 | 978 | 992 | ||||||||||||||||||||
| Other income | 84 | 14 | 54 | 6 | — | 25 | ||||||||||||||||||||
| Income from fully consolidated private equity investments | — | — | — | — | — | — | ||||||||||||||||||||
| Total income | 11,475 | 11,033 | 9,448 | 9,554 | 3,667 | 3,801 | ||||||||||||||||||||
| Claims and insurance benefits incurred (net) | (6,383) | (6,182) | (4,702) | (4,693) | — | — | ||||||||||||||||||||
| Changes in reserves for insurance and investment contracts (net) | (81) | (72) | (2,624) | (2,648) | — | — | ||||||||||||||||||||
| Interest expense | (92) | (63) | (91) | (64) | (1,281) | (1,279) | ||||||||||||||||||||
| Loan loss provisions | — | (1) | (3) | — | 5 | 33 | ||||||||||||||||||||
| Impairments of investments (net) | (26) | (13) | (37) | (35) | (13) | (20) | ||||||||||||||||||||
| Investment expenses | (74) | (48) | (196) | (157) | (9) | (6) | ||||||||||||||||||||
| Acquisition and administrative expenses (net) | (2,675) | (2,663) | (874) | (1,025) | (1,410) | (1,428) | ||||||||||||||||||||
| Fee and commission expenses | (197) | (170) | (62) | (50) | (146) | (160) | ||||||||||||||||||||
| Amortization of intangible assets | (2) | (4) | (1) | (1) | — | — | ||||||||||||||||||||
| Restructuring charges | (14) | (2) | (5) | — | (9) | (2) | ||||||||||||||||||||
| Other expenses | — | (1) | — | — | 13 | — | ||||||||||||||||||||
| Expenses from fully consolidated private equity investments | — | — | — | — | — | — | ||||||||||||||||||||
| Total expenses | (9,544) | (9,219) | (8,595) | (8,673) | (2,850) | (2,862) | ||||||||||||||||||||
| Income before income taxes and minority interests in earnings | 1,931 | 1,814 | 853 | 881 | 817 | 939 | ||||||||||||||||||||
| Income taxes | (537) | (524) | (201) | (219) | (168) | (245) | ||||||||||||||||||||
| Minority interests in earnings | (214) | (190) | (99) | (128) | (24) | (28) | ||||||||||||||||||||
| Net income | 1,180 | 1,100 | 553 | 534 | 625 | 666 | ||||||||||||||||||||
40
Table of Contents
Notes to the Consolidated Financial Statements
| Asset Management | Corporate | Consolidation | Group | |||||||||||||||||||||||||||
2007 € mn | 2006 € mn | 2007 € mn | 2006 € mn | 2007 € mn | 2006 € mn | 2007 € mn | 2006 € mn | |||||||||||||||||||||||
| — | — | — | — | — | — | 14,543 | 14,420 | |||||||||||||||||||||||
| 33 | 25 | 154 | 86 | (291) | (277) | 6,266 | 5,683 | |||||||||||||||||||||||
| 7 | 14 | 85 | (96) | 4 | 21 | 115 | 500 | |||||||||||||||||||||||
| 2 | 2 | 640 | 70 | 468 | (317) | 3,209 | 1,895 | |||||||||||||||||||||||
| 1,073 | 1,031 | 45 | 41 | (183) | (193) | 2,356 | 2,252 | |||||||||||||||||||||||
| 4 | 3 | 5 | 13 | (54) | (22) | 93 | 39 | |||||||||||||||||||||||
| — | — | 471 | 159 | — | — | 471 | 159 | |||||||||||||||||||||||
| 1,119 | 1,075 | 1,400 | 273 | (56) | (788) | 27,053 | 24,948 | |||||||||||||||||||||||
| — | — | — | — | — | — | (11,085) | (10,875) | |||||||||||||||||||||||
| — | — | — | — | (31) | 8 | (2,736) | (2,712) | |||||||||||||||||||||||
| (11) | (8) | (353) | (336) | 230 | 185 | (1,598) | (1,565) | |||||||||||||||||||||||
| — | — | — | — | — | — | 2 | 32 | |||||||||||||||||||||||
| — | — | 9 | 13 | — | — | (67) | (55) | |||||||||||||||||||||||
| 1 | — | (34) | (17) | 51 | 45 | (261) | (183) | |||||||||||||||||||||||
| (590) | (585) | (117) | (139) | 28 | 31 | (5,638) | (5,809) | |||||||||||||||||||||||
| (327) | (314) | (35) | (23) | 133 | 139 | (634) | (578) | |||||||||||||||||||||||
| — | — | — | — | — | — | (3) | (5) | |||||||||||||||||||||||
| (2) | — | — | — | — | — | (30) | (4) | |||||||||||||||||||||||
| — | — | — | — | — | — | 13 | (1) | |||||||||||||||||||||||
| — | — | (460) | (162) | — | — | (460) | (162) | |||||||||||||||||||||||
| (929) | (907) | (990) | (664) | 411 | 408 | (22,497) | (21,917) | |||||||||||||||||||||||
| 190 | 168 | 410 | (391) | 355 | (380) | 4,556 | 3,031 | |||||||||||||||||||||||
| (80) | (65) | (25) | 154 | 44 | — | (967) | (899) | |||||||||||||||||||||||
| (11) | (13) | (4) | (2) | 3 | 8 | (349) | (353) | |||||||||||||||||||||||
| 99 | 90 | 381 | (239) | 402 | (372) | 3,240 | 1,779 | |||||||||||||||||||||||
41
Table of Contents
Allianz Group Interim Report First Quarter of 2007
Segment Information – Total Revenues and Operating Profit
For the three months ended March 31, 2007 and 2006
The following table summarizes the total revenues and operating profit for each of the segments for the three months ended March 31, 2007 and 2006, as well as IFRS consolidated net income of the Allianz Group.
Property- Casualty | Life/Health | Banking | Asset Management | Corporate | Consolidation | Group | ||||||||||||||||||||||
| Three months ended March 31, | € mn | € mn | € mn | € mn | € mn | € mn | € mn | |||||||||||||||||||||
| 2007 | ||||||||||||||||||||||||||||
| Total revenues1) | 14,111 | 12,326 | 2,101 | 780 | — | 5 | 29,323 | |||||||||||||||||||||
| Operating profit (loss) | 1,267 | 750 | 700 | 312 | (101) | (58) | 2,870 | |||||||||||||||||||||
| Non-operating items | 664 | 103 | 117 | (122) | 511 | 413 | 1,686 | |||||||||||||||||||||
| Income (loss) before income taxes and minority interests in earnings | 1,931 | 853 | 817 | 190 | 410 | 355 | 4,556 | |||||||||||||||||||||
| Income taxes | (537) | (201) | (168) | (80) | (25) | 44 | (967) | |||||||||||||||||||||
| Minority interests in earnings | (214) | (99) | (24) | (11) | (4) | 3 | (349) | |||||||||||||||||||||
| Net income (loss) | 1,180 | 553 | 625 | 99 | 381 | 402 | 3,240 | |||||||||||||||||||||
| 2006 | ||||||||||||||||||||||||||||
| Total revenues1) | 14,149 | 12,822 | 1,948 | 751 | — | (29) | 29,641 | |||||||||||||||||||||
| Operating profit (loss) | 1,386 | 723 | 547 | 304 | (180) | (103) | 2,677 | |||||||||||||||||||||
| Non-operating items | 428 | 158 | 392 | (136) | (211) | (277) | 354 | |||||||||||||||||||||
| Income (loss) before income taxes and minority interests in earnings | 1,814 | 881 | 939 | 168 | (391) | (380) | 3,031 | |||||||||||||||||||||
| Income taxes | (524) | (219) | (245) | (65) | 154 | — | (899) | |||||||||||||||||||||
| Minority interests in earnings | (190) | (128) | (28) | (13) | (2) | 8 | (353) | |||||||||||||||||||||
| Net income (loss) | 1,100 | 534 | 666 | 90 | (239) | (372) | 1,779 |
1) | Total revenues comprise Property-Casualty segment’s gross premiums written, Life/Health segment’s statutory premiums, Banking segment’s operating revenues and Asset Management segment’s operating revenues. |
42
Table of Contents
Notes to the Consolidated Financial Statements
Property-Casualty Segment
| Three months ended March 31, | 2007 € mn | 2006 € mn | ||||||
| Gross premiums written1) | 14,111 | 14,149 | ||||||
| Ceded premiums written | (1,586) | (1,712) | ||||||
| Change in unearned premiums | (3,167) | (3,096) | ||||||
| Premiums earned (net) | 9,358 | 9,341 | ||||||
| Interest and similar income | 1,006 | 922 | ||||||
| Income from financial assets and liabilities designated at fair value through income (net)2) | 32 | 36 | ||||||
| Income from financial assets and liabilities held for trading (net), shared with policyholder2) | (15) | — | ||||||
| Realized gains/losses (net) from investments, shared with policyholders3) | 34 | 25 | ||||||
| Fee and commission income | 272 | 252 | ||||||
| Other income | 84 | 14 | ||||||
| Operating revenues | 10,771 | 10,590 | ||||||
| Claims and insurance benefits incurred (net) | (6,383) | (6,182) | ||||||
| Changes in reserves for insurance and investment contracts (net) | (81) | (72) | ||||||
| Interest expense | (92) | (63) | ||||||
| Loan loss provisions | — | (1) | ||||||
| Impairments of investments (net), shared with policyholders4) | (2) | (4) | ||||||
| Investment expenses | (74) | (48) | ||||||
| Acquisition and administrative expenses (net) | (2,675) | (2,663) | ||||||
| Fee and commission expenses | (197) | (170) | ||||||
| Other expenses | — | (1) | ||||||
| Operating expenses | (9,504) | (9,204) | ||||||
| Operating profit | 1,267 | 1,386 | ||||||
| Income from financial assets and liabilities held for trading (net), not shared with policyholders2) | (29) | 4 | ||||||
| Realized gains/losses (net) from investments, not shared with policyholders3) | 733 | 439 | ||||||
| Impairments of investments (net), not shared with policyholders4) | (24) | (9) | ||||||
| Amortization of intangible assets | (2) | (4) | ||||||
| Restructuring charges | (14) | (2) | ||||||
| Non-operating items | 664 | 428 | ||||||
| Income before income taxes and minority interests in earnings | 1,931 | 1,814 | ||||||
| Income taxes | (537) | (524) | ||||||
| Minority interests in earnings | (214) | (190) | ||||||
| Net income | 1,180 | 1,100 | ||||||
| Loss ratio5)in % | 68.2 | 66.2 | ||||||
| Expense ratio6)in % | 28.6 | 28.5 | ||||||
| Combined ratio7)in % | 96.8 | 94.7 |
1) | For the Property-Casualty segment, total revenues are measured based upon gross premiums written. |
2) | The total of these items equals income from financial assets and liabilities carried at fair value through income (net) in the segment income statement. |
3) | The total of these items equals realized gains/losses (net) in the segment income statement. |
4) | The total of these items equals impairments of investments (net) in the segment income statement. |
5) | Represents claims and insurance benefits incurred (net) divided by premiums earned (net). |
6) | Represents acquisition and administrative expenses (net) divided by premiums earned (net). |
7) | Represents the total of acquisition and administrative expenses (net) and claims and insurance benefits incurred (net) divided by premiums earned (net). |
43
Table of Contents
Allianz Group Interim Report First Quarter of 2007
Life/Health Segment
| Three months ended March 31, | 2007 € mn | 2006 € mn | ||||||
Statutory premiums1) | 12,326 | 12,822 | ||||||
Ceded premiums written | (193) | (196) | ||||||
Change in unearned premiums | (27) | (75) | ||||||
Statutory premiums (net) | 12,106 | 12,551 | ||||||
Deposits from SFAS 97 insurance and investment contracts | (6,921) | (7,472) | ||||||
Premiums earned (net) | 5,185 | 5,079 | ||||||
Interest and similar income | 3,155 | 3,047 | ||||||
Income from financial assets and liabilities carried at fair value through income (net), shared with policyholders2) | (311) | 31 | ||||||
Realized gains/losses (net) from investments, shared with policyholders3) | 1,088 | 1,103 | ||||||
Fee and commission income | 171 | 129 | ||||||
Other income | 54 | 6 | ||||||
Operating revenues | 9,342 | 9,395 | ||||||
Claims and insurance benefits incurred (net) | (4,702) | (4,693) | ||||||
Changes in reserves for insurance and investment contracts (net) | (2,624) | (2,648) | ||||||
Interest expense | (91) | (64) | ||||||
Loan loss provisions | (3) | — | ||||||
Impairments of investments (net), shared with policyholders | (37) | (35) | ||||||
Investment expenses | (196) | (157) | ||||||
Acquisition and administrative expenses (net) | (874) | (1,025) | ||||||
Fee and commission expenses | (62) | (50) | ||||||
Operating restructuring charges4) | (3) | — | ||||||
Operating expenses | (8,592) | (8,672) | ||||||
Operating profit | 750 | 723 | ||||||
| Income from financial assets and liabilities carried at fair value through income (net), not shared with policyholders2) | 1 | — | ||||||
Realized gains/losses (net) from investments, not shared with policyholders3) | 105 | 159 | ||||||
Amortization of intangible assets | (1) | (1) | ||||||
Non-operating restructuring charges4) | (2) | — | ||||||
Non-operating items | 103 | 158 | ||||||
Income before income taxes and minority interests in earnings | 853 | 881 | ||||||
Income taxes | (201) | (219) | ||||||
Minority interests in earnings | (99) | (128) | ||||||
Net income | 553 | 534 | ||||||
Statutory expense ratio5) in % | 7.2 | 8.2 |
1) | For the Life/Health segment, total revenues are measured based upon statutory premiums. Statutory premiums are gross premiums written from sales of life insurance policies, as well as gross receipts from sales of unit linked and other investment-oriented products, in accordance with the statutory accounting practices applicable in the insurer’s home jurisdiction. |
2) | The total of these items equals income from financial assets and liabilities carried at fair value through income (net) in the segment income statement. |
3) | The total of these items equals realized gains/losses (net) in the segment income statement. |
4) | The total of these items equals restructuring charges in the segment income statement. |
5) | Represents acquisition and administrative expenses (net) divided by statutory premiums (net). |
44
Table of Contents
Notes to the Consolidated Financial Statements
Banking Segment
| Three months ended March 31, | 2007 | 2006 | ||||||||||||||
Banking € mn | Dresdner Bank € mn | Banking € mn | Dresdner Bank € mn | |||||||||||||
| Net interest income1) | 928 | 900 | 601 | 578 | ||||||||||||
| Net fee and commission income2) | 832 | 789 | 832 | 793 | ||||||||||||
| Trading income (net)3) | 351 | 345 | 487 | 484 | ||||||||||||
| Income from financial assets and liabilities designated at fair value through income (net)3) | (10) | (11) | 3 | 3 | ||||||||||||
| Other income | — | — | 25 | 26 | ||||||||||||
| Operating revenues4) | 2,101 | 2,023 | 1,948 | 1,884 | ||||||||||||
| Administrative expenses | (1,410) | (1,355) | (1,428) | (1,381) | ||||||||||||
| Investment expenses | (9) | (11) | (6) | (7) | ||||||||||||
| Other expenses | 13 | 13 | — | — | ||||||||||||
| Operating expenses | (1,406) | (1,353) | (1,434) | (1,388) | ||||||||||||
| Loan loss provisions | 5 | 7 | 33 | 33 | ||||||||||||
| Operating profit | 700 | 677 | 547 | 529 | ||||||||||||
| Realized gains/losses (net) | 139 | 137 | 414 | 414 | ||||||||||||
| Impairments of investments (net) | (13) | (13) | (20) | (20) | ||||||||||||
| Restructuring charges | (9) | (9) | (2) | (2) | ||||||||||||
| Non-operating items | 117 | 115 | 392 | 392 | ||||||||||||
| Income before income taxes and minority interests in earnings | 817 | 792 | 939 | 921 | ||||||||||||
| Income taxes | (168) | (158) | (245) | (238) | ||||||||||||
| Minority interests in earnings | (24) | (22) | (28) | (25) | ||||||||||||
| Net income | 625 | 612 | 666 | 658 | ||||||||||||
| Cost-income ratio5)in % | 66.9 | 66.9 | 73.6 | 73.7 | ||||||||||||
1) | Represents interest and similar income less interest expense. |
2) | Represents fee and commission income less fee and commission expense. |
3) | The total of these items equals income from financial assets and liabilities carried at fair value through income (net) in the segment income statement. |
4) | For the Banking segment, total revenues are measured based upon operating revenues. |
5) | Represents operating expenses divided by operating revenues. |
45
Table of Contents
Allianz Group Interim Report First Quarter of 2007
Asset Management Segment
| Three months ended March 31, | 2007 | 2006 | ||||||||||||||
Asset Management Segment € mn | Allianz Global Investors € mn | Asset Management Segment € mn | Allianz Global Investors € mn | |||||||||||||
| Net fee and commission income1) | 746 | 728 | 717 | 704 | ||||||||||||
| Net interest income2) | 23 | 19 | 17 | 14 | ||||||||||||
| Income from financial assets and liabilities carried at fair value through income (net) | 7 | 7 | 14 | 14 | ||||||||||||
| Other income | 4 | 4 | 3 | 3 | ||||||||||||
| Operating revenues3) | 780 | 758 | 751 | 735 | ||||||||||||
| Administrative expenses, excluding acquisition-related expenses4) | (468) | (454) | (447) | (435) | ||||||||||||
| Operating expenses | (468) | (454) | (447) | (435) | ||||||||||||
| Operating profit | 312 | 304 | 304 | 300 | ||||||||||||
| Realized gains/losses (net) | 2 | 2 | 2 | 1 | ||||||||||||
| Acquisition-related expenses, thereof4) | ||||||||||||||||
Deferred purchases of interests in PIMCO | (122) | (122) | (136) | (136) | ||||||||||||
Other acquisition-related expenses5) | — | — | (2) | (2) | ||||||||||||
Subtotal | (122) | (122) | (138) | (138) | ||||||||||||
| Restructuring charges | (2) | (2) | — | — | ||||||||||||
| Non-operating items | (122) | (122) | (136) | (137) | ||||||||||||
| Income before income taxes and minority interests in earnings | 190 | 182 | 168 | 163 | ||||||||||||
| Income taxes | (80) | (79) | (65) | (64) | ||||||||||||
| Minority interests in earnings | (11) | (10) | (13) | (12) | ||||||||||||
| Net income | 99 | 93 | 90 | 87 | ||||||||||||
| Cost-income ratio6)in % | 60.0 | 59.9 | 59.5 | 59.2 | ||||||||||||
1) | Represents fee and commission income less fee and commission expense. |
2) | Represents interest and similar income less interest expense and investment expenses. |
3) | For the Asset Management segment, total revenues are measured based upon operating revenues. |
4) | The total of these items equals acquisition and administration expenses (net) in the segment income statement. |
5) | Consists of retention payments for the management and employees of PIMCO and Nicholas Applegate. |
6) | Represents operating expenses divided by operating revenues. |
46
Table of Contents
Notes to the Consolidated Financial Statements
Corporate Segment
| Three months ended March 31, | 2007 € mn | 2006 € mn | ||||||
| Interest and similar income | 154 | 86 | ||||||
| Income from financial assets and liabilities designated at fair value through income (net)1) | 1 | — | ||||||
| Fee and commission income | 45 | 41 | ||||||
| Other income | 5 | 13 | ||||||
| Income from fully consolidated private equity investments | 471 | 159 | ||||||
| Operating revenues | 676 | 299 | ||||||
| Interest expense, excluding interest expense from external debt2) | (131) | (138) | ||||||
| Investment expenses | (34) | (17) | ||||||
| Acquisition and administrative expenses (net) | (117) | (139) | ||||||
| Fee and commission expenses | (35) | (23) | ||||||
| Expenses from fully consolidated private equity investments | (460) | (162) | ||||||
| Operating expenses | (777) | (479) | ||||||
| Operating profit (loss) | (101) | (180) | ||||||
| Income from financial assets and liabilities held for trading (net)1) | 84 | (96) | ||||||
| Realized gains/losses (net) | 640 | 70 | ||||||
| Impairments of investments (net) | 9 | 13 | ||||||
| Interest expense from external debt2) | (222) | (198) | ||||||
| Non-operating items | 511 | (211) | ||||||
| Income (loss) before income taxes and minority interests in earnings | 410 | (391) | ||||||
| Income taxes | (25) | 154 | ||||||
| Minority interests in earnings | (4) | (2) | ||||||
| Net income (loss) | 381 | (239) |
1) | The total of these items equals income from financial assets and liabilities carried at fair value through income (net) in the segment income statement. |
2) | The total of these items equals interest expense in the segment income statement. |
47
Table of Contents
Allianz Group Interim Report First Quarter of 2007
Supplementary Information to the
Consolidated Balance Sheets
4 Financial assets carried at fair value through income
As of March 31, 2007 € mn | As of December 31, 2006 € mn | |||||||
| Financial assets held for trading | ||||||||
Debt securities | 76,678 | 81,881 | ||||||
Equity securities | 38,765 | 31,266 | ||||||
Derivative financial instruments | 26,153 | 24,835 | ||||||
Subtotal | 141,596 | 137,982 | ||||||
| Financial assets designated at fair value through income | ||||||||
Debt securities | 16,107 | 14,414 | ||||||
Equity securities | 3,828 | 3,834 | ||||||
Loans to banks and customers | 707 | 639 | ||||||
Subtotal | 20,642 | 18,887 | ||||||
| Total | 162,238 | 156,869 |
As of March 31, 2007 € mn | As of December 31, 2006 € mn | |||||||
| Available-for-sale investments | 278,149 | 277,898 | ||||||
| Held-to-maturity investments | 4,687 | 4,748 | ||||||
| Funds held by others under reinsurance contracts assumed | 1,021 | 1,033 | ||||||
| Investments in associates and joint ventures | 5,475 | 4,900 | ||||||
| Real estate held for investment | 9,431 | 9,555 | ||||||
| Total | 298,763 | 298,134 |
Available-for-sale investments
As of March 31, 2007 | As of December 31, 2006 | |||||||||||||||||||||||||||||||
Amortized € mn | Unrealized € mn | Unrealized € mn | Fair value € mn | Amortized € mn | Unrealized € mn | Unrealized € mn | Fair value € mn | |||||||||||||||||||||||||
| Equity securities | 42,612 | 25,343 | (250) | 67,705 | 43,139 | 26,795 | (159) | 69,775 | ||||||||||||||||||||||||
| Government debt securities | 113,382 | 2,267 | (1,272) | 114,377 | 112,893 | 2,813 | (1,077) | 114,629 | ||||||||||||||||||||||||
| Corporate debt securities | 93,332 | 1,321 | (962) | 93,691 | 90,493 | 1,542 | (860) | 91,175 | ||||||||||||||||||||||||
| Other debt securities | 2,263 | 145 | (32) | 2,376 | 2,122 | 215 | (18) | 2,319 | ||||||||||||||||||||||||
| Total | 251,589 | 29,076 | (2,516) | 278,149 | 248,647 | 31,365 | (2,114) | 277,898 | ||||||||||||||||||||||||
6 Loans and advances to banks and customers
| As of March 31, 2007 | As of December 31, 2006 | |||||||||||||||||||||||
Banks € mn | Customers € mn | Total € mn | Banks € mn | Customers € mn | Total € mn | |||||||||||||||||||
| Short-term investments and certificates of deposit | 8,467 | — | 8,467 | 6,775 | — | 6,775 | ||||||||||||||||||
| Reverse repurchase agreements | 92,127 | 62,949 | 155,076 | 86,957 | 52,456 | 139,413 | ||||||||||||||||||
| Collateral paid for securities borrowing transactions | 23,670 | 32,582 | 56,252 | 17,612 | 23,419 | 41,031 | ||||||||||||||||||
| Loans | 69,295 | 127,128 | 196,423 | 69,211 | 129,319 | 198,530 | ||||||||||||||||||
| Other advances | 13,106 | 16,187 | 29,293 | 15,225 | 8,358 | 23,583 | ||||||||||||||||||
| Subtotal | 206,665 | 238,846 | 445,511 | 195,780 | 213,552 | 409,332 | ||||||||||||||||||
| Loan loss allowance | (108) | (957) | (1,065) | (108) | (946) | (1,054) | ||||||||||||||||||
| Total | 206,557 | 237,889 | 444,446 | 195,672 | 212,606 | 408,278 | ||||||||||||||||||
48
Table of Contents
Notes to the Consolidated Financial Statements
Loans and advances to customers by type of customer
As of March 31, 2007 € mn | As of 2006 € mn | |||||||
| Corporate customers | 171,682 | 146,750 | ||||||
| Private customers | 58,935 | 59,505 | ||||||
| Public authorities | 8,229 | 7,297 | ||||||
| Subtotal | 238,846 | 213,552 | ||||||
| Loan loss allowance | (957) | (946) | ||||||
| Total | 237,889 | 212,606 |
As of March 31, 2007 € mn | As of 2006 € mn | |||||||
| Unearned premiums | 1,758 | 1,317 | ||||||
| Reserves for loss and loss adjustment expenses | 8,795 | 9,719 | ||||||
| Aggregate policy reserves | 6,868 | 8,223 | ||||||
| Other insurance reserves | 56 | 101 | ||||||
| Total | 17,477 | 19,360 |
As of March 31, 2007 € mn | As of 2006 € mn | |||||||
| Deferred acquisition costs | ||||||||
Property-Casualty | 4,054 | 3,692 | ||||||
Life/Health | 13,967 | 13,619 | ||||||
Asset Management | 52 | 50 | ||||||
Subtotal | 18,073 | 17,361 | ||||||
| Present value of future profits | 1,296 | 1,227 | ||||||
| Deferred sales inducements | 557 | 547 | ||||||
| Total | 19,926 | 19,135 |
As of 2007 € mn | As of € mn | |||||||
| Receivables | ||||||||
Policyholders | 4,442 | 4,292 | ||||||
Agents | 4,592 | 3,698 | ||||||
Reinsurers | 2,118 | 2,832 | ||||||
Other | 7,789 | 6,283 | ||||||
Less allowance for doubtful accounts | (336) | (330) | ||||||
Subtotal | 18,605 | 16,775 | ||||||
| Tax receivables | ||||||||
Income tax | 2,088 | 1,995 | ||||||
Other tax | 755 | 690 | ||||||
Subtotal | 2,843 | 2,685 | ||||||
Accrued dividends, interest and rent | 5,487 | 5,658 | ||||||
| Prepaid expenses | ||||||||
Interest and rent | 3,149 | 2,678 | ||||||
Other prepaid expenses | 247 | 173 | ||||||
Subtotal | 3,396 | 2,851 | ||||||
| Derivative financial instruments used for hedging that meet the criteria for hedge accounting and firm commitments | 479 | 463 | ||||||
| Property and equipment | ||||||||
Real estate held for use | 4,708 | 4,758 | ||||||
Equipment | 1,629 | 1,597 | ||||||
Software | 1,057 | 1,078 | ||||||
Subtotal | 7,394 | 7,433 | ||||||
| Non-current assets and disposal groups held for sale | 18 | — | ||||||
| Other assets1) | 3,836 | 3,028 | ||||||
| Total | 42,058 | 38,893 |
1) | As of March 31, 2007, includes prepaid benefit costs for defined benefit plans of€ 274 mn. |
As of March 31, 2007 € mn | As of 2006 € mn | |||||||
| Goodwill | 12,486 | 12,007 | ||||||
| Brand names | 731 | 717 | ||||||
| Other | 208 | 211 | ||||||
| Total | 13,425 | 12,935 |
Changes in goodwill for the three months ended March 31, 2007, were as follows:
| € mn | ||||
| Cost as of 1/1/2007 | 12,231 | |||
| Accumulated impairments as of 1/1/2007 | (224) | |||
| Carrying amount as of 1/1/2007 | 12,007 | |||
| Additions | 515 | |||
| Foreign currency translation adjustments | (36) | |||
| Carrying amount as of 3/31/2007 | 12,486 | |||
| Accumulated impairments as of 3/31/2007 | 224 | |||
| Cost as of 3/31/2007 | 12,710 |
49
Table of Contents
Allianz Group Interim Report First Quarter of 2007
Additions include goodwill from
| • | increasing the interest in Russian People’s Insurance Society, Moscow, from 47.4% to 97.2%, |
| • | the acquisition of 100.0% participation in United Mercantile Agencies, Inc., Kentucky. |
11 Financial liabilities carried at fair value through income
As of March 31, 2007 € mn | As of 2006 € mn | |||||||
| Financial liabilities held for trading | ||||||||
Obligations to deliver securities | 47,812 | 39,951 | ||||||
Derivative financial instruments | 28,906 | 27,823 | ||||||
Other trading liabilities | 12,722 | 10,988 | ||||||
Subtotal | 89,440 | 78,762 | ||||||
| Financial liabilities designated at fair value through income | 989 | 937 | ||||||
| Total | 90,429 | 79,699 |
12 Liabilities to banks and customers
| As of March 31, 2007 | As of December 31, 2006 | |||||||||||||||||||||||
Banks € mn | Customers € mn | Total € mn | Banks € mn | Customers € mn | Total € mn | |||||||||||||||||||
| Payable on demand | 13,473 | 59,696 | 73,169 | 18,216 | 68,677 | 86,893 | ||||||||||||||||||
| Savings deposits | — | 5,345 | 5,345 | — | 5,421 | 5,421 | ||||||||||||||||||
| Term deposits and certificates of deposit | 65,361 | 65,262 | 130,624 | 68,429 | 50,380 | 118,809 | ||||||||||||||||||
| Repurchase agreements | 80,778 | 57,519 | 138,297 | 68,189 | 49,403 | 117,592 | ||||||||||||||||||
| Collateral received from securities lending transactions | 22,545 | 11,165 | 33,710 | 19,914 | 8,703 | 28,617 | ||||||||||||||||||
| Other | 8,756 | 3,109 | 11,865 | 876 | 2,870 | 3,746 | ||||||||||||||||||
| Total | 190,913 | 202,096 | 393,010 | 175,624 | 185,454 | 361,078 | ||||||||||||||||||
13 Reserves for loss and loss adjustment expenses
As of March 31, | As of December 31, | |||||||
2007 € mn | 2006 € mn | |||||||
| Property-Casualty | 57,321 | 58,664 | ||||||
| Life/Health | 6,877 | 6,804 | ||||||
| Consolidation | 2 | (4) | ||||||
| Total | 64,200 | 65,464 |
Changes in the reserves for loss and loss adjustment expenses for the Property-Casualty segment for the three months ended March 31, 2007 and 2006, are as follows:
| 2007 | 2006 | |||||||||||||||||||||||
Gross € mn | Ceded € mn | Net € mn | Gross € mn | Ceded € mn | Net € mn | |||||||||||||||||||
| Reserves for loss and loss adjustment expenses as of 1/1/ | 58,664 | (9,333) | 49,331 | 60,259 | (10,604) | 49,655 | ||||||||||||||||||
| Loss and loss adjustment expenses incurred | ||||||||||||||||||||||||
Current year | 7,581 | (990) | 6,591 | 7,148 | (785) | 6,363 | ||||||||||||||||||
Prior years | (407) | 199 | (208) | (180) | (1) | (181) | ||||||||||||||||||
Subtotal | 7,174 | (791) | 6,383 | 6,968 | (786) | 6,182 | ||||||||||||||||||
| Loss and loss adjustment expenses paid | ||||||||||||||||||||||||
Current year | (1,825) | 142 | (1,683) | (1,515) | 34 | (1,481) | ||||||||||||||||||
Prior years | (5,879) | 771 | (5,108) | (5,745) | 962 | (4,783) | ||||||||||||||||||
Subtotal | (7,704) | 913 | (6,791) | (7,260) | 996 | (6,264) | ||||||||||||||||||
| Foreign currency translation adjustments and other | (920) | 782 | (138) | (652) | 258 | (394) | ||||||||||||||||||
| Changes in the consolidated subsidiaries of the Allianz Group | 107 | (9) | 98 | — | — | — | ||||||||||||||||||
| Reserves for loss and loss adjustment expenses as of 3/31/ | 57,321 | (8,438) | 48,883 | 59,315 | (10,136) | 49,179 |
50
Table of Contents
Notes to the Consolidated Financial Statements
14 Reserves for insurance and investment contracts
As of March 31, 2007 € mn | As of € mn | |||||||
| Aggregate policy reserves | 257,949 | 256,333 | ||||||
| Reserves for premium refunds | 30,668 | 30,689 | ||||||
| Other insurance reserves | 773 | 675 | ||||||
| Total | 289,390 | 287,697 |
As of March 31, 2007 € mn | As of € mn | |||||||
| Payables | ||||||||
Policyholders | 4,830 | 5,322 | ||||||
Reinsurance | 2,053 | 1,868 | ||||||
Agents | 1,583 | 1,494 | ||||||
Subtotal | 8,466 | 8,684 | ||||||
| Payables for social security | 466 | 219 | ||||||
| Tax payables | ||||||||
Income tax | 2,321 | 2,076 | ||||||
Other | 1,251 | 968 | ||||||
Subtotal | 3,572 | 3,044 | ||||||
| Accrued interest and rent | 572 | 793 | ||||||
| Unearned income | ||||||||
Interest and rent | 2,742 | 2,645 | ||||||
Other | 284 | 279 | ||||||
Subtotal | 3,026 | 2,924 | ||||||
| Provisions | ||||||||
Pensions and similar obligations | 4,130 | 4,120 | ||||||
Employee related | 2,561 | 3,120 | ||||||
Share-based compensation | 1,700 | 1,898 | ||||||
Restructuring plans | 774 | 887 | ||||||
Loan commitments | 240 | 261 | ||||||
Other provisions | 1,833 | 1,943 | ||||||
Subtotal | 11,238 | 12,229 | ||||||
| Deposits retained for reinsurance ceded | 4,465 | 5,716 | ||||||
| Derivative financial instruments used for hedging purposes that meet the criteria for hedge accounting and firm commitments | 803 | 907 | ||||||
| Financial liabilities for puttable equity instruments | 4,098 | 3,750 | ||||||
| Other liabilities | 13,576 | 11,498 | ||||||
| Total | 50,282 | 49,764 |
As of March 31, 2007 € mn | As of € mn | |||||||
| Allianz SE1) | ||||||||
Senior bonds | 6,197 | 6,195 | ||||||
Exchangeable bonds | 450 | 1,262 | ||||||
Money market securities | 1,986 | 870 | ||||||
Subtotal | 8,633 | 8,327 | ||||||
| Banking subsidiaries | ||||||||
Senior bonds | 20,031 | 23,337 | ||||||
Money market securities | 23,861 | 22,655 | ||||||
Subtotal | 43,892 | 45,992 | ||||||
| All other subsidiaries | ||||||||
Certificated liabilities | 4 | 4 | ||||||
Money market securities | 600 | 599 | ||||||
Subtotal | 604 | 603 | ||||||
| Total | 53,129 | 54,922 |
1) | Includes senior bonds, exchangeable bonds and money market securities issued by Allianz Finance B. V. and Allianz Finance II B. V. guaranteed by Allianz SE and money market securities issued by Allianz Finance Corporation, a wholly-owned subsidiary of Allianz SE, which are fully and unconditionally guaranteed by Allianz SE. |
17 Participation certificates and subordinated liabilities
As of March 31, 2007 € mn | As of € mn | |||||||
| Allianz SE1) | ||||||||
Subordinated bonds | 6,881 | 6,883 | ||||||
Participation certificates | 85 | 85 | ||||||
Subtotal | 6,966 | 6,968 | ||||||
| Banking subsidiaries | ||||||||
Subordinated liabilities | 3,257 | 3,669 | ||||||
Hybrid equity | 2,505 | 2,513 | ||||||
Participation certificates | 2,249 | 2,262 | ||||||
Subtotal | 8,011 | 8,444 | ||||||
| All other subsidiaries | ||||||||
Subordinated liabilities | 905 | 905 | ||||||
Hybrid equity | 45 | 45 | ||||||
Subtotal | 950 | 950 | ||||||
| Total | 15,927 | 16,362 |
1) | Includes subordinated bonds issued by Allianz Finance B.V. and Allianz Finance II B.V. and guaranteed by Allianz SE. |
51
Table of Contents
Allianz Group Interim Report First Quarter of 2007
As of March 31, 2007 € mn | As of € mn | |||||||
| Shareholders’ equity | ||||||||
Issued capital | 1,106 | 1,106 | ||||||
Capital reserve | 24,292 | 24,292 | ||||||
Revenue reserves | 17,220 | 14,070 | ||||||
Treasury shares | (93) | (441) | ||||||
Foreign currency translation adjustments | (2,351) | (2,210) | ||||||
Unrealized gains and losses (net)1) | 12,109 | 13,664 | ||||||
Subtotal | 52,283 | 50,481 | ||||||
| Minority interests | 6,639 | 6,409 | ||||||
| Total | 58,922 | 56,890 |
1) | As of March 31, 2007 includes€ 145 mn related to cash flow hedges (2006: € 140 mn). |
52
Table of Contents
Notes to the Consolidated Financial Statements
Supplementary Information to the Consolidated Income Statements
Three months ended March 31, | Property- Casualty | Life/Health | Consolidation | Total | ||||||||||||
€ mn | € mn | € mn | € mn | |||||||||||||
| 2007 | ||||||||||||||||
| Premiums written | ||||||||||||||||
Direct | 13,464 | 5,311 | — | 18,775 | ||||||||||||
Assumed | 647 | 84 | (3) | 728 | ||||||||||||
Subtotal | 14,111 | 5,395 | (3) | 19,503 | ||||||||||||
Ceded | (1,586) | (178) | 3 | (1,761) | ||||||||||||
Net | 12,525 | 5,217 | — | 17,742 | ||||||||||||
| Change in unearned premiums | ||||||||||||||||
Direct | (3,498) | (38) | — | (3,536) | ||||||||||||
Assumed | (39) | 4 | — | (35) | ||||||||||||
Subtotal | (3,537) | (34) | — | (3,571) | ||||||||||||
Ceded | 370 | 2 | — | 372 | ||||||||||||
Net | (3,167) | (32) | — | (3,199) | ||||||||||||
| Premiums earned | ||||||||||||||||
Direct | 9,966 | 5,273 | — | 15,239 | ||||||||||||
Assumed | 608 | 88 | (3) | 693 | ||||||||||||
Subtotal | 10,574 | 5,361 | (3) | 15,932 | ||||||||||||
Ceded | (1,216) | (176) | 3 | (1,389) | ||||||||||||
Net | 9,358 | 5,185 | — | 14,543 | ||||||||||||
| 2006 | ||||||||||||||||
| Premiums written | ||||||||||||||||
Direct | 13,471 | 5,272 | — | 18,743 | ||||||||||||
Assumed | 678 | 72 | (5) | 745 | ||||||||||||
Subtotal | 14,149 | 5,344 | (5) | 19,488 | ||||||||||||
Ceded | (1,712) | (190) | 5 | (1,897) | ||||||||||||
Net | 12,437 | 5,154 | — | 17,591 | ||||||||||||
| Change in unearned premiums | ||||||||||||||||
Direct | (3,532) | (77) | — | (3,609) | ||||||||||||
Assumed | (63) | 2 | — | (61) | ||||||||||||
Subtotal | (3,595) | (75) | — | (3,670) | ||||||||||||
Ceded | 499 | — | — | 499 | ||||||||||||
Net | (3,096) | (75) | — | (3,171) | ||||||||||||
| Premiums earned | ||||||||||||||||
Direct | 9,939 | 5,195 | — | 15,134 | ||||||||||||
Assumed | 615 | 74 | (5) | 684 | ||||||||||||
Subtotal | 10,554 | 5,269 | (5) | 15,818 | ||||||||||||
Ceded | (1,213) | (190) | 5 | (1,398) | ||||||||||||
Net | 9,341 | 5,079 | — | 14,420 |
53
Table of Contents
Allianz Group Interim Report First Quarter of 2007
20 Interest and similar income
| Three months ended March 31, | 2007 € mn | 2006 € mn | ||||||
Interest from held-to-maturity investments | 56 | 60 | ||||||
Dividends from available-for-sale investments | 307 | 273 | ||||||
Interest from available-for-sale investments | 2,368 | 2,217 | ||||||
Share of earnings from investments in associates and joint ventures | 259 | 74 | ||||||
Rent from real estate held for investment | 209 | 219 | ||||||
| Interest from loans to banks and customers | 2,998 | 2,807 | ||||||
| Other | 69 | 33 | ||||||
| Total | 6,266 | 5,683 |
21 Income from financial assets and liabilities carried at fair value through income (net)
Three months ended March 31, | Property- Casualty | Life/Health | Banking | Asset Management | Corporate | Consolidation | Group | |||||||||||||||||||||
€ mn | € mn | € mn | € mn | € mn | € mn | € mn | ||||||||||||||||||||||
| 2007 | ||||||||||||||||||||||||||||
| Income (expense) from financial assets and liabilities held for trading (net) | (44) | (414) | 351 | (1) | 82 | 4 | (22) | |||||||||||||||||||||
| Income from financial assets designated at fair value through income | 30 | 139 | 32 | 22 | 3 | — | 226 | |||||||||||||||||||||
| Expense from financial liabilities designated at fair value through income | 2 | 8 | (42) | — | — | — | (32) | |||||||||||||||||||||
| Income (expense) from financial liabilities for puttable equity instruments (net) | — | (43) | — | (14) | — | — | (57) | |||||||||||||||||||||
| Total | (12) | (310) | 341 | 7 | 85 | 4 | 115 | |||||||||||||||||||||
| 2006 | ||||||||||||||||||||||||||||
| Income (expense) from financial assets and liabilities held for trading (net) | 4 | (18) | 487 | 3 | (96) | 21 | 401 | |||||||||||||||||||||
| Income from financial assets designated at fair value through income | 44 | 154 | 21 | 36 | — | — | 255 | |||||||||||||||||||||
| Expense from financial liabilities designated at fair value through income | (1) | — | (18) | — | — | — | (19) | |||||||||||||||||||||
| Income (expense) from financial liabilities for puttable equity instruments (net) | (7) | (105) | — | (25) | — | — | (137) | |||||||||||||||||||||
| Total | 40 | 31 | 490 | 14 | (96) | 21 | 500 |
54
Table of Contents
Notes to the Consolidated Financial Statements
Income from financial assets and liabilities held for trading (net)
Life/Health Segment
Income from financial assets and liabilities held for trading for the three months ended March 31, 2007 includes expenses of € 417 mn (2006: € 17 mn) from derivative financial instruments in the Life/Health insurance segment. This includes expenses from derivative financial instruments related to equity indexed annuity contracts and guaranteed benefits under unit-linked contracts of € 140 mn (2006: income: € 39 mn) and expenses from other derivative financial instruments of € 277 mn (2006: € 56 mn).
Banking Segment
Income from financial assets and liabilities held for trading of the Banking segment comprises:
| Three months ended March 31, | 2007 € mn | 2006 € mn | ||||||
| Trading in interest products | 240 | 242 | ||||||
| Trading in equity products | 145 | 136 | ||||||
| Foreign exchange/precious metals trading | 82 | 110 | ||||||
| Other trading activities | (116) | (1) | ||||||
| Total | 351 | 487 |
Corporate Segment
Income from financial assets and liabilities held for trading for the three months ended March 31, 2007, includes income of € 50 mn (2006: expenses: € 71 mn) from derivative financial instruments used by the Corporate segment for which hedge accounting is not applied. This includes expenses from derivative financial instruments embedded in exchangeable bonds of € 97 mn (2006: € 335 mn), income from derivative financial instruments which economically hedge the exchangeable bonds, however which do not qualify for hedge accounting, of € 164 mn (2006: € 232 mn), and expenses from other derivative financial instruments of € 17 mn (2006: income: € 32 mn).
22 Realized gains/losses (net)
| Three months ended March 31, | 2007 € mn | 2006 € mn | ||||||
| Realized gains | ||||||||
| Available-for-sale investments | ||||||||
Equity securities | 3,158 | 1,518 | ||||||
Debt securities | 139 | 224 | ||||||
Subtotal | 3,297 | 1,742 | ||||||
Investments in associates and joint ventures1) | 7 | 141 | ||||||
| Loans to banks and customers | 9 | 27 | ||||||
| Real estate held for investment | 109 | 174 | ||||||
| Subtotal | 3,422 | 2,084 | ||||||
| Realized losses | ||||||||
| Available-for-sale investments | ||||||||
Equity securities | (54) | (72) | ||||||
Debt securities | (136) | (90) | ||||||
Subtotal | (190) | (162) | ||||||
Investments in associates and joint ventures2) | (3) | (3) | ||||||
| Loans to banks and customers | (13) | (6) | ||||||
| Real estate held for investment | (7) | (18) | ||||||
| Subtotal | (213) | (189) | ||||||
| Total | 3,209 | 1,895 |
1) | During the three months ended March 31, 2007, includes realized gains from the disposal of subsidiaries of€ 1 mn (2006:€ 45 mn). |
2) | During the three months ended March 31, 2007, includes realized losses from the disposal of subsidiaries of€ – mn (2006:€ – mn). |
55
Table of Contents
Allianz Group Interim Report First Quarter of 2007
| Three months ended March 31, | 2007 | 2006 | ||||||||||||||||||||||
Segment € mn | Consolidation € mn | Group € mn | Segment € mn | Consolidation € mn | Group € mn | |||||||||||||||||||
| Property-Casualty | ||||||||||||||||||||||||
Fees from credit and assistance business | 173 | — | 173 | 168 | — | 168 | ||||||||||||||||||
| Service agreements | 99 | (5) | 94 | 81 | (10) | 71 | ||||||||||||||||||
| Investment advisory | — | — | — | 3 | — | 3 | ||||||||||||||||||
| Subtotal | 272 | (5) | 267 | 252 | (10) | 242 | ||||||||||||||||||
| Life/Health | ||||||||||||||||||||||||
| Service agreements | 54 | (11) | 43 | 37 | (21) | 16 | ||||||||||||||||||
| Investment advisory | 114 | (8) | 106 | 87 | — | 87 | ||||||||||||||||||
| Other | 3 | (3) | — | 5 | (3) | 2 | ||||||||||||||||||
| Subtotal | 171 | (22) | 149 | 129 | (24) | 105 | ||||||||||||||||||
| Banking | ||||||||||||||||||||||||
| Securities business | 465 | (49) | 416 | 465 | (47) | 418 | ||||||||||||||||||
| Investment advisory | 154 | (38) | 116 | 152 | (40) | 112 | ||||||||||||||||||
| Payment transactions | 91 | — | 91 | 91 | — | 91 | ||||||||||||||||||
| Mergers and acquisitions advisory | 41 | — | 41 | 65 | — | 65 | ||||||||||||||||||
| Underwriting business | 23 | — | 23 | 35 | — | 35 | ||||||||||||||||||
| Other | 204 | (9) | 195 | 184 | (26) | 158 | ||||||||||||||||||
| Subtotal | 978 | (96) | 882 | 992 | (113) | 879 | ||||||||||||||||||
| Asset Management | ||||||||||||||||||||||||
| Management fees | 866 | (30) | 836 | 841 | (21) | 820 | ||||||||||||||||||
| Loading and exit fees | 82 | — | 82 | 93 | — | 93 | ||||||||||||||||||
| Performance fees | 16 | — | 16 | 16 | — | 16 | ||||||||||||||||||
| Other | 109 | (2) | 107 | 81 | (3) | 78 | ||||||||||||||||||
| Subtotal | 1,073 | (32) | 1,041 | 1,031 | (24) | 1,007 | ||||||||||||||||||
| Corporate | ||||||||||||||||||||||||
| Service agreements | 45 | (28) | 17 | 41 | (22) | 19 | ||||||||||||||||||
| Subtotal | 45 | (28) | 17 | 41 | (22) | 19 | ||||||||||||||||||
| Total | 2,539 | (183) | 2,356 | 2,445 | (193) | 2,252 | ||||||||||||||||||
Three months ended March 31, | 2007 € mn | 2006 € mn | ||||||
| Income from real estate held for use | ||||||||
Realized gains from disposals of real estate held for use | 91 | 35 | ||||||
Other income from real estate held for use | — | 4 | ||||||
Subtotal | 91 | 39 | ||||||
| Income from non-current assets and disposal groups held for sale | 2 | — | ||||||
| Total | 93 | 39 |
25 Income from fully consolidated private equity investments
Three months ended March 31, | MAN Roland € mn | Four Seasons Health Care Ltd. | Total € mn | |||||||||
| 2007 | ||||||||||||
| Sales and service revenues | 456 | — | 456 | |||||||||
| Other operating revenues | 12 | — | 12 | |||||||||
| Interest income | 3 | — | 3 | |||||||||
| Total | 471 | — | 471 | |||||||||
| 2006 | ||||||||||||
| Sales and service revenues | — | 159 | 159 | |||||||||
| Other operating revenues | — | — | — | |||||||||
| Interest income | — | — | — | |||||||||
| Total | — | 159 | 159 |
56
Table of Contents
Notes to the Consolidated Financial Statements
26 Claims and insurance benefits incurred (net)
Three months ended March 31, | Property- Casualty | Life/Health | Consolidation | Total | ||||||||||||
€ mn | € mn | € mn | € mn | |||||||||||||
| 2007 | ||||||||||||||||
| Gross | ||||||||||||||||
Claims and insurance benefits paid | (7,704) | (4,888) | 6 | (12,586) | ||||||||||||
Change in loss and loss adjustment expenses | 530 | 10 | (1) | 539 | ||||||||||||
Subtotal | (7,174) | (4,878) | 5 | (12,047) | ||||||||||||
| Ceded | ||||||||||||||||
Claims and insurance benefits paid | 912 | 202 | (6) | 1,108 | ||||||||||||
Change in loss and loss adjustment expenses | (121) | (26) | 1 | (146) | ||||||||||||
Subtotal | 791 | 176 | (5) | 962 | ||||||||||||
| Net | ||||||||||||||||
Claims and insurance benefits paid | (6,792) | (4,686) | — | (11,478) | ||||||||||||
Change in loss and loss adjustment expenses | 409 | (16) | — | 393 | ||||||||||||
Total | (6,383) | (4,702) | — | (11,085) | ||||||||||||
| 2006 | ||||||||||||||||
| Gross | ||||||||||||||||
Claims and insurance benefits paid | (7,260) | (4,956) | 4 | (12,212) | ||||||||||||
Change in loss and loss adjustment expenses | 292 | 86 | (1) | 377 | ||||||||||||
Subtotal | (6,968) | (4,870) | 3 | (11,835) | ||||||||||||
| Ceded | ||||||||||||||||
Claims and insurance benefits paid | 996 | 176 | (4) | 1,168 | ||||||||||||
Change in loss and loss adjustment expenses | (210) | 1 | 1 | (208) | ||||||||||||
Subtotal | 786 | 177 | (3) | 960 | ||||||||||||
| Net | ||||||||||||||||
Claims and insurance benefits paid | (6,264) | (4,780) | — | (11,044) | ||||||||||||
Change in loss and loss adjustment expenses | 82 | 87 | — | 169 | ||||||||||||
Total | (6,182) | (4,693) | — | (10,875) |
57
Table of Contents
Allianz Group Interim Report First Quarter of 2007
27 Changes in reserves for insurance and investment contracts (net)
Three months ended March 31, | Property- Casualty | Life/Health
| Consolidation
| Total
| ||||||||||||
| € mn | € mn | € mn | € mn | |||||||||||||
| 2007 | ||||||||||||||||
| Gross | ||||||||||||||||
Aggregate policy reserves | (62) | (504) | — | (566) | ||||||||||||
Other insurance reserves | — | (94) | — | (94) | ||||||||||||
Expenses for premium refunds | (21) | (2,046) | (31) | (2,098) | ||||||||||||
Subtotal | (83) | (2,644) | (31) | (2,758) | ||||||||||||
| Ceded | ||||||||||||||||
Aggregate policy reserves | (1) | 19 | — | 18 | ||||||||||||
Other insurance reserves | 1 | (4) | — | (3) | ||||||||||||
Expenses for premium refunds | 2 | 5 | — | 7 | ||||||||||||
Subtotal | 2 | 20 | — | 22 | ||||||||||||
| Net | ||||||||||||||||
Aggregate policy reserves | (63) | (485) | — | (548) | ||||||||||||
Other insurance reserves | 1 | (98) | — | (97) | ||||||||||||
Expenses for premium refunds | (19) | (2,041) | (31) | (2,091) | ||||||||||||
Total | (81) | (2,624) | (31) | (2,736) | ||||||||||||
| 2006 | ||||||||||||||||
| Gross | ||||||||||||||||
Aggregate policy reserves | (59) | (583) | — | (642) | ||||||||||||
Other insurance reserves | 8 | (17) | — | (9) | ||||||||||||
Expenses for premium refunds | (28) | (2,101) | 8 | (2,121) | ||||||||||||
Subtotal | (79) | (2,701) | 8 | (2,772) | ||||||||||||
| Ceded | ||||||||||||||||
Aggregate policy reserves | 6 | 43 | — | 49 | ||||||||||||
Other insurance reserves | (1) | 5 | — | 4 | ||||||||||||
Expenses for premium refunds | 2 | 5 | — | 7 | ||||||||||||
Subtotal | 7 | 53 | — | 60 | ||||||||||||
| Net | ||||||||||||||||
Aggregate policy reserves | (53) | (540) | — | (593) | ||||||||||||
Other insurance reserves | 7 | (12) | — | (5) | ||||||||||||
Expenses for premium refunds | (26) | (2,096) | 8 | (2,114) | ||||||||||||
Total | (72) | (2,648) | 8 | (2,712) |
| Three months ended March 31, | 2007 € mn | 2006 € mn | ||||||
| Liabilities to banks and customers | (833) | (746) | ||||||
| Deposits retained on reinsurance ceded | (20) | (33) | ||||||
| Certificated liabilities | (380) | (413) | ||||||
| Participating certificates and subordinated liabilities | (178) | (177) | ||||||
| Other | (187) | (196) | ||||||
| Total | (1,598) | (1,565) |
| Three months ended March 31, | 2007 € mn | 2006 € mn | ||||||
| Additions to allowances including direct impairments | (106) | (120) | ||||||
| Amounts released | 51 | 100 | ||||||
| Recoveries on loans previously impaired | 57 | 52 | ||||||
| Total | 2 | 32 |
58
Table of Contents
Notes to the Consolidated Financial Statements
30 Impairments of investments (net)
| Three months ended March 31, | 2007 € mn | 2006 € mn | ||||||
| Impairments | ||||||||
| Available-for-sale investments | ||||||||
Equity securities | (81) | (47) | ||||||
Debt securities | — | (2) | ||||||
Subtotal | (81) | (49) | ||||||
| Investments in associates and joint ventures | — | (6) | ||||||
| Real estate held for investment | (2) | (1) | ||||||
| Subtotal | (83) | (56) | ||||||
| Reversals of impairments | ||||||||
| Available-for-sale investments | ||||||||
Debt securities | 13 | 1 | ||||||
| Real estate held for investment | 3 | — | ||||||
| Subtotal | 16 | 1 | ||||||
| Total | (67) | (55) |
| Three months ended March 31, | 2007 € mn | 2006 € mn | ||||||
| Investment management expenses | (103) | (83) | ||||||
| Depreciation from real estate held for investment | (54) | (58) | ||||||
| Other expenses from real estate held for investment | (72) | (53) | ||||||
| Foreign currency gains and losses (net) | ||||||||
Foreign currency gains | 127 | 142 | ||||||
Foreign currency losses | (159) | (131) | ||||||
Subtotal | (32) | 11 | ||||||
| Total | (261) | (183) |
59
Table of Contents
Allianz Group Interim Report First Quarter of 2007
32 Acquisition and administrative expenses (net)
| Three months ended March 31, | 2007 | 2006 | ||||||||||||||||||||||
Segment € mn | Consolidation € mn | Group € mn | Segment € mn | Consolidation € mn | Group € mn | |||||||||||||||||||
| Property-Casualty | ||||||||||||||||||||||||
| Acquisition costs | ||||||||||||||||||||||||
Incurred | (2,070) | — | (2,070) | (1,901) | — | (1,901) | ||||||||||||||||||
Commissions and profit received on reinsurance business ceded | 170 | — | 170 | 168 | — | 168 | ||||||||||||||||||
Deferrals of acquisition costs | 1,587 | — | 1,587 | 1,178 | — | 1,178 | ||||||||||||||||||
Amortization of deferred acquisition costs | (1,267) | — | (1,267) | (952) | — | (952) | ||||||||||||||||||
Subtotal | (1,580) | — | (1,580) | (1,507) | — | (1,507) | ||||||||||||||||||
| Administrative expenses | (1,095) | 16 | (1,079) | (1,156) | 51 | (1,105) | ||||||||||||||||||
| Subtotal | (2,675) | 16 | (2,659) | (2,663) | 51 | (2,612) | ||||||||||||||||||
| Life/Health | ||||||||||||||||||||||||
| Acquisition costs | ||||||||||||||||||||||||
Incurred | (907) | 1 | (906) | (980) | — | (980) | ||||||||||||||||||
Commissions and profit received on reinsurance business ceded | 48 | — | 48 | 26 | — | 26 | ||||||||||||||||||
Deferrals of acquisition costs | 627 | — | 627 | 830 | — | 830 | ||||||||||||||||||
Amortization of deferred acquisition costs | (182) | — | (182) | (529) | — | (529) | ||||||||||||||||||
Subtotal | (414) | 1 | (413) | (653) | — | (653) | ||||||||||||||||||
| Administrative expenses | (460) | (10) | (470) | (372) | 12 | (360) | ||||||||||||||||||
| Subtotal | (874) | (9) | (883) | (1,025) | 12 | (1,013) | ||||||||||||||||||
| Banking | ||||||||||||||||||||||||
| Personnel expenses | (907) | — | (907) | (910) | — | (910) | ||||||||||||||||||
| Non-personnel expenses | (503) | 9 | (494) | (518) | 10 | (508) | ||||||||||||||||||
| Subtotal | (1,410) | 9 | (1,401) | (1,428) | 10 | (1,418) | ||||||||||||||||||
| Asset Management | ||||||||||||||||||||||||
| Personnel expenses | (425) | — | (425) | (427) | — | (427) | ||||||||||||||||||
| Non-personnel expenses | (165) | 6 | (159) | (158) | — | (158) | ||||||||||||||||||
| Subtotal | (590) | 6 | (584) | (585) | — | (585) | ||||||||||||||||||
| Corporate | ||||||||||||||||||||||||
| Administrative expenses | (117) | 6 | (111) | (139) | (42) | (181) | ||||||||||||||||||
| Subtotal | (117) | 6 | (111) | (139) | (42) | (181) | ||||||||||||||||||
| Total | (5,666) | 28 | (5,638) | (5,840) | 31 | (5,809) | ||||||||||||||||||
60
Table of Contents
Notes to the Consolidated Financial Statements
33 Fee and commission expenses
| Three months ended March 31, | 2007 | 2006 | ||||||||||||||||||||||
Segment € mn | Consolidation € mn | Group € mn | Segment € mn | Consolidation € mn | Group € mn | |||||||||||||||||||
| Property-Casualty | ||||||||||||||||||||||||
| Fees from credit and assistance business | (118) | — | (118) | (124) | — | (124) | ||||||||||||||||||
| Service agreements | (79) | 4 | (75) | (44) | 4 | (40) | ||||||||||||||||||
| Investment advisory | — | — | — | (2) | — | (2) | ||||||||||||||||||
| Subtotal | (197) | 4 | (193) | (170) | 4 | (166) | ||||||||||||||||||
| Life/Health | ||||||||||||||||||||||||
| Service agreements | (21) | 8 | (13) | (25) | 6 | (19) | ||||||||||||||||||
| Investment advisory | (41) | 1 | (40) | (25) | — | (25) | ||||||||||||||||||
| Subtotal | (62) | 9 | (53) | (50) | 6 | (44) | ||||||||||||||||||
| Banking | ||||||||||||||||||||||||
| Securities business | (40) | — | (40) | (33) | — | (33) | ||||||||||||||||||
| Investment advisory | (46) | 2 | (44) | (50) | 2 | (48) | ||||||||||||||||||
| Payment transactions | (5) | — | (5) | (5) | — | (5) | ||||||||||||||||||
| Mergers and acquisitions advisory | (3) | — | (3) | (9) | — | (9) | ||||||||||||||||||
| Underwriting business | — | — | — | (1) | — | (1) | ||||||||||||||||||
| Other | (52) | 3 | (49) | (62) | 17 | (45) | ||||||||||||||||||
| Subtotal | (146) | 5 | (141) | (160) | 19 | (141) | ||||||||||||||||||
| Asset Management | ||||||||||||||||||||||||
| Commissions | (235) | 112 | (123) | (242) | 107 | (135) | ||||||||||||||||||
| Other | (92) | 1 | (91) | (72) | 1 | (71) | ||||||||||||||||||
| Subtotal | (327) | 113 | (214) | (314) | 108 | (206) | ||||||||||||||||||
| Corporate | ||||||||||||||||||||||||
| Service agreements | (35) | 2 | (33) | (23) | 2 | (21) | ||||||||||||||||||
| Subtotal | (35) | 2 | (33) | (23) | 2 | (21) | ||||||||||||||||||
| Total | (767) | 133 | (634) | (717) | 139 | (578) | ||||||||||||||||||
61
Table of Contents
Allianz Group Interim Report First Quarter of 2007
| Three months ended March 31, | 2007 € mn | 2006 € mn | ||||||
| Expenses from real estate held for use | ||||||||
Depreciation of real estate held for use | — | (1) | ||||||
| Other | 13 | — | ||||||
| Total | 13 | (1) |
35 Expenses from fully consolidated private equity investments
Three months ended | MAN Roland € mn | Four Seasons Health Care Ltd. € mn | Total € mn | |||||||||
| 2007 | ||||||||||||
| Cost of goods sold | (352) | — | (352) | |||||||||
| Commissions | (39) | — | (39) | |||||||||
| General and administrative expenses | (62) | — | (62) | |||||||||
| Interest expense | (7) | — | (7) | |||||||||
| Total | (460) | — | (460) | |||||||||
| 2006 | ||||||||||||
| Cost of goods sold | — | — | — | |||||||||
| Commissions | — | — | — | |||||||||
| General and administrative expenses | — | (128) | (128) | |||||||||
| Interest expense | — | (34) | (34) | |||||||||
| Total | — | (162) | (162) |
| Three months ended March 31, | 2007 € mn | 2006 € mn | ||||||
| Current income tax expense | (686) | (658) | ||||||
| Deferred income tax expense | (281) | (241) | ||||||
| Total | (967) | (899) |
Basic earnings per share is computed by dividing net income by the weighted average number of common shares outstanding for the period. Diluted earnings per share reflects the effect of dilutive securities. Dilutive securities include participation certificates issued by Allianz SE which can potentially be converted to Allianz shares, warrants issued by Allianz SE, share-based compensation plans, and derivatives on own shares.
| Three months ended March 31, | 2007 € mn | 2006 € mn | ||||||
| Numerator for basic earnings per share (net income) | 3,240 | 1,779 | ||||||
| Effect of dilutive securities | (7) | — | ||||||
| Numerator for diluted earnings per share (net income after assumed conversion) | 3,233 | 1,779 | ||||||
| Denominator for basic earnings per share (weighted-average shares) | 431,473,954 | 405,332,211 | ||||||
| Dilutive securities: | ||||||||
Participation certificates | 1,469,443 | 1,469,443 | ||||||
Warrants | 964,831 | 674,870 | ||||||
Share-based compensation plans | 1,088,515 | 86,941 | ||||||
Derivatives on own shares | 5,639,750 | 3,987,500 | ||||||
| Subtotal | 9,162,539 | 6,218,754 | ||||||
| Denominator for diluted earnings per share (weighted-average shares after assumed conversion) | 440,636,493 | 411,550,965 | ||||||
| Basic earnings per share | 7.51 | 4.39 | ||||||
| Diluted earnings per share | 7.34 | 4.32 |
For the three months ended March 31, 2007, the weighted average number of shares excludes 676,046 (2006: 707,789) treasury shares.
62
Table of Contents
Notes to the Consolidated Financial Statements
38 Supplemental information on the Banking segment
Net interest income from the Banking segment
| Three months ended March 31, | Segment € mn | Consolidation € mn | Group € mn | |||||||||
| 2007 | ||||||||||||
| Interest and similar income | 2,209 | (11) | 2,198 | |||||||||
| Interest expense | (1,281) | 31 | (1,250) | |||||||||
| Net interest income | 928 | 20 | 948 | |||||||||
| 2006 | ||||||||||||
| Interest and similar income | 1,880 | (23) | 1,857 | |||||||||
| Interest expense | (1,279) | 19 | (1,260) | |||||||||
| Net interest income | 601 | (4) | 597 |
Net fee and commission income from the Banking segment
| Three months ended March 31, | Segment € mn | Consolidation € mn | Group € mn | |||||||||
| 2007 | ||||||||||||
| Fee and commission income | 978 | (96) | 882 | |||||||||
| Fee and commission expense | (146) | 5 | (141) | |||||||||
| Net fee and commission income | 832 | (91) | 741 | |||||||||
| 2006 | ||||||||||||
| Fee and commission income | 992 | (113) | 879 | |||||||||
| Fee and commission expense | (160) | 19 | (141) | |||||||||
| Net fee and commission income | 832 | (94) | 738 |
The net fee and commission income of the Allianz Group’s Banking segment includes the following:
| Three months ended March 31, | 2007 € mn | 2006 € mn | ||||||
| Securities business | 425 | 432 | ||||||
Investment advisory | 108 | 102 | ||||||
| Payment transactions | 86 | 86 | ||||||
| Mergers and acquisitions advisory | 38 | 56 | ||||||
| Underwriting business | 23 | 34 | ||||||
| Other | 152 | 122 | ||||||
| Total | 832 | 832 |
39 Supplemental information on the consolidated statements of cash flows
| Three months ended March 31, | 2007 € mn | 2006 € mn | ||||||
| Income taxes (paid)/received | (533) | 78 | ||||||
| Dividends received | 238 | 235 | ||||||
| Interest received | 5,725 | 5,445 | ||||||
| Interest paid | (1,829) | (1,659) | ||||||
| Significant non-cash transactions: | ||||||||
Settlement of exchangeable bonds issued by Allianz Finance II B.V. for shares: | ||||||||
Available-for-sale investments | (812) | (552) | ||||||
Certificated liabilities | (812) | (552) | ||||||
Novation of quota share reinsurance agreement: | ||||||||
Reinsurance assets | (1,213) | (1,134) | ||||||
Deferred acquisition costs | 70 | 73 | ||||||
Payables from reinsurance contracts | (1,143) | (1,061) |
On February 21, 2007, the Allianz Group increased its investment in Russians People’s Insurance Society “Rosno”, Moscow from 47.4% to 97.2% at a purchase price of € 571 mn. The impact of the acquisition, net of cash acquired, on the consolidated statement of cash flows for the three months ended March 31, 2007 was:
As of March 31, | 2007 € mn | |||
| Intangible assets | (525) | |||
| Other assets | (798) | |||
| Other liabilities | 713 | |||
| Deferred tax liabilities | 15 | |||
| Minority interests | 10 | |||
| Less: previous investment in Rosno | 78 | |||
| Acquisition of subsidiary, net of cash acquired | (507) |
63
Table of Contents
Allianz Group Interim Report First Quarter of 2007
Number of employees
The Allianz Group had a total of 171,879 (2006: 166,505) employees as of March 31, 2007. 75,198 (2006: 76,731) of these were employed in Germany and 96,681 (2006: 89,774) in other countries. The number of employees undergoing training decreased by 50 to 3,905.
Allianz Group increases stake in Allianz Lebensversicherungs-AG to 92.58%
On February 28, 2007 Allianz AZL Vermögensverwaltung GmbH & Co. KG, a subsidiary of Allianz Deutschland AG (“ADAG“) announced a tender offer to the shareholders of Allianz Lebensversicherungs-AG (“Allianz Leben“). The deadline for acceptance of the offer elapsed on March 29, 2007. The Allianz Group increased its ownership interest from the 91.03% interest already indirectly held by ADAG and Allianz SE, by 1.55% to a total of 92.58% of the share
capital. Allianz Group’s interest therefore stays below the 95% level required for a squeeze-out of the remaining minority shareholders pursuant to the German Stock Corporation Act.
Minority buyout in Assurances Générales de France (“AGF“)
On April 27, 2007 the French stock market authority Autorité des Marchés Financiers(“AMF“) announced, that following the closing of the tender offer for the outstanding shares of AGF, the Allianz SE (directly and indirectly through its subsidiary AZ Holding France SAS) will hold 92.18% of AGF share capital and voting rights. Taking into account treasury shares held by AGF representing 3.21% of the share capital, minority shareholders will hold 4.61% and therefore less than 5% of the AGF share capital and voting rights following the tender offer. As stated already in the tender offer document, the Allianz Group intends to launch a squeeze-out procedure pursuant to the conditions set forth in the General Regulations of the AMF.
Munich, May 7, 2007
Allianz SE
The Board of Management

64
Table of Contents
Allianz SE
Koeniginstrasse 28
80802 Muenchen
Germany
Telephone +49 89 38 00 0
Telefax +49 89 34 99 41
www.allianz.com
Table of Contents
SIGNATURE
Pursuant to the requirements of the Securities Exchange Act of 1934, the registrant has duly caused this report to be signed on its behalf by the undersigned, thereunto duly authorized.
Date: May 9, 2007
ALLIANZ SE | ||
By | /s/ Harry Langley-Poole
| |
| Name: Harry Langley-Poole | ||
| Title: Head of Group Management Reporting | ||