Table of Contents
SECURITIES AND EXCHANGE COMMISSION
Washington, D.C. 20549
Form 6-K
Report of Foreign Private Issuer
Pursuant to Rules 13a-16 or 15d-16 of
the Securities Exchange Act of 1934
for the period ended June 30, 2007
Commission file Number: 1-15154
ALLIANZ SE
Königinstrasse 28
80802 Munich
Germany
(Address of principal executive offices)
Indicate by check mark whether the registrant files or will file annual reports under cover Form 20-F or Form 40-F.
Form 20-F x Form 40-F ¨
Indicate by check mark whether the registrant by furnishing the information contained in this Form is also thereby furnishing the information to the Commission pursuant to Rule 12g3-2(b) under the Securities Exchange Act of 1934.
Yes ¨ No x
THIS REPORT ON FORM 6-K (EXCEPT FOR ANY NON-GAAP FINANCIAL MEASURE AS SUCH TERM IS DEFINED IN REGULATION G UNDER THE SECURITIES EXCHANGE ACT OF 1934, AS AMENDED) SHALL BE DEEMED TO BE INCORPORATED BY REFERENCE IN THE REGISTRATION STATEMENTS ON FORM S-8 (FILE NO. 333-13462 AND NO. 333-139900) OF ALLIANZ SE AND TO BE A PART THEREOF FROM THE DATE ON WHICH THIS REPORT IS FURNISHED, TO THE EXTENT NOT SUPERSEDED BY DOCUMENTS OR REPORTS SUBSEQUENTLY FILED OR FURNISHED. FOR THE AVOIDANCE OF DOUBT, THE DISCLOSURE CONTAINING ANY NON-GAAP FINANCIAL MEASURE CONTAINED IN THE ATTACHED REPORT IS NOT INCORPORATED BY REFERENCE INTO THE ABOVE-MENTIONED REGISTRATION STATEMENTS FILED BY ALLIANZ SE.
Table of Contents

Table of Contents
| Consolidated Financial Statements for the Second Quarter and First Half of 2007 | 37 | |||||
| Notes to the Consolidated Financial Statements | 43 | |||||
Development of the Allianz share price versus Dow Jones EURO STOXX 50 and Dow Jones EURO STOXX Insurance indexed on the Allianz share price in€
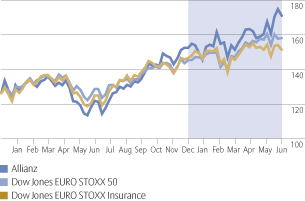
Source: Thomson Financial Datastream
Current information on the development of the Allianz share price is available on the internet atwww.allianz.com/stock.
Basic Allianz share information
| Share type | Registered share with restricted transfer | |||
| Denomination | No-par-value share | |||
| Stock exchanges | All German stock exchanges, London, Paris, Zurich, Milan, New York | |||
| Security Codes | WKN 840 400 ISIN DE 000 840 400 5 | |||
| Bloomberg | ALV GY | |||
| Reuters | ALVG.DE |
Investor Relations
We endeavor to keep our shareholders up-to-date on all company developments. Our Investor Relations Team is pleased to answer any questions you may have.
Allianz SE
Investor Relations
Koeniginstrasse 28
80802 Muenchen
Germany
| Investor Line: | + 49 1802 2554269 | |||
| + 49 1802 ALLIANZ | ||||
| Fax: | + 49 89 3800 3899 | |||
| E-mail: investor.relations@allianz.com | ||||
| Internet:www.allianz.com/investor-relations | ||||
Table of Contents
Allianz Group Key Data
Balance sheet
As of June 30, 2007 €mn | As of December 31, €mn | Change | ||||||||||
| Investments | 293,491 | 298,134 | (1.6)% | |||||||||
| Loans and advances to banks and customers | 452,961 | 408,278 | 10.9% | |||||||||
| Total assets | 1,111,145 | 1,053,226 | 5.5% | |||||||||
| Liabilities to banks and customers | 398,010 | 361,078 | 10.2% | |||||||||
| Reserves for loss and loss adjustment expenses | 64,824 | 65,464 | (1.0)% | |||||||||
| Reserves for insurance and investment contracts | 290,276 | 287,697 | 0.9% | |||||||||
| Shareholders’ equity | 48,459 | 50,481 | (4.0)% | |||||||||
| Minority interests | 3,288 | 6,409 | (48.7)% |
Allianz SE ratings as of July 31, 20071)
Standard & Poor’s | Moody’s | A.M. Best | ||||||||||
| Insurer financial strength | AA | Aa3 | A+ | |||||||||
| Outlook | Stable | Stable | Stable | |||||||||
| Counterparty credit | AA | Not rated | aa–2) | |||||||||
| Outlook | Stable | Stable | ||||||||||
| Senior unsecured debt | AA | Aa3 | aa– | |||||||||
| Outlook | Stable | Stable | ||||||||||
| Subordinated debt | A+/A3) | A2/A33) | a+/a3) | |||||||||
| Outlook | Stable | Stable | ||||||||||
Commercial paper (short term) | A-1+ | P-1 | Not rated | |||||||||
| Outlook | Stable | |||||||||||
1) | Includes ratings for securities issued by Allianz Finance B.V., Allianz Finance II B.V. and Allianz Finance Corporation. |
2) | Issuer credit rating. |
3) | Ratings vary on the basis of maturity period and terms. |
Other selected financial data
| Three months ended June 30, | Six months ended June 30, | |||||||||||||||||||||||||
| 2007 | 2006 | Change from previous year | 2007 | 2006 | Change from previous year | |||||||||||||||||||||
| Income statement | ||||||||||||||||||||||||||
| Total revenues1) | €mn | 24,337 | 24,067 | 1.1% | 53,660 | 53,708 | (0.1)% | |||||||||||||||||||
| Operating profit2) | €mn | 3,288 | 2,794 | 17.7% | 6,158 | 5,471 | 12.6% | |||||||||||||||||||
| Income before income taxes and minority interests in earnings | €mn | 3,198 | 2,992 | 6.9% | 7,754 | 6,023 | 28.7% | |||||||||||||||||||
| Net income | €mn | 2,140 | 2,279 | (6.1)% | 5,380 | 4,058 | 32.6% | |||||||||||||||||||
| Segments | ||||||||||||||||||||||||||
| Property-Casualty | ||||||||||||||||||||||||||
| Operating profit2) | €mn | 1,894 | 1,845 | 2.7% | 3,161 | 3,231 | (2.2)% | |||||||||||||||||||
| Loss ratio | % | 64.9 | 65.1 | (0.2)%–p | 66.5 | 65.6 | 0.9%–p | |||||||||||||||||||
| Expense ratio | % | 28.0 | 26.8 | 1.2%–p | 28.3 | 27.7 | 0.6%–p | |||||||||||||||||||
| Combined ratio | % | 92.9 | 91.9 | 1.0%–p | 94.8 | 93.3 | 1.5%–p | |||||||||||||||||||
| Life/Health | ||||||||||||||||||||||||||
| Operating profit2) | €mn | 758 | 527 | 43.8% | 1,508 | 1,250 | 20.6% | |||||||||||||||||||
| Statutory expense ratio | % | 9.6 | 9.5 | 0.1%–p | 8.4 | 8.8 | (0.4)%–p | |||||||||||||||||||
| Banking | ||||||||||||||||||||||||||
| Operating profit2) | €mn | 448 | 266 | 68.4% | 1,148 | 813 | 41.2% | |||||||||||||||||||
| Cost-income ratio | % | 72.3 | 84.0 | (11.7)%–p | 69.4 | 78.5 | (9.1)%–p | |||||||||||||||||||
| Loan loss provisions | €mn | (65) | (7) | 828.6% | (60) | 26 | — | |||||||||||||||||||
| Coverage ratio as of June 30,3) | % | 56.5% | 58.5% | (2.0)%–p | 56.5% | 58.5 | (2.0)%–p | |||||||||||||||||||
| Asset Management | ||||||||||||||||||||||||||
| Operating profit2) | €mn | 325 | 297 | 9.4% | 637 | 601 | 6.0% | |||||||||||||||||||
| Cost-income ratio | % | 59.2 | 59.1 | 0.1%–p | 59.6 | 59.3 | 0.3%–p | |||||||||||||||||||
| Third-party assets under management as of June 30, | €bn | 789 | 7644) | 3.3% | 789 | 7644) | 3.3% | |||||||||||||||||||
| Share information | ||||||||||||||||||||||||||
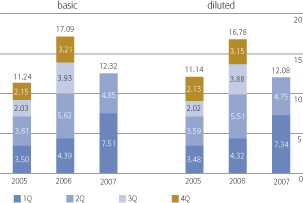
| Basic earnings per share | € | 4.85 | 5.62 | (13.7)% | 12.32 | 10.02 | 23.0% | |||||||||||||||||||
| Diluted earnings per share | € | 4.75 | 5.51 | (13.8)% | 12.08 | 9.83 | 22.9% | |||||||||||||||||||
| Share price as of June 30, | € | 173.59 | 154.764) | 12.2% | 173.59 | 154.764) | 12.2% | |||||||||||||||||||
| Market capitalization as of June 30, | €bn | 77.9 | 66.94) | 16.4% | 77.9 | 66.94) | 16.4% | |||||||||||||||||||
1) | Total revenues comprise Property-Casualty segment’s gross premiums written, Life/Health segment’s statutory premiums, Banking segment’s operating revenues and Asset Management segment’s operating revenues. |
2) | The Allianz Group uses operating profit to evaluate the performance of its business segments and the Group as a whole. |
3) | Represents total loan loss allowances as a percentage of total non-performing loans and potential problem loans. |
4) | As of December 31, 2006. |
1
Table of Contents
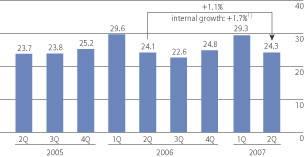
Total revenues
in€bn
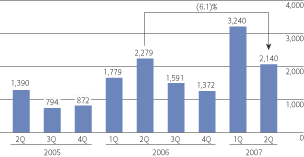
Net income
in€mn
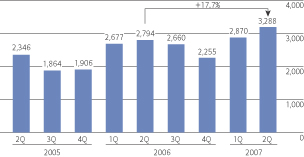
Operating profit
in€mn
Shareholders’ equity2)
in€mn

1) | Internal total revenue growth excludes the effects of foreign currency translation as well as acquisitions and disposals. Please see page 35 for a reconciliation of nominal total revenue growth to internal total revenue growth for each of our segments and the Allianz Group as a whole. |
2) | Does not include minority interests. |
2
Table of Contents
Group Management Report
Allianz Group’s Consolidated Results of Operations
Total revenues
Total revenues – Segments
in€mn
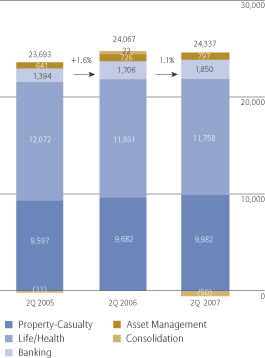
Total revenues were up 1.1% and amounted to €24.3 billion in 2Q 2007 compared to a year ago. Based on internal growth our revenues increased by 1.7%. All segments recorded positive internal growth rates on a 2007 to 2006 second quarter comparison, while the increases in our Asset Management and Banking segments were particularly strong.
Property-Casualty Managed growth and stable prices led to gross premiums written of €10.0 billion in 2Q 2007 and €24.1 billion for the first six months of 2007. The acquisition of ROSNO and Progress Garant contributed to the increase in premiums. Positive growth rates were recorded on both a total and internal growth basis.
Life/Health At €11.8 billion in 2Q 2007, our statutory premiums were down 1.5% compared to a year ago, whereas internal growth turned positive with 0.3%. With the exception of Germany and the United States, we achieved strong growth in all our life markets. However, the slowdown in the United States bottomed out in the first quarter. For the first six months of 2007, statutory premiums reached €24.1 billion, down 2.7% year-on-year.
Banking Our Banking segment's operating revenues grew substantially to €1.9 billion in 2Q 2007 and €4.0 billion in 1H 2007, up 8.4% and 8.1% from the respective prior year periods, respectively . On an internal basis growth came to 9.3% for the second quarter.
Asset Management We achieved net inflows to third-party assets of €20 billion in the first half of 2007. Together with positive market effects of €21 billion, third-party assets grew by 5.3% since year-end 2006, excluding foreign exchange and consolidation effects. Commensurate with the higher asset base, operating revenues grew by 9.8% on a 2007 to 2006 second quarter comparison and 6.8% on a first half comparison.
3
Table of Contents
Allianz Group Interim Report Second Quarter and First Half of 2007
Operating profit
Operating profit – Segments
in€mn
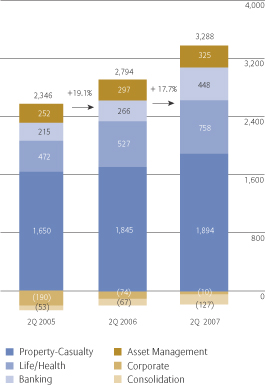
At €3.3 billion, operating profit in 2Q 2007 was 17.7% higher than in the comparison period, continuing a long-term history of substantial year-over-year improvement of quarterly operating profit. All business segments delivered higher operating profits than a year ago. For the first six months of 2007, operating profit amounted to €6.2 billion, 12.6% higher than in the same period last year.
Property-Casualty Operating profit grew by 2.7% to €1.9 billion in 2Q 2007 from an already high level a year ago. Despite the burden from winterstorm “Kyrill” in 1Q 2007, operating profit in the 2007 to 2006 first half comparison declined only €70 million to €3.2 billion.
Life/Health In 2Q 2007, operating profit grew dynamically by 43.8% to €758 million with most operations contributing to this growth. In the first half of 2007, operating profit was €1.5 billion, 20.6% above the same period last year. Solid improvements in our expense and investment margins drove these developments.
Banking We recorded strong operating profit growth of 68.4% and 41.2% compared to 2Q and the first half of 2006, respectively, resulting from higher revenues and lower expenses.
Asset Management Up 9.4% to €325 million in 2Q 2007 and 6.0% to €637 million in the first half of 2007, operating profit continued to benefit from our growing asset base and tight expense management. At 59.2% and 59.6%, our cost-income ratio remained at a very competitive level.
Non-operating items
The net result of non-operating items in 2Q 2007 was minus €90 million. Although not material in total, there were significant line item movements. As expected, harvesting returned to a normal level, while in the same period last year, we had the Schering sale, with a significant realized gain. Hence, the total impact from net realized gains and impairments of investments declined by €895 million to €401 million. Interest expense on AGF bridge financing amounted to approximately €74 million in 2Q 2007, resulting in substantially higher interest expense from external debt. Restructuring charges in 2Q 2006 stemmed primarily from the announcement at that time of our restructuring plan for the Allianz Group's insurance operations in Germany.
Contrary to the developments previously described in the comparison of the second quarters of 2007 versus 2006, in the six months comparison, the overall impact from net realized gains and impairments of investments increased by €372 million to €2.4 billion. This is attributable to the locking-in of unrealized gains in 1Q 2007, after the strong performance of our equity investments and thus we have already generated a significant part of our capital gains target for 2007. The cash from these sales was, in part, used for the acquisition of the outstanding shares in AGF that Allianz SE did not already own at that time.
4
Table of Contents
Group Management Report
Net income
Net income, at €2.1 billion in 2Q 2007, was down by 6.1%, primarily as a result of higher income tax expenses, with pre-tax income exceeding €3 billion. With significantly reduced tax-exempt income, the effective tax rate of 26.8% and income tax expenses of €858 million in 2Q 2007 were considerably higher than a year ago. Primarily due to the RAS minority buy-outs completed last year and the AGF minority buy-outs this year, the minority interests declined from €356 million to €200 million.
On a six months basis, net income grew by €1.3 billion to €5.4 billion, reflecting both our strong operating profit and the substantially increased non-operating result. Our six months effective tax rate rose from 20.9% in 2006 to 23.5% in 2007.
Earnings per share1)
in€
1) | See Note 37 to our consolidated financial statements for further details. |
5
Table of Contents
Allianz Group Interim Report Second Quarter and First Half of 2007
The following table summarizes the total revenues, operating profit and net income for each of our segments for the three and six months ended June 30, 2007 and 2006, as well as IFRS consolidated net income of the Allianz Group.
Property- Casualty | Life/Health | Banking | Asset Management | Corporate | Consolidation | Group | ||||||||||||||||||||||||||||||||||||||||||||||||||
2007 €mn | 2006 €mn | 2007 €mn | 2006 €mn | 2007 €mn | 2006 €mn | 2007 €mn | 2006 €mn | 2007 €mn | 2006 €mn | 2007 €mn | 2006 €mn | 2007 €mn | 2006 €mn | |||||||||||||||||||||||||||||||||||||||||||
| Three months ended June 30, | ||||||||||||||||||||||||||||||||||||||||||||||||||||||||
| Total revenues1) | 9,982 | 9,682 | 11,758 | 11,931 | 1,850 | 1,706 | 797 | 726 | — | — | (50) | 22 | 24,337 | 24,067 | ||||||||||||||||||||||||||||||||||||||||||
| Operating profit (loss) | 1,894 | 1,845 | 758 | 527 | 448 | 266 | 325 | 297 | (10) | (74) | (127) | (67) | 3,288 | 2,794 | ||||||||||||||||||||||||||||||||||||||||||
| Non-operating items | 180 | 440 | 15 | (17) | 39 | 12 | (82) | (134) | (74) | 184 | (168) | (287) | (90) | 198 | ||||||||||||||||||||||||||||||||||||||||||
| Income (loss) before income taxes and minority interests in earnings | 2,074 | 2,285 | 773 | 510 | 487 | 278 | 243 | 163 | (84) | 110 | (295) | (354) | 3,198 | 2,992 | ||||||||||||||||||||||||||||||||||||||||||
| Income taxes | (578) | (466) | (234) | (90) | (56) | (89) | (101) | (62) | 80 | 80 | 31 | 270 | (858) | (357) | ||||||||||||||||||||||||||||||||||||||||||
| Minority interests in earnings | (116) | (237) | (60) | (92) | (20) | (27) | (8) | (11) | (4) | (7) | 8 | 18 | (200) | (356) | ||||||||||||||||||||||||||||||||||||||||||
| Net income (loss) | 1,380 | 1,582 | 479 | 328 | 411 | 162 | 134 | 90 | (8) | 183 | (256) | (66) | 2,140 | 2,279 | ||||||||||||||||||||||||||||||||||||||||||
| Six months ended June 30, | ||||||||||||||||||||||||||||||||||||||||||||||||||||||||
| Total revenues1) | 24,093 | 23,831 | 24,084 | 24,753 | 3,951 | 3,654 | 1,577 | 1,477 | — | — | (45) | (7) | 53,660 | 53,708 | ||||||||||||||||||||||||||||||||||||||||||
| Operating profit (loss) | 3,161 | 3,231 | 1,508 | 1,250 | 1,148 | 813 | 637 | 601 | (111) | (254) | (185) | (170) | 6,158 | 5,471 | ||||||||||||||||||||||||||||||||||||||||||
| Non-operating items | 844 | 868 | 118 | 141 | 156 | 404 | (204) | (270) | 437 | (27) | 245 | (564) | 1,596 | 552 | ||||||||||||||||||||||||||||||||||||||||||
| Income (loss) before income taxes and minority interests in earnings | 4,005 | 4,099 | 1,626 | 1,391 | 1,304 | 1,217 | 433 | 331 | 326 | (281) | 60 | (734) | 7,754 | 6,023 | ||||||||||||||||||||||||||||||||||||||||||
| Income taxes | (1,115) | (990) | (435) | (309) | (224) | (334) | (181) | (127) | 55 | 234 | 75 | 270 | (1,825) | (1,256) | ||||||||||||||||||||||||||||||||||||||||||
| Minority interests in earnings | (330) | (427) | (159) | (220) | (44) | (55) | (19) | (24) | (8) | (9) | 11 | 26 | (549) | (709) | ||||||||||||||||||||||||||||||||||||||||||
| Net income (loss) | 2,560 | 2,682 | 1,032 | 862 | 1,036 | 828 | 233 | 180 | 373 | (56) | 146 | (438) | 5,380 | 4,058 | ||||||||||||||||||||||||||||||||||||||||||
1) | Total revenues comprise Property-Casualty segment’s gross premiums written, Life/Health segment’s statutory premiums, Banking segment’s operating revenues and Asset Management segment’s operating revenues. |
6
Table of Contents
Group Management Report
Risk Management
Risk management is an integral part of our business processes and supports our value-based management. As our internal risk capital model provides management with information which allows for active asset-liability management and monitoring, risk is well controlled and there are no identified risks which could in the future pose a threat to the existence of the Allianz Group.
Out of our € 1,031 billion investments and receivables €35 billion are invested in asset-backed securities. Thereof €16.3 billion are kept in the trading book of our banking segment. Only €1.7 billion or 0.16% of our investments and receivables are related to risks out of the US subprime-market. Out of these €1.7 billion, € 1.6 billion are held in the trading book of our banking segment which is carried at fair-value. The exposure is split into the following ratings: 54.8% AAA, 31.0% AA, 12.7% A and 1.0% BBB. Only 0.5% are out of BB ratings.
The information contained in the risk report in our 2006 Annual Report is still valid.
Events After the Balance Sheet Date
See Note 41 to the consolidated financial statements.
Opportunities
As presented in our 2006 Annual Report, we remain confident that the business prospects for financial service providers remain positive against the background of continuous dynamic global economic development.
Outlook
Our outlook remains unchanged; we are on track to achieve our targets.
In the years 2007 to 2009, we expect average annual consolidated operating profit growth of 10% from the 2006 level, adjusted for the particularly favorable natural catastrophe trend in 2006. Within the same time period, we are striving to maintain a strong combined ratio of less than 94% on average in our Property-Casualty segment. In Life/Health we aim to achieve an average new business margin1) greater than 3%. We also target an average return on risk-adjusted capital in our Banking segment of above 15%. For our Asset Management segment, we are targeting average annual growth of third-party assets under management of 10%, excluding foreign currency conversion effects.
We expect net income of around €8 billion for the full year 2007.
As always, natural catastrophes and adverse developments in the capital markets, as well as the factors stated below in our cautionary note regarding forward-looking statements, may severely impact our results of operations.
Cautionary Note Regarding Forward-Looking Statements
The statements contained herein may include statements of future expectations and other forward-looking statements that are based on management’s current views and assumptions and involve known and unknown risks and uncertainties that could cause actual results, performance or events to differ materially from those expressed or implied in such statements. In addition to statements which are forward-looking by reason of context, the words “may”, “will”, “should”, “expects”, “plans”, “intends”, “anticipates”, “believes”, “estimates”, “predicts”, “potential”, or “continue” and similar expressions identify forward-looking statements.
Actual results, performance or events may differ materially from those in such statements due to, without limitation, (i) general economic conditions, including in particular economic conditions in the Allianz Group’s core business and core markets, (ii) performance of financial markets, including emerging markets, (iii) the frequency and severity of insured loss events, (iv) mortality
and morbidity levels and trends, (v) persistency levels, (vi) the extent of credit defaults, (vii) interest rate levels, (viii) currency exchange rates including the Euro/U.S. Dollar exchange rate, (ix) changing levels of competition, (x) changes in laws and regulations, including monetary convergence and the European Monetary Union, (xi) changes in the policies of central banks and/or foreign governments, (xii) the impact of acquisitions, including related integration issues, (xiii) reorganization measures, and (xiv) general competitive factors, in each case on a local, regional, national and/or global basis. Many of these factors may be more likely to occur, or more pronounced, as a result of terrorist activities and their consequences.
The matters discussed herein may also be affected by risks and uncertainties described from time to time in Allianz SE’s filings with the U.S. Securities and Exchange Commission. The company assumes no obligation to update any forward-looking statement.
1) | New business margin according to the definition of European Embedded Value. |
7
Table of Contents
Earnings Summary
Gross premiums written
Gross premiums written by region1)
in %
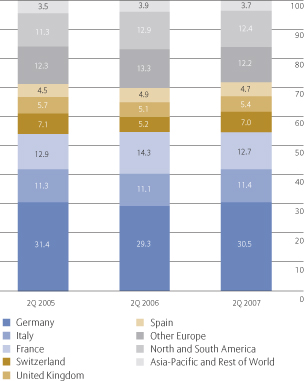
1) | After elimination of transactions between Allianz Group companies in different geographic regions and different segments. Gross premiums written from our specialty lines have been allocated to the respective geographic regions. |
Gross premiums written – Growth rates1)
in %
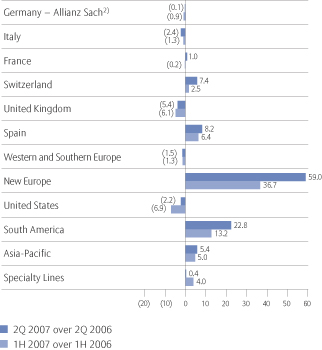
1) | Before elimination of transactions between Allianz Group companies in different geographic regions and different segments. |
2) | Together with our property-casualty assumed reinsurance business, primarily attributable to Allianz SE, the decline within Germany was (6.7)% for 2Q 2007 over 2Q 2006 and (5.4)% for 1H 2007 over 1H 2006. |
8
Table of Contents
Group Management Report
2007 to 2006 second quarter comparison
At €9,982 million in 2Q 2007, gross premiums written were up 3.1% from a year ago. Based on internal growth, the increase amounted to 1.8%. We continued targeting risk adequate prices. Overall, we recorded a price effect on gross premiums written of minus 0.5% and a volume effect of plus 2.3%.
Operations with decreased or flat gross premiums written included Allianz Sach in Germany, our Italian entities and Allianz Global Corporate & Specialty.
At Allianz Sach and in Italy, tariff increases in certain lines of business were offset by unfavorable developments in other business lines, leading to stable gross premiums written at Allianz Sach of €1,696 million and slightly lower revenues in Italy of €1,340 million.
Allianz Global Corporate & Specialty recorded an aggregate decline of gross premiums written of 9.3% as we remained diligent in our risk selection. Furthermore, price decreases in the aviation business, in the property business in the United Kingdom, and in the German marine business impacted revenue growth.
At the same time, our growth markets, our credit insurance business and Spain recorded solid increases. In aggregate, “New Europe” – our growth markets within Central and Eastern Europe – together with Asia-Pacific and South America accounted for 13.3% of our Property-Casualty segment's gross premiums written in 2Q 2007, compared to 10.4% a year earlier.
Premium volume in New Europe benefited from organic growth and the first time consolidation of ROSNO and Progress Garant in Russia.
Premium growth at our credit insurer Euler Hermes was driven by increased business volume and higher retention rates. Total revenues went up €48 million to €446 million.
In Spain, gross premiums written increased by €38 million to €502 million. Here, we saw growth across all business lines.
2007 to 2006 first half comparison
In the 2007 to 2006 first half comparison, our gross premiums written increased by 1.1% to €24,093 million. In most of our markets, the developments were consistent with the 2007 to 2006 second quarter comparison. Only our operations at Fireman's Fund in the United States recorded a decline, mainly as a result of the unfavorable exchange rate development of the U.S. Dollar against the Euro. Adjusted for this effect internal growth was 0.6%.
Operating profit
Operating profit
in€mn
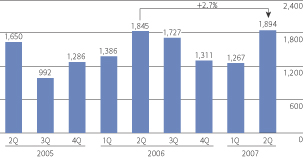
2007 to 2006 second quarter comparison
Operating profit remained strong at €1,894 million in 2Q 2007, up 2.7% from an already high profit level a year ago. This was primarily the result of increased investment income, reflecting higher dividend payments, higher yields on debt investments and positive net inflows to our asset base.
The top contributors to operating profit were Germany at €467 million, Italy at €264 million, the United States at €189 million, France at €163 million and our credit insurance business of Euler Hermes at €161 million.
We continued to benefit from our strong underwriting profitability and our initiatives to improve claims management. The accident year loss ratio was down 20 basis points to 69.4%. At 4.5%, the positive net development in prior years’ loss reserves was unchanged. The impact from natural catastrophes remained at a similar magnitude of 1.1% in 2Q 2007, compared to 1.2% a year ago, while we recorded a lower overall claims frequency1)
1) | Excluding claims related to winterstorm “Kyrill” that were reported in 2Q 2007 only. |
9
Table of Contents
Allianz Group Interim Report Second Quarter and First Half of 2007
and an almost stable net claims severity. Commensurate with the stable positive net development in prior years' loss reserves, our calendar year loss ratio also decreased by 20 basis points to 64.9%.
With our expense ratio up 1.2 percentage points to 28.0%, our combined ratio increased from 91.9% to 92.9%.
2007 to 2006 first half comparison
On a six months basis, operating profit amounted to €3,161 million, only down 2.2%, despite significantly higher net losses from natural catastrophes of €458 million, mainly related to winterstorm “Kyrill” in Europe in 1Q 2007. While strong, our combined ratio for the first six months of 2007 rose to 94.8%, after 93.3% in the same period last year, reflecting the increased impact from natural catastrophes. Consistent with the 2007 to 2006 second quarter comparison, current investment income grew mainly due to a strong dividend season.
Non-operating items
2007 to 2006 second quarter comparison
The net gain from non-operating items decreased substantially by €260 million to €180 million. This development resulted mainly from lower realized gains from investments which amounted to €216 million, down €662 million from a year earlier largely as a result of the sale of our participation in Schering AG at that time. Conversely, no major single sales transaction was recorded in 2Q 2007. Similarly, restructuring charges were negligible in 2Q 2007, while in the prior year period expenses of €354 million were incurred, primarily in connection with the reorganization of our German insurance activities.
2007 to 2006 first half comparison
In contrast to the 2007 to 2006 second quarter comparison, on a six months basis, the net gain from non-operating items was down only slightly. In addition to the developments previously described, this resulted predominantly from higher net realized gains from investments in 1Q 2007 versus 1Q 2006.
Net income
2007 to 2006 second quarter comparison
Net income was down by €202 million to €1,380 million, predominantly reflecting the lower aggregate gain from non-operating items.
Income tax expenses, at €578 million in 2Q 2007, rose by €112 million. Mainly as a result of significantly higher tax-exempted realized gains in 2Q 2006 as compared to 2Q 2007, our effective tax rate increased from 20.4% to 27.9%
Minority interests in earnings declined from €237 million to €116 million mainly due to the minority buy-outs at RAS and AGF.
2007 to 2006 first half comparison
At €2,560 million for the first half of 2007, net income decreased by 4.5%. Both lower operating profit and lower non-operating income contributed to this development. Furthermore, income tax expenses increased by €125 million for the reasons already mentioned driving the effective tax rate up to 27.8% from 24.2%.
10
Table of Contents
Group Management Report
The following table sets forth our Property-Casualty insurance segment’s income statement, loss ratio, expense ratio and combined ratio for the three and six months ended June 30, 2007 and 2006.
| Three months ended June 30, | Six months ended June 30, | |||||||||||||||
2007 €mn | 2006 €mn | 2007 €mn | 2006 €mn | |||||||||||||
| Gross premiums written1) | 9,982 | 9,682 | 24,093 | 23,831 | ||||||||||||
| Ceded premiums written | (1,245) | (1,230) | (2,831) | (2,942) | ||||||||||||
| Change in unearned premiums | 919 | 906 | (2,248) | (2,190) | ||||||||||||
| Premiums earned (net) | 9,656 | 9,358 | 19,014 | 18,699 | ||||||||||||
| Interest and similar income | 1,380 | 1,257 | 2,386 | 2,179 | ||||||||||||
| Income from financial assets and liabilities designated at fair value through income (net)2) | 39 | 6 | 71 | 42 | ||||||||||||
| Income from financial assets and liabilities held for trading (net), shared with policyholder2) | (40) | — | (55) | — | ||||||||||||
| Realized gains/losses (net) from investments, shared with policyholders3) | 1 | 11 | 35 | 36 | ||||||||||||
| Fee and commission income | 280 | 265 | 552 | 517 | ||||||||||||
| Other income | 11 | 24 | 95 | 38 | ||||||||||||
| Operating revenues | 11,327 | 10,921 | 22,098 | 21,511 | ||||||||||||
| Claims and insurance benefits incurred (net) | (6,266) | (6,090) | (12,649) | (12,272) | ||||||||||||
| Changes in reserves for insurance and investment contracts (net) | (97) | (121) | (178) | (193) | ||||||||||||
| Interest expense | (92) | (66) | (184) | (129) | ||||||||||||
| Loan loss provisions | (9) | (2) | (9) | (3) | ||||||||||||
| Impairments of investments (net), shared with policyholders4) | (5) | (13) | (7) | (17) | ||||||||||||
| Investment expenses | (69) | (67) | (143) | (115) | ||||||||||||
| Acquisition and administrative expenses (net) | (2,705) | (2,511) | (5,380) | (5,174) | ||||||||||||
| Fee and commission expenses | (190) | (205) | (387) | (375) | ||||||||||||
| Other expenses | — | (1) | — | (2) | ||||||||||||
| Operating expenses | (9,433) | (9,076) | (18,937) | (18,280) | ||||||||||||
| Operating profit | 1,894 | 1,845 | 3,161 | 3,231 | ||||||||||||
| Income from financial assets and liabilities held for trading (net), not shared with policyholders2) | (1) | (1) | (30) | 3 | ||||||||||||
| Realized gains/losses (net) from investments, not shared with policyholders3) | 216 | 878 | 949 | 1,317 | ||||||||||||
| Impairments of investments (net), not shared with policyholders4) | (23) | (80) | (47) | (89) | ||||||||||||
| Amortization of intangible assets | (4) | (3) | (6) | (7) | ||||||||||||
| Restructuring charges | (8) | (354) | (22) | (356) | ||||||||||||
| Non-operating items | 180 | 440 | 844 | 868 | ||||||||||||
| Income before income taxes and minority interests in earnings | 2,074 | 2,285 | 4,005 | 4,099 | ||||||||||||
| Income taxes | (578) | (466) | (1,115) | (990) | ||||||||||||
| Minority interests in earnings | (116) | (237) | (330) | (427) | ||||||||||||
| Net income | 1,380 | 1,582 | 2,560 | 2,682 | ||||||||||||
| Loss ratio5)in % | 64.9 | 65.1 | 66.5 | 65.6 | ||||||||||||
| Expense ratio6)in % | 28.0 | 26.8 | 28.3 | 27.7 | ||||||||||||
| Combined ratio7)in % | 92.9 | 91.9 | 94.8 | 93.3 | ||||||||||||
1) | For the Property-Casualty segment, total revenues are measured based upon gross premiums written. |
2) | The total of these items equals income from financial assets and liabilities carried at fair value through income (net) in the segment income statement included in Note 3 to the consolidated financial statements. |
3) | The total of these items equals realized gains/losses (net) in the segment income statement included in Note 3 to the consolidated financial statements. |
4) | The total of these items equals impairments of investments (net) in the segment income statement included in Note 3 to the consolidated financial statements. |
5) | Represents claims and insurance benefits incurred (net) divided by premiums earned (net). |
6) | Represents acquisition and administrative expenses (net) divided by premiums earned (net). |
7) | Represents the total of acquisition and administrative expenses (net) and claims and insurance benefits incurred (net) divided by premiums earned (net). |
11
Table of Contents
Allianz Group Interim Report Second Quarter and First Half of 2007
Property-Casualty Operations by Geographic Region
The following table sets forth our Property-Casualty gross premiums written, premiums earned (net), combined ratio, loss ratio, expense ratio and operating profit by geographic region for the three and six months ended June 30, 2007 and 2006. Consistent with our general practice, these figures are presented before consolidation adjustments, representing the elimination of transactions between Allianz Group companies in different geographic regions and different segments.
| Gross premiums written | Premiums earned (net) | Combined ratio | Loss ratio | Expense ratio | Operating profit | |||||||||||||||||||||||||||||||||||||||||||
| Three months ended June 30, | 2007 €mn | 2006 €mn | 2007 €mn | 2006 €mn | 2007 % | 2006 % | 2007 % | 2006 % | 2007 % | 2006 % | 2007 €mn | 2006 €mn | ||||||||||||||||||||||||||||||||||||
| Germany | 1,959 | 2,099 | 2,325 | 2,442 | 92.6 | 92.6 | 64.9 | 68.1 | 27.7 | 24.5 | 467 | 448 | ||||||||||||||||||||||||||||||||||||
| France | 1,143 | 1,132 | 1,103 | 1,092 | 96.8 | 98.6 | 69.3 | 71.1 | 27.5 | 27.5 | 163 | 139 | ||||||||||||||||||||||||||||||||||||
| Italy | 1,340 | 1,373 | 1,234 | 1,242 | 93.8 | 93.5 | 69.8 | 70.3 | 24.0 | 23.2 | 264 | 250 | ||||||||||||||||||||||||||||||||||||
| United Kingdom | 613 | 648 | 498 | 462 | 98.5 | 94.6 | 65.3 | 65.6 | 33.2 | 29.0 | 64 | 71 | ||||||||||||||||||||||||||||||||||||
| Switzerland | 305 | 284 | 402 | 432 | 92.3 | 94.9 | 66.3 | 72.8 | 26.0 | 22.1 | 71 | 54 | ||||||||||||||||||||||||||||||||||||
| Spain | 502 | 464 | 452 | 417 | 90.9 | 90.0 | 71.3 | 70.6 | 19.6 | 19.4 | 65 | 64 | ||||||||||||||||||||||||||||||||||||
Netherlands | 228 | 227 | 204 | 206 | 89.6 | 87.3 | 59.0 | 55.1 | 30.6 | 32.2 | 32 | 47 | ||||||||||||||||||||||||||||||||||||
Austria | 201 | 200 | 183 | 188 | 92.9 | 96.9 | 69.6 | 70.1 | 23.3 | 26.8 | 31 | 36 | ||||||||||||||||||||||||||||||||||||
Ireland | 165 | 176 | 154 | 153 | 94.7 | 65.9 | 70.0 | 42.5 | 24.7 | 23.4 | 29 | 68 | ||||||||||||||||||||||||||||||||||||
Belgium | 83 | 85 | 75 | 75 | 97.9 | 98.7 | 63.1 | 63.3 | 34.8 | 35.4 | 15 | 14 | ||||||||||||||||||||||||||||||||||||
Portugal | 67 | 68 | 62 | 64 | 89.9 | 86.5 | 62.7 | 60.9 | 27.2 | 25.6 | 11 | 13 | ||||||||||||||||||||||||||||||||||||
Greece | 19 | 19 | 12 | 12 | 97.1 | 78.0 | 65.4 | 49.1 | 31.7 | 28.9 | 1 | 3 | ||||||||||||||||||||||||||||||||||||
Western and Southern Europe | 763 | 775 | 690 | 698 | 92.7 | 86.0 | 65.2 | 57.6 | 27.5 | 28.4 | 1241) | 1861) | ||||||||||||||||||||||||||||||||||||
Hungary | 127 | 124 | 125 | 123 | 95.8 | 83.2 | 68.2 | 55.9 | 27.6 | 27.3 | 17 | 36 | ||||||||||||||||||||||||||||||||||||
Slovakia | 70 | 59 | 68 | 60 | 61.6 | 64.3 | 35.2 | 36.9 | 26.4 | 27.4 | 32 | 27 | ||||||||||||||||||||||||||||||||||||
Czech Republic | 54 | 57 | 46 | 44 | 75.5 | 82.1 | 52.4 | 63.0 | 23.1 | 19.1 | 13 | 9 | ||||||||||||||||||||||||||||||||||||
Poland | 95 | 71 | 61 | 49 | 93.0 | 83.8 | 57.6 | 49.8 | 35.4 | 34.0 | 7 | 9 | ||||||||||||||||||||||||||||||||||||
Romania | 83 | 67 | 39 | 24 | 86.5 | 103.8 | 72.1 | 97.9 | 14.4 | 5.9 | 5 | 1 | ||||||||||||||||||||||||||||||||||||
Bulgaria | 24 | 23 | 15 | 15 | 93.1 | 88.9 | 47.1 | 50.7 | 46.0 | 38.2 | 2 | 2 | ||||||||||||||||||||||||||||||||||||
Croatia | 21 | 18 | 14 | 13 | 105.9 | 95.0 | 69.9 | 62.5 | 36.0 | 32.5 | — | 1 | ||||||||||||||||||||||||||||||||||||
Russia2) | 200 | 5 | 155 | — | 103.6 | 90.4 | 65.0 | 37.8 | 38.6 | 52.6 | 3 | — | ||||||||||||||||||||||||||||||||||||
New Europe3) | 674 | 424 | 523 | 330 | 92.0 | 82.2 | 60.1 | 55.6 | 31.9 | 26.6 | 74 | 82 | ||||||||||||||||||||||||||||||||||||
| Other Europe | 1,437 | 1,199 | 1,213 | 1,028 | 91.4 | 84.8 | 62.6 | 57.0 | 28.8 | 27.8 | 198 | 268 | ||||||||||||||||||||||||||||||||||||
| United States | 1,030 | 1,053 | 804 | 838 | 87.8 | 83.7 | 56.0 | 49.8 | 31.8 | 33.9 | 189 | 227 | ||||||||||||||||||||||||||||||||||||
| Mexico4) | 53 | 41 | 22 | 24 | 94.0 | 93.5 | 69.1 | 69.5 | 24.9 | 24.0 | 2 | 5 | ||||||||||||||||||||||||||||||||||||
| NAFTA | 1,083 | 1,094 | 826 | 862 | 88.0 | 83.9 | 56.4 | 50.3 | 31.6 | 33.6 | 191 | 232 | ||||||||||||||||||||||||||||||||||||
| Australia | 390 | 368 | 311 | 301 | 90.8 | 85.9 | 65.0 | 60.1 | 25.8 | 25.8 | 84 | 83 | ||||||||||||||||||||||||||||||||||||
| Other | 81 | 79 | 39 | 35 | 86.0 | 93.5 | 51.0 | 54.1 | 35.0 | 39.4 | 8 | 5 | ||||||||||||||||||||||||||||||||||||
| Asia-Pacific | 471 | 447 | 350 | 336 | 90.2 | 86.7 | 63.4 | 59.5 | 26.8 | 27.2 | 92 | 88 | ||||||||||||||||||||||||||||||||||||
| South America | 242 | 197 | 180 | 148 | 98.7 | 102.0 | 63.6 | 64.8 | 35.1 | 37.2 | 14 | 15 | ||||||||||||||||||||||||||||||||||||
| Other | 22 | 16 | 15 | 7 | —5) | —5) | —5) | —5) | —5) | —5) | 1 | 3 | ||||||||||||||||||||||||||||||||||||
| Specialty lines | ||||||||||||||||||||||||||||||||||||||||||||||||
| Credit Insurance | 446 | 398 | 330 | 283 | 73.1 | 77.3 | 43.4 | 50.9 | 29.7 | 26.4 | 161 | 122 | ||||||||||||||||||||||||||||||||||||
| Allianz Global Corporate & Specialty | 623 | 687 | 462 | 368 | 94.4 | 103.1 | 74.3 | 72.0 | 20.1 | 31.1 | 116 | 66 | ||||||||||||||||||||||||||||||||||||
| Travel Insurance and Assistance Services | 270 | 249 | 266 | 239 | 107.7 | 98.9 | 58.8 | 58.5 | 48.9 | 40.4 | 24 | 25 | ||||||||||||||||||||||||||||||||||||
| Subtotal | 10,456 | 10,287 | 9,656 | 9,358 | — | — | — | — | — | — | 1,891 | 1,845 | ||||||||||||||||||||||||||||||||||||
| Consolidation adjustments6) | (474) | (605) | — | — | — | — | — | — | — | — | 3 | — | ||||||||||||||||||||||||||||||||||||
| Total | 9,982 | 9,682 | 9,656 | 9,358 | 92.9 | 91.9 | 64.9 | 65.1 | 28.0 | 26.8 | 1,894 | 1,845 | ||||||||||||||||||||||||||||||||||||
1) | Contains run-off of€5 mn in both 2007 and 2006 from a former operating entity located in Luxembourg. |
2) | Effective February 21, 2007, Russian People’s Insurance Society “ROSNO” was consolidated following the acquisition of approximately 49.2% of the shares in ROSNO by the Allianz Group, increasing our holding to approximately 97%. Effective May 21, 2007 we consolidated Progress Garant for the first time. |
3) | Contains income and expense items from a management holding in both 2007 and 2006. |
4) | Effective 1Q 2007, life business in Mexico is shown within the Life/Health segment. |
5) | Presentation not meaningful. |
6) | Represents elimination of transactions between Allianz Group companies in different geographic regions. |
12
Table of Contents
Group Management Report
| Gross premiums written | Premiums earned (net) | Combined ratio | Loss ratio | Expense ratio | Operating profit | |||||||||||||||||||||||||||||||||||||||||||
| Six months ended June 30, | 2007 €mn | 2006 €mn | 2007 €mn | 2006 €mn | 2007 % | 2006 % | 2007 % | 2006 % | 2007 % | 2006 % | 2007 €mn | 2006 €mn | ||||||||||||||||||||||||||||||||||||
| Germany | 6,575 | 6,951 | 4,592 | 4,853 | 97.8 | 92.7 | 69.2 | 63.9 | 28.6 | 28.8 | 582 | 818 | ||||||||||||||||||||||||||||||||||||
| France | 2,838 | 2,845 | 2,217 | 2,206 | 99.0 | 99.8 | 71.5 | 72.7 | 27.5 | 27.1 | 237 | 216 | ||||||||||||||||||||||||||||||||||||
| Italy | 2,586 | 2,620 | 2,431 | 2,447 | 93.6 | 95.1 | 69.9 | 71.6 | 23.7 | 23.5 | 439 | 358 | ||||||||||||||||||||||||||||||||||||
| United Kingdom | 1,152 | 1,227 | 989 | 919 | 97.4 | 96.7 | 64.1 | 66.7 | 33.3 | 30.0 | 127 | 127 | ||||||||||||||||||||||||||||||||||||
| Switzerland | 1,272 | 1,241 | 806 | 868 | 94.9 | 95.6 | 68.3 | 71.5 | 26.6 | 24.1 | 122 | 118 | ||||||||||||||||||||||||||||||||||||
| Spain | 1,193 | 1,121 | 885 | 812 | 90.5 | 90.7 | 71.3 | 71.6 | 19.2 | 19.1 | 135 | 123 | ||||||||||||||||||||||||||||||||||||
Netherlands | 534 | 545 | 401 | 403 | 91.6 | 90.3 | 60.6 | 57.3 | 31.0 | 33.0 | 57 | 74 | ||||||||||||||||||||||||||||||||||||
Austria | 551 | 557 | 366 | 380 | 95.1 | 103.3 | 73.1 | 78.3 | 22.0 | 25.0 | 52 | 29 | ||||||||||||||||||||||||||||||||||||
Ireland | 369 | 374 | 305 | 306 | 93.9 | 78.8 | 69.3 | 55.1 | 24.6 | 23.7 | 128 | 95 | ||||||||||||||||||||||||||||||||||||
Belgium | 207 | 206 | 150 | 149 | 103.5 | 100.2 | 69.2 | 64.3 | 34.3 | 35.9 | 21 | 23 | ||||||||||||||||||||||||||||||||||||
Portugal | 147 | 152 | 124 | 130 | 89.7 | 86.9 | 61.8 | 63.2 | 27.9 | 23.7 | 20 | 24 | ||||||||||||||||||||||||||||||||||||
Greece | 40 | 38 | 24 | 23 | 91.6 | 86.4 | 61.1 | 57.2 | 30.5 | 29.2 | 4 | 4 | ||||||||||||||||||||||||||||||||||||
Western and Southern Europe | 1,848 | 1,872 | 1,370 | 1,391 | 94.3 | 92.0 | 67.0 | 63.8 | 27.3 | 28.2 | 2921) | 2591) | ||||||||||||||||||||||||||||||||||||
Hungary | 321 | 316 | 251 | 250 | 93.9 | 87.6 | 66.5 | 60.3 | 27.4 | 27.3 | 41 | 63 | ||||||||||||||||||||||||||||||||||||
Slovakia | 175 | 152 | 135 | 122 | 64.0 | 72.4 | 37.8 | 42.0 | 26.2 | 30.4 | 60 | 44 | ||||||||||||||||||||||||||||||||||||
Czech Republic | 132 | 139 | 91 | 87 | 77.6 | 86.0 | 54.9 | 65.1 | 22.7 | 20.9 | 25 | 14 | ||||||||||||||||||||||||||||||||||||
Poland | 181 | 143 | 117 | 97 | 94.6 | 90.0 | 60.5 | 57.5 | 34.1 | 32.5 | 12 | 12 | ||||||||||||||||||||||||||||||||||||
Romania | 173 | 138 | 75 | 60 | 94.8 | 95.3 | 76.3 | 82.1 | 18.5 | 13.2 | 4 | 4 | ||||||||||||||||||||||||||||||||||||
Bulgaria | 47 | 43 | 31 | 31 | 84.9 | 81.1 | 42.8 | 47.4 | 42.1 | 33.7 | 7 | 7 | ||||||||||||||||||||||||||||||||||||
Croatia | 44 | 40 | 29 | 27 | 101.7 | 95.8 | 69.2 | 64.1 | 32.5 | 31.7 | 1 | 2 | ||||||||||||||||||||||||||||||||||||
Russia2) | 268 | 11 | 199 | 2 | 103.8 | 69.0 | 65.3 | 31.0 | 38.5 | 38.0 | 4 | 1 | ||||||||||||||||||||||||||||||||||||
New Europe3) | 1,341 | 981 | 928 | 676 | 91.2 | 85.8 | 60.3 | 58.6 | 30.9 | 27.2 | 143 | 144 | ||||||||||||||||||||||||||||||||||||
| Other Europe | 3,189 | 2,853 | 2,298 | 2,067 | 92.3 | 89.9 | 64.1 | 62.1 | 28.2 | 27.8 | 435 | 403 | ||||||||||||||||||||||||||||||||||||
| United States | 1,912 | 2,054 | 1,605 | 1,723 | 89.3 | 87.0 | 56.5 | 54.9 | 32.8 | 32.1 | 355 | 426 | ||||||||||||||||||||||||||||||||||||
| Mexico4) | 92 | 92 | 42 | 49 | 89.6 | 101.3 | 64.0 | 76.9 | 25.6 | 24.4 | 7 | 8 | ||||||||||||||||||||||||||||||||||||
| NAFTA | 2,004 | 2,146 | 1,647 | 1,772 | 89.3 | 87.4 | 56.7 | 55.5 | 32.6 | 31.9 | 362 | 434 | ||||||||||||||||||||||||||||||||||||
| Australia | 741 | 703 | 615 | 601 | 96.5 | 94.1 | 71.3 | 68.8 | 25.2 | 25.3 | 134 | 121 | ||||||||||||||||||||||||||||||||||||
| Other | 162 | 157 | 75 | 69 | 93.1 | 94.3 | 55.6 | 55.9 | 37.5 | 38.4 | 11 | 9 | ||||||||||||||||||||||||||||||||||||
| Asia-Pacific | 903 | 860 | 690 | 670 | 96.1 | 94.2 | 69.6 | 67.5 | 26.5 | 26.7 | 145 | 130 | ||||||||||||||||||||||||||||||||||||
| South America | 479 | 423 | 347 | 300 | 99.4 | 102.5 | 64.4 | 65.7 | 35.0 | 36.8 | 28 | 27 | ||||||||||||||||||||||||||||||||||||
| Other | 57 | 41 | 26 | 15 | —5) | —5) | —5) | —5) | —5) | —5) | 4 | 4 | ||||||||||||||||||||||||||||||||||||
| Specialty lines | ||||||||||||||||||||||||||||||||||||||||||||||||
| Credit Insurance | 934 | 866 | 631 | 543 | 74.6 | 79.1 | 45.8 | 52.3 | 28.8 | 26.8 | 278 | 217 | ||||||||||||||||||||||||||||||||||||
| Allianz Global Corporate & Specialty | 1,556 | 1,557 | 929 | 757 | 94.2 | 92.8 | 70.3 | 67.2 | 23.9 | 25.6 | 211 | 211 | ||||||||||||||||||||||||||||||||||||
| Travel Insurance and Assistance Services | 566 | 515 | 526 | 470 | 104.2 | 100.2 | 56.9 | 60.1 | 47.3 | 40.1 | 55 | 47 | ||||||||||||||||||||||||||||||||||||
| Subtotal | 25,304 | 25,266 | 19,014 | 18,699 | — | — | — | — | — | — | 3,160 | 3,233 | ||||||||||||||||||||||||||||||||||||
| Consolidation adjustments6) | (1,211) | (1,435) | — | — | — | — | — | — | — | — | 1 | (2) | ||||||||||||||||||||||||||||||||||||
| Total | 24,093 | 23,831 | 19,014 | 18,699 | 94.8 | 93.3 | 66.5 | 65.6 | 28.3 | 27.7 | 3,161 | 3,231 | ||||||||||||||||||||||||||||||||||||
1) | Contains run-off of€10 mn in both 2007 and 2006 from a former operating entity located in Luxembourg. |
2) | Effective February 21, 2007, Russian People’s Insurance Society “ROSNO” was consolidated following the acquisition of approximately 49.2% of the shares in ROSNO by the Allianz Group, increasing our holding to approximately 97%. Effective May 21, 2007 we consolidated Progress Garant for the first time. |
3) | Contains income and expense items from a management holding in both 2007 and 2006. |
4) | Effective 1Q 2007, life business in Mexico is shown within the Life/Health segment. |
5) | Presentation not meaningful. |
6) | Represents elimination of transactions between Allianz Group companies in different geographic regions. |
13
Table of Contents
Earnings Summary
Statutory premiums
Statutory premiums by region1)
in %

1) | After elimination of transactions between Allianz Group companies in different geographic regions and different segments. |
2007 to 2006 second quarter comparison
Our statutory premiums decreased by 1.5% to €11,758 million in 2Q 2007. On an internal basis, we grew slightly by 0.3%. Whereas in most of our life insurance markets we recorded positive developments, statutory premium volumes declined in the United States and in Germany by 18.5% and 9.7%, respectively. On an internal growth basis, the decrease within the United States came to 12.6%.
Statutory premiums – Growth rates1)
in %
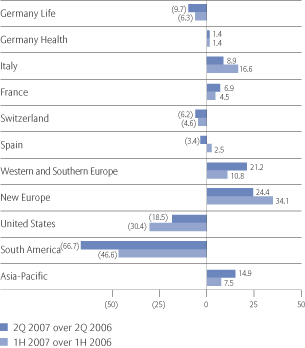
1) | Before elimination of transactions between Allianz Group companies in different geographic regions and different segments. |
The total revenue volume from New Europe and Asia-Pacific accounted for 12.0% of our Life/Health segment's statutory premiums in 2Q 2007, compared to 10.1% in the same period last year.
The highest absolute growth was achieved in Italy, where revenues grew by €210 million despite poor overall market performance, principally because sales through our bancassurance channel at RAS Group picked up and
14
Table of Contents
Group Management Report
we successfully launched three index-linked single premium products.
Within France, the increase in premiums by €101 million was largely brought about by an increase in group life business. In contrast to previous quarters, the highest proportion of new business originated from proprietary sales channels.
Total revenues within Asia-Pacific were up €155 million, mainly as we recorded strong sales of single premium unit-linked products sold foremost through our bank channels. In China, we obtained sales licenses for additional provinces, that allowed us to grow via the expansion of our sales network. Furthermore, we benefited from our strategic partnership with Industrial and Commercial Bank of China Limited (ICBC).
Statutory premium volume from New Europe rose by €42 million to €214 million, mainly driven by our operations in Slovakia where we recorded strong sales of single premium products through the agent network.
These positive developments did not fully compensate for the declines in particular in the United States and Germany.
In the United States, the changed market regulations affecting the sale of indexed annuity products are still visible in the statutory premium development. On a 2007 to 2006 quarter comparison statutory premiums decreased by €408 million. Additionally, business was negatively affected by the weakening of the U.S. Dollar against the Euro. On a local currency basis, the decline amounted to USD 348 million. However, we recorded a significant slowdown in the deterioration and statutory premium volume picked up growth compared to 1Q 2007, as the launch of new products and the focusing on key distribution channels showed first signs of success.
In a weak market environment, premiums from our German life business declined due to higher market interest rates which made some of our short term savings products relatively less attractive. Furthermore, we saw a shift from single premium business towards business with recurring premiums.
2007 to 2006 first half comparison
Statutory premiums declined by 2.7% to €24,084 million. In most of our markets, we recorded developments consistent with those previously described. Based on internal growth, our statutory premiums were down 0.9%.
Operating profit
Operating profit
in€mn
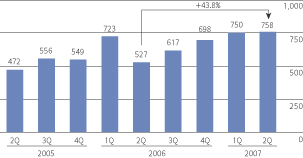
2007 to 2006 second quarter comparison
Operating profit grew dynamically by 43.8% to €758 million, resulting mostly from improved expense margins and investment result. Our expense margin benefited from – among other factors – increased fee and commission income on unit linked and variable annuity business, and our investment income grew mainly due to our higher asset base.
Interest and similar income was up as interest payments on debt securities and dividend payments on equity securities both grew. Conversely, due to significantly reduced equity harvesting in 2Q 2007, net realized gains dropped. In the prior year period, we recorded an exceptionally high level of realized capital gains, while this year, no major single transaction was executed. The considerably increased net loss from financial assets and liabilities carried at fair value through income stemmed largely from freestanding derivatives in connection with our German life business.
Changes in reserves for insurance and investment contracts (net) declined to €2,211 million from €2,950 million, predominantly due to lower net realized capital gains.
The markets which made the highest absolute contribution to operating profit in 2Q 2007 were France at €227 million, our German life operations at €141 million, Italy at €102 million and the United States at €88 million.
15
Table of Contents
Allianz Group Interim Report Second Quarter and First Half of 2007
2007 to 2006 first half comparison
Operating profit was up €258 million to €1,508 million. The various line item developments in the 2007 to 2006 first half comparison were largely consistent with the second quarter comparison.
Non-operating items
2007 to 2006 second quarter comparison
Non-operating items improved to an aggregate gain of €15 million, coming from an aggregate loss of €17 million, as no restructuring charges were recorded in 2Q 2007.
2007 to 2006 first half comparison
Significantly lower net realized gains not to be shared with policyholders in the United States led to a decreased aggregate half-year non-operating result in 2007 of €118 million, compared to €141 million last year.
Net income
2007 to 2006 second quarter comparison
Net income increased by €151 million to €479 million, primarily driven by our increased operating profit.
Our effective tax rate rose from 17.6% to 30.3% as a significantly higher tax-exempt income was recorded in 2Q 2006.
Due to the minority buy-outs at RAS and AGF, minority interests in earnings decreased by €32 million to €60 million.
2007 to 2006 first half comparison
Net income for the first six months of 2007 amounted to €1,032 million, up by €170 million from the prior year level. Consistent with the 2007 to 2006 first quarter comparison, this development was primarily driven by our operating profit. Income tax expenses increased by €126 million to €435 million, driving up our effective tax rate by 4.6 percentage points to 26.8%. As in the second quarter comparison, a lower impact from tax-exempt income was the main reason behind this development.
16
Table of Contents
Group Management Report
The following table sets forth our Life/Health insurance segment’s income statement and statutory expense ratio for the three and six months ended June 30, 2007 and 2006.
| Three months ended June 30, | Six months ended June 30, | |||||||||||||||
2007 €mn | 2006 €mn | 2007 €mn | 2006 €mn | |||||||||||||
| Statutory premiums1) | 11,758 | 11,931 | 24,084 | 24,753 | ||||||||||||
| Ceded premiums written | (186) | (213) | (379) | (409) | ||||||||||||
| Change in unearned premiums | 3 | (76) | (24) | (151) | ||||||||||||
| Statutory premiums (net) | 11,575 | 11,642 | 23,681 | 24,193 | ||||||||||||
| Deposits from SFAS 97 insurance and investment contracts | (6,892) | (6,874) | (13,813) | (14,346) | ||||||||||||
| Premiums earned (net) | 4,683 | 4,768 | 9,868 | 9,847 | ||||||||||||
| Interest and similar income | 3,783 | 3,698 | 6,938 | 6,745 | ||||||||||||
| Income from financial assets and liabilities carried at fair value through income (net), shared with policyholders2) | (668) | (216) | (979) | (185) | ||||||||||||
| Realized gains/losses (net) from investments, shared with policyholders3) | 646 | 947 | 1,734 | 2,050 | ||||||||||||
| Fee and commission income | 164 | 162 | 335 | 291 | ||||||||||||
| Other income | 9 | 7 | 63 | 13 | ||||||||||||
| Operating revenues | 8,617 | 9,366 | 17,959 | 18,761 | ||||||||||||
| Claims and insurance benefits incurred (net) | (4,158) | (4,103) | (8,860) | (8,796) | ||||||||||||
| Changes in reserves for insurance and investment contracts (net) | (2,211) | (2,950) | (4,835) | (5,598) | ||||||||||||
| Interest expense | (111) | (73) | (202) | (137) | ||||||||||||
| Loan loss provisions | — | 1 | (3) | 1 | ||||||||||||
| Impairments of investments (net), shared with policyholders | (56) | (210) | (93) | (245) | ||||||||||||
| Investment expenses | (163) | (211) | (359) | (368) | ||||||||||||
| Acquisition and administrative expenses (net) | (1,115) | (1,105) | (1,989) | (2,130) | ||||||||||||
| Fee and commission expenses | (43) | (70) | (105) | (120) | ||||||||||||
| Operating restructuring charges4) | (2) | (118) | (5) | (118) | ||||||||||||
| Operating expenses | (7,859) | (8,839) | (16,451) | (17,511) | ||||||||||||
| Operating profit | 758 | 527 | 1,508 | 1,250 | ||||||||||||
| Income from financial assets and liabilities carried at fair value through income (net), not shared with policyholders2) | (1) | — | — | — | ||||||||||||
| Realized gains/losses (net) from investments, not shared with policyholders3) | 17 | 27 | 122 | 186 | ||||||||||||
| Amortization of intangible assets | — | (1) | (1) | (2) | ||||||||||||
| Non-operating restructuring charges4) | (1) | (43) | (3) | (43) | ||||||||||||
| Non-operating items | 15 | (17) | 118 | 141 | ||||||||||||
| Income before income taxes and minority interests in earnings | 773 | 510 | 1,626 | 1,391 | ||||||||||||
| Income taxes | (234) | (90) | (435) | (309) | ||||||||||||
| Minority interests in earnings | (60) | (92) | (159) | (220) | ||||||||||||
| Net income | 479 | 328 | 1,032 | 862 | ||||||||||||
| Statutory expense ratio5) in % | 9.6 | 9.5 | 8.4 | 8.8 | ||||||||||||
1) | For the Life/Health segment, total revenues are measured based upon statutory premiums. Statutory premiums are gross premiums written from sales of life insurance policies, as well as gross receipts from sales of unit-linked and other investment-oriented products, in accordance with the statutory accounting practices applicable in the insurer’s home jurisdiction. |
2) | The total of these items equals income from financial assets and liabilities carried at fair value through income (net) in the segment income statement included in Note 3 to the consolidated financial statements. |
3) | The total of these items equals realized gains/losses (net) in the segment income statement included in Note 3 to the consolidated financial statements. |
4) | The total of these items equals restructuring charges in the segment income statement included in Note 3 to the consolidated financial statements. |
5) | Represents acquisition and administrative expenses (net) divided by statutory premiums (net). |
17
Table of Contents
Allianz Group Interim Report Second Quarter and First Half of 2007
Life/Health Operations by Geographic Region
The following table sets forth our Life/Health statutory premiums, premiums earned (net), statutory expense ratio and operating profit by geographic region for the three and six months ended June 30, 2007 and 2006. Consistent with our general practice, these figures are presented before consolidation adjustments, representing the elimination of transactions between Allianz Group companies in different geographic regions and different segments.
| Statutory premiums1) | Premiums earned (net) | Statutory expense ratio | Operating profit | |||||||||||||||||||||||||||||
| Three months ended June 30, | 2007 €mn | 2006 €mn | 2007 €mn | 2006 €mn | 2007 % | 2006 % | 2007 €mn | 2006 €mn | ||||||||||||||||||||||||
| Germany Life | 2,776 | 3,075 | 2,222 | 2,317 | 8.1 | 9.5 | 141 | 113 | ||||||||||||||||||||||||
| Germany Health2) | 783 | 772 | 783 | 772 | 9.4 | 7.6 | 41 | 46 | ||||||||||||||||||||||||
| Italy | 2,572 | 2,362 | 255 | 280 | 5.7 | 6.9 | 102 | 109 | ||||||||||||||||||||||||
| France | 1,575 | 1,474 | 390 | 376 | 15.1 | 12.1 | 227 | 101 | ||||||||||||||||||||||||
| Switzerland | 167 | 178 | 83 | 80 | 13.9 | 12.8 | 19 | 13 | ||||||||||||||||||||||||
| Spain | 168 | 174 | 119 | 122 | 8.3 | 9.3 | 26 | 20 | ||||||||||||||||||||||||
Netherlands | 101 | 104 | 34 | 35 | 13.4 | 11.9 | 12 | 12 | ||||||||||||||||||||||||
Austria | 95 | 83 | 71 | 64 | 8.8 | 15.5 | 6 | 9 | ||||||||||||||||||||||||
Belgium | 155 | 116 | 71 | 69 | 10.4 | 14.2 | 28 | 16 | ||||||||||||||||||||||||
Portugal | 28 | 25 | 17 | 16 | 26.1 | 16.2 | 7 | 5 | ||||||||||||||||||||||||
Luxembourg | 37 | 12 | 7 | 8 | 7.6 | 13.4 | 2 | 1 | ||||||||||||||||||||||||
Greece | 25 | 24 | 16 | 16 | 23.6 | 22.1 | 1 | — | ||||||||||||||||||||||||
Western and Southern Europe | 441 | 364 | 216 | 208 | 12.2 | 15.0 | 553) | 43 | ||||||||||||||||||||||||
Hungary | 26 | 22 | 20 | 18 | 27.6 | 27.4 | 4 | 4 | ||||||||||||||||||||||||
Slovakia | 64 | 45 | 40 | 34 | 12.3 | 19.2 | 9 | 6 | ||||||||||||||||||||||||
Czech Republic | 24 | 19 | 13 | 14 | 15.5 | 19.3 | 3 | 2 | ||||||||||||||||||||||||
Poland | 66 | 62 | 16 | 21 | 19.1 | 19.8 | 3 | 2 | ||||||||||||||||||||||||
Romania | 7 | 5 | 4 | 4 | 41.6 | 46.8 | — | — | ||||||||||||||||||||||||
Bulgaria | 7 | 6 | 6 | 5 | 16.4 | 17.2 | 1 | 1 | ||||||||||||||||||||||||
Croatia | 17 | 11 | 10 | 8 | 6.1 | 23.6 | — | 1 | ||||||||||||||||||||||||
Russia | 3 | 2 | 3 | 2 | 126.1 | (4.7) | (3) | — | ||||||||||||||||||||||||
New Europe | 214 | 172 | 112 | 106 | 18.9 | 21.2 | 17 | 16 | ||||||||||||||||||||||||
| Other Europe | 655 | 536 | 328 | 314 | 14.4 | 17.0 | 72 | 59 | ||||||||||||||||||||||||
| United States | 1,796 | 2,204 | 105 | 80 | 9.5 | 7.6 | 88 | 32 | ||||||||||||||||||||||||
| Mexico4) | 9 | — | 8 | — | 14.0 | — | 1 | — | ||||||||||||||||||||||||
| NAFTA | 1,805 | 2,204 | 113 | 80 | 9.6 | 7.6 | 89 | 32 | ||||||||||||||||||||||||
| South Korea | 466 | 522 | 238 | 248 | 17.6 | 15.8 | 24 | 13 | ||||||||||||||||||||||||
| Taiwan | 544 | 445 | 16 | 27 | 3.1 | 3.3 | 5 | 5 | ||||||||||||||||||||||||
| Malaysia | 30 | 28 | 26 | 22 | 21.2 | 23.7 | 3 | 2 | ||||||||||||||||||||||||
| Indonesia | 76 | 19 | 11 | 7 | 7.4 | 29.3 | 2 | 1 | ||||||||||||||||||||||||
| Other | 82 | 29 | 4 | 4 | 10.1 | 18.4 | (2) | (1) | ||||||||||||||||||||||||
| Asia-Pacific | 1,198 | 1,043 | 295 | 308 | 10.0 | 11.0 | 32 | 20 | ||||||||||||||||||||||||
| South America | 14 | 42 | 8 | 12 | 47.3 | 18.1 | — | (1) | ||||||||||||||||||||||||
| Other5) | 98 | 129 | 87 | 106 | —6) | —6) | 18 | 15 | ||||||||||||||||||||||||
| Subtotal | 11,811 | 11,989 | 4,683 | 4,767 | — | — | 767 | 527 | ||||||||||||||||||||||||
| Consolidation adjustments7) | (53) | (58) | — | — | — | — | (9) | — | ||||||||||||||||||||||||
| Total | 11,758 | 11,931 | 4,683 | 4,767 | 9.6 | 9.5 | 758 | 527 | ||||||||||||||||||||||||
1) | Statutory premiums are gross premiums written from sales of life insurance policies as well as gross receipts from sales of unit-linked and other investment-oriented products, in accordance with the statutory accounting practices applicable in the insurer’s home jurisdiction. |
2) | Loss ratios were 68.1% and 63.7% for 2007 and 2006, respectively. |
3) | Contains run-off of € (1) mn in 2007 from our former life insurance business in the United Kingdom which we sold in December 2004. |
4) | Effective 1Q 2007, life business in Mexico is shown within the Life/Health segment. |
5) | Contains, among others, the Life/Health business assumed by Allianz SE. |
6) | Presentation not meaningful. |
7) | Represents elimination of transactions between Allianz Group companies in different geographic regions. |
18
Table of Contents
Group Management Report
| Statutory premiums1) | Premiums earned (net) | Statutory expense ratio | Operating profit | |||||||||||||||||||||||||||||
| Six months ended June 30, | 2007 €mn | 2006 €mn | 2007 €mn | 2006 €mn | 2007 % | 2006 % | 2007 €mn | 2006 €mn | ||||||||||||||||||||||||
| Germany Life | 5,815 | 6,204 | 4,788 | 4,898 | 4.6 | 9.1 | 332 | 246 | ||||||||||||||||||||||||
| Germany Health2) | 1,563 | 1,541 | 1,563 | 1,542 | 9.8 | 7.3 | 82 | 99 | ||||||||||||||||||||||||
| Italy | 5,402 | 4,631 | 498 | 522 | 5.5 | 6.4 | 196 | 203 | ||||||||||||||||||||||||
| France | 3,065 | 2,934 | 825 | 732 | 14.4 | 12.6 | 362 | 275 | ||||||||||||||||||||||||
| Switzerland | 665 | 697 | 278 | 289 | 6.9 | 7.4 | 35 | 27 | ||||||||||||||||||||||||
| Spain | 324 | 316 | 229 | 222 | 9.4 | 8.9 | 53 | 41 | ||||||||||||||||||||||||
Netherlands | 214 | 228 | 69 | 73 | 12.9 | 12.2 | 23 | 22 | ||||||||||||||||||||||||
Austria | 198 | 184 | 139 | 132 | 9.4 | 12.5 | 25 | 22 | ||||||||||||||||||||||||
Belgium | 349 | 295 | 147 | 145 | 8.9 | 10.4 | 71 | 32 | ||||||||||||||||||||||||
Portugal | 50 | 45 | 36 | 33 | 28.4 | 15.1 | 17 | 12 | ||||||||||||||||||||||||
Luxembourg | 47 | 21 | 14 | 15 | 11.1 | 15.2 | 5 | 3 | ||||||||||||||||||||||||
Greece | 54 | 50 | 32 | 31 | 20.2 | 23.1 | 2 | 2 | ||||||||||||||||||||||||
| Western and Southern Europe | 912 | 823 | 437 | 429 | 11.8 | 12.7 | 1423) | 923) | ||||||||||||||||||||||||
Hungary | 56 | 45 | 40 | 37 | 23.8 | 27.1 | 8 | 8 | ||||||||||||||||||||||||
Slovakia | 126 | 88 | 80 | 67 | 13.6 | 19.5 | 16 | 14 | ||||||||||||||||||||||||
Czech Republic | 45 | 38 | 26 | 27 | 17.6 | 20.9 | 6 | 4 | ||||||||||||||||||||||||
Poland | 314 | 231 | 44 | 40 | 10.5 | 10.7 | 6 | 3 | ||||||||||||||||||||||||
Romania | 16 | 15 | 6 | 6 | 34.1 | 39.1 | (1) | 1 | ||||||||||||||||||||||||
Bulgaria | 15 | 11 | 13 | 10 | 15.3 | 15.9 | 2 | 1 | ||||||||||||||||||||||||
Croatia | 29 | 20 | 19 | 16 | 10.6 | 24.7 | 2 | 1 | ||||||||||||||||||||||||
Russia | 5 | 4 | 5 | 4 | 133.5 | 17.4 | (3) | — | ||||||||||||||||||||||||
New Europe | 606 | 452 | 233 | 207 | 14.7 | 16.4 | 36 | 32 | ||||||||||||||||||||||||
| Other Europe | 1,518 | 1,275 | 670 | 636 | 12.9 | 14.0 | 178 | 124 | ||||||||||||||||||||||||
| United States | 3,465 | 4,976 | 205 | 168 | 9.4 | 6.5 | 159 | 153 | ||||||||||||||||||||||||
| Mexico4) | 16 | — | 16 | — | 15.0 | — | 2 | — | ||||||||||||||||||||||||
| NAFTA | 3,481 | 4,976 | 221 | 168 | 9.5 | 6.5 | 161 | 153 | ||||||||||||||||||||||||
| South Korea | 931 | 1,094 | 490 | 503 | 15.8 | 13.3 | 78 | 38 | ||||||||||||||||||||||||
| Taiwan | 894 | 744 | 30 | 41 | 2.8 | 2.5 | 9 | 9 | ||||||||||||||||||||||||
| Malaysia | 58 | 50 | 49 | 41 | 18.2 | 21.2 | 5 | 4 | ||||||||||||||||||||||||
| Indonesia | 106 | 34 | 22 | 16 | 11.4 | 31.9 | 4 | 1 | ||||||||||||||||||||||||
| Other | 130 | 50 | 9 | 8 | 11.4 | 18.3 | (6) | (1) | ||||||||||||||||||||||||
| Asia-Pacific | 2,119 | 1,972 | 600 | 609 | 10.0 | 9.9 | 90 | 51 | ||||||||||||||||||||||||
| South America | 47 | 88 | 17 | 25 | 27.5 | 14.3 | (1) | (1) | ||||||||||||||||||||||||
| Other5) | 200 | 242 | 179 | 204 | —6) | —6) | 34 | 32 | ||||||||||||||||||||||||
| Subtotal | 24,199 | 24,876 | 9,868 | 9,847 | — | — | 1,522 | 1,250 | ||||||||||||||||||||||||
| Consolidation adjustments7) | (115) | (123) | — | — | — | — | (14) | — | ||||||||||||||||||||||||
| Total | 24,084 | 24,753 | 9,868 | 9,847 | 8.4 | 8.8 | 1,508 | 1,250 | ||||||||||||||||||||||||
1) | Statutory premiums are gross premiums written from sales of life insurance policies as well as gross receipts from sales of unit-linked and other investment-oriented products, in accordance with the statutory accounting practices applicable in the insurer’s home jurisdiction. |
2) | Loss ratios were 72.9% and 69.7% for 2007 and 2006, respectively. |
3) | Contains run-off of€(1) mn in both 2007 and 2006 from our former life insurance business in the United Kingdom which we sold in December 2004. |
4) | Effective 1Q 2007, life business in Mexico is shown within the Life/Health segment. |
5) | Contains, among others, the Life/Health business assumed by Allianz SE. |
6) | Presentation not meaningful. |
7) | Represents elimination of transactions between Allianz Group companies in different geographic regions. |
19
Table of Contents
Earnings Summary
The results of operations of our Banking segment are almost exclusively represented by Dresdner Bank, accounting for 96.0% of our total Banking segment’s operating revenues in 1H 2007 (1H 2006: 96.1%). Accordingly, the discussion of our Banking segment’s results of operations relates solely to the operations of Dresdner Bank.
We have restated the prior year presentation of revenues and operating profit stemming from trades in own shares1). From 2007 onwards, these results are eliminated on Dresdner Bank level, whereas in 2006 they were adjusted on segment level only.
Operating revenues
2007 to 2006 second quarter comparison
Dresdner Bank’s operating revenues at €1,770 million, up 8.7% compared to a year ago, continued the ongoing trend of exceeding prior year level.
Net interest income was €701 million, up 11.1%, mainly due to a significant increase in our structured transaction business and the favorable development of margins and volumes in our deposit business, which was partially offset by a slight margin-driven decline in the commercial loan business.
Net fee and commission income increased by €38 million to €718 million, benefiting from ongoing strong certificates business.
Trading income (net) increased by 11.7% to €335 million. The investment bank entered into various underlying positions which are economically hedged with own shares. The increase of the trading result represents the accounting treatment required under IFRS which results in this case in a one-sided effect stemming from the elimination of the economic hedge in own shares. Trading income (net) from our operating divisions declined. In expectation of the current development, we positioned ourselves on the conservative side and forewent upside potential, resulting in reduced trading volumes.
2007 to 2006 first half comparison
Operating revenues increased by 8.0% to €3,793 million. The main contributor was net interest income at €1,601 million which grew by 32.4%.
Operating profit
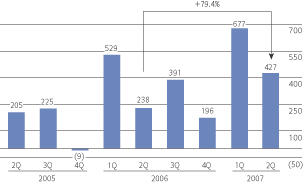
Operating profit
in€mn
1) | Shares of Allianz SE and its affiliates. |
20
Table of Contents
Group Management Report
2007 to 2006 second quarter comparison
At €427 million, up 79.4% from a year ago, operating profit again grew substantially, notwithstanding higher loan loss provisions. The increase in revenues previously described and declining operating expenses contributed to this positive development. As a result, our cost-income ratio dropped by 12.7 percentage points to 72.4%.
Further efficiency gains and a continuous adherence to cost discipline continued to pay off. Operating expenses developed favorably, down 7.5% to €1,281 million. Non-personnel expenses accounted for €476 million, down 3.8% as a result of further cost reductions across almost all cost categories with the most significant reduction in fees for external services. Personnel expenses at €801 million dropped by 10.1%.
Loan loss provisions recorded net additions of €62 million. This increase was composed of gross additions of €140 million versus €106 million in 2Q 2006 and lower gross releases and recoveries of €78 million compared to €101 million a year ago.
2007 to 2006 first half comparison
We recorded a strong operating profit of €1,104 million, up 43.9% compared to a year earlier. Increased operating revenues and further decreasing operating expenses led to a significant decrease of our cost-income ratio to 69.4% down 9.6% percentage points.
The positive development of our operating profit was achieved despite net loan loss provisions turning to a net expense, as expected, and on a relatively low level in 1H 2007. Our coverage ratio amounted to 56.5% compared to 58.5% a year ago.
Non-operating items
2007 to 2006 second quarter comparison
Non-operating items increased by €18 million to €30 million, made up almost exclusively of realized gains which developed in a similar magnitude.
2007 to 2006 first half comparison
With a decline of 64.1% to €145 million, the impact from non-operating items was materially lower than in the prior year period. Realized gains in 1H 2006 included the sale of Dresdner Bank's remaining shareholdings in Munich Re to Allianz SE (formerly Allianz AG) and the disposal of our remaining participation in Eurohypo AG.
Net income
2007 to 2006 second quarter comparison
Net income at €395 million more than doubled compared to a year earlier. In addition to a higher income before taxes this was due to higher tax exempt income. Accordingly, our effective tax rate dropped to only 9.6% from 32.0% a year earlier.
2007 to 2006 first half comparison
Net income increased by 24.8% to €1,007 million due to significant tax-exempt income in 1H 2007. The high increase of operating profit was partially offset by the decline of non-operating items, leaving income before income taxes and minority interests in earnings €78 million higher, at €1,249 million.
21
Table of Contents
Allianz Group Interim Report Second Quarter and First Half of 2007
The following table sets forth the income statements and cost-income ratios for both our Banking segment as a whole and Dresdner Bank for the three and six months ended June 30, 2007 and 2006.
| Three months ended June 30, | Six months ended June 30, | |||||||||||||||||||||||||||||||
| 2007 | 2006 | 2007 | 2006 | |||||||||||||||||||||||||||||
Banking €mn | Dresdner Bank €mn | Banking €mn | Dresdner Bank1) €mn | Banking €mn | Dresdner Bank €mn | Banking €mn | Dresdner Bank1) €mn | |||||||||||||||||||||||||
| Net interest income2) | 730 | 701 | 652 | 631 | 1,658 | 1,601 | 1,253 | 1,209 | ||||||||||||||||||||||||
| Net fee and commission income3) | 766 | 718 | 728 | 680 | 1,598 | 1,507 | 1,560 | 1,473 | ||||||||||||||||||||||||
| Trading income (net)4) | 338 | 335 | 308 | 300 | 689 | 680 | 795 | 784 | ||||||||||||||||||||||||
| Income from financial assets and liabilities designated at fair value through income (net)4) | 16 | 16 | 18 | 18 | 6 | 5 | 21 | 21 | ||||||||||||||||||||||||
| Other income | — | — | — | (1) | — | — | 25 | 25 | ||||||||||||||||||||||||
| Operating revenues5) | 1,850 | 1,770 | 1,706 | 1,628 | 3,951 | 3,793 | 3,654 | 3,512 | ||||||||||||||||||||||||
| Administrative expenses | (1,334) | (1,277) | (1,436) | (1,386) | (2,744) | (2,632) | (2,864) | (2,767) | ||||||||||||||||||||||||
| Investment expenses | (4) | (5) | (10) | (12) | (13) | (16) | (16) | (19) | ||||||||||||||||||||||||
| Other expenses | 1 | 1 | 13 | 13 | 14 | 14 | 13 | 13 | ||||||||||||||||||||||||
| Operating expenses | (1,337) | (1,281) | (1,433) | (1,385) | (2,743) | (2,634) | (2,867) | (2,773) | ||||||||||||||||||||||||
| Loan loss provisions | (65) | (62) | (7) | (5) | (60) | (55) | 26 | 28 | ||||||||||||||||||||||||
| Operating profit | 448 | 427 | 266 | 238 | 1,148 | 1,104 | 813 | 767 | ||||||||||||||||||||||||
| Realized gains/losses (net) | 51 | 43 | 32 | 30 | 190 | 180 | 446 | 444 | ||||||||||||||||||||||||
| Impairments of investments (net) | (9) | (9) | (12) | (12) | (22) | (22) | (32) | (32) | ||||||||||||||||||||||||
| Amortization of intangible assets | — | — | (1) | — | — | — | (1) | — | ||||||||||||||||||||||||
| Restructuring charges | (3) | (4) | (7) | (6) | (12) | (13) | (9) | (8) | ||||||||||||||||||||||||
| Non-operating items | 39 | 30 | 12 | 12 | 156 | 145 | 404 | 404 | ||||||||||||||||||||||||
| Income before income taxes and minority interests in earnings | 487 | 457 | 278 | 250 | 1,304 | 1,249 | 1,217 | 1,171 | ||||||||||||||||||||||||
| Income taxes | (56) | (44) | (89) | (80) | (224) | (202) | (334) | (318) | ||||||||||||||||||||||||
| Minority interests in earnings | (20) | (18) | (27) | (21) | (44) | (40) | (55) | (46) | ||||||||||||||||||||||||
| Net income | 411 | 395 | 162 | 149 | 1,036 | 1,007 | 828 | 807 | ||||||||||||||||||||||||
| Cost-income ratio6)in % | 72.3 | 72.4 | 84.0 | 85.1 | 69.4 | 69.4 | 78.5 | 79.0 | ||||||||||||||||||||||||
1) | We have restated the presentation of revenues and operating profit stemming from trades in shares of Allianz SE and its affiliates. From 2007 onwards, these results are eliminated on Dresdner Bank level, whereas in 2006 they were adjusted on segment level only. |
2) | Represents interest and similar income less interest expense. |
3) | Represents fee and commission income less fee and commission expense. |
4) | The total of these items equals income from financial assets and liabilities carried at fair value through income (net) in the segment income statement included in Note 3 to the consolidated financial statements. |
5) | For the Banking segment, total revenues are measured based upon operating revenues. |
6) | Represents operating expenses divided by operating revenues. |
22
Table of Contents
Group Management Report
Banking Operations by Division
The following table sets forth our banking operating revenues, operating profit and cost-income ratio by division. Consistent with our general practice, these figures are presented before consolidation adjustments, representing the elimination of transactions between Allianz Group companies in different segments.
| Operating revenues | Operating profit (loss) | Cost-Income ratio | ||||||||||||||||||||||
| Three months ended June 30, | 2007 €mn | 2006 €mn | 2007 €mn | 2006 €mn | 2007 % | 2006 % | ||||||||||||||||||
| Private & Corporate Clients1) | 884 | 875 | 188 | 193 | 75.7 | 75.3 | ||||||||||||||||||
| Investment Banking1) | 760 | 868 | 153 | 178 | 75.1 | 79.4 | ||||||||||||||||||
| Corporate Other2) | 126 | (115) | 86 | (133) | —3) | —3) | ||||||||||||||||||
| Dresdner Bank4) | 1,770 | 1,628 | 427 | 238 | 72.4 | 85.1 | ||||||||||||||||||
| Other Banks5) | 80 | 78 | 21 | 28 | 70.0 | 61.5 | ||||||||||||||||||
| Total | 1,850 | 1,706 | 448 | 266 | 72.3 | 84.0 | ||||||||||||||||||
| Operating revenues | Operating profit (loss) | Cost-Income ratio | ||||||||||||||||||||||
| Six months ended June 30, | 2007 €mn | 2006 €mn | 2007 €mn | 2006 €mn | 2007 % | 2006 % | ||||||||||||||||||
| Private & Corporate Clients1) | 1,880 | 1,870 | 510 | 506 | 71.4 | 71.1 | ||||||||||||||||||
| Investment Banking1) | 1,649 | 1,731 | 372 | 399 | 75.8 | 78.9 | ||||||||||||||||||
| Corporate Other2) | 264 | (89) | 222 | (138) | —3) | —3) | ||||||||||||||||||
| Dresdner Bank4) | 3,793 | 3,512 | 1,104 | 767 | 69.4 | 79.0 | ||||||||||||||||||
| Other Banks5) | 158 | 142 | 44 | 46 | 69.0 | 66.2 | ||||||||||||||||||
| Total | 3,951 | 3,654 | 1,148 | 813 | 69.4 | 78.5 | ||||||||||||||||||
1) | Our reporting by division reflects the organizational changes within Dresdner Bank effective starting with 1Q 2007, resulting in two operating divisions, Private & Corporate Clients (“PCC”) and Investment Banking (“IB”). PCC combines all banking activities formerly provided by the Personal Banking and Private & Business Banking (including Private Wealth Management) divisions as well as our activities with medium-sized business clients from our former Corporate Banking division. IB, with Global Banking and Capital Markets, unites the activities formerly provided by the Dresdner Kleinwort (formerly Dresdner Kleinwort Wasserstein) division and the remaining activities of the former Corporate Banking division. Prior year balances have been adjusted accordingly to reflect these reorganization measures and allow for comparability across periods. |
2) | The Corporate Other division contains income and expense items that are not assigned to Dresdner Bank’s operating divisions. These items include, in particular, impacts from the accounting treatment for derivative financial instruments which do not qualify for hedge accounting as well as provisioning requirements for country and general risks. For the three and six months, the impact from the accounting treatment for derivative financial instruments which do not qualify for hedge accounting on Corporate Other’s operating revenues amounted to€4 mn and€(16) mn respectively (2006:€9 mn and€(14) mn respectively). |
3) | Presentation not meaningful. |
4) | We have restated the presentation of revenues and operating profit stemming from trades in shares of Allianz SE and its affiliates. From 2007 onwards, these results are eliminated on Dresdner Bank level, whereas in 2006 they were adjusted on segment level only. |
5) | Consists of non-Dresdner Bank banking operations within our Banking segment. |
Reconciliation of Operating Profit and Operating Revenues
| 2006 | ||||||||||||||||
| Three months ended | March 31, €mn | June 30, €mn | September 30, €mn | December 31, €mn | ||||||||||||
| Operating revenues | ||||||||||||||||
| Dresdner Bank – previously stated | 1,884 | 1,709 | 1,520 | 1,697 | ||||||||||||
| Reversal of impact “Own shares” (previously shown on segment level) | — | (81) | 81 | (6) | ||||||||||||
| Dresdner Bank | 1,884 | 1,628 | 1,601 | 1,691 | ||||||||||||
| Operating profit | ||||||||||||||||
| Dresdner Bank – previously stated | 529 | 319 | 310 | 202 | ||||||||||||
| Reversal of impact “Own shares” (previously shown on segment level) | — | (81) | 81 | (6) | ||||||||||||
| Dresdner Bank | 529 | 238 | 391 | 196 | ||||||||||||
23
Table of Contents
Third-Party Assets Under Management of the Allianz Group
With third-party assets of €789 billion as of June 30, 2007 we recorded a 3.3% increase compared to December 31, 2006. In the first half of 2007, net inflows to third-party assets of €20 billion were achieved, primarily in the United States, France and Asia-Pacific. Of the total net inflows, our fixed income business made up for € 18 billion and our equity business for €2 billion. The strong fixed income net inflows were achieved despite a challenging market environment, in particular rising interest rates and flattening yield curves across regions.
Market-related appreciation was €21 billion. The majority of both the fixed income and equity assets we manage outperformed their respective benchmarks.
Net inflows and positive market effects were partly offset by negative currency translation effects of €14 billion, resulting primarily from a weaker U.S. Dollar versus the Euro. Overall, on a Euro-basis, our third-party assets increased by €25 billion1) to €789 billion as of June 30, 2007, compared to €764 billion as of December 31, 2006.
We operate our third-party asset management business primarily through Allianz Global Investors (“AGI”). As of June 30, 2007, AGI managed approximately 94.7% (December 31, 2006: 94.6%) of the Allianz Group’s third-party assets. The remaining third-party assets are managed by Dresdner Bank (approximately 2.6% and 2.7% as of June 30, 2007 and December 31, 2006, respectively) and other Allianz Group subsidiaries (approximately 2.7% as of both, June 30, 2007 and December 31, 2006).
1) | Including a negative deconsolidation effect of€2 bn. |
The following graphs present the third-party assets managed by the Allianz Group by geographic region, investment category and investor class as of June 30, 2007 and December 31, 2006, respectively.
Third-party assets under management – Fair values by geographic region1)
in€bn
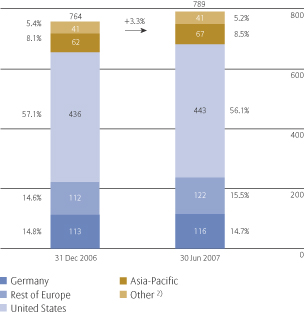
1) | Based on the origination of the assets. |
2) | Consists of third-party assets managed by Dresdner Bank (approximately€21 bn as of both, June 30, 2007 and December 31, 2006) and by other Allianz Group companies (approximately€20 bn as of both, June 30, 2007 and December 31, 2006). |
24
Table of Contents
Group Management Report
Third-party assets under management – Fair values by investment category
in€bn
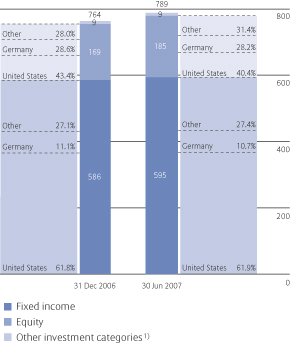
1) | Includes primarily investments in real estate. |
Third-party assets under management – Fair values by investor class
in€bn
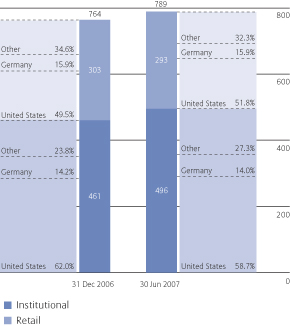
Third-party assets under management – Composition of fair value development in the United States
in€bn
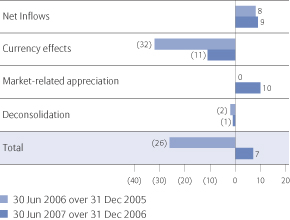
Third-party assets under management – Composition of fair value development in Germany
in€bn
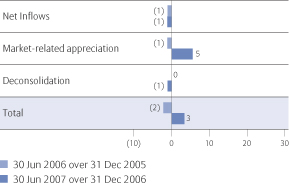
Our major achievements in the first half of 2007 included:
• | AGI Germany with assets under management of €284.8 billion and a market share of 17.8% is a clear market leader in Germany1). |
| • | AGI Germany for the third consecutive year achieved a TOP 3 position for service quality in the ranking of “FONDS professionell” magazine. |
| • | Particular strong net inflows of approximately €2.2 billion at our equity fund manager NFJ Investment Group. |
| • | PIMCO was awarded “Best Third-Party Provider of Fixed Income Portfolio Management Services in Asia” from Euromoney Private Banking Survey 2007. |
1) | Source: Bundesverband Investment und Asset Management (BVI), an association representing the German investment fund industry. |
25
Table of Contents
Allianz Group Interim Report Second Quarter and First Half of 2007
Earnings Summary
The results of operations of our Asset Management segment are almost exclusively represented by AGI, accounting for 97.6% and 96.6% of our total Asset Management segment’s operating revenues and operating profit, respectively, in 2Q 2007 (2Q 2006: 98.8% and 99.3%, respectively). Accordingly, the discussion of our Asset Management segment’s results of operations relates solely to the operations of AGI.
Operating revenues
2007 to 2006 second quarter comparison
At €778 million, operating revenues improved by 8.5%; a substantial increase given unfavorable currency effects such as the depreciation of the U.S. Dollar versus the Euro. At constant exchange rates, operating revenues
would have been up by 14.2%. Management fees increased alongside the growing asset base as previously described. Income from financial assets and liabilities carried at fair value through income (net) was up €17 million compared to a year ago; primarily stemming from higher mark-to-market valuation of seed money in the United States. Performance fees also developed favorably, predominantly as a result of our positive business development in Europe.
2007 to 2006 first half comparison
Operating revenues at €1,536 million were up 5.8% . The internal growth rate amounted to 12.0%. Asset-based management fees surpassed the result of last year's period, reflecting the growth of our third-party asset base at higher revenue margins. To a large extent driven by our business located in the United States, performance fees rose by 40.0% to €35 million. Reduced loading and exit fees reflect the development of mutual fund sales.
| Three months ended June 30, | Six months ended June 30, | |||||||||||||||
2007 €mn | 2006 €mn | 2007 €mn | 2006 €mn | |||||||||||||
| Management fees | 861 | 823 | 1,712 | 1,652 | ||||||||||||
| Loading and exit fees | 78 | 86 | 159 | 177 | ||||||||||||
| Performance fees | 20 | 9 | 35 | 25 | ||||||||||||
| Other income | 94 | 97 | 196 | 176 | ||||||||||||
| Fee and commission income | 1,053 | 1,015 | 2,102 | 2,030 | ||||||||||||
| Commissions | (226) | (223) | (446) | (449) | ||||||||||||
| Other expenses | (84) | (91) | (185) | (176) | ||||||||||||
| Fee and commission expenses | (310) | (314) | (631) | (625) | ||||||||||||
| Net fee and commission income | 743 | 701 | 1,471 | 1,405 | ||||||||||||
Operating profit
Operating profit
in€mn
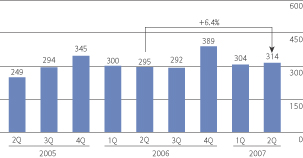
2007 to 2006 second quarter comparison
Operating profit was €314 million; an increase of 6.4%. Adjusted for currency translation effects, operating profit would have exceeded the 2Q 2006 level by 12.6%. This increase was predominantly due to the favorable business development in the United States.
Administrative expenses, excluding acquisition-related expenses, rose by 10.0% to €464 million; €192 million of which were compensation related, an increase compared to €161 million a year earlier. Non-compensation related expenses were at €272 million versus €261 million in 2Q 2006. This development was in line with our ongoing business expansion and investments in future growth.
Our cost-income ratio slightly increased by 0.7% percentage points to 59.6%.
26
Table of Contents
Group Management Report
2007 to 2006 first half comparison
In 1H 2007 operating profit was up 3.9%, amounting to €618 million; despite the burden of unfavorable currency effects. Excluding these effects operating profit would have surpassed last year's result by 10.5%.
Due to continuous investment in future growth and further business expansion, administrative expenses, excluding acquisition-related expenses, were up €61 million to €918 million. Thereof, €384 million were compensation-related expenses and €534 million non compensation-related expenses.
Non-operating items
2007 to 2006 second quarter comparison
Acquisition-related expenses dropped by €49 million to €83 million. This decline was mainly driven by a lower number of outstanding PIMCO LLC Class B Units (or “Class B Units”). The Allianz Group had acquired 37,760 of the 150,000 PIMCO LLC Class B Units originally outstanding, as of June 30, 2007, compared to 11,721 as of June 30, 2006.
2007 to 2006 first half comparison
At €205 million, acquisition-related expenses were down by €65 million. A lower number of outstanding Class B Units as previously described contributed most to this development.
Net income
2007 to 2006 second quarter comparison
Net income of €126 million significantly exceeded the 2Q 2006 result by 40.0%. Excluding effects of exchange rate movements, the internal growth rate would have been 50.1%.
With income tax expenses at €100 million versus €62 million a year ago our effective tax rate was 43.1% (2Q 2006: 38.3%).
2007 to 2006 first half comparison
Net income grew significantly by 23.7% to €219 million, despite unfavorable currency effects. At constant exchange rates net income would have surpassed prior year's period by 32.0%
27
Table of Contents
Allianz Group Interim Report Second Quarter and First Half of 2007
The following table sets forth the income statements and cost-income ratios for both our Asset Management segment as a whole and AGI for the three and six months ended June 30, 2007 and 2006.
| Three months ended June 30, | Six months ended June 30, | |||||||||||||||||||||||||||||||
| 2007 | 2006 | 2007 | 2006 | |||||||||||||||||||||||||||||
Asset Management Segment €mn | Allianz Global Investors €mn | Asset Management Segment €mn | Allianz Global Investors €mn | Asset Management Segment €mn | Allianz Global Investors €mn | Asset Management Segment €mn | Allianz Global Investors €mn | |||||||||||||||||||||||||
| Net fee and commission income1) | 765 | 743 | 712 | 701 | 1,511 | 1,471 | 1,429 | 1,405 | ||||||||||||||||||||||||
| Net interest income2) | 13 | 17 | 13 | 15 | 36 | 36 | 30 | 29 | ||||||||||||||||||||||||
| Income from financial assets and liabilities carried at fair value through income (net) | 16 | 15 | (2) | (2) | 23 | 22 | 12 | 12 | ||||||||||||||||||||||||
| Other income | 3 | 3 | 3 | 3 | 7 | 7 | 6 | 6 | ||||||||||||||||||||||||
| Operating revenues3) | 797 | 778 | 726 | 717 | 1,577 | 1,536 | 1,477 | 1,452 | ||||||||||||||||||||||||
| Administrative expenses, excluding acquisition-related expenses4) | (472) | (464) | (429) | (422) | (940) | (918) | (876) | (857) | ||||||||||||||||||||||||
| Operating expenses | (472) | (464) | (429) | (422) | (940) | (918) | (876) | (857) | ||||||||||||||||||||||||
| Operating profit | 325 | 314 | 297 | 295 | 637 | 618 | 601 | 595 | ||||||||||||||||||||||||
| Realized gains/losses (net) | 1 | 1 | (1) | (1) | 3 | 3 | 1 | — | ||||||||||||||||||||||||
| Impairments of investments (net) | — | — | (1) | — | — | — | (1) | — | ||||||||||||||||||||||||
| Acquisition-related expenses, thereof4) | ||||||||||||||||||||||||||||||||
Deferred purchases of interests in PIMCO | (80) | (80) | (130) | (130) | (202) | (202) | (266) | (266) | ||||||||||||||||||||||||
Other acquisition-related expenses5) | (3) | (3) | (2) | (2) | (3) | (3) | (4) | (4) | ||||||||||||||||||||||||
Subtotal | (83) | (83) | (132) | (132) | (205) | (205) | (270) | (270) | ||||||||||||||||||||||||
| Restructuring charges | — | — | — | — | (2) | (2) | — | — | ||||||||||||||||||||||||
| Non-operating items | (82) | (82) | (134) | (133) | (204) | (204) | (270) | (270) | ||||||||||||||||||||||||
| Income before income taxes and minority interests in earnings | 243 | 232 | 163 | 162 | 433 | 414 | 331 | 325 | ||||||||||||||||||||||||
| Income taxes | (101) | (100) | (62) | (62) | (181) | (179) | (127) | (126) | ||||||||||||||||||||||||
| Minority interests in earnings | (8) | (6) | (11) | (10) | (19) | (16) | (24) | (22) | ||||||||||||||||||||||||
| Net income | 134 | 126 | 90 | 90 | 233 | 219 | 180 | 177 | ||||||||||||||||||||||||
| Cost-income ratio6)in % | 59.2 | 59.6 | 59.1 | 58.9 | 59.6 | 59.8 | 59.3 | 59.0 | ||||||||||||||||||||||||
1) | Represents fee and commission income less fee and commission expense. |
2) | Represents interest and similar income less interest expense and investment expenses. |
3) | For the Asset Management segment, total revenues are measured based upon operating revenues. |
4) | The total of these items equals acquisition and administration expenses (net) in the segment income statement in Note 3 to the consolidated financial statements. |
5) | Consists of retention payments for the management and employees of PIMCO and Nicholas Applegate. |
6) | Represents operating expenses divided by operating revenues. |
28
Table of Contents
| Group Management Report | ||||||
| Corporate Activities | ||||||
Earnings Summary
| Three months ended June 30, | Six months ended June 30, | |||||||||||||||||||||||||||||||
| Holding Function | Private Equity | Holding Function | Private Equity | |||||||||||||||||||||||||||||
2007 €mn | 2006 €mn | 2007 €mn | 2006 €mn | 2007 €mn | 2006 €mn | 2007 €mn | 2006 €mn | |||||||||||||||||||||||||
| Operating profit | (46) | (97) | 36 | 23 | (178) | (285) | 67 | 31 | ||||||||||||||||||||||||
| Non-operating items | (61) | 169 | (13) | 15 | 451 | (48) | (14) | 21 | ||||||||||||||||||||||||
| Income before income taxes and minorities | (107) | 72 | 23 | 38 | 273 | (333) | 53 | 52 | ||||||||||||||||||||||||
| Net income | (1) | 151 | (7) | 32 | 362 | (96) | 10 | 40 | ||||||||||||||||||||||||
Holding Function
Operating profit
2007 to 2006 second quarter comparison
The operating loss decreased by €51 million to €46 million benefiting from higher current investment income and lower investment expenses. These positive effects were partly offset by increased administrative expenses driven by higher performance-based remuneration.
2007 to 2006 first half comparison
The operating loss was €178 million, down €107 million from a year ago. An increase in interest and similar income stemming from a higher asset base with at the same time lower investment expenses, more than compensated for the development of administrative expenses. These went up, primarily driven by higher performance-based remuneration expenses.
Non-operating items
2007 to 2006 second quarter comparison
Total non-operating items declined by €230 million to an aggregate loss of €61 million. Lower realized gains and losses as well as higher interest expenses from external debt, which reflect predominantly the interest expenses of €74 million for the bridge financing in connection with the acquisition of the AGF shares that Allianz did not already own, turned the non-operating result negative. Acquisition-related expenses of €52 million for the redemption of stock-based compensation plans from AGF had an additional impact on the non-operating result.
2007 to 2006 first half comparison
Due to exceptionally high realized gains in the first quarter, non-operating items amounted to an aggregate gain of €451 million, up €499 million on the prior year period. Furthermore, the effects described above impacted the development in the first half of 2007.
29
Table of Contents
Allianz Group Interim Report Second Quarter and First Half of 2007
Private Equity
Operating profit
2007 to 2006 second quarter comparison
Operating profit increased by €13 million to €36 million. Higher invested capital and lending to shareholders had a positive impact on interest and similar income, which accounted for most of the rise.
2007 to 2006 first half comparison
Compared to the previous year, operating profit more than doubled to €67 million. Besides the higher interest and similar income lower administrative expenses contributed to this development.
Non-operating items
2007 to 2006 second quarter comparison
Aggregate non-operating items showed a negative result of €13 million compared to a positive result of €15 million a year ago. Gains from the disposal of an interest swap and capital gains from the disposal of an investment that were realized in the prior year period were not repeated. Additionally, depreciation of €8 million contributed to this development.
2007 to 2006 first half comparison
The improvement in the operating profit was offset by negative non-operating items of a similar magnitude. The causes did not change materially from that in 2Q.
30
Table of Contents
| Group Management Report | ||||||
| Balance Sheet Review | ||||||
| Shareholders’ equity decreased due to dividend payments, higher interest rates and the net impact of the AGF transaction. | ||||||
Shareholders’ Equity
Shareholders’ equity1)
in€mn
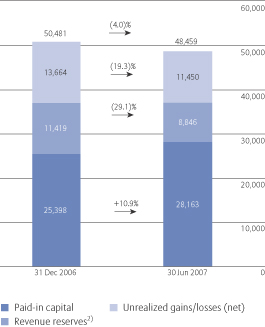
1) | Does not include minority interests of€3.3 bn as of June 30, 2007 and of€6.4 bn as of December 31, 2006. Please see Note 18 to the consolidated financial statements for further information. |
2) | Includes foreign currency translation adjustments. |
As of June 30, 2007, shareholders' equity was €48.5 billion, reflecting a decrease of 4.0% compared to year-end 2006. Our strong net income of €5.4 billion for the first half of 2007 could not fully compensate for various decreasing effects. The combined negative effect of €2.8 billion from transactions between equity holders resulted mainly from the minority buy-outs of AGF, Allianz Leben and in Taiwan. Thereof, the AGF transaction was the most significant with a net impact of minus €2.7 billion. Additionally, shareholders' equity was impacted by the dividend payment for fiscal year 2006 of €1.6 billion and increased unrealized losses of €0.6 billion resulting from the recent rise in interest rates.
Total Assets and Total Liabilities
Total assets and total liabilities increased by €57.9 billion and €63.1 billion, respectively. In the following sections we analyze important developments within the balance sheets of our Life/Health, Property-Casualty and Banking segments. Relative to the Allianz Group’s total assets and total liabilities, we consider the total assets and total liabilities from our Asset Management segment as immaterial and have, accordingly, excluded these assets and liabilities from the following discussion. Our Asset Management segment’s results of operations stem primarily from its business with third-party assets. Please see pages 24 and 25 for further information on the development of our third-party assets.
31
Table of Contents
Allianz Group Interim Report Second Quarter and First Half of 2007
Insurance Assets and Liabilities
Life/Health insurance operations
Life/Health asset base
fair values1) in€bn
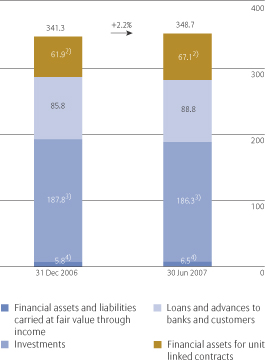
1) | Loans and advances to banks and customers, held-to-maturity investments, and real estate held for investment are stated at amortized cost. Investments in associates and joint ventures are stated at either amortized cost or equity, depending upon, among other factors, our ownership percentage. |
2) | Financial assets for unit-linked contracts represent assets owned by, and managed on the behalf of, policyholders of the Allianz Group, with all appreciation and depreciation in these assets accruing to the benefit of policyholders. As a result, the value of financial assets for unit-linked contracts in our balance sheet corresponds with the value of financial liabilities for unit-linked contracts. |
3) | Does not include affiliates at€2.9 bn and€2.8 bn as of June 30, 2007 and December 31, 2006, respectively. |
4) | Includes, in each case as of June 30, 2007 and December 31, 2006, respectively, debt securities at€9.0 bn and€7.3 bn, equity securities at€3.3 bn and€2.9 bn, and derivative financial instruments at€(5.7) bn and€(4.4) bn. |
As of June 30, 2007, reserves for insurance and investment contracts from the Life/Health segment amounted to €281.3 billion, up €2.5 billion from December 31, 2006. This development primarily stemmed from higher aggregate policy reserves for universal-life type insurance contracts. Compared to December 31, 2006, financial assets and liabilities for unit-linked contracts increased by 8.4% to €67.1 billion, reflecting our positive sales performance with regards to unit-linked insurance and investment contracts as well as market-related appreciation of our assets. In aggregate our Life/Health asset base improved to €348.7 billion, an increase of 2.2%.
Property-Casualty insurance operations
Property-Casualty asset base
fair values1) in€bn
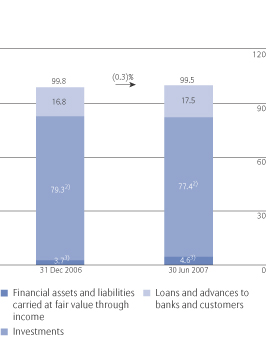
1) | Loans and advances to banks and customers, held-to-maturity investments, and real estate held for investment are stated at amortized cost. Investments in associates and joint ventures are stated at either amortized cost or equity, depending upon, among other factors, our ownership percentage. |
2) | Does not include affiliates at€9.7 bn and€9.5 bn as of June 30, 2007 and December 31, 2006, respectively. |
3) | Includes, in each case as of June 30, 2007 and December 31, 2006, respectively, debt securities at€4.1 bn and€3.2 bn, equity securities at€0.4 bn and€ 0.4 bn, and derivative financial instruments at€0.1 bn and€0.1 bn. |
32
Table of Contents
Group Management Report
The asset base of our Property-Casualty segment declined by €0.3 billion from year-end 2006 to €99.5 billion as of June 30, 2007. Reserves for loss and loss adjustment expenses, at €58.0 billion as of June 30, 2007, reflected a slight reduction of 1.2%, primarily due to the depreciation of the U.S Dollar compared to the Euro.
Banking Assets and Liabilities
Banking loans and advances to banks and customers
in€bn
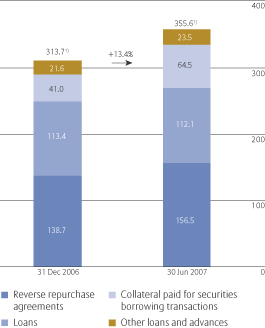
1) | Includes loan loss allowance at€(1.0) bn as of both June 30, 2007 and December 31, 2006, respectively. |
In our Banking segment, loans and advances to banks and customers were €355.6 million, up 13.4% as of June 30, 2007. This development was mainly driven by an increasing volume of the collateralized refinancing business of Dresdner Bank. Liabilities to banks and customers also recorded an increase, primarily in the form of repurchase agreements and collateral received from securities lending transactions.
33
Table of Contents
| Allianz Group Interim Report Second Quarter and First Half of 2007 | ||||||
| Other Information | ||||||
Reconciliation of Consolidated Operating Profit and Income before Income Taxes and Minority Interests in Earnings
The previous analysis is based on our consolidated financial statements and should be read in conjunction with those statements. The Allianz Group uses operating profit to evaluate the performance of its business segments and the Group as a whole. The Allianz Group considers the presentation of operating profit to be useful and meaningful to investors because it enhances the understanding of the Allianz Group’s underlying operating performance and the comparability of its operating performance over time. Operating profit highlights the portion of income before income taxes and minority interests in earnings attributable to the on-going core operations of the Allianz Group. To better understand the on-going operations of the business, we exclude the effects of acquisition-related expenses and the amortization of intangible assets, as these relate to business
combinations; and we exclude interest expense from external debt and income from financial assets and liabilities held for trading (relating to exchangeables on external debt) as these relate to our capital structure.
We believe that trends in the underlying profitability of our business can be more clearly identified without the fluctuating effects of the realized capital gains and losses or impairments of investment securities, as these are largely dependent on market cycles or issuer-specific events over which we have little or no control, and can and do vary, sometimes materially, across periods. Further, the timing of sales that would result in such gains or losses is largely at our discretion. Due to the non-recurring nature of restructuring charges we also exclude them in order to avoid distortions in the operating results of the underlying business.
Operating profit should be viewed as complementary to, and not a substitute for, income before income taxes and minority interests in earnings or net income as determined in accordance with IFRS.
The following table reconciles operating profit on a consolidated basis to the Allianz Group’s income before income taxes and minority interests in earnings.
| Three months ended June 30, | Six months ended June 30, | |||||||||||||||
2007 €mn | 2006 €mn | 2007 €mn | 2006 €mn | |||||||||||||
| Operating profit | 3,288 | 2,794 | 6,158 | 5,471 | ||||||||||||
| Realized gains/losses and impairments of investments (net) | 401 | 1,296 | 2,446 | 2,074 | ||||||||||||
| Income from financial assets and liabilities held for trading (net) | (37) | (75) | (3) | (154) | ||||||||||||
| Interest expense from external debt | (278) | (196) | (500) | (394) | ||||||||||||
| Restructuring charges | (12) | (404) | (39) | (408) | ||||||||||||
| Acquisition-related expenses | (135) | (132) | (257) | (270) | ||||||||||||
| Amortization of intangible assets | (4) | (5) | (7) | (10) | ||||||||||||
| Reclassification of policyholder participation in tax benefits arising in connection with tax-exempt income | (25) | (286) | (44) | (286) | ||||||||||||
| Income before income taxes and minority interests in earnings | 3,198 | 2,992 | 7,754 | 6,023 | ||||||||||||
34
Table of Contents
Group Management Report
Composition of Total Revenue Growth
We further believe that an understanding of our total revenue performance is enhanced when the effects of foreign currency translation as well as acquisitions and disposals (or “changes in scope of consolidation”) are excluded. Accordingly, in addition to presenting “nominal growth”, we also present “internal growth”,
which excludes the effects of foreign currency translation and changes in scope of consolidation. The following table sets forth the reconciliation of nominal total revenue growth to internal total revenue growth for each of our segments and the Allianz Group as a whole for the three and six months ended June 30, 2007, respectively.
Composition of total revenue1) growth
| Three months ended June 30, 2007 | Six months ended June 30, 2007 | |||||||||||||||||||||||||||||||
| Segment | Nominal | Changes in dation | Foreign currency translation | Internal growth | Nominal growth | Changes in dation | Foreign currency translation | Internal growth | ||||||||||||||||||||||||
| % | % | % | % | % | % | % | % | |||||||||||||||||||||||||
| Property-Casualty | 3.1 | 1.9 | (0.6) | 1.8 | 1.1 | 1.0 | (0.8) | 0.9 | ||||||||||||||||||||||||
| Life/Health | (1.5) | 0.1 | (1.9) | 0.3 | (2.7) | — | (1.8) | (0.9) | ||||||||||||||||||||||||
| Banking | 8.4 | — | (0.9) | 9.3 | 8.1 | — | (0.6) | 8.7 | ||||||||||||||||||||||||
thereof: Dresdner Bank | 8.7 | — | (0.9) | 9.6 | 8.0 | — | (0.6) | 8.6 | ||||||||||||||||||||||||
| Asset Management | 9.8 | (0.7) | (5.8) | 16.3 | 6.8 | (0.7) | (6.2) | 13.7 | ||||||||||||||||||||||||
thereof: Allianz Global Investors | 8.5 | — | (5.7) | 14.2 | 5.7 | — | (6.3) | 12.0 | ||||||||||||||||||||||||
| Allianz Group | 1.1 | 0.7 | (1.3) | 1.7 | (0.1) | 0.4 | (1.4) | 0.9 | ||||||||||||||||||||||||
1) | Total revenues comprise Property-Casualty segment’s gross premiums written, Life/Health segment’s statutory premiums, Banking segment’s operating revenues and Asset Management segment’s operating revenues. Segment growth rates are presented before the elimination of transactions between Allianz Group companies in different segments. |
35
Table of Contents
Allianz Group Interim Report Second Quarter and First Half of 2007
36
Table of Contents
Consolidated Financial Statements
Contents
Table of Contents
Allianz Group Interim Report Second Quarter and First Half of 2007
As of June 30, 2007 and as of December 31, 2006
| Note | As of June 30, 2007 €mn | As of €mn | ||||||||||
| ASSETS | ||||||||||||
| Cash and cash equivalents | 32,927 | 33,031 | ||||||||||
| Financial assets carried at fair value through income | 4 | 166,774 | 156,869 | |||||||||
| Investments | 5 | 293,491 | 298,134 | |||||||||
| Loans and advances to banks and customers | 6 | 452,961 | 408,278 | |||||||||
| Financial assets for unit linked contracts | 67,058 | 61,864 | ||||||||||
| Reinsurance assets | 7 | 18,012 | 19,360 | |||||||||
| Deferred acquisition costs | 8 | 20,401 | 19,135 | |||||||||
| Deferred tax assets | 4,639 | 4,727 | ||||||||||
| Other assets | 9 | 41,430 | 38,893 | |||||||||
| Intangible assets | 10 | 13,452 | 12,935 | |||||||||
| Total assets | 1,111,145 | 1,053,226 |
| Note | As of June 30, 2007 €mn | As of €mn | ||||||||||
| LIABILITIES AND EQUITY | ||||||||||||
| Financial liabilities carried at fair value through income | 11 | 96,861 | 79,699 | |||||||||
| Liabilities to banks and customers | 12 | 398,010 | 361,078 | |||||||||
| Unearned premiums | 17,776 | 14,868 | ||||||||||
| Reserves for loss and loss adjustment expenses | 13 | 64,824 | 65,464 | |||||||||
| Reserves for insurance and investment contracts | 14 | 290,276 | 287,697 | |||||||||
| Financial liabilities for unit linked contracts | 67,058 | 61,864 | ||||||||||
| Deferred tax liabilities | 4,263 | 4,618 | ||||||||||
| Other liabilities | 15 | 49,096 | 49,764 | |||||||||
| Certificated liabilities | 16 | 56,148 | 54,922 | |||||||||
| Participation certificates and subordinated liabilities | 17 | 15,086 | 16,362 | |||||||||
| Total liabilities | 1,059,398 | 996,336 | ||||||||||
| Shareholders’ equity | 48,459 | 50,481 | ||||||||||
| Minority interests | 3,288 | 6,409 | ||||||||||
| Total equity | 18 | 51,747 | 56,890 | |||||||||
| Total liabilities and equity | 1,111,145 | 1,053,226 |
38
Table of Contents
Consolidated Financial Statements
Consolidated Income Statements
For the three months and six months ended June 30, 2007 and 2006
| Three months ended June 30, | Six months ended June 30, | |||||||||||||||||||
| Note | 2007 €mn | 2006 €mn | 2007 €mn | 2006 €mn | ||||||||||||||||
| Premiums written | 14,833 | 14,736 | 34,336 | 34,224 | ||||||||||||||||
| Ceded premiums written | (1,415) | (1,439) | (3,176) | (3,336) | ||||||||||||||||
| Change in unearned premiums | 921 | 829 | (2,278) | (2,342) | ||||||||||||||||
| Premiums earned (net) | 19 | 14,339 | 14,126 | 28,882 | 28,546 | |||||||||||||||
| Interest and similar income | 20 | 7,316 | 6,559 | 13,582 | 12,242 | |||||||||||||||
| Income from financial assets and liabilities carried at fair value through income (net) | 21 | (343) | 63 | (228) | 563 | |||||||||||||||
| Realized gains/losses (net) | 22 | 1,088 | 2,337 | 4,297 | 4,232 | |||||||||||||||
| Fee and commission income | 23 | 2,322 | 2,162 | 4,678 | 4,414 | |||||||||||||||
| Other income | 24 | 6 | 17 | 99 | 56 | |||||||||||||||
| Income from fully consolidated private equity investments | 25 | 470 | 169 | 941 | 328 | |||||||||||||||
| Total income | 25,198 | 25,433 | 52,251 | 50,381 | ||||||||||||||||
| Claims and insurance benefits incurred (gross) | (11,421) | (10,839) | (23,468) | (22,674) | ||||||||||||||||
| Claims and Insurance benefits incurred (ceded) | 997 | 646 | 1,959 | 1,606 | ||||||||||||||||
| Claims and insurance benefits incurred (net) | 26 | (10,424) | (10,193) | (21,509) | (21,068) | |||||||||||||||
| Changes in reserves for insurance and investment contracts (net) | 27 | (2,332) | (3,358) | (5,068) | (6,070) | |||||||||||||||
| Interest expense | 28 | (1,841) | (1,284) | (3,439) | (2,849) | |||||||||||||||
| Loan loss provisions | 29 | (74) | (8) | (72) | 24 | |||||||||||||||
| Impairments of investments (net) | 30 | (102) | (307) | (169) | (362) | |||||||||||||||
| Investment expenses | 31 | (202) | (299) | (463) | (482) | |||||||||||||||
| Acquisition and administrative expenses (net) | 32 | (5,950) | (5,718) | (11,588) | (11,527) | |||||||||||||||
| Fee and commission expenses | 33 | (601) | (607) | (1,235) | (1,185) | |||||||||||||||
| Amortization of intangible assets | (4) | (5) | (7) | (10) | ||||||||||||||||
| Restructuring charges | (14) | (522) | (44) | (526) | ||||||||||||||||
| Other expenses | 34 | — | 12 | 13 | 11 | |||||||||||||||
| Expenses from fully consolidated private equity investments | 35 | (456) | (152) | (916) | (314) | |||||||||||||||
| Total expenses | (22,000) | (22,441) | (44,497) | (44,358) | ||||||||||||||||
| Income before income taxes and minority interests in earnings | 3,198 | 2,992 | 7,754 | 6,023 | ||||||||||||||||
| Income taxes | 36 | (858) | (357) | (1,825) | (1,256) | |||||||||||||||
| Minority interests in earnings | (200) | (356) | (549) | (709) | ||||||||||||||||
| Net income | 2,140 | 2,279 | 5,380 | 4,058 | ||||||||||||||||
| Three months ended June 30, | Six months ended June 30, | |||||||||||||||||||
| Note | 2007 € | 2006 € | 2007 € | 2006 € | ||||||||||||||||
| Basic earnings per share | 37 | 4.85 | 5.62 | 12.32 | 10.02 | |||||||||||||||
| Diluted earnings per share | 37 | 4.75 | 5.51 | 12.08 | 9.83 | |||||||||||||||
39
Table of Contents
Allianz Group Interim Report Second Quarter and First Half of 2007
Consolidated Statements of Changes in Equity
For the six months ended June 30, 2007 and 2006
Paid-in capital | Revenue | Foreign currency translation adjustments | Unrealized gains and losses (net) | Shareholders’ equity | Minority interests | Total equity | ||||||||||||||||||||||||||
| €mn | €mn | €mn | €mn | €mn | €mn | €mn | ||||||||||||||||||||||||||
| Balance as of December 31, 2005 | 21,616 | 8,579 | (1,032) | 10,324 | 39,487 | 7,615 | 47,102 | |||||||||||||||||||||||||
| Foreign currency translation adjustments | — | — | (894) | (7) | (901) | (215) | (1,116) | |||||||||||||||||||||||||
| Available-for-sale investments | ||||||||||||||||||||||||||||||||
Unrealized gains and losses (net) arising during the period | — | — | — | (939) | (939) | (412) | (1,351) | |||||||||||||||||||||||||
Transferred to net income on disposal | — | — | — | (1,484) | (1,484) | (117) | (1,601) | |||||||||||||||||||||||||
| Cash flow hedges | — | — | — | (32) | (32) | (1) | (33) | |||||||||||||||||||||||||
| Miscellaneous | — | (347) | — | — | (347) | 14 | (333) | |||||||||||||||||||||||||
| Total income and expense recognized directly in shareholders’ equity | — | (347) | (894) | (2,462) | (3,703) | (731) | (4,434) | |||||||||||||||||||||||||
| Net income | — | 4,058 | — | — | 4,058 | 709 | 4,767 | |||||||||||||||||||||||||
| Total recognized income and expense for the period | — | 3,711 | (894) | (2,462) | 355 | (22) | 333 | |||||||||||||||||||||||||
| Treasury shares | — | 1,275 | — | — | 1,275 | — | 1,275 | |||||||||||||||||||||||||
| Transactions between equity holders | — | 25 | (4) | (4) | 17 | 9 | 26 | |||||||||||||||||||||||||
| Dividends paid | — | (811) | — | — | (811) | (596) | (1,407) | |||||||||||||||||||||||||
| Balance as of June 30, 2006 | 21,616 | 12,779 | (1,930) | 7,858 | 40,323 | 7,006 | 47,329 | |||||||||||||||||||||||||
| Balance as of December 31, 2006 | 25,398 | 13,629 | (2,210) | 13,664 | 50,481 | 6,409 | 56,890 | |||||||||||||||||||||||||
| Foreign currency translation adjustments | — | — | (262) | (7) | (269) | (42) | (311) | |||||||||||||||||||||||||
| Available-for-sale investments | ||||||||||||||||||||||||||||||||
Unrealized gains and losses (net) arising during the period | — | — | — | (559) | (559) | (52) | (611) | |||||||||||||||||||||||||
Transferred to net income on disposal | — | — | — | (2,202) | (2,202) | (97) | (2,299) | |||||||||||||||||||||||||
| Cash flow hedges | — | — | — | (9) | (9) | — | (9) | |||||||||||||||||||||||||
| Miscellaneous | — | (136) | — | — | (136) | 9 | (127) | |||||||||||||||||||||||||
| Total income and expense recognized directly in shareholders’ equity | — | (136) | (262) | (2,777) | (3,175) | (182) | (3,357) | |||||||||||||||||||||||||
| Net income | — | 5,380 | — | — | 5,380 | 549 | 5,929 | |||||||||||||||||||||||||
| Total recognized income and expense for the period | — | 5,244 | (262) | (2,777) | 2,205 | 367 | 2,572 | |||||||||||||||||||||||||
| Treasury shares | — | 200 | — | — | 200 | — | 200 | |||||||||||||||||||||||||
| Transactions between equity holders | 2,765 | (6,051) | (62) | 563 | (2,785) | (3,242) | (6,027) | |||||||||||||||||||||||||
| Dividends paid | — | (1,642) | — | — | (1,642) | (246) | (1,888) | |||||||||||||||||||||||||
| Balance as of June 30, 2007 | 28,163 | 11,380 | (2,534) | 11,450 | 48,459 | 3,288 | 51,747 |
40
Table of Contents
Consolidated Financial Statements
Consolidated Statements of Cash Flows
For the six months ended June 30, 2007 and 2006
| Six months ended June 30, | 2007 €mn | 2006 €mn | ||||||
| Cash flow from operating activities: | ||||||||
| Net income | 5,380 | 4,058 | ||||||
| Adjustments to reconcile net income to net cash flow provided by (used in) operating activities: | ||||||||
Minority interests in earnings | 549 | 709 | ||||||
Share of earnings from investments in associates and joint ventures | (331) | (122) | ||||||
Realized gains/losses (net) and impairments of investments (net) of: | ||||||||
Available-for-sale and held-to-maturity investments, investments in associates and joint ventures, real estate held for investment, loans to banks and customers | (4,128) | (3,870) | ||||||
Other investments, mainly financial assets held for trading and designated at fair value through income | 449 | (24) | ||||||
Depreciation and amortization | 419 | 324 | ||||||
Loan loss provision | 72 | (24) | ||||||
Interest credited to policyholder accounts | 1,268 | 2,070 | ||||||
Net change in: | ||||||||
Financial assets and liabilities held for trading | 10,266 | 15,678 | ||||||
Reverse repurchase agreements and collateral paid for securities borrowing transactions | (41,316) | (44,047) | ||||||
Repurchase agreements and collateral received from securities lending transactions | 34,231 | 28,483 | ||||||
Reinsurance assets | (50) | (117) | ||||||
Deferred acquisition costs | (905) | (995) | ||||||
Unearned premiums | 2,610 | 2,626 | ||||||
Reserves for losses and loss adjustment expenses | (394) | (147) | ||||||
Reserves for insurance and investment contracts | 3,389 | 4,262 | ||||||
Deferred tax assets/liabilities | 435 | 71 | ||||||
Other (net) | (1,392) | 27 | ||||||
| Net cash flow provided by operating activities | 10,552 | 8,962 | ||||||
| Cash flow from investing activities: | ||||||||
| Net change in: | ||||||||
Financial assets designated at fair value through income | (2,869) | (1,397) | ||||||
Available-for-sale investments | (944) | (7,710) | ||||||
Held-to-maturity investments | 4 | 30 | ||||||
Investments in associates and joint ventures | 189 | (72) | ||||||
Non-current assets and disposal groups held for sale | 3 | 1,397 | ||||||
Real estate held for investment | 339 | 653 | ||||||
Loans and advances to banks and customers | (3,528) | (13,410) | ||||||
Property and equipment | (120) | (514) | ||||||
| Acquisition of subsidiaries, net of cash acquired | (507) | — | ||||||
| Other (net) | 172 | (21) | ||||||
| Net cash flow used in investing activities | (7,261) | (21,044) | ||||||
| Cash flow from financing activities: | ||||||||
| Net change in: | ||||||||
Policyholders’ accounts | 1,048 | 2,822 | ||||||
Liabilities to banks and customers | 2,750 | 10,861 | ||||||
Certificated liabilities, participation certificates and subordinated liabilities | 853 | (1,875) | ||||||
| Transactions between equity holders | (6,027) | (70) | ||||||
| Dividends paid to shareholders | (1,888) | (1,407) | ||||||
| Net cash from sale or purchase of treasury shares | (290) | (279) | ||||||
| Other (net) | 187 | 460 | ||||||
| Net cash flow provided by (used in) financing activities | (3,367) | 10,512 | ||||||
| Effect of exchange rate changes on cash and cash equivalents | (28) | (61) | ||||||
| Change in cash and cash equivalents | (104) | (1,631) | ||||||
| Cash and cash equivalents at beginning of period | 33,031 | 31,647 | ||||||
| Cash and cash equivalents at end of period | 32,927 | 30,016 |
41
Table of Contents
Allianz Group Interim Report Second Quarter and First Half of 2007
[THIS PAGE INTENTIONALLY LEFT BLANK]
42
Table of Contents
Notes to the Consolidated Financial Statements
Notes to the Consolidated Financial Statements
The consolidated interim financial statements of the Allianz Group have been prepared using accounting policies consistent with International Financial Reporting Standards (“IFRS”) and in accordance with the requirements of IAS 34, Interim Financial Reporting, as published by the International Accounting Standard Board (“IASB”) and as endorsed by the European Union (“EU”).
The consolidated interim financial statements comply with all new or amended IFRSs, where application is compulsory for the first time for periods beginning on January 1, 2007. For existing and unchanged IFRSs the accounting policies for recognition, measurement, consolidation and presentation applied in the preparation of the consolidated interim financial statements are consistent with the accounting policies, that have been applied in the preparation of the consolidated financial statements for the year ended December 31, 2006.
IFRS does not provide specific guidance concerning all aspects of the recognition and measurement of insurance and reinsurance contracts. Therefore, as envisioned in IAS 8, Accounting Policies, Changes in Accounting Estimates and Errors, the provisions embodied under
accounting principles generally accepted in the United States of America (“US GAAP”) have been applied to those aspects where specific guidance is not provided by IFRS 4, Insurance Contracts.
IFRS 7, Financial Instruments: Disclosures, is applicable for annual periods beginning January 1, 2007. IFRS 7 requires extended disclosures about the significance of financial instruments and the nature and extent of risks arising from financial instruments. Simultaneously with the development of IFRS 7, the IASB amended IAS 1, Presentation of Financial Statements, to add disclosures about capital management and capital requirements. The new requirements of IFRS 7 and IAS 1 will be of significance for the consolidated financial statements for the year ended December 31, 2007.
The consolidated financial statements are presented in millions of Euro (€ mn).
2 Changes in the presentation of the consolidated financial statements
Reclassifications
Beginning with the third quarter of 2006, income from fully consolidated private equity investments and expenses from fully consolidated private equity investments have been included as separate line items in the consolidated income statements. Accordingly, the prior period income statement has been reclassified to conform to the current period presentation.
A summary of the impact of these changes on the consolidated income statements for the three and six months ended June 30, 2006 is as follows:
Three months ended June 30, 2006 as previously | Reclassifi-
| Three months ended June 30, 2006 | Six months June 30, 2006 as previously | Reclassifi- cations | Six months ended June 30, 2006 | |||||||||||||||||||
| €mn | €mn | €mn | €mn | €mn | €mn | |||||||||||||||||||
| Interest and similar income | 6,576 | (17) | 6,559 | 12,267 | (25) | 12,242 | ||||||||||||||||||
| Fee and commission income | 2,314 | (152) | 2,162 | 4,717 | (303) | 4,414 | ||||||||||||||||||
| Income from fully consolidated private equity investments | — | 169 | 169 | — | 328 | 328 | ||||||||||||||||||
| Interest expense | (1,299) | 15 | (1,284) | (2,899) | 50 | (2,849) | ||||||||||||||||||
Acquisition costs and administrative expenses (net) | (5,791) | 25 | (5,766) | (11,634) | 42 | (11,592) | ||||||||||||||||||
| Fee and commission expenses | (719) | 112 | (607) | (1,407) | 222 | (1,185) | ||||||||||||||||||
| Expenses from fully consolidated private equity investments | — | (152) | (152) | — | (314) | (314) | ||||||||||||||||||
Additionally, certain immaterial amounts of unearned premiums were previously netted against deferred acquisition costs in the consolidated balance sheets and
against the related amortization account in the consolidated income statements. All periods have now been presented on a gross basis.
43
Table of Contents
Allianz Group Interim Report Second Quarter and First Half of 2007
Business Segment Information – Consolidated Balance Sheets
As of June 30, 2007 and as of December 31, 2006
| Property-Casualty | Life/Health | Banking | ||||||||||||||||||||||||
As of June 30, 2007 €mn | As of December 31, €mn | As of June 30, 2007 €mn | As of December 31, €mn | As of June 30, 2007 €mn | As of December 31, €mn | |||||||||||||||||||||
| ASSETS | ||||||||||||||||||||||||||
| Cash and cash equivalents | 5,345 | 4,100 | 9,652 | 6,998 | 16,390 | 21,528 | ||||||||||||||||||||
| Financial assets carried at fair value through income | 4,709 | 4,814 | 13,094 | 11,026 | 147,604 | 139,505 | ||||||||||||||||||||
| Investments | 87,070 | 88,819 | 189,166 | 190,607 | 17,738 | 17,803 | ||||||||||||||||||||
| Loans and advances to banks and customers | 17,462 | 16,825 | 88,794 | 85,769 | 355,609 | 313,709 | ||||||||||||||||||||
| Financial assets for unit linked contracts | — | — | 67,058 | 61,864 | — | — | ||||||||||||||||||||
| Reinsurance assets | 11,409 | 11,437 | 6,641 | 7,966 | — | — | ||||||||||||||||||||
| Deferred acquisition costs | 4,001 | 3,704 | 16,347 | 15,381 | — | — | ||||||||||||||||||||
| Deferred tax assets | 1,676 | 1,651 | 583 | 503 | 1,750 | 1,679 | ||||||||||||||||||||
| Other assets | 21,119 | 17,737 | 14,828 | 12,891 | 9,652 | 9,571 | ||||||||||||||||||||
| Intangible assets | 2,253 | 1,653 | 2,396 | 2,399 | 2,285 | 2,285 | ||||||||||||||||||||
| Total assets | 155,044 | 150,740 | 408,559 | 395,404 | 551,028 | 506,080 | ||||||||||||||||||||
| Property-Casualty | Life/Health | Banking | ||||||||||||||||||||||||
As of June 30, 2007 €mn | As of 2006 €mn | As of June 30, 2007 €mn | As of December 31, €mn | As of June 30, 2007 €mn | As of December 31, €mn | |||||||||||||||||||||
| LIABILITIES AND EQUITY | ||||||||||||||||||||||||||
| Financial liabilities carried at fair value through income | 86 | 1,070 | 6,561 | 5,251 | 89,586 | 72,215 | ||||||||||||||||||||
| Liabilities to banks and customers | 5,906 | 4,473 | 10,477 | 7,446 | 377,577 | 350,148 | ||||||||||||||||||||
| Unearned premiums | 15,834 | 12,994 | 1,943 | 1,874 | — | — | ||||||||||||||||||||
| Reserves for loss and loss adjustment expenses | 57,966 | 58,664 | 6,857 | 6,804 | — | — | ||||||||||||||||||||
| Reserves for insurance and investment contracts | 9,042 | 8,956 | 281,250 | 278,701 | — | — | ||||||||||||||||||||
| Financial liabilities for unit linked contracts | — | — | 67,058 | 61,864 | — | — | ||||||||||||||||||||
| Deferred tax liabilities | 3,393 | 3,902 | 1,206 | 1,181 | 70 | 83 | ||||||||||||||||||||
| Other liabilities | 19,439 | 18,699 | 17,211 | 16,314 | 11,395 | 12,140 | ||||||||||||||||||||
| Certificated liabilities | 57 | 657 | 433 | 3 | 47,350 | 46,191 | ||||||||||||||||||||
| Participation certificates and subordinated liabilities | 1,608 | 1,605 | 66 | 66 | 7,187 | 8,456 | ||||||||||||||||||||
| Total liabilities | 113,331 | 111,020 | 393,062 | 379,504 | 533,165 | 489,233 | ||||||||||||||||||||
44
Table of Contents
Notes to the Consolidated Financial Statements
| Asset Management | Corporate | Consolidation | Group | |||||||||||||||||||||||||||
As of June 30, 2007 €mn | As of December 31, €mn | As of June 30, 2007 €mn | As of December 31, €mn | As of June 30, 2007 €mn | As of December 31, €mn | As of June 30, 2007 €mn | As of December 31, €mn | |||||||||||||||||||||||
| 612 | 767 | 1,800 | 536 | (872) | (898) | 32,927 | 33,031 | |||||||||||||||||||||||
| 1,069 | 985 | 973 | 1,158 | (675) | (619) | 166,774 | 156,869 | |||||||||||||||||||||||
| 680 | 774 | 104,607 | 96,652 | (105,770) | (96,521) | 293,491 | 298,134 | |||||||||||||||||||||||
| 638 | 367 | 4,273 | 2,963 | (13,815) | (11,355) | 452,961 | 408,278 | |||||||||||||||||||||||
| — | — | — | — | — | — | 67,058 | 61,864 | |||||||||||||||||||||||
| — | — | — | — | (38) | (43) | 18,012 | 19,360 | |||||||||||||||||||||||
| 53 | 50 | — | — | — | — | 20,401 | 19,135 | |||||||||||||||||||||||
| 185 | 196 | 1,034 | 1,473 | (589) | (775) | 4,639 | 4,727 | |||||||||||||||||||||||
| 3,471 | 3,471 | 4,930 | 7,020 | (12,570) | (11,797) | 41,430 | 38,893 | |||||||||||||||||||||||
| 6,259 | 6,334 | 259 | 264 | — | — | 13,452 | 12,935 | |||||||||||||||||||||||
| 12,967 | 12,944 | 117,876 | 110,066 | (134,329) | (122,008) | 1,111,145 | 1,053,226 | |||||||||||||||||||||||
| Asset Management | Corporate | Consolidation | Group | |||||||||||||||||||||||||||
As of June 30, 2007 €mn | As of December 31, €mn | As of June 30, 2007 €mn | As of December 31, €mn | As of June 30, 2007 €mn | As of December 31, €mn | As of June 30, 2007 €mn | As of December 31, €mn | |||||||||||||||||||||||
| — | — | 1,160 | 1,713 | (532) | (550) | 96,861 | 79,699 | |||||||||||||||||||||||
| 778 | 605 | 13,313 | 7,293 | (10,041) | (8,887) | 398,010 | 361,078 | |||||||||||||||||||||||
| — | — | — | — | (1) | — | 17,776 | 14,868 | |||||||||||||||||||||||
| — | — | — | — | 1 | (4) | 64,824 | 65,464 | |||||||||||||||||||||||
| — | — | 249 | 306 | (265) | (266) | 290,276 | 287,697 | |||||||||||||||||||||||
| — | — | — | — | — | — | 67,058 | 61,864 | |||||||||||||||||||||||
| 43 | 46 | 133 | 171 | (582) | (765) | 4,263 | 4,618 | |||||||||||||||||||||||
| 3,608 | 3,689 | 14,024 | 14,149 | (16,581) | (15,227) | 49,096 | 49,764 | |||||||||||||||||||||||
| — | — | 9,509 | 9,265 | (1,201) | (1,194) | 56,148 | 54,922 | |||||||||||||||||||||||
| — | — | 7,094 | 7,099 | (869) | (864) | 15,086 | 16,362 | |||||||||||||||||||||||
| 4,429 | 4,340 | 45,482 | 39,996 | (30,071) | (27,757) | 1,059,398 | 996,336 | |||||||||||||||||||||||
| Total equity | 51,747 | 56,890 | ||||||||||||||||||||||||||||
| Total liabilities and equity | 1,111,145 | 1,053,226 | ||||||||||||||||||||||||||||
45
Table of Contents
Allianz Group Interim Report Second Quarter and First Half of 2007
Business Segment Information – Consolidated Income Statements
For the three months ended June 30, 2007 and 2006
| Property-Casualty | Life/Health | Banking | ||||||||||||||||||||||||
Three months ended June 30, | 2007 €mn | 2006 €mn | 2007 €mn | 2006 €mn | 2007 €mn | 2006 €mn | ||||||||||||||||||||
| Premiums written | 9,982 | 9,682 | 4,856 | 5,053 | — | — | ||||||||||||||||||||
| Ceded premiums written | (1,245) | (1,230) | (175) | (208) | — | — | ||||||||||||||||||||
| Change in unearned premiums | 919 | 906 | 2 | (77) | — | — | ||||||||||||||||||||
| Premiums earned (net) | 9,656 | 9,358 | 4,683 | 4,768 | — | — | ||||||||||||||||||||
| Interest and similar income | 1,380 | 1,257 | 3,783 | 3,698 | 2,214 | 1,630 | ||||||||||||||||||||
| Income from financial assets and liabilities carried at fair value through income (net) | (2) | 5 | (669) | (216) | 354 | 326 | ||||||||||||||||||||
| Realized gains/losses (net) | 217 | 889 | 663 | 974 | 51 | 32 | ||||||||||||||||||||
| Fee and commission income | 280 | 265 | 164 | 162 | 923 | 868 | ||||||||||||||||||||
| Other income | 11 | 24 | 9 | 7 | — | — | ||||||||||||||||||||
| Income from fully consolidated private equity investments | — | — | — | — | — | — | ||||||||||||||||||||
| Total income | 11,542 | 11,798 | 8,633 | 9,393 | 3,542 | 2,856 | ||||||||||||||||||||
| Claims and insurance benefits incurred (gross) | (7,093) | (6,554) | (4,336) | (4,293) | — | — | ||||||||||||||||||||
| Claims and insurance benefits incurred (ceded) | 827 | 464 | 178 | 190 | — | — | ||||||||||||||||||||
| Claims and insurance benefits incurred (net) | (6,266) | (6,090) | (4,158) | (4,103) | — | — | ||||||||||||||||||||
| Changes in reserves for insurance and investment contracts (net) | (97) | (121) | (2,211) | (2,950) | — | — | ||||||||||||||||||||
| Interest expense | (92) | (66) | (111) | (73) | (1,484) | (978) | ||||||||||||||||||||
| Loan loss provisions | (9) | (2) | — | 1 | (65) | (7) | ||||||||||||||||||||
| Impairments of investments (net) | (28) | (93) | (56) | (210) | (9) | (12) | ||||||||||||||||||||
| Investment expenses | (69) | (67) | (163) | (211) | (4) | (10) | ||||||||||||||||||||
| Acquisition and administrative expenses (net) | (2,705) | (2,511) | (1,115) | (1,105) | (1,334) | (1,436) | ||||||||||||||||||||
| Fee and commission expenses | (190) | (205) | (43) | (70) | (157) | (140) | ||||||||||||||||||||
| Amortization of intangible assets | (4) | (3) | — | (1) | — | (1) | ||||||||||||||||||||
| Restructuring charges | (8) | (354) | (3) | (161) | (3) | (7) | ||||||||||||||||||||
| Other expenses | — | (1) | — | — | 1 | 13 | ||||||||||||||||||||
| Expenses from fully consolidated private equity investments | — | — | — | — | — | — | ||||||||||||||||||||
| Total expenses | (9,468) | (9,513) | (7,860) | (8,883) | (3,055) | (2,578) | ||||||||||||||||||||
| Income before income taxes and minority interests in earnings | 2,074 | 2,285 | 773 | 510 | 487 | 278 | ||||||||||||||||||||
| Income taxes | (578) | (466) | (234) | (90) | (56) | (89) | ||||||||||||||||||||
| Minority interests in earnings | (116) | (237) | (60) | (92) | (20) | (27) | ||||||||||||||||||||
| Net income | 1,380 | 1,582 | 479 | 328 | 411 | 162 | ||||||||||||||||||||
46
Table of Contents
Notes to the Consolidated Financial Statements
| Asset Management | Corporate | Consolidation | Group | |||||||||||||||||||||||||||
2007 €mn | 2006 €mn | 2007 €mn | 2006 €mn | 2007 €mn | 2006 €mn | 2007 €mn | 2006 €mn | |||||||||||||||||||||||
| — | — | — | — | (5) | 1 | 14,833 | 14,736 | |||||||||||||||||||||||
| — | — | — | — | 5 | (1) | (1,415) | (1,439) | |||||||||||||||||||||||
| — | — | — | — | — | — | 921 | 829 | |||||||||||||||||||||||
| — | — | — | — | — | — | 14,339 | 14,126 | |||||||||||||||||||||||
| 33 | 25 | 245 | 215 | (339) | (266) | 7,316 | 6,559 | |||||||||||||||||||||||
| 16 | (2) | (44) | (56) | 2 | 6 | (343) | 63 | |||||||||||||||||||||||
| 1 | (1) | 348 | 427 | (192) | 16 | 1,088 | 2,337 | |||||||||||||||||||||||
| 1,080 | 1,030 | 44 | 38 | (169) | (201) | 2,322 | 2,162 | |||||||||||||||||||||||
| 3 | 3 | 9 | 4 | (26) | (21) | 6 | 17 | |||||||||||||||||||||||
| — | — | 470 | 169 | — | — | 470 | 169 | |||||||||||||||||||||||
| 1,133 | 1,055 | 1,072 | 797 | (724) | (466) | 25,198 | 25,433 | |||||||||||||||||||||||
— | — | — | — | 8 | 8 | (11,421) | (10,839) | |||||||||||||||||||||||
— | — | — | — | (8) | (8) | 997 | 646 | |||||||||||||||||||||||
| — | — | — | — | — | — | (10,424) | (10,193) | |||||||||||||||||||||||
| — | — | — | — | (24) | (287) | (2,332) | (3,358) | |||||||||||||||||||||||
| (19) | (12) | (394) | (323) | 259 | 168 | (1,841) | (1,284) | |||||||||||||||||||||||
| — | — | — | — | — | — | (74) | (8) | |||||||||||||||||||||||
| — | (1) | (9) | 9 | — | — | (102) | (307) | |||||||||||||||||||||||
| (1) | — | (20) | (60) | 55 | 49 | (202) | (299) | |||||||||||||||||||||||
| (555) | (561) | (251) | (142) | 10 | 37 | (5,950) | (5,718) | |||||||||||||||||||||||
| (315) | (318) | (26) | (19) | 130 | 145 | (601) | (607) | |||||||||||||||||||||||
| — | — | — | — | — | — | (4) | (5) | |||||||||||||||||||||||
| — | — | — | — | — | — | (14) | (522) | |||||||||||||||||||||||
| — | — | — | — | (1) | — | — | 12 | |||||||||||||||||||||||
| — | — | (456) | (152) | — | — | (456) | (152) | |||||||||||||||||||||||
| (890) | (892) | (1,156) | (687) | 429 | 112 | (22,000) | (22,441) | |||||||||||||||||||||||
| 243 | 163 | (84) | 110 | (295) | (354) | 3,198 | 2,992 | |||||||||||||||||||||||
| (101) | (62) | 80 | 80 | 31 | 270 | (858) | (357) | |||||||||||||||||||||||
| (8) | (11) | (4) | (7) | 8 | 18 | (200) | (356) | |||||||||||||||||||||||
| 134 | 90 | (8) | 183 | (256) | (66) | 2,140 | 2,279 | |||||||||||||||||||||||
47
Table of Contents
Allianz Group Interim Report Second Quarter and First Half of 2007
Business Segment Information – Consolidated Income Statements
For the six months ended June 30, 2007 and 2006
| Property-Casualty | Life/Health | Banking | ||||||||||||||||||||||||
Six months ended June 30, | 2007 €mn | 2006 €mn | 2007 €mn | 2006 €mn | 2007 €mn | 2006 €mn | ||||||||||||||||||||
| Premiums written | 24,093 | 23,831 | 10,251 | 10,397 | — | — | ||||||||||||||||||||
| Ceded premiums written | (2,831) | (2,942) | (353) | (398) | — | — | ||||||||||||||||||||
| Change in unearned premiums | (2,248) | (2,190) | (30) | (152) | — | — | ||||||||||||||||||||
| Premiums earned (net) | 19,014 | 18,699 | 9,868 | 9,847 | — | — | ||||||||||||||||||||
| Interest and similar income | 2,386 | 2,179 | 6,938 | 6,745 | 4,423 | 3,510 | ||||||||||||||||||||
| Income from financial assets and liabilities carried at fair value through income (net) | (14) | 45 | (979) | (185) | 695 | 816 | ||||||||||||||||||||
| Realized gains/losses (net) | 984 | 1,353 | 1,856 | 2,236 | 190 | 446 | ||||||||||||||||||||
| Fee and commission income | 552 | 517 | 335 | 291 | 1,901 | 1,860 | ||||||||||||||||||||
| Other income | 95 | 38 | 63 | 13 | — | 25 | ||||||||||||||||||||
| Income from fully consolidated private equity investments | — | — | — | — | — | — | ||||||||||||||||||||
| Total income | 23,017 | 22,831 | 18,081 | 18,947 | 7,209 | 6,657 | ||||||||||||||||||||
| Claims and insurance benefits incurred (gross) | (14,267) | (13,522) | (9,214) | (9,163) | — | — | ||||||||||||||||||||
| Claims and insurance benefits incurred (ceded) | 1,618 | 1,250 | 354 | 367 | — | — | ||||||||||||||||||||
| Claims and insurance benefits incurred (net) | (12,649) | (12,272) | (8,860) | (8,796) | — | — | ||||||||||||||||||||
| Changes in reserves for insurance and investment contracts (net) | (178) | (193) | (4,835) | (5,598) | — | — | ||||||||||||||||||||
| Interest expense | (184) | (129) | (202) | (137) | (2,765) | (2,257) | ||||||||||||||||||||
| Loan loss provisions | (9) | (3) | (3) | 1 | (60) | 26 | ||||||||||||||||||||
| Impairments of investments (net) | (54) | (106) | (93) | (245) | (22) | (32) | ||||||||||||||||||||
| Investment expenses | (143) | (115) | (359) | (368) | (13) | (16) | ||||||||||||||||||||
| Acquisition and administrative expenses (net) | (5,380) | (5,174) | (1,989) | (2,130) | (2,744) | (2,864) | ||||||||||||||||||||
| Fee and commission expenses | (387) | (375) | (105) | (120) | (303) | (300) | ||||||||||||||||||||
| Amortization of intangible assets | (6) | (7) | (1) | (2) | — | (1) | ||||||||||||||||||||
| Restructuring charges | (22) | (356) | (8) | (161) | (12) | (9) | ||||||||||||||||||||
| Other expenses | — | (2) | — | — | 14 | 13 | ||||||||||||||||||||
| Expenses from fully consolidated private equity investments | — | — | — | — | — | — | ||||||||||||||||||||
| Total expenses | (19,012) | (18,732) | (16,455) | (17,556) | (5,905) | (5,440) | ||||||||||||||||||||
| Income before income taxes and minority interests in earnings | 4,005 | 4,099 | 1,626 | 1,391 | 1,304 | 1,217 | ||||||||||||||||||||
| Income taxes | (1,115) | (990) | (435) | (309) | (224) | (334) | ||||||||||||||||||||
| Minority interests in earnings | (330) | (427) | (159) | (220) | (44) | (55) | ||||||||||||||||||||
| Net income | 2,560 | 2,682 | 1,032 | 862 | 1,036 | 828 | ||||||||||||||||||||
48
Table of Contents
Notes to the Consolidated Financial Statements
| Asset Management | Corporate | Consolidation | Group | |||||||||||||||||||||||||||
2007 €mn | 2006 €mn | 2007 €mn | 2006 €mn | 2007 €mn | 2006 €mn | 2007 €mn | 2006 €mn | |||||||||||||||||||||||
| — | — | — | — | (8) | (4) | 34,336 | 34,224 | |||||||||||||||||||||||
| — | — | — | — | 8 | 4 | (3,176) | (3,336) | |||||||||||||||||||||||
| — | — | — | — | — | — | (2,278) | (2,342) | |||||||||||||||||||||||
| — | — | — | — | — | — | 28,882 | 28,546 | |||||||||||||||||||||||
| 66 | 50 | 399 | 301 | (630) | (543) | 13,582 | 12,242 | |||||||||||||||||||||||
| 23 | 12 | 41 | (152) | 6 | 27 | (228) | 563 | |||||||||||||||||||||||
| 3 | 1 | 988 | 497 | 276 | (301) | 4,297 | 4,232 | |||||||||||||||||||||||
| 2,153 | 2,061 | 89 | 79 | (352) | (394) | 4,678 | 4,414 | |||||||||||||||||||||||
| 7 | 6 | 14 | 17 | (80) | (43) | 99 | 56 | |||||||||||||||||||||||
| — | — | 941 | 328 | — | — | 941 | 328 | |||||||||||||||||||||||
| 2,252 | 2,130 | 2,472 | 1,070 | (780) | (1,254) | 52,251 | 50,381 | |||||||||||||||||||||||
| — | — | — | — | 13 | 11 | (23,468) | (22,674) | |||||||||||||||||||||||
| — | — | — | — | (13) | (11) | 1,959 | 1,606 | |||||||||||||||||||||||
| — | — | — | — | — | — | (21,509) | (21,068) | |||||||||||||||||||||||
| — | — | — | — | (55) | (279) | (5,068) | (6,070) | |||||||||||||||||||||||
| (30) | (20) | (747) | (659) | 489 | 353 | (3,439) | (2,849) | |||||||||||||||||||||||
| — | — | — | — | — | — | (72) | 24 | |||||||||||||||||||||||
| — | (1) | — | 22 | — | — | (169) | (362) | |||||||||||||||||||||||
| — | — | (54) | (77) | 106 | 94 | (463) | (482) | |||||||||||||||||||||||
| (1,145) | (1,146) | (368) | (281) | 38 | 68 | (11,588) | (11,527) | |||||||||||||||||||||||
| (642) | (632) | (61) | (42) | 263 | 284 | (1,235) | (1,185) | |||||||||||||||||||||||
| — | — | — | — | — | — | (7) | (10) | |||||||||||||||||||||||
| (2) | — | — | — | — | — | (44) | (526) | |||||||||||||||||||||||
| — | — | — | — | (1) | — | 13 | 11 | |||||||||||||||||||||||
| — | — | (916) | (314) | — | — | (916) | (314) | |||||||||||||||||||||||
| (1,819) | (1,799) | (2,146) | (1,351) | 840 | 520 | (44,497) | (44,358) | |||||||||||||||||||||||
| 433 | 331 | 326 | (281) | 60 | (734) | 7,754 | 6,023 | |||||||||||||||||||||||
| (181) | (127) | 55 | 234 | 75 | 270 | (1,825) | (1,256) | |||||||||||||||||||||||
| (19) | (24) | (8) | (9) | 11 | 26 | (549) | (709) | |||||||||||||||||||||||
| 233 | 180 | 373 | (56) | 146 | (438) | 5,380 | 4,058 | |||||||||||||||||||||||
49
Table of Contents
Allianz Group Interim Report Second Quarter and First Half of 2007
Segment Information – Total Revenues and Operating Profit
For the three months and six months ended June 30, 2007 and 2006
The following table summarizes the total revenues and operating profit for each of the segments for the three months and six months ended June 30, 2007 and 2006, as well as IFRS consolidated net income of the Allianz Group.
Property- Casualty | Life/Health | Banking | Asset Management | Corporate | Consolidation | Group | ||||||||||||||||||||||||||||||||||||||||||||||||||
2007 €mn | 2006 €mn | 2007 €mn | 2006 €mn | 2007 €mn | 2006 €mn | 2007 €mn | 2006 €mn | 2007 €mn | 2006 €mn | 2007 €mn | 2006 €mn | 2007 €mn | 2006 €mn | |||||||||||||||||||||||||||||||||||||||||||
| Three months ended June 30, | ||||||||||||||||||||||||||||||||||||||||||||||||||||||||
| Total revenues1) | 9,982 | 9,682 | 11,758 | 11,931 | 1,850 | 1,706 | 797 | 726 | — | — | (50) | 22 | 24,337 | 24,067 | ||||||||||||||||||||||||||||||||||||||||||
| Operating profit (loss) | 1,894 | 1,845 | 758 | 527 | 448 | 266 | 325 | 297 | (10) | (74) | (127) | (67) | 3,288 | 2,794 | ||||||||||||||||||||||||||||||||||||||||||
| Non-operating items | 180 | 440 | 15 | (17) | 39 | 12 | (82) | (134) | (74) | 184 | (168) | (287) | (90) | 198 | ||||||||||||||||||||||||||||||||||||||||||
| Income (loss) before income taxes and minority interests in earnings | 2,074 | 2,285 | 773 | 510 | 487 | 278 | 243 | 163 | (84) | 110 | (295) | (354) | 3,198 | 2,992 | ||||||||||||||||||||||||||||||||||||||||||
| Income taxes | (578) | (466) | (234) | (90) | (56) | (89) | (101) | (62) | 80 | 80 | 31 | 270 | (858) | (357) | ||||||||||||||||||||||||||||||||||||||||||
| Minority interests in earnings | (116) | (237) | (60) | (92) | (20) | (27) | (8) | (11) | (4) | (7) | 8 | 18 | (200) | (356) | ||||||||||||||||||||||||||||||||||||||||||
| Net income (loss) | 1,380 | 1,582 | 479 | 328 | 411 | 162 | 134 | 90 | (8) | 183 | (256) | (66) | 2,140 | 2,279 | ||||||||||||||||||||||||||||||||||||||||||
| Six months ended June 30, | ||||||||||||||||||||||||||||||||||||||||||||||||||||||||
| Total revenues1) | 24,093 | 23,831 | 24,084 | 24,753 | 3,951 | 3,654 | 1,577 | 1,477 | — | — | (45) | (7) | 53,660 | 53,708 | ||||||||||||||||||||||||||||||||||||||||||
| Operating profit (loss) | 3,161 | 3,231 | 1,508 | 1,250 | 1,148 | 813 | 637 | 601 | (111) | (254) | (185) | (170) | 6,158 | 5,471 | ||||||||||||||||||||||||||||||||||||||||||
| Non-operating items | 844 | 868 | 118 | 141 | 156 | 404 | (204) | (270) | 437 | (27) | 245 | (564) | 1,596 | 552 | ||||||||||||||||||||||||||||||||||||||||||
| Income (loss) before income taxes and minority interests in earnings | 4,005 | 4,099 | 1,626 | 1,391 | 1,304 | 1,217 | 433 | 331 | 326 | (281) | 60 | (734) | 7,754 | 6,023 | ||||||||||||||||||||||||||||||||||||||||||
| Income taxes | (1,115) | (990) | (435) | (309) | (224) | (334) | (181) | (127) | 55 | 234 | 75 | 270 | (1,825) | (1,256) | ||||||||||||||||||||||||||||||||||||||||||
| Minority interests in earnings | (330) | (427) | (159) | (220) | (44) | (55) | (19) | (24) | (8) | (9) | 11 | 26 | (549) | (709) | ||||||||||||||||||||||||||||||||||||||||||
| Net income (loss) | 2,560 | 2,682 | 1,032 | 862 | 1,036 | 828 | 233 | 180 | 373 | (56) | 146 | (438) | 5,380 | 4,058 | ||||||||||||||||||||||||||||||||||||||||||
1) | Total revenues comprise Property-Casualty segment’s gross premiums written, Life/Health segment’s statutory premiums, Banking segment’s operating revenues and Asset Management segment’s operating revenues. |
50
Table of Contents
Notes to the Consolidated Financial Statements
Property-Casualty Segment
| Three months ended June 30, | Six months ended June 30, | |||||||||||||||
2007 €mn | 2006 €mn | 2007 €mn | 2006 €mn | |||||||||||||
| Gross premiums written1) | 9,982 | 9,682 | 24,093 | 23,831 | ||||||||||||
| Ceded premiums written | (1,245) | (1,230) | (2,831) | (2,942) | ||||||||||||
| Change in unearned premiums | 919 | 906 | (2,248) | (2,190) | ||||||||||||
| Premiums earned (net) | 9,656 | 9,358 | 19,014 | 18,699 | ||||||||||||
| Interest and similar income | 1,380 | 1,257 | 2,386 | 2,179 | ||||||||||||
| Income from financial assets and liabilities designated at fair value through income (net)2) | 39 | 6 | 71 | 42 | ||||||||||||
| Income from financial assets and liabilities held for trading (net), shared with policyholder2) | (40) | — | (55) | — | ||||||||||||
| Realized gains/losses (net) from investments, shared with policyholders3) | 1 | 11 | 35 | 36 | ||||||||||||
| Fee and commission income | 280 | 265 | 552 | 517 | ||||||||||||
| Other income | 11 | 24 | 95 | 38 | ||||||||||||
| Operating revenues | 11,327 | 10,921 | 22,098 | 21,511 | ||||||||||||
| Claims and insurance benefits incurred (net) | (6,266) | (6,090) | (12,649) | (12,272) | ||||||||||||
| Changes in reserves for insurance and investment contracts (net) | (97) | (121) | (178) | (193) | ||||||||||||
| Interest expense | (92) | (66) | (184) | (129) | ||||||||||||
| Loan loss provisions | (9) | (2) | (9) | (3) | ||||||||||||
| Impairments of investments (net), shared with policyholders4) | (5) | (13) | (7) | (17) | ||||||||||||
| Investment expenses | (69) | (67) | (143) | (115) | ||||||||||||
| Acquisition and administrative expenses (net) | (2,705) | (2,511) | (5,380) | (5,174) | ||||||||||||
| Fee and commission expenses | (190) | (205) | (387) | (375) | ||||||||||||
| Other expenses | — | (1) | — | (2) | ||||||||||||
| Operating expenses | (9,433) | (9,076) | (18,937) | (18,280) | ||||||||||||
| Operating profit | 1,894 | 1,845 | 3,161 | 3,231 | ||||||||||||
| Income from financial assets and liabilities held for trading (net), not shared with policyholders2) | (1) | (1) | (30) | 3 | ||||||||||||
| Realized gains/losses (net) from investments, not shared with policyholders3) | 216 | 878 | 949 | 1,317 | ||||||||||||
| Impairments of investments (net), not shared with policyholders4) | (23) | (80) | (47) | (89) | ||||||||||||
| Amortization of intangible assets | (4) | (3) | (6) | (7) | ||||||||||||
| Restructuring charges | (8) | (354) | (22) | (356) | ||||||||||||
| Non-operating items | 180 | 440 | 844 | 868 | ||||||||||||
| Income before income taxes and minority interests in earnings | 2,074 | 2,285 | 4,005 | 4,099 | ||||||||||||
| Income taxes | (578) | (466) | (1,115) | (990) | ||||||||||||
| Minority interests in earnings | (116) | (237) | (330) | (427) | ||||||||||||
| Net income | 1,380 | 1,582 | 2,560 | 2,682 | ||||||||||||
| Loss ratio5)in % | 64.9 | 65.1 | 66.5 | 65.6 | ||||||||||||
| Expense ratio6)in % | 28.0 | 26.8 | 28.3 | 27.7 | ||||||||||||
| Combined ratio7)in % | 92.9 | 91.9 | 94.8 | 93.3 | ||||||||||||
1) | For the Property-Casualty segment, total revenues are measured based upon gross premiums written. |
2) | The total of these items equals income from financial assets and liabilities carried at fair value through income (net) in the segment income statement. |
3) | The total of these items equals realized gains/losses (net) in the segment income statement. |
4) | The total of these items equals impairments of investments (net) in the segment income statement. |
5) | Represents claims and insurance benefits incurred (net) divided by premiums earned (net). |
6) | Represents acquisition and administrative expenses (net) divided by premiums earned (net). |
7) | Represents the total of acquisition and administrative expenses (net) and claims and insurance benefits incurred (net) divided by premiums earned (net). |
51
Table of Contents
Allianz Group Interim Report Second Quarter and First Half of 2007
Life/Health Segment
| Three months ended June 30, | Six months ended June 30, | |||||||||||||||
2007 €mn | 2006 €mn | 2007 €mn | 2006 €mn | |||||||||||||
| Statutory premiums1) | 11,758 | 11,931 | 24,084 | 24,753 | ||||||||||||
| Ceded premiums written | (186) | (213) | (379) | (409) | ||||||||||||
| Change in unearned premiums | 3 | (76) | (24) | (151) | ||||||||||||
| Statutory premiums (net) | 11,575 | 11,642 | 23,681 | 24,193 | ||||||||||||
| Deposits from SFAS 97 insurance and investment contracts | (6,892) | (6,874) | (13,813) | (14,346) | ||||||||||||
| Premiums earned (net) | 4,683 | 4,768 | 9,868 | 9,847 | ||||||||||||
| Interest and similar income | 3,783 | 3,698 | 6,938 | 6,745 | ||||||||||||
| Income from financial assets and liabilities carried at fair value through income (net), shared with policyholders2) | (668) | (216) | (979) | (185) | ||||||||||||
| Realized gains/losses (net) from investments, shared with policyholders3) | 646 | 947 | 1,734 | 2,050 | ||||||||||||
| Fee and commission income | 164 | 162 | 335 | 291 | ||||||||||||
| Other income | 9 | 7 | 63 | 13 | ||||||||||||
| Operating revenues | 8,617 | 9,366 | 17,959 | 18,761 | ||||||||||||
| Claims and insurance benefits incurred (net) | (4,158) | (4,103) | (8,860) | (8,796) | ||||||||||||
| Changes in reserves for insurance and investment contracts (net) | (2,211) | (2,950) | (4,835) | (5,598) | ||||||||||||
| Interest expense | (111) | (73) | (202) | (137) | ||||||||||||
| Loan loss provisions | — | 1 | (3) | 1 | ||||||||||||
| Impairments of investments (net), shared with policyholders | (56) | (210) | (93) | (245) | ||||||||||||
| Investment expenses | (163) | (211) | (359) | (368) | ||||||||||||
| Acquisition and administrative expenses (net) | (1,115) | (1,105) | (1,989) | (2,130) | ||||||||||||
| Fee and commission expenses | (43) | (70) | (105) | (120) | ||||||||||||
| Operating restructuring charges4) | (2) | (118) | (5) | (118) | ||||||||||||
| Operating expenses | (7,859) | (8,839) | (16,451) | (17,511) | ||||||||||||
| Operating profit | 758 | 527 | 1,508 | 1,250 | ||||||||||||
| Income from financial assets and liabilities carried at fair value through income (net), not shared with policyholders2) | (1) | — | — | — | ||||||||||||
| Realized gains/losses (net) from investments, not shared with policyholders3) | 17 | 27 | 122 | 186 | ||||||||||||
| Amortization of intangible assets | — | (1) | (1) | (2) | ||||||||||||
| Non-operating restructuring charges4) | (1) | (43) | (3) | (43) | ||||||||||||
| Non-operating items | 15 | (17) | 118 | 141 | ||||||||||||
| Income before income taxes and minority interests in earnings | 773 | 510 | 1,626 | 1,391 | ||||||||||||
| Income taxes | (234) | (90) | (435) | (309) | ||||||||||||
| Minority interests in earnings | (60) | (92) | (159) | (220) | ||||||||||||
| Net income | 479 | 328 | 1,032 | 862 | ||||||||||||
| Statutory expense ratio5) in % | 9.6 | 9.5 | 8.4 | 8.8 | ||||||||||||
1) | For the Life/Health segment, total revenues are measured based upon statutory premiums. Statutory premiums are gross premiums written from sales of life insurance policies, as well as gross receipts from sales of unit linked and other investment-oriented products, in accordance with the statutory accounting practices applicable in the insurer’s home jurisdiction. |
2) | The total of these items equals income from financial assets and liabilities carried at fair value through income (net) in the segment income statement. |
3) | The total of these items equals realized gains/losses (net) in the segment income statement. |
4) | The total of these items equals restructuring charges in the segment income statement. |
5) | Represents acquisition and administrative expenses (net) divided by statutory premiums (net). |
52
Table of Contents
Notes to the Consolidated Financial Statements
Banking Segment
| Three months ended June 30, | Six months ended June 30, | |||||||||||||||||||||||||||||||
| 2007 | 2006 | 2007 | 2006 | |||||||||||||||||||||||||||||
Banking €mn | Dresdner Bank €mn | Banking €mn | Dresdner Bank1) €mn | Banking €mn | Dresdner Bank €mn | Banking €mn | Dresdner Bank1) €mn | |||||||||||||||||||||||||
| Net interest income2) | 730 | 701 | 652 | 631 | 1,658 | 1,601 | 1,253 | 1,209 | ||||||||||||||||||||||||
| Net fee and commission income3) | 766 | 718 | 728 | 680 | 1,598 | 1,507 | 1,560 | 1,473 | ||||||||||||||||||||||||
| Trading income (net)4) | 338 | 335 | 308 | 300 | 689 | 680 | 795 | 784 | ||||||||||||||||||||||||
| Income from financial assets and liabilities designated at fair value through income (net)4) | 16 | 16 | 18 | 18 | 6 | 5 | 21 | 21 | ||||||||||||||||||||||||
| Other income | — | — | — | (1) | — | — | 25 | 25 | ||||||||||||||||||||||||
| Operating revenues5) | 1,850 | 1,770 | 1,706 | 1,628 | 3,951 | 3,793 | 3,654 | 3,512 | ||||||||||||||||||||||||
| Administrative expenses | (1,334) | (1,277) | (1,436) | (1,386) | (2,744) | (2,632) | (2,864) | (2,767) | ||||||||||||||||||||||||
| Investment expenses | (4) | (5) | (10) | (12) | (13) | (16) | (16) | (19) | ||||||||||||||||||||||||
| Other expenses | 1 | 1 | 13 | 13 | 14 | 14 | 13 | 13 | ||||||||||||||||||||||||
| Operating expenses | (1,337) | (1,281) | (1,433) | (1,385) | (2,743) | (2,634) | (2,867) | (2,773) | ||||||||||||||||||||||||
| Loan loss provisions | (65) | (62) | (7) | (5) | (60) | (55) | 26 | 28 | ||||||||||||||||||||||||
| Operating profit | 448 | 427 | 266 | 238 | 1,148 | 1,104 | 813 | 767 | ||||||||||||||||||||||||
| Realized gains/losses (net) | 51 | 43 | 32 | 30 | 190 | 180 | 446 | 444 | ||||||||||||||||||||||||
| Impairments of investments (net) | (9) | (9) | (12) | (12) | (22) | (22) | (32) | (32) | ||||||||||||||||||||||||
| Amortization of intangible assets | — | — | (1) | — | — | — | (1) | — | ||||||||||||||||||||||||
| Restructuring charges | (3) | (4) | (7) | (6) | (12) | (13) | (9) | (8) | ||||||||||||||||||||||||
| Non-operating items | 39 | 30 | 12 | 12 | 156 | 145 | 404 | 404 | ||||||||||||||||||||||||
| Income before income taxes and minority interests in earnings | 487 | 457 | 278 | 250 | 1,304 | 1,249 | 1,217 | 1,171 | ||||||||||||||||||||||||
| Income taxes | (56) | (44) | (89) | (80) | (224) | (202) | (334) | (318) | ||||||||||||||||||||||||
| Minority interests in earnings | (20) | (18) | (27) | (21) | (44) | (40) | (55) | (46) | ||||||||||||||||||||||||
| Net income | 411 | 395 | 162 | 149 | 1,036 | 1,007 | 828 | 807 | ||||||||||||||||||||||||
| Cost-income ratio6)in % | 72.3 | 72.4 | 84.0 | 85.1 | 69.4 | 69.4 | 78.5 | 79.0 | ||||||||||||||||||||||||
1) | We have restated the presentation of revenues and operating profit stemming from trades in shares of Allianz SE and its affiliates. From 2007 onwards, these results are eliminated on Dresdner Bank level, whereas in 2006 they were adjusted on segment level only. |
2) | Represents interest and similar income less interest expense. |
3) | Represents fee and commission income less fee and commission expense. |
4) | The total of these items equals income from financial assets and liabilities carried at fair value through income (net) in the segment income statement. |
5) | For the Banking segment, total revenues are measured based upon operating revenues. |
6) | Represents operating expenses divided by operating revenues. |
53
Table of Contents
Allianz Group Interim Report Second Quarter and First Half of 2007
Asset Management Segment
| Three months ended June 30, | Six months ended June 30, | |||||||||||||||||||||||||||||||
| 2007 | 2006 | 2007 | 2006 | |||||||||||||||||||||||||||||
Asset Management Segment €mn | Allianz Global Investors €mn | Asset Management Segment €mn | Allianz Global Investors €mn | Asset Management Segment €mn | Allianz Global Investors €mn | Asset Management Segment €mn | Allianz Global Investors €mn | |||||||||||||||||||||||||
| Net fee and commission income1) | 765 | 743 | 712 | 701 | 1,511 | 1,471 | 1,429 | 1,405 | ||||||||||||||||||||||||
| Net interest income2) | 13 | 17 | 13 | 15 | 36 | 36 | 30 | 29 | ||||||||||||||||||||||||
| Income from financial assets and liabilities carried at fair value through income (net) | 16 | 15 | (2) | (2) | 23 | 22 | 12 | 12 | ||||||||||||||||||||||||
| Other income | 3 | 3 | 3 | 3 | 7 | 7 | 6 | 6 | ||||||||||||||||||||||||
| Operating revenues3) | 797 | 778 | 726 | 717 | 1,577 | 1,536 | 1,477 | 1,452 | ||||||||||||||||||||||||
| Administrative expenses, excluding acquisition-related expenses4) | (472) | (464) | (429) | (422) | (940) | (918) | (876) | (857) | ||||||||||||||||||||||||
| Operating expenses | (472) | (464) | (429) | (422) | (940) | (918) | (876) | (857) | ||||||||||||||||||||||||
| Operating profit | 325 | 314 | 297 | 295 | 637 | 618 | 601 | 595 | ||||||||||||||||||||||||
| Realized gains/losses (net) | 1 | 1 | (1) | (1) | 3 | 3 | 1 | — | ||||||||||||||||||||||||
| Impairments of investments (net) | — | — | (1) | — | — | — | (1) | — | ||||||||||||||||||||||||
| Acquisition-related expenses, thereof4) | ||||||||||||||||||||||||||||||||
Deferred purchases of interests in PIMCO | (80) | (80) | (130) | (130) | (202) | (202) | (266) | (266) | ||||||||||||||||||||||||
Other acquisition-related expenses5) | (3) | (3) | (2) | (2) | (3) | (3) | (4) | (4) | ||||||||||||||||||||||||
Subtotal | (83) | (83) | (132) | (132) | (205) | (205) | (270) | (270) | ||||||||||||||||||||||||
| Restructuring charges | — | — | — | — | (2) | (2) | — | — | ||||||||||||||||||||||||
| Non-operating items | (82) | (82) | (134) | (133) | (204) | (204) | (270) | (270) | ||||||||||||||||||||||||
| Income before income taxes and minority interests in earnings | 243 | 232 | 163 | 162 | 433 | 414 | 331 | 325 | ||||||||||||||||||||||||
| Income taxes | (101) | (100) | (62) | (62) | (181) | (179) | (127) | (126) | ||||||||||||||||||||||||
| Minority interests in earnings | (8) | (6) | (11) | (10) | (19) | (16) | (24) | (22) | ||||||||||||||||||||||||
| Net income | 134 | 126 | 90 | 90 | 233 | 219 | 180 | 177 | ||||||||||||||||||||||||
| Cost-income ratio6)in % | 59.2 | 59.6 | 59.1 | 58.9 | 59.6 | 59.8 | 59.3 | 59.0 | ||||||||||||||||||||||||
1) | Represents fee and commission income less fee and commission expense. |
2) | Represents interest and similar income less interest expense and investment expenses. |
3) | For the Asset Management segment, total revenues are measured based upon operating revenues. |
4) | The total of these items equals acquisition and administration expenses (net) in the segment income statement. |
5) | Consists of retention payments for the management and employees of PIMCO and Nicholas Applegate. |
6) | Represents operating expenses divided by operating revenues. |
54
Table of Contents
Notes to the Consolidated Financial Statements
Corporate Segment
| Three months ended June 30, | Six months ended June 30, | |||||||||||||||
2007 €mn | 2006 €mn | 2007 €mn | 2006 €mn | |||||||||||||
| Interest and similar income | 245 | 215 | 399 | 301 | ||||||||||||
| Income from financial assets and liabilities designated at fair value through income (net)1) | 4 | — | 5 | — | ||||||||||||
| Operating income from financial assets and liabilities held of trading (net)1) | 35 | — | 35 | — | ||||||||||||
| Fee and commission income | 44 | 38 | 89 | 79 | ||||||||||||
| Other income | 9 | 4 | 14 | 17 | ||||||||||||
| Income from fully consolidated private equity investments | 470 | 169 | 941 | 328 | ||||||||||||
| Operating revenues | 807 | 426 | 1,483 | 725 | ||||||||||||
| Interest expense, excluding interest expense from external debt2) | (116) | (127) | (247) | (265) | ||||||||||||
| Investment expenses | (20) | (60) | (54) | (77) | ||||||||||||
| Acquisition and administrative expenses (net), excluding acquisition-related expenses | (199) | (142) | (316) | (281) | ||||||||||||
| Fee and commission expenses | (26) | (19) | (61) | (42) | ||||||||||||
| Expenses from fully consolidated private equity investments | (456) | (152) | (916) | (314) | ||||||||||||
| Operating expenses | (817) | (500) | (1,594) | (979) | ||||||||||||
| Operating profit (loss) | (10) | (74) | (111) | (254) | ||||||||||||
| Non-operating income from financial assets and liabilities held for trading (net)1) | (83) | (56) | 1 | (152) | ||||||||||||
| Realized gains/losses (net) | 348 | 427 | 988 | 497 | ||||||||||||
| Interest expense from external debt2) | (278) | (196) | (500) | (394) | ||||||||||||
| Impairments of investments (net) | (9) | 9 | — | 22 | ||||||||||||
| Acquisition-related expenses | (52) | — | (52) | — | ||||||||||||
| Non-operating items | (74) | 184 | 437 | (27) | ||||||||||||
| Income (loss) before income taxes and minority interests in earnings | (84) | 110 | 326 | (281) | ||||||||||||
| Income taxes | 80 | 80 | 55 | 234 | ||||||||||||
| Minority interests in earnings | (4) | (7) | (8) | (9) | ||||||||||||
| Net income (loss) | (8) | 183 | 373 | (56) | ||||||||||||
1) | The total of these items equals income from financial assets and liabilities carried at fair value through income (net) in the segment income statement. |
2) | The total of these items equals interest expense in the segment income statement. |
55
Table of Contents
Allianz Group Interim Report Second Quarter and First Half of 2007
Supplementary Information to the
Consolidated Balance Sheets
4 Financial assets carried at fair value through income
As of June 30, 2007 €mn | As of December 31, 2006 €mn | |||||||
| Financial assets held for trading | ||||||||
Debt securities | 74,065 | 81,881 | ||||||
Equity securities | 42,144 | 31,266 | ||||||
Derivative financial instruments | 28,198 | 24,835 | ||||||
Subtotal | 144,407 | 137,982 | ||||||
| Financial assets designated at fair value through income | ||||||||
Debt securities | 17,430 | 14,414 | ||||||
Equity securities | 4,231 | 3,834 | ||||||
Loans to banks and customers | 706 | 639 | ||||||
Subtotal | 22,367 | 18,887 | ||||||
| Total | 166,774 | 156,869 |
As of June 30, 2007 €mn | As of December 31, 2006 €mn | |||||||
| Available-for-sale investments | 274,712 | 277,898 | ||||||
| Held-to-maturity investments | 4,680 | 4,748 | ||||||
| Funds held by others under reinsurance contracts assumed | 1,038 | 1,033 | ||||||
| Investments in associates and joint ventures | 5,176 | 4,900 | ||||||
| Real estate held for investment | 7,885 | 9,555 | ||||||
| Total | 293,491 | 298,134 |
Available-for-sale investments
| As of June 30, 2007 | As of December 31, 2006 | |||||||||||||||||||||||||||||||
Amortized €mn | Unrealized €mn | Unrealized €mn | Fair value €mn | Amortized €mn | Unrealized €mn | Unrealized €mn | Fair value €mn | |||||||||||||||||||||||||
| Equity securities | 43,034 | 27,051 | (260) | 69,825 | 43,139 | 26,795 | (159) | 69,775 | ||||||||||||||||||||||||
| Government debt securities | 112,041 | 1,028 | (3,031) | 110,038 | 112,893 | 2,813 | (1,077) | 114,629 | ||||||||||||||||||||||||
| Corporate debt securities | 93,950 | 672 | (2,401) | 92,221 | 90,493 | 1,542 | (860) | 91,175 | ||||||||||||||||||||||||
| Other debt securities | 2,621 | 110 | (103) | 2,628 | 2,122 | 215 | (18) | 2,319 | ||||||||||||||||||||||||
| Total | 251,646 | 28,861 | (5,795) | 274,712 | 248,647 | 31,365 | (2,114) | 277,898 | ||||||||||||||||||||||||
6 Loans and advances to banks and customers
| As of June 30, 2007 | As of December 31, 2006 | |||||||||||||||||||||||
Banks €mn | Customers €mn | Total €mn | Banks €mn | Customers €mn | Total €mn | |||||||||||||||||||
| Short-term investments and certificates of deposit | 8,066 | — | 8,066 | 6,775 | — | 6,775 | ||||||||||||||||||
| Reverse repurchase agreements | 89,858 | 67,362 | 157,220 | 86,957 | 52,456 | 139,413 | ||||||||||||||||||
| Collateral paid for securities borrowing transactions | 30,371 | 34,166 | 64,537 | 17,612 | 23,419 | 41,031 | ||||||||||||||||||
| Loans | 71,657 | 126,625 | 198,282 | 69,211 | 129,319 | 198,530 | ||||||||||||||||||
| Other advances | 12,154 | 13,779 | 25,933 | 15,225 | 8,358 | 23,583 | ||||||||||||||||||
| Subtotal | 212,106 | 241,932 | 454,038 | 195,780 | 213,552 | 409,332 | ||||||||||||||||||
| Loan loss allowance | (107) | (970) | (1,077) | (108) | (946) | (1,054) | ||||||||||||||||||
| Total | 211,999 | 240,962 | 452,961 | 195,672 | 212,606 | 408,278 | ||||||||||||||||||
56
Table of Contents
Notes to the Consolidated Financial Statements
Loans and advances to customers by type of customer
As of June 30, 2007 €mn | As of 2006 €mn | |||||||
| Corporate customers | 172,166 | 146,750 | ||||||
| Private customers | 58,968 | 59,505 | ||||||
| Public authorities | 10,798 | 7,297 | ||||||
| Subtotal | 241,932 | 213,552 | ||||||
| Loan loss allowance | (970) | (946) | ||||||
| Total | 240,962 | 212,606 |
As of June 30, 2007 €mn | As of 2006 €mn | |||||||
| Unearned premiums | 1,749 | 1,317 | ||||||
| Reserves for loss and loss adjustment expenses | 9,354 | 9,719 | ||||||
| Aggregate policy reserves | 6,847 | 8,223 | ||||||
| Other insurance reserves | 62 | 101 | ||||||
| Total | 18,012 | 19,360 |
As of June 30, 2007 €mn | As of 2006 €mn | |||||||
| Deferred acquisition costs | ||||||||
Property-Casualty | 3,992 | 3,692 | ||||||
Life/Health | 14,487 | 13,619 | ||||||
Asset Management | 53 | 50 | ||||||
Subtotal | 18,532 | 17,361 | ||||||
| Present value of future profits | 1,275 | 1,227 | ||||||
| Deferred sales inducements | 594 | 547 | ||||||
| Total | 20,401 | 19,135 |
As of 2007 €mn | As of €mn | |||||||
| Receivables | ||||||||
Policyholders | 4,351 | 4,292 | ||||||
Agents | 4,188 | 3,698 | ||||||
Reinsurers | 2,105 | 2,832 | ||||||
Other | 6,099 | 6,283 | ||||||
Less allowance for doubtful accounts | (358) | (330) | ||||||
Subtotal | 16,385 | 16,775 | ||||||
| Tax receivables | ||||||||
Income tax | 1,736 | 1,995 | ||||||
Other tax | 779 | 690 | ||||||
Subtotal | 2,515 | 2,685 | ||||||
| Accrued dividends, interest and rent | 5,958 | 5,658 | ||||||
| Prepaid expenses | ||||||||
Interest and rent | 3,620 | 2,678 | ||||||
Other prepaid expenses | 183 | 173 | ||||||
Subtotal | 3,803 | 2,851 | ||||||
| Derivative financial instruments used for hedging that meet the criteria for hedge accounting and firm commitments | 362 | 463 | ||||||
| Property and equipment | ||||||||
Real estate held for use | 3,796 | 4,758 | ||||||
Equipment | 1,616 | 1,597 | ||||||
Software | 1,092 | 1,078 | ||||||
Subtotal | 6,504 | 7,433 | ||||||
| Non-current assets and disposal groups held for sale | 2,717 | — | ||||||
| Other assets1) | 3,186 | 3,028 | ||||||
| Total | 41,430 | 38,893 |
1) | As of June 30, 2007, includes prepaid benefit costs for defined benefit plans of€305 mn. |
Non-current assets and disposal groups held for sale as of June 30, 2007 consists primarily of real estate held for investment and real estate held for use in Germany. Much of the real estate held for use is expected to be disposed of through sale-leaseback transactions.
57
Table of Contents
Allianz Group Interim Report Second Quarter and First Half of 2007
As of June 30, 2007 €mn | As of 2006 €mn | |||||||
| Goodwill | 12,511 | 12,007 | ||||||
| Brand names | 737 | 717 | ||||||
| Other | 204 | 211 | ||||||
| Total | 13,452 | 12,935 |
Changes in goodwill for the six months ended June 30, 2007, were as follows:
| €mn | ||||
| Cost as of 1/1/2007 | 12,231 | |||
| Accumulated impairments as of 1/1/2007 | (224) | |||
| Carrying amount as of 1/1/2007 | 12,007 | |||
| Additions | 586 | |||
| Foreign currency translation adjustments | (82) | |||
| Carrying amount as of 6/30/2007 | 12,511 | |||
| Accumulated impairments as of 6/30/2007 | 224 | |||
| Cost as of 6/30/2007 | 12,735 |
Additions include goodwill from
| • | increasing the interest in Russian People’s Insurance Society, “ROSNO”, Moscow, from 47.4% to 97.2%, |
| • | the acquisition of 100.0% participation in Insurance Company “Progress Garant”, Moscow, |
| • | the acquisition of 100.0% participation in United Mercantile Agencies, Inc., Kentucky. |
11 Financial liabilities carried at fair value through income
As of June 30, 2007 €mn | As of 2006 €mn | |||||||
| Financial liabilities held for trading | ||||||||
Obligations to deliver securities | 48,928 | 39,951 | ||||||
Derivative financial instruments | 32,954 | 27,823 | ||||||
Other trading liabilities | 13,936 | 10,988 | ||||||
Subtotal | 95,818 | 78,762 | ||||||
| Financial liabilities designated at fair value through income | 1,043 | 937 | ||||||
| Total | 96,861 | 79,699 |
58
Table of Contents
Notes to the Consolidated Financial Statements
12 Liabilities to banks and customers
| As of June 30, 2007 | As of December 31, 2006 | |||||||||||||||||||||||
Banks €mn | Customers €mn | Total €mn | Banks €mn | Customers €mn | Total €mn | |||||||||||||||||||
| Payable on demand | 18,122 | 62,312 | 80,434 | 18,216 | 68,677 | 86,893 | ||||||||||||||||||
| Savings deposits | — | 5,310 | 5,310 | — | 5,421 | 5,421 | ||||||||||||||||||
| Term deposits and certificates of deposit | 55,552 | 65,311 | 120,863 | 68,429 | 50,380 | 118,809 | ||||||||||||||||||
| Repurchase agreements | 84,656 | 56,203 | 140,859 | 68,189 | 49,403 | 117,592 | ||||||||||||||||||
| Collateral received from securities lending transactions | 24,807 | 14,775 | 39,582 | 19,914 | 8,703 | 28,617 | ||||||||||||||||||
| Other | 8,017 | 2,945 | 10,962 | 876 | 2,870 | 3,746 | ||||||||||||||||||
| Total | 191,154 | 206,856 | 398,010 | 175,624 | 185,454 | 361,078 | ||||||||||||||||||
13 Reserves for loss and loss adjustment expenses
As of June 30, | As of December 31, | |||||||
2007 €mn | 2006 €mn | |||||||
| Property-Casualty | 57,966 | 58,664 | ||||||
| Life/Health | 6,857 | 6,804 | ||||||
| Consolidation | 1 | (4) | ||||||
| Total | 64,824 | 65,464 |
Changes in the reserves for loss and loss adjustment expenses for the Property-Casualty segment for the six months ended June 30, 2007 and 2006, are as follows:
| 2007 | 2006 | |||||||||||||||||||||||
Gross €mn | Ceded €mn | Net €mn | Gross €mn | Ceded €mn | Net €mn | |||||||||||||||||||
| Reserves for loss and loss adjustment expenses as of 1/1/ | 58,664 | (9,333) | 49,331 | 60,259 | (10,604) | 49,655 | ||||||||||||||||||
| Loss and loss adjustment expenses incurred | ||||||||||||||||||||||||
Current year | 15,114 | (1,822) | 13,292 | 14,362 | (1,487) | 12,875 | ||||||||||||||||||
Prior years | (847) | 204 | (643) | (840) | 237 | (603) | ||||||||||||||||||
Subtotal | 14,267 | (1,618) | 12,649 | 13,522 | (1,250) | 12,272 | ||||||||||||||||||
| Loss and loss adjustment expenses paid | ||||||||||||||||||||||||
Current year | (5,086) | 402 | (4,684) | (4,464) | 170 | (4,294) | ||||||||||||||||||
Prior years | (9,384) | 1,199 | (8,185) | (9,066) | 1,338 | (7,728) | ||||||||||||||||||
Subtotal | (14,470) | 1,601 | (12,869) | (13,530) | 1,508 | (12,022) | ||||||||||||||||||
| Foreign currency translation adjustments and other | (617) | 358 | (259) | (1,299) | 398 | (901) | ||||||||||||||||||
| Changes in the consolidated subsidiaries of the Allianz Group | 122 | (14) | 108 | — | — | — | ||||||||||||||||||
| Reserves for loss and loss adjustment expenses as of 6/30/ | 57,966 | (9,006) | 48,960 | 58,952 | (9,948) | 49,004 |
59
Table of Contents
Allianz Group Interim Report Second Quarter and First Half of 2007
14 Reserves for insurance and investment contracts
As of June 30, 2007 €mn | As of €mn | |||||||
| Aggregate policy reserves | 259,892 | 256,333 | ||||||
| Reserves for premium refunds | 29,623 | 30,689 | ||||||
| Other insurance reserves | 761 | 675 | ||||||
| Total | 290,276 | 287,697 |
As of June 30, 2007 €mn | As of €mn | |||||||
| Payables | ||||||||
Policyholders | 4,743 | 5,322 | ||||||
Reinsurance | 2,283 | 1,868 | ||||||
Agents | 1,550 | 1,494 | ||||||
Subtotal | 8,576 | 8,684 | ||||||
| Payables for social security | 356 | 219 | ||||||
| Tax payables | ||||||||
Income tax | 2,011 | 2,076 | ||||||
Other | 1,064 | 968 | ||||||
Subtotal | 3,075 | 3,044 | ||||||
| Accrued interest and rent | 883 | 793 | ||||||
| Unearned income | ||||||||
Interest and rent | 3,476 | 2,645 | ||||||
Other | 173 | 279 | ||||||
Subtotal | 3,649 | 2,924 | ||||||
| Provisions | ||||||||
Pensions and similar obligations | 4,156 | 4,120 | ||||||
Employee related | 2,654 | 3,120 | ||||||
Share-based compensation | 1,866 | 1,898 | ||||||
Restructuring plans | 684 | 887 | ||||||
Loan commitments | 243 | 261 | ||||||
Other provisions | 1,849 | 1,943 | ||||||
Subtotal | 11,452 | 12,229 | ||||||
| Deposits retained for reinsurance ceded | 4,450 | 5,716 | ||||||
| Derivative financial instruments used for hedging purposes that meet the criteria for hedge accounting and firm commitments | 1,168 | 907 | ||||||
| Financial liabilities for puttable equity instruments | 4,226 | 3,750 | ||||||
| Disposal groups held for sale | 314 | — | ||||||
| Other liabilities | 10,947 | 11,498 | ||||||
| Total | 49,096 | 49,764 |
As of June 30, 2007 €mn | As of €mn | |||||||
| Allianz SE1) | ||||||||
Senior bonds | 6,496 | 6,195 | ||||||
Exchangeable bonds | 450 | 1,262 | ||||||
Money market securities | 1,613 | 870 | ||||||
Subtotal | 8,559 | 8,327 | ||||||
| Banking subsidiaries | ||||||||
Senior bonds | 20,665 | 23,337 | ||||||
Money market securities | 26,491 | 22,655 | ||||||
Subtotal | 47,156 | 45,992 | ||||||
| All other subsidiaries | ||||||||
Certificated liabilities | 3 | 4 | ||||||
Money market securities | 430 | 599 | ||||||
Subtotal | 433 | 603 | ||||||
| Total | 56,148 | 54,922 |
1) | Includes senior bonds and exchangeable bonds issued by Allianz Finance B.V. and Allianz Finance II B.V. guaranteed by Allianz SE and money market securities issued by Allianz Finance Corporation, a wholly-owned subsidiary of Allianz SE, which are fully and unconditionally guaranteed by Allianz SE. |
17 Participation certificates and subordinated liabilities
As of June 30, 2007 €mn | As of €mn | |||||||
| Allianz SE1) | ||||||||
Subordinated bonds | 6,878 | 6,883 | ||||||
Participation certificates | 85 | 85 | ||||||
Subtotal | 6,963 | 6,968 | ||||||
| Banking subsidiaries | ||||||||
Subordinated liabilities | 3,002 | 3,669 | ||||||
Hybrid equity | 2,489 | 2,513 | ||||||
Participation certificates | 1,679 | 2,262 | ||||||
Subtotal | 7,170 | 8,444 | ||||||
| All other subsidiaries | ||||||||
Subordinated liabilities | 908 | 905 | ||||||
Hybrid equity | 45 | 45 | ||||||
Subtotal | 953 | 950 | ||||||
| Total | 15,086 | 16,362 |
1) | Includes subordinated bonds issued by Allianz Finance B.V. and Allianz Finance II B.V. and guaranteed by Allianz SE. |
60
Table of Contents
Notes to the Consolidated Financial Statements
In 2006 Allianz issued a €800 mn 5.375% Perpetual Subordinated Bond. The bond requires Allianz, in specified circumstances (which relate to adverse changes in the financial condition of Allianz), either to defer interest otherwise payable or to settle such interest with funds raised through the issue of Allianz shares or certain other types of securities. Any interest that is so deferred can only be settled upon the occurrence of certain events and only with funds raised through the issue of such shares or other securities.
It is the intention of Allianz that in the unlikely event of a mandatory deferral of interest in respect of the above instrument (other than in circumstances where interest or distributions on all of its subordinated securities are deferred) to use its best endeavours to arrange for the issue or sale of Allianz shares or such other securities so as to raise cash to enable it to settle interest no later than 30 days after its original due date for payment.
Investors should note that Allianz is not obligated, under any circumstances, to issue new shares or sell treasury shares and that Allianz may be prevented by compulsory provisions of German stock corporation law or otherwise from issuing new shares or selling treasury shares.
As of June 30, 2007 €mn | As of €mn | |||||||
| Shareholders’ equity | ||||||||
Issued capital | 1,149 | 1,106 | ||||||
Capital reserve | 27,014 | 24,292 | ||||||
Revenue reserves | 11,621 | 14,070 | ||||||
Treasury shares | (241) | (441) | ||||||
Foreign currency translation adjustments | (2,534) | (2,210) | ||||||
Unrealized gains and losses (net)1) | 11,450 | 13,664 | ||||||
Subtotal | 48,459 | 50,481 | ||||||
| Minority interests | 3,288 | 6,409 | ||||||
| Total | 51,747 | 56,890 |
1) | As of June 30, 2007 includes€130 mn related to cash flow hedges (2006: €140 mn). |
Dividends
In the second quarter of 2007 a dividend of €3.80 (2006: €2.00) per qualifying share was paid to the shareholders.
61
Table of Contents
Allianz Group Interim Report Second Quarter and First Half of 2007
Supplementary Information to the Consolidated Income Statements
Property- Casualty | Life/Health | Consolidation | Total | |||||||||||||
| Three months ended June 30, | €mn | €mn | €mn | €mn | ||||||||||||
| 2007 | ||||||||||||||||
| Premiums written | ||||||||||||||||
Direct | 9,347 | 4,794 | — | 14,141 | ||||||||||||
Assumed | 635 | 62 | (5) | 692 | ||||||||||||
Subtotal | 9,982 | 4,856 | (5) | 14,833 | ||||||||||||
Ceded | (1,245) | (175) | 5 | (1,415) | ||||||||||||
Net | 8,737 | 4,681 | — | 13,418 | ||||||||||||
| Change in unearned premiums | ||||||||||||||||
Direct | 936 | — | — | 936 | ||||||||||||
Assumed | (55) | 3 | 1 | (51) | ||||||||||||
Subtotal | 881 | 3 | 1 | 885 | ||||||||||||
Ceded | 38 | (1) | (1) | 36 | ||||||||||||
Net | 919 | 2 | — | 921 | ||||||||||||
| Premiums earned | ||||||||||||||||
Direct | 10,283 | 4,794 | — | 15,077 | ||||||||||||
Assumed | 580 | 65 | (4) | 641 | ||||||||||||
Subtotal | 10,863 | 4,859 | (4) | 15,718 | ||||||||||||
Ceded | (1,207) | (176) | 4 | (1,379) | ||||||||||||
Net | 9,656 | 4,683 | — | 14,339 | ||||||||||||
| 2006 | ||||||||||||||||
| Premiums written | ||||||||||||||||
Direct | 9,036 | 4,932 | — | 13,968 | ||||||||||||
Assumed | 646 | 121 | 1 | 768 | ||||||||||||
Subtotal | 9,682 | 5,053 | 1 | 14,736 | ||||||||||||
Ceded | (1,230) | (208) | (1) | (1,439) | ||||||||||||
Net | 8,452 | 4,845 | — | 13,297 | ||||||||||||
| Change in unearned premiums | ||||||||||||||||
Direct | 1,000 | (66) | — | 934 | ||||||||||||
Assumed | 67 | (13) | — | 54 | ||||||||||||
Subtotal | 1,067 | (79) | — | 988 | ||||||||||||
Ceded | (161) | 2 | — | (159) | ||||||||||||
Net | 906 | (77) | — | 829 | ||||||||||||
| Premiums earned | ||||||||||||||||
Direct | 10,036 | 4,866 | — | 14,902 | ||||||||||||
Assumed | 713 | 108 | 1 | 822 | ||||||||||||
Subtotal | 10,749 | 4,974 | 1 | 15,724 | ||||||||||||
Ceded | (1,391) | (206) | (1) | (1,598) | ||||||||||||
Net | 9,358 | 4,768 | — | 14,126 |
62
Table of Contents
Notes to the Consolidated Financial Statements
19 Premiums earned (net) (continued)
Property- Casualty | Life/Health | Consolidation | Total | |||||||||||||
| Six months ended June 30, | €mn | €mn | €mn | €mn | ||||||||||||
| 2007 | ||||||||||||||||
| Premiums written | ||||||||||||||||
Direct | 22,811 | 10,105 | — | 32,916 | ||||||||||||
Assumed | 1,282 | 146 | (8) | 1,420 | ||||||||||||
Subtotal | 24,093 | 10,251 | (8) | 34,336 | ||||||||||||
Ceded | (2,831) | (353) | 8 | (3,176) | ||||||||||||
Net | 21,262 | 9,898 | — | 31,160 | ||||||||||||
| Change in unearned premiums | ||||||||||||||||
Direct | (2,562) | (38) | — | (2,600) | ||||||||||||
Assumed | (94) | 7 | 1 | (86) | ||||||||||||
Subtotal | (2,656) | (31) | 1 | (2,686) | ||||||||||||
Ceded | 408 | 1 | (1) | 408 | ||||||||||||
Net | (2,248) | (30) | — | (2,278) | ||||||||||||
| Premiums earned | ||||||||||||||||
Direct | 20,249 | 10,067 | — | 30,316 | ||||||||||||
Assumed | 1,188 | 153 | (7) | 1,334 | ||||||||||||
Subtotal | 21,437 | 10,220 | (7) | 31,650 | ||||||||||||
Ceded | (2,423) | (352) | 7 | (2,768) | ||||||||||||
Net | 19,014 | 9,868 | — | 28,882 | ||||||||||||
| 2006 | ||||||||||||||||
| Premiums written | ||||||||||||||||
Direct | 22,507 | 10,204 | — | 32,711 | ||||||||||||
Assumed | 1,324 | 193 | (4) | 1,513 | ||||||||||||
Subtotal | 23,831 | 10,397 | (4) | 34,224 | ||||||||||||
Ceded | (2,942) | (398) | 4 | (3,336) | ||||||||||||
Net | 20,889 | 9,999 | — | 30,888 | ||||||||||||
| Change in unearned premiums | ||||||||||||||||
Direct | (2,532) | (143) | — | (2,675) | ||||||||||||
Assumed | 4 | (11) | — | (7) | ||||||||||||
Subtotal | (2,528) | (154) | — | (2,682) | ||||||||||||
Ceded | 338 | 2 | — | 340 | ||||||||||||
Net | (2,190) | (152) | — | (2,342) | ||||||||||||
| Premiums earned | ||||||||||||||||
Direct | 19,975 | 10,061 | — | 30,036 | ||||||||||||
Assumed | 1,328 | 182 | (4) | 1,506 | ||||||||||||
Subtotal | 21,303 | 10,243 | (4) | 31,542 | ||||||||||||
Ceded | (2,604) | (396) | 4 | (2,996) | ||||||||||||
Net | 18,699 | 9,847 | — | 28,546 |
20 Interest and similar income
| Three months ended June 30, | Six months ended June 30, | |||||||||||||||
2007 €mn | 2006 €mn | 2007 €mn | 2006 €mn | |||||||||||||
| Interest from held-to-maturity investments | 55 | 57 | 111 | 117 | ||||||||||||
| Dividends from available-for-sale investments | 1,347 | 1,258 | 1,654 | 1,531 | ||||||||||||
| Interest from available-for-sale investments | 2,402 | 2,336 | 4,770 | 4,553 | ||||||||||||
| Share of earnings from investments in associates and joint ventures | 72 | 48 | 331 | 122 | ||||||||||||
| Rent from real estate held for investment | 220 | 244 | 429 | 463 | ||||||||||||
| Interest from loans to banks and customers | 3,155 | 2,570 | 6,153 | 5,377 | ||||||||||||
| Other | 65 | 46 | 134 | 79 | ||||||||||||
| Total | 7,316 | 6,559 | 13,582 | 12,242 | ||||||||||||
63
Table of Contents
Allianz Group Interim Report Second Quarter and First Half of 2007
21 Income from financial assets and liabilities carried at fair value through income (net)
| Property- Casualty | Life/Health | Banking | Asset Management | Corporate | Consolidation | Group | ||||||||||||||||||||||
| Three months ended June 30, | €mn | €mn | €mn | €mn | €mn | €mn | €mn | |||||||||||||||||||||
| 2007 | ||||||||||||||||||||||||||||
| Income from financial assets and liabilities held for trading | (42) | (775) | 338 | 4 | (46) | 9 | (511) | |||||||||||||||||||||
| Income from financial assets designated at fair value through income | 42 | 181 | 42 | 47 | 2 | (8) | 305 | |||||||||||||||||||||
| Expense from financial liabilities designated at fair value through income | — | 1 | (26) | — | — | 1 | (24) | |||||||||||||||||||||
| Income (expense) from financial liabilities for puttable equity instruments (net) | (2) | (76) | — | (35) | — | — | (113) | |||||||||||||||||||||
| Total | (2) | (669) | 354 | 16 | (44) | 2 | (343) | |||||||||||||||||||||
| 2006 | ||||||||||||||||||||||||||||
| Income from financial assets and liabilities held for trading | (1) | (110) | 308 | — | (56) | 5 | 146 | |||||||||||||||||||||
| Income from financial assets designated at fair value through income | 6 | (198) | 25 | (188) | — | — | (355) | |||||||||||||||||||||
| Expense from financial liabilities designated at fair value through income | — | (1) | (7) | — | — | 1 | (7) | |||||||||||||||||||||
| Income (expense) from financial liabilities for puttable equity instruments (net) | — | 93 | — | 186 | — | — | 279 | |||||||||||||||||||||
| Total | 5 | (216) | 326 | (2) | (56) | 6 | 63 | |||||||||||||||||||||
| Property- Casualty | Life/Health | Banking | Asset Management | Corporate | Consolidation | Group | ||||||||||||||||||||||
| Six months ended June 30, | €mn | €mn | €mn | €mn | €mn | €mn | €mn | |||||||||||||||||||||
| 2007 | ||||||||||||||||||||||||||||
| Income from financial assets and liabilities held for trading | (86) | (1,189) | 689 | 3 | 36 | 13 | (533) | |||||||||||||||||||||
| Income from financial assets designated at fair value through income | 72 | 320 | 74 | 69 | 5 | (8) | 531 | |||||||||||||||||||||
| Expense from financial liabilities designated at fair value through income | 2 | 9 | (68) | — | — | 1 | (56) | |||||||||||||||||||||
| Income (expense) from financial liabilities for puttable equity instruments (net) | (2) | (119) | — | (49) | — | — | (170) | |||||||||||||||||||||
| Total | (14) | (979) | 695 | 23 | 41 | 6 | (228) | |||||||||||||||||||||
| 2006 | ||||||||||||||||||||||||||||
| Income from financial assets and liabilities held for trading | 3 | (128) | 795 | 3 | (152) | 26 | 547 | |||||||||||||||||||||
| Income from financial assets designated at fair value through income | 50 | (44) | 46 | (152) | — | — | (100) | |||||||||||||||||||||
| Expense from financial liabilities designated at fair value through income | (1) | (1) | (25) | — | — | 1 | (26) | |||||||||||||||||||||
| Income (expense) from financial liabilities for puttable equity instruments (net) | (7) | (12) | — | 161 | — | — | 142 | |||||||||||||||||||||
| Total | 45 | (185) | 816 | 12 | (152) | 27 | 563 |
64
Table of Contents
Notes to the Consolidated Financial Statements
Income from financial assets and liabilities held for trading (net)
Life/Health Segment
Income from financial assets and liabilities held for trading for the six month ended June 30, 2007 includes expenses of €1,208 mn (2006: €128 mn) from derivative financial instruments in the Life/Health segment.
Expenses of €771 mn (2006: €39 mn) result from the purchase of forward contracts for interest bonds and forward sales of shares. Also included are expenses from derivative financial instruments related to equity indexed annuity contracts and guaranteed benefits under unit-linked contracts of €142 mn (2006: €100 mn) and expenses from other derivative financial instruments of €295 mn (2006: income: €11 mn).
Banking Segment
Income from financial assets and liabilities held for trading of the Banking segment comprises:
| Three months ended June 30, | Six months ended June 30, | |||||||||||||||
2007 €mn | 2006 €mn | 2007 €mn | 2006 €mn | |||||||||||||
| Trading in interest products | 169 | 261 | 408 | 533 | ||||||||||||
| Trading in equity products | 137 | 31 | 260 | 155 | ||||||||||||
| Foreign exchange/precious metals trading | 40 | 53 | 92 | 109 | ||||||||||||
| Other trading activities | (8) | (37) | (71) | (2) | ||||||||||||
| Total | 338 | 308 | 689 | 795 | ||||||||||||
Corporate Segment
Income from financial assets and liabilities held for trading for the six months ended June 30, 2007, includes income of €86 mn (2006: expense: €152 mn) from derivative financial instruments used by the Corporate segment for which hedge accounting is not applied. This includes expenses from derivative financial instruments
embedded in exchangeable bonds of €216 mn (2006: €215 mn), income from derivative financial instruments which economically hedge the exchangeable bonds, however which do not qualify for hedge accounting, of €164 mn (2006: €195 mn), and income from other derivative financial instruments of €138 mn (2006: expense: €132 mn).
22 Realized gains/losses (net)
| Three months ended June 30, | Six months ended June 30, | |||||||||||||||
2007 €mn | 2006 €mn | 2007 €mn | 2006 €mn | |||||||||||||
| Realized gains | ||||||||||||||||
| Available-for-sale investments | ||||||||||||||||
Equity securities | 1,427 | 2,285 | 4,585 | 3,803 | ||||||||||||
Debt securities | 103 | 147 | 242 | 371 | ||||||||||||
Subtotal | 1,530 | 2,432 | 4,827 | 4,174 | ||||||||||||
| Investments in associates and joint ventures1) | 38 | 126 | 45 | 267 | ||||||||||||
| Loans to banks and customers | 16 | 3 | 25 | 30 | ||||||||||||
| Real estate held for investment | 108 | 309 | 217 | 483 | ||||||||||||
| Subtotal | 1,692 | 2,870 | 5,114 | 4,954 | ||||||||||||
| Realized losses | ||||||||||||||||
| Available-for-sale investments | ||||||||||||||||
Equity securities | (90) | (132) | (144) | (204) | ||||||||||||
Debt securities | (450) | (376) | (586) | (466) | ||||||||||||
Subtotal | (540) | (508) | (730) | (670) | ||||||||||||
| Investments in associates and joint ventures2) | (3) | (5) | (6) | (8) | ||||||||||||
| Loans to banks and customers | (28) | (11) | (41) | (17) | ||||||||||||
| Real estate held for investment | (33) | (9) | (40) | (27) | ||||||||||||
| Subtotal | (604) | (533) | (817) | (722) | ||||||||||||
| Total | 1,088 | 2,337 | 4,297 | 4,232 | ||||||||||||
1) | During the three and six months ended June 30, 2007, includes realized gains from the disposal of subsidiaries of€6 mn (2006:€5 mn) and€7 mn (2006:€50 mn) respectively. |
2) | During the three and six months ended June 30, 2007, includes realized losses from the disposal of subsidiaries of€1 mn (2006:€1 mn) and€1 mn (2006:€1 mn) respectively. |
65
Table of Contents
Allianz Group Interim Report Second Quarter and First Half of 2007
| Three months ended June 30, | 2007 | 2006 | ||||||||||||||||||||||
Segment €mn | Consolidation €mn | Group €mn | Segment €mn | Consolidation €mn | Group €mn | |||||||||||||||||||
| Property-Casualty | ||||||||||||||||||||||||
Fees from credit and assistance business | 183 | (1) | 182 | 165 | — | 165 | ||||||||||||||||||
Service agreements | 97 | (6) | 91 | 96 | (12) | 84 | ||||||||||||||||||
Investment advisory | — | — | — | 4 | — | 4 | ||||||||||||||||||
Subtotal | 280 | (7) | 273 | 265 | (12) | 253 | ||||||||||||||||||
| Life/Health | ||||||||||||||||||||||||
Service agreements | 37 | 4 | 41 | 52 | (27) | 25 | ||||||||||||||||||
Investment advisory | 122 | 1 | 123 | 97 | — | 97 | ||||||||||||||||||
Other | 5 | (5) | — | 13 | (3) | 10 | ||||||||||||||||||
Subtotal | 164 | — | 164 | 162 | (30) | 132 | ||||||||||||||||||
| Banking | ||||||||||||||||||||||||
Securities business | 362 | (45) | 317 | 347 | (49) | 298 | ||||||||||||||||||
Investment advisory | 154 | (38) | 116 | 156 | (40) | 116 | ||||||||||||||||||
Payment transactions | 91 | (1) | 90 | 92 | (1) | 91 | ||||||||||||||||||
Mergers and acquisitions advisory | 72 | — | 72 | 59 | — | 59 | ||||||||||||||||||
Underwriting business | 19 | — | 19 | 40 | — | 40 | ||||||||||||||||||
Other | 225 | (22) | 203 | 174 | (12) | 162 | ||||||||||||||||||
Subtotal | 923 | (106) | 817 | 868 | (102) | 766 | ||||||||||||||||||
| Asset Management | ||||||||||||||||||||||||
Management fees | 876 | (30) | 846 | 836 | (32) | 804 | ||||||||||||||||||
Loading and exit fees | 80 | — | 80 | 88 | — | 88 | ||||||||||||||||||
Performance fees | 21 | — | 21 | 9 | — | 9 | ||||||||||||||||||
Other | 103 | (2) | 101 | 97 | — | 97 | ||||||||||||||||||
Subtotal | 1,080 | (32) | 1,048 | 1,030 | (32) | 998 | ||||||||||||||||||
| Corporate | ||||||||||||||||||||||||
Service agreements | 44 | (24) | 20 | 38 | (25) | 13 | ||||||||||||||||||
Subtotal | 44 | (24) | 20 | 38 | (25) | 13 | ||||||||||||||||||
| Total | 2,491 | (169) | 2,322 | 2,363 | (201) | 2,162 | ||||||||||||||||||
| Six months ended June 30, | 2007 | 2006 | ||||||||||||||||||||||
Segment €mn | Consolidation €mn | Group €mn | Segment €mn | Consolidation €mn | Group €mn | |||||||||||||||||||
| Property-Casualty | ||||||||||||||||||||||||
Fees from credit and assistance business | 356 | (1) | 355 | 333 | — | 333 | ||||||||||||||||||
Service agreements | 196 | (11) | 185 | 177 | (22) | 155 | ||||||||||||||||||
Investment advisory | — | — | — | 7 | — | 7 | ||||||||||||||||||
Subtotal | 552 | (12) | 540 | 517 | (22) | 495 | ||||||||||||||||||
| Life/Health | ||||||||||||||||||||||||
Service agreements | 91 | (7) | 84 | 89 | (48) | 41 | ||||||||||||||||||
Investment advisory | 236 | (7) | 229 | 184 | — | 184 | ||||||||||||||||||
Other | 8 | (8) | — | 18 | (6) | 12 | ||||||||||||||||||
Subtotal | 335 | (22) | 313 | 291 | (54) | 237 | ||||||||||||||||||
| Banking | ||||||||||||||||||||||||
Securities business | 827 | (94) | 733 | 812 | (96) | 716 | ||||||||||||||||||
Investment advisory | 308 | (76) | 232 | 308 | (80) | 228 | ||||||||||||||||||
Payment transactions | 182 | (1) | 181 | 183 | (1) | 182 | ||||||||||||||||||
Mergers and acquisitions advisory | 113 | — | 113 | 124 | — | 124 | ||||||||||||||||||
Underwriting business | 42 | — | 42 | 75 | — | 75 | ||||||||||||||||||
Other | 429 | (31) | 398 | 358 | (38) | 320 | ||||||||||||||||||
Subtotal | 1,901 | (202) | 1,699 | 1,860 | (215) | 1,645 | ||||||||||||||||||
| Asset Management | ||||||||||||||||||||||||
Management fees | 1,742 | (60) | 1,682 | 1,677 | (53) | 1,624 | ||||||||||||||||||
Loading and exit fees | 162 | — | 162 | 181 | — | 181 | ||||||||||||||||||
Performance fees | 37 | — | 37 | 25 | — | 25 | ||||||||||||||||||
Other | 212 | (4) | 208 | 178 | (3) | 175 | ||||||||||||||||||
Subtotal | 2,153 | (64) | 2,089 | 2,061 | (56) | 2,005 | ||||||||||||||||||
| Corporate | ||||||||||||||||||||||||
Service agreements | 89 | (52) | 37 | 79 | (47) | 32 | ||||||||||||||||||
Subtotal | 89 | (52) | 37 | 79 | (47) | 32 | ||||||||||||||||||
| Total | 5,030 | (352) | 4,678 | 4,808 | (394) | 4,414 | ||||||||||||||||||
66
Table of Contents
Notes to the Consolidated Financial Statements
| Three months ended June 30, | Six months ended June 30, | |||||||||||||||
2007 €mn | 2006 €mn | 2007 €mn | 2006 €mn | |||||||||||||
| Income from real estate held for use | ||||||||||||||||
Realized gains from disposals of real estate held for use | 3 | 16 | 94 | 51 | ||||||||||||
Other income from real estate held for use | — | (2) | — | 2 | ||||||||||||
Subtotal | 3 | 14 | 94 | 53 | ||||||||||||
| Income from non-current assets and disposal groups held for sale | 1 | 1 | 3 | 1 | ||||||||||||
| Other income | 2 | 2 | 2 | 2 | ||||||||||||
| Total | 6 | 17 | 99 | 56 | ||||||||||||
25 Income from fully consolidated private equity investments
| 2007 | 2006 | |||||||||||||||||||||||||||
MAN Roland | Four Seasons Health Care Ltd. | Other | Total | MAN Roland | Four Seasons Health Care Ltd. | Total | ||||||||||||||||||||||
| €mn | €mn | €mn | €mn | €mn | €mn | €mn | ||||||||||||||||||||||
| Three months ended June 30, | ||||||||||||||||||||||||||||
| Sales and service revenues | 456 | — | 1 | 457 | — | 169 | 169 | |||||||||||||||||||||
| Other operating revenues | 11 | — | — | 11 | — | — | — | |||||||||||||||||||||
| Interest income | 2 | — | — | 2 | — | — | — | |||||||||||||||||||||
| Total | 469 | — | 1 | 470 | — | 169 | 169 | |||||||||||||||||||||
| Six months ended June 30, | ||||||||||||||||||||||||||||
| Sales and service revenues | 909 | — | 4 | 913 | — | 328 | 328 | |||||||||||||||||||||
| Other operating revenues | 23 | — | — | 23 | — | — | — | |||||||||||||||||||||
| Interest income | 5 | — | — | 5 | — | — | — | |||||||||||||||||||||
| Total | 937 | — | 4 | 941 | — | 328 | 328 | |||||||||||||||||||||
67
Table of Contents
Allianz Group Interim Report Second Quarter and First Half of 2007
26 Claims and insurance benefits incurred (net)
| Three months ended June 30, | 2007 | 2006 | ||||||||||||||||||||||||||||||
Property- Casualty | Life/Health | Consolidation | Total | Property- Casualty | Life/Health | Consolidation | Total | |||||||||||||||||||||||||
| €mn | €mn | €mn | €mn | €mn | €mn | €mn | €mn | |||||||||||||||||||||||||
| Gross | ||||||||||||||||||||||||||||||||
Claims and insurance benefits paid | (6,766) | (4,294) | 7 | (11,053) | (6,270) | (4,220) | 9 | (10,481) | ||||||||||||||||||||||||
Change in loss and loss adjustment expenses | (327) | (42) | 1 | (368) | (284) | (73) | (1) | (358) | ||||||||||||||||||||||||
Subtotal | (7,093) | (4,336) | 8 | (11,421) | (6,554) | (4,293) | 8 | (10,839) | ||||||||||||||||||||||||
| Ceded | ||||||||||||||||||||||||||||||||
Claims and insurance benefits paid | 689 | 180 | (7) | 862 | 512 | 180 | (9) | 683 | ||||||||||||||||||||||||
Change in loss and loss adjustment expenses | 138 | (2) | (1) | 135 | (48) | 10 | 1 | (37) | ||||||||||||||||||||||||
Subtotal | 827 | 178 | (8) | 997 | 464 | 190 | (8) | 646 | ||||||||||||||||||||||||
| Net | ||||||||||||||||||||||||||||||||
Claims and insurance benefits paid | (6,077) | (4,114) | — | (10,191) | (5,758) | (4,040) | — | (9,798) | ||||||||||||||||||||||||
Change in loss and loss adjustment expenses | (189) | (44) | — | (233) | (332) | (63) | — | (395) | ||||||||||||||||||||||||
Total | (6,266) | (4,158) | — | (10,424) | (6,090) | (4,103) | — | (10,193) | ||||||||||||||||||||||||
| Six months ended June 30, | 2007 | 2006 | ||||||||||||||||||||||||||||||
Property- Casualty | Life/Health | Consolidation | Total | Property- Casualty | Life/Health | Consolidation | Total | |||||||||||||||||||||||||
| €mn | €mn | €mn | €mn | €mn | €mn | €mn | €mn | |||||||||||||||||||||||||
| Gross | ||||||||||||||||||||||||||||||||
Claims and insurance benefits paid | (14,470) | (9,182) | 13 | (23,639) | (13,530) | (9,176) | 13 | (22,693) | ||||||||||||||||||||||||
Change in loss and loss adjustment expenses | 203 | (32) | — | 171 | 8 | 13 | (2) | 19 | ||||||||||||||||||||||||
Subtotal | (14,267) | (9,214) | 13 | (23,468) | (13,522) | (9,163) | 11 | (22,674) | ||||||||||||||||||||||||
| Ceded | ||||||||||||||||||||||||||||||||
Claims and insurance benefits paid | 1,601 | 382 | (13) | 1,970 | 1,508 | 356 | (13) | 1,851 | ||||||||||||||||||||||||
Change in loss and loss adjustment expenses | 17 | (28) | — | (11) | (258) | 11 | 2 | (245) | ||||||||||||||||||||||||
Subtotal | 1,618 | 354 | (13) | 1,959 | 1,250 | 367 | (11) | 1,606 | ||||||||||||||||||||||||
| Net | ||||||||||||||||||||||||||||||||
Claims and insurance benefits paid | (12,869) | (8,800) | — | (21,669) | (12,022) | (8,820) | — | (20,842) | ||||||||||||||||||||||||
Change in loss and loss adjustment expenses | 220 | (60) | — | 160 | (250) | 24 | — | (226) | ||||||||||||||||||||||||
Total | (12,649) | (8,860) | — | (21,509) | (12,272) | (8,796) | — | (21,068) | ||||||||||||||||||||||||
68
Table of Contents
Notes to the Consolidated Financial Statements
27 Changes in reserves for insurance and investment contracts (net)
| Three months ended June 30, | 2007 | 2006 | ||||||||||||||||||||||||||||||
| Property- Casualty | Life/Health | Consolidation | Total | Property- Casualty | Life/Health | Consolidation | Total | |||||||||||||||||||||||||
| €mn | €mn | €mn | €mn | €mn | €mn | €mn | €mn | |||||||||||||||||||||||||
| Gross | ||||||||||||||||||||||||||||||||
Aggregate policy reserves | (93) | (1,337) | — | (1,430) | (109) | (948) | — | (1,057) | ||||||||||||||||||||||||
Other insurance reserves | (2) | (29) | — | (31) | 7 | (23) | — | (16) | ||||||||||||||||||||||||
Expenses for premium refunds | (15) | (906) | (24) | (945) | (38) | (1,950) | (287) | (2,275) | ||||||||||||||||||||||||
Subtotal | (110) | (2,272) | (24) | (2,406) | (140) | (2,921) | (287) | (3,348) | ||||||||||||||||||||||||
| Ceded | ||||||||||||||||||||||||||||||||
Aggregate policy reserves | 9 | 57 | — | 66 | 11 | (33) | — | (22) | ||||||||||||||||||||||||
Other insurance reserves | 1 | (1) | — | — | 4 | — | — | 4 | ||||||||||||||||||||||||
Expenses for premium refunds | 3 | 5 | — | 8 | 4 | 4 | — | 8 | ||||||||||||||||||||||||
Subtotal | 13 | 61 | — | 74 | 19 | (29) | — | (10) | ||||||||||||||||||||||||
| Net | ||||||||||||||||||||||||||||||||
Aggregate policy reserves | (84) | (1,280) | — | (1,364) | (98) | (981) | — | (1,079) | ||||||||||||||||||||||||
Other insurance reserves | (1) | (30) | — | (31) | 11 | (23) | — | (12) | ||||||||||||||||||||||||
Expenses for premium refunds | (12) | (901) | (24) | (937) | (34) | (1,946) | (287) | (2,267) | ||||||||||||||||||||||||
Total | (97) | (2,211) | (24) | (2,332) | (121) | (2,950) | (287) | (3,358) | ||||||||||||||||||||||||
| Six months ended June 30, | 2007 | 2006 | ||||||||||||||||||||||||||||||
| Property- Casualty | Life/Health | Consolidation | Total | Property- Casualty | Life/Health | Consolidation | Total | |||||||||||||||||||||||||
| €mn | €mn | €mn | €mn | €mn | €mn | €mn | €mn | |||||||||||||||||||||||||
| Gross | ||||||||||||||||||||||||||||||||
Aggregate policy reserves | (155) | (1,841) | — | (1,996) | (168) | (1,531) | — | (1,699) | ||||||||||||||||||||||||
Other insurance reserves | (2) | (123) | — | (125) | 15 | (40) | — | (25) | ||||||||||||||||||||||||
Expenses for premium refunds | (36) | (2,952) | (55) | (3,043) | (66) | (4,051) | (279) | (4,396) | ||||||||||||||||||||||||
Subtotal | (193) | (4,916) | (55) | (5,164) | (219) | (5,622) | (279) | (6,120) | ||||||||||||||||||||||||
| Ceded | ||||||||||||||||||||||||||||||||
Aggregate policy reserves | 8 | 76 | — | 84 | 17 | 10 | — | 27 | ||||||||||||||||||||||||
Other insurance reserves | 2 | (5) | — | (3) | 3 | 5 | — | 8 | ||||||||||||||||||||||||
Expenses for premium refunds | 5 | 10 | — | 15 | 6 | 9 | — | 15 | ||||||||||||||||||||||||
Subtotal | 15 | 81 | — | 96 | 26 | 24 | — | 50 | ||||||||||||||||||||||||
| Net | ||||||||||||||||||||||||||||||||
Aggregate policy reserves | (147) | (1,765) | — | (1,912) | (151) | (1,521) | — | (1,672) | ||||||||||||||||||||||||
Other insurance reserves | — | (128) | — | (128) | 18 | (35) | — | (17) | ||||||||||||||||||||||||
Expenses for premium refunds | (31) | (2,942) | (55) | (3,028) | (60) | (4,042) | (279) | (4,381) | ||||||||||||||||||||||||
Total | (178) | (4,835) | (55) | (5,068) | (193) | (5,598) | (279) | (6,070) | ||||||||||||||||||||||||
69
Table of Contents
Allianz Group Interim Report Second Quarter and First Half of 2007
| Three months ended June 30, | Six months ended June 30, | |||||||||||||||
2007 €mn | 2006 €mn | 2007 €mn | 2006 €mn | |||||||||||||
| Liabilities to banks and customers | (929) | (478) | (1,762) | (1,224) | ||||||||||||
| Deposits retained on reinsurance ceded | (34) | (32) | (54) | (65) | ||||||||||||
| Certificated liabilities | (417) | (354) | (797) | (767) | ||||||||||||
| Participating certificates and subordinated liabilities | (181) | (184) | (359) | (361) | ||||||||||||
| Other | (280) | (236) | (467) | (432) | ||||||||||||
| Total | (1,841) | (1,284) | (3,439) | (2,849) | ||||||||||||
| Three months ended June 30, | Six months ended June 30, | |||||||||||||||
2007 €mn | 2006 €mn | 2007 €mn | 2006 €mn | |||||||||||||
| Additions to allowances including direct impairments | (153) | (115) | (259) | (235) | ||||||||||||
| Amounts released | 38 | 54 | 89 | 154 | ||||||||||||
| Recoveries on loans previously impaired | 41 | 53 | 98 | 105 | ||||||||||||
| Total | (74) | (8) | (72) | 24 | ||||||||||||
30 Impairments of investments (net)
| Three months ended June 30, | Six months ended June 30, | |||||||||||||||
2007 €mn | 2006 €mn | 2007 €mn | 2006 €mn | |||||||||||||
| Impairments | ||||||||||||||||
| Available-for-sale investments | ||||||||||||||||
Equity securities | (95) | (265) | (176) | (312) | ||||||||||||
Debt securities | (1) | (24) | (1) | (26) | ||||||||||||
Subtotal | (96) | (289) | (177) | (338) | ||||||||||||
| Investments in associates and joint ventures | — | — | — | (6) | ||||||||||||
| Real estate held for investment | (7) | (96) | (9) | (97) | ||||||||||||
| Subtotal | (103) | (385) | (186) | (441) | ||||||||||||
| Reversals of impairments | ||||||||||||||||
| Available-for-sale investments | ||||||||||||||||
Debt securities | — | — | 13 | 1 | ||||||||||||
Subtotal | — | — | 13 | 1 | ||||||||||||
| Held-to-maturity investments | — | 1 | — | 1 | ||||||||||||
| Real estate held for investment | 1 | 77 | 4 | 77 | ||||||||||||
| Subtotal | 1 | 78 | 17 | 79 | ||||||||||||
| Total | (102) | (307) | (169) | (362) | ||||||||||||
70
Table of Contents
Notes to the Consolidated Financial Statements
| Three months ended June 30, | Six months ended June 30, | |||||||||||||||
2007 €mn | 2006 €mn | 2007 €mn | 2006 €mn | |||||||||||||
| Investment management expenses | (119) | (132) | (222) | (215) | ||||||||||||
| Depreciation from real estate held for investment | (50) | (54) | (104) | (112) | ||||||||||||
| Other expenses from real estate held for investment | (58) | (54) | (130) | (107) | ||||||||||||
| Foreign currency gains and losses (net) | ||||||||||||||||
Foreign currency gains | 155 | 209 | 282 | 351 | ||||||||||||
Foreign currency losses | (130) | (268) | (289) | (399) | ||||||||||||
Subtotal | 25 | (59) | (7) | (48) | ||||||||||||
| Total | (202) | (299) | (463) | (482) | ||||||||||||
32 Acquisition and administrative expenses (net)
| Three months ended June 30, | 2007 | 2006 | ||||||||||||||||||||||
| Segment | Consolidation | Group | Segment | Consolidation | Group | |||||||||||||||||||
| €mn | €mn | €mn | €mn | €mn | €mn | |||||||||||||||||||
| Property-Casualty | ||||||||||||||||||||||||
Acquisition costs | ||||||||||||||||||||||||
Incurred | (1,768) | — | (1,768) | (1,564) | — | (1,564) | ||||||||||||||||||
Commissions and profit received on reinsurance business ceded | 196 | (1) | 195 | 211 | — | 211 | ||||||||||||||||||
Deferrals of acquisition costs | 890 | — | 890 | 786 | — | 786 | ||||||||||||||||||
Amortization of deferred acquisition costs | (950) | — | (950) | (825) | — | (825) | ||||||||||||||||||
Subtotal | (1,632) | (1) | (1,633) | (1,392) | — | (1,392) | ||||||||||||||||||
Administrative expenses | (1,073) | 28 | (1,045) | (1,119) | (25) | (1,144) | ||||||||||||||||||
Subtotal | (2,705) | 27 | (2,678) | (2,511) | (25) | (2,536) | ||||||||||||||||||
| Life/Health | ||||||||||||||||||||||||
Acquisition costs | ||||||||||||||||||||||||
Incurred | (923) | — | (923) | (1,004) | — | (1,004) | ||||||||||||||||||
Commissions and profit received on reinsurance business ceded | 40 | — | 40 | 28 | — | 28 | ||||||||||||||||||
Deferrals of acquisition costs | 634 | — | 634 | 643 | — | 643 | ||||||||||||||||||
Amortization of deferred acquisition costs | (455) | — | (455) | (391) | — | (391) | ||||||||||||||||||
Subtotal | (704) | — | (704) | (724) | — | (724) | ||||||||||||||||||
Administrative expenses | (411) | (25) | (436) | (381) | (3) | (384) | ||||||||||||||||||
Subtotal | (1,115) | (25) | (1,140) | (1,105) | (3) | (1,108) | ||||||||||||||||||
| Banking | ||||||||||||||||||||||||
Personnel expenses | (820) | — | (820) | (912) | — | (912) | ||||||||||||||||||
Non-personnel expenses | (514) | 23 | (491) | (524) | 20 | (504) | ||||||||||||||||||
Subtotal | (1,334) | 23 | (1,311) | (1,436) | 20 | (1,416) | ||||||||||||||||||
| Asset Management | ||||||||||||||||||||||||
Personnel expenses | (383) | — | (383) | (400) | — | (400) | ||||||||||||||||||
Non-personnel expenses | (172) | 7 | (165) | (161) | 1 | (160) | ||||||||||||||||||
Subtotal | (555) | 7 | (548) | (561) | 1 | (560) | ||||||||||||||||||
| Corporate | ||||||||||||||||||||||||
Administrative expenses | (251) | (22) | (273) | (142) | 44 | (98) | ||||||||||||||||||
Subtotal | (251) | (22) | (273) | (142) | 44 | (98) | ||||||||||||||||||
| Total | (5,960) | 10 | (5,950) | (5,755) | 37 | (5,718) | ||||||||||||||||||
71
Table of Contents
Allianz Group Interim Report Second Quarter and First Half of 2007
32 Acquisition and administrative expenses (net) (continued)
| Six months ended June 30, | 2007 | 2006 | ||||||||||||||||||||||
| Segment | Consolidation | Group | Segment | Consolidation | Group | |||||||||||||||||||
| €mn | €mn | €mn | €mn | €mn | €mn | |||||||||||||||||||
| Property-Casualty | ||||||||||||||||||||||||
Acquisition costs | ||||||||||||||||||||||||
Incurred | (3,838) | — | (3,838) | (3,465) | — | (3,465) | ||||||||||||||||||
Commissions and profit received on reinsurance business ceded | 366 | (1) | 365 | 379 | — | 379 | ||||||||||||||||||
Deferrals of acquisition costs | 2,477 | — | 2,477 | 1,964 | — | 1,964 | ||||||||||||||||||
Amortization of deferred acquisition costs | (2,217) | — | (2,217) | (1,777) | — | (1,777) | ||||||||||||||||||
Subtotal | (3,212) | (1) | (3,213) | (2,899) | — | (2,899) | ||||||||||||||||||
Administrative expenses | (2,168) | 44 | (2,124) | (2,275) | 26 | (2,249) | ||||||||||||||||||
Subtotal | (5,380) | 43 | (5,337) | (5,174) | 26 | (5,148) | ||||||||||||||||||
| Life/Health | ||||||||||||||||||||||||
Acquisition costs | ||||||||||||||||||||||||
Incurred | (1,830) | 1 | (1,829) | (1,984) | — | (1,984) | ||||||||||||||||||
Commissions and profit received on reinsurance business ceded | 88 | — | 88 | 54 | — | 54 | ||||||||||||||||||
Deferrals of acquisition costs | 1,261 | — | 1,261 | 1,473 | — | 1,473 | ||||||||||||||||||
Amortization of deferred acquisition costs | (637) | — | (637) | (920) | — | (920) | ||||||||||||||||||
Subtotal | (1,118) | 1 | (1,117) | (1,377) | — | (1,377) | ||||||||||||||||||
Administrative expenses | (871) | (35) | (906) | (753) | 9 | (744) | ||||||||||||||||||
Subtotal | (1,989) | (34) | (2,023) | (2,130) | 9 | (2,121) | ||||||||||||||||||
| Banking | ||||||||||||||||||||||||
Personnel expenses | (1,727) | — | (1,727) | (1,822) | — | (1,822) | ||||||||||||||||||
Non-personnel expenses | (1,017) | 32 | (985) | (1,042) | 30 | (1,012) | ||||||||||||||||||
Subtotal | (2,744) | 32 | (2,712) | (2,864) | 30 | (2,834) | ||||||||||||||||||
| Asset Management | ||||||||||||||||||||||||
Personnel expenses | (808) | — | (808) | (827) | — | (827) | ||||||||||||||||||
Non-personnel expenses | (337) | 13 | (324) | (319) | 1 | (318) | ||||||||||||||||||
Subtotal | (1,145) | 13 | (1,132) | (1,146) | 1 | (1,145) | ||||||||||||||||||
| Corporate | ||||||||||||||||||||||||
Administrative expenses | (368) | (16) | (384) | (281) | 2 | (279) | ||||||||||||||||||
Subtotal | (368) | (16) | (384) | (281) | 2 | (279) | ||||||||||||||||||
| Total | (11,626) | 38 | (11,588) | (11,595) | 68 | (11,527) | ||||||||||||||||||
72
Table of Contents
Notes to the Consolidated Financial Statements
33 Fee and commission expenses
| Three months ended June 30, | 2007 | 2006 | ||||||||||||||||||||||
Segment €mn | Consolidation €mn | Group €mn | Segment €mn | Consolidation €mn | Group €mn | |||||||||||||||||||
| Property-Casualty | ||||||||||||||||||||||||
Fees from credit and assistance business | (116) | 1 | (115) | (120) | — | (120) | ||||||||||||||||||
Service agreements | (74) | 4 | (70) | (84) | 7 | (77) | ||||||||||||||||||
Investment advisory | — | — | — | (1) | 2 | 1 | ||||||||||||||||||
Subtotal | (190) | 5 | (185) | (205) | 9 | (196) | ||||||||||||||||||
| Life/Health | ||||||||||||||||||||||||
Service agreements | (7) | — | (7) | (42) | 15 | (27) | ||||||||||||||||||
Investment advisory | (36) | (2) | (34) | (28) | — | (28) | ||||||||||||||||||
Subtotal | (43) | 2 | (41) | (70) | 15 | (55) | ||||||||||||||||||
| Banking | ||||||||||||||||||||||||
Securities business | (45) | — | (45) | (33) | — | (33) | ||||||||||||||||||
Investment advisory | (50) | 2 | (48) | (46) | 2 | (44) | ||||||||||||||||||
Payment transactions | (6) | — | (6) | (6) | — | (6) | ||||||||||||||||||
Mergers and acquisitions advisory | (9) | — | (9) | (8) | — | (8) | ||||||||||||||||||
Underwriting business | (1) | — | (1) | (1) | — | (1) | ||||||||||||||||||
Other | (46) | 7 | (39) | (46) | 17 | (29) | ||||||||||||||||||
Subtotal | (157) | 9 | (148) | (140) | 19 | (121) | ||||||||||||||||||
| Asset Management | ||||||||||||||||||||||||
Commissions | (241) | 110 | (131) | (209) | 100 | (109) | ||||||||||||||||||
Other | (74) | 1 | (73) | (109) | — | (109) | ||||||||||||||||||
Subtotal | (315) | 111 | (204) | (318) | 100 | (218) | ||||||||||||||||||
| Corporate | ||||||||||||||||||||||||
Service agreements | (26) | 3 | (23) | (19) | 2 | (17) | ||||||||||||||||||
Subtotal | (26) | 3 | (23) | (19) | 2 | (17) | ||||||||||||||||||
| Total | (731) | 130 | (601) | (752) | 145 | (607) | ||||||||||||||||||
| Six months ended June 30, | 2007 | 2006 | ||||||||||||||||||||||
Segment €mn | Consolidation €mn | Group €mn | Segment €mn | Consolidation €mn | Group €mn | |||||||||||||||||||
| Property-Casualty | ||||||||||||||||||||||||
Fees from credit and assistance business | (234) | 1 | (233) | (244) | — | (244) | ||||||||||||||||||
Service agreements | (153) | 8 | (145) | (128) | 11 | (117) | ||||||||||||||||||
Investment advisory | — | — | — | (3) | 2 | (1) | ||||||||||||||||||
Subtotal | (387) | 9 | (378) | (375) | 13 | (362) | ||||||||||||||||||
| Life/Health | ||||||||||||||||||||||||
Service agreements | (28) | 8 | (20) | (67) | 21 | (46) | ||||||||||||||||||
Investment advisory | (77) | 3 | (74) | (53) | — | (53) | ||||||||||||||||||
Subtotal | (105) | 11 | (94) | (120) | 21 | (99) | ||||||||||||||||||
| Banking | ||||||||||||||||||||||||
Securities business | (85) | — | (85) | (66) | — | (66) | ||||||||||||||||||
Investment advisory | (96) | 4 | (92) | (96) | 4 | (92) | ||||||||||||||||||
Payment transactions | (11) | — | (11) | (11) | — | (11) | ||||||||||||||||||
Mergers and acquisitions advisory | (12) | — | (12) | (17) | — | (17) | ||||||||||||||||||
Underwriting business | (1) | — | (1) | (2) | — | (2) | ||||||||||||||||||
Other | (98) | 10 | (88) | (108) | 34 | (74) | ||||||||||||||||||
Subtotal | (303) | 14 | (289) | (300) | 38 | (262) | ||||||||||||||||||
| Asset Management | ||||||||||||||||||||||||
Commissions | (476) | 222 | (254) | (451) | 207 | (244) | ||||||||||||||||||
Other | (166) | 2 | (164) | (181) | 1 | (180) | ||||||||||||||||||
Subtotal | (642) | 224 | (418) | (632) | 208 | (424) | ||||||||||||||||||
| Corporate | ||||||||||||||||||||||||
Service agreements | (61) | 5 | (56) | (42) | 4 | (38) | ||||||||||||||||||
Subtotal | (61) | 5 | (56) | (42) | 4 | (38) | ||||||||||||||||||
| Total | (1,498) | 263 | (1,235) | (1,469) | 284 | (1,185) | ||||||||||||||||||
73
Table of Contents
Allianz Group Interim Report Second Quarter and First Half of 2007
| Three months ended June 30, | Six months ended June 30, | |||||||||||||||
2007 €mn | 2006 €mn | 2007 €mn | 2006 €mn | |||||||||||||
| Expenses from real estate held for use | ||||||||||||||||
Realized losses from disposals of real estate held for use | — | (2) | — | (2) | ||||||||||||
Impairments of real estate held for use | (1) | — | (1) | (1) | ||||||||||||
Subtotal | (1) | (2) | (1) | (3) | ||||||||||||
| Other | 1 | 14 | 14 | 14 | ||||||||||||
| Total | — | 12 | 13 | 11 | ||||||||||||
35 Expenses from fully consolidated private equity investments
| 2007 | 2006 | |||||||||||||||||||||||||||
MAN Roland | Four Seasons Health Care Ltd | Other | Total | MAN Roland | Four Seasons Health Care Ltd | Total | ||||||||||||||||||||||
| €mn | €mn | €mn | €mn | €mn | €mn | €mn | ||||||||||||||||||||||
| Three months ended June 30, | ||||||||||||||||||||||||||||
| Cost of goods sold | (358) | — | — | (358) | — | — | — | |||||||||||||||||||||
| Commissions | (40) | — | — | (40) | — | — | — | |||||||||||||||||||||
| General and administrative expenses | (50) | — | (1) | (51) | — | (136) | (136) | |||||||||||||||||||||
| Interest expense | (7) | — | — | (7) | — | (16) | (16) | |||||||||||||||||||||
| Total | (455) | — | (1) | (456) | — | (152) | (152) | |||||||||||||||||||||
| Six months ended June 30, | ||||||||||||||||||||||||||||
| Cost of goods sold | (710) | — | — | (710) | — | — | — | |||||||||||||||||||||
| Commissions | (79) | — | — | (79) | — | — | — | |||||||||||||||||||||
| General and administrative expenses | (112) | — | (1) | (113) | — | (264) | (264) | |||||||||||||||||||||
| Interest expense | (14) | — | — | (14) | — | (50) | (50) | |||||||||||||||||||||
| Total | (915) | — | (1) | (916) | — | (314) | (314) | |||||||||||||||||||||
| Three months ended June 30, | Six months ended June 30, | |||||||||||||||
2007 €mn | 2006 €mn | 2007 €mn | 2006 €mn | |||||||||||||
| Current income tax expense | (654) | (451) | (1,340) | (1,109) | ||||||||||||
| Deferred income tax expense | (204) | 94 | (485) | (147) | ||||||||||||
| Total | (858) | (357) | (1,825) | (1,256) | ||||||||||||
74
Table of Contents
Notes to the Consolidated Financial Statements
Basic earnings per share is computed by dividing net income by the weighted average number of common shares outstanding for the period. Diluted earnings per
share reflects the effect of dilutive securities. Dilutive securities include participation certificates issued by Allianz SE which can potentially be converted to Allianz shares, warrants issued by Allianz SE, share-based compensation plans, and derivatives on own shares.
| Three months ended June 30, | Six months ended June 30, | |||||||||||||||
2007 €mn | 2006 €mn | 2007 €mn | 2006 €mn | |||||||||||||
| Numerator for basic earnings per share (net income) | 2,140 | 2,279 | 5,380 | 4,058 | ||||||||||||
| Effect of dilutive securities | — | (7) | 1 | (3) | ||||||||||||
| Numerator for diluted earnings per share (net income after assumed conversion) | 2,140 | 2,272 | 5,381 | 4,055 | ||||||||||||
| Denominator for basic earnings per share (weighted-average shares) | 441,507,123 | 405,326,745 | 436,618,651 | 405,096,498 | ||||||||||||
| Dilutive securities: | ||||||||||||||||
Participation certificates | 1,469,443 | 1,469,443 | 1,469,443 | 1,469,443 | ||||||||||||
Warrants | 1,051,153 | 596,450 | 1,008,321 | 637,669 | ||||||||||||
Share-based compensation plans | 42,837 | 794,767 | 93,698 | 799,490 | ||||||||||||
Derivatives on own shares | 6,790,408 | 4,321,217 | 6,291,475 | 4,617,832 | ||||||||||||
| Subtotal | 9,353,841 | 7,181,877 | 8,862,937 | 7,524,434 | ||||||||||||
| Denominator for diluted earnings per share (weighted-average shares after assumed conversion) | 450,860,964 | 412,508,622 | 445,481,588 | 412,620,932 | ||||||||||||
| Basic earnings per share | €4.85 | €5.62 | €12.32 | €10.02 | ||||||||||||
| Diluted earnings per share | €4.75 | €5.51 | €12.08 | €9.83 | ||||||||||||
For the six months ended June 30, 2007, the weighted average number of shares excludes 1,251,988 (2006: 943,502) treasury shares.
75
Table of Contents
Allianz Group Interim Report Second Quarter and First Half of 2007
38 Supplemental information on the Banking segment
Net interest income from the Banking segment
| 2007 | 2006 | |||||||||||||||||||||||
Segment €mn | Consolidation €mn | Group €mn | Segment €mn | Consolidation €mn | Group €mn | |||||||||||||||||||
| Three months ended June 30, | ||||||||||||||||||||||||
| Interest and similar income | 2,214 | (32) | 2,182 | 1,630 | 14 | 1,644 | ||||||||||||||||||
| Interest expense | (1,484) | 53 | (1,431) | (978) | 13 | (965) | ||||||||||||||||||
| Net interest income | 730 | 21 | 751 | 652 | 27 | 679 | ||||||||||||||||||
| Six months ended June 30, | ||||||||||||||||||||||||
| Interest and similar income | 4,423 | (43) | 4,380 | 3,510 | (9) | 3,501 | ||||||||||||||||||
| Interest expense | (2,765) | 84 | (2,681) | (2,257) | 32 | (2,225) | ||||||||||||||||||
| Net interest income | 1,658 | 41 | 1,699 | 1,253 | 23 | 1,276 | ||||||||||||||||||
Net fee and commission income from the Banking segment
| 2007 | 2006 | |||||||||||||||||||||||
Segment €mn | Consolidation €mn | Group €mn | Segment €mn | Consolidation €mn | Group €mn | |||||||||||||||||||
| Three months ended June 30, | ||||||||||||||||||||||||
| Fee and commission income | 923 | (106) | 817 | 868 | (102) | 766 | ||||||||||||||||||
| Fee and commission expense | (157) | 9 | (148) | (140) | 19 | (121) | ||||||||||||||||||
| Net fee and commission income | 766 | (97) | 669 | 728 | (83) | 645 | ||||||||||||||||||
| Six months ended June 30, | ||||||||||||||||||||||||
| Fee and commission income | 1,901 | (202) | 1,699 | 1,860 | (215) | 1,645 | ||||||||||||||||||
| Fee and commission expense | (303) | 14 | (289) | (300) | 38 | (262) | ||||||||||||||||||
| Net fee and commission income | 1,598 | (188) | 1,410 | 1,560 | (177) | 1,383 | ||||||||||||||||||
The net fee and commission income of the Allianz Group’s Banking segment includes the following:
| Three months ended June 30, | Six months ended June 30, | |||||||||||||||
2007 €mn | 2006 €mn | 2007 €mn | 2006 €mn | |||||||||||||
| Securities business | 317 | 314 | 742 | 746 | ||||||||||||
| Investment advisory | 104 | 110 | 212 | 212 | ||||||||||||
| Payment transactions | 85 | 86 | 171 | 172 | ||||||||||||
| Mergers and acquisitions advisory | 63 | 51 | 101 | 107 | ||||||||||||
| Underwriting business | 18 | 39 | 41 | 73 | ||||||||||||
| Other | 179 | 128 | 331 | 250 | ||||||||||||
| Total | 766 | 728 | 1,598 | 1,560 | ||||||||||||
76
Table of Contents
Notes to the Consolidated Financial Statements
39 Supplemental information on the consolidated statements of cash flows
| Six months ended June 30, | ||||||||
2007 €mn | 2006 €mn | |||||||
| Income taxes (paid)/received | (1,147) | (265) | ||||||
| Dividends received | 1,460 | 1,507 | ||||||
| Interest received | 11,043 | 10,151 | ||||||
| Interest paid | (3,359) | (2,662) | ||||||
| Significant non-cash transactions: | ||||||||
Settlement of exchangeable bonds issued by Allianz Finance II B.V. for shares: | ||||||||
Available-for-sale investments | (812) | (842) | ||||||
Certificated liabilities | (812) | (842) | ||||||
Novation of quota share reinsurance agreement: | ||||||||
Reinsurance assets | (1,216) | (1,115) | ||||||
Deferred acquisition costs | 71 | 71 | ||||||
Payables from reinsurance contracts | (1,145) | (1,044) | ||||||
Effects from buyout of AGF minorities: | ||||||||
Revenue reserves | (1,843) | — | ||||||
Unrealized gains and losses (net) | 146 | — | ||||||
Minority interests | (1,068) | — | ||||||
Paid-in capital | 2,765 | — | ||||||
On February 21, 2007, the Allianz Group increased its investment in Russians People’s Insurance Society “ROSNO”, Moscow from 47.4% to 97.2% at a purchase price of €571 mn. The impact of the acquisition, net of cash acquired, on the consolidated statement of cash flows for the six months ended June 30, 2007 was:
| As of June 30, | 2007 €mn | |||
| Intangible assets | (525) | |||
| Other assets | (798) | |||
| Other liabilities | 713 | |||
| Deferred tax liabilities | 15 | |||
| Minority interests | 10 | |||
| Less: previous investment in ROSNO | 78 | |||
| Acquisition of subsidiary, net of cash acquired | (507) |
Number of employees
The Allianz Group had a total of 173,215 (2006: 166,505) employees as of June 30, 2007. 73,894 (2006: 76,790) of these were employed in Germany and 99,321 (2006: 89,715) in other countries. The number of employees undergoing training decreased by 122 to 3,833.
Allianz Capital Partners GmbH (“ACP”) acquires 40% of ferry operator Scandlines AG
On June 19, 2007 a consortium of Allianz Capital Partners GmbH (“ACP”), Munich, 3i Group, Frankfurt and Copenhagen, and Deutsche Seereederei GmbH (“DSR”), Rostock, signed a contract to purchase the shares of ferry operator Scandlines AG with the previous owners, Deutsche Bahn AG and the Danish Ministry of Transport and Energy.
The agreement is subject to approval by the supervisory board of Deutsche Bahn AG, the Finance Committee in the Danish parliament and anti-trust authorities.
ACP and 3i Group will each hold 40% of the shares of
the consortium, while DSR will hold 20% of the shares.
Allianz Capital Partners GmbH (“ACP”) acquires Selecta
On July 3, 2007, Allianz Capital Partners GmbH (“ACP”), Munich, acquired the leading European vending operator Selecta.
Allianz Group completes squeeze-out procedure for Assurances Générales de France (AGF)
On July 10, 2007, the Allianz Group completed the squeeze-out procedure for AGF. As a result, the AGF shares are no longer listed on the Paris stock exchange Euronext.
The acquisition of the AGF shares, which Allianz did not already own is now fully completed. Allianz now holds 100% of the shares in AGF.
77
Table of Contents
Allianz Group Interim Report Second Quarter and First Half of 2007
Standard & Poor’s raised its rating for Allianz SE to “AA”
On July 11, 2007, Standard & Poor’s (S&P) raised its long-term counterparty credit and insurer financial strength ratings on Allianz SE and various core entities from “AA-” to “AA”. This consequentially led to a raise of ratings on various strategically important insurance subsidiaries of Allianz from “A+” to “AA-”. The rating agency affirmed its “A-1+” short-term ratings on Allianz SE and various core operating subsidiaries. The outlook for all Allianz entities remains stable.
Corporate Tax Reform 2008
In July 2007 the Bill on the 2008 Corporate Tax Reform has been passed by the upper house of the German parliament which, among other, will lead to a reduction of
income tax rates for German corporations from January 1, 2008. Consequently, from third quarter 2007 onwards, the Allianz Group will calculate its deferred taxes in Germany applying an accordingly reduced tax rate. Based on preliminary calculations the Allianz Group expects no material impact from the application of the reduced tax rate on its deferred tax balances.
European Floods and Storms
As a result of the severe flooding in the United Kingdom during late June and July 2007, the Allianz Group estimates further claims losses of approximately €135 mn. In addition, claims from July storms in Germany are expected to result in losses of approximately €55 mn, net of reinsurance.
78
Table of Contents
Notes to the Consolidated Financial Statements
To the best of our knowledge, and in accordance with the applicable reporting principles for interim financial reporting, the interim consolidated financial statements give a true and fair view of the net assets, financial position and results of operations of the group, and the interim management report of the group includes a true and fair review of the development and performance of the business and the position of the group, together with a description of the principal opportunities and risks associated with the expected development of the group for the remaining months of the financial year.
Munich, August 2, 2007
Allianz SE
The Board of Management

79
Table of Contents
Allianz Group Interim Report Second Quarter and First Half of 2007
To Allianz SE, Munich
We have reviewed the condensed interim consolidated financial statements - comprising the balance sheet, income statement, condensed cash flow statement, statement of changes in equity and selected explanatory notes - and the interim group management report of Allianz SE, Munich for the period from January 1 to June 30, 2007 which are part of the half year financial reports according to § 37 w WpHG [„Wertpapierhandelsgesetz“: „German Securities Trading Act“]. The preparation of the condensed interim consolidated financial statements in accordance with the IFRS applicable to interim financial reporting as adopted by the EU, and of the interim group management report which has been prepared in accordance with the regulations of the German Securities Trading Act applicable to interim group management reports is the responsibility of the Company’s management. Our responsibility is to issue a review report on these condensed interim consolidated financial statements and on the interim group management report based on our review.
We performed our review of the condensed interim consolidated financial statements and the interim group management report in accordance with the German generally accepted standards for the review of financial statements promulgated by the Institut der Wirtschaftsprüfer (IDW). Those standards require that we plan and conduct the review so that we can preclude through critical evaluation, with a certain level of assurance, that the condensed interim consolidated financial statements
have not been prepared, in material aspects, in accordance with the IFRS applicable to interim financial reporting as adopted by the EU, and that the interim group management report has not been prepared, in material aspects, in accordance with the regulations of the German Securities Trading Act applicable to interim group management reports. A review is limited primarily to inquiries of company employees and analytical assessments and therefore does not provide the assurance attainable in a financial statement audit. Since, in accordance with our engagement, we have not performed a financial statement audit, we cannot issue an auditor’s report.
Based on our review, no matters have come to our attention that cause us to presume that the condensed interim consolidated financial statements have not been prepared, in all material respects, in accordance with the IFRS applicable to interim financial reporting as adopted by the EU and that the interim group management report has not been prepared, in all material respects, in accordance with the regulations of the German Securities Trading Act applicable to interim group management reports.
Munich, August 10, 2007
KPMG Deutsche Treuhand-Gesellschaft
Aktiengesellschaft
Wirtschaftsprüfungsgesellschaft
| Johannes Pastor | Dr. Frank Pfaffenzeller | |
| Independent Auditor | Independent Auditor |
80
Table of Contents
Allianz SE
Koeniginstrasse 28
80802 Muenchen
Germany
Telephone +49 89 38 00 0
Telefax +49 89 34 99 41
www.allianz.com
Table of Contents
SIGNATURE
Pursuant to the requirements of the Securities Exchange Act of 1934, the registrant has duly caused this report to be signed on its behalf by the undersigned, thereunto duly authorized.
Date: August 10, 2007
| ALLIANZ SE | ||||
| By | /s/ Harold Michael Langley-Poole | |||
| Name: | Harold Michael Langley-Poole | |||
| Title: | Head of Group Management Reporting | |||