Table of Contents
SECURITIES AND EXCHANGE COMMISSION
Washington, D.C. 20549
Form 6-K
Report of Foreign Private Issuer
Pursuant to Rules 13a-16 or 15d-16 of
the Securities Exchange Act of 1934
for the period ended September 30, 2007
Commission file Number: 1-15154
ALLIANZ SE
Königinstrasse 28
80802 Munich
Germany
(Address of principal executive offices)
Indicate by check mark whether the registrant files or will file annual reports under cover Form 20-F or Form 40-F.
Form 20-F x Form 40-F ¨
Indicate by check mark whether the registrant by furnishing the information contained in this Form is also thereby furnishing the information to the Commission pursuant to Rule 12g3-2(b) under the Securities Exchange Act of 1934.
Yes ¨ No x
THIS REPORT ON FORM 6-K (EXCEPT FOR ANY NON-GAAP FINANCIAL MEASURE AS SUCH TERM IS DEFINED IN REGULATION G UNDER THE SECURITIES EXCHANGE ACT OF 1934, AS AMENDED) SHALL BE DEEMED TO BE INCORPORATED BY REFERENCE IN THE REGISTRATION STATEMENTS ON FORM S-8 (FILE NO. 333-13462 AND NO. 333-139900) OF ALLIANZ SE AND TO BE A PART THEREOF FROM THE DATE ON WHICH THIS REPORT IS FURNISHED, TO THE EXTENT NOT SUPERSEDED BY DOCUMENTS OR REPORTS SUBSEQUENTLY FILED OR FURNISHED. FOR THE AVOIDANCE OF DOUBT, THE DISCLOSURE CONTAINING ANY NON-GAAP FINANCIAL MEASURE CONTAINED IN THE ATTACHED REPORT IS NOT INCORPORATED BY REFERENCE INTO THE ABOVE-MENTIONED REGISTRATION STATEMENTS FILED BY ALLIANZ SE.
Table of Contents

Table of Contents
| Condensed Consolidated Financial Statements for the Third Quarter and First Nine Months of 2007 | 37 | |||||
| Notes to the Condensed Consolidated Financial Statements | 43 | |||||
Development of the Allianz share price versus Dow Jones EURO STOXX 50 and Dow Jones EURO STOXX Insurance
indexed on the Allianz share price in€
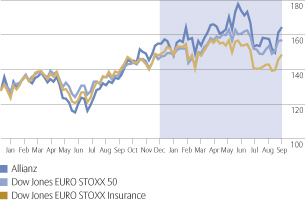
Source: Thomson Financial Datastream
Current information on the development of the Allianz share price is available on the internet atwww.allianz.com/stock.
Basic Allianz share information
| Share type | Registered share with restricted transfer | |||
| Denomination | No-par-value share | |||
| Stock exchanges | All German stock exchanges, London, Paris, Zurich, Milan, New York | |||
| Security Codes | WKN 840 400 ISIN DE 000 840 400 5 | |||
| Bloomberg | ALV GY | |||
| Reuters | ALVG.DE |
Investor Relations
We endeavor to keep our shareholders up-to-date on all company developments. Our Investor Relations Team is pleased to answer any questions you may have.
Allianz SE
Investor Relations
Koeniginstrasse 28
80802 Muenchen
Germany
| Investor Line: | + 49 1802 2554269 | |||
| + 49 1802 ALLIANZ | ||||
| Fax: | + 49 89 3800 3899 | |||
| E-mail: investor.relations@allianz.com | ||||
| Internet:www.allianz.com/investor-relations | ||||
Table of Contents
Allianz Group Key Data
Balance sheet
As of September 30, 2007 €mn | As of December 31, €mn | Change | ||||||||||
| Investments | 292,185 | 298,134 | (2.0)% | |||||||||
| Loans and advances to banks and customers | 457,441 | 408,278 | 12.0% | |||||||||
| Total assets | 1,094,763 | 1,053,226 | 3.9% | |||||||||
| Liabilities to banks and customers | 392,629 | 361,078 | 8.7% | |||||||||
| Reserves for loss and loss adjustment expenses | 64,712 | 65,464 | (1.1)% | |||||||||
| Reserves for insurance and investment contracts | 290,997 | 287,697 | 1.1% | |||||||||
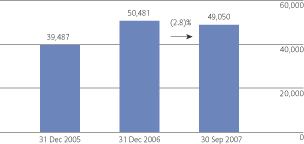
| Shareholders’ equity | 49,050 | 50,481 | (2.8)% | |||||||||
| Minority interests | 2,819 | 6,409 | (56.0)% |
Allianz SE ratings as of September 30, 20071)
Standard & Poor’s | Moody’s | A.M. Best | ||||||||||
| Insurer financial strength | AA | Aa3 | A+ | |||||||||
| Outlook | Stable | Stable | Stable | |||||||||
| Counterparty credit | AA | Not rated | aa–2) | |||||||||
| Outlook | Stable | Stable | ||||||||||
| Senior unsecured debt | AA | Aa3 | aa– | |||||||||
| Outlook | Stable | Stable | ||||||||||
| Subordinated debt | A+/A3) | A2/A33) | a+/a3) | |||||||||
| Outlook | Stable | Stable | ||||||||||
Commercial paper (short term) | A-1+ | P-1 | Not rated | |||||||||
| Outlook | Stable | |||||||||||
1) | Includes ratings for securities issued by Allianz Finance B.V., Allianz Finance II B.V. and Allianz Finance Corporation. |
2) | Issuer credit rating. |
3) | Ratings vary on the basis of maturity period and terms. |
Other selected financial data
| Three months ended September 30, | Nine months ended September 30, | |||||||||||||||||||||||||
| 2007 | 2006 | Change from previous year | 2007 | 2006 | Change from previous year | |||||||||||||||||||||
| Income statement | ||||||||||||||||||||||||||
| Total revenues1) | €mn | 23,004 | 22,599 | 1.8% | 76,664 | 76,308 | 0.5% | |||||||||||||||||||
| Operating profit2) | €mn | 2,604 | 2,660 | (2.1)% | 8,762 | 8,131 | 7.8% | |||||||||||||||||||
| Income before income taxes and minority interests in earnings | €mn | 2,694 | 2,673 | 0.8% | 10,448 | 8,696 | 20.1% | |||||||||||||||||||
| Net income | €mn | 1,921 | 1,591 | 20.7% | 7,301 | 5,649 | 29.2% | |||||||||||||||||||
| Segments | ||||||||||||||||||||||||||
| Property-Casualty | ||||||||||||||||||||||||||
| Operating profit2) | €mn | 1,487 | 1,727 | (13.9)% | 4,648 | 4,958 | (6.3)% | |||||||||||||||||||
| Loss ratio | % | 66.5 | 64.2 | 2.3%-p | 66.5 | 65.1 | 1.4%-p | |||||||||||||||||||
| Expense ratio | % | 27.6 | 26.0 | 1.6%-p | 28.1 | 27.1 | 1.0%-p | |||||||||||||||||||
| Combined ratio | % | 94.1 | 90.2 | 3.9%-p | 94.6 | 92.2 | 2.4%-p | |||||||||||||||||||
| Life/Health | ||||||||||||||||||||||||||
| Operating profit2) | €mn | 873 | 617 | 41.5% | 2,381 | 1,867 | 27.5% | |||||||||||||||||||
| Statutory expense ratio | % | 11.0 | 11.3 | (0.3)%-p | 9.2 | 9.5 | (0.3)%-p | |||||||||||||||||||
| Banking | ||||||||||||||||||||||||||
| Operating profit2) | €mn | 78 | 406 | (80.8)% | 1,226 | 1,219 | 0.6% | |||||||||||||||||||
| Cost-income ratio | % | 92.2 | 78.9 | 13.3%-p | 75.0 | 78.6 | (3.6)%-p | |||||||||||||||||||
| Loan loss provisions | €mn | (21) | 52 | —4) | (81) | 78 | —4) | |||||||||||||||||||
| Coverage ratio3) as of September 30, | % | 66.3 | 58.55) | 7.8%-p | 66.3 | 58.55) | 7.8%-p | |||||||||||||||||||
| Asset Management | ||||||||||||||||||||||||||
| Operating profit2) | €mn | 330 | 294 | 12.2% | 967 | 895 | 8.0% | |||||||||||||||||||
| Cost-income ratio | % | 58.9 | 59.5 | (0.6)%-p | 59.4 | 59.4 | — | |||||||||||||||||||
| Third-party assets under management as of September 30, | €bn | 775 | 7645) | 1.4% | 775 | 7645) | 1.4% | |||||||||||||||||||
| Share information | ||||||||||||||||||||||||||
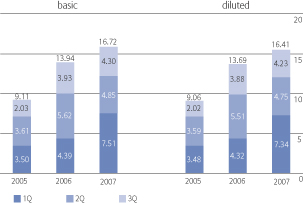
| Basic earnings per share | € | 4.30 | 3.93 | 9.4% | 16.72 | 13.94 | 19.9% | |||||||||||||||||||
| Diluted earnings per share | € | 4.23 | 3.88 | 9.0% | 16.41 | 13.69 | 19.9% | |||||||||||||||||||
| Share price as of September 30, | € | 163.85 | 154.765) | 5.9% | 163.85 | 154.765) | 5.9% | |||||||||||||||||||
| Market capitalization as of September 30, | €bn | 73.6 | 66.95) | 10.0% | 73.6 | 66.95) | 10.0% | |||||||||||||||||||
1) | Total revenues comprise Property-Casualty segment’s gross premiums written, Life/Health segment’s statutory premiums, Banking segment’s operating revenues and Asset Management segment’s operating revenues. |
2) | The Allianz Group uses operating profit to evaluate the performance of its business segments and the Group as a whole. |
3) | Represents total loan loss allowances as a percentage of total non-performing loans and potential problem loans. |
4) | Presentation not meaningful. |
5) | As of December 31, 2006. |
1
Table of Contents
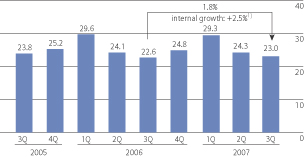
Total revenues
in€bn
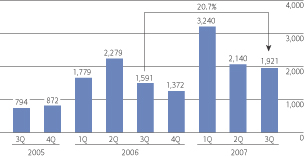
Net income
in€mn
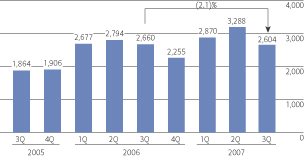
Operating profit
in€mn
Shareholders’ equity2)
in€mn
1) | Internal total revenue growth excludes the effects of foreign currency translation as well as acquisitions and disposals. Please see page 36 for a reconciliation of nominal total revenue growth to internal total revenue growth for each of our segments and the Allianz Group as a whole. |
2) | Does not include minority interests. |
2
Table of Contents
Group Management Report
Allianz Group’s Consolidated Results of Operations
Total revenues
Total revenues – Segments
in€mn
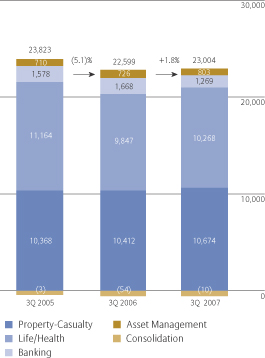
Our total revenues were up 1.8% to €23,004 million for the third quarter and 0.5% to €76,664 million for the first nine months. Total internal revenue growth amounted to 2.5% and 1.4% for the third quarter and the first nine months respectively. The main driver in 3Q was the development in the insurance segments delivering 4.1% internal revenue growth. Asset Management revenues grew on an internal basis by 15.7%, whereas in the Banking segment, effects from the current market situation led to a significant shortfall in net trading income, reflected in negative internal growth of 23.0%.
Property-Casualty Gross premiums written increased by 2.5% to €10,674 million, reflecting our diligent risk selection and focus on profitability. Through this policy we were able to selectively grow premiums. Internal revenue growth amounted to 1.8% (9M 2007: 1.2%).
Life/Health At €10,268 million in the third quarter, statutory premiums were up 4.3% (9M 2007: €34,352 million). We achieved strong double-digit growth in many markets around the world, with substantial contributions from Asia-Pacific, Italy and France. The situation in the United States is still challenging, however good progress is being made, notwithstanding the current revenue shortfall. On an internal basis, premiums grew by 6.2% (9M 2007: 1.1%). At the same time our operating asset base increased from €341.9 billion as of September 30, 2006 to €354.4 billion as of September 30, 2007.
Banking The third quarter was challenging for the Banking business due to the effects of the financial markets turbulence. Revenues showed a decline of 23.9% to €1,269 million, entirely attributable to a significant drop in net trading income, whereas the other revenue components developed positively. The development of the first nine months was also affected by the current market situation which led to a decrease of 1.9% to €5,220 million compared to the same period a year ago. Internal growth was (23.0)% and (1.2)% for the third quarter and the first nine months respectively.
Asset Management The strong performance track record of our asset management business continued. The third quarter was characterized by a challenging market environment which led to a negative market sentiment. Our own net outflows in the third quarter were €8 billion, leaving net inflows for the nine months at €12 billion. In line with the higher asset base operating revenues were up 10.6% in 3Q 2007.
3
Table of Contents
Allianz Group Interim Report Third Quarter and First Nine Months of 2007
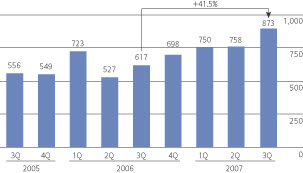
Operating profit
Operating profit – Segments
in€mn
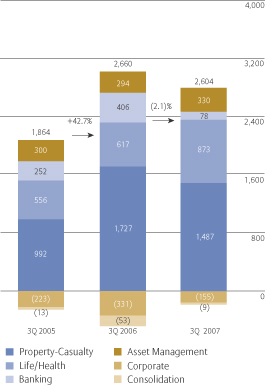
Operating profit increased by €631 million for the first nine months.
Property-Casualty We saw another quarter of strong operating profitability. At €1,487 million, operating profit was only €240 million below the comparison period which benefited from exceptionally low claims from natural catastrophes. On a nine months basis, the decline in operating profit amounted to 6.3% or €310 million. Higher current investment income partially compensated the €480 million increase in claims due to natural catastrophes in the first nine months of 2007.
Life/Health Operating profit of €873 million was up 41.5%, growing for the fifth quarter in a row. This was mainly driven by a one-time benefit and margin improvements with most operating entities contributing to this development. For the first nine months, operating profit grew by 27.5% to €2,381 million.
Banking As a result of the financial markets turbulence, we recorded an operating profit in the third quarter of only €78 million (3Q 2006: €406 million) mainly stemming from a negative trading income, which was affected by the financial markets turbulence.
Asset Management Our Asset Management's operating profit was up 12.2% and 8.0% in the third quarter and the first nine months of 2007, respectively. At 58.9% for the third quarter, our cost-income ratio remained at a very competitive level.
Non-operating items
Non-operating items resulted in an aggregate gain of €90 million, €77 million higher than a year ago. Although not material in total, there were some line-item movements worth mentioning. While equity harvesting remained at last year’s level, realized losses and impairments on debt securities increased by €94 million leaving net realized gains and impairments of investments down €98 million to €367 million. At the same time, interest expense from external debt increased by €80 million to €271 million, mainly in connection with the bridge financing transaction for the acquisition of the outstanding shares in AGF. These negative effects were more than compensated by a positive trading result, lower acquisition-related expenses and movements in restructuring charges due to lower provisions and a partial release of restructuring provisions at Allianz Sach in Germany.
Non-operating items, on a nine months basis resulted in an aggregate gain of €1,686 million, 198.4% above prior year’s level. The locking-in of unrealized gains on investments in the first quarter and significantly reduced restructuring charges were the main reasons behind this development.
4
Table of Contents
Group Management Report
Net income
Net income, at €1,921 million, increased by 20.7% on the prior year level, primarily as a result of lower income tax expenses and lower minority interests in earnings. Our effective tax rate declined to 24.3%. Mainly due to the minority buy-out at AGF, minority interests in earnings declined by €167 million.
On a nine months basis, net income grew by 29.2% to €7,301 million. In aggregate, this resulted from our strong operating income and a significantly higher non-operating result as well as lower minority interests in earnings.
Earnings per share1)
in€
1) | See Note 37 to our condensed consolidated financial statements for further details. |
5
Table of Contents
Allianz Group Interim Report Third Quarter and First Nine Months of 2007
The following table summarizes the total revenues, operating profit and net income for each of our segments for the three and nine months ended September 30, 2007 and 2006, as well as IFRS consolidated net income of the Allianz Group.
Property- Casualty | Life/Health | Banking | Asset Management | Corporate | Consolidation | Group | ||||||||||||||||||||||||||||||||||||||||||||||||||
2007 €mn | 2006 €mn | 2007 €mn | 2006 €mn | 2007 €mn | 2006 €mn | 2007 €mn | 2006 €mn | 2007 €mn | 2006 €mn | 2007 €mn | 2006 €mn | 2007 €mn | 2006 €mn | |||||||||||||||||||||||||||||||||||||||||||
| Three months ended September 30, | ||||||||||||||||||||||||||||||||||||||||||||||||||||||||
| Total revenues1) | 10,674 | 10,412 | 10,268 | 9,847 | 1,269 | 1,668 | 803 | 726 | — | — | (10) | (54) | 23,004 | 22,599 | ||||||||||||||||||||||||||||||||||||||||||
| Operating profit (loss) | 1,487 | 1,727 | 873 | 617 | 78 | 406 | 330 | 294 | (155) | (331) | (9) | (53) | 2,604 | 2,660 | ||||||||||||||||||||||||||||||||||||||||||
| Non-operating items | 252 | 139 | 9 | (8) | 61 | (8) | (97) | (133) | (166) | 27 | 31 | (4) | 90 | 13 | ||||||||||||||||||||||||||||||||||||||||||
| Income (loss) before income taxes and minority interests in earnings | 1,739 | 1,866 | 882 | 609 | 139 | 398 | 233 | 161 | (321) | (304) | 22 | (57) | 2,694 | 2,673 | ||||||||||||||||||||||||||||||||||||||||||
| Income taxes | 34 | (600) | (293) | (240) | (177) | (96) | (87) | (67) | (126) | 180 | (6) | 26 | (655) | (797) | ||||||||||||||||||||||||||||||||||||||||||
| Minority interests in earnings | (65) | (177) | (26) | (81) | (16) | (19) | (4) | (10) | (8) | — | 1 | 2 | (118) | (285) | ||||||||||||||||||||||||||||||||||||||||||
| Net income (loss) | 1,708 | 1,089 | 563 | 288 | (54) | 283 | 142 | 84 | (455) | (124) | 17 | (29) | 1,921 | 1,591 | ||||||||||||||||||||||||||||||||||||||||||
| Nine months ended September 30, | ||||||||||||||||||||||||||||||||||||||||||||||||||||||||
| Total revenues1) | 34,767 | 34,243 | 34,352 | 34,600 | 5,220 | 5,322 | 2,380 | 2,203 | — | — | (55) | (60) | 76,664 | 76,308 | ||||||||||||||||||||||||||||||||||||||||||
| Operating profit (loss) | 4,648 | 4,958 | 2,381 | 1,867 | 1,226 | 1,219 | 967 | 895 | (266) | (585) | (194) | (223) | 8,762 | 8,131 | ||||||||||||||||||||||||||||||||||||||||||
| Non-operating items | 1,096 | 1,007 | 127 | 133 | 217 | 396 | (301) | (403) | 271 | — | 276 | (568) | 1,686 | 565 | ||||||||||||||||||||||||||||||||||||||||||
| Income (loss) before income taxes and minority interests in earnings | 5,744 | 5,965 | 2,508 | 2,000 | 1,443 | 1,615 | 666 | 492 | 5 | (585) | 82 | (791) | 10,448 | 8,696 | ||||||||||||||||||||||||||||||||||||||||||
| Income taxes | (1,081) | (1,590) | (728) | (549) | (401) | (430) | (268) | (194) | (71) | 414 | 69 | 296 | (2,480) | (2,053) | ||||||||||||||||||||||||||||||||||||||||||
| Minority interests in earnings | (395) | (604) | (185) | (301) | (60) | (74) | (23) | (34) | (16) | (9) | 12 | 28 | (667) | (994) | ||||||||||||||||||||||||||||||||||||||||||
| Net income (loss) | 4,268 | 3,771 | 1,595 | 1,150 | 982 | 1,111 | 375 | 264 | (82) | (180) | 163 | (467) | 7,301 | 5,649 | ||||||||||||||||||||||||||||||||||||||||||
1) | Total revenues comprise Property-Casualty segment’s gross premiums written, Life/Health segment’s statutory premiums, Banking segment’s operating revenues and Asset Management segment’s operating revenues. |
6
Table of Contents
Group Management Report
Risk Management
Risk management is an integral part of our business processes and supports our value-based management. As our internal risk capital model provides management with information which allows for active asset-liability management and monitoring, risk is well controlled and there are no identified risks which could in the future pose a threat to the existence of the Allianz Group.
The financial markets turbulence driven by the sub-prime issue in the US led to abnormal conditions with regard to short-term refinancing, as well as declining market prices in the structural finance business. The negative effects from this development for the banking segment are covered in the 3Q interim financial statements.
If the market disturbances continue, then we cannot rule out further write-downs or the necessity to draw on liquidity facilities. Furthermore, strategic changes in the business area of structured finance could be considered in the long run.
The information contained in the risk report in our 2006 Annual Report is still valid.
Events After the Balance Sheet Date
See Note 41 to the condensed consolidated financial statements.
Opportunities
As presented in our 2006 Annual Report, we remain confident that the business prospects for financial service providers remain positive against the background of continuous dynamic global economic development.
Outlook
Our outlook remains unchanged; we are on track to achieve our targets.
In the years 2007 to 2009, we expect average annual consolidated operating profit growth of 10% from the 2006 level, adjusted for the particularly favorable natural catastrophe trend in 2006. Within the same time period, we are striving to maintain a strong combined ratio of less than 94% on average in our Property-Casualty segment. In Life/Health we aim to achieve an average new business margin1) greater than 3%. We also target an average return on risk-adjusted capital in our Banking segment of above 15%. For our Asset Management segment, we are targeting average annual growth of third-party assets under management of 10%, excluding foreign currency conversion effects. We expect net income of around €8 billion for the full year 2007.
As always, natural catastrophes and adverse developments in the capital markets, as well as the factors stated below in our cautionary note regarding forward-looking statements, may severely impact our results of operations.
Cautionary Note Regarding Forward-Looking Statements
The statements contained herein may include statements of future expectations and other forward-looking statements that are based on management’s current views and assumptions and involve known and unknown risks and uncertainties that could cause actual results, performance or events to differ materially from those expressed or implied in such statements. In addition to statements which are forward-looking by reason of context, the words “may”, “will”, “should”, “expects”, “plans”, “intends”, “anticipates”, “believes”, “estimates”, “predicts”, “potential”, or “continue” and similar expressions identify forward-looking statements.
Actual results, performance or events may differ materially from those in such statements due to, without limitation, (i) general economic conditions, including in particular economic conditions in the Allianz Group’s core business and core markets, (ii) performance of financial markets, including emerging markets, (iii) the frequency and severity of insured loss events, (iv) mortality
and morbidity levels and trends, (v) persistency levels, (vi) the extent of credit defaults, (vii) interest rate levels, (viii) currency exchange rates including the Euro/U.S. Dollar exchange rate, (ix) changing levels of competition, (x) changes in laws and regulations, including monetary convergence and the European Monetary Union, (xi) changes in the policies of central banks and/or foreign governments, (xii) the impact of acquisitions, including related integration issues, (xiii) reorganization measures, and (xiv) general competitive factors, in each case on a local, regional, national and/or global basis. Many of these factors may be more likely to occur, or more pronounced, as a result of terrorist activities and their consequences.
The matters discussed herein may also be affected by risks and uncertainties described from time to time in Allianz SE’s filings with the U.S. Securities and Exchange Commission. The company assumes no obligation to update any forward-looking statement.
1) | New business margin according to the definition of European Embedded Value. |
7
Table of Contents
Earnings Summary
Gross premiums written
Gross premiums written by region1)
in %
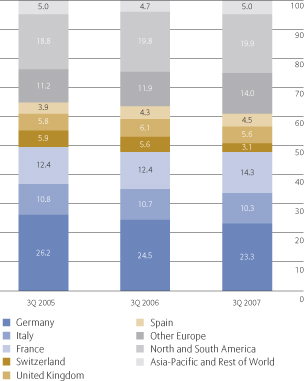
1) | After elimination of transactions between Allianz Group companies in different geographic regions and different segments. Gross premiums written from our specialty lines have been allocated to the respective geographic regions. |
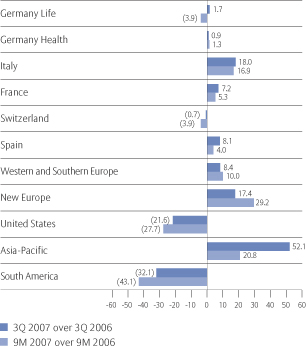
Gross premiums written – Growth rates1)
in %
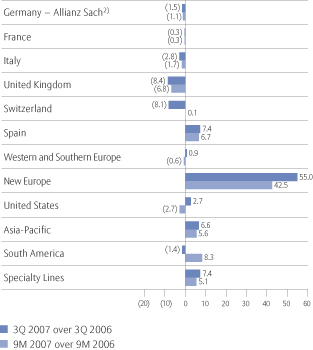
1) | Before elimination of transactions between Allianz Group companies in different geographic regions and different segments. |
2) | Together with our property-casualty assumed reinsurance business, primarily attributable to Allianz SE, the decline within Germany was (7.5)% for 3Q 2007 over 3Q 2006 and (6.0)% for 9M 2007 over 9M 2006. |
8
Table of Contents
Group Management Report
2007 to 2006 third quarter comparison
Compared to previous year, gross premiums written increased by 2.5% to €10,674 million. Internal growth amounted to 1.8%, which excludes €208 million of premiums written by the acquired Russian insurance companies ROSNO and Progress Garant, and large foreign currency translation effects of €(114) million.
The revenue environment remained mixed across our different regions, with ongoing downward pressure on prices in mature markets. Nonetheless, through our policy of selective underwriting we maintained a profit-first approach.
At Allianz Sach within Germany, gross premiums declined by 1.5 % mainly due to price pressures in the motor market. Internal reinsurance business at Allianz SE was also reduced. Taken together, this led to a premium reduction in Germany of €183 million.
The decline in Italy of €30 million stemmed from stagnation in motor markets and the impact from a new regulation, the so-called Bersani law, which will result in an overall price reduction.
Premiums in the United Kingdom decreased primarily due to the internal transfer of business to Allianz Global Corporate & Specialty (or “AGCS”). Without this effect, the business in the UK grew internally by 11.2%.
The main contributors to growth were our markets in New Europe, the United States and Spain as well as our global travel and assistance business at Mondial.
In New Europe, premiums increased by €251 million. Revenue volume benefited mainly from the first time consolidation of ROSNO and Progress Garant in Russia as already mentioned. Additionally, motor insurance business in Romania and Poland contributed to the rise in premiums.
In our travel insurance business we saw growth across all regions. Gross premiums increased by €60 million.
At Fireman's Fund Insurance Company (or “Fireman's Fund”) in the United States, revenues increased by 2.7% to €1,644 million, mainly driven by crop insurance business and personal lines. Revenues were up 10.7% on a U.S. Dollar basis.
Our Spanish operations recorded higher revenues from all lines of business. The good ongoing performance of our direct sales channel Fénix Directo also contributed to the development. Total revenues were up by €33 million.
2007 to 2006 nine months comparison
For the first nine months of 2007, gross premiums written increased by 1.5% to €34,767 million. While the developments in most of our markets were consistent with the third quarter comparison, we recorded lower premiums at Fireman's Fund due to the unfavorable development of the U.S. Dollar against the Euro. On an internal basis, segment growth amounted to 1.2%.
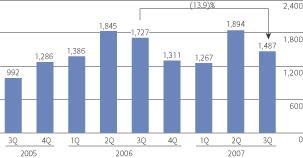
Operating profit
Operating profit
in€mn
2007 to 2006 third quarter comparison
At €1,487 million operating profit met our expectation. Compared to a prior year period that was characterized by a high profit level due to unusually low claims from natural catastrophes, the operating profit declined. Except for the specialty lines and Allianz Sach, operating profit development was flat or negative in most of our markets.
Our combined ratio went up by 3.9 percentage points to 94.1%. The accident year loss ratio went up 3.6 percentage points to 69.0%. Thereof, 2.3 percentage points are attributable to claims from natural catastrophes in the third quarter (3Q 2006: 0.6%), following the floods in the United Kingdom and severe storms in several parts of the world. Additionally, the first time consolidation of our Russian entities contributed to the rise in the loss ratio. Adding the positive net development in prior years’ loss reserves, our calendar year loss ratio increased by 2.3 percentage points to 66.5%.
9
Table of Contents
Allianz Group Interim Report Third Quarter and First Nine Months of 2007
The expense ratio increased by 1.6 percentage points to 27.6%.
2007 to 2006 nine months comparison
On a nine months basis, operating profit amounted to €4,648 million, €310 million less than in the prior year period. Both higher net losses from natural catastrophes as well as higher acquisition and administrative expenses are responsible for this change. An increase in profitable, higher-commission business resulted in both an absolute and relative increase in acquisition costs. The increase in administrative expenses resulted from acquisitions (€49 million), higher Group investments (€79 million), and changes in the business mix (€95 million). These increases were partially offset by lower expense run rates of €99 million. Our combined ratio rose by 2.4 percentage points to 94.6%.
Non-operating items
2007 to 2006 third quarter comparison
In aggregate, non-operating items nearly doubled to €252 million. Higher realized gains on investments contributed €79 million to the increase. Additionally, the movements in provisions for restructuring charges added €48 million.
2007 to 2006 nine months comparison
In contrast to the third quarter comparison, non-operating items increased to a lesser extent, namely by 8.8% to €1,096 million, as lower realized gains were more than offset by negative restructuring charges.
Net income
2007 to 2006 third quarter comparison
Net income was up 56.8% to €1,708 million, driven predominantly by a high tax benefit and, to a lesser extent, by lower minorities in earnings.
Income taxes changed by €634 million from an income tax expense of €600 million to an income tax benefit of €34 million in the third quarter. This predominantly reflects the effect of the favorable change in the German tax rate driving our effective tax rate significantly down from 32.2% to (1.9)%.
Minority interests in earnings decreased by €112 million to €65 million mainly due to the minority buy-out at AGF.
2007 to 2006 nine months comparison
Net income for the first nine months increased by 13.2% to €4,268 million. Consistent with the third quarter comparison, income tax benefits due to the tax rate change in Germany and decreased minority interests in earnings contributed to this development. The income tax charge decreased by €509 million to €1,081 million driving the effective tax rate down from 26.7% to 18.8%.
10
Table of Contents
Group Management Report
The following table sets forth our Property-Casualty insurance segment’s income statement, loss ratio, expense ratio and combined ratio for the three and nine months ended September 30, 2007 and 2006.
| Three months ended September 30, | Nine months ended September 30, | |||||||||||||||
2007 €mn | 2006 €mn | 2007 €mn | 2006 €mn | |||||||||||||
| Gross premiums written1) | 10,674 | 10,412 | 34,767 | 34,243 | ||||||||||||
| Ceded premiums written | (1,460) | (1,486) | (4,291) | (4,428) | ||||||||||||
| Change in unearned premiums | 737 | 750 | (1,511) | (1,440) | ||||||||||||
| Premiums earned (net) | 9,951 | 9,676 | 28,965 | 28,375 | ||||||||||||
| Interest and similar income | 1,007 | 928 | 3,393 | 3,107 | ||||||||||||
| Income from financial assets and liabilities designated at fair value through income (net)2) | 32 | 39 | 103 | 81 | ||||||||||||
| Income from financial assets and liabilities held for trading (net), shared with policyholder2) | 45 | — | (10) | — | ||||||||||||
| Realized gains/losses (net) from investments, shared with policyholders3) | 13 | 8 | 48 | 44 | ||||||||||||
| Fee and commission income | 290 | 253 | 842 | 770 | ||||||||||||
| Other income | 14 | 13 | 109 | 51 | ||||||||||||
| Operating revenues | 11,352 | 10,917 | 33,450 | 32,428 | ||||||||||||
| Claims and insurance benefits incurred (net) | (6,615) | (6,208) | (19,264) | (18,480) | ||||||||||||
| Changes in reserves for insurance and investment contracts (net) | (114) | (151) | (292) | (344) | ||||||||||||
| Interest expense | (108) | (67) | (292) | (196) | ||||||||||||
| Loan loss provisions | 5 | — | (4) | (3) | ||||||||||||
| Impairments of investments (net), shared with policyholders4) | (17) | (5) | (24) | (22) | ||||||||||||
| Investment expenses | (74) | (63) | (217) | (178) | ||||||||||||
| Acquisition and administrative expenses (net) | (2,745) | (2,512) | (8,125) | (7,686) | ||||||||||||
| Fee and commission expenses | (193) | (184) | (580) | (559) | ||||||||||||
| Other expenses | (4) | — | (4) | (2) | ||||||||||||
| Operating expenses | (9,865) | (9,190) | (28,802) | (27,470) | ||||||||||||
| Operating profit | 1,487 | 1,727 | 4,648 | 4,958 | ||||||||||||
| Income from financial assets and liabilities held for trading (net), not shared with policyholders2) | (26) | (7) | (56) | (4) | ||||||||||||
| Realized gains/losses (net) from investments, not shared with policyholders3) | 302 | 223 | 1,251 | 1,540 | ||||||||||||
| Impairments of investments (net), not shared with policyholders4) | (59) | (64) | (106) | (153) | ||||||||||||
| Amortization of intangible assets | (3) | (3) | (9) | (10) | ||||||||||||
| Restructuring charges | 38 | (10) | 16 | (366) | ||||||||||||
| Non-operating items | 252 | 139 | 1,096 | 1,007 | ||||||||||||
| Income before income taxes and minority interests in earnings | 1,739 | 1,866 | 5,744 | 5,965 | ||||||||||||
| Income taxes | 34 | (600) | (1,081) | (1,590) | ||||||||||||
| Minority interests in earnings | (65) | (177) | (395) | (604) | ||||||||||||
| Net income | 1,708 | 1,089 | 4,268 | 3,771 | ||||||||||||
| Loss ratio5)in % | 66.5 | 64.2 | 66.5 | 65.1 | ||||||||||||
| Expense ratio6)in % | 27.6 | 26.0 | 28.1 | 27.1 | ||||||||||||
| Combined ratio7)in % | 94.1 | 90.2 | 94.6 | 92.2 | ||||||||||||
1) | For the Property-Casualty segment, total revenues are measured based upon gross premiums written. |
2) | The total of these items equals income from financial assets and liabilities carried at fair value through income (net) in the segment income statement included in Note 3 to the condensed consolidated financial statements. |
3) | The total of these items equals realized gains/losses (net) in the segment income statement included in Note 3 to the condensed consolidated financial statements. |
4) | The total of these items equals impairments of investments (net) in the segment income statement included in Note 3 to the condensed consolidated financial statements. |
5) | Represents claims and insurance benefits incurred (net) divided by premiums earned (net). |
6) | Represents acquisition and administrative expenses (net) divided by premiums earned (net). |
7) | Represents the total of acquisition and administrative expenses (net) and claims and insurance benefits incurred (net) divided by premiums earned (net). |
11
Table of Contents
Allianz Group Interim Report Third Quarter and First Nine Months of 2007
Property-Casualty Operations by Geographic Region
The following table sets forth our Property-Casualty gross premiums written, premiums earned (net), combined ratio, loss ratio, expense ratio and operating profit by geographic region for the three and nine months ended September 30, 2007 and 2006. Consistent with our general practice, these figures are presented before consolidation adjustments, representing the elimination of transactions between Allianz Group companies in different geographic regions and different segments.
| Gross premiums written | Premiums earned (net) | Combined ratio | Loss ratio | Expense ratio | Operating profit | |||||||||||||||||||||||||||||||||||||||||||
| Three months ended September 30, | 2007 €mn | 2006 €mn | 2007 €mn | 2006 €mn | 2007 % | 2006 % | 2007 % | 2006 % | 2007 % | 2006 % | 2007 €mn | 2006 €mn | ||||||||||||||||||||||||||||||||||||
| Germany | 2,256 | 2,439 | 2,335 | 2,475 | 88.5 | 87.0 | 60.7 | 62.2 | 27.8 | 24.8 | 446 | 454 | ||||||||||||||||||||||||||||||||||||
| France | 1,204 | 1,208 | 1,125 | 1,121 | 98.5 | 99.6 | 71.9 | 72.2 | 26.6 | 27.4 | 78 | 99 | ||||||||||||||||||||||||||||||||||||
| Italy | 1,048 | 1,078 | 1,192 | 1,214 | 91.9 | 89.9 | 68.8 | 68.0 | 23.1 | 21.9 | 195 | 209 | ||||||||||||||||||||||||||||||||||||
| United Kingdom | 536 | 585 | 499 | 473 | 106.9 | 90.7 | 75.3 | 60.7 | 31.6 | 30.0 | 18 | 98 | ||||||||||||||||||||||||||||||||||||
| Switzerland | 339 | 369 | 393 | 401 | 102.1 | 90.7 | 77.9 | 67.5 | 24.2 | 23.2 | 13 | 52 | ||||||||||||||||||||||||||||||||||||
| Spain | 479 | 446 | 460 | 428 | 91.3 | 91.1 | 70.8 | 71.1 | 20.5 | 20.0 | 63 | 62 | ||||||||||||||||||||||||||||||||||||
Netherlands | 207 | 207 | 205 | 206 | 91.9 | 87.3 | 58.8 | 53.1 | 33.1 | 34.2 | 36 | 43 | ||||||||||||||||||||||||||||||||||||
Austria | 195 | 195 | 196 | 198 | 95.5 | 91.1 | 75.7 | 65.2 | 19.8 | 25.9 | 16 | 35 | ||||||||||||||||||||||||||||||||||||
Ireland | 181 | 182 | 155 | 157 | 99.9 | 56.8 | 74.3 | 34.9 | 25.6 | 21.9 | 23 | 85 | ||||||||||||||||||||||||||||||||||||
Belgium | 89 | 80 | 75 | 74 | 85.2 | 100.5 | 50.5 | 61.5 | 34.7 | 39.0 | 18 | 10 | ||||||||||||||||||||||||||||||||||||
Portugal | 66 | 68 | 61 | 64 | 91.4 | 88.1 | 64.3 | 63.3 | 27.1 | 24.8 | 9 | 10 | ||||||||||||||||||||||||||||||||||||
Greece | 18 | 17 | 13 | 11 | 91.0 | 82.1 | 60.0 | 51.2 | 31.0 | 30.9 | 2 | 3 | ||||||||||||||||||||||||||||||||||||
Western and Southern Europe | 756 | 749 | 705 | 710 | 93.8 | 83.0 | 66.5 | 54.2 | 27.3 | 28.8 | 1091) | 1911) | ||||||||||||||||||||||||||||||||||||
Hungary | 141 | 135 | 127 | 123 | 87.4 | 89.8 | 57.5 | 65.4 | 29.9 | 24.4 | 31 | 22 | ||||||||||||||||||||||||||||||||||||
Slovakia | 76 | 72 | 71 | 65 | 63.7 | 65.2 | 37.6 | 35.7 | 26.1 | 29.5 | 32 | 27 | ||||||||||||||||||||||||||||||||||||
Czech Republic | 58 | 56 | 45 | 45 | 73.2 | 76.5 | 51.5 | 60.1 | 21.7 | 16.4 | 12 | 12 | ||||||||||||||||||||||||||||||||||||
Poland | 85 | 71 | 62 | 50 | 103.0 | 88.6 | 64.8 | 54.7 | 38.2 | 33.9 | — | 7 | ||||||||||||||||||||||||||||||||||||
Romania | 84 | 79 | 42 | 37 | 106.4 | 85.9 | 92.3 | 68.1 | 14.1 | 17.8 | 3 | 6 | ||||||||||||||||||||||||||||||||||||
Bulgaria | 22 | 24 | 16 | 15 | 98.5 | 88.7 | 57.2 | 56.0 | 41.3 | 32.7 | 2 | 2 | ||||||||||||||||||||||||||||||||||||
Croatia | 18 | 15 | 15 | 12 | 102.5 | 101.8 | 67.5 | 66.1 | 35.0 | 35.7 | — | — | ||||||||||||||||||||||||||||||||||||
Russia2) | 223 | 8 | 186 | 1 | 101.2 | 127.0 | 65.3 | 68.8 | 35.9 | 58.2 | 5 | — | ||||||||||||||||||||||||||||||||||||
New Europe3) | 707 | 456 | 565 | 349 | 93.1 | 84.6 | 60.7 | 57.6 | 32.4 | 27.0 | 75 | 71 | ||||||||||||||||||||||||||||||||||||
| Other Europe | 1,463 | 1,205 | 1,270 | 1,059 | 93.5 | 83.6 | 63.9 | 55.4 | 29.6 | 28.2 | 184 | 262 | ||||||||||||||||||||||||||||||||||||
| United States | 1,644 | 1,601 | 1,052 | 1,049 | 94.0 | 89.4 | 68.8 | 64.8 | 25.2 | 24.6 | 147 | 201 | ||||||||||||||||||||||||||||||||||||
| Mexico4) | 51 | 40 | 23 | 24 | 106.3 | 114.2 | 84.5 | 89.3 | 21.8 | 24.9 | 1 | 1 | ||||||||||||||||||||||||||||||||||||
| NAFTA | 1,695 | 1,641 | 1,075 | 1,073 | 94.3 | 90.0 | 69.1 | 65.4 | 25.2 | 24.6 | 148 | 202 | ||||||||||||||||||||||||||||||||||||
| Australia | 432 | 413 | 321 | 289 | 103.9 | 93.7 | 79.4 | 68.6 | 24.5 | 25.1 | 63 | 60 | ||||||||||||||||||||||||||||||||||||
| Other | 88 | 75 | 45 | 35 | 93.6 | 94.7 | 57.1 | 58.8 | 36.5 | 35.9 | 6 | 5 | ||||||||||||||||||||||||||||||||||||
| Asia-Pacific | 520 | 488 | 366 | 324 | 102.7 | 93.9 | 76.7 | 67.6 | 26.0 | 26.3 | 69 | 65 | ||||||||||||||||||||||||||||||||||||
| South America | 204 | 207 | 168 | 157 | 98.8 | 99.9 | 62.3 | 66.4 | 36.5 | 33.5 | 14 | 12 | ||||||||||||||||||||||||||||||||||||
| Other | 19 | 12 | 14 | 9 | —5) | —5) | —5) | —5) | —5) | —5) | 2 | 1 | ||||||||||||||||||||||||||||||||||||
| Specialty lines | ||||||||||||||||||||||||||||||||||||||||||||||||
| Credit Insurance | 403 | 404 | 309 | 285 | 72.8 | 74.9 | 40.7 | 48.8 | 32.1 | 26.1 | 131 | 111 | ||||||||||||||||||||||||||||||||||||
| Allianz Global Corporate & Specialty | 687 | 649 | 432 | 390 | 101.9 | 95.3 | 70.5 | 64.4 | 31.4 | 30.9 | 86 | 75 | ||||||||||||||||||||||||||||||||||||
| Travel Insurance and Assistance Services | 312 | 252 | 312 | 267 | 101.8 | 102.3 | 58.3 | 62.3 | 43.5 | 40.0 | 37 | 26 | ||||||||||||||||||||||||||||||||||||
| Subtotal | 11,165 | 10,983 | 9,950 | 9,676 | — | — | — | — | — | — | 1,484 | 1,728 | ||||||||||||||||||||||||||||||||||||
| Consolidation adjustments6) | (491) | (571) | — | — | — | — | — | — | — | — | 3 | (1) | ||||||||||||||||||||||||||||||||||||
| Total | 10,674 | 10,412 | 9,950 | 9,676 | 94.1 | 90.2 | 66.5 | 64.2 | 27.6 | 26.0 | 1,487 | 1,727 | ||||||||||||||||||||||||||||||||||||
1) | Contains run-off of€5 mn in both 2007 and 2006 from a former operating entity located in Luxembourg. |
2) | Effective February 21, 2007, Russian People’s Insurance Society “ROSNO” was consolidated following the acquisition of approximately 49.2% of the shares in ROSNO by the Allianz Group, increasing our holding to approximately 97%. Effective May 21, 2007 we consolidated Progress Garant for the first time. |
3) | Contains income and expense items from a management holding in both 2007 and 2006. |
4) | Effective 1Q 2007, life business in Mexico is shown within the Life/Health segment. |
5) | Presentation not meaningful. |
6) | Represents elimination of transactions between Allianz Group companies in different geographic regions. |
12
Table of Contents
Group Management Report
| Gross premiums written | Premiums earned (net) | Combined ratio | Loss ratio | Expense ratio | Operating profit | |||||||||||||||||||||||||||||||||||||||||||
| Nine months ended September 30, | 2007 €mn | 2006 €mn | 2007 €mn | 2006 €mn | 2007 % | 2006 % | 2007 % | 2006 % | 2007 % | 2006 % | 2007 €mn | 2006 €mn | ||||||||||||||||||||||||||||||||||||
| Germany | 8,831 | 9,390 | 6,928 | 7,328 | 94.6 | 90.8 | 66.3 | 63.3 | 28.3 | 27.5 | 1,028 | 1,272 | ||||||||||||||||||||||||||||||||||||
| France | 4,042 | 4,053 | 3,343 | 3,327 | 98.8 | 99.7 | 71.6 | 72.5 | 27.2 | 27.2 | 315 | 315 | ||||||||||||||||||||||||||||||||||||
| Italy | 3,634 | 3,698 | 3,623 | 3,661 | 93.1 | 93.4 | 69.6 | 70.4 | 23.5 | 23.0 | 634 | 567 | ||||||||||||||||||||||||||||||||||||
| United Kingdom | 1,688 | 1,812 | 1,488 | 1,392 | 100.6 | 94.7 | 67.8 | 64.7 | 32.8 | 30.0 | 145 | 225 | ||||||||||||||||||||||||||||||||||||
| Switzerland | 1,611 | 1,610 | 1,199 | 1,269 | 97.3 | 94.0 | 71.5 | 70.2 | 25.8 | 23.8 | 135 | 170 | ||||||||||||||||||||||||||||||||||||
| Spain | 1,672 | 1,567 | 1,345 | 1,240 | 90.8 | 90.9 | 71.7 | 71.5 | 19.7 | 19.4 | 198 | 185 | ||||||||||||||||||||||||||||||||||||
Netherlands | 741 | 752 | 606 | 609 | 91.7 | 89.3 | 60.0 | 55.9 | 31.7 | 33.4 | 93 | 117 | ||||||||||||||||||||||||||||||||||||
Austria | 746 | 752 | 562 | 578 | 95.2 | 99.1 | 74.0 | 73.8 | 21.2 | 25.3 | 67 | 64 | ||||||||||||||||||||||||||||||||||||
Ireland | 550 | 556 | 461 | 463 | 95.9 | 71.4 | 71.0 | 48.3 | 24.9 | 23.1 | 151 | 180 | ||||||||||||||||||||||||||||||||||||
Belgium | 297 | 286 | 225 | 223 | 97.5 | 100.3 | 63.0 | 63.4 | 34.5 | 36.9 | 39 | 33 | ||||||||||||||||||||||||||||||||||||
Portugal | 213 | 220 | 185 | 194 | 90.2 | 87.2 | 62.6 | 63.2 | 27.6 | 24.0 | 29 | 34 | ||||||||||||||||||||||||||||||||||||
Greece | 58 | 55 | 37 | 34 | 91.3 | 84.9 | 60.7 | 55.2 | 30.6 | 29.7 | 6 | 7 | ||||||||||||||||||||||||||||||||||||
Western and Southern Europe | 2,605 | 2,621 | 2,076 | 2,101 | 94.1 | 89.0 | 66.8 | 60.6 | 27.3 | 28.4 | 4011) | 4501) | ||||||||||||||||||||||||||||||||||||
Hungary | 463 | 451 | 379 | 373 | 91.7 | 88.3 | 63.5 | 62.0 | 28.2 | 26.3 | 72 | 85 | ||||||||||||||||||||||||||||||||||||
Slovakia | 252 | 224 | 206 | 187 | 63.9 | 69.9 | 37.7 | 39.8 | 26.2 | 30.1 | 91 | 71 | ||||||||||||||||||||||||||||||||||||
Czech Republic | 190 | 194 | 136 | 132 | 76.1 | 82.8 | 53.8 | 63.4 | 22.3 | 19.4 | 37 | 26 | ||||||||||||||||||||||||||||||||||||
Poland | 265 | 213 | 179 | 147 | 97.5 | 89.5 | 62.0 | 56.5 | 35.5 | 33.0 | 12 | 19 | ||||||||||||||||||||||||||||||||||||
Romania | 257 | 215 | 117 | 97 | 98.9 | 91.7 | 82.0 | 76.7 | 16.9 | 15.0 | 7 | 10 | ||||||||||||||||||||||||||||||||||||
Bulgaria | 69 | 67 | 47 | 46 | 89.6 | 83.6 | 47.8 | 50.2 | 41.8 | 33.4 | 9 | 9 | ||||||||||||||||||||||||||||||||||||
Croatia | 62 | 54 | 45 | 39 | 102.0 | 97.7 | 68.6 | 64.7 | 33.4 | 33.0 | 1 | 2 | ||||||||||||||||||||||||||||||||||||
Russia2) | 490 | 19 | 386 | 3 | 102.5 | 91.1 | 65.3 | 45.4 | 37.2 | 45.7 | 9 | 1 | ||||||||||||||||||||||||||||||||||||
New Europe3) | 2,048 | 1,437 | 1,493 | 1,024 | 92.0 | 85.4 | 60.5 | 58.3 | 31.5 | 27.1 | 218 | 215 | ||||||||||||||||||||||||||||||||||||
| Other Europe | 4,653 | 4,058 | 3,569 | 3,125 | 93.1 | 87.8 | 64.1 | 59.8 | 29.0 | 28.0 | 619 | 665 | ||||||||||||||||||||||||||||||||||||
| United States | 3,555 | 3,655 | 2,657 | 2,772 | 91.2 | 88.0 | 61.4 | 58.7 | 29.8 | 29.3 | 502 | 627 | ||||||||||||||||||||||||||||||||||||
| Mexico4) | 142 | 132 | 65 | 73 | 95.5 | 105.5 | 71.3 | 81.0 | 24.2 | 24.5 | 8 | 9 | ||||||||||||||||||||||||||||||||||||
| NAFTA | 3,697 | 3,787 | 2,722 | 2,845 | 91.3 | 88.5 | 61.6 | 59.3 | 29.7 | 29.2 | 510 | 636 | ||||||||||||||||||||||||||||||||||||
| Australia | 1,173 | 1,116 | 936 | 890 | 99.0 | 94.0 | 74.1 | 68.8 | 24.9 | 25.2 | 197 | 181 | ||||||||||||||||||||||||||||||||||||
| Other | 250 | 232 | 120 | 104 | 93.3 | 94.5 | 56.2 | 56.9 | 37.1 | 37.6 | 17 | 14 | ||||||||||||||||||||||||||||||||||||
| Asia-Pacific | 1,423 | 1,348 | 1,056 | 994 | 98.4 | 94.0 | 72.1 | 67.5 | 26.3 | 26.5 | 214 | 195 | ||||||||||||||||||||||||||||||||||||
| South America | 682 | 630 | 515 | 457 | 99.2 | 101.6 | 63.7 | 65.9 | 35.5 | 35.7 | 42 | 39 | ||||||||||||||||||||||||||||||||||||
| Other | 76 | 53 | 35 | 25 | —5) | —5) | —5) | —5) | —5) | —5) | 6 | 5 | ||||||||||||||||||||||||||||||||||||
| Specialty lines | ||||||||||||||||||||||||||||||||||||||||||||||||
| Credit Insurance | 1,338 | 1,270 | 941 | 828 | 74.0 | 77.6 | 44.1 | 51.1 | 29.9 | 26.5 | 409 | 328 | ||||||||||||||||||||||||||||||||||||
| Allianz Global Corporate & Specialty | 2,243 | 2,206 | 1,361 | 1,147 | 96.6 | 93.6 | 70.3 | 66.2 | 26.3 | 27.4 | 297 | 286 | ||||||||||||||||||||||||||||||||||||
| Travel Insurance and Assistance Services | 878 | 767 | 839 | 737 | 103.3 | 100.9 | 57.4 | 60.9 | 45.9 | 40.0 | 92 | 73 | ||||||||||||||||||||||||||||||||||||
| Subtotal | 36,468 | 36,249 | 28,964 | 28,375 | — | — | — | — | — | — | 4,644 | 4,961 | ||||||||||||||||||||||||||||||||||||
| Consolidation adjustments6) | (1,701) | (2,006) | — | — | — | — | — | — | — | — | 4 | (3) | ||||||||||||||||||||||||||||||||||||
| Total | 34,767 | 34,243 | 28,964 | 28,375 | 94.6 | 92.2 | 66.5 | 65.1 | 28.1 | 27.1 | 4,648 | 4,958 | ||||||||||||||||||||||||||||||||||||
1) | Contains run-off of€16 mn and€15 mn in 2007 and 2006 respectively from a former operating entity located in Luxembourg. |
2) | Effective February 21, 2007, Russian People’s Insurance Society “ROSNO” was consolidated following the acquisition of approximately 49.2% of the shares in ROSNO by the Allianz Group, increasing our holding to approximately 97%. Effective May 21, 2007 we consolidated Progress Garant for the first time. |
3) | Contains income and expense items from a management holding in both 2007 and 2006. |
4) | Effective 1Q 2007, life business in Mexico is shown within the Life/Health segment. |
5) | Presentation not meaningful. |
6) | Represents elimination of transactions between Allianz Group companies in different geographic regions. |
13
Table of Contents
Earnings Summary
Statutory premiums
Statutory premiums by region1)
in %
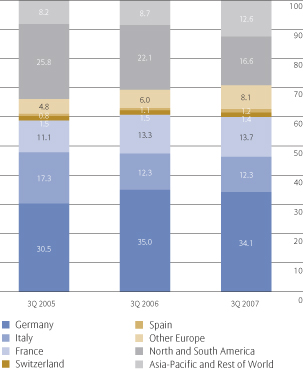
1) | After elimination of transactions between Allianz Group companies in different geographic regions and different segments. |
Statutory premiums – Growth rates1)
in %
1) | Before elimination of transactions between Allianz Group companies in different geographic regions and different segments. |
14
Table of Contents
Group Management Report
2007 to 2006 third quarter comparison
Statutory premiums increased by 4.3% to €10,268 million, and on an internal basis revenues grew by 6.2%. Many of our operating entities worldwide, especially our growth markets of Asia-Pacific and New Europe but also some more mature markets, showed double-digit growth rates. The total revenue volume from Asia-Pacific and New Europe accounted for 14.6% of our Life/Health segment’s statutory premiums in the third quarter 2007, compared to 10.6% in the same period last year.
Whereas most of our markets showed a solid performance, statutory premiums in the United States declined by €464 million. Here, the premium development is still challenged by the legal and regulatory environment relating to the sale of indexed-annuity products. However, during the past months we made progress in closing pending litigations. On a local currency basis the decline in statutory premiums amounted to USD 424 million or 15.5%.
The highest absolute growth was achieved in Asia-Pacific, where revenues increased by €435 million in aggregate. Taiwan, with €220 million delivered the biggest portion to the rise, recording increases in new business mainly due to the dynamic sales of unit-linked products and the ongoing good performance of the bancassurance channel. Within South Korea, we saw a further strong increase in single premium income, driving revenues up €107 million. Furthermore, we benefited from organic revenue growth of €78 million in China where we benefited from our strategic partnership with Industrial and Commercial Bank of China Limited (or “ICBC”).
In Italy, statutory premiums grew by €228 million. This was achieved despite an ongoing poor overall market performance, principally because sales through our bancassurance channel at RAS Group increased and we successfully launched new products.
Within France, we generated revenue growth of €94 million. This positive development was brought about by strong sales within the group life business, and sales of individual life insurance policies also picked up. Growth was achieved both through our tied agents network and the dynamically developing bancassurance channel.
In our German life insurance business, premiums grew by €45 million, mainly coming from growth in our single premium business.
2007 to 2006 nine months comparison
Statutory premiums declined by 0.7% to €34,352 million. In most of our markets, revenue developments were consistent with those described for the third quarter. However, in Germany, premiums declined by €344 million due to an overall weak market environment and high interest rates which made some of our short-term savings products less attractive. Based on internal growth, our statutory premiums increased slightly by 1.1%.
Operating profit
Operating profit
in€mn
2007 to 2006 third quarter comparison
Operating profit was up for the fifth consecutive quarter, growing by 41.5% or €256 million. Our technical margin benefited from an extraordinary reserve release. The higher asset base also increased our current investment income. Interest and similar income grew by €81 million as both payments on debt securities and dividends grew. In contrast net realized gains on investments declined as no major single transaction was executed in the third quarter. The high increase of €251 million in income from financial assets and liabilities carried at fair value through income stemmed predominantly from trading activities.
Our statutory expense ratio declined by 0.3 percentage points to 11.0%.
15
Table of Contents
Allianz Group Interim Report Third Quarter and First Nine Months of 2007
Most life insurance markets delivered operating profit growth. The highest contributions came from Asia-Pacific (+ €192 million including a one-off reserve release of €170 million), the United States (+ €72 million), France (+ €47 million) and Italy (+ €33 million).
2007 to 2006 nine months comparison
Operating profit was up 27.5% to €2,381 million. Unlike in the third quarter comparison this was mostly impacted by an improved technical margin and an improved expense result.
Non-operating items
2007 to 2006 third quarter comparison
Non-operating items improved to an aggregate gain of €9 million coming from an aggregate loss in 2006 of almost the same amount, as we recorded higher net realized gains not to be shared with policyholders.
2007 to 2006 nine months comparison
Significantly lower net realized gains not to be shared with policyholders in the United States led to a decrease in our non-operating result of €6 million.
Net income
2007 to 2006 third quarter comparison
Driven by the higher operating profit, net income rose by 95.5% to €563 million. The aggregate of higher income tax expenses of €53 million and lower minority interests in earnings of €55 million contributed little to this development. Our effective tax rate went down from 39.4% to 33.2%.
2007 to 2006 nine months comparison
Net income for the first nine months amounted to €1,595 million, up 38.7% from the prior year level. Consistent with the third quarter comparison, this development was predominantly attributable to the improved operating profit. Income tax expenses increased by €179 million, driving our effective tax rate up from 27.5% to 29.0%. Minority interests in earnings declined by €116 million.
16
Table of Contents
Group Management Report
The following table sets forth our Life/Health insurance segment’s income statement and statutory expense ratio for the three and nine months ended September 30, 2007 and 2006.
| Three months ended September 30, | Nine months ended September 30, | |||||||||||||||
2007 €mn | 2006 €mn | 2007 €mn | 2006 €mn | |||||||||||||
| Statutory premiums1) | 10,268 | 9,847 | 34,352 | 34,600 | ||||||||||||
| Ceded premiums written | (108) | (163) | (487) | (572) | ||||||||||||
| Change in unearned premiums | (17) | (49) | (41) | (200) | ||||||||||||
| Statutory premiums (net) | 10,143 | 9,635 | 33,824 | 33,828 | ||||||||||||
| Deposits from SFAS 97 insurance and investment contracts | (5,662) | (5,169) | (19,475) | (19,515) | ||||||||||||
| Premiums earned (net) | 4,481 | 4,466 | 14,349 | 14,313 | ||||||||||||
| Interest and similar income | 3,174 | 3,093 | 10,112 | 9,838 | ||||||||||||
| Income from financial assets and liabilities carried at fair value through income (net), shared with policyholders2) | 231 | (20) | (748) | (205) | ||||||||||||
| Realized gains/losses (net) from investments, shared with policyholders3) | 617 | 537 | 2,351 | 2,587 | ||||||||||||
| Fee and commission income | 171 | 144 | 506 | 435 | ||||||||||||
| Other income | 10 | 7 | 73 | 20 | ||||||||||||
| Operating revenues | 8,684 | 8,227 | 26,643 | 26,988 | ||||||||||||
| Claims and insurance benefits incurred (net) | (3,901) | (3,942) | (12,761) | (12,738) | ||||||||||||
| Changes in reserves for insurance and investment contracts (net) | (2,140) | (2,262) | (6,975) | (7,860) | ||||||||||||
| Interest expense | (85) | (70) | (287) | (207) | ||||||||||||
| Loan loss provisions | 1 | — | (2) | 1 | ||||||||||||
| Impairments of investments (net), shared with policyholders4) | (288) | (63) | (381) | (308) | ||||||||||||
| Investment expenses | (235) | (129) | (594) | (497) | ||||||||||||
| Acquisition and administrative expenses (net) | (1,113) | (1,087) | (3,102) | (3,217) | ||||||||||||
| Fee and commission expenses | (49) | (57) | (154) | (177) | ||||||||||||
| Operating restructuring charges4) | (1) | — | (6) | (118) | ||||||||||||
| Operating expenses | (7,811) | (7,610) | (24,262) | (25,121) | ||||||||||||
| Operating profit | 873 | 617 | 2,381 | 1,867 | ||||||||||||
| Income from financial assets and liabilities carried at fair value through income (net), not shared with policyholders2) | 3 | — | 3 | — | ||||||||||||
| Realized gains/losses (net) from investments, not shared with policyholders3) | 11 | — | 133 | 186 | ||||||||||||
Impairments of investments (net), not shared with policyholders4) | (1) | — | (1) | — | ||||||||||||
| Amortization of intangible assets | (1) | — | (2) | (2) | ||||||||||||
| Non-operating restructuring charges5) | (3) | (8) | (6) | (51) | ||||||||||||
| Non-operating items | 9 | (8) | 127 | 133 | ||||||||||||
| Income before income taxes and minority interests in earnings | 882 | 609 | 2,508 | 2,000 | ||||||||||||
| Income taxes | (293) | (240) | (728) | (549) | ||||||||||||
| Minority interests in earnings | (26) | (81) | (185) | (301) | ||||||||||||
| Net income | 563 | 288 | 1,595 | 1,150 | ||||||||||||
| Statutory expense ratio6) in % | 11.0 | 11.3 | 9.2 | 9.5 | ||||||||||||
1) | For the Life/Health segment, total revenues are measured based upon statutory premiums. Statutory premiums are gross premiums written from sales of life insurance policies, as well as gross receipts from sales of unit-linked and other investment-oriented products, in accordance with the statutory accounting practices applicable in the insurer’s home jurisdiction. |
2) | The total of these items equals income from financial assets and liabilities carried at fair value through income (net) in the segment income statement included in Note 3 to the condensed consolidated financial statements. |
3) | The total of these items equals realized gains/losses (net) in the segment income statement included in Note 3 to the condensed consolidated financial statements. |
4) | The total of these items equals impairments of investments (net) in the segment income statement included in Note 3 to the condensed consolidated financial statements. |
5) | The total of these items equals restructuring charges in the segment income statement included in Note 3 to the condensed consolidated financial statements. |
6) | Represents acquisition and administrative expenses (net) divided by statutory premiums (net). |
17
Table of Contents
Allianz Group Interim Report Third Quarter and First Nine Months of 2007
Life/Health Operations by Geographic Region
The following table sets forth our Life/Health statutory premiums, premiums earned (net), statutory expense ratio and operating profit by geographic region for the three and nine months ended September 30, 2007 and 2006. Consistent with our general practice, these figures are presented before consolidation adjustments, representing the elimination of transactions between Allianz Group companies in different geographic regions and different segments.
| Statutory premiums1) | Premiums earned (net) | Statutory expense ratio | Operating profit (loss) | |||||||||||||||||||||||||||||
| Three months ended September 30, | 2007 €mn | 2006 €mn | 2007 €mn | 2006 €mn | 2007 % | 2006 % | 2007 €mn | 2006 €mn | ||||||||||||||||||||||||
| Germany Life | 2,685 | 2,640 | 2,099 | 2,205 | 8.0 | 9.9 | 139 | 208 | ||||||||||||||||||||||||
| Germany Health2) | 783 | 776 | 781 | 773 | 9.2 | 10.5 | 25 | 33 | ||||||||||||||||||||||||
| Italy | 1,495 | 1,267 | 186 | 198 | 8.0 | 10.2 | 99 | 66 | ||||||||||||||||||||||||
| France | 1,407 | 1,313 | 458 | 332 | 15.0 | 12.3 | 142 | 95 | ||||||||||||||||||||||||
| Switzerland | 142 | 143 | 66 | 76 | 20.4 | 16.9 | 17 | 14 | ||||||||||||||||||||||||
| Spain | 120 | 111 | 80 | 72 | 12.3 | 15.6 | 26 | 24 | ||||||||||||||||||||||||
Netherlands | 89 | 96 | 32 | 38 | 3.4 | 36.8 | 8 | 11 | ||||||||||||||||||||||||
Austria | 84 | 86 | 67 | 69 | 15.3 | 14.8 | 8 | 6 | ||||||||||||||||||||||||
Belgium | 154 | 120 | 73 | 64 | 9.4 | 13.4 | 1 | 35 | ||||||||||||||||||||||||
Portugal | 26 | 19 | 18 | 16 | 29.3 | 13.2 | 5 | 5 | ||||||||||||||||||||||||
Luxembourg | 10 | 14 | 6 | 7 | 20.0 | 12.3 | 1 | — | ||||||||||||||||||||||||
Greece | 23 | 21 | 15 | 14 | 24.1 | 25.6 | 2 | 1 | ||||||||||||||||||||||||
Western and Southern Europe | 386 | 356 | 211 | 208 | 11.7 | 20.7 | 243) | 563) | ||||||||||||||||||||||||
Hungary | 51 | 24 | 20 | 18 | 15.5 | 23.9 | 2 | 3 | ||||||||||||||||||||||||
Slovakia | 65 | 43 | 39 | 33 | 8.3 | 11.6 | 5 | 1 | ||||||||||||||||||||||||
Czech Republic | 19 | 17 | 13 | 13 | 20.1 | 8.6 | (1) | 3 | ||||||||||||||||||||||||
Poland | 53 | 76 | 32 | 29 | 41.3 | 26.8 | 5 | 2 | ||||||||||||||||||||||||
Romania | 6 | 5 | 3 | 3 | 37.6 | 38.6 | 1 | — | ||||||||||||||||||||||||
Bulgaria | 7 | 6 | 6 | 5 | 18.9 | 15.4 | 1 | 1 | ||||||||||||||||||||||||
Croatia | 11 | 11 | 9 | 9 | 23.9 | 16.8 | 1 | — | ||||||||||||||||||||||||
Russia | 4 | 2 | 3 | 2 | 134.0 | 14.1 | (3) | — | ||||||||||||||||||||||||
New Europe | 216 | 184 | 125 | 112 | 23.0 | 20.6 | 11 | 10 | ||||||||||||||||||||||||
| Other Europe | 602 | 540 | 336 | 320 | 15.8 | 20.8 | 35 | 66 | ||||||||||||||||||||||||
| United States | 1,680 | 2,144 | 60 | 95 | 14.3 | 7.6 | 163 | 91 | ||||||||||||||||||||||||
| Mexico4) | 7 | — | 8 | — | 18.4 | — | 1 | — | ||||||||||||||||||||||||
| NAFTA | 1,687 | 2,144 | 68 | 95 | 14.3 | 7.6 | 164 | 91 | ||||||||||||||||||||||||
| South Korea | 574 | 467 | 243 | 243 | 13.7 | 13.1 | 195 | 17 | ||||||||||||||||||||||||
| Taiwan | 516 | 296 | 12 | 24 | 1.9 | 6.2 | 19 | 3 | ||||||||||||||||||||||||
| Malaysia | 30 | 26 | 25 | 21 | 19.2 | 12.8 | 3 | 2 | ||||||||||||||||||||||||
| Indonesia | 47 | 21 | 13 | 9 | 15.2 | 30.4 | 1 | 1 | ||||||||||||||||||||||||
| Other | 103 | 25 | 4 | 4 | 11.6 | 19.4 | (5) | (2) | ||||||||||||||||||||||||
| Asia-Pacific | 1,270 | 835 | 297 | 301 | 9.0 | 11.3 | 213 | 21 | ||||||||||||||||||||||||
| South America | 19 | 28 | 15 | 8 | 38.1 | 21.3 | 1 | (1) | ||||||||||||||||||||||||
| Other5) | 108 | 96 | 95 | 86 | —6) | —6) | 11 | — | ||||||||||||||||||||||||
| Subtotal | 10,318 | 9,893 | 4,481 | 4,466 | — | — | 872 | 617 | ||||||||||||||||||||||||
| Consolidation adjustments7) | (50) | (46) | — | — | — | — | 1 | — | ||||||||||||||||||||||||
| Total | 10,268 | 9,847 | 4,481 | 4,466 | 11.0 | 11.3 | 873 | 617 | ||||||||||||||||||||||||
1) | Statutory premiums are gross premiums written from sales of life insurance policies as well as gross receipts from sales of unit-linked and other investment-oriented products, in accordance with the statutory accounting practices applicable in the insurer’s home jurisdiction. |
2) | Loss ratios were 71.8% and 67.4% for 2007 and 2006, respectively. |
3) | Contains run-off of€(1) mn and€(2) mn in 2007 and 2006 respectively from our former life insurance business in the United Kingdom which we sold in December 2004. |
4) | Effective 1Q 2007, life business in Mexico is shown within the Life/Health segment. |
5) | Contains, among others, the Life/Health business assumed by Allianz SE. |
6) | Presentation not meaningful. |
7) | Represents elimination of transactions between Allianz Group companies in different geographic regions. |
18
Table of Contents
Group Management Report
| Statutory premiums1) | Premiums earned (net) | Statutory expense ratio | Operating profit (loss) | |||||||||||||||||||||||||||||
| Nine months ended September 30, | 2007 €mn | 2006 €mn | 2007 €mn | 2006 €mn | 2007 % | 2006 % | 2007 €mn | 2006 €mn | ||||||||||||||||||||||||
| Germany Life | 8,500 | 8,844 | 6,887 | 7,103 | 5.7 | 9.4 | 471 | 454 | ||||||||||||||||||||||||
| Germany Health2) | 2,346 | 2,317 | 2,344 | 2,315 | 9.6 | 8.4 | 107 | 132 | ||||||||||||||||||||||||
| Italy | 6,897 | 5,898 | 684 | 720 | 6.0 | 7.2 | 295 | 269 | ||||||||||||||||||||||||
| France | 4,472 | 4,247 | 1,283 | 1,064 | 14.6 | 12.5 | 504 | 370 | ||||||||||||||||||||||||
| Switzerland | 807 | 840 | 344 | 365 | 9.2 | 9.0 | 52 | 41 | ||||||||||||||||||||||||
| Spain | 444 | 427 | 309 | 294 | 10.2 | 10.7 | 78 | 65 | ||||||||||||||||||||||||
Netherlands | 303 | 324 | 101 | 111 | 10.1 | 19.5 | 32 | 33 | ||||||||||||||||||||||||
Austria | 282 | 270 | 206 | 201 | 11.3 | 13.3 | 33 | 28 | ||||||||||||||||||||||||
Belgium | 503 | 415 | 220 | 209 | 9.0 | 11.3 | 72 | 67 | ||||||||||||||||||||||||
Portugal | 75 | 64 | 54 | 49 | 28.7 | 14.6 | 22 | 17 | ||||||||||||||||||||||||
Luxembourg | 57 | 35 | 20 | 22 | 12.7 | 14.1 | 6 | 3 | ||||||||||||||||||||||||
Greece | 77 | 71 | 47 | 45 | 21.4 | 23.9 | 4 | 3 | ||||||||||||||||||||||||
| Western and Southern Europe | 1,297 | 1,179 | 648 | 637 | 11.7 | 14.9 | 1673) | 1483) | ||||||||||||||||||||||||
Hungary | 107 | 69 | 61 | 55 | 19.9 | 25.9 | 10 | 11 | ||||||||||||||||||||||||
Slovakia | 191 | 131 | 119 | 100 | 11.8 | 16.8 | 21 | 15 | ||||||||||||||||||||||||
Czech Republic | 64 | 55 | 39 | 40 | 18.4 | 17.0 | 5 | 7 | ||||||||||||||||||||||||
Poland | 368 | 307 | 76 | 69 | 14.9 | 14.7 | 11 | 5 | ||||||||||||||||||||||||
Romania | 22 | 20 | 9 | 9 | 35.2 | 39.0 | — | — | ||||||||||||||||||||||||
Bulgaria | 21 | 17 | 18 | 15 | 16.5 | 15.7 | 3 | 2 | ||||||||||||||||||||||||
Croatia | 40 | 31 | 28 | 25 | 14.3 | 21.9 | 2 | 2 | ||||||||||||||||||||||||
Russia | 9 | 6 | 8 | 6 | 133.7 | 16.4 | (7) | — | ||||||||||||||||||||||||
New Europe | 822 | 636 | 358 | 319 | 16.9 | 17.6 | 45 | 42 | ||||||||||||||||||||||||
| Other Europe | 2,119 | 1,815 | 1,006 | 956 | 13.8 | 15.9 | 212 | 190 | ||||||||||||||||||||||||
| United States | 5,145 | 7,120 | 266 | 263 | 11.0 | 6.9 | 323 | 244 | ||||||||||||||||||||||||
| Mexico4) | 23 | — | 23 | — | 16.1 | — | 3 | — | ||||||||||||||||||||||||
| NAFTA | 5,168 | 7,120 | 289 | 263 | 11.1 | 6.9 | 326 | 244 | ||||||||||||||||||||||||
| South Korea | 1,506 | 1,561 | 734 | 746 | 15.0 | 13.2 | 273 | 55 | ||||||||||||||||||||||||
| Taiwan | 1,410 | 1,040 | 42 | 65 | 2.5 | 3.6 | 27 | 11 | ||||||||||||||||||||||||
| Malaysia | 88 | 76 | 73 | 62 | 18.5 | 18.3 | 9 | 6 | ||||||||||||||||||||||||
| Indonesia | 153 | 55 | 35 | 25 | 12.6 | 31.3 | 4 | 1 | ||||||||||||||||||||||||
| Other | 233 | 75 | 12 | 12 | 11.5 | 18.6 | (10) | (3) | ||||||||||||||||||||||||
| Asia-Pacific | 3,390 | 2,807 | 896 | 910 | 9.6 | 10.3 | 303 | 70 | ||||||||||||||||||||||||
| South America | 66 | 116 | 32 | 33 | 30.5 | 16.0 | — | (2) | ||||||||||||||||||||||||
| Other5) | 308 | 338 | 275 | 290 | —6) | —6) | 32 | 33 | ||||||||||||||||||||||||
| Subtotal | 34,517 | 34,769 | 14,349 | 14,313 | — | — | 2,380 | 1,866 | ||||||||||||||||||||||||
| Consolidation adjustments7) | (165) | (169) | — | — | — | — | 1 | 1 | ||||||||||||||||||||||||
| Total | 34,352 | 34,600 | 14,349 | 14,313 | 9.2 | 9.5 | 2,381 | 1,867 | ||||||||||||||||||||||||
1) | Statutory premiums are gross premiums written from sales of life insurance policies as well as gross receipts from sales of unit-linked and other investment-oriented products, in accordance with the statutory accounting practices applicable in the insurer’s home jurisdiction. |
2) | Loss ratios were 72.5% and 68.9% for 2007 and 2006, respectively. |
3) | Contains run-off of€(2) mn and€(3) mn in 2007 and 2006 respectively, from our former life insurance business in the United Kingdom which we sold in December 2004. |
4) | Effective 1Q 2007, life business in Mexico is shown within the Life/Health segment. |
5) | Contains, among others, the Life/Health business assumed by Allianz SE. |
6) | Presentation not meaningful. |
7) | Represents elimination of transactions between Allianz Group companies in different geographic regions. |
19
Table of Contents
Earnings Summary1)
Operating revenues
2007 to 2006 third quarter comparison
Operating revenues of €1,217 million were down by 24.0%, as the financial markets turbulence had a damaging effect on our trading income (net).
The net trading income declined from €269 million to a loss of €204 million. This decline stemmed predominantly from our investment banking activities.
Conversely, the other two revenue components showed good performance.
Net interest income of €724 million, was up 4.2%. This was driven mainly by strong growth at the Investment Bank and positive developments in the deposit business of the Private & Corporate Clients division. Conversely, loan business in this division is suffering from margin pressure.
Net fee and commission income increased by 9.2% to €689 million. Higher advisory fees of the Investment Bank, principally from mergers & acquisitions and loan advisory activities contributed most to the improvement.
2007 to 2006 nine months comparison
Operating revenues for the first nine months were also affected by the current market situation. Revenues decreased by €103 million to €5,010 million, including a decline of 54.8% in our trading income (net) of €476 million, for the reasons already mentioned.
Impacts from the financial markets turbulence
Dresdner Bank carries asset backed securities (or “ABS”) within trading assets of €18 billion on its balance sheet, but due to hedging strategies is economically only exposed by €7.9 billion, comprising CDO2)/CLO3) warehouses of €3.0 billion, other CDO/CLO positions of €1.3 billion and other RMBS4)/ABS of €3.6 billion.
Exposure by rating
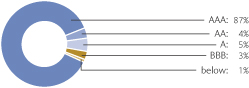
Our ABS assets are of high quality but CDO/CLO positions were significantly impacted by discounts due to current market conditions.
1) | The results of operations of our Banking segment are almost exclusively represented by Dresdner Bank, accounting for 96.0% of our total Banking segment’s operating revenues for the first nine months of 2007 (9M 2006: 96.1%). Accordingly, the discussion of our Banking segment’s results of operations relates solely to the operations of Dresdner Bank. |
2) | Collateralized debt obligations |
3) | Collateralized loan obligations |
4) | Residential mortgage backed securities |
20
Table of Contents
Group Management Report
Three months | Nine months ended September 30, 2007 | |||||||
| €mn | €mn | |||||||
| Write-downs on CDO/CLO warehouses | 246 | 282 | ||||||
| Write-downs on other ABS | 52 | 52 | ||||||
| Write-downs on other CDO/CLO | 52 | 82 | ||||||
| Total | 350 | 416 |
In addition, spill-over effects on other credit products negatively impacted the net trading income by €195 million in the third quarter and the first nine months of 2007. We had also entered into leveraged buy-out (or “LBO”) commitments of €5.0 billion which resulted in write-downs of €30 million in the third quarter.
In summary, the negative profit & loss impact from the financial markets turbulence was €575 million in the third quarter.
Operating profit
Operating profit (loss)
in€mn
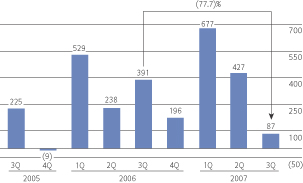
2007 to 2006 third quarter comparison
At €87 million, operating profit was down 77.7%. The €384 million drop in operating revenues, triggered by current market conditions outweighed a €150 million reduction in operating expenses. Net additional loan loss provisions of €70 million make up the balance of the movement.
Operating expenses were down 11.9% to €1,109 million. Personnel expenses decreased by 22.3% to €595 million, driven by reduced performance-related compensation in
Investment Banking and lower personnel costs due to outsourcing. Non-personnel expenses were 8.3% higher at €510 million, due to extended marketing activities and external costs from outsourcing.
Despite the positive effect of lower expenses, the cost-income ratio was driven up by the scale of the revenue shortfall, coming in 12.5 percentage points higher, at 91.1%.
Gross additions to loan loss provisions were €161 million. Gross releases and recoveries amounted to €140 million. Combined, this led to a net charge in the quarter of €21 million, compared to a release of €49 million in the prior period.
2007 to 2006 nine months comparison
Despite the difficult market conditions in the third quarter, our operating profit grew by 2.8% to €1,191 million. We achieved significantly lower operating expenses by 7.2% to €3,743 million, due to further efficiency gains, continuous adherence to cost discipline and lower performance-related expenses, which partially offset the revenue decrease. At 74.7%, the cost-income-ratio was 4.2 percentage points lower than last year.
Net additions to loan loss provisions in the first nine months of 2007 were €76 million, further demonstrating adherence to our cautious risk approach and the high quality of the loan portfolio. As of September 30, 2007, our coverage ratio was 66.3% (September 30, 2006: 59.8%).
Non-operating items
2007 to 2006 third quarter comparison
Non-operating items amounted to an aggregate gain of €48 million, compared to a loss of €8 million a year ago. This is mainly attributable to lower restructuring charges and decreased impairments of investments.
2007 to 2006 nine months comparison
Non-operating items declined by 51.3% to €193 million. This is largely due to the significant reduction in realized gains, as reported at the half year. In the first half of 2006
21
Table of Contents
Allianz Group Interim Report Third Quarter and First Nine Months of 2007
these included the sale of Dresdner Bank's remaining shareholdings in Munich Re to Allianz SE, and the disposal of our remaining participation in Eurohypo AG. Impairments of investments (net) stood at €35 million compared to €80 million in the previous nine months, and restructuring charges declined by €24 million to €17 million.
Net income
2007 to 2006 third quarter comparison
Net income declined to €(52) million compared to €278 million a year ago, driven by the lower operating profit. The tax expenses at €173 million rose by 96.6% resulting in an effective tax rate of 128.1% (3Q 2006: 23.0%) significantly influenced by the revaluation of our domestic tax assets due to the German tax reform.
2007 to 2006 nine months comparison
Net income declined by 12.0% to €955 million. The higher operating profit was offset by the decline in gains from non-operating items, however the nine months tax expense of €375 million was down 7.6%, leading to an effective tax rate at 27.1%, compared to 26.1% a year earlier.
22
Table of Contents
Group Management Report
The following table sets forth the income statements and cost-income ratios for both our Banking segment as a whole and Dresdner Bank for the three and nine months ended September 30, 2007 and 2006.
| Three months ended September 30, | Nine months ended September 30, | |||||||||||||||||||||||||||||||
| 2007 | 2006 | 2007 | 2006 | |||||||||||||||||||||||||||||
Banking €mn | Dresdner Bank €mn | Banking €mn | Dresdner Bank1) €mn | Banking €mn | Dresdner Bank €mn | Banking €mn | Dresdner Bank1) €mn | |||||||||||||||||||||||||
| Net interest income2) | 745 | 724 | 709 | 695 | 2,403 | 2,325 | 1,962 | 1,904 | ||||||||||||||||||||||||
| Net fee and commission income3) | 727 | 689 | 668 | 631 | 2,325 | 2,196 | 2,228 | 2,104 | ||||||||||||||||||||||||
| Trading income (net)4) | (210) | (204) | 285 | 269 | 479 | 476 | 1,080 | 1,053 | ||||||||||||||||||||||||
| Income from financial assets and liabilities designated at fair value through income (net)4) | 7 | 8 | 6 | 6 | 13 | 13 | 27 | 27 | ||||||||||||||||||||||||
| Other income | — | — | — | — | — | — | 25 | 25 | ||||||||||||||||||||||||
| Operating revenues5) | 1,269 | 1,217 | 1,668 | 1,601 | 5,220 | 5,010 | 5,322 | 5,113 | ||||||||||||||||||||||||
| Administrative expenses | (1,166) | (1,105) | (1,294) | (1,237) | (3,910) | (3,737) | (4,158) | (4,004) | ||||||||||||||||||||||||
| Investment expenses | (2) | (4) | (19) | (21) | (15) | (20) | (35) | (40) | ||||||||||||||||||||||||
| Other expenses | (2) | — | (1) | (1) | 12 | 14 | 12 | 12 | ||||||||||||||||||||||||
| Operating expenses | (1,170) | (1,109) | (1,314) | (1,259) | (3,913) | (3,743) | (4,181) | (4,032) | ||||||||||||||||||||||||
| Loan loss provisions | (21) | (21) | 52 | 49 | (81) | (76) | 78 | 77 | ||||||||||||||||||||||||
| Operating profit | 78 | 87 | 406 | 391 | 1,226 | 1,191 | 1,219 | 1,158 | ||||||||||||||||||||||||
| Realized gains/losses (net) | 78 | 65 | 71 | 73 | 268 | 245 | 517 | 517 | ||||||||||||||||||||||||
| Impairments of investments (net) | (13) | (13) | (48) | (48) | (35) | (35) | (80) | (80) | ||||||||||||||||||||||||
| Amortization of intangible assets | — | — | 1 | — | — | — | — | — | ||||||||||||||||||||||||
| Restructuring charges | (4) | (4) | (32) | (33) | (16) | (17) | (41) | (41) | ||||||||||||||||||||||||
| Non-operating items | 61 | 48 | (8) | (8) | 217 | 193 | 396 | 396 | ||||||||||||||||||||||||
| Income before income taxes and minority interests in earnings | 139 | 135 | 398 | 383 | 1,443 | 1,384 | 1,615 | 1,554 | ||||||||||||||||||||||||
| Income taxes | (177) | (173) | (96) | (88) | (401) | (375) | (430) | (406) | ||||||||||||||||||||||||
| Minority interests in earnings | (16) | (14) | (19) | (17) | (60) | (54) | (74) | (63) | ||||||||||||||||||||||||
| Net income (loss) | (54) | (52) | 283 | 278 | 982 | 955 | 1,111 | 1,085 | ||||||||||||||||||||||||
| Cost-income ratio6)in % | 92.2 | 91.1 | 78.8 | 78.6 | 75.0 | 74.7 | 78.6 | 78.9 | ||||||||||||||||||||||||
1) | We have restated the presentation of revenues and operating profit stemming from trades in shares of Allianz SE and its affiliates. From 2007 onwards, these results are eliminated on Dresdner Bank level, whereas in 2006 they were adjusted on segment level only. |
2) | Represents interest and similar income less interest expense. |
3) | Represents fee and commission income less fee and commission expense. |
4) | The total of these items equals income from financial assets and liabilities carried at fair value through income (net) in the segment income statement included in Note 3 to the condensed consolidated financial statements. |
5) | For the Banking segment, total revenues are measured based upon operating revenues. |
6) | Represents operating expenses divided by operating revenues. |
23
Table of Contents
Allianz Group Interim Report Third Quarter and First Nine Months of 2007
Banking Operations by Division
The following table sets forth our banking operating revenues, operating profit and cost-income ratio by division. Consistent with our general practice, these figures are presented before consolidation adjustments, representing the elimination of transactions between Allianz Group companies in different segments.
| Operating revenues | Operating profit (loss) | Cost-Income ratio | ||||||||||||||||||||||
| Three months ended September 30, | 2007 €mn | 2006 €mn | 2007 €mn | 2006 €mn | 2007 % | 2006 % | ||||||||||||||||||
| Private & Corporate Clients1) | 845 | 863 | 149 | 167 | 82.0 | 76.9 | ||||||||||||||||||
| Investment Banking1) | 347 | 627 | (147) | 88 | 134.9 | 88.8 | ||||||||||||||||||
| Corporate Other2) | 25 | 111 | 85 | 136 | —3) | —3) | ||||||||||||||||||
| Dresdner Bank4) | 1,217 | 1,601 | 87 | 391 | 91.1 | 78.6 | ||||||||||||||||||
| Other Banks5) | 52 | 67 | (9) | 15 | 117.3 | 82.1 | ||||||||||||||||||
| Total | 1,269 | 1,668 | 78 | 406 | 92.2 | 78.8 | ||||||||||||||||||
| Operating revenues | Operating profit (loss) | Cost-Income ratio | ||||||||||||||||||||||
| Nine months ended September 30, | 2007 €mn | 2006 €mn | 2007 €mn | 2006 €mn | 2007 % | 2006 % | ||||||||||||||||||
| Private & Corporate Clients1) | 2,723 | 2,731 | 645 | 660 | 75.1 | 73.4 | ||||||||||||||||||
| Investment Banking1) | 1,996 | 2,358 | 230 | 489 | 85.8 | 81.4 | ||||||||||||||||||
| Corporate Other2) | 291 | 24 | 316 | 9 | —3) | —3) | ||||||||||||||||||
| Dresdner Bank4) | 5,010 | 5,113 | 1,191 | 1,158 | 74.7 | 78.9 | ||||||||||||||||||
| Other Banks5) | 210 | 209 | 35 | 61 | 81.0 | 71.3 | ||||||||||||||||||
| Total | 5,220 | 5,322 | 1,226 | 1,219 | 75.0 | 78.6 | ||||||||||||||||||
1) | Our reporting by division reflects the organizational changes within Dresdner Bank effective starting with 1Q 2007, resulting in two operating divisions, Private & Corporate Clients (“PCC”) and Investment Banking (“IB”). PCC combines all banking activities formerly provided by the Personal Banking and Private & Business Banking (including Private Wealth Management) divisions as well as our activities with medium-sized business clients from our former Corporate Banking division. IB, with Global Banking and Capital Markets, unites the activities formerly provided by the Dresdner Kleinwort (formerly Dresdner Kleinwort Wasserstein) division and the remaining activities of the former Corporate Banking division. Prior year balances have been adjusted accordingly to reflect these reorganization measures and allow for comparability across periods. |
2) | The Corporate Other division contains income and expense items that are not assigned to Dresdner Bank’s operating divisions. These items include, in particular, impacts from the accounting treatment for derivative financial instruments which do not qualify for hedge accounting as well as provisioning requirements for country and general risks. For the three and nine months, the impact from the accounting treatment for derivative financial instruments which do not qualify for hedge accounting on Corporate Other’s operating revenues amounted to€(24) mn and€(40) mn respectively (2006:€(35) mn and€(49) mn respectively). |
3) | Presentation not meaningful. |
4) | We have restated the presentation of revenues and operating profit stemming from trades in shares of Allianz SE and its affiliates. From 2007 onwards, these results are eliminated on Dresdner Bank level, whereas in 2006 they were adjusted on segment level only. |
5) | Consists of non-Dresdner Bank banking operations within our Banking segment. |
Reconciliation of Operating Profit and Operating Revenues1)
| 2006 | ||||||||||||||||
| Three months ended | March 31, €mn | June 30, €mn | September 30, €mn | December 31, €mn | ||||||||||||
| Operating revenues | ||||||||||||||||
| Dresdner Bank – previously stated | 1,884 | 1,709 | 1,520 | 1,697 | ||||||||||||
| Reversal of impact “Own shares” (previously shown on segment level) | — | (81) | 81 | (6) | ||||||||||||
| Dresdner Bank | 1,884 | 1,628 | 1,601 | 1,691 | ||||||||||||
| Operating profit | ||||||||||||||||
| Dresdner Bank – previously stated | 529 | 319 | 310 | 202 | ||||||||||||
| Reversal of impact “Own shares” (previously shown on segment level) | — | (81) | 81 | (6) | ||||||||||||
| Dresdner Bank | 529 | 238 | 391 | 196 | ||||||||||||
1) | We have restated the prior year presentation of revenues and operating profit stemming from trades in own shares (shares of Allianz SE and its affiliates). From 2007 onwards, these results are eliminated on Dresdner Bank level, whereas in 2006 they were adjusted on segment level only. |
24
Table of Contents
Third-Party Assets Under Management of the Allianz Group
The vast majority of our assets under management continued to outperform their respective benchmarks. On the fixed income side, our conservative approach over the past year and a half really paid off over the last few months as the macroeconomic outlook we forecast has largely come to fruition.
On an internal basis, growth of our asset base was 7.1% as at September 30, 2007 (total growth amounted to 1.4%) compared to the year end 2006. The net inflows across all regions amounted to €12 billion, driven primarily by the United States, France and Asia-Pacific, and market appreciation amounted to €42 billion. These additions to the asset base were largely offset by negative currency translation effects of €40 billion, resulting primarily from a weaker U.S. Dollar against the Euro.
Third-party assets under management – Fair values by geographic region1)
in€bn
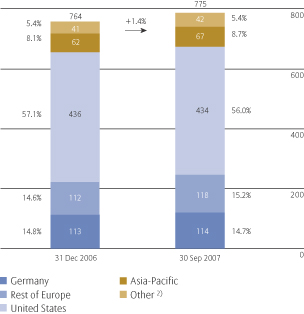
1) | Based on the origination of the assets. |
2) | Consists of third-party assets managed by Dresdner Bank (approximately€21 bn as of both, September 30, 2007 and December 31, 2006) and by other Allianz Group companies (approximately€21 bn as of September 30, 2007 and€20 bn as of December 31, 2006). |
25
Table of Contents
Allianz Group Interim Report Third Quarter and First Nine Months of 2007
The allocation between retail and institutional clients remained almost unchanged.
Third-party assets under management – Fair values by investor class
in€bn
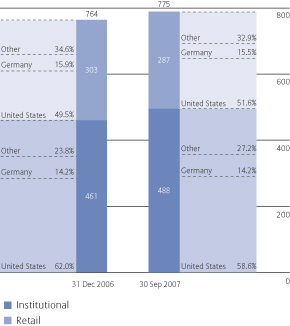
Our fixed income business contributed €11 billion to the total net inflows, the remainder of €1 billion was generated by our equity business.
Third-party assets under management – Fair values by investment category
in€bn
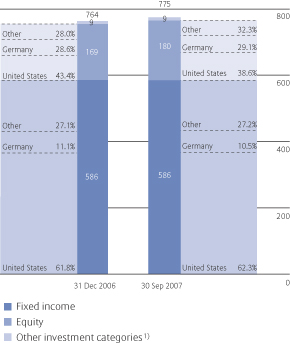
1) | Includes primarily investments in real estate. |
The third quarter was characterized by a challenging market environment which led to a negative market sentiment. Our net outflows in the third quarter were €8 billion, leaving net inflows for the nine months at €12 billion as already mentioned. Thereof, the majority was attributable to the fixed income business.
26
Table of Contents
Group Management Report
Third-party assets under management – Composition of fair value development in the United States
in€bn
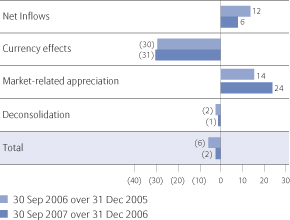
Third-party assets under management – Composition of fair value development in Germany
in€bn
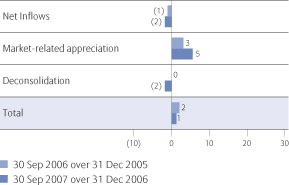
Our major achievements in the first nine months of 2007 included:
| • | Strategic partnership with Xchanging Transaction Bank in investment account administration. |
| • | PIMCO was awarded “Best Third-Party Provider of Fixed Income Portfolio Management Services in Asia” from Euromoney Private Banking Survey 2007. |
Earnings Summary1)
Operating revenues
2007 to 2006 third quarter comparison
On an internal basis, operating revenues were up 15.2%. This considerable increase was subdued by currency-related effects, predominantly the weakening of the U.S. Dollar against the Euro. At stable revenue margins, asset-based management fees increased, driven by the growth of our third party asset base. The development of the performance fees was largely influenced by a performance fee recognition in the third quarter instead of the fourth quarter as a result of a change in German fund contracts. This change affected the majority of those funds.
2007 to 2006 nine months comparison
At €2,314 million operating revenues were up 6.8%. At constant exchange rates, operating revenues would have been 13.1% ahead of the prior year period. The rise in management fees was commensurate with the increase in our third party asset base. The decline of loading and exit fees reflected the development of mutual fund sales.
| Three months ended September 30, | Nine months ended September 30, | |||||||||||||||
2007 €mn | 2006 €mn | 2007 €mn | 2006 €mn | |||||||||||||
| Management fees | 913 | 818 | 2,625 | 2,469 | ||||||||||||
| Loading and exit fees | 76 | 75 | 235 | 253 | ||||||||||||
| Performance fees | 31 | 5 | 67 | 30 | ||||||||||||
| Other income | 25 | 86 | 220 | 261 | ||||||||||||
| Fee and commission income | 1,045 | 984 | 3,147 | 3,013 | ||||||||||||
| Commissions | (215) | (214) | (661) | (663) | ||||||||||||
| Other expenses | (83) | (81) | (268) | (256) | ||||||||||||
| Fee and commission expenses | (298) | (295) | (929) | (919) | ||||||||||||
| Net fee and commission income | 747 | 689 | 2,218 | 2,094 | ||||||||||||
1) | The results of operations of our Asset Management segment are almost exclusively represented by Allianz Global Investors (AGI), accounting for 97.2% of our total Asset Management segment’s operating revenues and operating profit in the first nine months of 2007 (9M 2006: 98.3% and 99.1%, respectively). Accordingly, the discussion of our Asset Management segment’s results of operations relates solely to the operations of AGI. |
27
Table of Contents
Allianz Group Interim Report Third Quarter and First Nine Months of 2007
Operating profit
Operating profit
in€mn
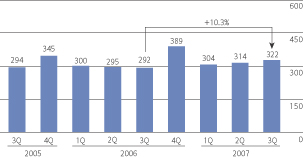
2007 to 2006 third quarter comparison
Operating profit was €322 million, up 10.3%. Internal growth amounted to 17.2%. This sizeable increase was driven by positive business developments across all the regions on a local currency basis.
Administrative expenses, excluding acquisition related expenses, increased by 8.1% to €456 million, containing €290 million compensation-related expenses.
At 58.6%, our cost-income ratio decreased by 0.5 percentage points.
2007 and 2006 nine months comparison
Operating profit of €940 million was 6.0% higher than the prior year period, resulting from further growth in all regions. Excluding the effects of exchange rate movements, operating profit improved by 12.7%.
Administrative expenses, excluding acquisition-related expenses, were up 7.4%. At €883 million, compensation-related expenses increased by €55 million. Non-compensation related expenses rose by €40 million to €491 million. Both developments were in line with our business expansion plans and investments in future growth.
Our cost-income ratio slightly improved by 0.4 percentage points to 59.4%.
Non-operating items
2007 to 2006 third quarter comparison
Acquisition-related expenses significantly dropped from €134 million to €97 million. This decline of 27.6% was predominantly due to a lower number of outstanding PIMCO LLC Class B Units (or “Class B Units”). As of September 30, 2007, the Allianz Group had acquired 43,917 of the 150,000 units originally outstanding.
2007 to 2006 first nine months comparison
At €302 million, acquisition-related expenses were 25.2% below last year's period. This development was mainly driven by the effect of a lower number of outstanding Class B Units as previously described.
Net income
2007 to 2006 third quarter comparison
Net income increased by 67.1% to €137 million. Internal growth rate amounted to 75.0%. This development was primarily driven by operating profit growth and lower acquisition-related expenses which were partly compensated by higher tax expenses. The effective tax rate was 37.8% (3Q 2006: 42.1%).
2007 to 2006 nine months comparison
Net income was up 37.5%, reaching €356 million for the reasons already mentioned in the quarter-to-quarter comparison. At constant exchange rates, net income exceeded 9M 2006 by 45.7%. The effective tax rate increased by 1.4 percentage points to 41.3%.
28
Table of Contents
Group Management Report
The following table sets forth the income statements and cost-income ratios for both our Asset Management segment as a whole and AGI for the three and nine months ended September 30, 2007 and 2006.
| Three months ended September 30, | Nine months ended September 30, | |||||||||||||||||||||||||||||||
| 2007 | 2006 | 2007 | 2006 | |||||||||||||||||||||||||||||
Asset Management Segment €mn | Allianz Global Investors €mn | Asset Management Segment €mn | Allianz Global Investors €mn | Asset Management Segment €mn | Allianz Global Investors €mn | Asset Management Segment €mn | Allianz Global Investors €mn | |||||||||||||||||||||||||
| Net fee and commission income1) | 767 | 747 | 699 | 689 | 2,278 | 2,218 | 2,128 | 2,094 | ||||||||||||||||||||||||
| Net interest income2) | 24 | 19 | 19 | 17 | 60 | 55 | 49 | 46 | ||||||||||||||||||||||||
| Income from financial assets and liabilities carried at fair value through income (net) | 8 | 8 | 5 | 5 | 31 | 30 | 17 | 17 | ||||||||||||||||||||||||
| Other income | 4 | 4 | 3 | 3 | 11 | 11 | 9 | 9 | ||||||||||||||||||||||||
| Operating revenues3) | 803 | 778 | 726 | 714 | 2,380 | 2,314 | 2,203 | 2,166 | ||||||||||||||||||||||||
| Administrative expenses, excluding acquisition-related expenses4) | (473) | (456) | (432) | (422) | (1,413) | (1,374) | (1,308) | (1,279) | ||||||||||||||||||||||||
| Operating expenses | (473) | (456) | (432) | (422) | (1,413) | (1,374) | (1,308) | (1,279) | ||||||||||||||||||||||||
| Operating profit | 330 | 322 | 294 | 292 | 967 | 940 | 895 | 887 | ||||||||||||||||||||||||
| Realized gains/losses (net) | — | — | 1 | 1 | 3 | 3 | 2 | 1 | ||||||||||||||||||||||||
| Impairments of investments (net) | — | — | 1 | — | — | — | — | — | ||||||||||||||||||||||||
| Acquisition-related expenses, thereof4) | ||||||||||||||||||||||||||||||||
Deferred purchases of interests in PIMCO | (97) | (97) | (131) | (131) | (299) | (299) | (397) | (397) | ||||||||||||||||||||||||
Other acquisition-related expenses5) | — | — | (3) | (3) | (3) | (3) | (7) | (7) | ||||||||||||||||||||||||
Subtotal | (97) | (97) | (134) | (134) | (302) | (302) | (404) | (404) | ||||||||||||||||||||||||
| Amortization of intangible assets | — | — | (1) | — | — | — | (1) | — | ||||||||||||||||||||||||
| Restructuring charges | — | — | — | — | (2) | (2) | — | — | ||||||||||||||||||||||||
| Non-operating items | (97) | (97) | (133) | (133) | (301) | (301) | (403) | (403) | ||||||||||||||||||||||||
| Income before income taxes and minority interests in earnings | 233 | 225 | 161 | 159 | 666 | 639 | 492 | 484 | ||||||||||||||||||||||||
| Income taxes | (87) | (85) | (67) | (67) | (268) | (264) | (194) | (193) | ||||||||||||||||||||||||
| Minority interests in earnings | (4) | (3) | (10) | (10) | (23) | (19) | (34) | (32) | ||||||||||||||||||||||||
| Net income | 142 | 137 | 84 | 82 | 375 | 356 | 264 | 259 | ||||||||||||||||||||||||
| Cost-income ratio6)in % | 58.9 | 58.6 | 59.5 | 59.1 | 59.4 | 59.4 | 59.4 | 59.0 | ||||||||||||||||||||||||
1) | Represents fee and commission income less fee and commission expense. |
2) | Represents interest and similar income less interest expense and investment expenses. |
3) | For the Asset Management segment, total revenues are measured based upon operating revenues. |
4) | The total of these items equals acquisition and administration expenses (net) in the segment income statement in Note 3 to the condensed consolidated financial statements. |
5) | Consists of retention payments for the management and employees of PIMCO and Nicholas Applegate. |
6) | Represents operating expenses divided by operating revenues. |
29
Table of Contents
| Allianz Group Interim Report Third Quarter and First Nine Months of 2007 | ||||||
| Corporate Activities | ||||||
Earnings Summary
| Three months ended September 30, | Nine months ended September 30, | |||||||||||||||||||||||||||||||
| Holding Function | Private Equity | Holding Function | Private Equity | |||||||||||||||||||||||||||||
2007 €mn | 2006 €mn | 2007 €mn | 2006 €mn | 2007 €mn | 2006 €mn | 2007 €mn | 2006 €mn | |||||||||||||||||||||||||
| Operating profit (loss) | (128) | (276) | (27) | (55) | (306) | (561) | 40 | (24) | ||||||||||||||||||||||||
| Non-operating items | (153) | (248) | (13) | 275 | 298 | (296) | (27) | 296 | ||||||||||||||||||||||||
| Income before income taxes and minorities | (281) | (524) | (40) | 220 | (8) | (857) | 13 | 272 | ||||||||||||||||||||||||
| Net income (loss) | (431) | (343) | (24) | 219 | (68) | (439) | (14) | 259 | ||||||||||||||||||||||||
Holding Function
Operating profit
2007 to 2006 third quarter comparison
The operating loss decreased significantly. At €128 million, down €148 million, the main drivers were higher interest and similar income, and positive exchange rate movements. These positive developments were partly offset by a negative operating trading result from our hedge program for Group Equity Incentives.
2007 to 2006 nine months comparison
At €306 million the operating loss was 45.5% lower than the previous year figure, stemming from both an increase in operating revenues of 43.7% and reduced operating expenses.
Non-operating items
2007 to 2006 third quarter comparison
Total non-operating items amounted to an aggregate loss of €153 million, €95 million lower than in the comparison period. A trading loss of €63 million in the prior year was turned into a trading gain of €83 million this year, mainly resulting from derivative transactions. Conversely, there was an increase in interest expense, €70 million of which derived from external debt in connection with AGF bridge financing.
2007 to 2006 nine months comparison
Non-operating profit turned into an aggregate gain of €298 million coming from an aggregate loss of almost the same amount in the prior year. The trading result turned positive, primarily driven by derivative transactions and increased realized gains (net) which more than doubled due to the sale of shares in the first half of the year.
30
Table of Contents
Group Management Report
Private Equity
Operating profit
2007 to 2006 third quarter comparison
At €27 million the operating loss was almost halved. Income from fully consolidated private equity investments contributed most on the revenue side. This was partly offset by corresponding costs within the expenses.
2007 to 2006 nine months comparison
On a year-to-date comparison the operating result developed favorably, from a €24 million loss to a profit of €40 million. Whereas higher income from fully consolidated private equity investments was partly compensated by the rise of the corresponding expenses, interest and fee income contributed significantly to the operating profit development.
Non-operating items
2007 to 2006 third quarter comparison
With an aggregate loss of €13 million non-operating items turned negative coming from a €275 million gain a year earlier. This development is almost exclusively due to one-off gains of almost €300 million from the disposal of investments in 2006.
2007 to 2006 nine months comparison
Non-operating items recorded a loss of €27 million. The €296 million gain from a year earlier resulted from one-off disposals of investments.
31
Table of Contents
| Allianz Group Interim Report Third Quarter and First Nine Months of 2007 | ||||||
| Balance Sheet Review | ||||||
Slight decrease in shareholders’ equity. | ||||||
Shareholders’ Equity
Shareholders’ equity1)
in€mn

1) | Does not include minority interests of€2.8 bn as of September 30, 2007 and of€6.4 bn as of December 31, 2006. Please see Note 18 to the condensed consolidated financial statements for further information. |
2) | Includes foreign currency translation adjustments. |
Shareholders’ equity decreased by 2.8% to €49.0 billion. The net income of €7.3 billion earned in the first nine months was offset by the minority buy-out that resulted in various impacts to shareholders’ equity, primarily stemming from the accounting treatment of the goodwill and the capital increase. Additionally, the transfer on disposal of unrealized gains and losses to realized of €2.6 billion and the dividend payment of €1.6 billion contributed to this development.
Total Assets and Total Liabilities
Total assets and liabilities increased by €41.5 billion and €46.6 billion, respectively. In the following sections we analyze important developments within the balance sheets of our Life/Health, Property-Casualty and Banking segments as presented on page 44. Relative to the Allianz Group's total assets and total liabilities, we consider the total assets and total liabilities from our Asset Management segment as immaterial and have, accordingly, excluded these assets and liabilities from the following discussion. Our Asset Management segment's results of operations stem primarily from its business with third-party assets. Please see pages 25 and 26 for further information on the development of our third-party assets
32
Table of Contents
Group Management Report
Insurance Assets and Liabilities
Life/Health insurance operations
Life/Health asset base
fair values1) in€bn
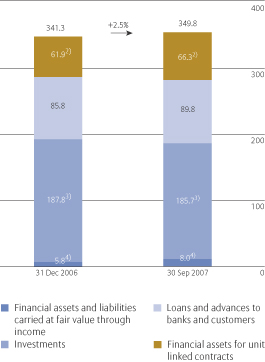
1) | Loans and advances to banks and customers, held-to-maturity investments, and real estate held for investment are stated at amortized cost. Investments in associates and joint ventures are stated at either amortized cost or equity, depending upon, among other factors, our ownership percentage. |
2) | Financial assets for unit-linked contracts represent assets owned by, and managed on the behalf of, policyholders of the Allianz Group, with all appreciation and depreciation in these assets accruing to the benefit of policyholders. As a result, the value of financial assets for unit-linked contracts in our balance sheet corresponds with the value of financial liabilities for unit-linked contracts. |
3) | Does not include affiliates at€2.9 bn and€2.8 bn as of September 30, 2007 and December 31, 2006, respectively. |
4) | Includes, in each case as of September 30, 2007 and December 31, 2006, respectively, debt securities at€9.4 bn and€7.3 bn, equity securities at€3.6 bn and€2.9 bn, and derivative financial instruments at€(5.0) bn and€(4.4) bn. |
In aggregate, our Life/Health asset base grew by €8.5 billion to €349.8 billion, stemming primarily from increased assets for unit-linked contracts (+ €4.4 billion) and higher loans and advances to banks and customers (+ €4.0 billion). This reflected our strong sales performance with unit-linked insurance and investment contracts.
The reserves for insurance and investment contracts were up €3.2 billion amounting to €281.9 billion since December 31, 2006. This development was mainly driven by higher policy reserves especially out of our German Life- and Health business.
Property-Casualty insurance operations
Property-Casualty asset base
fair values1) in€bn
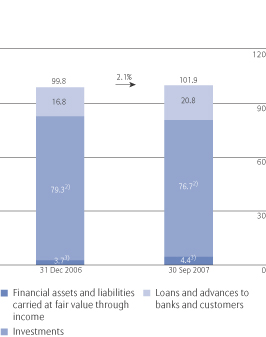
1) | Loans and advances to banks and customers, held-to-maturity investments, and real estate held for investment are stated at amortized cost. Investments in associates and joint ventures are stated at either amortized cost or equity, depending upon, among other factors, our ownership percentage. |
2) | Does not include affiliates at€9.8 bn and€9.5 bn as of September 30, 2007 and December 31, 2006, respectively. |
3) | Includes, in each case as of September 30, 2007 and December 31, 2006, respectively, debt securities at€3.7 bn and€3.2 bn, equity securities at €0.5 bn and€0.4 bn, and derivative financial instruments at€0.2 bn and €0.1 bn. |
Our Property-Casualty asset base increased by €2.1 billion to €101.9 billion.
33
Table of Contents
Allianz Group Interim Report Third Quarter and First Nine Months of 2007
Banking Assets and Liabilities
Banking loans and advances to banks and customers
in€bn
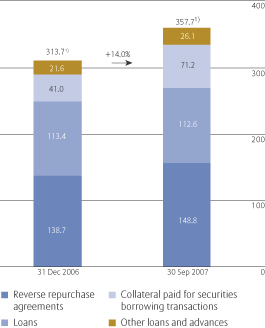
1) | Includes loan loss allowance at€(1.0) bn as of both September 30, 2007 and December 31, 2006, respectively. |
Loans and advances to banks and customers in our Banking segment amounted to €357.7 billion as of September 30, 2007. This increase of 14.0% compared to December 31, 2006 was particularly driven by an increasing volume of the collateralized refinancing business of Dresdner Bank. Therefore, at €369.7 billion, liabilities to banks and customers also experienced an increase up 5.6% namely in the form of repurchase agreements and collateral received from securities lending transactions.
34
Table of Contents
| Group Management Report | ||||||
| Other Information | ||||||
Reconciliation of Consolidated Operating Profit and Income before Income Taxes and Minority Interests in Earnings
The previous analysis is based on our condensed consolidated financial statements and should be read in conjunction with those statements. The Allianz Group uses operating profit to evaluate the performance of its business segments and the Group as a whole. The Allianz Group considers the presentation of operating profit to be useful and meaningful to investors because it enhances the understanding of the Allianz Group’s underlying operating performance and the comparability of its operating performance over time. Operating profit highlights the portion of income before income taxes and minority interests in earnings attributable to the on-going core operations of the Allianz Group. To better understand the ongoing operations of the business, we exclude the effects of acquisition-related expenses and the amortization of intangible assets, as these relate to business
combinations; and we exclude interest expense from external debt and income from financial assets and liabilities held for trading (relating to exchangeables on external debt) as these relate to our capital structure.
We believe that trends in the underlying profitability of our business can be more clearly identified without the fluctuating effects of the realized capital gains and losses or impairments of investment securities, as these are largely dependent on market cycles or issuer-specific events over which we have little or no control, and can and do vary, sometimes materially, across periods. Further, the timing of sales that would result in such gains or losses is largely at our discretion. Similarly, we exclude restructuring charges because the timing of the restructuring charges are largely within our control, and accordingly their exclusion provides additional insight into the operating trends of the underlying business.
Operating profit should be viewed as complementary to, and not a substitute for, income before income taxes and minority interests in earnings or net income as determined in accordance with IFRS.
The following table reconciles operating profit on a consolidated basis to the Allianz Group’s income before income taxes and minority interests in earnings.
| Three months ended September 30, | Nine months ended September 30, | |||||||||||||||
2007 €mn | 2006 €mn | 2007 €mn | 2006 €mn | |||||||||||||
| Operating profit | 2,604 | 2,660 | 8,762 | 8,131 | ||||||||||||
| Realized gains/losses and impairments of investments (net) | 367 | 465 | 2,813 | 2,539 | ||||||||||||
| Income from financial assets and liabilities held for trading (net) | 48 | (49) | 45 | (203) | ||||||||||||
| Interest expense from external debt | (271) | (191) | (771) | (585) | ||||||||||||
| Restructuring charges | 23 | (50) | (16) | (458) | ||||||||||||
| Acquisition-related expenses | (72) | (134) | (329) | (404) | ||||||||||||
| Amortization of intangible assets | (4) | (3) | (11) | (13) | ||||||||||||
| Reclassification of policyholder participation in tax benefits arising in connection with tax-exempt income | (1) | (25) | (45) | (311) | ||||||||||||
| Income before income taxes and minority interests in earnings | 2,694 | 2,673 | 10,448 | 8,696 | ||||||||||||
35
Table of Contents
Allianz Group Interim Report Third Quarter and First Nine Months of 2007
Composition of Total Revenue Growth
We further believe that an understanding of our total revenue performance is enhanced when the effects of foreign currency translation as well as acquisitions and disposals (or “changes in scope of consolidation”) are excluded. Accordingly, in addition to presenting “nominal growth”, we also present “internal growth”,
which excludes the effects of foreign currency translation and changes in scope of consolidation. The following table sets forth the reconciliation of nominal total revenue growth to internal total revenue growth for each of our segments and the Allianz Group as a whole for the three and nine months ended September 30, 2007.
Composition of total revenue1) growth
| Three months ended September 30, 2007 | Nine months ended September 30, 2007 | |||||||||||||||||||||||||||||||
| Segment | Nominal growth | Changes in dation | Foreign currency translation | Internal growth | Nominal growth | Changes in dation | Foreign currency translation | Internal growth | ||||||||||||||||||||||||
| % | % | % | % | % | % | % | % | |||||||||||||||||||||||||
| Property-Casualty | 2.5 | 1.8 | (1.1) | 1.8 | 1.5 | 1.3 | (1.0) | 1.2 | ||||||||||||||||||||||||
| Life/Health | 4.3 | 0.1 | (2.0) | 6.2 | (0.7) | — | (1.8) | 1.1 | ||||||||||||||||||||||||
| Banking | (23.9) | — | (0.9) | (23.0) | (1.9) | — | (0.7) | (1.2) | ||||||||||||||||||||||||
thereof: Dresdner Bank | (24.0) | — | (1.0) | (23.0) | (2.0) | — | (0.7) | (1.3) | ||||||||||||||||||||||||
| Asset Management | 10.6 | 0.9 | (6.1) | 15.7 | 8.0 | 0.7 | (6.2) | 13.5 | ||||||||||||||||||||||||
thereof: Allianz Global Investors | 9.0 | — | (6.2) | 15.2 | 6.8 | — | (6.3) | 13.1 | ||||||||||||||||||||||||
| Allianz Group | 1.8 | 0.9 | (1.6) | 2.5 | 0.5 | 0.6 | (1.5) | 1.4 | ||||||||||||||||||||||||
1) | Total revenues comprise Property-Casualty segment’s gross premiums written, Life/Health segment’s statutory premiums, Banking segment’s operating revenues and Asset Management segment’s operating revenues. Segment growth rates are presented before the elimination of transactions between Allianz Group companies in different segments. |
36
Table of Contents
Condensed Consolidated Interim Financial Statements
Contents
Table of Contents
Allianz Group Interim Report Third Quarter and First Nine Months of 2007
As of September 30, 2007 and as of December 31, 2006
| Note | As of September 30, 2007 €mn | As of €mn | ||||||||||
| ASSETS | ||||||||||||
| Cash and cash equivalents | 28,263 | 33,031 | ||||||||||
| Financial assets carried at fair value through income | 4 | 153,527 | 156,869 | |||||||||
| Investments | 5 | 292,185 | 298,134 | |||||||||
| Loans and advances to banks and customers | 6 | 457,441 | 408,278 | |||||||||
| Financial assets for unit linked contracts | 66,254 | 61,864 | ||||||||||
| Reinsurance assets | 7 | 17,396 | 19,360 | |||||||||
| Deferred acquisition costs | 8 | 19,850 | 19,135 | |||||||||
| Deferred tax assets | 4,548 | 4,727 | ||||||||||
| Other assets | 9 | 40,794 | 38,893 | |||||||||
| Intangible assets | 10 | 14,505 | 12,935 | |||||||||
| Total assets | 1,094,763 | 1,053,226 |
| Note | As of September 30, 2007 €mn | As of €mn | ||||||||||
| LIABILITIES AND EQUITY | ||||||||||||
| Financial liabilities carried at fair value through income | 11 | 90,092 | 79,699 | |||||||||
| Liabilities to banks and customers | 12 | 392,629 | 361,078 | |||||||||
| Unearned premiums | 16,750 | 14,868 | ||||||||||
| Reserves for loss and loss adjustment expenses | 13 | 64,712 | 65,464 | |||||||||
| Reserves for insurance and investment contracts | 14 | 290,997 | 287,697 | |||||||||
| Financial liabilities for unit linked contracts | 66,254 | 61,864 | ||||||||||
| Deferred tax liabilities | 4,248 | 4,618 | ||||||||||
| Other liabilities | 15 | 50,057 | 49,764 | |||||||||
| Certificated liabilities | 16 | 52,044 | 54,922 | |||||||||
| Participation certificates and subordinated liabilities | 17 | 15,111 | 16,362 | |||||||||
| Total liabilities | 1,042,894 | 996,336 | ||||||||||
| Shareholders’ equity | 49,050 | 50,481 | ||||||||||
| Minority interests | 2,819 | 6,409 | ||||||||||
| Total equity | 18 | 51,869 | 56,890 | |||||||||
| Total liabilities and equity | 1,094,763 | 1,053,226 |
38
Table of Contents
Consolidated Financial Statements
Consolidated Income Statements
For the three months and nine months ended September 30, 2007 and 2006
| Three months ended September 30, | Nine months ended September 30, | |||||||||||||||||||
| Note | 2007 €mn | 2006 €mn | 2007 €mn | 2006 €mn | ||||||||||||||||
| Premiums written | 15,262 | 15,079 | 49,598 | 49,303 | ||||||||||||||||
| Ceded premiums written | (1,546) | (1,637) | (4,722) | (4,973) | ||||||||||||||||
| Change in unearned premiums | 716 | 700 | (1,562) | (1,642) | ||||||||||||||||
| Premiums earned (net) | 19 | 14,432 | 14,142 | 43,314 | 42,688 | |||||||||||||||
| Interest and similar income | 20 | 6,145 | 5,765 | 19,727 | 18,007 | |||||||||||||||
| Income from financial assets and liabilities carried at fair value through income (net) | 21 | 116 | 210 | (112) | 773 | |||||||||||||||
| Realized gains/losses (net) | 22 | 1,079 | 1,128 | 5,376 | 5,360 | |||||||||||||||
| Fee and commission income | 23 | 2,278 | 2,072 | 6,956 | 6,486 | |||||||||||||||
| Other income | 24 | 9 | 2 | 108 | 58 | |||||||||||||||
| Income from fully consolidated private equity investments | 25 | 686 | 436 | 1,627 | 764 | |||||||||||||||
| Total income | 24,745 | 23,755 | 76,996 | 74,136 | ||||||||||||||||
| Claims and insurance benefits incurred (gross) | (11,138) | (10,908) | (34,606) | (33,582) | ||||||||||||||||
| Claims and Insurance benefits incurred (ceded) | 622 | 758 | 2,581 | 2,364 | ||||||||||||||||
| Claims and insurance benefits incurred (net) | 26 | (10,516) | (10,150) | (32,025) | (31,218) | |||||||||||||||
| Changes in reserves for insurance and investment contracts (net) | 27 | (2,254) | (2,438) | (7,322) | (8,508) | |||||||||||||||
| Interest expense | 28 | (1,592) | (1,432) | (5,031) | (4,281) | |||||||||||||||
| Loan loss provisions | 29 | (15) | 52 | (87) | 76 | |||||||||||||||
| Impairments of investments (net) | 30 | (388) | (186) | (557) | (548) | |||||||||||||||
| Investment expenses | 31 | (278) | (212) | (741) | (694) | |||||||||||||||
| Acquisition and administrative expenses (net) | 32 | (5,751) | (5,644) | (17,339) | (17,171) | |||||||||||||||
| Fee and commission expenses | 33 | (588) | (570) | (1,823) | (1,755) | |||||||||||||||
| Amortization of intangible assets | (4) | (3) | (11) | (13) | ||||||||||||||||
| Restructuring charges | 22 | (50) | (22) | (576) | ||||||||||||||||
| Other expenses | 34 | (5) | (2) | 8 | 9 | |||||||||||||||
| Expenses from fully consolidated private equity investments | 35 | (682) | (447) | (1,598) | (761) | |||||||||||||||
| Total expenses | (22,051) | (21,082) | (66,548) | (65,440) | ||||||||||||||||
| Income before income taxes and minority interests in earnings | 2,694 | 2,673 | 10,448 | 8,696 | ||||||||||||||||
| Income taxes | 36 | (655) | (797) | (2,480) | (2,053) | |||||||||||||||
| Minority interests in earnings | (118) | (285) | (667) | (994) | ||||||||||||||||
| Net income | 1,921 | 1,591 | 7,301 | 5,649 | ||||||||||||||||
| Three months ended September 30, | Nine months ended September 30, | |||||||||||||||||||
| Note | 2007 € | 2006 € | 2007 € | 2006 € | ||||||||||||||||
| Basic earnings per share | 37 | 4.30 | 3.93 | 16.72 | 13.94 | |||||||||||||||
| Diluted earnings per share | 37 | 4.23 | 3.88 | 16.41 | 13.69 | |||||||||||||||
39
Table of Contents
Allianz Group Interim Report Third Quarter and First Nine Months of 2007
Consolidated Statements of Changes in Equity
For the nine months ended September 30, 2007 and 2006
Paid-in capital | Revenue | Foreign currency translation adjustments | Unrealized gains and losses (net) | Shareholders’ equity | Minority interests | Total equity | ||||||||||||||||||||||||||
| €mn | €mn | €mn | €mn | €mn | €mn | €mn | ||||||||||||||||||||||||||
| Balance as of December 31, 2005 | 21,616 | 8,579 | (1,032) | 10,324 | 39,487 | 7,615 | 47,102 | |||||||||||||||||||||||||
| Foreign currency translation adjustments | — | — | (797) | (5) | (802) | (207) | (1,009) | |||||||||||||||||||||||||
| Available-for-sale investments | ||||||||||||||||||||||||||||||||
Unrealized gains and losses (net) arising during the period | — | — | — | 1,625 | 1,625 | (68) | 1,557 | |||||||||||||||||||||||||
Transferred to net income on disposal | — | — | — | (1,534) | (1,534) | (134) | (1,668) | |||||||||||||||||||||||||
| Cash flow hedges | — | — | — | (3) | (3) | (1) | (4) | |||||||||||||||||||||||||
| Miscellaneous | — | 21 | — | — | 21 | (30) | (9) | |||||||||||||||||||||||||
| Total income and expense recognized directly in shareholders’ equity | — | 21 | (797) | 83 | (693) | (440) | (1,133) | |||||||||||||||||||||||||
| Net income | — | 5,649 | — | — | 5,649 | 994 | 6,643 | |||||||||||||||||||||||||
| Total recognized income and expense for the period | — | 5,670 | (797) | 83 | 4,956 | 554 | 5,510 | |||||||||||||||||||||||||
| Treasury shares | — | 1,266 | — | — | 1,266 | — | 1,266 | |||||||||||||||||||||||||
| Transactions between equity holders | — | 48 | (3) | (9) | 36 | 81 | 117 | |||||||||||||||||||||||||
| Dividends paid | — | (811) | — | — | (811) | (636) | (1,447) | |||||||||||||||||||||||||
| Balance as of September 30, 2006 | 21,616 | 14,752 | (1,832) | 10,398 | 44,934 | 7,614 | 52,548 | |||||||||||||||||||||||||
| Balance as of December 31, 2006 | 25,398 | 13,629 | (2,210) | 13,664 | 50,481 | 6,409 | 56,890 | |||||||||||||||||||||||||
| Foreign currency translation adjustments | — | — | (819) | — | (819) | (139) | (958) | |||||||||||||||||||||||||
| Available-for-sale investments | ||||||||||||||||||||||||||||||||
Unrealized gains and losses (net) arising during the period | — | — | — | (531) | (531) | (45) | (576) | |||||||||||||||||||||||||
Transferred to net income on disposal | — | — | — | (2,577) | (2,577) | (99) | (2,676) | |||||||||||||||||||||||||
| Cash flow hedges | — | — | — | 18 | 18 | — | 18 | |||||||||||||||||||||||||
| Miscellaneous | — | (26) | — | — | (26) | 16 | (10) | |||||||||||||||||||||||||
| Total income and expense recognized directly in shareholders’ equity | — | (26) | (819) | (3,090) | (3,935) | (267) | (4,202) | |||||||||||||||||||||||||
| Net income | — | 7,301 | — | — | 7,301 | 667 | 7,968 | |||||||||||||||||||||||||
| Total recognized income and expense for the period | — | 7,275 | (819) | (3,090) | 3,366 | 400 | 3,766 | |||||||||||||||||||||||||
| Treasury shares | — | 357 | — | — | 357 | — | 357 | |||||||||||||||||||||||||
| Transactions between equity holders | 2,765 | (6,832) | (66) | 621 | (3,512) | (3,660) | (7,172) | |||||||||||||||||||||||||
| Dividends paid | — | (1,642) | — | — | (1,642) | (330) | (1,972) | |||||||||||||||||||||||||
| Balance as of September 30, 2007 | 28,163 | 12,787 | (3,095) | 11,195 | 49,050 | 2,819 | 51,869 |
40
Table of Contents
Consolidated Financial Statements
Condensed Consolidated Statements of Cash Flows
For the nine months ended September 30, 2007 and 2006
| Nine months ended September 30, | 2007 €mn | 2006 €mn | ||||||
| Cash flow from operating activities: | ||||||||
| Net income | 7,301 | 5,649 | ||||||
| Adjustments to reconcile net income to net cash flow provided by operating activities: | ||||||||
Minority interests in earnings | 667 | 994 | ||||||
Share of earnings from investments in associates and joint ventures | (393) | (180) | ||||||
Realized gains/losses (net) and impairments of investments (net) of: | ||||||||
Available-for-sale and held-to-maturity investments, investments in associates and joint ventures, real estate held for investment, loans to banks and customers | (4,819) | (4,812) | ||||||
Other investments, mainly financial assets held for trading and designated at fair value through income | 354 | 1 | ||||||
Depreciation and amortization | 638 | 481 | ||||||
Loan loss provisions | 87 | (76) | ||||||
Interest credited to policyholder accounts | 2,651 | 2,809 | ||||||
Net change in: | ||||||||
Financial assets and liabilities held for trading | 17,018 | 18,409 | ||||||
Reverse repurchase agreements and collateral paid for securities borrowing transactions | (39,890) | (59,897) | ||||||
Repurchase agreements and collateral received from securities lending transactions | 23,262 | 57,398 | ||||||
Reinsurance assets | 181 | 213 | ||||||
Deferred acquisition costs | (802) | (1,104) | ||||||
Unearned premiums | 1,701 | 1,862 | ||||||
Reserves for loss and loss adjustment expenses | 3 | 304 | ||||||
Reserves for insurance and investment contracts | 4,710 | 5,655 | ||||||
Deferred tax assets/liabilities | 273 | 445 | ||||||
Other (net) | (1,094) | (1,605) | ||||||
| Net cash flow provided by operating activities | 11,848 | 26,546 | ||||||
| Cash flow from investing activities: | ||||||||
| Net change in: | ||||||||
Financial assets designated at fair value through income | (2,356) | (4,116) | ||||||
Available-for-sale investments | (363) | (12,039) | ||||||
Held-to-maturity investments | 43 | 50 | ||||||
Investments in associates and joint ventures | (1,129) | 130 | ||||||
Non-current assets and disposal groups held for sale | 3 | 2,193 | ||||||
Real estate held for investment | 418 | 617 | ||||||
Loans and advances to banks and customers | (9,502) | (18,094) | ||||||
Property and equipment | (267) | (736) | ||||||
| Acquisition of subsidiaries, net of cash acquired | (1,580) | (344) | ||||||
| Other (net) | 771 | 35 | ||||||
| Net cash flow used in investing activities | (13,962) | (32,304) | ||||||
| Cash flow from financing activities: | ||||||||
| Net change in: | ||||||||
Policyholders’ accounts | 1,407 | 3,654 | ||||||
Liabilities to banks and customers | 8,278 | 4,086 | ||||||
Certificated liabilities, participation certificates and subordinated liabilities | (3,131) | (592) | ||||||
| Transactions between equity holders | (7,172) | 8 | ||||||
| Dividends paid to shareholders | (1,972) | (1,447) | ||||||
| Net cash from sale or purchase of treasury shares | 25 | (217) | ||||||
| Other (net) | (13) | 307 | ||||||
| Net cash flow provided by (used in) financing activities | (2,578) | 5,799 | ||||||
| Effect of exchange rate changes on cash and cash equivalents | (76) | (56) | ||||||
| Change in cash and cash equivalents | (4,768) | (15) | ||||||
| Cash and cash equivalents at beginning of period | 33,031 | 31,647 | ||||||
| Cash and cash equivalents at end of period | 28,263 | 31,632 |
41
Table of Contents
Allianz Group Interim Report Third Quarter and First Nine Months of 2007
[THIS PAGE INTENTIONALLY LEFT BLANK]
42
Table of Contents
Notes to the Consolidated Financial Statements
Notes to the Condensed Consolidated Interim Financial Statements
The condensed consolidated interim financial statements of the Allianz Group – comprising the consolidated balance sheet, income statement, condensed cash flow statement, statement of changes in equity and selected explanatory notes – are presented in accordance with the requirements of IAS 34, Interim Financial Reporting, and have been prepared in accordance with International Financial Reporting Standards (“IFRSs”), as published by the International Accounting Standards Board (“IASB”) and as endorsed by the European Union (“EU”).
The condensed consolidated interim financial statements comply with all new or amended IFRSs, where application is compulsory for the first time for periods beginning on January 1, 2007. For existing and unchanged IFRSs the accounting policies for recognition, measurement, consolidation and presentation applied in the preparation of the condensed consolidated interim financial statements are consistent with the accounting policies that have been applied in the preparation of the consolidated financial statements for the year ended December 31, 2006.
IFRSs do not provide specific guidance concerning all aspects of the recognition and measurement of insurance and reinsurance contracts. Therefore, as envisioned
in IAS 8, Accounting Policies, Changes in Accounting Estimates and Errors, the provisions embodied under accounting principles generally accepted in the United States of America (“US GAAP”) have been applied to those aspects where specific guidance is not provided by IFRS 4, Insurance Contracts.
IFRS 7, Financial Instruments: Disclosures, is applicable for annual periods beginning January 1, 2007. IFRS 7 requires extended disclosures about the significance of financial instruments and the nature and extent of risks arising from financial instruments. Simultaneously with the development of IFRS 7, the IASB amended IAS 1, Presentation of Financial Statements, to add disclosures about capital management and capital requirements. The new requirements of IFRS 7 and IAS 1 will be of significance for the consolidated financial statements for the year ended December 31, 2007.
The condensed consolidated interim financial statements are presented in millions of Euro (€mn).
2 Changes in the presentation of the condensed consolidated interim financial statements
Reclassifications
Certain immaterial amounts of unearned premiums were previously netted against deferred acquisition costs in the consolidated balance sheets and against the related amortization account in the consolidated income statements. All periods have now been presented on a gross basis.
43
Table of Contents
Allianz Group Interim Report Third Quarter and First Nine Months of 2007
Business Segment Information – Consolidated Balance Sheets
As of September 30, 2007 and as of December 31, 2006
| Property-Casualty | Life/Health | Banking | ||||||||||||||||||||||||
As of September 30, 2007 €mn | As of December 31, €mn | As of September 30, 2007 €mn | As of December 31, €mn | As of September 30, 2007 €mn | As of December 31, €mn | |||||||||||||||||||||
| ASSETS | ||||||||||||||||||||||||||
| Cash and cash equivalents | 5,293 | 4,100 | 10,736 | 6,998 | 12,063 | 21,528 | ||||||||||||||||||||
| Financial assets carried at fair value through income | 4,460 | 4,814 | 13,852 | 11,026 | 134,267 | 139,505 | ||||||||||||||||||||
| Investments | 86,525 | 88,819 | 188,596 | 190,607 | 16,621 | 17,803 | ||||||||||||||||||||
| Loans and advances to banks and customers | 20,798 | 16,825 | 89,836 | 85,769 | 357,670 | 313,709 | ||||||||||||||||||||
| Financial assets for unit linked contracts | — | — | 66,254 | 61,864 | — | — | ||||||||||||||||||||
| Reinsurance assets | 11,005 | 11,437 | 6,432 | 7,966 | — | — | ||||||||||||||||||||
| Deferred acquisition costs | 3,816 | 3,704 | 15,980 | 15,381 | — | — | ||||||||||||||||||||
| Deferred tax assets | 1,581 | 1,651 | 456 | 503 | 1,661 | 1,679 | ||||||||||||||||||||
| Other assets | 20,735 | 17,737 | 13,063 | 12,891 | 9,885 | 9,571 | ||||||||||||||||||||
| Intangible assets | 2,343 | 1,653 | 2,393 | 2,399 | 2,283 | 2,285 | ||||||||||||||||||||
| Total assets | 156,556 | 150,740 | 407,598 | 395,404 | 534,450 | 506,080 | ||||||||||||||||||||
| Property-Casualty | Life/Health | Banking | ||||||||||||||||||||||||
As of September 30, 2007 €mn | As of 2006 €mn | As of September 30, 2007 €mn | As of December 31, €mn | As of September 30, 2007 €mn | As of December 31, €mn | |||||||||||||||||||||
| LIABILITIES AND EQUITY | ||||||||||||||||||||||||||
| Financial liabilities carried at fair value through income | 84 | 1,070 | 5,837 | 5,251 | 83,791 | 72,215 | ||||||||||||||||||||
| Liabilities to banks and customers | 7,136 | 4,473 | 10,027 | 7,446 | 369,703 | 350,148 | ||||||||||||||||||||
| Unearned premiums | 14,827 | 12,994 | 1,924 | 1,874 | — | — | ||||||||||||||||||||
| Reserves for loss and loss adjustment expenses | 57,956 | 58,664 | 6,758 | 6,804 | — | — | ||||||||||||||||||||
| Reserves for insurance and investment contracts | 9,068 | 8,956 | 281,856 | 278,701 | — | — | ||||||||||||||||||||
| Financial liabilities for unit linked contracts | — | — | 66,254 | 61,864 | — | — | ||||||||||||||||||||
| Deferred tax liabilities | 2,906 | 3,902 | 1,036 | 1,181 | 114 | 83 | ||||||||||||||||||||
| Other liabilities | 20,250 | 18,699 | 18,147 | 16,314 | 11,815 | 12,140 | ||||||||||||||||||||
| Certificated liabilities | 159 | 657 | 4 | 3 | 44,308 | 46,191 | ||||||||||||||||||||
| Participation certificates and subordinated liabilities | 1,607 | 1,605 | 65 | 66 | 8,232 | 8,456 | ||||||||||||||||||||
| Total liabilities | 113,993 | 111,020 | 391,908 | 379,504 | 517,963 | 489,233 | ||||||||||||||||||||
44
Table of Contents
Notes to the Consolidated Financial Statements
| Asset Management | Corporate | Consolidation | Group | |||||||||||||||||||||||||||
As of September 30, 2007 €mn | As of December 31, €mn | As of September 30, 2007 €mn | As of December 31, €mn | As of September 30, 2007 €mn | As of December 31, €mn | As of September 30, 2007 €mn | As of December 31, €mn | |||||||||||||||||||||||
| 866 | 767 | 367 | 536 | (1,062) | (898) | 28,263 | 33,031 | |||||||||||||||||||||||
| 1,053 | 985 | 914 | 1,158 | (1,019) | (619) | 153,527 | 156,869 | |||||||||||||||||||||||
| 821 | 774 | 104,531 | 96,652 | (104,909) | (96,521) | 292,185 | 298,134 | |||||||||||||||||||||||
| 521 | 367 | 4,249 | 2,963 | (15,633) | (11,355) | 457,441 | 408,278 | |||||||||||||||||||||||
| — | — | — | — | — | — | 66,254 | 61,864 | |||||||||||||||||||||||
| — | — | — | — | (41) | (43) | 17,396 | 19,360 | |||||||||||||||||||||||
| 54 | 50 | — | — | — | — | 19,850 | 19,135 | |||||||||||||||||||||||
| 168 | 196 | 812 | 1,473 | (130) | (775) | 4,548 | 4,727 | |||||||||||||||||||||||
| 3,355 | 3,471 | 6,420 | 7,020 | (12,664) | (11,797) | 40,794 | 38,893 | |||||||||||||||||||||||
| 6,118 | 6,334 | 1,368 | 264 | — | — | 14,505 | 12,935 | |||||||||||||||||||||||
| 12,956 | 12,944 | 118,661 | 110,066 | (135,458) | (122,008) | 1,094,763 | 1,053,226 | |||||||||||||||||||||||
| Asset Management | Corporate | Consolidation | Group | |||||||||||||||||||||||||||
As of September 30, 2007 €mn | As of December 31, €mn | As of September 30, 2007 €mn | As of December 31, €mn | As of September 30, 2007 €mn | As of December 31, €mn | As of September 30, 2007 €mn | As of December 31, €mn | |||||||||||||||||||||||
| — | — | 1,282 | 1,713 | (902) | (550) | 90,092 | 79,699 | |||||||||||||||||||||||
| 829 | 605 | 16,048 | 7,293 | (11,114) | (8,887) | 392,629 | 361,078 | |||||||||||||||||||||||
| — | — | — | — | (1) | — | 16,750 | 14,868 | |||||||||||||||||||||||
| — | — | — | — | (2) | (4) | 64,712 | 65,464 | |||||||||||||||||||||||
| — | — | 339 | 306 | (266) | (266) | 290,997 | 287,697 | |||||||||||||||||||||||
| — | — | — | — | — | — | 66,254 | 61,864 | |||||||||||||||||||||||
| 33 | 46 | 278 | 171 | (119) | (765) | 4,248 | 4,618 | |||||||||||||||||||||||
| 3,481 | 3,689 | 12,688 | 14,149 | (16,324) | (15,227) | 50,057 | 49,764 | |||||||||||||||||||||||
| — | — | 8,879 | 9,265 | (1,306) | (1,194) | 52,044 | 54,922 | |||||||||||||||||||||||
| — | — | 7,080 | 7,099 | (1,873) | (864) | 15,111 | 16,362 | |||||||||||||||||||||||
| 4,343 | 4,340 | 46,594 | 39,996 | (31,907) | (27,757) | 1,042,894 | 996,336 | |||||||||||||||||||||||
| Total equity | 51,869 | 56,890 | ||||||||||||||||||||||||||||
| Total liabilities and equity | 1,094,763 | 1,053,226 | ||||||||||||||||||||||||||||
45
Table of Contents
Allianz Group Interim Report Third Quarter and First Nine Months of 2007
Business Segment Information – Consolidated Income Statements
For the three months ended September 30, 2007 and 2006
| Property-Casualty | Life/Health | Banking | ||||||||||||||||||||||||
Three months ended September 30, | 2007 €mn | 2006 €mn | 2007 €mn | 2006 €mn | 2007 €mn | 2006 €mn | ||||||||||||||||||||
| Premiums written | 10,674 | 10,412 | 4,593 | 4,674 | — | — | ||||||||||||||||||||
| Ceded premiums written | (1,460) | (1,486) | (91) | (158) | — | — | ||||||||||||||||||||
| Change in unearned premiums | 737 | 750 | (21) | (50) | — | — | ||||||||||||||||||||
| Premiums earned (net) | 9,951 | 9,676 | 4,481 | 4,466 | — | — | ||||||||||||||||||||
| Interest and similar income | 1,007 | 928 | 3,174 | 3,093 | 1,979 | 1,856 | ||||||||||||||||||||
| Income from financial assets and liabilities carried at fair value through income (net) | 51 | 32 | 234 | (20) | (203) | 291 | ||||||||||||||||||||
| Realized gains/losses (net) | 315 | 231 | 628 | 537 | 78 | 71 | ||||||||||||||||||||
| Fee and commission income | 290 | 253 | 171 | 144 | 869 | 851 | ||||||||||||||||||||
| Other income | 14 | 13 | 10 | 7 | — | — | ||||||||||||||||||||
| Income from fully consolidated private equity investments | — | — | — | — | — | — | ||||||||||||||||||||
| Total income | 11,628 | 11,133 | 8,698 | 8,227 | 2,723 | 3,069 | ||||||||||||||||||||
| Claims and insurance benefits incurred (gross) | (7,122) | (6,789) | (4,010) | (4,130) | — | — | ||||||||||||||||||||
| Claims and insurance benefits incurred (ceded) | 507 | 581 | 109 | 188 | — | — | ||||||||||||||||||||
| Claims and insurance benefits incurred (net) | (6,615) | (6,208) | (3,901) | (3,942) | — | — | ||||||||||||||||||||
| Changes in reserves for insurance and investment contracts (net) | (114) | (151) | (2,140) | (2,262) | — | — | ||||||||||||||||||||
| Interest expense | (108) | (67) | (85) | (70) | (1,234) | (1,147) | ||||||||||||||||||||
| Loan loss provisions | 5 | — | 1 | — | (21) | 52 | ||||||||||||||||||||
| Impairments of investments (net) | (76) | (69) | (289) | (63) | (13) | (48) | ||||||||||||||||||||
| Investment expenses | (74) | (63) | (235) | (129) | (2) | (19) | ||||||||||||||||||||
| Acquisition and administrative expenses (net) | (2,745) | (2,512) | (1,113) | (1,087) | (1,166) | (1,294) | ||||||||||||||||||||
| Fee and commission expenses | (193) | (184) | (49) | (57) | (142) | (183) | ||||||||||||||||||||
| Amortization of intangible assets | (3) | (3) | (1) | — | — | 1 | ||||||||||||||||||||
| Restructuring charges | 38 | (10) | (4) | (8) | (4) | (32) | ||||||||||||||||||||
| Other expenses | (4) | — | — | — | (2) | (1) | ||||||||||||||||||||
| Expenses from fully consolidated private equity investments | — | — | — | — | — | — | ||||||||||||||||||||
| Total expenses | (9,889) | (9,267) | (7,816) | (7,618) | (2,584) | (2,671) | ||||||||||||||||||||
| Income (loss) before income taxes and minority interests in earnings | 1,739 | 1,866 | 882 | 609 | 139 | 398 | ||||||||||||||||||||
| Income taxes | 34 | (600) | (293) | (240) | (177) | (96) | ||||||||||||||||||||
| Minority interests in earnings | (65) | (177) | (26) | (81) | (16) | (19) | ||||||||||||||||||||
| Net income (loss) | 1,708 | 1,089 | 563 | 288 | (54) | 283 | ||||||||||||||||||||
46
Table of Contents
Notes to the Consolidated Financial Statements
| Asset Management | Corporate | Consolidation | Group | |||||||||||||||||||||||||||
2007 €mn | 2006 €mn | 2007 €mn | 2006 €mn | 2007 €mn | 2006 €mn | 2007 €mn | 2006 €mn | |||||||||||||||||||||||
| — | — | — | — | (5) | (7) | 15,262 | 15,079 | |||||||||||||||||||||||
| — | — | — | — | 5 | 7 | (1,546) | (1,637) | |||||||||||||||||||||||
| — | — | — | — | — | — | 716 | 700 | |||||||||||||||||||||||
| — | — | — | — | — | — | 14,432 | 14,142 | |||||||||||||||||||||||
| 39 | 29 | 221 | 102 | (275) | (243) | 6,145 | 5,765 | |||||||||||||||||||||||
| 8 | 5 | 44 | (118) | (18) | 20 | 116 | 210 | |||||||||||||||||||||||
| — | 1 | 15 | 287 | 43 | 1 | 1,079 | 1,128 | |||||||||||||||||||||||
| 1,071 | 999 | 40 | 41 | (163) | (216) | 2,278 | 2,072 | |||||||||||||||||||||||
| 4 | 3 | — | 6 | (19) | (27) | 9 | 2 | |||||||||||||||||||||||
| — | — | 686 | 436 | — | — | 686 | 436 | |||||||||||||||||||||||
| 1,122 | 1,037 | 1,006 | 754 | (432) | (465) | 24,745 | 23,755 | |||||||||||||||||||||||
| — | — | — | — | (6) | 11 | (11,138) | (10,908) | |||||||||||||||||||||||
| — | — | — | — | 6 | (11) | 622 | 758 | |||||||||||||||||||||||
| — | — | — | — | — | — | (10,516) | (10,150) | |||||||||||||||||||||||
| — | — | — | — | — | (25) | (2,254) | (2,438) | |||||||||||||||||||||||
| (16) | (10) | (402) | (300) | 253 | 162 | (1,592) | (1,432) | |||||||||||||||||||||||
| — | — | — | — | — | — | (15) | 52 | |||||||||||||||||||||||
| — | 1 | (10) | (7) | — | — | (388) | (186) | |||||||||||||||||||||||
| 1 | — | (18) | (63) | 50 | 62 | (278) | (212) | |||||||||||||||||||||||
| (570) | (566) | (171) | (215) | 14 | 30 | (5,751) | (5,644) | |||||||||||||||||||||||
| (304) | (300) | (36) | (25) | 136 | 179 | (588) | (570) | |||||||||||||||||||||||
| — | (1) | — | — | — | — | (4) | (3) | |||||||||||||||||||||||
| — | — | (8) | — | — | — | 22 | (50) | |||||||||||||||||||||||
| — | — | — | (1) | 1 | — | (5) | (2) | |||||||||||||||||||||||
| — | — | (682) | (447) | — | — | (682) | (447) | |||||||||||||||||||||||
| (889) | (876) | (1,327) | (1,058) | 454 | 408 | (22,051) | (21,082) | |||||||||||||||||||||||
| 233 | 161 | (321) | (304) | 22 | (57) | 2,694 | 2,673 | |||||||||||||||||||||||
| (87) | (67) | (126) | 180 | (6) | 26 | (655) | (797) | |||||||||||||||||||||||
| (4) | (10) | (8) | — | 1 | 2 | (118) | (285) | |||||||||||||||||||||||
| 142 | 84 | (455) | (124) | 17 | (29) | 1,921 | 1,591 | |||||||||||||||||||||||
47
Table of Contents
Allianz Group Interim Report Third Quarter and First Nine Months of 2007
Business Segment Information – Consolidated Income Statements
For the nine months ended September 30, 2007 and 2006
| Property-Casualty | Life/Health | Banking | ||||||||||||||||||||||||
Nine months ended September 30, | 2007 €mn | 2006 €mn | 2007 €mn | 2006 €mn | 2007 €mn | 2006 €mn | ||||||||||||||||||||
| Premiums written | 34,767 | 34,243 | 14,844 | 15,071 | — | — | ||||||||||||||||||||
| Ceded premiums written | (4,291) | (4,428) | (444) | (556) | — | — | ||||||||||||||||||||
| Change in unearned premiums | (1,511) | (1,440) | (51) | (202) | — | — | ||||||||||||||||||||
| Premiums earned (net) | 28,965 | 28,375 | 14,349 | 14,313 | — | — | ||||||||||||||||||||
| Interest and similar income | 3,393 | 3,107 | 10,112 | 9,838 | 6,402 | 5,366 | ||||||||||||||||||||
| Income from financial assets and liabilities carried at fair value through income (net) | 37 | 77 | (745) | (205) | 492 | 1,107 | ||||||||||||||||||||
| Realized gains/losses (net) | 1,299 | 1,584 | 2,484 | 2,773 | 268 | 517 | ||||||||||||||||||||
| Fee and commission income | 842 | 770 | 506 | 435 | 2,770 | 2,711 | ||||||||||||||||||||
| Other income | 109 | 51 | 73 | 20 | — | 25 | ||||||||||||||||||||
| Income from fully consolidated private equity investments | — | — | — | — | — | — | ||||||||||||||||||||
| Total income | 34,645 | 33,964 | 26,779 | 27,174 | 9,932 | 9,726 | ||||||||||||||||||||
| Claims and insurance benefits incurred (gross) | (21,389) | (20,311) | (13,224) | (13,293) | — | — | ||||||||||||||||||||
| Claims and insurance benefits incurred (ceded) | 2,125 | 1,831 | 463 | 555 | — | — | ||||||||||||||||||||
| Claims and insurance benefits incurred (net) | (19,264) | (18,480) | (12,761) | (12,738) | — | — | ||||||||||||||||||||
| Changes in reserves for insurance and investment contracts (net) | (292) | (344) | (6,975) | (7,860) | — | — | ||||||||||||||||||||
| Interest expense | (292) | (196) | (287) | (207) | (3,999) | (3,404) | ||||||||||||||||||||
| Loan loss provisions | (4) | (3) | (2) | 1 | (81) | 78 | ||||||||||||||||||||
| Impairments of investments (net) | (130) | (175) | (382) | (308) | (35) | (80) | ||||||||||||||||||||
| Investment expenses | (217) | (178) | (594) | (497) | (15) | (35) | ||||||||||||||||||||
| Acquisition and administrative expenses (net) | (8,125) | (7,686) | (3,102) | (3,217) | (3,910) | (4,158) | ||||||||||||||||||||
| Fee and commission expenses | (580) | (559) | (154) | (177) | (445) | (483) | ||||||||||||||||||||
| Amortization of intangible assets | (9) | (10) | (2) | (2) | — | — | ||||||||||||||||||||
| Restructuring charges | 16 | (366) | (12) | (169) | (16) | (41) | ||||||||||||||||||||
| Other expenses | (4) | (2) | — | — | 12 | 12 | ||||||||||||||||||||
| Expenses from fully consolidated private equity investments | — | — | — | — | — | — | ||||||||||||||||||||
| Total expenses | (28,901) | (27,999) | (24,271) | (25,174) | (8,489) | (8,111) | ||||||||||||||||||||
| Income (loss) before income taxes and minority interests in earnings | 5,744 | 5,965 | 2,508 | 2,000 | 1,443 | 1,615 | ||||||||||||||||||||
| Income taxes | (1,081) | (1,590) | (728) | (549) | (401) | (430) | ||||||||||||||||||||
| Minority interests in earnings | (395) | (604) | (185) | (301) | (60) | (74) | ||||||||||||||||||||
| Net income (loss) | 4,268 | 3,771 | 1,595 | 1,150 | 982 | 1,111 | ||||||||||||||||||||
48
Table of Contents
Notes to the Consolidated Financial Statements
| Asset Management | Corporate | Consolidation | Group | |||||||||||||||||||||||||||
2007 €mn | 2006 €mn | 2007 €mn | 2006 €mn | 2007 €mn | 2006 €mn | 2007 €mn | 2006 €mn | |||||||||||||||||||||||
| — | — | — | — | (13) | (11) | 49,598 | 49,303 | |||||||||||||||||||||||
| — | — | — | — | 13 | 11 | (4,722) | (4,973) | |||||||||||||||||||||||
| — | — | — | — | — | — | (1,562) | (1,642) | |||||||||||||||||||||||
| — | — | — | — | — | — | 43,314 | 42,688 | |||||||||||||||||||||||
| 105 | 79 | 620 | 403 | (905) | (786) | 19,727 | 18,007 | |||||||||||||||||||||||
| 31 | 17 | 85 | (270) | (12) | 47 | (112) | 773 | |||||||||||||||||||||||
| 3 | 2 | 1,003 | 784 | 319 | (300) | 5,376 | 5,360 | |||||||||||||||||||||||
| 3,224 | 3,060 | 129 | 120 | (515) | (610) | 6,956 | 6,486 | |||||||||||||||||||||||
| 11 | 9 | 14 | 23 | (99) | (70) | 108 | 58 | |||||||||||||||||||||||
| — | — | 1,627 | 764 | — | — | 1,627 | 764 | |||||||||||||||||||||||
| 3,374 | 3,167 | 3,478 | 1,824 | (1,212) | (1,719) | 76,996 | 74,136 | |||||||||||||||||||||||
| — | — | — | — | 7 | 22 | (34,606) | (33,582) | |||||||||||||||||||||||
| — | — | — | — | (7) | (22) | 2,581 | 2,364 | |||||||||||||||||||||||
| — | — | — | — | — | — | (32,025) | (31,218) | |||||||||||||||||||||||
| — | — | — | — | (55) | (304) | (7,322) | (8,508) | |||||||||||||||||||||||
| (46) | (30) | (1,149) | (959) | 742 | 515 | (5,031) | (4,281) | |||||||||||||||||||||||
| — | — | — | — | — | — | (87) | 76 | |||||||||||||||||||||||
| — | — | (10) | 15 | — | — | (557) | (548) | |||||||||||||||||||||||
| 1 | — | (72) | (140) | 156 | 156 | (741) | (694) | |||||||||||||||||||||||
| (1,715) | (1,712) | (539) | (496) | 52 | 98 | (17,339) | (17,171) | |||||||||||||||||||||||
| (946) | (932) | (97) | (67) | 399 | 463 | (1,823) | (1,755) | |||||||||||||||||||||||
| — | (1) | — | — | — | — | (11) | (13) | |||||||||||||||||||||||
| (2) | — | (8) | — | — | — | (22) | (576) | |||||||||||||||||||||||
| — | — | — | (1) | — | — | 8 | 9 | |||||||||||||||||||||||
| — | — | (1,598) | (761) | — | — | (1,598) | (761) | |||||||||||||||||||||||
| (2,708) | (2,675) | (3,473) | (2,409) | 1,294 | 928 | (66,548) | (65,440) | |||||||||||||||||||||||
| 666 | 492 | 5 | (585) | 82 | (791) | 10,448 | 8,696 | |||||||||||||||||||||||
| (268) | (194) | (71) | 414 | 69 | 296 | (2,480) | (2,053) | |||||||||||||||||||||||
| (23) | (34) | (16) | (9) | 12 | 28 | (667) | (994) | |||||||||||||||||||||||
| 375 | 264 | (82) | (180) | 163 | (467) | 7,301 | 5,649 | |||||||||||||||||||||||
49
Table of Contents
Allianz Group Interim Report Third Quarter and First Nine Months of 2007
Segment Information – Total Revenues and Operating Profit
For the three months and nine months ended September 30, 2007 and 2006
The following table summarizes the total revenues, operating profit and net income for each of the segments and the Allianz Group for the three months and nine months ended September 30, 2007 and 2006.
Property- Casualty | Life/Health | Banking | Asset Management | Corporate | Consolidation | Group | ||||||||||||||||||||||||||||||||||||||||||||||||||
2007 €mn | 2006 €mn | 2007 €mn | 2006 €mn | 2007 €mn | 2006 €mn | 2007 €mn | 2006 €mn | 2007 €mn | 2006 €mn | 2007 €mn | 2006 €mn | 2007 €mn | 2006 €mn | |||||||||||||||||||||||||||||||||||||||||||
| Three months ended September 30, | ||||||||||||||||||||||||||||||||||||||||||||||||||||||||
| Total revenues1) | 10,674 | 10,412 | 10,268 | 9,847 | 1,269 | 1,668 | 803 | 726 | — | — | (10) | (54) | 23,004 | 22,599 | ||||||||||||||||||||||||||||||||||||||||||
| Operating profit (loss) | 1,487 | 1,727 | 873 | 617 | 78 | 406 | 330 | 294 | (155) | (331) | (9) | (53) | 2,604 | 2,660 | ||||||||||||||||||||||||||||||||||||||||||
| Non-operating items | 252 | 139 | 9 | (8) | 61 | (8) | (97) | (133) | (166) | 27 | 31 | (4) | 90 | 13 | ||||||||||||||||||||||||||||||||||||||||||
| Income (loss) before income taxes and minority interests in earnings | 1,739 | 1,866 | 882 | 609 | 139 | 398 | 233 | 161 | (321) | (304) | 22 | (57) | 2,694 | 2,673 | ||||||||||||||||||||||||||||||||||||||||||
| Income taxes | 34 | (600) | (293) | (240) | (177) | (96) | (87) | (67) | (126) | 180 | (6) | 26 | (655) | (797) | ||||||||||||||||||||||||||||||||||||||||||
| Minority interests in earnings | (65) | (177) | (26) | (81) | (16) | (19) | (4) | (10) | (8) | — | 1 | 2 | (118) | (285) | ||||||||||||||||||||||||||||||||||||||||||
| Net income (loss) | 1,708 | 1,089 | 563 | 288 | (54) | 283 | 142 | 84 | (455) | (124) | 17 | (29) | 1,921 | 1,591 | ||||||||||||||||||||||||||||||||||||||||||
| Nine months ended September 30, | ||||||||||||||||||||||||||||||||||||||||||||||||||||||||
| Total revenues1) | 34,767 | 34,243 | 34,352 | 34,600 | 5,220 | 5,322 | 2,380 | 2,203 | — | — | (55) | (60) | 76,664 | 76,308 | ||||||||||||||||||||||||||||||||||||||||||
| Operating profit (loss) | 4,648 | 4,958 | 2,381 | 1,867 | 1,226 | 1,219 | 967 | 895 | (266) | (585) | (194) | (223) | 8,762 | 8,131 | ||||||||||||||||||||||||||||||||||||||||||
| Non-operating items | 1,096 | 1,007 | 127 | 133 | 217 | 396 | (301) | (403) | 271 | — | 276 | (568) | 1,686 | 565 | ||||||||||||||||||||||||||||||||||||||||||
| Income (loss) before income taxes and minority interests in earnings | 5,744 | 5,965 | 2,508 | 2,000 | 1,443 | 1,615 | 666 | 492 | 5 | (585) | 82 | (791) | 10,448 | 8,696 | ||||||||||||||||||||||||||||||||||||||||||
| Income taxes | (1,081) | (1,590) | (728) | (549) | (401) | (430) | (268) | (194) | (71) | 414 | 69 | 296 | (2,480) | (2,053) | ||||||||||||||||||||||||||||||||||||||||||
| Minority interests in earnings | (395) | (604) | (185) | (301) | (60) | (74) | (23) | (34) | (16) | (9) | 12 | 28 | (667) | (994) | ||||||||||||||||||||||||||||||||||||||||||
| Net income (loss) | 4,268 | 3,771 | 1,595 | 1,150 | 982 | 1,111 | 375 | 264 | (82) | (180) | 163 | (467) | 7,301 | 5,649 | ||||||||||||||||||||||||||||||||||||||||||
1) | Total revenues comprise Property-Casualty segment’s gross premiums written, Life/Health segment’s statutory premiums, Banking segment’s operating revenues and Asset Management segment’s operating revenues. |
50
Table of Contents
Notes to the Consolidated Financial Statements
Property-Casualty Segment
| Three months ended September 30, | Nine months ended September 30, | |||||||||||||||
2007 €mn | 2006 €mn | 2007 €mn | 2006 €mn | |||||||||||||
| Gross premiums written1) | 10,674 | 10,412 | 34,767 | 34,243 | ||||||||||||
| Ceded premiums written | (1,460) | (1,486) | (4,291) | (4,428) | ||||||||||||
| Change in unearned premiums | 737 | 750 | (1,511) | (1,440) | ||||||||||||
| Premiums earned (net) | 9,951 | 9,676 | 28,965 | 28,375 | ||||||||||||
| Interest and similar income | 1,007 | 928 | 3,393 | 3,107 | ||||||||||||
| Income from financial assets and liabilities designated at fair value through income (net)2) | 32 | 39 | 103 | 81 | ||||||||||||
| Income from financial assets and liabilities held for trading (net), shared with policyholder2) | 45 | — | (10) | — | ||||||||||||
| Realized gains/losses (net) from investments, shared with policyholders3) | 13 | 8 | 48 | 44 | ||||||||||||
| Fee and commission income | 290 | 253 | 842 | 770 | ||||||||||||
| Other income | 14 | 13 | 109 | 51 | ||||||||||||
| Operating revenues | 11,352 | 10,917 | 33,450 | 32,428 | ||||||||||||
| Claims and insurance benefits incurred (net) | (6,615) | (6,208) | (19,264) | (18,480) | ||||||||||||
| Changes in reserves for insurance and investment contracts (net) | (114) | (151) | (292) | (344) | ||||||||||||
| Interest expense | (108) | (67) | (292) | (196) | ||||||||||||
| Loan loss provisions | 5 | — | (4) | (3) | ||||||||||||
| Impairments of investments (net), shared with policyholders4) | (17) | (5) | (24) | (22) | ||||||||||||
| Investment expenses | (74) | (63) | (217) | (178) | ||||||||||||
| Acquisition and administrative expenses (net) | (2,745) | (2,512) | (8,125) | (7,686) | ||||||||||||
| Fee and commission expenses | (193) | (184) | (580) | (559) | ||||||||||||
| Other expenses | (4) | — | (4) | (2) | ||||||||||||
| Operating expenses | (9,865) | (9,190) | (28,802) | (27,470) | ||||||||||||
| Operating profit | 1,487 | 1,727 | 4,648 | 4,958 | ||||||||||||
| Income from financial assets and liabilities held for trading (net), not shared with policyholders2) | (26) | (7) | (56) | (4) | ||||||||||||
| Realized gains/losses (net) from investments, not shared with policyholders3) | 302 | 223 | 1,251 | 1,540 | ||||||||||||
| Impairments of investments (net), not shared with policyholders4) | (59) | (64) | (106) | (153) | ||||||||||||
| Amortization of intangible assets | (3) | (3) | (9) | (10) | ||||||||||||
| Restructuring charges | 38 | (10) | 16 | (366) | ||||||||||||
| Non-operating items | 252 | 139 | 1,096 | 1,007 | ||||||||||||
| Income before income taxes and minority interests in earnings | 1,739 | 1,866 | 5,744 | 5,965 | ||||||||||||
| Income taxes | 34 | (600) | (1,081) | (1,590) | ||||||||||||
| Minority interests in earnings | (65) | (177) | (395) | (604) | ||||||||||||
| Net income | 1,708 | 1,089 | 4,268 | 3,771 | ||||||||||||
| Loss ratio5)in % | 66.5 | 64.2 | 66.5 | 65.1 | ||||||||||||
| Expense ratio6)in % | 27.6 | 26.0 | 28.1 | 27.1 | ||||||||||||
| Combined ratio7)in % | 94.1 | 90.2 | 94.6 | 92.2 | ||||||||||||
1) | For the Property-Casualty segment, total revenues are measured based upon gross premiums written. |
2) | The total of these items equals income from financial assets and liabilities carried at fair value through income (net) in the segment income statement. |
3) | The total of these items equals realized gains/losses (net) in the segment income statement. |
4) | The total of these items equals impairments of investments (net) in the segment income statement. |
5) | Represents claims and insurance benefits incurred (net) divided by premiums earned (net). |
6) | Represents acquisition and administrative expenses (net) divided by premiums earned (net). |
7) | Represents the total of acquisition and administrative expenses (net) and claims and insurance benefits incurred (net) divided by premiums earned (net). |
51
Table of Contents
Allianz Group Interim Report Third Quarter and First Nine Months of 2007
Life/Health Segment
| Three months ended September 30, | Nine months ended September 30, | |||||||||||||||
2007 €mn | 2006 €mn | 2007 €mn | 2006 €mn | |||||||||||||
| Statutory premiums1) | 10,268 | 9,847 | 34,352 | 34,600 | ||||||||||||
| Ceded premiums written | (108) | (163) | (487) | (572) | ||||||||||||
| Change in unearned premiums | (17) | (49) | (41) | (200) | ||||||||||||
| Statutory premiums (net) | 10,143 | 9,635 | 33,824 | 33,828 | ||||||||||||
| Deposits from SFAS 97 insurance and investment contracts | (5,662) | (5,169) | (19,475) | (19,515) | ||||||||||||
| Premiums earned (net) | 4,481 | 4,466 | 14,349 | 14,313 | ||||||||||||
| Interest and similar income | 3,174 | 3,093 | 10,112 | 9,838 | ||||||||||||
| Income from financial assets and liabilities carried at fair value through income (net), shared with policyholders2) | 231 | (20) | (748) | (205) | ||||||||||||
| Realized gains/losses (net) from investments, shared with policyholders3) | 617 | 537 | 2,351 | 2,587 | ||||||||||||
| Fee and commission income | 171 | 144 | 506 | 435 | ||||||||||||
| Other income | 10 | 7 | 73 | 20 | ||||||||||||
| Operating revenues | 8,684 | 8,227 | 26,643 | 26,988 | ||||||||||||
| Claims and insurance benefits incurred (net) | (3,901) | (3,942) | (12,761) | (12,738) | ||||||||||||
| Changes in reserves for insurance and investment contracts (net) | (2,140) | (2,262) | (6,975) | (7,860) | ||||||||||||
| Interest expense | (85) | (70) | (287) | (207) | ||||||||||||
| Loan loss provisions | 1 | — | (2) | 1 | ||||||||||||
| Impairments of investments (net), shared with policyholders4) | (288) | (63) | (381) | (308) | ||||||||||||
| Investment expenses | (235) | (129) | (594) | (497) | ||||||||||||
| Acquisition and administrative expenses (net) | (1,113) | (1,087) | (3,102) | (3,217) | ||||||||||||
| Fee and commission expenses | (49) | (57) | (154) | (177) | ||||||||||||
| Operating restructuring charges5) | (1) | — | (6) | (118) | ||||||||||||
| Operating expenses | (7,811) | (7,610) | (24,262) | (25,121) | ||||||||||||
| Operating profit | 873 | 617 | 2,381 | 1,867 | ||||||||||||
| Income from financial assets and liabilities carried at fair value through income (net), not shared with policyholders2) | 3 | — | 3 | — | ||||||||||||
| Realized gains/losses (net) from investments, not shared with policyholders3) | 11 | — | 133 | 186 | ||||||||||||
| Impairments of investments (net), not shared with policyholders4) | (1) | — | (1) | — | ||||||||||||
| Amortization of intangible assets | (1) | — | (2) | (2) | ||||||||||||
| Non-operating restructuring charges5) | (3) | (8) | (6) | (51) | ||||||||||||
| Non-operating items | 9 | (8) | 127 | 133 | ||||||||||||
| Income before income taxes and minority interests in earnings | 882 | 609 | 2,508 | 2,000 | ||||||||||||
| Income taxes | (293) | (240) | (728) | (549) | ||||||||||||
| Minority interests in earnings | (26) | (81) | (185) | (301) | ||||||||||||
| Net income | 563 | 288 | 1,595 | 1,150 | ||||||||||||
| Statutory expense ratio6) in % | 11.0 | 11.3 | 9.2 | 9.5 | ||||||||||||
1) | For the Life/Health segment, total revenues are measured based upon statutory premiums. Statutory premiums are gross premiums written from sales of life insurance policies, as well as gross receipts from sales of unit linked and other investment-oriented products, in accordance with the statutory accounting practices applicable in the insurer’s home jurisdiction. |
2) | The total of these items equals income from financial assets and liabilities carried at fair value through income (net) in the segment income statement. |
3) | The total of these items equals realized gains/losses (net) in the segment income statement. |
4) | The total of these items equals impairments of investments (net) in the segment income statement. |
5) | The total of these items equals restructuring charges in the segment income statement. |
6) | Represents acquisition and administrative expenses (net) divided by statutory premiums (net). |
52
Table of Contents
Notes to the Consolidated Financial Statements
Banking Segment
| Three months ended September 30, | Nine months ended September 30, | |||||||||||||||||||||||||||||||
| 2007 | 2006 | 2007 | 2006 | |||||||||||||||||||||||||||||
Banking €mn | Dresdner Bank €mn | Banking €mn | Dresdner Bank1) €mn | Banking €mn | Dresdner Bank €mn | Banking €mn | Dresdner Bank1) €mn | |||||||||||||||||||||||||
| Net interest income2) | 745 | 724 | 709 | 695 | 2,403 | 2,325 | 1,962 | 1,904 | ||||||||||||||||||||||||
| Net fee and commission income3) | 727 | 689 | 668 | 631 | 2,325 | 2,196 | 2,228 | 2,104 | ||||||||||||||||||||||||
| Trading income (net)4) | (210) | (204) | 285 | 269 | 479 | 476 | 1,080 | 1,053 | ||||||||||||||||||||||||
| Income from financial assets and liabilities designated at fair value through income (net)4) | 7 | 8 | 6 | 6 | 13 | 13 | 27 | 27 | ||||||||||||||||||||||||
| Other income | — | — | — | — | — | — | 25 | 25 | ||||||||||||||||||||||||
| Operating revenues5) | 1,269 | 1,217 | 1,668 | 1,601 | 5,220 | 5,010 | 5,322 | 5,113 | ||||||||||||||||||||||||
| Administrative expenses | (1,166) | (1,105) | (1,294) | (1,237) | (3,910) | (3,737) | (4,158) | (4,004) | ||||||||||||||||||||||||
| Investment expenses | (2) | (4) | (19) | (21) | (15) | (20) | (35) | (40) | ||||||||||||||||||||||||
| Other expenses | (2) | — | (1) | (1) | 12 | 14 | 12 | 12 | ||||||||||||||||||||||||
| Operating expenses | (1,170) | (1,109) | (1,314) | (1,259) | (3,913) | (3,743) | (4,181) | (4,032) | ||||||||||||||||||||||||
| Loan loss provisions | (21) | (21) | 52 | 49 | (81) | (76) | 78 | 77 | ||||||||||||||||||||||||
| Operating profit | 78 | 87 | 406 | 391 | 1,226 | 1,191 | 1,219 | 1,158 | ||||||||||||||||||||||||
| Realized gains/losses (net) | 78 | 65 | 71 | 73 | 268 | 245 | 517 | 517 | ||||||||||||||||||||||||
| Impairments of investments (net) | (13) | (13) | (48) | (48) | (35) | (35) | (80) | (80) | ||||||||||||||||||||||||
| Amortization of intangible assets | — | — | 1 | — | — | — | — | — | ||||||||||||||||||||||||
| Restructuring charges | (4) | (4) | (32) | (33) | (16) | (17) | (41) | (41) | ||||||||||||||||||||||||
| Non-operating items | 61 | 48 | (8) | (8) | 217 | 193 | 396 | 396 | ||||||||||||||||||||||||
| Income before income taxes and minority interests in earnings | 139 | 135 | 398 | 383 | 1,443 | 1,384 | 1,615 | 1,554 | ||||||||||||||||||||||||
| Income taxes | (177) | (173) | (96) | (88) | (401) | (375) | (430) | (406) | ||||||||||||||||||||||||
| Minority interests in earnings | (16) | (14) | (19) | (17) | (60) | (54) | (74) | (63) | ||||||||||||||||||||||||
| Net income (loss) | (54) | (52) | 283 | 278 | 982 | 955 | 1,111 | 1,085 | ||||||||||||||||||||||||
| Cost-income ratio6)in % | 92.2 | 91.1 | 78.8 | 78.6 | 75.0 | 74.7 | 78.6 | 78.9 | ||||||||||||||||||||||||
1) | We have restated the presentation of revenues and operating profit stemming from trades in shares of Allianz SE and its affiliates. From 2007 onwards, these results are eliminated on Dresdner Bank level, whereas in 2006 they were adjusted on segment level only. |
2) | Represents interest and similar income less interest expense. |
3) | Represents fee and commission income less fee and commission expenses. |
4) | The total of these items equals income from financial assets and liabilities carried at fair value through income (net) in the segment income statement. |
5) | For the Banking segment, total revenues are measured based upon operating revenues. |
6) | Represents operating expenses divided by operating revenues. |
53
Table of Contents
Allianz Group Interim Report Third Quarter and First Nine Months of 2007
Asset Management Segment
| Three months ended September 30, | Nine months ended September 30, | |||||||||||||||||||||||||||||||
| 2007 | 2006 | 2007 | 2006 | |||||||||||||||||||||||||||||
Asset Management Segment €mn | Allianz Global Investors €mn | Asset Management Segment €mn | Allianz Global Investors €mn | Asset Management Segment €mn | Allianz Global Investors €mn | Asset Management Segment €mn | Allianz Global Investors €mn | |||||||||||||||||||||||||
| Net fee and commission income1) | 767 | 747 | 699 | 689 | 2,278 | 2,218 | 2,128 | 2,094 | ||||||||||||||||||||||||
| Net interest income2) | 24 | 19 | 19 | 17 | 60 | 55 | 49 | 46 | ||||||||||||||||||||||||
| Income from financial assets and liabilities carried at fair value through income (net) | 8 | 8 | 5 | 5 | 31 | 30 | 17 | 17 | ||||||||||||||||||||||||
| Other income | 4 | 4 | 3 | 3 | 11 | 11 | 9 | 9 | ||||||||||||||||||||||||
| Operating revenues3) | 803 | 778 | 726 | 714 | 2,380 | 2,314 | 2,203 | 2,166 | ||||||||||||||||||||||||
| Administrative expenses, excluding acquisition-related expenses4) | (473) | (456) | (432) | (422) | (1,413) | (1,374) | (1,308) | (1,279) | ||||||||||||||||||||||||
| Operating expenses | (473) | (456) | (432) | (422) | (1,413) | (1,374) | (1,308) | (1,279) | ||||||||||||||||||||||||
| Operating profit | 330 | 322 | 294 | 292 | 967 | 940 | 895 | 887 | ||||||||||||||||||||||||
| Realized gains/losses (net) | — | — | 1 | 1 | 3 | 3 | 2 | 1 | ||||||||||||||||||||||||
| Impairments of investments (net) | — | — | 1 | — | — | — | — | — | ||||||||||||||||||||||||
| Acquisition-related expenses, thereof4) | ||||||||||||||||||||||||||||||||
Deferred purchases of interests in PIMCO | (97) | (97) | (131) | (131) | (299) | (299) | (397) | (397) | ||||||||||||||||||||||||
Other acquisition-related expenses5) | — | — | (3) | (3) | (3) | (3) | (7) | (7) | ||||||||||||||||||||||||
Subtotal | (97) | (97) | (134) | (134) | (302) | (302) | (404) | (404) | ||||||||||||||||||||||||
Amortization of intangible assets | — | — | (1) | — | — | — | (1) | — | ||||||||||||||||||||||||
| Restructuring charges | — | — | — | — | (2) | (2) | — | — | ||||||||||||||||||||||||
| Non-operating items | (97) | (97) | (133) | (133) | (301) | (301) | (403) | (403) | ||||||||||||||||||||||||
| Income before income taxes and minority interests in earnings | 233 | 225 | 161 | 159 | 666 | 639 | 492 | 484 | ||||||||||||||||||||||||
| Income taxes | (87) | (85) | (67) | (67) | (268) | (264) | (194) | (193) | ||||||||||||||||||||||||
| Minority interests in earnings | (4) | (3) | (10) | (10) | (23) | (19) | (34) | (32) | ||||||||||||||||||||||||
| Net income | 142 | 137 | 84 | 82 | 375 | 356 | 264 | 259 | ||||||||||||||||||||||||
| Cost-income ratio6)in % | 58.9 | 58.6 | 59.5 | 59.1 | 59.4 | 59.4 | 59.4 | 59.0 | ||||||||||||||||||||||||
1) | Represents fee and commission income less fee and commission expenses. |
2) | Represents interest and similar income less interest expense and investment expenses. |
3) | For the Asset Management segment, total revenues are measured based upon operating revenues. |
4) | The total of these items equals acquisition and administration expenses (net) in the segment income statement. |
5) | Consists of retention payments for the management and employees of PIMCO and Nicholas Applegate. |
6) | Represents operating expenses divided by operating revenues. |
54
Table of Contents
Notes to the Consolidated Financial Statements
Corporate Segment
| Three months ended September 30, | Nine months ended September 30, | |||||||||||||||
2007 €mn | 2006 €mn | 2007 €mn | 2006 €mn | |||||||||||||
| Interest and similar income | 221 | 102 | 620 | 403 | ||||||||||||
| Income from financial assets and liabilities designated at fair value through income (net)1) | 1 | (56) | 6 | (56) | ||||||||||||
| Operating income from financial assets and liabilities held of trading (net)1) | (40) | — | (5) | — | ||||||||||||
| Fee and commission income | 40 | 41 | 129 | 120 | ||||||||||||
| Other income | — | 6 | 14 | 23 | ||||||||||||
| Income from fully consolidated private equity investments | 686 | 436 | 1,627 | 764 | ||||||||||||
| Operating revenues | 908 | 529 | 2,391 | 1,254 | ||||||||||||
| Interest expense, excluding interest expense from external debt2) | (131) | (109) | (378) | (374) | ||||||||||||
| Investment expenses | (18) | (63) | (72) | (140) | ||||||||||||
| Acquisition and administrative expenses (net), excluding acquisition-related expenses | (196) | (215) | (512) | (496) | ||||||||||||
| Fee and commission expenses | (36) | (25) | (97) | (67) | ||||||||||||
| Other expenses | — | (1) | — | (1) | ||||||||||||
| Expenses from fully consolidated private equity investments | (682) | (447) | (1,598) | (761) | ||||||||||||
| Operating expenses | (1,063) | (860) | (2,657) | (1,839) | ||||||||||||
| Operating profit (loss) | (155) | (331) | (266) | (585) | ||||||||||||
| Non-operating income from financial assets and liabilities held for trading (net)1) | 83 | (62) | 84 | (214) | ||||||||||||
| Realized gains/losses (net) | 15 | 287 | 1,003 | 784 | ||||||||||||
| Interest expense from external debt2) | (271) | (191) | (771) | (585) | ||||||||||||
| Impairments of investments (net) | (10) | (7) | (10) | 15 | ||||||||||||
| Acquisition-related expenses | 25 | — | (27) | — | ||||||||||||
| Non-operating restructuring charges | (8) | — | (8) | — | ||||||||||||
| Non-operating items | (166) | 27 | 271 | — | ||||||||||||
| Income (loss) before income taxes and minority interests in earnings | (321) | (304) | 5 | (585) | ||||||||||||
| Income taxes | (126) | 180 | (71) | 414 | ||||||||||||
| Minority interests in earnings | (8) | — | (16) | (9) | ||||||||||||
| Net loss | (455) | (124) | (82) | (180) | ||||||||||||
1) | The total of these items equals income from financial assets and liabilities carried at fair value through income (net) in the segment income statement. |
2) | The total of these items equals interest expense in the segment income statement. |
55
Table of Contents
Allianz Group Interim Report Third Quarter and First Nine Months of 2007
Supplementary Information to the
Consolidated Balance Sheets
4 Financial assets carried at fair value through income
As of September 30, 2007 €mn | As of December 31, 2006 €mn | |||||||
| Financial assets held for trading | ||||||||
Debt securities | 69,773 | 81,881 | ||||||
Equity securities | 34,660 | 31,266 | ||||||
Derivative financial instruments | 26,689 | 24,835 | ||||||
Subtotal | 131,122 | 137,982 | ||||||
| Financial assets designated at fair value through income | ||||||||
Debt securities | 17,194 | 14,414 | ||||||
Equity securities | 4,531 | 3,834 | ||||||
Loans to banks and customers | 680 | 639 | ||||||
Subtotal | 22,405 | 18,887 | ||||||
| Total | 153,527 | 156,869 |
As of September 30, 2007 €mn | As of December 31, 2006 €mn | |||||||
| Available-for-sale investments | 272,224 | 277,898 | ||||||
| Held-to-maturity investments | 4,627 | 4,748 | ||||||
| Funds held by others under reinsurance contracts assumed | 1,032 | 1,033 | ||||||
| Investments in associates and joint ventures | 6,457 | 4,900 | ||||||
| Real estate held for investment | 7,845 | 9,555 | ||||||
| Total | 292,185 | 298,134 |
Available-for-sale investments
| As of September 30, 2007 | As of December 31, 2006 | |||||||||||||||||||||||||||||||
Amortized €mn | Unrealized €mn | Unrealized €mn | Fair value €mn | Amortized €mn | Unrealized €mn | Unrealized €mn | Fair value €mn | |||||||||||||||||||||||||
| Equity securities | 42,206 | 25,117 | (454) | 66,869 | 43,139 | 26,795 | (159) | 69,775 | ||||||||||||||||||||||||
| Government debt securities | 109,470 | 1,352 | (1,947) | 108,875 | 112,893 | 2,813 | (1,077) | 114,629 | ||||||||||||||||||||||||
| Corporate debt securities | 95,301 | 732 | (2,243) | 93,790 | 90,493 | 1,542 | (860) | 91,175 | ||||||||||||||||||||||||
| Other debt securities | 2,688 | 108 | (106) | 2,690 | 2,122 | 215 | (18) | 2,319 | ||||||||||||||||||||||||
| Total | 249,665 | 27,309 | (4,750) | 272,224 | 248,647 | 31,365 | (2,114) | 277,898 | ||||||||||||||||||||||||
6 Loans and advances to banks and customers
| As of September 30, 2007 | As of December 31, 2006 | |||||||||||||||||||||||
Banks €mn | Customers €mn | Total €mn | Banks €mn | Customers €mn | Total €mn | |||||||||||||||||||
| Short-term investments and certificates of deposit | 9,309 | — | 9,309 | 6,775 | — | 6,775 | ||||||||||||||||||
| Reverse repurchase agreements | 83,944 | 65,179 | 149,123 | 86,957 | 52,456 | 139,413 | ||||||||||||||||||
| Collateral paid for securities borrowing transactions | 32,212 | 38,993 | 71,205 | 17,612 | 23,419 | 41,031 | ||||||||||||||||||
| Loans | 72,624 | 127,940 | 200,564 | 69,211 | 129,319 | 198,530 | ||||||||||||||||||
| Other advances | 17,500 | 10,798 | 28,298 | 15,225 | 8,358 | 23,583 | ||||||||||||||||||
| Subtotal | 215,589 | 242,910 | 458,499 | 195,780 | 213,552 | 409,332 | ||||||||||||||||||
| Loan loss allowance | (87) | (971) | (1,058) | (108) | (946) | (1,054) | ||||||||||||||||||
| Total | 215,502 | 241,939 | 457,441 | 195,672 | 212,606 | 408,278 | ||||||||||||||||||
56
Table of Contents
Notes to the Consolidated Financial Statements
Loans and advances to customers by type of customer
As of September 30, 2007 €mn | As of 2006 €mn | |||||||
| Corporate customers | 172,447 | 146,750 | ||||||
| Private customers | 56,161 | 59,505 | ||||||
| Public authorities | 14,302 | 7,297 | ||||||
| Subtotal | 242,910 | 213,552 | ||||||
| Loan loss allowance | (971) | (946) | ||||||
| Total | 241,939 | 212,606 |
As of September 30, 2007 €mn | As of 2006 €mn | |||||||
| Unearned premiums | 1,621 | 1,317 | ||||||
| Reserves for loss and loss adjustment expenses | 9,010 | 9,719 | ||||||
| Aggregate policy reserves | 6,671 | 8,223 | ||||||
| Other insurance reserves | 94 | 101 | ||||||
| Total | 17,396 | 19,360 |
As of September 30, 2007 €mn | As of 2006 €mn | |||||||
| Deferred acquisition costs | ||||||||
Property-Casualty | 3,808 | 3,692 | ||||||
Life/Health | 14,198 | 13,619 | ||||||
Asset Management | 54 | 50 | ||||||
Subtotal | 18,060 | 17,361 | ||||||
| Present value of future profits | 1,239 | 1,227 | ||||||
| Deferred sales inducements | 551 | 547 | ||||||
| Total | 19,850 | 19,135 |
As of 2007 €mn | As of €mn | |||||||
| Receivables | ||||||||
Policyholders | 4,032 | 4,292 | ||||||
Agents | 4,087 | 3,698 | ||||||
Reinsurers | 2,616 | 2,832 | ||||||
Other | 5,879 | 6,283 | ||||||
Less allowance for doubtful accounts | (359) | (330) | ||||||
Subtotal | 16,255 | 16,775 | ||||||
| Tax receivables | ||||||||
Income tax | 1,942 | 1,995 | ||||||
Other tax | 793 | 690 | ||||||
Subtotal | 2,735 | 2,685 | ||||||
| Accrued dividends, interest and rent | 5,340 | 5,658 | ||||||
| Prepaid expenses | ||||||||
Interest and rent | 3,703 | 2,678 | ||||||
Other prepaid expenses | 245 | 173 | ||||||
Subtotal | 3,948 | 2,851 | ||||||
| Derivative financial instruments used for hedging that meet the criteria for hedge accounting and firm commitments | 301 | 463 | ||||||
| Property and equipment | ||||||||
Real estate held for use | 3,756 | 4,758 | ||||||
Equipment | 1,828 | 1,597 | ||||||
Software | 1,102 | 1,078 | ||||||
Subtotal | 6,686 | 7,433 | ||||||
| Non-current assets and disposal groups held for sale | 2,339 | — | ||||||
| Other assets1) | 3,190 | 3,028 | ||||||
| Total | 40,794 | 38,893 |
1) | As of September 30, 2007, includes prepaid benefit costs for defined benefit plans of€285 mn. |
Non-current assets and disposal groups held for sale as of September 30, 2007 consists primarily of real estate held for investment and real estate held for use in Germany. Much of the real estate held for use is expected to be disposed of through sale-leaseback transactions.
57
Table of Contents
Allianz Group Interim Report Third Quarter and First Nine Months of 2007
As of September 30, 2007 €mn | As of 2006 €mn | |||||||
| Goodwill | 12,883 | 12,007 | ||||||
| Brand names | 1,080 | 717 | ||||||
| Other | 542 | 211 | ||||||
| Total | 14,505 | 12,935 |
The acquisition of a 100.0% participation in Selecta AG, Muntelier, increased brand names by €355 mn and other intangible assets by €340 mn.
Changes in goodwill for the nine months ended September 30, 2007, were as follows:
| €mn | ||||
| Cost as of 1/1/2007 | 12,231 | |||
| Accumulated impairments as of 1/1/2007 | (224) | |||
| Carrying amount as of 1/1/2007 | 12,007 | |||
| Additions | 1,119 | |||
| Foreign currency translation adjustments | (243) | |||
| Carrying amount as of 9/30/2007 | 12,883 | |||
| Accumulated impairments as of 9/30/2007 | 224 | |||
| Cost as of 9/30/2007 | 13,107 |
Additions include goodwill from
| • | increasing the interest in Russian People’s Insurance Society, Moscow, from 47.4% to 97.2%, |
| • | the acquisition of a 100.0% participation in Selecta AG, Muntelier, |
| • | the acquisition of a 100.0% participation in Commerce Assurance Bhd., Kuala Lumpur, |
| • | the acquisition of a 100.0% participation in Insurance Company “Progress Garant”, Moscow, |
| • | the acquisition of a 100.0% participation in SC Tour Michelet, Paris, |
| • | the acquisition of a 100.0% participation in JTS Insurance Company “ATF POLICY”, Almaty, |
| • | the acquisition of a 100.0% participation in United Mercantile Agencies, Inc., Kentucky. |
11 Financial liabilities carried at fair value through income
As of September 30, 2007 €mn | As of 2006 €mn | |||||||
| Financial liabilities held for trading | ||||||||
Obligations to deliver securities | 45,113 | 39,951 | ||||||
Derivative financial instruments | 29,784 | 27,823 | ||||||
Other trading liabilities | 14,163 | 10,988 | ||||||
Subtotal | 89,060 | 78,762 | ||||||
| Financial liabilities designated at fair value through income | 1,032 | 937 | ||||||
| Total | 90,092 | 79,699 |
58
Table of Contents
Notes to the Consolidated Financial Statements
12 Liabilities to banks and customers
| As of September 30, 2007 | As of December 31, 2006 | |||||||||||||||||||||||
Banks €mn | Customers €mn | Total €mn | Banks €mn | Customers €mn | Total €mn | |||||||||||||||||||
| Payable on demand | 16,729 | 67,822 | 84,551 | 18,216 | 68,677 | 86,893 | ||||||||||||||||||
| Savings deposits | — | 5,314 | 5,314 | — | 5,421 | 5,421 | ||||||||||||||||||
| Term deposits and certificates of deposit | 56,528 | 66,683 | 123,211 | 68,429 | 50,380 | 118,809 | ||||||||||||||||||
| Repurchase agreements | 74,109 | 54,839 | 128,948 | 68,189 | 49,403 | 117,592 | ||||||||||||||||||
| Collateral received from securities lending transactions | 25,347 | 15,176 | 40,523 | 19,914 | 8,703 | 28,617 | ||||||||||||||||||
| Other | 7,965 | 2,117 | 10,082 | 876 | 2,870 | 3,746 | ||||||||||||||||||
| Total | 180,678 | 211,951 | 392,629 | 175,624 | 185,454 | 361,078 | ||||||||||||||||||
13 Reserves for loss and loss adjustment expenses
As of September 30, | As of December 31, | |||||||
2007 €mn | 2006 €mn | |||||||
| Property-Casualty | 57,956 | 58,664 | ||||||
| Life/Health | 6,758 | 6,804 | ||||||
| Consolidation | (2) | (4) | ||||||
| Total | 64,712 | 65,464 |
Changes in the reserves for loss and loss adjustment expenses for the Property-Casualty segment for the nine months ended September 30, 2007 and 2006, are as follows:
| 2007 | 2006 | |||||||||||||||||||||||
Gross €mn | Ceded €mn | Net €mn | Gross €mn | Ceded €mn | Net €mn | |||||||||||||||||||
| Reserves for loss and loss adjustment expenses as of 1/1/ | 58,664 | (9,333) | 49,331 | 60,259 | (10,604) | 49,655 | ||||||||||||||||||
| Loss and loss adjustment expenses incurred | ||||||||||||||||||||||||
Current year | 22,551 | (2,393) | 20,158 | 21,251 | (2,056) | 19,195 | ||||||||||||||||||
Prior years | (1,162) | 268 | (894) | (940) | 225 | (715) | ||||||||||||||||||
Subtotal | 21,389 | (2,125) | 19,264 | 20,311 | (1,831) | 18,480 | ||||||||||||||||||
| Loss and loss adjustment expenses paid | ||||||||||||||||||||||||
Current year | (9,132) | 746 | (8,386) | (8,137) | 416 | (7,721) | ||||||||||||||||||
Prior years | (11,852) | 1,566 | (10,286) | (11,848) | 1,950 | (9,898) | ||||||||||||||||||
Subtotal | (20,984) | 2,312 | (18,672) | (19,985) | 2,366 | (17,619) | ||||||||||||||||||
| Foreign currency translation adjustments and other | (1,371) | 520 | (851) | (1,053) | 271 | (782) | ||||||||||||||||||
| Changes in the consolidated subsidiaries of the Allianz Group | 258 | (61) | 197 | — | — | — | ||||||||||||||||||
| Reserves for loss and loss adjustment expenses as of 9/30/ | 57,956 | (8,687) | 49,269 | 59,532 | (9,798) | 49,734 |
59
Table of Contents
Allianz Group Interim Report Third Quarter and First Nine Months of 2007
14 Reserves for insurance and investment contracts
As of September 30, 2007 €mn | As of €mn | |||||||
| Aggregate policy reserves | 260,674 | 256,333 | ||||||
| Reserves for premium refunds | 29,579 | 30,689 | ||||||
| Other insurance reserves | 744 | 675 | ||||||
| Total | 290,997 | 287,697 |
As of September 30, 2007 €mn | As of €mn | |||||||
| Payables | ||||||||
Policyholders | 4,500 | 5,322 | ||||||
Reinsurance | 2,000 | 1,868 | ||||||
Agents | 1,765 | 1,494 | ||||||
Subtotal | 8,265 | 8,684 | ||||||
| Payables for social security | 368 | 219 | ||||||
| Tax payables | ||||||||
Income tax | 2,364 | 2,076 | ||||||
Other | 1,080 | 968 | ||||||
Subtotal | 3,444 | 3,044 | ||||||
| Accrued interest and rent | 849 | 793 | ||||||
| Unearned income | ||||||||
Interest and rent | 3,689 | 2,645 | ||||||
Other | 200 | 279 | ||||||
Subtotal | 3,889 | 2,924 | ||||||
| Provisions | ||||||||
Pensions and similar obligations | 4,181 | 4,120 | ||||||
Employee related | 2,773 | 3,120 | ||||||
Share-based compensation | 1,707 | 1,898 | ||||||
Restructuring plans | 567 | 887 | ||||||
Loan commitments | 246 | 261 | ||||||
Other provisions | 1,930 | 1,943 | ||||||
Subtotal | 11,404 | 12,229 | ||||||
| Deposits retained for reinsurance ceded | 4,381 | 5,716 | ||||||
| Derivative financial instruments used for hedging purposes that meet the criteria for hedge accounting and firm commitments | 1,779 | 907 | ||||||
| Financial liabilities for puttable equity instruments | 4,753 | 3,750 | ||||||
| Disposal groups held for sale | 7 | — | ||||||
| Other liabilities | 10,918 | 11,498 | ||||||
| Total | 50,057 | 49,764 |
As of September 30, 2007 €mn | As of €mn | |||||||
| Allianz SE1) | ||||||||
Senior bonds | 5,384 | 6,195 | ||||||
Exchangeable bonds | 450 | 1,262 | ||||||
Money market securities | 2,089 | 870 | ||||||
Subtotal | 7,923 | 8,327 | ||||||
| Banking subsidiaries | ||||||||
Senior bonds | 20,885 | 23,337 | ||||||
Money market securities | 23,232 | 22,655 | ||||||
Subtotal | 44,117 | 45,992 | ||||||
| All other subsidiaries | ||||||||
Certificated liabilities | 4 | 4 | ||||||
Money market securities | — | 599 | ||||||
Subtotal | 4 | 603 | ||||||
| Total | 52,044 | 54,922 |
1) | Includes senior bonds and exchangeable bonds issued by Allianz Finance B.V. and Allianz Finance II B.V. guaranteed by Allianz SE and money market securities issued by Allianz Finance Corporation, a wholly-owned subsidiary of Allianz SE, which are fully and unconditionally guaranteed by Allianz SE. |
17 Participation certificates and subordinated liabilities
As of September 30, 2007 €mn | As of €mn | |||||||
| Allianz SE1) | ||||||||
Subordinated bonds | 6,859 | 6,883 | ||||||
Participation certificates | 85 | 85 | ||||||
Subtotal | 6,944 | 6,968 | ||||||
| Banking subsidiaries | ||||||||
Subordinated liabilities | 3,057 | 3,669 | ||||||
Hybrid equity | 2,456 | 2,513 | ||||||
Participation certificates | 1,702 | 2,262 | ||||||
Subtotal | 7,215 | 8,444 | ||||||
| All other subsidiaries | ||||||||
Subordinated liabilities | 907 | 905 | ||||||
Hybrid equity | 45 | 45 | ||||||
Subtotal | 952 | 950 | ||||||
| Total | 15,111 | 16,362 |
1) | Includes subordinated bonds issued by Allianz Finance B.V. and Allianz Finance II B.V. and guaranteed by Allianz SE. |
60
Table of Contents
Notes to the Consolidated Financial Statements
As of September 30, 2007 €mn | As of €mn | |||||||
| Shareholders’ equity | ||||||||
Issued capital | 1,149 | 1,106 | ||||||
Capital reserve | 27,014 | 24,292 | ||||||
Revenue reserves | 12,871 | 14,070 | ||||||
Treasury shares | (84) | (441) | ||||||
Foreign currency translation adjustments | (3,095) | (2,210) | ||||||
Unrealized gains and losses (net)1) | 11,195 | 13,664 | ||||||
Subtotal | 49,050 | 50,481 | ||||||
| Minority interests | 2,819 | 6,409 | ||||||
| Total | 51,869 | 56,890 |
1) | As of September 30, 2007 includes€158 mn related to cash flow hedges (2006: €140 mn). |
61
Table of Contents
Allianz Group Interim Report Third Quarter and First Nine Months of 2007
Supplementary Information to the Consolidated Income Statements
Property- Casualty | Life/Health | Consolidation | Total | |||||||||||||
| Three months ended September 30, | €mn | €mn | €mn | €mn | ||||||||||||
| 2007 | ||||||||||||||||
| Premiums written | ||||||||||||||||
Direct | 9,715 | 4,513 | — | 14,228 | ||||||||||||
Assumed | 959 | 80 | (5) | 1,034 | ||||||||||||
Subtotal | 10,674 | 4,593 | (5) | 15,262 | ||||||||||||
Ceded | (1,460) | (91) | 5 | (1,546) | ||||||||||||
Net | 9,214 | 4,502 | — | 13,716 | ||||||||||||
| Change in unearned premiums | ||||||||||||||||
Direct | 839 | (17) | — | 822 | ||||||||||||
Assumed | 56 | (3) | — | 53 | ||||||||||||
Subtotal | 895 | (20) | — | 875 | ||||||||||||
Ceded | (158) | (1) | — | (159) | ||||||||||||
Net | 737 | (21) | — | 716 | ||||||||||||
| Premiums earned | ||||||||||||||||
Direct | 10,554 | 4,496 | — | 15,050 | ||||||||||||
Assumed | 1,015 | 77 | (5) | 1,087 | ||||||||||||
Subtotal | 11,569 | 4,573 | (5) | 16,137 | ||||||||||||
Ceded | (1,618) | (92) | 5 | (1,705) | ||||||||||||
Net | 9,951 | 4,481 | — | 14,432 | ||||||||||||
| 2006 | ||||||||||||||||
| Premiums written | ||||||||||||||||
Direct | 9,468 | 4,593 | — | 14,061 | ||||||||||||
Assumed | 944 | 81 | (7) | 1,018 | ||||||||||||
Subtotal | 10,412 | 4,674 | (7) | 15,079 | ||||||||||||
Ceded | (1,486) | (158) | 7 | (1,637) | ||||||||||||
Net | 8,926 | 4,516 | — | 13,442 | ||||||||||||
| Change in unearned premiums | ||||||||||||||||
Direct | 940 | (49) | — | 891 | ||||||||||||
Assumed | 26 | — | — | 26 | ||||||||||||
Subtotal | 966 | (49) | — | 917 | ||||||||||||
Ceded | (216) | (1) | — | (217) | ||||||||||||
Net | 750 | (50) | — | 700 | ||||||||||||
| Premiums earned | ||||||||||||||||
Direct | 10,408 | 4,544 | — | 14,952 | ||||||||||||
Assumed | 970 | 81 | (7) | 1,044 | ||||||||||||
Subtotal | 11,378 | 4,625 | (7) | 15,996 | ||||||||||||
Ceded | (1,702) | (159) | 7 | (1,854) | ||||||||||||
Net | 9,676 | 4,466 | — | 14,142 |
62
Table of Contents
Notes to the Consolidated Financial Statements
19 Premiums earned (net) (continued)
Property- Casualty | Life/Health | Consolidation | Total | |||||||||||||
| Nine months ended September 30, | €mn | €mn | €mn | €mn | ||||||||||||
| 2007 | ||||||||||||||||
| Premiums written | ||||||||||||||||
Direct | 32,526 | 14,618 | — | 47,144 | ||||||||||||
Assumed | 2,241 | 226 | (13) | 2,454 | ||||||||||||
Subtotal | 34,767 | 14,844 | (13) | 49,598 | ||||||||||||
Ceded | (4,291) | (444) | 13 | (4,722) | ||||||||||||
Net | 30,476 | 14,400 | — | 44,876 | ||||||||||||
| Change in unearned premiums | ||||||||||||||||
Direct | (1,723) | (55) | — | (1,778) | ||||||||||||
Assumed | (38) | 4 | 1 | (33) | ||||||||||||
Subtotal | (1,761) | (51) | 1 | (1,811) | ||||||||||||
Ceded | 250 | — | (1) | 249 | ||||||||||||
Net | (1,511) | (51) | — | (1,562) | ||||||||||||
| Premiums earned | ||||||||||||||||
Direct | 30,803 | 14,563 | — | 45,366 | ||||||||||||
Assumed | 2,203 | 230 | (12) | 2,421 | ||||||||||||
Subtotal | 33,006 | 14,793 | (12) | 47,787 | ||||||||||||
Ceded | (4,041) | (444) | 12 | (4,473) | ||||||||||||
Net | 28,965 | 14,349 | — | 43,314 | ||||||||||||
| 2006 | ||||||||||||||||
| Premiums written | ||||||||||||||||
Direct | 31,975 | 14,797 | — | 46,772 | ||||||||||||
Assumed | 2,268 | 274 | (11) | 2,531 | ||||||||||||
Subtotal | 34,243 | 15,071 | (11) | 49,303 | ||||||||||||
Ceded | (4,428) | (556) | 11 | (4,973) | ||||||||||||
Net | 29,815 | 14,515 | — | 44,330 | ||||||||||||
| Change in unearned premiums | ||||||||||||||||
Direct | (1,592) | (192) | — | (1,784) | ||||||||||||
Assumed | 30 | (11) | — | 19 | ||||||||||||
Subtotal | (1,562) | (203) | — | (1,765) | ||||||||||||
Ceded | 122 | 1 | — | 123 | ||||||||||||
Net | (1,440) | (202) | — | (1,642) | ||||||||||||
| Premiums earned | ||||||||||||||||
Direct | 30,383 | 14,605 | — | 44,988 | ||||||||||||
Assumed | 2,298 | 263 | (11) | 2,550 | ||||||||||||
Subtotal | 32,681 | 14,868 | (11) | 47,538 | ||||||||||||
Ceded | (4,306) | (555) | 11 | (4,850) | ||||||||||||
Net | 28,375 | 14,313 | — | 42,688 |
20 Interest and similar income
| Three months ended September 30, | Nine months ended September 30, | |||||||||||||||
2007 €mn | 2006 €mn | 2007 €mn | 2006 €mn | |||||||||||||
| Interest from held-to-maturity investments | 56 | 56 | 167 | 173 | ||||||||||||
| Dividends from available-for-sale investments | 363 | 303 | 2,017 | 1,834 | ||||||||||||
| Interest from available-for-sale investments | 2,435 | 2,346 | 7,205 | 6,899 | ||||||||||||
| Share of earnings from investments in associates and joint ventures | 62 | 58 | 393 | 180 | ||||||||||||
| Rent from real estate held for investment | 191 | 222 | 620 | 685 | ||||||||||||
| Interest from loans to banks and customers | 2,993 | 2,747 | 9,146 | 8,124 | ||||||||||||
| Other | 45 | 33 | 179 | 112 | ||||||||||||
| Total | 6,145 | 5,765 | 19,727 | 18,007 | ||||||||||||
63
Table of Contents
Allianz Group Interim Report Third Quarter and First Nine Months of 2007
21 Income from financial assets and liabilities carried at fair value through income (net)
| Property- Casualty | Life/Health | Banking | Asset Management | Corporate | Consolidation | Group | ||||||||||||||||||||||
| Three months ended September 30, | €mn | €mn | €mn | €mn | €mn | €mn | €mn | |||||||||||||||||||||
| 2007 | ||||||||||||||||||||||||||||
| Income (expense) from financial assets and liabilities held for trading | 19 | 141 | (210) | (1) | 43 | (17) | (25) | |||||||||||||||||||||
| Income from financial assets designated at fair value through income | 34 | 16 | 48 | 3 | 1 | — | 102 | |||||||||||||||||||||
| Income (expense) from financial liabilities designated at fair value through income | 1 | 1 | (41) | — | — | (1) | (40) | |||||||||||||||||||||
| Income (expense) from financial liabilities for puttable equity instruments | (3) | 76 | — | 6 | — | — | 79 | |||||||||||||||||||||
| Total | 51 | 234 | (203) | 8 | 44 | (18) | 116 | |||||||||||||||||||||
| 2006 | ||||||||||||||||||||||||||||
| Income (expense) from financial assets and liabilities held for trading | (7) | (316) | 285 | — | (62) | 20 | (80) | |||||||||||||||||||||
| Income from financial assets designated at fair value through income | 36 | 386 | 23 | 43 | — | — | 488 | |||||||||||||||||||||
| Income (expense) from financial liabilities designated at fair value through income | 1 | — | (17) | — | — | — | (16) | |||||||||||||||||||||
| Income (expense) from financial liabilities for puttable equity instruments | 2 | (90) | — | (38) | (56) | — | (182) | |||||||||||||||||||||
| Total | 32 | (20) | 291 | 5 | (118) | 20 | 210 | |||||||||||||||||||||
| Property- Casualty | Life/Health | Banking | Asset Management | Corporate | Consolidation | Group | ||||||||||||||||||||||
| Nine months ended September 30, | €mn | €mn | €mn | €mn | €mn | €mn | €mn | |||||||||||||||||||||
| 2007 | ||||||||||||||||||||||||||||
| Income (expense) from financial assets and liabilities held for trading | (66) | (1,048) | 479 | 2 | 79 | (4) | (558) | |||||||||||||||||||||
| Income from financial assets designated at fair value through income | 105 | 336 | 122 | 72 | 6 | (8) | 633 | |||||||||||||||||||||
| Income (expense) from financial liabilities designated at fair value through income | 3 | 10 | (109) | — | — | — | (96) | |||||||||||||||||||||
| Expense from financial liabilities for puttable equity instruments | (5) | (43) | — | (43) | — | — | (91) | |||||||||||||||||||||
| Total | 37 | (745) | 492 | 31 | 85 | (12) | (112) | |||||||||||||||||||||
| 2006 | ||||||||||||||||||||||||||||
| Income (expense) from financial assets and liabilities held for trading | (4) | (444) | 1,080 | 3 | (214) | 46 | 467 | |||||||||||||||||||||
| Income (expense) from financial assets designated at fair value through income | 86 | 342 | 69 | (109) | — | — | 388 | |||||||||||||||||||||
| Income (expense) from financial liabilities designated at fair value through income | — | (1) | (42) | — | — | 1 | (42) | |||||||||||||||||||||
| Income (expense) from financial liabilities for puttable equity instruments | (5) | (102) | — | 123 | (56) | — | (40) | |||||||||||||||||||||
| Total | 77 | (205) | 1,107 | 17 | (270) | 47 | 773 |
64
Table of Contents
Notes to the Consolidated Financial Statements
Income from financial assets and liabilities held for trading (net)
Life/Health Segment
Income from financial assets and liabilities held for trading for the nine months ended September 30, 2007 includes expenses of €1,069 mn (2006: €433 mn) from derivative financial instruments in the Life/Health
segment. Expenses of €758 mn (2006: €232 mn) result from the purchase of forward contracts for interest bonds and forward sales of shares. Also included are expenses from derivative financial instruments related to equity indexed annuity contracts and guaranteed benefits under unit-linked contracts of €185 mn (2006: €266 mn) and expenses from other derivative financial instruments of €126 mn (2006: income: €65 mn).
Banking Segment
Income from financial assets and liabilities held for trading of the Banking segment comprises:
| Three months ended September 30, | Nine months ended September 30, | |||||||||||||||
2007 €mn | 2006 €mn | 2007 €mn | 2006 €mn | |||||||||||||
| Trading in interest products | (346) | 227 | 62 | 760 | ||||||||||||
| Trading in equity products | 149 | 67 | 409 | 222 | ||||||||||||
| Foreign exchange/precious metals trading | 95 | 40 | 187 | 149 | ||||||||||||
| Other trading activities | (108) | (49) | (179) | (51) | ||||||||||||
| Total | (210) | 285 | 479 | 1,080 | ||||||||||||
Corporate Segment
Income from financial assets and liabilities held for trading for the nine months ended September 30, 2007, includes income of €88 mn (2006: expense: €175 mn) from derivative financial instruments used by the Corporate segment for which hedge accounting is not applied. This includes expenses from derivative financial instru-
ments embedded in exchangeable bonds of €200 mn (2006: €353 mn), income from derivative financial instruments which economically hedge the exchangeable bonds, however which do not qualify for hedge accounting, of €164 mn (2006: €219 mn), and income from other derivative financial instruments of €124 mn (2006: expense: €41 mn).
22 Realized gains/losses (net)
| Three months ended September 30, | Nine months ended September 30, | |||||||||||||||
2007 €mn | 2006 €mn | 2007 €mn | 2006 €mn | |||||||||||||
| Realized gains | ||||||||||||||||
| Available-for-sale investments | ||||||||||||||||
Equity securities | 1,317 | 626 | 5,902 | 4,429 | ||||||||||||
Debt securities | 74 | 144 | 316 | 515 | ||||||||||||
Subtotal | 1,391 | 770 | 6,218 | 4,944 | ||||||||||||
| Investments in associates and joint ventures1) | 121 | 595 | 166 | 862 | ||||||||||||
| Loans to banks and customers | 17 | 1 | 42 | 31 | ||||||||||||
| Real estate held for investment | 110 | 68 | 327 | 551 | ||||||||||||
| Subtotal | 1,639 | 1,434 | 6,753 | 6,388 | ||||||||||||
| Realized losses | ||||||||||||||||
| Available-for-sale investments | ||||||||||||||||
Equity securities | (118) | (89) | (262) | (293) | ||||||||||||
Debt securities | (346) | (205) | (932) | (671) | ||||||||||||
Subtotal | (464) | (294) | (1,194) | (964) | ||||||||||||
| Investments in associates and joint ventures2) | (50) | (3) | (56) | (11) | ||||||||||||
| Loans to banks and customers | (43) | (6) | (84) | (23) | ||||||||||||
| Real estate held for investment | (3) | (3) | (43) | (30) | ||||||||||||
| Subtotal | (560) | (306) | (1,377) | (1,028) | ||||||||||||
| Total | 1,079 | 1,128 | 5,376 | 5,360 | ||||||||||||
1) | During the three and nine months ended September 30, 2007, includes realized gains from the disposal of subsidiaries of€114 mn (2006:€533 mn) and€121 mn (2006:€603 mn) respectively. |
2) | During the three and nine months ended September 30, 2007, includes realized losses from the disposal of subsidiaries of€46 mn (2006:€1 mn) and€47 mn (2006:€2 mn) respectively. |
65
Table of Contents
Allianz Group Interim Report Third Quarter and First Nine Months of 2007
| Three months ended September 30, | 2007 | 2006 | ||||||||||||||||||||||
Segment €mn | Consolidation €mn | Group €mn | Segment €mn | Consolidation €mn | Group €mn | |||||||||||||||||||
| Property-Casualty | ||||||||||||||||||||||||
Fees from credit and assistance business | 174 | — | 174 | 168 | — | 168 | ||||||||||||||||||
Service agreements | 116 | (8) | 108 | 82 | (7) | 75 | ||||||||||||||||||
Investment advisory | — | — | — | 3 | — | 3 | ||||||||||||||||||
Subtotal | 290 | (8) | 282 | 253 | (7) | 246 | ||||||||||||||||||
| Life/Health | ||||||||||||||||||||||||
Service agreements | 43 | (3) | 40 | 27 | (9) | 18 | ||||||||||||||||||
Investment advisory | 125 | (5) | 120 | 119 | — | 119 | ||||||||||||||||||
Other | 3 | (3) | — | (2) | (3) | (5) | ||||||||||||||||||
Subtotal | 171 | (11) | 160 | 144 | (12) | 132 | ||||||||||||||||||
| Banking | ||||||||||||||||||||||||
Securities business | 365 | (45) | 320 | 305 | (48) | 257 | ||||||||||||||||||
Investment advisory | 150 | (33) | 117 | 136 | (49) | 87 | ||||||||||||||||||
Payment transactions | 90 | (1) | 89 | 87 | — | 87 | ||||||||||||||||||
Mergers and acquisitions advisory | 65 | — | 65 | 83 | — | 83 | ||||||||||||||||||
Underwriting business | 21 | — | 21 | 27 | — | 27 | ||||||||||||||||||
Other | 178 | (8) | 170 | 213 | (52) | 161 | ||||||||||||||||||
Subtotal | 869 | (87) | 782 | 851 | (149) | 702 | ||||||||||||||||||
| Asset Management | ||||||||||||||||||||||||
Management fees | 928 | (32) | 896 | 830 | (25) | 805 | ||||||||||||||||||
Loading and exit fees | 78 | — | 78 | 76 | — | 76 | ||||||||||||||||||
Performance fees | 33 | — | 33 | 5 | 1 | 6 | ||||||||||||||||||
Other | 32 | (2) | 30 | 88 | (1) | 87 | ||||||||||||||||||
Subtotal | 1,071 | (34) | 1,037 | 999 | (25) | 974 | ||||||||||||||||||
| Corporate | ||||||||||||||||||||||||
Service agreements | 40 | (23) | 17 | 41 | (23) | 18 | ||||||||||||||||||
Subtotal | 40 | (23) | 17 | 41 | (23) | 18 | ||||||||||||||||||
| Total | 2,441 | (163) | 2,278 | 2,288 | (216) | 2,072 | ||||||||||||||||||
| Nine months ended September 30, | 2007 | 2006 | ||||||||||||||||||||||
Segment €mn | Consolidation €mn | Group €mn | Segment €mn | Consolidation €mn | Group €mn | |||||||||||||||||||
| Property-Casualty | ||||||||||||||||||||||||
Fees from credit and assistance business | 530 | (1) | 529 | 501 | — | 501 | ||||||||||||||||||
Service agreements | 312 | (19) | 293 | 259 | (29) | 230 | ||||||||||||||||||
Investment advisory | — | — | — | 10 | — | 10 | ||||||||||||||||||
Subtotal | 842 | (20) | 822 | 770 | (29) | 741 | ||||||||||||||||||
| Life/Health | ||||||||||||||||||||||||
Service agreements | 134 | (10) | 124 | 116 | (57) | 59 | ||||||||||||||||||
Investment advisory | 361 | (12) | 349 | 303 | — | 303 | ||||||||||||||||||
Other | 11 | (11) | — | 16 | (9) | 7 | ||||||||||||||||||
Subtotal | 506 | (33) | 473 | 435 | (66) | 369 | ||||||||||||||||||
| Banking | ||||||||||||||||||||||||
Securities business | 1,192 | (139) | 1,053 | 1,117 | (144) | 973 | ||||||||||||||||||
Investment advisory | 458 | (109) | 349 | 444 | (129) | 315 | ||||||||||||||||||
Payment transactions | 272 | (2) | 270 | 270 | (1) | 269 | ||||||||||||||||||
Mergers and acquisitions advisory | 178 | — | 178 | 207 | — | 207 | ||||||||||||||||||
Underwriting business | 63 | — | 63 | 102 | — | 102 | ||||||||||||||||||
Other | 607 | (39) | 568 | 571 | (90) | 481 | ||||||||||||||||||
Subtotal | 2,770 | (289) | 2,481 | 2,711 | (364) | 2,347 | ||||||||||||||||||
| Asset Management | ||||||||||||||||||||||||
Management fees | 2,670 | (92) | 2,578 | 2,507 | (78) | 2,429 | ||||||||||||||||||
Loading and exit fees | 240 | — | 240 | 257 | — | 257 | ||||||||||||||||||
Performance fees | 70 | — | 70 | 30 | 1 | 31 | ||||||||||||||||||
Other | 244 | (6) | 238 | 266 | (4) | 262 | ||||||||||||||||||
Subtotal | 3,224 | (98) | 3,126 | 3,060 | (81) | 2,979 | ||||||||||||||||||
| Corporate | ||||||||||||||||||||||||
Service agreements | 129 | (75) | 54 | 120 | (70) | 50 | ||||||||||||||||||
Subtotal | 129 | (75) | 54 | 120 | (70) | 50 | ||||||||||||||||||
| Total | 7,471 | (515) | 6,956 | 7,096 | (610) | 6,486 | ||||||||||||||||||
66
Table of Contents
Notes to the Consolidated Financial Statements
| Three months ended September 30, | Nine months ended September 30, | |||||||||||||||
2007 €mn | 2006 €mn | 2007 €mn | 2006 €mn | |||||||||||||
| Income from real estate held for use | ||||||||||||||||
Realized gains from disposals of real estate held for use | 8 | 4 | 102 | 55 | ||||||||||||
Other income from real estate held for use | — | — | — | 2 | ||||||||||||
Subtotal | 8 | 4 | 102 | 57 | ||||||||||||
| Income from non-current assets and disposal groups held for sale | — | — | 3 | 1 | ||||||||||||
| Other income | 1 | (2) | 3 | — | ||||||||||||
| Total | 9 | 2 | 108 | 58 | ||||||||||||
25 Income from fully consolidated private equity investments
| 2007 | 2006 | |||||||||||||||||||||||||||
MAN Roland | Selecta AG | Other | Total | MAN Roland | Four Seasons Health Care Ltd. | Total | ||||||||||||||||||||||
| €mn | €mn | €mn | €mn | €mn | €mn | €mn | ||||||||||||||||||||||
| Three months ended September 30, | ||||||||||||||||||||||||||||
| Sales and service revenues | 486 | 191 | 7 | 684 | 429 | — | 429 | |||||||||||||||||||||
| Other operating revenues | — | — | — | — | 5 | — | 5 | |||||||||||||||||||||
| Interest income | 2 | — | — | 2 | 2 | — | 2 | |||||||||||||||||||||
| Total | 488 | 191 | 7 | 686 | 436 | — | 436 | |||||||||||||||||||||
| Nine months ended September 30, | ||||||||||||||||||||||||||||
| Sales and service revenues | 1,395 | 191 | 11 | 1,597 | 429 | 328 | 757 | |||||||||||||||||||||
| Other operating revenues | 23 | — | — | 23 | 5 | — | 5 | |||||||||||||||||||||
| Interest income | 7 | — | — | 7 | 2 | — | 2 | |||||||||||||||||||||
| Total | 1,425 | 191 | 11 | 1,627 | 436 | 328 | 764 | |||||||||||||||||||||
67
Table of Contents
Allianz Group Interim Report Third Quarter and First Nine Months of 2007
26 Claims and insurance benefits incurred (net)
| Three months ended September 30, | 2007 | 2006 | ||||||||||||||||||||||||||||||
Property- Casualty | Life/Health | Consolidation | Total | Property- Casualty | Life/Health | Consolidation | Total | |||||||||||||||||||||||||
| €mn | €mn | €mn | €mn | €mn | €mn | €mn | €mn | |||||||||||||||||||||||||
| Gross | ||||||||||||||||||||||||||||||||
Claims and insurance benefits paid | (6,514) | (4,007) | (7) | (10,528) | (6,455) | (4,084) | 13 | (10,526) | ||||||||||||||||||||||||
Change in loss and loss adjustment expenses | (608) | (3) | 1 | (610) | (334) | (46) | (2) | (382) | ||||||||||||||||||||||||
Subtotal | (7,122) | (4,010) | (6) | (11,138) | (6,789) | (4,130) | 11 | (10,908) | ||||||||||||||||||||||||
| Ceded | ||||||||||||||||||||||||||||||||
Claims and insurance benefits paid | 711 | 127 | 7 | 845 | 858 | 184 | (13) | 1,029 | ||||||||||||||||||||||||
Change in loss and loss adjustment expenses | (204) | (18) | (1) | (223) | (277) | 4 | 2 | (271) | ||||||||||||||||||||||||
Subtotal | 507 | 109 | 6 | 622 | 581 | 188 | (11) | 758 | ||||||||||||||||||||||||
| Net | ||||||||||||||||||||||||||||||||
Claims and insurance benefits paid | (5,803) | (3,880) | — | (9,683) | (5,597) | (3,900) | — | (9,497) | ||||||||||||||||||||||||
Change in loss and loss adjustment expenses | (812) | (21) | — | (833) | (611) | (42) | — | (653) | ||||||||||||||||||||||||
Total | (6,615) | (3,901) | — | (10,516) | (6,208) | (3,942) | — | (10,150) | ||||||||||||||||||||||||
| Nine months ended September 30, | 2007 | 2006 | ||||||||||||||||||||||||||||||
Property- Casualty | Life/Health | Consolidation | Total | Property- Casualty | Life/Health | Consolidation | Total | |||||||||||||||||||||||||
| €mn | €mn | €mn | €mn | €mn | €mn | €mn | €mn | |||||||||||||||||||||||||
| Gross | ||||||||||||||||||||||||||||||||
Claims and insurance benefits paid | (20,984) | (13,189) | 6 | (34,167) | (19,985) | (13,260) | 26 | (33,219) | ||||||||||||||||||||||||
Change in loss and loss adjustment expenses | (405) | (35) | 1 | (439) | (326) | (33) | (4) | (363) | ||||||||||||||||||||||||
Subtotal | (21,389) | (13,224) | 7 | (34,606) | (20,311) | (13,293) | 22 | (33,582) | ||||||||||||||||||||||||
| Ceded | ||||||||||||||||||||||||||||||||
Claims and insurance benefits paid | 2,312 | 509 | (6) | 2,815 | 2,366 | 540 | (26) | 2,880 | ||||||||||||||||||||||||
Change in loss and loss adjustment expenses | (187) | (46) | (1) | (234) | (535) | 15 | 4 | (516) | ||||||||||||||||||||||||
Subtotal | 2,125 | 463 | (7) | 2,581 | 1,831 | 555 | (22) | 2,364 | ||||||||||||||||||||||||
| Net | ||||||||||||||||||||||||||||||||
Claims and insurance benefits paid | (18,672) | (12,680) | — | (31,352) | (17,619) | (12,720) | — | (30,339) | ||||||||||||||||||||||||
Change in loss and loss adjustment expenses | (592) | (81) | — | (673) | (861) | (18) | — | (879) | ||||||||||||||||||||||||
Total | (19,264) | (12,761) | — | (32,025) | (18,480) | (12,738) | — | (31,218) | ||||||||||||||||||||||||
68
Table of Contents
Notes to the Consolidated Financial Statements
27 Changes in reserves for insurance and investment contracts (net)
Three months ended | 2007 | 2006 | ||||||||||||||||||||||||||||||
| Property- Casualty | Life/Health | Consolidation | Total | Property- Casualty | Life/Health | Consolidation | Total | |||||||||||||||||||||||||
| €mn | �� €mn | €mn | €mn | €mn | €mn | €mn | €mn | |||||||||||||||||||||||||
| Gross | ||||||||||||||||||||||||||||||||
Aggregate policy reserves | (76) | (850) | — | (926) | (110) | (1,144) | (1) | (1,255) | ||||||||||||||||||||||||
Other insurance reserves | 2 | (39) | — | (37) | (2) | (20) | — | (22) | ||||||||||||||||||||||||
Expenses for premium refunds | (52) | (1,242) | — | (1,294) | (49) | (1,171) | (24) | (1,244) | ||||||||||||||||||||||||
Subtotal | (126) | (2,131) | — | (2,257) | (161) | (2,335) | (25) | (2,521) | ||||||||||||||||||||||||
| Ceded | ||||||||||||||||||||||||||||||||
Aggregate policy reserves | 9 | (22) | — | (13) | 13 | 65 | — | 78 | ||||||||||||||||||||||||
Other insurance reserves | 3 | 9 | — | 12 | — | 3 | — | 3 | ||||||||||||||||||||||||
Expenses for premium refunds | — | 4 | — | 4 | (3) | 5 | — | 2 | ||||||||||||||||||||||||
Subtotal | 12 | (9) | — | 3 | 10 | 73 | — | 83 | ||||||||||||||||||||||||
| Net | ||||||||||||||||||||||||||||||||
Aggregate policy reserves | (67) | (872) | — | (939) | (97) | (1,079) | (1) | (1,177) | ||||||||||||||||||||||||
Other insurance reserves | 5 | (30) | — | (25) | (2) | (17) | — | (19) | ||||||||||||||||||||||||
Expenses for premium refunds | (52) | (1,238) | — | (1,290) | (52) | (1,166) | (24) | (1,242) | ||||||||||||||||||||||||
Total | (114) | (2,140) | — | (2,254) | (151) | (2,262) | (25) | (2,438) | ||||||||||||||||||||||||
| Nine months ended September 30, | 2007 | 2006 | ||||||||||||||||||||||||||||||
| Property- Casualty | Life/Health | Consolidation | Total | Property- Casualty | Life/Health | Consolidation | Total | |||||||||||||||||||||||||
| €mn | €mn | €mn | €mn | €mn | €mn | €mn | €mn | |||||||||||||||||||||||||
| Gross | ||||||||||||||||||||||||||||||||
Aggregate policy reserves | (231) | (2,691) | — | (2,922) | (278) | (2,675) | (1) | (2,954) | ||||||||||||||||||||||||
Other insurance reserves | — | (162) | — | (162) | 13 | (60) | — | (47) | ||||||||||||||||||||||||
Expenses for premium refunds | (88) | (4,194) | (55) | (4,337) | (115) | (5,222) | (303) | (5,640) | ||||||||||||||||||||||||
Subtotal | (319) | (7,047) | (55) | (7,421) | (380) | (7,957) | (304) | (8,641) | ||||||||||||||||||||||||
| Ceded | ||||||||||||||||||||||||||||||||
Aggregate policy reserves | 17 | 54 | — | 71 | 30 | 75 | — | 105 | ||||||||||||||||||||||||
Other insurance reserves | 5 | 4 | — | 9 | 3 | 8 | — | 11 | ||||||||||||||||||||||||
Expenses for premium refunds | 5 | 14 | — | 19 | 3 | 14 | — | 17 | ||||||||||||||||||||||||
Subtotal | 27 | 72 | — | 99 | 36 | 97 | — | 133 | ||||||||||||||||||||||||
| Net | ||||||||||||||||||||||||||||||||
Aggregate policy reserves | (214) | (2,637) | — | (2,851) | (248) | (2,600) | (1) | (2,849) | ||||||||||||||||||||||||
Other insurance reserves | 5 | (158) | — | (153) | 16 | (52) | — | (36) | ||||||||||||||||||||||||
Expenses for premium refunds | (83) | (4,180) | (55) | (4,318) | (112) | (5,208) | (303) | (5,623) | ||||||||||||||||||||||||
Total | (292) | (6,975) | (55) | (7,322) | (344) | (7,860) | (304) | (8,508) | ||||||||||||||||||||||||
69
Table of Contents
Allianz Group Interim Report Third Quarter and First Nine Months of 2007
| Three months ended September 30, | Nine months ended September 30, | |||||||||||||||
2007 €mn | 2006 €mn | 2007 €mn | 2006 €mn | |||||||||||||
| Liabilities to banks and customers | (752) | (879) | (2,514) | (2,103) | ||||||||||||
| Deposits retained on reinsurance ceded | (17) | (30) | (71) | (95) | ||||||||||||
| Certificated liabilities | (668) | (468) | (1,465) | (1,235) | ||||||||||||
| Participating certificates and subordinated liabilities | (178) | (182) | (537) | (543) | ||||||||||||
| Other | 23 | 127 | (444) | (305) | ||||||||||||
| Total | (1,592) | (1,432) | (5,031) | (4,281) | ||||||||||||
| Three months ended September 30, | Nine months ended September 30, | |||||||||||||||
2007 €mn | 2006 €mn | 2007 €mn | 2006 €mn | |||||||||||||
| Additions to allowances including direct impairments | (160) | (104) | (419) | (339) | ||||||||||||
| Amounts released | 85 | 119 | 174 | 273 | ||||||||||||
| Recoveries on loans previously impaired | 60 | 37 | 158 | 142 | ||||||||||||
| Total | (15) | 52 | (87) | 76 | ||||||||||||
30 Impairments of investments (net)
| Three months ended September 30, | Nine months ended September 30, | |||||||||||||||
2007 €mn | 2006 €mn | 2007 €mn | 2006 €mn | |||||||||||||
| Impairments | ||||||||||||||||
| Available-for-sale investments | ||||||||||||||||
Equity securities | (370) | (108) | (546) | (420) | ||||||||||||
Debt securities | (16) | (55) | (17) | (81) | ||||||||||||
Subtotal | (386) | (163) | (563) | (501) | ||||||||||||
| Held-to-maturity investments | — | (7) | — | (7) | ||||||||||||
| Investments in associates and joint ventures | — | (2) | — | (8) | ||||||||||||
| Real estate held for investment | (2) | (14) | (11) | (111) | ||||||||||||
| Subtotal | (388) | (186) | (574) | (627) | ||||||||||||
| Reversals of impairments | ||||||||||||||||
| Available-for-sale investments | ||||||||||||||||
Debt securities | — | — | 13 | 1 | ||||||||||||
Subtotal | — | — | 13 | 1 | ||||||||||||
| Held-to-maturity investments | — | — | — | 1 | ||||||||||||
| Real estate held for investment | — | — | 4 | 77 | ||||||||||||
| Subtotal | — | — | 17 | 79 | ||||||||||||
| Total | (388) | (186) | (557) | (548) | ||||||||||||
70
Table of Contents
Notes to the Consolidated Financial Statements
| Three months ended September 30, | Nine months ended September 30, | |||||||||||||||
2007 €mn | 2006 €mn | 2007 €mn | 2006 €mn | |||||||||||||
| Investment management expenses | (85) | (82) | (307) | (297) | ||||||||||||
| Depreciation from real estate held for investment | (43) | (53) | (147) | (165) | ||||||||||||
| Other expenses from real estate held for investment | (60) | (78) | (190) | (185) | ||||||||||||
| Foreign currency gains and losses (net) | ||||||||||||||||
Foreign currency gains | 127 | 24 | 409 | 375 | ||||||||||||
Foreign currency losses | (217) | (23) | (506) | (422) | ||||||||||||
Subtotal | (90) | 1 | (97) | (47) | ||||||||||||
| Total | (278) | (212) | (741) | (694) | ||||||||||||
32 Acquisition and administrative expenses (net)
| Three months ended September 30, | 2007 | 2006 | ||||||||||||||||||||||
| Segment | Consolidation | Group | Segment | Consolidation | Group | |||||||||||||||||||
| €mn | €mn | €mn | €mn | €mn | €mn | |||||||||||||||||||
| Property-Casualty | ||||||||||||||||||||||||
Acquisition costs | ||||||||||||||||||||||||
Incurred | (1,702) | — | (1,702) | (1,729) | — | (1,729) | ||||||||||||||||||
Commissions and profit received on reinsurance business ceded | 140 | — | 140 | 133 | (1) | 132 | ||||||||||||||||||
Deferrals of acquisition costs | 826 | — | 826 | 1,054 | — | 1,054 | ||||||||||||||||||
Amortization of deferred acquisition costs | (987) | — | (987) | (1,150) | — | (1,150) | ||||||||||||||||||
Subtotal | (1,723) | — | (1,723) | (1,692) | (1) | (1,693) | ||||||||||||||||||
Administrative expenses | (1,022) | 12 | (1,010) | (820) | 20 | (800) | ||||||||||||||||||
Subtotal | (2,745) | 12 | (2,733) | (2,512) | 19 | (2,493) | ||||||||||||||||||
| Life/Health | ||||||||||||||||||||||||
Acquisition costs | ||||||||||||||||||||||||
Incurred | (861) | (1) | (862) | (830) | — | (830) | ||||||||||||||||||
Commissions and profit received on reinsurance business ceded | 28 | — | 28 | 15 | — | 15 | ||||||||||||||||||
Deferrals of acquisition costs | 548 | — | 548 | 572 | — | 572 | ||||||||||||||||||
Amortization of deferred acquisition costs | (455) | — | (455) | (441) | — | (441) | ||||||||||||||||||
Subtotal | (740) | (1) | (741) | (684) | — | (684) | ||||||||||||||||||
Administrative expenses | (373) | (18) | (391) | (403) | 17 | (386) | ||||||||||||||||||
Subtotal | (1,113) | (19) | (1,132) | (1,087) | 17 | (1,070) | ||||||||||||||||||
| Banking | ||||||||||||||||||||||||
Personnel expenses | (617) | — | (617) | (785) | — | (785) | ||||||||||||||||||
Non-personnel expenses | (549) | 8 | (541) | (509) | 12 | (497) | ||||||||||||||||||
Subtotal | (1,166) | 8 | (1,158) | (1,294) | 12 | (1,282) | ||||||||||||||||||
| Asset Management | ||||||||||||||||||||||||
Personnel expenses | (393) | — | (393) | (415) | — | (415) | ||||||||||||||||||
Non-personnel expenses | (177) | 4 | (173) | (151) | (1) | (152) | ||||||||||||||||||
Subtotal | (570) | 4 | (566) | (566) | (1) | (567) | ||||||||||||||||||
| Corporate | ||||||||||||||||||||||||
Administrative expenses | (171) | 9 | (162) | (215) | (17) | (232) | ||||||||||||||||||
Subtotal | (171) | 9 | (162) | (215) | (17) | (232) | ||||||||||||||||||
| Total | (5,765) | 14 | (5,751) | (5,674) | 30 | (5,644) | ||||||||||||||||||
71
Table of Contents
Allianz Group Interim Report Third Quarter and First Nine Months of 2007
32 Acquisition and administrative expenses (net) (continued)
| Nine months ended September 30, | 2007 | 2006 | ||||||||||||||||||||||
| Segment | Consolidation | Group | Segment | Consolidation | Group | |||||||||||||||||||
| €mn | €mn | €mn | €mn | €mn | €mn | |||||||||||||||||||
| Property-Casualty | ||||||||||||||||||||||||
Acquisition costs | ||||||||||||||||||||||||
Incurred | (5,540) | — | (5,540) | (5,194) | — | (5,194) | ||||||||||||||||||
Commissions and profit received on reinsurance business ceded | 506 | (1) | 505 | 512 | (1) | 511 | ||||||||||||||||||
Deferrals of acquisition costs | 3,303 | — | 3,303 | 3,018 | — | 3,018 | ||||||||||||||||||
Amortization of deferred acquisition costs | (3,204) | — | (3,204) | (2,927) | — | (2,927) | ||||||||||||||||||
Subtotal | (4,935) | (1) | (4,936) | (4,591) | (1) | (4,592) | ||||||||||||||||||
Administrative expenses | (3,190) | 56 | (3,134) | (3,095) | 46 | (3,049) | ||||||||||||||||||
Subtotal | (8,125) | 55 | (8,070) | (7,686) | 45 | (7,641) | ||||||||||||||||||
| Life/Health | ||||||||||||||||||||||||
Acquisition costs | ||||||||||||||||||||||||
Incurred | (2,691) | — | (2,691) | (2,814) | — | (2,814) | ||||||||||||||||||
Commissions and profit received on reinsurance business ceded | 116 | — | 116 | 69 | — | 69 | ||||||||||||||||||
Deferrals of acquisition costs | 1,809 | — | 1,809 | 2,045 | — | 2,045 | ||||||||||||||||||
Amortization of deferred acquisition costs | (1,092) | — | (1,092) | (1,361) | — | (1,361) | ||||||||||||||||||
Subtotal | (1,858) | — | (1,858) | (2,061) | — | (2,061) | ||||||||||||||||||
Administrative expenses | (1,244) | (53) | (1,297) | (1,156) | 26 | (1,130) | ||||||||||||||||||
Subtotal | (3,102) | (53) | (3,155) | (3,217) | 26 | (3,191) | ||||||||||||||||||
| Banking | ||||||||||||||||||||||||
Personnel expenses | (2,344) | — | (2,344) | (2,607) | — | (2,607) | ||||||||||||||||||
Non-personnel expenses | (1,566) | 40 | (1,526) | (1,551) | 42 | (1,509) | ||||||||||||||||||
Subtotal | (3,910) | 40 | (3,870) | (4,158) | 42 | (4,116) | ||||||||||||||||||
| Asset Management | ||||||||||||||||||||||||
Personnel expenses | (1,201) | — | (1,201) | (1,242) | — | (1,242) | ||||||||||||||||||
Non-personnel expenses | (514) | 17 | (497) | (470) | — | (470) | ||||||||||||||||||
Subtotal | (1,715) | 17 | (1,698) | (1,712) | — | (1,712) | ||||||||||||||||||
| Corporate | ||||||||||||||||||||||||
Administrative expenses | (539) | (7) | (546) | (496) | (15) | (511) | ||||||||||||||||||
Subtotal | (539) | (7) | (546) | (496) | (15) | (511) | ||||||||||||||||||
| Total | (17,391) | 52 | (17,339) | (17,269) | 98 | (17,171) | ||||||||||||||||||
72
Table of Contents
Notes to the Consolidated Financial Statements
33 Fee and commission expenses
| Three months ended September 30, | 2007 | 2006 | ||||||||||||||||||||||
Segment €mn | Consolidation €mn | Group €mn | Segment €mn | Consolidation €mn | Group €mn | |||||||||||||||||||
| Property-Casualty | ||||||||||||||||||||||||
Fees from credit and assistance business | (117) | — | (117) | (114) | — | (114) | ||||||||||||||||||
Service agreements | (76) | 6 | (70) | (69) | 5 | (64) | ||||||||||||||||||
Investment advisory | — | — | — | (1) | 1 | — | ||||||||||||||||||
Subtotal | (193) | 6 | (187) | (184) | 6 | (178) | ||||||||||||||||||
| Life/Health | ||||||||||||||||||||||||
Service agreements | (8) | 2 | (6) | (17) | — | (17) | ||||||||||||||||||
Investment advisory | (41) | 2 | (39) | (40) | — | (40) | ||||||||||||||||||
Subtotal | (49) | 4 | (45) | (57) | — | (57) | ||||||||||||||||||
| Banking | ||||||||||||||||||||||||
Securities business | (36) | — | (36) | (33) | — | (33) | ||||||||||||||||||
Investment advisory | (43) | 2 | (41) | (39) | 13 | (26) | ||||||||||||||||||
Payment transactions | (6) | — | (6) | (5) | — | (5) | ||||||||||||||||||
Mergers and acquisitions advisory | (3) | — | (3) | (26) | — | (26) | ||||||||||||||||||
Underwriting business | (1) | — | (1) | (2) | — | (2) | ||||||||||||||||||
Other | (53) | (2) | (55) | (78) | 48 | (30) | ||||||||||||||||||
Subtotal | (142) | — | (142) | (183) | 61 | (122) | ||||||||||||||||||
| Asset Management | ||||||||||||||||||||||||
Commissions | (230) | 108 | (122) | (256) | 105 | (151) | ||||||||||||||||||
Other | (74) | 1 | (73) | (44) | 2 | (42) | ||||||||||||||||||
Subtotal | (304) | 109 | (195) | (300) | 107 | (193) | ||||||||||||||||||
| Corporate | ||||||||||||||||||||||||
Service agreements | (36) | 17 | (19) | (25) | 5 | (20) | ||||||||||||||||||
Subtotal | (36) | 17 | (19) | (25) | 5 | (20) | ||||||||||||||||||
| Total | (724) | 136 | (588) | (749) | 179 | (570) | ||||||||||||||||||
| Nine months ended September 30, | 2007 | 2006 | ||||||||||||||||||||||
Segment €mn | Consolidation €mn | Group €mn | Segment €mn | Consolidation €mn | Group €mn | |||||||||||||||||||
| Property-Casualty | ||||||||||||||||||||||||
Fees from credit and assistance business | (351) | 1 | (350) | (358) | — | (358) | ||||||||||||||||||
Service agreements | (229) | 14 | (215) | (197) | 16 | (181) | ||||||||||||||||||
Investment advisory | — | — | — | (4) | 3 | (1) | ||||||||||||||||||
Subtotal | (580) | 15 | (565) | (559) | 19 | (540) | ||||||||||||||||||
| Life/Health | ||||||||||||||||||||||||
Service agreements | (36) | 10 | (26) | (84) | 21 | (63) | ||||||||||||||||||
Investment advisory | (118) | 5 | (113) | (93) | — | (93) | ||||||||||||||||||
Subtotal | (154) | 15 | (139) | (177) | 21 | (156) | ||||||||||||||||||
| Banking | ||||||||||||||||||||||||
Securities business | (121) | — | (121) | (99) | — | (99) | ||||||||||||||||||
Investment advisory | (139) | 6 | (133) | (135) | 17 | (118) | ||||||||||||||||||
Payment transactions | (17) | — | (17) | (16) | — | (16) | ||||||||||||||||||
Mergers and acquisitions advisory | (15) | — | (15) | (43) | — | (43) | ||||||||||||||||||
Underwriting business | (2) | — | (2) | (4) | — | (4) | ||||||||||||||||||
Other | (151) | 8 | (143) | (186) | 82 | (104) | ||||||||||||||||||
Subtotal | (445) | 14 | (431) | (483) | 99 | (384) | ||||||||||||||||||
| Asset Management | ||||||||||||||||||||||||
Commissions | (706) | 330 | (376) | (707) | 312 | (395) | ||||||||||||||||||
Other | (240) | 3 | (237) | (225) | 3 | (222) | ||||||||||||||||||
Subtotal | (946) | 333 | (613) | (932) | 315 | (617) | ||||||||||||||||||
| Corporate | ||||||||||||||||||||||||
Service agreements | (97) | 22 | (75) | (67) | 9 | (58) | ||||||||||||||||||
Subtotal | (97) | 22 | (75) | (67) | 9 | (58) | ||||||||||||||||||
| Total | (2,222) | 399 | (1,823) | (2,218) | 463 | (1,755) | ||||||||||||||||||
73
Table of Contents
Allianz Group Interim Report Third Quarter and First Nine Months of 2007
| Three months ended September 30, | Nine months ended September 30, | |||||||||||||||
2007 €mn | 2006 €mn | 2007 €mn | 2006 €mn | |||||||||||||
| Expenses from real estate held for use | ||||||||||||||||
Realized losses from disposals of real estate held for use | (3) | — | (3) | (2) | ||||||||||||
Impairments of real estate held for use | — | — | (1) | (1) | ||||||||||||
Subtotal | (3) | — | (4) | (3) | ||||||||||||
| Expense from assets held for sale, disposal groups and other non-current assets | — | (1) | — | (1) | ||||||||||||
| Other | (2) | (1) | 12 | 13 | ||||||||||||
| Total | (5) | (2) | 8 | 9 | ||||||||||||
35 Expenses from fully consolidated private equity investments
| 2007 | 2006 | |||||||||||||||||||||||||||
MAN Roland | Selecta AG | Other | Total | MAN Roland | Four Seasons Health Care Ltd | Total | ||||||||||||||||||||||
| €mn | €mn | €mn | €mn | €mn | €mn | €mn | ||||||||||||||||||||||
| Three months ended September 30, | ||||||||||||||||||||||||||||
| Cost of goods sold | (385) | (64) | (1) | (450) | (331) | — | (331) | |||||||||||||||||||||
| Commissions | (42) | — | — | (42) | (27) | — | (27) | |||||||||||||||||||||
| General and administrative expenses | (53) | (122) | — | (175) | (75) | — | (75) | |||||||||||||||||||||
| Interest expense | (6) | (9 ) | — | (15) | (14) | — | (14) | |||||||||||||||||||||
| Total | (486) | (195) | (1) | (682) | (447) | — | (447) | |||||||||||||||||||||
| Nine months ended September 30, | ||||||||||||||||||||||||||||
| Cost of goods sold | (1,095) | (64) | (2) | (1,161) | (331) | — | (331) | |||||||||||||||||||||
| Commissions | (121) | — | — | (121) | (27) | — | (27) | |||||||||||||||||||||
| General and administrative expenses | (165) | (122) | — | (287) | (75) | (264) | (339) | |||||||||||||||||||||
| Interest expense | (20) | (9) | — | (29) | (14) | (50) | (64) | |||||||||||||||||||||
| Total | (1,401) | (195) | (2) | (1,598) | (447) | (314) | (761) | |||||||||||||||||||||
| Three months ended September 30, | Nine months ended September 30, | |||||||||||||||
2007 €mn | 2006 €mn | 2007 €mn | 2006 €mn | |||||||||||||
| Current income tax expense | (786) | (572) | (2,126) | (1,681) | ||||||||||||
| Deferred income tax expense | 131 | (225) | (354) | (372) | ||||||||||||
| Total | (655) | (797) | (2,480) | (2,053) | ||||||||||||
74
Table of Contents
Notes to the Consolidated Financial Statements
Basic earnings per share is computed by dividing net income by the weighted average number of common shares outstanding for the period. Diluted earnings per
share reflects the effect of dilutive securities. Dilutive securities include participation certificates issued by Allianz SE which can potentially be converted to Allianz shares, warrants issued by Allianz SE, share-based compensation plans, and derivatives on own shares.
| Three months ended September 30, | Nine months ended September 30, | |||||||||||||||
2007 €mn | 2006 €mn | 2007 €mn | 2006 €mn | |||||||||||||
| Numerator for basic earnings per share (net income) | 1,921 | 1,591 | 7,301 | 5,649 | ||||||||||||
| Effect of dilutive securities | 3 | (1) | 9 | 3 | ||||||||||||
| Numerator for diluted earnings per share (net income after assumed conversion) | 1,924 | 1,590 | 7,310 | 5,652 | ||||||||||||
| Denominator for basic earnings per share (weighted-average shares) | 447,167,792 | 405,197,435 | 436,688,326 | 405,248,299 | ||||||||||||
| Dilutive securities: | ||||||||||||||||
Participation certificates | 1,469,443 | 1,469,443 | 1,469,443 | 1,469,443 | ||||||||||||
Warrants | 995,246 | 620,478 | 997,193 | 632,466 | ||||||||||||
Share-based compensation plans | 1,429,617 | 79,939 | 632,507 | 796,999 | ||||||||||||
Derivatives on own shares | 4,363,456 | 2,837,515 | 5,757,942 | 4,642,666 | ||||||||||||
| Subtotal | 8,257,762 | 5,007,375 | 8,857,085 | 7,541,574 | ||||||||||||
| Denominator for diluted earnings per share (weighted-average shares after assumed conversion) | 455,425,554 | 410,204,810 | 445,545,411 | 412,789,873 | ||||||||||||
| Basic earnings per share | €4.30 | €3.93 | €16.72 | €13.94 | ||||||||||||
| Diluted earnings per share | €4.23 | €3.88 | €16.41 | €13.69 | ||||||||||||
For the nine months ended September 30, 2007, the weighted average number of shares excludes 1,182,313 (2006: 791,701) treasury shares.
75
Table of Contents
Allianz Group Interim Report Third Quarter and First Nine Months of 2007
38 Supplemental information on the Banking segment
Net interest income from the Banking segment
| 2007 | 2006 | |||||||||||||||||||||||
Segment €mn | Consolidation €mn | Group €mn | Segment €mn | Consolidation €mn | Group €mn | |||||||||||||||||||
| Three months ended September 30, | ||||||||||||||||||||||||
| Interest and similar income | 1,979 | (1) | 1,978 | 1,856 | (34) | 1,822 | ||||||||||||||||||
| Interest expense | (1,234) | 39 | (1,195) | (1,147) | 16 | (1,131) | ||||||||||||||||||
| Net interest income | 745 | 38 | 783 | 709 | (18) | 691 | ||||||||||||||||||
| Nine months ended September 30, | ||||||||||||||||||||||||
| Interest and similar income | 6,402 | (44) | 6,358 | 5,366 | (43) | 5,323 | ||||||||||||||||||
| Interest expense | (3,999) | 123 | (3,876) | (3,404) | 48 | (3,356) | ||||||||||||||||||
| Net interest income | 2,403 | 79 | 2,482 | 1,962 | 5 | 1,967 | ||||||||||||||||||
Net fee and commission income from the Banking segment
| 2007 | 2006 | |||||||||||||||||||||||
Segment €mn | Consolidation €mn | Group €mn | Segment €mn | Consolidation €mn | Group €mn | |||||||||||||||||||
| Three months ended September 30, | ||||||||||||||||||||||||
| Fee and commission income | 869 | (87) | 782 | 851 | (149) | 702 | ||||||||||||||||||
| Fee and commission expenses | (142) | — | (142) | (183) | 61 | (122) | ||||||||||||||||||
| Net fee and commission income | 727 | (87) | 640 | 668 | (88) | 580 | ||||||||||||||||||
| Nine months ended September 30, | ||||||||||||||||||||||||
| Fee and commission income | 2,770 | (289) | 2,481 | 2,711 | (364) | 2,347 | ||||||||||||||||||
| Fee and commission expenses | (445) | 14 | (431) | (483) | 99 | (384) | ||||||||||||||||||
| Net fee and commission income | 2,325 | (275) | 2,050 | 2,228 | (265) | 1,963 | ||||||||||||||||||
The net fee and commission income of the Allianz Group’s Banking segment includes the following:
| Three months ended September 30, | Nine months ended September 30, | |||||||||||||||
2007 €mn | 2006 €mn | 2007 €mn | 2006 €mn | |||||||||||||
| Securities business | 329 | 272 | 1,071 | 1,018 | ||||||||||||
Investment advisory | 107 | 97 | 319 | 309 | ||||||||||||
| Payment transactions | 84 | 82 | 255 | 254 | ||||||||||||
| Mergers and acquisitions advisory | 62 | 57 | 163 | 164 | ||||||||||||
| Underwriting business | 20 | 25 | 61 | 98 | ||||||||||||
| Other | 125 | 135 | 456 | 385 | ||||||||||||
| Total | 727 | 668 | 2,325 | 2,228 | ||||||||||||
76
Table of Contents
Notes to the Consolidated Financial Statements
39 Supplemental information on the condensed consolidated statements of cash flows
| Nine months ended September 30, | ||||||||
2007 €mn | 2006 €mn | |||||||
| Income taxes (paid)/received | (1,788) | (1,160) | ||||||
| Dividends received | 2,165 | 1,687 | ||||||
| Interest received | 16,826 | 15,567 | ||||||
| Interest paid | (4,985) | (4,137) | ||||||
| Significant non-cash transactions: | ||||||||
Settlement of exchangeable bonds issued by Allianz Finance II B.V. for shares: | ||||||||
Available-for-sale investments | (812) | (895) | ||||||
Certificated liabilities | (812) | (895) | ||||||
Novation of quota share reinsurance agreement: | ||||||||
Reinsurance assets | (1,226) | (1,111) | ||||||
Deferred acquisition costs | 71 | 76 | ||||||
Payables from reinsurance contracts | (1,155) | (1,035) | ||||||
Effects from buyout of AGF minorities: | ||||||||
Revenue reserves | (1,843) | — | ||||||
Unrealized gains and losses (net) | 146 | — | ||||||
Minority interests | (1,068) | — | ||||||
Paid-in capital | 2,765 | — | ||||||
On February 21, 2007, the Allianz Group increased its investment in Russians People’s Insurance Society “ROSNO”, Moscow from 47.4% to 97.2% at a purchase price of € 571 mn. The impact of the acquisition, net of cash acquired, on the condensed consolidated statement of cash flows for the nine months ended September 30, 2007 was:
| As of September 30, | 2007 €mn | |||
| Intangible assets | (525) | |||
| Other assets | (798) | |||
| Other liabilities | 713 | |||
| Deferred tax liabilities | 15 | |||
| Minority interests | 10 | |||
| Less: previous investment in ROSNO | 78 | |||
| Acquisition of subsidiary, net of cash acquired | (507) |
On July 3, 2007, the Allianz Group acquired 100.0% participation in Selecta AG, Muntelier at a purchase price of €1,126 mn. The impact of the acquisition, net of cash acquired, on the condensed consolidated statement of cash flows for the nine months ended September 30, 2007 was:
| As of September 30, | 2007 €mn | |||
| Intangible assets | (1,113) | |||
| Loans and advances to banks and customers | (107) | |||
| Other assets | (301) | |||
| Other liabilities | 258 | |||
| Deferred tax liabilities | 190 | |||
| Acquisition of subsidiary, net of cash acquired | (1,073) |
Number of employees
The Allianz Group had a total of 178,727 (2006: 166,505) employees as of September 30, 2007. 73,369 (2006: 76,790) of these were employed in Germany and 105,358 (2006: 89,715) in other countries. The number of employees undergoing training increased by 449 to 4,404.
Financial market turbulence
After September 30, 2007, the turbulence in financial markets continued. Certain market segments for asset-backed-securities, namely CDOs and CLOs, still lack sufficient liquidity. Transactions occur only rarely. The Allianz Group will follow this development closely. The Allianz Group cannot rule out that this may lead to downward adjustments in the fourth quarter.
Wildfires in Southern California, USA
As a result of the severe wildfires in Southern California, USA during October 2007, the Allianz Group estimates claims losses of approximately €60 mn.
77
Table of Contents
Allianz Group Interim Report Third Quarter and First Nine Months of 2007
To the best of our knowledge, and in accordance with the applicable reporting principles for interim financial reporting, the condensed consolidated interim financial statements give a true and fair view of the net assets, financial position and results of operations of the group, and the interim management report of the group includes a true and fair review of the development and performance of the business and the position of the group, together with a description of the principal opportunities and risks associated with the expected development of the group for the remaining months of the financial year.
Munich, November 9, 2007
Allianz SE
The Board of Management

78
Table of Contents
Notes to the Consolidated Financial Statements
To Allianz SE, Munich
We have reviewed the condensed consolidated interim financial statements - comprising the balance sheet, income statement, condensed statement of cash flows, statement of changes in equity and selected explanatory notes - together with the interim group management report of Allianz SE, Munich for the period from January 1 to September 30, 2007 that are part of the quarterly financial report according to § 37x WpHG („Wertpapierhandelsgesetz“: „German Securities Trading Act“). The preparation of the condensed consolidated interim financial statements in accordance with those IFRSs applicable to interim financial reporting as adopted by the EU, and of the interim group management report in accordance with the requirements of the WpHG applicable to interim group management reports is the responsibility of the Company’s management. Our responsibility is to issue a review report on the condensed consolidated interim financial statements and on the interim group management report based on our review.
We performed our review of the condensed consolidated interim financial statements and the interim group management report in accordance with the German generally accepted standards for the review of financial statements promulgated by the Institut der Wirtschaftsprüfer (IDW). Those standards require that we plan and conduct the review so that we can preclude through critical evaluation, with a certain level of assurance, that the condensed consolidated interim financial statements
have not been prepared, in material aspects, in accordance with the IFRSs applicable to interim financial reporting as adopted by the EU, and that the interim group management report has not been prepared, in material aspects, in accordance with the requirements of the WpHG applicable to interim group management reports. A review is limited primarily to inquiries of company employees and analytical assessments and therefore does not provide the assurance attainable in a financial statement audit. Since, in accordance with our engagement, we have not performed a financial statement audit, we cannot issue an auditor’s report.
Based on our review, no matters have come to our attention that cause us to presume that the condensed consolidated interim financial statements have not been prepared, in all material respects, in accordance with the IFRSs applicable to interim financial reporting as adopted by the EU and that the interim group management report has not been prepared, in all material respects, in accordance with the requirements of the WpHG applicable to interim group management reports.
Munich, November 9, 2007
KPMG Deutsche Treuhand-Gesellschaft
Aktiengesellschaft
Wirtschaftsprüfungsgesellschaft
| Johannes Pastor | Dr. Frank Pfaffenzeller | |
| Independent Auditor | Independent Auditor |
79
Table of Contents
Allianz Group Interim Report Third Quarter and First Nine Months of 2007
[THIS PAGE INTENTIONALLY LEFT BLANK]
80
Table of Contents
Allianz SE
Koeniginstrasse 28
80802 Muenchen
Germany
Telephone +49 89 38 00 0
Telefax +49 89 34 99 41
www.allianz.com
Table of Contents
SIGNATURE
Pursuant to the requirements of the Securities Exchange Act of 1934, the registrant has duly caused this report to be signed on its behalf by the undersigned, thereunto duly authorized.
Date: November 9, 2007
| ALLIANZ SE | ||||
| By | /s/ Burkhard Keese | |||
| Name: | Burkhard Keese | |||
| Title: | Executive Vice President Group Financial Reporting | |||
| ALLIANZ SE | ||||
| By | /s/ Harold Michael Langley-Poole | |||
| Name: | Harold Michael Langley-Poole | |||
| Title: | Head of Group Management Reporting | |||