Forward Looking Statements
This presentation contains Forward Looking Statements and other information designed
to convey our projections and expectations regarding future results. There are a number
of factors which could cause our actual results to vary materially from those projected in
this presentation. The principal risk factors that may cause these differences are
described in various documents we file with the Securities and Exchange Commission,
such as our current reports on Form 8-K, and our regular reports on Forms 10-Q and
10-K, particularly in “Item 1A, Risk Factors.” Please review this presentation in
conjunction with a thorough reading and understanding of these risk factors.
This presentation contains Non-GAAP measures, and we may reference
Non-GAAP measures in our remarks. A reconciliation of these measures to GAAP
measures is available in our latest quarterly news release, which is available in the
Investor Relations section of our website, www.ProAssurance.com, and in
the related Current Reports on Form 8K disclosing that release.
Non-GAAP measures in our remarks. A reconciliation of these measures to GAAP
measures is available in our latest quarterly news release, which is available in the
Investor Relations section of our website, www.ProAssurance.com, and in
the related Current Reports on Form 8K disclosing that release.
1
Non-GAAP Measures

ProAssurance: Quick Facts
Fifth largest1 writer of medical liability
Writing business in 491 jurisdictions
Approximately 55,0002 individual
policyholders
policyholders
42,000 physicians and dentists
8,000 ancillary and other healthcare professionals
4,800 attorneys
Majority in small or solo practice
500 hospitals and facilities
Highly rated by A. M. Best and Fitch
2
1 Includes PICA 2 Includes PICA and Georgia
Lawyers
Lawyers

Recent Highlights
Completion of three M&A transactions in 2009
Potential new premium is approximately
$100 million on an annualized basis
$100 million on an annualized basis
Restoring growth to the top line
Existing markets grew modestly in Q2 2009
Maintaining profitability
Successful performance in a challenging
financial market and a demanding line of
insurance
financial market and a demanding line of
insurance
3
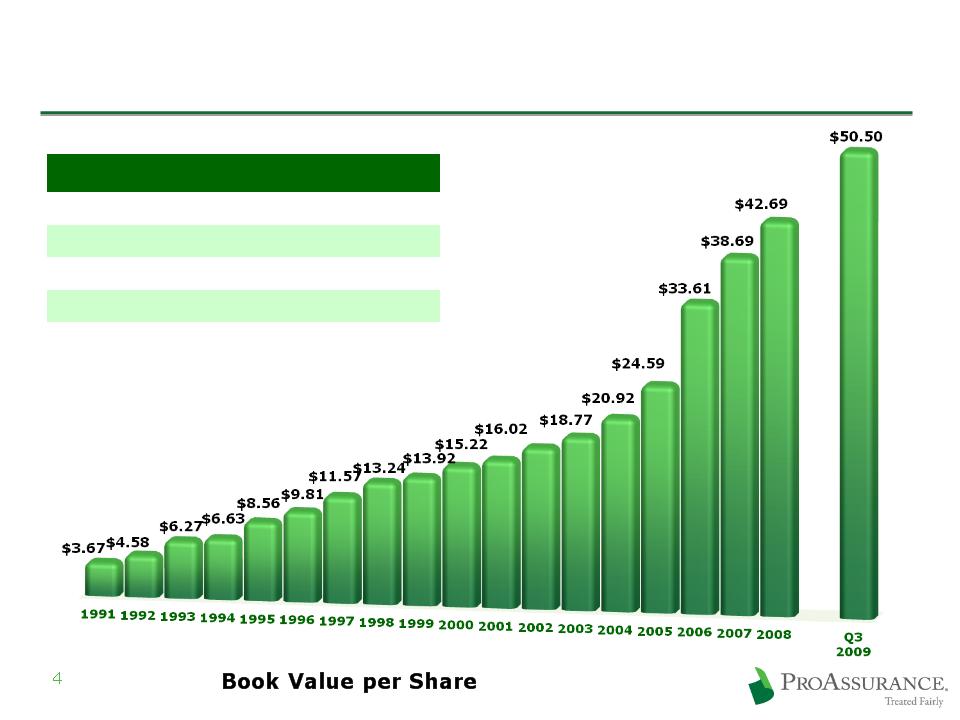
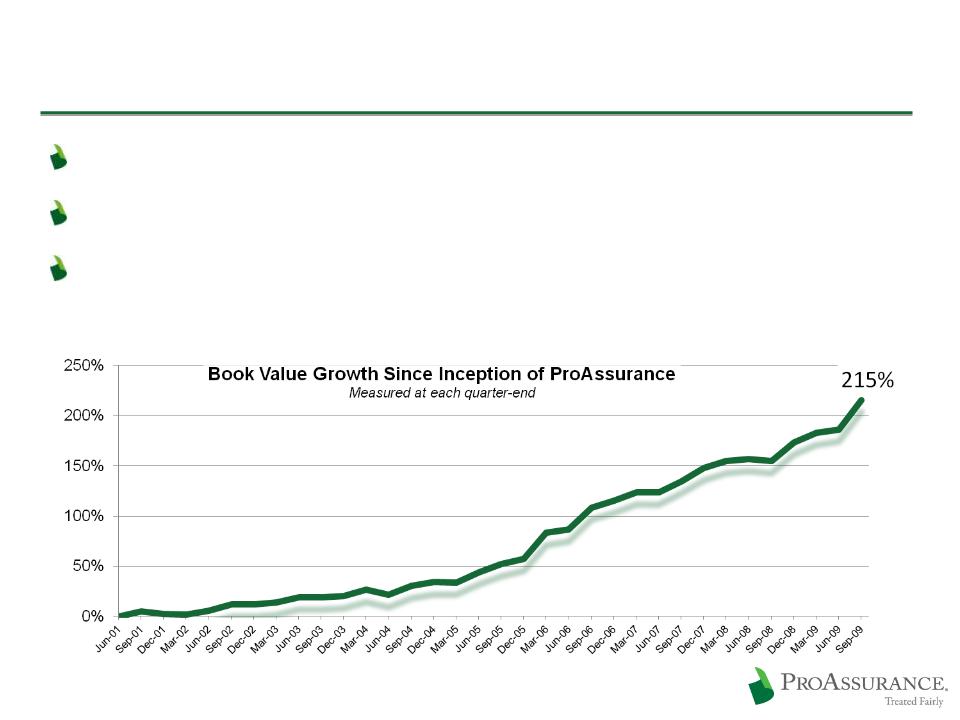
Successful Performance: Book Value
Book Value Growth | ||
Cumulative | CAGR | |
10 year | 222% | 12% |
5 year | 127% | 18% |
1 year | 10% | 10% |
Measured through Year-End 2008 | ||
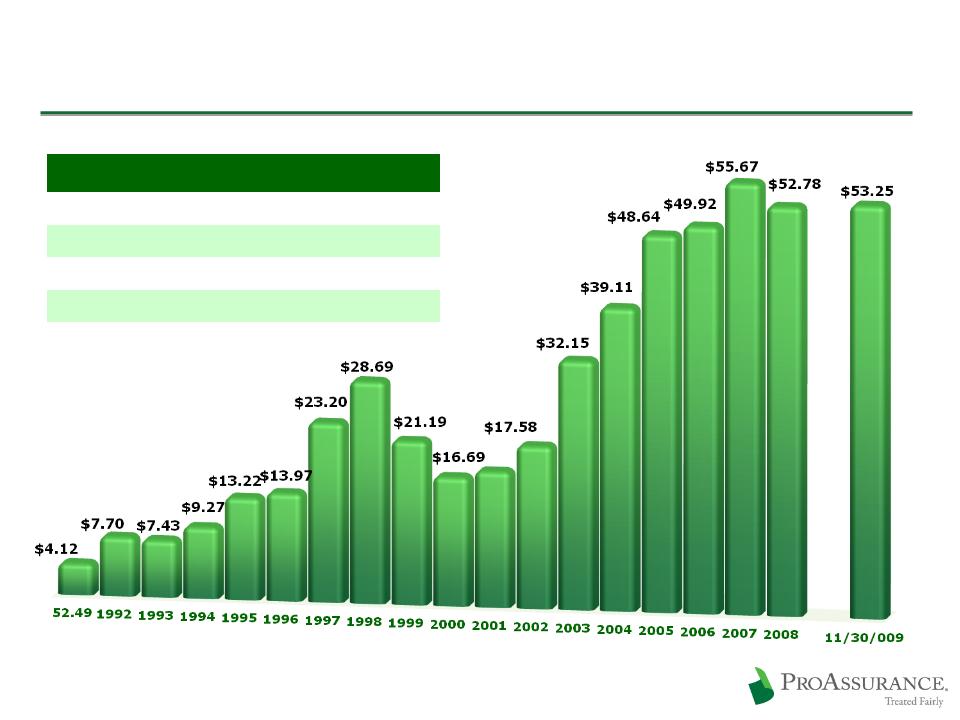
Successful Performance: Stock Price
Share Price Growth | ||
Cumulative | CAGR | |
10 year | 84% | 6% |
5 year | 64% | 10% |
1 year | -5% | -5% |
Measured through Year-End 2008 | ||
5
Share Price at Year End Since Inception
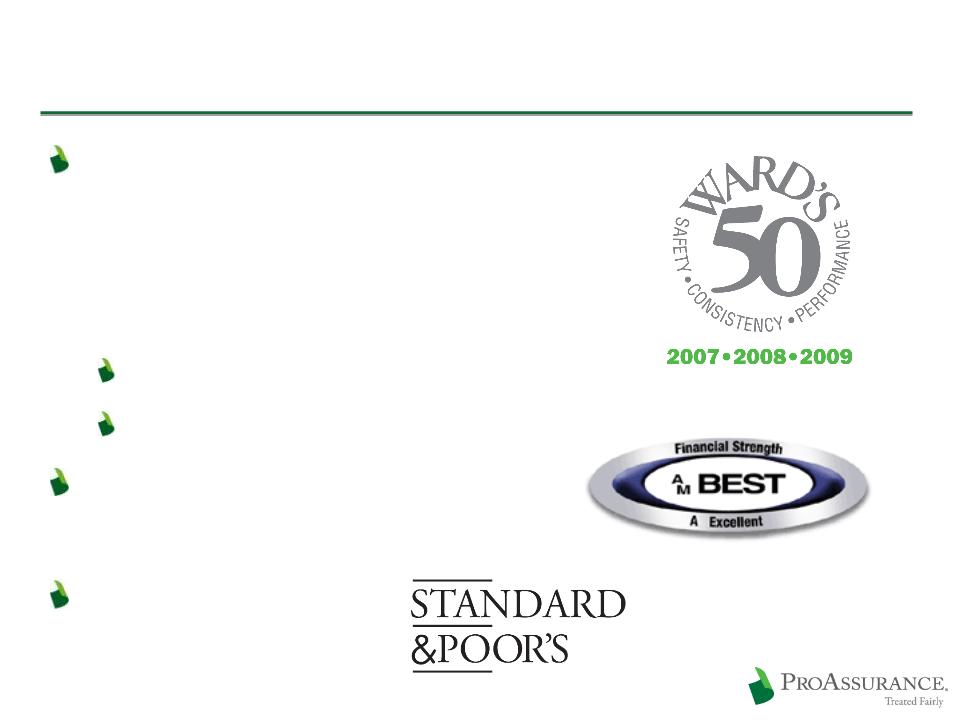
Recent Business Highlights
Again recognized as one of
the 50 top performing
property casualty insurance
companies by The Ward Group
the 50 top performing
property casualty insurance
companies by The Ward Group
Top 3% of all P&C companies
Our third straight year
Upgrade to “A” (Excellent)
by A. M. Best
by A. M. Best
Positive outlook
assigned by S & P
assigned by S & P
6

Recent Employee Highlights
Named The Best Mid-Size
Insurance Employer
in America by
Business Insurance
Insurance Employer
in America by
Business Insurance
Named one of America’s
Top Ten Companies for
Employee Financial Security
by The Principal
Top Ten Companies for
Employee Financial Security
by The Principal
7

Operational Strategies
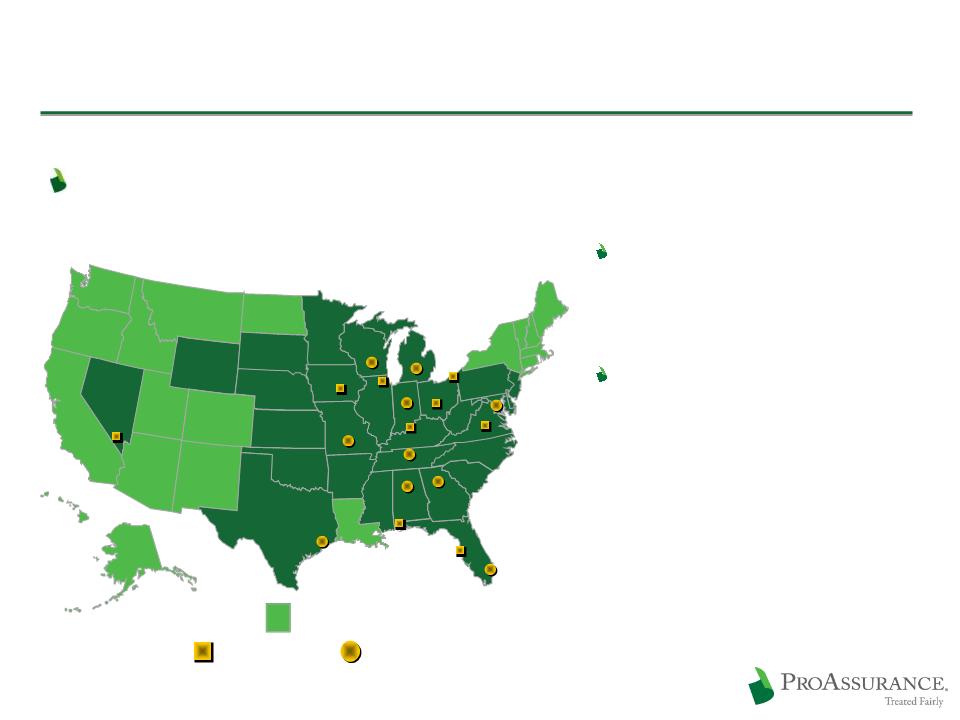
Spreading Risk is Vital
Broad geographic diversification provides an
unmatched spread of risk
unmatched spread of risk
9
Our spread of risk provides
better market awareness and
more data points to gauge loss
trends
better market awareness and
more data points to gauge loss
trends
Our internal actuarial depth
allows us to assess emerging
trends and respond quickly
allows us to assess emerging
trends and respond quickly
Corporate Headquarters
Corporate Headquarters
Claims Offices
Claims Offices
Claims / Underwriting Offices
Claims / Underwriting Offices
PICA and/or E&S States
PICA and/or E&S States
PICA Headquarters
PICA Headquarters
(Birmingham)
(Nashville)

We Dare to Defend
Our balance sheet strength and deep expertise
ensures our insureds have the option of an
uncompromising defense of their claim
ensures our insureds have the option of an
uncompromising defense of their claim
We defend our insureds at trial more often
than any other company in our line
than any other company in our line
Provides a long-term financial and marketing
advantage
advantage
A key differentiating factor in the market
as claims data becomes public
as claims data becomes public
10
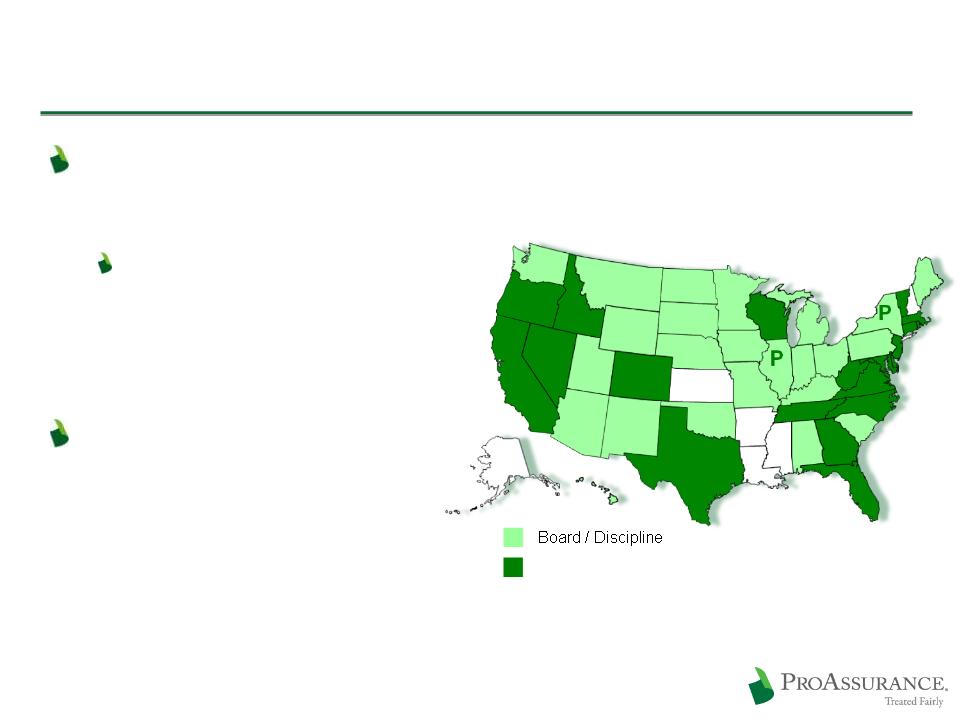
Respond to Transparency
Malpractice judgments/settlements now
disclosed in 18 states
disclosed in 18 states
Public access to the
National Practitioner
Data Bank is the
next step
National Practitioner
Data Bank is the
next step
Disciplinary actions
now disclosed in
almost every state
now disclosed in
almost every state
11
Board / Discipline / Med Mal
Med Mal disclosure
legislation proposed
legislation proposed
P
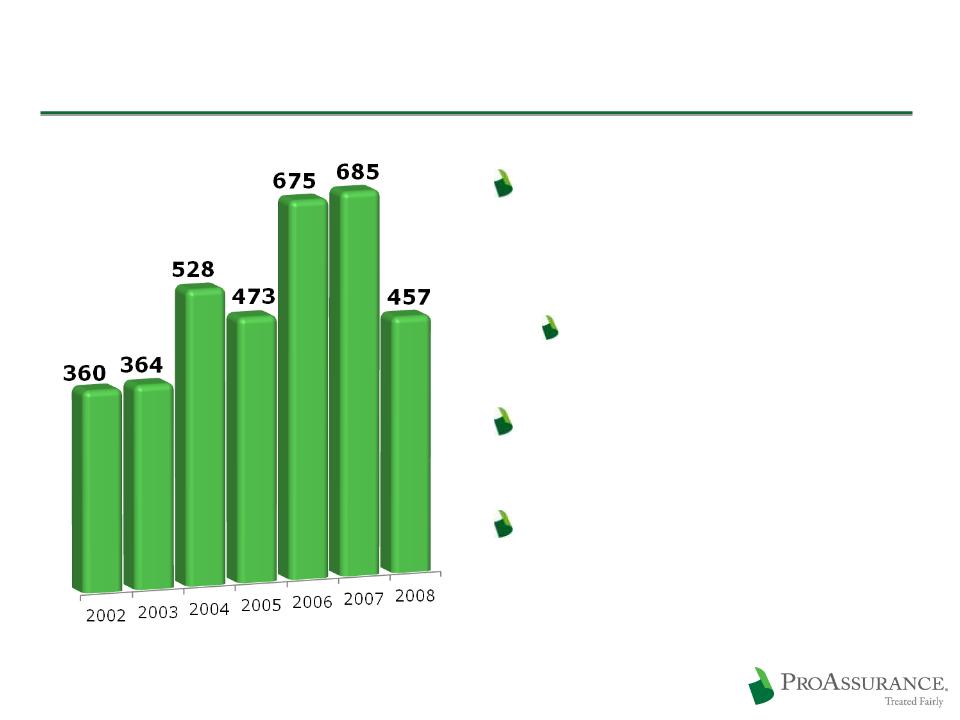
Claims Trends Remain Favorable
Frequency trends are
stable after declining
since 2005/2006
stable after declining
since 2005/2006
The results is fewer
cases to try
cases to try
Severity trends also
stable
stable
Trends are much the
same in states with or
without Tort Reform
same in states with or
without Tort Reform
12
ProAssurance Claims Tried
to a Verdict
to a Verdict

Health Care Reform & Tort Reform
No major changes in the tort system based on
currently written legislation
currently written legislation
Demonstration projects do not provide meaningful
reform or immediate data
reform or immediate data
Signals a desire to leave the tort system in
the hands of each state
the hands of each state
We set prices and reserves as if there is no tort
reform, until results reflect otherwise
reform, until results reflect otherwise
We are prepared, operationally and financially, if
reforms are struck down in our states
reforms are struck down in our states
13

Maintaining Pricing Discipline
14
Pricing developed using multiple years
Using credits allows us to maintain existing
rate filings
rate filings
Not unduly influenced by current market
conditions
conditions
Rates on renewing physician business down
less than 12% from peak pricing in 2006
less than 12% from peak pricing in 2006
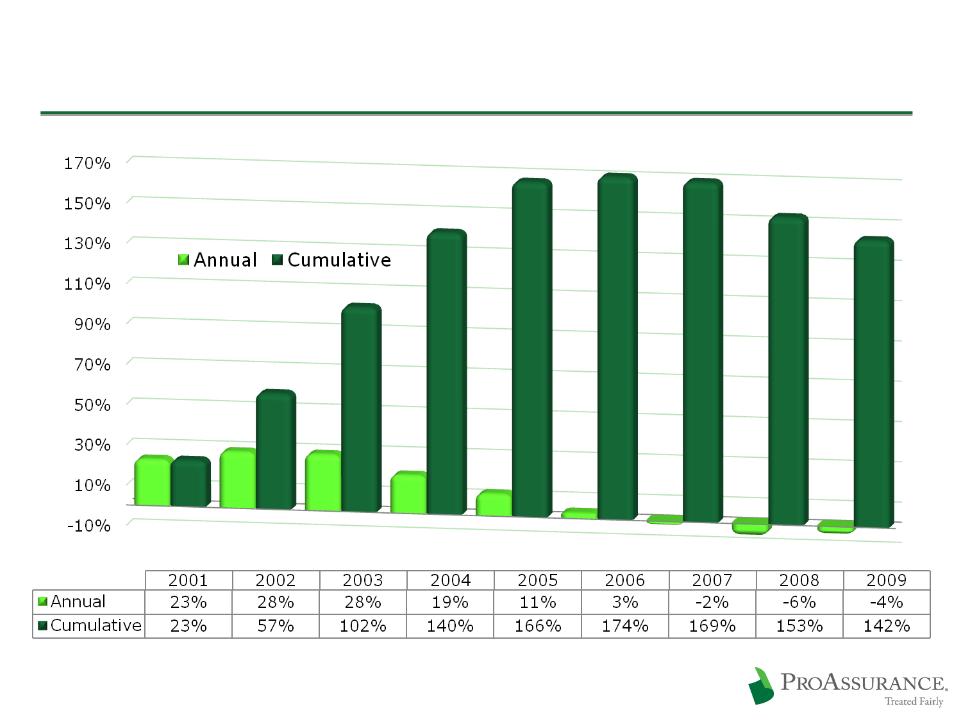
Rate Change History
15
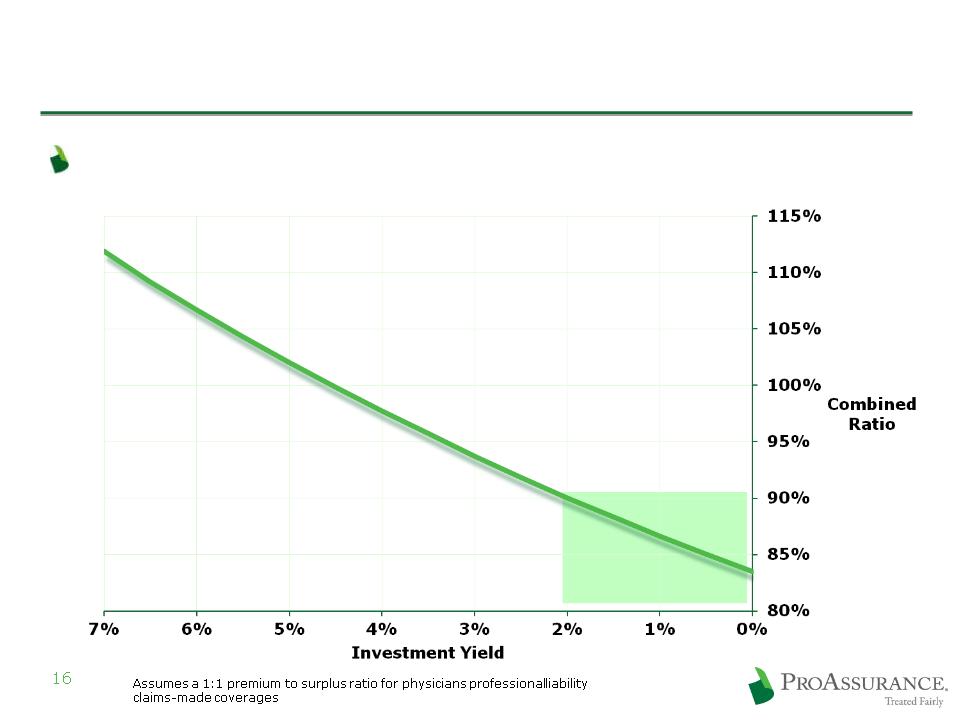
Pricing in a Low Interest Environment
Pricing Discipline is Even More Critical
Combined ratio
required to generate
a 13% after-tax ROE
required to generate
a 13% after-tax ROE
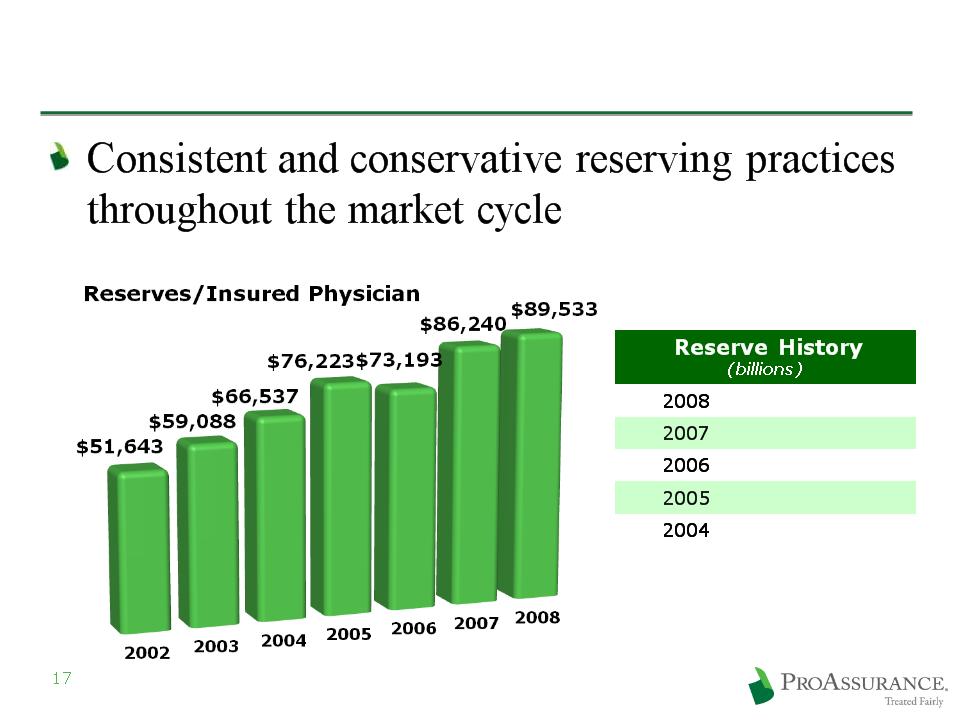
Strategy: Actuarial Conservatism
$ 2.4 | |
$ 2.6 | |
$ 2.6 | |
$ 2.2 | |
$ 1.8 | |
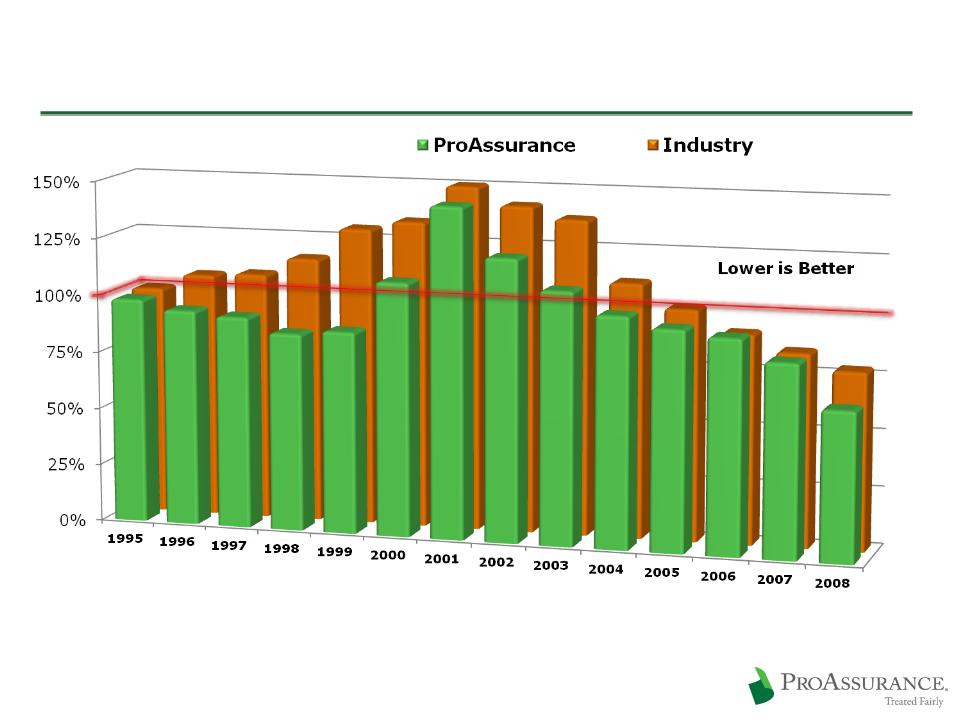
Combined Ratio Comparison
18
Source: A. M. Best Aggregates and Averages 2009
Medical Malpractice Lines of Business Net
Medical Malpractice Lines of Business Net

Strategy: Treated Fairly
Treated Fairly is our brand enhancement initiative
Affirms our existing, enduring commitment to
every stakeholder
every stakeholder
Insureds
Agents
Investors
The public
We run our business as owners who are
rewarded for long-term success
rewarded for long-term success
19

Growth Strategies

Key Opportunities
New insurance buyers will emerge as
healthcare reform evolves
healthcare reform evolves
New products will respond to physician/hospitals
combinations
combinations
The outcome of medical liability claims will
become more transparent
become more transparent
Financial issues will highlight the need for
successful, long-term companies with superior
balance sheets strength and outstanding ratings
successful, long-term companies with superior
balance sheets strength and outstanding ratings
21
2009: Consolidation of:
Mid-Continent General Agency
Mid-Continent General Agency
2009: Consolidation of:
Mid-Continent General Agency
Mid-Continent General Agency
Georgia Lawyers Insurance Co.
Georgia Lawyers Insurance Co.
2004: Purchased Selected Renewal Rights from:
OHIC Insurance Company
OHIC Insurance Company
2004: Purchased Selected Renewal Rights from:
OHIC Insurance Company
OHIC Insurance Company
We Created a Leader Through Consolidation
1994: Consolidation of:
West Virginia Hosp. Ins Co.
West Virginia Hosp. Ins Co.
1994: Consolidation of:
West Virginia Hosp. Ins Co.
West Virginia Hosp. Ins Co.
1995: Consolidation of;
1995: Consolidation of;
Physicians Ins Co of Indiana
Physicians Ins Co of Indiana
Assumed business of:
Physicians Ins Co of Ohio
Physicians Ins Co of Ohio
Assumed business of:
Physicians Ins Co of Ohio
Physicians Ins Co of Ohio
1996: Consolidation of:
1996: Consolidation of:
Missouri Medical Ins Co
Missouri Medical Ins Co
1995: Assumed business of:
Associated Physicians Ins Co. (IL)
Associated Physicians Ins Co. (IL)
1995: Assumed business of:
Associated Physicians Ins Co. (IL)
Associated Physicians Ins Co. (IL)
1998: Consolidation of:
Physicians Protective Trust Fund (FL)
Physicians Protective Trust Fund (FL)
1998: Consolidation of:
Physicians Protective Trust Fund (FL)
Physicians Protective Trust Fund (FL)
1996: Assumed business of:
American Medical Ins Exchange (IN)
American Medical Ins Exchange (IN)
1996: Assumed business of:
American Medical Ins Exchange (IN)
American Medical Ins Exchange (IN)
Founding in the 1970’s
Founding in the 1970’s
1999: Assumed business of:
Medical Defense Associates (MO)
Medical Defense Associates (MO)
1999: Assumed business of:
Medical Defense Associates (MO)
Medical Defense Associates (MO)
Mutual Assurance
Physicians Ins. Co. of Michigan
Professionals Group
Creation of:
Creation of:
2005: Consolidation of:
NCRIC Group
NCRIC Group
2005: Consolidation of:
NCRIC Group
NCRIC Group
2006: Consolidation of:
PIC Wisconsin Group
PIC Wisconsin Group
2006: Consolidation of:
PIC Wisconsin Group
PIC Wisconsin Group
2007: PRI renewal rights deal
2002: SERTA renewal rights deal
2001: OUM renewal rights deal
2000: DPM Merger
1999: PACO Acquisition
22

Experienced Management Team
Name | Position | Years at Company | Years Affiliated With The Industry |
Stan Starnes | Chairman & CEO | 2 | 31 |
Victor Adamo | President | 24 | 29 |
Jeff Bowlby | Chief Marketing Officer | 11 | 25 |
Howard Friedman | Liability Group President / Chief Underwriting Officer | 13 | 29 |
Jeff Lisenby | Corporate Counsel | 8 | 8 |
Frank O'Neil | Investor Relations Officer | 22 | 22 |
Ned Rand | Chief Financial Officer | 5 | 17 |
Darryl Thomas | Liability Group President / Chief Claims Officer | 12 | 22 |
Hayes Whiteside | Chief Medical Officer | 6 | 6 |
Average | 11 | 21 |
Our Team Understands Integration |
Joined PRA from Medical Assurance |
Joined PRA From Professionals Group |
Joined PRA after merger |
Officers, Directors & Employees Own ~9% of ProAssurance
23
Recent M & A Transactions
24
Significant growth in our core business
Geographical expansion
Extends our core business
Broadens our medically-related range
Geographical expansion
Broadens our medically-related range
Geographical expansion
Adds to our lawyers’ book
Geographical expansion
Affirms our interest in this line

Extending our Reach in MPL
Podiatry Insurance Company of America (PICA)
Dominant (70%), profitable, national company
~$96 million Direct Premium in 2008
Renewals at expected levels in 2009
$13.7 million added to PRA premium in Q2 2009
Podiatry is growing in importance as a specialty
Involved in treating complications in a population with an
increasing prevalence of diabetes
increasing prevalence of diabetes
Increases our understanding of policies that are
higher volume, lower cost
higher volume, lower cost
25
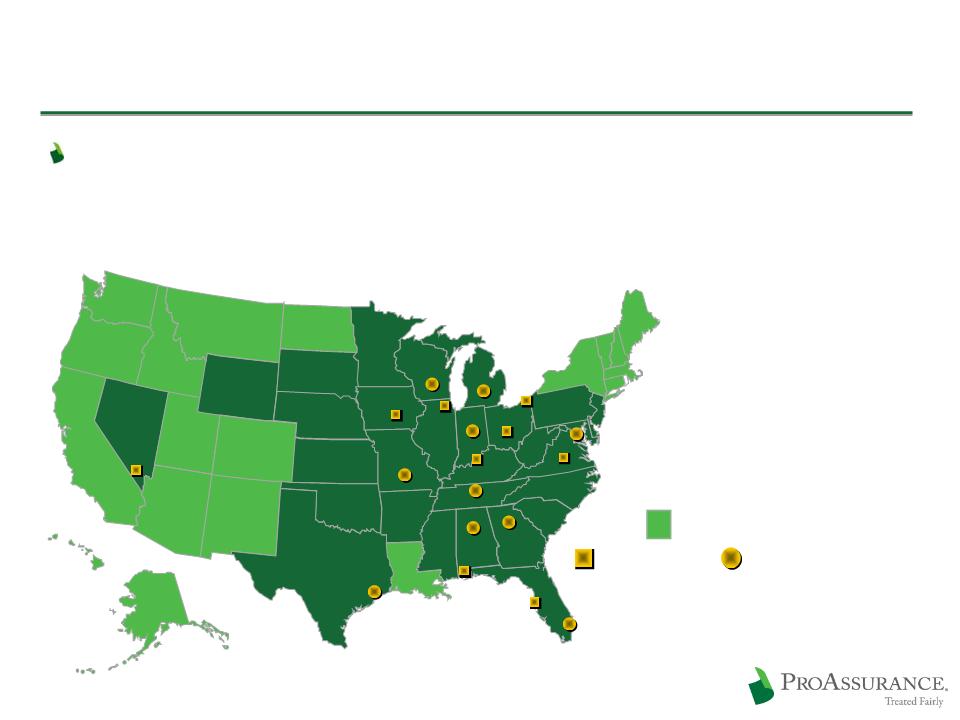
With PICA We Are a National Carrier
Leveraging the benefits of our many M & A transactions through
long-term customer relationships and local and specialty
knowledge
long-term customer relationships and local and specialty
knowledge
26
Corporate Headquarters
Corporate Headquarters
Claims Offices
Claims Offices
Claims / Underwriting Offices
Claims / Underwriting Offices
PICA and/or E&S States
PICA and/or E&S States
PICA Headquarters
PICA Headquarters
(Birmingham)
(Nashville)

Opening New Avenues in MPL
Mid-Continent General Agency
Large writer of ancillary healthcare
Healthcare reform will emphasize care delivery from a
larger array of lower-cost providers
larger array of lower-cost providers
Home health care
Physician-extenders
~$26 million in total premium in 2008
$20 million healthcare related
PRA will write most of this business
$3.6 million added to PRA premium in Q2 2009
Commission derived from business we choose not to write
27

Adding to our Legal E&O Book
Georgia Lawyers Insurance Company
A leading insurer of Georgia attorneys
2008 Premium: $5.7 million
Highlights our desire to grow in this line
Sets the stage for expansion in the southeast
Our existing legal professional business is primarily in
the midwest
the midwest
Approximately 2,650 attorneys in 600 law firms
2008 Total Legal E&O Premium: $7.8 million
New MGA’s writing in the West and mid-Atlantic
28

ProAssurance Growth Strategy
The legal and regulatory environment must be
favorable
favorable
Understanding why companies are available
Not all M&A opportunities should be pursed
We don’t “bet the farm” and can acquire
without “breaking the bank”
without “breaking the bank”
Ability to use our stock in transactions
Attractive because of strong book-value multiple
Cash flow remains strong
29

30
ProAssurance Growth Strategy
The current market environment favors growth by
acquisition
acquisition
DE NOVO GROWTH vs. GROWTH BY ACQUISITION
DE NOVO GROWTH vs. GROWTH BY ACQUISITION
- Must price your way into the market + Pricing can be adjusted
- Must price your way into the market + Pricing can be adjusted
- No prior history + Prior history available
- No prior history + Prior history available
- Lack of experienced personnel + Local expertise available
- Lack of experienced personnel + Local expertise available
- Limited access to key defense lawyers + Access to proven defense lawyers
- Limited access to key defense lawyers + Access to proven defense lawyers
- Must establish distribution + Utilize existing distribution
- Must establish distribution + Utilize existing distribution
- Must create brand awareness + Build on existing relationships with
insureds and organized medicine, etc.
insureds and organized medicine, etc.
- Must create brand awareness + Build on existing relationships with
insureds and organized medicine, etc.
insureds and organized medicine, etc.
+ No integration risk - Integration risk
+ No integration risk - Integration risk
+ No reserve risk - Reserve risk—need for careful due diligence
+ No reserve risk - Reserve risk—need for careful due diligence

Financial Highlights

2009 YTD Income Statement Highlights
32
in millions, except per share data
Gross Premiums Written $ 435 $ 374 $ 472
Net Investment Income 113 122 158
Total Revenue 489 431 567
Total Expenses 295 294 470
Operating Income $ 136 $ 127 207
Net Income (Includes Investment Losses) $ 137 $ 101 178
Operating Income/Diluted Share $ 2.50 $ 2.43 $ 6.07
September 30, Year-End
2009 2008 2008
We have reversed the decline in premiums with new
business from PICA, Mid-Continent and Georgia Lawyers
business from PICA, Mid-Continent and Georgia Lawyers
Strategy: Enduring Financial Strength
33
Emphasizing an appropriate balance of risk vs. return
Committed to enduring balance sheet strength
Responding to the low interest rate environment
Stockholder’s Equity Up
Over 16% Since 12/31/07
Over 16% Since 12/31/07
Strategy: Use Capital Prudently
Using capital to build through M&A
Preserving capital for future opportunities
Enhancing shareholder value by repurchasing shares
at prices that build Book Value
at prices that build Book Value
34
Source: SNL Financial
Our Strong Capital/Low Leverage Position
35
(in millions)
Prepared for an
improving market
improving market
Prudent capital
management
management
Premiums to Surplus
for Each year
for Each year
$567
$ 96 (PICA pro forma)
$471
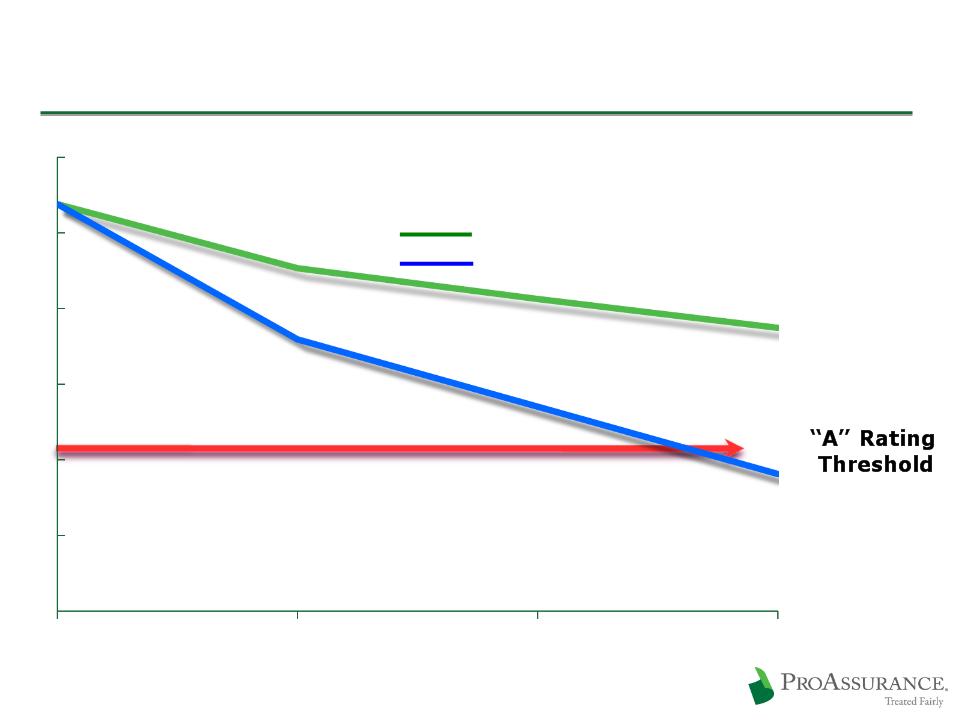
Excess Capital vs. Excess Capacity
36
Conceptual Model of Projected
A. M. Best BCAR Scores if
A. M. Best BCAR Scores if
Premiums Increase
Surplus is Reduced

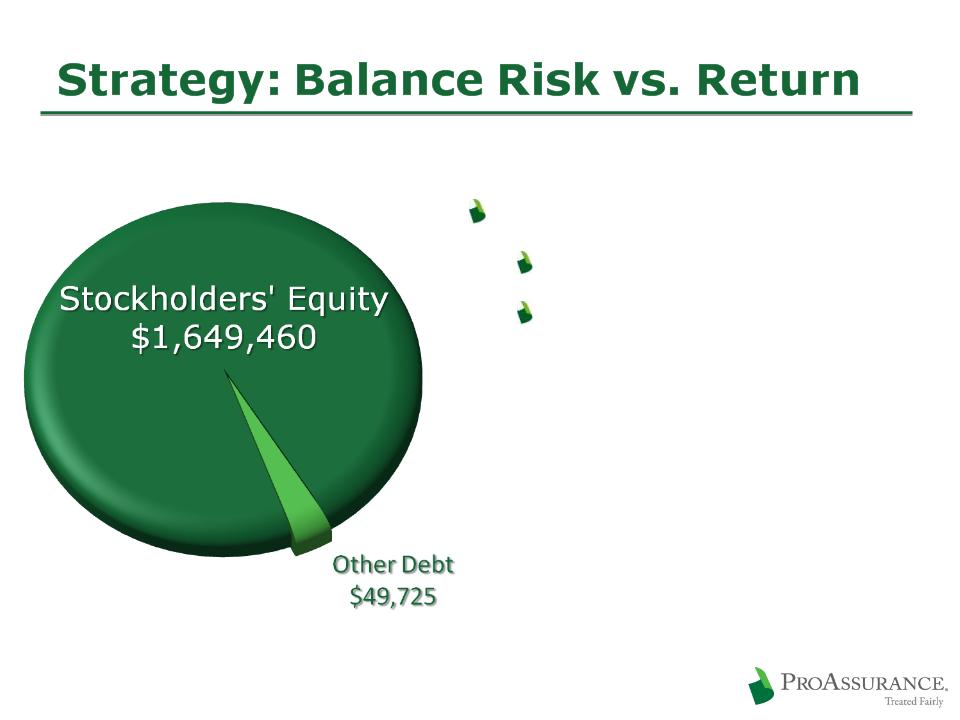
Strategy: Balance Risk vs. Return
Key Investment Actions in Q3 09
Reduced cash and short-term
balances
balances
Added to corporate bonds
CUSIP-level portfolio disclosure
on our website:
www.proassurance.com/investorrelations/supplemental.aspx
on our website:
www.proassurance.com/investorrelations/supplemental.aspx
$3.9 Billion
Portfolio
Portfolio
$3.9 Billion
Portfolio
Portfolio
Fixed Income: 91%
Short Term: 4%
Short Term: 4%
Equity and Other Investments: 3%
Equity and Other Investments: 3%
BOLI: 2%
BOLI: 2%
37
9/30/09
38
Little Dependence on Debt
Low Debt to Cap Ratio
Little strain on cash flow
9/30/2009

Fixed Income: $3.6 Billion
39
9/30/09

Summary

ProAssurance
Producing sustainable shareholder value
Growing Book Value per Share
Finding the right M & A opportunities
Significant share ownership at all levels
Focusing on long-term
Preparing for a changing market
Leveraging financial strength
Protecting the balance sheet
Maintain our leading market position
Building strength for the next cycle turn
41

Appendix: Market Conditions
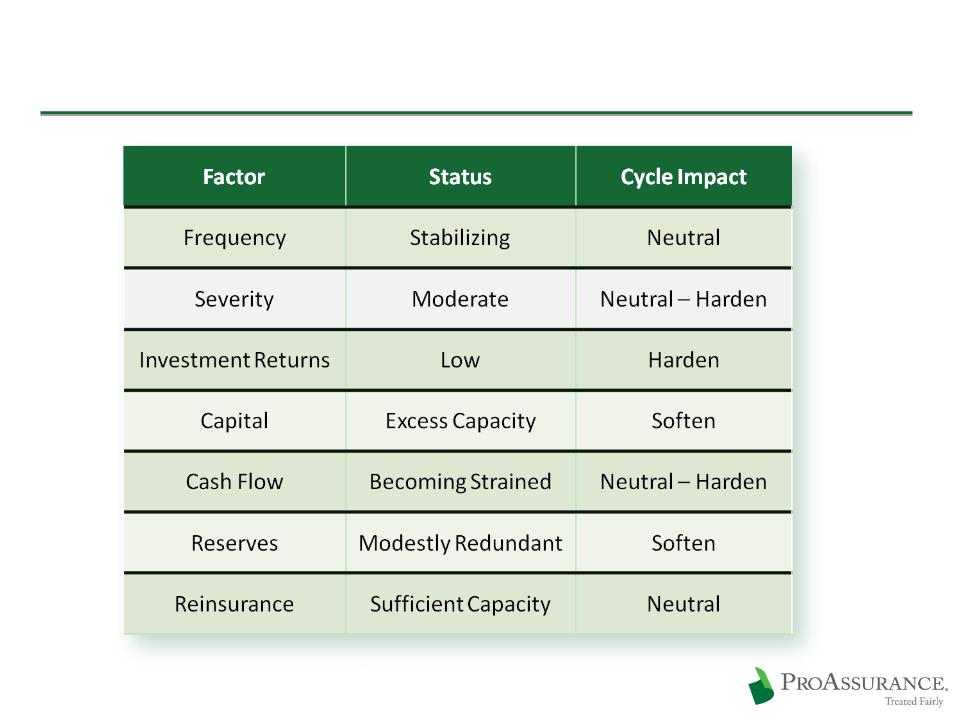
Current Industry Status
43

Appendix: Claims
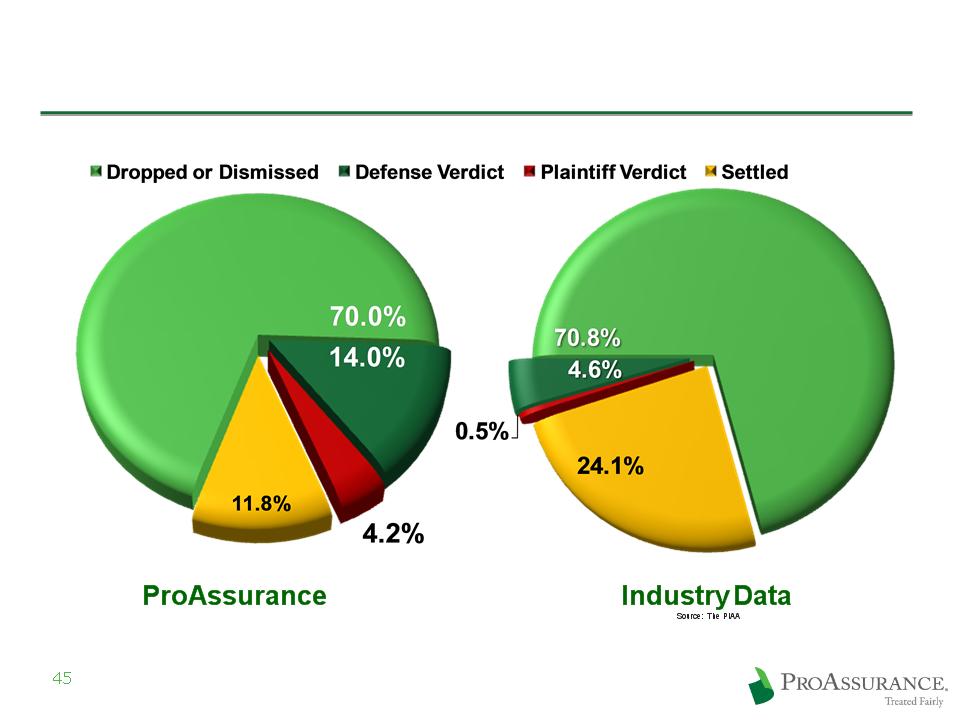
Why Claims Strategy Matters
Favorable
Outcomes:
84.0%
Outcomes:
84.0%
Favorable
Outcomes:
84.0%
Outcomes:
84.0%
Five Year Average
2004 - 2008
2004 - 2008
Favorable
Outcomes:
75.4%
Outcomes:
75.4%
Favorable
Outcomes:
75.4%
Outcomes:
75.4%
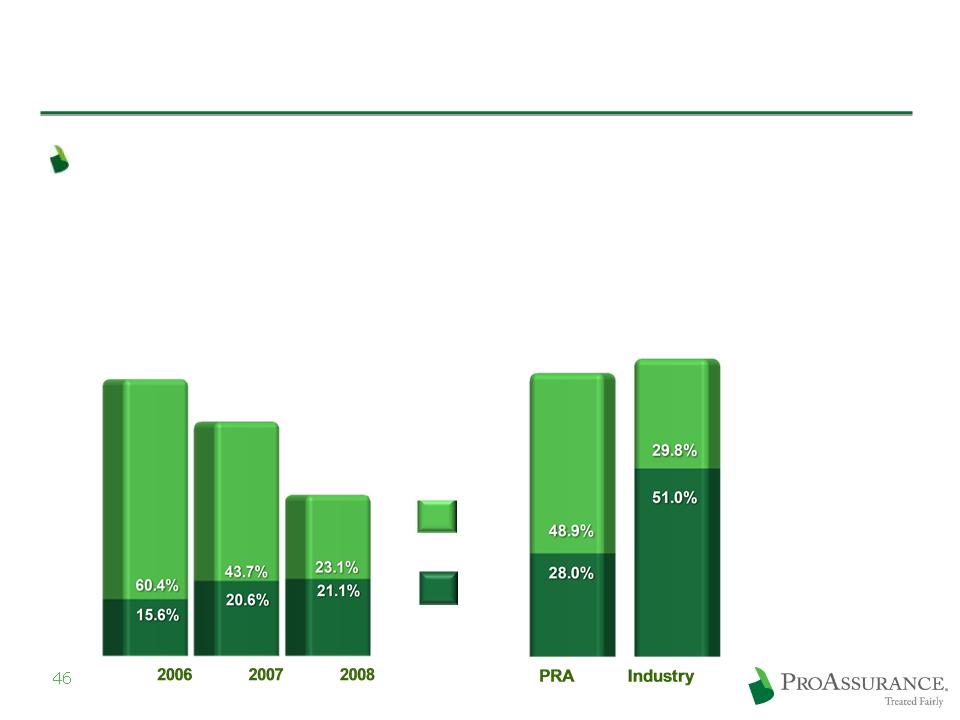
Why Claims Strategy Matters
Our ability and willingness to defend claims
allows us to achieve better results
allows us to achieve better results
ProAssurance vs. Industry
Average Statutory Loss Ratio
Average Statutory Loss Ratio
2003-2008
Legal
Payments
Payments
Loss
Payments
Payments
Trend for ProAssurance
Stand Alone Statutory Loss Ratio
Stand Alone Statutory Loss Ratio
2006 - - 2008
76.0%
*Source: A. M. Best Aggregates & Averages, Medical Malpractice Predominating
64.3%
80.8%
76.9%
44.2%

Appendix: Investments
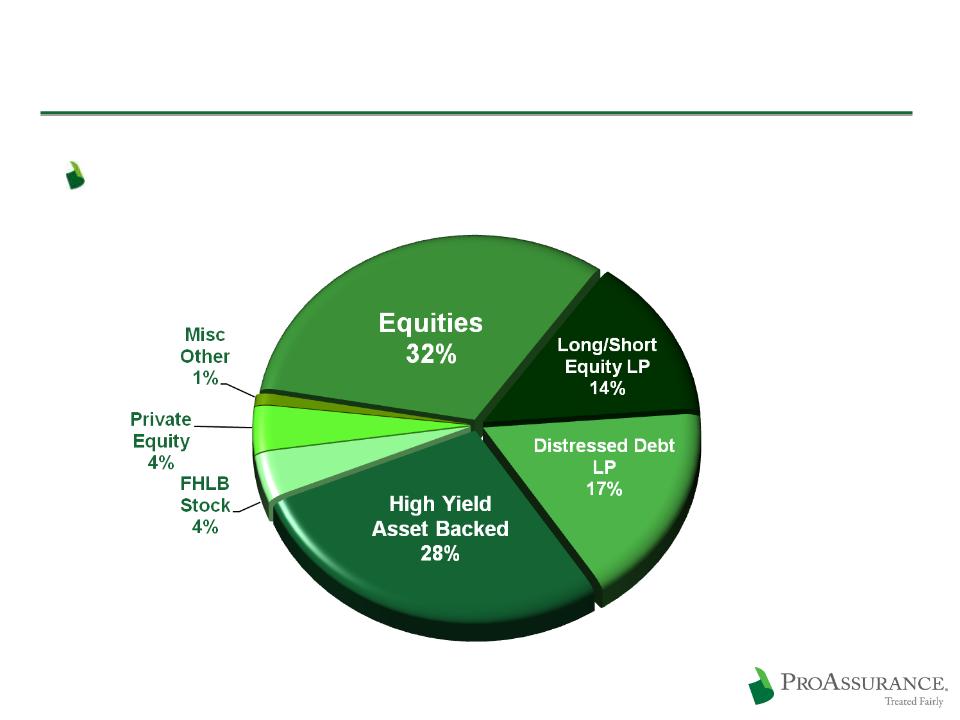
Equities & Other: $136 Million
48
9/30/09
Represents 3.5% of our Total Investments
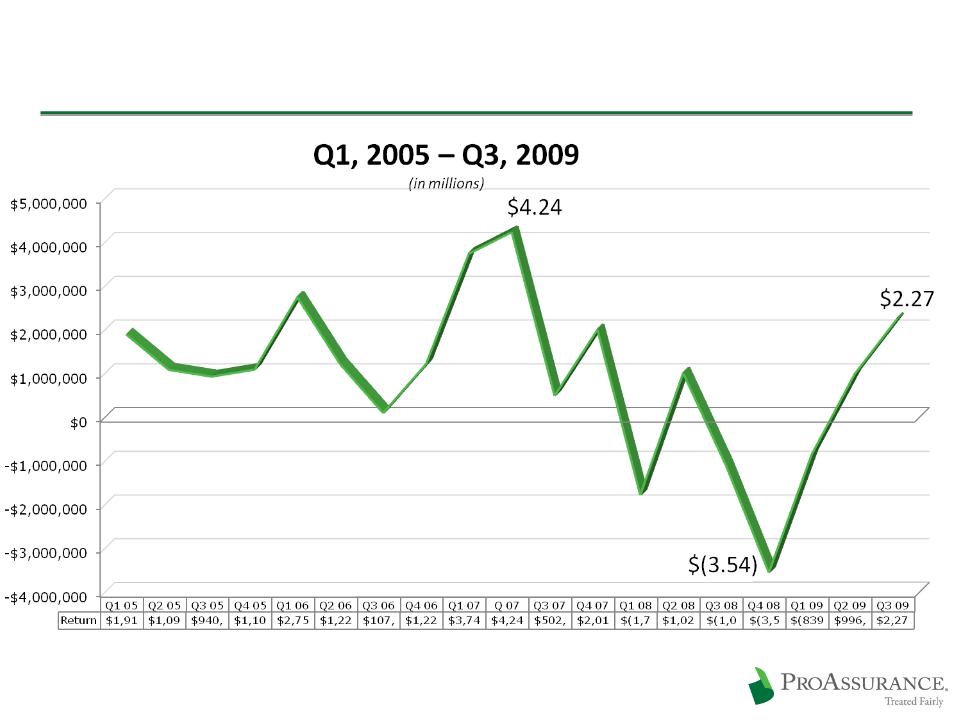
Return by Quarter: Equities & Other
49
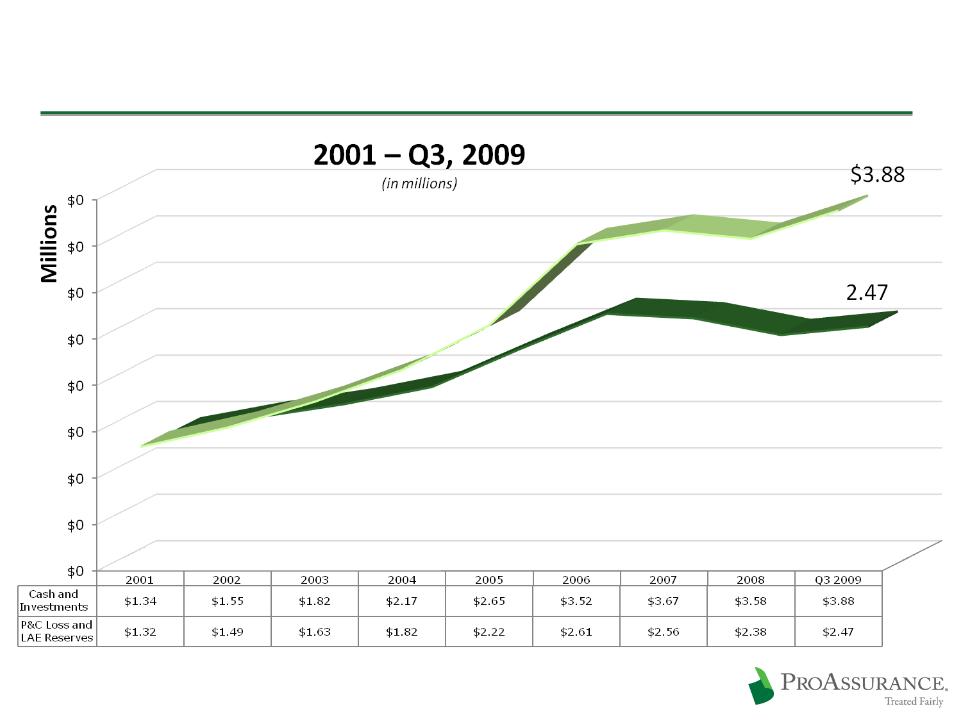
Growth in Investment vs. Reserves
50
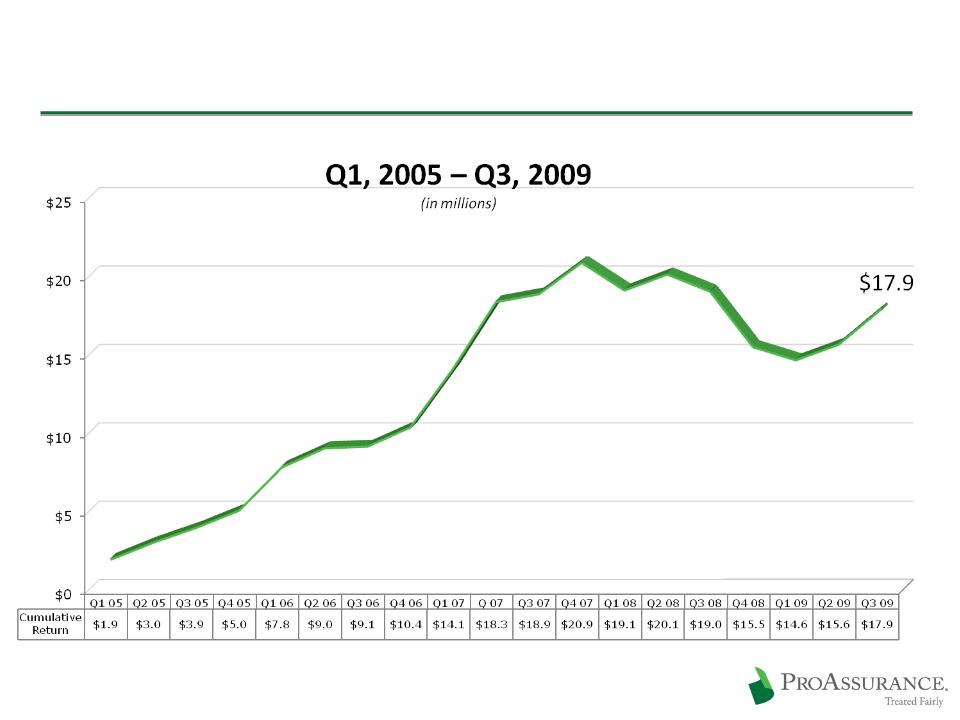
Cumulative Return: Equities & Other
51
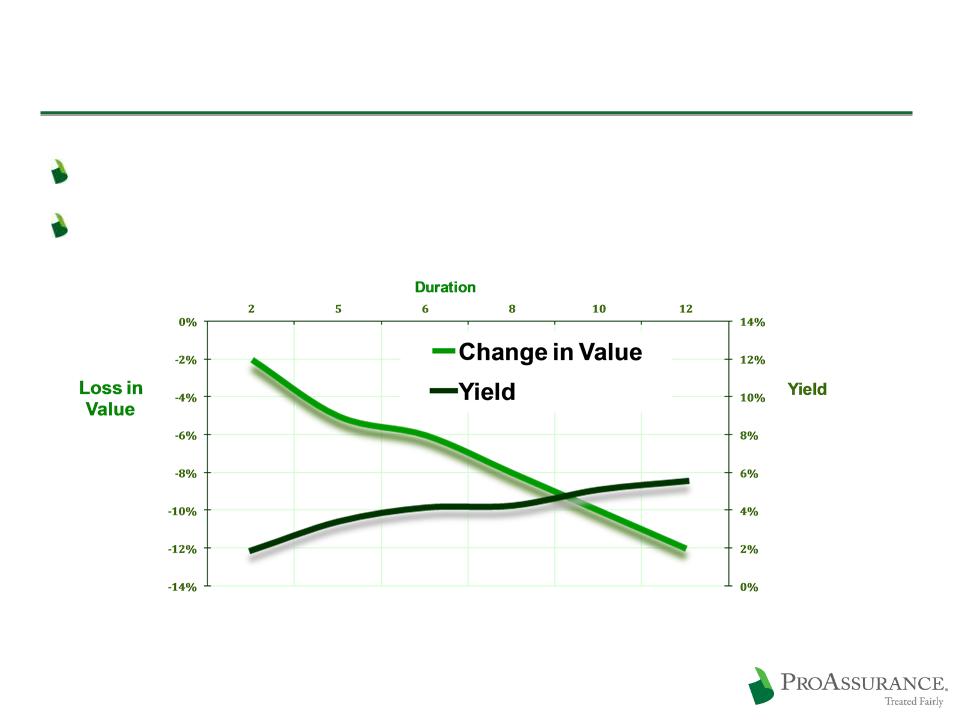
Strategy: Investment Discipline
The choice: Chase yield or extend duration
We are maintaining duration, looking for opportunities
52
Loss in value assuming a 100 basis point shift in the yield curve
Yields based on Single A composite corporate debt
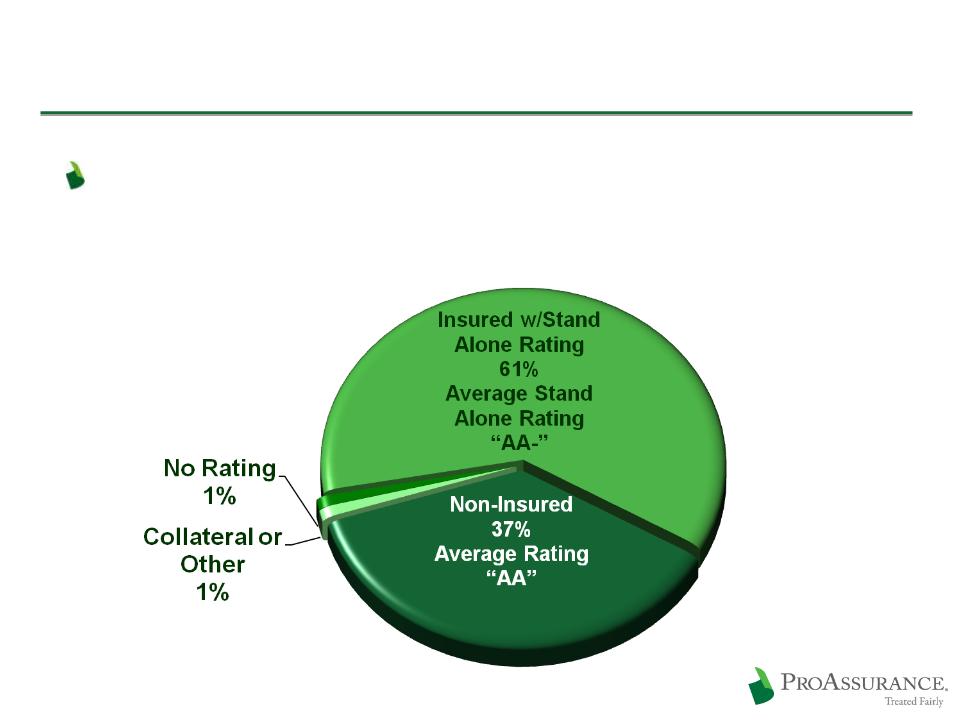
Municipals: $1.5 Billion
53
9/30/09
Investment policy has always required
investment grade rating prior to applying the
effect of insurance
investment grade rating prior to applying the
effect of insurance
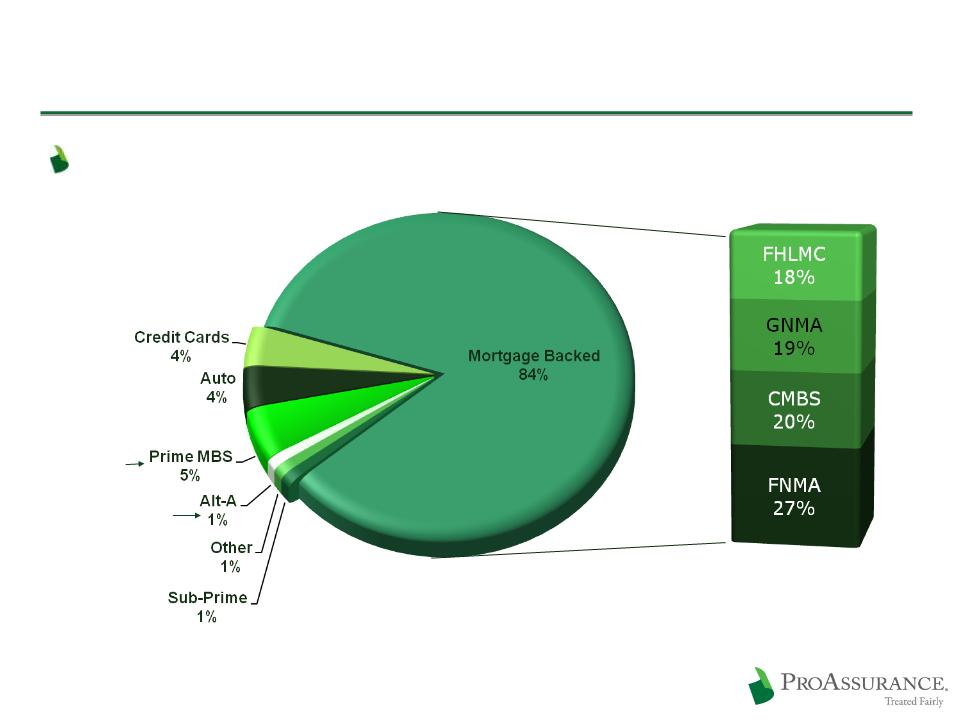
Asset Backed: $805 Million
Weighted average rating: “AAA”
Bloomberg Data
9/30/09
9/30/09
Alt-A
LTV 63%
LTV 63%
Prime MBS
LTV 56%
LTV 56%
Further Details Provided
on Sub-Prime and CMBS
on following pages
on Sub-Prime and CMBS
on following pages
54

Sub-Prime Detail
55
$6.7 million market value in AFS portfolio
$4.2 million unrealized loss
$9.6 million market value in
high-yield LP rated B
high-yield LP rated B
LP’s focus is distressed ABS
At 9/30/09 | Vintage |
$4.8 Mln | 2004 & Prior |
$1.9 Mln | 2005 |
Quality & Vintage information only on direct holdings at 9/30/09
At 9/30/09 | Type | Quality |
$2.9 Mln | Mortgage-Backed | AA avg - LTV 68% |
$3.8 Mln | Home Equity | A+ avg |

CMBS Detail
Vintages
2005 & Prior- $136 million
2006- $23 million
2007- $3 million
Top Property Types
Retail-Anchored: 45% of CMBS portfolio
Exposure: 19% - 44% of underlying occupancies
Office: 44% of CMBS portfolio
Exposure: 23% - 49% of underlying occupancies
Multi Family: 4% of CMBS portfolio
Mixed Use: 3% of CMBS portfolio
Other: 4% of CMBS Portfolio
56

CMBS Detail
$162 million Fair Value in non-agency CMBS
Book Value: $164 million
5% of fixed income portfolio
57
At 9/30/09 | Quality |
$160 Mln | AAA |
$ 2.0 Mln | AA |
At 9/30/09 | Wtd Avg LTV |
24% | <65% |
43% | =65-70% |
21% | <70-75% |
12% | =75-85% |
At 9/30/09 | Credit Support |
26% | >30% |
52% | 20% - 30% |
20% | 10% - 20% |
2% | Less than 10% |
At 9/30/09 | Deal Cumulative Delinquencies |
27% | 0% - 0.5% |
3% | 0.5% - 1.0% |
32% | 1.0% - 2.0% |
4% | 2.0% - 3.0% |
22% | 3.0%-5.0% |
12% | 5.0%-9.0% |
At 9/30/09 | Debt Service Coverage |
69% | =>1.5x |
25% | 1.4x-1.5x |
6% | 1.3x-1.4x |
AT
9/30/09
9/30/09

CMBS Since September 30, 2009
Since 9/30/09:
Sold $50.0 million CMBS
Paydowns of $8.0 million
As of November 30, 2009 CMBS:
Market value: $108 million
Book value: $110 million
Expecting pay down of $19 million
by year-end 2009
by year-end 2009
Projecting ~$90 million exposure at year-end
58
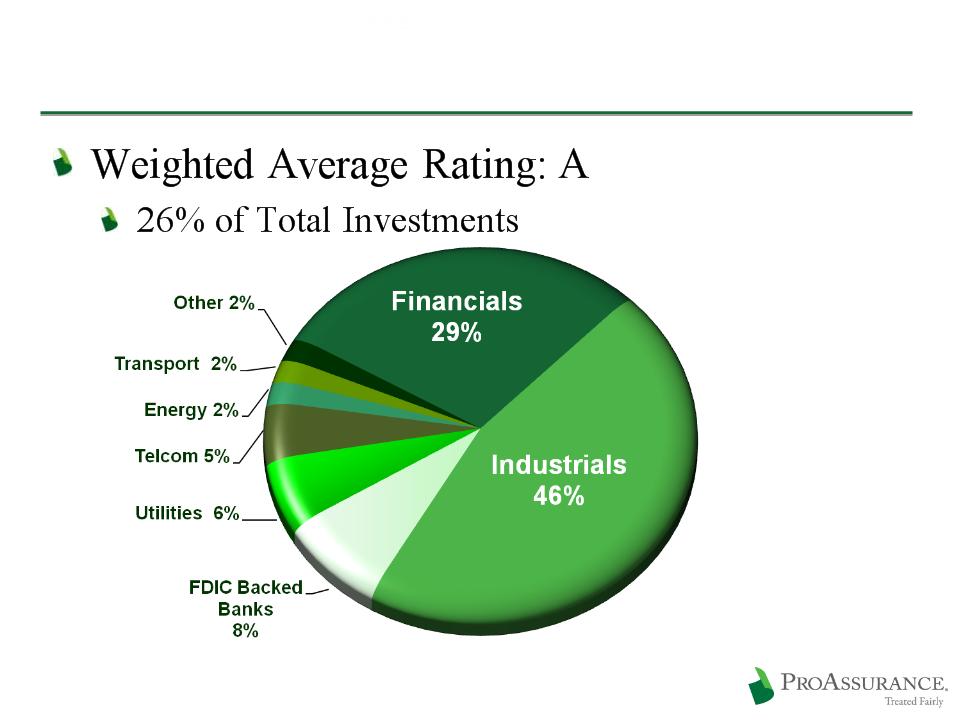
Corporates: $1.0 Billion
59
9/30/09

Corporate: Detail on Financials
Top 20 Largest Banks/Financials: $ 294 million
$75 mm FDIC backing
BA $44 ($23) | BNY Mellon $10 |
MS $27 ($6) | Credit Suisse $9 |
BP Cap $25 | Eurohypo $8 |
GECC $25 ($8) | KEY $6 ($6) |
JPM $24 ($14) | NRUC $6 |
CITI $20 ($7) | Deutsche Bank $5 |
Wells $20 | FMCC $5 |
GS $16 ($2) | NY Commt’y Bank $5 ($5) |
PNC $15 ($2) | Depfa ACS Covered $5 |
Amex $14 | John Deere Cap $5 ($2) |
FDIC backed amounts listed in parentheses | |
60
9/30/2009
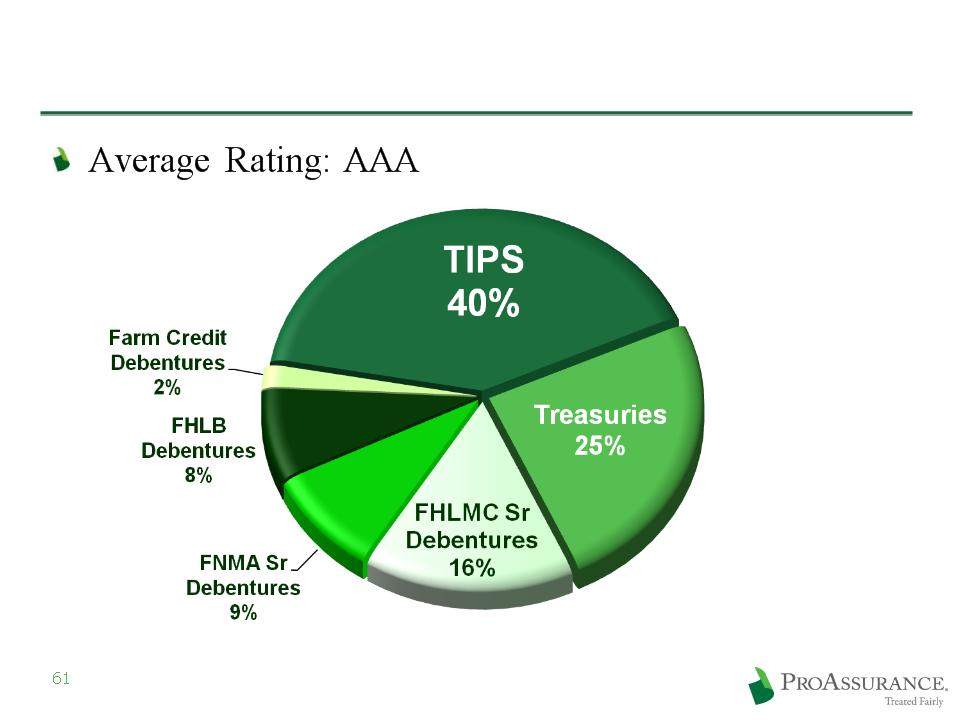
Treasury/GSE: $228 Million
9/30/09

62
9/30/09
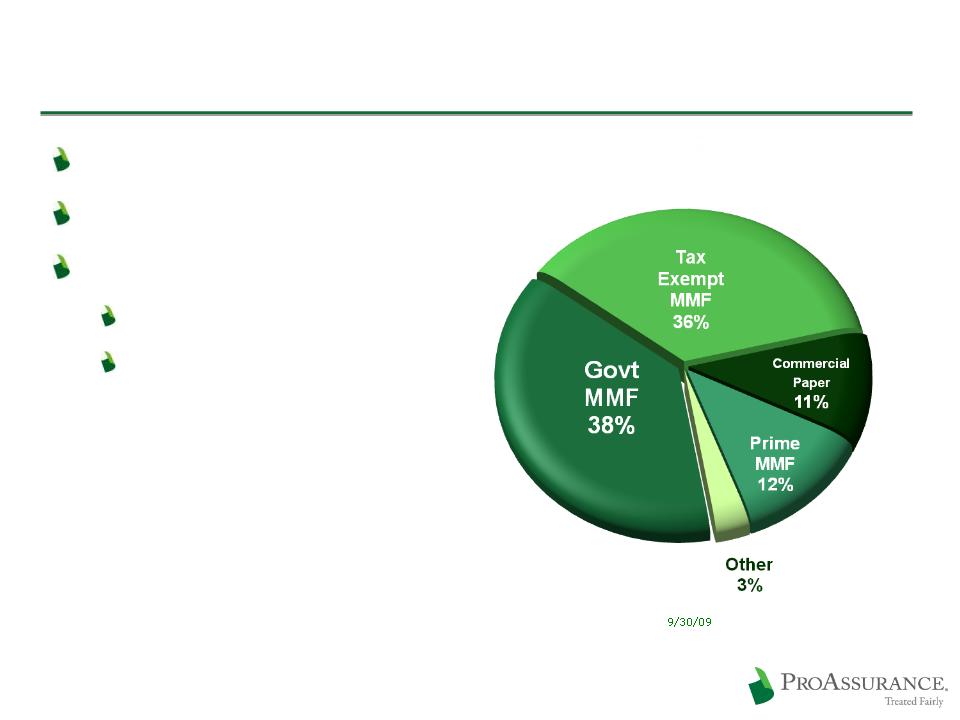
Portfolio Overview: Short Term
$138 Million
Rated A1/P1 or better
Money Markets:
Moody’s: Aaa
S&P: AAA
63
BOLI: $65 Million
Weighted average rating
Moody’s: AA3
S&P: AA
A. M. Best: A+
64

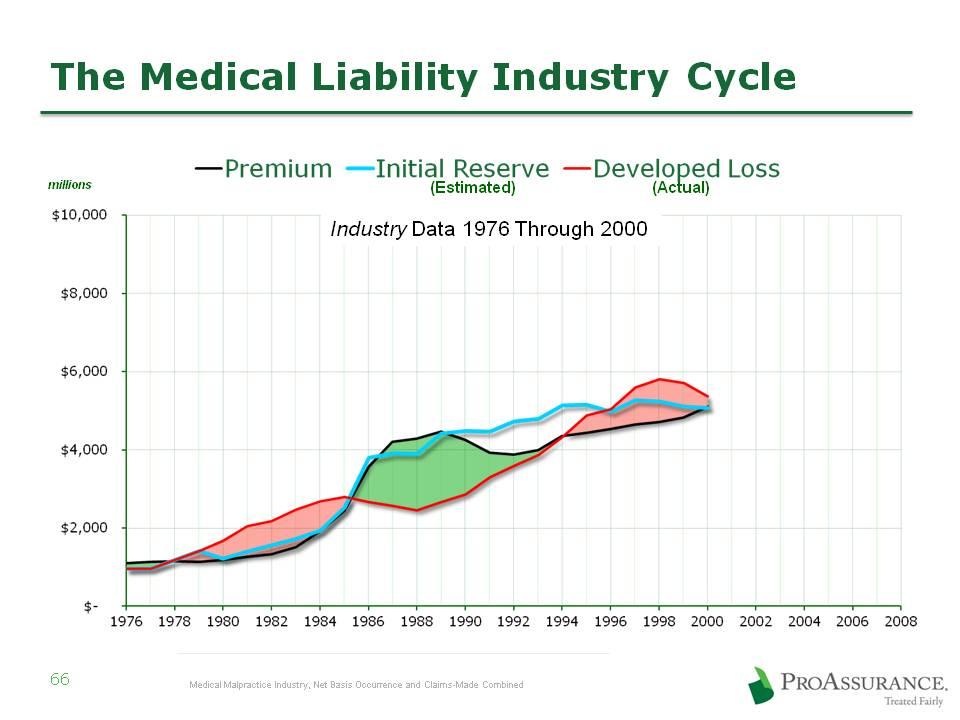
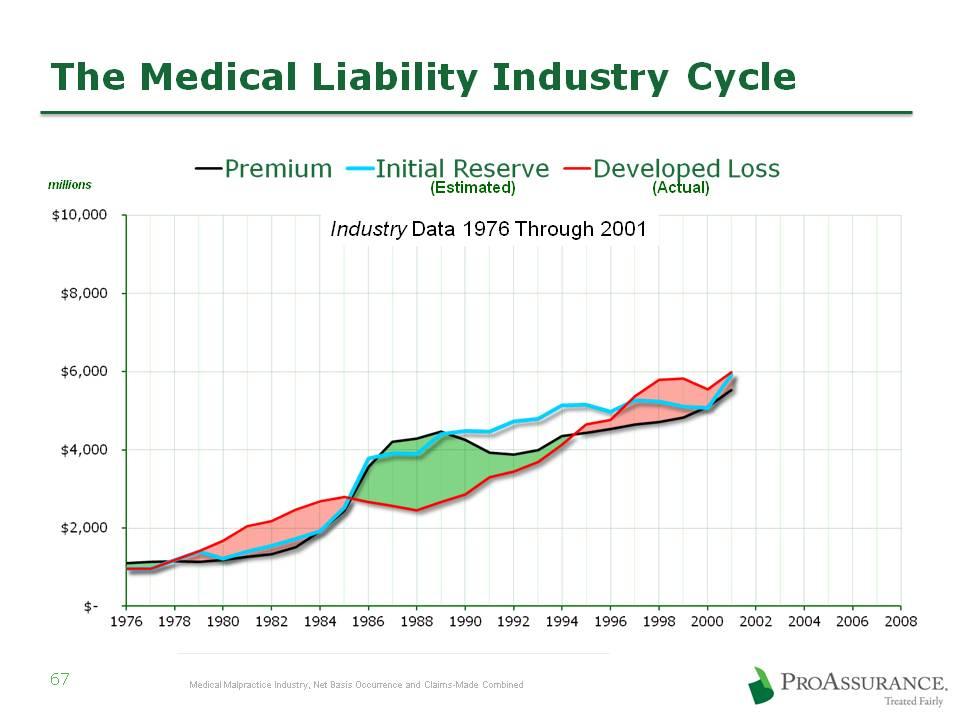
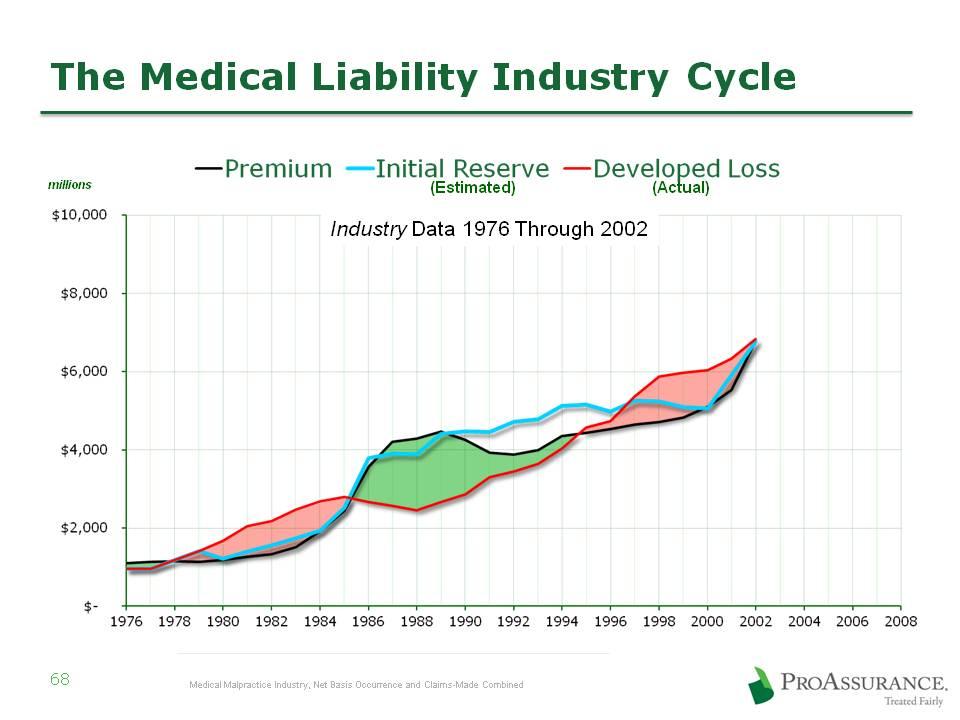
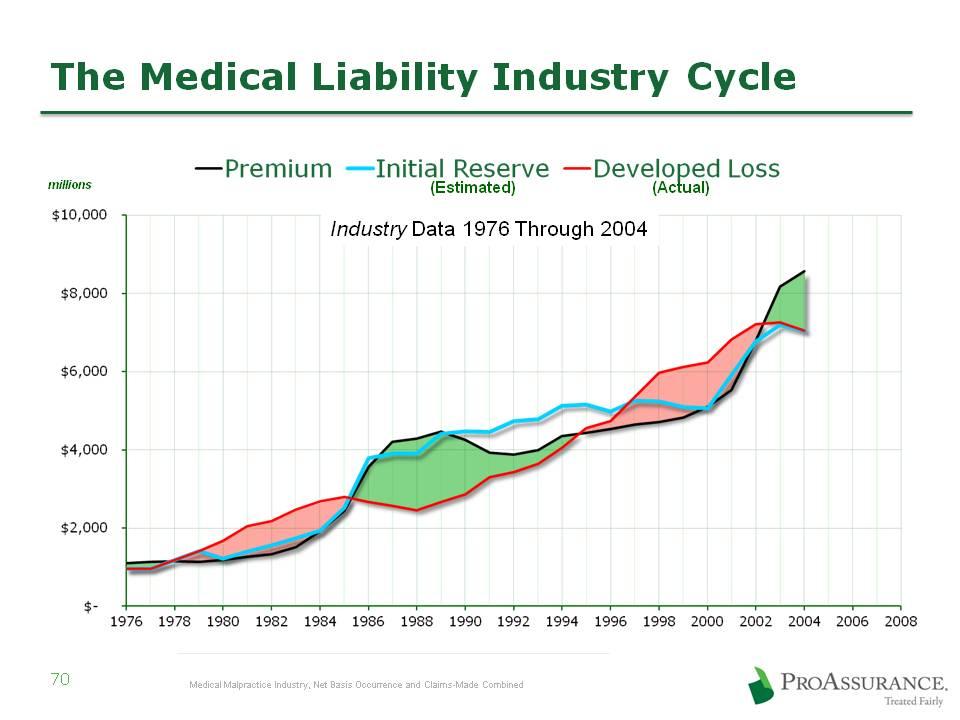
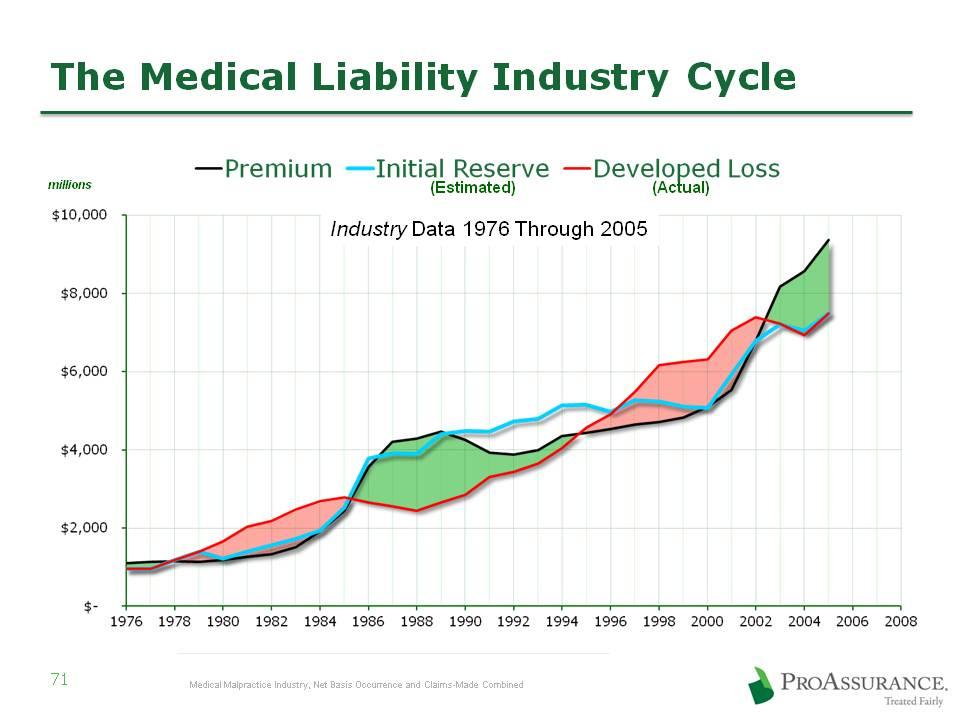
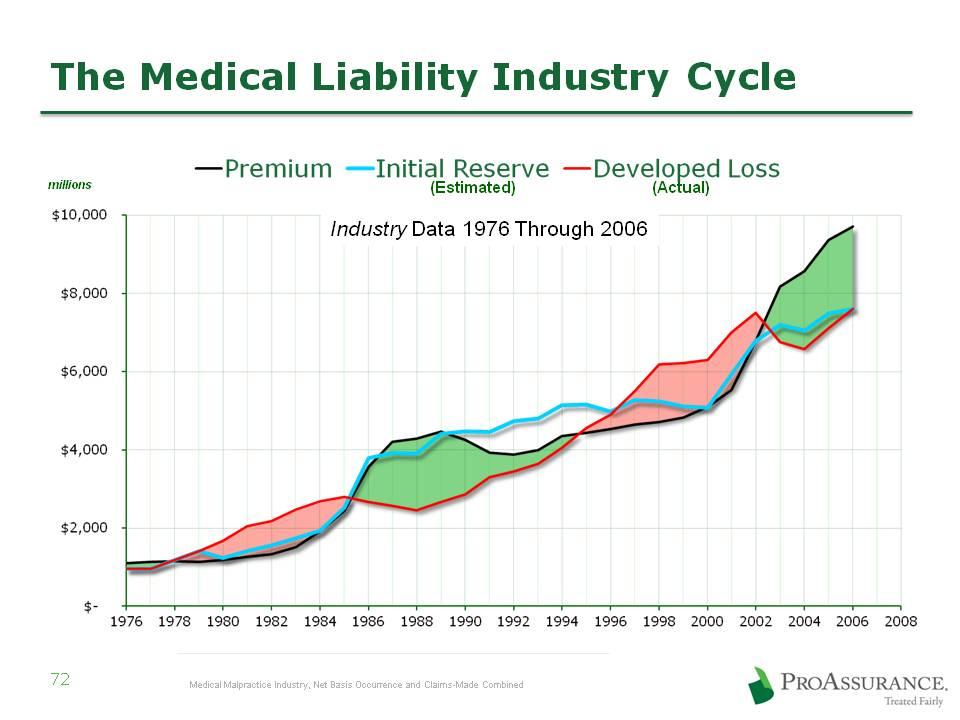
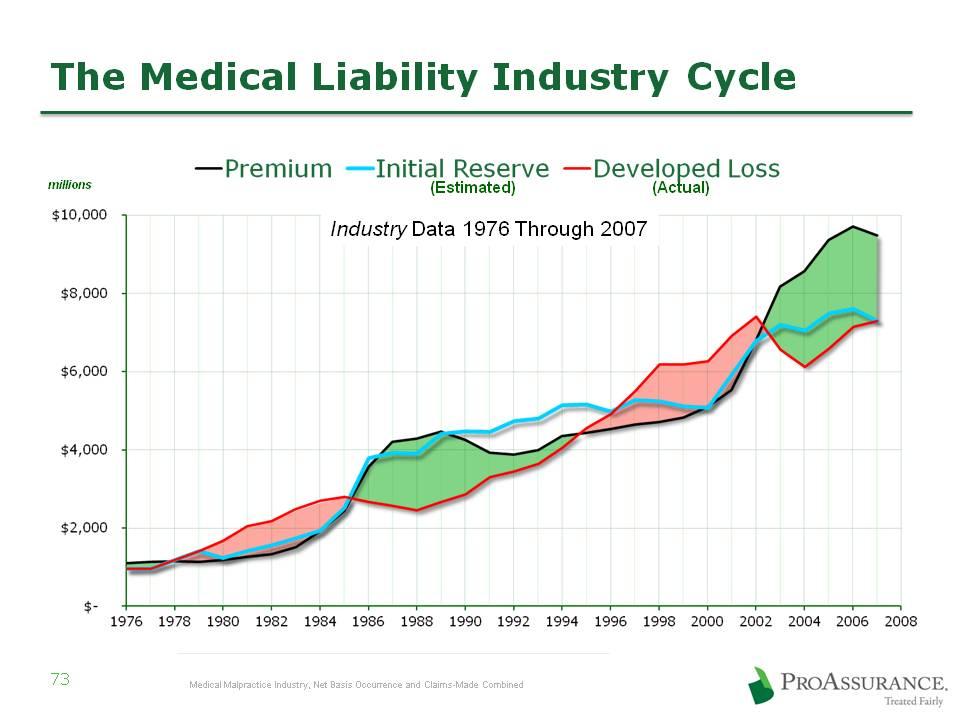
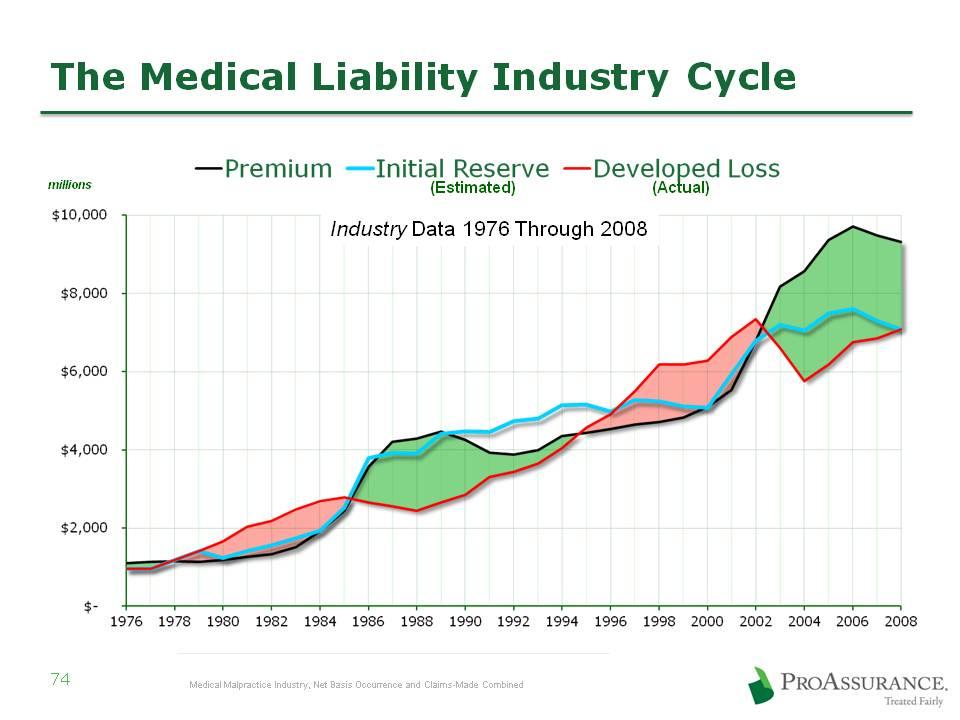
Appendix: Industry History


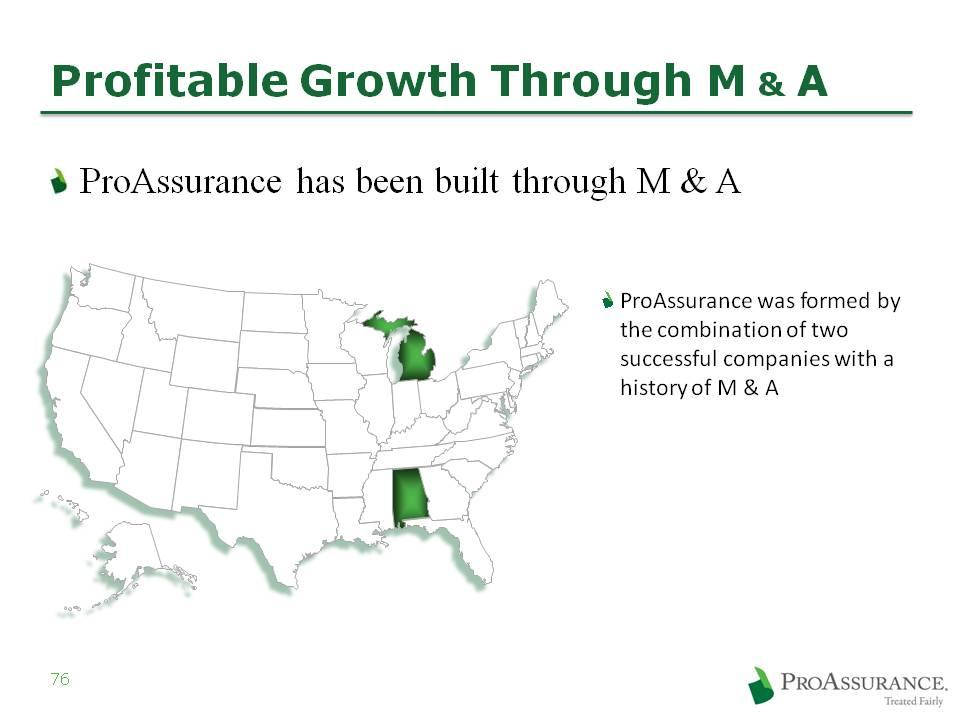
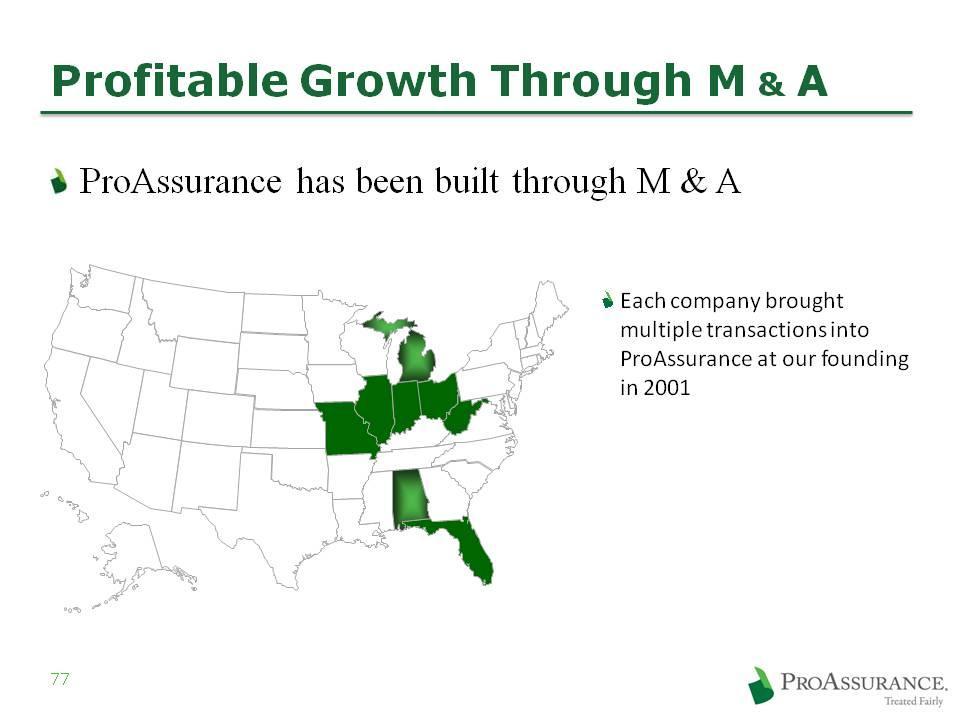
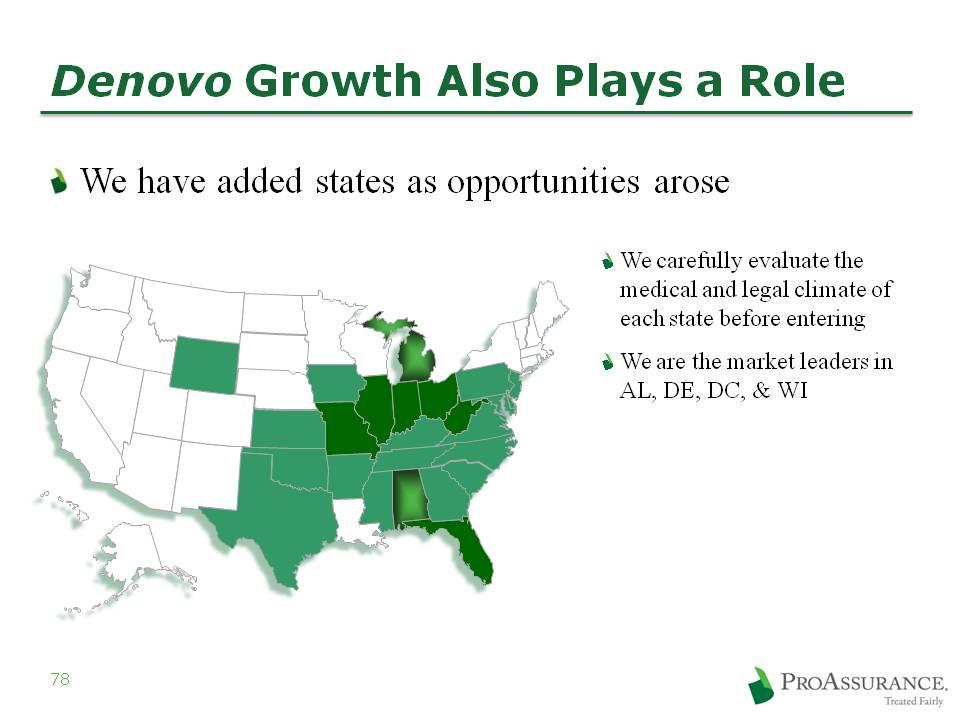
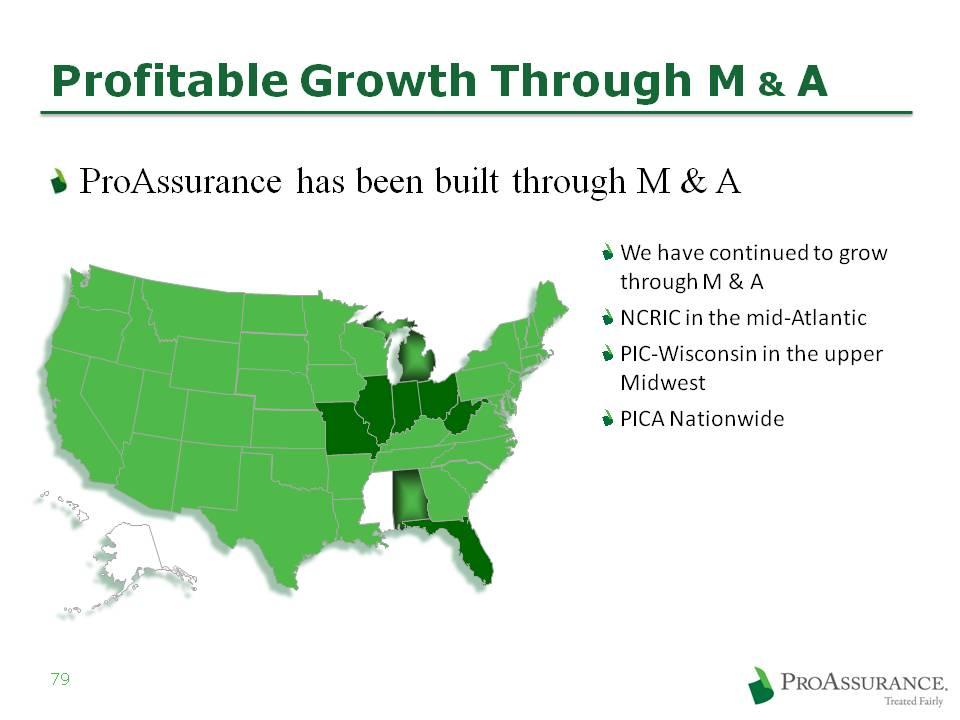
Appendix: Growth Maps