United States
Securities and Exchange Commission
Washington, D.C. 20549
Amended
Form N-CSR
Certified Shareholder Report of Registered
Management Investment Companies
811-10625
(Investment Company Act File Number)
Federated Core Trust II, L.P.
(Exact Name of Registrant as Specified in Charter)
Federated Investors Funds
4000 Ericsson Drive
Warrendale, Pennsylvania 15086-7561
(Address of Principal Executive Offices)
(412) 288-1900
(Registrant’s Telephone Number)
John W. McGonigle, Esquire
Federated Investors Tower
1001 Liberty Avenue
Pittsburgh, Pennsylvania 15222-3779
(Name and Address of Agent for Service)
(Notices should be sent to the Agent for Service)
Date of Fiscal Year End: 12/31/2009
Date of Reporting Period: 12/31/2009
| Item 1. | Reports to Stockholders |
Market Plus Core Fund
A Portfolio of Federated Core Trust II, L.P.ANNUAL SHAREHOLDER REPORT
December 31, 2009
FINANCIAL HIGHLIGHTS
SHAREHOLDER EXPENSE EXAMPLE
MANAGEMENT'S DISCUSSION OF FUND PERFORMANCE
PORTFOLIO OF INVESTMENTS SUMMARY TABLE
PORTFOLIO OF INVESTMENTS
STATEMENT OF ASSETS AND LIABILITIES
STATEMENT OF OPERATIONS
STATEMENT OF CHANGES IN NET ASSETS
NOTES TO FINANCIAL STATEMENTS
REPORT OF INDEPENDENT REGISTERED PUBLIC ACCOUNTING FIRM
BOARD OF DIRECTORS AND TRUST OFFICERS
EVALUATION AND APPROVAL OF ADVISORY CONTRACT
VOTING PROXIES ON FUND PORTFOLIO SECURITIES
QUARTERLY PORTFOLIO SCHEDULE
Financial Highlights
(For a Share Outstanding Throughout Each Period)
| Year Ended December 31, | Period
Ended
12/31/2005 1 |
| 2009 | 2008 | 2007 | 2006 |
| Net Asset Value, Beginning of Period | $6.80 | $12.30 | $12.01 | $10.32 | $10.00 |
| Income From Investment Operations: | | | | | |
| Net investment income | 0.26 | 0.49 | 0.68 | 0.17 | 0.11 |
| Net realized and unrealized gain (loss) on investments, futures contracts, swap contracts and foreign currency transactions | 2.56 | (5.99) | (0.39) | 1.52 | 0.21 |
| TOTAL FROM INVESTMENT OPERATIONS | 2.82 | (5.50) | 0.29 | 1.69 | 0.32 |
| Net Asset Value, End of Period | $9.62 | $6.80 | $12.30 | $12.01 | $10.32 |
| Total Return2 | 41.47% | (44.72)%3 | 2.41% | 16.38% | 3.20% |
| Ratios to Average Net Assets: | | | | | |
| Net expenses | 0.05% | 0.05% | 0.05% | 0.05% | 0.05%4 |
| Net investment income | 3.39% | 4.96% | 5.53% | 5.47% | 4.30%4 |
| Expense waiver/reimbursement5 | 0.93% | 0.75% | 0.56% | 1.55% | 6.45%4 |
| Supplemental Data: | | | | | |
| Net assets, end of period (000 omitted) | $36,019 | $25,451 | $46,015 | $44,106 | $5,160 |
| Portfolio turnover | 33% | 19% | 290% | 396% | 11% |
| 1 | Reflects operations for the period from October 4, 2005 (date of initial investment) to December 31, 2005. |
| 2 | Based on net asset value, which does not reflect the sales charge, redemption fee or contingent deferred sales charge, if applicable. Total returns for periods of less than one year are not annualized. |
| 3 | During the year ended December 31, 2008, the Fund was reimbursed by the Adviser, which had an impact of less than 0.01% on the total return. |
| 4 | Computed on an annualized basis. |
| 5 | This expense decrease is reflected in both the net expense and the net investment income ratios shown above. |
Annual Shareholder Report1
Shareholder Expense Example (unaudited)
As a shareholder of the Fund, you incur ongoing costs, including to the extent applicable, management fees, distribution (12b-1) fees and/or shareholder services fees and other Fund expenses. This Example is intended to help you to understand your ongoing costs (in dollars) of investing in the Fund and to compare these costs with the ongoing costs of investing in other mutual funds. It is based on an investment of $1,000 invested at the beginning of the period and held for the entire period from July 1, 2009 to December 31, 2009.
ACTUAL EXPENSES
The first section of the table below provides information about actual account values and actual expenses. You may use the information in this section, together with the amount you invested, to estimate the expenses that you incurred over the period. Simply divide your account value by $1,000 (for example, an $8,600 account value divided by $1,000 = 8.6), then multiply the result by the number in the first section under the heading entitled “Expenses Paid During Period” to estimate the expenses attributable to your investment during this period.
HYPOTHETICAL EXAMPLE FOR COMPARISON PURPOSES
The second section of the table below provides information about hypothetical account values and hypothetical expenses based on the Fund's actual expense ratio and an assumed rate of return of 5% per year before expenses, which is not the Fund's actual return. Thus, you should not use the hypothetical account values and expenses to estimate the actual ending account balance or your expenses for the period. Rather, these figures are required to be provided to enable you to compare the ongoing costs of investing in the Fund with other funds. To do so, compare this 5% hypothetical example with the 5% hypothetical examples that appear in the shareholder reports of the other funds.
Please note that the expenses shown in the table are meant to highlight your ongoing costs only. Therefore, the second section of the table is useful in comparing ongoing costs only, and will not help you determine the relative total costs of owning different funds.
| Beginning
Account Value
7/1/2009 | Ending
Account Value
12/31/2009 | Expenses Paid
During Period1 |
| Actual | $1,000 | $1,316.00 | $0.29 |
| Hypothetical (assuming a 5% returnbefore expenses) | $1,000 | $1,024.95 | $0.26 |
| 1 | Expenses are equal to the Fund's annualized net expense ratio of 0.05%, multiplied by the average account value over the period, multiplied by 184/365 (to reflect the one-half-year period). |
Annual Shareholder Report2
Performance data quoted represents past performance which is no guarantee of future results. Investment return and principal value will fluctuate so that an investor's shares, when redeemed, may be worth more or less than their original cost.
Management's Discussion of Fund Performance (unaudited)
FUND PERFORMANCE AND SUMMARY
The Fund's total return, based on net asset value, for the 12-month reporting period ended December 31, 2009, was 41.47%. By comparison, the Standard & Poor's 500 Index1 (S&P 500) returned 26.46% for the same period. The Fund's total return for the most recently completed period reflected actual cash flows, transaction costs and other expenses which were not reflected in the total return of the S&P 500.
The Fund's overall investment strategy focused on the combination of a short duration bond portfolio and S&P 500-based equity derivatives to transform the bond portfolio into a synthetic equity portfolio. The Fund's equity derivatives strategy is to replicate or exceed the price performance of the S&P 500.
The Fund's bond investment strategy focused on: (a) the allocation of the portfolio among various sectors of the bond market; (b) the credit ratings of portfolio securities (which indicates the risk that securities will default); (c) the overall interest sensitivity of the portfolio, as measured by the effective duration of the portfolio; (d) the management of the equity hedge; (e) the structure risk of asset-backed and mortgage-backed securities; and, (f) the selection of individual bond securities.
These were the most significant factors affecting the Fund's performance during the 12-month reporting period.
MARKET OVERVIEW
After falling precipitously in 2008, equities had a very good year in 2009. It was also a great year in the bond market for spread investors, particularly for high-yield and emerging market bond investors. The Barclays Capital U.S. Corporate High Yield Index2 produced a remarkable total return of 58.21%, while the Barclays Capital Emerging Markets Index3 returned 34.23% for 2009. Treasury interest rates finished the year unchanged up 200 basis points, more at the longer maturities. The three-month LIBOR (London InterBank Offered Rate)4 finished 2009 at 0.25%.
Positioning and strategy
The Fund's strategy attempts to exceed the return of the S&P 500: (1) when interest rates are falling; and (2) when bond spread product is narrowing.
We experienced a modest rise in interest rates toward the end of 2009. Fears of an imminent tightening in monetary policy were misplaced as the Federal Reserve remained on hold awaiting an improvement in jobs and a solid recovery. Treasury note futures were used to shorten the interest rate sensitivity of the portfolio to near three-month LIBOR, approximately the funding cost of the equity derivatives.
Spread product had a stellar year in 2009, despite a rough start in the first quarter. With the Federal Government hovering over the banking industry, the trust preferred positions in major banks improved in 2009.
| 1 | The S&P 500 is an unmanaged, capitalization-weighted index of 500 stocks designed to measure performance of the broad domestic economy through changes in the aggregate market value of 500 stocks representing all major industries. The index is unmanaged and it is not possible to invest directly in an index. |
| 2 | Barclays Capital U.S. Corporate High Yield Index covers the universe of fixed rate, publicly issued, noninvestment-grade debt registered with the SEC. All bonds included in the High Yield Index must be dollar-denominated and nonconvertible and have at least one year remaining to maturity and an outstanding par value of at least $100 million. Generally, securities must be rated Ba1 or lower by Moody's Investors Service, including defaulted issues. If no Moody's rating is available, bonds must be rated BB+ or lower by S&P; and if no S&P rating is available, bonds must be rated below investment grade by Fitch Investor's Service. A small number of unrated bonds is included in the index; to be eligible they must have previously held a high-yield rating or have been associated with a high-yield issuer, and must trade accordingly. |
| 3 | Barclays Capital Emerging Markets Index tracks total returns for U.S. dollar-denominated debt instruments issued by sovereign and corporate credits in emerging economies from the following regions: Americas, Europe, Middle East and Asia. Countries covered include among others: Argentina, Brazil, Bulgaria, Ecuador, Mexico, Panama, Peru, the Philippines, Russia and Venezuela. The JPMXUS and BCMBI are not adjusted to reflect sales charges, expenses or other fees that the Securities and Exchange Commission (SEC) requires to be reflected in the Fund's performance. Indexes are unmanaged, and it is not possible to invest directly in an index. |
| 4 | LIBOR (London InterBank Offered Rate) is the rate banks charge each other on short-term money. The average periodic rate on three-month LIBOR is calculated as the average of all daily nine-month LIBOR settings during the period under review, adjusted for the length of the period. Note that this figure does not represent actual return on an investment made in an instrument having a rate equal to three-month LIBOR on the initial day of the period under review and reinvested at the end of three months (again at a rate equal to the then-prevailing three-month LIBOR rate) for a further three-month period. |
Annual Shareholder Report3
BOND PORTFOLIO DURATION5
Duration positioning had a positive effect on Fund performance last year.
SECTOR ALLOCATION AND CREDIT QUALITY6
The Fund's sector positioning and quality stance helped portfolio performance significantly throughout 2009. The High Yield Core Fund and the Federated Emerging Markets Core Fund were aggressively added to the portfolio as spreads were wide in the first quarter. The Fund's bank-trust-preferred securities took a beating in 2008 but recovered nicely in 2009. Mortgage-backed securities, agency-backed and whole-loan Collateralized Mortgage Obligations (CMOs) and Asset-Backed Securities (ABS) in the portfolio also recovered in 2009, but not to the same extent as the high-yield and emerging markets sectors recovered. These were the areas where the sector call helped performance significantly. The portfolio's average quality stood at AA-/A1 at year-end compared to AA+/Aa1 at prior year-end.
SECURITY SELECTION and hedge management
The equity hedge added significantly to portfolio performance, particularly on the futures side of the hedge. We were successful at executing the equity total return swap during the year and were able to pick up sub-LIBOR funding. S&P 500 futures contracts performed particularly well, as declining dividends in cash-settled equities dramatically improved the attractiveness of equity futures.
Overall, bond security selection detracted significantly from portfolio performance. Security selection was poor in non-agency floating rate CMOs and ABS. Security selection in the emerging markets sector was also lacking. In the corporate area, Capmark Financial and CIT Group were significant drags on performance as these finance companies were hit hard in the financial crisis of 2008. There were some positives: the positions in Telecom Italia and American Express Credit performed well in 2009. In the trust-preferred area, Zurich Financial and State Street Bank and Trust Company were significant positives while Wells Fargo/Wachovia and Bank of America/Nationsbank were drags.
| 5 | Duration is a measure of a security's price sensitivity to change in interest rates. Securities with longer durations are more sensitive to change in interest rates than securities of shorter durations. |
| 6 | Credit ratings pertain only to the securities in the portfolio and do not protect fund shares against market risks. |
Annual Shareholder Report4
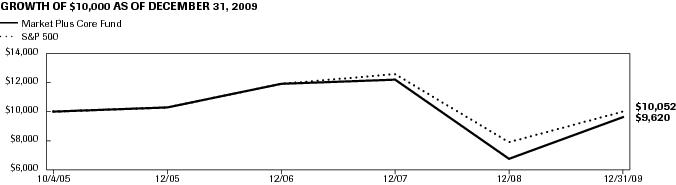
GROWTH OF A $10,000 INVESTMENT
The graph below illustrates the hypothetical investment of $10,0001 in Market Plus Core Fund (the “Fund”) from October 4, 2005 (start of performance) to December 31, 2009, compared to the S&P 500 Index (S&P 500).2
| Average Annual Total Returns for the Period Ended 12/31/2009 | |
| 1 Year | 41.47% |
| Start of Performance (10/4/2005) | -0.91% |
Performance data quoted represents past performance which is no guarantee of future results. Investment return and principal value will fluctuate so that an investor's shares, when redeemed, may be worth more or less than their original cost. Mutual fund performance changes over time and current performance may be lower or higher than what is stated. For current to the most recent month-end performance and after-tax returns, call 1-800-341-7400. Returns shown do not reflect the deduction of taxes that a shareholder would pay on Fund distributions or the redemption of Fund shares. Mutual funds are not obligations of or guaranteed by any bank and are not federally insured.
| 1 | Represents a hypothetical investment of $10,000 in the Fund. The Fund's performance assumes the reinvestment of all dividends and distributions. The S&P 500 has been adjusted to reflect reinvestment of dividends on securities in the index. |
| 2 | The S&P 500 is not adjusted to reflect sales charges, expenses or other fees that the Securities and Exchange Commission requires to be reflected in the Fund's performance. The index is unmanaged and, unlike the Fund, is not affected by cash flows. It is not possible to invest directly in an index. |
Annual Shareholder Report5
Portfolio of Investments Summary Table (unaudited)
At December 31, 2009, the Fund's portfolio composition1 was as follows:
| Security Type | Percentage of
Total Net Assets2 |
| Corporate Debt Securities | 42.2% |
| Mortgage-Backed Securities3 | 18.1% |
| U.S. Treasury and Agency Securities4 | 11.1% |
| Asset-Backed Securities | 3.5% |
| Other Securities5 | 0.1% |
| Derivative Contracts6 | 1.3% |
| Cash Equivalents7 | 23.3% |
| Other Assets and Liabilities — Net8 | 0.4% |
| TOTAL | 100.0% |
| 1 | See the Fund's Confidential Private Offering Memorandum for a description of these security types. |
| 2 | As of the date specified above, the Fund owned shares of one or more affiliated investment companies. For purposes of this table, the affiliated investment company (other than an affiliated money market mutual fund) is not treated as a single portfolio security, but rather the Fund is treated as owning a pro rata portion of each security and each other asset and liability owned by the affiliated investment company. Accordingly, the percentages of total net assets shown in the table will differ from those presented on the Portfolio of Investments. |
| 3 | For purposes of this table, Mortgage-Backed Securities include mortgage-backed securities guaranteed by Government Sponsored Entities (GSEs) and adjustable rate mortgage-backed securities. |
| 4 | For purposes of this table, U.S. Treasury and Agency Securities do not include mortgage-backed securities guaranteed by GSEs. |
| 5 | Other Securities include common stocks, preferred stocks and warrants. |
| 6 | Based upon net unrealized appreciation (depreciation) or value of the derivative contracts as applicable. Derivative contracts may consist of futures, forwards, options and swaps. The impact of a derivative contract on the Fund's performance may be larger than its unrealized appreciation (depreciation) or value may indicate. In many cases, the notional value or amount of a derivative contract may provide a better indication of the contract's significance to the portfolio. More complete information regarding the Fund's direct investments in derivative contracts, including unrealized appreciation (depreciation), value and notional values or amounts of such contracts, can be found in the table at the end of the Portfolio of Investments included in this report. |
| 7 | Cash Equivalents include any investments in money market mutual funds and/or overnight repurchase agreements. |
| 8 | Assets, other than investments in securities and derivative contracts, less liabilities. See Statement of Assets and Liabilities. |
Annual Shareholder Report6
Portfolio of Investments
December 31, 2009
Principal
Amount
or Shares | | | Value |
| | Adjustable Rate Mortgages – 15.3% | |
| | Federal Home Loan Mortgage Corporation – 12.5% | |
| 1,712,301 | | Federal Home Loan Mortgage Corp., 3.759%, 6/1/2036 | 1,776,995 |
| 2,600,881 | | Federal Home Loan Mortgage Corp., 5.443%, 12/1/2035 | 2,711,988 |
| | TOTAL | 4,488,983 |
| | Federal National Mortgage Association – 2.8% | |
| 209,778 | | Federal National Mortgage Association, 2.500%, 5/1/2033 | 213,713 |
| 10,802 | | Federal National Mortgage Association, 3.130%, 6/1/2035 | 11,169 |
| 17,733 | | Federal National Mortgage Association, 3.810%, 4/1/2035 | 18,435 |
| 696,423 | | Federal National Mortgage Association, 3.810%, 4/1/2036 | 720,951 |
| 50,815 | | Federal National Mortgage Association, 4.020%, 5/1/2036 | 52,888 |
| | TOTAL | 1,017,156 |
| | TOTAL ADJUSTABLE RATE MORTGAGES
(IDENTIFIED COST $5,300,577) | 5,506,139 |
| | Asset-Backed Securities – 3.5% | |
| | Auto Receivables – 1.6% | |
| 149,161 | | Carmax Auto Owner Trust 2007-3, Series 2007-3, 0.633%, 12/15/2011 | 149,254 |
| 433,990 | 1,2 | Huntington Auto Trust 2008-1, Series 2008-1, 1.733%, 04/16/2012 | 437,824 |
| | TOTAL | 587,078 |
| | Home Equity Loan – 0.8% | |
| 11,658 | | Asset Backed Funding Certificate 2005-OPT1 A1MZ, 0.581%, 7/25/2035 | 9,911 |
| 46,495 | | GSAA Home Equity Trust 2005-15 1A2, 0.611%, 1/25/2036 | 12,616 |
| 75,000 | | GSAA Home Equity Trust 2005MTR1 A3, 0.541%, 10/25/2035 | 24,581 |
| 39,277 | | GSAMP Trust 2005-SEA2 A1, 0.581%, 1/25/2045 | 26,408 |
| 280,000 | | Morgan Stanley ABS Capital I 2004-OP1 M3, 0.911%,11/25/2034 | 173,589 |
| 68,742 | | Option One Mortgage Loan Trust 2005-1 A1B, 0.561%, 2/25/2035 | 45,368 |
| | TOTAL | 292,473 |
| | Non-Agency Mortgage – 1.1% | |
| 390,464 | | Countrywide Alternative Loan Trust 2007-OA9, Series 2007-OA9, 0.581%, 06/25/2047 | 89,711 |
| 401,447 | | Harborview Mortgage Loan Trust 2007-1, Series 2007-1, 0.363%, 04/19/2038 | 212,528 |
| 28,769 | | Harborview Mortgage Loan Trust 2006-1 2A1A, 0.473%, 3/19/2036 | 15,335 |
| 433,627 | 1,2 | KLIO Funding Ltd. 2004-1A A1, 0.828%, 4/23/2039 | 13,082 |
| 44,815 | | Washington Mutual 2003-S4 1A3, 0.731%, 6/25/2018 | 40,536 |
| 18,838 | | Washington Mutual 2005-AR17 A-1A1, 0.501%, 12/25/2045 | 13,662 |
| | TOTAL | 384,854 |
| | TOTAL ASSET-BACKED SECURITIES
(IDENTIFIED COST $2,403,449) | 1,264,405 |
| | Collateralized Mortgage Obligations – 2.8% | |
| | Federal Home Loan Mortgage Corporation – 0.3% | |
| 66,896 | | Federal Home Loan Mortgage Corp. REMIC 2395 FA, 0.833%, 6/15/2029 | 67,197 |
| 48,695 | | Federal Home Loan Mortgage Corp. REMIC 2395 FT, 0.683%, 12/15/2031 | 48,389 |
| | TOTAL | 115,586 |
| | Federal National Mortgage Association – 0.5% | |
| 53,419 | | Federal National Mortgage Association REMIC 0287A FB, 0.741%, 10/25/2031 | 53,608 |
| 97,123 | | Federal National Mortgage Association REMIC 1993-179 FJ, 1.400%, 10/25/2023 | 99,219 |
| 28,230 | | Federal National Mortgage Association REMIC 1993-247 FM, 2.459%, 12/25/2023 | 28,252 |
| | TOTAL | 181,079 |
Annual Shareholder Report7
Principal
Amount
or Shares | | | Value |
| | Non-Agency Mortgage – 2.0% | |
| 238,304 | | Citigroup Mortgage Loan Trust 2004-UST1 A2, 1.542%, 8/25/2034 | 217,064 |
| 108,172 | | Washington Mutual 2002-AR6 A, 1.944%, 6/25/2042 | 86,368 |
| 231,155 | | Washington Mutual 2006-AR1 2A1B, 1.614%, 1/25/2046 | 90,838 |
| 318,698 | | Washington Mutual 2006-AR15 1A, 1.384%, 11/25/2046 | 177,797 |
| 263,903 | | Washington Mutual 2006-AR17 1A, 1.364%, 12/25/2046 | 119,037 |
| 325,032 | | Washington Mutual Mortgage Pass Through Certificates 2007-OA3 DA1C, 0.551%, 4/25/2047 | 37,466 |
| | TOTAL | 728,570 |
| | TOTAL COLLATERALIZED MORTGAGE OBLIGATIONS
(IDENTIFIED COST $1,779,993) | 1,025,235 |
| | CORPORATE BONDS – 27.0% | |
| | Basic Industry — Chemicals – 2.7% | |
| 950,000 | | Dow Chemical Co., Floating Rate Note — Sr. Note, 2.525%, 08/08/2011 | 967,211 |
| | Communications — Telecom Wireless – 1.6% | |
| 600,000 | | Vodafone Group PLC, Note, 0.536%, 02/27/2012 | 595,688 |
| | Communications — Telecom Wirelines – 2.8% | |
| 300,000 | | Telecom Italia Capital, Note, 0.761%, 02/01/2011 | 299,288 |
| 725,000 | | Telecom Italia Capital SA, Floating Rate Note — Sr. Note, 0.894%, 07/18/2011 | 720,021 |
| | TOTAL | 1,019,309 |
| | Consumer Cyclical — Automotive – 0.7% | |
| 250,000 | 1,2 | American Honda Finance Corp., Floating Rate Note — Sr. Note, Series MTN, 0.397%, 02/21/2012 | 243,347 |
| | Financial Institution — Banking – 13.6% | |
| 900,000 | | Chase Capital II, Company Guarantee, 0.781%, 02/01/2027 | 634,792 |
| 750,000 | | Citigroup, Inc., Floating Rate Note — Sr. Sub Note, 0.527%, 06/09/2016 | 616,054 |
| 500,000 | | Credit Suisse (USA), Inc., Floating Rate Note — Sr. Note, 0.534%, 04/12/2013 | 495,856 |
| 550,000 | | Goldman Sachs Group, Inc., Floating Rate Note, 0.683%, 07/22/2015 | 515,891 |
| 50,000 | | Goldman Sachs Group, Inc., Floating Rate Note, 0.851%, 09/29/2014 | 48,524 |
| 50,000 | | Morgan Stanley Group, Inc., 0.534%, 01/18/2011 | 49,794 |
| 900,000 | | NationsBank Capital Trust III, Bond, 0.834%, 01/15/2027 | 628,465 |
| 1,100,000 | | State Street Capital Trust IV, 1.254%, 06/15/2037 | 743,099 |
| 900,000 | | Wachovia Capital Trust II, Company Guarantee, 0.784%, 01/15/2027 | 562,412 |
| 900,000 | | Wells Fargo Capital II, Company Guarantee, 0.781%, 01/30/2027 | 597,995 |
| | TOTAL | 4,892,882 |
| | Financial Institution — Finance Noncaptive – 2.7% | |
| 400,000 | | American Express Credit Corp., Floating Rate Note, 1.631%, 05/27/2010 | 401,508 |
| 500,000 | | General Electric Capital Corp., Floating Rate Note — Sr. Note, Series MTN, 0.753%, 08/15/2036 | 357,407 |
| 250,000 | | HSBC Finance Corp., Floating Rate Note — Sr. Note, 0.686%, 06/01/2016 | 228,185 |
| | TOTAL | 987,100 |
| | Financial Institution — Insurance — P&C – 1.2% | |
| 30,000 | | CNA Financial Corp., 6.500%, 08/15/2016 | 29,528 |
| 500,000 | 1,2 | ZFS Finance USA Trust III, Floating Rate Note, 1.404%, 12/15/2065 | 410,702 |
| | TOTAL | 440,230 |
Annual Shareholder Report8
Principal
Amount
or Shares | | | Value |
| | Technology – 1.7% | |
| 600,000 | | Hewlett-Packard Co., Floating Rate Note — Sr. Note, 0.366%, 03/01/2012 | 599,323 |
| | TOTAL CORPORATE BONDS
(IDENTIFIED COST $11,256,995) | 9,745,090 |
| | U.S. Treasury – 4.2%;3 | |
| 1,500,000 | 4 | U.S.Treasury Bill, 0.20%, 7/1/2010
(INDENTIFIED COST $1,498,754) | 1,498,591 |
| | MUTUAL FUNDS – 46.0%;5 | |
| 140,919 | | Emerging Markets Fixed Income Core Fund | 3,397,441 |
| 782,963 | | High Yield Bond Portfolio | 4,909,181 |
| 8,248,732 | 6 | Prime Value Obligations Fund, Institutional Shares, 0.18% | 8,248,732 |
| | TOTAL MUTUAL FUNDS
(IDENTIFIED COST $15,513,594) | 16,555,354 |
| | TOTAL INVESTMENTS — 98.8%
(IDENTIFIED COST $37,753,362)7 | 35,594,814 |
| | OTHER ASSETS AND LIABILITIES - NET — 1.2%8 | 424,018 |
| | TOTAL NET ASSETS — 100% | $36,018,832 |
At December 31, 2009, the Fund had the following outstanding futures contracts:
| Description | Number of
Contracts | Notional Value | Expiration Date | Unrealized
Appreciation |
| 9S&P 500 Index Long Futures | 9 | $2,499,075 | March 2010 | $23,364 |
| 9United States Treasury Notes 2-Year Short Futures | 40 | $8,650,625 | March 2010 | $41,163 |
| 9United States Treasury Notes 5-Year Short Futures | 5 | $571,914 | March 2010 | $9,130 |
| UNREALIZED APPRECIATION ON FUTURES CONTRACTS | $73,657 |
At December 31, 2009, the Fund had the following open swap contract:
Total Return
Swap
Counterparty | J.P. Morgan
Chase & Co. |
| Reference Entity | S&P 500 Total Return |
| Buy/Sell | Buy |
| Pay/Receive Fixed Rate | 2.81% |
| Expiration Date | 9/9/2010 |
| Notional Amount | $32,727,938 |
| Unrealized Appreciation | $388,464 |
Unrealized Appreciation on Futures Contracts and Swap Contract is included in “Other Assets and Liabilities — Net.”
| 1 | Denotes a restricted security that either: (a) cannot be offered for public sale without first being registered, or being able to take advantage of an exemption from registration, under the Securities Act of 1933; or (b) is subject to a contractual restriction on public sales. At December 31, 2009, these restricted securities amounted to $1,104,955, which represented 3.1% of total net assets. |
| 2 | Denotes a restricted security that may be resold without restriction to “qualified institutional buyers” as defined in Rule 144A under the Securities Act of 1933 and that the Fund has determined to be liquid under criteria established by the Fund's Board of Directors (the “Directors”). At December 31, 2009, these liquid restricted securities amounted to $1,104,955, which represented 3.1% of total net assets. |
| 3 | Discount rate at time of purchase. |
| 4 | Pledged as collateral to ensure the Fund is able to satisfy the obligations of its outstanding futures contracts. |
| 5 | Affiliated companies. |
| 6 | 7-Day net yield. |
| 7 | Also represents cost for federal tax purposes. |
| 8 | Assets, other than investments in securities, less liabilities. See Statement of Assets and Liabilities. |
| 9 | Non-income producing security. |
Note: The categories of investments are shown as a percentage of total net assets at December 31, 2009.
Annual Shareholder Report9
Various inputs are used in determining the value of the Fund's investments. These inputs are summarized in the three broad levels listed below:
Level 1 — quoted prices in active markets for identical securities
Level 2 — other significant observable inputs (including quoted prices for similar securities, interest rates, prepayment speeds, credit risk, etc.)
Level 3 — significant unobservable inputs (including the Fund's own assumptions in determining the fair value of investments)
The inputs or methodology used for valuing securities are not an indication of the risk associated with investing in those securities.
The following is a summary of the inputs used, as of December 31, 2009, in valuing the Fund's assets carried at fair value:
| Valuation Inputs |
| Level 1 -
Quoted
Prices and
Investments in
Mutual Funds* | Level 2 -
Other
Significant
Observable
Inputs | Level 3 -
Significant
Unobservable
Inputs | Total |
| Debt Securities: | | | | |
| Adjustable Rate Mortgages | $ — | $5,506,139 | $ — | $5,506,139 |
| Asset-Backed Securities | — | 1,264,405 | — | 1,264,405 |
| Collateralized Mortgage Obligations | — | 1,025,235 | — | 1,025,235 |
| Corporate Bonds | — | 9,745,090 | — | 9,745,090 |
| U.S. Treasury | — | 1,498,591 | — | 1,498,591 |
| Mutual Funds | 16,555,354 | — | — | 16,555,354 |
| TOTAL SECURITIES | $16,555,354 | $19,039,460 | $ — | $35,594,814 |
| OTHER FINANCIAL INSTRUMENTS** | $73,657 | $388,464 | $ — | $462,121 |
| * | Emerging Markets Fixed Income Core Fund (EMCORE) is an affiliated limited partnership offered only to registered investment companies and other accredited investors. EMCORE invests primarily in emerging markets fixed-income securities. |
| ** | Other financial instruments include futures contracts and a swap contract. |
The following acronyms are used throughout this portfolio:
MTN — Medium Term Note
REMIC — Real Estate Mortgage Investment Conduit
See Notes which are an integral part of the Financial Statements
Annual Shareholder Report10
Statement of Assets and Liabilities
December 31, 2009
| Assets: | | |
Total investments in securities, at value including $16,555,354 of investments in affiliated issuers (Note 4)
(identified cost $37,753,362) | | $35,594,814 |
| Income receivable | | 96,822 |
| Swaps, at value | | 388,464 |
| TOTAL ASSETS | | 36,080,100 |
| Liabilities: | | |
| Payable for portfolio accounting fees | $11,956 | |
| Payable for auditing fees | 17,969 | |
| Payable for legal fees | 3,086 | |
| Payable for transfer and dividend disbursing agent fees and expenses | 3,281 | |
| Payable for Directors'/Trustees' fees | 1,256 | |
| Payable for fund tax expense | 4,166 | |
| Payable for daily variation margin | 16,705 | |
| Accrued expenses | 2,849 | |
| TOTAL LIABILITIES | | 61,268 |
| Net assets for 3,742,531 shares outstanding | | $36,018,832 |
| Net Assets Consist of: | | |
| Paid-in capital | | $40,744,227 |
| Net unrealized depreciation of investments, futures contracts and swap contracts | | (1,696,427) |
| Accumulated net realized loss on investments, futures contracts, swap contracts and foreign currency transactions | | (9,426,928) |
| Undistributed net investment income | | 6,397,960 |
| TOTAL NET ASSETS | | $36,018,832 |
| Net Asset Value, Offering Price and Redemption Proceeds Per Share: | | |
| $36,018,832 ÷ 3,742,531 shares outstanding, no par value, unlimited shares authorized | | $9.62 |
See Notes which are an integral part of the Financial Statements
Annual Shareholder Report11
Statement of Operations
Year Ended December 31, 2009
| Investment Income: | | | |
| Interest | | | $546,737 |
| Dividends received from affiliated issuers (Note 4) | | | 312,167 |
| Investment income allocated from affiliated partnership (net of foreign taxes withheld of $476) (Note 4) | | | 121,415 |
| TOTAL INCOME AND ALLOCATED EXPENSES | | | 980,319 |
| Expenses: | | | |
| Administrative personnel and services fee (Note 4) | | $150,000 | |
| Custodian fees | | 9,372 | |
| Transfer and dividend disbursing agent fees and expenses | | 13,421 | |
| Directors'/Trustees' fees | | 6,049 | |
| Auditing fees | | 18,000 | |
| Legal fees | | 6,047 | |
| Portfolio accounting fees | | 72,046 | |
| Insurance premiums | | 4,012 | |
| Miscellaneous | | 2,133 | |
| TOTAL EXPENSES | | 281,080 | |
| Waiver and Reimbursement (Note 4): | | | |
| Waiver of administrative personnel and services fee | $(150,000) | | |
| Reimbursement of other operating expenses | (115,708) | | |
| TOTAL WAIVER AND REIMBURSEMENT | | (265,708) | |
| Net expenses | | | 15,372 |
| Net investment income | | | 964,947 |
| Realized and Unrealized Gain (Loss) on Investments, Futures Contracts, Swap Contracts and Foreign Currency Transactions: | | | |
Net realized loss on investments (including realized loss of $(235,959) on sales of investments in an
affiliated issuer (Note 4)) | | | (554,093) |
| Net realized gain on futures contracts | | | 597,187 |
| Net realized gain on swap contracts | | | 7,503,134 |
| Net realized loss on investments and foreign currency transactions allocated from affiliated partnership (Note 4) | | | (12,549) |
| Net change in unrealized depreciation of investments | | | 3,274,916 |
| Net change in unrealized appreciation of futures contracts | | | (64,453) |
| Net change in unrealized appreciation of swap contracts | | | (1,140,661) |
| Net realized and unrealized gain on investments, futures contracts, swap contracts and foreign currency transactions | | | 9,603,481 |
| Change in net assets resulting from operations | | | $10,568,428 |
See Notes which are an integral part of the Financial Statements
Annual Shareholder Report12
Statement of Changes in Net Assets
| Year Ended December 31 | 2009 | 2008 |
| Increase (Decrease) in Net Assets | | |
| Operations: | | |
| Net investment income | $964,947 | $1,850,634 |
| Net realized gain (loss) on investments including allocation from affiliated partnership, futures contracts, swap contracts and foreign currency transactions | 7,533,679 | (19,962,478) |
| Net increase due to reimbursement from Adviser (Note 4) | — | 18,032 |
| Net change in unrealized appreciation/depreciation of investments, futures contracts and swap contracts | 2,069,802 | (2,470,403) |
| CHANGE IN NET ASSETS RESULTING FROM OPERATIONS | 10,568,428 | (20,564,215) |
| Net Assets: | | |
| Beginning of period | 25,450,404 | 46,014,619 |
| End of period (including undistributed net investment income of $6,397,960 and $5,433,013, respectively) | $36,018,832 | $25,450,404 |
See Notes which are an integral part of the Financial Statements
Annual Shareholder Report13
Notes to Financial Statements
December 31, 2009
1. ORGANIZATION
Market Plus Core Fund (the “Fund”) is a diversified portfolio of Federated Core Trust II, L.P. (the “Trust”). The Trust is registered under the Investment Company Act of 1940, as amended (the “Act”). The Trust is a limited partnership that was established under the laws of the state of Delaware on November 13, 2000, and offered only to registered investment companies and other accredited investors. The Trust consists of two portfolios. The financial statements included herein are only those of the Fund. Each portfolio pays its own expenses. The Fund's investment objective is to seek total return over the business cycle (which may be longer or shorter than a 12-month period) in excess of the S&P 500 Index.
2. SIGNIFICANT ACCOUNTING POLICIES
The following is a summary of significant accounting policies consistently followed by the Fund in the preparation of its financial statements. These policies are in conformity with U.S. generally accepted accounting principles (GAAP).
Investment Valuation
In calculating its net asset value (NAV), the Fund generally values investments as follows:
- Fixed-income securities acquired with remaining maturities greater than 60 days are fair valued using price evaluations provided by a pricing service approved by the Directors.
- Fixed-income securities acquired with remaining maturities of 60 days or less are valued at their cost (adjusted for the accretion of any discount or amortization of any premium).
- Shares of other mutual funds are valued based upon their reported NAVs.
- Derivative contracts listed on exchanges are valued at their reported settlement or closing price.
- Over-the-counter (OTC) derivative contracts are fair valued using price evaluations provided by a pricing service approved by the Directors.
- Equity securities listed on an exchange or traded through a regulated market system are valued at their last reported sale price or official closing price in their principal exchange or market.
If the Fund cannot obtain a price or price evaluation from a pricing service for an investment, the Fund may attempt to value the investment based upon the mean of bid and asked quotations or fair value the investment based on price evaluations, from one or more dealers. If any price, quotation, price evaluation or other pricing source is not readily available when the NAV is calculated, the Fund uses the fair value of the investment determined in accordance with the procedures described below. There can be no assurance that the Fund could purchase or sell an investment at the price used to calculate the Fund's NAV.
Fair Valuation and Significant Events Procedures
The Directors have authorized the use of pricing services to provide evaluations of the current fair value of certain investments for purposes of calculating the NAV. Factors considered by pricing services in evaluating an investment include the yields or prices of investments of comparable quality, coupon, maturity, call rights and other potential prepayments, terms and type, reported transactions, indications as to values from dealers and general market conditions. Some pricing services provide a single price evaluation reflecting the bid-side of the market for an investment (a “bid” evaluation). Other pricing services offer both bid evaluations and price evaluations indicative of a price between the prices bid and asked for the investment (a “mid” evaluation). The Fund normally uses bid evaluations for U.S. Treasury and Agency securities, mortgage-backed securities and municipal securities. The Fund normally uses mid evaluations for other types of fixed-income securities and OTC derivative contracts. In the event that market quotations and price evaluations are not available for an investment, the fair value of the investment is determined in accordance with procedures adopted by the Directors.
The Directors also have adopted procedures requiring an investment to be priced at its fair value whenever the Adviser determines that a significant event affecting the value of the investment has occurred between the time as of which the price of the investment would otherwise be determined and the time as of which the NAV is computed. An event is considered significant if there is both an affirmative expectation that the investment's value will change in response to the event and a reasonable basis for quantifying the resulting change in value. Examples of significant events that may occur after the close of the principal market on which a security is traded, or after the time of a price evaluation provided by a pricing service or a dealer, include:
- With respect to securities traded in foreign markets, significant trends in U.S. equity markets or in the trading of foreign securities index futures or options contracts;
- With respect to price evaluations of fixed-income securities determined before the close of regular trading on the NYSE, actions by the Federal Reserve Open Market Committee and other significant trends in U.S. fixed-income markets;
- Political or other developments affecting the economy or markets in which an issuer conducts its operations or its securities are traded; and
- Announcements concerning matters such as acquisitions, recapitalizations, litigation developments, a natural disaster affecting the issuer's operations or regulatory changes or market developments affecting the issuer's industry.
The Directors have approved the use of a pricing service to determine the fair value of equity securities traded principally in foreign markets when the Adviser determines that there has been a significant trend in the U.S. equity markets or in index futures trading. For other significant events, the Fund may seek to obtain more current quotations or price evaluations from alternative pricing sources. If a reliable alternative pricing source is not available, the Fund will determine the fair value of the investment using another method approved by the Directors.
Annual Shareholder Report14
Repurchase AgreementsIt is the policy of the Fund to require the other party to a repurchase agreement to transfer to the Fund's custodian or sub-custodian eligible securities or cash with a market value (after transaction costs) at least equal to the repurchase price to be paid under the repurchase agreement. The eligible securities are transferred to accounts with the custodian or sub-custodian in which the Fund holds a “securities entitlement” and exercises “control” as those terms are defined in the Uniform Commercial Code. The Fund has established procedures for monitoring the market value of the transferred securities and requiring the transfer of additional eligible securities if necessary to equal at least the repurchase price. These procedures also allow the other party to require securities to be transferred from the account to the extent that their market value exceeds the repurchase price or in exchange for other eligible securities of equivalent market value.
With respect to agreements to repurchase U.S. government securities and cash items, the Fund treats the repurchase agreement as an investment in the underlying securities and not as an obligation of the other party to the repurchase agreement. Other repurchase agreements are treated as obligations of the other party secured by the underlying securities. Nevertheless, the insolvency of the other party or other failure to repurchase the securities may delay the disposition of the underlying securities or cause the Fund to receive less than the full repurchase price. Under the terms of the repurchase agreement, any amounts received by the Fund in excess of the repurchase price and related transaction costs must be remitted to the other party.
The Fund may enter into repurchase agreements in which eligible securities are transferred into joint trading accounts maintained by the custodian or sub-custodian for investment companies and other clients advised by the Fund's Adviser and its affiliates. The Fund will participate on a pro rata basis with the other investment companies and clients in its share of the securities transferred under such repurchase agreements and in its share of proceeds from any repurchase or other disposition of such securities.
Investment Income, Expenses and Distributions
Investment transactions are accounted for on a trade-date basis. Realized gains and losses from investment transactions are recorded on an identified-cost basis. Interest income and expenses are accrued daily. Dividend income is recorded on the ex-dividend date. Foreign dividends are recorded on the ex-dividend date or when the Fund is informed of the ex-dividend date. Positive or negative inflation adjustments on Treasury Inflation-Protected Securities are included in interest income. All net income earned and gain/loss (realized and unrealized) will be allocated daily to the shareholders based on their capital contributions to the Fund. The Fund does not currently intend to declare and pay distributions.
Premium and Discount Amortization/Paydown Gains and Losses
All premiums and discounts on fixed-income securities, other than mortgage-backed securities, are amortized/accreted for financial statement purposes. Gains and losses realized on principal payment of mortgage-backed securities (paydown gains and losses) are classified as part of investment income.
Federal Taxes
As a partnership, the Fund is not subject to U.S. federal income tax. Instead, each investor reports separately on its own federal tax return its allocated portion of the Fund's income, gains, losses, deductions and credits. As of and during the year ended December 31, 2009, the Fund did not have a liability for any uncertain tax positions. The Fund recognizes interest and penalties, if any, related to tax liabilities as income tax expense in the Statement of Operations. As of December 31, 2009, tax years 2006 through 2009 remain subject to examination by the Fund's major tax jurisdictions, which include the United States of America and the state of Delaware.
When-Issued and Delayed Delivery Transactions
The Fund may engage in when-issued or delayed delivery transactions. The Fund records when-issued securities on the trade date and maintains security positions such that sufficient liquid assets will be available to make payment for the securities purchased. Securities purchased on a when-issued or delayed delivery basis are marked to market daily and begin earning interest on the settlement date. Losses may occur on these transactions due to changes in market conditions or the failure of counterparties to perform under the contract.
Swap Contracts
Swap contracts involve two parties that agree to exchange the returns (or the differential in rates of return) earned or realized on particular predetermined investments, instruments, indices or other measures. The gross returns to be exchanged or “swapped” between parties are generally calculated with respect to a “notional amount” for a predetermined period of time. The Fund may enter into interest rate, total return, credit default, currency and other swap agreements. Risks may arise upon entering into swap agreements from the potential inability of the counterparties to meet the terms of their contract from unanticipated changes in the value of the swap agreement.
The Fund may enter into total return swaps to establish and maintain continual economic exposure to changes in the value of the reference index. Total return swap agreements involve the commitment to pay or receive an amount generally determined by reference to an interest rate in exchange for a specific market-linked return, based on notional amounts. To the extent that the total return of the security or index underlying the transactions exceeds or falls short of the offsetting interest rate-based obligation, the Fund receives or makes a payment to the counterparty.
The Fund's maximum risk of loss from counterparty credit risk is the discounted value of the net cash flows to be received from/paid to the counterparty over the contract's remaining life, to the extent the amount is positive. This risk is mitigated by having a master netting arrangement between the Fund and the counterparty and by the posting of collateral by the counterparty to the Fund to cover the Fund's exposure to the counterparty.
Upfront payments received or paid by the Fund will be reflected as an asset or liability on the Statement of Assets and Liabilities. Changes in the value of swap contracts are included in Swaps, at value on the Statement of Assets and Liabilities, and periodic payments are reported as Net realized gain/loss on swap contracts in the Statement of Operations.
Swap contracts outstanding at period end are listed after the Fund's Portfolio of Investments.
Annual Shareholder Report15
Futures ContractsThe Fund purchases and sells financial futures contracts to manage cash flows, enhance yield and to establish and maintain continual economic exposure to the changes in the value of the S&P 500 Index and to potentially reduce transaction costs. Upon entering into a financial futures contract with a broker, the Fund is required to deposit in a segregated account a specified amount of cash or U.S. government securities. Futures contracts are valued daily and unrealized gains or losses are recorded in a “variation margin” account. Daily, the Fund receives from or pays to the broker a specified amount of cash based upon changes in the variation margin account. When a contract is closed, the Fund recognizes a realized gain or loss. Futures contracts have market risks, including the risk that the change in the value of the contract may not correlate with the changes in the value of the underlying securities. There is minimal counterparty risk to the Fund since futures are exchange traded and the exchange's clearinghouse, as counterparty to all exchange traded futures, guarantees the futures against default.
Futures contracts outstanding at period end are listed after the Fund's Portfolio of Investments.
Foreign Currency Translation
The accounting records of the Fund are maintained in U.S. dollars. All assets and liabilities denominated in foreign currencies (FCs) are translated into U.S. dollars based on the rates of exchange of such currencies against U.S. dollars on the date of valuation. Purchases and sales of securities, income and expenses are translated at the rate of exchange quoted on the respective date that such transactions are recorded. The Fund does not isolate that portion of the results of operations resulting from changes in foreign exchange rates on investments from the fluctuations arising from changes in market prices of securities held. Such fluctuations are included with the net realized and unrealized gain or loss from investments.
Reported net realized foreign exchange gains or losses arise from sales of portfolio securities, sales and maturities of short-term securities, sales of FCs, currency gains or losses realized between the trade and settlement dates on securities transactions, the difference between the amounts of dividends, interest and foreign withholding taxes recorded on the Fund's books and the U.S. dollar equivalent of the amounts actually received or paid. Net unrealized foreign exchange gains and losses arise from changes in the value of assets and liabilities other than investments in securities at fiscal year end, resulting from changes in the exchange rate.
Restricted Securities
The Fund may purchase securities which are considered restricted. Restricted securities are securities that either: (a) cannot be offered for public sale without first being registered, or being able to take advantage of an exemption from registration, under the Securities Act of 1933; or (b) are subject to contractual restrictions on public sales. In some cases, when a security cannot be offered for public sale without first being registered, the issuer of the restricted security has agreed to register such securities for resale, at the issuer's expense, either upon demand by the Fund or in connection with another registered offering of the securities. Many such restricted securities may be resold in the secondary market in transactions exempt from registration. Restricted securities may be determined to be liquid under criteria established by the Directors. The Fund will not incur any registration costs upon such resales. The Fund's restricted securities are valued at the price provided by dealers in the secondary market or, if no market prices are available, at the fair value as determined in accordance with procedures established by and under the general supervision of the Directors.
Additional Disclosure Related to Derivative Instruments
| Fair Value of Derivative Instruments |
| Asset | Liability |
| Statement of
Assets and
Liabilities
Location | Fair
Value | Statement of
Assets and
Liabilities
Location | Fair
Value |
| Derivatives not accounted for as hedging instruments under ASC Topic 815 | | | | |
| Equity contracts | Swaps, at value | $388,464 | Payable for daily variation margin | $(23,364)* |
| Interest rate contracts | — | — | Payable for daily variation margin | (50,293)* |
| Total derivatives not accounted for as hedging instruments under ASC Topic 815 | | $388,464 | | $(73,657) |
| * | Includes cumulative appreciation/depreciation of futures contracts as reported in the footnotes to the Portfolio of Investments. Only the current day's variation margin is reported within the Statement of Assets and Liabilities. |
Annual Shareholder Report16
The Effect of Derivative Instruments on the Statement of Operations for the Year Ended December 31, 2009
| Amount of Realized Gain or (Loss) on Derivatives Recognized in Income |
| Total Return
Swaps | Futures | Total |
| Equity contracts | $7,503,134 | $599,264 | $8,102,398 |
| Interest rate contracts | — | (2,077) | (2,077) |
| Total | $7,503,134 | $597,187 | $8,100,321 |
| Change in Unrealized Appreciation or (Depreciation) on Derivatives Recognized in Income |
| Total Return
Swaps | Futures | Total |
| Equity contracts | $(1,140,661) | $(114,746) | $(1,255,407) |
| Interest rate contracts | — | 50,293 | 50,293 |
| Total | $(1,140,661) | $(64,453) | $(1,205,114) |
Other
The preparation of financial statements in conformity with GAAP requires management to make estimates and assumptions that affect the amounts of assets, liabilities, expenses and revenues reported in the financial statements. Actual results could differ from those estimated.
3. FEDERAL TAX INFORMATION
At December 31, 2009, the cost of investments for federal tax purposes was $37,753,362. The net unrealized depreciation of investments for federal tax purposes excluding any unrealized appreciation resulting from futures contracts and swap contracts was $2,158,548. This consists of net unrealized appreciation from investments for those securities having an excess of value over cost of $1,386,933 and net unrealized depreciation from investments for those securities having an excess of cost over value of $3,545,481.
4. INVESTMENT ADVISER FEE AND OTHER TRANSACTIONS WITH AFFILIATES
Investment Adviser Fee
Federated Investment Counseling is the Fund's investment adviser (the “Adviser”), subject to the oversight of the Directors. The Adviser provides investment adviser services at no fee, because all investors in the Fund are other Federated funds, insurance company separate accounts, common or commingled trust funds or similar organizations or entities that are “accredited investors” within the meaning of Regulation D of the 1933 Act. The Adviser may voluntarily choose to reimburse certain operating expenses of the Fund. The Adviser can modify or terminate this voluntary reimbursement at any time at its sole discretion. For the year ended December 31, 2009, the Adviser voluntarily reimbursed $115,708 of other operating expenses.
Administrative Fee
Federated Administrative Services, Inc. (FASI), under the Administrative Services Agreement, provides the Fund with administrative personnel and services. The fee paid to FASI is based on the average aggregate daily net assets of certain Federated funds as specified below:
| Administrative Fee | Average Aggregate Daily Net Assets
of the Trust |
| 0.150% | on the first $5 billion |
| 0.125% | on the next $5 billion |
| 0.100% | on the next $10 billion |
| 0.075% | on assets in excess of $20 billion |
The administrative fee received during any fiscal year shall be at least $150,000 per portfolio. FASI may voluntarily choose to waive any portion of its fee. FASI can modify or terminate this voluntary waiver at any time at its sole discretion. For the year ended December 31, 2009, FASI waived its entire fee of $150,000.
General
Certain Officers and Directors of the Fund are Officers and Directors or Trustees of the above companies.
Other
For the year ended December 31, 2008, the Fund's Adviser made a contribution to the Fund of $18,032 for losses on an inadvertent security trade.
Annual Shareholder Report17
Transactions with Affiliated CompaniesAffiliated holdings are mutual funds which are managed by the Adviser or an affiliate of the Adviser. Transactions with the affiliated companies during the year ended December 31, 2009, were as follows:
| Affiliates | Balance of
Shares Held
12/31/2008 | Purchases/
Additions | Sales/
Reductions | Balance of
Shares Held
12/31/2009 | Value | Dividend
Income/
Allocated
Investment
Income |
| Emerging Markets Fixed Income Core Fund | — | 140,919 | — | 140,919 | $3,397,441 | $121,415 |
| High Yield Bond Portfolio | 490,129 | 787,772 | 494,938 | 782,963 | 4,909,181 | 294,638 |
| Prime Value Obligations Fund, Institutional Shares | 713,117 | 32,022,021 | 24,486,406 | 8,248,732 | 8,248,732 | 17,529 |
| TOTAL OF AFFILIATED TRANSACTIONS | 1,203,246 | 32,950,712 | 24,981,344 | 9,172,614 | $16,555,354 | $433,582 |
5. Investment TRANSACTIONS
Purchases and sales of investments, excluding long-term U.S. government securities and short-term obligations, for the year ended December 31, 2009, were as follows:
| Purchases | $12,111,968 |
| Sales | $5,288,604 |
6. LINE OF CREDIT
The Fund participates in a $100,000,000 unsecured, uncommitted revolving line of credit (LOC) agreement with PNC Bank. The LOC was made available for extraordinary or emergency purposes, primarily for financing redemption payments. Borrowings are charged interest at a rate offered to the Fund by PNC Bank at the time of the borrowing. As of December 31, 2009, there were no outstanding loans. During the year ended December 31, 2009, the Fund did not utilize the LOC.
7. INTERFUND LENDING
Pursuant to an Exemptive Order issued by the Securities and Exchange Commission (SEC), the Fund, along with other funds advised by subsidiaries of Federated Investors, Inc., may participate in an interfund lending program. This program provides an alternative credit facility allowing the Fund to borrow from other participating affiliated funds. As of December 31, 2009, there were no outstanding loans. During the year ended December 31, 2009, the program was not utilized.
8. Legal Proceedings
Since October 2003, Federated Investors, Inc. and related entities (collectively, “Federated”), and various Federated funds (Federated Funds) have been named as defendants in several class action lawsuits now pending in the United States District Court for the District of Maryland. The lawsuits were purportedly filed on behalf of people who purchased, owned and/or redeemed shares of Federated-sponsored mutual funds during specified periods beginning November 1, 1998. The suits are generally similar in alleging that Federated engaged in illegal and improper trading practices including market timing and late trading in concert with certain institutional traders, which allegedly caused financial injury to the mutual fund shareholders. These lawsuits began to be filed shortly after Federated's first public announcement that it had received requests for information on shareholder trading activities in the Federated Funds from the SEC, the Office of the New York State Attorney General (NYAG) and other authorities. In that regard, on November 28, 2005, Federated announced that it had reached final settlements with the SEC and the NYAG with respect to those matters. As Federated previously reported in 2004, it has already paid approximately $8.0 million to certain funds as determined by an independent consultant. As part of these settlements, Federated agreed to pay for the benefit of fund shareholders additional disgorgement and a civil money penalty in the aggregate amount of an additional $72 million. Federated entities have also been named as defendants in several additional lawsuits that are now pending in the United States District Court for the Western District of Pennsylvania, alleging, among other things, excessive advisory and Rule 12b-1 fees. The Board of the Federated Funds retained the law firm of Dickstein Shapiro LLP to represent the Federated Funds in these lawsuits. Federated and the Federated Funds, and their respective counsel, have been defending this litigation, and none of the Federated Funds remains a defendant in any of the lawsuits (though some could potentially receive any recoveries as nominal defendants). Additional lawsuits based upon similar allegations may be filed in the future. The potential impact of these lawsuits, all of which seek unquantified damages, attorneys' fees and expenses, and future potential similar suits is uncertain. Although we do not believe that these lawsuits will have a material adverse effect on the Federated Funds, there can be no assurance that these suits, the ongoing adverse publicity and/or other developments resulting from the regulatory investigations will not result in increased Federated Fund redemptions, reduced sales of Federated Fund shares or other adverse consequences for the Federated Funds.
9. Subsequent events
Management has evaluated subsequent events through February 22, 2010, the date the financial statements were issued, and determined that no events have occurred that require additional disclosure.
Annual Shareholder Report18
Report of Independent Registered Public Accounting Firm
TO THE BOARD OF Trustees of Federated Core Trust II, L.P. AND SHAREHOLDERS OF Market Plus Core Fund:
We have audited the accompanying statement of assets and liabilities of Market Plus Core Fund (the “Fund”) (one of the portfolios constituting Federated Core Trust II, L.P.), including the portfolio of investments, as of December 31, 2009, and the related statement of operations for the year then ended, the statement of changes in net assets for each of the two years in the period then ended, and the financial highlights for each of the periods indicated therein. These financial statements and financial highlights are the responsibility of the Fund's management. Our responsibility is to express an opinion on these financial statements and financial highlights based on our audits.
We conducted our audits in accordance with auditing standards in the United States of America. Those standards require that we plan and perform the audit to obtain reasonable assurance about whether the financial statements and financial highlights are free of material misstatement. We were not engaged to perform an audit of the Fund's internal control over financial reporting. Our audits included consideration of internal control over financial reporting as a basis for designing audit procedures that are appropriate in the circumstances, but not for the purpose of expressing an opinion on the effectiveness of the Fund's internal control over financial reporting. Accordingly, we express no such opinion. An audit also includes examining, on a test basis, evidence supporting the amounts and disclosures in the financial statements and financial highlights, assessing the accounting principles used and significant estimates made by management, and evaluating the overall financial statement presentation. Our procedures included confirmation of securities owned as of December 31, 2009, by correspondence with the custodian and brokers. We believe that our audits provide a reasonable basis for our opinion.
In our opinion, the financial statements and financial highlights referred to above present fairly, in all material respects, the financial position of Market Plus Core Fund, a portfolio of Federated Core Trust II, L.P., at December 31, 2009, the results of its operations for the year then ended, the changes in its net assets for each of the two years in the period then ended, and the financial highlights for each of the periods indicated therein, in conformity with U.S. generally accepted accounting principles.
Boston, Massachusetts
February 22, 2010
Annual Shareholder Report19
Board of Directors and Trust Officers
The Board is responsible for managing the Trust's business affairs and for exercising all the Trust's powers except those reserved for the shareholders. The following tables give information about each Board member and the senior officers of the Fund. Where required, the tables separately list Board members who are “interested persons” of the Fund (i.e., “Interested” Board members) and those who are not (i.e., “Independent” Board members). Unless otherwise noted, the address of each person listed is Federated Investors Tower, 1001 Liberty Avenue, Pittsburgh, PA 15222. The address of all Independent Board members listed is 4000 Ericsson Drive, Warrendale, PA 15086-7561; Attention: Mutual Fund Board. As of December 31, 2009, the Trust comprised two portfolios, and the Federated Fund Complex consisted of 43 investment companies (comprising 145 portfolios). Unless otherwise noted, each Officer is elected annually. Unless otherwise noted, each Board member oversees all portfolios in the Federated Fund Complex and serves for an indefinite term. The Fund's Statement of Additional Information includes additional information about Trust Directors and is available, without charge and upon request, by calling 1-800-341-7400.
Interested Directors Background
Name
Birth Date
Positions Held with Trust
Date Service Began | Principal Occupation(s) for Past Five Years,
Other Directorships Held and Previous Position(s) |
John F. Donahue*
Birth Date: July 28, 1924
DIRECTOR
Began serving: November 2001 | Principal Occupations: Director or Trustee of the Federated Fund Complex; Chairman and Director, Federated Investors, Inc.; Chairman of the Federated Fund Complex's Executive Committee.
Previous Positions: Chairman of the Federated Fund Complex; Trustee, Federated Investment Management Company; Chairman and Director, Federated Investment Counseling. |
J. Christopher Donahue*
Birth Date: April 11, 1949
PRESIDENT AND DIRECTOR
Began serving: November 2000 | Principal Occupations: Principal Executive Officer and President of the Federated Fund Complex; Director or Trustee of some of the Funds in the Federated Fund Complex; President, Chief Executive Officer and Director, Federated Investors, Inc.; Chairman and Trustee, Federated Investment Management Company; Trustee, Federated Investment Counseling; Chairman and Director, Federated Global Investment Management Corp.; Chairman, Federated Equity Management Company of Pennsylvania and Passport Research, Ltd. (investment advisory subsidiary of Federated); Trustee, Federated Shareholder Services Company; Director, Federated Services Company.
Previous Positions: President, Federated Investment Counseling; President and Chief Executive Officer, Federated Investment Management Company, Federated Global Investment Management Corp. and Passport Research, Ltd. |
| * | Family relationships and reasons for “interested” status: John F. Donahue is the father of J. Christopher Donahue; both are “interested” due to their beneficial ownership of shares of Federated Investors, Inc. and the positions they hold with Federated and its subsidiaries. |
INDEPENDENT Directors Background
Name
Birth Date
Positions Held with Trust
Date Service Began | Principal Occupation(s) for Past Five Years,
Other Directorships Held and Previous Position(s) |
John T. Conroy, Jr., Ph.D.
Birth Date: June 23, 1937
DIRECTOR
Began serving: November 2001 | Principal Occupations: Director or Trustee of the Federated Fund Complex; Chairman of the Board, Investment Properties Corporation; Partner or Trustee in private real estate ventures in Southwest Florida; Assistant Professor in Theology, Blessed Edmund Rice School for Pastoral Ministry.
Previous Positions: President, Investment Properties Corporation; Senior Vice President, John R. Wood and Associates, Inc., Realtors; President, Naples Property Management, Inc. and Northgate Village Development Corporation. |
Nicholas P. Constantakis
Birth Date: September 3, 1939
DIRECTOR
Began serving: November 2001 | Principal Occupation: Director or Trustee of the Federated Fund Complex.
Other Directorship Held: Director and Chairman of the Audit Committee, Michael Baker Corporation (architecture, engineering and construction services).
Previous Position: Partner, Andersen Worldwide SC. |
John F. Cunningham
Birth Date: March 5, 1943
DIRECTOR
Began serving: November 2001 | Principal Occupation: Director or Trustee of the Federated Fund Complex.
Other Directorships Held: Chairman, President and Chief Executive Officer, Cunningham & Co., Inc. (strategic business consulting); Trustee Associate, Boston College.
Previous Positions: Director, Redgate Communications and EMC Corporation (computer storage systems); Chairman of the Board and Chief Executive Officer, Computer Consoles, Inc.; President and Chief Operating Officer, Wang Laboratories; Director, First National Bank of Boston; Director, Apollo Computer, Inc. |
20
Name
Birth Date
Positions Held with Trust
Date Service Began | Principal Occupation(s) for Past Five Years,
Other Directorships Held and Previous Position(s) |
Maureen Lally-Green
Birth Date: July 5, 1949
DIRECTOR
Began serving: August 2009 | Principal Occupations: Director or Trustee of the Federated Fund Complex; Director, Office of Church Relations, Diocese of Pittsburgh; Adjunct Professor of Law, Duquesne University School of Law.
Other Directorships Held: Director, Auberle; Trustee St. Francis University; Director, Ireland Institute of Pittsburgh; Director, UPMC Mercy Hospital; Regent, St. Vincent Seminary; Director, Epilepsy Foundation of Western and Central Pennsylvania; Director, Saint Thomas More Society, Allegheny County; Director, Carlow University.
Previous Position: Pennsylvania Superior Court Judge. |
Peter E. Madden
Birth Date: March 16, 1942
DIRECTOR
Began serving: November 2001 | Principal Occupation: Director or Trustee, and Chairman of the Board of Directors or Trustees, of the Federated Fund Complex.
Other Directorship Held: Board of Overseers, Babson College.
Previous Positions: Representative, Commonwealth of Massachusetts General Court; President, Chief Operating Officer and Director, State Street Bank and Trust Company and State Street Corporation (retired); Director, VISA USA and VISA International; Chairman and Director, Massachusetts Bankers Association; Director, Depository Trust Corporation; Director, The Boston Stock Exchange. |
Charles F. Mansfield, Jr.
Birth Date: April 10, 1945
DIRECTOR
Began serving: January 1999 | Principal Occupations: Director or Trustee and Chairman of the Audit Committee of the Federated Fund Complex; Management Consultant.
Previous Positions: Chief Executive Officer, PBTC International Bank; Partner, Arthur Young & Company (now Ernst & Young LLP); Chief Financial Officer of Retail Banking Sector, Chase Manhattan Bank; Senior Vice President, HSBC Bank USA (formerly, Marine Midland Bank); Vice President, Citibank; Assistant Professor of Banking and Finance, Frank G. Zarb School of Business, Hofstra University; Executive Vice President DVC Group, Inc. (marketing, communications and technology). |
R. James Nicholson
Birth Date: February 4, 1938
DIRECTOR
Began serving: January 2008 | Principal Occupations: Director or Trustee of the Federated Fund Complex; Senior Counsel, Brownstein Hyatt Farber Schrek, P.C.; Former Secretary of the U.S. Dept. of Veterans Affairs; Former U.S. Ambassador to the Holy See; Former Chairman of the Republican National Committee.
Other Directorships Held: Director, Horatio Alger Association; Director, The Daniels Fund.
Previous Positions: Colonel, U.S. Army Reserve; Partner, Calkins, Kramer, Grimshaw and Harring, P.C.; General Counsel, Colorado Association of Housing and Building; Chairman and CEO, Nicholson Enterprises, Inc. (real estate holding company); Chairman and CEO, Renaissance Homes of Colorado. |
Thomas M. O'Neill
Birth Date: June 14, 1951
DIRECTOR
Began serving: October 2006 | Principal Occupations: Director or Trustee of the Federated Fund Complex; Sole Proprietor, Navigator Management Company (investment and strategic consulting).
Other Directorships Held: Board of Overseers, Children's Hospital of Boston; Visiting Committee on Athletics, Harvard College.
Previous Positions: Chief Executive Officer and President, Managing Director and Chief Investment Officer, Fleet Investment Advisors; President and Chief Executive Officer, Aeltus Investment Management, Inc.; General Partner, Hellman, Jordan Management Co., Boston, MA; Chief Investment Officer, The Putnam Companies, Boston, MA; Credit Analyst and Lending Officer, Fleet Bank; Director and Consultant, EZE Castle Software (investment order management software); Director, Midway Pacific (lumber). |
John S. Walsh
Birth Date: November 28, 1957
DIRECTOR
Began serving: November 2001 | Principal Occupations: Director or Trustee of the Federated Fund Complex; President and Director, Heat Wagon, Inc. (manufacturer of construction temporary heaters); President and Director, Manufacturers Products, Inc. (distributor of portable construction heaters); President, Portable Heater Parts, a division of Manufacturers Products, Inc.
Previous Position: Vice President, Walsh & Kelly, Inc. |
James F. Will
Birth Date: October 12, 1938
DIRECTOR
Began serving: April 2006 | Principal Occupations: Director or Trustee of the Federated Fund Complex; formerly, Vice Chancellor and President, Saint Vincent College.
Other Directorships Held: Trustee, Saint Vincent College; Alleghany Corporation.
Previous Positions: Chairman, President and Chief Executive Officer, Armco, Inc.; President and Chief Executive Officer, Cyclops Industries; President and Chief Operating Officer, Kaiser Steel Corporation. |
21
OFFICERS
Name
Birth Date
Address
Positions Held with Trust
Date Service Began | Principal Occupation(s) for Past Five Years
and Previous Position(s) |
John W. McGonigle
Birth Date: October 26, 1938
EXECUTIVE VICE PRESIDENT AND SECRETARY
Began serving: November 2000 | Principal Occupations: Executive Vice President and Secretary of the Federated Fund Complex; Vice Chairman, Executive Vice President, Secretary and Director, Federated Investors, Inc.
Previous Positions: Trustee, Federated Investment Management Company and Federated Investment Counseling; Director, Federated Global Investment Management Corp., Federated Services Company and Federated Securities Corp. |
Richard A. Novak
Birth Date: December 25, 1963
TREASURER
Began serving: January 2006 | Principal Occupations: Principal Financial Officer and Treasurer of the Federated Fund Complex; Senior Vice President, Federated Administrative Services; Financial and Operations Principal for Federated Securities Corp., Edgewood Services, Inc. and Southpointe Distribution Services, Inc.
Previous Positions: Controller of Federated Investors, Inc.; Vice President, Finance of Federated Services Company; held various financial management positions within The Mercy Hospital of Pittsburgh; Auditor, Arthur Andersen & Co. |
Richard B. Fisher
Birth Date: May 17, 1923
VICE CHAIRMAN
Began serving: August 2002 | Principal Occupations: Vice Chairman or Vice President of some of the Funds in the Federated Fund Complex; Vice Chairman, Federated Investors, Inc.; Chairman, Federated Securities Corp.
Previous Positions: President and Director or Trustee of some of the Funds in the Federated Fund Complex; Executive Vice President, Federated Investors, Inc.; Director and Chief Executive Officer, Federated Securities Corp. |
Brian P. Bouda
Birth Date: February 28, 1947
SENIOR VICE PRESIDENT AND CHIEF COMPLIANCE OFFICER
Began serving: August 2004 | Principal Occupations: Senior Vice President and Chief Compliance Officer of the Federated Fund Complex; Vice President and Chief Compliance Officer of Federated Investors, Inc. and Chief Compliance Officer of its subsidiaries. Mr. Bouda joined Federated in 1999 and is a member of the American Bar Association and the State Bar Association of Wisconsin. |
Stephen F. Auth
Birth Date: September 3, 1956
450 Lexington Avenue
Suite 3700
New York, NY 10017-3943
CHIEF INVESTMENT OFFICER
Began serving: May 2004 | Principal Occupations: Mr. Auth is Chief Investment Officer of this Fund and various other Funds in the Federated Fund Complex; Executive Vice President, Federated Investment Counseling, Federated Global Investment Management Corp. and Federated Equity Management Company of Pennsylvania.
Previous Positions: Executive Vice President, Federated Investment Management Company, and Passport Research, Ltd. (investment advisory subsidiary of Federated); Senior Vice President, Global Portfolio Management Services Division; Senior Vice President, Federated Investment Management Company and Passport Research, Ltd.; Senior Managing Director and Portfolio Manager, Prudential Investments. |
Robert J. Ostrowski
Birth Date: April 26, 1963
CHIEF INVESTMENT OFFICER
Began serving: May 2004 | Principal Occupations: Robert J. Ostrowski joined Federated in 1987 as an Investment Analyst and became a Portfolio Manager in 1990. He was named Chief Investment Officer of taxable fixed-income products in 2004 and also serves as a Senior Portfolio Manager. He has been a Senior Vice President of the Fund's Adviser since 1997. Mr. Ostrowski is a Chartered Financial Analyst. He received his M.S. in Industrial Administration from Carnegie Mellon University. |
Todd A. Abraham
Birth Date: February 10, 1966
VICE PRESIDENT
Began serving: May 2004 | Principal Occupations: Todd A. Abraham is Vice President of the Trust. Mr. Abraham has been a Portfolio Manager since 1995 , a Vice President of the Fund's Adviser since 1997 and a Senior Vice President of the Fund's Adviser beginning 2007. Mr. Abraham joined Federated in 1993 as an Investment Analyst and served as Assistant Vice President of the Fund's Adviser from 1995 to 1997. Mr. Abraham served as a Portfolio Analyst at Ryland Mortgage Co. from 1992-1993. Mr. Abraham is a Chartered Financial Analyst and received his M.B.A. in Finance from Loyola College. |
Ihab Salib
Birth Date: December 14, 1964
VICE PRESIDENT
Began serving: May 2006 | Principal Occupations: Ihab Salib is Vice President of the Trust. Mr. Salib joined Federated in April 1999 as a Senior Fixed-Income Trader/Assistant Vice President of the Fund's Adviser. In July 2000, he was named a Vice President of the Fund's Adviser and in January 2007 he was named a Senior Vice President of the Fund's Adviser. He has served as a Portfolio Manager since January 2002. From January 1994 through March 1999, Mr. Salib was employed as a Senior Global Fixed-Income Analyst with UBS Brinson, Inc. Mr. Salib received his B.A. with a major in Economics from Stony Brook University. |
22
Evaluation and Approval of Advisory Contract - May 2009
Market Plus Core Fund (the “Fund”)
The Fund's Board reviewed the Fund's investment advisory contract at meetings held in May 2009. The Board's decision regarding the contract reflects the exercise of its business judgment on whether to continue the existing arrangements. The Fund is distinctive in that it is designed for the efficient management of a particular asset class and is made available for investment only to other Federated funds and a limited number of other accredited investors. In addition, the Adviser does not charge an investment advisory fee for its services although it or its affiliates may receive compensation for managing assets invested in the Fund.
The Federated funds' Board had previously appointed a Senior Officer, whose duties include specified responsibilities relating to the process by which advisory fees are to be charged to a Federated fund. The Senior Officer has the authority to retain consultants, experts, or staff as may be reasonably necessary to assist in the performance of his duties, reports directly to the Board, and may be terminated only with the approval of a majority of the independent members of the Board. The Senior Officer prepared and furnished to the Board an independent, written evaluation that covered topics discussed below. The Board considered that evaluation, along with other information, in deciding to approve the advisory contract.
As previously noted, the Adviser does not charge an investment advisory fee for its services; however, the Board did consider compensation and benefits received by the Adviser, including fees received for services provided to the Fund by other entities in the Federated organization and research services received by the Adviser from brokers that execute Federated fund trades. The Board is also familiar with and considered judicial decisions concerning allegedly excessive investment advisory fees which have indicated that the following factors may be relevant to an Adviser's fiduciary duty with respect to its receipt of compensation from a fund: the nature and quality of the services provided by the Adviser, including the performance of the Fund; the Adviser's cost of providing the services; the extent to which the Adviser may realize “economies of scale” as the Fund grows larger; any indirect benefits that may accrue to the Adviser and its affiliates as a result of the Adviser's relationship with the Fund; performance and expenses of comparable funds; and the extent to which the independent Board members are fully informed about all facts the Board deems relevant bearing on the Adviser's services and fees. The Board further considered management fees (including any components thereof) charged to institutional and other clients of the Adviser for what might be viewed as like services, and the cost to the Adviser and its affiliates of supplying services pursuant to the management fee agreements, excluding any intra-corporate profit and profit margins of the Adviser and its affiliates for supplying such services. The Board was aware of these factors and was guided by them in its review of the Fund's advisory contract to the extent it considered them to be appropriate and relevant, as discussed further below.
The Board considered and weighed these circumstances in light of its substantial accumulated experience in governing the Fund and working with Federated on matters relating to the Federated funds, and was assisted in its deliberations by independent legal counsel. Throughout the year, the Board has requested and received substantial and detailed information about the Fund and the Federated organization that was in addition to the extensive materials that comprise and accompany the Senior Officer's evaluation. Federated provided much of this information at each regular meeting of the Board, and furnished additional reports in connection with the particular meeting at which the Board's formal review of the advisory contract occurred. Between regularly scheduled meetings, the Board has received information on particular matters as the need arose. Thus, the Board's consideration of the advisory contract included review of the Senior Officer's evaluation, accompanying data and additional reports covering such matters as: the Adviser's investment philosophy, personnel and processes; investment and operating strategies; the Fund's short- and long-term performance, and comments on the reasons for performance; the Fund's investment objectives; the Fund's overall expense structure; the use and allocation of brokerage commissions derived from trading the Fund's portfolio securities (if any); and the nature, quality and extent of the advisory and other services provided to the Fund by the Adviser and its affiliates. The Board also considered the preferences and expectations of Fund shareholders and their relative sophistication; the continuing state of competition in the mutual fund industry and market practices; the Fund's relationship to the Federated family of funds which include a comprehensive array of funds with different investment objectives, policies and strategies which are available for exchange without the incurrence of additional sales charges; compliance and audit reports concerning the Federated funds and the Federated companies that service them (including communications from regulatory agencies), as well as Federated's responses to any issues raised therein; and relevant developments in the mutual fund industry and how the Federated funds and/or Federated are responding to them. The Board's evaluation process is evolutionary. The criteria considered and the emphasis placed on relevant criteria change in recognition of changing circumstances in the mutual fund marketplace.
Because the Adviser does not charge the Fund an investment advisory fee, the Fund's Board does not consider fee comparisons to other mutual funds or other institutional or separate accounts to be relevant.
Annual Shareholder Report23
The Board also received financial information about Federated, including reports on the compensation and benefits Federated derived from its relationships with the Federated funds. Because the Adviser does not charge an investment advisory fee for its services, these reports generally cover fees received by Federated's subsidiaries for providing other services to the Federated funds under separate contracts (e.g., for serving as the Federated funds' administrator). The reports also discussed any indirect benefit Federated may derive from its receipt of research services from brokers who execute Federated fund trades. In addition, the Board considered the fact that, in order for a fund to be competitive in the marketplace, Federated and its affiliates frequently waive non-advisory fees and/or reimburse other expenses and have disclosed to fund investors and/or indicated to the Board their intention to do so in the future, where appropriate. Moreover, the Board receives regular reports regarding the institution or elimination of these voluntary waivers.The Board and the Senior Officer also reviewed a report compiled by Federated comparing profitability information for Federated to other publicly held fund management companies. In this regard, the Senior Officer noted the limited availability of such information, but nonetheless concluded that Federated's profit margins did not appear to be excessive and the Board agreed.
The Board based its decision to approve the advisory contract on the totality of the circumstances and relevant factors and with a view to past and future long-term considerations. Not all of the factors and considerations identified above were necessarily relevant to the Fund, nor did the Board consider any one of them to be determinative. In particular, due to the unusual nature of the Fund as primarily an internal product with no advisory fee, the Board does not consider the assessment of whether economies of scale would be realized if the Fund were to grow to some sufficient size to be relevant. With respect to the factors that were relevant, the Board's decision to approve the contract reflects its determination that Federated's performance and actions provided a satisfactory basis to support the decision to continue the existing arrangement.
Annual Shareholder Report24
Voting Proxies on Fund Portfolio Securities
A description of the policies and procedures that the Fund uses to determine how to vote proxies, if any, relating to securities held in the Fund's portfolio, as well as a report on “Form N-PX” of how the Fund voted any such proxies during the most recent 12-month period ended June 30, are available, without charge and upon request, by calling 1-800-341-7400. These materials are also available at the SEC's Web site at www.sec.gov.
Quarterly Portfolio Schedule
Each Fund files with the SEC a complete schedule of its portfolio holdings, as of the close of the first and third quarters of its fiscal year, on “Form N-Q.” These filings are available on the SEC's Web site at www.sec.gov and may be reviewed and copied at the SEC's Public Reference Room in Washington, DC. (Call 1-800-SEC-0330 for information on the operation of the Public Reference Room.)
Mutual funds are not bank deposits or obligations, are not guaranteed by any bank and are not insured or guaranteed by the U.S. government, the Federal Deposit Insurance Corporation, the Federal Reserve Board or any other government agency. Investment in mutual funds involves investment risk, including the possible loss of principal.
This Report is authorized for distribution to prospective investors only when preceded or accompanied by the Fund's Confidential Private Offering Memorandum, which contains facts concerning its objective and policies, management fees, expenses and other information.
Market Plus Core Fund
Federated Investors Funds
4000 Ericsson Drive
Warrendale, PA 15086-7561
Contact us at FederatedInvestors.com
or call 1-800-341-7400.
Federated Securities Corp., Distributor
Cusip 31409R300
34315 (2/10)
Federated is a registered mark of Federated Investors, Inc.
2010 © Federated Investors, Inc.
SIGNATURES
Pursuant to the requirements of the Securities Exchange Act of 1934 and the Investment Company Act of 1940, the registrant has duly caused this report to be signed on its behalf by the undersigned, thereunto duly authorized.
| | |
| Registrant Federated Core Trust II, L.P. |
| |
| By | | /S/ RICHARD A. NOVAK |
| | Richard A. Novak, |
| | Principal Financial Officer |
Date June 22, 2010
Pursuant to the requirements of the Securities Exchange Act of 1934 and the Investment Company Act of 1940, this report has been signed below by the following persons on behalf of the registrant and in the capacities and on the dates indicated.
| | |
| By | | /S/ J. CHRISTOPHER DONAHUE |
| | J. Christopher Donahue, |
| | Principal Executive Officer |
|
| Date June 22, 2010 |
| |
| By | | /S/ RICHARD A. NOVAK |
| | Richard A. Novak, |
| | Principal Financial Officer |
|
| Date June 22, 2010 |