United States
Securities and Exchange Commission
Washington, D.C. 20549
Form N-CSR
Certified Shareholder Report of Registered Management Investment Companies
811-10625
(Investment Company Act File Number)
Federated Core Trust II, L.P.
_______________________________________________________________
(Exact Name of Registrant as Specified in Charter)
Federated Investors Funds
4000 Ericsson Drive
Warrendale, Pennsylvania 15086-7561
(Address of Principal Executive Offices)
(412) 288-1900
(Registrant's Telephone Number)
John W. McGonigle, Esquire
Federated Investors Tower
1001 Liberty Avenue
Pittsburgh, Pennsylvania 15222-3779
(Name and Address of Agent for Service)
(Notices should be sent to the Agent for Service)
Date of Fiscal Year End: 11/30/2011
Date of Reporting Period: 11/30/2011
Item 1. Reports to Stockholders
 | | Annual Shareholder Report |
| | November 30, 2011 |
|
Emerging Markets Fixed Income Core Fund
A Portfolio of Federated Core Trust II, L.P.
Management's Discussion of Fund Performance (unaudited)
The Fund's total return, based on net asset value, for the 12-month reporting period ended November 30, 2011, was 6.82%. The total return of the Barclays Capital Emerging Markets Index (BCEMI),1 the Fund's broad-based securities market index, was 4.91% for the same period. The Fund's total return for the reporting period reflected actual cash flows, transaction costs and other expenses which were not reflected in the total return of the BCEMI.
During the reporting period, the most significant factors affecting the Fund's performance relative to the BCEMI were: (1) duration2 of its portfolio (which indicates the portfolio's price sensitivity to interest rates);3 and (2) the credit quality4 of the portfolio securities (which indicate the risk that securities will default).
Market Overview
The reporting period ended in general terms on a sober tone. This was primarily due not only to lack of resolution for the eurozone debt crisis and growing concerns on medium-term prospects for China's economy (both having severe implications for the global growth outlook) but also demand for commodities and the impact of emerging markets (EM).
During most of the period, the markets digested various iterations of confidence crises and risk aversion triggered by concerns in developed markets, mainly within the European Union (EU). Additionally, the U.S. markets continued the debates from last year regarding implementation of financial regulation, the extension of tax cuts and, since last summer, the need to materially address the fiscal deficit from both the revenue and the expenditure sides. As of the end of the reporting period, the multiple debates were far from resolved.
During the first quarter of the reporting period, geopolitics in the Middle East played a principal role in increased market volatility fueled by supply interruptions of oil and gas to Western Europe, resulting in an increase in the global price of crude. By the second quarter, Japan had suffered a massive natural disaster followed by a nuclear plant explosion. This, in turn, triggered a global response by the energy sector causing a more cautious view towards nuclear energy (new plant constructions were put on hold, while old plants were shut down), moving instead in favor of the hydrocarbon complex with the resulting upward move in spot prices.
In Europe, the market remained increasingly impatient with policymakers for the lack of a clear and realistic blueprint for resolution of the fiscal and debt sustainability crisis. Furthermore, market analysts and the media debated tirelessly about the future of the EU and the euro currency. Towards the end of the prior fiscal year, the confidence crisis had already expanded beyond Greece. It affected primarily the most vulnerable economies of Ireland and Portugal, which experienced growing funding problems for both sovereign credits and banks. During this current reporting period, the funding problems of Greece, Ireland and Portugal (with aggregate gross domestic product of less than 10% of the EU) continued to deteriorate but only marginally impacted global markets, except for increased volatility in the EM equity markets.
Despite numerous measures announced by the Greek government early in 2011, by the summer, fiscal performance had disappointed alongside the slow implementation of austerity measures and reforms. Using fiscal performance as a yardstick of debt sustainability, market analysts turned their attention to larger and more significant economies within the EU, such as Italy and Spain, with the resulting widening of borrowing costs and credit default swap spreads. At this point, risk aversion to global equity and credit markets increased sharply with growing concerns that the eurozone debt crisis of periphery countries was spreading to the core countries.
EM debt demonstrated resilience to the market volatility during the first half of the reporting period and, in fact, continued the improving credit rating trajectory reaching a significant milestone by end of May 2011 – the asset class represented by the BCEMI reached an average credit rating of “BBB-” by all three rating agencies. On the monetary policy front, EM economies responded to inflationary concerns early in the year by initiating a tightening cycle via macro-prudential measures in combination with selected interest rate hikes. Toward the end of the second quarter of the reporting period, the asset class experienced the negative impact of the eurozone crisis in the form of significant outflows from EM debt funds, widening the BCEMI spread over Treasuries to a peak of 525 basis points (bps) in early October from 313 bps at the beginning of August. Although the situation stabilized later in the fall, the spread remained elevated at around 450 bps for the remainder of the reporting period. The asset class ended the reporting period with net inflows of around $37 billion.
In the current market environment, EM investment-grade securities outperformed EM high-yield securities, while EM sovereign and quasi-sovereign credits outperformed EM corporate securities. Notably, over the last 12 months, long duration securities with maturities in excess of 10 years significantly outperformed securities with shorter maturities. Furthermore, Latin America as a region outperformed all other regions with a return of 7.5%, followed by Asia with 3.1%, and EMEA (Europe, Middle East and Africa) with 2.0%. During the overall reporting period, EM spreads traded in a wide range of between 270 bps and a brief peak at 520 bps over U.S. Treasuries ending at about 448 bps for a net increase of about 150 bps from the start of the period. On a yield basis, EM started at 5.7% and traded within a range of 5.3% and a peak of 6.8%, ending the period at 6.1% for a total return of 4.9%.
Comparatively, the Barclays Capital Global Treasury U.S. Bond Index5 was up 6.8%, the JPMorgan Government Bond Index – Emerging Markets Global Diversified6 (local markets unhedged) was up 5.1% and the S&P 500 Index7 was up 5.6%.
Annual Shareholder Report
Credit QualityFund management allocated as compared to the BCEMI more of its portfolio to relatively higher-yielding sovereign credits within their respective credit rating categories. This included countries such as Argentina, Colombia, Indonesia and Uruguay under the premise that risk premiums versus comparable credits continued to be large despite the positive returns from the prior year and still not accurately reflected credit fundamentals. During the reporting period, the average credit quality of the portfolio was increased to an investment-grade rating. This strategic allocation was an additional contributor to Fund performance over the reporting period.
Duration
Early in the 12-month reporting period, Fund management allocated a large percentage of sovereign bonds from investment-grade countries to securities with longer duration than those comprising the BCEMI. With the anticipation of a relatively subdued global growth in developed economies, the risk premium priced in EM bonds was expected to narrow under an extended period of accommodative monetary policy in developed markets, mainly in the United States and, as highlighted above, in Europe due to its debt crisis. Furthermore, the Fund was positioned to benefit from constructive bond price movements reflecting the improving credit quality of the asset class. This strategy remained in place throughout the reporting period which markedly benefited from the decline in U.S. Treasury yields from 2.80% to 2.07% and was the main contributor to relative performance.
| 1 | The BCEMI tracks total returns for U.S. dollar-denominated debt instruments issued by sovereign and corporate credits in emerging economies from the following regions: Americas, Europe, Middle East and Asia. Countries covered include among others: Argentina, Brazil, Bulgaria, Ecuador, Mexico, Panama, Peru, the Philippines, Russia and Venezuela. The BCEMI is not adjusted to reflect sales charges, expenses or other fees that the Securities and Exchange Commission (SEC) requires to be reflected in the Fund's performance. The index is unmanaged, and it is not possible to invest directly in an index. |
| 2 | Duration is a measure of a security's price sensitivity to changes in interest rates. Securities with longer durations are more sensitive to changes in interest rates than securities with shorter durations. For purposes of this Management Discussion of Fund Performance, duration is determined using a third-party analytical system. |
| 3 | Bond prices are sensitive to changes in interest rates and a rise in interest rates can cause a decline in their prices. |
| 4 | Investment-grade securities are securities that are rated at least “BBB- (minus)” or unrated securities of a comparable quality. Noninvestment-grade securities are securities that are not rated at least “BBB- (minus)” or unrated securities of a comparable quality. Credit ratings are an indication of the risk that a security will default. They do not protect a security from credit risk. Lower-rated bonds typically offer higher yields to help compensate investors for the increased risk associated with them. Among these risks are lower credit-worthiness, greater price volatility, more risk to principal and income than with higher-rated securities and increased possibilities of default. |
| 5 | The Barclays Capital Global Treasury U.S. Bond Index includes public obligations of the U.S. Treasury that have remaining maturities of one year or more. The index is unmanaged, and it is not possible to invest directly in an index. |
| 6 | The JPMorgan Government Bond Index-Emerging Markets Global Diversified is a local emerging markets debt benchmark that tracks local currency government bonds issued by emerging markets. It includes 16 countries in Asia, Europe, Latin America and Middle East/Africa that provide easy access and no impediments for foreign investors. The index is unmanaged, and it is not possible to invest directly in an index. |
| 7 | The S&P 500 Index is an unmanaged capitalization-weighted index of 500 stocks designed to measure performance of the broad domestic economy through changes in the aggregate market value of 500 stocks representing all major industries. The index is unmanaged, and it is not possible to invest directly in an index. |
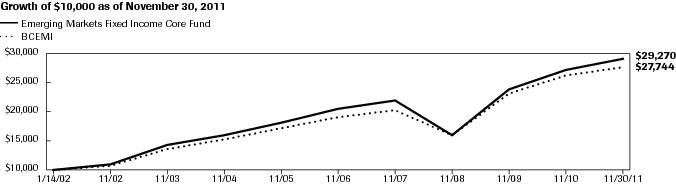
Annual Shareholder Report FUND PERFORMANCE AND GROWTH OF A $10,000 INVESTMENT
The Average Annual Total Return table below shows returns averaged over the stated periods. The graph below illustrates the hypothetical investment of $10,0001 in the Emerging Markets Fixed Income Core Fund (the “Fund”) from January 14, 2002 (start of performance) to November 30, 2011, compared to Barclays Capital Emerging Markets Index (BCEMI).2
| Average Annual Total Returns for the Period Ended 11/30/2011 | |
| 1 Year | 6.82% |
| 5 Years | 7.18% |
| Start of Performance* | 11.48% |
| * | The Fund's start of performance date was January 14, 2002. |
Performance data quoted represents past performance which is no guarantee of future results. Investment return and principal value will fluctuate so that an investor's shares, when redeemed, may be worth more or less than their original cost. Mutual fund performance changes over time and current performance may be lower or higher than what is stated. For current to the most recent month-end performance and after-tax returns, visit FederatedInvestors.com or call 1-800-341-7400. Returns shown do not reflect the deduction of taxes that a shareholder would pay on Fund distributions or the redemption of Fund shares. Mutual funds are not obligations of or guaranteed by any bank and are not federally insured.
Growth of a $10,000 Investment
| Emerging Markets Fixed Income Core Fund | C000026708 | BCEMI |
| 1/14/2002 | 10,000 | 10,000 |
| 11/30/2002 | 10,980 | 10,749 |
| 11/30/2003 | 14,390 | 13,637 |
| 11/30/2004 | 15,910 | 15,341 |
| 11/30/2005 | 18,080 | 17,221 |
| 11/30/2006 | 20,690 | 19,207 |
| 11/30/2007 | 22,070 | 20,248 |
| 11/30/2008 | 16,000 | 15,982 |
| 11/30/2009 | 24,040 | 23,269 |
| 11/30/2010 | 27,400 | 26,446 |
| 11/30/2011 | 29,270 | 27,744 |
41 graphic description end -->
| 1 | The Fund's performance assumes the reinvestment of all dividends and distributions. The BCEMI has been adjusted to reflect reinvestment of dividends on securities in the index. |
| 2 | The BCEMI tracks total returns for external-currency-denominated debt instruments of the emerging markets. The BCEMI is not adjusted to reflect sales charges, expenses or other fees that the Securities and Exchange Commission requires to be reflected in the Fund's performance. The index is unmanaged and, unlike the Fund, is not affected by cash flows. It is not possible to invest directly in an index. |
Annual Shareholder Report Portfolio of Investments Summary Table (unaudited)
At November 30, 2011, the Fund's issuer country exposure composition was as follows:
| Country | Exposure as a Percentage
of Total Net Assets1 |
| Russia | 14.7% |
| Mexico | 12.9% |
| Brazil | 12.6% |
| Indonesia | 8.4% |
| Turkey | 8.1% |
| Venezuela | 7.4% |
| Argentina | 4.7% |
| Colombia | 4.1% |
| Peru | 3.9% |
| Philippines | 3.5% |
| Uruguay | 3.2% |
| United Arab Emirates | 2.1% |
| Panama | 1.9% |
| Qatar | 1.4% |
| El Salvador | 1.1% |
| South Africa | 0.9% |
| India | 0.8% |
| Sri Lanka | 0.7% |
| Chile | 0.6% |
| Poland | 0.6% |
| Kazakhstan | 0.5% |
| Egypt | 0.4% |
| Hungary | 0.4% |
| Lithuania | 0.4% |
| Trinidad and Tobago | 0.4% |
| Belize | 0.3% |
| Croatia | 0.3% |
| Guatemala | 0.3% |
| Ukraine | 0.3% |
| Dominican Republic | 0.2% |
| Cash Equivalents2 | 0.6% |
| Other Assets and Liabilities — Net3 | 2.3% |
| TOTAL | 100.0% |
| 1 | This table depicts the Fund's exposure to various countries through its investment in foreign fixed-income securities along with the Fund's holdings of cash equivalents and other assets and liabilities. With respect to foreign fixed-income securities, country allocations are based primarily on the country in which the issuing company (the “Issuer”) has registered the security. However, the Fund's Adviser may allocate the Issuer to a country based on other factors such as the location of the Issuer's head office, the jurisdiction of the Issuer's incorporation, the location of the principal trading market for the Issuer's securities or the country from which a majority of the Issuer's revenue is derived. |
| 2 | Cash Equivalents include any investments in money market mutual funds and/or overnight repurchase agreements. This does not include cash held in the Fund that is denominated in foreign currencies. See the Statement of Assets and Liabilities for information regarding the Fund's foreign cash position. |
| 3 | Assets, other than investments in securities, less liabilities. See Statement of Assets and Liabilities. |
Annual Shareholder Report Portfolio of Investments
November 30, 2011
Shares or
Foreign
Currency
Par Amount | | | Value in
U.S. Dollars |
| | Corporate Bonds – 34.1% | |
| | Banking – 3.4% | |
| 3,000,000 | | Banco Bradesco SA, Series REGS, 6.75%, 9/29/2019 | 3,232,500 |
| 1,500,000 | 1,2 | Banco Bradesco SA, Sub. Note, Series 144A, 5.90%, 1/16/2021 | 1,518,750 |
| 4,000,000 | | Banco Do Brasil S.A., Jr. Sub. Note, Series REGS, 8.50%, 10/29/2049 | 4,660,000 |
| 2,000,000 | 1,2 | Banco Internacional del Peru, Jr. Sub. Note, Series 144A, 8.50%, 4/23/2070 | 2,035,000 |
| 3,000,000 | 1,2 | Banco Internacional del Peru, Sr. Unsecd. Note, Series 144A, 5.75%, 10/7/2020 | 2,895,000 |
| 2,000,000 | 1,2 | ICICI Bank Ltd., Sr. Unsecd. Note, Series 144A, 5.75%, 11/16/2020 | 1,860,760 |
| 4,000,000 | 1,2 | ICICI Bank Ltd./Dubai, Sr. Unsecd. Note, Series 144A, 4.75%, 11/25/2016 | 3,846,396 |
| 3,500,000 | 1,2 | VTB Capital SA, Bond, Series 144A, 6.25%, 6/30/2035 | 3,420,729 |
| | TOTAL | 23,469,135 |
| | Broadcast Radio & TV – 0.7% | |
| 3,800,000 | | Grupo Televisa S.A., Sr. Note, 8.50%, 3/11/2032 | 4,842,868 |
| | Building & Development – 0.3% | |
| 2,000,000 | 1,2 | Odebrecht SA, Company Guarantee, Series 144A, 7.50%, 9/29/2049 | 1,960,000 |
| | Building Materials – 1.0% | |
| 3,235,000 | 1,2 | Rearden G Holdings EINS GmbH, Company Guarantee, Series 144A, 7.875%, 3/30/2020 | 3,267,350 |
| 4,000,000 | 1,2 | Votorantim Celulose e Papel SA, Company Guarantee, Series 144A, 7.25%, 4/5/2041 | 3,814,011 |
| | TOTAL | 7,081,361 |
| | Cable & Wireless Television – 0.7% | |
| 4,250,000 | | Net Servicos de Comunicacao SA, Company Guarantee, 7.50%, 1/27/2020 | 4,866,250 |
| | Capital Goods — Aerospace & Defense – 0.4% | |
| 2,400,000 | | Embraer Overseas Ltd., Sr. Unsecd. Note, 6.375%, 1/15/2020 | 2,634,000 |
| | Chemicals & Plastics – 1.1% | |
| 3,200,000 | 1,2 | Braskem Finance Ltd., Company Guarantee, Series 144A, 5.75%, 4/15/2021 | 3,184,000 |
| 4,000,000 | 1,2 | Sociedad Quimica Y Minera de Chile, Note, Series 144A, 5.50%, 4/21/2020 | 4,248,874 |
| | TOTAL | 7,432,874 |
| | Conglomerate – 0.9% | |
| 6,100,000 | | Voto-Votorantim O/S Trad, Series REGS, 6.625%, 9/25/2019 | 6,450,750 |
| | Construction & Engineering – 0.5% | |
| 3,200,000 | | Odebrecht Finance Ltd., Series REGS, 7.00%, 4/21/2020 | 3,432,000 |
| | Container & Glass Products – 0.8% | |
| 5,400,000 | | Vitro SA, Note, 11.75%, 11/1/2013 | 3,996,000 |
| 2,000,000 | | Vitro SA, Sr. Unsecd. Note, 9.125%, 2/1/2017 | 1,480,000 |
| | TOTAL | 5,476,000 |
| | Finance – 0.1% | |
| 500,000 | | Gruposura Finance, Company Guarantee, Series REGS, 5.70%, 5/18/2021 | 505,500 |
| | Materials – 0.5% | |
| 3,500,000 | 1,2 | CSN Islands XI Corp., Company Guarantee, Series 144A, 6.875%, 9/21/2019 | 3,666,250 |
| | Metals & Mining – 1.4% | |
| 5,000,000 | 1,2 | Bumi Investment PTE Ltd., Company Guarantee, Series 144A, 10.75%, 10/6/2017 | 4,950,000 |
| 3,850,000 | | Vale Overseas Ltd., 6.875%, 11/21/2036 | 4,303,235 |
| | TOTAL | 9,253,235 |
| | Mortgage Banks – 0.7% | |
| 4,425,000 | 1,2 | Credito Real, S.A. de C.V., Sr. Note, Series 144A, 10.25%, 4/14/2015 | 4,535,625 |
| | Oil & Gas – 13.1% | |
| 5,000,000 | | CITGO Petroleum Corp., Sr. Secd. Note, Series REGS, 11.50%, 7/1/2017 | 5,675,000 |
Annual Shareholder ReportShares or
Foreign
Currency
Par Amount | | | Value in
U.S. Dollars |
| 6,550,000 | | Ecopetrol SA, Note, 7.625%, 7/23/2019 | 7,958,250 |
| 4,471,722 | | Gazprom International SA, Series REGS, 7.201%, 2/1/2020 | 4,798,739 |
| 10,850,000 | 1,2 | Gazprom, Note, Series 144A, 8.625%, 4/28/2034 | 12,857,250 |
| 4,000,000 | 1,2 | IPIC GMTN, Ltd., Company Guarantee, Series 144A, 5.00%, 11/15/2020 | 3,932,500 |
| 6,300,000 | 1,2 | IPIC GMTN, Ltd., Company Guarantee, Series 144A, 6.875%, 11/1/2041 | 6,363,000 |
| 3,000,000 | | KazMunaiGaz Finance Sub B.V., Series REGS, 6.375%, 4/9/2021 | 3,105,000 |
| 3,800,000 | 1,2 | Lukoil International Finance BV, Company Guarantee, Series 144A, 6.125%, 11/9/2020 | 3,800,000 |
| 1,850,000 | 1,2 | Pacific Rubiales, Series 144A, 8.75%, 11/10/2016 | 2,067,375 |
| 1,150,000 | 1,2 | Pertamina PT, Note, Series 144A, 5.25%, 5/23/2021 | 1,152,875 |
| 1,000,000 | 1,2 | Pertamina PT, Sr. Unsecd. Note, Series 144A, 6.50%, 5/27/2041 | 1,010,000 |
| 5,300,000 | | Petrobras International Finance Co., Company Guarantee, 7.875%, 3/15/2019 | 6,187,750 |
| 24,800,000 | | Petroleos de Venezuela, S.A., Company Guarantee, Series REGS, 8.50%, 11/2/2017 | 18,600,000 |
| 1,600,000 | 1,2 | Petroleos Mexicanos, Company Guarantee, Series 144A, 6.50%, 6/2/2041 | 1,744,397 |
| 4,650,000 | | Petroleos Mexicanos, Company Guarantee, Series WI, 8.00%, 5/3/2019 | 5,726,864 |
| 2,625,000 | | Petroleum Co. of Trinidad and Tobago Ltd., Sr. Unsecd. Note, Series REGS, 6.00%, 5/8/2022 | 2,583,761 |
| 2,100,000 | 1,2 | TNK-BP Finance SA, Company Guarantee, Series 144A, 7.25%, 2/2/2020 | 2,249,625 |
| | TOTAL | 89,812,386 |
| | Paper Products – 0.8% | |
| 2,000,000 | 1,2 | Fibria Overseas Finance, Company Guarantee, Series 144A, 6.75%, 3/3/2021 | 1,885,000 |
| 3,709,000 | 1,2 | Fibria Overseas Finance, Company Guarantee, Series 144A, 7.50%, 5/4/2020 | 3,653,365 |
| | TOTAL | 5,538,365 |
| | Pharmaceuticals – 0.5% | |
| 4,000,000 | 1,2 | Hypermarcas SA, Note, Series 144A, 6.50%, 4/20/2021 | 3,520,000 |
| | Real Estate – 0.6% | |
| 4,000,000 | 1,2 | Qatari Diar Finance QSC, Foreign Gov't. Guarantee, Series 144A, 5.00%, 7/21/2020 | 4,188,819 |
| | Telecommunications & Cellular – 3.2% | |
| 1,800,000 | | America Movil S.A.B. de C.V., Company Guarantee, Series WI, 5.00%, 10/16/2019 | 1,944,326 |
| 3,000,000 | | MTS International Funding Ltd., Series REGS, 8.625%, 6/22/2020 | 3,228,600 |
| 1,500,000 | 1,2 | MTS International Funding Ltd., Sr. Unsecd. Note, Series 144A, 8.625%, 6/22/2020 | 1,614,300 |
| 3,300,000 | 1,2 | Qtel International Finance Ltd., Bank Guarantee, Series 144A, 5.00%, 10/19/2025 | 3,373,753 |
| 1,800,000 | 1,2 | Qtel International Finance Ltd., Company Guarantee, Series 144A, 4.75%, 2/16/2021 | 1,818,605 |
| 2,600,000 | 1,2 | Telemovil Finance Co., Ltd., Company Guarantee, Series 144A, 8.00%, 10/1/2017 | 2,665,000 |
| 4,500,000 | | Telemovil Finance Co., Ltd., Company Guarantee, Series REGS, 8.00%, 10/1/2017 | 4,612,500 |
| 3,200,000 | 1,2 | Vimpelcom, Company Guarantee, Series 144A, 7.504%, 3/1/2022 | 2,796,000 |
| | TOTAL | 22,053,084 |
| | Utilities – 3.4% | |
| 1,000,000 | | Centrais Eletricas Brasileiras SA, Sr. Unsecd. Note, Series REGS, 6.875%, 7/30/2019 | 1,140,000 |
| 1,000,000 | 1,2 | Comision Fed De Electric, Sr. Note, Series 144A, 4.875%, 5/26/2021 | 1,022,338 |
| 1,500,000 | 1,2 | DTEK Finance BV, Company Guarantee, Series 144A, 9.50%, 4/28/2015 | 1,425,000 |
| 4,000,000 | 1,2 | Dubai Electricity & Water, Sr. Unsecd. Note, Series 144A, 7.375%, 10/21/2020 | 3,980,000 |
| 6,010,000 | | Majapahit Holding BV, Company Guarantee, Series REGS, 7.75%, 1/20/2020 | 6,911,500 |
| 4,750,000 | | Power Sector Assets & Liabilities Management Corp., Company Guarantee, Series REGS, 7.39%, 12/2/2024 | 5,818,750 |
| 2,800,000 | | Power Sector Assets & Liabilities Management Corp., Series REGS, 7.25%, 5/27/2019 | 3,381,000 |
| | TOTAL | 23,678,588 |
| | TOTAL CORPORATE BONDS
(IDENTIFIED COST $228,259,628) | 234,397,090 |
| | Floating Rate Loan – 0.1% | |
| 1,405,504 | 3 | Carolbrl, 4.003%, 12/31/2017
(IDENTIFIED COST $1,382,524) | 723,132 |
Annual Shareholder ReportShares or
Foreign
Currency
Par Amount | | | Value in
U.S. Dollars |
| | Governments/Agencies – 62.9% | |
| | Sovereign – 62.9% | |
| 7,150,000 | | Argentina, Government of, Bond, 0.439%, 8/3/2012 | 865,865 |
| 63,983,000 | | Argentina, Government of, Note, 1.00%, 12/15/2035 | 3,627,836 |
| 21,176,570 | | Argentina, Government of, Note, 8.28%, 12/31/2033 | 15,353,013 |
| 240 | | Argentina, Government of, Sr. Unsecd. Note, 12.00%, 12/15/2035 | 13 |
| 13,723,000 | | Argentina, Government of, Sr. Unsecd. Note, 7.00%, 10/3/2015 | 12,007,625 |
| 3,200,000 | | Belize, Government of, Unsub., 6.00%, 2/20/2029 | 1,904,000 |
| 4,000,000 | | Brazil, Government of, Bond, 8.25%, 1/20/2034 | 5,890,000 |
| 6,500,000 | | Brazil, Government of, Note, 8.00%, 1/15/2018 | 7,572,500 |
| 1,500,000 | | Brazil, Government of, Sr. Unsecd. Note, 5.625%, 1/7/2041 | 1,698,750 |
| 6,000,000 | | Brazil, Government of, Unsub., 11.00%, 8/17/2040 | 7,875,000 |
| 7,400,000 | | Colombia, Government of, 7.375%, 9/18/2037 | 10,045,500 |
| 3,500,000 | | Colombia, Government of, Bond, 6.125%, 1/18/2041 | 4,156,250 |
| 3,100,000 | | Colombia, Government of, Note, 7.375%, 1/27/2017 | 3,730,850 |
| 2,100,000 | 1,2 | Croatia, Government of, Note, 144A, 6.625%, 7/14/2020 | 1,858,500 |
| 1,500,000 | | Dominican Republic, Government of, Sr. Unsecd. Note, 7.50%, 5/6/2021 | 1,500,000 |
| 3,100,000 | 1,2 | Egypt, Government of, Note, 144A, 6.875%, 4/30/2040 | 2,743,500 |
| 1,750,000 | 1,2 | Guatemala, Government of, Note, 144A, 9.25%, 8/1/2013 | 1,904,875 |
| 3,000,000 | | Hungary, Government of, Unsecd. Note, 6.25%, 1/29/2020 | 2,737,500 |
| 14,700,000 | | Indonesia, Government of, 6.625%, 2/17/2037 | 17,640,000 |
| 10,000,000 | | Indonesia, Government of, 7.75%, 1/17/2038 | 13,375,000 |
| 3,500,000 | 1,2 | Indonesia, Government of, 144A, 8.50%, 10/12/2035 | 4,987,500 |
| 5,300,000 | 1,2 | Indonesia, Government of, Sr. Unsecd. Note, 144A, 11.625%, 3/4/2019 | 7,751,250 |
| 2,800,000 | 1,2 | Lithuania, Government of, Bond, 144A, 7.375%, 2/11/2020 | 2,968,000 |
| 3,058,000 | | Mexico, Government of, Sr. Note, 5.75%, 10/12/2110 | 3,126,805 |
| 7,950,000 | | Panama, Government of, 6.70%, 1/26/2036 | 10,295,250 |
| 2,400,000 | | Panama, Government of, 7.25%, 3/15/2015 | 2,769,600 |
| 13,095,000 | | Peru, Government of, 6.55%, 3/14/2037 | 15,975,900 |
| 4,620,000 | | Peru, Government of, Bond, 7.35%, 7/21/2025 | 5,982,900 |
| 2,650,000 | | Philippines, Government of, Sr. Unsecd. Note, 5.50%, 3/30/2026 | 2,924,938 |
| 10,000,000 | | Philippines, Government of, Sr. Unsecd. Note, 6.375%, 10/23/2034 | 11,912,500 |
| 3,900,000 | | Republic of Poland, Sr. Unsecd. Note, 6.375%, 7/15/2019 | 4,221,750 |
| 12,730,000 | | Republica Oriental del Uruguay, 7.625%, 3/21/2036 | 16,956,360 |
| 9,000,000 | 1,2 | Russia, Government of, Bond, 144A, 5.00%, 4/29/2020 | 9,301,500 |
| 49,031,200 | | Russia, Government of, Unsub., 7.50%, 3/31/2030 | 57,489,082 |
| 3,700,000 | | South Africa, Government of, Bond, 5.50%, 3/9/2020 | 4,051,500 |
| 1,800,000 | | South Africa, Government of, Sr. Unsecd. Note, 6.875%, 5/27/2019 | 2,124,000 |
| 2,000,000 | | Sri Lanka, Government of, Note, 7.40%, 1/22/2015 | 2,112,500 |
| 2,690,000 | 1,2 | Sri Lanka, Government of, Sr. Unsecd. Note, 144A, 6.25%, 10/4/2020 | 2,676,550 |
| 10,000,000 | | Turkey, Government of, 6.75%, 5/30/2040 | 10,525,000 |
| 10,070,000 | | Turkey, Government of, 6.875%, 3/17/2036 | 10,749,725 |
| 6,650,000 | | Turkey, Government of, 7.00%, 9/26/2016 | 7,315,000 |
| 16,320,000 | | Turkey, Government of, Bond, 5.625%, 3/30/2021 | 16,564,800 |
| 9,500,000 | | Turkey, Government of, Note, 7.375%, 2/5/2025 | 10,782,500 |
| 600,000 | | Ukraine, Government of, Bond, 7.65%, 6/11/2013 | 576,000 |
| 12,910,000 | | United Mexican States, 6.75%, 9/27/2034 | 16,460,250 |
| 26,400,000 | | United Mexican States, Note, 5.125%, 1/15/2020 | 29,541,600 |
| 12,600,000 | | United Mexican States, Sr. Unsecd. Note, 5.95%, 3/19/2019 | 14,754,600 |
| 3,600,000 | | Uruguay, Government of, Note, 8.00%, 11/18/2022 | 4,788,000 |
| 7,400,000 | | Venezuela, Government of, 10.75%, 9/19/2013 | 7,418,500 |
Annual Shareholder ReportShares or
Foreign
Currency
Par Amount | | | Value in
U.S. Dollars |
| 29,150,000 | | Venezuela, Government of, 9.375%, 1/13/2034 | 19,239,000 |
| | TOTAL GOVERNMENTS/AGENCIES
(IDENTIFIED COST $404,067,775) | 432,829,437 |
| | MUTUAL FUND – 0.6% | |
| 3,816,451 | 4,5 | Federated Prime Value Obligations Fund, Institutional Shares, 0.20%
(AT NET ASSET VALUE) | 3,816,451 |
| | TOTAL INVESTMENTS-97.7%
(IDENTIFIED COST $637,526,378)6 | 671,766,110 |
| | OTHER ASSETS AND LIABILITIES — NET-2.3%7 | 16,117,052 |
| | TOTAL NET ASSETS-100% | $687,883,162 |
| 1 | Denotes a restricted security that either: (a) cannot be offered for public sale without first being registered, or being able to take advantage of an exemption from registration, under the Securities Act of 1933; or (b) is subject to a contractual restriction on public sales. At November 30, 2011, these restricted securities amounted to $146,513,622, which represented 21.3% of total net assets. |
| 2 | Denotes a restricted security that may be resold without restriction to “qualified institutional buyers” as defined in Rule 144A under the Securities Act of 1933 and that the Fund has determined to be liquid under criteria established by the Fund's Board of Directors (the “Directors”). At November 30, 2011, these liquid restricted securities amounted to $146,513,622, which represented 21.3% of total net assets. |
| 3 | The rate shown represents a weighted average coupon rate on settled positions at year end. Remaining maturities of floating rate loans may be less than stated maturities shown as a result of contractual or optional prepayments by the borrower. Such prepayments cannot be predicted with certainty. These loans may be subject to restrictions on resale. Floating rate loans generally have rates of interest which are determined periodically by reference to a base lending rate plus a premium. |
| 4 | Affiliated holding. |
| 5 | 7-Day net yield. |
| 6 | The cost of investments for federal tax purposes amounts to $638,885,721. |
| 7 | Assets, other than investments in securities, less liabilities. See Statement of Assets and Liabilities. |
Note: The categories of investments are shown as a percentage of total net assets at November 30, 2011.
Various inputs are used in determining the value of the Fund's investments. These inputs are summarized in the three broad levels listed below:
Level 1 — quoted prices in active markets for identical securities, including investment companies with daily net asset values, if applicable. Level 2 — other significant observable inputs (including quoted prices for similar securities, interest rates, prepayment speeds, credit risk, etc.). Also includes securities valued at amortized cost. Level 3 — significant unobservable inputs (including the Fund's own assumptions in determining the fair value of investments).The inputs or methodology used for valuing securities are not an indication of the risk associated with investing in those securities.
The following is a summary of the inputs used, as of November 30, 2011, in valuing the Fund's assets carried at fair value:
| Valuation Inputs | | | | |
| Level 1 —
Quoted
Prices and
Investments in
Mutual Funds | Level 2 —
Other
Significant
Observable
Inputs | Level 3 —
Significant
Unobservable
Inputs | Total |
| Debt Securities: | | | | |
| Corporate Bonds | $ — | $234,397,090 | $ — | $234,397,090 |
| Floating Rate Loan | — | 723,132 | — | 723,132 |
| Governments/Agencies | — | 432,829,437 | — | 432,829,437 |
| Mutual Fund | 3,816,451 | — | — | 3,816,451 |
| TOTAL SECURITIES | $3,816,451 | $667,949,659 | $ — | $671,766,110 |
See Notes which are an integral part of the Financial Statements
Annual Shareholder Report Financial Highlights
(For a Share Outstanding Throughout Each Period)
| Year Ended November 30 | 2011 | 2010 | 2009 | 2008 | 2007 |
| Net Asset Value, Beginning of Period | $27.40 | $24.04 | $15.99 | $22.07 | $20.69 |
| Income From Investment Operations: | | | | | |
| Net investment income | 1.881 | 1.901 | 1.751 | 1.691 | 1.471 |
| Net realized and unrealized gain (loss) on investments, futures contracts, swap contracts and foreign currency transactions | (0.01) | 1.46 | 6.30 | (7.77) | (0.09) |
| TOTAL FROM INVESTMENT OPERATIONS | 1.87 | 3.36 | 8.05 | (6.08) | 1.38 |
| Net Asset Value, End of Period | $29.27 | $27.40 | $24.04 | $15.99 | $22.07 |
| Total Return2 | 6.82% | 13.98% | 50.34% | (27.55)% | 6.67% |
| Ratios to Average Net Assets: | | | | | |
| Net expenses | 0.00% | 0.00% | 0.00%3 | 0.05% | 0.05% |
| Net investment income | 6.63% | 7.41% | 8.46% | 7.95% | 6.82% |
| Expense waiver/reimbursement4 | 0.06% | 0.06% | 0.17% | 0.14% | 0.10% |
| Supplemental Data: | | | | | |
| Net assets, end of period (000 omitted) | $687,883 | $698,514 | $461,477 | $182,058 | $417,205 |
| Portfolio turnover | 18% | 23% | 30% | 61% | 65% |
| 1 | Per share numbers have been calculated using the average shares method. |
| 2 | Based on net asset value. |
| 3 | Represents less than 0.01% |
| 4 | This expense decrease is reflected in both the net expense and the net investment income ratios shown above. |
See Notes which are an integral part of the Financial Statements
Annual Shareholder Report Statement of Assets and Liabilities
November 30, 2011
| Assets: | | |
Total investments in securities, at value including $3,816,451 of investments in an affiliated holding (Note 5)
(identified cost $637,526,378) | | $671,766,110 |
| Cash denominated in foreign currencies (identified cost $3,093) | | 3,111 |
| Income receivable | | 16,180,898 |
| Bank loan receivable | | 9,910 |
| TOTAL ASSETS | | 687,960,029 |
| Liabilities: | | |
| Payable for custodian fees | $27,617 | |
| Payable for transfer and dividend disbursing agent fees and expenses | 2,325 | |
| Payable for auditing fees | 25,900 | |
| Payable for portfolio accounting fees | 13,924 | |
| Payable for insurance premiums | 5,518 | |
| Accrued expenses | 1,583 | |
| TOTAL LIABILITIES | | 76,867 |
| Net assets for 23,502,707 shares outstanding | | $687,883,162 |
| Net Assets Consist of: | | |
| Paid-in capital | | $653,643,412 |
| Net unrealized appreciation of investments and translation of assets and liabilities in foreign currency | | 34,239,750 |
| TOTAL NET ASSETS | | $687,883,162 |
| Net Asset Value, Offering Price and Redemption Proceeds Per Share: | | |
| $687,883,162 ÷ 23,502,707 shares outstanding | | $29.27 |
See Notes which are an integral part of the Financial Statements
Annual Shareholder Report Statement of Operations
Year Ended November 30, 2011
| Investment Income: | | |
| Interest | | $45,570,284 |
| Dividends received from an affiliated holding (Note 5) | | 17,338 |
| TOTAL INCOME | | 45,587,622 |
| Expenses: | | |
| Custodian fees | $171,736 | |
| Transfer and dividend disbursing agent fees and expenses | 13,909 | |
| Directors'/Trustees' fees | 12,220 | |
| Auditing fees | 25,924 | |
| Legal fees | 6,124 | |
| Portfolio accounting fees | 157,741 | |
| Printing and postage | 10,680 | |
| Insurance premiums | 5,891 | |
| Miscellaneous | 7,076 | |
| TOTAL EXPENSES | 411,301 | |
| Reimbursement of other operating expenses (Note 5) | (411,301) | |
| Net expenses | | — |
| Net investment income | | 45,587,622 |
Realized and Unrealized Gain (Loss) on Investments, Futures Contracts, Swap Contracts and
Foreign Currency Transactions: | | |
| Net realized gain on investments | | 3,398,565 |
| Net realized loss on futures contracts | | (42,405) |
| Net realized loss on swap contracts | | (693,197) |
| Net change in unrealized appreciation of investments and translation of assets and liabilities in foreign currency | | (3,841,653) |
| Net realized and unrealized gain on investments, futures contracts, swap contracts and foreign currency transactions | | (1,178,690) |
| Change in net assets resulting from operations | | $44,408,932 |
See Notes which are an integral part of the Financial Statements
Annual Shareholder Report Statement of Changes in Net Assets
| Year Ended November 30 | 2011 | 2010 |
| Increase (Decrease) in Net Assets | | |
| Operations: | | |
| Net investment income | $45,587,622 | $45,909,240 |
| Net realized gain on investments, futures contracts, swap contracts and foreign currency transactions | 2,662,963 | 8,018,815 |
| Net change in unrealized appreciation/depreciation of investments and translation of assets and liabilities in foreign currency | (3,841,653) | 26,692,897 |
| CHANGE IN NET ASSETS RESULTING FROM OPERATIONS | 44,408,932 | 80,620,952 |
| Share Transactions: | | |
| Contributions | 113,935,100 | 214,669,756 |
| Withdrawals | (168,974,983) | (58,253,591) |
| CHANGE IN NET ASSETS RESULTING FROM SHARE TRANSACTIONS | (55,039,883) | 156,416,165 |
| Change in net assets | (10,630,951) | 237,037,117 |
| Net Assets: | | |
| Beginning of period | 698,514,113 | 461,476,996 |
| End of period (including undistributed net investment income of $243,817,197 and $198,229,575, respectively) | $687,883,162 | $698,514,113 |
See Notes which are an integral part of the Financial Statements
Annual Shareholder Report Notes to Financial Statements
November 30, 2011
1. ORGANIZATION
Emerging Markets Fixed Income Core Fund (the “Fund”) is a non-diversified portfolio of Federated Core Trust II, L.P. (the “Trust”). The Trust is registered under the Investment Company Act of 1940, as amended (the “Act”). The Trust is a limited partnership that was established under the laws of the state of Delaware on November 13, 2000 and offered only to registered investment companies and other accredited investors. The Trust consists of one portfolio. The Fund's primary investment objective is to achieve total return on its assets. Its secondary investment objective is to achieve a high level of income. The Fund pursues these objectives by investing primarily in emerging market fixed-income securities.
2. SIGNIFICANT ACCOUNTING POLICIES
The following is a summary of significant accounting policies consistently followed by the Fund in the preparation of its financial statements. These policies are in conformity with U.S. generally accepted accounting principles (GAAP).
Investment Valuation
In calculating its net asset value (NAV), the Fund generally values investments as follows:
- Fixed-income securities acquired with remaining maturities greater than 60 days are fair valued using price evaluations provided by a pricing service approved by the Directors.
- Fixed-income securities acquired with remaining maturities of 60 days or less are valued at their cost (adjusted for the accretion of any discount or amortization of any premium), which approximates market value.
- Equity securities listed on an exchange or traded through a regulated market system are valued at their last reported sale price or official closing price in their principal exchange or market.
- Derivative contracts listed on exchanges are valued at their reported settlement or closing price.
- Over-the-counter (OTC) derivative contracts are fair valued using price evaluations provided by a pricing service approved by the Directors.
- Shares of other mutual funds are valued based upon their reported NAVs.
- For securities that are fair valued in accordance with procedures established by and under the general supervision of the Directors, certain factors may be considered such as: the purchase price of the security, information obtained by contacting the issuer, analysis of the issuer's financial statements or other available documents, fundamental analytical data, the nature and duration of restrictions on disposition, the movement of the market in which the security is normally traded and public trading in similar securities of the issuer or comparable issuers.
If the Fund cannot obtain a price or price evaluation from a pricing service for an investment, the Fund may attempt to value the investment based upon the mean of bid and asked quotations or fair value the investment based on price evaluations, from one or more dealers. If any price, quotation, price evaluation or other pricing source is not readily available when the NAV is calculated, the Fund uses the fair value of the investment determined in accordance with the procedures described below. There can be no assurance that the Fund could purchase or sell an investment at the price used to calculate the Fund's NAV.
Fair Valuation and Significant Events Procedures
The Directors have authorized the use of pricing services to provide evaluations of the current fair value of certain investments for purposes of calculating the NAV. Factors considered by pricing services in evaluating an investment include the yields or prices of investments of comparable quality, coupon, maturity, call rights and other potential prepayments, terms and type, reported transactions, indications as to values from dealers and general market conditions. Some pricing services provide a single price evaluation reflecting the bid-side of the market for an investment (a “bid” evaluation). Other pricing services offer both bid evaluations and price evaluations indicative of a price between the prices bid and asked for the investment (a “mid” evaluation). The Fund normally uses bid evaluations for U.S. Treasury and Agency securities and mortgage-backed securities. The Fund normally uses mid evaluations for other types of fixed-income securities and OTC derivative contracts. In the event that market quotations and price evaluations are not available for an investment, the fair value of the investment is determined in accordance with procedures adopted by the Directors.
The Directors also have adopted procedures requiring an investment to be priced at its fair value whenever the Adviser determines that a significant event affecting the value of the investment has occurred between the time as of which the price of the investment would otherwise be determined and the time as of which the NAV is computed. An event is considered significant if there is both an affirmative expectation that the investment's value will change in response to the event and a reasonable basis for quantifying the resulting change in value. Examples of significant events that may occur after the close of the principal market on which a security is traded, or after the time of a price evaluation provided by a pricing service or a dealer, include:
- With respect to securities traded in foreign markets, significant trends in U.S. equity markets or in the trading of foreign securities index futures or options contracts;
- With respect to price evaluations of fixed-income securities determined before the close of regular trading on the NYSE, actions by the Federal Reserve Open Market Committee and other significant trends in U.S. fixed-income markets;
- Political or other developments affecting the economy or markets in which an issuer conducts its operations or its securities are traded; and
- Announcements concerning matters such as acquisitions, recapitalizations, litigation developments, a natural disaster affecting the issuer's operations or regulatory changes or market developments affecting the issuer's industry.
The Directors have approved the use of a pricing service to determine the fair value of equity securities traded principally in foreign markets when the Adviser determines that there has been a significant trend in the U.S. equity markets or in index futures trading. For other significant events, the Fund may seek to obtain more current quotations or price evaluations from alternative pricing sources. If a reliable alternative pricing source is not available, the Fund will determine the fair value of the investment using another method approved by the Directors.
Annual Shareholder Report
Repurchase AgreementsThe Fund may invest in repurchase agreements for short-term liquidity purposes. It is the policy of the Fund to require the other party to a repurchase agreement to transfer to the Fund's custodian or sub-custodian eligible securities or cash with a market value (after transaction costs) at least equal to the repurchase price to be paid under the repurchase agreement. The eligible securities are transferred to accounts with the custodian or sub-custodian in which the Fund holds a “securities entitlement” and exercises “control” as those terms are defined in the Uniform Commercial Code. The Fund has established procedures for monitoring the market value of the transferred securities and requiring the transfer of additional eligible securities if necessary to equal at least the repurchase price. These procedures also allow the other party to require securities to be transferred from the account to the extent that their market value exceeds the repurchase price or in exchange for other eligible securities of equivalent market value.
The insolvency of the other party or other failure to repurchase the securities may delay the disposition of the underlying securities or cause the Fund to receive less than the full repurchase price. Under the terms of the repurchase agreement, any amounts received by the Fund in excess of the repurchase price and related transaction costs must be remitted to the other party.
The Fund may enter into repurchase agreements in which eligible securities are transferred into joint trading accounts maintained by the custodian or sub-custodian for investment companies and other clients advised by the Fund's Adviser and its affiliates. The Fund will participate on a pro rata basis with the other investment companies and clients in its share of the securities transferred under such repurchase agreements and in its share of proceeds from any repurchase or other disposition of such securities.
Investment Income, Gains and Losses, Expenses and Distributions
Investment transactions are accounted for on a trade-date basis. Realized gains and losses from investment transactions are recorded on an identified-cost basis. Interest income and expenses are accrued daily. All net income and gain/loss (realized and unrealized) will be allocated daily to the shareholders based on their capital contributions to the Fund. The Fund does not currently intend to declare and pay distributions.
Premium and Discount Amortization
All premiums and discounts on fixed-income securities are amortized/accreted using the effective interest rate method.
Federal Taxes
As a partnership, the Fund is not subject to U.S. federal income tax. Instead, each investor reports separately on its own federal income tax return its allocated portion of the Fund's income, gain, losses, deductions and credits (including foreign tax credits for creditable foreign taxes imposed on the Fund). As of and during the year ended November 30, 2011, the Fund did not have a liability for any uncertain tax positions. The Fund recognizes interest and penalties, if any, related to tax liabilities as income tax expense in the Statement of Operations. As of November 30, 2011, tax years 2008 through 2011 remain subject to examination by the Fund's major tax jurisdictions, which include the United States of America and the Commonwealth of Pennsylvania.
The Fund has reclassified $243,817,197 and $24,822,670 from undistributed net investment income and accumulated net realized gain on investments, futures contracts, swap contracts and foreign currency transactions, respectively, to paid-in capital during the year ended November 30, 2011. The reclassification was to reflect, as an adjustment to paid-in capital, the cumulative amount of net investment income and net realized gains that have been allocated to the Fund's shareholders as of November 30, 2011 and had no impact on shareholders' capital.
The Fund may be subject to taxes imposed by governments of countries in which it invests. Such taxes are generally based on either income or gains earned or repatriated. The Fund accrues and applies such taxes to net investment income, net realized gains and net unrealized gains as income and/or gains are earned.
When-Issued and Delayed Delivery Transactions
The Fund may engage in when-issued or delayed delivery transactions. The Fund records when-issued securities on the trade date and maintains security positions such that sufficient liquid assets will be available to make payment for the securities purchased. Securities purchased on a when-issued or delayed delivery basis are marked to market daily and begin earning interest on the settlement date. Losses may occur on these transactions due to changes in market conditions or the failure of counterparties to perform under the contract.
Swap Contracts
Swap contracts involve two parties that agree to exchange the returns (or the differential in rates of return) earned or realized on particular predetermined investments, instruments, indices or other measures. The gross returns to be exchanged or “swapped” between parties are generally calculated with respect to a “notional amount” for a predetermined period of time. The Fund enters into interest rate, total return, credit default, currency and other swap agreements. Risks may arise upon entering into swap agreements from the potential inability of the counterparties to meet the terms of their contract from unanticipated changes in the value of the swap agreement. The Fund uses credit default swaps to manage exposure to a given issuer or sector by either selling protection to increase exposure, or buying protection to reduce exposure. The “buyer” in a credit default swap is obligated to pay the “seller” a periodic stream of payments over the term of the contract provided that no event of default on an underlying reference obligation has occurred. If an event of default occurs, the seller must pay the buyer the full notional value, or the “par value,” of the reference obligation in exchange for the reference obligation. In connection with these agreements, securities may be identified as collateral in accordance with the terms of the respective swap agreements to provide assets of value and recourse in the event of default or bankruptcy/insolvency. Recovery values are assumed by market makers considering either industry standard recovery rates or entity specific factors and considerations until a credit event occurs. If a credit event has occurred, the recovery value is typically determined by a facilitated auction whereby a minimum number of allowable broker bids, together with a specific valuation method, are used to calculate the settlement value. The maximum amount of the payment that may occur, as a result of a credit event payable by the protection seller, is equal to the notional amount of the underlying index or security. The Fund's maximum risk of loss from counterparty credit risk, either as the protection buyer or as the protection seller, is the fair value of the contract. This risk is mitigated by having a master netting arrangement between the Fund and the counterparty and by the posting of collateral by the counterparty to the Fund to cover the Fund's exposure to the counterparty.
Annual Shareholder Report
Upfront payments received or paid by the Fund will be reflected as an asset or liability on the Statement of Assets and Liabilities. Changes in the value of swap contracts are included in Swaps, at value on the Statement of Assets and Liabilities, and periodic payments are reported as Net realized gain (loss) on swap contracts in the Statement of Operations.At November 30, 2011, the Fund had no outstanding swap contracts.
The average notional amount of swap contracts held by the Fund throughout the period was $5,534,615. This is based on amounts held as of each month-end throughout the fiscal period.
Futures Contracts
The Fund purchases and sells financial futures contracts to manage cash flows, enhance yield and to potentially reduce transaction costs. Upon entering into a financial futures contract with a broker, the Fund is required to deposit in a segregated account a specified amount of cash or U.S. government securities. Futures contracts are valued daily and unrealized gains or losses are recorded in a “variation margin” account. Daily, the Fund receives from or pays to the broker a specified amount of cash based upon changes in the variation margin account. When a contract is closed, the Fund recognizes a realized gain or loss. Futures contracts have market risks, including the risk that the change in the value of the contract may not correlate with the changes in the value of the underlying securities. There is minimal counterparty risk to the Fund since futures are exchange traded and the exchange's clearinghouse, as counterparty to all exchange traded futures, guarantees the futures against default.
At November 30, 2011, the Fund had no outstanding futures contracts.
Foreign Currency Translation
The accounting records of the Fund are maintained in U.S. dollars. All assets and liabilities denominated in foreign currencies (FCs) are translated into U.S. dollars based on the rates of exchange of such currencies against U.S. dollars on the date of valuation. Purchases and sales of securities, income and expenses are translated at the rate of exchange quoted on the respective date that such transactions are recorded. The Fund does not isolate that portion of the results of operations resulting from changes in foreign exchange rates on investments from the fluctuations arising from changes in market prices of securities held. Such fluctuations are included with the net realized and unrealized gain or loss from investments.
Reported net realized foreign exchange gains or losses arise from sales of portfolio securities, sales and maturities of short-term securities, sales of FCs, currency gains or losses realized between the trade and settlement dates on securities transactions, the difference between the amounts of dividends, interest and foreign withholding taxes recorded on the Fund's books, and the U.S. dollar equivalent of the amounts actually received or paid. Net unrealized foreign exchange gains and losses arise from changes in the value of assets and liabilities other than investments in securities at fiscal year end, resulting from changes in the exchange rate.
Restricted Securities
The Fund may purchase securities which are considered restricted. Restricted securities are securities that either: (a) cannot be offered for public sale without first being registered, or being able to take advantage of an exemption from registration, under the Securities Act of 1933; or (b) are subject to contractual restrictions on public sales. In some cases, when a security cannot be offered for public sale without first being registered, the issuer of the restricted security has agreed to register such securities for resale, at the issuer's expense, either upon demand by the Fund or in connection with another registered offering of the securities. Many such restricted securities may be resold in the secondary market in transactions exempt from registration. Restricted securities may be determined to be liquid under criteria established by the Directors. The Fund will not incur any registration costs upon such resales. The Fund's restricted securities are valued at the price provided by dealers in the secondary market or, if no market prices are available, at the fair value as determined in accordance with procedures established by and under the general supervision of the Directors.
Additional Disclosure Related to Derivative Instruments
The Effect of Derivative Instruments on the Statement of Operations for the Year Ended November 30, 2011
| Amount of Realized Gain or (Loss) on Derivatives Recognized in Income |
| Credit
Default
Swaps | Futures | Total |
| Credit contracts | $(693,197) | $ — | $(693,197) |
| Interest rate contracts | — | (42,405) | (42,405) |
| TOTAL | $(693,197) | $(42,405) | $(735,602) |
Other
The preparation of financial statements in conformity with GAAP requires management to make estimates and assumptions that affect the amounts of assets, liabilities, expenses and revenues reported in the financial statements. Actual results could differ from those estimated.
3. CONTRIBUTIONS/WITHDRAWALS
Transactions in shares were as follows:
| Year Ended November 30 | 2011 | 2010 |
| Contributions | 4,134,287 | 8,536,278 |
| Withdrawals | (6,127,782) | (2,235,485) |
| TOTAL CHANGE RESULTING FROM CONTRIBUTIONS/WITHDRAWALS | (1,993,495) | 6,300,793 |
Annual Shareholder Report 4. FEDERAL TAX INFORMATION
At November 30, 2011, the cost of investments for federal tax purposes was $638,885,721. The net unrealized appreciation of investments for federal tax purposes excluding any unrealized appreciation resulting from changes in foreign currency exchange rates was $32,880,389. This consists of net unrealized appreciation from investments for those securities having an excess of value over cost of $56,522,116 and net unrealized depreciation from investments for those securities having an excess of cost over value of $23,641,727.
5. INVESTMENT ADVISER FEE AND OTHER TRANSACTIONS WITH AFFILIATES
Investment Adviser Fee
Federated Investment Counseling is the Fund's investment adviser (the “Adviser”), subject to the oversight of the Directors. The Adviser provides investment adviser services at no fee. The Adviser may voluntarily choose to reimburse certain operating expenses of the Fund. The Adviser can modify or terminate this voluntary reimbursement at any time at its sole discretion. For the year ended November 30, 2011, the Adviser voluntarily reimbursed $411,301 of other operating expenses.
Administrative Fee
Federated Administrative Services, Inc. (FASI), under the Administrative Services Agreement, provides the Fund with administrative personnel and services. FASI provides administrative personnel and services at no fee.
General
Certain Officers and Directors of the Fund are Officers and Directors or Trustees of the above companies.
Transactions Involving Affiliated Holdings
Affiliated holdings are mutual funds which are managed by the Adviser or an affiliate of the Adviser. Transactions involving the affiliated holdings during the year ended November 30, 2011, were as follows:
| Federated
Prime Value
Obligations Fund,
Institutional Shares |
| Balance of Shares Held 11/30/2010 | 23,467,140 |
| Purchases/Additions | 164,873,595 |
| Sales/Reductions | 184,524,284 |
| Balance of Shares Held 11/30/2011 | 3,816,451 |
| Value | $3,816,451 |
| Dividend Income | $17,338 |
6. Investment TRANSACTIONS
Purchases and sales of investments, excluding long-term U.S. government securities and short-term obligations, for the year ended November 30, 2011, were as follows:
| Purchases | $133,288,638 |
| Sales | $122,729,526 |
7. LINE OF CREDIT
The Fund participates in a $100,000,000 unsecured, uncommitted revolving line of credit (LOC) agreement with PNC Bank. The LOC was made available for extraordinary or emergency purposes, primarily for financing redemption payments. Borrowings are charged interest at a rate offered to the Fund by PNC Bank at the time of the borrowing. As of November 30, 2011, there were no outstanding loans. During the year ended November 30, 2011, the Fund did not utilize the LOC.
8. CONCENTRATION OF RISK
Compared to diversified mutual funds, the Fund may invest a higher percentage of its assets among fewer issuers of portfolio securities. This increases the Fund's risk by magnifying the impact (positively or negatively) that any one issuer has on the Fund's share price and performance. The Fund invests in securities of non-U.S. issuers. Political or economic developments may have an effect on the liquidity and volatility of portfolio securities and currency holdings.
9. INTERFUND LENDING
Pursuant to an Exemptive Order issued by the Securities and Exchange Commission, the Fund, along with other funds advised by subsidiaries of Federated Investors, Inc., may participate in an interfund lending program. This program provides an alternative credit facility allowing the Fund to borrow from other participating affiliated funds. As of November 30, 2011, there were no outstanding loans. During the year ended November 30, 2011, the program was not utilized.
Annual Shareholder Report
10. RECENT ACCOUNTING PRONOUNCEMENTSIn April 2011, the Financial Accounting Standards Board (FASB) released Accounting Standards Update (ASU) No. 2011-03, “Reconsideration of Effective Control for Repurchase Agreements.” This ASU amends FASB Accounting Standards Codification (ASC) Topic 860, “Transfers and Servicing”; specifically the criteria required to determine whether a repurchase agreement and similar agreements should be accounted for as sales of financial assets or secured borrowings with commitments. This ASU is effective for fiscal years and interim periods beginning after December 15, 2011. Management has concluded that the adoption of ASU No. 2011-03 is not expected to have a material impact on the Fund's financial statements and the accompanying notes, net assets or results of operations.
In addition, in May 2011, FASB released ASU No. 2011-04, “Amendments to Achieve Common Fair Value Measurement and Disclosure Requirements in U.S. GAAP and IFRSs.” This ASU amends FASB ASC Topic 820, “Fair Value Measurement,” to establish common requirements for measuring fair value and for disclosing information about fair value measurements in accordance with GAAP. This ASU is effective for fiscal years and interim periods beginning after December 15, 2011. Management has concluded that the adoption of ASU No. 2011-04 is not expected to have a material impact on the Fund's financial statements and the accompanying notes.
Annual Shareholder Report Report of Independent Registered Public Accounting Firm
TO THE BOARD OF DIRECTORS OF Federated Core trust II, l.p. AND SHAREHOLDERS OF emerging markets fixed income core fund:
We have audited the accompanying statement of assets and liabilities of Emerging Markets Fixed Income Core Fund (the “Fund”) (one of the portfolios constituting Federated Core Trust II, L.P.), including the portfolio of investments, as of November 30, 2011, and the related statement of operations for the year then ended, the statement of changes in net assets for each of the two years in the period then ended, and the financial highlights for each of the five years in the period then ended. These financial statements and financial highlights are the responsibility of the Fund's management. Our responsibility is to express an opinion on these financial statements and financial highlights based on our audits.
We conducted our audits in accordance with standards of the Public Company Accounting Oversight Board (United States). Those standards require that we plan and perform the audit to obtain reasonable assurance about whether the financial statements and financial highlights are free of material misstatement. We were not engaged to perform an audit of the Fund's internal control over financial reporting. Our audits included consideration of internal control over financial reporting as a basis for designing audit procedures that are appropriate in the circumstances, but not for the purpose of expressing an opinion on the effectiveness of the Fund's internal control over financial reporting. Accordingly, we express no such opinion. An audit also includes examining, on a test basis, evidence supporting the amounts and disclosures in the financial statements and financial highlights, assessing the accounting principles used and significant estimates made by management, and evaluating the overall financial statement presentation. Our procedures included confirmation of securities owned as of November 30, 2011, by correspondence with the custodian and others. We believe that our audits provide a reasonable basis for our opinion.
In our opinion, the financial statements and financial highlights referred to above present fairly, in all material respects, the financial position of Emerging Markets Fixed Income Core Fund, a portfolio of Federated Core Trust II, L.P., at November 30, 2011, the results of its operations for the year then ended, the changes in its net assets for each of the two years in the period then ended, and the financial highlights for each of the five years in the period then ended, in conformity with U.S. generally accepted accounting principles.
Boston, Massachusetts
January 23, 2012
Annual Shareholder Report Shareholder Expense Example (unaudited)
As a shareholder of the Fund, you incur ongoing costs, including to the extent applicable, management fees, distribution (12b-1) fees and/or shareholder services fees and other Fund expenses. This Example is intended to help you to understand your ongoing costs (in dollars) of investing in the Fund and to compare these costs with the ongoing costs of investing in other mutual funds. It is based on an investment of $1,000 invested at the beginning of the period and held for the entire period from June 1, 2011 to November 30, 2011.
ACTUAL EXPENSES
The first section of the table below provides information about actual account values and actual expenses. You may use the information in this section, together with the amount you invested, to estimate the expenses that you incurred over the period. Simply divide your account value by $1,000 (for example, an $8,600 account value divided by $1,000 = 8.6), then multiply the result by the number in the first section under the heading entitled “Expenses Paid During Period” to estimate the expenses attributable to your investment during this period.
HYPOTHETICAL EXAMPLE FOR COMPARISON PURPOSES
The second section of the table below provides information about hypothetical account values and hypothetical expenses based on the Fund's actual expense ratio and an assumed rate of return of 5% per year before expenses, which is not the Fund's actual return. Thus, you should not use the hypothetical account values and expenses to estimate the actual ending account balance or your expenses for the period. Rather, these figures are required to be provided to enable you to compare the ongoing costs of investing in the Fund with other funds. To do so, compare this 5% hypothetical example with the 5% hypothetical examples that appear in the shareholder reports of the other funds.
Please note that the expenses shown in the table are meant to highlight your ongoing costs only. Therefore, the second section of the table is useful in comparing ongoing costs only, and will not help you determine the relative total costs of owning different funds.
| Beginning
Account Value
6/1/2011 | Ending
Account Value
11/30/2011 | Expenses Paid
During Period1 |
| Actual | $1,000 | $1,027.40 | $0.00 |
Hypothetical (assuming a 5% return
before expenses) | $1,000 | $1,025.07 | $0.00 |
| 1 | Expenses are equal to the Fund's annualized net expense ratio of 0.00%, multiplied by the average account value over the period, multiplied by 183/365 (to reflect the one-half-year period). |
Annual Shareholder Report Board of Directors and Trust Officers
The Board of Directors is responsible for managing the Trust's business affairs and for exercising all the Trust's powers except those reserved for the shareholders. The following tables give information about each Director and the senior officers of the Fund. Where required, the tables separately list Directors who are “interested persons” of the Fund (i.e., “Interested” Directors) and those who are not (i.e., “Independent” Directors). Unless otherwise noted, the address of each person listed is Federated Investors Tower, 1001 Liberty Avenue, Pittsburgh, PA 15222. The address of all Independent Directors listed is 4000 Ericsson Drive, Warrendale, PA 15086-7561; Attention: Mutual Fund Board. As of December 31, 2011, the Trust comprised one portfolio(s), and the Federated Fund Family consisted of 43 investment companies (comprising 134 portfolios). Unless otherwise noted, each Officer is elected annually. Unless otherwise noted, each Director oversees all portfolios in the Federated Fund Family and serves for an indefinite term. The Fund's Statement of Additional Information includes additional information about Trust Directors and is available, without charge and upon request, by calling 1-800-341-7400.
Interested Directors Background
Name
Birth Date
Positions Held with Trust
Date Service Began | Principal Occupation(s) for Past Five Years,
Other Directorships Held and Previous Position(s) |
John F. Donahue*
Birth Date: July 28, 1924
Director
Began serving: November 2001 | Principal Occupations: Director or Trustee of the Federated Fund Family; Chairman and Director, Federated Investors, Inc.; Chairman of the Federated Fund Family's Executive Committee.
Previous Positions: Chairman of the Federated Fund Family; Trustee, Federated Investment Management Company; Chairman and Director, Federated Investment Counseling. |
J. Christopher Donahue*
Birth Date: April 11, 1949
President and Director
Began serving: November 2000 | Principal Occupations: Principal Executive Officer and President of the Federated Fund Family; Director or Trustee of some of the Funds in the Federated Fund Family; President, Chief Executive Officer and Director, Federated Investors, Inc.; Chairman and Trustee, Federated Investment Management Company; Trustee, Federated Investment Counseling; Chairman and Director, Federated Global Investment Management Corp.; Chairman, Federated Equity Management Company of Pennsylvania and Passport Research, Ltd. (investment advisory subsidiary of Federated); Trustee, Federated Shareholder Services Company; Director, Federated Services Company.
Previous Positions: President, Federated Investment Counseling; President and Chief Executive Officer, Federated Investment Management Company, Federated Global Investment Management Corp. and Passport Research, Ltd. |
| * | Family relationships and reasons for “interested” status: John F. Donahue is the father of J. Christopher Donahue; both are “interested” due to their beneficial ownership of shares of Federated Investors, Inc. and the positions they hold with Federated and its subsidiaries. |
INDEPENDENT Directors Background
Name
Birth Date
Positions Held with Trust
Date Service Began | Principal Occupation(s) for Past Five Years,
Other Directorships Held, Previous Position(s) and Qualifications |
Nicholas P. Constantakis, CPA
Birth Date: September 3, 1939
Director
Began serving: November 2001 | Principal Occupation: Director or Trustee of the Federated Fund Family.
Other Directorship Held: Director, Chairman of the Audit Committee, and member of the Compensation Committee, Michael Baker Corporation (architecture, engineering and construction services).
Previous Position: Partner, Andersen Worldwide SC.
Qualifications: Public accounting and director experience. |
John F. Cunningham
Birth Date: March 5, 1943
Director
Began serving: November 2001 | Principal Occupation: Director or Trustee of the Federated Fund Family.
Other Directorships Held: Chairman, President and Chief Executive Officer, Cunningham & Co., Inc. (strategic business consulting); Trustee Associate, Boston College.
Previous Positions: Director, Redgate Communications and EMC Corporation (computer storage systems); Chairman of the Board and Chief Executive Officer, Computer Consoles, Inc.; President and Chief Operating Officer, Wang Laboratories; Director, First National Bank of Boston; Director, Apollo Computer, Inc.
Qualifications: Business management and director experience. |
Annual Shareholder ReportName
Birth Date
Positions Held with Trust
Date Service Began | Principal Occupation(s) for Past Five Years,
Other Directorships Held, Previous Position(s) and Qualifications |
Maureen Lally-Green
Birth Date: July 5, 1949
Director
Began serving: August 2009 | Principal Occupations: Director or Trustee of the Federated Fund Family; Director, Office of Church Relations, Diocese of Pittsburgh; Adjunct Professor of Law, Duquesne University School of Law.
Other Directorships Held: Director, Auberle; Trustee, St. Francis University; Director, Ireland Institute of Pittsburgh; Director, UPMC Mercy Hospital; Regent, St. Vincent Seminary; Director, Epilepsy Foundation of Western and Central Pennsylvania; Director, Saint Thomas More Society, Allegheny County.
Previous Position: Pennsylvania Superior Court Judge.
Qualifications: Legal and director experience. |
Peter E. Madden
Birth Date: March 16, 1942
Director
Began serving: November 2001 | Principal Occupation: Director or Trustee, and Chairman of the Board of Directors or Trustees, of the Federated Fund Family.
Previous Positions: Representative, Commonwealth of Massachusetts General Court; President, Chief Operating Officer and Director, State Street Bank and Trust Company and State Street Corporation (retired); Director, VISA USA and VISA International; Chairman and Director, Massachusetts Bankers Association; Director, Depository Trust Corporation; Director, The Boston Stock Exchange.
Qualifications: Business management, mutual fund services and director experience. |
Charles F. Mansfield, Jr.
Birth Date: April 10, 1945
Director
Began serving: November 2001 | Principal Occupations: Director or Trustee of the Federated Fund Family; Management Consultant.
Previous Positions: Chief Executive Officer, PBTC International Bank; Partner, Arthur Young & Company (now Ernst & Young LLP); Chief Financial Officer of Retail Banking Sector, Chase Manhattan Bank; Senior Vice President, HSBC Bank USA (formerly Marine Midland Bank); Vice President, Citibank; Assistant Professor of Banking and Finance, Frank G. Zarb School of Business, Hofstra University; Executive Vice President, DVC Group, Inc. (marketing, communications and technology).
Qualifications: Banking, business management, education and director experience. |
Thomas M. O'Neill
Birth Date: June 14, 1951
Director
Began serving: October 2006 | Principal Occupations: Director or Trustee, Vice Chairman of the Audit Committee of the Federated Fund Family; Sole Proprietor, Navigator Management Company (investment and strategic consulting).
Other Directorships Held: Board of Overseers, Children's Hospital of Boston; Visiting Committee on Athletics, Harvard College; Board of Directors, Medicines for Humanity; Board of Directors, The Golisano Children's Museum of Naples, Florida.
Previous Positions: Chief Executive Officer and President, Managing Director and Chief Investment Officer, Fleet Investment Advisors; President and Chief Executive Officer, Aeltus Investment Management, Inc.; General Partner, Hellman, Jordan Management Co., Boston, MA; Chief Investment Officer, The Putnam Companies, Boston, MA; Credit Analyst and Lending Officer, Fleet Bank; Director and Consultant, EZE Castle Software (investment order management software); Director, Midway Pacific (lumber).
Qualifications: Business management, mutual fund, director and investment experience. |
John S. Walsh
Birth Date: November 28, 1957
Director
Began serving: November 2001 | Principal Occupations: Director or Trustee, Chairman of the Audit Committee of the Federated Fund Family; President and Director, Heat Wagon, Inc. (manufacturer of construction temporary heaters); President and Director, Manufacturers Products, Inc. (distributor of portable construction heaters); President, Portable Heater Parts, a division of Manufacturers Products, Inc.
Previous Position: Vice President, Walsh & Kelly, Inc.
Qualifications: Business management and director experience. |
OFFICERS
Name
Birth Date
Address
Positions Held with Trust
Date Service Began | Principal Occupation(s) for Past Five Years
and Previous Position(s) |
John W. McGonigle
Birth Date: October 26, 1938
EXECUTIVE VICE PRESIDENT AND SECRETARY
Began serving: November 2000 | Principal Occupations: Executive Vice President and Secretary of the Federated Fund Family; Vice Chairman, Executive Vice President, Secretary and Director, Federated Investors, Inc.
Previous Positions: Trustee, Federated Investment Management Company and Federated Investment Counseling; Director, Federated Global Investment Management Corp., Federated Services Company and Federated Securities Corp. |
Richard A. Novak
Birth Date: December 25, 1963
TREASURER
Began serving: January 2006 | Principal Occupations: Principal Financial Officer and Treasurer of the Federated Fund Family; Senior Vice President, Federated Administrative Services; Financial and Operations Principal for Federated Securities Corp., Edgewood Services, Inc. and Southpointe Distribution Services, Inc.
Previous Positions: Controller of Federated Investors, Inc.; Vice President, Finance of Federated Services Company; held various financial management positions within The Mercy Hospital of Pittsburgh; Auditor, Arthur Andersen & Co. |
Annual Shareholder ReportName
Birth Date
Address
Positions Held with Trust
Date Service Began | Principal Occupation(s) for Past Five Years
and Previous Position(s) |
Richard B. Fisher
Birth Date: May 17, 1923
VICE PRESIDENT
Began serving: August 2002 | Principal Occupations: Vice Chairman or Vice President of some of the Funds in the Federated Fund Family; Vice Chairman, Federated Investors, Inc.; Chairman, Federated Securities Corp.
Previous Positions: President and Director or Trustee of some of the Funds in the Federated Fund Family; Executive Vice President, Federated Investors, Inc.; Director and Chief Executive Officer, Federated Securities Corp. |
Brian P. Bouda
Birth Date: February 28, 1947
CHIEF COMPLIANCE OFFICER AND SENIOR VICE PRESIDENT
Began serving: August 2004 | Principal Occupations: Senior Vice President and Chief Compliance Officer of the Federated Fund Family; Vice President and Chief Compliance Officer of Federated Investors, Inc. and Chief Compliance Officer of its subsidiaries. Mr. Bouda joined Federated in 1999 and is a member of the American Bar Association and the State Bar Association of Wisconsin. |
Stephen F. Auth
Birth Date: September 3, 1956
450 Lexington Avenue
Suite 3700
New York, NY 10017-3943
CHIEF INVESTMENT OFFICER
Began serving: May 2004 | Principal Occupations: Mr. Auth is Chief Investment Officer of this Fund and various other Funds in the Federated Fund Family; Executive Vice President, Federated Investment Counseling, Federated Global Investment Management Corp. and Federated Equity Management Company of Pennsylvania.
Previous Positions: Executive Vice President, Federated Investment Management Company, and Passport Research, Ltd. (investment advisory subsidiary of Federated); Senior Vice President, Global Portfolio Management Services Division; Senior Vice President, Federated Investment Management Company and Passport Research, Ltd.; Senior Managing Director and Portfolio Manager, Prudential Investments. |
Robert J. Ostrowski
Birth Date: April 26, 1963
CHIEF INVESTMENT OFFICER
Began serving: May 2004 | Principal Occupations: Robert J. Ostrowski has been the Fund's Portfolio Manager since May 2004. Mr. Ostrowski joined Federated in 1987 as an Investment Analyst and became a Portfolio Manager in 1990. He was named Chief Investment Officer of taxable fixed-income products in 2004 and also serves as a Senior Portfolio Manager. He has been a Senior Vice President of the Fund's Adviser since 1997. Mr. Ostrowski has received the Chartered Financial Analyst designation. He received his M.S. in Industrial Administration from Carnegie Mellon University. |
Ihab Salib
Birth Date: December 14, 1964
VICE PRESIDENT
Began serving: May 2006 | Principal Occupations: Ihab Salib is Vice President of the Trust. Mr. Salib joined Federated in April 1999 as a Senior Fixed-Income Trader/Assistant Vice President of the Fund's Adviser. In July 2000, he was named a Vice President of the Fund's Adviser and in January 2007 he was named a Senior Vice President of the Fund's Adviser. He has served as a Portfolio Manager since January 2002. From January 1994 through March 1999, Mr. Salib was employed as a Senior Global Fixed-Income Analyst with UBS Brinson, Inc. Mr. Salib received his B.A. with a major in Economics from Stony Brook University. |
Annual Shareholder Report Evaluation and Approval of Advisory Contract – May 2011
emerging markets fixed income core fund (the “Fund”)
The Fund's Board reviewed the Fund's investment advisory contract at meetings held in May 2011. The Board's decision regarding the contract reflects the exercise of its business judgment on whether to continue the existing arrangements. The Fund is distinctive in that it is designed for the efficient management of a particular asset class and is made available for investment only to other Federated funds and a limited number of other accredited investors. In addition, the Adviser does not charge an investment advisory fee for its services although it or its affiliates may receive compensation for managing assets invested in the Fund.
The Federated Funds' Board had previously appointed a Senior Officer, whose duties include specified responsibilities relating to the process by which advisory fees are to be charged to a Federated fund. The Senior Officer has the authority to retain consultants, experts, or staff as may be reasonably necessary to assist in the performance of his duties, reports directly to the Board, and may be terminated only with the approval of a majority of the independent members of the Board. The Senior Officer prepared and furnished to the Board an independent, written evaluation that covered topics discussed below (the “Evaluation”). The Board considered that Evaluation, along with other information, in deciding to approve the advisory contract.
As previously noted, the Adviser does not charge an investment advisory fee for its services; however, the Board did consider compensation and benefits received by the Adviser, including fees received for services provided to the Fund by other entities in the Federated organization and research services received by the Adviser from brokers that execute Federated fund trades. The Board is also familiar with and considered judicial decisions concerning allegedly excessive investment advisory fees which have indicated that the following factors may be relevant to an Adviser's fiduciary duty with respect to its receipt of compensation from a fund: the nature and quality of the services provided by the Adviser, including the performance of the Fund; the Adviser's cost of providing the services; the extent to which the Adviser may realize “economies of scale” as the Fund grows larger; any indirect benefits that may accrue to the Adviser and its affiliates as a result of the Adviser's relationship with the Fund; performance and expenses of comparable funds; and the extent to which the independent Board members are fully informed about all facts the Board deems relevant bearing on the Adviser's services and fees. The Board further considered management fees (including any components thereof) charged to institutional and other clients of the Adviser for what might be viewed as like services, and the cost to the Adviser and its affiliates of supplying services pursuant to the management fee agreements, excluding any intra-corporate profit and profit margins of the Adviser and its affiliates for supplying such services. The Board was aware of these factors and was guided by them in its review of the Fund's advisory contract to the extent it considered them to be appropriate and relevant, as discussed further below.
The Board considered and weighed these circumstances in light of its substantial accumulated experience in governing the Fund and working with Federated on matters relating to the Federated funds, and was assisted in its deliberations by independent legal counsel. Throughout the year, the Board has requested and received substantial and detailed information about the Fund and the Federated organization that was in addition to the extensive materials that comprise and accompany the Senior Officer's Evaluation. Federated provided much of this information at each regular meeting of the Board, and furnished additional information in connection with the particular meeting at which the Board's formal review of the advisory contract occurred. Between regularly scheduled meetings, the Board has received information on particular matters as the need arose. Thus, the Board's consideration of the advisory contract included review of the Senior Officer's Evaluation, accompanying data and additional information covering such matters as: the Adviser's investment philosophy, personnel and processes; investment and operating strategies; the Fund's short- and long-term performance, and comments on the reasons for performance; the Fund's investment objectives; the Fund's overall expense structure; the use and allocation of brokerage commissions derived from trading the Fund's portfolio securities (if any); and the nature, quality and extent of the advisory and other services provided to the Fund by the Adviser and its affiliates. The Board also considered the preferences and expectations of Fund shareholders and their relative sophistication; the continuing state of competition in the mutual fund industry and market practices; the Fund's relationship to the Federated family of funds which include a comprehensive array of funds with different investment objectives, policies and strategies which are available for exchange without the incurrence of additional sales charges; compliance and audit reports concerning the Federated funds and the Federated companies that service them (including communications from regulatory agencies), as well as Federated's responses to any issues raised therein; and relevant developments in the mutual fund industry and how the Federated funds and/or Federated are responding to them. The Board's evaluation process is evolutionary. The criteria considered and the emphasis placed on relevant criteria change in recognition of changing circumstances in the mutual fund marketplace.
Because the Adviser does not charge the Fund an investment advisory fee, the Fund's Board does not consider fee comparisons to other mutual funds or other institutional or separate accounts to be relevant.
Annual Shareholder Report
The Board also received financial information about Federated, including information regarding the compensation and benefits Federated derived from its relationships with the Federated funds. Because the Adviser does not charge an investment advisory fee for its services, this information generally covered fees received by Federated's subsidiaries for providing other services to the Federated funds under separate contracts (e.g., for serving as the Federated funds' administrator). The information also detailed any indirect benefit Federated may derive from its receipt of research services from brokers who execute Federated fund trades. In addition, the Board considered the fact that, in order for a fund to be competitive in the marketplace, Federated and its affiliates frequently waive non-advisory fees and/or reimburse other expenses and have disclosed to fund investors and/or indicated to the Board their intention to do so in the future, where appropriate. Moreover, the Board receives regular reporting as to the institution or elimination of these voluntary waivers.The Board and the Senior Officer also reviewed information compiled by Federated comparing profitability information for Federated to other publicly held fund management companies. In this regard, the Senior Officer noted the limited availability of such information, but nonetheless concluded that Federated's profit margins did not appear to be excessive and the Board agreed.
The Senior Officer noted that, considering the totality of the circumstances, and all of the factors referenced within his Evaluation, he had concluded that, subject to comments and recommendations made within his Evaluation, his observations and the information accompanying the Evaluation supported a finding by the Board that the management fees for each of the funds are reasonable and that Federated appeared to provide appropriate administrative services to the Fund for the fees paid. The Board concluded that the nature, quality and scope of services provided the Fund by the Adviser and its affiliates were satisfactory.
The Board based its decision to approve the advisory contract on the totality of the circumstances and relevant factors and with a view to past and future long-term considerations. Not all of the factors and considerations identified above were necessarily relevant to the Fund, nor did the Board consider any one of them to be determinative. In particular, due to the unusual nature of the Fund as primarily an internal product with no advisory fee, the Board does not consider the assessment of whether economies of scale would be realized if the Fund were to grow to some sufficient size to be relevant. With respect to the factors that were relevant, the Board's decision to approve the contract reflects its determination that Federated's performance and actions provided a satisfactory basis to support the decision to continue the existing arrangement.
Annual Shareholder Report Voting Proxies on Fund Portfolio Securities
A description of the policies and procedures that the Fund uses to determine how to vote proxies, if any, relating to securities held in the Fund's portfolio, as well as a report on “Form N-PX” of how the Fund voted any such proxies during the most recent 12-month period ended June 30, are available, without charge and upon request, by calling 1-800-341-7400. These materials are also available at the SEC's website at www.sec.gov.
Quarterly Portfolio Schedule
The Fund files with the SEC a complete schedule of its portfolio holdings, as of the close of the first and third quarters of its fiscal year, on “Form N-Q.” These filings are available on the SEC's website at www.sec.gov and may be reviewed and copied at the SEC's Public Reference Room in Washington, DC. (Call 1-800-SEC-0330 for information on the operation of the Public Reference Room.)
Annual Shareholder ReportMutual funds are not bank deposits or obligations, are not guaranteed by any bank and are not insured or guaranteed by the U.S. government, the Federal Deposit Insurance Corporation, the Federal Reserve Board or any other government agency. Investment in mutual funds involves investment risk, including the possible loss of principal.
This Report is authorized for distribution to prospective investors only when preceded or accompanied by the Fund's Confidential Private Offering Memorandum, which contains facts concerning its objective and policies, management fees, expenses and other information.
Emerging Markets Fixed Income Core Fund
Federated Investors Funds
4000 Ericsson Drive
Warrendale, PA 15086-7561
Contact us at FederatedInvestors.com
or call 1-800-341-7400.
Federated Securities Corp., Distributor
Cusip 31409R102
28172 (1/12)
Federated is a registered trademark of Federated Investors, Inc.
2012 © Federated Investors, Inc.
Item 2. Code of Ethics
(a) As of the end of the period covered by this report, the registrant has adopted a code of ethics (the "Section 406 Standards for Investment Companies - Ethical Standards for Principal Executive and Financial Officers") that applies to the registrant's Principal Executive Officer and Principal Financial Officer; the registrant's Principal Financial Officer also serves as the Principal Accounting Officer.
(c) Not Applicable
(d) Not Applicable
(e) Not Applicable
(f)(3) The registrant hereby undertakes to provide any person, without charge, upon request, a copy of the code of ethics. To request a copy of the code of ethics, contact the registrant at 1-800-341-7400, and ask for a copy of the Section 406 Standards for Investment Companies - Ethical Standards for Principal Executive and Financial Officers.
Item 3. Audit Committee Financial Expert
The registrant's Board has determined that each of the following members of the Board's Audit Committee is an “audit committee financial expert,” and is "independent," for purposes of this Item: Nicholas P. Constantakis, Charles F. Mansfield, Jr., Thomas M. O'Neill and John S. Walsh.
Item 4. Principal Accountant Fees and Services
(a) Audit Fees billed to the registrant for the two most recent fiscal years:
Fiscal year ended 2011 - $26,950
Fiscal year ended 2010 - $43,900
(b) Audit-Related Fees billed to the registrant for the two most recent fiscal years:
Fiscal year ended 2011 - $0
Fiscal year ended 2010 - $49
Travel to Audit Committee Meeting.
Amount requiring approval of the registrant’s audit committee pursuant to paragraph (c)(7)(ii) of Rule 2-01 of Regulation S-X, $0 and $0 respectively.
(c) Tax Fees billed to the registrant for the two most recent fiscal years:
Fiscal year ended 2011 - $0
Fiscal year ended 2010 - $0
Amount requiring approval of the registrant’s audit committee pursuant to paragraph (c)(7)(ii) of Rule 2-01 of Regulation S-X, $1,012 and $0 respectively. Fiscal year ended 2011- Fees for review of Federal and state taxes.
(d) All Other Fees billed to the registrant for the two most recent fiscal years:
Fiscal year ended 2011 - $0
Fiscal year ended 2010 - $0
Amount requiring approval of the registrant’s audit committee pursuant to paragraph (c)(7)(ii) of Rule 2-01 of Regulation S-X, $3,051 and $1,852 respectively. Fiscal year ended 2011- Service fee for analysis of potential Passive Foreign Investment Company holdings. Fiscal year ended 2010- Service fee for analysis of potential Passive Foreign Investment Company holdings.
(e)(1) Audit Committee Policies regarding Pre-approval of Services.
The Audit Committee is required to pre-approve audit and non-audit services performed by the independent auditor in order to assure that the provision of such services do not impair the auditor’s independence. Unless a type of service to be provided by the independent auditor has received general pre-approval, it will require specific pre-approval by the Audit Committee. Any proposed services exceeding pre-approved cost levels will require specific pre-approval by the Audit Committee.
Certain services have the general pre-approval of the Audit Committee. The term of the general pre-approval is 12 months from the date of pre-approval, unless the Audit Committee specifically provides for a different period. The Audit Committee will annually review the services that may be provided by the independent auditor without obtaining specific pre-approval from the Audit Committee and may grant general pre-approval for such services. The Audit Committee will revise the list of general pre-approved services from time to time, based on subsequent determinations. The Audit Committee will not delegate its responsibilities to pre-approve services performed by the independent auditor to management.
The Audit Committee has delegated pre-approval authority to its Chairman. The Chairman will report any pre-approval decisions to the Audit Committee at its next scheduled meeting. The Committee will designate another member with such pre-approval authority when the Chairman is unavailable.
AUDIT SERVICES
The annual Audit services engagement terms and fees will be subject to the specific pre-approval of the Audit Committee. The Audit Committee must approve any changes in terms, conditions and fees resulting from changes in audit scope, registered investment company (RIC) structure or other matters.
In addition to the annual Audit services engagement specifically approved by the Audit Committee, the Audit Committee may grant general pre-approval for other Audit Services, which are those services that only the independent auditor reasonably can provide. The Audit Committee has pre-approved certain Audit services, all other Audit services must be specifically pre-approved by the Audit Committee.
AUDIT-RELATED SERVICES
Audit-related services are assurance and related services that are reasonably related to the performance of the audit or review of the Company’s financial statements or that are traditionally performed by the independent auditor. The Audit Committee believes that the provision of Audit-related services does not impair the independence of the auditor, and has pre-approved certain Audit-related services, all other Audit-related services must be specifically pre-approved by the Audit Committee.
TAX SERVICES
The Audit Committee believes that the independent auditor can provide Tax services to the Company such as tax compliance, tax planning and tax advice without impairing the auditor’s independence. However, the Audit Committee will not permit the retention of the independent auditor in connection with a transaction initially recommended by the independent auditor, the purpose of which may be tax avoidance and the tax treatment of which may not be supported in the Internal Revenue Code and related regulations. The Audit Committee has pre-approved certain Tax services, all Tax services involving large and complex transactions must be specifically pre-approved by the Audit Committee.
ALL OTHER SERVICES
With respect to the provision of services other than audit, review or attest services the pre-approval requirement is waived if:
(1) The aggregate amount of all such services provided constitutes no more than five percent of the total amount of revenues paid by the registrant, the registrant’s adviser (not including any sub-adviser whose role is primarily portfolio management and is subcontracted with or overseen by another investment adviser), and any entity controlling, controlled by, or under common control with the investment adviser that provides ongoing services to the registrant to its accountant during the fiscal year in which the services are provided;
(2) Such services were not recognized by the registrant, the registrant’s adviser (not including any sub-adviser whose role is primarily portfolio management and is subcontracted with or overseen by another investment adviser), and any entity controlling, controlled by, or under common control with the investment adviser that provides ongoing services to the registrant at the time of the engagement to be non-audit services; and
(3) Such services are promptly brought to the attention of the Audit Committee of the issuer and approved prior to the completion of the audit by the Audit Committee or by one or more members of the Audit Committee who are members of the board of directors to whom authority to grant such approvals has been delegated by the Audit Committee.
The Audit Committee may grant general pre-approval to those permissible non-audit services classified as All Other services that it believes are routine and recurring services, and would not impair the independence of the auditor.
The SEC’s rules and relevant guidance should be consulted to determine the precise definitions of prohibited non-audit services and the applicability of exceptions to certain of the prohibitions.
PRE-APPROVAL FEE LEVELS
Pre-approval fee levels for all services to be provided by the independent auditor will be established annually by the Audit Committee. Any proposed services exceeding these levels will require specific pre-approval by the Audit Committee.
PROCEDURES
Requests or applications to provide services that require specific approval by the Audit Committee will be submitted to the Audit Committee by both the independent auditor and the Principal Accounting Officer and/or Internal Auditor, and must include a joint statement as to whether, in their view, the request or application is consistent with the SEC’s rules on auditor independence.
(e)(2) Percentage of services identified in items 4(b) through 4(d) that were approved by the registrants audit committee pursuant to paragraph (c)(7)(i)(C) of Rule 2-01 of Regulation S-X:
4(b)
Fiscal year ended 2011 – 0%
Fiscal year ended 2010 - 0%
Percentage of services provided to the registrants investment adviser and any entity controlling, controlled by, or under common control with the investment adviser that provides ongoing services to the registrant that were approved by the registrants audit committee pursuant to paragraph (c)(7)(i)(C) of Rule 2-01 of Regulation S-X, 0% and 0% respectively.
4(c)
Fiscal year ended 2011 – 0%
Fiscal year ended 2010 – 0%
Percentage of services provided to the registrants investment adviser and any entity controlling, controlled by, or under common control with the investment adviser that provides ongoing services to the registrant that were approved by the registrants audit committee pursuant to paragraph (c)(7)(i)(C) of Rule 2-01 of Regulation S-X, 0% and 0% respectively.
4(d)
Fiscal year ended 2011 – 0%
Fiscal year ended 2010 – 0%
Percentage of services provided to the registrants investment adviser and any entity controlling, controlled by, or under common control with the investment adviser that provides ongoing services to the registrant that were approved by the registrants audit committee pursuant to paragraph (c)(7)(i)(C) of Rule 2-01 of Regulation S-X, 0% and 0% respectively.
(f) NA
(g) Non-Audit Fees billed to the registrant, the registrant’s investment adviser, and certain entities controlling, controlled by or under common control with the investment adviser:
Fiscal year ended 2011 - $24,999
Fiscal year ended 2010 - $29,327
(h) The registrant’s Audit Committee has considered that the provision of non-audit services that were rendered to the registrant’s adviser (not including any sub-adviser whose role is primarily portfolio management and is subcontracted with or overseen by another investment adviser), and any entity controlling, controlled by, or under common control with the investment adviser that provides ongoing services to the registrant that were not pre-approved pursuant to paragraph (c)(7)(ii) of Rule 2-01 of Regulation S-X is compatible with maintaining the principal accountant’s independence.
Item 5. Audit Committee of Listed Registrants
Not Applicable
Item 6. Schedule of Investments
(a) The registrant’s Schedule of Investments is included as part of the Report to Stockholders filed under Item 1 of this form.
(b) Not Applicable; Fund had no divestments during the reporting period covered since the previous Form N-CSR filing.
Item 7. Disclosure of Proxy Voting Policies and Procedures for Closed-End Management Investment Companies
Not Applicable
Item 8. Portfolio Managers of Closed-End Management Investment Companies
Not Applicable
Item 9. Purchases of Equity Securities by Closed-End Management Investment Company and Affiliated Purchasers
Not Applicable
Item 10. Submission of Matters to a Vote of Security Holders
No changes to report.
Item 11. Controls and Procedures
(a) The registrant’s President and Treasurer have concluded that the
registrant’s disclosure controls and procedures (as defined in rule 30a-3(c) under the Act) are effective in design and operation and are sufficient to form the basis of the certifications required by Rule 30a-(2) under the Act, based on their evaluation of these disclosure controls and procedures within 90 days of the filing date of this report on Form N-CSR.
(b) There were no changes in the registrant’s internal control over financial reporting (as defined in rule 30a-3(d) under the Act) during the second fiscal quarter of the period covered by this report that have materially affected, or are reasonably likely to materially affect, the registrant’s internal control over financial reporting.
Item 12. Exhibits
(a)(1) Code of Ethics- Not Applicable to this Annual Report.
(a)(2) Certifications of Principal Executive Officer and Principal Financial Officer.
(a)(3) Not Applicable.
(b) Certifications pursuant to 18 U.S.C. Section 1350.
SIGNATURES
Pursuant to the requirements of the Securities Exchange Act of 1934 and the Investment Company Act of 1940, the registrant has duly caused this report to be signed on its behalf by the undersigned, thereunto duly authorized.
Registrant Federated Core Trust II, L.P.
By /S/ Richard A. Novak
Richard A. Novak, Principal Financial Officer
Date January 23, 2012
Pursuant to the requirements of the Securities Exchange Act of 1934 and the Investment Company Act of 1940, this report has been signed below by the following persons on behalf of the registrant and in the capacities and on the dates indicated.
By /S/ J. Christopher Donahue
J. Christopher Donahue, Principal Executive Officer
Date January 23, 2012
By /S/ Richard A. Novak
Richard A. Novak, Principal Financial Officer
Date January 23, 2012