United States
Securities and Exchange Commission
Washington, D.C. 20549
Form N-CSR
Certified Shareholder Report of Registered Management Investment Companies
811-10625
(Investment Company Act File Number)
Federated Core Trust II, L.P.
_______________________________________________________________
(Exact Name of Registrant as Specified in Charter)
Federated Investors Funds
4000 Ericsson Drive
Warrendale, Pennsylvania 15086-7561
(Address of Principal Executive Offices)
(412) 288-1900
(Registrant's Telephone Number)
John W. McGonigle, Esquire
Federated Investors Tower
1001 Liberty Avenue
Pittsburgh, Pennsylvania 15222-3779
(Name and Address of Agent for Service)
(Notices should be sent to the Agent for Service)
Date of Fiscal Year End: 11/30/14
Date of Reporting Period: 11/30/14
Item 1. Reports to Stockholders

Annual Shareholder Report
November 30, 2014
Emerging Markets Fixed Income Core Fund
A Portfolio of Federated Core Trust II, L.P.
Not FDIC Insured • May Lose Value • No Bank Guarantee
CONTENTS
| 1 |
| 3 |
| 4 |
| 16 |
| 17 |
| 18 |
| 19 |
| 20 |
| 27 |
| 28 |
| 29 |
| 32 |
| 34 |
| 34 |
Management's Discussion of Fund Performance (unaudited)
The total return of Emerging Markets Fixed Income Core Fund (the “Fund”), based on net asset value for the 12-month reporting period ended November 30, 2014, was 6.66%. The total return for the Barclays Emerging Markets USD Aggregate Index (BEMAI),1 the Fund's broad-based securities market index, was 7.80% for the same period. The Fund's total return for the most recently completed fiscal year reflected actual cash flows, transaction costs and other expenses that were not reflected in the total return of the BEMAI.
During the reporting period, the most significant factors affecting the Fund's performance relative to the BEMAI were: (1) the effective duration2,3 of the portfolio (the portfolio's price sensitivity to interest rates); (2) sector allocation (the allocation of the portfolio among securities with similar issuers); (3) regional and country allocation (the positioning of the Fund's assets in different countries and regions); and (4) currency (an allocation to markets denominated in local currencies).4
MARKET OVERVIEW
The 12-month reporting period presented a challenging investment environment. Impacts from the broad collapse of commodity prices during the last few months of the year were heightened by a decline in oil prices of historic dimensions. This structural supply shock, to which the United States has become a major contributor, resulted in a price drop of approximately 50% over the last six months of 2014. Several emerging market (EM) countries rely greatly on commodity exports to fund their balance of payments and the steep drop in oil prices served as a particular stress to oil-exporting countries, affecting issuers in Russia, Venezuela, Ecuador, Nigeria, Malaysia, Saudi Arabia and other Middle East nations. Russian issuers were also penalized by the decision of the U.S. and Europe to impose substantial economic sanctions in response to that country's invasion of Crimea and its interference in Ukraine's internal conflict.
There was increasing confirmation of the divergence of economic activity between the U.S. and the rest of the world during the reporting period. European economic growth continued to fall short of expectations. More worrisome was that eurozone malaise had inflation readings falling to below 1%, dashing hopes of a European contribution to the global recovery. Japan's fall back into recession had a similar impact. Although repetitive stimulus measures kept China's growth from a deep slide, its economic deceleration further contributed to lower commodity prices.
DURATION
Credit markets denominated in U.S. dollars have two types of duration: U.S. interest rate duration (IRdur) and spread duration (Sdur). Fund management, during the second half of 2014 reduced IRdur to about 80% of the BEMAI and actively managed the Sdur. The reduction of IRdur was executed primarily through 5-year interest rate derivative hedging. Over the period, the “belly” (3-5 years) U.S. interest rates did sell-off by 25-50 basis points (bps) and therefore helped Fund performance. On the other hand, the long end of the U.S. Treasury yield curve rallied about 50 bps and therefore the lack of IRdur sensitivity negatively affected Fund performance by about 50 bps. The average IRdur was about 88% of benchmark throughout the year.
REGIONAL ALLOCATION
Notable country allocation contributions included the large underweight positions in Venezuela (+13 bps of alpha), Russia (-41 bps of alpha) and China (-20 bps of alpha) relative to the BEMAI. The decline in oil prices affected EM assets, and the Fund proactively reduced exposure to Russia and effectively eliminated all exposure to Venezuela and Ecuador.
CURRENCY
The Fund had a long U.S. dollar bias for most of the year. The U.S. dollar long against the euro contributed about 63 bps to Fund performance during the reporting period.
| 1 | Please see the footnotes to the line graphs under “Fund Performance and Growth of a $10,000 Investment” below for the definition of, and more information about, the BEMAI. |
| 2 | Duration is a measure of a security's price sensitivity to changes in interest rates. Securities with longer durations are more sensitive to changes in interest rates than securities with shorter durations. |
| 3 | Bond prices are sensitive to changes in interest rates, and a rise in interest rates can cause a decline in their prices. |
| 4 | International investing involves special risks including currency risk, increased volatility, political risks and differences in auditing and other financial standards. Prices of emerging market securities can be significantly more volatile than the prices of securities in developed countries, and currency risk and political risks are accentuated in emerging markets. |
Annual Shareholder Report
FUND PERFORMANCE AND GROWTH OF A $10,000 INVESTMENT
The graph below illustrates the hypothetical investment of $10,0001 in the Emerging Markets Fixed Income Core Fund from November 30, 2004 to November 30, 2014, compared to Barclays Emerging Markets USD Aggregate Index (BEMAI).2 The Average Annual Total Return table below shows returns averaged over the stated periods.
Growth of a $10,000 Investment
Growth of $10,000 as of November 30, 2014
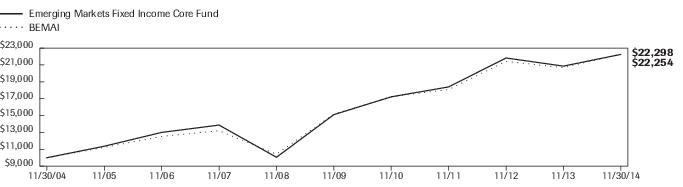
| Emerging Markets Fixed Income Core Fund | | BEMAI |
| F | I |
| 11/30/2004 | 10,000 | 10,000 |
| 11/30/2005 | 11,364 | 11,226 |
| 11/30/2006 | 13,004 | 12,520 |
| 11/30/2007 | 13,872 | 13,202 |
| 11/30/2008 | 10,057 | 10,420 |
| 11/30/2009 | 15,110 | 15,171 |
| 11/30/2010 | 17,222 | 17,242 |
| 11/30/2011 | 18,397 | 18,089 |
| 11/30/2012 | 21,829 | 21,428 |
| 11/30/2013 | 20,865 | 20,686 |
| 11/30/2014 | 22,254 | 22,298 |
41 graphic description end -->
Average Annual Total Return for the Period Ended 11/30/2014
| | 1 Year | 5 Years | 10 Years |
| Fund | 6.66% | 8.05% | 8.33% |
| BEMAI | 7.80% | 8.01% | 8.35% |
Performance data quoted represents past performance which is no guarantee of future results. Investment return and principal value will fluctuate so that an investor's shares, when redeemed, may be worth more or less than their original cost. Mutual fund performance changes over time and current performance may be lower or higher than what is stated. For current to the most recent month-end performance and after-tax returns, call 1-800-341-7400. Returns shown do not reflect the deduction of taxes that a shareholder would pay on Fund distributions or the redemption of Fund shares. Mutual funds are not obligations of or guaranteed by any bank and are not federally insured.
| 1 | The Fund's performance assumes the reinvestment of all dividends and distributions. The BEMAI has been adjusted to reflect reinvestment of dividends on securities in the index. |
| 2 | The BEMAI tracks total returns for external-currency-denominated debt instruments of the emerging markets. The BEMAI is not adjusted to reflect sales charges, expenses or other fees that the Securities and Exchange Commission requires to be reflected in the Fund's performance. The index is unmanaged and, unlike the Fund, is not affected by cash flows. It is not possible to invest directly in an index. |
Annual Shareholder Report
Portfolio of Investments Summary Table (unaudited)
At November 30, 2014, the Fund's issuer country exposure composition was as follows:
| Country | Exposure as a Percentage
of Total Net Assets1 |
| Brazil | 16.0% |
| Mexico | 10.5% |
| Russia | 10.3% |
| Turkey | 5.3% |
| Hungary | 3.3% |
| Peru | 3.1% |
| Colombia | 3.0% |
| United Arab Emirates | 3.0% |
| Argentina | 2.6% |
| Indonesia | 2.6% |
| China | 2.3% |
| Chile | 2.1% |
| Bahrain | 1.7% |
| Philippines | 1.7% |
| Qatar | 1.5% |
| Kenya | 1.4% |
| South Africa | 1.4% |
| Croatia | 1.3% |
| Kazakhstan | 1.3% |
| Venezuela | 1.3% |
| Morocco | 1.2% |
| Bulgaria | 1.0% |
| Ghana | 1.0% |
| Other2 | 13.2% |
| Derivatives3 | 0.1% |
| Other Security Type4,5 | 0.0% |
| Cash Equivalents6 | 6.4% |
| Other Assets and Liabilities—Net7 | 1.4% |
| TOTAL | 100% |
| 1 | This table depicts the Fund's exposure to various countries through its investment in foreign fixed-income securities along with the Fund's holdings of cash equivalents and other assets and liabilities. With respect to foreign fixed-income securities, country allocations are based primarily on the country in which the issuing company (the “Issuer”) has registered the security. However, the Fund's Adviser may allocate the Issuer to a country based on other factors such as the location of the Issuer's head office, the jurisdiction of the Issuer's incorporation, the location of the principal trading market for the Issuer's securities or the country from which a majority of the Issuer's revenue is derived. |
| 2 | For purposes of this table, issuer country exposure which constitutes less than 1.00% of the Fund's total net assets have been aggregated under the designation “Other”. |
| 3 | Based upon net unrealized appreciation (depreciation) or value of the derivative contracts as applicable. Derivative contracts may consist of futures, forwards, options and swaps. The impact of a derivative contract on the Fund's performance may be larger than its unrealized appreciation (depreciation) or value may indicate. In many cases, the notional value or amount of a derivative contract may provide a better indication of the contract's significance to the portfolio. More complete information regarding the Fund's direct investments in derivative contracts, including unrealized appreciation (depreciation), value, and notional values or amounts of such contracts, can be found in the table at the end of the Portfolio of Investments included in this Report. |
| 4 | Other Security Type consists of purchased call swaptions. |
| 5 | Represents less than 0.1%. |
| 6 | Cash Equivalents include any investments in money market mutual funds and/or overnight repurchase agreements. This does not include cash held in the Fund that is denominated in foreign currencies. See the Statements of Assets and Liabilities for information regarding the Fund's foreign cash position. |
| 7 | Assets, other than investments in securities and derivative contracts, less liabilities. See Statement of Assets and Liabilities. |
Annual Shareholder Report
Portfolio of Investments
November 30, 2014
Principal
Amount,
Foreign
Currency
Par Amount,
or Shares | | | Value in
U.S. Dollars |
| | | CORPORATE BONDS—62.1% | |
| | | Aerospace & Defense—0.3% | |
| $3,283,000 | 1,2 | Embraer Overseas Ltd., Sr. Unsecd. Note, Series 144A, 5.696%, 9/16/2023 | $3,541,536 |
| | | Automotive—1.1% | |
| 7,000,000 | 1,2 | Metalsa SA De CV, Series 144A, 4.90%, 4/24/2023 | 6,475,000 |
| 4,450,000 | 1,2 | Tenedora Nemak SA de CV, Series 144A, 5.50%, 2/28/2023 | 4,567,925 |
| | | TOTAL | 11,042,925 |
| | | Banking—16.1% | |
| 2,300,000 | | ADCB Finance Cayman, Ltd., Series EMTN, 4.50%, 3/6/2023 | 2,374,750 |
| 450,000 | | BBVA Banco Continental, Series REGS, 5.00%, 8/26/2022 | 473,625 |
| 4,290,000 | 1,2 | BBVA Bancomer SA Mexico, Jr. Sub. Note, Series 144A, 5.35%, 11/12/2029 | 4,287,855 |
| 1,050,000 | | BBVA Paraguay SA, Series REGS, 9.75%, 2/11/2016 | 1,101,238 |
| 4,285,000 | 1,2 | Banco ABC Brasil SA, Sub. Note, Series 144A, 7.875%, 4/8/2020 | 4,542,100 |
| 600,000 | | Banco Bradesco SA, Series REGS, 5.90%, 1/16/2021 | 639,750 |
| 2,100,000 | | Banco Bradesco SA, Series REGS, 6.75%, 9/29/2019 | 2,375,625 |
| 400,000 | | Banco Bradesco SA, Sub., Series REGS, 5.75%, 3/1/2022 | 419,000 |
| 2,600,000 | | Banco Btg Pactual/Cayman, Series REGS, 5.75%, 9/28/2022 | 2,522,000 |
| 4,000,000 | | Banco Davivienda SA, Series REGS, 5.875%, 7/9/2022 | 4,090,000 |
| 3,000,000 | | Banco Daycoval SA, Series REGS, 5.75%, 3/19/2019 | 3,030,000 |
| 920,000 | | Banco de Credito del Peru, Series REGS, 6.125%, 4/24/2027 | 993,784 |
| 3,200,000 | | Banco Do Brasil SA, Jr. Sub. Note, Series REGS, 9.25%, 10/29/2049 | 3,337,600 |
| 2,000,000 | 1,2 | Banco Internacional del Peru, Jr. Sub. Note, Series 144A, 8.50%, 4/23/2070 | 2,133,303 |
| 2,000,000 | 1,2 | Banco Internacional del Peru, Sr. Unsecd. Note, Series 144A, 5.75%, 10/7/2020 | 2,180,000 |
| 1,500,000 | | Banco Internacional del Peru, Sr. Unsecd. Note, Series REGS, 5.75%, 10/7/2020 | 1,635,000 |
| 600,000 | | Banco Pan SA, Series REGS, 8.50%, 4/23/2020 | 649,470 |
| 1,900,000 | 1,2 | Banco Reservas Rep Domin, Series 144A, 7.00%, 2/1/2023 | 1,928,500 |
| 250,000 | | Banco Reservas Rep Domin, Series REGS, 7.00%, 2/1/2023 | 253,750 |
| 4,130,000 | 1,2 | Bank of China Ltd., Series 144A, 5.00%, 11/13/2024 | 4,233,134 |
| 3,610,000 | | Burgan Finance No.1 Ltd., Series REGS, 7.875%, 9/29/2020 | 4,256,190 |
| 4,400,000 | 1,2 | Caixa Economica Federal, Sub. Note, Series 144A, 7.25%, 7/23/2024 | 4,422,000 |
| 4,575,000 | | Corpbanca, 3.125%, 1/15/2018 | 4,602,665 |
| 7,030,000 | 1,2 | Corpbanca, Series 144A, 3.875%, 9/22/2019 | 7,146,262 |
| 4,100,000 | | Emirates NBD Tier 1 Ltd., 5.75%, 5/29/2049 | 4,090,570 |
| 7,292,000 | 1,2 | Export Credit Bank of Turkey, Series 144A, 5.00%, 9/23/2021 | 7,536,924 |
| 3,900,000 | 1,2 | Finansbank AS, Series 144A, 5.15%, 11/1/2017 | 4,060,290 |
| 3,400,000 | 1,2 | Finansbank AS, Series 144A, 6.25%, 4/30/2019 | 3,629,500 |
| 800,000 | 1,2 | GTB Finance BV, Series 144A, 6.00%, 11/8/2018 | 778,000 |
| 3,500,000 | 1,2 | Global Bank Corp., Sr. Unsecd. Note, Series 144A, 5.125%, 10/30/2019 | 3,578,750 |
| 2,000,000 | 1,2 | ICICI Bank Ltd., Sr. Unsecd. Note, Series 144A, 5.75%, 11/16/2020 | 2,250,208 |
| 4,000,000 | | Itau Unibanco Holding SA, Series REGS, 5.125%, 5/13/2023 | 4,012,000 |
| 7,500,000 | | Itau Unibanco Holding SA, Sub., Series REGS, 5.50%, 8/6/2022 | 7,661,250 |
| 99,600,000 | | Ojsc Russ Agric Bk(Rshb), Note, Series EMTN, 8.70%, 3/17/2016 | 1,877,400 |
| 1,100,000 | | Ojsc Russ Agric Bk(Rshb), Sr. Unsecd. Note, Series REGS, 5.298%, 12/27/2017 | 1,051,875 |
| 2,355,000 | 1,2 | RSHB Capital S.A., Series 144A, 5.10%, 7/25/2018 | 2,229,073 |
| 200,000 | | RSHB Capital S.A., Series REGS, 5.10%, 7/25/2018 | 189,306 |
| 4,400,000 | | Sibur Securities Ltd., Series REGS, 3.914%, 1/31/2018 | 3,773,000 |
Annual Shareholder Report
Principal
Amount,
Foreign
Currency
Par Amount,
or Shares | | | Value in
U.S. Dollars |
| | | CORPORATE BONDS—continued | |
| | | Banking—continued | |
| $2,000,000 | 1,2 | Turkiye Garanti Bankasi A.S., Series 144A, 5.25%, 9/13/2022 | $2,102,000 |
| 5,145,000 | 1,2 | Turkiye Is Bankasi (Isbank), Series 144A, 5.00%, 6/25/2021 | 5,296,778 |
| 6,000,000 | 1,2 | Turkiye Is Bankasi (Isbank), Sr. Unsecd. Note, Series 144A, 5.00%, 4/30/2020 | 6,211,200 |
| 3,900,000 | 1,2 | Turkiye Vakiflar Bankasi T.A.O., Series 144A, 3.75%, 4/15/2018 | 3,911,700 |
| 1,360,000 | 1,2 | Turkiye Vakiflar Bankasi T.A.O., Series 144A, 5.00%, 10/31/2018 | 1,415,488 |
| 200,000 | | Turkiye Vakiflar Bankasi T.A.O., Series REGS, 5.00%, 10/31/2018 | 208,160 |
| 20,350,000 | | VTB Bank OJSC, Series REGS, 6.25%, 6/30/2035 | 20,526,435 |
| 4,110,000 | 1,2 | VTB Capital SA, Series 144A, 6.95%, 10/17/2022 | 3,534,600 |
| 1,560,000 | | Vnesheconombank (VEB), Series REGS, 5.942%, 11/21/2023 | 1,378,650 |
| 1,515,000 | | Vnesheconombank (VEB), Series REGS, 6.025%, 7/5/2022 | 1,384,331 |
| 2,600,000 | 1,2 | Vnesheconombank (VEB), Sr. Unsecd. Note, Series 144A, 5.375%, 2/13/2017 | 2,556,580 |
| 5,200,000 | | Vnesheconombank (VEB), Sr. Unsecd. Note, Series REGS, 6.902%, 7/9/2020 | 5,083,000 |
| 1,650,000 | 1,2 | Yapi ve Kredi Bankasi A.S., Series 144A, 5.25%, 12/3/2018 | 1,730,190 |
| 2,740,000 | 1,2 | Zenith Bank Ltd., Series 144A, 6.25%, 4/22/2019 | 2,681,775 |
| | | TOTAL | 168,366,634 |
| | | Beverage & Tobacco—0.8% | |
| 400,000 | 1,2 | Ajecorp BV, Series 144A, 6.50%, 5/14/2022 | 362,000 |
| 4,400,000 | | Ajecorp BV, Series REGS, 6.50%, 5/14/2022 | 3,982,000 |
| 3,000,000 | 1,2 | Corp Lindley SA, Series 144A, 4.625%, 4/12/2023 | 2,933,700 |
| 1,000,000 | | Corp Lindley SA, Series REGS, 6.75%, 11/23/2021 | 1,095,000 |
| | | TOTAL | 8,372,700 |
| | | Broadcast Radio & TV—0.7% | |
| 1,413,000 | | Grupo Televisa SA, 6.625%, 3/18/2025 | 1,745,083 |
| 3,800,000 | | Grupo Televisa SA, Sr. Note, 8.50%, 3/11/2032 | 5,303,341 |
| | | TOTAL | 7,048,424 |
| | | Building & Development—0.6% | |
| 3,350,000 | 1,2 | Odebrecht SA, Company Guarantee, Series 144A, 7.50%, 9/29/2049 | 3,182,500 |
| 3,425,000 | 1,2 | Odebrecht SA, Series 144A, 5.25%, 6/27/2029 | 3,116,750 |
| | | TOTAL | 6,299,250 |
| | | Building Materials—1.2% | |
| 1,555,000 | 1,2 | Cemex SAB de CV, Bond, Series 144A, 6.50%, 12/10/2019 | 1,624,975 |
| 6,745,000 | | Cemex SAB de CV, Series REGS, 5.233%, 9/30/2015 | 6,887,994 |
| 3,760,000 | 1,2 | Rearden G Holdings EINS GmbH, Company Guarantee, Series 144A, 7.875%, 3/30/2020 | 3,872,800 |
| | | TOTAL | 12,385,769 |
| | | Chemicals & Plastics—2.0% | |
| 2,000,000 | 1,2 | ALPEK SA de CV, Series 144A, 4.50%, 11/20/2022 | 2,020,000 |
| 2,595,000 | | ALPEK SA de CV, Series REGS, 4.50%, 11/20/2022 | 2,620,950 |
| 1,200,000 | 1,2 | Elementia SA, Series 144A, 5.50%, 1/15/2025 | 1,207,800 |
| 9,950,000 | 1,2 | Groupe Office Cherifien des Phosphates SA, Sr. Unsecd. Note, Series 144A, 5.625%, 4/25/2024 | 10,561,428 |
| 4,750,000 | | Nitrogenmuvek ZRT, Series REGS, 7.875%, 5/21/2020 | 4,808,900 |
| | | TOTAL | 21,219,078 |
| | | Conglomerates—0.3% | |
| 3,000,000 | | Hutch Whampoa Int. 12 Ltd., Series REGS, 6.00%, 5/29/2049 | 3,202,500 |
| | | Consumer Cyclical - Services—0.3% | |
| 2,915,000 | 1,2 | Alibaba Group Holding Ltd., Sr. Unsecd. Note, Series 144A, 3.125%, 11/28/2021 | 2,918,781 |
| | | Consumer Products—0.7% | |
| 1,500,000 | | Fomento Economico Mexicano, SA de C.V., 2.875%, 5/10/2023 | 1,417,590 |
Annual Shareholder Report
Principal
Amount,
Foreign
Currency
Par Amount,
or Shares | | | Value in
U.S. Dollars |
| | | CORPORATE BONDS—continued | |
| | | Consumer Products—continued | |
| $3,250,000 | | Fomento Economico Mexicano, SA de C.V., 4.375%, 5/10/2043 | $3,064,574 |
| 2,800,000 | 1,2 | InRetail Consumer, Sr. Unsecd. Note, Series 144A, 5.25%, 10/10/2021 | 2,829,400 |
| | | TOTAL | 7,311,564 |
| | | Farming & Agriculture—0.6% | |
| 4,840,000 | 1,2 | Kazagro Natl Mgmt Hldng., Series 144A, 4.625%, 5/24/2023 | 4,477,000 |
| 250,000 | | Kazagro Natl Mgmt Hldng., Series REGS, 4.625%, 5/24/2023 | 231,250 |
| 1,000,000 | | Marfrig Overseas Ltd., Series REGS, 9.625%, 11/16/2016 | 1,065,000 |
| | | TOTAL | 5,773,250 |
| | | Finance—0.8% | |
| 1,000,000 | 1,2 | Corp Financi De Desarrol, Sr. Unsecd. Note, Series 144A, 4.75%, 2/8/2022 | 1,052,500 |
| 500,000 | | Gruposura Finance, Company Guarantee, Series REGS, 5.70%, 5/18/2021 | 545,000 |
| 5,000,000 | 1,2 | Mubadala Ge Capital Ltd., Sr. Unsecd. Note, Series 144A, 3.00%, 11/10/2019 | 5,044,000 |
| 2,000,000 | | Suam Finance BV, Sr. Unsecd. Note, Series REGS, 4.875%, 4/17/2024 | 2,044,400 |
| | | TOTAL | 8,685,900 |
| | | Financial Intermediaries—1.8% | |
| 2,400,000 | | ADIB Capital Invest 1 Ltd., 6.375%, 10/29/2049 | 2,508,000 |
| 2,700,000 | 1,2 | Banco Santander, S.A., Series 144A, 4.125%, 11/9/2022 | 2,727,000 |
| 3,600,000 | 1,2 | Cimpor Financial Operations, Series 144A, 5.75%, 7/17/2024 | 3,370,500 |
| 3,000,000 | | Financiera Independencia S.A.B. de C.V, Sr. Unsecd. Note, Series REGS, 7.50%, 6/3/2019 | 3,075,000 |
| 200,000 | | Helios Towers Finance NL, 8.375%, 7/15/2019 | 181,000 |
| 1,700,000 | 1,2 | Investcorp SA, Series 144A, 8.25%, 11/1/2017 | 1,859,715 |
| 4,900,000 | 1,2 | Trust F/1401, Series 144A, 5.25%, 12/15/2024 | 5,157,250 |
| | | TOTAL | 18,878,465 |
| | | Food Products—2.3% | |
| 1,300,000 | | Cosan Luxembourg SA, Series REGS, 5.00%, 3/14/2023 | 1,222,000 |
| 1,420,000 | | Gruma SAB de CV, Series REGS, 7.75%, 12/29/2049 | 1,434,200 |
| 2,620,000 | 1,2 | Gruma SAB de CV, Sr. Unsecd. Note, Series 144A, 4.875%, 12/1/2024 | 2,685,500 |
| 2,810,000 | 1,2 | Grupo Bimbo SAB de CV, Sr. Unsecd. Note, Series 144A, 4.50%, 1/25/2022 | 2,957,638 |
| 2,400,000 | | JBS Fiance II Ltd., Sr. Unsecd. Note, Series REGS, 8.25%, 1/29/2018 | 2,526,000 |
| 4,000,000 | 1,2 | JBS Investments GmbH, Series 144A, 7.75%, 10/28/2020 | 4,360,000 |
| 3,000,000 | | JBS Investments GmbH, Series REGS, 7.75%, 10/28/2020 | 3,270,000 |
| 5,300,000 | | Minerva Luxembourg SA, Sr. Unsecd. Note, Series REGS, 7.75%, 1/31/2023 | 5,486,560 |
| | | TOTAL | 23,941,898 |
| | | Forest Products—0.1% | |
| 1,525,000 | 1,2 | Klabin Finance SA, Series 144A, 5.25%, 7/16/2024 | 1,490,230 |
| | | Metals & Mining—6.7% | |
| 1,658,000 | | Anglogold Ashanti Holdings PLC, Sr. Unsecd. Note, 5.125%, 8/1/2022 | 1,590,141 |
| 3,480,000 | | Anglogold Ashanti Holdings PLC, Sr. Unsecd. Note, 8.50%, 7/30/2020 | 3,754,050 |
| 3,100,000 | | CSN Resources SA, Series REGS, 6.50%, 7/21/2020 | 3,014,750 |
| 2,600,000 | 1,2 | Codelco, Inc., Series 144A, 3.00%, 7/17/2022 | 2,535,889 |
| 5,000,000 | 1,2 | Codelco, Inc., Sr. Unsecd. Note, Series 144A, 4.875%, 11/4/2044 | 5,069,600 |
| 700,000 | 1,2 | Compania Minera Ares SAC, Series 144A, 7.75%, 1/23/2021 | 742,875 |
| 4,750,000 | | Evraz Group SA, Sr. Unsecd. Note, Series REGS, 6.50%, 4/22/2020 | 3,906,875 |
| 5,470,000 | | GTL Trade Finance, Inc., Sr. Unsecd. Note, Series REGS, 5.893%, 4/29/2024 | 5,606,750 |
| 7,500,000 | | Metinvest BV, Sr. Unsecd. Note, Series REGS, 8.75%, 2/14/2018 | 4,969,500 |
| 3,635,000 | | Nord Gold NV, Series REGS, 6.375%, 5/7/2018 | 3,371,462 |
| 1,309,000 | | OAO TMK, 7.75%, 1/27/2018 | 1,230,460 |
Annual Shareholder Report
Principal
Amount,
Foreign
Currency
Par Amount,
or Shares | | | Value in
U.S. Dollars |
| | | CORPORATE BONDS—continued | |
| | | Metals & Mining—continued | |
| $4,400,000 | | OAO TMK, Series REGS, 6.75%, 4/3/2020 | $3,608,000 |
| 11,602,000 | 1,2 | Polyus Gold International, Ltd., Series 144A, 5.625%, 4/29/2020 | 10,209,760 |
| 4,950,000 | 1,2 | Samarco Mineracao SA, Series 144A, 4.125%, 11/1/2022 | 4,547,812 |
| 1,100,000 | 1,2 | Samarco Mineracao SA, Series 144A, 5.75%, 10/24/2023 | 1,101,375 |
| 610,000 | | Samarco Mineracao SA, Series REGS, 4.125%, 11/1/2022 | 560,438 |
| 1,450,000 | | Samarco Mineracao SA, Series REGS, 5.75%, 10/24/2023 | 1,451,813 |
| 600,000 | 1,2 | Samarco Mineracao SA, Sr. Unsecd. Note, Series 144A, 5.375%, 9/26/2024 | 576,000 |
| 7,035,000 | 1,2 | Tupy SA, Series 144A, 6.625%, 7/17/2024 | 7,070,175 |
| 4,790,000 | | Vale Overseas Ltd., 6.875%, 11/21/2036 | 5,251,890 |
| 300,000 | | Vale SA, 5.625%, 9/11/2042 | 290,565 |
| | | TOTAL | 70,460,180 |
| | | Oil & Gas—13.1% | |
| 1,400,000 | 1,2 | Afren PLC, Series 144A, 6.625%, 12/9/2020 | 1,148,000 |
| 1,230,000 | | Afren PLC, Series REGS, 10.25%, 4/8/2019 | 1,142,719 |
| 2,600,000 | | Afren PLC, Series REGS, 11.50%, 2/1/2016 | 2,561,000 |
| 3,400,000 | 1,2 | Alliance Oil Co. Ltd., Series 144A, 7.00%, 5/4/2020 | 2,346,000 |
| 4,000,000 | | CNOOC Finance 2014 ULC, 4.25%, 4/30/2024 | 4,177,300 |
| 900,000 | 1,2 | Empresa Nacional del Petroleo, Note, Series 144A, 5.25%, 8/10/2020 | 959,990 |
| 1,370,000 | 1,2 | Gazprom Neft OAO, Series 144A, 6.00%, 11/27/2023 | 1,251,621 |
| 2,000,000 | | Gazprom Via Gaz Capital SA, Sr. Unsecd. Note, Series REGS, 4.95%, 7/19/2022 | 1,787,500 |
| 3,000,000 | | KazMunaiGaz Finance Sub B.V., Series REGS, 6.375%, 4/9/2021 | 3,273,600 |
| 1,000,000 | 1,2 | Kazmunaygas National Co., Series 144A, 4.40%, 4/30/2023 | 970,000 |
| 2,900,000 | 1,2 | Kazmunaygas National Co., Series 144A, 5.75%, 4/30/2043 | 2,726,000 |
| 1,500,000 | | Mie Holdings Corp., Series EMTN, 6.875%, 2/6/2018 | 1,391,250 |
| 2,049,810 | | Odbrcht Offshore Drilling Finance Ltd., Series REGS, 6.625%, 10/1/2022 | 2,008,814 |
| 4,830,000 | | Odebrecht Drill VIII/IX, Series REGS, 6.35%, 6/30/2021 | 4,854,150 |
| 5,970,000 | 1,2 | PTT Exploration and Production Public Co., Series 144A, 4.875%, 12/29/2049 | 6,096,863 |
| 2,200,000 | 1,2 | Pacific Rubiales, Series 144A, 5.375%, 1/26/2019 | 2,189,000 |
| 11,700,000 | 1,2 | Pacific Rubiales, Series 144A, 5.625%, 1/19/2025 | 10,822,500 |
| 5,627,000 | 1,2 | Pacific Rubiales, Sr. Unsecd. Note, Series 144A, 7.25%, 12/12/2021 | 5,922,418 |
| 1,150,000 | 1,2 | Pertamina PT, Note, Series 144A, 5.25%, 5/23/2021 | 1,224,750 |
| 5,990,000 | 1,2 | Pertamina PT, Series 144A, 4.30%, 5/20/2023 | 5,945,075 |
| 16,700,000 | | Petrobras Global Finance BV, Sr. Unsecd. Note, 4.375%, 5/20/2023 | 15,465,202 |
| 10,000,000 | | Petrobras Global Finance BV, Sr. Unsecd. Note, 6.25%, 3/17/2024 | 10,273,400 |
| 5,300,000 | | Petrobras International Finance Co., Company Guarantee, 7.875%, 3/15/2019 | 5,848,550 |
| 900,000 | | Petrobras International Finance Co., Sr. Unsecd. Note, 5.375%, 1/27/2021 | 900,612 |
| 1,600,000 | | Petroleos Mexicanos, 6.50%, 6/2/2041 | 1,860,000 |
| 4,650,000 | | Petroleos Mexicanos, Company Guarantee, 8.00%, 5/3/2019 | 5,590,230 |
| 7,000,000 | 1,2 | Petroleos Mexicanos, Unsecd. Note, Series 144A, 4.25%, 1/15/2025 | 7,098,000 |
| 1,125,000 | | Petroleum Co. of Trinidad and Tobago Ltd., Sr. Unsecd. Note, Series REGS, 6.00%, 5/8/2022 | 1,185,469 |
| 6,565,000 | 1,2 | Puma International Financing SA, Series 144A, 6.75%, 2/1/2021 | 6,673,322 |
| 200,000 | | Puma International Financing SA, Series REGS, 6.75%, 2/1/2021 | 203,300 |
| 2,000,000 | | Rosneft Oil Co., Series REGS, 4.199%, 3/6/2022 | 1,657,644 |
| 800,000 | 1,2 | Sinopec Group Oversea 2012, Series 144A, 3.90%, 5/17/2022 | 826,924 |
| 2,565,000 | 1,2 | Sinopec Group Oversea 2013, Series 144A, 4.375%, 10/17/2023 | 2,730,224 |
| 2,600,000 | 1,2 | Thai Oil PCL, Series 144A, 4.875%, 1/23/2043 | 2,532,873 |
| 2,500,000 | 1,2 | Transport De Gas Peru, Series 144A, 4.25%, 4/30/2028 | 2,427,500 |
Annual Shareholder Report
Principal
Amount,
Foreign
Currency
Par Amount,
or Shares | | | Value in
U.S. Dollars |
| | | CORPORATE BONDS—continued | |
| | | Oil & Gas—continued | |
| $2,000,000 | 1,2 | YPF Sociedad Anonima, Series 144A, 8.75%, 4/4/2024 | $2,085,000 |
| 6,175,000 | | YPF Sociedad Anonima, Series REGS, 8.75%, 4/4/2024 | 6,437,438 |
| | | TOTAL | 136,594,238 |
| | | Real Estate—1.8% | |
| 4,700,000 | | China Overseas Finance Cayman V Ltd., Sr. Unsecd. Note, 3.95%, 11/15/2022 | 4,592,591 |
| 4,800,000 | 1,2 | Country Garden Holdings Co., Series 144A, 11.125%, 2/23/2018 | 5,154,000 |
| 1,550,000 | | Dubai Holding Comm Op, Series EMTN, 6.00%, 2/1/2017 | 2,480,416 |
| 200,000 | | Franshion Brilliant Ltd., 5.375%, 10/17/2018 | 208,000 |
| 200,000 | | Franshion Brilliant Ltd., 5.75%, 3/19/2019 | 208,240 |
| 5,700,000 | 1,2 | Qatari Diar Finance QSC, Foreign Gov't. Guarantee, Series 144A, 5.00%, 7/21/2020 | 6,419,910 |
| | | TOTAL | 19,063,157 |
| | | Software & Services—0.2% | |
| 1,900,000 | 1,2 | SixSigma Networks Mexico SA de CV, Sr. Unsecd. Note, Series 144A, 8.25%, 11/7/2021 | 1,971,250 |
| | | State/Provincial—1.8% | |
| 15,200,000 | | Provincia De Buenos Aires, Series REGS, 10.875%, 1/26/2021 | 14,326,000 |
| 5,375,000 | | Provincia De Buenos Aires, Series REGS, 9.375%, 9/14/2018 | 4,864,375 |
| | | TOTAL | 19,190,375 |
| | | Telecommunications & Cellular—3.2% | |
| 2,150,000 | 1,2 | Bharti Airtel International Netherlands BV, Series 144A, 5.35%, 5/20/2024 | 2,354,401 |
| 2,230,000 | | Bharti Airtel International Netherlands BV, Series REGS, 5.125%, 3/11/2023 | 2,411,210 |
| 2,100,000 | | Colombia Telecomunicaciones SA ESP, Sr. Unsecd. Note, Series REGS, 5.375%, 9/27/2022 | 2,116,800 |
| 6,050,000 | 1,2 | Digicel Ltd., Series 144A, 6.00%, 4/15/2021 | 5,944,125 |
| 3,000,000 | | MTS International Funding Ltd., Series REGS, 8.625%, 6/22/2020 | 3,161,400 |
| 1,715,000 | 1,2 | MTS International Funding Ltd., Sr. Unsecd. Note, Series 144A, 8.625%, 6/22/2020 | 1,807,267 |
| 2,800,000 | 1,2 | Qtel International Finance Ltd., Company Guarantee, Series 144A, 4.75%, 2/16/2021 | 3,048,500 |
| 1,850,000 | 1,2 | Qtel International Finance Ltd., Series 144A, 3.25%, 2/21/2023 | 1,817,625 |
| 200,000 | | Qtel International Finance Ltd., Series REGS, 3.25%, 2/21/2023 | 196,500 |
| 5,920,000 | | Sistema JSFC, Series REGS, 6.95%, 5/17/2019 | 4,327,413 |
| 3,100,000 | 1,2 | Vimpelcom, Series 144A, 5.95%, 2/13/2023 | 2,613,300 |
| 2,650,000 | | Vivacom, Series REGS, 6.625%, 11/15/2018 | 3,344,570 |
| | | TOTAL | 33,143,111 |
| | | Transportation—1.0% | |
| 2,100,000 | 1,2 | DP World Ltd., Series 144A, 6.85%, 7/2/2037 | 2,425,500 |
| 4,460,000 | 1,2 | Global Liman Isletmeleri SA, Sr. Unsecd. Note, Series 144A, 8.125%, 11/14/2021 | 4,316,210 |
| 3,500,000 | 1,2 | Topaz Marine SA, Series 144A, 8.625%, 11/1/2018 | 3,447,500 |
| | | TOTAL | 10,189,210 |
| | | Utilities—3.6% | |
| 3,500,000 | 1,2 | Abu Dhabi National Energy Co. PJSC, Series 144A, 3.625%, 1/12/2023 | 3,543,750 |
| 5,900,000 | | Bulgarian Energy Holding EAD, 4.25%, 11/7/2018 | 7,331,103 |
| 1,000,000 | | Centrais Eletricas Brasileiras SA, Sr. Unsecd. Note, Series REGS, 6.875%, 7/30/2019 | 1,071,800 |
| 200,000 | 1,2 | ContourGlobal Power Holdings SA, Series 144A, 7.125%, 6/1/2019 | 204,470 |
| 1,550,000 | | Empresa de Energia de Bogota SA, Sr. Unsecd. Note, Series REGS, 6.125%, 11/10/2021 | 1,667,025 |
| 2,620,000 | 1,2 | Empresa Electrica Angamo, Series 144A, 4.875%, 5/25/2029 | 2,620,000 |
| 1,428,000 | | Hrvatska Electroprivreda, Series REGS, 6.00%, 11/9/2017 | 1,506,183 |
| 3,260,000 | | Inkia Energy Ltd., Series REGS, 8.375%, 4/4/2021 | 3,496,350 |
| 1,300,000 | 1,2 | Kosmos Energy Ltd., Series 144A, 7.875%, 8/1/2021 | 1,235,000 |
| 200,000 | | Majapahit Holding BV, Series REGS, 7.875%, 6/29/2037 | 246,000 |
Annual Shareholder Report
Principal
Amount,
Foreign
Currency
Par Amount,
or Shares | | | Value in
U.S. Dollars |
| | | CORPORATE BONDS—continued | |
| | | Utilities—continued | |
| $5,255,000 | 1,2 | PT Perusahaan Gas Negara, Series 144A, 5.125%, 5/16/2024 | $5,484,906 |
| 4,450,000 | | Power Sector Assets & Liabilities Management Corp., Company Guarantee, Series REGS, 7.39%, 12/2/2024 | 5,829,500 |
| 2,800,000 | | Power Sector Assets & Liabilities Management Corp., Series REGS, 7.25%, 5/27/2019 | 3,363,500 |
| | | TOTAL | 37,599,587 |
| | | Utility - Diversified—1.0% | |
| 6,410,000 | 1,2 | EDP Finance BV, Series 144A, 4.125%, 1/15/2020 | 6,512,528 |
| 3,950,000 | | Kuwait Energy Co., Sr. Unsecd. Note, Series REGS, 9.50%, 8/4/2019 | 4,064,550 |
| | | TOTAL | 10,577,078 |
| | | TOTAL CORPORATE BONDS
(IDENTIFIED COST $650,721,815) | 649,267,090 |
| | | FLOATING RATE LOAN—0.1% | |
| 1,493,868 | 3 | Carolbrl, 1.00%, 12/31/2017
(IDENTIFIED COST $1,470,924) | 599,041 |
| | | FOREIGN GOVERNMENTS/AGENCIES—29.9% | |
| | | Banking—0.2% | |
| 2,735,000 | | African Export-Import Bank, 5.75%, 7/27/2016 | 2,868,796 |
| | | Sovereign—29.7% | |
| 2,705,000 | 1,2 | Armenia, Government of, Sr. Unsecd. Note, Series 144A, 6.00%, 9/30/2020 | 2,772,625 |
| 3,850,000 | | Bahrain, Government of, 5.50%, 3/31/2020 | 4,186,875 |
| 4,200,000 | 1,2 | Bahrain, Government of, 6.125%, Series 144A, 8/1/2023 | 4,756,500 |
| 7,100,000 | 1,2 | Bahrain, Government of, Sr. Unsecd. Note, Series 144A, 6.00%, 9/19/2044 | 7,259,750 |
| 965,000 | 1,2 | Bolivia, Government of, 4.875%, Series 144A, 10/29/2022 | 992,744 |
| 2,225,000 | | Colombia, Government of, Sr. Unsecd. Note, 4.375%, 7/12/2021 | 2,372,962 |
| 1,500,000 | 1,2 | Costa Rica, Government of, 4.25%, Series 144A, 1/26/2023 | 1,417,500 |
| 5,100,000 | 1,2 | Croatia, Government of, 6.00%, Series 144A, 1/26/2024 | 5,533,500 |
| 5,400,000 | | Croatia, Government of, 6.00%, 1/26/2024 | 5,859,000 |
| 550,000 | | Croatia, Government of, Sr. Unsecd. Note, 6.25%, 4/27/2017 | 589,776 |
| 1,200,000 | 1,2 | Dominican Republic, Government of, 5.875%, Series 144A, 4/18/2024 | 1,254,000 |
| 1,700,000 | | Dominican Republic, Government of, Sr. Unsecd. Note, 7.50%, 5/6/2021 | 1,914,200 |
| 6,200,000 | | Dubai, Government of, 5.25%, 1/30/2043 | 5,983,000 |
| 8,255,000 | | Egypt, Government of, Note, 6.875%, 4/30/2040 | 8,770,937 |
| 5,760,000 | 1,2 | El Salvador, Government of, 6.375%, Series 144A, 1/18/2027 | 5,918,400 |
| 1,430,000 | | El Salvador, Government of, Sr. Unsecd. Note, 5.875%, 1/30/2025 | 1,438,937 |
| 2,000,000 | 1,2 | Georgia, Government of, Series 144A, 7.75%, 7/5/2017 | 2,130,000 |
| 1,385,000 | 1,2 | Guatemala, Government of, 4.875%, Series 144A, 2/13/2028 | 1,402,313 |
| 1,902,000 | | Hungary, Government of, 4.125%, 2/19/2018 | 1,978,080 |
| 4,200,000,000 | | Hungary, Government of, 5.50%, 6/24/2025 | 19,910,288 |
| 1,970,000 | | Hungary, Government of, 5.75%, 11/22/2023 | 2,200,518 |
| 750,000 | | Hungary, Government of, 6.375%, 3/29/2021 | 863,903 |
| 5,200,000 | | Hungary, Government of, Unsecd. Note, 6.25%, 1/29/2020 | 5,877,664 |
| 2,790,000 | 1,2 | Indonesia, Government of, 3.375%, Series 144A, 4/15/2023 | 2,709,787 |
| 2,810,000 | | Indonesia, Government of, 6.875%, 1/17/2018 | 3,182,325 |
| 5,300,000 | 1,2 | Indonesia, Government of, Sr. Unsecd. Note, 11.625%, Series 144A, 3/4/2019 | 7,128,500 |
| 1,500,000 | 1,2 | Indonesia, Government of, Unsecd. Note, 4.35%, Series 144A, 9/10/2024 | 1,520,625 |
| 1,100,000 | 1,2 | Kazakhstan, Government of, Company Guarantee, 6.375%, Series 144A, 10/6/2020 | 1,193,500 |
| 1,850,000 | 1,2 | Kenya, Government of, 5.875%, Series 144A, 6/24/2019 | 1,905,500 |
| 11,180,000 | 1,2 | Kenya, Government of, 6.875%, Series 144A, 6/24/2024 | 11,951,420 |
Annual Shareholder Report
Principal
Amount,
Foreign
Currency
Par Amount,
or Shares | | | Value in
U.S. Dollars |
| | | FOREIGN GOVERNMENTS/AGENCIES—continued | |
| | | Sovereign—continued | |
| $2,200,000 | 1,2 | Kingdom of Morocco, 4.25%, Series 144A, 12/11/2022 | $2,255,000 |
| 220,000,000 | | Mex Bonos Desarr Fix Rate, 8.50%, 12/13/2018 | 18,072,794 |
| 197,000,000 | | Mexico, Government of, Unsecd. Note, 8.00%, 6/11/2020 | 16,076,069 |
| 76,700,000 | | Nota Do Tesouro Nacional, 10.00%, 1/1/2025 | 28,036,922 |
| 1,800,000 | 1,2 | Pakistan, Government of, 7.25%, Series 144A, 4/15/2019 | 1,860,750 |
| 3,500,000 | 1,2 | Pakistan, Government of, Unsecd. Note, 6.75%, Series 144A, 12/3/2019 | 3,505,880 |
| 200,000 | | Paraguay, Government of, 4.625%, 1/25/2023 | 204,500 |
| 1,300,000 | 1,2 | Paraguay, Government of, 4.625%, Series 144A, 1/25/2023 | 1,329,250 |
| 4,100,000 | 1,2 | Paraguay, Government of, 6.10%, Series 144A, 8/11/2044 | 4,366,500 |
| 1,670,000 | | Peru, Government of, Bond, 7.35%, 7/21/2025 | 2,221,100 |
| 25,600,000 | 1,2 | Peru, Government of, Sr. Unsecd. Note, 5.70%, Series 144A, 8/12/2024 | 8,898,269 |
| 6,750,000 | | Philippines, Government of, Sr. Unsecd. Note, 6.375%, 10/23/2034 | 9,002,812 |
| 3,100,000 | 1,2 | Qatar, Government of, Series 144A, 6.40%, 1/20/2040 | 3,975,750 |
| 5,150,000 | | Republic of Ghana, 7.875%, 8/7/2023 | 5,060,905 |
| 3,480,000 | | Republic of Ghana, Unsecd. Note, 8.50%, 10/4/2017 | 3,662,700 |
| 4,800,000 | 1,2 | Republic of Ivory Coast, 5.375%, Series 144A, 7/23/2024 | 4,656,960 |
| 634,000 | 1,2 | Romania, Government of, 4.875%, Series 144A, 1/22/2024 | 689,475 |
| 700,000,000 | | Russia, Government of, 7.50%, 2/27/2019 | 12,601,406 |
| 335,000,000 | | Russia, Government of, Unsecd. Note, 6.90%, Series 144A, 8/3/2016 | 6,363,655 |
| 200,000,000 | | Russia, Government of, Unsecd. Note, 7.00%, 8/16/2023 | 3,261,044 |
| 6,600,000 | 1,2 | Senegal, Government of, Unsecd. Note, Series 144A, 6.25%, 7/30/2024 | 6,583,500 |
| 1,315,000 | 1,2 | Serbia, Government of, 5.875%, Series 144A, 12/3/2018 | 1,392,822 |
| 79,500,000 | | South Africa, Government of, 10.50%, 12/21/2026 | 8,748,428 |
| 4,000,000 | 1,2 | Sri Lanka, Government of, 6.00%, Series 144A, 1/14/2019 | 4,245,000 |
| 2,390,000 | 1,2 | Sri Lanka, Government of, Sr. Unsecd. Note, 6.25%, Series 144A, 10/4/2020 | 2,557,300 |
| 8,400,000 | | Turkey, Government of, 10.40%, 3/20/2024 | 4,439,363 |
| 8,500,000 | | Turkey, Government of, Note, 7.375%, 2/5/2025 | 10,710,425 |
| 21,620,000 | | Venezuela, Government of, 7.00%, 3/31/2038 | 10,658,660 |
| | | TOTAL | 310,412,368 |
| | | TOTAL FOREIGN GOVERNMENTS/AGENCIES
(IDENTIFIED COST $314,212,739) | 313,281,164 |
| | | PURCHASED CALL SWAPTIONS—0.0% | |
| 25,000,000 | | Barclays Capital, Inc., Upon exercise, receive floating 3 month LIBOR, pay 2.80%, Expiration Date 8/13/2020 | 60,650 |
| 25,000,000 | | Barclays Capital, Inc., Upon exercise, receive floating 3 month LIBOR, pay 2.80%, Expiration Date 10/8/2015 | 103,060 |
| 54,000,000 | | Goldman Sachs & Co., Upon exercise, receive floating 3 month LIBOR, pay 2.90%, Expiration Date 7/6/2015 | 62,149 |
| 93,000,000 | | Goldman Sachs & Co., Upon exercise, receive floating 3 month LIBOR, pay 3.00%, Expiration Date 7/6/2015 | 100,347 |
| | | TOTAL PURCHASED CALL SWAPTIONS
(IDENTIFIED COST $1,118,098) | 326,206 |
| | | INVESTMENT COMPANY—6.4% | |
| 66,749,383 | 4,5 | Federated Prime Value Obligations Fund, Institutional Shares, 0.07%
(AT NET ASSET VALUE) | 66,749,383 |
| | | TOTAL INVESTMENTS—98.5%
(IDENTIFIED COST $1,034,272,959)6 | 1,030,222,884 |
| | | OTHER ASSETS AND LIABILITIES - NET—1.5%7 | 15,240,706 |
| | | TOTAL NET ASSETS—100% | $1,045,463,590 |
Annual Shareholder Report
At November 30, 2014, the Fund had the following outstanding futures contracts:
| Description | Number of
Contracts | Notional
Value | Expiration
Date | Unrealized
Appreciation
(Depreciation) |
| 8United States Treasury Notes 10-Year Long Futures | 644 | $81,818,188 | March 2015 | $310,395 |
| 8Euro-Bund Short Futures | 29 | $4,432,650 | December 2014 | $(104,986) |
| 8United States Treasury Notes 5-Year Short Futures | 570 | $68,110,547 | March 2015 | $(317,526) |
| NET UNREALIZED DEPRECIATION ON FUTURES CONTRACTS | $(112,117) |
At November 30, 2014, the Fund had the following outstanding foreign exchange contracts:
| Settlement Date | Counterparty | Foreign Currency
Units to
Deliver/Receive | In
Exchange
For | Unrealized
Appreciation
(Depreciation) |
| Contracts Purchased: |
| 12/3/2014 | BNP Paribas SA | 2,840,000,000 CLP | $4,745,196 | $(78,104) |
| 12/3/2014 | BNP Paribas SA | 5,750,000,000 CLP | $9,644,576 | $(195,358) |
| 12/3/2014 | Bank of New York | 1,036,000,000 JPY | $9,504,151 | $(777,212) |
| 12/4/2014 | Barclays Bank PLC | 932,650,000 JPY | $8,888,391 | $(1,028,921) |
| 12/4/2014 | JPMorgan Chase Bank N.A | 550,000 TRY | $241,886 | $5,773 |
| 12/4/2014 | JPMorgan Chase Bank N.A | 11,030,000 TRY | $4,860,316 | $106,367 |
| 12/4/2014 | JPMorgan Chase Bank N.A | 11,350,000 TRY | $4,927,071 | $183,705 |
| 12/4/2014 | JPMorgan Chase Bank N.A | 20,270,000 TRY | $9,227,898 | $(100,548) |
| 12/8/2014 | Morgan Stanley Capital SE | 11,475,000 SGD | $8,981,333 | $(177,231) |
| 12/8/2014 | Morgan Stanley Capital SE | 11,475,000 SGD | $8,999,718 | $(195,615) |
| 12/9/2014 | BNP Paribas SA | 10,700,000,000 COP | $5,149,182 | $(326,769) |
| 12/10/2014 | Morgan Stanley Capital SE | 5,120,000 AUD | $4,629,197 | $(272,976) |
| 12/10/2014 | Barclays Bank PLC | 104,000,000 PHP | $2,313,167 | $1,733 |
| 12/10/2014 | Barclays Bank PLC | 104,000,000 PHP | $2,320,911 | $(6,010) |
| 12/11/2014 | Bank of America, N.A. | 9,220,000,000 KRW | $8,850,917 | $(532,729) |
| 12/12/2014 | BNP Paribas SA | 7,378,895 EUR | 2,310,000,000 HUF | $(192,525) |
| 12/12/2014 | BNP Paribas SA | 5,266,109 EUR | 1,625,000,000 HUF | $(41,700) |
| 12/15/2014 | Barclays Bank PLC | 54,100,000 ZAR | $4,854,369 | $17,167 |
| 12/15/2014 | BNP Paribas SA | 57,700,000 ZAR | $5,142,419 | $53,285 |
| 12/16/2014 | Morgan Stanley Capital SE | 5,550,000 AUD | $4,856,472 | $(136,374) |
| 12/16/2014 | BNP Paribas SA | 3,080,000 NZD | $2,439,976 | $(29,021) |
| 12/17/2014 | HSBC Bank USA | 29,300,000 CNY | $4,762,679 | $(2,914) |
| 12/17/2014 | JPMorgan Chase Bank N.A | 286,700,000 TWD | $9,462,046 | $(196,715) |
| 12/18/2014 | Bank of America, N.A. | 9,800,000,000 COP | $4,813,951 | $(401,780) |
| 12/18/2014 | Bank of America, N.A. | 18,750,000,000 COP | $9,382,037 | $(940,384) |
| 12/18/2014 | Bank of America, N.A. | 20,900,000,000 COP | $10,193,879 | $(784,250) |
| 12/23/2014 | Morgan Stanley Capital SE | 4,610,000,000 KRW | $4,308,411 | $(151,640) |
| 12/23/2014 | Bank of America, N.A. | 5,100,000,000 KRW | $4,806,786 | $(208,189) |
| 12/23/2014 | Bank of America, N.A. | 5,250,000,000 KRW | $4,986,465 | $(252,615) |
| 12/24/2014 | Citibank N.A. | 31,000,000 MYR | $9,492,314 | $(343,332) |
| 1/2/2015 | BNP Paribas SA | 5,220,908 EUR | 43,250,000 NOK | $356,045 |
| 1/5/2015 | JPMorgan Chase Bank N.A | 4,035,000 EUR | 1,255,732,350 HUF | $(71,400) |
| 1/7/2015 | Morgan Stanley Capital SE | 311,000,000 THB | $9,573,649 | $(118,278) |
| 1/9/2015 | Morgan Stanley Capital SE | 2,450,000,000 HUF | $9,902,271 | $33,472 |
| 1/12/2015 | Bank of America, N.A. | 5,820,000 CAD | $5,133,497 | $(50,548) |
| 1/13/2015 | BNP Paribas SA | 239,000,000 RUB | $5,139,785 | $(474,329) |
| 1/20/2015 | Barclays Bank PLC | 592,000,000 INR | $9,525,342 | $(82,888) |
| 1/21/2015 | Barclays Bank PLC | 54,300,000 ZAR | $4,828,813 | $29,934 |
| 1/21/2015 | Barclays Bank PLC | 56,000,000 ZAR | $5,086,840 | $(75,977) |
| 1/22/2015 | Morgan Stanley Capital SE | 117,000,000,000 IDR | $9,628,045 | $(121,372) |
| 1/22/2015 | Morgan Stanley Capital SE | 597,000,000 INR | $9,610,431 | $(92,242) |
Annual Shareholder Report
| Settlement Date | Counterparty | Foreign Currency
Units to
Deliver/Receive | In
Exchange
For | Unrealized
Appreciation
(Depreciation) |
| Contracts Purchased: (continued) |
| 1/30/2015 | JPMorgan Chase Bank N.A | 4,035,000 EUR | 1,255,974,450 HUF | $(67,677) |
| 2/6/2015 | Morgan Stanley Capital SE | 6,000,000 AUD | $5,136,600 | $(52,845) |
| 2/9/2015 | JPMorgan Chase Bank N.A | 1,780,000 EUR | $2,224,080 | $(8,155) |
| 2/9/2015 | JPMorgan Chase Bank N.A | 10,620,000 EUR | $13,322,896 | $(102,037) |
| 2/12/2015 | Morgan Stanley Capital SE | 8,243,541 EUR | 70,500,000 NOK | $265,797 |
| 2/17/2015 | JPMorgan Chase Bank N.A | 8,630,000 EUR | $10,827,025 | $(82,806) |
| 2/17/2015 | JPMorgan Chase Bank N.A | 14,060,000 EUR | $17,639,395 | $(134,907) |
| 2/18/2015 | Morgan Stanley Capital SE | 13,400,000 BRL | $5,138,037 | $(31,427) |
| 2/26/2015 | BNP Paribas SA | 6,235,000,000 CLP | $10,404,673 | $(238,134) |
| 2/26/2015 | JPMorgan Chase Bank N.A | 25,200,000 CNY | $4,052,098 | $13,930 |
| 2/26/2015 | JPMorgan Chase Bank N.A | 45,776,400 CNY | $7,349,742 | $36,295 |
| 4/13/2015 | JPMorgan Chase Bank N.A | 26,753,740 CNY | $4,288,970 | $16,178 |
| 6/23/2015 | Barclays Bank PLC | 60,100,000 CNY | $9,639,134 | $(3,884) |
| 6/23/2015 | Barclays Bank PLC | 90,000,000 CNY | $14,404,609 | $24,217 |
| Contracts Sold: |
| 12/3/2014 | BNP Paribas SA | 8,590,000,000 CLP | $14,526,084 | $409,774 |
| 12/3/2014 | Bank of New York | 1,036,000,000 JPY | $9,472,693 | $745,753 |
| 12/4/2014 | Barclays Bank PLC | 932,650,000 JPY | $8,893,137 | $1,033,668 |
| 12/4/2014 | JPMorgan Chase Bank N.A | 500,000 TRY | $223,834 | $(1,310) |
| 12/4/2014 | JPMorgan Chase Bank N.A | 9,600,000 TRY | $4,363,438 | $40,668 |
| 12/4/2014 | JPMorgan Chase Bank N.A | 9,900,000 TRY | $4,470,737 | $12,880 |
| 12/4/2014 | JPMorgan Chase Bank N.A | 10,300,000 TRY | $4,592,269 | $(45,703) |
| 12/4/2014 | JPMorgan Chase Bank N.A | 11,100,000 TRY | $4,843,989 | $(154,214) |
| 12/4/2014 | JPMorgan Chase Bank N.A | 11,800,000 TRY | $5,214,317 | $(99,088) |
| 12/8/2014 | Morgan Stanley Capital SE | 6,000,000 SGD | $4,767,732 | $164,280 |
| 12/8/2014 | Morgan Stanley Capital SE | 16,950,000 SGD | $13,496,297 | $491,545 |
| 12/10/2014 | Morgan Stanley Capital SE | 5,120,000 AUD | $4,725,350 | $369,129 |
| 12/10/2014 | Barclays Bank PLC | 208,000,000 PHP | $4,743,444 | $113,643 |
| 12/11/2014 | Bank of America, N.A. | 9,220,000,000 KRW | $8,988,983 | $670,795 |
| 12/12/2014 | BNP Paribas SA | 7,438,655 EUR | 2,310,000,000 HUF | $118,162 |
| 12/12/2014 | BNP Paribas SA | 5,313,149 EUR | 1,625,000,000 HUF | $(16,836) |
| 12/15/2014 | Barclays Bank PLC | 54,100,000 ZAR | $4,810,172 | $(61,364) |
| 12/15/2014 | BNP Paribas SA | 57,700,000 ZAR | $5,150,176 | $(45,528) |
| 12/16/2014 | Morgan Stanley Capital SE | 5,550,000 AUD | $4,812,128 | $92,030 |
| 12/16/2014 | BNP Paribas SA | 3,080,000 NZD | $2,399,320 | $(11,635) |
| 12/17/2014 | HSBC Bank USA | 29,300,000 CNY | $4,741,484 | $(18,281) |
| 12/17/2014 | JPMorgan Chase Bank N.A | 154,000,000 TWD | $5,073,299 | $96,456 |
| 12/17/2014 | JPMorgan Chase Bank N.A | 286,700,000 TWD | $9,517,012 | $251,681 |
| 12/17/2014 | JPMorgan Chase Bank N.A | 292,000,000 TWD | $9,614,751 | $178,139 |
| 12/18/2014 | Bank of America, N.A. | 49,450,000,000 COP | $23,652,931 | $1,389,479 |
| 12/22/2014 | JPMorgan Chase Bank N.A | 215,900,000 PHP | $4,802,046 | $(555) |
| 12/23/2014 | Morgan Stanley Capital SE | 4,610,000,000 KRW | $4,408,530 | $251,759 |
| 12/23/2014 | Bank of America, N.A. | 5,000,000,000 KRW | $4,725,898 | $217,469 |
| 12/23/2014 | Bank of America, N.A. | 5,350,000,000 KRW | $4,974,431 | $150,412 |
| 12/24/2014 | Citibank N.A. | 31,000,000 MYR | $9,465,649 | $316,666 |
| 1/2/2015 | BNP Paribas SA | 5,315,488 EUR | 43,250,000 NOK | $(473,750) |
| 1/5/2015 | JPMorgan Chase Bank N.A | 4,035,000 EUR | 1,247,944,800 HUF | $39,815 |
| 1/7/2015 | Morgan Stanley Capital SE | 311,000,000 THB | $9,478,817 | $23,446 |
| 1/9/2015 | Morgan Stanley Capital SE | 2,450,000,000 HUF | $10,179,914 | $244,172 |
| 1/12/2015 | Bank of America, N.A. | 5,820,000 CAD | $5,114,775 | $31,825 |
Annual Shareholder Report
| Settlement Date | Counterparty | Foreign Currency
Units to
Deliver/Receive | In
Exchange
For | Unrealized
Appreciation
(Depreciation) |
| Contracts Sold: (continued) |
| 1/13/2015 | BNP Paribas SA | 237,000,000 RUB | $4,973,245 | $346,830 |
| 1/13/2015 | BNP Paribas SA | 1,264,000,000 RUB | $26,616,130 | $1,941,917 |
| 1/20/2015 | Barclays Bank PLC | 592,000,000 INR | $9,516,155 | $73,701 |
| 1/21/2015 | Barclays Bank PLC | 53,900,000 ZAR | $4,800,627 | $(22,328) |
| 1/21/2015 | Barclays Bank PLC | 59,800,000 ZAR | $5,357,607 | $6,722 |
| 1/21/2015 | Barclays Bank PLC | 96,100,000 ZAR | $8,643,252 | $44,254 |
| 1/30/2015 | JPMorgan Chase Bank N.A | 4,035,000 EUR | 1,247,944,800 HUF | $35,133 |
| 2/6/2015 | Morgan Stanley Capital SE | 6,000,000 AUD | $5,133,180 | $49,425 |
| 2/9/2015 | JPMorgan Chase Bank N.A | 12,400,000 EUR | $15,494,668 | $57,883 |
| 2/10/2015 | Bank of America, N.A. | 211,600,000 MXN | $15,468,967 | $334,045 |
| 2/10/2015 | Bank of America, N.A. | 279,000,000 MXN | $20,495,868 | $540,087 |
| 2/12/2015 | Morgan Stanley Capital SE | 8,275,765 EUR | 70,500,000 NOK | $(305,914) |
| 2/17/2015 | JPMorgan Chase Bank N.A | 5,648,000 EUR | $7,015,098 | $(16,576) |
| 2/17/2015 | JPMorgan Chase Bank N.A | 6,902,000 EUR | $8,574,700 | $(18,186) |
| 2/17/2015 | JPMorgan Chase Bank N.A | 12,600,000 EUR | $15,611,274 | $(75,536) |
| 2/17/2015 | JPMorgan Chase Bank N.A | 16,050,000 EUR | $20,024,783 | $42,775 |
| 2/17/2015 | JPMorgan Chase Bank N.A | 16,430,000 EUR | $20,619,814 | $164,713 |
| 2/17/2015 | JPMorgan Chase Bank N.A | 19,000,000 EUR | $23,653,290 | $(1,423) |
| 2/17/2015 | JPMorgan Chase Bank N.A | 24,650,000 EUR | $30,886,450 | $197,572 |
| 2/18/2015 | Morgan Stanley Capital SE | 13,400,000 BRL | $5,027,388 | $(79,222) |
| 2/18/2015 | Morgan Stanley Capital SE | 69,200,000 BRL | $26,432,391 | $60,942 |
| 2/18/2015 | Bank of America, N.A. | 13,500,000 SGD | $10,371,053 | $17,226 |
| 2/20/2015 | Citibank N.A. | 1,660,000 GBP | $2,597,037 | $2,264 |
| 2/24/2015 | Morgan Stanley Capital SE | 318,500,000 TWD | $10,364,465 | $60,046 |
| 2/26/2015 | JPMorgan Chase Bank N.A | 70,976,400 CNY | $11,400,000 | $(52,065) |
| 4/13/2015 | Bank of New York | 26,753,740 CNY | $4,300,000 | $(5,149) |
| 6/23/2015 | Barclays Bank PLC | 150,100,000 CNY | $24,141,536 | $77,460 |
| NET UNREALIZED APPRECIATION ON FOREIGN EXCHANGE CONTRACTS | $1,964,058 |
At November 30, 2014, the Fund had the following outstanding written swaption contracts:
| Security | Contracts | Value |
| 8Barclays Capital, Inc., Upon exercise, receive 2.00%, pay floating 3 month LIBOR, Expiration Date 8/13/2020 | 25,000,000 | $(312,307) |
| 8Barclays Capital, Inc., Upon exercise, receive 2.00%, pay floating 3 month LIBOR, Expiration Date 8/27/2020 | 25,000,000 | $(310,785) |
| 8Goldman Sachs & Co., Upon exercise, receive 2.00%, pay floating 3 month LIBOR, Expiration Date 8/10/2015 | 25,000,000 | $(305,463) |
| (PREMIUMS RECEIVED $446,912) | $(928,555) |
At November 30, 2014, the Fund had the following open swap contracts:
Interest Rate Swap
Counterparty | Citigroup Global Markets |
| Pay/Receive Floating Rate | Receive |
| Fixed Rate | 2.483% |
| Expiration Date | 11/4/2024 |
| Notional Amount | $10,000,000 |
| Market Value | $(152,313) |
| Unrealized Appreciation/(Depreciation) | $(152,313) |
Annual Shareholder Report
Credit Default Swap
Counterparty | Barclays Capital | Bank of America
Securities LLC | Goldman
Sachs and Co. | Bank of America
Securities LLC | Total |
| Reference Entity | Government of Venezuela Bond | Government of Brazil Bond | CDX Index EM Series 22 | CDX Index EM Series 22 | |
| Buy/Sell | Buy | Sell | Sell | Sell | |
| Pay/Receive Fixed Rate | 5.00% | 1.00% | 1.00% | 1.00% | |
| Expiration Date | 12/20/2019 | 12/20/2024 | 12/20/2019 | 12/20/2019 | |
| Implied Credit Spread at 11/30/20149 | 28.47% | 2.23% | 7.08% | 7.08% | |
| Notional Amount | $5,800,000 | $5,130,000 | $62,900,000 | $11,000,000 | |
| Market Value | $2,551,950 | $(490,232) | $(4,925,403) | $(861,359) | $(3,725,044) |
| Upfront Premiums Paid/(Received) | $2,233,000 | $(517,935) | $(4,871,919) | $(833,800) | $(3,990,654) |
Unrealized Appreciation/
(Depreciation) | $318,950 | $27,703 | $(53,484) | $(27,559) | $265,610 |
Net Unrealized Appreciation/Depreciation on Futures Contracts, Foreign Exchange Contracts, Written Swaption Contracts and Swap Contracts is included in “Other Assets and Liabilities—Net.”
| 1 | Denotes a restricted security that either: (a) cannot be offered for public sale without first being registered, or being able to take advantage of an exemption from registration, under the Securities Act of 1933; or (b) is subject to a contractual restriction on public sales. At November 30, 2014, these restricted securities amounted to $433,685,046, which represented 41.5% of total net assets. |
| 2 | Denotes a restricted security that may be resold without restriction to “qualified institutional buyers” as defined in Rule 144A under the Securities Act of 1933 and that the Fund has determined to be liquid under criteria established by the Fund's Board of Directors (the “Directors”). At November 30, 2014, these liquid restricted securities amounted to $433,685,046, which represented 41.5% of total net assets. |
| 3 | The rate shown represents a weighted average coupon rate on settled positions at year end. Remaining maturities of floating rate loans may be less than stated maturities shown as a result of contractual or optional prepayments by the borrower. Such prepayments cannot be predicted with certainty. These loans may be subject to restrictions on resale. Floating rate loans generally have rates of interest which are determined periodically by reference to a base lending rate plus a premium. |
| 4 | Affiliated holding. |
| 5 | 7-day net yield. |
| 6 | The cost of investments for federal tax purposes amounts to $1,035,513,793. |
| 7 | Assets, other than investments in securities, less liabilities. See Statement of Assets and Liabilities. |
| 8 | Non-income-producing security. |
| 9 | Implied credit spreads, represented in absolute terms, utilized in determining the market value of credit default swap agreements serve as an indicator of the current status of the payment/performance risk and represent the likelihood or risk of default for the credit derivative. The implied credit spread of a particular referenced entity reflects the cost of buying/selling protection and may include upfront payments required to be made to enter into the agreement. Wider credit spreads represent a deterioration of the referenced entity's credit soundness and a greater likelihood or risk of default or other credit event occurring as defined under the terms of the agreement. A credit spread identified as “Defaulted” indicates a credit event has occurred for the referenced entity or obligation. |
Note: The categories of investments are shown as a percentage of total net assets at November 30, 2014.
Various inputs are used in determining the value of the Fund's investments. These inputs are summarized in the three broad levels listed below:
Level 1—quoted prices in active markets for identical securities, including investment companies with daily net asset values, if applicable.
Level 2—other significant observable inputs (including quoted prices for similar securities, interest rates, prepayment speeds, credit risk, etc.). Also includes securities valued at amortized cost.
Level 3—significant unobservable inputs (including the Fund's own assumptions in determining the fair value of investments).
The inputs or methodology used for valuing securities are not an indication of the risk associated with investing in those securities.
Annual Shareholder Report
The following is a summary of the inputs used, as of November 30, 2014, in valuing the Fund's assets carried at fair value:
| Valuation Inputs | | | | |
| | Level 1—
Quoted
Prices and
Investments in
Investment
Companies | Level 2—
Other
Significant
Observable
Inputs | Level 3—
Significant
Unobservable
Inputs | Total |
| Debt Securities: | | | | |
| Corporate Bonds | $— | $649,267,090 | $— | $649,267,090 |
| Floating Rate Loan | — | — | 599,041 | 599,041 |
| Foreign Governments/Agencies | — | 313,281,164 | — | 313,281,164 |
| Purchased Call Swaptions | — | 326,206 | — | 326,206 |
| Investment Company | 66,749,383 | — | — | 66,749,383 |
| TOTAL SECURITIES | $66,749,383 | $962,874,460 | $599,041 | $1,030,222,884 |
| OTHER FINANCIAL INSTRUMENTS* | $(112,117) | $(2,841,854) | $— | $(2,953,971) |
| * | Other financial instruments include futures contracts, foreign exchange contracts, written swaption contracts and swap contracts. |
The following acronyms are used throughout this portfolio:
| AUD | —Australian Dollar |
| BRL | —Brazilian Real |
| CAD | —Canadian Dollar |
| CLP | —Chilean Peso |
| CNY | —Yuan Renminbi |
| COP | —Colombian Peso |
| EUR | —Euro Currency |
| GBP | —British Pound |
| HUF | —Hungarian Forint |
| IDR | —Indonesian Rupiah |
| INR | —Indian Rupee |
| JPY | —Japanese Yen |
| KRW | —South Korean Won |
| MXN | —Mexican Peso |
| MYR | —Malaysian Ringgit |
| NOK | —Norwegian Krone |
| NZD | —New Zealand Dollar |
| PHP | —Philippine Peso |
| RUB | —New Russian Ruble |
| SGD | —Singapore Dollar |
| THB | —Thailand Baht |
| TRY | —Turkish Lira |
| TWD | —New Taiwan Dollar |
| ZAR | —South African Rand |
See Notes which are an integral part of the Financial Statements
Annual Shareholder Report
Financial Highlights
(For a Share Outstanding Throughout Each Period)
| Year Ended November 30 | 2014 | 2013 | 2012 | 2011 | 2010 |
| Net Asset Value, Beginning of Period | $33.20 | $34.73 | $29.27 | $27.40 | $24.04 |
| Income From Investment Operations: | | | | | |
| Net investment income1 | 1.96 | 1.88 | 1.91 | 1.88 | 1.90 |
| Net realized and unrealized gain (loss) on investments, futures contracts, written options, swap contracts and foreign currency transactions | 0.25 | (3.41) | 3.55 | (0.01) | 1.46 |
| TOTAL FROM INVESTMENT OPERATIONS | 2.21 | (1.53) | 5.46 | 1.87 | 3.36 |
| Net Asset Value, End of Period | $35.41 | $33.20 | $34.73 | $29.27 | $27.40 |
| Total Return2 | 6.66% | (4.42)% | 18.65% | 6.82% | 13.98% |
| Ratios to Average Net Assets: | | | | | |
| Net expenses | 0.04% | 0.00%3 | 0.00%3 | 0.00%3 | 0.00%3 |
| Net investment income | 5.61% | 5.53% | 5.99% | 6.63% | 7.41% |
| Expense waiver/reimbursement4 | 0.02% | 0.06% | 0.06% | 0.06% | 0.06% |
| Supplemental Data: | | | | | |
| Net assets, end of period (000 omitted) | $1,045,464 | $795,077 | $764,886 | $687,883 | $698,514 |
| Portfolio turnover | 124% | 37% | 19% | 18% | 23% |
| 1 | Per share numbers have been calculated using the average shares method. |
| 2 | Based on net asset value. |
| 3 | The Adviser reimbursed all operating expenses incurred by the Fund. |
| 4 | This expense decrease is reflected in both the net expense and the net investment income ratios shown above. |
See Notes which are an integral part of the Financial Statements
Annual Shareholder Report
Statement of Assets and Liabilities
November 30, 2014
| Assets: | | |
| Total investment in securities, at value including $66,749,383 of investment in an affiliated holding (Note 5) (identified cost $1,034,272,959) | | $1,030,222,884 |
| Cash | | 10,052,413 |
| Restricted cash (Note 2) | | 624,902 |
| Cash collateral on deposit at broker | | 413,271 |
| Income receivable | | 14,041,771 |
| Receivable for investments sold | | 128,853,410 |
| Unrealized appreciation on foreign exchange contracts | | 12,650,539 |
| Receivable for daily variation margin | | 86,760 |
| Swaps, at value (premium paid $2,233,000) | | 2,551,950 |
| Receivable for periodic payments from swap contracts | | 179,411 |
| Bank loan receivable | | 24,445 |
| TOTAL ASSETS | | 1,199,701,756 |
| Liabilities: | | |
| Payable for investments purchased | $135,921,378 | |
| Written swaption contracts outstanding, at value (premium received $446,912) | 928,555 | |
| Unrealized depreciation on foreign exchange contracts | 10,686,481 | |
| Bank overdraft denominated in foreign currencies (identified cost $82,820) | 82,814 | |
| Swaps, at value (premium received $6,223,654) | 6,429,307 | |
| Payable for periodic payments to swap contracts | 75,011 | |
| Payable for Directors'/Trustees' fees (Note 5) | 457 | |
| Accrued expenses (Note 5) | 114,163 | |
| TOTAL LIABILITIES | | 154,238,166 |
| Net assets for 29,525,955 shares outstanding | | $1,045,463,590 |
| Net Assets Consist of: | | |
| Paid-in capital | | $1,048,208,017 |
| Net unrealized depreciation of investments, futures contracts, written options, swap contracts and translation of assets and liabilities in foreign currency | | (2,744,427) |
| TOTAL NET ASSETS | | $1,045,463,590 |
| Net Asset Value, Offering Price and Redemption Proceeds Per Share: | | |
| $1,045,463,590 ÷ 29,525,955 shares outstanding | | $35.41 |
See Notes which are an integral part of the Financial Statements
Annual Shareholder Report
Statement of Operations
Year Ended November 30, 2014
| Investment Income: | | |
| Interest | | $48,635,836 |
| Dividends received from an affiliated holding (Note 5) | | 29,881 |
| TOTAL INCOME | | 48,665,717 |
| Expenses: | | |
| Custodian fees | $224,742 | |
| Transfer agent fee | 67,345 | |
| Directors'/Trustees' fees (Note 5) | 11,400 | |
| Auditing fees | 31,850 | |
| Legal fees | 13,612 | |
| Portfolio accounting fees | 156,710 | |
| Printing and postage | 15,691 | |
| Taxes | 1,487 | |
| Miscellaneous (Note 5) | 13,686 | |
| TOTAL EXPENSES | 536,523 | |
| Reimbursement of other operating expenses (Note 5) | (215,378) | |
| Net expenses | | 321,145 |
| Net investment income | | 48,344,572 |
Realized and Unrealized Gain (Loss) on Investments, Futures Contracts, Written Options,
Swap Contracts and Foreign Currency Transactions: | | |
| Net realized gain on investments and foreign currency transactions | | 21,161,602 |
| Net realized loss on futures contracts | | (1,191,578) |
| Net realized gain on written options | | 60,214 |
| Net realized loss on swap contracts | | (2,746,659) |
| Net change in unrealized appreciation of investments and translation of assets and liabilities in foreign currency | | (15,246,133) |
| Net change in unrealized depreciation of futures contracts | | (112,117) |
| Net change in unrealized depreciation of written options | | (481,643) |
| Net change in unrealized appreciation of swap contracts | | 113,297 |
| Net realized and unrealized gain on investments, futures contracts, written options, swap contracts and foreign currency transactions | | 1,556,983 |
| Change in net assets resulting from operations | | $49,901,555 |
See Notes which are an integral part of the Financial Statements
Annual Shareholder Report
Statement of Changes in Net Assets
| Year Ended November 30 | 2014 | 2013 |
| Increase (Decrease) in Net Assets | | |
| Operations: | | |
| Net investment income | $48,344,572 | $45,873,192 |
| Net realized gain (loss) on investments, futures contracts, written options, swap contracts and foreign currency transactions | 17,283,579 | (2,170,586) |
| Net change in unrealized appreciation/depreciation of investments, futures contracts, written options, swap contracts and translation of assets and liabilities in foreign currency | (15,726,596) | (87,153,380) |
| CHANGE IN NET ASSETS RESULTING FROM OPERATIONS | 49,901,555 | (43,450,774) |
| Share Transactions: | | |
| Contributions | 494,723,551 | 320,028,385 |
| Withdrawals | (294,238,307) | (246,387,179) |
| CHANGE IN NET ASSETS RESULTING FROM SHARE TRANSACTIONS | 200,485,244 | 73,641,206 |
| Change in net assets | 250,386,799 | 30,190,432 |
| Net Assets: | | |
| Beginning of period | 795,076,791 | 764,886,359 |
| End of period | $1,045,463,590 | $795,076,791 |
See Notes which are an integral part of the Financial Statements
Annual Shareholder Report
Notes to Financial Statements
November 30, 2014
1. ORGANIZATION
Emerging Markets Fixed Income Core Fund (the “Fund”) is a non-diversified portfolio of Federated Core Trust II, L.P. (the “Trust”). The Trust is registered under the Investment Company Act of 1940, as amended (the “Act”). The Trust is a limited partnership that was established under the laws of the State of Delaware on November 13, 2000 and offered only to registered investment companies and other accredited investors. The Trust consists of one portfolio. The Fund's primary investment objective is to achieve total return on its assets. Its secondary investment objective is to achieve a high level of income.
2. SIGNIFICANT ACCOUNTING POLICIES
The following is a summary of significant accounting policies consistently followed by the Fund in the preparation of its financial statements. These policies are in conformity with U.S. generally accepted accounting principles (GAAP).
Investment Valuation
In calculating its net asset value (NAV), the Fund generally values investments as follows:
| ■ | Fixed-income securities acquired with remaining maturities greater than 60 days are fair valued using price evaluations provided by a pricing service approved by the Directors. |
| ■ | Fixed-income securities and repurchase agreements acquired with remaining maturities of 60 days or less are valued at their amortized cost (adjusted for the accretion of any discount or amortization of any premium), unless the issuer's creditworthiness is impaired or other factors indicate that amortized cost is not an accurate estimate of the investment's fair value, in which case it would be valued in the same manner as a longer-term security. |
| ■ | Equity securities listed on an exchange or traded through a regulated market system are valued at their last reported sale price or official closing price in their principal exchange or market. |
| ■ | Derivative contracts listed on exchanges are valued at their reported settlement or closing price. |
| ■ | Over-the-counter (OTC) derivative contracts are fair valued using price evaluations provided by a pricing service approved by the Directors. |
| ■ | Shares of other mutual funds or non-exchange-traded investment companies are valued based upon their reported NAVs. |
| ■ | For securities that are fair valued in accordance with procedures established by and under the general supervision of the Directors, certain factors may be considered such as: the purchase price of the security, information obtained by contacting the issuer, analysis of the issuer's financial statements or other available documents, fundamental analytical data, the nature and duration of restrictions on disposition, the movement of the market in which the security is normally traded and public trading in similar securities of the issuer or comparable issuers. |
If the Fund cannot obtain a price or price evaluation from a pricing service for an investment, the Fund may attempt to value the investment based upon the mean of bid and asked quotations or fair value the investment based on price evaluations, from one or more dealers. If any price, quotation, price evaluation or other pricing source is not readily available when the NAV is calculated, or if the Fund cannot obtain price evaluations from a pricing service or from more than one dealer for an investment within a reasonable period of time as set forth in the Fund's valuation policies and procedures, the Fund uses the fair value of the investment determined in accordance with the procedures described below. There can be no assurance that the Fund could purchase or sell an investment at the price used to calculate the Fund's NAV.
Fair Valuation and Significant Events Procedures
The Directors have appointed a Valuation Committee comprised of officers of the Fund, Federated Investment Counseling (“Adviser”) and certain of the Adviser's affiliated companies to determine fair value of securities and in overseeing the calculation of the NAV. The Directors have also authorized the use of pricing services recommended by the Valuation Committee to provide fair value evaluations of the current value of certain investments for purposes of calculating the NAV. The Valuation Committee employs various methods for reviewing third-party pricing-service evaluations including periodic reviews of third-party pricing services' policies, procedures and valuation methods (including key inputs and assumptions), transactional back-testing, comparisons of evaluations of different pricing services and review of price challenges by the Adviser based on recent market activity. In the event that market quotations and price evaluations are not available for an investment, the Valuation Committee determines the fair value of the investment in accordance with procedures adopted by the Directors. The Directors periodically review and approve the fair valuations made by the Valuation Committee and any changes made to the procedures.
Factors considered by pricing services in evaluating an investment include the yields or prices of investments of comparable quality, coupon, maturity, call rights and other potential prepayments, terms and type, reported transactions, indications as to values from dealers and general market conditions. Some pricing services provide a single price evaluation reflecting the bid-side of the market for an investment (a “bid” evaluation). Other pricing services offer both bid evaluations and price evaluations indicative of a price between the prices bid and asked for the investment (a “mid” evaluation). The Fund normally uses bid evaluations for U.S. Treasury and Agency securities and mortgage-backed securities. The Fund normally uses mid evaluations for other types of fixed-income securities and OTC derivative contracts. In the event that market quotations and price evaluations are not available for an investment, the fair value of the investment is determined in accordance with procedures adopted by the Directors.
Annual Shareholder Report
The Directors also have adopted procedures requiring an investment to be priced at its fair value whenever the Adviser determines that a significant event affecting the value of the investment has occurred between the time as of which the price of the investment would otherwise be determined and the time as of which the NAV is computed. An event is considered significant if there is both an affirmative expectation that the investment's value will change in response to the event and a reasonable basis for quantifying the resulting change in value. Examples of significant events that may occur after the close of the principal market on which a security is traded, or after the time of a price evaluation provided by a pricing service or a dealer, include:
| ■ | With respect to securities traded in foreign markets, significant trends in U.S. equity markets or in the trading of foreign securities index futures contracts; |
| ■ | Political or other developments affecting the economy or markets in which an issuer conducts its operations or its securities are traded; and |
| ■ | Announcements concerning matters such as acquisitions, recapitalizations, litigation developments, a natural disaster affecting the issuer's operations or regulatory changes or market developments affecting the issuer's industry. |
The Directors have approved the use of a pricing service to determine the fair value of equity securities traded principally in foreign markets when the Adviser determines that there has been a significant trend in the U.S. equity markets or in index futures trading. For other significant events, the Fund may seek to obtain more current quotations or price evaluations from alternative pricing sources. If a reliable alternative pricing source is not available, the Fund will determine the fair value of the investment using another method approved by the Directors.
Repurchase Agreements
The Fund may invest in repurchase agreements for short-term liquidity purposes. It is the policy of the Fund to require the other party to a repurchase agreement to transfer to the Fund's custodian or sub-custodian eligible securities or cash with a market value (after transaction costs) at least equal to the repurchase price to be paid under the repurchase agreement. The eligible securities are transferred to accounts with the custodian or sub-custodian in which the Fund holds a “securities entitlement” and exercises “control” as those terms are defined in the Uniform Commercial Code. The Fund has established procedures for monitoring the market value of the transferred securities and requiring the transfer of additional eligible securities if necessary to equal at least the repurchase price. These procedures also allow the other party to require securities to be transferred from the account to the extent that their market value exceeds the repurchase price or in exchange for other eligible securities of equivalent market value.
The insolvency of the other party or other failure to repurchase the securities may delay the disposition of the underlying securities or cause the Fund to receive less than the full repurchase price. Under the terms of the repurchase agreement, any amounts received by the Fund in excess of the repurchase price and related transaction costs must be remitted to the other party.
The Fund may enter into repurchase agreements in which eligible securities are transferred into joint trading accounts maintained by the custodian or sub-custodian for investment companies and other clients advised by the Fund's Adviser and its affiliates. The Fund will participate on a pro rata basis with the other investment companies and clients in its share of the securities transferred under such repurchase agreements and in its share of proceeds from any repurchase or other disposition of such securities.
Investment Income, Gains and Losses, Expenses and Distributions
Investment transactions are accounted for on a trade-date basis. Realized gains and losses from investment transactions are recorded on an identified-cost basis. Interest income and expenses are accrued daily. All net income and gain/loss (realized and unrealized) will be allocated daily to the shareholders based on their capital contributions to the Fund. The Fund does not currently intend to declare and pay distributions.
Premium and Discount Amortization
All premiums and discounts on fixed-income securities are amortized/accreted using the effective-interest-rate method.
Federal Taxes
As a partnership, the Fund is not subject to U.S. federal income tax. Instead, each investor reports separately on its own federal income tax return its allocated portion of the Fund's income, gain, losses, deductions and credits (including foreign tax credits for creditable foreign taxes imposed on the Fund). As of and during the year ended November 30, 2014, the Fund did not have a liability for any uncertain tax positions. The Fund recognizes interest and penalties, if any, related to tax liabilities as income tax expense in the Statement of Operations. As of November 30, 2014, tax years 2011 through 2014 remain subject to examination by the Fund's major tax jurisdictions, which include the United States of America and the Commonwealth of Pennsylvania.
The Fund has reclassified $383,278,991 and $56,852,531 from undistributed net investment income and accumulated net realized gain on investments and foreign currency transactions, respectively, to paid-in capital during the year ended November 30, 2014. The reclassification was to reflect, as an adjustment to paid-in capital, the cumulative amount of net investment income and net realized gains that have been allocated to the Fund's shareholders as of November 30, 2014, and had no impact to shareholders' capital.
The Fund may be subject to taxes imposed by governments of countries in which it invests. Such taxes are generally based on either income or gains earned or repatriated. The Fund accrues and applies such taxes to net investment income, net realized gains and net unrealized gains as income and/or gains are earned.
When-Issued and Delayed-Delivery Transactions
The Fund may engage in when-issued or delayed-delivery transactions. The Fund records when-issued securities on the trade date and maintains security positions such that sufficient liquid assets will be available to make payment for the securities purchased. Securities purchased on a when-issued or delayed-delivery basis are marked to market daily and begin earning interest on the settlement date. Losses may occur on these transactions due to changes in market conditions or the failure of counterparties to perform under the contract.
Annual Shareholder Report
Swap Contracts
Swap contracts involve two parties that agree to exchange the returns (or the differential in rates of return) earned or realized on particular predetermined investments, instruments, indices or other measures. The gross returns to be exchanged or “swapped” between parties are generally calculated with respect to a “notional amount” for a predetermined period of time. The Fund enters into interest rate, total return, credit default and other swap agreements. Risks may arise upon entering into swap agreements from the potential inability of the counterparties to meet the terms of their contract from unanticipated changes in the value of the swap agreement.
The Fund is subject to interest rate risk exposure in the normal course of pursuing its investment objectives. Because the Fund holds fixed rate bonds, the value of these bonds may decrease if interest rates rise. The Fund enters into interest rate swap contracts to manage sector/asset class risk. Interest rate swap agreements generally involve the agreement by the Fund to pay the counterparty a fixed or floating interest rate on a fixed notional amount and to receive a fixed or floating rate on a fixed notional amount, but may also involve the agreement to pay or receive payments derived from changes in interest rates. Periodic payments are generally made during the life of the swap agreement according to the terms and conditions of the agreement and at termination or maturity. The Fund's maximum risk of loss from counterparty credit risk is the discounted value of the net cash flows to be received from/paid to the counterparty over the contract's remaining life, to the extent the amount is positive. This risk is mitigated by having a master netting arrangement between the Fund and the counterparty and by the posting of collateral by the counterparty to the Fund to cover the Fund's exposure to the counterparty.
The Fund uses credit default swaps to manage sector/asset class risk. The “buyer” in a credit default swap is obligated to pay the “seller” a periodic stream of payments over the term of the contract provided that no event of default on an underlying reference obligation has occurred. If an event of default occurs, the seller must pay the buyer the full notional value, or the “par value”, of the reference obligation in exchange for the reference obligation. In connection with these agreements, securities may be identified as collateral in accordance with the terms of the respective swap agreements to provide assets of value and recourse in the event of default or bankruptcy/insolvency. Recovery values are assumed by market makers considering either industry standard recovery rates or entity specific factors and considerations until a credit event occurs. If a credit event has occurred, the recovery value is typically determined by a facilitated auction whereby a minimum number of allowable broker bids, together with a specific valuation method, are used to calculate the settlement value. The maximum amount of the payment that may occur, as a result of a credit event payable by the protection seller, is equal to the notional amount of the underlying index or security. The Fund's maximum exposure to loss of the notional value of credit default swaps outstanding at November 30, 2014, is $84,830,000. The Fund's maximum risk of loss from counterparty credit risk, either as the protection buyer or as the protection seller, is the fair value of the contract. This risk is mitigated by having a master netting arrangement between the Fund and the counterparty and by the posting of collateral by the counterparty to the Fund to cover the Fund's exposure to the counterparty.
Upfront payments received or paid by the Fund will be reflected as an asset or liability on the Statement of Assets and Liabilities. Changes in the value of swap contracts are included in “Swaps, at value” on the Statement of Assets and Liabilities, and periodic payments are reported as “Net realized gain (loss) on swap contracts” in the Statement of Operations.
Swap contracts are subject Master Netting Agreements (MNA) which are agreements between the Fund and its counterparties that provide for the net settlement of all transactions and collateral with the Fund, through a single payment, in the event of default or termination. Amounts presented on the Portfolio of Investments and Statement of Assets and Liabilities are not net settlement amounts but gross. Swaps, at value at period end, including net unrealized appreciation/depreciation, are listed after the Fund's Portfolio of Investments.
The average notional amount of interest rate swap contracts held by the Fund throughout the period was $1,538,462. This is based on amounts held as of each month-end throughout the fiscal period.
The average notional amount of credit default swap contracts held by the Fund throughout the period was $38,859,846. This is based on amounts held as of each month-end throughout the fiscal period.
Futures Contracts
The Fund purchases and sells financial futures contracts to manage duration risk and yield curve risk. Upon entering into a financial futures contract with a broker, the Fund is required to deposit in a segregated account a specified amount of cash or U.S. government securities which is shown as Restricted Cash in the Statement of Assets and Liabilities. Futures contracts are valued daily and unrealized gains or losses are recorded in a “variation margin” account. Daily, the Fund receives from or pays to the broker a specified amount of cash based upon changes in the variation margin account. When a contract is closed, the Fund recognizes a realized gain or loss. Futures contracts have market risks, including the risk that the change in the value of the contract may not correlate with the changes in the value of the underlying securities. There is minimal counterparty risk to the Fund since futures are exchange traded and the exchange's clearinghouse, as counterparty to all exchange traded futures, guarantees the futures against default.
Futures contracts outstanding at period end are listed after the Fund's Portfolio of Investments.
The average notional value of long and short futures contracts held by the Fund throughout the period was $6,293,707 and $80,058,669, respectively. This is based on amounts held as of each month-end throughout the fiscal period.
Foreign Exchange Contracts
The Fund enters into foreign exchange contracts to manage currency risk. Purchased contracts are used to acquire exposure to foreign currencies, whereas, contracts to sell are used to hedge the Fund's securities against currency fluctuations. Risks may arise upon entering into these transactions from the potential inability of counterparties to meet the terms of their commitments and from unanticipated movements in security prices or foreign exchange rates. The foreign exchange contracts are adjusted by the daily exchange rate of the underlying currency and any gains or losses are recorded for financial statement purposes as unrealized until the settlement date.
Foreign exchange contracts are subject MNA which are agreements between the Fund and its counterparties that provide for the net settlement of all transactions and collateral with the Fund, through a single payment, in the event of default or termination. Amounts presented on the Portfolio of Investments and Statement of Assets and Liabilities are not net settlement amounts but gross. Foreign exchange contracts outstanding at period end, including net unrealized appreciation/depreciation or net settlement amount, are listed after the Fund's Portfolio of Investments.
Annual Shareholder Report
The average value at settlement date payable and receivable of foreign exchange contracts purchased and sold by the Fund throughout the period was $4,883,858 and $5,857,109, respectively. This is based on the contracts held as of each month-end throughout the fiscal period.
Foreign Currency Translation
The accounting records of the Fund are maintained in U.S. dollars. All assets and liabilities denominated in foreign currencies (FCs) are translated into U.S. dollars based on the rates of exchange of such currencies against U.S. dollars on the date of valuation. Purchases and sales of securities, income and expenses are translated at the rate of exchange quoted on the respective date that such transactions are recorded. The Fund does not isolate that portion of the results of operations resulting from changes in foreign exchange rates on investments from the fluctuations arising from changes in market prices of securities held. Such fluctuations are included with the net realized and unrealized gain or loss from investments.
Reported net realized foreign exchange gains or losses arise from sales of portfolio securities, sales and maturities of short-term securities, sales of FCs, currency gains or losses realized between the trade and settlement dates on securities transactions, the difference between the amounts of dividends, interest and foreign withholding taxes recorded on the Fund's books, and the U.S. dollar equivalent of the amounts actually received or paid. Net unrealized foreign exchange gains and losses arise from changes in the value of assets and liabilities other than investments in securities at fiscal year end, resulting from changes in the exchange rate.
Restricted Securities
The Fund may purchase securities which are considered restricted. Restricted securities are securities that either: (a) cannot be offered for public sale without first being registered, or being able to take advantage of an exemption from registration, under the Securities Act of 1933; or (b) are subject to contractual restrictions on public sales. In some cases, when a security cannot be offered for public sale without first being registered, the issuer of the restricted security has agreed to register such securities for resale, at the issuer's expense, either upon demand by the Fund or in connection with another registered offering of the securities. Many such restricted securities may be resold in the secondary market in transactions exempt from registration. Restricted securities may be determined to be liquid under criteria established by the Directors. The Fund will not incur any registration costs upon such resales. The Fund's restricted securities, like other securities, are priced in accordance with procedures established by and under the general supervision of the Directors.
Option Contracts
The Fund buys or sells put and call options to increase return and to manage currency risk. The seller (“writer”) of an option receives a payment or premium, from the buyer, which the writer keeps regardless of whether the buyer exercises the option. When the Fund writes a put or call option, an amount equal to the premium received is recorded as a liability and subsequently marked to market to reflect the current value of the option written. Premiums received from writing options which expire are treated as realized gains. The Fund, as a writer of an option, bears the market risk of an unfavorable change in the price of the underlying reference instrument. When the Fund purchases a put or call option, an amount equal to the premium paid is recorded as an increase to the cost of the investment and subsequently marked to market to reflect the current value of the option purchased. Premiums paid for purchasing options which expire are treated as realized losses. Premiums received/paid for writing/purchasing options which are exercised or closed are added to the proceeds or offset against amounts paid on the underlying reference instrument to determine the realized gain or loss. The risk associated with purchasing put and call options is limited to the premium paid. Options can trade on securities or commodities exchanges. In this case, the exchange sets all the terms of the contract except for the price. Most exchanges require investors to maintain margin accounts through their brokers to cover their potential obligations to the exchange. This protects investors against potential defaults by the counterparty.
The following is a summary of the Fund's written option activity:
| Contracts | Number of
Contracts | Premium |
| Outstanding at November 30, 2013 | — | $— |
| Contracts written | 395,920,000 | 634,278 |
| Contracts exercised | — | — |
| Contracts expired | — | — |
| Contracts bought back | (320,920,000) | (187,366) |
| Outstanding at November 30, 2014 | 75,000,000 | $446,912 |
Written option contracts outstanding at period end are listed after the Fund's Portfolio of Investments.
The average market value of purchased options held by the Fund throughout the period was $329,806. This is based on amounts held as of each month-end throughout the fiscal period.
The average market value of written options held by the Fund throughout the period was $194,223. This is based on amounts held as of each month-end throughout the fiscal period.
Annual Shareholder Report
Additional Disclosure Related to Derivative Instruments
| Fair Value of Derivative Instruments |
| | Asset | Liability |
| | Statement of
Assets and
Liabilities
Location | Fair
Value | Statement of
Assets and
Liabilities
Location | Fair
Value |
| Derivatives not accounted for as hedging instruments under ASC Topic 815 | | | | |
| Interest rate contracts | Purchased
swaptions,
at value | $326,206 | Written swaptions
outstanding,
at value | $928,555 |
| Interest rate contracts | — | — | Swaps, at value | 152,313 |
| Interest rate contracts | Receivable for daily
variation margin | (112,117)* | — | — |
| Foreign exchange contracts | Unrealized appreciation
on foreign
exchange contracts | 12,650,539 | Unrealized depreciation
on foreign
exchange contracts | 10,686,481 |
| Credit contracts | Swaps, at value | 2,551,950 | Swaps, at value | 6,276,994 |
| Total derivatives not accounted for as hedging instruments under ASC Topic 815 | | $15,416,578 | | $18,044,343 |
| * | Includes cumulative depreciation of futures contracts as reported in the footnotes to the Portfolio of Investments. Only the current day's variation margin is reported within the Statement of Assets and Liabilities. |
The Effect of Derivative Instruments on the Statement of Operations for the Year Ended November 30, 2014
| Amount of Realized Gain or (Loss) on Derivatives Recognized in Income |
| | Credit
Default
Swaps | Futures | Forward
Currency
Contracts | Purchased
Option
Contracts | Written
Option
Contracts | Total |
| Interest rate contracts | $— | $(1,191,578) | $— | $— | $— | $(1,191,578) |
| Foreign exchange contracts | — | — | 9,588,720 | (743,193) | 60,214 | 8,905,741 |
| Credit contracts | (2,746,659) | — | — | — | — | (2,746,659) |
| TOTAL | $(2,746,659) | $(1,191,578) | $9,588,720 | $(743,193) | $60,214 | $4,967,504 |
| Change in Unrealized Appreciation or (Depreciation) on Derivatives Recognized in Income | |
| | Credit
Default
Swaps | Interest
Rate
Swaps | Futures | Forward
Currency
Contracts | Purchased
Swaption
Contracts | Written
Swaption
Contracts | Total |
| Interest rate contracts | $— | $(152,313) | $(112,117) | $— | $(791,892) | $(481,643) | $(1,537,965) |
| Foreign exchange contracts | — | — | — | 1,949,716 | — | — | 1,949,716 |
| Credit contracts | 265,610 | — | — | — | — | — | 265,610 |
| TOTAL | $265,610 | $(152,313) | $(112,117) | $1,949,716 | $(791,892) | $(481,643) | $677,361 |
As indicated above, certain derivative investments are transacted subject to MNA. These agreements permit the Fund to offset with a counterparty certain derivative payables and/or receivables with collateral held and create one single net payment in the event of default or termination of the agreement by either the Fund or the counterparty. Amounts presented on the Portfolio of Investments and Statement of Assets and Liabilities are not net settlement amounts but gross. As of November 30, 2014, the impact of netting assets and liabilities and the collateral pledged or received based on MNA are detailed below:
| Gross Amounts Not Offset in the Statement of Assets and Liabilities |
| Transaction | Gross Asset
Derivatives
Presented in
Statement of
Assets and
Liabilities | Financial
Instrument | Collateral
Received | Net Amount |
| Swap Contracts | $2,551,950 | $— | $— | $2,551,950 |
| Foreign Exchange Contracts | 12,650,539 | (10,604,276) | — | 2,046,263 |
| TOTAL | $15,202,489 | $(10,604,276) | $— | $4,598,213 |
Annual Shareholder Report
| Transaction | Gross Liability
Derivatives
Presented in
Statement of
Assets and
Liabilities | Financial
Instrument | Collateral
Received | Net Amount
|
| Swap Contracts | $6,429,307 | $— | $(152,313)1 | $6,276,994 |
| Foreign Exchange Contracts | 10,686,481 | (10,604,276) | — | 82,205 |
| TOTAL | $17,115,788 | $(10,604,276) | $(152,313) | $6,359,199 |
| 1 | The amount of collateral presented has been limited such that the net amount per counterparty cannot be less than zero. |
Other
The preparation of financial statements in conformity with GAAP requires management to make estimates and assumptions that affect the amounts of assets, liabilities, expenses and revenues reported in the financial statements. Actual results could differ from those estimated. The Fund applies Investment Company accounting and reporting guidance.
3. CONTRIBUTIONS/WITHDRAWALS
Transactions in shares were as follows:
| Year Ended November 30 | 2014 | 2013 |
| Contributions | 14,127,878 | 9,337,737 |
| Withdrawals | (8,552,619) | (7,411,217) |
| TOTAL CHANGE RESULTING FROM CONTRIBUTIONS/WITHDRAWALS | 5,575,259 | 1,926,520 |
4. FEDERAL TAX INFORMATION
At November 30, 2014, the cost of investments for federal tax purposes was $1,035,513,793. The net unrealized depreciation of investments for federal tax purposes excluding any unrealized appreciation/depreciation resulting from: (a) the translation from FCs to U.S. dollars of assets and liabilities other than investments in securities; (b) outstanding foreign currency commitments; (c) futures contract; (d) written swaptions; and (e) swap contracts was $5,290,909. This consists of net unrealized appreciation from investments for those securities having an excess of value over cost of $26,891,749 and net unrealized depreciation from investments for those securities having an excess of cost over value of $32,182,658.
5. INVESTMENT ADVISER FEE AND OTHER TRANSACTIONS WITH AFFILIATES
Investment Adviser Fee
The Adviser provides investment adviser services at no fee. Effective June 1, 2014, the Fund pays operating expenses associated with the operation and maintenance of the Fund (excluding fees and expenses that may be charged by the Adviser and its affiliates). Although not contractually obligated to do so, the Adviser intends to initially voluntarily reimburse operating expenses (excluding extraordinary expenses, and proxy-related expenses paid by the Fund, if any) such that the Fund will only bear such expenses in an amount of up to 0.15% of the Fund's average net assets.The Adviser can modify or terminate this voluntary reimbursement at any time at its sole discretion. For the year ended November 30, 2014, the Adviser voluntarily reimbursed $215,378 of other operating expenses.
Administrative Fee
Federated Administrative Services (FAS), under the Administrative Services Agreement, provides the Fund with administrative personnel and services. FAS provides administrative personnel and services at no fee.
Interfund Transactions
During the year ended November 30, 2014, the Fund engaged in purchase and sale transactions with funds that have a common investment adviser (or affiliated investment advisers), common Directors/Trustees, and/or common Officers. These purchase and sale transactions complied with Rule 17a-7 under the Act and amounted to $47,452,563 and $32,743,487, respectively.
General
Certain Officers and Directors of the Fund are Officers and Directors or Trustees of certain of the above companies. To efficiently facilitate payment, Directors'/Trustees' fees and certain expenses related to conducting meetings of the Directors/Trustees and other miscellaneous expenses are paid by an affiliate of the Adviser which in due course are reimbursed by the Fund. Such expenses may be included in Accrued and Miscellaneous Expenses on the Statement of Assets and Liabilities and Statement of Operations, respectively.
Annual Shareholder Report
Transactions Involving Affiliated Holdings
Affiliated holdings are investment companies which are managed by the Adviser or an affiliate of the Adviser. Transactions involving the affiliated holding during the year ended November 30, 2014, were as follows:
| | Federated
Prime Value
Obligations Fund,
Institutional Shares |
| Balance of Shares Held 11/30/2013 | 37,304,479 |
| Purchases/Additions | 843,591,232 |
| Sales/Reductions | (814,146,328) |
| Balance of Shares Held 11/30/2014 | 66,749,383 |
| Value | $66,749,383 |
| Dividend Income | $29,881 |
6. Investment TRANSACTIONS
Purchases and sales of investments, excluding long-term U.S. government securities and short-term obligations, for the year ended November 30, 2014, were as follows:
| Purchases | $1,225,067,451 |
| Sales | $994,044,556 |
7. CONCENTRATION OF RISK
Compared to diversified mutual funds, the Fund may invest a higher percentage of its assets among fewer issuers of portfolio securities. This increases the Fund's risk by magnifying the impact (positively or negatively) that any one issuer has on the Fund's share price and performance. The Fund invests in securities of non-U.S. issuers. Political or economic developments may have an effect on the liquidity and volatility of portfolio securities and currency holdings.
8. LINE OF CREDIT
The Fund participates in a $100,000,000 unsecured, uncommitted revolving line of credit (LOC) agreement with PNC Bank. The LOC was made available for extraordinary or emergency purposes, primarily for financing redemption payments. Borrowings are charged interest at a rate offered to the Fund by PNC Bank at the time of the borrowing. As of November 30, 2014, there were no outstanding loans. During the year ended November 30, 2014, the Fund did not utilize the LOC.
9. INTERFUND LENDING
Pursuant to an Exemptive Order issued by the Securities and Exchange Commission, the Fund, along with other funds advised by subsidiaries of Federated Investors, Inc., may participate in an interfund lending program. This program provides an alternative credit facility allowing the Fund to borrow from other participating affiliated funds. As of November 30, 2014, there were no outstanding loans. During the year ended November 30, 2014, the program was not utilized.
Annual Shareholder Report
Report of Independent Registered Public Accounting Firm
TO THE BOARD OF DIRECTORS OF Federated Core trust II, l.p. AND SHAREHOLDERS OF emerging markets fixed income core fund:
We have audited the accompanying statement of assets and liabilities of Emerging Markets Fixed Income Core Fund (the “Fund”) (one of the portfolios constituting Federated Core Trust II, L.P.), including the portfolio of investments, as of November 30, 2014, and the related statement of operations for the year then ended, the statement of changes in net assets for each of the two years in the period then ended, and the financial highlights for each of the five years in the period then ended. These financial statements and financial highlights are the responsibility of the Fund's management. Our responsibility is to express an opinion on these financial statements and financial highlights based on our audits.
We conducted our audits in accordance with standards of the Public Company Accounting Oversight Board (United States). Those standards require that we plan and perform the audit to obtain reasonable assurance about whether the financial statements and financial highlights are free of material misstatement. We were not engaged to perform an audit of the Fund's internal control over financial reporting. Our audits included consideration of internal control over financial reporting as a basis for designing audit procedures that are appropriate in the circumstances, but not for the purpose of expressing an opinion on the effectiveness of the Fund's internal control over financial reporting. Accordingly, we express no such opinion. An audit also includes examining, on a test basis, evidence supporting the amounts and disclosures in the financial statements and financial highlights, assessing the accounting principles used and significant estimates made by management, and evaluating the overall financial statement presentation. Our procedures included confirmation of securities owned as of November 30, 2014, by correspondence with the custodian and others or by other appropriate auditing procedures where replies from others were not received. We believe that our audits provide a reasonable basis for our opinion.
In our opinion, the financial statements and financial highlights referred to above present fairly, in all material respects, the financial position of Emerging Markets Fixed Income Core Fund, a portfolio of Federated Core Trust II, L.P., at November 30, 2014, the results of its operations for the year then ended, the changes in its net assets for each of the two years in the period then ended, and the financial highlights for each of the five years in the period then ended, in conformity with U.S. generally accepted accounting principles.
Boston, Massachusetts
January 23, 2015
Annual Shareholder Report
Shareholder Expense Example (unaudited)
As a shareholder of the Fund, you incur ongoing costs, including to the extent applicable, management fees, distribution (12b-1) fees and/or other service fees and other Fund expenses. This Example is intended to help you to understand your ongoing costs (in dollars) of investing in the Fund and to compare these costs with the ongoing costs of investing in other mutual funds. It is based on an investment of $1,000 invested at the beginning of the period and held for the entire period from June 1, 2014 to November 30, 2014.
ACTUAL EXPENSES
The first section of the table below provides information about actual account values and actual expenses. You may use the information in this section, together with the amount you invested, to estimate the expenses that you incurred over the period. Simply divide your account value by $1,000 (for example, an $8,600 account value divided by $1,000 = 8.6), then multiply the result by the number in the first section under the heading entitled “Expenses Paid During Period” to estimate the expenses attributable to your investment during this period.
HYPOTHETICAL EXAMPLE FOR COMPARISON PURPOSES
The second section of the table below provides information about hypothetical account values and hypothetical expenses based on the Fund's actual expense ratio and an assumed rate of return of 5% per year before expenses, which is not the Fund's actual return. Thus, you should not use the hypothetical account values and expenses to estimate the actual ending account balance or your expenses for the period. Rather, these figures are required to be provided to enable you to compare the ongoing costs of investing in the Fund with other funds. To do so, compare this 5% hypothetical example with the 5% hypothetical examples that appear in the shareholder reports of the other funds.
Please note that the expenses shown in the table are meant to highlight your ongoing costs only. Therefore, the second section of the table is useful in comparing ongoing costs only, and will not help you determine the relative total costs of owning different funds.
| | Beginning
Account Value
6/1/2014 | Ending
Account Value
11/30/2014 | Expenses Paid
During Period1 |
| Actual | $1,000 | $994.00 | $0.35 |
Hypothetical (assuming a 5% return
before expenses) | $1,000 | $1,024.72 | $0.36 |
| 1 | Expenses are equal to the Fund's annualized net expense ratio of 0.07%, multiplied by the average account value over the period, multiplied by 183/365 (to reflect the one-half-year period).
|
Annual Shareholder Report
Board of Directors and Trust Officers
The Board of Directors is responsible for managing the Trust's business affairs and for exercising all the Trust's powers except those reserved for the shareholders. The following tables give information about each Director and the senior officers of the Fund. Where required, the tables separately list Directors who are “interested persons” of the Fund (i.e., “Interested” Directors) and those who are not (i.e., “Independent” Directors). Unless otherwise noted, the address of each person listed is Federated Investors Tower, 1001 Liberty Avenue, Pittsburgh, PA 15222. The address of all Independent Directors listed is 4000 Ericsson Drive, Warrendale, PA 15086-7561; Attention: Mutual Fund Board. As of December 31, 2014, the Trust comprised one portfolio(s), and the Federated Fund Family consisted of 40 investment companies (comprising 131 portfolios). Unless otherwise noted, each Officer is elected annually. Unless otherwise noted, each Director oversees all portfolios in the Federated Fund Family and serves for an indefinite term. The Fund's Statement of Additional Information includes additional information about Trust Directors and is available, without charge and upon request, by calling 1-800-341-7400.
Interested Directors Background
Name
Birth Date
Positions Held with Trust
Date Service Began | Principal Occupation(s) for Past Five Years,
Other Directorships Held and Previous Position(s) |
John F. Donahue*
Birth Date: July 28, 1924
Director
Indefinite Term
Began serving: November 2001 | Principal Occupations: Director or Trustee of the Federated Fund Family; Chairman and Director, Federated Investors, Inc.; Chairman of the Federated Fund Family's Executive Committee.
Previous Positions: Chairman of the Federated Fund Family; Trustee, Federated Investment Management Company; Chairman and Director, Federated Investment Counseling. |
J. Christopher Donahue*
Birth Date: April 11, 1949
President and Director
Indefinite Term
Began serving: November 2000 | Principal Occupations: Principal Executive Officer and President of certain of the Funds in the Federated Fund Family; Director or Trustee of the Funds in the Federated Fund Family; President, Chief Executive Officer and Director, Federated Investors, Inc.; Chairman and Trustee, Federated Investment Management Company; Trustee, Federated Investment Counseling; Chairman and Director, Federated Global Investment Management Corp.; Chairman, Federated Equity Management Company of Pennsylvania and Passport Research, Ltd. (investment advisory subsidiary of Federated); Trustee, Federated Shareholder Services Company; Director, Federated Services Company.
Previous Positions: President, Federated Investment Counseling; President and Chief Executive Officer, Federated Investment Management Company, Federated Global Investment Management Corp. and Passport Research, Ltd. |
| * | Family relationships and reasons for “interested” status: John F. Donahue is the father of J. Christopher Donahue; both are “interested” due to their beneficial ownership of shares of Federated Investors, Inc. and the positions they hold with Federated and its subsidiaries. |
INDEPENDENT Directors Background
Name
Birth Date
Positions Held with Trust
Date Service Began | Principal Occupation(s) for Past Five Years,
Other Directorships Held, Previous Position(s) and Qualifications |
John T. Collins
Birth Date: January 24, 1947
Director
Indefinite Term
Began serving: October 2013 | Principal Occupations: Director or Trustee of the Federated Fund Family; Chairman and CEO, The Collins Group, Inc. (a private equity firm).
Other Directorships Held: Director, KLX Corp.
Qualifications: Mr. Collins has served in several business and financial management roles and directorship positions throughout his career. Mr. Collins serves as Chairman Emeriti, Bentley University. Mr. Collins previously served as Director, Sterling Suffolk Downs, Inc. (racecourse); Director and Audit Committee Member, Bank of America Corp. and Director, Beth Israel Deaconess Medical Center (Harvard University Affiliate Hospital). |
Maureen Lally-Green
Birth Date: July 5, 1949
Director
Indefinite Term
Began serving: August 2009 | Principal Occupations: Director or Trustee of the Federated Fund Family; Associate General Secretary and Director, Office for Church Relations, Diocese of Pittsburgh; Adjunct Professor of Law, Duquesne University School of Law.
Other Directorships Held: Director, CONSOL Energy Inc.
Qualifications: Judge Lally-Green has served in various legal and business roles and directorship positions throughout her career. Judge Lally-Green previously served as Professor of Law, Duquesne University School of Law and was a member of the Superior Court of Pennsylvania. Judge Lally-Green also holds the positions of: Member, Pennsylvania State Board of Education; Director, Saint Vincent College; Director and Chair, UPMC Mercy Hospital; Regent, St. Vincent Seminary; Director, Epilepsy Foundation of Western and Central Pennsylvania; Director, Our Campaign for the Church Alive!, Inc.; Director, Pennsylvania Bar Institute; and Director, Catholic High Schools of the Diocese of Pittsburgh, Inc. Judge Lally-Green has held the positions of: Director, Auberle; Director, Ireland Institute of Pittsburgh; Director, Saint Thomas More Society; and Director Cardinal Wuerl Catholic High School. |
Annual Shareholder Report
Name
Birth Date
Positions Held with Trust
Date Service Began | Principal Occupation(s) for Past Five Years,
Other Directorships Held, Previous Position(s) and Qualifications |
Peter E. Madden
Birth Date: March 16, 1942
Director
Indefinite Term
Began serving: November 2001 | Principal Occupation: Director or Trustee, and Chair of the Board of Directors or Trustees, of the Federated Fund Family; Retired.
Other Directorships Held: None.
Qualifications: Mr. Madden has served in several business management, mutual fund services and directorship positions throughout his career. Mr. Madden previously served as President, Chief Operating Officer and Director, State Street Bank and Trust Company (custodian bank) and State Street Corporation (financial services). He was Director, VISA USA and VISA International and Chairman and Director, Massachusetts Bankers Association. Mr. Madden served as Director, Depository Trust Corporation and Director, The Boston Stock Exchange. Mr. Madden also served as a Representative to the Commonwealth of Massachusetts General Court. |
Charles F. Mansfield, Jr.
Birth Date: April 10, 1945
Director
Indefinite Term
Began serving: November 2001 | Principal Occupations: Director or Trustee of the Federated Fund Family; Management Consultant.
Other Directorships Held: None.
Qualifications: Mr. Mansfield has served in several banking, business management and educational roles and directorship positions throughout his career. Mr. Mansfield previously served as Chief Executive Officer, PBTC International Bank; Partner, Arthur Young & Company (now Ernst & Young LLP); Chief Financial Officer of Retail Banking Sector, Chase Manhattan Bank; Senior Vice President, HSBC Bank USA (formerly, Marine Midland Bank); Vice President, Citibank; Assistant Professor of Banking and Finance, Frank G. Zarb School of Business, Hofstra University; Executive Vice President DVC Group, Inc. (marketing, communications and technology). |
Thomas M. O'Neill
Birth Date: June 14, 1951
Director
Indefinite Term
Began serving: October 2006 | Principal Occupations: Director or Trustee, Vice Chair of the Audit Committee of the Federated Fund Family; Sole Proprietor, Navigator Management Company (investment and strategic consulting).
Other Directorships Held: None.
Qualifications: Mr. O'Neill has served in several business, mutual fund and financial management roles and directorship positions throughout his career. Mr. O'Neill serves as Director, Medicines for Humanity and Director, The Golisano Children's Museum of Naples, Florida. Mr. O'Neill previously served as Chief Executive Officer and President, Managing Director and Chief Investment Officer, Fleet Investment Advisors; President and Chief Executive Officer, Aeltus Investment Management, Inc.; General Partner, Hellman, Jordan Management Co., Boston, MA; Chief Investment Officer, The Putnam Companies, Boston, MA; Credit Analyst and Lending Officer, Fleet Bank; Director and Consultant, EZE Castle Software (investment order management software); and Director, Midway Pacific (lumber). |
P. Jerome Richey
Birth Date: February 23, 1949
Director
Indefinite Term
Began serving: October 2013 | Principal Occupations: Director or Trustee of the Federated Fund Family; General Counsel, University of Pittsburgh.
Other Directorships Held: None.
Qualifications: Mr. Richey has served in several business and legal management roles and directorship positions throughout his career. Mr. Richey serves as Board Member, Epilepsy Foundation of Western Pennsylvania and Board member, World Affairs Council of Pittsburgh. Mr. Richey previously served as Chief Legal Officer and Executive Vice President, CONSOL Energy Inc. and Shareholder, Buchanan Ingersoll & Rooney PC (a law firm). |
John S. Walsh
Birth Date: November 28, 1957
Director
Indefinite Term
Began serving: November 2001 | Principal Occupations: Director or Trustee, Chair of the Audit Committee of the Federated Fund Family; President and Director, Heat Wagon, Inc. (manufacturer of construction temporary heaters); President and Director, Manufacturers Products, Inc. (distributor of portable construction heaters); President, Portable Heater Parts, a division of Manufacturers Products, Inc.
Other Directorships Held: None.
Qualifications: Mr. Walsh has served in several business management roles and directorship positions throughout his career. Mr. Walsh previously served as Vice President, Walsh & Kelly, Inc. (paving contractors). |
OFFICERS
Name
Birth Date
Address
Positions Held with Trust
Date Service Began | Principal Occupation(s) for Past Five Years
and Previous Position(s) |
John W. McGonigle
Birth Date: October 26, 1938
EXECUTIVE VICE PRESIDENT AND SECRETARY
Officer since: November 2000 | Principal Occupations: Executive Vice President and Secretary of the Federated Fund Family; Vice Chairman, Executive Vice President, Secretary and Director, Federated Investors, Inc.
Previous Positions: Trustee, Federated Investment Management Company and Federated Investment Counseling; Director, Federated Global Investment Management Corp., Federated Services Company and Federated Securities Corp. |
Annual Shareholder Report
Name
Birth Date
Address
Positions Held with Trust
Date Service Began | Principal Occupation(s) for Past Five Years
and Previous Position(s) |
Lori A. Hensler
Birth Date: January 6, 1967
TREASURER
Officer since: April 2013 | Principal Occupations: Principal Financial Officer and Treasurer of the Federated Fund Family; Senior Vice President, Federated Administrative Services; Financial and Operations Principal for Federated Securities Corp. and Edgewood Services, Inc.; and Assistant Treasurer, Federated Investors Trust Company. Ms. Hensler has received the Certified Public Accountant designation.
Previous Positions: Controller of Federated Investors, Inc.; Senior Vice President and Assistant Treasurer, Federated Investors Management Company; Treasurer, Federated Investors Trust Company; Assistant Treasurer, Federated Administrative Services, Federated Administrative Services, Inc., Federated Securities Corp., Edgewood Services, Inc., Federated Advisory Services Company, Federated Equity Management Company of Pennsylvania, Federated Global Investment Management Corp., Federated Investment Counseling, Federated Investment Management Company, Passport Research, Ltd., and Federated MDTA, LLC; Financial and Operations Principal for Federated Securities Corp., Edgewood Services, Inc. and Southpointe Distribution Services, Inc. |
Peter J. Germain
Birth Date: September 3, 1959
CHIEF LEGAL OFFICER
Officer since: January 2005 | Principal Occupations: Mr. Germain is Chief Legal Officer of the Federated Fund Family. He is General Counsel and Vice President, Federated Investors, Inc.; President, Federated Administrative Services and Federated Administrative Services, Inc.; Vice President, Federated Securities Corp.; Secretary, Federated Private Asset Management, Inc.; and Secretary, Retirement Plan Service Company of America. Mr. Germain joined Federated in 1984 and is a member of the Pennsylvania Bar Association.
Previous Positions: Deputy General Counsel, Special Counsel, Managing Director of Mutual Fund Services, Federated Investors, Inc.; Senior Vice President, Federated Services Company; and Senior Corporate Counsel, Federated Investors, Inc. |
Richard B. Fisher
Birth Date: May 17, 1923
VICE PRESIDENT
Officer since: August 2002 | Principal Occupations: Vice Chairman or Vice President of some of the Funds in the Federated Fund Family; Vice Chairman, Federated Investors, Inc.; Chairman, Federated Securities Corp.
Previous Positions: President and Director or Trustee of some of the Funds in the Federated Fund Family; Executive Vice President, Federated Investors, Inc.; Director and Chief Executive Officer, Federated Securities Corp. |
Brian P. Bouda
Birth Date: February 28, 1947
CHIEF COMPLIANCE OFFICER AND SENIOR VICE PRESIDENT
Officer since: August 2004 | Principal Occupations: Senior Vice President and Chief Compliance Officer of the Federated Fund Family; Vice President and Chief Compliance Officer of Federated Investors, Inc. and Chief Compliance Officer of certain of its subsidiaries. Mr. Bouda joined Federated in 1999 and is a member of the American Bar Association and the State Bar Association of Wisconsin.
Previous Positions: Served in Senior Management positions with a large regional banking organization. |
Robert J. Ostrowski
Birth Date: April 26, 1963
Chief Investment Officer
Officer since: May 2004 | Principal Occupations: Robert J. Ostrowski joined Federated in 1987 as an Investment Analyst and became a Portfolio Manager in 1990. He was named Chief Investment Officer of Federated's taxable fixed-income products in 2004 and also serves as a Senior Portfolio Manager. Mr. Ostrowski became an Executive Vice President of the Fund's Adviser in 2009 and served as a Senior Vice President of the Fund's Adviser from 1997 to 2009. Mr. Ostrowski has received the Chartered Financial Analyst designation. He received his M.S. in Industrial Administration from Carnegie Mellon University. |
Ihab Salib
Birth Date: December 14, 1964
VICE PRESIDENT
Officer since: May 2006
Portfolio Manager since:
May 2013
| Principal Occupations: Ihab Salib has been a Portfolio Manager of the Fund since May 2013. He is Vice President of the Trust with respect to the Fund. Mr. Salib joined Federated in April 1999 as a Senior Fixed-Income Trader/Assistant Vice President of the Fund's Adviser. In July 2000, he was named a Vice President of the Fund's Adviser and in January 2007 he was named a Senior Vice President of the Fund's Adviser. He has served as a Portfolio Manager since January 2002. From January 1994 through March 1999, Mr. Salib was employed as a Senior Global Fixed-Income Analyst with UBS Brinson, Inc. Mr. Salib received his B.A. with a major in Economics from Stony Brook University. |
Annual Shareholder Report
Evaluation and Approval of Advisory Contract–May 2014
Emerging Markets Fixed Income Core Fund (the “Fund”)
Following a review and recommendation of approval by the Fund's independent trustees, the Fund's Board reviewed and approved at its May 2014 meetings the Fund's investment advisory contract for an additional one-year term. The Board's decision regarding the contract reflects the exercise of its business judgment on whether to continue the existing arrangements. The Fund is distinctive in that it is designed for the efficient management of a particular asset class and is made available for investment only to other Federated funds and a limited number of other accredited investors. In addition, the Adviser does not charge an investment advisory fee for its services although it or its affiliates may receive compensation for managing assets invested in the Fund.
In this connection, the Federated Funds' Board had previously appointed a Senior Officer, whose duties include specified responsibilities relating to the process by which advisory fees are to be charged to a Federated fund. The Senior Officer has the authority to retain consultants, experts, or staff as may be reasonably necessary to assist in the performance of his duties, reports directly to the Board, and may be terminated only with the approval of a majority of the independent members of the Board. The Senior Officer prepared and furnished to the Board an independent, written evaluation that covered topics discussed below (the “Evaluation”). The Board considered that Evaluation, along with other information, in deciding to approve the advisory contract.
As previously noted, the Adviser does not charge an investment advisory fee for its services; however, the Board did consider compensation and benefits received by the Adviser, including fees received for services provided to the Fund by other entities in the Federated organization and research services received by the Adviser from brokers that execute Federated fund trades. The Board is also familiar with and considered judicial decisions concerning allegedly excessive investment advisory fees which have indicated that the following factors may be relevant to an Adviser's fiduciary duty with respect to its receipt of compensation from a fund: the nature and quality of the services provided by the Adviser to a fund and its shareholders, including the performance and expenses of the fund and of comparable funds; the Adviser's cost of providing the services, including the profitability to the Adviser of providing advisory services to a fund; the extent to which the Adviser may realize “economies of scale” as a fund grows larger and, if such economies exist, whether they have been shared with a fund and its shareholders or the family of funds; any “fall-out financial benefits” that accrue to the Adviser because of its relationship with a fund (including research services received from brokers that execute fund trades and any fees paid to affiliates of the Adviser for services rendered to a fund); comparative fee structures, including a comparison of fees paid to the Adviser with those paid by similar funds; and the extent of care, conscientiousness and independence with which the Board members perform their duties and their expertise, including whether they are fully informed about all facts the Board deems relevant to its consideration of the Adviser's services and fees. The Board noted that SEC disclosure requirements regarding the basis for the Board's approval of the Fund's advisory contract generally track the factors listed above. Consistent with these judicial decisions and SEC disclosure requirements, the Board also considered management fees charged to institutional and other clients of the Adviser for what might be viewed as like services. The Board was aware of these factors and was guided by them in its review of the Fund's advisory contract to the extent it considered them to be appropriate and relevant, as discussed further below.
The Board considered and weighed these circumstances in light of its substantial accumulated experience in governing the Fund and working with Federated on matters relating to the Federated funds, and was assisted in its deliberations by independent legal counsel. Throughout the year and in connection with its May meetings, the Board requested and received substantial and detailed information about the Fund and the Federated organization that was in addition to the extensive materials that comprise and accompany the Senior Officer's Evaluation. Federated provided much of this information at each regular meeting of the Board, and furnished additional substantial information in connection with the May meeting at which the Board's formal review of the advisory contract occurred. At this May meeting, senior management of the Adviser also met with the independent trustees and their counsel to discuss the materials presented and any other matters thought relevant by the Adviser or the trustees. Between regularly scheduled meetings, the Board also received information on particular matters as the need arose. Thus, the Board's consideration of the advisory contract included review of the Senior Officer's Evaluation, accompanying data and additional information covering such matters as: the Adviser's investment philosophy, revenue, profitability, personnel and processes; investment and operating strategies; the Fund's short- and long-term performance, (in absolute terms, both on a gross basis and net of expenses, as well as in relationship to its particular investment program and certain competitor or “peer group” funds and/or other benchmarks, as appropriate), and comments on the reasons for performance; the Fund's investment objectives; the Fund's expenses (including the advisory fee itself and the overall expense structure of the Fund both in absolute terms and relative to similar and/or competing funds with due regard for contractual or voluntary expense limitations); the use and allocation of brokerage commissions derived from trading the Fund's portfolio securities (if any); and the nature, quality and extent of the advisory and other services provided to the Fund by the Adviser and its affiliates. The Board also considered the preferences and expectations of Fund shareholders; the entrepreneurial risk assumed by the Adviser in sponsoring the funds; the continuing state of competition in
Annual Shareholder Report
the mutual fund industry and market practices; the range of comparable fees for similar funds in the mutual fund industry, the Fund's relationship to the Federated family of funds which include a comprehensive array of funds with different investment objectives, policies and strategies which are available for exchange without the incurrence of additional sales charges; compliance and audit reports concerning the Federated funds and the Federated companies that service them (including communications from regulatory agencies), as well as Federated's responses to any issues raised therein; and relevant developments in the mutual fund industry and how the Federated funds and/or Federated are responding to them. The Board's evaluation process is evolutionary. The criteria considered and the emphasis placed on relevant criteria change in recognition of changing circumstances in the mutual fund marketplace.
The Fund's ability to deliver competitive performance when compared to its benchmark index was also deemed to be relevant by the Board as a useful indicator of how the Adviser is executing the Fund's investment program, which in turn was one of the Board's considerations in reaching a conclusion that the nature, extent, and quality of the Adviser's investment management services were such as to warrant continuation of the advisory contract.
The Board was informed by the Adviser that, for the periods covered by the Evaluation, the Fund underperformed its benchmark index for the one-year period, outperformed its benchmark index for the three-year period and outperformed its benchmark index for the five-year period. The Board discussed the Fund's performance with the Adviser and recognized the efforts being undertaken by the Adviser. The Board will continue to monitor these efforts and the performance of the Fund in the context of the other factors considered relevant by the Board.
Because the Adviser does not charge the Fund an investment advisory fee, the Fund's Board does not consider fee comparisons to other mutual funds or other institutional or separate accounts to be relevant.
The Board also received financial information about Federated, including information regarding the compensation and benefits Federated derived from its relationships with the Federated funds. Because the Adviser does not charge an investment advisory fee for its services, this information generally covered fees received by Federated's subsidiaries for providing other services to the Federated funds under separate contracts (e.g., for serving as the Federated funds' administrator). The information also detailed any indirect benefit Federated may derive from its receipt of research services from brokers who execute Federated fund trades. In addition, the Board considered the fact that, in order for a fund to be competitive in the marketplace, Federated and its affiliates frequently waived fees and/or reimbursed other expenses and have disclosed to fund investors and/or indicated to the Board their intention to do so in the future, where appropriate. Moreover, the Board receives regular reporting as to the institution, adjustment or elimination of these voluntary waivers. In addition, following discussions regarding the Senior Officer's May 2013 recommendations, Federated made meaningful reductions to gross advisory fees for several funds. At the Board meeting in May 2014, the Senior Officer proposed, and the Board approved, reductions in the contractual advisory fees of certain other funds.
The Board and the Senior Officer also reviewed information compiled by Federated comparing profitability information for Federated to other publicly held fund management companies. In this regard, the Senior Officer concluded that Federated's profit margins did not appear to be excessive.
The Senior Officer noted that, subject to the comments and recommendations made within his Evaluation, his observations and the information accompanying the Evaluation supported a finding by the Board that the management fees for each of the funds were reasonable.
The Board based its decision to approve the advisory contract on the totality of the circumstances and relevant factors and with a view to past and future long-term considerations. Not all of the factors and considerations identified above were necessarily relevant to the Fund, nor did the Board consider any one of them to be determinative. In particular, due to the unusual nature of the Fund as primarily an internal product with no advisory fee, the Board does not consider the assessment of whether economies of scale would be realized if the Fund were to grow to some sufficient size to be relevant. With respect to the factors that were relevant, the Board's decision to approve the contract reflects its determination that Federated's performance and actions provided a satisfactory basis to support the decision to continue the existing arrangement.
Annual Shareholder Report
Voting Proxies on Fund Portfolio Securities
A description of the policies and procedures that the Fund uses to determine how to vote proxies, if any, relating to securities held in the Fund's portfolio, as well as a report on “Form N-PX” of how the Fund voted any such proxies during the most recent 12-month period ended June 30, are available, without charge and upon request, by calling 1-800-341-7400. These materials are also available at the SEC's website at www.sec.gov.
Quarterly Portfolio Schedule
The Fund files with the SEC a complete schedule of its portfolio holdings, as of the close of the first and third quarters of its fiscal year, on “Form N-Q.” These filings are available on the SEC's website at www.sec.gov and may be reviewed and copied at the SEC's Public Reference Room in Washington, DC. (Call 1-800-SEC-0330 for information on the operation of the Public Reference Room.)
Annual Shareholder Report
Mutual funds are not bank deposits or obligations, are not guaranteed by any bank and are not insured or guaranteed by the U.S. government, the Federal Deposit Insurance Corporation, the Federal Reserve Board or any other government agency. Investment in mutual funds involves investment risk, including the possible loss of principal.
This Report is authorized for distribution to prospective investors only when preceded or accompanied by the Fund's Confidential Private Offering Memorandum, which contains facts concerning its objective and policies, management fees, expenses and other information.
Emerging Markets Fixed Income Core Fund
Federated Investors Funds
4000 Ericsson Drive
Warrendale, PA 15086-7561
Contact us at FederatedInvestors.com
or call 1-800-341-7400.
Federated Securities Corp., Placement Agent
CUSIP 31409R102
28172 (1/15)
Federated is a registered trademark of Federated Investors, Inc.
2015 ©Federated Investors, Inc.
Item 2. Code of Ethics
(a) As of the end of the period covered by this report, the registrant has adopted a code of ethics (the "Section 406 Standards for Investment Companies - Ethical Standards for Principal Executive and Financial Officers") that applies to the registrant's Principal Executive Officer and Principal Financial Officer; the registrant's Principal Financial Officer also serves as the Principal Accounting Officer.
(c) Not Applicable
(d) Not Applicable
(e) Not Applicable
(f)(3) The registrant hereby undertakes to provide any person, without charge, upon request, a copy of the code of ethics. To request a copy of the code of ethics, contact the registrant at 1-800-341-7400, and ask for a copy of the Section 406 Standards for Investment Companies - Ethical Standards for Principal Executive and Financial Officers.
Item 3. Audit Committee Financial Expert
The registrant's Board has determined that each of the following members of the Board's Audit Committee is an “audit committee financial expert,” and is "independent," for purposes of this Item: John T. Collins, Thomas M. O'Neill and John S. Walsh.
Item 4. Principal Accountant Fees and Services
(a) Audit Fees billed to the registrant for the two most recent fiscal years:
Fiscal year ended 2014 - $30,400
Fiscal year ended 2013 - $30,400
(b) Audit-Related Fees billed to the registrant for the two most recent fiscal years:
Fiscal year ended 2014 - $15
Fiscal year ended 2013 - $0
Travel to Audit Committee Meeting.
Amount requiring approval of the registrant’s audit committee pursuant to paragraph (c)(7)(ii) of Rule 2-01 of Regulation S-X, $0 and $0 respectively.
(c) Tax Fees billed to the registrant for the two most recent fiscal years:
Fiscal year ended 2014 - $0
Fiscal year ended 2013 - $0
Amount requiring approval of the registrant’s audit committee pursuant to paragraph (c)(7)(ii) of Rule 2-01 of Regulation S-X, $452 and $373 respectively. Fiscal year ended 2014- Fees for review of Federal and state taxes. Fiscal year ended 2013- Fees for review of Federal and state taxes.
(d) All Other Fees billed to the registrant for the two most recent fiscal years:
Fiscal year ended 2014 - $0
Fiscal year ended 2013 - $0
Amount requiring approval of the registrant’s audit committee pursuant to paragraph (c)(7)(ii) of Rule 2-01 of Regulation S-X, $2,284 and $1,055 respectively. Fiscal year ended 2014- Service fee for analysis of potential Passive Foreign Investment Company holdings. Fiscal year ended 2013- Service fee for analysis of potential Passive Foreign Investment Company holdings.
(e)(1) Audit Committee Policies regarding Pre-approval of Services.
The Audit Committee is required to pre-approve audit and non-audit services performed by the independent auditor in order to assure that the provision of such services do not impair the auditor’s independence. Unless a type of service to be provided by the independent auditor has received general pre-approval, it will require specific pre-approval by the Audit Committee. Any proposed services exceeding pre-approved cost levels will require specific pre-approval by the Audit Committee.
Certain services have the general pre-approval of the Audit Committee. The term of the general pre-approval is 12 months from the date of pre-approval, unless the Audit Committee specifically provides for a different period. The Audit Committee will annually review the services that may be provided by the independent auditor without obtaining specific pre-approval from the Audit Committee and may grant general pre-approval for such services. The Audit Committee will revise the list of general pre-approved services from time to time, based on subsequent determinations. The Audit Committee will not delegate its responsibilities to pre-approve services performed by the independent auditor to management.
The Audit Committee has delegated pre-approval authority to its Chairman. The Chairman will report any pre-approval decisions to the Audit Committee at its next scheduled meeting. The Committee will designate another member with such pre-approval authority when the Chairman is unavailable.
AUDIT SERVICES
The annual Audit services engagement terms and fees will be subject to the specific pre-approval of the Audit Committee. The Audit Committee must approve any changes in terms, conditions and fees resulting from changes in audit scope, registered investment company (RIC) structure or other matters.
In addition to the annual Audit services engagement specifically approved by the Audit Committee, the Audit Committee may grant general pre-approval for other Audit Services, which are those services that only the independent auditor reasonably can provide. The Audit Committee has pre-approved certain Audit services, all other Audit services must be specifically pre-approved by the Audit Committee.
AUDIT-RELATED SERVICES
Audit-related services are assurance and related services that are reasonably related to the performance of the audit or review of the Company’s financial statements or that are traditionally performed by the independent auditor. The Audit Committee believes that the provision of Audit-related services does not impair the independence of the auditor, and has pre-approved certain Audit-related services, all other Audit-related services must be specifically pre-approved by the Audit Committee.
TAX SERVICES
The Audit Committee believes that the independent auditor can provide Tax services to the Company such as tax compliance, tax planning and tax advice without impairing the auditor’s independence. However, the Audit Committee will not permit the retention of the independent auditor in connection with a transaction initially recommended by the independent auditor, the purpose of which may be tax avoidance and the tax treatment of which may not be supported in the Internal Revenue Code and related regulations. The Audit Committee has pre-approved certain Tax services, all Tax services involving large and complex transactions must be specifically pre-approved by the Audit Committee.
ALL OTHER SERVICES
With respect to the provision of services other than audit, review or attest services the pre-approval requirement is waived if:
| (1) | The aggregate amount of all such services provided constitutes no more than five percent of the total amount of revenues paid by the registrant, the registrant’s adviser (not including any sub-adviser whose role is primarily portfolio management and is subcontracted with or overseen by another investment adviser), and any entity controlling, controlled by, or under common control with the investment adviser that provides ongoing services to the registrant to its accountant during the fiscal year in which the services are provided; |
| (2) | Such services were not recognized by the registrant, the registrant’s adviser (not including any sub-adviser whose role is primarily portfolio management and is subcontracted with or overseen by another investment adviser), and any entity controlling, controlled by, or under common control with the investment adviser that provides ongoing services to the registrant at the time of the engagement to be non-audit services; and |
| (3) | Such services are promptly brought to the attention of the Audit Committee of the issuer and approved prior to the completion of the audit by the Audit Committee or by one or more members of the Audit Committee who are members of the board of directors to whom authority to grant such approvals has been delegated by the Audit Committee. |
The Audit Committee may grant general pre-approval to those permissible non-audit services classified as All Other services that it believes are routine and recurring services, and would not impair the independence of the auditor.
The SEC’s rules and relevant guidance should be consulted to determine the precise definitions of prohibited non-audit services and the applicability of exceptions to certain of the prohibitions.
PRE-APPROVAL FEE LEVELS
Pre-approval fee levels for all services to be provided by the independent auditor will be established annually by the Audit Committee. Any proposed services exceeding these levels will require specific pre-approval by the Audit Committee.
PROCEDURES
Requests or applications to provide services that require specific approval by the Audit Committee will be submitted to the Audit Committee by both the independent auditor and the Principal Accounting Officer and/or Internal Auditor, and must include a joint statement as to whether, in their view, the request or application is consistent with the SEC’s rules on auditor independence.
(e)(2) Percentage of services identified in items 4(b) through 4(d) that were approved by the registrants audit committee pursuant to paragraph (c)(7)(i)(C) of Rule 2-01 of Regulation S-X:
4(b)
Fiscal year ended 2014 – 0%
Fiscal year ended 2013 - 0%
Percentage of services provided to the registrants investment adviser and any entity controlling, controlled by, or under common control with the investment adviser that provides ongoing services to the registrant that were approved by the registrants audit committee pursuant to paragraph (c)(7)(i)(C) of Rule 2-01 of Regulation S-X, 0% and 0% respectively.
4(c)
Fiscal year ended 2014 – 0%
Fiscal year ended 2013 – 0%
Percentage of services provided to the registrants investment adviser and any entity controlling, controlled by, or under common control with the investment adviser that provides ongoing services to the registrant that were approved by the registrants audit committee pursuant to paragraph (c)(7)(i)(C) of Rule 2-01 of Regulation S-X, 0% and 0% respectively.
4(d)
Fiscal year ended 2014 – 0%
Fiscal year ended 2013 – 0%
Percentage of services provided to the registrants investment adviser and any entity controlling, controlled by, or under common control with the investment adviser that provides ongoing services to the registrant that were approved by the registrants audit committee pursuant to paragraph (c)(7)(i)(C) of Rule 2-01 of Regulation S-X, 0% and 0% respectively.
| (g) | Non-Audit Fees billed to the registrant, the registrant’s investment adviser, and certain entities controlling, controlled by or under common control with the investment adviser: |
Fiscal year ended 2014 - $8,254
Fiscal year ended 2013 - $8,849
(h) The registrant’s Audit Committee has considered that the provision of non-audit services that were rendered to the registrant’s adviser (not including any sub-adviser whose role is primarily portfolio management and is subcontracted with or overseen by another investment adviser), and any entity controlling, controlled by, or under common control with the investment adviser that provides ongoing services to the registrant that were not pre-approved pursuant to paragraph (c)(7)(ii) of Rule 2-01 of Regulation S-X is compatible with maintaining the principal accountant’s independence.
Item 5. Audit Committee of Listed Registrants
Not Applicable
Item 6. Schedule of Investments
(a) The registrant’s Schedule of Investments is included as part of the Report to Stockholders filed under Item 1 of this form.
(b) Not Applicable; Fund had no divestments during the reporting period covered since the previous Form N-CSR filing.
Item 7. Disclosure of Proxy Voting Policies and Procedures for Closed-End Management Investment Companies
Item 8. Portfolio Managers of Closed-End Management Investment Companies
Item 9. Purchases of Equity Securities by Closed-End Management Investment Company and Affiliated Purchasers
Item 10. Submission of Matters to a Vote of Security Holders
No Changes to Report
Item 11. Controls and Procedures
(a) The registrant’s President and Treasurer have concluded that the
registrant’s disclosure controls and procedures (as defined in rule 30a-3(c) under the Act) are effective in design and operation and are sufficient to form the basis of the certifications required by Rule 30a-(2) under the Act, based on their evaluation of these disclosure controls and procedures within 90 days of the filing date of this report on Form N-CSR.
(b) There were no changes in the registrant’s internal control over financial reporting (as defined in rule 30a-3(d) under the Act) during the second fiscal quarter of the period covered by this report that have materially affected, or are reasonably likely to materially affect, the registrant’s internal control over financial reporting.
Item 12. Exhibits
(a)(1) Code of Ethics- Not Applicable to this Report.
(a)(2) Certifications of Principal Executive Officer and Principal Financial Officer.
(a)(3) Not Applicable.
(b) Certifications pursuant to 18 U.S.C. Section 1350.
SIGNATURES
Pursuant to the requirements of the Securities Exchange Act of 1934 and the Investment Company Act of 1940, the registrant has duly caused this report to be signed on its behalf by the undersigned, thereunto duly authorized.
Registrant Federated Core Trust II, L.P.
By /S/ Lori A. Hensler
Lori A. Hensler, Principal Financial Officer
Date January 21, 2015
Pursuant to the requirements of the Securities Exchange Act of 1934 and the Investment Company Act of 1940, this report has been signed below by the following persons on behalf of the registrant and in the capacities and on the dates indicated.
By /S/ J. Christopher Donahue
J. Christopher Donahue, Principal Executive Officer
Date January 21, 2015
By /S/ Lori A. Hensler
Lori A. Hensler, Principal Financial Officer
Date January 21, 2015