Exhibit 99.1
“To Serve All People During the End of Life’s Journey”
Forward-Looking Statements Forward-Looking Statements Certain statements contained in this presentation are forward-looking statements within the meaning of the federal securities laws. Such forward-looking statements are based on management’s current expectations and are subject to known and unknown risks, uncertainties and assumptions which may cause the forward-looking events and circumstances discussed in this presentation to differ materially from those anticipated or implied by the forwardlooking statements. Such risks, uncertainties and assumptions include, but are not limited to, general market conditions; adverse changes in reimbursement levels under Medicare and Medicaid programs; adverse changes in the Medicare payment cap limits and increases in the Company’s estimated Medicare cap contractual adjustment; decline in patient census growth; increases in inflation including inflationary increases in patient care costs; challenges inherent in and potential changes in the Company’s growth and development strategy; our ability to effectively implement the Company’s 2007 operations and development initiatives; the Company’s dependence on patient referral sources and potential adverse changes in patient referral practices of those referral sources; our ability to implement a new integrated billing and clinical management and electronic medical records system; the ability to attract and retain healthcare professionals; increases in the Company’s bad debt expense due to various factors including an increase in the volume of pre-payment reviews by the Company’s Medicare fiscal intermediaries; changes in state or federal income, franchise or similar tax laws and regulations; adverse changes in the state and federal licensure and certification laws and regulations; adverse results of regulatory surveys; delays in licensure and/or certification; government and private party, legal proceedings and investigations; cost of complying with the terms and conditions of our corporate integrity agreement; adverse changes in the competitive environment in which the Company operates; adverse impact of natural disasters; changes in our estimate of additional compensation costs under FASB Statement No. 123(R); and the disclosures contained under the headings “Government Regulation and Payment Structure” in “Item 1. Business” and “Item 1A. Risk Factors” of Odyssey’s Annual Report on Form 10-K filed with the Securities and Exchange Commission on March 9, 2007, and its most recent report on Form 10-Q and in its other filings with the Securities and Exchange Commission. Many of these factors are beyond the ability of the Company to control or predict. Given these uncertainties, readers are cautioned not to place undue reliance on such forward-looking statements, which reflect management’s views only as of the date hereof. The Company undertakes no obligation to revise or update any of the forward-looking statements or publicly announce any updates or revisions to any of the forward-looking statements contained herein to reflect any change in the Company’s expectations with regard thereto or any change in events, conditions, circumstances or assumptions underlying such statements.
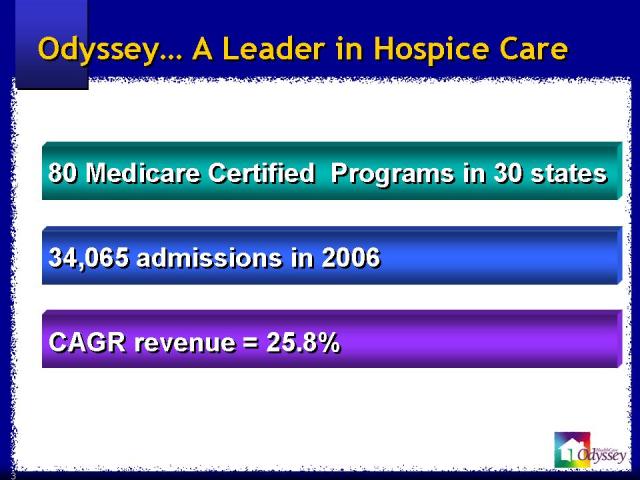
Odyssey… A Leader in Hospice Care 80 Medicare Certified Programs in 30 states 34,065 admissions in 2006 CAGR revenue = 25.8% 80 Medicare Certified

Investment Highlights ⑀⍵ Favorable growth demographics ⑀⍵ CMS acknowledges value of industry ⑀⍵ Experienced management team ⑀⍵ New growth strategies ⑀⍵ Strong balance sheet and cash flow
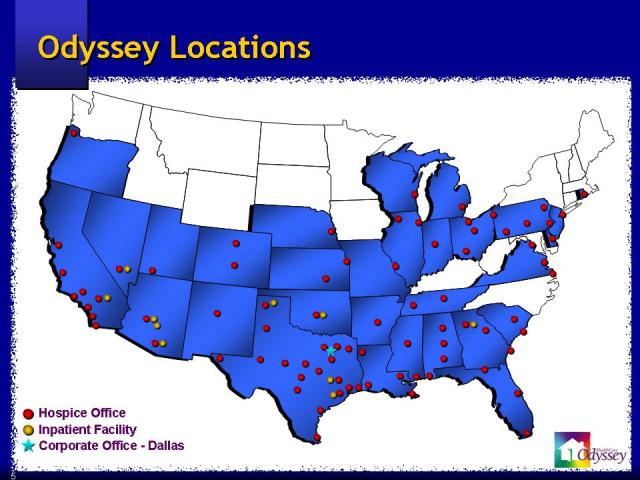
Odyssey Locations Odyssey Locations Hospice Office Inpatient Facility Corporate Office - Dallas
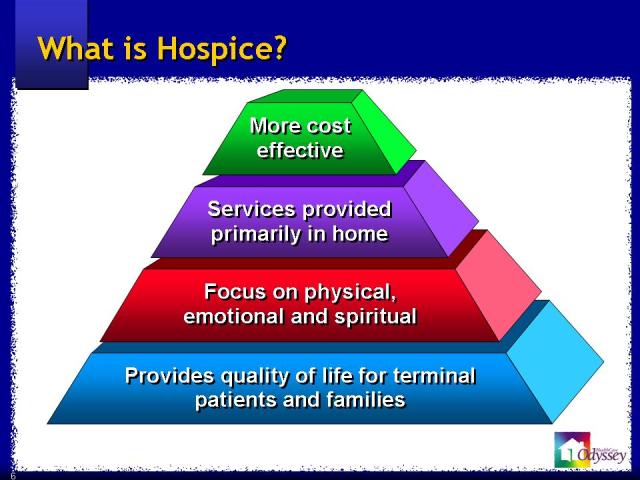
What is Hospice? What is Hospice? Provides quality of life for terminal patients and families Provides quality of life for terminal patients and families Focus on physical, emotional and spiritual Focus on physical, emotional and spiritual More cost effective More cost effective Services provided primarily in home Services provided primarily in home.
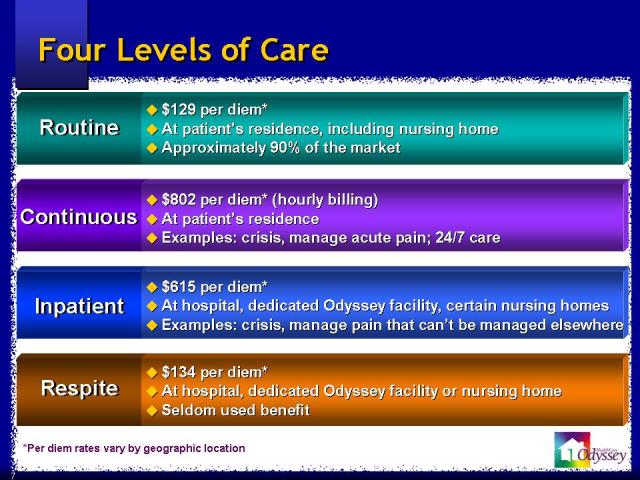
Four Levels of Care Four Levels of Care *Per diem rates vary by geographic location Routine Routine ⑀⍵ $129 per diem* ⑀⍵ At patient’s residence, including nursing home ⑀⍵ Approximately 90% of the market ⑀⍵ $129 per diem* ⑀⍵ At patient’s residence, including nursing home ⑀⍵ Approximately 90% of the market Continuous Continuous ⑀⍵ $802 per diem* (hourly billing) ⑀⍵ At patient’s residence ⑀⍵ Examples: crisis, manage acute pain; 24/7 care ⑀⍵ $802 per diem* (hourly billing) ⑀⍵ At patient’s residence ⑀⍵ Examples: crisis, manage acute pain; 24/7 care Inpatient Inpatient ⑀⍵ $615 per diem* ⑀⍵ At hospital, dedicated Odyssey facility, certain nursing homes ⑀⍵ Examples: crisis, manage pain that can’t be managed elsewhere ⑀⍵ $615 per diem* ⑀⍵ At hospital, dedicated Odyssey facility, certain nursing homes ⑀⍵ Examples: crisis, manage pain that can’t be managed elsewhere Respite Respite ⑀⍵ $134 per diem* ⑀⍵ At hospital, dedicated Odyssey facility or nursing home ⑀⍵ Seldom used benefit ⑀⍵ $134 per diem* ⑀⍵ At hospital, dedicated Odyssey facility or nursing home ⑀⍵ Seldom used benefit
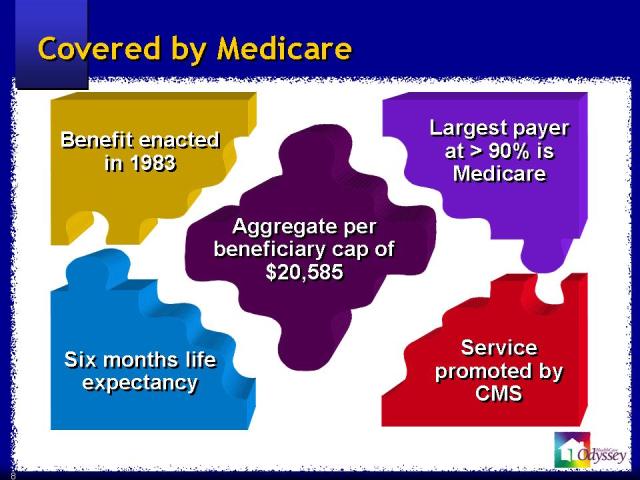
Covered by Medicare Covered by Medicare Benefit enacted in 1983 Benefit enacted in 1983 Aggregate per beneficiary cap of $20,585 Aggregate per beneficiary cap of $20,585 Six months life expectancy Six months life expectancy Largest payer at > 90% is Medicare Largest payer at > 90% is Medicare Service promoted by CMS Service promoted by CMS

Market Opportunity Sudden Death/Other Hospice Patients Served 41% 2.5 million deaths annually in U.S. 42% Under-Served Market 17%
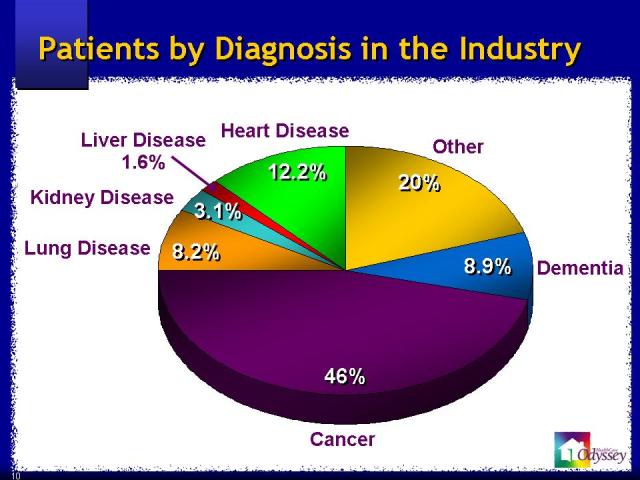
Patients by Diagnosis in the Industry Patients by Diagnosis in the Industry Heart Disease 12.2% 12.2% 20% 20% 8.9% 8.9% 46% 46% 8.2% 8.2% 3.1% 3.1% Other Dementia Cancer Lung Disease Kidney Disease Liver Disease 1.6%
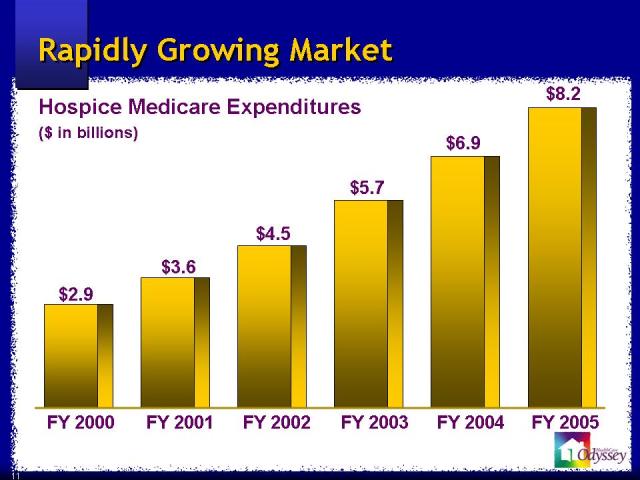
Rapidly Growing Market Hospice Medicare Expenditures ($ in billions) $2.9 $3.6 $4.5 $5.7 $8.2 FY 2000 FY 2001 FY 2002 FY 2003 FY 2005 $6.9 FY 2004
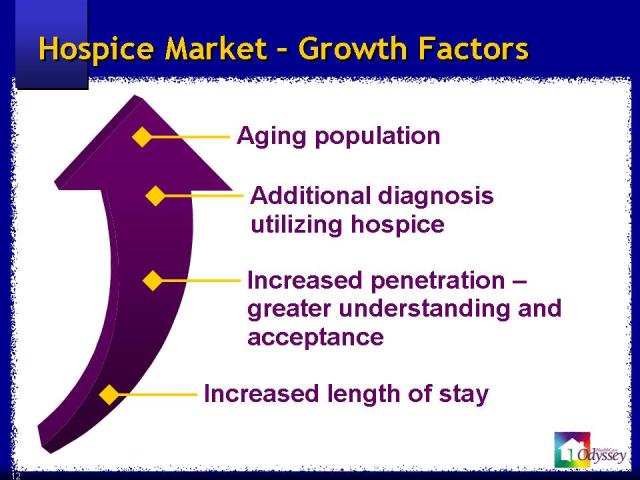
Hospice Market - Growth Factors Hospice Market - Growth Factors Increased length of stay Increased penetration - greater understanding and acceptance Additional diagnosis utilizing hospice Aging population

Hospice Market Hospice Market Non-profit & Government 54% 54% Approximately 2,850 hospice programs in 2005 46% 46% For profit

Hospice Types Hospice Types SNF-based 1% Home Health-based 23% 23% 19% 19% 57% 57% Hospital-based Free Standing
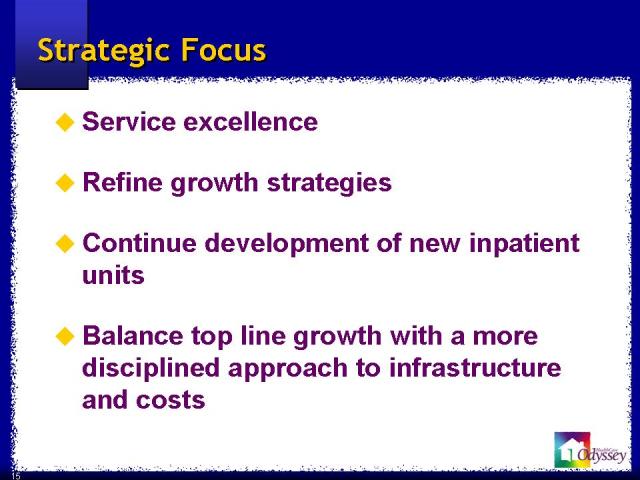
Strategic Focus Strategic Focus ⑀⍵ Service excellence ⑀⍵ Refine growth strategies ⑀⍵ Continue development of new inpatient units ⑀⍵ Balance top line growth with a more disciplined approach to infrastructure and costs
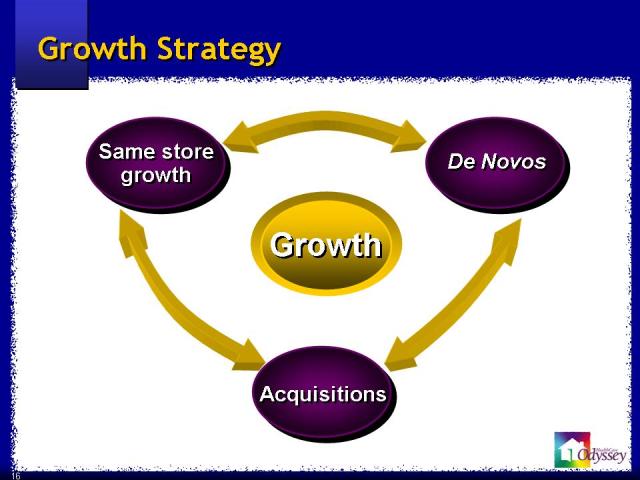
Growth Strategy Growth Growth Same store growth Same store growth De Novos De Novos Acquisitions Acquisitions
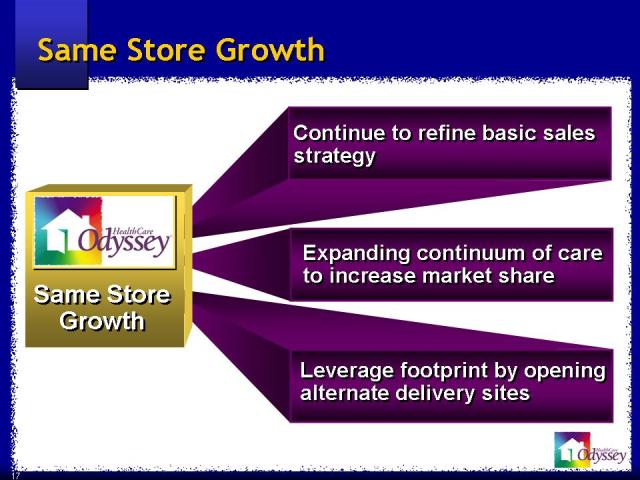
Same Store Growth Same Store Growth Expanding continuum of care to increase market share Expanding continuum of care to increase market share Leverage footprint by opening alternate delivery sites Leverage footprint by opening alternate delivery sites Continue to refine basic sales strategy Continue to refine basic sales strategy Same Store Growth Same Store Growth
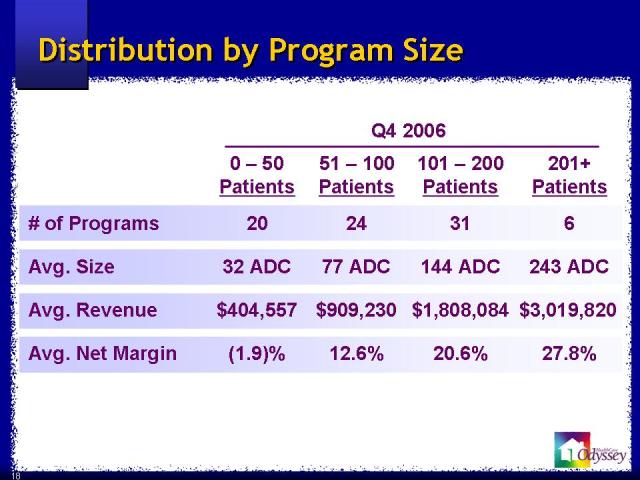
Distribution by Program Size Distribution by Program Size Q4 2006 0 - 50 51 - 100 101 - 200 201+ Patients Patients Patients Patients # of Programs 20 24 31 6 Avg. Size 32 ADC 77 ADC 144 ADC 243 ADC Avg. Revenue $404,557 $909,230 $1,808,084 $3,019,820 Avg. Net Margin (1.9)% 12.6% 20.6% 27.8%

Criteria for De Novos ⑀⍵Growing markets ⑀⍵Broad base of referral sources ⑀⍵Competitive advantage ⑀⍵Regulatory environment
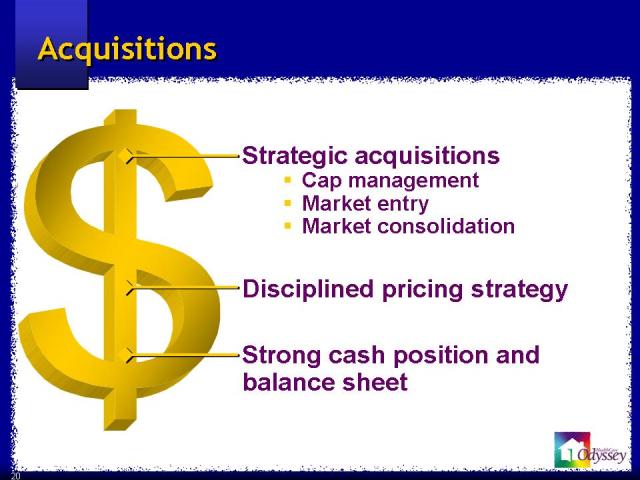
Acquisitions Acquisitions Strategic acquisitions ⑀⍽ Cap management ⑀⍽ Market entry ⑀⍽ Market consolidation Strong cash position and balance sheet Disciplined pricing strategy

Medicare “Cap” Medicare “Cap” ⑀⍵Sets a limit on reimbursement per provider number ⑀⍵Determined on an annual basis at program level ⑀⍵$20,585 x number of adjusted admissions = limit
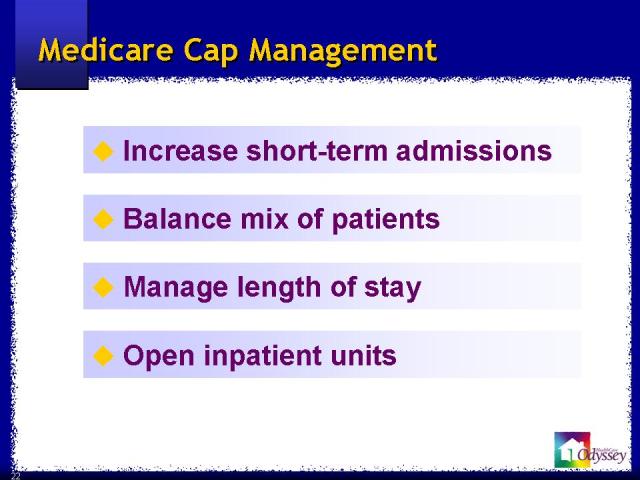
Medicare Cap Management Medicare Cap Management ⑀⍵ Increase short-term admissions ⑀⍵ Balance mix of patients ⑀⍵ Manage length of stay ⑀⍵ Open inpatient units
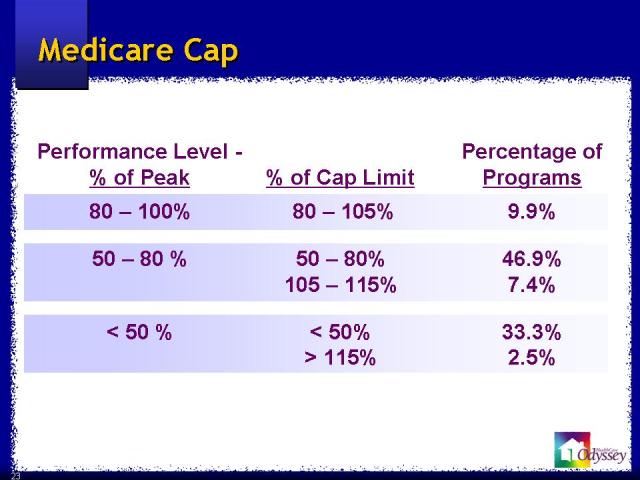
Medicare Cap Medicare Cap Performance Level - % of Peak 80 - 100% 50 - 80 % < 50 % % of Cap Limit 80 - 105% 50 - 80% 105 - 115% < 50% > 115% Percentage of Programs 9.9% 46.9% 7.4% 33.3% 2.5%
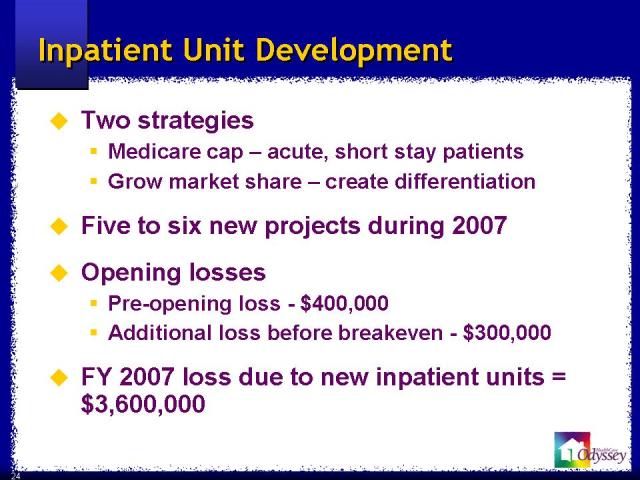
Inpatient Unit Development Inpatient Unit Development ⑀⍵ Two strategies ⑀⍽ Medicare cap - acute, short stay patients ⑀⍽ Grow market share - create differentiation ⑀⍵ Five to six new projects during 2007 ⑀⍵ Opening losses ⑀⍽ Pre-opening loss - $400,000 ⑀⍽ Additional loss before breakeven - $300,000 ⑀⍵ FY 2007 loss due to new inpatient units = $3,600,000

Odyssey HealthCare Financial Summary
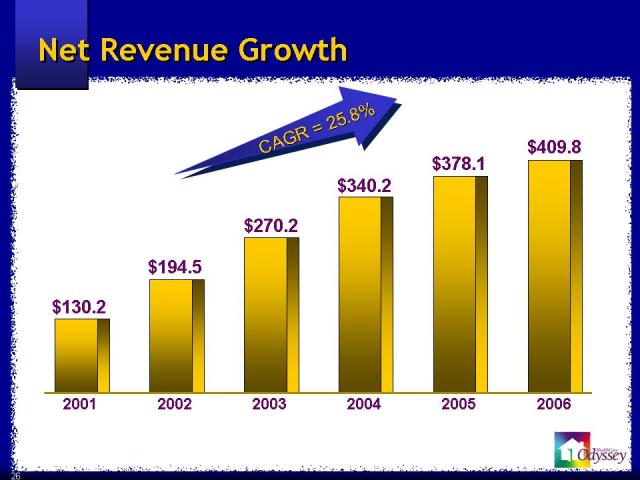
Net Revenue Growth Net Revenue Growth CAGR = 25.8% CAGR = 25.8% 2001 $130.2 2002 $194.5 2003 $270.2 2004 $340.2 $409.8 2006 2005 $378.1
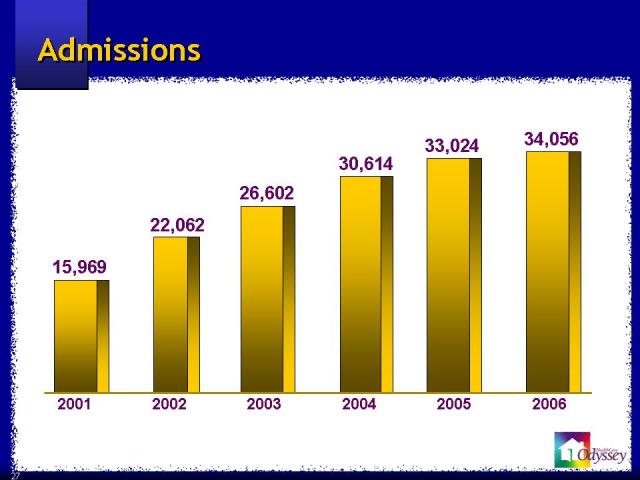
Admissions Admissions 15,969 22,062 26,602 30,614 34,056 33,024 2001 2002 2003 2004 2006 2005

Average Length of Stay Average Length of Stay (Days) 2003 74 2004 79 2005 82 2006 86
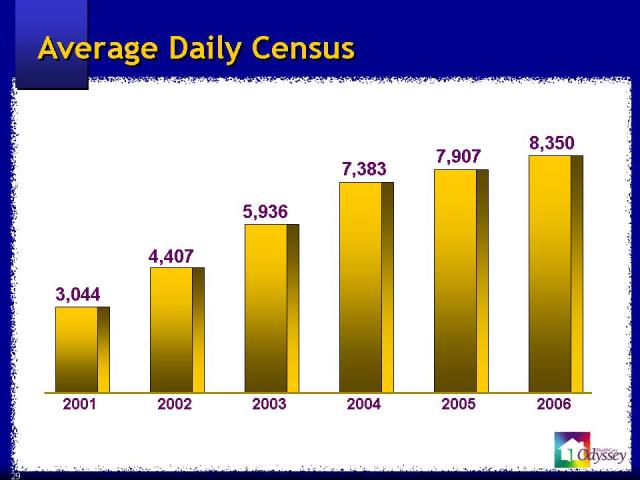
Average Daily Census Average Daily Census 3,044 4,407 5,936 7,383 7,907 8,350 2001 2002 2003 2004 2006 2005
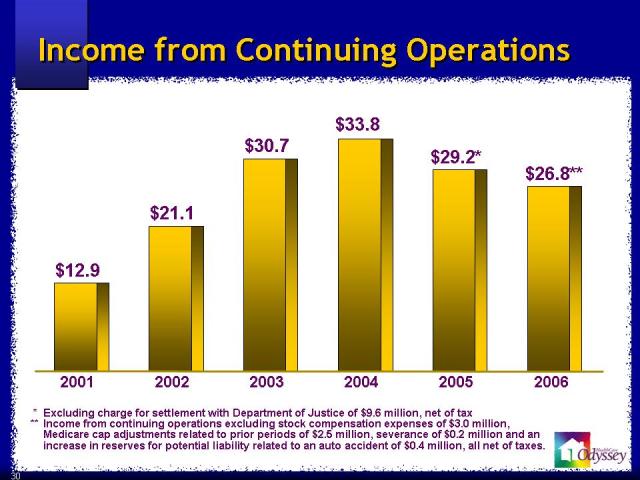
Income from Continuing Operations Income from Continuing Operations * Excluding charge for settlement with Department of Justice of $9.6 million, net of tax ** Income from continuing operations excluding stock compensation expenses of $3.0 million, Medicare cap adjustments related to prior periods of $2.5 million, severance of $0.2 million and an increase in reserves for potential liability related to an auto accident of $0.4 million, all net of taxes. 2001 $29.2* 2005 $12.9 $21.1 2002 $30.7 2003 $33.8 2004 $26.8** 2006
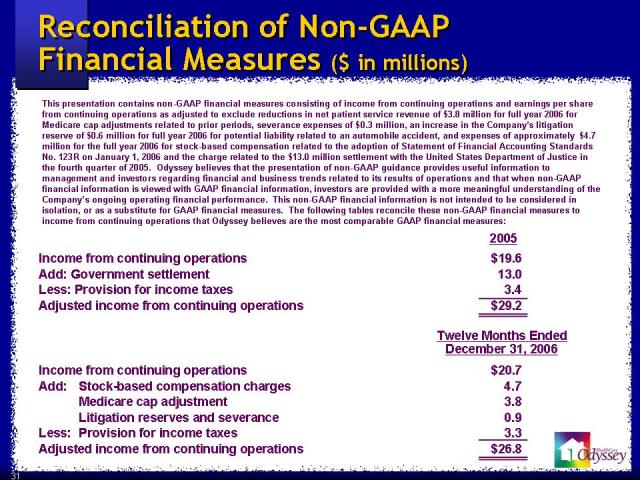
Reconciliation of Non-GAAP Financial Measures ($ in millions) Reconciliation of Non-GAAP Financial Measures ($ in millions) Income from continuing operations Add: Government settlement Less: Provision for income taxes Adjusted income from continuing operations Income from continuing operations Add: Stock-based compensation charges Medicare cap adjustment Litigation reserves and severance Less: Provision for income taxes Adjusted income from continuing operations $20.7 4.7 3.8 0.9 3.3 $26.8 Twelve Months Ended December 31, 2006 $19.6 13.0 3.4 $29.2 2005 This presentation contains non-GAAP financial measures consisting of income from continuing operations and earnings per share from continuing operations as adjusted to exclude reductions in net patient service revenue of $3.8 million for full year 2006 for Medicare cap adjustments related to prior periods, severance expenses of $0.3 million, an increase in the Company’s litigation reserve of $0.6 million for full year 2006 for potential liability related to an automobile accident, and expenses of approximately $4.7 million for the full year 2006 for stock-based compensation related to the adoption of Statement of Financial Accounting Standards No. 123R on January 1, 2006 and the charge related to the $13.0 million settlement with the United States Department of Justice in the fourth quarter of 2005. Odyssey believes that the presentation of non-GAAP guidance provides useful information to management and investors regarding financial and business trends related to its results of operations and that when non-GAAP financial information is viewed with GAAP financial information, investors are provided with a more meaningful understanding of the Company’s ongoing operating financial performance. This non-GAAP financial information is not intended to be considered in isolation, or as a substitute for GAAP financial measures. The following tables reconcile these non-GAAP financial measures to income from continuing operations that Odyssey believes are the most comparable GAAP financial measures:

Net Cash from Continuing Operations Net Cash from Continuing Operations ($ in millions) * Exclusive of $13 million for Department of Justice payment $27.6 2003 $47.1 2004 $58.6 2005 $47.9* 2006

2007 Guidance 2007 Guidance Net patient revenues $433 - $443 million EPS continuing ops $0.68 - $0.73 Average daily census 8,400 - 8,700 Medicare cap allowance as % of gross revenues 2.8% - 3.0% De novo units 3 - 4 IPUs 5 - 6; loss of $3.6 million Bad debt expense 1 - 1.2% Cap Ex approximately 6.6 million

Investment Highlights Investment Highlights ⑀⍵ Favorable growth demographics ⑀⍵ CMS acknowledges value of industry ⑀⍵ Experienced management team ⑀⍵ New growth strategies ⑀⍵ Strong balance sheet and cash flow

Odyssey HealthCare “To Serve All People During the End of Life’s Journey”