 Presentation Regarding Virtus Investment Partners, Inc. December 4, 2008 Exhibit 99.1 |
 Important Disclosures This presentation may contain forward-looking statements within the meaning of the Private Securities Litigation Reform Act of 1995 which, by their nature, are subject to risks and uncertainties. The Phoenix Companies, Inc. (“PNX”) and Virtus Investment Partners, Inc. (“Virtus”) intend for these forward-looking statements to be covered by the safe harbor provisions of the federal securities laws relating to forward-looking statements. These include statements relating to trends in, or representing management’s beliefs about, our future transactions, strategies, operations and financial results, as well as other statements including words such as “anticipate,” “believe,” “plan,” “estimate,” “expect,” “intend,” “may,” “should” and other similar expressions. Forward-looking statements are made based upon our current expectations and beliefs concerning trends and future developments and their potential effects on the company. They are not guarantees of future performance. Actual results may differ materially from those suggested by forward-looking statements as a result of risks and uncertainties, which for PNX include, among others: (i) the effects of recent adverse market and economic developments on all aspects of its business; (ii) changes in general market and business conditions, interest rates and the debt and equity markets; (iii) the possibility that mortality rates, persistency rates or funding levels may differ significantly from its pricing expectations; (iv) the availability, pricing and terms of reinsurance coverage generally and the inability or unwillingness of its reinsurers to meet their obligations to it specifically; (v) its dependence on non-affiliated distributors for its product sales, (vi) downgrades in its debt or financial strength ratings; (vii) its dependence on third parties to maintain critical business and administrative functions; (viii) the ability of independent trustees of its mutual funds and closed-end funds, intermediary program sponsors, managed account clients and institutional asset management clients to terminate their relationships with it; (ix) its ability to attract and retain key personnel in a competitive environment; (x) the poor relative investment performance of some of its asset management strategies and the resulting outflows in its assets under management; (xi) the possibility that the goodwill or intangible assets associated with its asset management business could become impaired, requiring a charge to earnings; (xii) the strong competition it faces in its business from mutual fund companies, banks, asset management firms and other insurance companies; (xiii) its reliance, as a holding company, on dividends and other payments from its subsidiaries to meet its financial obligations and pay future dividends, particularly since its insurance subsidiaries’ ability to pay dividends is subject to regulatory restrictions; (xiv) the potential need to fund deficiencies in its closed block; (xv) tax developments that may affect it directly, or indirectly through the cost of, the demand for or profitability of its products or services; (xvi) other legislative or regulatory developments; (xvii) legal or regulatory actions; (xviii) changes in accounting standards; (xix) the potential effects of the spin- off of its asset management business on its expense levels, liquidity and third-party relationships; and (xx) other risks and uncertainties described herein or in any of its filings with the SEC. For Virtus these risks and uncertainties include, among others: (a) the effects of recent adverse market and economic developments on all aspects of its business; (b) the poor performance of the securities markets; (c) the poor relative investment performance of some of its asset management strategies and the resulting outflows in its assets under management; (d) the inadequate performance of third-party relationships; (e) the withdrawal of assets from its management; (f) the impact of its separation from PNX; (g) its ability to attract and retain key personnel in a competitive environment; (h) the ability of independent trustees of its mutual funds and closed-end funds, intermediary program sponsors, managed account clients and institutional asset management clients to terminate their relationships with it; (i) the possibility that its goodwill or intangible assets could become impaired, requiring a charge to earnings; (j) the strong competition it faces in its business from mutual fund companies, banks and asset management firms; (k) the lack of availability of additional financing; (l) potential adverse regulatory and legal developments; (m) the difficulty of detecting misconduct by its employees, sub-advisors and distribution partners; (n) changes in accounting standards; (o) the difficulty in successfully completing future acquisitions; and (p) other risks and uncertainties described herein or in any of its filings with the SEC. Neither PNX nor Virtus undertakes any obligation to update or revise publicly any forward-looking statement, whether as a result of new information, future events or otherwise. 2 |
 Important Disclosures (Cont’d) Subject to SEC comment, Virtus intends to use the supplemental performance measure “adjusted net income”. Adjusted net income is provided in addition to net income, but is not a substitute for net income determined in accordance with GAAP and may not be comparable to other non-GAAP performance measures, including measures of cash earnings or cash income, of other companies. Furthermore, adjusted net income is not a liquidity measure and should not be used in place of cash flow measures determined in accordance with GAAP. Virtus considers adjusted net income an important measure of its financial performance, as it believes it best represents the operating performance of the primary asset management business. Virtus considers this non-GAAP financial measure when evaluating its performance and believes the presentation of these amounts provides the reader with information to better analyze its operations for the periods presented. Adjusted net income is defined as net income (loss) plus amortization and impairments of intangible assets and deferred taxes related to those intangible assets. Adjusted net income also excludes restructuring and severance charges. Subject to SEC comment, Virtus also intends to use the supplemental measure “EBITDA”. EBITDA, a non-GAAP liquidity measure, defined as earnings before interest expense, income taxes, depreciation and amortization, is provided in addition to, but not as a substitute for, cash flow from operations. EBITDA, as calculated by Virtus, may not be consistent with computations of EBITDA by other companies. As a measure of liquidity Virtus believes that EBITDA is a useful indicator of its ability to service debt, make new investments and meet working capital requirements. Virtus further believes that many investors use this information when analyzing the financial position of companies in the asset management industry. The unaudited pro forma consolidated financial information set forth herein has been prepared on a consolidated basis from Virtus’ consolidated financial statements using the historical results of operations and bases of the assets and liabilities of Virtus’ businesses and gives effect to allocations of expenses from PNX. The unaudited pro forma consolidated financial information is not indicative of Virtus’ future performance or what its results of operations and financial position would have been if it had operated as an independent company during the periods presented or if the transactions reflected therein had actually occurred as of January 1, 2007 or September 30, 2008, as the case may be. The unaudited pro forma consolidated statement of operations may not reflect the complete impact of one-time and ongoing incremental costs required to operate as an independent publicly traded company. These pro formas do not reflect the costs of a new equity incentive plan that Virtus expects to adopt after the distribution. More detailed financial information, including reconciling information regarding these non-GAAP financial measures, can be found in the Appendix to this presentation, which is also available on our Web sites, www.phoenixwm.com or www.virtus.com in the Investor Relations section. This presentation also refers to Morningstar Ratings TM for certain of our funds. Morningstar Ratings are for Class A shares only. Ratings for other share classes may vary. For each fund with at least a 3-year history, Morningstar calculates a Morningstar Rating based on a Morningstar Risk- Adjusted Return measure that account for variation in a fund’s monthly performance (including the effects of sales charges, loads and redemption fees), placing more emphasis on downward variations and rewarding consistent performance. The top 10% of funds in each category receive 5 stars, the next 22.5% receive 4 stars, the next 35% receive 3 stars, the next 22.5% receive 2 stars and the bottom 10% receive 1 star. (Each share class is counted as a fraction of one fund within this scale and rated separately, which may cause slight variations in the distribution percentages.) The overall Morningstar Rating for a fund is derived from a weighted average of the performance figures associated with its 3-, 5- and 10-year (if applicable) Morningstar Ratings metrics. Morningstar Ratings are for Class A shares only; other classes may have different performance characteristics. Morningstar Ratings reflect a fund’s past performance, which is no guarantee of future results. 3 |
 4 2 Dona D. Young Chairman, President and Chief Executive Officer The Phoenix Companies, Inc. 2 Peter A. Hofmann Senior Executive Vice President and Chief Financial Officer The Phoenix Companies, Inc. 2 George R. Aylward President Virtus Investment Partners, Inc. 2 Michael A. Angerthal Chief Financial Officer Virtus Investment Partners, Inc. Call Participants |
 Transaction Description 5 2 SEC declaring Form 10 eligible to be mailed to stockholders 2 PNX Board setting distribution ratio 2 PNX Board declaring dividend 2 Record Date 2 Distribution Next Steps 2 Filed 2 nd amendment to Form 10 2 Established new infrastructure 2 Solidified management team 2 Identified Board of Directors 2 Established separate benefit plans Achieved Progress 2 Virtus Investment Partners, Inc. (“Virtus”) 2 VRTS / NASDAQ 2 The Phoenix Companies, Inc. (“PNX”) Shares to be Distributed Expected Listing Distributing Company |
 Key Investment Highlights 2 Established multi-manager, multi-style asset manager 2 Broad distribution capabilities 2 Experienced portfolio management teams 2 Upside potential with market recovery and rationalization of expenses 2 Potential realization of favorable tax attributes 6 |
 Transaction Rationale 2 Focused Business Strategy. Allows Virtus to pursue a focused standalone business strategy 2 Alignment of Interests. Enhanced alignment of interests among Virtus stockholders, senior management, portfolio managers, fund boards and customers 2 Efficiency Improvement Opportunities. Allows Virtus to establish an expense structure appropriate to its business and size 2 Improved Transparency. Greater financial transparency for Virtus as a separate business 2 Strategic Flexibility. As a separate entity, Virtus has broader strategic options 7 |
 BMO / Harris Minority Investment 2 Harris Bankcorp, a subsidiary of Bank of Montreal (“BMO”), will have a $45 million preferred stock investment in Virtus 2 Harris Investment Management is our largest sub-advisory relationship 2 23% participation alongside common stockholders 2 Proceeds used to repay existing intercompany obligations to Phoenix and to bolster Virtus’ working capital 2 BMO will have governance rights, including 2 of 9 board seats 8 |
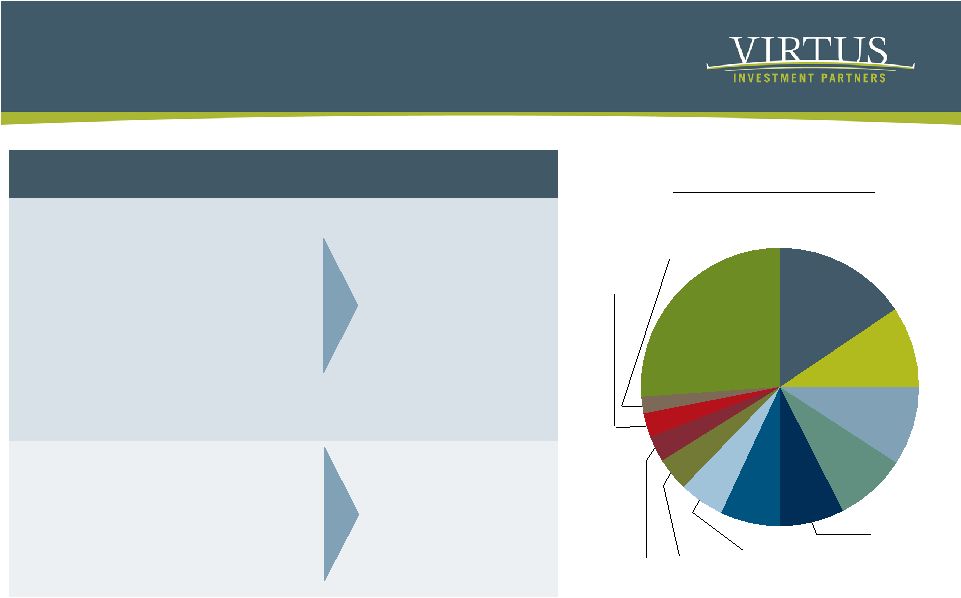
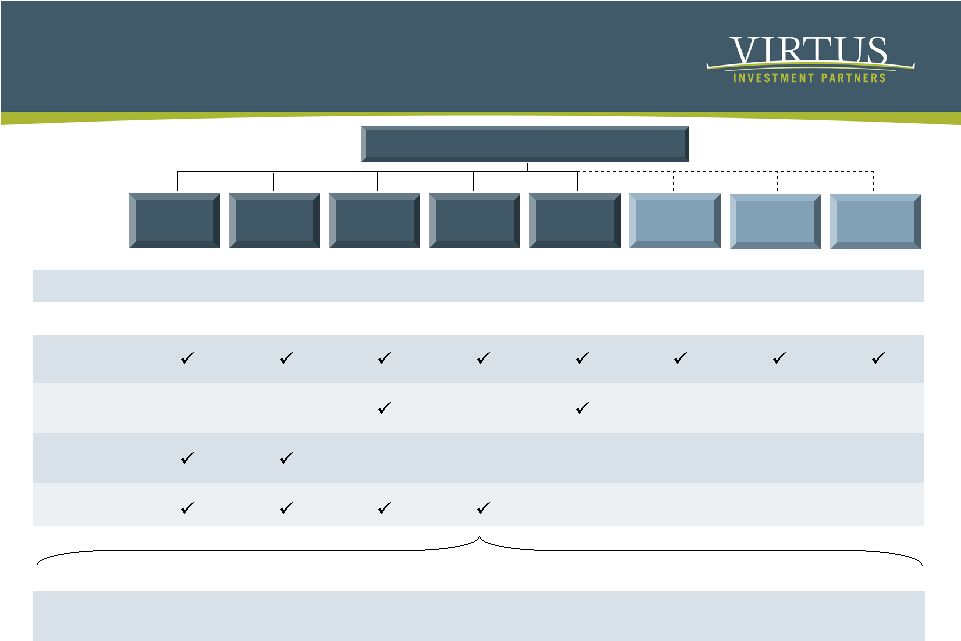 Overview of Affiliated Managers Note: Effective on the spin, Goodwin will remain with PNX and become an outside third party sub-adviser. 1 Includes $0.2 billion in AUM of Engemann Asset Management. ² As of September 30, 2008. Excludes PNX’s general account assets. Zweig Virtus Investment Partners Harris Sub- advisory SCM¹ Kayne Anderson Rudnick Duff & Phelps Oakhurst Goodwin Sub- advisory Institutional Separately Managed Closed-End Funds Open-End Funds $2.1 AUM ($ bn)² $3.5 $4.1 $6.7 $1.2 $1.0 $2.6 $5.8 Products Other Sub- advisory Shared Services Marketing Distribution Fund Administration Product Management Product Development Legal & Compliance Management 9 |
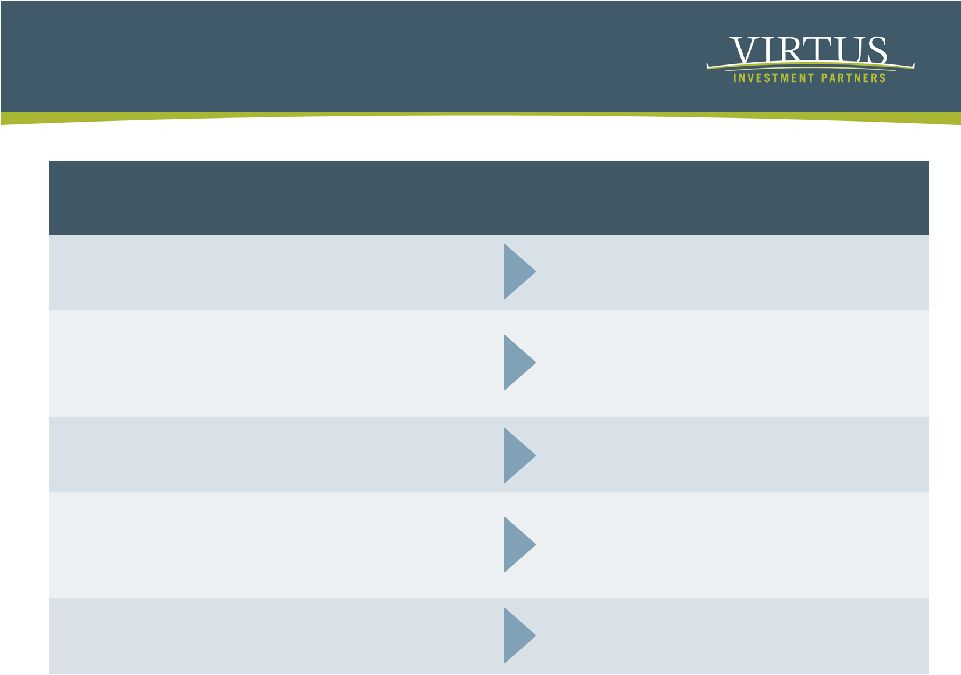 Virtus Strategy 10 Strengths Intended Strategy Affiliated managers have strong investment capabilities Leverage internal capabilities to new areas and products Product line is multi-style, multi-discipline. Active product management and development Extend product offerings Distribution through multiple channels, with broad retail access Build on distribution access Attractive environment exists for current and future portfolio management teams Develop and attract investment talent Potential for more synergies and shared support Enhance model to achieve greater economies of scale |
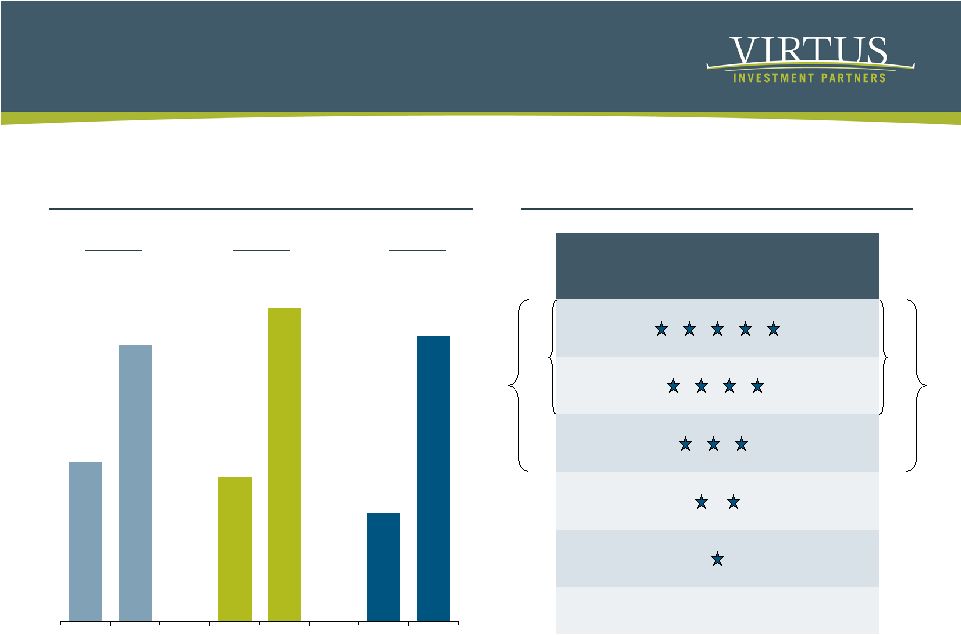 11 Strong Investment Performance 100% 100% 8% 10% 6% 21% 40% 34% 20% 24% 26% 11% Assets Sept 08 Morningstar Rating Funds Sept 08 35% 46% 86% Note: Morningstar load waived overall. AUM excludes non-rated funds. See disclosures at beginning of presentation regarding Morningstar ratings. Percentage of our Funds and Assets in Each Morningstar Rating Category 69% Pro Forma Percent of AUM in Top Third of Peers 1 Year 3 Year 5 Year 35% 61% 69% 32% 63% 24% Sep-04 Sep-08 Sep-04 Sep-08 Sep-04 Sep-08 Note: This chart includes assets under management for all lines of business for which peer group rankings are available from Lipper, Inc. for retail products and from PSN/Informa Solutions, Inc. for our institutional products. Excludes Goodwin institutional assets. |
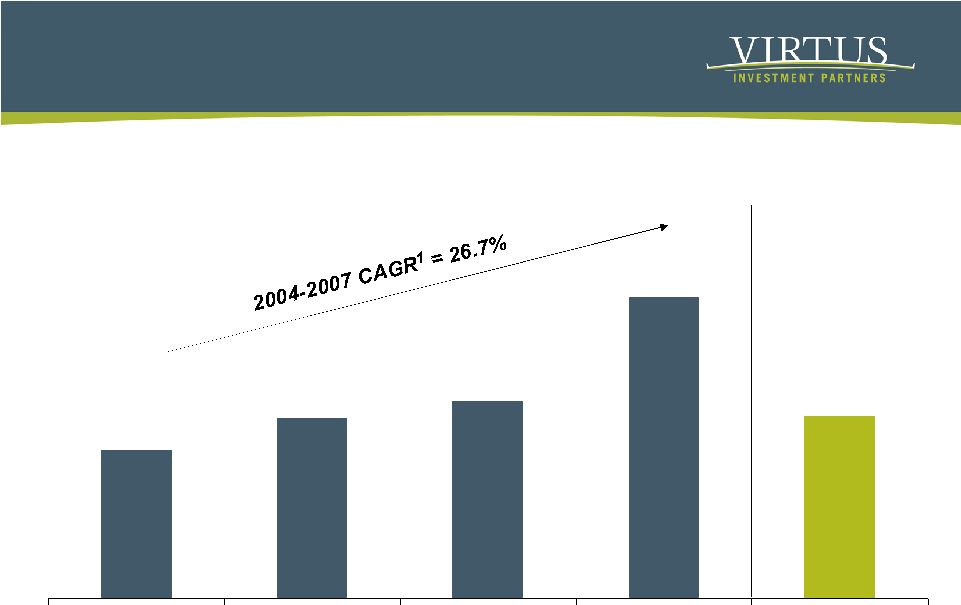 12 Leveraging Performance into Sales Open-End Mutual Fund Gross Sales $ in millions 1 Compound Annual Growth Rate. ² As of September 30, 2008. $1,673 $2,030 $2,219 $3,405 $2,049 2004 2005 2006 2007 YTD 2008² |
 Diversified Distribution Platform 13 2 Consultants 2 Direct 2 Advisor 2 RIA 2 Direct 2 Retirement Plans 2 Subadvised 2 Private Clients Channel 2 Centralized coordination 2 Institutional distributional professionals 2 Asset management wholesalers (external and internal) 2 RIA specialists 2 SMA specialists 2 Regional coverage Support Infrastructure Institutional 16% of Sales¹ Retail 84% of Sales¹ ¹ YTD September 30, 2008. Retail Sales by Distributor ¹ National Financial Services 8% Edward Jones 5% Ameriprise 4% Charles Schwab 3% Affiliated Harris Dealers 3% Wachovia Securities 2% Morgan Stanley 15% Merrill Lynch 10% Smith Barney 9% UBS 8% LPL 7% All Other Dealers 26% |
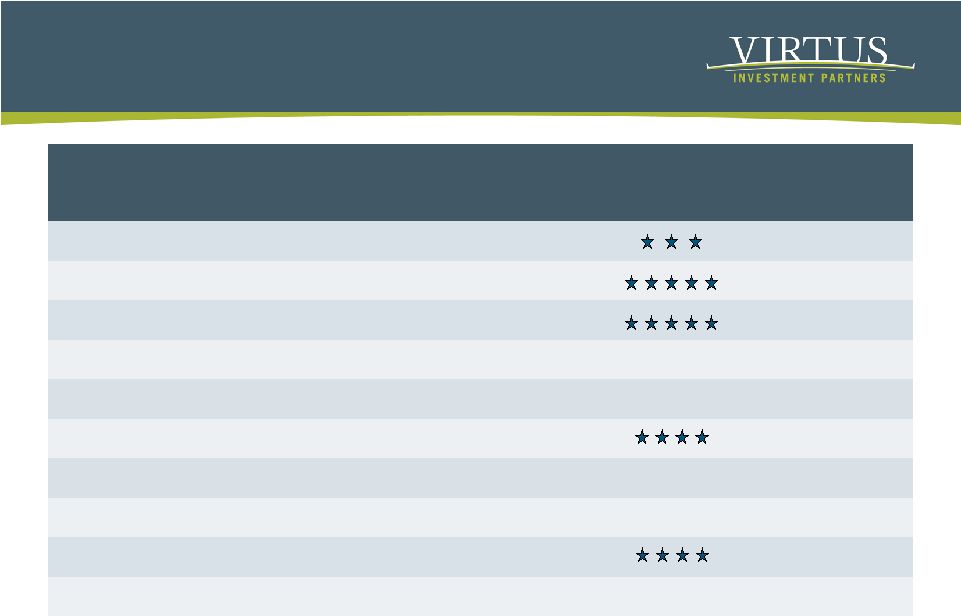 Current Sources of Flows 225 Large Value Value Equity 424 NA NA KAR Small & Mid-Cap (SMA) 546 Mid-Cap Value Mid-Cap Value 622 NA NA KAR Small-Cap Quality Value (SMA) 718 NA NA KAR Small-Cap Core (SMA) 76 NA Small Blend Quality Small-Cap Product Morningstar Category Load-Waived Morningstar Rating AUM ¹ Multi-Sector Short Term Bond Short-Term Bond $1,691 Foreign Opportunities Foreign Large Growth 1,113 Real Estate Specialty-Real Estate 1,082 Alternatives Diversifier Long-Short NA 405 $ in millions Note: See disclosures at beginning of presentation regarding Morningstar ratings. ¹ As of September 30, 2008. 14 |
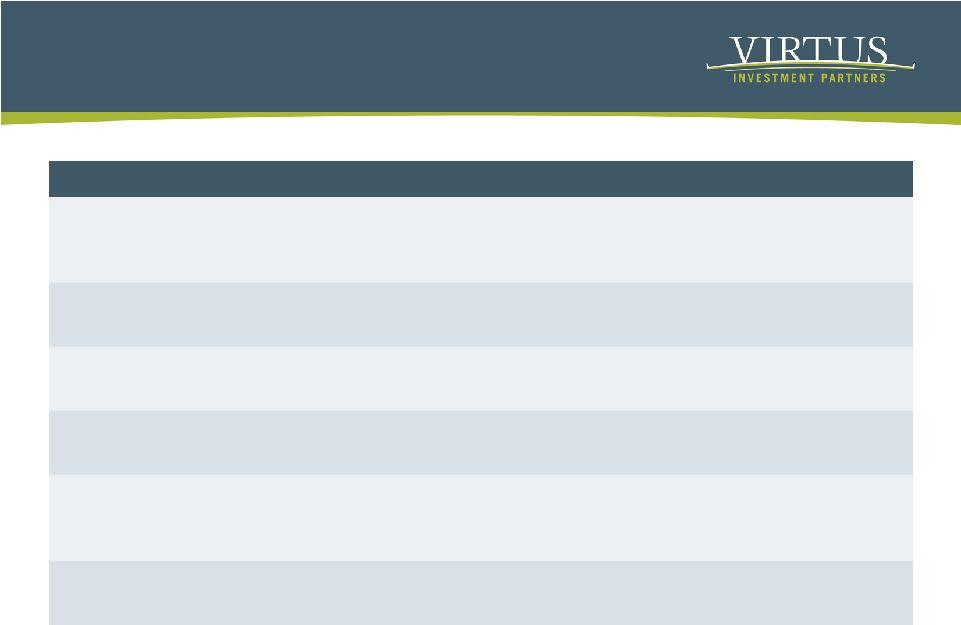 405 Diversified portfolio of alternative asset classes 11/30/05 Diversifier Fund 15 Currently focused on the top tier issuers of floating rate securities 1/31/08 Senior Floating Rate 55 Emphasizes non-U.S. real estate securities that derive significant revenue from rental income 10/1/07 International Real Estate Securities $78 Infrastructure focused, includes utilities, communications, transportation and energy 12/30/04 Global Infrastructure 17 Small cap growth strategy focused on high quality companies 6/28/06 Small-Cap Sustainable Growth 76 Small cap value strategy focused on high quality companies 6/28/06 Quality Small-Cap AUM ¹ Investment Strategy Inception Fund Name Emerging Products 15 $ in millions ¹ As of September 30, 2008. |
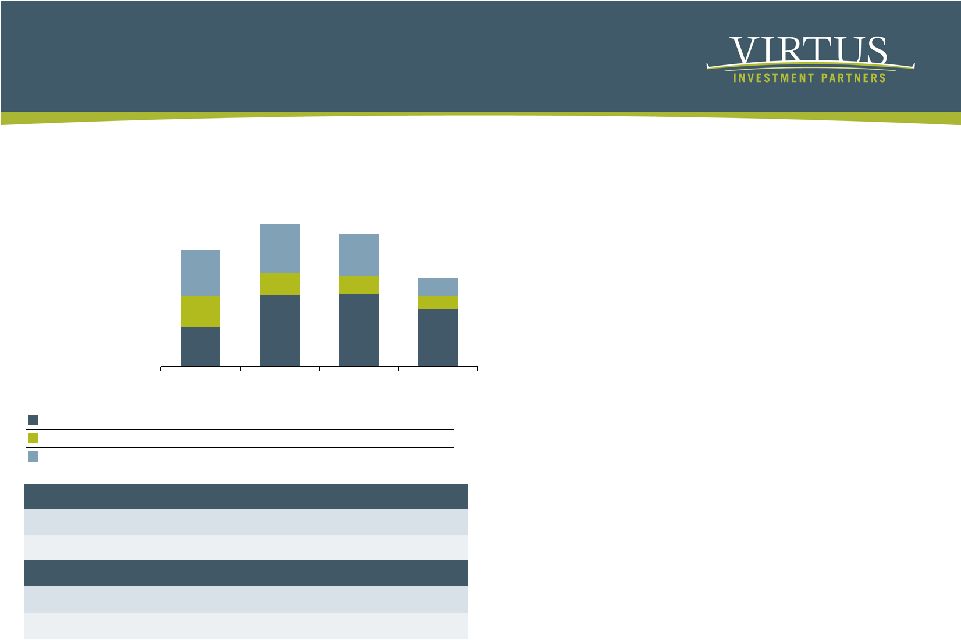 16 Financial Summary $0 $10 $20 $30 $40 $50 2005 2006 2007 YTD 9/30/08 $ in billions for AUM; $ in millions for revenue and adjusted net income 1 Institutional consists of Institutional Products and Structured Finance Products. 2 The non-GAAP supplemental performance measure “adjusted net income” is provided in addition to net income but is not a substitute for net income determined in accordance with GAAP and may not be comparable to other non-GAAP performance measures, including measures of cash earnings or cash income, of other companies. Pro Forma 11 31 Adjusted Net Income² $126 $203 Revenue 14 17 19 17 Adjusted Net Income² $143 $226 $219 $237 Revenue 2008¹ 2007 2006 2005 Historical Assets Under Management Mutual Funds $12.1 $21.9 $22.3 $17.7 Managed Accounts 9.4 6.8 5.4 3.8 Institutional¹ 14.2 14.9 12.7 5.5 $35.7 $43.6 $40.4 $27.0 2 Significant growth in Retail Mutual Funds including fund adoptions 2 Significant decline in Managed Accounts as result of underperforming equity strategies 2 Exited Structured Finance products 2 Through active expense management we have maintained consistent adjusted net income |
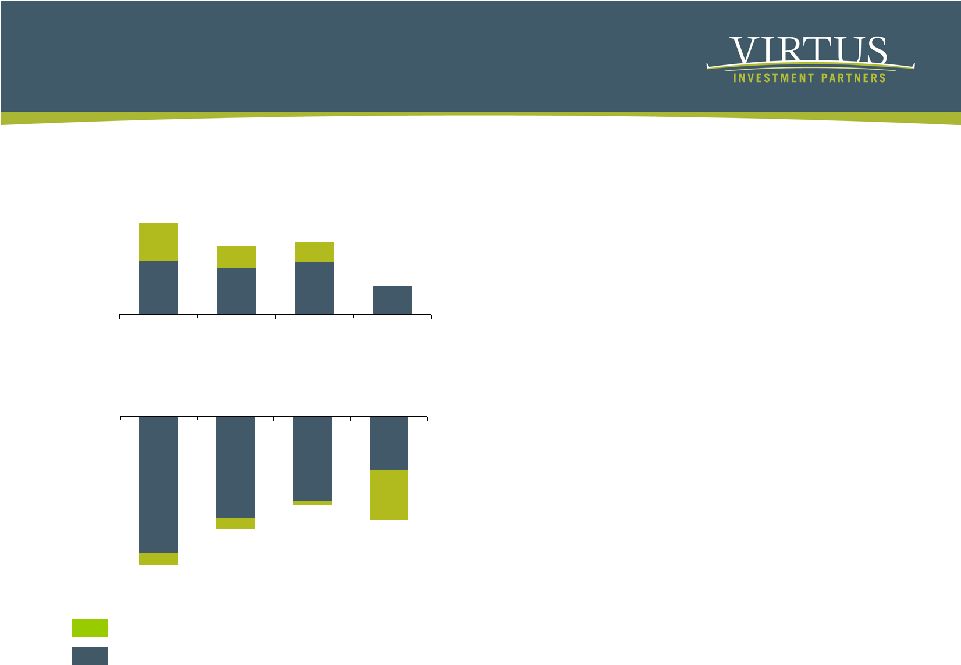 $0 $4 $8 $12 $16 2005 2006 2007 YTD 9/30/08 ($16) ($12) ($8) ($4) $0 17 Financial Summary $ in billions = Structured Products / $3.7B Unaffiliated General Account Inflows Outflows $10.2 $7.6 $8.1 $3.2 $5.8 $5.2 $5.9 $(14.6) $(11.1) $(8.7) $(10.2) $(5.3) $(8.3) $(10.0) $(13.4) = Core Products 2 Generally stable inflows impacted by market conditions 2 Significantly improved outflows in core products: Retail Mutual Funds, Managed Accounts and Traditional Institutional Accounts |
 Pro Forma Financial Highlights 18 Statement of Operations $ in millions ¹ The non-GAAP supplemental performance measure “adjusted net income” is provided in addition to net income, but is not a substitute for net income determined in accordance with GAAP and may not be comparable to other non-GAAP performance measures, including measures of cash earnings or cash income, of other companies. 15.1 Administration and Transfer Agent Fees 20.4 Amortization of Intangible Assets 432.2 Goodwill and Intangible Asset Impairment 99.4 Income Tax Benefit / (Expense) $(2.1) Other Income / (Expense) $(351.5) Net Income $574.5 Total Operating Expenses $10.8 Adjusted Net Income¹ 33.6 Distrib. & Admin. Expenses $56.5 Employment Expenses $84.6 Investment Management Fees 31.8 Other Operating Expenses $125.7 Total Revenues 1.7 Other Revenues 24.3 Distribution and Service Fees Pro Forma YTD September 30, 2008 2 Improve revenue line with continued focus on strong performers and emerging products 2 Deliver cost savings from prior initiatives; incremental costs as separate public entity are offset by reduced operating costs 2 Aggressively manage operating margins; drive scalability; immediate focus on driving down variable cost base Opportunities |
 Pro Forma Financial Highlights 19 $ in millions ¹ Includes $10 million in current portion of notes payable to related parties. 10.8 Deferred Tax Liabilities $159.3 Stockholder’s Equity 1.7 Other Long-Term Liabilities 8.7 Other Assets $274.3 Total Liabilities and SE $45.0 Convertible Preferred Equity $70.0 Total Liabilities 10.0 Long-Term Portion of Notes Payable to Related Parties $47.5 Total Current Liabilities¹ $274.3 Total Assets 183.9 Goodwill and Intangibles $81.7 Total Current Assets 37.2 Other Current Assets $44.5 Cash and Cash Equivalents Pro Forma As of September 30, 2008 Balance Sheet 2 Working capital of $33 expected at time of spin-off; positioned to satisfy all short-term capital requirements 2 Closing BMO / Harris transaction adds $35 capital liquidity; proceeds to partially pay down existing intercompany debt 2 In process of securing 3rd party bank financing expected to fully retire intercompany debt and liabilities 2 Potential embedded tax attributes established from amortization of intangible assets and NOLs |
 Key Investment Highlights 2 Established multi-manager, multi-style asset manager 2 Broad distribution capabilities 2 Experienced portfolio management teams 2 Upside potential with market recovery and rationalization of expenses 2 Potential realization of favorable tax attributes 20 |
 Appendix 21 |
 Reconciliation of Adjusted Net Income 22 YTD 9/30/08 2007 YTD 9/30/08 2007 $10.8 $31.3 $13.6 $16.5 Adjusted Net Income (90.3) 1.2 (91.1) 0.3 plus: Adjustment to Deferred Taxes¹ 331.7 — 331.7 — plus: Goodwill Impairment 100.5 0.3 100.5 0.3 plus: Intangible Asset Impairment 20.4 27.5 22.4 30.1 plus: Intangible Asset Amortization $(351.5) $2.3 $(349.9) $(14.2) Net Income / (Loss) Pro Forma Historical $ in millions ¹ Adjustment to Deferred Taxes related to intangible assets. |
 Reconciliation of EBITDA 23 YTD 9/30/08 2007 $7.8 $38.1 EBITDA 108.1 4.4 plus: Changes in Assets and Liabilities and Other Adjustments (99.5) (6.0) less: Current Tax Provision 2.0 26.7 plus: Interest Expense $(2.8) $13.0 Cash Flow From Operations Historical $ in millions |
 |